PROTHENA CORP PLC
10-Ks and 10-Qs
|
|
|
|
|
|
|
|
|
|
|
|
|
|
|
|
|
|
|
|
|
|
|
|
|
|
|
|
|
|
|
|
|
|
|
|
|
|
|
|
|
|
|
|
|
|
|
|
|
|
UNITED STATES
SECURITIES AND EXCHANGE COMMISSION
Washington, D.C. 20549
______________________________________
FORM 10-K
______________________________________
(Mark One)
|
x
|
ANNUAL REPORT PURSUANT TO SECTION 13 OR 15(d) OF THE SECURITIES EXCHANGE ACT OF 1934
|
For the
year ended December 31, 2017
|
¨
|
TRANSITION REPORT PURSUANT TO SECTION 13 OR 15(d) OF THE SECURITIES EXCHANGE ACT OF 1934
|
For the transition period from to
Commission file number: 001-35676
______________________________________
PROTHENA CORPORATION PUBLIC LIMITED COMPANY
(Exact name of registrant as specified in its charter)
______________________________________
|
Ireland
|
|
98-1111119
|
|
(State or other jurisdiction of
incorporation or organization)
|
|
(I.R.S. Employer
Identification Number)
|
|
Adelphi Plaza
Upper George's Street
Dún Laoghaire
Co. Dublin, A96 T927, Ireland
|
||
|
(Address of principal executive offices including Zip Code)
|
||
Registrant’s telephone number, including area code:
011-353-1-236-2500
Securities registered pursuant to Section 12(b) of the Act:
|
Title of Each Class
|
|
Name of Each Exchange on Which Registered
|
|
Ordinary Shares, par value $0.01 per share
|
|
The Nasdaq Global Select Market
|
Securities registered pursuant to Section 12(g) of the Act: None
______________________________________
Indicate by check mark if the registrant is a well-known seasoned issuer, as defined in Rule 405 of the Securities Act. Yes
x
No
o
Indicate by check mark if the registrant is not required to file reports pursuant to Section 13 or Section 15(d) of the Act. Yes
o
No
x
Indicate by check mark whether the registrant (1) has filed all reports required to be filed by Section 13 or 15(d) of the Securities Exchange Act of 1934 during the preceding 12 months (or for such shorter period that the registrant was required to file such reports), and (2) has been subject to such filing requirements for the past 90 days. Yes
x
No
o
Indicate by check mark whether the registrant has submitted electronically and posted on its corporate Web site, if any, every Interactive Data File required to be submitted and posted pursuant to Rule 405 of Regulation S-T (§232.405 of this chapter) during the preceding 12 months (or for such shorter period that the registrant was required to submit and post such files). Yes
x
No
o
Indicate by check mark if disclosure of delinquent filers pursuant to Item 405 of Regulation S-K is not contained herein, and will not be contained, to the best of registrant’s knowledge, in definitive proxy or information statements incorporated by reference in Part III of this Form 10-K or any amendment to this Form 10-K.
x
Indicate by check mark whether the registrant is a large accelerated filer, an accelerated filer, a non-accelerated filer, or a smaller reporting company. See definitions of “large accelerated filer,” “accelerated filer,” “smaller reporting company” and “emerging growth company” in Rule 12b-2 of the Exchange Act.
|
Large accelerated filer
|
x
|
Accelerated filer
|
o
|
|
Non-accelerated filer
|
o
(Do not check if a smaller reporting company)
|
Smaller reporting company
|
o
|
|
Emerging growth company
|
o
|
||
|
If an emerging growth company that prepares its financial statements in accordance with U.S. GAAP, indicate by check mark if the registrant has elected not to use the extended transition period for complying with any new or revised financial accounting standards provided pursuant to Section 13(a) of the Exchange Act.
o
|
|||
Indicate by check mark whether the registrant is a shell company (as defined in Rule 12b-2 of the Exchange Act). Yes
¨
No
x
As of
June 30, 2017
, the last business day of the registrant’s most recently completed second fiscal quarter, the aggregate market value of the voting shares held by non-affiliates of the registrant was approximately
$2.1 billion
, based on the last reported sale of the registrant’s ordinary shares on the Nasdaq Global Market on such date.
38,540,539
of the Registrant’s ordinary shares, par value $0.01 per share, were outstanding as of
February 9, 2018
.
DOCUMENTS INCORPORATED BY REFERENCE
Portions of the registrant’s Proxy Statement to be delivered to shareholders in connection with the registrant’s Annual General Meeting of Shareholders to be held on
May 15, 2018
are incorporated by reference into Part III of this Form 10-K. The registrant intends to file its Proxy Statement within 120 days after its fiscal year ended
December 31, 2017
.
PROTHENA CORPORATION PLC
Annual Report on Form 10-K
For the
Year Ended December 31, 2017
TABLE OF CONTENTS
|
|
Page
|
|
Item 1.
Business
|
|
|
Item 1B. Unresolved Staff Comments
|
|
|
Item 2.
Properties
|
|
|
Item 3.
Legal Proceedings
|
|
|
Item 4. Mine Safety Disclosures
|
|
|
Item 5.
Market for Registrant's Common Equity, Related Stockholder Matters and Issuer Purchases of Equity Securities
|
|
|
Item 6.
Selected Financial Data
|
|
|
Item 8. Financial Statements
and Supplementary Data
|
|
|
Item 9.
Changes in and Disagreements with Accountants on Accounting and Financial Disclosure
|
|
|
Item 9B.
Other Information
|
|
|
Item 10.
Directors, Executive Officers and Corporate Governance
|
|
|
Item 12.
Security Ownership of Certain Beneficial Owners and Management and Related Stockholder Matters.
|
|
|
Item 13.
Certain Relationships and Related Transactions, and Director Independence
|
|
|
Item 14.
Principal Accounting Fees and Services
|
|
|
Item 15.
Exhibits, Financial Statement Schedules
|
|
Overview
Prothena Corporation plc (“Prothena” or the “Company”) is a global, late-stage clinical biotechnology company establishing fully-integrated research, development and commercial capabilities and focused on advancing new therapies in the neuroscience and orphan disease categories. Fueled by its deep scientific understanding built over decades of research in protein misfolding, Prothena seeks to fundamentally change the course of grave or currently untreatable diseases associated with this biology.
Our pipeline of antibody-based product candidates targets a number of potential indications including AL amyloidosis (NEOD001), Parkinson’s disease and other related synucleinopathies (PRX002/RG7935) and ATTR amyloidosis (PRX004). The Company continues to advance additional discovery programs where our deep scientific understanding of disease pathology can be leveraged. We have a number of discovery-stage programs targeting proteins implicated in diseases across the neuroscience and orphan categories, including tau and Aβ (Amyloid beta) for the potential treatment of Alzheimer’s disease and other neurodegenerative disorders and ALECT2 for the potential treatment of ALECT2 amyloidosis.
We were formed on September 26, 2012 under the laws of Ireland and re-registered as an Irish public limited company on October 25, 2012. Our ordinary shares began trading on The Nasdaq Global Market under the symbol “PRTA” on December 21, 2012 and currently trade on The Nasdaq Global Select Market.
Our Strategy
Our goal is to be a leading biotechnology company focused on the discovery, development and commercialization of novel immunotherapies for the treatment of diseases in the neuroscience and orphan categories. Key elements of our strategy to achieve this goal are to:
|
•
|
Concentrate our discovery and development efforts in areas where we have decades of scientific expertise and experience.
|
We leverage our core scientific expertise and proprietary technology to develop innovative therapeutics for the potential treatment of diseases with major unmet medical needs in the neuroscience and orphan categories. Our scientists are primarily focused on the biology of diseases caused by protein misfolding and our approach leverages the unique insights derived from our decades of research and development in this area. Our approach to advancing new compounds from discovery through clinical development is based on a deep understanding of how to optimally target proteins, assess target engagement and disease progression and develop antibodies that relevantly influence biology. Once we formulate a novel hypothesis or approach to a known target, we generate antibodies against that target. Specific and selective antibodies are characterized in vitro, then used to test the initial hypothesis in vivo using animal models of disease. We sometimes rely on the use of animal models that have been extensively developed by external laboratories. To establish early clinical proof of concept for our programs, we leverage our insight of disease pathology and, when possible, employ biomarker endpoints as a way to detect signals of biological activity. We may elect to start clinical testing of our antibodies in indications that have well-established endpoints in order to demonstrate proof of concept as a basis for further investment in clinical trials, either by us or potential partners.
•
Focus on diseases that lack effective therapies.
We focus on the development and commercialization of therapies for serious and/or life-threatening diseases that currently lack effective therapies or in areas where current therapies have known limitations. Our efforts in AL amyloidosis, Parkinson’s disease, and other diseases where misfolded proteins are implicated in pathogenesis are examples of this. In AL amyloidosis, misfolded proteins aggregate and form amyloid, which can accumulate in vital organs, disrupt their normal function and cause death. Today, there are no approved treatments that directly target and clear amyloid that builds up in organs. NEOD001 is intended to neutralize and clear disease-causing amyloid in AL amyloidosis and is the first immunotherapy directly targeting light chain amyloid to receive Fast Track designation from the U.S. Food and Drug Administration (the “FDA”).
Similarly, in Parkinson’s disease, currently approved therapies focus on the alleviation of symptoms without addressing the underlying cause of the disease. Prothena is focusing its efforts to develop a therapeutic with the potential to slow the progression of Parkinson’s disease by targeting the α-synuclein protein. Synucleins are a family of proteins, of which there are three known members: α-synuclein, β-synuclein, and γ-synuclein. The α- and β-synuclein proteins are found primarily in brain tissue. There is genetic evidence that α-synuclein plays a fundamental role in Parkinson’s disease, and an increasing body of evidence
1
demonstrates that pathogenic forms of α-synuclein can be propagated and transmitted from neuron to neuron. Prothena’s scientists have generated PRX002/RG7935 - a monoclonal antibody targeting the pathogenic aggregated form of α-synuclein that is designed to slow or reduce the neurodegeneration associated with α-synuclein misfolding and/or its transmission. We are developing PRX002/RG7935 in collaboration with Roche for the potential treatment of Parkinson’s disease and other related synucleinopathies.
Moving forward, we intend to advance new discovery-stage monoclonal antibody therapeutics with first-in-class or best-in-class potential, and our discovery efforts targeting tau, Aβ and ALECT2 are examples of this.
•
Strategically partner, collaborate and leverage external resources.
We rely on strategic collaborations and a combination of internal and external resources to advance our objectives.
Our robust discovery engine generates monoclonal antibodies that may be useful in treating unmet medical needs. For investigational therapeutic antibody programs targeting broad patient populations that may require large clinical trials and development investment, we may seek to collaborate or license these programs to biotechnology or pharmaceutical companies for development and/or commercialization. Our collaboration with Roche to develop PRX002/RG7935 for the potential treatment of Parkinson’s disease and other related synucleinopathies is a good example of this.
We also collaborate with scientific and clinical experts in disease areas of interest to test and characterize our potential therapeutic antibody candidates and to gain feedback and guidance on our programs.
Although we rely on, and will expand as appropriate, strong internal talent with expertise in our core areas of focus, we also rely on external resources, as needed, to execute efficiently on our clinical development and other business objectives. We engage consultants who have certain functional and/or disease area expertise to help us execute specific activities related to our programs.
•
Pursue commercialization strategies to maximize the value of our product candidates or future potential products.
As we move our drug candidates through development toward regulatory approval, we will evaluate several strategic options for commercialization. These options include building our own internal sales force; forging partnerships with other pharmaceutical or biotechnology companies, whereby we jointly sell and market the product; regional licensing for markets where we do not have expertise or infrastructure; and out-licensing our product, whereby another pharmaceutical or biotechnology company sells and markets our product and pays us a royalty on sales. We evaluate options for each product based on a number of factors including commercial synergies and expertise, capital necessary to execute on each option, size of the market to be addressed and the expertise and terms of potential offers from other pharmaceutical and biotechnology companies.
Research and Development Pipeline
Our research and development pipeline includes two therapeutic antibody programs in clinical development: NEOD001 for the potential treatment of AL amyloidosis; and PRX002/RG7935, in collaboration with Roche, for the potential treatment of Parkinson’s disease and other related synucleinopathies. PRX004, our program for the potential treatment of ATTR amyloidosis, is in late stage preclinical development.
In addition to our development pipeline, we have a number of discovery-stage programs targeting proteins in the neuroscience and orphan disease categories, including tau and Aβ for the potential treatment of Alzheimer’s disease and other neurodegenerative disorders and ALECT2 for the potential treatment of ALECT2 amyloidosis.
2
The following table summarizes the status of our research and development pipeline:
Our Programs
NEOD001 for the Potential Treatment of AL Amyloidosis
Our most advanced program is NEOD001, an investigational monoclonal antibody that specifically targets the amyloid that accumulates in AL amyloidosis. Systemic amyloidoses, including AL, AA and ATTR amyloidosis, are a complex group of diseases caused by misfolded amyloid proteins that aggregate and deposit in tissue, resulting in progressive organ damage and failure. The most common type, AL amyloidosis, is a rare, progressive and typically fatal disease caused by extracellular deposition of misfolded immunoglobulin light chains. Plasma cells normally produce light chains that pair with heavy chains to make functional antibodies. But in AL amyloidosis, something goes awry - the cause remains unknown - whereby a subset of clonal plasma cells overproduce a single light chain, or fragment thereof, in great abundance. These amyloid light chains (AL) misfold to form toxic soluble and insoluble aggregates that deposit in vital organs such as heart, kidneys, and/or the autonomic or peripheral nerves, causing extensive damage, and potentially organ failure and death. In many cases, patients have multiple organ involvement.
There are no approved treatments for AL amyloidosis and there is a large unmet need for therapies that specifically target soluble toxic aggregates and deposited amyloid fibrils, thereby preserving and improving vital organ function. The Amyloidosis Foundation estimates that approximately 30,000 to 45,000 patients are living with AL amyloidosis in the United States and European Union today. It is estimated that there are approximately 10,000 to 15,000 new cases of AL amyloidosis diagnosed annually in the United States and European Union. The cause of AL amyloidosis remains poorly understood, and we believe this disease is significantly underdiagnosed.
Current treatment for patients with AL amyloidosis may include autologous stem cell transplant or the administration of off-label chemotherapeutic and/or oncologic therapies. The goal of these treatments is to control the hematologic burden by targeting clonal plasma cells in order to decrease the production of new light chain. These chemotherapeutic and/or oncologic agents are associated with known adverse event profiles and patients often become refractory to their hematologic effect and/or relapse. In addition, the target of these therapies is the plasma cells responsible for production of light chain, rather than the toxic light chain in circulation or built up in the organs. Delaying time to organ progression is the goal in the treatment of AL amyloidosis and as such, there remains a significant unmet need to directly target and remove the amyloid deposited on organs.
3
NEOD001 is a first-in-class antibody that specifically targets the disease-causing, misfolded light chain aggregates in AL amyloidosis. Preclinical testing has demonstrated that NEOD001 reacts only with a “cryptic” epitope that is exposed only in the misfolded form of the light chain. The proposed mechanism of action of NEOD001 is to neutralize circulating soluble aggregates and clear deposited insoluble aggregates from organs. NEOD001 received Fast Track designation from the FDA in December 2014.
The purpose of the Fast Track designation is to make important new drugs available to patients earlier. The Fast Track program also provides a company with the ability to submit sections of the Biologic License Application (“BLA”) for review before the company submits the complete BLA. This enables the FDA to review sections of the BLA as they are received, rather than waiting until every section of the application is completed, and also allows for Priority Review, which can shorten the standard review of the final BLA to six months. A drug program with Fast Track designation permits the company to have early and frequent communications with the FDA in the development and review of the product candidate, potentially leading to faster drug approval.
In addition, NEOD001 was granted orphan drug designation for the treatment of AL and AA amyloidosis by the FDA in 2012 and for the treatment of AL amyloidosis by the European Medicines Agency (the “EMA”) in 2013.
Clinical Development Program for NEOD001
Consistent with a commitment to developing a disease-modifying therapy for patients with AL amyloidosis, Prothena has two ongoing global, multi-center, randomized, double-blind, placebo-controlled clinical studies for NEOD001: the PRONTO study (NCT# 02632786, EudraCT# 2015-004318-14) is evaluating NEOD001 in previously-treated patients with AL amyloidosis and persistent cardiac dysfunction, and The VITAL Amyloidosis Study (NCT# 02312206, EudraCT# 2014-003865-11) is evaluating NEOD001 in newly-diagnosed, treatment-naïve patients with AL amyloidosis and cardiac dysfunction.
The VITAL Amyloidosis Study was initiated in December 2014 and is a Phase 3 global, multi-center, randomized, double-blind, placebo-controlled clinical trial for NEOD001 in patients with AL amyloidosis. The trial is designed to support global regulatory approvals. The original target enrollment of 236 patients was exceeded and 260 newly diagnosed, treatment-naïve patients with AL amyloidosis and cardiac dysfunction were randomized into the study. Patients were randomized on a 1:1 basis to receive 24 mg/kg of NEOD001 or placebo via intravenous infusion every 28 days, with both groups receiving concurrent standard of care therapy.
The composite primary endpoint is event-based, with all-cause mortality or cardiac hospitalizations as qualifying events. Secondary endpoints of the study include evaluation of the quality of life evaluation Short Forum-36 (“SF-36”) and Six-Minute Walk Test.
The PRONTO study was initiated in October 2015 and is a Phase 2b global, multi-center, randomized, double-blind, placebo-controlled clinical trial for NEOD001 in previously-treated patients with AL amyloidosis and persistent cardiac dysfunction. The original target enrollment of 100 patients was exceeded and 129 previously-treated patients with AL amyloidosis and persistent cardiac dysfunction have been randomized into the study. Patients were randomized on a 1:1 basis to receive 24 mg/kg of NEOD001 or placebo via intravenous infusion every 28 days.
The primary endpoint is best response over 12 months of the cardiac biomarker NT-proBNP, defined by the consensus criteria of NT-proBNP change. Secondary endpoints include evaluations of SF-36 and Six-Minute Walk Test.
NT-proBNP is a cardiac biomarker that is widely used by clinicians who treat patients with AL amyloidosis to stage patients at baseline, determine treatment outcomes and predict survival. In multiple independent studies, NT-proBNP has been shown to predict survival in patients with AL amyloidosis (Merlini, et. al, Leukemia, 2016). Our scientists have generated and presented new preclinical data at the Heart Failure Society of America 21st Annual Scientific Meeting (HFSA, September 2017) that further supports the important role of the cardiac biomarker NT-proBNP in the biology of AL amyloidosis. This new preclinical data presented at HFSA provides mechanistic insight into how misfolded soluble light chains induce cardiotoxicity resulting in an increase to NT-proBNP production. This preclinical data demonstrated that misfolded soluble light chain induces oxidative stress and leads to an increase in expression of the oxidative response marker heme oxygenase-1 (Hmox-1) in cardiomyocytes. The research further showed that NT-proBNP secretion is increased by misfolded soluble light chain, via a mechanism dependent on Hmox-1 catalytic activity. Misfolded soluble light chain exhibited dose-dependent binding to cardiomyocytes, suggesting that the observed effect is driven by the direct interaction between misfolded soluble light chains and cardiomyocytes. Taken together, these results presented at the HFSA 21st Annual Scientific Meeting support the finding that misfolded soluble light chain induces cardiomyocyte toxicity and provides a direct link between misfolded soluble light chain and NT-proBNP elevation in AL
4
amyloidosis. These data indicate that the role of NT-proBNP in AL amyloidosis is differentiated from other forms of heart failure, and support the relationship that has been reported between lowering of NT-proBNP and survival in patients with AL amyloidosis.
Cardiac, Renal and Peripheral Neuropathy Responses in Phase 1/2 Multiple Ascending Dose Study
The VITAL Amyloidosis Study and the PRONTO study were initiated based on data from the Phase 1/2 multiple ascending dose clinical study. In 2015, data from an interim assessment from the dose escalation phase of the Phase 1/2 clinical study were reported in oral presentations at both the American Society for Clinical Oncology Annual Meeting (ASCO) and the 20th Congress of the European Hematology Association (EHA) and subsequently published in February 2016 in the Journal of Clinical Oncology. We presented the final analysis from the Phase 1/2 clinical study from patients in both the dose escalation and expansion phases in December 2016 at the American Society of Hematology (ASH) Annual Meeting.
The Phase 1/2 study of NEOD001 enrolled patients with AL amyloidosis with persistent organ dysfunction who had been previously treated with standard-of-care plasma cell directed therapy. The Phase 1/2 study consisted of a dose escalation phase (n=27) and expansion phase (n=42) which evaluated safety, tolerability, pharmacokinetics and immunogenicity of NEOD001 as well as the specific clinical activity against cardiac and renal endpoints. The expansion phase of this study also evaluated clinical activity against a neuropathy endpoint. The 42 patients in the expansion phase of the study were enrolled into three prospectively-defined cohorts as follows: 15 patients with predominantly cardiac dysfunction, 16 patients with predominantly renal dysfunction and 11 patients with predominantly peripheral neuropathy. All patients received 24 mg/kg of NEOD001 by intravenous infusion every 28 days.
Results of the Phase 1/2 study demonstrated that NEOD001 was safe and well-tolerated in patients with AL amyloidosis and persistent organ dysfunction. In this study, clinical assessments demonstrated improvements in three organ systems in previously treated patients with AL amyloidosis.
In a best response analysis of patients in the Phase 1/2 study who received NEOD001, 53% or 19 of 36 total cardiac-evaluable patients demonstrated a cardiac response, defined as at least 30% and 300 pg/mL decrease in levels of NT-proBNP. Of the 36 cardiac-evaluable patients, 50% or 18 patients demonstrated a cardiac response, defined as more than 30% and 300 pg/mL decrease in levels of NT-proBNP. In a best response analysis of patients in the Phase 1/2 study who received NEOD001, 64%, or 23 of 36 total renal-evaluable patients, demonstrated a renal response, defined as at least a 30% decrease in proteinuria in the absence of estimated glomerular filtration rate (eGFR) worsening. In addition, an improvement in peripheral neuropathy in patients in the prospectively defined peripheral neuropathy expansion cohort was demonstrated by a mean 33% (median 22%) decrease in NIS-LL measured at month 10, indicating improvement to a third organ system in NEOD001-treated patients. Complete resolution of peripheral neuropathy, as measured by NIS-LL, was achieved in two patients in this cohort. Improvements in patient NIS-LL scores resulted in a response rate of 82% or nine of 11 patients in the peripheral neuropathy expansion cohort of the Phase 1/2 study. A response on the NIS-LL is defined as a less than 2-point increase on the 88-point scale.
Safety, Tolerability, Pharmacokinetics and Immunogenicity
Data from the Phase 1/2 study demonstrated that monthly infusions (every 28 days) of NEOD001 were safe and well-tolerated in patients with AL amyloidosis and persistent organ dysfunction. A total of 69 patients received more than 990 infusions, of up to 24 mg/kg, with a mean treatment duration of 12.8 months. No hypersensitivity reactions or drug-related serious adverse events were reported and no persistent anti-NEOD001 antibodies were detected. NEOD001 also demonstrated excellent pharmacokinetic properties, supporting a dose level of 24 mg/kg administered every 28 days. The most commonly reported treatment-emergent adverse events of those occurring in more than 10% of subjects, regardless of relationship to study drug, were fatigue, nausea, upper respiratory tract infection, peripheral edema, diarrhea, anemia, increased blood creatinine, dizziness, cough, constipation, headache, vomiting, dyspnea, pain in extremity, back pain, muscle spasms, rash and urinary tract infection. No dose limiting toxicities were observed and no patient discontinued treatment due to drug-related adverse events.
PRX002/RG7935 for the Potential Treatment of Parkinson’s Disease and other synucleinopathies
In December 2013, we entered into a License, Development, and Commercialization Agreement (the “License Agreement”) with F. Hoffmann-La Roche Ltd and Hoffmann-La Roche Inc. (collectively, “Roche”) to develop and commercialize certain antibodies that target α-synuclein, including PRX002/RG7935. Together with Roche, we aim to develop PRX002/RG7935 as a disease-modifying treatment for Parkinson’s disease and potentially other synucleinopathies. For more information on the License Agreement, see the information below.
The protein α-synuclein is found extensively in neurons and is a major component of pathological inclusions that characterize several neurodegenerative disorders, including Parkinson’s disease, dementia with Lewy bodies, and multiple system atrophy,
5
which collectively are termed synucleinopathies. While the normal function of α-synuclein is not well understood, the protein normally occurs in a soluble form. In synucleinopathies, the α-synuclein protein can misfold and aggregate to form soluble aggregates and insoluble fibrils that contribute to the pathology of the disease.
There is genetic evidence for a causal role of α-synuclein in Parkinson’s disease. In rare cases of familial forms of Parkinson’s disease, there are mutations in the synuclein protein sequence, or duplication and triplications of the relevant gene leading to high levels of α-synuclein production, which may cause α-synuclein protein to form amyloid-like fibrils that contribute to the disease. There is also increasing evidence that this disease-causing α-synuclein can be propagated and transmitted from neuron to neuron, resulting in a spreading of neuronal death. Recent studies in cellular and animal models suggest that the spread of α-synuclein-associated neurodegeneration can be disrupted by targeting aberrant forms of α-synuclein.
Parkinson’s disease is a degenerative disorder of the central nervous system that affects approximately seven to ten million people worldwide, making it the second most common neurodegenerative disease after Alzheimer's. The disease is characterized by the neuronal accumulation of aggregated α-synuclein in the central nervous system (“CNS”) and peripheral nervous system that results in a wide spectrum of worsening progressive motor and non-motor symptoms. While diagnosis relies on motor symptoms classically associated with Parkinson's disease, non-motor symptoms may present many years earlier. Current treatments for Parkinson's disease are primarily directed at managing the early motor symptoms of the disease, mainly through the use of levodopa and dopamine agonists and only address a subset of symptoms such as motor impairment, dementia, or psychosis. Symptomatic therapies do not target the underlying cause of the disease and as the disease progresses and dopaminergic neurons continue to be lost, these drugs lose effectiveness, often leading to debilitating side effects as the disease progresses. The goal of our approach is to slow the progressive neurodegenerative consequences of disease, a current unmet need. PRX002/RG7935 targets α-synuclein and may slow or reduce the neurodegeneration associated with synuclein misfolding and/or transmission.
Clinical Development Program for PRX002/RG7935
Prior to initiating clinical trials, we tested the efficacy of PRX002/RG7935 in various cellular and animal models of α-synuclein-related disease. In transgenic mouse models of Parkinson’s disease, passive immunization with 9E4, the murine version of PRX002/RG7935, reduced the appearance of α-synuclein pathology, protected synapses and improved performance by the mice in behavioral testing.
During 2014, together with Roche, we advanced PRX002/RG7935 into clinical development with the initiation of two Phase 1 studies. Results of the first study, a Phase 1 double-blind, placebo-controlled, single ascending dose trial, were presented in June 2015 as part of the late breaking session at the 19th International Congress of Parkinson's Disease and Movement Disorders and published in December 2016 in the journal Movement Disorders. The data demonstrated that PRX002/RG7935 was safe and well-tolerated in healthy volunteers, meeting the primary objective of the study. Further, results from this study showed that administration of PRX002/RG7935 led to a mean reduction of free serum α-synuclein levels of up to 96.5%. These overall results were statistically significant (p < 0.0001). Reduction of free serum α-synuclein, a protein potentially involved in the onset and progression of Parkinson's disease and the target of PRX002/RG7935, was shown to be rapid, and dose- and time-dependent after a single dose. No serious adverse events or hypersensitivity reactions were reported. PRX002/RG7935 demonstrated favorable pharmacokinetic properties. The most common treatment emergent adverse events were headache, nausea, vessel puncture site pain, viral infection, and viral upper respiratory tract infection. In this study, all PRX002/RG7935-related adverse events were mild, no dose limiting toxicities were observed and no anti-drug antibodies were detected.
Results of the second study, a Phase 1b double-blind, placebo-controlled, multiple ascending dose study of PRX002/RG7935 in 80 patients with Parkinson’s disease that was designed to assess the safety, tolerability, pharmacokinetics and immunogenicity of PRX002/RG7935, were presented by Dr. Joseph Jankovic of Baylor College of Medicine in April 2017 in a late-breaking therapeutic strategies session at the 13th International Conference on Alzheimer's and Parkinson’s Disease (AD/PD).
The 80 patients with Parkinson’s disease in this study were randomized into six escalating dose cohorts to receive PRX002/RG7935 or placebo (2:1 randomization for 0.3, 1, 3 or 10 mg/kg, and 3:1 randomization for 30 or 60 mg/kg). In this six-month study, patients received three monthly doses (intravenous infusion once every 28 days) of PRX002/RG7935 or placebo and were followed for an observational period of three months. All dose levels of PRX002/RG7935 were found to have an acceptable safety and tolerability profile in patients with Parkinson’s disease, meeting the primary objective of the study. CNS penetration was demonstrated by a dose-dependent increase in PRX002/RG7935 levels in cerebrospinal fluid (CSF), and a mean concentration of PRX002/RG7935 in CSF of 0.3% relative to serum across all dose levels, which exceeded our expectations based on our preclinical experience. Data from the study also demonstrated rapid, dose- and time-dependent mean reduction in levels of free serum alpha-synuclein of up to 97% after a single dose, which were statistically significant (p < 0.0001), and maintained following two additional monthly doses. No serious or severe treatment emergent adverse events (TEAEs) were reported in PRX002/RG7935 treated patients. No TEAEs were observed in ten percent or more of PRX002/RG7935 treated patients. TEAEs greater than placebo in
6
five percent or more of PRX002/RG7935 treated patients, regardless of relationship to PRX002/RG7935, included constipation, infusion related reactions (IRRs), diarrhoea, peripheral oedema, and post lumbar puncture syndrome. Mild-to-moderate IRRs, that all resolved, were limited to the 60 mg/kg dose cohort and were observed in four of 12 treated patients. No dose-limiting toxicities were observed. PRX002/RG7935 demonstrated acceptable pharmacokinetic properties.
The results from this study further supported advancing PRX002/RG7935 into the Phase 2 study, PASADENA, that was initiated by Roche in the second quarter of 2017. PASADENA is a two-part Phase 2 clinical study in early Parkinson's disease patients that is being conducted by Roche. Part 1 is a randomized, double-blind, placebo-controlled, three-arm study designed to enroll approximately 300 patients to evaluate the efficacy and safety of PRX002/RG7935 in patients over 52 weeks. In part 1, patients will be randomized on a 1:1:1 basis to receive one of two active doses (1500 mg or 4500 mg) of PRX002/RG7935 or placebo via intravenous infusion once every 4 weeks. Eligible patients must not be on dopaminergic therapy and must not be expected to require dopaminergic therapy for at least 52 weeks. Part 2 of the study is a 52-week blinded extension phase in which patients from the placebo arm of the study will be re-randomized onto one of two active doses on a 1:1 basis, so that all participants will be on active treatment. Patients who were originally randomized to an active dose will continue at that dose level for the additional 52 weeks. In part 2, patients will be allowed to use concomitant dopaminergic therapy. Any patient who medically requires initiation of dopaminergic therapy during part 1 will have their subsequent data censored for the primary endpoint analysis.
The primary endpoint of the Phase 2 PASADENA study is the comparison of change from baseline in the Movement Disorder Society-Unified Parkinson's Disease Rating Scale (MDS-UPDRS) total score (sections 1, 2 and 3) at the completion of part 1 (week 52) in each treatment group vs. the placebo group. Key secondary endpoints include safety, tolerability and DaT-SPECT imaging.
License, Development, and Commercialization Agreement with Roche
In December 2013, we entered into the License Agreement with Roche to develop and commercialize certain antibodies that target α-synuclein, including PRX002/RG7935, which are referred to in this report collectively as “Licensed Products.” The License Agreement became effective on January 17, 2014, which triggered an upfront payment to us of $30.0 million from Roche, which we received in February 2014. In July 2017, we announced that the first patient has been enrolled in PASADENA, a global Phase 2 study of PRX002/RG7935 in patients with early Parkinson's disease. The start of the Phase 2 PASADENA study triggered a $30 million milestone payment from Roche to Prothena, which was earned in the second quarter of 2017. Prothena had previously received $45 million in upfront and development milestone payments.
Pursuant to the License Agreement, we are collaborating with Roche to research and develop antibody products targeting α-synuclein. Roche is providing funding for this research collaboration, which is focused on optimizing early stage antibodies targeting α-synuclein, potentially including incorporation of Roche’s proprietary Brain Shuttle™ technology to increase delivery of therapeutic antibodies to the brain. Roche is primarily responsible for developing, obtaining and maintaining regulatory approval for, and commercializing Licensed Products under the collaboration, including PRX002/RG7935. Roche is responsible for the clinical and commercial manufacture and supply of Licensed Products within a defined time period following the effective date of the License Agreement.
In addition to the $30.0 million upfront payment and clinical milestone payment of $15.0 million (both in 2014) and the clinical milestone payment of $30.0 million in 2017, Roche is also obligated to pay:
|
•
|
up to
$350.0 million
upon the achievement of additional development, regulatory and various first commercial sales milestones;
|
|
•
|
up to an additional $175.0 million in ex-U.S. commercial sales milestones; and
|
|
•
|
tiered, high single-digit to high double-digit royalties in the teens on ex-U.S. annual net sales, subject to certain adjustments.
|
In the U.S., Prothena and Roche share all development and commercialization costs, as well as profits, all of which will be allocated 70% to Roche and 30% to us, for PRX002/RG7935 in the Parkinson’s disease indication, as well as any other licensed products and/or indications for which we opt in to co-develop and co-fund. We may opt out of the co-development and cost and profit sharing on any co-developed licensed products and instead receive U.S. commercial sales milestones totaling up to $155.0 million and tiered, single-digit to high double-digit royalties in the teens based on U.S. annual net sales, subject to certain adjustments, with respect to the applicable licensed product. In addition, we have an option under the License Agreement to co-promote PRX002/RG7935 in the U.S. in the Parkinson’s disease indication. If we exercise such option, we may also elect to co-
7
promote additional licensed products in the U.S. approved for Parkinson’s disease or other indications calling on the same prescriber. Outside the U.S., Roche has responsibility for developing and commercializing the licensed products.
Under the License Agreement with Roche, we granted to Roche an exclusive, worldwide license to develop, make, have made, use, sell, offer to sell, import and export the Licensed Products. The License Agreement continues on a country-by-country basis until the expiration of all payment obligations thereunder. The License Agreement may also be terminated (i) by Roche at will after the first anniversary of the effective date of the License Agreement, either in its entirety or on a Licensed Product-by-Licensed Product basis, upon 90 days’ prior written notice to us prior to first commercial sale and 180 days’ prior written notice to us after first commercial sale, (ii) by either party, either in its entirety or on a Licensed Product-by-Licensed Product or region-by-region basis, upon written notice in connection with a material breach uncured 90 days after initial written notice, and (iii) by either party, in its entirety, upon insolvency of the other party. The License Agreement may be terminated by either party on a patent-by-patent and country-by-country basis if the other party challenges a given patent in a given country. Our rights to co-develop licensed products under the License Agreement will terminate if we commence certain studies for certain types of competitive products. Our rights to co-promote licensed products under the License Agreement will terminate if we commence a Phase 3 study for such competitive products.
PRX004 for the Potential Treatment of ATTR Amyloidosis
PRX004 is an investigational monoclonal antibody designed to specifically target and clear the misfolded (toxic) forms of the TTR amyloid protein found in ATTR amyloidosis.
Transthyretin amyloidosis (ATTR amyloidosis) is a rare, progressive and often fatal disease characterized by deposition of aggregates of misfolded protein, or amyloid. There are three types of ATTR amyloidosis: hereditary ATTR with cardiomyopathy (hATTR-CM); wild-type ATTR which occurs sporadically and also involves cardiomyopathy (wtATTR); and hereditary ATTR with polyneuropathy (hATTR-PN).
The TTR protein is produced primarily in the liver and in its normal tetrameric form serves as a carrier for thyroxin and vitamin A and is also implicated in neuroprotective functions. In hereditary ATTR (hATTR), the body makes a mutant form of the TTR protein. There are more than 100 reported types of TTR mutations that promote amyloid fibril formation, which most commonly affect the heart (hATTR-CM) and nervous system (hATTR-PN). Wild-type ATTR is similar to hereditary ATTR except that the protein that is deposited is the misfolded, non-mutated transthyretin protein. The wild-type transthyretin protein is less prone to forming amyloid deposits than the mutated form and patients usually develop the disease at 65 years of age or older.
Clinical development program for PRX004
Prothena has generated monoclonal antibodies that selectively bind to amyloidogenic (diseased) forms of the transthyretin (ATTR) protein. Preclinical data published in March 2016 in the journal Amyloid suggest that Prothena's antibodies have unique biological activity that may lead to the prevention of deposition, and enhancement of clearance, of ATTR in patients with both wild type and hereditary TTR-mediated amyloidosis.
Additionally, Prothena has developed a proprietary, high-sensitivity assay that specifically detects circulating misfolded-hATTR in plasma across multiple TTR mutations and can be used in clinical studies to monitor pharmacodynamic response to PRX004 in plasma.
Currently in late-stage preclinical development, Prothena plans to initiate a Phase 1 clinical study of PRX004 for the potential treatment of ATTR amyloidosis. The Phase 1 study is designed as an open-label, dose escalation study to determine the safety, tolerability, pharmacokinetic, pharmacodynamic and maximum tolerated dose of PRX004 and is expected to enroll up to 36 patients with hATTR amyloidosis.
Our Discovery Programs
Our pipeline also includes several discovery-stage programs for neurodegenerative or orphan diseases and includes targets such as tau, Aβ, ALECT2, TDP-43 and others that are implicated in devastating diseases that lack effective therapies such as Alzheimer's disease (AD), ALECT2 amyloidosis, frontotemporal dementia (FTD) and amyotrophic lateral sclerosis (ALS). If promising, we expect to advance programs into preclinical development. New target discovery will focus on the potential treatment of neurodegenerative or orphan indications where we can bring these therapies to patients expeditiously through our internal expertise and resources. Existing late discovery-stage programs with non-orphan indications may be partnered or out-licensed. Targets in our discovery pipeline include the following:
8
|
•
|
Tau
, a protein implicated in diseases including Alzheimer's disease (AD), progressive supranuclear palsy (PSP), frontotemporal dementia (FTD), chronic traumatic encephalopathy (CTE ) and other tauopathies. Prothena has identified antibodies targeting novel epitopes on the tau protein with the potential to block misfolded tau from binding to cells and to inhibit cell-to-cell transmission, preventing downstream toxic functional effects.
|
|
•
|
Aβ, or Amyloid Beta,
a protein implicated in Alzheimer’s disease (AD). Prothena scientists have advanced the understanding of the biology of AD and made particularly impactful and fundamental discoveries that elucidated the role amyloid plays in the disease. Today, Prothena is advancing a new approach to design a more potent anti-Aβ antibody.
|
|
•
|
LECT2
, a protein implicated in ALECT2 amyloidosis. Similar to AL amyloidosis and ATTR amyloidosis, ALECT2 amyloidosis is a rare disease caused by deposits of misfolded aggregated protein in vital organs, most often the kidneys and liver. Prothena has identified novel epitopes on the misfolded forms of the protein
.
|
Regulation
We anticipate that if we commercialize any products, the U.S. market will ultimately be our most important market. For this reason, the laws and regulations discussed below focus on the requirements applicable to biologic products in the U.S.
Government Regulation
Governmental authorities, including the FDA, the EMA and comparable regulatory authorities in other countries, regulate the development, testing, safety, efficacy, labeling, manufacturing, storage, record-keeping, reporting, marketing, advertising, and promotion of pharmaceutical products, including biologics. The FDA does so under the U.S. Federal Food, Drug, and Cosmetic Act and its implementing regulations and guidance for industry, and the U.S. Public Health Service Act and its implementing regulations. Non-compliance with applicable requirements can result in fines and other judicially imposed sanctions, including product seizures, import restrictions, injunctive actions and criminal prosecutions of both companies and individuals. In addition, administrative remedies can involve requests to recall violative products; the refusal of the government to enter into supply contracts; or the refusal to approve pending applications for product approval until manufacturing or other alleged deficiencies are brought into compliance. The FDA and other comparable regulatory authorities also have the authority to cause the withdrawal of approval of a marketed product or to impose additional labeling restrictions.
The pricing of pharmaceutical products is regulated in many countries and the mechanism of price regulation varies. In the U.S., while there are limited indirect federal government price controls over private sector purchases of drugs, it is not possible to predict future regulatory action or private sector initiatives on the pricing of pharmaceutical products.
Product Approval
United States.
In the U.S., our drug candidates are regulated as biologic pharmaceuticals, or biologics. The FDA regulates biologics under the U.S. Food, Drug, and Cosmetics Act, U.S. Public Health Service Act and its implementing regulations. Biologics are also subject to other federal, state and local statutes and regulations. The process required by the FDA before biologic product candidates may be marketed in the U.S. generally involves the following:
|
•
|
submission to the FDA of an Investigational New Drug Application (“IND”), which must become effective before human clinical trials may begin and must be updated annually;
|
|
•
|
completion of extensive nonclinical laboratory tests and animal studies, performed in accordance with the FDA’s Good Laboratory Practice (“GLP”) regulations;
|
|
•
|
performance of adequate and well-controlled human clinical trials to establish the efficacy and safety of the product for each proposed indication, all performed in accordance with FDA’s current good clinical practices (“cGCP”) requirements;
|
|
•
|
submission to the FDA of a BLA for a new biologic, after completion of all required clinical trials;
|
|
•
|
satisfactory completion of an FDA pre-approval inspection of the manufacturing facilities at which the product is produced and tested to assess compliance with regulatory requirements, including current good manufacturing practices (“cGMP”) regulations; and
|
9
|
•
|
FDA review and approval of a BLA for a new biologic, prior to any commercial marketing or sale of the product in the U.S.
|
Nonclinical tests assess the potential safety and efficacy of a product candidate in in vitro and/or in vivo studies. The results of these studies must be submitted to the FDA as part of an IND before human testing may proceed. An IND is a request for authorization from the FDA to administer an investigational drug or biologic product to humans. The IND includes the general investigational plan and the proposed protocol(s) for human studies. The IND also includes results of nonclinical studies and other human studies, as appropriate, as well as manufacturing information, analytical data and any other available data or literature to support the use of the investigational new drug. An IND must become effective before human clinical trials may be initiated. An IND will automatically become effective 30 days after receipt by the FDA, unless before that time the FDA raises concerns or questions related to initiation of the proposed clinical trial(s). In such a case, the IND may be placed on clinical hold and the IND sponsor and the FDA must resolve any outstanding concerns or questions before the clinical trial(s) may begin. Accordingly, submission of an IND may or may not result in the FDA allowing a clinical trial(s) to commence.
Clinical trials involve the administration of the investigational product to human subjects under the supervision of qualified investigators in accordance with cGCPs, which include the requirement that all research subjects provide their informed consent for their participation in any clinical trial. Clinical trials are conducted under protocols detailing, among other things, the objectives of the study, the parameters to be used in monitoring safety, and the efficacy criteria to be evaluated. A protocol for each clinical trial and any subsequent protocol amendments must be submitted to the FDA as part of the IND. Additionally, approval must also be obtained from each clinical trial site’s Institutional Review Board (“IRB”) before the trials may be initiated, and the IRB must provide oversight of the study until completed. There are also requirements governing the reporting of ongoing clinical trials and clinical trial results to public registries.
The clinical investigation of a pharmaceutical, including a biologic, is generally divided into three phases. Although the phases are usually conducted sequentially, they may overlap or be combined. The three phases of an investigation are as follows:
•
Phase 1.
Phase 1 includes the initial introduction of an investigational product into humans. Phase 1 clinical trials are typically closely monitored and may be conducted in patients with the target disease or condition or in healthy volunteers. These studies are designed to evaluate the safety, appropriate dosage, metabolism and pharmacologic actions of the investigational product in humans, the side effects associated with increasing doses, and if possible, to gain early evidence on effectiveness. During Phase 1 clinical trials, sufficient information about the investigational product’s pharmacokinetics and pharmacological effects may be obtained to permit the design of well-controlled Phase 2 clinical trials. The total number of participants included in Phase 1 clinical trials varies, but is generally in the range of 20 to 80;
•
Phase 2.
Phase 2 includes controlled clinical trials conducted to preliminarily or further evaluate the efficacy and safety of the investigational product for a specific indication(s) in patients with the disease or condition under study, to determine dosage for further studies, and to identify possible adverse side effects and safety risks associated with the product. Phase 2 clinical trials are typically well-controlled, closely monitored, and conducted in a limited patient population, usually involving no more than several hundred participants; and
•
Phase 3.
Phase 3 clinical trials are generally controlled clinical trials conducted in an expanded patient population generally at geographically dispersed clinical trial sites. They are performed after preliminary evidence suggesting effectiveness of the product has been obtained, and are intended to further evaluate dosage, efficacy and safety, to establish the overall benefit-risk relationship of the investigational product, and to provide an adequate basis for product approval. Phase 3 clinical trials usually involve several hundred to several thousand participants.
The clinical trial process can take many years to complete, and there can be no assurance that the data collected will support FDA approval of the product. The FDA may place clinical trials on hold at any point in this process if, among other reasons, it concludes that clinical subjects are being exposed to an unacceptable health risk. Trials may also be terminated by IRBs, which must review and approve all research involving human subjects. Side effects or adverse events that are reported during clinical trials can delay, impede or prevent marketing authorization.
The results of the nonclinical and clinical testing, along with information regarding the chemistry, manufacturing and controls of the product and proposed product labeling, are evaluated and, if determined appropriate, submitted to the FDA through a BLA. The application includes all relevant data available from nonclinical and clinical trials, together with detailed information relating to the product’s chemistry, manufacturing, controls and proposed labeling, among other required information. Data from company-sponsored clinical trials intended to test the efficacy and safety of a proposed use of a product, and/or from alternative sources, including studies initiated by investigators may be included in a BLA.
10
Once the BLA submission has been accepted for filing, the FDA’s standard goal is to review applications within ten months of the filing date for Standard Review or, in the case of Priority Review, six months from the filing date. The review process is often significantly extended by FDA requests for additional information or clarification. The FDA reviews the BLA to determine, among other things, whether the proposed product is safe and effective, which includes determining whether it is safe and effective for its intended use, and whether the product is being manufactured in accordance with cGMP to assure and preserve the product’s identity, strength, quality, potency and purity. The FDA may refer the application to an advisory committee for evaluation and recommendation as to whether the application should be approved. The FDA is not bound by the recommendation of an advisory committee, but it typically follows such recommendations.
The FDA has four expedited program designations for serious conditions - Fast Track, Breakthrough Therapy, Accelerated Approval and Priority Review - to facilitate and expedite development and review of new drugs to address unmet medical needs in the treatment of serious or life-threatening conditions. The Fast Track designation provides pharmaceutical manufacturers with opportunities for frequent interactions with FDA during the product’s development and for a rolling review of the BLA. A rolling review allows for completed portions of the application to be submitted and reviewed by the FDA prior to submission of the complete application. The Breakthrough Therapy designation provides sponsors with all of the features of the Fast Track designation as well as intensive guidance on implementing an efficient development program for the product and a commitment by the FDA to involve senior managers and experienced review staff in the review. The Accelerated Approval designation allows the FDA to approve a product based on an effect on a surrogate or intermediate endpoint that is reasonably likely to predict a product’s clinical benefit and generally requires the sponsor to conduct required post-approval confirmatory trials to verify the clinical benefit. The Priority Review designation signifies that the FDA review clock for the BLA is six months, compared to ten months under standard review.
After the FDA evaluates the BLA and conducts pre-approval inspections of manufacturing facilities where the candidate product and/or its active pharmaceutical ingredient will be produced, of clinical sites and of the sponsor, if deemed necessary, it may issue an approval letter or a Complete Response Letter. An approval letter authorizes commercial marketing of the biologic with specific prescribing information for specific indications. A Complete Response Letter indicates that the review cycle of the application is complete and the application is not ready for approval. A Complete Response Letter may require additional clinical data and/or an additional Phase 3 clinical trial(s), and/or other significant, expensive and time-consuming requirements related to clinical trials, nonclinical studies or manufacturing. Even if such additional information is submitted, the FDA may ultimately decide that the BLA does not satisfy the criteria for approval. The FDA could approve the BLA with a Risk Evaluation and Mitigation Strategy (“REMS”) plan to mitigate risks, which could include medication guides, physician communication plans, or elements to assure safe use, such as restricted distribution methods, patient registries and other risk minimization tools. The FDA also may impose conditions for approval including but not limited to, changes to proposed labeling, changes to manufacturing controls and specifications, or a commitment to conduct one or more post-market studies or additional clinical trials. Such post- market commitments may include Phase 4 clinical trials and surveillance to further assess and monitor the product’s safety and effectiveness after commercialization.
European Union
. In Europe, there are several pathways for marketing approval, depending on the type of product for which approval is sought. Under the centralized procedure, a sponsor submits a single application to the EMA. The marketing application is similar to the BLA submitted to FDA in the U.S. and is evaluated by the Committee for Medicinal Products for Human Use (the “CHMP”), the expert scientific committee of the EMA. If the CHMP determines that the marketing application fulfills the requirements for efficacy, safety and quality (equivalent to chemistry, manufacturing and controls in the US), it will submit a favorable opinion to the European Commission (the “EC”). The CHMP opinion is not binding, but is typically adopted by the EC. A marketing application approved by the EC is valid in all EU member states.
In addition to the centralized procedure, the EC also has: (i) national authorization procedures, which requires a separate application in and approval determination by each country; (ii) a decentralized procedure, whereby applicants submit identical applications to several countries and receive simultaneous approval; and (iii) a mutual recognition procedure, where applicants submit an application to one country for review and approval, and other countries may accept or reject the decision in the initial country. Regardless of the approval process employed, various regulatory authorities share responsibilities for the monitoring, detection, and evaluation of adverse events post-approval, including national authorities, the EMA, the EC, and the marketing authorization holder.
Post-Approval Requirements
Any products manufactured or distributed by us or on our behalf pursuant to FDA approvals are subject to continuing regulation by the FDA, including requirements for record-keeping, reporting of adverse events, and submitting biological product deviation reports to notify the FDA of unanticipated changes in distributed products. Additionally, any significant change in the
11
approved product or in how it is manufactured, including changes in formulation or the site of manufacture, generally require prior FDA approval. The packaging and labeling of all products developed by us are also subject to FDA approval and ongoing regulation.
Sponsors are required to register their facilities with the FDA and certain state agencies, and are subject to periodic unannounced inspections by the FDA and certain state agencies for compliance with cGMP standards, which impose certain quality processes, manufacturing controls and documentation requirements upon us and our third-party manufacturers in order to ensure that the product is safe, has the identity and strength, and meets the quality, purity and potency characteristics that it purports to have. Certain states also impose requirements on manufacturers and distributors to establish the pedigree of product in the chain of distribution, including some states that require manufacturers and others to adopt new technology capable of tracking and tracing product as it moves through the distribution chain. Noncompliance with cGMP or other requirements can result in issuance of warning letters, civil and criminal penalties, seizures, and injunctive action.
FDA regulations also require investigation and correction of any deviations from cGMP requirements and impose reporting and documentation requirements upon us and any third-party manufacturers that we may decide to use. Accordingly, manufacturers and sponsors must continue to expend time, money and effort in the area of production and quality control to maintain compliance with cGMP and other aspects of regulatory compliance.
The FDA and other federal and state agencies closely regulate the labeling, marketing and promotion of drugs. While doctors are free to prescribe any product approved by the FDA for any use, a company can only make claims relating to safety and efficacy of a product that are consistent with FDA approval, and the company is allowed to market a drug only for the particular use(s) approved by the FDA. In addition, any claims we make for our products in advertising or promotion must be appropriately balanced with important safety information and otherwise be adequately substantiated. Failure to comply with these requirements can result in adverse publicity, warning letters, corrective advertising, injunctions, potential civil and criminal penalties, criminal prosecution, and agreements with governmental agencies that materially restrict the manner in which a company promotes or distributes drug products. Government regulators, including the Department of Justice and the Office of the Inspector General of the Department of Health and Human Services, as well as state authorities, have increased their scrutiny of the promotion and marketing of drugs.
The FDA also enforces the requirements of the U.S. Prescription Drug Marketing Act, which, among other things, imposes various requirements in connection with the distribution of product samples to physicians. Sales, marketing and scientific/educational grant programs must comply with the U.S. Anti-Kickback Statute, the U.S. False Claims Act, and similar state laws. Pricing and rebate programs must comply with the Medicaid rebate requirements of the U.S. Omnibus Budget Reconciliation Act. We may also be subject to the U.S. Physician Payment Sunshine Act (the “Sunshine Act”) which regulates disclosure of payments to healthcare professionals and providers.
The U.S. Foreign Corrupt Practices Act (the “FCPA”) and U.K. Bribery Act prohibit companies and their representatives from offering, promising, authorizing or making payments to governmental officials (and certain private individuals under the U.K. Bribery Act) for the purpose of obtaining or retaining business abroad. In many countries, the healthcare professionals we interact with may meet the definition of a government official for purposes of the FCPA. Failure to comply with domestic or non-domestic laws could result in various adverse consequences, including possible delay in approval or refusal to approve a product, recalls, seizures, withdrawal of an approved product from the market, the imposition of civil or criminal sanctions and the prosecution of executives overseeing our international operations.
Orphan Drugs
Under the U.S. Orphan Drug Act, the FDA may grant orphan drug designation to drugs intended to treat a rare disease or condition, which is generally defined as a disease or condition that affects fewer than 200,000 individuals in the U.S. Orphan drug designation must be requested before submitting a BLA. In the U.S., orphan drug designation entitles a party to financial incentives such as opportunities for grant funding towards clinical trial costs, tax advantages, and user-fee waivers. After the FDA grants orphan drug designation, the generic identity of the drug and its potential orphan use are disclosed publicly by the FDA. Orphan drug designation does not convey any advantage in, or shorten the duration of, the regulatory review and approval process. The first BLA applicant to receive FDA approval for a particular active ingredient to treat a particular disease with FDA orphan drug designation is entitled to a seven-year exclusive marketing period in the U.S. for that product, for that indication. During the seven-year exclusivity period, the FDA may not approve any other applications to market the same drug for the same orphan indication, except in limited circumstances, such as demonstration of clinical superiority to the product with orphan exclusivity or if FDA finds that the holder of the orphan drug exclusivity has not shown that it can assure the availability of sufficient quantities of the orphan drug to meet the needs of patients with the disease or condition for which the drug was designated. As a result, even if one of our drug candidates receives orphan exclusivity, the FDA can still approve other drugs that
12
have a different active ingredient for use in treating the same indication or disease. Furthermore, the FDA can waive orphan exclusivity if we are unable to manufacture sufficient supply of our product.
Pharmaceutical Coverage, Pricing and Reimbursement
Sales of our products will depend, in part, on the extent to which our products will be covered by third-party payors, such as federal, state and other government health care programs, commercial insurance and managed healthcare organizations. These third-party payors are increasingly reducing reimbursements for medical products, drugs and services. In addition, the U.S. government, state legislatures and other governments have continued implementing cost containment programs, including price controls, restrictions on reimbursement and requirements for substitution of generic products. Adoption of price controls and cost- containment measures, and adoption of more restrictive policies in jurisdictions with existing controls and measures, could further limit our net revenue and results. Decreases in third-party reimbursement for our drug candidates or a decision by a third-party payor to not cover our drug candidates could reduce physician usage of our products once approved and have a material adverse effect on our sales, results of operations and financial condition.
Other Healthcare Laws
Although we currently do not have any products on the market, if our drug candidates are approved and we begin commercialization, we may be subject to additional healthcare regulation and enforcement by the federal government and by authorities in the states and other jurisdictions in which we conduct our business. Such laws include, without limitation, anti-kickback, fraud and abuse, false claims, privacy and security and physician sunshine laws and regulations. If our operations are found to be in violation of any of such laws or any other governmental regulations that apply to us, we may be subject to penalties, including, without limitation, civil and criminal penalties, damages, fines, the curtailment or restructuring of our operations, exclusion from participation in federal and state healthcare programs and imprisonment, any of which could adversely affect our ability to operate our business and our financial results.
Intellectual Property
We seek to protect our proprietary technology and other intellectual property that we believe is important to our business, including by seeking, maintaining and defending patents. We also rely on trade secrets and know-how to protect our business. We seek licenses from others as appropriate to enhance or maintain our competitive position.
Our intellectual property is primarily directed to immunological approaches to the treatment of diseases that involve amyloid or cell adhesion, and other proprietary technologies and processes related to our lead product development candidates.
We own or hold exclusive licenses to a number of issued U.S. patents and pending U.S. patent applications, as well as issued non-U.S. patents and pending Patent Cooperation Treaty applications and non-U.S. counterparts. As of December 31, 2017, our patent portfolio included the following patents or patent applications that we own or have exclusively licensed from other parties:
|
•
|
Approximately 6 patent families related to AL or AA amyloidosis, including our NEOD001 program;
|
|
•
|
Approximately 14 patent families related to Parkinson’s disease and other synucleinopathies, including our PRX002 program;
|
|
•
|
Approximately 13 patent families related to inflammatory diseases including psoriasis, including our PRX003 program;
|
|
•
|
Approximately 7 patent families related to ATTR amyloidosis, including our PRX004 program; and
|
|
•
|
Approximately 12 patent families related to other potential targets of intervention and diseases.
|
The term of individual patents depends upon the legal term of the patents in the countries in which they are obtained. In most countries in which we file, the patent term is 20 years from the date of filing the non-provisional application. In the U.S., a patent’s term may be lengthened by patent term adjustment, which compensates a patentee for administrative delays by the U.S. Patent and Trademark Office in granting a patent, or may be shortened if a patent is terminally disclaimed over an earlier-filed patent.
The term of a patent that covers an FDA-approved drug may also be eligible for patent term extension, which permits patent term restoration of a U.S. patent as compensation for the patent term lost during the FDA regulatory review process. The U.S. Hatch-Waxman Act permits a patent term extension of up to five years beyond the expiration of the patent. The length of the patent term extension is related to the length of time the drug is under regulatory review. A patent term extension cannot extend the remaining term of a patent beyond a total of 14 years from the date of product approval and only one patent applicable to an approved drug may be extended. Moreover, a patent can only be extended once, and thus, if a single patent is applicable to
13
multiple products, it can only be extended based on one product. Similar provisions are available in Europe and other jurisdictions to extend the term of a patent that covers an approved drug. When possible, depending upon the length of clinical trials and other factors involved in the filing of a BLA, we expect to apply for patent term extensions for patents covering our product candidates and their methods of use.
The patents referenced above have expiration dates ranging from 2020 through 2038 (excluding any available patent term extensions).
University of Tennessee License Agreement:
Under a License Agreement with the University of Tennessee Research Foundation, we have exclusively licensed from the University of Tennessee its joint ownership interest in certain patents jointly owned with us. Those patents relate to our program targeting amyloidosis. Under that sublicensable, worldwide license, we are required to pay to the University of Tennessee an amount equal to 1% of net sales of any product covered by any licensed patent, plus certain additional payments in the event that all or a portion of the license is sublicensed. To date, we have not paid or incurred any royalties to the University of Tennessee under our agreement. The agreement is effective on a country-by-country basis for the longer of (i) a period of twenty years from the effective date of the agreement, or (ii) in each country in which a valid claim for any licensed patent or patent application exists, expiration of such valid claim. The agreement will terminate prior to the end of its term if we become insolvent unless the University of Tennessee elects to allow the agreement to remain in effect. The University of Tennessee may terminate the agreement prior to the end of its term upon our failure to make payment under the agreement within 120 days of notice of such failure or upon our material breach of the agreement, which breach has not been cured within 60 days of written notice of such breach. We may terminate the agreement prior to the end of its term if we have paid all amounts due to the University of Tennessee through the effective date of the termination and provide three months’ written notice to the University of Tennessee or upon material breach of the agreement by the University of Tennessee, which breach has not been cured within 60 days of written notice of such breach.
University of California License Agreement:
Under a License Agreement with The Regents of the University of California, we have exclusively licensed from the University of California its joint ownership interest in certain patents jointly owned with us. Those patents relate to our program targeting α
-
synuclein. Under that sublicensable, worldwide license, we are required to pay to the University of California an amount equal to 1% of net sales of any product covered by any licensed patent, plus certain additional payments for milestones achieved and sublicense revenue. To date, we have not paid or incurred any royalties to the University of California under our agreement. The agreement is effective until the expiration date of the last to expire licensed patent. The obligation to pay royalties continues on a country-by-country basis until the expiration of the last to expire patent containing a valid claim covering the applicable product. The agreement will terminate prior to the end of its term without prior written notice if (i) we, or third parties on our behalf or at our written urging, file a claim including an assertion that any portion of the licensed patents is invalid or unenforceable, or (ii) upon the filing of a petition for relief under the U.S. Bankruptcy Code by or against us as a debtor or alleged debtor. The University of California may terminate the agreement prior to the end of its term upon our default, if we fail to cure the default within 60 days of written notice of such default. We may terminate the agreement prior to the end of its term upon a 90 day written notice to the University of California.
Elan License Agreement:
Under an Amended and Restated Intellectual Property License and Contribution Agreement with Elan and certain of its affiliates, we have exclusively licensed from Elan and those affiliates certain patents and patent applications owned by them, and exclusively sublicensed from Elan and those affiliates certain patents and patent applications owned by Janssen Alzheimer Immunotherapy. Those licenses are worldwide, fully paid, royalty-free, perpetual and irrevocable, and relate to our program targeting α
-
synuclein. Subsequent to entering into this Agreement, Elan was acquired by Perrigo Company plc.
Competition
The pharmaceutical industry is highly competitive. Our principal competitors consist of major international companies, all of which are larger and have greater financial resources, technical staff, manufacturing, R&D and marketing capabilities than we have. We also compete with smaller research companies and generic drug and biosimilar manufacturers. The degree of competition varies for each of our programs.
A drug may be subject to competition from alternative therapies during the period of patent protection or regulatory exclusivity and thereafter it may be subject to further competition from generic products or biosimilars. Governmental and other pressures toward the dispensing of generic products or biosimilars may rapidly and significantly reduce, slow or reverse the growth, sales and profitability of any product not protected by patents or regulatory exclusivity, and may adversely affect our future results and financial condition. If we successfully discover, develop and commercialize any products, the launch of competitive products, including generic or biosimilar versions of any such products, may have a material adverse effect on our revenues and results of operations.
14
Our competitive position depends in part upon our ability to discover and develop innovative and cost-effective new products. If we fail to discover and develop new products, our business, financial condition and results of operations will be materially and adversely affected.
Manufacturing
We do not own or operate facilities for the manufacture, packaging, labeling, storage, testing or distribution of preclinical or clinical supplies of any of our drug candidates. We instead contract with and rely on third-parties to manufacture, package, label, store, test and distribute all pre-clinical development and clinical supplies of our drug candidates, and we plan to continue to do so for the foreseeable future. We also rely on third-party consultants to assist us with managing these third-parties and with our manufacturing strategy.
NEOD001
- Boehringer Ingelheim Biopharmaceuticals GmbH (“BI”) has manufactured and is contracted to continue to manufacture clinical supplies of our drug candidate NEOD001 for all of its clinical trials. We are dependent on BI to continue to manufacture these clinical supplies.
We have contracted with Rentschler Biopharma SE (formerly known as Rentschler Biotechnologie GmbH) (“Rentschler”) to develop the capability to manufacture and supply drug substance of NEOD001, and to so supply NEOD001 to us for worldwide commercial sale purposes if we apply for and obtain regulatory approval to market NEOD001. In order to be able to use drug substance supplied by Rentschler for commercial purposes, we will need to first establish comparability of drug substance manufactured by Rentschler with clinical supplies manufactured by BI and used by us in clinical development of NEOD001.
We have contracted with BI to develop the capability to manufacture and supply drug substance of NEOD001, and to so supply NEOD001 to us for worldwide commercial sale purposes if we apply for and obtain regulatory approval to market NEOD001. In order to be able to use drug substance supplied by BI for commercial purposes, we will need to first establish a validated manufacturing process and obtain regulatory approval to use such drug substance for commercial purposes.
PRX002/RG7935
- BI manufactured clinical supplies of our drug candidate PRX002/RG7935 for our completed Phase 1a single ascending dose and Phase 1b multiple ascending dose clinical trials. Roche, with whom we are collaborating on development of PRX002/RG7935, is manufacturing clinical supplies for the Phase 2 and any subsequent clinical trials for PRX002/RG7935. We are dependent on Roche to manufacture these clinical supplies.
PRX004
- Rentschler is our third party manufacturer of clinical supplies of our drug candidate PRX004. We are dependent on Rentschler to manufacture these clinical supplies in order to initiate clinical trials for PRX004.
Research and Development
Our research and development expenses totaled
$134.5 million
,
$119.5 million
and
$58.4 million
in 2017, 2016 and 2015, respectively. For more information, see “Management’s Discussion and Analysis of Financial Condition and Results of Operations.”
Employees
As of
December 31, 2017
, we had
125
employees, of whom
83
were engaged in research and development activities and the remainder were working in general and administrative areas.
Information about Segment and Geographic Revenue
Information about segment and geographic revenue is set forth in Note 2 to the Consolidated Financial Statements included in this report.
Available information
Our principal executive office is at Adelphi Plaza, Upper George’s Street, Dún Laoghaire, Co. Dublin, A96 T927, Ireland, and our telephone number at that address is 011-353-1-236-2500. We are subject to the information and periodic reporting requirements of the Securities Exchange Act of 1934, as amended, and, in accordance therewith, file periodic reports, proxy statements and other information with the U.S. Securities and Exchange Commission (the “SEC”). Such periodic reports, proxy statements and other information are available for inspection and copying at the SECs Public Reference Room at 100 F Street, NE., Washington, DC 20549 or may be obtained by calling the SEC at 1-800-SEC-0330. In addition, the SEC maintains a website at www.sec.gov that contains reports, proxy statements and other information regarding issuers that file electronically with the
15
SEC. We also post on the Investors page of our website, www.prothena.com, a link to our filings with the SEC, our Corporate Governance Guidelines and Code of Conduct, which applies to all directors and employees, and the charters of our Audit, Compensation and Nominating and Corporate Governance Committees of our Board of Directors. Our filings with the SEC are posted on our website and are available free of charge as soon as reasonably practical after they are filed electronically with the SEC. Please note that information contained on our website is not incorporated by reference in, or considered to be a part of, this report. You can also obtain copies of these documents free of charge by writing or telephoning us at: Prothena Corporation plc, Adelphi Plaza, Upper George’s Street, Dún Laoghaire, Co. Dublin, A96 T927, Ireland, 011-353-1-236-2500, or through the Investors page of our website.
You should carefully consider the risks described below, together with all of the other information included in this Form 10-K, in considering our business and prospects. Set forth below and elsewhere in this report and in other documents we file with the SEC are descriptions of certain risks, uncertainties and other factors that could cause our actual results to differ materially from those anticipated. If any of the following risks, other unknown risks or risks that we think are immaterial occur, our business, financial condition, results of operations, cash flows or growth prospects could be adversely impacted, which could result in a complete loss on your investment.
Risks Relating to Our Financial Position, Our Need for Additional Capital and Our Business
We anticipate that we will incur losses for the foreseeable future and we may never sustain profitability.
We may not generate the cash that is necessary to finance our operations in the foreseeable future. We incurred net losses of
$153.2 million
,
$160.1 million
and
$80.6 million
for the years ended December 31, 2017, 2016 and 2015, respectively. We expect to continue to incur substantial losses for the foreseeable future as we:
|
•
|
conduct our Phase 2b, Phase 3 and open label extension (“OLE”) clinical trials for NEOD001, support the Phase 2 clinical trial for PRX002/RG7935 being conducted by Roche and initiate additional clinical trials for these and other programs, including PRX004;
|
|
•
|
develop and commercialize our product candidates, including NEOD001, PRX002/RG7935 and PRX004;
|
|
•
|
undertake nonclinical development of other product candidates and initiate clinical trials, if supported by positive nonclinical data; and
|
|
•
|
pursue our early stage research and seek to identify additional drug candidates and potentially acquire rights from third parties to drug candidates through licenses, acquisitions or other means.
|
We must generate significant revenue to achieve and maintain profitability. Even if we succeed in discovering, developing and commercializing one or more drug candidates, we may not be able to generate sufficient revenue and we may never be able to achieve or sustain profitability.
We will require additional capital to fund our operations, and if we are unable to obtain such capital, we will be unable to successfully develop and commercialize drug candidates.
As of
December 31, 2017
, we had cash and cash equivalents of
$417.6 million
. Although we believe, based on our current business plans, that our existing cash and cash equivalents will be sufficient to meet our obligations for at least the next twelve months, we anticipate that we will require additional capital in the future in order to continue the research and development, and eventually commercialization, of our drug candidates. Our future capital requirements will depend on many factors that are currently unknown to us, including, without limitation:
|
•
|
the timing of initiation, progress, results and costs of our clinical trials, including our Phase 2b, Phase 3 and OLE clinical trials for NEOD001, the Phase 2 clinical trial for PRX002/RG7935 and our planned Phase 1 clinical trial for PRX004;
|
|
•
|
the timing, initiation, progress, results and costs of these and our other research, development and commercialization activities;
|
|
•
|
the results of our research and nonclinical studies;
|
|
•
|
the costs of manufacturing our drug candidates for clinical development as well as for future commercialization needs;
|
16
|
•
|
the costs of preparing for commercialization of our drug candidates, in particular NEOD001;
|
|
•
|
the costs of preparing, filing and prosecuting patent applications and maintaining, enforcing and defending intellectual property-related claims;
|
|
•
|
our ability to establish research collaborations, strategic collaborations, licensing or other arrangements;
|
|
•
|
the costs to satisfy our obligations under potential future collaborations; and
|
|
•
|
the timing, receipt, and amount of revenues or royalties, if any, from any approved drug candidates.
|
We have based our expectations relating to liquidity and capital resources on assumptions that may prove to be wrong, and we could use our available capital resources sooner than we currently expect. Because of the numerous risks and uncertainties associated with the development and commercialization of our product candidates, we are unable to estimate the amounts of increased capital outlays and operating expenses associated with completing the development and commercialization of our current product candidates.
In the pharmaceutical industry, the research and development process is lengthy and involves a high degree of risk and uncertainty. This process is conducted in various stages and, during each stage, there is a substantial risk that product candidates in our research and development pipeline will experience difficulties, delays or failures. This makes it difficult to estimate the total costs to complete our ongoing clinical trials and to estimate anticipated completion dates with any degree of accuracy, which raises concerns that attempts to quantify costs and provide estimates of timing may be misleading by implying a greater degree of certainty than actually exists.
In order to develop and obtain regulatory approval for our product candidates we will need to raise substantial additional funds. We expect to raise any such additional funds through public or private equity or debt financings, collaborative agreements with corporate partners or other arrangements. We cannot assure you that additional funds will be available when we need them on terms that are acceptable to us, or at all. General market conditions may make it very difficult for us to seek or obtain financing from the capital markets. If we raise additional funds by issuing equity securities, substantial dilution to existing shareholders would result. If we raise additional funds by incurring debt financing, the terms of the debt may involve significant cash payment obligations as well as covenants and specific financial ratios that may restrict our ability to operate our business. We may be required to relinquish rights to our technologies or drug candidates or grant licenses on terms that are not favorable to us in order to raise additional funds through strategic alliances, joint ventures or licensing arrangements.
If adequate funds are not available on a timely basis, we may be required to:
|
•
|
terminate or delay clinical trials or other development for one or more of our drug candidates;
|
|
•
|
delay arrangements for activities that may be necessary to commercialize our drug candidates;
|
|
•
|
curtail or eliminate our drug research and development programs that are designed to identify new drug candidates; or
|
|
•
|
cease operations.
|
In addition, if we do not meet our payment obligations to third parties as they come due, we may be subject to litigation claims. Even if we are successful in defending against these claims, litigation could result in substantial costs and distract management, and may have unfavorable results that could further adversely impact our financial condition.
The United Kingdom
’
s announced withdrawal from the European Union could have a negative effect on global economic conditions and financial markets, EU regulatory procedures and our business.
In June 2016, a majority of voters in the United Kingdom (the “UK”) elected in a national referendum to withdraw from the European Union (the “EU”). In March 2017, the UK government formally initiated the withdrawal process. That pending withdrawal, currently scheduled to occur in or before March 2019, has created significant uncertainty about the future relationship between the UK and the EU, including with respect to the laws and regulations that will apply as the UK determines which EU laws to replace or replicate upon withdrawal. The pending withdrawal has also given rise to calls for the governments of other EU member states to consider withdrawal. These developments, or the perception that any of them could occur, have had and may continue to have a material adverse effect on global economic conditions and the stability of global financial markets, and may significantly reduce global market liquidity and restrict the ability of key market participants to operate in certain financial markets. Any of these factors could depress economic activity and restrict access to capital, which could have a material adverse effect on our business, financial condition, results of operations and growth prospects.
17
The UK’s withdrawal from the EU also means that the European Medicines Agency (the “EMA”), from which we must obtain approval to sell any product in the EU, is scheduled to relocate from its current headquarters in the UK to new headquarters in the Netherlands in early 2019. This relocation of the EMA could significantly disrupt its operations, which could cause delays in the EMA’s review and approval of marketing authorization applications. Such a disruption could impact our future applications for EMA approval of our drug candidates, including NEOD001, which could have a material adverse effect on our business, financial condition and results of operations and growth prospects.
Our future success depends on our ability to retain key personnel and to attract, retain and motivate qualified personnel.
We are highly dependent on key personnel, including Dr. Gene G. Kinney, our President and Chief Executive Officer. There can be no assurance that we will be able to retain Dr. Kinney or any of our key personnel. The loss of the services of Dr. Kinney or any other person on whom we are highly dependent might impede the achievement of our research, development and commercial objectives.
Recruiting and retaining qualified scientific and other personnel are critical to our growth and future success. Competition for qualified personnel in our industry is intense. We may not be able to attract and retain these personnel on acceptable terms given that competition. Failure to recruit and retain qualified personnel could have a material adverse effect on our business, financial condition, results of operations and growth prospects.
Our collaborators, prospective collaborators and suppliers may need assurances that our financial resources and stability on a stand-alone basis are sufficient to satisfy their requirements for doing or continuing to do business with us.
Some of our collaborators, prospective collaborators and suppliers may need assurances that our financial resources and stability on a stand-alone basis are sufficient to satisfy their requirements for doing or continuing to do business with us. If our collaborators, prospective collaborators or suppliers are not satisfied with our financial resources and stability, it could have a material adverse effect on our ability to develop our drug candidates, enter into licenses or other agreements and on our business, financial condition or results of operations.
The agreements we entered into with Elan involve conflicts of interest and therefore may have materially disadvantageous terms to us.
We entered into certain agreements with Elan in connection with our separation from Elan, which set forth the main terms of the separation and provided a framework for our initial relationship with Elan. These agreements may have terms that are materially disadvantageous to us or are otherwise not as favorable as those that might be negotiated between unaffiliated third parties. In December 2013, Elan was acquired by Perrigo Company plc (“Perrigo”), and in February 2014 Perrigo caused Elan to sell all of its shares of Prothena in an underwritten offering. As a result of the acquisition of Elan by Perrigo and the subsequent sale of all of its shares of Prothena, Perrigo may be less willing to collaborate with us in connection with the agreements to which we and Elan are a party and other matters.
We may be adversely affected by earthquakes or other natural disasters
We have a key facility and operations in the San Francisco Bay Area of Northern California, which in the past has experienced severe earthquakes. If an earthquake, other natural disaster or similar event were to occur and prevent us from using all or a significant portion of those operations or local critical infrastructure, or that otherwise disrupts our operations, it could be difficult or, in certain cases, impossible for us to continue our business for a substantial period of time. We have disaster recovery and business continuity plans, but they may prove to be inadequate in the event of a natural disaster or similar event. We may incur substantial expenses if our disaster recovery and business continuity plans prove to be inadequate. We do not carry earthquake insurance. Furthermore, third parties upon which we are materially dependent upon may be vulnerable to natural disasters or similar events. Accordingly, such a natural disaster or similar event could have an adverse effect on our business, financial condition or results of operations.
We may experience breaches or similar disruptions of our information technology systems or data.
Our business is increasingly dependent on critical, complex and interdependent information technology systems to support business processes as well as internal and external communications. The size and complexity of those systems make them vulnerable to breakdown, malicious intrusion and computer viruses. We have developed systems and processes that are designed to protect our information technology systems and prevent data loss and other security breaches, including systems and processes designed to reduce the impact of a security breach. However, such measures cannot provide absolute security. Any breakdown, malicious intrusion or computer virus could result in the impairment of key business processes or breach of data security, which could cause us to lose trade secrets or other intellectual property or lead to unauthorized disclosure of personal data of our employees, third
18
parties with which we do business, clinical trial participants or others. Such an event could have an adverse effect on our business, financial condition or results of operations.
We are subject to increasingly complex data protection laws and regulations.
We are subject to various data protection laws and regulations, which are expanding and becoming more complex. In April 2016, the EU General Data Protection Regulation (the “GDPR”) was adopted in the EU and is intended to supersede the current EU Data Protection Directive in May 2018. Under the GDPR, enhanced data protection requirements as well as substantial fines for breaches of personal data will apply and increase our obligations and potential liabilities for the personal data that we process or control. We may be required to implement additional controls to facilitate compliance with the GDPR and other new or evolving data protection laws and regulations. Ensuring our compliance with these laws and regulations involves substantial costs, and it is possible that governmental authorities or third parties will assert that our business practices fail to comply with these laws and regulations. If our operations are found to be in violation of any of such laws and regulations, we may be subject to significant civil, criminal and administrative damages, penalties and fines, as well as reputational harm, which could have a material adverse effect on our business, financial condition or results of operations.
We could be adversely impacted by tax reform in the United States.
The U.S. Tax Cuts and Jobs Act (the “TCJA”) was signed into law on December 22, 2017. The TCJA significantly changes U.S. tax law and includes numerous provisions that will impact our business going forward, including changes to the U.S. federal statutory tax rate, the repeal of alternative minimum tax and additional limits on the deductibility of executive compensation, among other things. Some of those effects are expected to be positive for us, such as the lower statutory tax rate and repeal of the alternative minimum taxes. However, other effects are expected to negative for us, such as the expanded limitations on the deductibility of compensation paid to certain of our executive officers. We have not yet completed an assessment of the impact on us of the TCJA. The actual net effect could be adverse.
Risks Related to the Discovery, Development and Regulatory Approval of Drug Candidates
Our success is largely dependent on the success of our research and development programs. Our drug candidates are in various stages of development and we may not be able to successfully discover, develop, obtain regulatory approval for or commercialize any drug candidates.
The success of our business depends substantially upon our ability to discover, develop, obtain regulatory approval for and commercialize our drug candidates successfully. Our research and development programs are prone to the significant and likely risks of failure inherent in drug development. We intend to continue to invest most of our time and financial resources in our research and development programs.
Although we have ongoing Phase 2b, Phase 3 and OLE clinical trials for NEOD001, have an ongoing Phase 2 clinical trial for PRX002/RG7935 and are planning a Phase 1 clinical trial for PRX004, there is no assurance that this work will support further development of these drug candidates. In addition, we currently do not, and may never, have any other drug candidates in clinical trials and we have not identified drug candidates for many of our research programs.
Before obtaining regulatory approvals for the commercial sale of any drug candidate for a target indication, we must demonstrate with substantial evidence gathered in adequate and well-controlled clinical trials, and that the drug candidate is safe and effective for use for that target indication. In the U.S., this must be done to the satisfaction of the U.S. Food and Drug Administration (the “FDA”); in the EU this must be done to the satisfaction of the EMA; and in other countries this must be done to the satisfaction of comparable regulatory authorities.
Satisfaction of these and other regulatory requirements is costly, time consuming, uncertain, and subject to unanticipated delays. Despite our efforts, our drug candidates may not:
|
•
|
offer improvement over existing treatment options;
|
|
•
|
be proven safe and effective in clinical trials; or
|
|
•
|
meet applicable regulatory standards.
|
Positive results in nonclinical studies of a drug candidate may not be predictive of similar results in humans during clinical trials, and promising results from early clinical trials of a drug candidate may not be replicated in later clinical trials. Interim results of a clinical trial do not necessarily predict final results. A number of companies in the pharmaceutical and biotechnology industries have suffered significant setbacks in late-stage clinical trials even after achieving promising results in early-stage development. Accordingly, the results from completed nonclinical studies and clinical trials for our drug candidates may not be predictive of
19
the results we may obtain in later stage trials or studies. Our nonclinical studies or clinical trials may produce negative or inconclusive results, and we may decide, or regulators may require us, to conduct additional nonclinical studies or clinical trials, or to discontinue clinical trials altogether.
Furthermore, we have not marketed, distributed or sold any products. Our success will, in addition to the factors discussed above, depend on the successful commercialization of our drug candidates, which may require:
|
•
|
obtaining and maintaining commercial manufacturing arrangements with third-party manufacturers;
|
|
•
|
developing the marketing and sales capabilities, internal and/or in collaboration with pharmaceutical companies or contract sales organizations, to market and sell any approved drug; and
|
|
•
|
acceptance of any approved drug in the medical community and by patients and third-party payors.
|
Many of these factors are beyond our control. We do not expect any of our drug candidates to be commercially available for several years and some or all may never become commercially available. Accordingly, we may never generate revenues through the sale of products.
If clinical trials of our drug candidates are prolonged, delayed, suspended or terminated, we may be unable to commercialize our drug candidates on a timely basis, which would require us to incur additional costs and delay our receipt of any revenue from potential product sales.
We cannot predict whether we will encounter problems with our Phase 2b, Phase 3 or OLE clinical trials for NEOD001, the Phase 2 clinical trial for PRX002/RG7935, our planned Phase 1 clinical trial for PRX004 or any other or future clinical trials that will cause us or any regulatory authority to delay or suspend those clinical trials or delay the analysis of data derived from them. A number of events, including any of the following, could delay the completion of our ongoing or planned clinical trials and negatively impact our ability to obtain regulatory approval for, and to market and sell, a particular drug candidate:
|
•
|
conditions imposed on us by the FDA, the EMA or other comparable regulatory authorities regarding the scope or design of our clinical trials;
|
|
•
|
delays in obtaining, or our inability to obtain, required approvals from institutional review boards (“IRBs”) or other reviewing entities at clinical sites selected for participation in our clinical trials;
|
|
•
|
insufficient supply or deficient quality of our drug candidates or other materials necessary to conduct our clinical trials;
|
|
•
|
delays in obtaining regulatory agency agreement for the conduct of our clinical trials;
|
|
•
|
lower than anticipated enrollment and/or retention rate of subjects in our clinical trials, which can be impacted by a number of factors, including size of patient population, design of trial protocol, trial length, eligibility criteria, perceived risks and benefits of the study drug, patient proximity to trial sites, patient referral practices of physicians, availability of other treatments for the relevant disease and competition from other clinical trials;
|
|
•
|
slower than expected rates of events in trials with a composite primary endpoint that is event-based, such as our Phase 3 trial for NEOD001, in which all-cause mortality and/or cardiac hospitalizations are primary endpoints;
|
|
•
|
serious and unexpected drug-related side effects experienced by subjects in clinical trials; or
|
|
•
|
failure of our third-party contractors and collaborators to meet their contractual obligations to us or otherwise meet their development or other objectives in a timely manner.
|
We are dependent upon Roche with respect to further development of PRX002/RG7935. Under the terms of our collaboration with Roche, Roche is responsible for that further development, including the conduct of the ongoing Phase 2 clinical trial and any future clinical trial of that drug candidate.
Clinical trials may also be delayed or terminated as a result of ambiguous or negative data or results. In addition, a clinical trial may be suspended or terminated by us, the FDA, the EMA or other comparable regulatory authorities, the IRBs at the sites where the IRBs are overseeing a trial, or the safety oversight committee overseeing the clinical trial at issue due to a number of factors, including:
|
•
|
failure to conduct the clinical trial in accordance with regulatory requirements or our clinical protocols;
|
20
|
•
|
inspection of the clinical trial operations or trial sites by the FDA, the EMA or other regulatory authorities resulting in the imposition of a clinical hold on or imposition of additional conditions for the conduct of the trial;
|
|
•
|
interpretation of data by the FDA, the EMA or other regulatory authorities;
|
|
•
|
requirement by the FDA, the EMA or other regulatory authorities to perform additional studies;
|
|
•
|
failure to achieve primary or secondary endpoints or other failure to demonstrate efficacy or adequate safety;
|
|
•
|
unforeseen safety issues; or
|
|
•
|
lack of adequate funding to continue the clinical trial.
|
Additionally, changes in regulatory requirements and guidance may occur and we may need to amend clinical trial protocols to reflect these changes. Amendments may require us to resubmit our clinical trial protocols to regulatory authorities and IRBs for reexamination, which may impact the cost, timing or successful completion of a clinical trial.
We do not know whether our clinical trials will be conducted as planned, will need to be restructured or will be completed on schedule, if at all. Delays in our clinical trials will result in increased development costs for our drug candidates. In addition, if we experience delays in the completion of, or if we terminate, any of our clinical trials, the commercial prospects for our drug candidates may be delayed or harmed and our ability to generate product revenues will be delayed or jeopardized. Furthermore, many of the factors that cause, or lead to, a delay in the commencement or completion of clinical trials may also ultimately lead to the denial of regulatory approval of a drug candidate.
The regulatory approval processes of the FDA, the EMA and other comparable regulatory authorities are lengthy, time consuming and inherently unpredictable, and if we are ultimately unable to obtain regulatory approval for our drug candidates, our business will be substantially harmed.
The time required to obtain approval by the FDA, the EMA and other comparable regulatory authorities is inherently unpredictable but typically takes many years following the commencement of clinical trials and depends upon numerous factors, including the substantial discretion of the regulatory authorities. In addition, approval policies, regulations, or the type and amount of clinical data necessary to gain approval may change during the course of a drug candidate’s clinical development and may vary among jurisdictions. We have not obtained regulatory approval for any drug candidate and it is possible that none of our existing drug candidates or any drug candidates we may seek to develop in the future will ever obtain regulatory approval.
Our drug candidates could fail to receive regulatory approval for many reasons, including the following:
|
•
|
the FDA, the EMA or comparable regulatory authorities may disagree with the design, implementation or conduct of our clinical trials;
|
|
•
|
we may be unable to demonstrate to the satisfaction of the FDA, the EMA or comparable regulatory authorities that a drug candidate is safe and effective for its proposed indication;
|
|
•
|
the results of clinical trials may not meet the level of statistical significance required by the FDA, the EMA or comparable regulatory authorities for approval;
|
|
•
|
we may be unable to demonstrate that a drug candidate’s clinical and other benefits outweigh its safety risks;
|
|
•
|
the FDA, the EMA or comparable regulatory authorities may disagree with our interpretation of data from nonclinical studies or clinical trials;
|
|
•
|
the data collected from clinical trials of our drug candidates may not be sufficient to support the submission of a Biologic License Application (“BLA”) to the FDA, a Marketing Authorization Application (“MAA”) to the EMA or similar applications to comparable regulatory authorities;
|
|
•
|
the FDA, the EMA or comparable regulatory authorities may fail to approve the manufacturing processes or facilities of third-party manufacturers with which we contract for clinical and commercial supplies; or
|
|
•
|
the approval policies or regulations of the FDA, the EMA or comparable regulatory authorities may significantly change in a manner rendering our clinical data insufficient for approval.
|
This lengthy approval process as well as the unpredictability of future clinical trial results may result in our failing to obtain regulatory approval to market our drug candidates, which would significantly harm our business, results of operations and prospects.
21
In addition, even if we were to obtain approval, regulatory authorities may approve any of our drug candidates for fewer or more limited indications than we request, may grant approval contingent on the performance of costly post-marketing clinical trials, or may approve a drug candidate with a label that does not include the labeling claims necessary or desirable for the successful commercialization of that drug candidate. Any of the foregoing scenarios could materially harm the commercial prospects for our drug candidates.
We rely on obtaining and maintaining orphan drug exclusivity for NEOD001, if approved, but cannot ensure that we will enjoy market exclusivity in a particular market.
NEOD001 has been granted orphan drug designation by the FDA and the EMA for the treatment of AL amyloidosis. Under the U.S. Orphan Drug Act, the FDA may designate a product as an orphan drug if it is intended to treat a rare disease or condition, defined as a disease or condition that affects a patient population of fewer than 200,000 in the U.S., or a patient population greater than 200,000 in the U.S. where there is no reasonable expectation that the cost of developing the drug will be recovered from sales in the U.S. In the EU, the EMA’s Committee for Orphan Medicinal Products grants orphan drug designation to promote the development of products that are intended for the diagnosis, prevention, or treatment of a life-threatening or chronically debilitating condition affecting not more than five in 10,000 persons in the EU. Additionally, designation is granted for products intended for the diagnosis, prevention, or treatment of a life-threatening, seriously debilitating or serious and chronic condition when, without incentives, it is unlikely that sales of the drug in the EU would be sufficient to justify the necessary investment in developing the drug or biological product or where there is no satisfactory method of diagnosis, prevention, or treatment, or, if such a method exists, the medicine must be of significant benefit to those affected by the condition.
In the U.S., orphan drug designation entitles a party to financial incentives such as opportunities for grant funding towards clinical trial costs, tax advantages, and user-fee waivers. In addition, if a product receives the first FDA approval for the indication for which it has orphan designation, the product is entitled to orphan drug exclusivity, which means the FDA may not approve any other application to market the same drug for the same indication for a period of seven years, except in limited circumstances, such as a showing of clinical superiority over the product with orphan exclusivity or where the manufacturer is unable to assure sufficient product quantity. In the EU, orphan drug designation entitles a party to financial incentives such as reduction of fees or fee waivers and ten years of market exclusivity following drug or biological product approval. This period may be reduced to six years if the orphan drug designation criteria are no longer met, including where it is shown that the product is sufficiently profitable not to justify maintenance of market exclusivity.
Even though we have obtained orphan drug designation for NEOD001 in the U.S. and the EU, we may not be the first to obtain marketing approval for any particular orphan indication due to the uncertainties associated with developing pharmaceutical products. Further, even if we obtain orphan drug designation for a product, that exclusivity may not effectively protect the product from competition from different drugs with different active moieties which may be approved for the same condition. Orphan drug designation neither shortens the development time or regulatory review time of a drug nor gives the drug any advantage in the regulatory review or approval process. Even if one of our drug candidates receives orphan exclusivity, the FDA or EMA may still approve other drugs that have a different active ingredient for use in treating the same indication or disease, or may approve an application to market the same drug for the same indication that shows clinical superiority over our product. Furthermore, the FDA or EMA may waive orphan exclusivity if we are unable to manufacture sufficient supply of our product.
Even if our drug candidates receive regulatory approval in one country or jurisdiction, we may never receive approval or commercialize our products in other countries or jurisdictions.
In order to market drug candidates in a particular country or jurisdiction, we must establish and comply with numerous and varying regulatory requirements of that country or jurisdiction, including with respect to safety and efficacy. Approval procedures vary among countries and can involve additional product testing and additional administrative review periods. The time required to obtain approval in other countries might differ from that required to obtain, for example, FDA approval in the U.S. or EMA approval in the EU. The regulatory approval process in other countries may include all of the risks detailed above regarding FDA approval in the U.S. and EMA approval in the EU as well as other risks. Regulatory approval in one country or jurisdiction does not ensure regulatory approval in another country or jurisdiction, but a failure or delay in obtaining regulatory approval in one country may have a negative effect on the regulatory process in others. Failure to obtain regulatory approval in one country or jurisdiction or any delay or setback in obtaining such approval would impair our ability to develop other markets for that drug candidate.
Both before and after marketing approval, our drug candidates are subject to ongoing regulatory requirements and continued regulatory review, and if we fail to comply with these continuing requirements, we could be subject to a variety of sanctions and the sale of any approved products could be suspended.
Both before and after regulatory approval to market a particular drug candidate, adverse event reporting, manufacturing, labeling, packaging, storage, distribution, advertising, promotion, record keeping and reporting related to the product are subject
22
to extensive, ongoing regulatory requirements. These requirements include submissions of safety and other post-marketing information and reports, as well as continued compliance with current good manufacturing practice (“cGMP”) requirements and current good clinical practice (“cGCP”) requirements for any clinical trials that we conduct post-approval. Any regulatory approvals that we receive for our drug candidates may also be subject to limitations on the approved indicated uses for which the product may be marketed or to the conditions of approval, or contain requirements for potentially costly post-marketing testing, including Phase 4 clinical trials, and surveillance to monitor the safety and efficacy of the drug candidate. Later discovery of previously unknown problems with a product, including adverse events of unanticipated severity or frequency, or not previously observed in clinical trials, or with our third-party manufacturers or manufacturing processes, or failure to comply with the regulatory requirements of the FDA, the EMA and other comparable regulatory authorities could subject us to administrative or judicially imposed sanctions, including:
|
•
|
restrictions on the marketing of our products or their manufacturing processes;
|
|
•
|
warning letters;
|
|
•
|
civil or criminal penalties;
|
|
•
|
fines;
|
|
•
|
injunctions;
|
|
•
|
product seizures or detentions;
|
|
•
|
import or export bans;
|
|
•
|
voluntary or mandatory product recalls and related publicity requirements;
|
|
•
|
suspension or withdrawal of regulatory approvals;
|
|
•
|
total or partial suspension of production; and
|
|
•
|
refusal to approve pending applications for marketing approval of new products or supplements to approved applications.
|
The FDA’s, the EMA’s or other comparable regulatory authorities’ policies may change and additional government regulations may be enacted that could prevent, limit or delay regulatory approval of our drug candidates. If we are slow or unable to adapt to changes in existing requirements or the adoption of new requirements or policies, or if we are not able to maintain regulatory compliance, we may lose any marketing approval that we may have obtained, which would adversely affect our business, prospects and ability to achieve or sustain profitability.
If side effects are identified during the time our drug candidates are in development or after they are approved and on the market, we may choose to or be required to perform lengthy additional clinical trials, discontinue development of the affected drug candidate, change the labeling of any such products, or withdraw any such products from the market, any of which would hinder or preclude our ability to generate revenues.
Undesirable side effects caused by our drug candidates could cause us or regulatory authorities to interrupt, delay or halt clinical trials and could result in a more restrictive label or the delay or denial of regulatory approval by the FDA, the EMA or other comparable regulatory authorities. Drug-related side effects could affect patient recruitment or the ability of enrolled patients to complete a trial or result in potential product liability claims. Any of these occurrences may harm our business, financial condition and prospects significantly. Even if any of our drug candidates receives marketing approval, as greater numbers of patients use a drug following its approval, an increase in the incidence or severity of side effects or the incidence of other post-approval problems that were not seen or anticipated during pre-approval clinical trials could result in a number of potentially significant negative consequences, including:
|
•
|
regulatory authorities may withdraw their approval of the product;
|
|
•
|
regulatory authorities may require the addition of labeling statements, such as warnings or contraindications, or impose additional safety monitoring or reporting requirements;
|
|
•
|
we may be required to change the way the product is administered, conduct additional clinical trials;
|
|
•
|
we could be sued and held liable for harm caused to patients; and
|
23
|
•
|
our reputation may suffer.
|
Any of these events could substantially increase the costs and expenses of developing, commercializing and marketing any such drug candidates or could harm or prevent sales of any approved products.
We deal with hazardous materials and must comply with environmental laws and regulations, which can be expensive and restrict how we do business.
Some of our research and development activities involve the controlled storage, use, and disposal of hazardous materials. We are subject to U.S. federal, state, local and other countries’ and jurisdictions’ laws and regulations governing the use, manufacture, storage, handling and disposal of these hazardous materials. Although we believe that our safety procedures for the handling and disposing of these materials comply with the standards prescribed by these laws and regulations, we cannot eliminate the risk of accidental contamination or injury from these materials. In the event of an accident, state or federal authorities may curtail our use of these materials, and we could be liable for any civil damages that result, which may exceed our financial resources and may seriously harm our business. Because we believe that our laboratory and materials handling policies and practices sufficiently mitigate the likelihood of materials liability or third-party claims, we currently carry no insurance covering such claims. An accident could damage, or force us to shut down, our operations.
Risks Related to the Commercialization of Our Drug Candidates
Even if any of our drug candidates receives regulatory approval, if such approved product does not achieve broad market acceptance, the revenues that we generate from sales of the product will be limited.
Even if any drug candidates we may develop or acquire in the future obtain regulatory approval, they may not gain broad market acceptance among physicians, healthcare payors, patients and the medical community. The degree of market acceptance for any approved drug candidate will depend on a number of factors, including:
|
•
|
the indication and label for the product and the timing of introduction of competitive products;
|
|
•
|
demonstration of clinical safety and efficacy compared to other products;
|
|
•
|
prevalence and severity of adverse side effects;
|
|
•
|
availability of coverage and adequate reimbursement from managed care plans and other third-party payors;
|
|
•
|
convenience and ease of administration;
|
|
•
|
cost-effectiveness;
|
|
•
|
other potential advantages of alternative treatment methods; and
|
|
•
|
the effectiveness of marketing and distribution support of the product.
|
Consequently, even if we discover, develop and commercialize a product, the product may fail to achieve broad market acceptance and we may not be able to generate significant revenue from the product.
The success of PRX002/RG7935 in the United States is dependent upon the strength and performance of our collaboration with Roche. If we fail to maintain our existing collaboration with Roche, such termination would likely have a material adverse effect on our ability to develop and commercialize PRX002/RG7935 and our business. Furthermore, if we opt out of profit and loss sharing with Roche, our revenues from PRX002/RG7935 will be reduced.
The success of sales of PRX002/RG7935 in the U.S. will be dependent on the ability of Roche to successfully develop in collaboration with us, and launch and commercialize PRX002/RG7935, if approved by the FDA, pursuant to the License Agreement we entered into in December 2013. Our collaboration with Roche is complex, particularly with respect to future U.S. commercialization of PRX002/RG7935, with respect to financial provisions, allocations of responsibilities, cost estimates and the respective rights of the parties in decision making. Accordingly, significant aspects of the development and commercialization of PRX002/RG7935 require Roche to execute its responsibilities under the arrangement, or require Roche’s agreement or approval, prior to implementation, which could cause significant delays that may materially impact the potential success of PRX002/RG7935 in the U.S. In addition, Roche may under some circumstances independently develop products that compete with PRX002/RG7935, or Roche may decide to not commit sufficient resources to the development, commercialization, marketing and distribution of PRX002/RG7935. If we are not able to collaborate effectively with Roche on plans and efforts to develop and commercialize PRX002/RG7935, our business could be materially adversely affected.
24
Furthermore, the terms of the License Agreement provide that Roche has the ability to terminate such arrangement for any reason after the first anniversary of the License Agreement at any time upon 90 days’ notice (if prior to first commercial sale) or 180 days’ notice (if after first commercial sale). For example, Roche may determine that the outcomes of clinical trials have made PRX002/RG7935 a less attractive commercial product and terminate our collaboration. If the License Agreement is terminated, our business and our ability to generate revenue from sales of PRX002/RG7935 could be substantially harmed as we will be required to develop, commercialize and build our own sales and marketing organization or enter into another strategic collaboration in order to develop and commercialize PRX002/RG7935 in the U.S. Such efforts may not be successful and, even if successful, would require substantial time and resources to carry out.
The manner in which Roche launches PRX002/RG7935, including the timing of launch and potential pricing, will have a significant impact on the ultimate success of PRX002/RG7935 in the U.S, and the success of the overall commercial arrangement with Roche. If launch of commercial sales of PRX002/RG7935 in the U.S. by Roche is delayed or prevented, our revenue will suffer and our stock price may decline. Further, if launch and resulting sales by Roche are not deemed successful, our business would be harmed and our stock price may decline. Any lesser effort by Roche in its PRX002/RG7935 sales and marketing efforts may result in lower revenue and thus lower profits with respect to the U.S. The outcome of Roche’s commercialization efforts in the U.S. could also have a negative effect on investors’ perception of potential sales of PRX002/RG7935 outside of the U.S., which could also cause a decline in our stock price.
Furthermore, pursuant to the License Agreement, we are responsible for 30% of all development and commercialization costs for PRX002/RG7935 for the treatment of Parkinson’s disease in the U.S., and for any future Licensed Products and/or indications that we opt to co-develop, in each case unless we elect to opt out of profit and loss sharing. If we elect to opt out of profit and loss sharing, we will instead receive sales milestones and royalties, and our revenue, if any, from PRX002/RG7935 will be reduced.
Our right to co-develop PRX002/RG7935 and other Licensed Products under the License Agreement will terminate if we commence certain studies for a competitive product that treats Parkinson’s disease or other indications that we opted to co-develop. In addition, our right to co-promote PRX002/RG7935 and other Licensed Products will terminate if we commence a Phase 3 study for a competitive product that treats Parkinson’s disease.
Moreover, under the terms of the License Agreement, we rely on Roche to provide us estimates of their costs, revenue and revenue adjustments and royalties, which estimates we use in preparing our quarterly and annual financial reports. If the underlying assumptions on which Roche’s estimates were based prove to be incorrect, actual results or revised estimates supplied by Roche that are materially different from the original estimates could require us to adjust the estimates included in our reported financial results. If material, these adjustments could require us to restate previously reported financial results, which could have a negative effect on our stock price.
Our ability to receive any significant revenue from PRX002/RG7935 will be dependent on Roche’s efforts and our participation in profit and loss sharing, and may result in lower levels of income than if we marketed or developed our product candidates entirely on our own. Roche may not fulfill its obligations or carry out marketing activities for PRX002/RG7935 as diligently as we would like. We could also become involved in disputes with Roche, which could lead to delays in or termination of development or commercialization activities and time-consuming and expensive litigation or arbitration. If Roche terminates or breaches the License Agreement, or otherwise decides not to complete its obligations in a timely manner, the chances of successfully developing, commercializing or marketing PRX002/RG7935 would be materially and adversely affected.
Outside of the United States, we are solely dependent on the efforts and commitments of Roche, either directly or through third parties, to further develop and commercialize PRX002/RG7935. If Roche’s efforts are unsuccessful, our ability to generate future product sales from PRX002/RG7935 outside the United States would be significantly reduced.
Under our License Agreement, outside of the U.S., Roche has responsibility for developing and commercializing PRX002/RG7935 and any future Licensed Products targeting
α-
synuclein. As a consequence, any progress and commercial success outside of the U.S. is dependent solely on Roche’s efforts and commitment to the program. For example, Roche may delay, reduce or terminate development efforts relating to PRX002/RG7935 outside of the U.S., or under some circumstances independently develop products that compete with PRX002/RG7935, or decide not to commit sufficient resources to the commercialization, marketing and distribution of PRX002/RG7935.
In the event that Roche does not diligently develop and commercialize PRX002/RG7935, the License Agreement provides us the right to terminate the License Agreement in connection with a material breach uncured for 90 days after notice thereof. However, our ability to enforce the provisions of the License Agreement so as to obtain meaningful recourse within a reasonable timeframe is uncertain. Further, any decision to pursue available remedies including termination would impact the potential success of PRX002/RG7935, including inside the U.S., and we may choose not to terminate as we may not be able to find another partner and any new collaboration likely will not provide comparable financial terms to those in our arrangement with Roche. In the event
25
of our termination, this may require us to develop and commercialize PRX002/RG7935 on our own, which is likely to result in significant additional expense and delay. Significant changes in Roche’s business strategy, resource commitment and the willingness or ability of Roche to complete its obligations under our arrangement could materially affect the potential success of the product. Furthermore, if Roche does not successfully develop and commercialize PRX002/RG7935 outside of the U.S., our potential to generate future revenue outside of the U.S. would be significantly reduced.
If we are unable to establish sales and marketing capabilities or enter into agreements with third parties to market and sell approved products, we may be unable to generate product revenue.
We do not currently have a fully-scaled organization for the sales, marketing and distribution of pharmaceutical products. In order to market any products that may be approved by the FDA, the EMA or other comparable regulatory authorities, we must build our sales, marketing, managerial and other non-technical capabilities or make arrangements with third parties to perform these services.
We have entered into the License Agreement with Roche for the development of PRX002/RG7935 and may develop our own sales force and marketing infrastructure to co-promote PRX002/RG7935 in the U.S. for the treatment of Parkinson’s disease and any future Licensed Products approved for Parkinson’s disease in the U.S. If we exercise our co-promotion option and are unable to develop our own sales force and marketing infrastructure to effectively commercialize PRX002/RG7935 or other Licensed Products, our ability to generate additional revenue from potential sales of PRX002/RG7935 or such products in the U.S. may be harmed. In addition, our right to co-promote PRX002/RG7935 and other Licensed Products will terminate if we commence a Phase 3 study for a competitive product that treats Parkinson’s disease.
For our other approved products, if we are unable to establish adequate sales, marketing and distribution capabilities, whether independently or with third parties, we may not be able to generate product revenue and may not become profitable.
If government and third-party payors fail to provide coverage and adequate reimbursement rates for any of our drug candidates that receive regulatory approval, our revenue and prospects for profitability will be harmed.
In both U.S. and non-U.S. markets, our sales of any future products will depend in part upon the availability of reimbursement from third-party payors. Such third-party payors include government health programs such as Medicare, managed care providers, private health insurers, and other organizations. There is significant uncertainty related to the third-party coverage and reimbursement of newly approved drugs. Coverage and reimbursement may not be available for any drug that we or our collaborators commercialize and, even if these are available, the level of reimbursement may not be satisfactory. Third-party payors often rely upon Medicare coverage policy and payment limitations in setting their own reimbursement policies. Third-party payors are also increasingly attempting to contain healthcare costs by demanding price discounts or rebates limiting both coverage and the amounts that they will pay for new drugs, and, as a result, they may not cover or provide adequate payment for our drug candidates. We might need to conduct post-marketing studies in order to demonstrate the cost-effectiveness of any future products to such payors’ satisfaction. Such studies might require us to commit a significant amount of management time and financial and other resources. Our future products might not ultimately be considered cost-effective. Adequate third-party reimbursement might not be available to enable us to maintain price levels sufficient to realize an appropriate return on investment in product development. If coverage and adequate reimbursement are not available or reimbursement is available only to limited levels, we or our collaborators may not be able to successfully commercialize any product candidates for which marketing approval is obtained.
The regulations that govern marketing approvals, pricing, coverage and reimbursement for new drugs vary widely from country to country. Current and future legislation may significantly change the approval requirements in ways that could involve additional costs and cause delays in obtaining approvals. Some countries require approval of the sale price of a drug before it can be marketed. In many countries, the pricing review period begins after marketing or licensing approval is granted. In some countries, prescription pharmaceutical pricing remains subject to continuing governmental control even after initial approval is granted. As a result, we or our collaborators might obtain marketing approval for a drug in a particular country, but then be subject to price regulations that delay commercial launch of the drug, possibly for lengthy time periods, and negatively impact our ability to generate revenue from the sale of the drug in that country. Adverse pricing limitations may hinder our ability to recoup our investment in one or more drug candidates, even if our drug candidates obtain marketing approval.
U.S. and other governments continue to propose and pass legislation designed to reduce the cost of healthcare. In the U.S., we expect that there will continue to be federal and state proposals to implement similar governmental controls. In addition, recent changes in the Medicare program and increasing emphasis on managed care in the U.S. will continue to put pressure on pharmaceutical product pricing. For example, in 2010, the U.S. Patient Protection and Affordable Care Act, as amended by the U.S. Health Care and Education Reconciliation Act (collectively, the “Healthcare Reform Law”), was enacted. The Healthcare Reform Law substantially changed the way healthcare is financed by both governmental and private insurers and significantly affects the pharmaceutical industry. Among the provisions of the Healthcare Reform Law of importance to the pharmaceutical industry are the following:
26
|
•
|
an annual, nondeductible fee on any entity that manufactures or imports certain branded prescription drugs and biologic agents, apportioned among these entities according to their market share in certain government healthcare programs;
|
|
•
|
an increase in the minimum rebates a manufacturer must pay under the U.S. Medicaid Drug Rebate Program to 23.1% and 13.0% of the average manufacturer price for branded and generic drugs, respectively;
|
|
•
|
expansion of healthcare fraud and abuse laws, including the U.S. False Claims Act and the U.S. Anti-Kickback Statute, new government investigative powers and enhanced penalties for non-compliance;
|
|
•
|
a new Medicare Part D coverage gap discount program, under which manufacturers must agree to offer 50 percent point-of-sale discounts off negotiated prices of applicable brand drugs to eligible beneficiaries during their coverage gap period, as a condition for the manufacturer’s outpatient drugs to be covered under Medicare Part D;
|
|
•
|
extension of manufacturers’ Medicaid rebate liability to covered drugs dispensed to individuals who are enrolled in Medicaid managed care organizations;
|
|
•
|
expansion of eligibility criteria for Medicaid programs by, among other things, allowing states to offer Medicaid coverage to additional individuals and by adding new mandatory eligibility categories for certain individuals with income at or below 133% of the federal poverty level, thereby potentially increasing a manufacturer’s Medicaid rebate liability;
|
|
•
|
a licensure framework for follow-on biologic products;
|
|
•
|
expansion of the entities eligible for discounts under the Public Health Service pharmaceutical pricing program;
|
|
•
|
new requirements under the federal Open Payments program and its implementing regulations;
|
|
•
|
a new requirement to annually report drug samples that manufacturers and distributors provide to physicians; and
|
|
•
|
a new Patient-Centered Outcomes Research Institute to oversee, identify priorities in, and conduct comparative clinical effectiveness research, along with funding for such research.
|
In addition, other legislative changes have been proposed and adopted since the Healthcare Reform Law was enacted. These changes include aggregate reductions to Medicare payments to providers of up to 2% per fiscal year, which went into effect in 2013 and will stay in effect through 2024 unless additional congressional action is taken. In 2013, the U.S. American Taxpayer Relief Act of 2012, among other things, further reduced Medicare payments to several types of providers and increased the statute of limitations period for the government to recover overpayments to providers from three to five years. These new laws may result in additional reductions in Medicare and other healthcare funding, which could have a material adverse effect on customers for our drugs, if approved, and, accordingly, our financial operations.
We expect that the Healthcare Reform Law, as well as other healthcare reform measures that may be adopted in the future, may result in more rigorous coverage criteria and in additional downward pressure on the price that we receive for any approved drug. Legislation and regulations affecting the pricing of pharmaceuticals might change before our drug candidates are approved for marketing. Any reduction in reimbursement from Medicare or other government healthcare programs may result in a similar reduction in payments from private payors. The implementation of cost containment measures or other healthcare reforms may prevent us from being able to generate revenue, attain profitability or commercialize our drugs.
There can be no assurance that our drug candidates, if they are approved for sale in the U.S. or in other countries, will be considered medically reasonable and necessary for a specific indication, that they will be considered cost-effective by third-party payors, that coverage or an adequate level of reimbursement will be available, or that third-party payors’ reimbursement policies will not adversely affect our ability to sell our drug candidates profitably if they are approved for sale.
The markets for our drug candidates are subject to intense competition. If we are unable to compete effectively, our drug candidates may be rendered noncompetitive or obsolete.
The research, development and commercialization of new drugs is highly competitive. We will face competition with respect to all drug candidates we may develop or commercialize in the future from pharmaceutical and biotechnology companies worldwide. The key factors affecting the success of any approved product will be its indication, label, efficacy, safety profile, drug interactions, method of administration, pricing, coverage, reimbursement and level of promotional activity relative to those of competing drugs.
Furthermore, many large pharmaceutical and biotechnology companies, academic institutions, governmental agencies and other public and private research organizations are pursuing the development of novel drugs that target the same indications we
27
are targeting with our research and development program. We face, and expect to continue to face, intense and increasing competition as new products enter the market and advanced technologies become available. Many of our competitors have:
|
•
|
significantly greater financial, technical and human resources than we have and may be better equipped to discover, develop, manufacture and commercialize drug candidates;
|
|
•
|
more extensive experience in nonclinical testing and clinical trials, obtaining regulatory approvals and manufacturing and marketing pharmaceutical products;
|
|
•
|
drug candidates that have been approved or are in late-stage clinical development; and/or
|
|
•
|
collaborative arrangements in our target markets with leading companies and research institutions.
|
Competitive products may render our research and development program obsolete or noncompetitive before we can recover the expenses of developing and commercializing our drug candidates. Furthermore, the development of new treatment methods and/or the widespread adoption or increased utilization of any vaccine or development of other products or treatments for the diseases we are targeting could render any of our drug candidates noncompetitive, obsolete or uneconomical. If we successfully develop and obtain approval for a drug candidate, we will face competition based on the safety and effectiveness of the approved product, the timing of its entry into the market in relation to competitive products in development, the availability and cost of supply, marketing and sales capabilities, coverage, reimbursement, price, patent position and other factors. Even if we successfully develop drug candidates but those drug candidates do not achieve and maintain market acceptance, our business will not be successful.
Our drug candidates for which we intend to seek approval as biologic products may face competition sooner than anticipated.
Our drug candidates are regulated by the FDA as biologic products and we intend to seek approval for these products pursuant to the BLA pathway. The U.S. Biologics Price Competition and Innovation Act of 2009 (the “BPCIA”) created an abbreviated pathway for the approval of biosimilar and interchangeable biologic products. The abbreviated regulatory pathway establishes legal authority for the FDA to review and approve biosimilar biologics, including the possible designation of a biosimilar as “interchangeable” based on its similarity to an existing brand product. Under the BPCIA, an application for a biosimilar product cannot be approved by the FDA until 12 years after the original branded product was approved under a BLA. The law is complex and is still being interpreted and implemented by the FDA. As a result, its ultimate impact, implementation, and meaning are subject to uncertainty. While it is uncertain when such processes intended to implement BPCIA may be fully adopted by the FDA, any such processes could have a material adverse effect on the future commercial prospects for our biologic products.
We believe that any of our drug candidates approved as a biologic product under a BLA should qualify for the 12-year period of exclusivity. However, there is a risk that this exclusivity could be shortened due to congressional action or otherwise, or that the FDA will not consider our drug candidates to be reference products for competing products, potentially creating the opportunity for generic competition sooner than anticipated. Moreover, the extent to which a biosimilar, once approved, will be substituted for any one of our reference products in a way that is similar to traditional generic substitution for non-biologic products is not yet clear, and will depend on a number of marketplace and regulatory factors that are still developing.
We are subject to healthcare and other laws and regulations, including anti-bribery anti-kickback, fraud and abuse, false claims, physician payment transparency and health information privacy and security laws and regulations, which could expose us to criminal, civil and/or administrative sanctions and penalties, exclusion from governmental healthcare programs or reimbursements, contractual damages and reputational harm.
Our operations and activities are directly, or indirectly through our service providers and collaborators, subject to numerous healthcare and others laws and regulations, including, without limitation, those relating to anti-bribery, anti-kickback, fraud and abuse, false claims, physician payment transparency and health information privacy and security, in the U.S., the EU and other countries and jurisdictions in which we conduct our business. These laws include:
|
•
|
the U.S. Anti-Kickback Statute, which prohibits, among other things, persons from knowingly and willfully soliciting, receiving, offering or paying remuneration, directly or indirectly, in cash or in kind, to induce or reward, or in return for, either the referral of an individual for, or the purchase or recommendation of an item or service reimbursable under a federal healthcare program, such as the Medicare and Medicaid programs;
|
|
•
|
U.S. federal and state false claims laws, including the False Claims Act, which impose criminal and civil penalties, including civil whistleblower or qui tam actions, against individuals or entities for knowingly presenting, or causing to be presented, claims for payment from Medicare, Medicaid, or other third-party payors that are false or fraudulent or making a false statement to avoid, decrease or conceal an obligation to pay money to the federal government;
|
28
|
•
|
the U.S. Health Insurance Portability and Accountability Act of 1996 (“HIPAA”), which imposes criminal and civil liability for executing a scheme to defraud any healthcare benefit program and making false statements in connection with the delivery of or payment for healthcare benefits, items or services, and under the Health Information Technology for Economic and Clinical Health Act of 2009 (“HITECH”) imposes obligations, including mandatory contractual terms, on certain types of individuals and entities with respect to safeguarding the privacy, security and transmission of individually identifiable health information and places restrictions on the use of such information for marketing communications;
|
|
•
|
the U.S. Physician Payment Sunshine Act, which requires applicable manufacturers of drugs, devices, biologics and medical supplies for which payment is available under Medicare, Medicaid or the Children’s Health Insurance Program, with specific exceptions, to report annually to the Centers for Medicare & Medicaid Services (“CMS”) information related to “payments or other transfers of value” made to physicians and teaching hospitals and applicable manufacturers and applicable group purchasing organizations to report annually to CMS ownership and investment interests held by the physicians and their immediate family members;
|
|
•
|
laws and regulations that apply to sales or marketing arrangements; apply to healthcare items or services reimbursed by non-governmental third-party payors, including private insurers; require pharmaceutical companies to comply with the pharmaceutical industry’s voluntary compliance guidelines; that restrict payments that may be made to healthcare providers; require drug manufacturers to report information related to payments and other transfers of value to physicians and other healthcare providers or marketing expenditures; and
|
|
•
|
similar and other laws and regulations in the U.S. (federal, state and local), in the EU (including member countries) and other countries and jurisdictions.
|
Further, the Healthcare Reform Law, among other things, amended the intent requirements of the U.S. Anti-Kickback Statute and the criminal statutes governing healthcare fraud. A person or entity can now be found guilty of violating the statute without actual knowledge of the statute or specific intent to violate it. In addition, the Healthcare Reform Law provided that the government may assert that a claim including items or services resulting from a violation of the U.S. Anti-Kickback Statute constitutes a false or fraudulent claim for purposes of the U.S. False Claims Act.
Ensuring our compliance with applicable healthcare and others laws and regulations involves substantial costs, and it is possible that governmental authorities or third parties will assert that our business practices fail to comply with these laws and regulations. If our operations are found to be in violation of any of such laws and regulations, we may be subject to significant civil, criminal and administrative damages, penalties and fines, as well exclusion from participation in government healthcare programs, dcurtailment or restructuring of our operations and reputational harm, any of which could have a material adverse effect on our business, financial condition or results of operations.
If a successful product liability or clinical trial claim or series of claims is brought against us for uninsured liabilities or in excess of insured liabilities, we could incur substantial liability.
The use of our drug candidates in clinical trials and the sale of any products for which we obtain marketing approval will expose us to the risk of product liability and clinical trial liability claims. Product liability claims might be brought against us by consumers, healthcare providers or others selling or otherwise coming into contact with our products. Clinical trial liability claims may be filed against us for damages suffered by clinical trial subjects or their families. If we cannot successfully defend ourselves against product liability claims, we could incur substantial liabilities. In addition, regardless of merit or eventual outcome, product liability claims may result in:
|
•
|
decreased demand for any approved drug candidates;
|
|
•
|
impairment of our business reputation;
|
|
•
|
withdrawal of clinical trial participants;
|
|
•
|
costs of related litigation;
|
|
•
|
distraction of management’s attention;
|
|
•
|
substantial monetary awards to patients or other claimants; and
|
|
•
|
loss of revenues; and the inability to successfully commercialize any approved drug candidates.
|
29
We currently have clinical trial liability insurance coverage for all of our clinical trials. However, our insurance coverage may not be sufficient to reimburse us for any expenses or losses we may suffer. Moreover, insurance coverage is becoming increasingly expensive, and, in the future, we may not be able to maintain insurance coverage at a reasonable cost or in sufficient amounts to protect us against losses due to liability. If and when we obtain marketing approval for any of our drug candidates, we intend to expand our insurance coverage to include the sale of commercial products; however, we may be unable to obtain this product liability insurance on commercially reasonable terms. On occasion, large judgments have been awarded in class action lawsuits based on drugs that had unanticipated side effects. A successful product liability claim or series of claims brought against us could cause our ordinary share price to decline and, if judgments exceed our insurance coverage, could decrease our cash and adversely affect our business.
Risks Related to Our Dependence on Third Parties
We rely on third parties to conduct our clinical trials, and those third parties may not perform satisfactorily, including failing to meet established deadlines for the completion of any such clinical trials.
We do not have the ability to independently conduct clinical trials for our drug candidates, and we rely on third parties, such as consultants, contract research organizations, medical institutions and clinical investigators, to assist us with these activities. Our reliance on these third parties for clinical development activities results in reduced control over these activities. Furthermore, these third parties may also have relationships with other entities, some of which may be our competitors. Although we have and will enter into agreements with these third parties, we will be responsible for confirming that our clinical trials are conducted in accordance with their general investigational plans and protocols. Moreover, the FDA, the EMA and other comparable regulatory authorities require us to comply with regulations and standards, commonly referred to as cGCPs, for conducting, recording and reporting the results of clinical trials to assure that data and reported results are credible and accurate and that the trial participants are adequately protected. Our reliance on third parties does not relieve us of these responsibilities and requirements. If we or any of our third party contractors fail to comply with applicable cGCPs, the clinical data generated in our clinical trials may be deemed unreliable and the FDA, the EMA or other comparable regulatory authorities may require us to perform additional clinical trials before approving our marketing applications. We cannot assure you that upon inspection by a given regulatory authority, such regulatory authority will determine that any of our clinical trials complies with cGCP regulations. In addition, our clinical trials must be conducted with product produced under cGMP regulations. Our failure to comply with these regulations may require us to repeat clinical trials, which would delay the regulatory approval process.
To date, we believe our consultants, contract research organizations and other third parties with which we are working have performed well; however, if these third parties do not successfully carry out their contractual duties, meet expected deadlines, or comply with applicable regulations, we may be required to replace them. Although we believe that there are a number of other third-party contractors we could engage to continue these activities, we may not be able to enter into arrangements with alternative third-party contractors or to do so on commercially reasonable terms, which may result in a delay of our planned clinical trials. Accordingly, we may be delayed in obtaining regulatory approvals for our drug candidates and may be delayed in our efforts to successfully develop our drug candidates.
In addition, our third-party contractors are not our employees, and except for remedies available to us under our agreements with such third-party contractors, we cannot control whether or not they devote sufficient time and resources to our ongoing clinical and nonclinical programs. If third-party contractors do not successfully carry out their contractual duties or obligations or meet expected deadlines, if they need to be replaced or if the quality or accuracy of the clinical data they obtain is compromised due to the failure to adhere to our clinical protocols, regulatory requirements or for other reasons, our clinical trials may be extended, delayed or terminated and we may not be able to obtain regulatory approval for or successfully commercialize our drug candidates. As a result, our results of operations and the commercial prospects for our drug candidates would be harmed, our costs could increase and our ability to generate revenues could be delayed.
If we do not establish additional strategic collaborations, we may have to alter our research and development plans.
Our drug research and development programs and potential commercialization of our drug candidates will require substantial additional cash to fund expenses. Our strategy includes potentially collaborating with additional leading pharmaceutical and biotechnology companies to assist us in furthering development and potential commercialization of some of our drug candidates, in some or all geographies. It may be difficult to enter into one or more of such collaborations in the future. We face significant competition in seeking appropriate collaborators and these collaborations are complex and time-consuming to negotiate and document. We may not be able to negotiate collaborations on acceptable terms, or at all, in which case we may have to curtail the development of a particular drug candidate, reduce or delay its development program or one or more of our other development programs, delay its potential commercialization or increase our expenditures and undertake development or commercialization activities at our own expense. If we elect to increase our expenditures to fund development or commercialization activities on our
30
own, we will need to obtain additional capital, which may not be available to us on acceptable terms, or at all. If we do not have sufficient funds, we will not be able to bring our drug candidates to market and generate product revenue.
We have no manufacturing capacity and depend on third-party manufacturers to supply us with nonclinical and clinical trial supplies of all of our drug candidates, and we will depend on third-party manufacturers to supply us with any drug products for commercial sale if we obtain marketing approval from the FDA, the EMA or any other comparable regulatory authority for any of our drug candidates.
We do not own or operate facilities for the manufacture, packaging, labeling, storage, testing or distribution of nonclinical or clinical supplies of any of our drug candidates. We instead contract with and rely on third parties to manufacture, package, label, store, test and distribute nonclinical and clinical supplies of our drug candidates, and we plan to continue to do so for the foreseeable future. We also rely on third-party consultants to assist us with managing these third-parties and with our manufacturing strategy. If any of these third-parties fail to perform these activities for us, nonclinical or clinical development of our drug candidates could be delayed, which could have an adverse effect on our business, financial condition, results of operations and growth prospects.
If the FDA, the EMA or any other comparable regulatory authority approves any of our drug candidates for commercial sale, we expect to continue to rely, at least initially, on third-parties to manufacture, package, label, store, test and distribute commercial supplies of such approved drug product. Significant scale-up of manufacturing may require additional comparability validation studies, which the FDA, the EMA or other comparable regulatory authorities must review and approve. Our third-party manufacturers might not be able to successfully establish such comparability or increase their manufacturing capacity in a timely or economic manner, or at all. If our third-party manufacturers are unable to successfully establish comparability or increase their manufacturing capacity for any drug product, and we are unable to timely establish our own manufacturing capabilities, the commercial launch of that drug product could be delayed or there could be a shortage in supply, which could have an adverse effect on our business, financial condition, results of operations and growth prospects.
Our third-party manufacturers’ facilities could be damaged by fire, power interruption, information system failure, natural disaster or other similar event, which could cause a delay or shortage in supplies of our drug candidates, which could have an adverse effect on our business, financial condition, results of operations and growth prospects.
Our drug candidates require, and any future drug product will require, precise, high quality manufacturing, packaging, labeling, storage and testing that meet stringent cGMP, other regulatory requirements and other standards. Our third-party manufacturers are subject to ongoing periodic and unannounced inspections by the FDA, the EMA and other comparable regulatory authorities to ensure compliance with these cGMPs, other regulatory requirements and other standards. We do not have control over, and are dependent upon, our third-party manufacturers’ compliance with these cGMPs, regulations and standards. Any failure by a third-party manufacturer to comply with these cGMPs, regulations or standards or that compromises the safety of any of our drug candidates or any drug product could cause a delay or suspension of production of nonclinical or clinical supplies of our drug candidates or commercial supplies of drug products, cause a delay or suspension of nonclinical or clinical development, product approval and commercialization of our drug candidates or drug products, result in seizure or recall of clinical or commercial supplies, result in fines and civil penalties, result in liability for any patient injury or death or otherwise increase our costs, any of which could have an adverse effect on our business, financial condition, results of operations and growth prospects. If a third-party manufacturer cannot or fails to perform its contractual commitments, does not have sufficient capacity to meet our nonclinical, clinical or eventual commercial requirements or fails to meet cGMPs, regulations or other standards, we may be required to replace it or qualify an additional third-party manufacturer. Although we believe there are a number of potential alternative manufacturers, the number of manufacturers with the necessary manufacturing and regulatory expertise and facilities to manufacture biologics like our antibodies is limited. In addition, we could incur significant additional costs and delays in identifying and qualifying any new third-party manufacturer, due to the technology transfer to such new manufacturer and because the FDA, the EMA and other comparable regulatory authorities must approve any new manufacturer prior to manufacturing our drug candidates. Such approval would require successful technology transfer, comparability and other testing and compliance inspections. Transferring manufacturing to a new manufacturer could therefore interrupt supply, delay our clinical trials and any commercial launch and/or increase our costs for our drug candidates, any of which could have an adverse effect on our business, financial condition, results of operations and growth prospects.
Boehringer Ingelheim Biopharmaceuticals GmbH (“BI”) has manufactured and is contracted to continue to manufacture clinical supplies of our drug candidate NEOD001 for its clinical trials as well as for commercial purposes if we apply for and obtain regulatory approval to market NEOD001. We are dependent on BI to continue to manufacture these supplies. We have also contracted with Rentschler Biopharma SE (formerly known as Rentschler Biotechnologie GmbH) (“Rentschler”) to develop the capability to manufacture and supply drug substance of NEOD001, including for worldwide commercial purposes if we apply for and obtain regulatory approval to market NEOD001. In order to be able to use drug substance supplied by Rentschler for commercial
31
purposes, we will need to first establish comparability of drug substance manufactured by Rentschler with clinical supplies manufactured by BI and used by us in clinical development of NEOD001.
BI also manufactured clinical supplies of our drug candidate PRX002/RG7935 for our completed Phase 1a single ascending dose and Phase 1b multiple ascending dose trials. Roche, with whom we are collaborating on development of PRX002/RG7935, is manufacturing clinical supplies for the Phase 2 and is expected to do so for any subsequent clinical trials of PRX002/RG7935. We are dependent on Roche to continue to manufacture these clinical supplies.
Rentschler is also our third-party manufacturer of clinical supplies of our drug candidate PRX004. We are dependent on Rentschler to manufacture these clinical supplies in order to initiate clinical trials for PRX004.
We depend on third-party suppliers for key raw materials used in our manufacturing processes, and the loss of these third-party suppliers or their inability to supply us with adequate raw materials could harm our business.
We rely on third-party suppliers for the raw materials required for the production of our drug candidates. Our dependence on these third-party suppliers and the challenges we may face in obtaining adequate supplies of raw materials involve several risks, including limited control over pricing, availability, quality and delivery schedules. We cannot be certain that our suppliers will continue to provide us with the quantities of these raw materials that we require or satisfy our anticipated specifications and quality requirements. Any supply interruption in limited or sole sourced raw materials could materially harm our ability to manufacture our products until a new source of supply, if any, could be identified and qualified. Although we believe there are currently several other suppliers of these raw materials, we may be unable to find a sufficient alternative supply channel in a reasonable time or on commercially reasonable terms. Any performance failure on the part of our suppliers could delay the development and potential commercialization of our drug candidates, including limiting supplies necessary for clinical trials and regulatory approvals, which would have a material adverse effect on our business.
Risks Related to Our Intellectual Property
If we are unable to adequately protect or enforce the intellectual property relating to our drug candidates our ability to successfully commercialize our drug candidates will be harmed.
Our success depends in part on our ability to obtain patent protection both in the U.S. and in other countries for our drug candidates. Our ability to protect our drug candidates from unauthorized or infringing use by third parties depends in substantial part on our ability to obtain and maintain valid and enforceable patents. Due to evolving legal standards relating to the patentability, validity and enforceability of patents covering pharmaceutical inventions and the scope of claims made under these patents, our ability to obtain, maintain and enforce patents is uncertain and involves complex legal and factual questions. Accordingly, rights under any issued patents may not provide us with sufficient protection for our drug candidates or provide sufficient protection to afford us a commercial advantage against competitive products or processes.
In addition, we cannot guarantee that any patents will issue from any pending or future patent applications owned by or licensed to us or our affiliates. Even if patents have issued or will issue, we cannot guarantee that the claims of these patents are or will be valid or enforceable or will provide us with any significant protection against competitive products or otherwise be commercially valuable to us. Patent applications in the U.S. are maintained in confidence for up to 18 months after their filing. In some cases, however, patent applications remain confidential in the U.S. Patent and Trademark Office (the “USPTO”) for the entire time prior to issuance as a U.S. patent. Similarly, publication of discoveries in the scientific or patent literature often lags behind actual discoveries. Consequently, we cannot be certain that we or our licensors or co-owners were the first to invent, or the first to file patent applications on, our drug candidates or their use as drugs. In the event that a third party has also filed a U.S. patent application relating to our drug candidates or a similar invention, we may have to participate in interference or derivation proceedings declared by the USPTO to determine priority of invention in the U.S. The costs of these proceedings could be substantial and it is possible that our efforts would be unsuccessful, resulting in a loss of our U.S. patent position. Furthermore, we may not have identified all U.S. and non-U.S. patents or published applications that affect our business either by blocking our ability to commercialize our drugs or by covering similar technologies. Composition-of-matter patents on the biological or chemical active pharmaceutical ingredient are generally considered to be the strongest form of intellectual property protection for pharmaceutical products, as such patents provide protection without regard to any method of use. We cannot be certain that the claims in our patent applications covering composition-of-matter of our product candidates will be considered patentable by the USPTO and courts in the U.S. or by the patent offices and courts in other countries, nor can we be certain that the claims in our issued composition-of-matter patents will not be found invalid or unenforceable if challenged. Method-of-use patents protect the use of a product for the specified method. This type of patent does not prevent a competitor from making and marketing a product that is identical to our product for an indication that is outside the scope of the patented method. Moreover, even if competitors do not actively promote their product for our targeted indications, physicians may prescribe these products “off-label.” Although off-label
32
prescriptions may infringe or contribute to the infringement of method-of-use patents, the practice is common and such infringement is difficult to prevent or prosecute.
Recent patent reform legislation could increase the uncertainties and costs surrounding the prosecution of our patent applications and the enforcement or defense of our issued patents. In 2011, the U.S. Leahy-Smith America Invents Act (the “Leahy-Smith Act”) was signed into law. The Leahy-Smith Act includes a number of significant changes to U.S. patent law. These include provisions that affect the way patent applications are prosecuted, redefine prior art, may affect patent litigation, and switch the U.S. patent system from a “first-to-invent” system to a “first-to-file” system. Under a “first-to-file” system, assuming the other requirements for patentability are met, the first inventor to file a patent application generally will be entitled to the patent on an invention regardless of whether another inventor had made the invention earlier. The USPTO subsequently developed new regulations and procedures to govern administration of the Leahy-Smith Act, and many of the substantive changes to patent law associated with the Leahy-Smith Act, and in particular, the first-to-file provisions, only became effective in 2013. Accordingly, it is not clear what, if any, impact the Leahy-Smith Act will have on the operation of our business. However, the Leahy-Smith Act and its implementation could increase the uncertainties and costs surrounding the prosecution of our patent applications and the enforcement or defense of our issued patents, all of which could have a material adverse effect on our business and financial condition.
We may be subject to a third-party preissuance submission of prior art to the USPTO, or become involved in opposition, derivation, reexamination, inter partes review, post-grant review, or other patent office proceedings or litigation, in the U.S. or elsewhere, challenging our patent rights or the patent rights of others. An adverse determination in any such submission, proceeding or litigation could reduce the scope of, or invalidate, our patent rights, allow third parties to commercialize our technology or products and compete directly with us, without payment to us, or result in our inability to manufacture or commercialize products without infringing third party patent rights.
We may not be able to protect our intellectual property rights throughout the world.
The laws of some jurisdictions do not protect intellectual property rights to the same extent as in the U.S. and many companies have encountered significant difficulties in protecting and defending such rights in other jurisdictions. If we encounter such difficulties in protecting or are otherwise precluded from effectively protecting our intellectual property rights in other jurisdictions, our business prospects could be substantially harmed.
We license patent rights from third-party owners. Such licenses may be subject to early termination if we fail to comply with our obligations in our licenses with third parties, which could result in the loss of rights or technology that are material to our business.
We are a party to licenses that give us rights to third-party intellectual property that is necessary or useful for our business, and we may enter into additional licenses in the future. Under these license agreements we are obligated to pay the licensor fees, which may include annual license fees, milestone payments, royalties, a percentage of revenues associated with the licensed technology and a percentage of sublicensing revenue. In addition, under certain of such agreements, we are required to diligently pursue the development of products using the licensed technology. If we fail to comply with these obligations and fail to cure our breach within a specified period of time, the licensor may have the right to terminate the applicable license, in which event we could lose valuable rights and technology that are material to our business.
If the licensor retains control of prosecution of the patents and patent applications licensed to us, we may have limited or no control over the manner in which the licensor chooses to prosecute or maintain its patents and patent applications and have limited or no right to continue to prosecute any patents or patent applications that the licensor elects to abandon.
Litigation regarding patents, patent applications and other proprietary rights may be expensive and time consuming. If we are involved in such litigation, it could cause delays in bringing drug candidates to market and harm our ability to operate.
Our success will depend in part on our ability to operate without infringing the proprietary rights of third parties. Although we are not currently aware of any litigation or other proceedings or third-party claims of intellectual property infringement related to our drug candidates, the pharmaceutical industry is characterized by extensive litigation regarding patents and other intellectual property rights. Other parties may hold or obtain patents in the future and allege that the use of our technologies infringes these patent claims or that we are employing their proprietary technology without authorization.
In addition, third parties may challenge or infringe upon our existing or future patents. Proceedings involving our patents or patent applications or those of others could result in adverse decisions regarding:
|
•
|
the patentability of our inventions relating to our drug candidates; and/or
|
|
•
|
the enforceability, validity or scope of protection offered by our patents relating to our drug candidates.
|
33
Even if we are successful in these proceedings, we may incur substantial costs and divert management time and attention in pursuing these proceedings, which could have a material adverse effect on us.
If we are unable to avoid infringing the patent rights of others, we may be required to seek a license, defend an infringement action or challenge the validity of the patents in court. Patent litigation is costly and time consuming. We may not have sufficient resources to bring these actions to a successful conclusion. In addition, if we do not obtain a license, develop or obtain non-infringing technology, fail to defend an infringement action successfully or have infringed patents declared invalid, we may:
|
•
|
incur substantial monetary damages;
|
|
•
|
encounter significant delays in bringing our drug candidates to market; and/or
|
|
•
|
be precluded from participating in the manufacture, use or sale of our drug candidates or methods of treatment requiring licenses.
|
If our trademarks and trade names are not adequately protected, then we may not be able to build name recognition in our markets of interest and our business may be adversely affected.
Our registered or unregistered trademarks or trade names may be challenged, infringed, circumvented or declared generic or determined to be infringing on other marks. We may not be able to protect our rights to these trademarks and trade names, which we need to build name recognition by potential partners or customers in our markets of interest. Over the long term, if we are unable to establish name recognition based on our trademarks and trade names, then we may not be able to compete effectively and our business may be adversely affected.
We may be unable to adequately prevent disclosure of trade secrets and other proprietary information.
We rely on trade secrets to protect our proprietary technologies, especially where we do not believe patent protection is appropriate or obtainable; however, trade secrets are difficult to protect. We rely in part on confidentiality agreements with our employees, consultants, outside scientific collaborators, sponsored researchers, and other advisors to protect our trade secrets and other proprietary information. These agreements may not effectively prevent disclosure of confidential information and may not provide an adequate remedy in the event of unauthorized disclosure of confidential information. In addition, others may independently discover our trade secrets and proprietary information. Costly and time consuming litigation could be necessary to enforce and determine the scope of our proprietary rights, and failure to obtain or maintain trade secret protection could adversely affect our competitive business position.
We may be subject to claims that our employees have wrongfully used or disclosed alleged trade secrets of their former employers.
Many of our employees were previously employed at universities, Elan or Elan subsidiaries, or other biotechnology or pharmaceutical companies, including our competitors or potential competitors. Although we try to ensure that our employees do not use the proprietary information or know-how of others in their work for us, we may be subject to claims that we or these employees have used or disclosed intellectual property, including trade secrets or other proprietary information, of any such employee’s former employer. Litigation may be necessary to defend against these claims. If we fail in defending any such claims, in addition to paying monetary damages, we may lose valuable intellectual property rights or personnel. Even if we are successful in defending against such claims, litigation could result in substantial costs and be a distraction to management.
Risks Related to Our Ordinary Shares
The market price of our ordinary shares may fluctuate widely.
Our ordinary shares commenced trading on The Nasdaq Global Market on December 21, 2012 and currently trade on The Nasdaq Global Select Market. We cannot predict the prices at which our ordinary shares may trade. The market price of our ordinary shares may fluctuate widely, depending upon many factors, some of which may be beyond our control, including:
|
•
|
our ability to obtain financing as needed;
|
|
•
|
progress in and results from our ongoing or future clinical trials;
|
|
•
|
our collaboration with Roche pursuant to the License Agreement to develop and commercialize PRX002/RG7935, as well as any future Licensed Products targeting
α-
synuclein;
|
|
•
|
failure or delays in advancing our nonclinical drug candidates or other drug candidates we may develop in the future, into clinical trials;
|
34
|
•
|
results of clinical trials conducted by others on drugs that would compete with our drug candidates;
|
|
•
|
issues in manufacturing our drug candidates;
|
|
•
|
regulatory developments or enforcement in the U.S. and other countries;
|
|
•
|
developments or disputes concerning patents or other proprietary rights;
|
|
•
|
introduction of technological innovations or new commercial products by our competitors;
|
|
•
|
changes in estimates or recommendations by securities analysts, if any, who cover our company;
|
|
•
|
public concern over our drug candidates;
|
|
•
|
litigation;
|
|
•
|
future sales of our ordinary shares;
|
|
•
|
general market conditions;
|
|
•
|
changes in the structure of healthcare payment systems;
|
|
•
|
failure of any of our drug candidates, if approved, to achieve commercial success;
|
|
•
|
economic and other external factors or other disasters or crises;
|
|
•
|
period-to-period fluctuations in our financial results;
|
|
•
|
overall fluctuations in U.S. equity markets;
|
|
•
|
our quarterly or annual results, or those of other companies in our industry;
|
|
•
|
announcements by us or our competitors of significant acquisitions or dispositions;
|
|
•
|
the operating and ordinary share price performance of other comparable companies;
|
|
•
|
investor perception of our company and the drug development industry;
|
|
•
|
natural or environmental disasters that investors believe may affect us;
|
|
•
|
changes in tax laws or regulations applicable to our business or the interpretations of those tax laws and regulations by taxing authorities; or
|
|
•
|
fluctuations in the budgets of federal, state and local governmental entities around the world.
|
These and other external factors may cause the market price and demand for our ordinary shares to fluctuate substantially, which may limit or prevent investors from readily selling their ordinary shares and may otherwise negatively affect the liquidity of our ordinary shares. In particular, stock markets in general have experienced volatility that has often been unrelated to the operating performance of a particular company. These broad market fluctuations may adversely affect the trading price of our ordinary shares. In the past, when the market price of a stock has been volatile, some holders of that stock have instituted securities class action litigation against the company that issued the stock. If any of our shareholders brought a lawsuit against us, we could incur substantial costs defending the lawsuit. Such a lawsuit could also divert the time and attention of our management.
Your percentage ownership in Prothena may be diluted in the future.
As with any publicly traded company, your percentage ownership in us may be diluted in the future because of equity issuances for acquisitions, capital raising transactions or otherwise. We may need to raise additional capital in the future. If we are able to raise additional capital, we may issue equity or convertible debt instruments, which may severely dilute your ownership interest in us. In addition, we intend to continue to grant option awards to our directors, officers and employees, which would dilute your ownership stake in us. As of
December 31, 2017
, the number of ordinary shares available for issuance pursuant to outstanding and future equity awards under our equity plan was
6,668,497
.
35
If we are unable to maintain effective internal controls, our business could be adversely affected.
We are subject to the reporting and other obligations under the U.S. Securities Exchange Act of 1934, as amended, including the requirements of Section 404 of the U.S. Sarbanes-Oxley Act, which require annual management assessments of the effectiveness of our internal control over financial reporting. The rules governing the standards that must be met for management to assess our internal control over financial reporting are complex and require significant documentation, testing and possible remediation to meet the detailed standards under the rules. During the course of its testing, our management may identify material weaknesses or deficiencies which may not be remedied in time to meet the deadline imposed by the Sarbanes-Oxley Act. These reporting and other obligations place significant demands on our management and administrative and operational resources, including accounting resources.
Our management is responsible for establishing and maintaining adequate internal control over financial reporting. Our internal control over financial reporting is a process designed to provide reasonable assurance regarding the reliability of financial reporting and the preparation of our financial statements for external purposes in accordance with accounting principles generally accepted in the U.S. During the course of our review and testing of our internal controls, we may identify deficiencies and be unable to remediate them before we must provide the required reports. Furthermore, if we have a material weakness in our internal controls over financial reporting, we may not detect errors on a timely basis and our condensed consolidated financial statements may be materially misstated. We or our independent registered public accounting firm, when required, may not be able to conclude on an ongoing basis that we have effective internal control over financial reporting, which could harm our operating results, cause investors to lose confidence in our reported financial information and cause the trading price of our stock to fall.
We cannot provide assurance that a material weakness will not occur in the future, or that we will be able to conclude on an ongoing basis that we have effective internal controls over financial reporting in accordance with Section 404 and the related rules and regulations of the SEC when required. A material weakness in internal control over financial reporting is a deficiency, or a combination of deficiencies, in internal control over financial reporting, such that there is a reasonable possibility that a material misstatement of a company’s annual or interim consolidated financial statements will not be prevented or detected on a timely basis by the company’s internal controls. If we cannot in the future favorably assess, or our independent registered public accounting firm, when required, is unable to provide an unqualified attestation report on, the effectiveness of our internal controls over financial reporting, investor confidence in the reliability of our financial reports may be adversely affected, which could have a material adverse effect on our share price. In addition, any failure to report our financial results on an accurate and timely basis could result in sanctions, lawsuits, delisting of our shares from the Nasdaq Global Select Market or other adverse consequences that would have an adverse effect on our business, financial position and results of operations.
If we were treated as a passive foreign investment company for U.S. federal income tax purposes, it could result in adverse U.S. federal income tax consequences to United States holders of our ordinary shares
.
Significant potential adverse U.S. federal income tax implications generally apply to U.S. investors owning shares of a passive foreign investment company (“PFIC”), directly or indirectly. In general, we would be a PFIC for a taxable year if either (i) 75% or more of its income constitutes passive income (the “income test”) or (ii) 50% or more of our assets produce passive income (the “asset test”). Changes in the composition of our active or passive income, passive assets or fair market value may cause us to become a PFIC. A separate determination must be made each taxable year as to whether we are a PFIC (after the close of each taxable year).
We do not believe we were a PFIC for U.S. federal income tax purposes for our taxable years ended December 31, 2017, 2016 or 2015. However, the application of the PFIC rules is subject to uncertainties in a number of respects, and we cannot assure that the U.S. Internal Revenue Service (the “IRS”) will not take a contrary position. We also cannot assure that we will not be a PFIC for U.S. federal income tax purposes for any future taxable year.
We may not be able to successfully maintain our tax rates, which could adversely affect our business and financial condition, results of operations and growth prospects.
We are incorporated in Ireland and maintain subsidiaries or offices in Ireland, the U.S. and other jurisdictions. We are able to achieve a low average tax rate through the performance of certain functions and ownership of certain assets in tax-efficient jurisdictions, together with intra-group service agreements. However, changes in tax laws in any of these jurisdictions could adversely affect our ability to do so in the future. Taxing authorities, such as the IRS, actively audit and otherwise challenge these types of arrangements, and have done so in our industry. We are subject to reviews and audits by the IRS and other taxing authorities from time to time, and the IRS or other taxing authority may challenge our structure and inter-group arrangements. Responding to or defending against challenges from taxing authorities could be expensive and time consuming, and could divert management’s time and focus away from operating our business. We cannot predict whether and when taxing authorities will conduct an audit, challenge our tax structure or the cost involved in responding to any such audit or challenge. If we are unsuccessful, we may be
36
required to pay taxes for prior periods, interest, fines or penalties, and may be obligated to pay increased taxes in the future, all of which could have an adverse effect on our business, financial condition, results of operations or growth prospects.
Future changes to the tax laws relating to multinational corporations could adversely affect us.
Under current law, we are treated as a foreign corporation for U.S. federal tax purposes. However, changes to the U.S. Internal Revenue Code, U.S. Treasury Regulations or other IRS guidance thereunder could adversely affect our status as a foreign corporation or otherwise affect our effective tax rate. In addition, the U.S. Congress, the IRS, the Organization for Economic Co-operation and Development and other governments and agencies in jurisdictions where we do business have recently focused on issues related to the taxation of multinational corporations, and specifically in the area of “base erosion and profit shifting,” where payments are made between affiliates from a jurisdiction with high tax rates to a jurisdiction with lower tax rates. As a result, the tax laws in the U.S. and other countries in which we do business could change on a prospective or retroactive basis, and any such changes could have an adverse effect on our business, financial condition, results of operations or growth prospects.
Irish law differs from the laws in effect in the United States and may afford less protection to holders of our ordinary shares.
It may not be possible to enforce court judgments obtained in the U.S. against us in Ireland based on the civil liability provisions of the U.S. federal or state securities laws. In addition, there is uncertainty as to whether the courts of Ireland would recognize or enforce judgments of U.S. courts obtained against us or our directors or officers based on the civil liabilities provisions of the U.S. federal or state securities laws or hear actions against us or those persons based on those laws. We have been advised that the U.S. currently does not have a treaty with Ireland providing for the reciprocal recognition and enforcement of judgments in civil and commercial matters. Therefore, a final judgment for the payment of money rendered by any U.S. federal or state court based on civil liability, whether or not based solely on federal or state securities laws, would not automatically be enforceable in Ireland.
As an Irish incorporated company, we are governed by the Irish Companies Act 2014 (the “Companies Act”), which differ in some material respects from laws generally applicable to U.S. corporations and shareholders, including, among others, differences relating to interested director and officer transactions and shareholder lawsuits. Likewise, the duties of directors and officers of an Irish company generally are owed to the company only. Shareholders of Irish companies generally do not have a personal right of action against directors or officers of the company and may exercise such rights of action on behalf of the company only in limited circumstances. Accordingly, holders of our ordinary shares may have more difficulty protecting their interests than would holders of securities of a corporation incorporated in a jurisdiction of the U.S.
Irish law differs from the laws in effect in the United States with respect to defending unwanted takeover proposals and may give our board of directors less ability to control negotiations with hostile offerors.
We are subject to the Irish Takeover Panel Act, 1997, Takeover Rules, 2013. Under those Irish Takeover Rules, our Board is not permitted to take any action that might frustrate an offer for our ordinary shares once our Board has received an approach that may lead to an offer or has reason to believe that such an offer is or may be imminent, subject to certain exceptions. Potentially frustrating actions such as (i) the issue of ordinary shares, options or convertible securities, (ii) material acquisitions or disposals, (iii) entering into contracts other than in the ordinary course of business or (iv) any action, other than seeking alternative offers, which may result in frustration of an offer, are prohibited during the course of an offer or at any earlier time during which our Board has reason to believe an offer is or may be imminent. These provisions may give our Board less ability to control negotiations with hostile offerors and protect the interests of holders of ordinary shares than would be the case for a corporation incorporated in a jurisdiction of the U.S.
Irish law requires that our shareholders renew every five years the authority of our Board of Directors to issue shares and to do so for cash without applying the statutory pre-emption right, and if our shareholders do not renew these authorizations by May 17, 2022 (or any renewal is subject to limitations), our ability to raise additional capital to fund our operations would be limited.
As an Irish incorporated company, we are governed by the Companies Act. The Companies Act requires that every five years our shareholders renew the separate authorities of our Board to (a) allot and issue shares and (b) opt out of the statutory pre-emption right that otherwise applies to share issuances for cash (which pre-emption right would require that shares issued for cash be offered to our existing shareholders on a pro rata basis before the shares may be issued to new shareholders). Our Constitution currently authorizes our Board to issue ordinary shares up to the amount of our authorized share capital, and to opt out of the statutory pre-emption right for such issuances, and our shareholders renewed those authorizations at our Annual General Meeting of Shareholders held on May 17, 2017. Under Irish law, these authorizations will expire on May 17, 2022, five years after our shareholders last renewed these authorizations. Irish law requires that our shareholders renew the authority for our Board to issue ordinary shares by a resolution approved by not less than 50% of the votes cast at a general meeting of our shareholders. Irish law requires that our shareholders renew the authority of our Board to opt out of the statutory pre-emption right in share issuances for
37
cash by a resolution approved by not less than 75% of the votes cast at a general meeting of our shareholders. If these authorizations are not renewed before May 17, 2022, or are renewed with limitations, our Board would be limited in its ability to issue shares, which would limit our ability to raise additional capital to fund our operations, including the research, development and potential commercialization of our product candidates.
Transfers of our ordinary shares may be subject to Irish stamp duty.
Irish stamp duty may be payable in respect of transfers of our ordinary shares (currently at the rate of 1% of the price paid or the market value of the shares acquired, if greater).
Under the Irish Stamp Duties Consolidation Act, 1999 (the “Stamp Duties Act”), a transfer of our ordinary shares from a seller who holds shares through DTC to a buyer who holds the acquired shares through DTC should not be subject to Irish stamp duty. Shareholders may also transfer their shares into or out of DTC without giving rise to Irish stamp duty provided that there is no change in the beneficial ownership of such shares and the transfer into or out of DTC is not effected in contemplation of a subsequent sale of such shares to a third party; in order to benefit from this exemption from Irish stamp duty, the seller must confirm to us that there is no change in the ultimate beneficial ownership of the shares as a result of the transfer and there is no agreement for the sale of the shares by the beneficial owner to a third party being contemplated.
A transfer of our ordinary shares (i) by a seller who holds shares outside of DTC to any buyer, or (ii) by a seller who holds the shares through DTC to a buyer who holds the acquired shares outside of DTC, may be subject to Irish stamp duty. Payment of any Irish stamp duty is generally a legal obligation of the transferee.
Any Irish stamp duty payable on transfers of our ordinary shares could adversely affect the price of those shares.
We do not anticipate paying cash dividends, and accordingly, shareholders must rely on ordinary share appreciation for any return on their investment.
We anticipate losing money for the foreseeable future and, even if we do ever turn a profit, we intend to retain future earnings, if any, for the development, operation and expansion of our business. Thus, we do not anticipate declaring or paying any cash dividends for the foreseeable future. Therefore, the success of an investment in our ordinary shares will depend upon appreciation in their value and in order to receive any income or realize a return on your investment, you will need to sell your Prothena ordinary shares. There can be no assurance that our ordinary shares will maintain their price or appreciate in value.
Dividends paid by us may be subject to Irish dividend withholding tax.
Although we do not currently anticipate paying cash dividends, if we were to do so in the future, a dividend withholding tax (currently at a rate of 20%) may arise. A number of exemptions from dividend withholding tax exist such that shareholders resident in the U.S. and shareholders resident in other countries that have entered into a double taxation treaty with Ireland may be entitled to exemptions from dividend withholding tax subject to the completion of certain dividend withholding tax declaration forms.
Shareholders entitled to an exemption from Irish dividend withholding tax on any dividends received from us will not be subject to Irish income tax in respect of those dividends, unless they have some connection with Ireland other than their shareholding (for example, they are resident in Ireland). Shareholders who receive dividends subject to Irish dividend withholding tax will generally have no further liability to Irish income tax on those dividends.
Prothena ordinary shares received by means of a gift or inheritance could be subject to Irish capital acquisitions tax.
Irish capital acquisitions tax (“CAT”) could apply to a gift or inheritance of our ordinary shares irrespective of the place of residence, ordinary residence or domicile of the parties. This is because our ordinary shares will be regarded as property situated in Ireland. The person who receives the gift or inheritance has primary liability for CAT. Gifts and inheritances passing between spouses are exempt from CAT. It is recommended that each shareholder consult his or her own tax advisor as to the tax consequences of holding our ordinary shares or receiving dividends from us.
None.
Our corporate headquarters are located in Dún Laoghaire, Co. Dublin, Ireland and our U.S. operations are located in South San Francisco, California.
In Dún Laoghaire, Ireland, we occupy approximately 6,258 square feet of office under a lease which expires in August 2025.
In South San Francisco, California, we occupy approximately 129,000 square feet of office and laboratory space under a lease which expires in December 2023.
In Zug, Switzerland, we occupy office space under leases which expire in June and August 2018.
We believe that our facilities are sufficient to meet our current needs.
We are not party to any material pending legal proceedings. We may at times be party to ordinary routine litigation incidental to our business. When appropriate in management’s estimation, we may record reserves in our financial statements for pending legal proceedings.
Not Applicable.
38
Market Information for Ordinary Shares
Our ordinary shares commenced trading on The Nasdaq Global Market under the symbol “PRTA” on December 21, 2012 and currently trade on The Nasdaq Global Select Market. The following table sets forth the high and low intraday per share sale prices of our ordinary shares as reported by Nasdaq during each of the previous eight quarters.
|
Price Range Per Share
|
||||||||
|
|
High
|
Low
|
||||||
|
Fiscal 2017
|
||||||||
|
Fourth quarter
|
$
|
64.96
|
|
$
|
34.85
|
|
||
|
Third quarter
|
$
|
70.00
|
|
$
|
52.92
|
|
||
|
Second quarter
|
$
|
59.10
|
|
$
|
48.23
|
|
||
|
First quarter
|
$
|
63.14
|
|
$
|
45.13
|
|
||
|
Fiscal 2016
|
||||||||
|
Fourth quarter
|
$
|
68.18
|
|
$
|
40.58
|
|
||
|
Third quarter
|
$
|
64.50
|
|
$
|
35.04
|
|
||
|
Second quarter
|
$
|
51.45
|
|
$
|
33.53
|
|
||
|
First quarter
|
$
|
67.32
|
|
$
|
28.20
|
|
||
On
February 9, 2018
, the closing price of our ordinary shares was
$28.19
.
Holders
There were approximately
1,210
shareholders of record of our ordinary shares as of
February 9, 2018
. Because many of our shares are held by brokers and other institutions on behalf of shareholders, we are unable to estimate the total number of shareholders represented by these record holders.
Dividend Policy
We have not paid dividends in the past and do not anticipate paying dividends in the foreseeable future. Any future determination to pay dividends will be at the discretion of our Board of Directors and will be dependent upon our financial condition, results of operations, capital requirements and such other factors as the Board of Directors deems relevant.
Under Irish law, dividends and distributions may only be made from distributable reserves. Distributable reserves generally means accumulated realized profits, to the extent not previously utilized by distribution or capitalization, less accumulated realized losses, to the extent not previously written off in a reduction or re-organization of capital. In addition, no distribution or dividend may be made unless the net assets of Prothena are equal to, or in excess of, the aggregate of our called up share capital plus undistributable reserves and the distribution does not reduce our net assets below such aggregate. Undistributable reserves include undenominated capital, the share premium account, the capital redemption reserve fund and the amount by which Prothena’s accumulated unrealized profits, so far as not previously utilized by any capitalization, exceed our accumulated unrealized losses, so far as not previously written off in a reduction or reorganization of capital.
The determination as to whether or not we have sufficient distributable reserves to fund a dividend must be made by reference to the “relevant financial statements” of Prothena. The “relevant financial statements” are either the last set of unconsolidated annual audited financial statements or other financial statements properly prepared in accordance with the Irish Companies Act 2014, which give a “true and fair view” of our unconsolidated financial position and accord with accepted accounting practice. The relevant financial statements must be filed in the Companies Registration Office (the official public registry for companies in Ireland).
39
Securities Authorized for Issuance Under Equity Compensation Plans
See Item 12 of Part III of this Form 10-K regarding information about securities authorized for issuance under our equity compensation plans.
Performance Graph
(1)
The following graph shows a comparison from December 31, 2012 through
December 31, 2017
of cumulative total return on assumed investment of $100.00 in cash in our ordinary shares, the Nasdaq Composite Index and the Nasdaq Biotechnology Index. Such returns are based on historical results and are not intended to suggest future performance. Points on the graph represent the performance as of end of each business day.
COMPARISON OF 5-YEAR CUMULATIVE TOTAL RETURN
Among Prothena Corporation plc, the Nasdaq Composite Index, and the Nasdaq Biotechnology Index
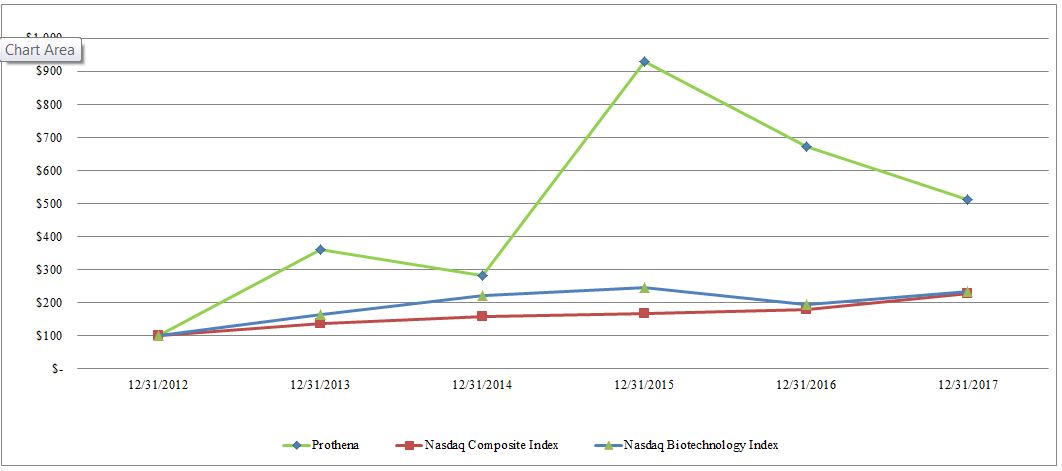
|
Cumulative Total Return as of
|
12/31/2012
|
12/31/2013
|
12/31/2014
|
12/31/2015
|
12/31/2016
|
12/31/2017
|
||||||||||||||||
|
Prothena Corporation plc
|
$100
|
$
|
362
|
|
$
|
283
|
|
$
|
929
|
|
$
|
671
|
|
$
|
511
|
|
||||||
|
Nasdaq Composite Index
|
$100
|
$
|
138
|
|
$
|
157
|
|
$
|
166
|
|
$
|
178
|
|
$
|
229
|
|
||||||
|
Nasdaq Biotechnology Index
|
$100
|
$
|
166
|
|
$
|
222
|
|
$
|
247
|
|
$
|
194
|
|
$
|
235
|
|
||||||
(1)
The information under the heading “Performance Graph” shall not be deemed “soliciting material” or to be “filed” with the SEC for purposes of Section 18 of the Securities Exchange Act of 1934, as amended, or otherwise subject to the liabilities under that Section, and shall not be deemed incorporated by reference into any filing of Prothena Corporation plc under the Securities Act of 1933, as amended.
Recent Sales of Unregistered Securities
None.
Use of Proceeds
None.
Purchases of Equity Securities by the Issuer and Affiliated Purchasers
None.
Irish Law Matters
40
As we are an Irish public limited company, the following matters of Irish law are relevant to the holders of our ordinary shares.
Irish Restrictions on Import and Export of Capital
Except as indicated below, there are no restrictions on non-residents of Ireland dealing in Irish domestic securities, which includes ordinary shares of Irish companies. Dividends and redemption proceeds also continue to be freely transferable to non-resident holders of such securities. The Irish Financial Transfers Act, 1992 (the “Transfers Act”) gives power to the Minister for Finance of Ireland to restrict financial transfers between Ireland and other countries and persons. Financial transfers are broadly defined and include all transfers that would be movements of capital or payments within the meaning of the treaties governing the member states of the European Union. The acquisition or disposal of interests in shares issued by an Irish incorporated company and associated payments falls within this definition. In addition, dividends or payments on redemption or purchase of shares and payments on a liquidation of an Irish incorporated company would fall within this definition. At present, the Transfers Act prohibits financial transfers involving the late Slobodan Milosevic and associated persons, Burma (Myanmar), Belarus, certain persons indicted by the International Criminal Tribunal for the former Yugoslavia, the late Osama bin Laden, Al-Qaida, the Taliban of Afghanistan, Democratic Republic of Congo, Democratic People’s Republic of Korea (North Korea), Iran, Iraq, Côte d’Ivoire, Lebanon, Liberia, Zimbabwe, Sudan, Somalia, Republic of Guinea, Afghanistan, Egypt, Eritrea, Libya, Syria, Tunisia, certain known terrorists and terrorist groups, and countries that harbor certain terrorist groups, without the prior permission of the Central Bank of Ireland.
Irish Taxes Applicable to U.S. Holders
Withholding Tax on Dividends
While we have no current plans to pay dividends, dividends on our ordinary shares would generally be subject to Irish Dividend Withholding Tax (“DWT”) at the standard rate of income tax (currently 20%), unless an exemption applies.
Dividends on our ordinary shares that are owned by residents of the U.S. and held beneficially through the Depositary Trust Company (“DTC”) will not be subject to DWT provided that the address of the beneficial owner of the ordinary shares in the records of the broker is in the U.S.
Dividends on our ordinary shares that are owned by residents of the U.S. and held directly (outside of DTC) will not be subject to DWT provided that the shareholder has completed the appropriate Irish DWT form and this form remains valid. Such shareholders must provide the appropriate Irish DWT form to our transfer agent at least seven business days before the record date for the first dividend payment to which they are entitled.
If any shareholder who is resident in the U.S. receives a dividend subject to DWT, he or she should generally be able to make an application for a refund from the Irish Revenue Commissioners on the prescribed form.
While the U.S./Ireland Double Tax Treaty contains provisions regarding withholding, due to the wide scope of the exemptions from DWT available under Irish domestic law, it would generally be unnecessary for a U.S. resident shareholder to rely on the treaty provisions.
Income Tax on Dividends
A shareholder who is neither resident nor ordinarily resident in Ireland and who is entitled to an exemption from DWT generally has no additional liability to Irish income tax or to the universal social charge on a dividend from us unless that shareholder holds their ordinary shares in connection with a trade or business carried on by such shareholder in Ireland through a branch or agency.
A shareholder who is neither resident nor ordinarily resident in Ireland and who is not entitled to an exemption from DWT generally has no additional liability to Irish income tax or to the universal social charge on a dividend from us. The DWT deducted by us discharges the liability to Irish income tax and to the universal social charge. This however is not the case where the shareholder holds their ordinary shares in connection with a trade or business carried on by such shareholder in Ireland through a branch or agency.
Irish Tax on Capital Gains
A shareholder who is neither resident nor ordinarily resident in Ireland and does not hold their shares in connection with a trade or business carried on by such shareholder in Ireland through a branch or agency should not be within the charge to Irish tax on capital on a disposal of our shares.
Capital Acquisitions Tax
41
Irish Capital Acquisitions Tax (“CAT”) is comprised principally of gift tax and inheritance tax. CAT could apply to a gift or inheritance of our ordinary shares irrespective of the place of residence, ordinary residence or domicile of the parties. This is because our ordinary shares are regarded as property situated in Ireland as our share register must be held in Ireland. The person who receives the gift or inheritance has primary liability for CAT.
CAT is currently levied at a rate of 33% above certain tax-free thresholds. The appropriate tax-free threshold is dependent upon (i) the relationship between the donor and the donee and (ii) the aggregation of the values of previous gifts and inheritances received by the donee from persons within the same category of relationship for CAT purposes. Gifts and inheritances passing between spouses are exempt from CAT. Our shareholders should consult their own tax advisers as to whether CAT is creditable or deductible in computing any domestic tax liabilities.
Stamp Duty
Irish stamp duty may be payable in respect of transfers of our ordinary shares (currently at the rate of 1% of the price paid or the market value of the shares acquired, if greater). Payment of any Irish stamp duty is generally a legal obligation of the transferee.
A transfer of our ordinary shares from a seller who holds shares through DTC to a buyer who holds the acquired shares through DTC should not be subject to Irish stamp duty. A transfer of our ordinary shares (i) by a seller who holds shares outside of DTC to any buyer, or (ii) by a seller who holds the shares through DTC to a buyer who holds the acquired shares outside of DTC, may be subject to Irish stamp duty. Shareholders wishing to transfer their shares into or out of DTC may do so without giving rise to Irish stamp duty provided that there is no change in the beneficial ownership of such shares and the transfer into or out of DTC is not effected in contemplation of a subsequent sale of such shares to a third party. In order to benefit from this exemption from Irish stamp duty, the seller must confirm to us that there is no change in the ultimate beneficial ownership of the shares as a result of the transfer and there is no agreement for the sale of the shares by the beneficial owner to a third party being contemplated.
The following selected consolidated financial information has been derived from our audited consolidated financial statements. The information set forth below is not necessarily indicative of results of future operations and should not be relied upon as an indicator of our future performance. The selected consolidated financial data should be read in conjunction with Item 7, “Management’s Discussion and Analysis of Financial Condition and Results of Operations” and the Consolidated Financial Statements and notes thereto included in Item 8 of this Form 10-K in order to fully understand factors that may affect the comparability of the information presented below.
The following tables set forth our selected consolidated financial data for the periods indicated below (amounts in thousands except for per share amounts).
42
|
Year Ended December 31,
|
||||||||||||||||||||
|
2017
|
2016
|
2015
|
2014
|
2013
|
||||||||||||||||
|
Consolidated Statement of Operations Data:
|
||||||||||||||||||||
|
Collaboration revenue
|
$
|
27,519
|
|
$
|
1,055
|
|
$
|
1,607
|
|
$
|
50,320
|
|
$
|
—
|
|
|||||
|
Revenue—related party
|
—
|
|
—
|
|
—
|
|
534
|
|
676
|
|
||||||||||
|
Total revenue
|
27,519
|
|
1,055
|
|
1,607
|
|
50,854
|
|
676
|
|
||||||||||
|
Operating expenses:
|
||||||||||||||||||||
|
Research and development
|
134,547
|
|
119,534
|
|
58,439
|
|
38,452
|
|
26,052
|
|
||||||||||
|
General and administrative
|
48,226
|
|
41,056
|
|
23,105
|
|
19,051
|
|
15,051
|
|
||||||||||
|
Total operating expenses
|
182,773
|
|
160,590
|
|
81,544
|
|
57,503
|
|
41,103
|
|
||||||||||
|
Loss from operations
|
(155,254
|
)
|
(159,535
|
)
|
(79,937
|
)
|
(6,649
|
)
|
(40,427
|
)
|
||||||||||
|
Other income (expense):
|
||||||||||||||||||||
|
Interest income (expense), net
|
(142
|
)
|
556
|
|
196
|
|
79
|
|
71
|
|
||||||||||
|
Other income (expense), net
|
(2,207
|
)
|
15
|
|
(170
|
)
|
231
|
|
(225
|
)
|
||||||||||
|
Total other income (expense), net
|
(2,349
|
)
|
571
|
|
26
|
|
310
|
|
(154
|
)
|
||||||||||
|
Loss before income taxes
|
(157,603
|
)
|
(158,964
|
)
|
(79,911
|
)
|
(6,339
|
)
|
(40,581
|
)
|
||||||||||
|
Provision for (benefit from) income taxes
|
(4,366
|
)
|
1,144
|
|
701
|
|
811
|
|
415
|
|
||||||||||
|
Net loss
|
$
|
(153,237
|
)
|
$
|
(160,108
|
)
|
$
|
(80,612
|
)
|
$
|
(7,150
|
)
|
$
|
(40,996
|
)
|
|||||
|
Basic and diluted net loss per share
|
$
|
(4.07
|
)
|
$
|
(4.66
|
)
|
$
|
(2.66
|
)
|
$
|
(0.29
|
)
|
$
|
(2.20
|
)
|
|||||
|
Shares used to compute basic and diluted net loss per share
|
37,654
|
|
34,351
|
|
30,326
|
|
24,672
|
|
18,615
|
|
||||||||||
|
Year Ended December 31,
|
||||||||||||||||||||
|
2017
|
2016
|
2015
|
2014
|
2013
|
||||||||||||||||
|
Consolidated Balance Sheet Data:
|
||||||||||||||||||||
|
Cash and cash equivalents and restricted cash
|
$
|
421,676
|
|
$
|
390,979
|
|
$
|
370,586
|
|
$
|
293,579
|
|
$
|
176,677
|
|
|||||
|
Total assets
|
496,329
|
|
459,976
|
|
385,236
|
|
304,116
|
|
182,410
|
|
||||||||||
|
Other non-current liabilities
|
51,769
|
|
53,498
|
|
2,351
|
|
2,188
|
|
1,734
|
|
||||||||||
|
Total liabilities
|
89,140
|
|
94,573
|
|
24,567
|
|
14,227
|
|
9,140
|
|
||||||||||
|
Shareholders’ equity
|
407,189
|
|
365,403
|
|
360,669
|
|
289,889
|
|
173,270
|
|
||||||||||
This Annual Report on Form 10-K, including under Item 1- Business and in this Management’s Discussion and Analysis of Financial Condition and Results of Operations, contains forward-looking statements within the meaning of Section 21E of the Securities Exchange Act of 1934, as amended. These statements relate to, among other things, our strategy; our expected research and development (“R&D”) and general and administrative (“G&A”) expenses in 2018; the sufficiency of our cash and cash equivalents to meet our obligations; our anticipated need for additional capital; the potential impact on us of recent U.S. tax legislation; and our estimates of certain future contractual obligations. Forward-looking statements may include words such as “aim,” “anticipate,” “assume,” “believe,” “contemplate,” “continue,” “could,” “due,” “estimate,” “expect,” “goal,” “intend,” “may,” “objective” “plan,” “predict,” “potential,” “positioned,” “seek,” “should,” “target,” “will,” “would” and other similar expressions that are predictions of or indicate future events and future trends, or the negative of these terms or other comparable terminology. Forward-looking statements are subject to risks and uncertainties, and actual events or results may differ materially. Factors that could cause our actual results to differ materially include, but are not limited to, the risks and uncertainties listed below as well as those discussed under Item 1A - Risk Factors of this Form 10-K.
|
•
|
our ability to obtain additional financing in future offerings and/or obtain funding from future collaborations;
|
|
•
|
our operating losses;
|
|
•
|
our ability to successfully complete research and development of our drug candidates;
|
43
|
•
|
our ability to develop, manufacture and commercialize products;
|
|
•
|
our collaboration with Roche pursuant to the License Agreement;
|
|
•
|
our ability to protect our patents and other intellectual property;
|
|
•
|
our ability to hire and retain key employees;
|
|
•
|
tax treatment of our separation from Elan and subsequent distribution of our ordinary shares;
|
|
•
|
our ability to maintain financial flexibility and sufficient cash, cash equivalents and investments and other assets capable of being monetized to meet our liquidity requirements;
|
|
•
|
potential disruptions in the U.S. and global capital and credit markets;
|
|
•
|
government regulation of our industry;
|
|
•
|
the volatility of our ordinary share price;
|
|
•
|
business disruptions; and
|
|
•
|
the other risks and uncertainties described in Item 1A - Risk Factors of this Form 10-K.
|
We undertake no obligation to revise or update any forward-looking statements to reflect any event or circumstance that arises after the date of this report.
This discussion should be read in conjunction with the Consolidated Financial Statements and Notes presented in Item 8 of this Form 10-K.
Overview
Prothena Corporation plc is a global, late-stage clinical biotechnology company establishing fully-integrated research, development and commercial capabilities and focused on advancing new therapies in the neuroscience and orphan disease categories. Fueled by its deep scientific understanding built over decades of research in protein misfolding, Prothena seeks to fundamentally change the course of progressive diseases associated with this biology.
Our pipeline of antibody-based product candidates targets a number of potential indications including AL amyloidosis (NEOD001), Parkinson’s disease and other related synucleinopathies (PRX002/RG7935) and ATTR amyloidosis (PRX004). The Company continues to advance additional discovery programs where our deep scientific understanding of disease pathology can be leveraged. We have a number of discovery-stage programs targeting proteins implicated in diseases across the neuroscience and orphan categories, including tau and Aβ for the potential treatment of Alzheimer’s disease and other neurodegenerative disorders and ALECT2 for the potential treatment of ALECT2 amyloidosis.
We were formed on September 26, 2012 under the laws of Ireland and re-registered as an Irish public limited company on October 25, 2012. Our ordinary shares began trading on The Nasdaq Global Market under the symbol “PRTA” on December 21, 2012 and currently trade on The Nasdaq Global Select Market.
Critical Accounting Policies and Estimates
Management’s discussion and analysis of our financial condition and results of operations is based on our consolidated financial statements, which have been prepared in accordance with the accounting principles generally accepted in the U.S. (“GAAP”). The preparation of these consolidated financial statements requires us to make estimates and assumptions for the reported amounts of assets, liabilities, revenues, expenses and related disclosures. We believe the following policies to be critical to the judgments and estimates used in the preparation of our financial statements.
Revenue Recognition
Revenue is recognized when earned and non-refundable, when payment is reasonably assured, and when there is no future obligation with respect to the revenue, in accordance with the terms prescribed in the applicable contract.
Multiple Element Arrangements
Our revenues are generated primarily through our license, development and commercialization agreement. These types of agreements generally contain multiple elements, or deliverables, which may include (i) licenses to our technology, (ii) research and development (“R&D”) activities to be performed on behalf of the collaborative partner, and (iii) in certain cases, services or
44
obligations in connection with the manufacturing or supply of preclinical and clinical material. Payments to us under these arrangements typically include one or more of the following: non-refundable, upfront license fees; funding of research and/or development efforts; milestone payments; and royalties on future product sales.
Revenue under license, development and commercialization agreements is recognized based on the performance requirements of the contract. Determinations of whether persuasive evidence of an arrangement exists and whether delivery has occurred or services have been rendered are based on management’s judgments regarding the fixed nature of the fees charged for deliverables and the collectability of those fees. Should changes in conditions cause management to determine that these criteria are not met for any new or modified transactions, revenue recognized could be adversely affected.
We recognize revenue related to license, development and commercialization agreements in accordance with the provisions of FASB ASC Topic 605-25, Revenue Recognition - Multiple-Element Arrangements. We evaluate all deliverables within an arrangement to determine whether or not they provide value on a stand-alone basis. Based on this evaluation, the deliverables are separated into units of accounting. The arrangement consideration that is fixed or determinable at the inception of the arrangement is allocated to the separate units of accounting based on their relative selling prices. We may exercise significant judgment in determining whether a deliverable is a separate unit of accounting, as well as in estimating the selling prices of such unit of accounting. A change in such judgment could result in a significant change in the period in which revenue is recognized.
To determine the selling price of a separate deliverable, we use the hierarchy as prescribed in ASC Topic 605-25 based on vendor-specific objective evidence (“VSOE”), third-party evidence (“TPE”) or best estimate of selling price (“BESP”). VSOE is based on the price charged when the element is sold separately and is the price actually charged for that deliverable. TPE is determined based on third party evidence for a similar deliverable when sold separately and BESP is the estimated selling price at which we would transact a sale if the elements of collaboration and license arrangements were sold on a stand-alone basis to the buyer. We may not be able to establish VSOE or TPE for the deliverables within collaboration and license arrangements, as we may not have a history of entering into such arrangements or selling the individual deliverables within such arrangements separately. In addition, there may be significant differentiation in these arrangements, which indicates that comparable third party pricing may not be available. We may determine that the selling price for the deliverables within collaboration and license arrangements should be determined using BESP. The process for determining BESP involves significant judgment on our part and includes consideration of multiple factors such as estimated direct expenses and other costs, and available data.
Payments or full reimbursements resulting from our R&D efforts for those arrangements where such efforts are considered as deliverables are recognized as the services are performed and are presented on a gross basis so long as there is persuasive evidence of an arrangement, the fee is fixed or determinable, and collection of the related receivable is reasonably assured. However, such funding is recognized as a reduction of R&D expense when we engage in a R&D project jointly with another entity, with both entities participating in project activities and sharing costs and potential benefits of the project. Accordingly, reimbursement of R&D expenses pursuant to the cost-sharing provisions of our agreements with Roche is recognized as a reduction to R&D expense.
Milestone Revenue
We account for milestones under ASU No. 2010-17, Milestone Method of Revenue Recognition. Under the milestone method, contingent consideration received from the achievement of a substantive milestone is recognized in its entirety in the period in which the milestone is achieved. A milestone is defined as an event (i) that can only be achieved based in whole or in part on either the entity’s performance or on the occurrence of a specific outcome resulting from the entity’s performance, (ii) for which there is substantive uncertainty at the date the arrangement is entered into that the event will be achieved, and (iii) that would result in additional payments being due to the entity. At the inception of an agreement that includes milestone payments, we evaluate whether each milestone is substantive and at risk to both parties on the basis of the contingent nature of the milestone. This evaluation includes an assessment of whether (a) the consideration is commensurate with either (1) the entity’s performance to achieve the milestone, or (2) the enhancement of the value of the delivered item(s) as a result of a specific outcome resulting from the entity’s performance to achieve the milestone, (b) the consideration relates solely to past performance, and (c) the consideration is reasonable relative to all of the deliverables and payment terms within the arrangement. We evaluate factors such as the scientific, regulatory, commercial and other risks that must be overcome to achieve the respective milestone, the level of effort and investment required to achieve the respective milestone and whether the milestone consideration is reasonable relative to all deliverables and payment terms in the arrangement in making this assessment. The conclusion as to whether milestone payments are substantive involves management judgment regarding the factors noted above.
We generally classify each of our milestones into one of three categories: (i) clinical milestones, (ii) regulatory and development milestones, and (iii) commercial milestones. Clinical milestones are typically achieved when a product candidate advances or completes a defined phase of clinical research. For example, a milestone payment may be due to us upon the initiation of a clinical trial for a new indication. Regulatory and development milestones are typically achieved upon acceptance of the
45
submission for marketing approval of a product candidate or upon approval to market the product candidate by the FDA or other regulatory authorities. For example, a milestone payment may be due to us upon filing of a Biologics License Application (“BLA”) with the FDA. Commercial milestones are typically achieved when an approved pharmaceutical product reaches certain defined levels of net royalty sales by the licensee of a specified amount within a specified period.
Commercial milestone payments and milestone payments that are not deemed to be substantive will be accounted for as a contingent revenue payment with revenue recognized when all contingencies are lifted, which is expected to be upon achievement of the milestone, assuming all revenue recognition criteria are met.
Profit Share Revenue
For agreements, with profit sharing arrangements, we will record our share of the pre-tax commercial profit as collaboration revenue when the profit sharing can be reasonably estimated and collectability is reasonably assured. If profit sharing estimates are materially different from actual results it could impact the amount of revenue recognized in future periods. If the profit share cannot be reasonably estimated or collectability of the profit share amount is not reasonably assured, our portion of the profit share it could impact the amount of revenue recognized in future periods.
Royalty Revenue
We will recognize revenue from royalties based on licensees' sales of our products or products using its technologies. Royalties are recognized as earned in accordance with the contract terms when royalties from licensees can be reasonably estimated and collectability is reasonably assured. If we can no longer estimate royalty revenue or our estimates are materially different from actual results it could impact the amount of revenue recognized in future periods.
Build-to-Suit Lease Accounting
In certain lease arrangements, we are involved in the construction of the building. To the extent we are involved with structural improvements of the construction project or take construction risk prior to the commencement of a lease, Financial Accounting Standards Board, or FASB, Accounting Standards Codification, or ASC, 840-40, Leases – Sale-Leaseback Transactions (Subsection 05-5), requires us to be considered the owner for accounting purposes of these types of projects during the construction period. Therefore, we record an asset in property and equipment, net on the consolidated balance sheets, including capitalized interest costs, for the replacement cost of the pre-existing building plus the amount of estimated construction costs and tenant improvements incurred by the landlord and us as of the balance sheet date. We record a corresponding build-to-suit lease obligation on our consolidated balance sheets representing the amounts paid by the lessor.
Once construction is complete, we consider the requirements for sale-leaseback accounting treatment, including evaluating whether all risks of ownership have been transferred back to the landlord, as evidenced by a lack of continuing involvement in the leased property. If the arrangement does not qualify for sale-leaseback accounting treatment, the building asset remains on our consolidated balance sheets at its historical cost, and such asset is depreciated over its estimated useful life of 30 years. We bifurcate our lease payments into a portion allocated to the building, and a portion allocated to the parcel of land on which the building has been built. The portion of the lease payments allocated to the land are treated for accounting purposes as operating lease payments, and therefore recorded as rent expense in the consolidated statements of operations. The portion of the lease payments allocated to the building is further bifurcated into a portion allocated to interest expense and a portion allocated to reduce the build-to-suit lease obligation.
The interest rate used for the build-to-suit lease obligation represents our estimated incremental borrowing rate, adjusted to reduce any built in loss.
The initial recording of these assets and liabilities is classified as non-cash investing and financing items, respectively, for purposes of the consolidated statements of cash flows.
The most significant estimates used by management in accounting for build-to-suit leases and the impact of these estimates are as follows:
|
•
|
Expected lease term- Our expected lease term includes the contractual lease period. The expected lease term is used in determining the depreciable life of the asset or the straight-line rent recognition period for the portion of the lease payment allocable to the land component.
|
|
•
|
Incremental borrowing rate- We estimate our incremental borrowing rate. For build-to-suit leases recorded on our consolidated balance sheets with a related build-to-suit lease obligation, the incremental borrowing rate is used in allocating our rental payments between interest expense and a reduction of the outstanding build-to-suit lease obligation.
|
|
•
|
Fair market value of leased asset- The fair market value of a build-to-suit lease property is based on replacement cost of the pre-construction shell and comparable market data. Fair market value is used in determining the amount of the property asset and related build-to-suit lease obligation to be recognized on our consolidated balance sheet for build-to-suit leases.
|
46
Research and Development
We expense R&D costs as incurred. R&D expenses include, but are not limited to, salary and benefits, share-based compensation, clinical trial activities, drug development and manufacturing prior to FDA approval and third-party service fees, including clinical research organizations and investigative sites. We recognize costs for certain development activities, such as clinical trials, based on an evaluation of the progress to completion of specific tasks using data such as patient enrollment, clinical site activations, or information provided to us by our vendors on their actual costs incurred. The objective of our accrual policy is to match the recording of the expenses in our Consolidated Financial Statements to the actual services we have received and efforts we have expended. As such, expense accruals related to clinical trials are recognized based on our estimate of the degree of completion of the events specified in the specific clinical study or trial contract. Payments for these activities are based on the terms of the individual arrangements, which may differ from the pattern of costs incurred, and are reflected in our Consolidated Financial Statements as prepaid or accrued research and development. Amounts due may be fixed fee, fee for service, and may include upfront payments, monthly payments, and payments upon the completion of milestones or receipt of deliverables.
Share-based Compensation
We account for our share-based compensation in accordance with the fair value recognition provisions of current authoritative guidance. Share-based awards, including stock options, are measured at fair value as of the grant date and recognized to expense over the requisite service period (generally the vesting period), which we have elected to amortize on a straight-line basis. Since share-based compensation expense is based on awards ultimately expected to vest, it has been reduced by an estimate for future forfeitures. Forfeitures are estimated based on expected turnover and historical experience. We estimate forfeitures at the time of grant and revise our estimate, if necessary, in subsequent periods. We estimate the fair value of options granted using the Black-Scholes option valuation model. Significant judgment is required in determining the proper assumptions used in these models. The assumptions used include the risk free interest rate, expected term, expected volatility and expected dividend yield. We base our assumptions on historical data when available or when not available, on a peer group of companies. Prior to 2015, the expected volatility was based on historical stock volatilities of several of our publicly traded comparable companies over a period equal to the expected life of the options, as we did not have a long enough trading history to use the volatility of our own ordinary shares. Starting in 2015, the expected volatility was based on a combination of historical volatility for our shares and the historical volatilities of several of our publicly traded comparable companies. These peer companies are publicly traded, have similar industry, life cycle, revenue and market capitalization. In addition, since we do not have sufficient historical employee share option exercise data, the simplified method has been used to estimate the expected life of all options.
These assumptions consist of estimates of future market conditions, which are inherently uncertain, and therefore subject to our judgment and therefore any changes in assumptions could significantly impact the future grant date fair value of share-based awards.
Total share-based compensation expense for the
years ended December 31, 2017, 2016 and 2015
was
$26.8 million
,
$24.9 million
and
$10.4 million
, respectively.
The information contained in Note 2 to the Consolidated Financial Statements under the heading “Recent Accounting Pronouncements” is hereby incorporated by reference into this Part II, Item 7.
Results of Operations
Comparison of Years Ended December 31, 2017, 2016 and 2015
Revenue
|
Year Ended December 31,
|
Percentage Change
|
||||||||||||||||
|
2017
|
2016
|
2015
|
2017/2016
|
2016/2015
|
|||||||||||||
|
(Dollars in thousands)
|
|||||||||||||||||
|
Collaboration revenue
|
$
|
27,519
|
|
$
|
1,055
|
|
$
|
1,607
|
|
2,508
|
%
|
(34
|
)%
|
||||
|
Total revenue
|
$
|
27,519
|
|
$
|
1,055
|
|
$
|
1,607
|
|
2,508
|
%
|
(34
|
)%
|
||||
Total revenue was
$27.5 million
,
$1.1 million
and
$1.6 million
for the
years ended December 31, 2017, 2016 and 2015
, respectively.
Collaboration revenue includes milestone payments and reimbursements under our License Agreement with Roche. The portion of the amounts recognized as collaboration revenue for the milestone and the development reimbursements were based
on the relative selling price method in applying multiple element accounting. See Note 8 to the Consolidated Financial Statements “Roche License Agreement” for more information.
Collaboration revenue for the
year ended December 31, 2017
consisted of a clinical milestone from Roche of
$30.0 million
(of which
$26.6 million
was recognized as collaboration revenue) and reimbursement for research services of
$0.9 million
, while collaboration revenue for the
year ended December 31, 2016
consisted of reimbursement for research services of
$1.1 million
. Conversely, collaboration revenue for the year ended December 31, 2015 consisted of the following amounts from Roche under the License Agreement: reimbursement for development costs of $5.1 million (of which $0.2 million was recognized as collaboration license revenue) and reimbursement for research services of $1.4 million.
Operating Expenses
|
Year Ended December 31,
|
Percentage Change
|
||||||||||||||||
|
2017
|
2016
|
2015
|
2017/2016
|
2016/2015
|
|||||||||||||
|
(Dollars in thousands)
|
|||||||||||||||||
|
Research and development
|
$
|
134,547
|
|
$
|
119,534
|
|
$
|
58,439
|
|
13
|
%
|
105
|
%
|
||||
|
General and administrative
|
48,226
|
|
41,056
|
|
23,105
|
|
17
|
%
|
78
|
%
|
|||||||
|
Total operating expenses
|
$
|
182,773
|
|
$
|
160,590
|
|
$
|
81,544
|
|
14
|
%
|
97
|
%
|
||||
Total operating expenses consist of R&D expenses and general and administrative (“G&A”) expenses. Our operating expenses were
$182.8 million
,
$160.6 million
and
$81.5 million
for the
years ended December 31, 2017, 2016 and 2015
, respectively.
Our R&D expenses primarily consist of personnel costs and related expenses, including share-based compensation and external costs associated with nonclinical activities and drug development related to our drug programs, including NEOD001, PRX002/RG7935, PRX003, PRX004 and our discovery programs. Pursuant to our License Agreement with Roche, we make payments to Roche for our share of the development expenses incurred by Roche related to PRX002/RG7935 program, which is included in our R&D expense. We also record reimbursements from Roche for development as an offset to R&D expense.
Our G&A expenses primarily consist of professional service expenses and personnel costs and related expenses, including share-based compensation.
Research and Development Expenses
Our R&D expenses increased by
$15.0 million
, or
13%
, for the
year ended December 31, 2017
, compared to the prior year. The increase for the
year ended December 31, 2017
was primarily due to higher personnel costs (including share-based compensation expenses), and to a lesser extent higher clinical trial costs associated primarily with the NEOD001 program, higher consulting expenses and higher expense associated with PRX002/RG7935, which was partially offset by a decrease in external expenses related to product manufacturing.
For the year ended December 31, 2016, our R&D expenses increased by $61.1 million, or 105%, compared to the prior year. The increase for the year ended December 31, 2016 was primarily due to an increase in external expenses related to product manufacturing related to NEOD001 and to a lesser extent PRX003 and PRX004, higher clinical trial costs associated primarily with NEOD001 and to a lesser extent PRX003, higher personnel costs (including share-based compensation expenses) and higher consulting expenses.
Our research activities are aimed at developing new drug products. Our development activities involve the translation of our research into potential new drugs. R&D expenses include personnel costs and related expenses, external expenses associated with nonclinical and drug development and materials, equipment and facilities costs that are allocated to clearly related R&D activities.
The following table sets forth the R&D expenses for our major programs (specifically, any program with successful first dosing in a Phase 1 clinical trial, which were NEOD001, PRX002/RG7935 and PRX003) and other R&D expenses for the
years ended December 31, 2017, 2016 and 2015
, and the cumulative amounts to date (in thousands):
47
|
Year Ended December 31,
|
Cumulative to Date
|
|||||||||||||||
|
2017
|
2016
|
2015
|
||||||||||||||
|
NEOD001
(1)
|
$
|
101,492
|
|
$
|
81,405
|
|
$
|
33,872
|
|
$
|
252,208
|
|
||||
|
PRX002/RG7935
(2)
|
6,412
|
|
6,554
|
|
7,472
|
|
50,748
|
|
||||||||
|
PRX003
(3)
|
9,234
|
|
15,135
|
|
8,580
|
|
58,674
|
|
||||||||
|
Other R&D
(4)
|
17,409
|
|
16,440
|
|
8,515
|
|
||||||||||
|
$
|
134,547
|
|
$
|
119,534
|
|
$
|
58,439
|
|
||||||||
|
(1)
|
Cumulative R&D costs to date for NEOD001 include the costs incurred from the date when the program has been separately tracked in preclinical development. Expenditures in the early discovery stage are not tracked by program and accordingly have been excluded from this cumulative amount.
|
|
(2)
|
Cumulative R&D costs to date for PRX002/RG7935 and related antibodies include the costs incurred from the date when the program has been separately tracked in nonclinical development. Expenditures in the early discovery stage are not tracked by program and accordingly have been excluded from this cumulative amount. PRX002/RG7935 cost include payments to Roche for our share of the development expenses incurred by Roche related to PRX002/RG7935 programs and is net of reimbursements from Roche for development and supply services recorded as an offset to R&D expense. For the
years ended December 31, 2017, 2016 and 2015
,
$5.1 million
,
$3.6 million
, and $4.9 million, respectively, were recorded as an offset to R&D expenses including
$3.4 million
for a portion of the
$30.0 million
milestone payment received from Roche in the
year ended December 31, 2017
.
|
|
(3)
|
Cumulative R&D costs to date for PRX003 include the costs incurred from the date when the program has been separately tracked in nonclinical development. Expenditures in the early discovery stage are not tracked by program and accordingly have been excluded from this cumulative amount. Based on the Phase 1b multiple ascending dose study results announced in September 2017, we announced that we will not advance PRX003 into mid-stage clinical development for psoriasis or psoriatic arthritis as previously planned.
|
|
(4)
|
Other R&D is comprised of preclinical development and discovery programs that have not progressed to first patient dosing in a Phase 1 clinical trial.
|
Assuming positive results from our Phase 2b PRONTO study of NEOD001, we expect our R&D expenses to increase in 2018 over the prior year primarily due to increased spending primarily related to the NEOD001 program.
General and Administrative Expenses
Our G&A expenses increased by
$7.2 million
, or
17%
, for the
year ended December 31, 2017
, compared to the prior year. The increase for the
year ended December 31, 2017
was primarily due to higher personnel costs, and to a lesser extent higher consulting and other expenses, which were partially offset by lower share-based compensation expense of $7.7 million and $1.0 million related to the accelerated vesting of stock options upon the passing of the Company's former CEO and accelerated vesting of stock options due to our former Chief Commercial Officer under a separation agreement for the year ended December 31, 2016, and the
$2.4 million
gain recognized from the assignment of our former South San Francisco facility lease in January 2017.
Our G&A expenses increased by $18.0 million, or 78%, for the year ended December 31, 2016, compared to the prior year. The increase for the year ended December 31, 2016 was primarily due to higher personnel costs, including share-based compensation expenses (which for the year ended December 31, 2016 includes $7.7 million and $1.0 million of share-based compensation expense related to the accelerated vesting of stock options and payments due to our former CEO's estate upon his death and accelerated vesting of stock options and payments due to our former Chief Commercial Officer under a separation agreement, respectively) and higher consulting expenses.
Assuming positive results from our Phase 2b PRONTO study of NEOD001, we expect our G&A expenses to increase in 2018 over the prior year in support of our anticipated R&D activities and due to increases in personnel, legal and expenses associated with regulatory and commercial preparation activities.
48
Other Income (Expense)
|
Year Ended December 31,
|
Percentage Change
|
||||||||||||||||
|
2017
|
2016
|
2015
|
2017/2016
|
2016/2015
|
|||||||||||||
|
(Dollars in thousands)
|
|||||||||||||||||
|
Interest income
|
$
|
3,546
|
|
$
|
1,419
|
|
$
|
196
|
|
150
|
%
|
624
|
%
|
||||
|
Interest expense
|
(3,688
|
)
|
(863
|
)
|
—
|
|
327
|
%
|
nm
|
|
|||||||
|
Interest income (expense), net
|
(142
|
)
|
556
|
|
196
|
|
(126
|
)%
|
184
|
%
|
|||||||
|
Other income (expense), net
|
(2,207
|
)
|
15
|
|
(170
|
)
|
nm
|
|
(109
|
)%
|
|||||||
|
Total Other Expense, net
|
$
|
(2,349
|
)
|
$
|
571
|
|
$
|
26
|
|
(511
|
)%
|
2,096
|
%
|
||||
_________________________
nm = not meaningful
Interest income (expense), net decreased by
$698,000
, or
126%
, for the
year ended December 31, 2017
, compared to the same period in the prior year. The decrease for the
year ended December 31, 2017
was primarily due to higher interest expense associated with our built-to-suit lease, which was partially offset by higher interest income associated with higher balances in our cash and money market accounts. Other expense, net for the
year ended December 31, 2017
was primarily foreign exchange losses from transactions with vendors denominated in Euros.
Interest income (expense), net increased by $360,000, or 184%, for the year ended December 31, 2016, compared to the prior year, primarily due to $1.2 million higher interest income associated with higher balances in our cash and money market accounts, which was partially offset by $0.9 million in interest expense associated with our built-to-suit property. Other income, net for the year ended December 31, 2016 was primarily foreign exchange gains from transactions with vendors denominated in Euros.
Provision for (benefit from) Income Taxes
|
Year Ended December 31,
|
Percentage Change
|
||||||||||||||||
|
2017
|
2016
|
2015
|
2017/2016
|
2016/2015
|
|||||||||||||
|
(Dollars in thousands)
|
|||||||||||||||||
|
Provision for (benefit from) income taxes
|
$
|
(4,366
|
)
|
$
|
1,144
|
|
$
|
701
|
|
(482
|
)%
|
63
|
%
|
||||
The provisions (benefit from) income taxes were
$(4.4) million
,
$1.1 million
and
$0.7 million
for the
years ended December 31, 2017, 2016 and 2015
, respectively. The benefit from income taxes increased by $5.5 million for the year ended December 31, 2017, compared to the prior year, primarily due to the excess tax benefits of
$5.3 million
recorded to the tax provision associated with the adoption of ASU 2016-09, Improvements to Employee Share-Based Payment Accounting on January 1, 2017. The provision for income taxes increased by $0.4 million for the year ended December 31, 2016, compared to the prior year, due to higher profits generated from our U.S. subsidiary.
The tax provisions for all periods presented primarily reflect U.S. federal taxes associated with recurring profits attributable to intercompany services that our U.S. subsidiary performs for the Company, and to a lesser extent 2017 also includes Swiss taxes associated with intercompany services that our Swiss subsidiary performs for the Company. No tax benefit has been recorded related to tax losses recognized in Ireland and any deferred tax assets for those losses are offset by a valuation allowance.
On December 22, 2017, the U.S. Tax Cuts and Jobs Act (the “TCJA”) was signed into law in the U.S. The TCJA significantly changes existing U.S. tax law and includes numerous provisions that will affect our business going forward, including changes to the U.S. federal statutory tax rate, the repeal of alternative minimum tax, and additional limits on the deductibility of executive compensation, among other things. The TCJA reduces the U.S. federal statutory tax rate from
34%
to
21%
effective January 1, 2018. Accordingly, we have recorded a provision tax benefit of
0.4 million
related to the remeasurement of our U.S. deferred tax assets to reflect the lower statutory tax rate. Due to the repeal of alternative minimum taxes, we anticipate that our future U.S. taxes will decrease due to our ability to use additional tax credits previously limited by the alternative minimum tax. However, we also expect an increase to our taxable income due to further limitations on the deductibility of compensation of certain of our executive officers.
As of December 31, 2017, we have not completed our accounting for the tax effects of the TCJA, and have recorded provisional net tax benefit based on our best estimates. The provisional amounts incorporate assumptions made based upon our current interpretation of the TCJA and are subject to revision as we receive and interpret any additional clarification and implementation
49
guidance issued by the U.S. Treasury Department, U.S. Internal Revenue Service (the “IRS”) and other standard-setting bodies. Any adjustments to the provisional amounts recorded will be included as an adjustment to the provision for income taxes. Adjustments may materially impact our provision for income taxes and effective tax rate in the period in which the adjustments are made. We anticipate our accounting for the tax effects of the TCJA will be completed in 2018.
Liquidity and Capital Resources
Overview
|
December 31,
|
|||||||
|
2017
|
2016
|
||||||
|
Working capital
|
$
|
388,956
|
|
$
|
350,287
|
|
|
|
Cash and cash equivalents
|
417,620
|
|
386,923
|
|
|||
|
Total assets
|
496,329
|
|
459,976
|
|
|||
|
Total liabilities
|
89,140
|
|
94,573
|
|
|||
|
Total shareholders’ equity
|
407,189
|
|
365,403
|
|
|||
Working capital was
$389.0 million
as of
December 31, 2017
, an increase of
$38.7 million
from working capital of
$350.3 million
as of
December 31, 2016
. This increase in working capital during the
year ended December 31, 2017
was primarily attributable to a higher net cash and cash equivalents balance resulting primarily from the net proceeds of
$150.3 million
from our public offering in March 2017, which was partially offset by use of
$182.8 million
for operating expenses (adjusted to exclude non-cash charges).
As of
December 31, 2017
, we had
$417.6 million
in cash and cash equivalents. Although we believe, based on our current business plans, that our existing cash and cash equivalents will be sufficient to meet our obligations for at least the next twelve months, we anticipate that we will require additional capital in the future in order to continue the research and development of our drug candidates and preparation for commercialization. As of
December 31, 2017
,
$80.1 million
of our outstanding cash and cash equivalents related to U.S. operations that are considered permanently reinvested. We do not intend to repatriate these funds. However, if these funds were repatriated back to Ireland we would incur a withholding tax from the dividend distribution.
We have based this estimate on assumptions that may prove to be wrong, and we could use our available capital resources sooner than we currently expect. Because of the numerous risks and uncertainties associated with the development and commercialization of our product candidates, we are unable to estimate the amounts of increased capital outlays and operating expenses associated with completing the development of our product candidates. Our future capital requirements will depend on numerous factors, including, without limitation, the timing of initiation, progress, results and costs of our clinical trials; the results of our research and nonclinical studies; the costs of clinical manufacturing and of establishing commercial manufacturing arrangements; the costs of preparing, filing and prosecuting patent applications and maintaining, enforcing and defending intellectual property-related claims; the costs and timing of capital asset purchases; our ability to establish research collaborations, strategic collaborations, licensing or other arrangements; the costs to satisfy our obligations under current and potential future collaborations; and the timing, receipt, and amount of revenues or royalties, if any, from any approved drug candidates. Pursuant to the License Agreement with Roche, in the U.S., we and Roche share all development and commercialization costs, as well as profits, all of which will be allocated 70% to Roche and 30% to us, for PRX002/RG7935 in the Parkinson’s disease indication, as well as any other Licensed Products and/or indications for which we opt in to co-develop and co-fund. In order to develop and obtain regulatory approval for our potential products we will need to raise substantial additional funds. We expect to raise any such additional funds through public or private equity or debt financings, collaborative agreements with corporate partners or other arrangements. We cannot assume that such additional financings will be available on acceptable terms, if at all, and such financings may only be available on terms dilutive to our shareholders.
Cash Flows for the Year Ended December 31, 2017, 2016 and 2015
The following table summarizes, for the periods indicated, selected items in our Consolidated Statements of Cash Flows (in thousands):
50
|
Year Ended December 31,
|
|||||||||||
|
|
2017
|
2016
|
2015
|
||||||||
|
Net cash used in operating activities
|
$
|
(131,183
|
)
|
$
|
(116,250
|
)
|
$
|
(58,600
|
)
|
||
|
Net cash used in investing activities
|
(3,521
|
)
|
(16,644
|
)
|
(1,382
|
)
|
|||||
|
Net cash provided by financing activities
|
165,401
|
|
153,287
|
|
136,989
|
|
|||||
|
Net increase in cash and cash equivalents and restricted cash
|
$
|
30,697
|
|
$
|
20,393
|
|
$
|
77,007
|
|
||
Cash Used in Operating Activities
Net cash used in operating activities was
$131.2 million
for the
year ended December 31, 2017
, primarily due to use of
$182.8 million
for operating expenses (adjusted to exclude non-cash charges) and an increase in prepaid expenses and other assets.
Net cash used in operating activities was
$116.3 million
for the year ended December 31, 2016, primarily due to use of $160.6 million for operating expenses (adjusted to exclude non-cash charges), which was partially offset by an increase in accounts payable and accrued liabilities.
Net cash used in operating activities was
$58.6 million
for the year ended December 31, 2015, primarily due to use of $81.5 million for operating expenses (adjusted to exclude non-cash charges), which was partially offset by an increase in accounts payable and accrued liabilities.
Cash Used in Investing Activities
Net cash used in investing activities was
$3.5 million
,
$16.6 million
and
$1.4 million
for the
years ended December 31, 2017, 2016 and 2015
, respectively. Net cash used in investing activities for the
years ended December 31, 2017, 2016 and 2015
primarily related to purchases of property and equipment.
Cash Provided by Financing Activities
Net cash provided by financing activities was
$165.4 million
for the
year ended December 31, 2017
, primarily from the net proceeds of
$150.3 million
from our March 2017 public offering and
$17.8 million
from issuances of ordinary shares upon exercises of stock options.
Net cash provided by financing activities was
$153.3 million
for the year ended December 31, 2016, primarily from the net proceeds of
$128.8 million
from our January 2016 public offering,
$14.2 million
from our landlord for tenant improvement allowance related to our build-to-suit lease and
$10.5 million
from issuances of ordinary shares upon exercises of stock options.
Net cash provided by financing activities was
$137.0 million
for the year ended December 31, 2015, primarily from the net proceeds of
$131.3 million
from our April 2015 public offering and proceeds of
$5.6 million
from issuances of ordinary shares upon exercises of stock options.
Off-Balance Sheet Arrangements
At
December 31, 2017
, we were not a party to any off-balance sheet arrangements that have, or are reasonably likely to have, a current or future effect on our financial condition, changes in financial condition, revenue or expenses, results of operations, liquidity, capital expenditures or capital resources.
Contractual Obligations
Our contractual obligations as of
December 31, 2017
consisted of minimum cash payments under a build-to-suit lease obligation of
$35.7 million
, operating leases of
$2.0 million
, purchase obligations of
$40.9 million
(of which
$8.6 million
is included in accrued current liabilities) and contractual obligations under license agreements of
$1.6 million
(of which
$0.2 million
is included in accrued current liabilities). Purchase obligations consist of non-cancelable purchase commitments to suppliers. Operating leases represent our future minimum rental commitments under our non-cancelable operating leases.
In
August 2015
, we entered into an agreement to lease
6,258
square feet of office space in Dún Laoghaire, Ireland. This lease has a term of
10 years
from commencement and provides for an option to terminate the lease at the end of the fifth year of the term. It is also subject to a rent review every
five
years. As a result of this noncancelable operating lease, we are obligated to make lease payments totaling approximately
€2.0 million
, or
$2.4 million
as converted using an exchange rate as of
December 31,
51
2017
, over the term of the lease, assuming current lease payments. Of this obligation, approximately
$1.9 million
remains outstanding as of
December 31, 2017
.
In
March 2016
, we entered into a noncancelable operating sublease to lease
128,751
square feet of office and laboratory space in South San Francisco, California. We are obligated to make lease payments totaling approximately
$39.2 million
over the lease term. Of this obligation, approximately
$35.7 million
remains outstanding as of
December 31, 2017
.
In 2017, we entered into noncancelable operating subleases to lease office space in Zug, Switzerland. The lease terms expire in March 2018 and August 2018. As of
December 31, 2017
, we are obligated to make lease payments of approximately
CHF 80,000
, or
$82,000
, as converted using an exchange rate as of
December 31, 2017
.
The following is a summary of our contractual obligations as of
December 31, 2017
(in thousands):
|
Total
|
2018
|
2019
|
2020
|
2021
|
2022
|
Thereafter
|
||||||||||||||||||||||
|
Operating leases
(1)
|
$
|
1,983
|
|
$
|
330
|
|
$
|
248
|
|
$
|
248
|
|
$
|
248
|
|
$
|
248
|
|
$
|
661
|
|
|||||||
|
Minimum cash payments under build-to-suit lease obligation
(1)
|
35,747
|
|
4,915
|
|
5,803
|
|
5,979
|
|
6,165
|
|
6,350
|
|
6,535
|
|
||||||||||||||
|
Purchase obligations
|
40,876
|
|
24,585
|
|
16,291
|
|
—
|
|
—
|
|
—
|
|
—
|
|
||||||||||||||
|
Contractual obligations under license agreements
(2)
|
1,560
|
|
370
|
|
130
|
|
100
|
|
100
|
|
85
|
|
775
|
|
||||||||||||||
|
Total
|
$
|
80,166
|
|
$
|
30,200
|
|
$
|
22,472
|
|
$
|
6,327
|
|
$
|
6,513
|
|
$
|
6,683
|
|
$
|
7,971
|
|
|||||||
(1)
See Note 7, “Commitments and Contingencies” to our consolidated financial statements.
(2)
Excludes future obligations pursuant to the cost-sharing arrangement under our License Agreement with Roche. Amounts of such obligations, if any, cannot be determined at this time.
Foreign Currency Risk
Our business is primarily conducted in U.S. dollars except for our agreements with contract manufacturers for drug supplies which are denominated in Euros. We recorded a loss on foreign currency exchange rate differences of approximately
$2.2 million
during the
year ended December 31, 2017
, a gain on foreign currency exchange rate differences of approximately $21,000 during the year ended December 31, 2016, and a loss of $170,000 during the year ended December 31, 2015. If we continue or increase our business activities that require the use of foreign currencies, we may incur further losses if the Euro and other such currencies continue to strengthen against the U.S. dollar.
Interest Rate Risk
Our exposure to interest rate risk is limited to our cash equivalents, which consist of accounts maintained in money market funds. We have assessed that there is no material exposure to interest rate risk given the nature of money market funds. In general, money market funds are not subject to interest rate risk because the interest paid on such funds fluctuates with the prevailing interest rate. Accordingly, our interest income fluctuates with short-term market conditions.
In the future, we anticipate that our exposure to interest rate risk will primarily be related to our investment portfolio. We intend to invest any surplus funds in accordance with a policy approved by our board of directors which will specify the categories, allocations, and ratings of securities we may consider for investment. The primary objectives of our investment policy are to preserve principal and maintain proper liquidity to meet our operating requirements. Our investment policy also specifies credit quality standards for our investments and limits the amount of credit exposure to any single issue, issuer or type of investment.
Credit Risk
Our receivable from Roche as of
December 31, 2017
and
2016
are amounts due from Roche entities located in the U.S. and Switzerland under the License Agreement with Roche.
Financial instruments that potentially subject us to concentration of credit risk consist of cash and cash equivalents and accounts receivable. We place our cash and cash equivalents with high credit quality financial institutions and pursuant to our investment policy, we limit the amount of credit exposure with any one financial institution. Deposits held with banks may exceed the amount of insurance provided on such deposits. We have not experienced any losses on our deposits of cash and cash equivalents.
52
INDEX TO CONSOLIDATED FINANCIAL STATEMENTS
|
Page
|
|
|
Consolidated Financial Statements:
|
|
|
Reports of Independent Registered Public Accounting Firm
|
|
|
Consolidated Balance Sheets as of December 31, 2017 and 2016
|
|
|
Consolidated Statements of Operations for the years ended December 31, 2017, 2016, and 2015
|
|
|
Consolidated Statements of Cash Flows for the years ended December 31, 2017, 2016, and 2015
|
|
|
Consolidated Statements of Shareholders’ Equity for the years ended December 31, 2017, 2016, and 2015
|
|
|
Notes to the Consolidated Financial Statements
|
|
53
Report of Independent Registered Public Accounting Firm
To the stockholders and board of directors
Prothena Corporation plc:
Opinion on the Consolidated
Financial Statements
We have audited the accompanying consolidated balance sheets of Prothena Corporation plc and subsidiaries as of
December 31, 2017
and
2016
, the related consolidated statements of operations, stockholders’ equity, and cash flows for each of the years in the three‑year period ended
December 31, 2017
, and the related notes (collectively, the “consolidated financial statements”). In our opinion, the consolidated financial statements present fairly, in all material respects, the financial position of the Company as of
December 31, 2017
and
2016
, and the results of its operations and its cash flows for each of the years in the three‑year period ended
December 31, 2017
, in conformity with U.S. generally accepted accounting principles.
We also have audited, in accordance with the standards of the Public Company Accounting Oversight Board (United States) (“PCAOB”), the Company’s internal control over financial reporting as of
December 31, 2017
, based on criteria established in
Internal Control - Integrated Framework (2013)
issued by the Committee of Sponsoring Organizations of the Treadway Commission, and our report dated
February 23, 2018
expressed an unqualified opinion on the effectiveness of the Company’s internal control over financial reporting.
Basis for Opinion
These consolidated financial statements are the responsibility of the Company’s management. Our responsibility is to express an opinion on these consolidated financial statements based on our audits. We are a public accounting firm registered with the PCAOB and are required to be independent with respect to the Company in accordance with the U.S. federal securities laws and the applicable rules and regulations of the Securities and Exchange Commission and the PCAOB.
We conducted our audits in accordance with the standards of the PCAOB. Those standards require that we plan and perform the audit to obtain reasonable assurance about whether the consolidated financial statements are free of material misstatement, whether due to error or fraud. Our audits included performing procedures to assess the risks of material misstatement of the consolidated financial statements, whether due to error or fraud, and performing procedures that respond to those risks. Such procedures included examining, on a test basis, evidence regarding the amounts and disclosures in the consolidated financial statements. Our audits also included evaluating the accounting principles used and significant estimates made by management, as well as evaluating the overall presentation of the consolidated financial statements. We believe that our audits provide a reasonable basis for our opinion.
/s/ KPMG LLP
We have served as the Company’s auditor since 2012.
San Francisco, California
February 23, 2018
54
Report of Independent Registered Public Accounting Firm
To the stockholders and board of directors
Prothena Corporation plc:
Opinion on Internal Control Over Financial Reporting
We have audited Prothena Corporation plc and subsidiaries internal control over financial reporting as of
December 31, 2017
, based on criteria established in
Internal Control - Integrated Framework (2013)
issued by the Committee of Sponsoring Organizations of the Treadway Commission. In our opinion, the Company maintained, in all material respects, effective internal control over financial reporting as of
December 31, 2017
, based on criteria established in
Internal Control - Integrated Framework (2013)
issued by the Committee of Sponsoring Organizations of the Treadway Commission.
We also have audited, in accordance with the standards of the Public Company Accounting Oversight Board (United States) (“PCAOB”), the consolidated balance sheets of the Company as of December 31, 2017 and 2016, the related consolidated statements of operations, stockholders’ equity, and cash flows for each of the years in the three-year period ended
December 31, 2017
, and the related notes (collectively, the “consolidated financial statements”), and our report dated
February 23, 2018
expressed an unqualified opinion on those consolidated financial statements.
Basis for Opinion
The Company’s management is responsible for maintaining effective internal control over financial reporting and for its assessment of the effectiveness of internal control over financial reporting, included in the accompanying “Item 9A, Controls and Procedures”. Our responsibility is to express an opinion on the Company’s internal control over financial reporting based on our audit. We are a public accounting firm registered with the PCAOB and are required to be independent with respect to the Company in accordance with the U.S. federal securities laws and the applicable rules and regulations of the Securities and Exchange Commission and the PCAOB.
We conducted our audit in accordance with the standards of the PCAOB. Those standards require that we plan and perform the audit to obtain reasonable assurance about whether effective internal control over financial reporting was maintained in all material respects. Our audit of internal control over financial reporting included obtaining an understanding of internal control over financial reporting, assessing the risk that a material weakness exists, and testing and evaluating the design and operating effectiveness of internal control based on the assessed risk. Our audit also included performing such other procedures as we considered necessary in the circumstances. We believe that our audit provides a reasonable basis for our opinion.
Definition and Limitations of Internal Control Over Financial Reporting
A company’s internal control over financial reporting is a process designed to provide reasonable assurance regarding the reliability of financial reporting and the preparation of financial statements for external purposes in accordance with generally accepted accounting principles. A company’s internal control over financial reporting includes those policies and procedures that (1) pertain to the maintenance of records that, in reasonable detail, accurately and fairly reflect the transactions and dispositions of the assets of the company; (2) provide reasonable assurance that transactions are recorded as necessary to permit preparation of financial statements in accordance with generally accepted accounting principles, and that receipts and expenditures of the company are being made only in accordance with authorizations of management and directors of the company; and (3) provide reasonable assurance regarding prevention or timely detection of unauthorized acquisition, use, or disposition of the company’s assets that could have a material effect on the financial statements.
Because of its inherent limitations, internal control over financial reporting may not prevent or detect misstatements. Also, projections of any evaluation of effectiveness to future periods are subject to the risk that controls may become inadequate because of changes in conditions, or that the degree of compliance with the policies or procedures may deteriorate.
/s/ KPMG LLP
San Francisco, California
February 23, 2018
55
Prothena Corporation plc and Subsidiaries
(in thousands, except share and per share data)
|
December 31,
|
|||||||
|
2017
|
2016
|
||||||
|
Assets
|
|||||||
|
Current assets:
|
|||||||
|
Cash and cash equivalents
|
$
|
417,620
|
|
$
|
386,923
|
|
|
|
Receivable from Roche
|
240
|
|
178
|
|
|||
|
Prepaid expenses and other current assets
|
8,467
|
|
4,261
|
|
|||
|
Total current assets
|
426,327
|
|
391,362
|
|
|||
|
Non-current assets:
|
|||||||
|
Property and equipment, net
|
54,990
|
|
56,452
|
|
|||
|
Deferred tax assets
|
8,113
|
|
5,913
|
|
|||
|
Restricted cash
|
4,056
|
|
4,056
|
|
|||
|
Other non-current assets
|
2,843
|
|
2,193
|
|
|||
|
Total non-current assets
|
70,002
|
|
68,614
|
|
|||
|
Total assets
|
$
|
496,329
|
|
$
|
459,976
|
|
|
|
Liabilities and Shareholders’ Equity
|
|||||||
|
Current liabilities:
|
|||||||
|
Accounts payable
|
$
|
13,633
|
|
$
|
13,069
|
|
|
|
Accrued research and development
|
13,509
|
|
19,073
|
|
|||
|
Income taxes payable, current
|
311
|
|
378
|
|
|||
|
Build-to-suit lease obligation, current
|
733
|
|
—
|
|
|||
|
Other current liabilities
|
9,185
|
|
8,555
|
|
|||
|
Total current liabilities
|
37,371
|
|
41,075
|
|
|||
|
Non-current liabilities:
|
|||||||
|
Income taxes payable, non-current
|
—
|
|
98
|
|
|||
|
Deferred rent
|
254
|
|
2,080
|
|
|||
|
Build-to-suit lease obligation, non-current
|
51,515
|
|
51,320
|
|
|||
|
Total non-current liabilities
|
51,769
|
|
53,498
|
|
|||
|
Total liabilities
|
89,140
|
|
94,573
|
|
|||
|
Commitments and contingencies (Note 7)
|
|
|
|||||
|
Shareholders’ equity:
|
|||||||
|
Euro deferred shares, €22 nominal value:
|
—
|
|
—
|
|
|||
|
Authorized shares — 10,000 at December 31, 2017 and 2016
|
|||||||
|
Issued and outstanding shares — none at December 31, 2017 and 2016
|
|||||||
|
Ordinary shares, $0.01 par value:
|
385
|
|
348
|
|
|||
|
Authorized shares — 100,000,000 at December 31, 2017 and 2016
|
|||||||
|
Issued and outstanding shares — 38,482,764 and 34,752,116 at December 31, 2017 and 2016, respectively
|
|||||||
|
Additional paid-in capital
|
849,154
|
|
654,266
|
|
|||
|
Accumulated deficit
|
(442,350
|
)
|
(289,211
|
)
|
|||
|
Total shareholders’ equity
|
407,189
|
|
365,403
|
|
|||
|
Total liabilities and shareholders’ equity
|
$
|
496,329
|
|
$
|
459,976
|
|
|
See accompanying Notes to Consolidated Financial Statements.
56
Prothena Corporation plc and Subsidiaries
(in thousands, except per share data)
|
Year Ended December 31,
|
||||||||||||
|
2017
|
2016
|
2015
|
||||||||||
|
Collaboration revenue
|
$
|
27,519
|
|
$
|
1,055
|
|
$
|
1,607
|
|
|||
|
Total revenue
|
27,519
|
|
1,055
|
|
1,607
|
|
||||||
|
Operating expenses:
|
||||||||||||
|
Research and development
|
134,547
|
|
119,534
|
|
58,439
|
|
||||||
|
General and administrative
|
48,226
|
|
41,056
|
|
23,105
|
|
||||||
|
Total operating expenses
|
182,773
|
|
160,590
|
|
81,544
|
|
||||||
|
Loss from operations
|
(155,254
|
)
|
(159,535
|
)
|
(79,937
|
)
|
||||||
|
Other income (expense):
|
||||||||||||
|
Interest income (expense), net
|
(142
|
)
|
556
|
|
196
|
|
||||||
|
Other income (expense), net
|
(2,207
|
)
|
15
|
|
(170
|
)
|
||||||
|
Total other income (expense), net
|
(2,349
|
)
|
571
|
|
26
|
|
||||||
|
Loss before income taxes
|
(157,603
|
)
|
(158,964
|
)
|
(79,911
|
)
|
||||||
|
Provision for (benefit from) income taxes
|
(4,366
|
)
|
1,144
|
|
701
|
|
||||||
|
Net loss
|
$
|
(153,237
|
)
|
$
|
(160,108
|
)
|
$
|
(80,612
|
)
|
|||
|
Basic and diluted net loss per share
|
$
|
(4.07
|
)
|
$
|
(4.66
|
)
|
$
|
(2.66
|
)
|
|||
|
Shares used to compute basic and diluted net loss per share
|
37,654
|
|
34,351
|
|
30,326
|
|
||||||
See accompanying Notes to Consolidated Financial Statements.
57
Prothena Corporation plc and Subsidiaries
(in thousands)
|
Year Ended December 31,
|
|||||||||||
|
2017
|
2016
|
2015
|
|||||||||
|
Operating activities
|
|||||||||||
|
Net loss
|
$
|
(153,237
|
)
|
$
|
(160,108
|
)
|
$
|
(80,612
|
)
|
||
|
Adjustments to reconcile net loss to cash used in operating activities:
|
|||||||||||
|
Depreciation and amortization
|
3,067
|
|
2,427
|
|
806
|
|
|||||
|
Share-based compensation
|
26,764
|
|
24,929
|
|
10,414
|
|
|||||
|
Deferred income taxes
|
(2,200
|
)
|
(3,248
|
)
|
(963
|
)
|
|||||
|
Interest expense under build-to-suit lease obligation
|
3,688
|
|
863
|
|
—
|
|
|||||
|
Gain from early lease retirement
|
(2,096
|
)
|
—
|
|
—
|
|
|||||
|
Gain from disposal of fixed assets
|
(5
|
)
|
—
|
|
20
|
|
|||||
|
Loss on sublease
|
—
|
|
—
|
|
261
|
|
|||||
|
Changes in operating assets and liabilities:
|
|||||||||||
|
Receivable from Roche
|
(62
|
)
|
331
|
|
1,220
|
|
|||||
|
Receivable from related party
|
—
|
|
—
|
|
30
|
|
|||||
|
Prepaid and other assets
|
(7,249
|
)
|
3,363
|
|
(937
|
)
|
|||||
|
Accounts payable, accruals and other liabilities
|
147
|
|
15,193
|
|
11,161
|
|
|||||
|
Net cash used in operating activities
|
(131,183
|
)
|
(116,250
|
)
|
(58,600
|
)
|
|||||
|
Investing activities
|
|||||||||||
|
Purchases of property and equipment
|
(3,626
|
)
|
(16,644
|
)
|
(1,382
|
)
|
|||||
|
Proceeds from disposal of fixed assets
|
105
|
|
—
|
|
—
|
|
|||||
|
Net cash used in investing activities
|
(3,521
|
)
|
(16,644
|
)
|
(1,382
|
)
|
|||||
|
Financing activities
|
|||||||||||
|
Proceeds from issuance of ordinary shares in public offering, net
|
150,323
|
|
128,777
|
|
131,341
|
|
|||||
|
Proceeds from issuance of ordinary shares upon exercise of stock options
|
17,838
|
|
10,516
|
|
5,648
|
|
|||||
|
Reduction of build-to-suit lease obligation
|
(2,760
|
)
|
(169
|
)
|
—
|
|
|||||
|
Proceeds from tenant improvement allowance under build-to-suit transaction
|
—
|
|
14,163
|
|
—
|
|
|||||
|
Net cash provided by financing activities
|
165,401
|
|
153,287
|
|
136,989
|
|
|||||
|
Net increase in cash, cash equivalents and restricted cash
|
30,697
|
|
20,393
|
|
77,007
|
|
|||||
|
Cash, cash equivalents and restricted cash, beginning of the year
|
390,979
|
|
370,586
|
|
293,579
|
|
|||||
|
Cash, cash equivalents and restricted cash, end of the period
|
$
|
421,676
|
|
$
|
390,979
|
|
$
|
370,586
|
|
||
|
Supplemental disclosures of cash flow information
|
|||||||||||
|
Cash paid for income taxes, net of refunds
|
$
|
294
|
|
$
|
575
|
|
$
|
442
|
|
||
|
Supplemental disclosures of non-cash investing and financing activities
|
|||||||||||
|
Acquisition of property and equipment included in accounts payable and accrued liabilities
|
$
|
175
|
|
$
|
575
|
|
$
|
185
|
|
||
|
Stock option shortfall
|
$
|
—
|
|
$
|
(258
|
)
|
$
|
—
|
|
||
|
Offering costs included in accounts payable and accrued liabilities
|
$
|
—
|
|
$
|
—
|
|
$
|
18
|
|
||
|
Amounts capitalized under build-to-suit lease transaction
|
$
|
—
|
|
$
|
36,805
|
|
$
|
—
|
|
||
|
Interest capitalized during construction period for build-to-suit lease transaction
|
$
|
—
|
|
$
|
1,179
|
|
$
|
—
|
|
||
See accompanying Notes to Consolidated Financial Statements.
58
Prothena Corporation plc and Subsidiaries
Consolidated Statements of Shareholders' Equity
(in thousands, except share data)
|
Ordinary Shares
|
Additional
Paid-in Capital |
Accumulated
Deficit |
Total
Shareholders' Equity |
|||||||||||
|
Shares
|
Amount
|
|||||||||||||
|
Balances at December 31, 2014
|
27,388,005
|
|
274
|
|
338,106
|
|
(48,491
|
)
|
289,889
|
|
||||
|
Issuance of ordinary shares in public offering, net of issuance costs of $8.9 million
|
3,795,000
|
|
38
|
|
131,443
|
|
—
|
|
131,481
|
|
||||
|
Share-based compensation
|
—
|
|
—
|
|
10,414
|
|
—
|
|
10,414
|
|
||||
|
Excess tax benefit from share-based award exercises
|
—
|
|
—
|
|
3,855
|
|
—
|
|
3,855
|
|
||||
|
Issuance of ordinary shares upon exercise of stock options
|
561,097
|
|
5
|
|
5,637
|
|
—
|
|
5,642
|
|
||||
|
Net loss
|
—
|
|
—
|
|
—
|
|
(80,612
|
)
|
(80,612
|
)
|
||||
|
Balances at December 31, 2015
|
31,744,102
|
|
317
|
|
489,455
|
|
(129,103
|
)
|
360,669
|
|
||||
|
Issuance of ordinary shares in public offering, net of issuance costs of $8.5 million
|
2,587,500
|
|
26
|
|
128,610
|
|
—
|
|
128,636
|
|
||||
|
Share-based compensation
|
—
|
|
—
|
|
24,929
|
|
—
|
|
24,929
|
|
||||
|
Excess tax benefit from share-based award exercises
|
—
|
|
—
|
|
761
|
|
—
|
|
761
|
|
||||
|
Issuance of ordinary shares upon exercise of stock options
|
420,514
|
|
5
|
|
10,511
|
|
—
|
|
10,516
|
|
||||
|
Net loss
|
—
|
|
—
|
|
—
|
|
(160,108
|
)
|
(160,108
|
)
|
||||
|
Balances at December 31, 2016
|
34,752,116
|
|
348
|
|
654,266
|
|
(289,211
|
)
|
365,403
|
|
||||
|
Issuance of ordinary shares in public offering, net of issuance costs of $4.9 million
|
2,700,000
|
|
27
|
|
150,296
|
|
—
|
|
150,323
|
|
||||
|
Share-based compensation
|
—
|
|
—
|
|
26,764
|
|
—
|
|
26,764
|
|
||||
|
Issuance of ordinary shares upon exercise of stock options
|
1,030,648
|
|
10
|
|
17,828
|
|
—
|
|
17,838
|
|
||||
|
Cumulative adjustment to accumulated deficit upon adoption of ASU 2016-09
|
—
|
|
—
|
|
—
|
|
98
|
|
98
|
|
||||
|
Net loss
|
—
|
|
—
|
|
—
|
|
(153,237
|
)
|
(153,237
|
)
|
||||
|
Balances at December 31, 2017
|
38,482,764
|
|
385
|
|
849,154
|
|
(442,350
|
)
|
407,189
|
|
||||
See accompanying Notes to Consolidated Financial Statements.
59
Notes to the Consolidated Financial Statements
|
1.
|
Organization
|
Description of Business
Prothena Corporation plc and its subsidiaries (“Prothena” or the “Company”) is a global, late-stage clinical biotechnology company establishing fully-integrated research, development and commercial capabilities and focused on advancing new therapies in the neuroscience and orphan disease categories. Fueled by its deep scientific understanding built over decades of research in protein misfolding, Prothena seeks to fundamentally change the course of grave or currently untreatable diseases associated with this biology.
The Company's pipeline of antibody-based product candidates targets a number of potential indications including AL amyloidosis (NEOD001), Parkinson’s disease and other related synucleinopathies (PRX002/RG7935) and ATTR amyloidosis (PRX004). The Company continues to advance additional discovery programs where its deep scientific understanding of disease pathology can be leveraged. The Company has a number of discovery-stage programs targeting proteins implicated in diseases across the neuroscience and orphan categories, including tau and Aβ (Amyloid beta) for the potential treatment of Alzheimer’s disease and other neurodegenerative disorders and ALECT2 for the potential treatment of ALECT2 amyloidosis.
The Company was formed on September 26, 2012 under the laws of Ireland and re-registered as an Irish public limited company on October 25, 2012. The Company's ordinary shares began trading on The Nasdaq Global Market under the symbol “PRTA” on December 21, 2012 and currently trade on The Nasdaq Global Select Market.
Liquidity and Business Risks
As of
December 31, 2017
, the Company had an accumulated deficit of
$442.4 million
and cash and cash equivalents of
$417.6 million
.
Based on the Company's business plans, management believes that the Company's cash and cash equivalents at
December 31, 2017
are sufficient to meet its obligations for at least the next twelve months. To operate beyond such period, or if the Company elects to increase its spending on development programs significantly above current long-term plans or enters into potential licenses and or other acquisitions of complementary technologies, products or companies, the Company may need additional capital. The Company expects to continue to finance future cash needs that exceed its cash from operating activities primarily through its current cash and cash equivalents, its collaboration with Roche, and to the extent necessary, through proceeds from public or private equity or debt financings, loans and other collaborative agreements with corporate partners or other arrangements.
The Company is subject to a number of risks, including but not limited to: the uncertainty of the Company's research and development (“R&D”) efforts resulting in future successful commercial products; obtaining regulatory approval for its product candidates; its ability to successfully commercialize its product candidates, if approved; significant competition from larger organizations; reliance on the proprietary technology of others; dependence on key personnel; uncertain patent protection; dependence on corporate partners and collaborators; and possible restrictions on reimbursement from governmental agencies and healthcare organizations, as well as other changes in the healthcare industry.
|
2.
|
Summary of Significant Accounting Policies
|
Basis of Preparation and Presentation of Financial Information
These Consolidated Financial Statements have been prepared in accordance with the accounting principles generally accepted in the U.S. (“GAAP”) and with the instructions for Form 10-K and Regulations S-X statements. The Consolidated Financial Statements of Prothena Corporation plc are presented in U.S. dollars, which is the functional currency of the Company. These Consolidated Financial Statements include the accounts of the Company and its consolidated subsidiaries. All intercompany balances and transactions have been eliminated in consolidation. Certain amounts in the Consolidated Financial Statements have been reclassified to conform to the current year presentation.
Use of Estimates
The preparation of the Consolidated Financial Statements in conformity with GAAP requires management to make judgments, estimates and assumptions that affect the reported amounts of assets, liabilities, revenues and expenses, and related disclosures. On an ongoing basis, management evaluates its estimates, including critical accounting policies or estimates related to revenue recognition, share-based compensation and research and development expenses. The Company bases its estimates on historical experience and on various other market specific and other relevant assumptions that management believes to be reasonable under the circumstances, the results of which form the basis for making judgments about the carrying values of assets and liabilities that
60
are not readily apparent from other sources. Because of the uncertainties inherent in such estimates, actual results may differ materially from these estimates.
Significant Accounting Policies
Cash and Cash Equivalents
The Company considers all highly liquid investments held at financial institutions, such as commercial paper, money market funds, and other money market securities with original maturities of three months or less at date of purchase to be cash equivalents.
Restricted Cash
Cash accounts that are restricted to withdrawal or usage are presented as restricted cash. As of
December 31, 2017
, the Company had
$4.1 million
of restricted cash held by a bank in a certificate of deposit as collateral to a standby letter of credit under a build-to-suit lease. This amount is classified as a non-current asset in the Company's Consolidated Balance Sheet. See Note 6 to the Consolidated Financial Statements regarding “Build-to-Suit Lease” for more information.
Property and Equipment, net
Property and equipment, net are stated at cost less accumulated depreciation and amortization. Depreciation and amortization is computed using the straight-line method over the estimated useful lives of the related assets. Maintenance and repairs are charged to expense as incurred, and improvements and betterments are capitalized. When assets are retired or otherwise disposed of, the cost and accumulated depreciation are removed from the balance sheet and any resulting gain or loss is reflected in operations in the period realized. Depreciation and amortization periods for the Company’s property, plant and equipment are as follows:
|
Useful Life
|
||
|
Machinery and equipment
|
4-7 years
|
|
|
Leasehold improvements
|
Shorter of expected useful life or lease term
|
|
|
Purchased computer software
|
4 years
|
|
|
Build-to-suit property
|
30 years
|
|
Impairment of Long-lived Assets
Long-lived assets are reviewed for impairment whenever events or changes in circumstances indicate that the carrying amount of an asset may not be recoverable or the estimated useful life is no longer appropriate. If circumstances require that a long-lived asset be tested for possible impairment, the Company compares the undiscounted cash flows expected to be generated by the asset to the carrying amount of the asset. If the carrying amount of the long-lived asset is not recoverable on an undiscounted cash flow basis, an impairment is recognized to the extent that the carrying amount exceeds its fair value. The Company determines fair value using the income approach based on the present value of expected future cash flows. The Company’s cash flow assumptions consider historical and forecasted revenue and operating costs and other relevant factors. There were no impairment charges recorded during the
years ended December 31, 2017, 2016 and 2015
.
Leases
At the inception of a lease, the Company evaluates the lease agreement to determine whether the lease is an operating, capital or build-to-suit lease using the criteria in ASC 840, Leases.
Certain lease agreements also require the Company to make additional payments for taxes, insurance, and other operating expenses incurred during the lease period, which are expensed as incurred.
Operating Leases
For operating leases, the Company recognizes rent expense on a straight-line basis over the lease term and records the difference between cash rent payments and the recognition of rent expense as a deferred liability. Where lease agreements contain rent escalation clauses, rent abatements and/or concessions, such as rent holidays, the Company applies them on a straight-line basis over the lease term.
Tenant improvement allowances are recorded as a deferred rent liability and are amortized over the term of the lease as a reduction to rent expense.
Build-to-Suit Leases
In certain lease arrangements, the Company is involved in the construction of the building. To the extent the Company is involved with the structural improvements of the construction project or takes construction risk prior to the commencement of a
61
lease, ASC 840-40, Leases – Sale-Leaseback Transactions (Subsection 05-5), requires the Company to be considered the owner for accounting purposes of these types of projects during the construction period. Therefore, the Company records an asset in property and equipment, net on the Consolidated Balance Sheets, including capitalized interest costs, for the replacement cost of the pre-existing building plus the amount of estimated construction costs and tenant improvements incurred by the landlord and the Company as of the balance sheet date. The Company records a corresponding build-to-suit lease obligation on its Consolidated Balance Sheets representing the amounts paid by the lessor.
Once construction is completed, the Company considers the requirements for sale-leaseback accounting treatment, including evaluating whether all risks of ownership have been transferred back to the landlord, as evidenced by a lack of continuing involvement in the leased property. If the arrangement does not qualify for sale-leaseback accounting treatment, the building asset remains on the Company’s Consolidated Balance Sheets at its historical cost, and such asset is depreciated over its estimated useful life. The Company bifurcates its lease payments into a portion allocated to the building and a portion allocated to the parcel of land on which the building has been built. The portion of the lease payments allocated to the land is treated for accounting purposes as operating lease payments, and therefore is recorded as rent expense in the consolidated statements of operations. The portion of the lease payments allocated to the building is further bifurcated into a portion allocated to interest expense and a portion allocated to reduce the build-to-suit lease obligation. The interest rate used for the build-to-suit lease obligation represents the Company’s estimated incremental borrowing rate at inception of the lease, adjusted to reduce any built in loss. The initial recording of these assets and liabilities is classified as non-cash investing and financing items, respectively, for purposes of the consolidated statements of cash flows.
Revenue Recognition
Revenue is recognized when earned and non-refundable, when payment is reasonably assured, and when there is no future obligation with respect to the revenue, in accordance with the terms prescribed in the applicable contract.
Multiple Element Arrangements
The Company's revenues are generated primarily through license, development and commercialization agreements. These types of agreements generally contain multiple elements, or deliverables, which may include (i) licenses to the Company's technology, (ii) R&D activities to be performed on behalf of the collaborative partner, and (iii) in certain cases, services or obligations in connection with the manufacturing or supply of preclinical and clinical material. Payments to the Company under these arrangements typically include one or more of the following: non-refundable, upfront license fees; funding of research and/or development efforts; milestone payments; and royalties on future product sales.
Revenue under license, development and commercialization agreements is recognized based on the performance requirements of the contract. Determinations of whether persuasive evidence of an arrangement exists and whether delivery has occurred or services have been rendered are based on management’s judgments.
The Company recognizes revenue related to license, development and commercialization agreements in accordance with the provisions of Financial Accounting Standards Board, or FASB, Accounting Standards Codification, or ASC, Topic 605-25, Revenue Recognition - Multiple-Element Arrangements. The Company evaluates all deliverables within an arrangement to determine whether or not they provide value on a stand-alone basis. Based on this evaluation, the deliverables are separated into units of accounting. The arrangement consideration that is fixed or determinable at the inception of the arrangement is allocated to the separate units of accounting based on their relative selling prices.
To determine the selling price of a separate deliverable, the Company uses the hierarchy as prescribed in ASC Topic 605-25 based on vendor-specific objective evidence (VSOE), third-party evidence (TPE) or best estimate of selling price (BESP). VSOE is based on the price charged when the element is sold separately and is the price actually charged for that deliverable. TPE is determined based on third party evidence for a similar deliverable when sold separately and BESP is the estimated selling price at which the Company would transact a sale if the elements of collaboration and license arrangements were sold on a stand-alone basis to the buyer.
Payments or full reimbursements resulting from the Company's R&D efforts for those arrangements where such efforts are considered as deliverables are recognized as the services are performed and are presented on a gross basis so long as there is persuasive evidence of an arrangement, the fee is fixed or determinable, and collection of the related receivable is reasonably assured. However, such funding is recognized as a reduction of R&D expense when the Company engages in a R&D project jointly with another entity, with both entities participating in project activities and sharing costs and potential benefits of the project.
Milestone Revenue
The Company accounts for milestones under ASU No. 2010-17, Milestone Method of Revenue Recognition. Under the milestone method, contingent consideration received from the achievement of a substantive milestone is recognized in its entirety
62
in the period in which the milestone is achieved. A milestone is defined as an event (i) that can only be achieved based in whole or in part on either the entity’s performance or on the occurrence of a specific outcome resulting from the entity’s performance, (ii) for which there is substantive uncertainty at the date the arrangement is entered into that the event will be achieved, and (iii) that would result in additional payments being due to the entity. At the inception of an agreement that includes milestone payments, the Company evaluates whether each milestone is substantive and at risk to both parties on the basis of the contingent nature of the milestone. This evaluation includes an assessment of whether (a) the consideration is commensurate with either (1) the entity’s performance to achieve the milestone, or (2) the enhancement of the value of the delivered item(s) as a result of a specific outcome resulting from the entity’s performance to achieve the milestone, (b) the consideration relates solely to past performance, and (c) the consideration is reasonable relative to all of the deliverables and payment terms within the arrangement. The Company evaluates factors such as the scientific, regulatory, commercial and other risks that must be overcome to achieve a particular milestone, the level of effort and investment required to achieve such milestone and whether the milestone consideration is reasonable relative to all deliverables and payment terms in the arrangement in making this assessment.
The Company generally classifies each of its milestones into one of three categories: (i) clinical milestones, (ii) regulatory and development milestones, and (iii) commercial milestones. Clinical milestones are typically achieved when a product candidate advances into or completes a defined phase of clinical research. For example, a milestone payment may be due to the Company upon the initiation of a clinical trial for a new indication. Regulatory and development milestones are typically achieved upon acceptance of the submission for marketing approval of a product candidate or upon approval to market the product candidate by the FDA or other regulatory authorities. For example, a milestone payment may be due to the Company upon filing of a BLA with the FDA. Commercial milestones are typically achieved when an approved pharmaceutical product reaches certain defined levels of net royalty sales by the licensee of a specified amount within a specified period.
Commercial milestone payments and milestone payments that are not deemed to be substantive will be accounted for as a contingent revenue payment with revenue recognized when all contingencies are lifted, which is expected to be upon achievement of the milestone, assuming all revenue recognition criteria are met.
Profit Share Revenue
For agreements, with profit sharing arrangements, the Company will record its share of the pre-tax commercial profit as collaboration revenue when the profit sharing can be reasonably estimated and collectability is reasonably assured.
Royalty Revenue
The Company will recognize revenue from royalties based on licensees' sales of the Company's products or products using the Company's technologies. Royalties are recognized as earned in accordance with the contract terms when royalties from licensees can be reasonably estimated and collectability is reasonably assured. There were no royalties earned during the three years ended 2017, 2016, and 2015, respectively.
Research and Development
Research and development costs are expensed as incurred and include, but are not limited to, salary and benefits, share-based compensation, clinical trial activities, drug development and manufacturing prior to FDA and other regulatory approval and third-party service fees, including clinical research organizations and investigative sites. Costs for certain development activities, such as clinical trials, are recognized based on an evaluation of the progress to completion of specific tasks using data such as patient enrollment, clinical site activations, or information provided to the Company by its vendors on their actual costs incurred. The objective of the Company's accrual policy is to match the recording of the expenses in its Consolidated Financial Statements to the actual services received and efforts expended. As such, expense accruals related to clinical trials are recognized based on its estimate of the degree of completion of the events specified in the specific clinical study or trial contract. Payments for these activities are based on the terms of the individual arrangements, which may differ from the pattern of costs incurred, and are reflected in the Consolidated Financial Statements as prepaid or accrued research and development. Amounts due may be fixed fee, fee for service, and may include upfront payments, monthly payments, and payments upon the completion of milestones or receipt of deliverables.
Acquired In-Process Research and Development Expense
The Company has acquired and may continue to acquire the rights to develop and commercialize new drug candidates from third parties. The upfront payments to acquire license, product or rights, as well as any future milestone payments, are immediately expensed as research and development provided that the drug has not achieved regulatory approval for marketing and, absent obtaining such approval, has no alternative future use.
63
Share-based Compensation
To determine the fair value of share-based payment awards, the Company uses the Black-Scholes option-pricing model. The determination of fair value using the Black-Scholes option-pricing model is affected by the Company’s share price as well as assumptions regarding a number of complex and subjective variables. Share-based compensation expense is recognized on a straight-line basis over the requisite service period for each award. Further, share-based compensation expense recognized in the Consolidated Statements of Operations is based on awards expected to vest and therefore the amount of expense has been reduced for estimated forfeitures. If actual forfeitures differ from estimates at the time of grant they will be revised in subsequent periods. The Company bases its assumptions on historical data when available or when not available, on a peer group of companies. If factors change and different assumptions are employed in determining the fair value of share-based awards, the share-based compensation expense recorded in future periods may differ significantly from what was recorded in the current period (see Note 10 for further information).
The Company records any excess tax benefits or deficiencies from its equity awards in its Consolidated Statements of Operations in the reporting periods in which stock options are exercised.
Income Taxes
The Company files its own U.S. and foreign income tax returns and income taxes are presented in the Consolidated Financial Statements using the asset and liability method prescribed by the accounting guidance for income taxes. Deferred tax assets (“DTAs”) and liabilities are determined based on the difference between the financial statement and tax basis of assets and liabilities using the enacted tax rates projected to be in effect for the year in which the differences are expected to reverse. Net deferred tax assets are recorded to the extent the Company believes that these assets will more likely than not be realized. In making such determination, all available positive and negative evidence is considered, including scheduled reversals of deferred tax liabilities, projected future taxable income, tax planning strategies and recent financial operations.
Estimates are required in determining the Company’s provision for income taxes. Some of these estimates are based on management’s interpretations of jurisdiction-specific tax laws or regulations. Various internal and external factors may have favorable or unfavorable effects on the future effective income tax rate of the business. These factors include, but are not limited to, changes in tax laws, regulations and/or rates, changing interpretations of existing tax laws or regulations, changes in estimates of prior years’ items, past and future levels of R&D spending and changes in overall levels of income before taxes.
The tax benefit from an uncertain tax position is recognized only if it is more likely than not the tax position will be sustained on examination by the taxing authorities, based on the technical merits of the position. The tax benefits recognized in the financial statements from such positions are then measured based on the largest benefit that has a greater than 50% likelihood of being realized upon settlement. Changes in recognition or measurement are reflected in the period in which the change in judgment occurs. Interest and penalties related to unrecognized tax benefits are accounted for in income tax expense.
Net Income (loss) per Ordinary Share
Basic net income (loss) per ordinary share is computed by dividing net income (loss) attributable to ordinary shareholders by the weighted average number of ordinary shares outstanding during the period. Diluted net income per ordinary share is computed by giving effect to all dilutive potential ordinary shares including options. However, potentially issuable ordinary shares are not used in computing diluted net loss per ordinary share as their effect would be anti-dilutive due to the loss recorded. In this case, diluted net loss per share is equal to basic net loss per share.
Comprehensive Loss
Comprehensive income (loss) is comprised of net income (loss) and other comprehensive income (loss). The Company has no components of other comprehensive income (loss). Therefore net income (loss) equals comprehensive income (loss) for all periods presented and, accordingly, the Consolidated Statements of Comprehensive Income (Loss) is not presented in a separate statement.
Segment and Concentration of Risks
The Company operates in one segment. The Company’s chief operating decision maker (the “CODM”), its Chief Executive Officer, manages the Company’s operations on a consolidated basis for purposes of allocating resources. When evaluating the Company’s financial performance, the CODM reviews all financial information on a consolidated basis.
Financial instruments that potentially subject the Company to concentration of credit risk consist of cash and cash equivalents and accounts receivable. The Company places its cash equivalents with high credit quality financial institutions and by policy, limits the amount of credit exposure with any one financial institution. Deposits held with banks may exceed the amount of
64
insurance provided on such deposits. The Company has not experienced any losses on its deposits of cash and cash equivalents and its credit risk exposure is up to the extent recorded on the Company's Consolidated Balance Sheet.
Receivable from Roche as of
December 31, 2017
and
2016
are amounts due from Roche entities located in the U.S. and Switzerland under the License Agreement that became effective January 22, 2014. Revenue recorded in the Statements of Operations consists of reimbursement from Roche for research and development services and includes revenue from achievement of a clinical milestone in fiscal year 2017. Credit risk exposure is up to the extent recorded on the Company's Consolidated Balance Sheet.
As of
December 31, 2017
,
$54.4 million
of the Company's long-lived assets were held in the U.S. and
$0.6 million
were in Ireland. As of
December 31, 2016
,
$55.7 million
of the Company's long-lived assets were held in the U.S. and
$0.8 million
were in Ireland.
The Company does not own or operate facilities for the manufacture, packaging, labeling, storage, testing or distribution of nonclinical or clinical supplies of any of its drug candidates, including for commercial supplies if the Company obtains regulatory approval to market any of its drug candidates. The Company instead contracts with and relies on third-parties to manufacture, package, label, store, test and distribute all pre-clinical development and clinical supplies of our drug candidates, and it plans to continue to do so for the foreseeable future, including for commercial supplies if the Company obtains regulatory approval to market any of its drug candidates. The Company also relies on third-party consultants to assist in managing these third-parties and assist with its manufacturing strategy.
Recent Accounting Pronouncements
In May 2014, the Financial Accounting Standards Board (the “FASB”) issued Accounting Standards Update 2014-09 (ASU 2014-09), Revenue from Contracts with Customers, which is largely codified in Accounting Standards Codification 606 (ASC Topic 606). The FASB issued subsequent amendments to the initial guidance: ASU 2015-14 in August 2015;
ASU 2016-08 in March 2016; ASU 2016-10 in April 2016; ASU 2016-12 in May 2016; ASU 2016-20 in December 2016; and ASU 2017-10 in May 2017, collectively ASC Topic 606. ASC Topic 606 supersedes the revenue recognition requirements in Revenue Recognition (Topic 605) and supersedes nearly all existing revenue recognition guidance under GAAP. To date, we have derived our revenues from a license and collaboration agreement and a service agreement. The consideration we are eligible to receive under these agreements includes upfront payments, research and development funding, milestone payments and royalties. The core principle of ASC Topic 606 is to recognize revenues when promised goods or services are transferred to customers in an amount that reflects the consideration that is expected to be received for those goods or services. ASC Topic 606 defines a five-step process to achieve this core principle and, in doing so, it is possible more judgment and estimates may be required within the revenue recognition process than are required under existing GAAP, including identifying performance obligations in the contract, estimating the amount of variable consideration to include in the transaction price and allocating the transaction price to each separate performance obligation, among others. ASC Topic 606 is effective for annual reporting periods beginning after December 15, 2017, including interim periods within that reporting period, which for the Company is January 1, 2018. Early adoption is permitted after January 1, 2017. The standard allows for two transition methods - retrospectively to each prior reporting period presented or retrospectively with the cumulative effect of initially applying the standard recognized at the date of initial adoption. The Company expects to adopt the requirements of the new standard effective January 1, 2018 using the retrospective with the cumulative effect transition method. ASC Topic 606 differs from the current accounting standard in many respects, such as in the accounting for variable consideration, including milestone payments and the measurement of progress toward completion of performance obligations. The Company does not expect the adoption of this standard to have a material impact on its consolidated financial statements in the period of adoption. Under its current accounting policy, the Company recognizes milestone revenue using the milestone method specified in ASC 605-28, which generally results in the recognition of the milestone payment as revenue in the period that the milestone is achieved. However, under the new accounting standard, it is possible to start to recognize milestone revenue before the milestone is achieved, subject to management’s assessment of whether it is probable that a significant reversal in the amount of cumulative revenue recognized will not occur when the uncertainty associated with the variable consideration is subsequently resolved. As such, the timing of revenue recognition for our license and collaboration agreements may change under the new revenue standard.
In February 2016, the FASB issued Accounting Standards Update 2016-02 (ASU 2016-02), Leases (ASC Topic 842), which will require lessees to recognize assets and liabilities for leases with lease terms of more than 12 months. Consistent with current GAAP, the recognition, measurement, and presentation of expenses and cash flows arising from a lease by a lessee primarily will depend on its classification as a finance or operating lease. However, unlike current GAAP, which requires only capital leases to be recognized on the balance sheet, the new guidance will require both types of leases to be recognized on the balance sheet. ASC Topic 842 is effective for annual periods beginning after December 15, 2018, and interim periods within those years. Early adoption is permitted for all entities. The standard requires that entities use a modified retrospective approach for leases that exist or are entered into after the beginning of the earliest comparative period in the financial statements. Entities have the option to use certain relief. Full retrospective application is prohibited. Note 7, “Commitments and Contingencies” provides details on the Company's
65
current lease arrangements. The Company continues to evaluate the provisions of ASC Topic 842 to determine the impact the adoption of ASU 2016-02 will have on its consolidated financial statements; however, the Company anticipates recognition of additional assets and corresponding liabilities related to leases on its consolidated balance sheets. Additionally, the Company expects to derecognize its build-to-suit asset and liabilities upon adoption pending its final evaluation.
In March 2016, the FASB issued Accounting Standards Update 2016-09 (ASU 2016-09), Improvements to Employee Share-Based Payment Accounting, which modifies certain aspects of the accounting for share-based payment transactions, including income taxes, classification of awards and classification in the statement of cash flows. Through December 31, 2016, excess tax benefits or deficiencies from the Company's equity awards were recorded as additional paid-in capital in its Consolidated Balance Sheets. Upon adoption, the Company will record any excess tax benefits or deficiencies from its equity awards in its Condensed Consolidated Statements of Operations in the reporting periods in which stock options are exercised. This guidance also requires excess tax benefits and deficiencies to be presented as an operating activity on the statement of cash flows and allows an entity to make an accounting policy election to either estimate expected forfeitures or to account for them as they occur. The ASU is effective for reporting periods beginning after December 15, 2016, with early adoption permitted. The Company adopted this ASU on January 1, 2017.
Pursuant to the adoption of ASU 2016-09, tax attributes previously tracked off balance sheet have been recorded as deferred tax assets, offset by a valuation allowance. In addition, the Company has reversed its non-current tax liability of
$98,000
with the offsetting entry recorded to retained earnings pursuant to the adoption of this ASU. Further, year-to-date excess benefits of stock compensation have been recorded as a benefit to the tax provision. For the
year ended December 31, 2017
, the Company recorded excess tax benefits of
$5.3 million
, which were recorded as part of its income tax provision in the Consolidated Statements of Operations. The Company's income tax expense will continue to be impacted by fluctuations in stock price between the grant dates and the exercise dates of its option awards. The presentation requirements for cash flows related to excess tax benefits will be applied retrospectively; as such, prior years have been restated. Lastly, the Company elected to continue to estimate the number of forfeitures related to share-based payments, rather than account for forfeitures as they occur.
In August 2016, the FASB issued Accounting Standards Update 2016-15 (ASU 2016-15), Statement of Cash Flows - Classification of Certain Cash Receipts and Cash Payments, which clarifies existing guidance related to accounting for cash receipts and cash payments and classification of statement of cash flow. This guidance is effective for fiscal years, and interim periods within those years, beginning after December 15, 2017, but early adoption is permitted. The Company does not expect the adoption of ASU 2016-15 to have an impact on its consolidated financial statements.
In May 2017, the FASB issued Accounting Standards Update 2017-09 (ASU 2017-09), Compensation - Stock Compensation (Topic 718) - Scope of Modification Accounting, which changes to the terms or conditions of a share-based payment award require an entity to apply modification accounting in Topic 718. Entities would apply the modification accounting guidance if the value, vesting requirements or classification of a share-based payment award changes. This pronouncement is effective for annual reporting periods beginning after December 15, 2017, but early adoption is permitted. The Company does not expect the adoption of ASU 2017-09 to have an impact on its consolidated financial statements.
In December 2017, the U.S. Securities and Exchange Commission (the “SEC”) staff issued Staff Accounting Bulletin (SAB) 118, Income Tax Accounting Implications of the Tax Cuts and Jobs Act (TCJA), to provide guidance for companies that are not able to complete their accounting for the income tax effects of the Act in the period of enactment. In doing so, the SEC staff acknowledged the challenges companies may face in accounting for the effects of the Act by their financial reporting deadlines and said the guidance is intended to help companies provide investors with timely, decision-useful information. The TCJA is effective in the first quarter of 2018 and, among other things, lowers the Company’s U.S. federal income tax rate from
34%
to
21%
. Accordingly, the Company has recorded a provision tax benefit of
$0.4 million
related to the remeasurement of its U.S. deferred tax assets to reflect the lower statutory tax rate. As of December 31, 2017, the Company has not completed its accounting for the tax effects of the TCJA, and recorded a provisional net tax benefit based on the Company's best estimates. The provisional amounts incorporate assumptions made based upon the Company's current interpretation of the TCJA and are subject to revision as the Company receives and interprets any additional clarification and implementation guidance issued by the U.S. Treasury Department, Internal Revenue Service (the “IRS”), and other standard-setting bodies. Any adjustments to the provisional amounts recorded will be included as an adjustment to the provision for income taxes. Adjustments may materially impact the Company's provision for income taxes and effective tax rate in the period in which the adjustments are made. The Company anticipates its accounting for the tax effects of the TCJA will be completed in 2018.
|
3.
|
Fair Value Measurements
|
The Company measures certain financial assets and liabilities at fair value on a recurring basis, including cash equivalents. Fair value is an exit price, representing the amount that would be received to sell an asset or paid to transfer a liability in an orderly transaction between market participants. As such, fair value is a market-based measurement that should be determined based on assumptions that market participants would use in pricing an asset or a liability. A three-tier fair value hierarchy is established as a basis for considering such assumptions and for inputs used in the valuation methodologies in measuring fair value:
66
Level 1 — Observable inputs such as quoted prices (unadjusted) for identical assets or liabilities in active markets.
|
Level 2 —
|
Include other inputs that are based upon quoted prices for similar instruments in active markets, quoted prices for identical or similar instruments in markets that are not active, and model-based valuation techniques for which all significant inputs are observable in the market or can be derived from observable market data. Where applicable, these models project future cash flows and discount the future amounts to a present value using market-based observable inputs including interest rate curves, foreign exchange rates, and credit ratings.
|
|
Level 3 —
|
Unobservable inputs that are supported by little or no market activities, which would require the Company to develop its own assumptions.
|
The fair value hierarchy also requires an entity to maximize the use of observable inputs and minimize the use of unobservable inputs when measuring fair value. The carrying amounts of certain financial instruments, such as cash equivalents, accounts receivable, accounts payable and accrued liabilities, approximate fair value due to their relatively short maturities, and low market interest rates, if applicable.
Based on the fair value hierarchy, the Company classifies its cash equivalents within Level 1. This is because the Company values its cash equivalents using quoted market prices. The Company’s Level 1 securities consist of
$319.7 million
and
$307.3 million
in money market funds included in cash and cash equivalents at
December 31, 2017
and
2016
, respectively.
|
4.
|
Composition of Certain Balance Sheet Items
|
Property and Equipment, net
Property and equipment, net consisted of the following (in thousands):
|
December 31,
|
|||||||
|
2017
|
2016
|
||||||
|
Machinery and equipment
|
$
|
9,078
|
|
$
|
9,629
|
|
|
|
Leasehold improvements
|
579
|
|
2,769
|
|
|||
|
Purchased computer software
|
1,316
|
|
363
|
|
|||
|
Build-to-suit property
|
51,760
|
|
51,359
|
|
|||
|
62,733
|
|
64,120
|
|
||||
|
Less: accumulated depreciation and amortization
|
(7,743
|
)
|
(7,668
|
)
|
|||
|
Property and equipment, net
|
$
|
54,990
|
|
$
|
56,452
|
|
|
Depreciation expense was
$3.1 million
,
$2.4 million
and
$0.8 million
for the
years ended December 31, 2017, 2016 and 2015
, respectively. The depreciation expense for the year ended December 31, 2016 includes incremental depreciation of
$1.2 million
associated with the acceleration of the useful life of certain leasehold improvements and other assets that were at the Company's former South San Francisco facility. See Note 7, “Commitments and Contingencies.”
Other Current Liabilities
Other current liabilities consisted of the following (in thousands):
|
December 31, 2017
|
December 31, 2016
|
||||||
|
Payroll and related expenses
|
$
|
7,342
|
|
$
|
6,629
|
|
|
|
Professional services
|
438
|
|
435
|
|
|||
|
Deferred rent
|
49
|
|
363
|
|
|||
|
Other
|
1,356
|
|
1,128
|
|
|||
|
Other current liabilities
|
$
|
9,185
|
|
$
|
8,555
|
|
|
|
5.
|
Net Loss Per Ordinary Share
|
Basic net income (loss) per ordinary share is calculated by dividing net income (loss) by the weighted-average number of ordinary shares outstanding during the period. Shares used in diluted net income per ordinary share would include the dilutive effect of ordinary shares potentially issuable upon the exercise of stock options outstanding. However, potentially issuable ordinary
67
shares are not used in computing diluted net loss per ordinary share as their effect would be anti-dilutive due to the loss recorded during the
years ended
December 31, 2017
,
2016
and
2015
, and therefore diluted net loss per share is equal to basic net loss per share.
Net loss per ordinary share was determined as follows (in thousands, except per share amounts):
|
Year Ended December 31,
|
||||||||||||
|
2017
|
2016
|
2015
|
||||||||||
|
Numerator:
|
||||||||||||
|
Net loss
|
$
|
(153,237
|
)
|
$
|
(160,108
|
)
|
$
|
(80,612
|
)
|
|||
|
Denominator:
|
||||||||||||
|
Weighted-average ordinary shares outstanding
|
37,654
|
|
34,351
|
|
30,326
|
|
||||||
|
Net loss per share:
|
||||||||||||
|
Basic and diluted net loss per share
|
$
|
(4.07
|
)
|
$
|
(4.66
|
)
|
$
|
(2.66
|
)
|
|||
The equivalent ordinary shares not included in diluted net loss per share because their effect would be anti-dilutive are as follows (in thousands):
|
|
Year Ended December 31,
|
|||||||
|
|
2017
|
2016
|
2015
|
|||||
|
Stock options to purchase ordinary shares
|
4,407
|
|
4,064
|
|
3,142
|
|
||
6. Build-to-Suit Lease
In
March 2016
, the Company entered into a noncancelable operating sublease (the “Lease”) to lease
128,751
square feet of office and laboratory space in South San Francisco, California (the “Current SSF Facility”). Subsequently, in April 2016, the Company took possession of the Current SSF Facility. The Lease includes a free rent period and escalating rent payments and has a term that expires on
December 31, 2023
, unless terminated earlier. The Company's obligation to pay rent commenced on August 1, 2016. The Company is obligated to make lease payments totaling approximately
$39.2 million
over the lease term. The Lease further provides that the Company is obligated to pay to the sublandlord and master landlord certain costs, including taxes and operating expenses. Expected future lease payments under the build-to-suit lease as of
December 31, 2017
are included in Note 7, “Commitments and Contingencies.”
In connection with this Lease, the Company received a tenant improvement allowance of
$14.2 million
from the sublandlord and the master landlord, for the costs associated with the design, development and construction of tenant improvements for the Current SSF Facility. The Company is obligated to fund all costs incurred in excess of the tenant improvement allowance. The scope of the tenant improvements did not qualify as “normal tenant improvements” under the lease accounting guidance. Accordingly, for accounting purposes, the Company is the deemed owner of the building during the construction period and the Company capitalized
$36.5 million
within property and equipment, net, including
$1.2 million
for capitalized interest and recognized a corresponding build-to-suit obligation in other non-current liabilities in the Consolidated Balance Sheets as of
December 31, 2017
. The Company has also recognized structural and non-structural tenant improvements totaling
$15.3 million
as of
December 31, 2017
as an addition to the build-to-suit lease property for amounts incurred by the Company during the construction period, of which
$14.2 million
were reimbursed by the landlord during the year ended December 31, 2016 through the tenant improvement allowance. The Company increased its financing obligation for the additional building costs reimbursements received from the landlord during the construction period. In addition, for the
years ended December 31, 2017
and
2016
, the Company recorded rent expense associated with the ground lease of
$0.5 million
and
$0.4 million
, respectively, in its Consolidated Statements of Operations. Total interest, which represents the cost of financing obligation under the Lease agreement, was
$3.7 million
and
$2.0 million
for the
years ended December 31, 2017
and
2016
, respectively, of which
$3.7 million
and
$0.9 million
, respectively, was recognized within the Consolidated Statement of Operations.
During the fourth quarter of 2016, construction on the build-to-suit lease property was substantially completed and the build-to-suit lease property was placed in service. As such, the Company evaluated the Lease to determine whether it had met the requirements for sale-leaseback accounting, including evaluating whether all risks of ownership have been transferred back to the landlord, as evidenced by a lack of continuing involvement in the build-to-suit lease property. The Company determined that the construction project did not qualify for sale-leaseback accounting and will instead be accounted for as a financing lease, given the Company’s expected continuing involvement after the conclusion of the construction period. The build-to-suit lease property
68
remains on the Company’s Consolidated Balance Sheets as of
December 31, 2017
at its historical cost of
$51.8 million
and is being depreciated over its estimated useful life. As of
December 31, 2017
, the total amount of the build-to-suit lease obligation was
$52.2 million
, of which
$0.7 million
and
$51.5 million
were classified as current and non-current liability, respectively, on the Company's Consolidated Balance Sheets. The Company expects to derecognize the build-to-suit lease property and financing lease obligation at the end of the lease term.
The Company obtained a standby letter of credit in April 2016 in the initial amount of
$4.1 million
, which may be drawn down by the sublandlord in the event the Company fails to fully and faithfully perform all of its obligations under the Lease and to compensate the sublandlord for all losses and damages the sublandlord may suffer as a result of the occurrence of any default on the part of Company not cured within the applicable cure period. This standby letter of credit is collateralized by a certificate of deposit of the same amount which is classified as restricted cash. As of
December 31, 2017
,
none
of the standby letter of credit amount has been used.
|
7.
|
Commitments and Contingencies
|
Lease Commitments
The Company recognizes rent expense for its operating leases on a straight-line basis over the noncancelable lease term and records the difference between cash rent payments and the recognition of rent expense as a deferred rent liability. Where leases contain escalation clauses, rent abatements and/or concessions, such as rent holidays and landlord or tenant incentives or allowances, the Company applies them in the determination of straight-line rent expense over the lease term. The Company records the tenant improvement allowance for operating leases as deferred rent and associated expenditures as leasehold improvements that are being amortized over the shorter of their estimated useful life or the term of the lease. Rent expense was
$0.9 million
,
$2.2 million
and
$1.9 million
for the
years ended December 31, 2017
,
2016
and
2015
, respectively.
Dublin
In
August 2015
, the Company entered into an agreement to lease
6,258
square feet of office space in Dún Laoghaire, Ireland. This lease has a term of
10 years
from commencement and provides for an option to terminate the lease at the end of the fifth year of the term. It is also subject to a rent review every
five
years. As a result of this noncancelable operating lease, the Company is obligated to make lease payments totaling approximately
€2.0 million
, or
$2.4 million
as converted using an exchange rate as of
December 31, 2017
, over the term of the lease, assuming current lease payments. Of this obligation, approximately
$1.9 million
remains outstanding as of
December 31, 2017
.
Switzerland
In 2017, the Company entered into noncancelable operating subleases to lease office space in Zug, Switzerland. The lease terms expire in March 2018 and August 2018. As of
December 31, 2017
, the Company is obligated to make lease payments of approximately
CHF 80,000
, or
$82,000
, as converted using an exchange rate as of
December 31, 2017
.
Former SSF Facility
The Company has previously leased
50,400
square feet of office and research and development space located South San Francisco, California (the “Former SSF Facility”), which had an annual rent payment of approximately
$2.1 million
. In addition, the Company had subleased a portion of its Former SSF Facility with a third party.
In January 2017, in accordance with an Assignment Agreement, the Company assigned to Merck Sharp & Dohme Corp. (“Merck”) the Company's lease on the Former SSF Facility. As a result of the assignment, the Company recognized a gain of approximately
$2.4 million
on early lease retirement resulting from the recognition of the remaining deferred rent liability. The Company’s operating lease commitments was reduced by approximately
$8.4 million
over the original lease term and the Company did not receive the future minimum payments from its Sublease of
$0.3 million
as a result of the Assignment.
Under the Assignment Agreement, Merck paid the Company the amount of
$500,000
as consideration for the assignment of the Company’s interest as tenant in the lease and the amount of
$100,000
as consideration for the Company’s transfer to Merck of certain furniture, fixtures and equipment located at the Former SSF Facility. The Company vacated the Former SSF Facility in December 2016 when it moved to the Current SSF Facility.
Future minimum payments under the above-described noncancelable operating leases as of
December 31, 2017
are as follows (in thousands):
69
|
Year Ended December 31,
|
Operating Lease
|
|||
|
2018
|
$
|
330
|
|
|
|
2019
|
248
|
|
||
|
2020
|
248
|
|
||
|
2021
|
248
|
|
||
|
2022
|
248
|
|
||
|
Thereafter
|
661
|
|
||
|
Total
|
$
|
1,983
|
|
|
Current SSF Facility
In
March 2016
, the Company entered into a noncancelable operating sublease of the Current SSF Facility which expires in
December 31, 2023
. The Company is considered the “accounting owner” of the Current SSF Facility as a build-to-suit property and has recorded a build-to-suit lease obligation on its consolidated balance sheet. Additional information regarding the build-to-suit lease is included in Note 6, “Build-To-Suit Lease.” Future minimum payments under build-to-suit lease obligation as of
December 31, 2017
are as follows (in thousands):
|
Year Ended December 31,
|
Expected Cash Payments Under Build-To-Suit Lease Obligation
|
|||
|
2018
|
$
|
4,915
|
|
|
|
2019
|
5,803
|
|
||
|
2020
|
5,979
|
|
||
|
2021
|
6,165
|
|
||
|
2022
|
6,350
|
|
||
|
Thereafter
|
6,535
|
|
||
|
Total
|
$
|
35,747
|
|
|
Indemnity Obligations
The Company has entered into indemnification agreements with its current and former directors and officers and certain key employees. These agreements contain provisions that may require the Company, among other things, to indemnify such persons against certain liabilities that may arise because of their status or service and advance their expenses incurred as a result of any indemnifiable proceedings brought against them. The obligations of the Company pursuant to the indemnification agreements continue during such time as the indemnified person serves the Company and continues thereafter until such time as a claim can be brought. The maximum potential amount of future payments the Company could be required to make under these indemnification agreements is unlimited; however, the Company has a director and officer liability insurance policy that limits its exposure and enables the Company to recover a portion of any future amounts paid. As a result of its insurance policy coverage, the Company believes the estimated fair value of these indemnification agreements is minimal. Accordingly, the Company had no liabilities recorded for these agreements as of
December 31, 2017
and
2016
.
Other Commitments
In April 2017, the Company contracted with Boehringer Ingelheim Biopharmaceuticals GmbH to develop the capability to manufacture and supply drug substance of NEOD0001, and to so supply NEOD001 to use for worldwide commercial sale purposes if the Company applies for and obtains regulatory approval to market NEOD001. No drug substance has been manufactured under this contract. However, the commitments table below includes the Company’s purchase obligations under this contract.
In the normal course of business, the Company enters into various firm purchase commitments primarily related to research and development activities. As of
December 31, 2017
, the Company had non-cancelable purchase commitments to suppliers for
$40.9 million
of which
$8.6 million
is included in accrued current liabilities, and contractual obligations under license agreements of
$1.6 million
of which
$0.2 million
is included in accrued current liabilities. The following is a summary of the Company's non-cancelable purchase commitments and contractual obligations as of
December 31, 2017
(in thousands):
70
|
Total
|
2018
|
2019
|
2020
|
2021
|
2022
|
Thereafter
|
||||||||||||||||||||||
|
Purchase Obligations
|
$
|
40,876
|
|
$
|
24,585
|
|
$
|
16,291
|
|
$
|
—
|
|
$
|
—
|
|
$
|
—
|
|
$
|
—
|
|
|||||||
|
Contractual obligations under license agreements
(1)
|
1,560
|
|
370
|
|
130
|
|
100
|
|
100
|
|
85
|
|
775
|
|
||||||||||||||
|
Total
|
$
|
42,436
|
|
$
|
24,955
|
|
$
|
16,421
|
|
$
|
100
|
|
$
|
100
|
|
$
|
85
|
|
$
|
775
|
|
|||||||
(1)
Excludes future obligations pursuant to the cost-sharing arrangement under the Company's License Agreement with Roche. Amounts of such obligations, if any, cannot be determined at this time.
|
8.
|
Roche License Agreement
|
Overview
In
December 2013
, the Company entered into the License Agreement with Roche to develop and commercialize certain antibodies that target α
-
synuclein, including PRX002/RG7935, which are referred to collectively as “Licensed Products.” Upon the effectiveness of the License Agreement in January 2014, the Company granted to Roche an exclusive, worldwide license to develop, make, have made, use, sell, offer to sell, import and export the Licensed Products. The Company retained certain rights to conduct development of the Licensed Products and an option to co-promote PRX002/RG7935 in the U.S. During the term of the License Agreement, the Company and Roche will work exclusively with each other to research and develop antibody products targeting α
-
synuclein potentially including incorporation of Roche’s proprietary Brain Shuttle™ technology to potentially increase delivery of therapeutic antibodies to the brain. The License Agreement provides that Roche would make an upfront payment to the Company of
$30.0 million
, which was received in February 2014, the clinical milestone payment of
$15.0 million
triggered by the initiation of the Phase 1 study for PRX002/RG7935 in the clinic, which was received in May 2014, and the clinical milestone payment of
$30.0 million
triggered by dosing of the first patient in the Phase 2 study for PRX002/RG7935, which was received in August 2017.
For PRX002/RG7935, Roche is also obligated to pay:
• up to
$380.0 million
upon the achievement of development, regulatory and various first commercial sales milestones;
• up to an additional
$175.0 million
in ex-U.S. commercial sales milestones; and
• tiered, high single-digit to high double-digit royalties in the teens on ex-U.S. annual net sales, subject to certain adjustments.
Roche bears
100%
of the cost of conducting the research activities under the License Agreement. In the U.S., the parties share all development and commercialization costs, as well as profits, all of which will be allocated
70%
to Roche and
30%
to the Company, for PRX002/RG7935 in the Parkinson’s disease indication, as well as any other Licensed Products and/or indications for which the Company opts in to participate in co-development and co-funding. After the completion of specific clinical trial activities, the Company may opt out of the co-development and cost and profit sharing on any co-developed Licensed Products and instead receive U.S. commercial sales milestones totaling up to
$155.0 million
and tiered, single-digit to high double-digit royalties in the teens based on U.S. annual net sales, subject to certain adjustments, with respect to the applicable Licensed Product.
The Company filed an Investigational New Drug Application (“IND”) with the FDA for PRX002/RG7935 and subsequently initiated a Phase 1 study in 2014. Following the Phase 1 study, Roche will be primarily responsible for developing, obtaining and maintaining regulatory approval for, and commercializing Licensed Products. Roche will also become responsible for the clinical and commercial manufacture and supply of Licensed Products within a defined time period following the effective date of the License Agreement.
In addition, the Company has an option under the License Agreement to co-promote PRX002/RG7935 in the U.S. in the Parkinson’s disease indication. If the Company exercises such option, it may also elect to co-promote additional Licensed Products in the U.S. approved for Parkinson’s disease. Outside the U.S., Roche will have responsibility for developing and commercializing the Licensed Products. Roche bears all costs that are specifically related to obtaining or maintaining regulatory approval outside the U.S. and will pay the Company a variable royalty based on annual net sales of the Licensed Products outside the U.S.
While Roche will record product revenue from sales of the Licensed Products, the Company and Roche will share in the net profits and losses of sales of the PRX002/RG7935 for the Parkinson's disease indication in the U.S. on a
70%
/
30%
basis with the Company receiving
30%
of the profit and losses provided that the Company has not exercised its opt-out right.
71
The License Agreement continues on a country-by-country basis until the expiration of all payment obligations under the License Agreement. The License Agreement may also be terminated (i) by Roche at will after the first anniversary of the effective date of the License Agreement, either in its entirety or on a Licensed Product-by-Licensed Product basis, upon 90 days’ prior written notice to the Company prior to first commercial sale and 180 days’ prior written notice to Prothena after first commercial sale, (ii) by either party, either in its entirety or on a Licensed Product-by-Licensed Product or region-by-region basis, upon written notice in connection with a material breach uncured 90 days after initial written notice, and (iii) by either party, in its entirety, upon insolvency of the other party. The License Agreement may be terminated by either party on a patent-by-patent and country-by-country basis if the other party challenges a given patent in a given country. The Company’s rights to co-develop Licensed Products under the License Agreement will terminate if the Company commences certain studies for certain types of competitive products. The Company’s rights to co-promote Licensed Products under the License Agreement will terminate if the Company commences a Phase 3 study for such competitive products.
The License Agreement cannot be assigned by either party without the prior written consent of the other party, except to an affiliate of such party or in the event of a merger or acquisition of such party, subject to certain conditions. The License Agreement also includes customary provisions regarding, among other things, confidentiality, intellectual property ownership, patent prosecution, enforcement and defense, representations and warranties, indemnification, insurance, and arbitration and dispute resolution.
Collaboration Accounting
The License Agreement was evaluated under ASC 808, Collaborative Agreements. At the outset of the contract, the Company concluded that this agreement does not qualify as a collaboration under ASC 808 as a result of the Company not sharing significant risks due to the net profit and loss split where Roche incurs substantially more of the costs of the collaboration as well as the Company's opt-out provision. The Company believes that Roche is the principal in the sales transactions with third parties as it is the primary obligor, bearing inventory and credit risk. The Company will record its share of pre-tax commercial profit generated from the collaboration with Roche, as collaboration revenue when the profit share can be reasonably estimated and collectability is reasonably assured. Prior to commercialization of a Licensed Product, the Company's portion of the expenses related to the License Agreement reflected on its income statement will be limited to R&D expenses. After commercialization, if the Company opts-in to co-detail commercialization expenses related to commercial capabilities, including the establishment of a field sales force and other activities to support the Company’s commercialization efforts, will be recorded as SG&A expense and will be factored into the computation of the profit and loss share. The Company will record the portion of the net receivable related to commercialization activities as collaboration revenue.
Multiple Element Accounting
The License Agreement was evaluated under ASC 605-25, Multiple Element Arrangements. The License Agreement includes the following deliverables: (1) an exclusive royalty bearing license, with the right to sublicense to develop and commercialize certain antibodies that target α
-
synuclein, including PRX002/RG7935 delivered at the effective date; (2) the Company's obligation to supply clinical material as requested by Roche for a period up to twelve months; (3) the Company's obligation to provide manufacturing related services to Roche for a period up to twelve months; (4) the Company's obligation to provide development activities under the development plan including the preparation and filing of the IND and initiation of the Phase I clinical trial estimated to be carried out over the next two years; and (5) the Company's obligation to provide indeterminate research services for up to three years at rates that are not significantly discounted and fully reimbursable by Roche.
All of the deliverables were deemed to have stand-alone value and to meet the criteria to be accounted for as separate units of accounting under ASC 605-25. Factors considered in the determination included, among other things, for the license, the research and development capabilities of Roche and Roche’s sublicense rights, and for the remaining deliverables the fact that they are not proprietary and can be and have been provided by other vendors.
The amount of allocable arrangement consideration is limited to amounts that are fixed or determinable excluding refund rights, concessions or performance bonuses. As such, the Company will exclude from such allocable consideration the milestone payments and royalties regardless of the probability of receipt because such payments are not considered fixed or determinable. Such milestone payments and royalties will be evaluated separately as the related contingencies are resolved. Consideration for research services were not allocated as the amount is not fixed and determinable and is not at a significant incremental discount. There are no refund rights, concessions or performance bonuses to consider.
The Company allocated the fixed and determinable consideration to the license and other deliverables using the relative selling price method based on the best estimate of selling price for the license and third party evidence for the remaining deliverables. The best estimate of selling price for the license was based on a discounted cash flow model. The key assumptions used in the discounted cash flow model used to determine the best estimate of selling price for the license granted to Roche under the License
72
Agreement included the market opportunity for commercialization of PRX002/RG7935 in the U.S. and the Royalty Territory (for jointly funded products the Royalty Territory is worldwide except for the U.S. for all Licensed Products that are not jointly funded the Royalty Territory is worldwide), the probability of successfully developing and commercializing PRX002/RG7935, the remaining development costs for PRX002/RG7935, and the estimated time to commercialization of PRX002/RG7935.
The Company’s discounted cash flow model included several market conditions and entity-specific inputs, including the likelihood that clinical trials will be successful, the likelihood that regulatory approval will be obtained and the product commercialized, the appropriate discount rate, the market locations, size and potential market share of the product, the expected life of the product, and the competitive environment for the product. The market assumptions were generated using a patient-based forecasting approach, with key epidemiological, market penetration, dosing, compliance, length of treatment, and pricing assumptions derived from primary and secondary market research, referenced from third-party sources.
The Company concluded that a change in the assumptions used to determine the BESP of the license deliverable would not have a significant effect on the allocation of arrangement consideration. Based on the relative selling price method, the amount that the Company recognized on the effective date of the agreement concurrent with the delivery of the license and know-how was limited to the lesser of the amount otherwise allocable using the relative selling price method, which based on the discounted cash flow model was determined to be
$35.6 million
, or the non-contingent amount which was the
$30.0 million
upfront fee. As the remaining deliverables are delivered, any consideration received will be allocated to license revenue and the other deliverables based on their relative percentages until such time as the full allocated consideration of
$35.6 million
has been recognized as license revenue, and the balance of the monetary consideration will be recorded as an offset against R&D expenses. The Company recognized the
$30.0 million
upfront payment as collaboration license revenue in the first quarter of 2014.
Under this agreement, the Company recognizes research reimbursement as collaboration revenue as earned. The Company recognized
$0.9 million
as collaboration revenue for research reimbursement from Roche for the
year ended December 31, 2017
, as compared to
$1.1 million
for the
year ended December 31, 2016
and
$1.4 million
for the year ended December 31, 2015. Cost sharing payments to Roche are recorded as R&D expenses. The Company recognized
$7.2 million
in R&D expenses for payments made to Roche during the
year ended December 31, 2017
, as compared to
$3.1 million
for the
year ended December 31, 2016
and
$2.9 million
for the year ended December 31, 2015.
Reimbursement for development costs from Roche under the cost-sharing arrangement were allocated between license revenue and an offset to R&D expenses based on the relative selling price method until the full allocated consideration of
$35.6 million
was recognized as license revenue, after which the full reimbursement is recorded as an offset to R&D expenses. In the year ended December 31, 2015, the Company reached the full allocated consideration of
$35.6 million
recognized as license revenue; accordingly, future development revenue were recorded as an offset to R&D expenses. Reimbursement for development costs from Roche during the
year ended December 31, 2017
was
$1.7 million
, as compared to
$3.6 million
for the
year ended December 31, 2016
, which was recognized as an offset to R&D expenses. Reimbursement for development costs from Roche during the year ended December 31, 2015 was
$5.1 million
, of which
$0.2 million
was recognized as collaboration license revenue and
$4.9 million
was recognized as an offset to R&D expenses.
Milestone Accounting
Under the License Agreement, the Company is eligible to receive milestone payments upon the achievement of development, regulatory and various first commercial sales milestones. Milestone payments are evaluated under ASU 2010-17, Milestone Method of Revenue Recognition. Factors considered in this determination included scientific and regulatory risk that must be overcome to achieve each milestone, the level of effort and investment required to achieve the milestone, and the monetary value attributed to the milestone. Accordingly, the Company recognizes payments related to the achievement of these milestones when the milestone is achieved.
The clinical and regulatory milestones under the License Agreement after the point at which the Company could opt-out are not considered to be substantive due to the fact that active participation in the development activities that generate the milestones is not required by the License Agreement, and the Company can opt-out of these activities. There are no refund or claw-back provisions and the milestones are uncertain of occurrence even after the Company has opted out. Based on this determination, these milestones will be recognized similar to the commercial milestone, which will be accounted for as contingent revenue payments with revenue recognized upon achievement of the milestone assuming all revenue recognition criteria are met.
In April 2014, the Company together with Roche initiated a Phase 1 clinical trial of PRX002/RG7935. As a result of this initiation, the Company received a
$15.0 million
milestone payment from Roche under the License Agreement. The Company concluded that the
$15.0 million
clinical milestone triggered upon the initiation of the Phase 1 study from PRX002/RG7935 in the clinic is consistent with the definition of a substantive milestone included in ASU 2010-17.
73
In June 2017, the Company achieved a
$30.0 million
clinical milestone under the License Agreement as a result of dosing of the first patient in the Phase 2 study for PRX002/RG7935, which the Company concluded was a substantive milestone under ASU 2010-17. The milestone was allocated to the units of accounting based on the relative selling price method for income statement classification purposes. As such, the Company recognized
$26.6 million
of the
$30.0 million
milestone as collaboration revenue and
$3.4 million
as an offset to R&D expenses during the
year ended December 31, 2017
. The Company did not achieve any clinical and regulatory milestones under the License Agreement during the years ended December 31, 2016 and 2015.
|
9.
|
Shareholders' Equity
|
Ordinary Shares
As of
December 31, 2017
, the Company had
100,000,000
ordinary shares authorized for issuance with a par value of
$0.01
per ordinary share and
38,482,764
ordinary shares issued and outstanding. Each ordinary share is entitled to
one
vote and, on a pro rata basis, to dividends when declared and the remaining assets of the Company in the event of a winding up.
Euro Deferred Shares
As of
December 31, 2017
, the Company had
10,000
Euro Deferred Shares authorized for issuance with a nominal value of
€22
per share.
No
Euro Deferred Shares are outstanding at
December 31, 2017
. The rights and restrictions attaching to the Euro Deferred Shares rank
pari passu
with the ordinary shares and are treated as a single class in all respects.
April 2015 Offering
In April 2015, the Company completed an underwritten public offering of an aggregate of
3,795,000
of its ordinary shares at a public offering price of
$37.00
per ordinary share. The Company received aggregate net proceeds of approximately
$131.5 million
, after deducting the underwriting discount and offering costs.
January 2016 Offering
In January 2016, the Company completed an underwritten public offering of an aggregate of
2,587,500
of its ordinary shares at a public offering price of
$53.00
per ordinary share. The Company received aggregate net proceeds of approximately
$128.6 million
, after deducting the underwriting discount and estimated offering costs.
March 2017 Offering
In March 2017, the Company completed an underwritten public offering of an aggregate of
2,700,000
of its ordinary shares at a public offering price of
$57.50
per ordinary share. The Company received aggregate net proceeds of approximately
$150.3 million
, after deducting the underwriting discount and offering costs.
10. Share-Based Compensation
Amended and Restated 2012 Long Term Incentive Plan (“LTIP”)
Employees and consultants of the Company, its subsidiaries and affiliates, as well as members of the Company's Board of Directors, are eligible to receive equity awards under the LTIP. The LTIP provides for the grant of stock options, including incentive stock options and nonqualified stock options, stock appreciation rights (“SARS”), restricted shares, restricted share units (“RSUs”), cash or stock-based performance awards and other share-based awards to eligible individuals. Options under the LTIP may be granted for periods up to
ten
years. All options issued to date have had a
ten
year life.
The Company granted
1,566,800
,
1,508,725
and
1,155,300
share options during the
years ended December 31, 2017, 2016 and 2015
, respectively, under the LTIP. The Company's option awards generally vest over
four
years. In May 2017, the Company's shareholders approved an increase of
1,350,000
additional ordinary shares authorized for issuance under the LTIP. The aggregate number of ordinary shares authorized for issuance under the LTIP is
8,750,000
ordinary shares. As of
December 31, 2017
,
2,261,745
ordinary shares remained available for grant, and options to purchase
4,406,752
ordinary shares under the LTIP were outstanding with a weighted-average exercise price of approximately
$38.93
per share.
Share-based Compensation Expense
The Company estimates the fair value of share-based compensation on the date of grant using an option-pricing model. The Company uses the Black-Scholes model to value share-based compensation, excluding RSUs, which the Company values using
74
the fair market value of its ordinary shares on the date of grant. The Black-Scholes option-pricing model determines the fair value of share-based payment awards based on the share price on the date of grant and is affected by assumptions regarding a number of complex and subjective variables. These variables include, but are not limited to, the Company’s share price, volatility over the expected life of the awards and actual and projected employee stock option exercise behaviors. Since the Company does not have sufficient historical employee share option exercise data, the simplified method has been used to estimate the expected life of all options. The expected volatility was based on a combination of historical volatility for the Company's stock and the historical volatilities of several of the Company's publicly traded comparable companies. Although the fair value of share options granted by the Company is estimated by the Black-Scholes model, the estimated fair value may not be indicative of the fair value observed in a willing buyer and seller market transaction.
As share-based compensation expense recognized in the Consolidated Financial Statements is based on awards ultimately expected to vest, it has been reduced for estimated forfeitures. Forfeitures are estimated at the time of grant and revised, if necessary, in subsequent periods if actual forfeitures differ from estimates. Forfeitures were estimated based on estimated future turnover and historical experience.
Share-based compensation expense will continue to have an adverse impact on the Company’s results of operations, although it will have no impact on its overall financial position. The amount of unearned share-based compensation currently estimated to be expensed from now through the year
2020
related to unvested share-based payment awards at
December 31, 2017
is
$65.8 million
. The weighted-average period over which the unearned share-based compensation is expected to be recognized is
2.72 years
. If there are any modifications or cancellations of the underlying unvested securities, the Company may be required to accelerate and/or increase any remaining unearned share-based compensation expense. Future share-based compensation expense and unearned share-based compensation will increase to the extent that the Company grants additional equity awards.
Share-based compensation expense recorded in these Consolidated Financial Statements for the
years ended December 31, 2017, 2016 and 2015
was based on awards granted under the LTIP. The following table summarizes share-based compensation expense for the periods presented (in thousands):
|
Year Ended December 31,
|
|||||||||||
|
2017
|
2016
|
2015
|
|||||||||
|
Research and development
(1)
|
$
|
10,914
|
|
$
|
7,094
|
|
$
|
4,301
|
|
||
|
General and administrative
(2)
|
15,850
|
|
17,835
|
|
6,113
|
|
|||||
|
Total share-based compensation expense
|
$
|
26,764
|
|
$
|
24,929
|
|
$
|
10,414
|
|
||
_________________
|
(1)
|
Includes
$nil
,
$nil
and
$42,000
for the
years ended December 31, 2017, 2016 and 2015
, respectively, of share-based compensation expense related to options granted to a consultant.
|
|
(2)
|
Includes
$nil
,
$6.5 million
and
$nil
for the
years ended December 31, 2017, 2016 and 2015
,
respectively, of share-based compensation expense related to the accelerated vesting of stock options to the Company's former CEO upon his death.
|
For the
years ended December 31, 2017, 2016 and 2015
, the Company recognized tax benefits from share-based awards of
$4.2 million
,
$4.3 million
and
$1.7 million
, respectively.
The fair value of the options granted to employees and non-employee directors during the
years ended December 31, 2017, 2016 and 2015
was estimated as of the grant date using the Black-Scholes option-pricing model assuming the weighted-average assumptions listed in the following table:
|
Year Ended December 31,
|
|||||
|
2017
|
2016
|
2015
|
|||
|
Expected volatility
|
72.4%
|
75.2%
|
76.3%
|
||
|
Risk-free interest rate
|
2.0%
|
1.5%
|
1.7%
|
||
|
Expected dividend yield
|
—%
|
—%
|
—%
|
||
|
Expected life (in years)
|
6.0
|
6.0
|
6.0
|
||
|
Weighted average grant date fair value
|
$35.71
|
$26.41
|
$23.12
|
||
75
The fair value of employee stock options is being amortized on a straight-line basis over the requisite service period for each award. Each of the inputs discussed above is subjective and generally requires significant management judgment to determine.
The following table summarizes the Company’s stock option activity during the
year ended December 31, 2017
:
|
Options
|
Weighted
Average Exercise Price |
Weighted
Average Remaining Contractual Term (years) |
Aggregate
Intrinsic Value (in thousands) |
|||||||||
|
Outstanding at December 31, 2016
|
4,064,207
|
|
$
|
27.19
|
|
6.79
|
$
|
92,640
|
|
|||
|
Granted
|
1,566,800
|
|
55.16
|
|
||||||||
|
Exercised
|
(1,030,648
|
)
|
17.31
|
|
||||||||
|
Canceled
|
(193,607
|
)
|
38.97
|
|
||||||||
|
Outstanding at December 31, 2017
|
4,406,752
|
|
$
|
38.93
|
|
7.60
|
$
|
30,455
|
|
|||
|
Vested and expected to vest at December 31, 2017
|
4,318,583
|
|
$
|
38.67
|
|
7.57
|
$
|
30,396
|
|
|||
|
Vested at December 31, 2017
|
2,044,977
|
|
$
|
26.12
|
|
6.15
|
$
|
27,753
|
|
|||
The total intrinsic value of options exercised was
$39.9 million
,
$12.8 million
and
$25.5 million
during the
years ended December 31, 2017, 2016 and 2015
, respectively, determined as of the date of exercise.
The following table summarizes information about the Company's share options outstanding as of
December 31, 2017
:
|
Options Outstanding
|
Options Exercisable
|
|||||||||||||||||||||
|
Range of Exercise Prices
|
Number of Options
|
Weighted -
Average Remaining Contractual Life (Years) |
Weighted Average Exercise Price
|
Number of Options
|
Weighted Average Exercise Price
|
|||||||||||||||||
|
$
|
6.41
|
|
$
|
6.65
|
|
449,575
|
|
5.08
|
$
|
6.42
|
|
449,575
|
|
$
|
6.42
|
|
||||||
|
6.73
|
|
26.47
|
|
314,165
|
|
5.18
|
12.49
|
|
297,443
|
|
11.96
|
|
||||||||||
|
27.81
|
|
27.81
|
|
466,229
|
|
6.62
|
27.81
|
|
314,142
|
|
27.81
|
|
||||||||||
|
29.52
|
|
34.44
|
|
386,744
|
|
5.87
|
30.86
|
|
362,830
|
|
30.79
|
|
||||||||||
|
34.61
|
|
34.61
|
|
535,189
|
|
7.78
|
34.61
|
|
244,715
|
|
34.61
|
|
||||||||||
|
37.02
|
|
49.60
|
|
456,704
|
|
8.09
|
45.07
|
|
205,778
|
|
42.68
|
|
||||||||||
|
49.79
|
|
54.64
|
|
461,396
|
|
8.88
|
52.67
|
|
101,491
|
|
52.75
|
|
||||||||||
|
55.00
|
|
55.00
|
|
649,500
|
|
9.15
|
55.00
|
|
—
|
|
—
|
|
||||||||||
|
55.15
|
|
60.45
|
|
524,250
|
|
9.32
|
57.46
|
|
25,335
|
|
59.16
|
|
||||||||||
|
62.10
|
|
67.64
|
|
163,000
|
|
8.78
|
65.04
|
|
43,668
|
|
67.56
|
|
||||||||||
|
$
|
6.41
|
|
$
|
67.64
|
|
4,406,752
|
|
7.60
|
$
|
38.93
|
|
2,044,977
|
|
$
|
26.12
|
|
||||||
11. Income Taxes
The Company files its U.S. and Irish income tax returns and income taxes are presented in the Consolidated Financial Statements using the asset and liability method prescribed by the accounting guidance for income taxes.
Income (loss) before provision for income taxes by country for each of the fiscal periods presented is summarized as follows (in thousands):
76
|
Year Ended December 31,
|
||||||||||||
|
2017
|
2016
|
2015
|
||||||||||
|
Ireland
|
$
|
(162,865
|
)
|
$
|
(164,797
|
)
|
$
|
(83,009
|
)
|
|||
|
Switzerland
|
480
|
|
—
|
|
—
|
|
||||||
|
U.S.
|
4,782
|
|
5,833
|
|
3,098
|
|
||||||
|
Loss before provision for income taxes
|
$
|
(157,603
|
)
|
$
|
(158,964
|
)
|
$
|
(79,911
|
)
|
|||
Components of the provision for income taxes for each of the fiscal periods presented consisted of the following (in thousands):
|
Year Ended December 31,
|
||||||||||||
|
2017
|
2016
|
2015
|
||||||||||
|
Current:
|
||||||||||||
|
U.S. Federal
|
$
|
(2,478
|
)
|
$
|
4,464
|
|
$
|
1,663
|
|
|||
|
U.S. State
|
1
|
|
1
|
|
1
|
|
||||||
|
Switzerland
|
306
|
|
—
|
|
—
|
|
||||||
|
Ireland
|
5
|
|
—
|
|
—
|
|
||||||
|
Total current provision
|
$
|
(2,166
|
)
|
$
|
4,465
|
|
$
|
1,664
|
|
|||
|
Deferred:
|
||||||||||||
|
U.S. Federal
|
$
|
(2,200
|
)
|
$
|
(3,321
|
)
|
$
|
(963
|
)
|
|||
|
U.S. State
|
—
|
|
—
|
|
—
|
|
||||||
|
Switzerland
|
—
|
|
—
|
|
—
|
|
||||||
|
Ireland
|
—
|
|
—
|
|
—
|
|
||||||
|
Total deferred benefit
|
(2,200
|
)
|
(3,321
|
)
|
$
|
(963
|
)
|
|||||
|
Total provision for income taxes
|
$
|
(4,366
|
)
|
$
|
1,144
|
|
$
|
701
|
|
|||
The Company adopted ASU 2016-09 on January 1, 2017. Pursuant to the adoption of ASU 2016-09, tax attributes previously tracked off balance sheet have been recorded as deferred tax assets, offset by a valuation allowance. In addition, the Company has reversed its non-current tax liability of
$98,000
, with the offsetting entry recorded to retained earnings pursuant to the adoption of this ASU. Further, year-to-date excess benefits of stock compensation have been recorded as a benefit to the tax provision. For the
year ended December 31, 2017
, the Company recorded excess tax benefits of
$5.3 million
, which were recorded as part of its income tax provision in the Consolidated Statements of Operations. The Company's income tax expense will continue to be impacted by fluctuations in stock price between the grant dates and the exercise dates of its option awards.
The provision for income taxes differs from the statutory tax rate of
12.5%
applicable to Ireland primarily due to Irish net operating losses for which a tax provision benefit is not recognized, U.S. income taxed at different rates, and excess tax benefits from stock options. Following is a reconciliation between income taxes computed at the Irish statutory tax rate and the provision for income taxes for each of the fiscal periods presented (in thousands):
|
Years Ended December 31,
|
||||||||||||
|
|
2017
|
2016
|
2015
|
|||||||||
|
Taxes at the Irish statutory tax rate of 12.5%
|
$
|
(19,700
|
)
|
$
|
(19,870
|
)
|
$
|
(9,989
|
)
|
|||
|
Income tax at rates other than applicable statutory rate
|
678
|
|
813
|
|
446
|
|
||||||
|
Change in valuation allowance
|
28,967
|
|
25,200
|
|
12,594
|
|
||||||
|
Share-based payments
|
(8,242
|
)
|
422
|
|
214
|
|
||||||
|
Tax credits
|
(5,857
|
)
|
(5,384
|
)
|
(2,712
|
)
|
||||||
|
Other
|
(212
|
)
|
(37
|
)
|
148
|
|
||||||
|
Provision for (benefit from) income taxes
|
$
|
(4,366
|
)
|
$
|
1,144
|
|
$
|
701
|
|
|||
Deferred income taxes reflect the net tax effect of temporary differences between the carrying amount of assets and liabilities for financial reporting purposes and the amounts used for income tax purposes.
77
On December 22, 2017, the U.S. Tax Cuts and Jobs Act (the “TCJA”) was signed into law. It contains many significant changes to the U.S. income tax laws. The TCJA is effective in the first quarter of 2018 and, among other things, lowers the Company’s U.S. federal income tax rate from
34%
to
21%
. Accordingly, the Company has recorded a provision tax benefit of
$0.4 million
related to the remeasurement of its U.S. deferred tax assets to reflect the lower statutory tax rate. Due to the repeal of alternative minimum taxes, the Company anticipates that its future U.S. taxes will decrease due to its ability to use additional tax credits previously limited by the alternative minimum tax. However, the Company also expects an increase to its taxable income due to additional limitations imposed by the TCJA on the deductibility of compensation of certain of its executive officers.
As of December 31, 2017, the Company has not completed its accounting for the tax effects of the TCJA, but recorded a provisional net tax benefit based on the Company's best estimates. The provisional amounts incorporate assumptions made based upon the Company's current interpretation of the TCJA and are subject to revision as the Company receives and interprets any additional clarification and implementation guidance issued by the U.S. Treasury Department, U.S. Internal Revenue Service (the “IRS”) and other standard-setting bodies. Any adjustments to the provisional amounts recorded will be included as an adjustment to the provision for income taxes. Adjustments may materially impact the Company's provision for income taxes and effective tax rate in the period in which the adjustments are made. The Company anticipates its accounting for the tax effects of the TCJA will be completed in 2018.
Significant components of the Company’s net deferred tax assets as of
December 31, 2017
and
2016
are as follows (in thousands):
|
December 31,
|
||||||||
|
2017
|
2016
|
|||||||
|
Deferred tax assets:
|
||||||||
|
Net operating losses
|
$
|
67,653
|
|
$
|
47,218
|
|
||
|
Tax credits
|
16,308
|
|
4,937
|
|
||||
|
Accruals
|
1,285
|
|
1,322
|
|
||||
|
Share-based compensation
|
7,444
|
|
8,966
|
|
||||
|
Gross deferred tax assets
|
92,690
|
|
62,443
|
|
||||
|
Valuation allowance
|
(83,972
|
)
|
(56,382
|
)
|
||||
|
Net deferred tax assets
|
8,718
|
|
6,061
|
|
||||
|
Deferred tax liability:
|
||||||||
|
Fixed Assets
|
(605
|
)
|
(148
|
)
|
||||
|
Net deferred tax assets
|
$
|
8,113
|
|
$
|
5,913
|
|
||
The Company's deferred tax assets are composed primarily of its Irish subsidiaries' net operating loss carryovers, state net operating loss carryforwards available to reduce future taxable income of the Company's U.S. subsidiary, federal and state tax credit carryforwards, share-based compensation and other temporary differences. The Company maintains a valuation allowance against certain U.S. federal and state and Irish deferred tax assets. Each reporting period, the Company evaluates the need for a valuation allowance on its deferred tax assets by jurisdiction.
Recognition of deferred tax assets is appropriate when realization of such assets is more likely than not. Based upon the weight of available evidence, especially the uncertainties surrounding the realization of deferred tax assets through future taxable income, the Company believes it is not yet more likely than not that the deferred tax assets will be fully realizable. Accordingly, the Company has provided a valuation allowance of
$84.0 million
against its deferred tax assets as of
December 31, 2017
primarily in relation to deferred tax assets arising from tax credits and net operating losses. The deferred tax assets recognized net of the valuation allowance,
$8.1 million
as of
December 31, 2017
, consist of U.S. federal temporary differences. Due to consistent U.S. operating income, the Company expects to realize such deferred tax assets. The net increase of
$27.6 million
in the valuation allowance during the year ended
December 31, 2017
was primarily due to net operating losses of the Company's Irish entities, and to a lesser extent from U.S. federal and state tax credits.
As of
December 31, 2017
, certain of the Company's Irish entities had trading loss carryovers of
$497.7 million
and non-trading loss carryovers of
$10.7 million
, each of which can be carried forward indefinitely but are limited to the same trade/trades. In addition, as of
December 31, 2017
, the Company had state net operating loss carryforwards of approximately
$46.4 million
, which are available to reduce future taxable income for the Company's U.S. subsidiary, if any. If not utilized, the state net operating loss carryforward begins expiring in
2032
.
78
The Company also has federal and California research and development credit carryforwards of
$11.8 million
and
$8.8 million
, respectively, at
December 31, 2017
. The federal research and development credit carryforwards will expire starting in
2035
if not utilized. The California tax credits can be carried forward indefinitely.
Cumulative unremitted earnings of the Company’s U.S. and Swiss subsidiaries total approximately
$20.4 million
and
$0.5 million
, respectively at
December 31, 2017
. The Company's U.S. and Swiss subsidiaries' cash balances at
December 31, 2017
are committed for their working capital needs. No taxes have been provided for the unremitted earnings as any tax basis differences relating to investments in these overseas subsidiaries are considered to be permanent in duration. Unremitted earnings may be subject to withholding taxes (potentially at
5%
in the U.S. and
5%
in Switzerland) and Irish taxes (potentially at a rate of
12.5%
) if they were to be distributed as dividends. However, Ireland allows a credit against Irish taxes for U.S. and Swiss taxes withheld and as of
December 31, 2017
the Company's current year net operating losses in Ireland are sufficient to offset any potential dividend income received from its overseas subsidiaries.
A reconciliation of the beginning and ending amounts of unrecognized tax benefits is as follows (in thousands):
|
2017
|
2016
|
||||||
|
Gross Unrecognized Tax Benefits at January 1
|
$
|
2,406
|
|
$
|
1,061
|
|
|
|
Additions for tax positions taken in the current year
|
1,464
|
|
1,346
|
|
|||
|
Additions for tax positions taken in the prior year
|
398
|
|
—
|
|
|||
|
Reductions for tax positions taken in the prior year
|
—
|
|
(1
|
)
|
|||
|
Gross Unrecognized Tax Benefits at December 31
|
$
|
4,268
|
|
$
|
2,406
|
|
|
If recognized, none of the Company's unrecognized tax benefits as of
December 31, 2017
would reduce its annual effective tax rate, primarily due to corresponding adjustments to its deferred tax valuation allowance. As of
December 31, 2017
, the Company has not recorded a liability for potential interest or penalties. The Company also does not expect its unrecognized tax benefits to change significantly over the next 12 months.
The tax years 2013 to 2017 remain subject to examination by the U.S taxing authorities and the tax years 2012 to 2017 remain subject to examination by the Irish taxing authorities.
12. Employee Retirement Plan
In the United States, the Company provides a qualified retirement plan under section 401(k) of the Internal Revenue Code (the “IRC”) under which participants may contribute up to
100%
of their eligible compensation, subject to maximum deferral limits specified by the IRC. In addition, the Company contributes
3%
of each participating employee’s eligible compensation, subject to limits specified by the IRC, on a quarterly basis. Further, the Company may make an annual discretionary matching and/or profit sharing contribution as determined solely by the Company. The Company recorded total expense for matching contributions of
$0.7 million
,
$0.6 million
and
$0.4 million
for the
years ended December 31, 2017, 2016 and 2015, respectively
.
In Europe, the Company recorded total expense for employer contribution of
$352,000
,
$92,000
and
$51,000
in the
years ended December 31, 2017, 2016 and 2015, respectively
. In Ireland, the Company operates a defined contribution plan in which it contributes up to
7.5%
of an employee's eligible earnings. In Switzerland, the Company contributes to an employee pension fund up to
19.0%
of an employee’s two-third eligible earnings. The percentage to be paid by the Company in Switzerland depends on the employee's age, gender, and employee classification. In Germany, Belgium and Spain, the Company contributes at a fixed rate of
8.0%
,
7.5%
and
7.5%
, respectively, of an employee's eligible earnings.
13. Related Parties
Consulting Agreement
Carol D. Karp commenced employment with the Company as its Chief Regulatory Officer on December 14, 2016. Prior to that, Ms. Karp provided consulting services to the Company under a written Consulting Agreement. That Consulting Agreement terminated as of December 13, 2016, before Ms. Karp joined the Company. There were
no
consulting fees paid to Ms. Karp for the year ended December 31, 2017. During fiscal year 2016 through December 13, 2016, the Company paid to Ms. Karp a total of
$304,150
(not including expense reimbursements) under the Consulting Agreement.
14. Selected Quarterly Financial Information (Unaudited)
79
The following table presents selected unaudited consolidated financial data for each of the eight quarters in the two-year period ended
December 31, 2017
. In the Company's opinion, this unaudited information has been prepared on the same basis as the audited information and includes all adjustments (consisting of only normal recurring adjustments) necessary for a fair statement of the financial information for the period presented. Net loss per share - basic and diluted, for the four quarters of each fiscal year may not sum to the total for the fiscal year because of the different number of shares outstanding during each period (in thousands, except per share data):
|
Quarter
|
|||||||||||||||
|
First
|
Second
|
Third
|
Fourth
|
||||||||||||
|
Year Ended December 31, 2017
|
|||||||||||||||
|
Revenues
|
$
|
259
|
|
$
|
26,812
|
|
$
|
219
|
|
$
|
229
|
|
|||
|
Operating expenses
|
$
|
36,530
|
|
$
|
44,944
|
|
$
|
53,753
|
|
$
|
47,546
|
|
|||
|
Net loss
|
$
|
(35,384
|
)
|
$
|
(17,701
|
)
|
$
|
(52,394
|
)
|
$
|
(47,758
|
)
|
|||
|
Net loss per share - basic
|
$
|
(0.99
|
)
|
$
|
(0.46
|
)
|
$
|
(1.37
|
)
|
$
|
(1.24
|
)
|
|||
|
Net loss per share - diluted
|
$
|
(0.99
|
)
|
$
|
(0.46
|
)
|
$
|
(1.37
|
)
|
$
|
(1.24
|
)
|
|||
|
Year Ended December 31, 2016
|
|||||||||||||||
|
Revenues
|
$
|
265
|
|
$
|
333
|
|
$
|
286
|
|
$
|
171
|
|
|||
|
Operating expenses
|
$
|
27,675
|
|
$
|
40,493
|
|
$
|
42,974
|
|
$
|
49,448
|
|
|||
|
Net income (loss)
|
$
|
(27,521
|
)
|
$
|
(40,445
|
)
|
$
|
(43,239
|
)
|
$
|
(48,903
|
)
|
|||
|
Net income (loss) per share - basic
|
$
|
(0.81
|
)
|
$
|
(1.18
|
)
|
$
|
(1.26
|
)
|
(1.41
|
)
|
||||
|
Net income (loss) per share - diluted
|
$
|
(0.81
|
)
|
$
|
(1.18
|
)
|
$
|
(1.26
|
)
|
$
|
(1.41
|
)
|
|||
80
None.
Evaluation of Disclosure Controls and Procedures
Our management, with the participation of our chief executive officer (“CEO”) and chief financial officer (“CFO”) evaluated the effectiveness of our disclosure controls and procedures pursuant to Rule 13a-15 under the Securities Exchange Act of 1934, as amended (the “Exchange Act”), as of the end of the period covered by this Form 10-K. Based on this evaluation, our CEO and CFO concluded that, as of
December 31, 2017
, our disclosure controls and procedures are designed and are effective to provide reasonable assurance that information we are required to disclose in reports that we file or submit under the Exchange Act is recorded, processed, summarized, and reported within the time periods specified in the SEC's rules and forms, and that such information is accumulated and communicated to our management, including our CEO and CFO, as appropriate, to allow timely decisions regarding required disclosure.
Management’s Report on Internal Control over Financial Reporting
Our management is responsible for establishing and maintaining adequate internal control over financial reporting as defined in Rule 13a-15(f) of the Exchange Act. Internal control over financial reporting is a process designed by, or under the supervision of, our CEO and CFO, and effected by our Board of Directors, management and other personnel, to provide reasonable assurance regarding the reliability of financial reporting and the preparation of financial statements for external purposes in accordance with generally accepted accounting principles and includes those policies and procedures that:
|
•
|
Pertain to the maintenance of records that accurately and fairly reflect in reasonable detail the transactions and dispositions of the assets of our company;
|
|
•
|
Provide reasonable assurance that transactions are recorded as necessary to permit preparation of financial statements in accordance with generally accepted accounting principles, and that our receipts and expenditures are being made only in accordance with authorizations of our management and directors; and
|
|
•
|
Provide reasonable assurances regarding prevention or timely detection of unauthorized acquisition, use or disposition of our assets that could have a material adverse effect on our financial statements.
|
Our management assessed our internal control over financial reporting as of
December 31, 2017
, the end of our fiscal year. Management based its assessment on criteria established in “Internal Control-Integrated Framework (2013)” issued by the Committee of Sponsoring Organizations of the Treadway Commission. Based on management's assessment of our internal control over financial reporting, management concluded that, as of
December 31, 2017
, our internal control over financial reporting was effective. The effectiveness of our internal control over financial reporting as of
December 31, 2017
has been audited by KPMG LLP, an independent registered public accounting firm, as stated in its report which is included in Item 8 of this Annual Report on Form 10-K.
Changes in Internal Control over Financial Reporting
There were no changes in our internal control over financial reporting identified in management’s evaluation pursuant to Rules 13a-15(d) or 15d-15(d) of the Exchange Act during our fourth fiscal quarter ended
December 31, 2017
that materially affected, or are reasonably likely to materially affect, our internal control over financial reporting.
Limitations on Effectiveness of Controls and Procedures
Internal control over financial reporting has inherent limitations. Internal control over financial reporting is a process that involves human diligence and compliance and is subject to lapses in judgment and breakdowns resulting from human failures. Internal control over financial reporting also can be circumvented by collusion or improper management override. Because of such limitations, there is a risk that material misstatements will not be prevented or detected on a timely basis by internal control over financial reporting. However, these inherent limitations are known features of the financial reporting process. Therefore, it is possible to design into the process safeguards to reduce, though not eliminate, this risk.
Our management recognizes that any controls and procedures, no matter how well designed and operated, can provide only reasonable assurance of achieving the desired control objectives. In addition, the design of disclosure controls and procedures
81
must reflect the fact that there are resource constraints and that management necessarily applies its judgment in evaluating the benefits of possible controls and procedures relative to their costs.
None.
Certain information required by Part III is incorporated herein by reference from our definitive proxy statement relating to our Annual General Meeting of Shareholders to be held on
May 15, 2018
(our “Proxy Statement”).
Except for the information about our executive officers and Code of Conduct shown below, the information appearing in our Proxy Statement under the following headings is incorporated herein by reference:
|
•
|
Election of Directors
|
|
•
|
Section 16(a) Beneficial Ownership Reporting Compliance
|
Executive Officers of the Registrant
Following is certain information regarding our executive officers as of
February 9, 2018
.
|
Name
|
Age
|
Position(s)
|
Since
|
|||
|
Gene G. Kinney
|
49
|
President and Chief Executive Officer, Director
|
2016
|
|||
|
A. W. Homan
|
58
|
Chief Legal Officer
|
2014
|
|||
|
Carol D. Karp
|
65
|
Chief Regulatory Officer
|
2016
|
|||
|
Tran B. Nguyen
|
44
|
Chief Financial Officer
|
2013
|
|||
|
Tara Nickerson, Ph.D.
|
45
|
Chief Business Officer
|
2014
|
|||
|
Karin L. Walker
|
54
|
Chief Accounting Officer and Controller
|
2013
|
|||
|
Wagner M. Zago, Ph.D.
|
45
|
Chief Scientific Officer
|
2017
|
|||
Gene G. Kinney, Ph.D.,
has served as our President and Chief Executive Officer as well as a member of our Board of Directors since 2016. Prior to that, he was our Chief Operating Officer for part of 2016, and prior to that he was our Chief Scientific Officer and Head of Research and Development from 2012 to 2016. From 2009 to 2012, Dr. Kinney held various positions with Elan Pharmaceuticals, Inc.: Senior Vice President of Pharmacological Sciences (from 2011 to 2012) and Vice President, Pharmacology (from 2009 to 2011) for Elan Pharmaceuticals, Inc; and while in those positions, he also served as Head of Nonclinical Research for Janssen Alzheimer Immunotherapy R&D. From 2001 to 2009, Dr. Kinney was Senior Director, Head of Central Pharmacology and acting lead for Bioanalytics & Pathology at the Merck Research Laboratories, where he contributed to the strategic direction and oversight of drug discovery activities and led a number of non-clinical discovery and clinical development programs targeted for the treatment of neurodegenerative and psychiatric conditions. Dr. Kinney also held positions at Bristol-Myers Squibb and was an Assistant Professor at the Emory University School of Medicine, Department of Psychiatry and Behavioral Sciences. He earned his BA from Bloomsburg University and his MA and PhD from Florida Atlantic University.
A. W. Homan
has served as our Chief Legal Officer since 2014. Prior to joining Prothena, Mr. Homan was Senior Vice President, General Counsel and Secretary of Complete Genomics, Inc. (a laboratory services company), a position he held from 2012 until its sale in 2013. He was Senior Vice President, General Counsel and Secretary of Varian, Inc. (a scientific instruments company), from 1999 until it was acquired in 2010. Prior to that, Mr. Homan was Associate General Counsel at Varian Associates, Inc., and also worked at a leading San Francisco law firm. He earned BA from Virginia Tech and his JD (law degree) from the University of Virginia.
Carol D. Karp
has served as our Chief Regulatory Officer since 2016. Prior to joining Prothena, she was an independent regulatory consultant to biotechnology and pharmaceutical companies. From 2013 to 2014, Ms. Karp was Senior Vice President, Regulatory Affairs and Compliance at Esperion Therapeutics, Inc. (a biotechnology company), and from 2010 to 2013, she was Vice President, Head of Global Regulatory Affairs, Pharmacovigilance & Risk Management at Janssen Alzheimer Immunotherapy, a Johnson & Johnson Company (a biopharmaceutical company). Previously, Ms. Karp held senior regulatory positions at Janssen
82
Alzheimer Immunotherapy, CV Therapeutics, Inc., PowderJect Technologies, VIVUS, Inc., Cygnus, Inc. and Janssen Pharmaceutica. She earned her BA in Biology from the University of Rochester, where she is a member of the Board of Trustees.
Tran B. Nguyen
has served as our Chief Financial Officer since 2013. Prior to joining Prothena, Mr. Nguyen was Vice President, Chief Financial Officer (from 2010 to 2011) and then Senior Vice President, Chief Financial Officer of Somaxon Pharmaceuticals, Inc., from 2011 until its sale in 2013. He was Vice President, Chief Financial Officer and Investor Relations at Metabasis Therapeutics, Inc. (a biopharmaceutical company) from 2009 until its sale in 2010. From 2007 to 2009, Mr. Nguyen was a Vice President in the Healthcare Investment Banking group at Citi Global Markets, Inc., and from 2004 to 2007 he served in various capacities as a healthcare investment banker at Lehman Brothers, Inc. Mr. Nguyen serves on the board of directors of Sierra Oncology, Inc. (a clinical-stage oncology company). He earned his BA in Economics and Psychology from Claremont McKenna College and his MBA from the Anderson School of Management at the University of California, Los Angeles.
Tara Nickerson, Ph.D.,
has served as our Chief Business Officer since 2014. Prior to that, she was our Head of Corporate and Business Development and Secretary, positions she held since 2012. Dr. Nickerson previously held various positions with Elan Pharmaceuticals, Inc., including Vice President and Head of Business Development (during 2012) and Senior Director of Corporate Strategy and Strategic Alliances (from 2007 to 2012). During her tenure at Elan, she was responsible for opportunity evaluation, diligence, negotiations and contracting for Elan external opportunities, and established a broad network of collaborations for Elan with academic investigators, not-for-profit disease-focused foundations and industry collaborators. Dr. Nickerson was previously a Senior Scientist at Axys Pharmaceuticals, where she led preclinical programs developing novel small molecule based therapeutics for oncology. Dr. Nickerson earned her BSc and PhD in Experimental Medicine from McGill University and her MBA from the University of California, Berkeley’s Haas School of Business.
Karin L. Walker
has served as our Chief Accounting Officer and Controller since 2013. Prior to joining Prothena, Ms. Walker was Vice President, Finance and Chief Accounting Officer of Affymax, Inc. (a biopharmaceutical company), a position she held from 2012 to 2013. From 2009 to 2012, she was Vice President, Finance and Corporate Controller at Amyris Inc. (a biotechnology company). From 2006 to 2009, Ms. Walker was Vice President, Finance and Corporate Controller for CV Therapeutics, Inc. (a biopharmaceutical company). She also held senior financial leadership positions at Knight Ridder Digital, Accellion, Niku Corporation, Financial Engines, Inc. and NeoMagic Corporation. Ms. Walker earned her BS in business from the California State Polytechnic University, San Luis Obispo, and is a certified public accountant.
Wagner M. Zago, Ph.D.
, has served as our Chief Scientific Officer since 2017. Prior to that, since 2015, he was our Vice President, Head of Research. From 2012 to 2015, Dr. Zago was our Head of Pharmacology and Neuropathology. From 2006 to 2012, he held various scientific positions at Elan Pharmaceuticals, Inc, performing research aimed at developing new therapeutics for central nervous system disorders and inflammation. While in these positions, from 2009 to 2013, Dr. Zago also served as a Scientist at Janssen Alzheimer Immunotherapy, a Johnson & Johnson Company (a biopharmaceutical company). He earned his BS in Biomedicine from the Universidade Federal de Sao Paulo (Escola Paulista de Medicina), Brazil, and his MS and PhD (both in Pharmacology) from the Universidade de Sao Paulo, Brazil, and was a Post-Doctoral Researcher at the University of California, San Diego and the Burnham Institute.
Code of Conduct
We have a Code of Conduct that applies to all of our directors, executive officers and employees, including our principal executive officer, principal financial officer, principal accounting officer or controller, or persons performing similar functions. Our Code of Conduct is available on the Company’s website at http://ir.prothena.com. We will provide to any person without charge, upon request, a copy of that Code of Conduct; such a request may be made by sending it to our Company Secretary, Prothena Corporation plc, Adelphi Plaza, Upper George's Street, Dún Laoghaire, Co. Dublin, A96 T927, Ireland. If we make any amendment to, or waiver from, a provision of our Code of Conduct that we are required to disclose under SEC rules, we intend to satisfy that disclosure requirement by posting such information to our website at http://ir.prothena.com.
The information appearing in our Proxy Statement under the following headings is incorporated herein by reference:
|
•
|
Executive Compensation
|
|
•
|
Director Compensation
|
|
•
|
Report of the Compensation Committee of the Board of Directors
|
The information appearing in our Proxy Statement under the following headings is incorporated herein by reference:
|
•
|
Equity Compensation Plan Information
|
|
•
|
Security Ownership of Certain Beneficial Owners and Management
|
The information appearing in our Proxy Statement under the following headings is incorporated herein by reference:
|
•
|
Transactions with Related Persons and Indemnification
|
|
•
|
Proposal No. 1 - Election of Directors
|
The information appearing in our Proxy Statement under the following headings is incorporated herein by reference:
|
•
|
Proposal No. 2 - Ratification of Appointment of Independent Registered Public Accounting Firm - Fees Paid to KPMG
|
|
•
|
Proposal No. 2 - Ratification of Appointment of Independent Registered Public Accounting Firm - Pre-Approval Policies and Procedures
|
With the exception of the information specifically incorporated by reference in Part III to this Form 10-K from our Proxy Statement, our Proxy Statement shall not be deemed to be filed as part of this Form 10-K.
(a)
The following documents are filed as part of this report on Form 10-K:
|
(1)
|
Financial Statements.
Reference is made to the Index to the registrant’s Financial Statements under Item 8 in Part II of this Form 10-K.
|
|
(2)
|
Financial Statement Schedules.
Financial statement schedules have been omitted because the required information is not present or not present in the amounts sufficient to require submission of the schedule or because the information is already included in the consolidated financial statements or notes thereto.
|
|
(3)
|
Exhibits.
The exhibits listed on the accompanying index to exhibits in Item 15(b) below are filed as part of, or hereby incorporated by reference into, this report on Form 10-K.
|
83
(b)
Exhibits.
The exhibits listed in the Exhibit Index hereto are incorporated or filed herewith.
84
SIGNATURES
Pursuant to the requirements of Section 13 or 15(d) of the Securities Exchange Act of 1934, as amended, the Registrant has duly caused this Annual Report on Form 10-K to be signed on its behalf by the undersigned, thereunto duly authorized.
|
Dated:
|
February 23, 2018
|
Prothena Corporation plc
(Registrant)
|
||
|
/s/ Gene G. Kinney
|
||||
|
Gene G. Kinney
|
||||
|
President and Chief Executive Officer
|
||||
|
/s/ Tran B. Nguyen
|
||||
|
Tran B. Nguyen
|
||||
|
Chief Financial Officer
|
||||
85
POWER OF ATTORNEY
KNOW ALL PERSONS BY THESE PRESENTS, that each person whose individual signature appears below hereby authorizes and appoints Gene G. Kinney and Tran B. Nguyen, and each of them, with full power of substitution and resubstitution and full power to act without the other, as his or her true and lawful attorney-in-fact and agent to act in his or her name, place and stead and to execute in the name and on behalf of each person, individually and in each capacity stated below, and to file any and all amendments to this Annual Report on Form 10-K, and to file the same, with all exhibits thereto, and other documents in connection therewith, with the Securities and Exchange Commission, granting unto said attorneys-in-fact and agents, and each of them, full power and authority to do and perform each and every act and thing, ratifying and confirming all that said attorneys-in-fact and agents or any of them or their or his substitute or substitutes may lawfully do or cause to be done by virtue thereof.
Pursuant to the requirements of the Securities Exchange Act of 1934, this report has been signed below by the following persons on behalf of the Registrant and in the capacities and on the dates indicated.
|
Name
|
Title
|
Date
|
||
|
/s/Gene G. Kinney
|
President and Chief Executive Officer
|
February 23, 2018
|
||
|
Gene G. Kinney, Ph.D.
|
(Principal Executive Officer) and Director
|
|||
|
/s/Tran B. Nguyen
|
Chief Financial Officer
|
February 23, 2018
|
||
|
Tran B. Nguyen
|
(Principal Financial Officer)
|
|||
|
/s/Karin L. Walker
|
Chief Accounting Officer and Controller
|
February 23, 2018
|
||
|
Karin L. Walker
|
(Principal Accounting Officer)
|
|||
|
/s/Lars G. Ekman
|
Chairman of the Board
|
February 23, 2018
|
||
|
Lars G. Ekman, M.D., Ph.D.
|
||||
|
/s/Richard T. Collier
|
Director
|
February 23, 2018
|
||
|
Richard T. Collier
|
||||
|
/s/Shane M. Cooke
|
Director
|
February 23, 2018
|
||
|
Shane M. Cooke
|
||||
|
/s/K. Anders O. Härfstrand
|
Director
|
February 23, 2018
|
||
|
K. Anders O. Härfstrand, M.D., Ph.D.
|
||||
|
/s/Christopher S. Henney
|
Director
|
February 23, 2018
|
||
|
Christopher S. Henney, D.Sc., Ph.D.
|
||||
|
/s/Dennis J. Selkoe
|
Director
|
February 23, 2018
|
||
|
Dennis J. Selkoe, M.D.
|
||||
86
EXHIBIT INDEX
|
Previously Filed
|
|||||||||
|
Exhibit
No.
|
Description
|
Form
|
File No.
|
Filing Date
|
Exhibit
|
Filed Herewith
|
|||
|
2.1
|
10/A
|
001-35676
|
11/30/2012
|
2.1
|
|||||
|
2.2(a)
|
8-K
|
001-35676
|
12/21/2012
|
2.1
|
|||||
|
2.2(b)
|
S-1/A
|
333-191218
|
9/30/2013
|
2.2(b)
|
|||||
|
2.3
|
8-K
|
001-35676
|
12/21/2012
|
2.2
|
|||||
|
3.1
|
8-K
|
001-35676
|
5/25/2016
|
3.1
|
|||||
|
4.1
|
|
8-K
|
001-35676
|
5/25/2016
|
3.1
|
||||
|
10.1(a)
|
8-K
|
001-35676
|
12/21/2012
|
10.1
|
|||||
|
10.1(b)
|
10-Q
|
001-35676
|
8/13/2013
|
10.2
|
|||||
|
10.2
|
10/A
|
001-35676
|
11/30/2012
|
10.14
|
|||||
|
10.3†
|
10-K/A
|
001-35676
|
6/6/2014
|
10.4
|
|||||
|
10.4†
|
10-Q
|
001-35676
|
8/13/2013
|
10.3
|
|||||
|
10.5†
|
|
10-Q
|
001-35676
|
8/9/2017
|
10.4
|
||||
|
10.6†
|
10-K
|
001-35676
|
2/27/2017
|
10.6
|
|||||
|
10.7(a)
|
10-Q
|
001-35676
|
5/4/2016
|
10.2(a)
|
|||||
87
|
Previously Filed
|
|||||||||
|
Exhibit
No.
|
Description
|
Form
|
File No.
|
Filing Date
|
Exhibit
|
Filed Herewith
|
|||
|
10.7(b)
|
10-Q
|
001-35676
|
5/4/2016
|
10.2(b)
|
|||||
|
10.8#
|
8-K
|
001-35676
|
5/23/2017
|
10.1
|
|||||
|
10.9#
|
10-Q
|
001-35676
|
5/9/2017
|
10.1
|
|||||
|
10.10#
|
8-K
|
001-35676
|
12/15/2015
|
10.1
|
|||||
|
10.11#
|
8-K
|
001-35676
|
12/11/2014
|
10.1
|
|||||
|
10.12#
|
S-8
|
333-196572
|
6/6/2014
|
99.2
|
|||||
|
10.13#
|
S-8
|
333-196572
|
6/6/2014
|
99.3
|
|||||
|
10.14#
|
10-K
|
001-35676
|
3/13/2015
|
10.11
|
|||||
|
10.15#
|
8-K
|
001-35676
|
3/28/2013
|
10.1
|
|||||
|
10.16#
|
8-K
|
001-35676
|
11/4/2016
|
10.1
|
|||||
|
10.17#
|
8-K
|
001-35676
|
3/28/2013
|
10.2
|
|||||
|
10.18#
|
8-K
|
001-35676
|
11/28/2016
|
10.1
|
|||||
|
10.19#
|
10-K
|
001-35676
|
3/29/2013
|
10.20
|
|||||
|
10.20#
|
8-K
|
001-35676
|
3/3/2014
|
10.1
|
|||||
|
10.21#
|
8-K
|
001-35676
|
5/22/2013
|
10.1
|
|||||
|
10.22#
|
10-Q
|
001-35676
|
8/5/2014
|
10.5
|
|||||
|
10.23#
|
10-K
|
001-35676
|
2/27/2017
|
10.28
|
|||||
|
10.24#
|
10-Q
|
001-35676
|
8/9/2017
|
10.2
|
|||||
|
10.25#
|
|
10-Q
|
001-35676
|
8/9/2017
|
10.3
|
||||
|
21.1
|
X
|
||||||||
88
|
Previously Filed
|
|||||||||
|
Exhibit
No.
|
Description
|
Form
|
File No.
|
Filing Date
|
Exhibit
|
Filed Herewith
|
|||
|
23.1
|
X
|
||||||||
|
24.1
|
X
|
||||||||
|
31.1
|
X
|
||||||||
|
31.2
|
X
|
||||||||
|
32.1*
|
X
|
||||||||
|
101.INS+
|
XBRL Instance Document
|
X
|
|||||||
|
101.SCH+
|
XBRL Taxonomy Extension Schema Document
|
X
|
|||||||
|
101.CAL+
|
XBRL Taxonomy Extension Calculation Linkbase Document
|
X
|
|||||||
|
101.DEF+
|
XBRL Taxonomy Extension Definition Linkbase Document
|
X
|
|||||||
|
101.LAB+
|
XBRL Taxonomy Extension Label Linkbase Document
|
X
|
|||||||
|
101.PRE+
|
XBRL Taxonomy Extension Presentation Linkbase Document
|
X
|
|||||||
_______________
|
*
|
Exhibit 32.1 is being furnished and shall not be deemed to be “filed” for purposes of Section 18 of the Securities Exchange Act of 1934, as amended, or otherwise subject to the liability of that section, nor shall such exhibit be deemed to be incorporated by reference in any registration statement or other document filed under the Securities Act of 1933, as amended, except as otherwise specifically stated in such filing.
|
|
#
|
Indicates management contract or compensatory plan or arrangement.
|
|
†
|
Portions of this exhibit (indicated by asterisks) have been omitted pursuant to a request for confidential treatment and this exhibit has been filed separately with the SEC.
|
|
+
|
XBRL information is furnished and not filed for purposes of Sections 11 and 12 of the Securities Act of 1933, as amended, and Section 18 of the Securities Exchange Act of 1934, as amended, and is not subject to liability under those sections, is not part of any registration statement or prospectus to which it relates and is not incorporated or deemed to be incorporated by reference into any registration statement, prospectus or other document.
|
89
TABLE OF CONTENTS
Part IItem 1. BusinessItem 1A. Risk FactorsItem 1B. Unresolved Staff CommentsItem 2. PropertiesItem 3. Legal ProceedingsItem 4. Mine Safety DisclosuresPart IIItem 5. Market For Registrant's Common Equity, Related Stockholder Matters and Issuer Purchases Of Equity SecuritiesItem 6. Selected Financial DataItem 7. Management S Discussion and Analysis Of Financial Condition and Results Of OperationsItem 7A. Quantitative and Qualitative Disclosures About Market RiskItem 8. Financial Statements and Supplementary DataItem 9. Changes in and Disagreements with AccountantsItem 9A. Controls and ProceduresItem 9B. Other InformationPart IIIItem 10. Directors, Executive Officers and Corporate GovernanceItem 11. Executive CompensationItem 12. Security Ownership Of Certain Beneficial Owners and Management and Related Stockholder MattersItem 13. Certain Relationships and Related Transactions, and Director IndependenceItem 14. Principal Accounting Fees and ServicesPart IVItem 15. Exhibits, Financial Statement Schedules