PRUDENTIAL FINANCIAL INC
10-Ks and 10-Qs
|
|
|
|
|
|
|
|
|
|
|
|
|
|
|
|
|
|
|
|
|
|
|
|
|
|
|
|
|
|
|
|
|
|
|
|
|
|
|
|
|
|
|
|
|
|
|
|
|
|
|
|
|
|
|
|
UNITED STATES
SECURITIES AND EXCHANGE COMMISSION
Washington, D.C. 20549
__________________________________________
FORM 10-K
|
ý
|
ANNUAL REPORT PURSUANT TO SECTION 13 OR 15(d) OF THE SECURITIES EXCHANGE ACT OF 1934
|
FOR THE FISCAL YEAR ENDED
DECEMBER 31, 2018
OR
|
¨
|
TRANSITION REPORT PURSUANT TO SECTION 13 OR 15(d) OF THE SECURITIES EXCHANGE ACT OF 1934
|
FOR THE TRANSITION PERIOD FROM TO
COMMISSION FILE NUMBER 001-16707
____________________________________________
Prudential Financial, Inc.
(Exact Name of Registrant as Specified in its Charter)
|
New Jersey
|
|
22-3703799
|
|
(State or Other Jurisdiction of
Incorporation or Organization)
|
|
(I.R.S. Employer
Identification Number)
|
751 Broad Street
Newark, New Jersey 07102
(973) 802-6000
(Address and Telephone Number of Registrant’s Principal Executive Offices)
SECURITIES REGISTERED PURSUANT TO SECTION 12(b) OF THE ACT:
|
Title of Each Class
|
|
Name of Each Exchange on Which Registered
|
|
Common Stock, Par Value $.01
|
|
New York Stock Exchange
|
|
5.625% Junior Subordinated Notes
|
New York Stock Exchange
|
|
SECURITIES REGISTERED PURSUANT TO SECTION 12(g) OF THE ACT: NONE
Indicate by check mark if the registrant is a well-known seasoned issuer, as defined in Rule 405 of the Securities Act. Yes
x
No
¨
Indicate by check mark if the registrant is not required to file reports pursuant to Section 13 or Section 15(d) of the Act. Yes
¨
No
x
Indicate by check mark whether the registrant (1) has filed all reports required to be filed by Section 13 or 15(d) of the Securities Exchange Act of 1934 during the preceding 12 months (or for such shorter period that the registrant was required to file such reports), and (2) has been subject to such filing requirements for the past 90 days. Yes
x
No
¨
Indicate by check mark whether the registrant has submitted electronically every Interactive Data File required to be submitted pursuant to Rule 405 of the Regulation S-T (§232.405 of this chapter) during the preceding 12 months (or for such shorter period that the registrant was required to submit such files). Yes
x
No
¨
Indicate by check mark if disclosure of delinquent filers pursuant to Item 405 of Regulation S-K is not contained herein, and will not be contained, to the best of registrant’s knowledge, in definitive proxy or information statements incorporated by reference in Part III of this Form 10-K or any amendment to this Form 10-K.
¨
Indicate by check mark whether the registrant is a large accelerated filer, an accelerated filer, a non-accelerated filer, a smaller reporting company, or an emerging growth company. See the definitions of “large accelerated filer,” “accelerated filer,” “smaller reporting company” and “emerging growth company” in Rule 12b-2 of the Exchange Act.
Large accelerated filer
x
Accelerated filer
¨
Non-accelerated filer
¨
Smaller reporting company
¨
Emerging growth company
¨
If an emerging growth company, indicate by check mark if the registrant has elected not to use the extended transition period for complying with any new or revised financial accounting standards provided pursuant to Section 13(a) of the Exchange Act.
¨
Indicate by check mark whether the registrant is a shell company (as defined in Rule 12b-2 of the Exchange Act). Yes
¨
No
x
As of June 30, 2018, the aggregate market value of the registrant’s Common Stock (par value $0.01) held by non-affiliates of the registrant was
$39.06 billion
and
418 million
shares of the Common Stock were outstanding. As of January 31, 2019, 409 million shares of the registrant’s Common Stock (par value $0.01) were outstanding.
DOCUMENTS INCORPORATED BY REFERENCE
Part III of this Form 10-K incorporates by reference certain information from the Registrant’s Definitive Proxy Statement for the Annual Meeting of Shareholders to be held on May 14, 2019, to be filed by the Registrant with the Securities and Exchange Commission pursuant to Regulation 14A not later than 120 days after the year ended
December 31, 2018
.
TABLE OF CONTENTS
|
|
|
|
Page
|
|
PART I
|
Item 1.
|
||
|
Item 1A.
|
|||
|
Item 1B.
|
|||
|
Item 2.
|
|||
|
Item 3.
|
|||
|
Item 4.
|
|||
|
PART II
|
Item 5.
|
||
|
Item 6.
|
|||
|
Item 7.
|
|||
|
Item 7A.
|
|||
|
Item 8.
|
|||
|
Item 9.
|
|||
|
Item 9A.
|
|||
|
Item 9B.
|
|||
|
PART III
|
Item 10.
|
||
|
Item 11.
|
|||
|
Item 12.
|
|||
|
Item 13.
|
|||
|
Item 14.
|
|||
|
PART IV
|
Item 15.
|
||
|
Item 16.
|
|||
Forward-Looking Statements
Certain of the statements included in this Annual Report on Form 10-K constitute forward-looking statements within the meaning of the U.S. Private Securities Litigation Reform Act of 1995. Words such as “expects,” “believes,” “anticipates,” “includes,” “plans,” “assumes,” “estimates,” “projects,” “intends,” “should,” “will,” “shall” or variations of such words are generally part of forward-looking statements. Forward-looking statements are made based on management’s current expectations and beliefs concerning future developments and their potential effects upon Prudential Financial, Inc. and its subsidiaries. There can be no assurance that future developments affecting Prudential Financial, Inc. and its subsidiaries will be those anticipated by management. These forward-looking statements are not a guarantee of future performance and involve risks and uncertainties, and there are certain important factors that could cause actual results to differ, possibly materially, from expectations or estimates reflected in such forward-looking statements, including, among others: (1) losses on investments or financial contracts due to deterioration in credit quality or value, or counterparty default; (2) losses on insurance products due to mortality experience, morbidity experience or policyholder behavior experience that differs significantly from our expectations when we price our products; (3) changes in interest rates, equity prices and foreign currency exchange rates that may (a) adversely impact the profitability of our products, the value of separate accounts supporting these products or the value of assets we manage, (b) result in losses on derivatives we use to hedge risk or increase collateral posting requirements and (c) limit opportunities to invest at appropriate returns; (4) guarantees within certain of our products which are market sensitive and may decrease our earnings or increase the volatility of our results of operations or financial position; (5) liquidity needs resulting from (a) derivative collateral market exposure, (b) asset/liability mismatches, (c) the lack of available funding in the financial markets or (d) unexpected cash demands due to severe mortality calamity or lapse events; (6) financial or customer losses, or regulatory and legal actions, due to inadequate or failed processes or systems, external events and human error or misconduct such as (a) disruption of our systems and data, (b) an information security breach, (c) a failure to protect the privacy of sensitive data or (d) reliance on third-parties; (7) changes in the regulatory landscape, including related to (a) financial sector regulatory reform, (b) changes in tax laws, (c) fiduciary rules and other standards of care, (d) U.S. state insurance laws and developments regarding group-wide supervision, capital and reserves, (e) insurer capital standards outside the U.S. and (f) privacy and cybersecurity regulation; (8) technological changes which may adversely impact companies in our investment portfolio or cause insurance experience to deviate from our assumptions; (9) ratings downgrades; (10) market conditions that may adversely affect the sales or persistency of our products; (11) competition; and (12) reputational damage. Prudential Financial, Inc. does not undertake to update any particular forward-looking statement included in this document. See “Risk Factors” included in this Annual Report on Form 10-K for discussion of certain risks relating to our businesses and investment in our securities.
Throughout this Annual Report on Form 10-K, “Prudential Financial” and the “Registrant” refer to Prudential Financial, Inc., the ultimate holding company for all of our companies. “Prudential Insurance” refers to The Prudential Insurance Company of America. “Prudential,” the “Company,” “we” and “our” refer to our consolidated operations.
PART I
|
ITEM 1.
|
BUSINESS
|
Table of Contents
|
|
Page
|
1
Overview
Prudential Financial, Inc., a financial services leader with approximately
$1.377 trillion
of assets under management as of December 31, 2018, has operations in the United States, Asia, Europe and Latin America. Through our subsidiaries and affiliates, we offer a wide array of financial products and services, including life insurance, annuities, retirement-related products and services, mutual funds and investment management. We offer these products and services to individual and institutional customers through proprietary and third-party distribution networks. Our principal executive offices are located in Newark, New Jersey, and our common stock is publicly traded on the New York Stock Exchange under the ticker symbol “PRU”.
On December 18, 2001, Prudential Insurance converted from a mutual life insurance company owned by its policyholders to a stock life insurance company and became a wholly-owned subsidiary of Prudential Financial. The demutualization was carried out under Prudential Insurance’s Plan of Reorganization, which required us to establish and operate a regulatory mechanism known as the “Closed Block.” The Closed Block includes certain in-force participating insurance and annuity products and corresponding assets that are used for the payment of benefits and policyholders’ dividends on these products, as well as certain related assets and liabilities.
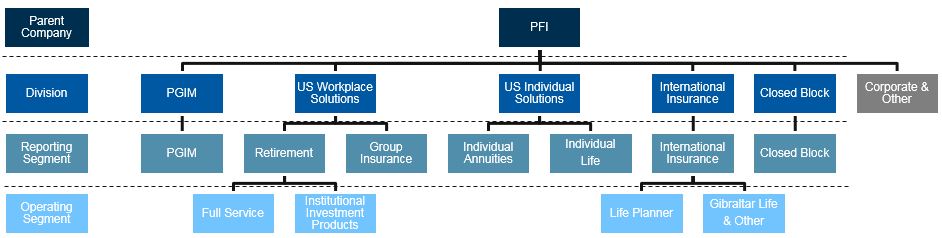
Our principal operations are comprised of five divisions, which together encompass seven segments, and our Corporate and Other operations. The PGIM division is comprised of our PGIM segment (formerly named the “Investment Management” segment). The U.S. Workplace Solutions division consists of our Retirement and Group Insurance segments. The U.S. Individual Solutions division consists of our Individual Annuities and Individual Life segments. The International Insurance division consists of our International Insurance segment, and the Closed Block division consists of our Closed Block segment. Our Corporate and Other operations include corporate items and initiatives that are not allocated to business segments and businesses that have been or will be divested or placed in run-off. See Note 21 to the Consolidated Financial Statements for revenues, income and loss, and total assets by segment.
Our strategy centers on our mix of high-quality protection, retirement and investment management businesses which creates growth potential due to earnings diversification and the opportunity to provide customers with integrated cross-business solutions, as well as capital benefits from a balanced risk profile. We are well positioned to meet the needs of customers and tap into significant market opportunities through our U.S. Financial Wellness businesses (represented by our U.S. Workplace Solutions and U.S. Individual Solutions Divisions), PGIM (our investment management business) and our International Insurance business. We see an opportunity to address the evolving needs of individual customers, workplace clients, and society at large through our increasingly important financial wellness solutions. We possess the key components to execute on this strategy, including a workplace platform covering twenty million individuals; solutions that cover protection, retirement, savings, income, and investment needs; and a customer-centric approach with different ways to engage with our clients through multiple channels such as meeting with one of our financial advisors, calling or video-conferencing with an advisor, or interacting with us in a purely digital manner. Our goal is to meet our customers’ needs when, where and how they want. By leveraging technology and our scale, we aim to significantly expand the addressable market, build deeper and longer-lasting relationships with customers and clients, and make a meaningful difference in the financial wellness of their lives.
2
PGIM Segment
Provides asset management services related to public and private fixed income, public equity and real estate, commercial mortgage origination and servicing, and mutual funds and other retail services to institutional, private and sub-advisory clients (including mutual funds), insurance company separate accounts, government sponsored entities (e.g. Fannie Mae, the Federal Housing Administration and Freddie Mac) and our general account.
|
Products
Our products and services are offered through the following eight businesses:
•
PGIM Fixed Income
- provides global active asset management services across all public fixed income markets ranging from core conservative to relative value hedge fund strategies.
•
Jennison Associates
- provides active fundamental public equity and fixed income asset management services across an array of high-quality fixed income and growth, value, blend, global and specialty equity strategies.
•
QMA
- provides equity and global multi-asset solutions with a quantitative investing approach.
•
Prudential Capital Group
- provides private corporate financing across the risk spectrum including investment grade, high yield and mezzanine, and offers a variety of products to its investors.
•
PGIM Real Estate Finance
- provides commercial mortgage origination and asset management services.
•
PGIM Real Estate
- provides a broad range of public and private real estate equity investment services utilizing deep knowledge of local and regional markets.
•
PGIM Investments
- develops, distributes and services investment management products primarily utilizing PGIM’s proprietary asset management expertise in the U.S. and European retail markets offering a suite of retail investment products covering a wide array of investment styles and objectives.
•
PGIM Global Partners
- operates an asset management business in Taiwan and has interests in asset management operating joint ventures in China, India and Italy. Each of these businesses offers mutual funds and serves individual and institutional investors and clients.
We also make seed and co-investments to support the creation and management of funds offered to third-party investors. Other strategic investments are made with the intention to sell or syndicate to investors, including our general account, or for placement in funds and structured products that we offer and manage (seed investments). We also make loans to, and guarantee obligations of, our managed funds that are secured by equity commitments from investors or assets of the funds.
|
Marketing and Distribution
We primarily distribute products through the following channels:
•
Institutional
◦
Proprietary sales force of each PGIM business with independent marketing and client service teams.
◦
PGIM's Institutional Relationship Group, which develops relationships with and introduces PGIM's broad capabilities to large institutions globally.
◦
Institutional asset management services through the Retirement Segment.
•
Retail
◦
Assets under management from distribution channels associated with other Prudential business segments.
◦
Third-party networks and product manufacturers/distributors who include our investment options in their products and platforms.
◦
Licensed sales professionals within Prudential Advisors, Prudential’s proprietary nationwide sales organization.
•
General account
◦
Provide investment management services across a broad array of asset classes for our general account.
|
3
PGIM Segment (Continued)
|
Revenues and Profitability
Our revenues primarily come from:
•
Asset management fees which are typically calculated based upon a percentage of assets under management. In certain asset management arrangements, we also receive performance-based incentive fees when the return on the managed assets exceeds certain benchmark returns or other performance targets.
•
Transaction fees earned as a percentage of the transaction price associated with the sale or purchase of assets in certain funds, primarily related to real estate and private fixed income.
•
Investment returns from strategic investing.
•
Revenues from commercial mortgage origination and servicing.
Our profitability is substantially impacted by:
•
Macro market movement (e.g. interest rates and equity market performance).
•
Our ability to achieve investment returns above the target benchmarks.
•
Our ability to attract and retain customer investments.
|
Competition
We compete with numerous asset managers and other financial institutions. For our investment management products, we compete based on a number of factors, including investment performance, strategy and process, talent, organizational stability and client relationships.
We offer products across multiple asset classes, with specialized investment teams that employ approaches designed to add value in each product area or asset class. Our organizational stability and robust institutional and retail businesses have helped attract and retain talent critical to delivering investment results for clients. Our private placement and commercial mortgage businesses compete based on price, terms, execution and the strength of our relationship with the borrower.
|
4
Retirement Segment
Provides retirement investment and income products and services to retirement plan sponsors in the public, private and not-for-profit sectors.
|
Products
Full Service
•
A broad range of products and services to assist in the design, delivery and administration of defined contribution, defined benefit and non-qualified retirement plans.
•
Recordkeeping and administrative services, actuarial advisory services, tailored participant education and communication services, comprehensive investment offerings and consulting services to assist retirement plan sponsors in managing fiduciary obligations.
•
Investment products including a variety of general and separate account stable value products, other fee-based products through which customer funds are held in separate accounts, retail mutual funds, institutional funds or bank collective trusts advised by affiliated and non-affiliated investment managers, as well as synthetic guaranteed investment contracts, and guaranteed minimum withdrawal benefit products.
Institutional Investment Products
•
Payout Annuities:
products that provide a predictable source of monthly income, generally for the life of the participant
◦
Pension risk transfer - non-participating group annuity insurance contracts issued to pension plan sponsors under which we assume all investment and actuarial risk associated with a group of specified participants within a plan in return for a premium typically paid as a lump-sum at inception.
◦
Pension risk transfer - longevity reinsurance contracts from which we earn a fee for assuming the longevity risk of pension plans that have been insured by third-parties. Premiums for these products are typically paid over the duration of the contract as opposed to a lump-sum at inception.
◦
Other products including structured settlements, voluntary income products and other group annuities.
|
Products (Continued)
•
Stable Value:
products where our obligations are backed by our general account, and we bear some or all of the investment and asset-liability management risk, depending on the product.
◦
Investment-only products - These products are for use in institutional capital markets and qualified plans primarily including fee-based wraps through which customers’ funds are held in a client-owned trust and investment results pass through to the customer. We earn fee revenue by providing a minimum interest rate guarantee backed by the general account.
◦
Guaranteed investment contracts and funding agreements - These products contain an obligation to pay interest at a specified rate and to repay principal at maturity or following contract termination.
◦
General Account and Separate Account Stable Value Products - In general, these products contain an obligation to pay interest at a specified rate for a specified period of time and to repay account balances over time, or market value upon contract termination. These products are either fully or partially participating, with annual or semi-annual rate resets subject to certain contractual minimums, giving effect to previous investment experience and other factors, depending on the products.
Marketing and Distribution
We primarily distribute products through the following channels:
Full Service
•
Proprietary sales and support teams
•
Third-party financial advisors, brokers, benefits consultants, and investment consultants
•
Direct to plan sponsors
Institutional Investment Products
•
Pension risk transfer through actuarial consultants and third-party brokers.
•
Structured settlements through third-party specialized brokers.
•
Voluntary income products and other group annuities through the defined contribution portion of our full service business and direct to plan sponsors.
•
Stable value products through proprietary sales force and third-party intermediaries.
|
5
Retirement Segment (Continued)
|
Underwriting and Pricing
Our revenues primarily come in the form of:
•
Premiums associated with insurance and reinsurance contracts and our payout annuities.
•
Policy charges and fee income associated with recordkeeping and other administrative services, and investment products (including fee-based stable value) that we offer. Policy charges and fees are primarily based on account values and/or number of participants.
•
Investment income (which contributes to the net spread over interest credited on certain stable value products and related expenses.)
Our profitability is substantially impacted by our ability to appropriately price our products. We price our products based on:
•
Pricing models that consider the investment environment and our risk, fees, expenses and profitability targets for our full service and institutional investment products.
◦
For products within our payout annuity area, our models also use assumptions for mortality and, if pertinent, early retirement risks. These assumptions may be less predictable in certain markets, and deviations in actual experience from pricing assumptions could affect the profitability of these products.
◦
For our investment-only stable value wrap product, our pricing risk is mitigated by several features:
▪
under the contracts, we have the ability to periodically reset the crediting rates, subject to a 0% minimum floor, as well as the ability to increase fees;
▪
generally, the contracts allow participants to withdraw funds at book value, while contractholder withdrawals occur at market value immediately or at book value over time; and
▪
our obligation is limited to payments that are in excess of the fund value.
|
Competition
We compete with other large, well-established insurance companies, asset managers, recordkeepers and diversified financial institutions.
Full Service
- we compete primarily based on:
•
pricing
•
the breadth of our service and investment offerings
•
the expertise of our employees
•
investment performance
•
our ability to offer product features to meet the retirement income needs of our clients
While we continue to have heightened pricing pressures (driven by competition, contractual limits on fee income, the influence of intermediaries and regulations requiring more standard and consistent fee disclosures across industry providers), this business has experienced strong persistency in recent years.
Institutional Investment Products
- we compete primarily based on:
•
our pricing
•
structuring capabilities
•
our ability to offer innovative product solutions and successfully execute large-scale transactions
Sales of institutional investment products are affected by competitive factors such as:
•
investment performance
•
company credit and financial strength ratings
•
product design
•
marketplace visibility
•
distribution capabilities
•
fees
•
crediting rates
•
customer service
We are a leader in providing innovative pension risk management solutions to plan sponsors and in the stable value wrap market. We believe the pension risk transfer market continues to offer attractive opportunities that are aligned with our expertise.
|
6
Group Insurance Segment
Provides a full range of group life, long-term and short-term group disability, and group corporate-, bank- and trust-owned life insurance in the U.S. primarily to institutional clients for use in connection with employee plans and affinity groups. Also sells accidental death and dismemberment and other ancillary coverages, and provides plan administrative services in connection with our insurance coverages.
|
Products
Group Life Insurance
•
Employer-paid and employee-paid coverages for term life insurance, group universal life, group variable universal life, basic and voluntary accidental death and dismemberment insurance, critical illness and accident insurance.
•
Many of our employee-paid coverages allow employees to retain their coverage when they change employers or retire, and we offer waiver of premium coverage where required premiums are waived in the event the insured suffers a qualifying disability.
•
Group corporate-, bank- and trust-owned life insurance products in the form of group variable life insurance contracts utilizing separate accounts. These products are typically used by large corporations to fund deferred compensation plans and benefit plans for retired employees.
Group Disability Insurance
•
Short-term and long-term group disability insurance which protects against loss of wages due to illness or injury. Short-term disability generally provides weekly benefits for three to six months while long-term disability benefits are typically paid monthly, following a waiting period and generally continue until the insured returns to work or reaches normal retirement age.
•
Plan administration and absence management services.
|
Marketing and Distribution
We primarily distribute products through a proprietary sales force organized around market segments in conjunction with employee benefit brokers and consultants.
|
7
Group Insurance Segment (Continued)
|
Underwriting and Pricing
Our revenues primarily come in the form of:
•
Premiums and policy charges for our group life and disability products.
•
Investment income (which contributes to the net spread over interest credited on our products and related expenses).
Our profitability is substantially impacted by our ability to appropriately price our products. We price our products based on:
•
Underwriting practices and rating systems that consider company, industry and/or other experience. We assess the risk profile of prospective insured groups; however, certain voluntary products or coverages may require underwriting on an individual basis. We are not obligated to accept any individual certificate application and may require a prospective insured to submit evidence of insurability.
•
The expected pay-out of benefits and other costs that we calculate using assumptions for mortality and morbidity rates, interest rates and expenses, depending upon the specific product features. On many of our group policies, we provide multiple year premium rate guarantees, which can contribute to fluctuations in profitability. For certain policies with experience-rated premium return provisions, the final premium is adjusted to reflect the group policyholder’s actual experience during the past year. For these policies, the group contractholder bears some of the risk, or receives some of the benefit, associated with claim experience fluctuations, thus lessening the fluctuations in profitability.
|
Competition
We compete with other large, well-established life and health insurance providers in mature markets. We compete primarily based on brand recognition, service capabilities, customer relationships, financial strength, range of product offerings and price. Pricing of group insurance products is reflective of the large number of competitors in the marketplace. The majority of our premiums are derived from large corporations, affinity groups or other organizations having over 5,000 insured individuals, which we refer to as the National segment. We are also seeking to grow our client base with institutions that have between 100 and 5,000 individuals, which we refer to as the Premier segment. Employee-paid coverage is important as employers attempt to control costs and shift benefit decisions and funding to employees who continue to value benefits offered at the workplace. Our profitability is dependent, in part, on the voluntary coverage marketplace, which will be affected by future employment and compensation rates.
|
8
Individual Annuities Segment
Develops and distributes individual variable and fixed annuity products, primarily to the U.S. mass affluent (households with investable assets or annual income in excess of $100,000) and affluent (households with investable assets in excess of $250,000) markets with a focus on innovative product design and risk management strategies.
|
Products
We offer a variety of products to serve different retirement needs and goals.
Variable Annuities
•
The Prudential Premier
®
Retirement Variable Annuity with Highest Daily Lifetime Income (“HDI”) offers lifetime income based on the highest daily account value plus a compounded deferral credit.
•
Prudential Defined Income
®
(“PDI”) Variable Annuity provides for guaranteed lifetime withdrawal payments, but restricts contractholder investment to a single bond sub-account within the separate accounts. PDI includes a living benefit rider which provides for a specified lifetime income withdrawal rate applied to purchase payment(s) paid, subject to annual roll-up increases until lifetime withdrawals commence, but does not have a highest daily benefit feature as discussed below.
•
Prudential Premier
®
Investment Variable Annuity (“PPI”) offers tax-deferred asset accumulation, annuitization options and an optional death benefit that guarantees the contractholder’s beneficiary a return of total purchase payments made to the contract, adjusted for any partial withdrawals, upon death.
•
Prudential Premier
®
Retirement Variable Annuity with Legacy Protection Plus (“LPP”) provides an optional enhanced death benefit based on the purchase payments rolling up at a preset rate on an annual basis until certain events occur, such as the death of the first owner (or annuitant if entity-owned) or the roll-up cap is reached. LPP cannot be elected together with any of the other optional living or death benefits we offer.
Fixed Annuities:
•
In January 2018, the Company launched PruSecure
SM
,
a single premium fixed index annuity, which allows the contractholder to allocate all or a portion of their account balance into an index-based strategy, such as the S&P 500. The index-based strategy provides interest or an interest component linked to, but not an investment in, the selected index, and its performance over the elected term (i.e., 1, 3 or 5 years), subject to certain contractual minimums and maximums.
•
In March 2018, the Company launched Guaranteed Income For Tomorrow (“GIFT”)
®
, a deferred income annuity. Each contribution purchases increments of guaranteed lifetime income that starts on a future date chosen at issue by the owner and continues for life.
•
Prudential Immediate Income Annuity (“PIIA”), a single premium immediate annuity, provides a regular stream of benefit payments. The payments are guaranteed and cannot be changed, and are higher than those guaranteed on products that provide liquidity.
|
Marketing and Distribution
Our distribution efforts, which are supported by a network of internal and external wholesalers, are executed through a diverse group of distributors including:
•
Third-party broker-dealers
•
Banks and wirehouses
•
Independent financial planners
•
Financial professionals, including those associated with Prudential Advisors, Prudential’s proprietary nationwide sales organization
•
Direct response solicitation through our Group Insurance business and online (specifically for our GIFT product)
|
9
Individual Annuities Segment (Continued)
|
Underwriting and Pricing
Our revenues primarily come in the form of:
•
Fee income from asset management fees, as well as service fees, representing administrative service and distribution fees from many of our proprietary and non-proprietary mutual funds. The asset management fees are determined as a percentage of the average assets of our proprietary mutual funds in our variable annuity products (net of sub-advisory expenses related to non-proprietary sub-advisors).
•
Policy charges and fee income representing mortality, expense and other fees for various insurance-related options and features based on the average daily net asset value of the annuity separate accounts, account value, premium, or guaranteed value, as applicable.
•
Investment income (which contributes to the net spread over interest credited on certain of our products and related expenses).
Our profitability is substantially impacted by our ability to appropriately price our products. We price our products based on:
•
An evaluation of the risks assumed and consideration of applicable risk management strategies, including hedging and reinsurance costs.
•
Assumptions regarding investment returns and contractholder behavior, including persistency (the probability that a contract will remain in force), benefit utilization and the timing and efficiency of withdrawals for contracts with living benefit features, as well as other assumptions.
|
Competition
We are among the industry’s largest providers of individual annuities and we compete with other providers of retirement savings and accumulation products, including large, well-established insurance and financial services companies. We believe our competitive advantage lies primarily in our innovative product features and our risk management strategies as well as brand recognition, financial strength, the breadth of our distribution platform and our customer service capabilities.
|
10
Individual Life Segment
Develops and distributes term life, variable life and universal life insurance products primarily to the U.S. mass middle (households with investable assets in excess of $25,000 or annual income in excess of $50,000), mass affluent (households with investable assets or annual income in excess of $100,000) and affluent (households with investable assets in excess of $250,000) with a focus on providing life insurance solutions to protect individuals, families and businesses and to support estate and wealth transfer planning.
|
Products
We offer a variety of products that serve different protection needs and goals.
Term Life - coverage for a specified number of years with a guaranteed tax-advantaged death benefit
•
Most of our term life policies offer an income tax-free death benefit, guaranteed premiums that will stay the same during the level-premium period and access to the death benefit while the policyholder is still alive to help them if they become terminally ill.
•
Most of our term life policies offer a conversion option that allows the policyholder to convert the policy into a permanent policy that can potentially cover the insured for life.
Variable Life - permanent coverage for life with potential to accumulate policy cash value based on underlying investment options
•
Our variable life policies offer flexibility in how much and when the policyholder pays premiums and the potential to accumulate cash value through a choice of over 50 underlying investment options or a fixed rate option.
•
We offer three types of variable life policies that, in addition to the death benefit, are tailored to prioritize different goals such as protection with moderate risk, growth with higher risk or legacy giving.
Universal Life - permanent coverage for life with the potential to accumulate policy cash value
•
Our universal life policies offer flexibility in how much and when the policyholder pays premiums and the potential to accumulate cash value in an account that earns interest based on a crediting rate determined by the Company subject to contractual minimums.
•
Guaranteed universal life policies provide a guarantee that the policy will remain in force when it would otherwise lapse due to insufficient cash value.
•
Indexed universal life policies provide interest credited to the cash value that is linked to, but not an investment in, the S&P 500® - index performance over a 1-year period subject to certain participation rates and contractual minimums/maximums.
|
Marketing and Distribution
We primarily distribute products through the following two channels:
•
Third-party distribution
◦
Independent brokers
◦
Banks and wirehouses
◦
General agencies and producer groups
•
Prudential Advisors
◦
Prudential’s proprietary nationwide sales organization that distributes Prudential life insurance, annuities and investment products with proprietary and non-proprietary investment options as well as select insurance and investment products from other carriers.
◦
Offers certain retail brokerage and retail investment advisory services (through our dually registered broker-dealer and investment advisor, Pruco Securities, LLC) including brokerage accounts, discretionary and non-discretionary investment advisory programs and financial planning services.
◦
Continues to execute a solutions-oriented business model centered around client relationships, while strengthening and driving Prudential’s brand promise across the country.
◦
Receives a market based allowance from other Prudential business segments for distributing their products which is eliminated between the segments in consolidation.
|
11
Individual Life Segment (Continued)
|
Underwriting and Pricing
Our revenues primarily come in the form of:
•
Premiums that are fixed or flexible in accordance with the terms of the policies.
•
Policy charges and fee income consisting of in-force policy- and/or asset-based fees.
•
Investment income (which contributes to the net spread over interest credited on our products and related expenses).
Our profitability is substantially impacted by our ability to appropriately price our products. We price our products based on:
•
Our assumptions of mortality and morbidity, persistency, interest rates, expenses, premium payment patterns, separate account fund performance, product generated tax deductions, as well as the level, cost and availability of financing for certain statutory reserves.
|
Competition
We compete with other large, well-established life insurance companies in a mature market. We compete primarily based on price, service, including the speed and ease of underwriting, distribution channel relationships, brand recognition and financial strength. Due to the large number of competitors, pricing is competitive. We periodically adjust product prices and features based on the market and our strategy, with a goal of managing the Individual Life business for steady, consistent sales growth across a balanced product portfolio and to avoid over-concentration in any one product type.
|
12
International Insurance Segment
Develops and distributes life insurance, retirement products and certain accident and health products with fixed benefits to the mass affluent and affluent markets through our Life Planner operations in Japan, Korea, Taiwan, Brazil, Argentina and Mexico. Also provides similar products to the broad middle income and mass affluent markets across Japan, our joint ventures in Chile, Malaysia, India and Indonesia, and our strategic investment in Ghana through multiple distribution channels including banks, independent agencies and Life Consultants associated with our Gibraltar Life and Other operations.
|
Products
Our products are classified into the following four categories:
Life Insurance Protection Products
- include various traditional whole life products that provide either level or increasing coverage, and that offer limited or lifetime premium payment options. We also offer increasing, decreasing and level benefit term insurance products that provide coverage for a specified time period, as well as protection-oriented variable universal life products. Some of these protection products are denominated in U.S. dollars and some are sold as bundled products which, in addition to death protection, include health benefits or savings elements.
Retirement Products
- include retirement income products which combine insurance protection similar to term life with a lifetime income stream which commences at a predefined age, savings-oriented variable universal life products which provide a non-guaranteed return linked to an underlying investment portfolio of equity and fixed income funds selected by the customer, and endowments which provide payment of the face amount on the earlier of death or policy maturity.
Annuity Products
- primarily represented by U.S. dollar- and Australian dollar-denominated fixed annuities sold by our Gibraltar Life operations in Japan, and Korean won- and U.S. dollar-denominated variable annuities sold by our Life Planner operation in Korea. Sales and surrenders of non-yen products can be sensitive to foreign currency relationships which are impacted by, among other things, the comparative interest rates in the respective countries. Most of our fixed annuity products impose a market value adjustment if the contract is not held to maturity.
Accident and Health Products
- provide benefits to cover accidental death and dismemberment, hospitalization, surgeries, and cancer and other dread diseases, often sold as supplementary riders and not as stand-alone products. We also offer waiver of premium coverage where required premiums are waived in the event the customer suffers a qualifying disability.
|
Marketing and Distribution
Proprietary agent models:
•
Life Planners
- focuses on selling protection-oriented life insurance products on a needs basis to mass affluent and affluent customers, as well as retirement-oriented products to small businesses. We believe that our recruiting and selection process, training programs and compensation packages are key to the Life Planner model and have helped our Life Planner operations achieve higher levels of agent retention, agent productivity and policy persistency.
•
Life Consultants
- is a proprietary distribution force for products offered by our Gibraltar Life operations. Their focus is to provide individual protection products to the broad middle income market, primarily in Japan, particularly through relationships with affinity groups. Our Life Consultant operation is based on a variable compensation plan designed to improve productivity and persistency that is similar to compensation plans in our Life Planner operations.
Third-party channels:
•
Bank Distribution Channel
- primarily consists of life insurance products intended to provide savings features, premature death protection and estate planning benefits as well as fixed annuity products primarily denominated in U.S. dollars and Australian dollars. We view the bank distribution channel as an adjunct to our core Life Planner and Life Consultant distribution channels. A significant portion of our sales in Japan through our bank channel distribution are derived through a single Japanese mega-bank; however, we have relationships with each of Japan’s four largest banks as well as many regional banks, and we continue to explore opportunities to expand our distribution capabilities through this channel, as appropriate.
•
Independent Agency Distribution Channel
- sells protection products and high cash value products for retirement benefits through the business market and also sells a variety of other products including protection, medical and fixed annuity products through the individual market. Our focus is to maintain a diverse mix of independent agency relationships including corporate agencies and other independent agencies with a balanced focus on individual and business markets.
|
13
International Insurance Segment (Continued)
|
Underwriting and Pricing
Our revenues primarily come in the form of:
•
Premiums that are fixed or flexible in accordance with the terms of the policies.
•
Policy charges and fee income consisting of in-force policy- and/or asset-based fees.
•
Investment income (which contributes to the net spread over interest credited on our products and related expenses).
Our profitability is substantially impacted by our ability to appropriately price our products. We price our products based on:
•
Local regulation that is generally more restrictive for product offerings, pricing and structure than U.S. insurance regulation. Each International Insurance operation has its own underwriting department that employs variations of U.S. practices in underwriting individual policy risks. To the extent permitted by local regulation, we base premiums and policy charges for our products on expected death and morbidity benefits, surrender benefits, expenses, required reserves, interest rates, policy persistency and premium payment patterns. In setting underwriting limits, we also consider local industry standards to prevent adverse selection and to stay abreast of industry trends. In addition, we set underwriting limits together with each operation’s reinsurers.
•
Achieving a targeted rate of return for each country, taking into account the country-specific costs of capital, risks, and competitive environment. The profitability of our products is impacted by differences between actual mortality, morbidity, expense, and investment experience and the related assumptions used in pricing these policies. As a result, the profitability of our products can fluctuate from period to period. Changes in local tax laws may also affect profitability.
|
Competition
The life insurance markets in Japan and Korea are mature and pricing is competitive. Rather than competing primarily based on price, we generally compete on the basis of customer service, including our needs-based approach to selling, the quality and diversity of our distribution capabilities, and our financial strength. Demographic trends in Asia suggest an increasing opportunity for product innovation, introducing insurance products that allow for savings and income as a growing portion of the population prepares for retirement. The ability to sell through multiple and complementary distribution channels is also a competitive advantage; however, competition for sales personnel, as well as access to third-party distribution channels, is intense.
|
14
Corporate and Other Operations
Includes corporate items and initiatives that are not allocated to our business segments and businesses that have been or will be divested or placed in run-off, except for the Closed Block. Results of the Closed Block, along with certain related assets and liabilities, are reported as the Closed Block division separately from the divested and run-off businesses included in Corporate and Other Operations.
Corporate Operations -
consist primarily of: (1) capital that is not deployed in any business segment; (2) investments not allocated to business segments, including debt-financed investment portfolios, and tax credit and other tax-enhanced investments financed by business segments; (3) capital debt that is used or will be used to meet the capital requirements of the Company and the related interest expense; (4) our qualified and non-qualified pension and other employee benefit plans, after allocations to business segments; (5) corporate-level activities, after allocations to business segments, including strategic expenditures, corporate governance, corporate advertising, philanthropic activities, deferred compensation, and costs related to certain contingencies and enhanced regulatory supervision; (6) certain retained obligations relating to pre-demutualization policyholders; (7) our ownership interest in a life insurance joint venture in China; (8) our Capital Protection Framework; (9) the foreign currency income hedging program used to hedge certain non-U.S. dollar denominated earnings in our International Insurance segment; (10) the impact of intercompany arrangements with our PGIM segment to translate certain non-U.S. dollar-denominated earnings at fixed currency exchange rates; and (11) transactions with and between other segments, including the elimination of intercompany transactions for consolidation purposes.
Divested and Run-off Businesses -
reflect the results of businesses that have been, or will be, sold or exited, including businesses that have been placed in wind down status that do not qualify for “discontinued operations” accounting treatment under Accounting Principles Generally Accepted in the United States of America (“U.S. GAAP”). We exclude these results from our adjusted operating income. Divested and Run-off Businesses include:
|
•
|
Long-Term Care:
In 2012, we discontinued sales of our individual and group long-term care insurance products. We establish reserves for these products in accordance with U.S. GAAP. We use best estimate assumptions as of the most recent loss recognition date when establishing reserves for future policyholder benefits and expenses, including assumptions for morbidity, mortality, mortality improvement, persistency, expenses and interest rates. Our assumptions also include our estimate of the timing and amount of anticipated future premium rate increases and policyholder benefit reductions which will require approval by state regulatory authorities. Reserves also include claims reported but not yet paid and claims incurred but not yet reported.
|
|
•
|
Other:
|
|
◦
|
In 2018, we sold our Pramerica of Poland subsidiary.
|
|
◦
|
In 2018, we entered into a definitive agreement to sell our Pramerica of Italy subsidiary subject to regulatory approvals and customary closing conditions. In February 2019, the agreement was terminated and we continue to explore strategic alternatives.
|
|
◦
|
In 2018, we exited our PGIM Brazil operations including the sale of our minority interest in a Brazilian asset management joint venture.
|
|
◦
|
In 2008, we announced our intention to exit our financial advisory business, which consisted of our investment in a retail securities brokerage and clearing operations joint venture which we sold on December 31, 2009. Certain expenses relating to the businesses we originally contributed to the joint venture were retained, primarily for litigation and regulatory matters.
|
|
◦
|
In 2003, we sold our property and casualty insurance companies to Liberty Mutual Group (“Liberty Mutual”). We have reinsured Liberty Mutual for adverse loss development for specific property and casualty risks that they did not want to retain.
|
|
◦
|
In 1993, we ceased writing hospital expense and major medical policies. For our hospital expense and major medical policies, the 1996 Health Insurance Portability and Accountability Act guarantees renewal beyond age 65. Under certain circumstances, with appropriate approvals from state regulatory authorities, we are permitted to change the premiums charged for these policies if we can demonstrate the premiums have not been sufficient to pay claims.
|
|
◦
|
In the early 1990s we ceased our active engagement in the assumed life reinsurance market in the United States; however, we remain subject to mortality risk for certain assumed individual life insurance policies under the terms of the reinsurance treaties.
|
15
Closed Block Division
In connection with the demutualization in 2001, we ceased offering domestic participating individual life insurance and annuity products, under which policyholders are eligible to receive policyholder dividends reflecting experience. The liabilities for our individual in-force participating products were segregated, together with assets to be used exclusively for the payment of benefits and policyholder dividends, expenses and taxes with respect to these products, in the Closed Block. We selected the amount of assets that were expected to generate sufficient cash flow, together with anticipated revenues from the Closed Block policies, over the life of the Closed Block to fund payments of all policyholder benefits, expenses and taxes, and to provide for the continuation of the policyholder dividend scales in effect in 2000, assuming experience underlying such scales continued. No policies sold after demutualization have been added to the Closed Block, and its in-force business is expected to decline as we pay policyholder benefits in full.
The results of the Closed Block, along with certain related assets and liabilities, comprise the Closed Block division, which is treated as a divested business under our definition of adjusted operating income and reported separately from the other divested and run-off businesses that are included in our Corporate and Other operations.
As discussed in Note 14 to the Consolidated Financial Statements, if the performance of the Closed Block is more or less favorable than we originally assumed in funding, total dividends paid to Closed Block policyholders in the future may be greater or less than the total dividends that would have been paid to these policyholders if the policyholder dividend scales in effect in 2000 had been continued. Any experience in excess of amounts assumed may be available for distribution over time to Closed Block policyholders as part of policyholder dividends unless offset by future Closed Block experience that is less favorable than expected. This excess experience will not be available to shareholders. If the Closed Block has insufficient funds to make guaranteed policy benefit payments, such payments will be made from Prudential Insurance’s assets outside of the Closed Block. A policyholder dividend obligation liability is established for any excess experience. Each year, the Board of Directors of Prudential Insurance determines the dividends payable on participating policies for the following year based on the experience of the Closed Block, including investment income, net realized and unrealized investment gains and losses, mortality experience and other factors. See Note 21 to the Consolidated Financial Statements for revenues, income and loss, and total assets of the Closed Block division.
Our strategy is to maintain the Closed Block as required by our Plan of Reorganization over the time period of its gradual diminution as policyholder benefits are paid in full. We are permitted under the Plan of Reorganization, with the prior consent of the Commissioner of Banking and Insurance for the State of New Jersey, to enter into agreements to transfer all or any part of the risks under the Closed Block policies.
16
Seasonality of Key Financial Items
A majority of our reporting segments experience seasonality with respect to certain elements of their business. The following chart summarizes the key areas of seasonality by business.
|
First Quarter
|
Second Quarter
|
Third Quarter
|
Fourth Quarter
|
|
|
PGIM
|
Other related revenues tend to be highest(1)
|
|||
|
Retirement
|
Reserve gains tend to be highest
|
PRT sales are episodic and tend to be highest in third quarter and fourth quarter
|
||
|
Group
Insurance
|
Mortality tends to be unfavorable
Sales tend to be highest
|
|||
|
Individual
Annuities
|
||||
|
Individual
Life
|
Mortality tends to be unfavorable
|
Sales tend to be highest
|
||
|
International Insurance
|
Earnings tend to be highest due to higher annual premiums
|
|||
|
Corporate &
Other
|
Long-term and deferred compensation expenses tend to fluctuate with equity markets
and Prudential stock price
|
|||
|
All
Businesses
|
Impact of annual assumption update(2)
|
Expenses tend to be highest
|
||
__________
|
(1)
|
Other related revenues include incentive fees, transaction fees, strategic investing results and commercial mortgage revenues.
|
|
(2)
|
Impact of annual reviews and update of actuarial assumptions and other refinements.
|
17
Reinsurance
We regularly enter into reinsurance agreements as either the ceding entity or the assuming entity. As a ceding entity, exposure to the risks reinsured is reduced by transferring certain rights and obligations of the underlying insurance product to a counterparty. As an assuming entity, exposure to the risks reinsured is increased by assuming certain rights and obligations of the underlying insurance products from a counterparty. We enter into reinsurance agreements as the ceding entity for a variety of reasons but primarily to reduce exposure to loss, reduce risk volatility, provide additional capacity for future growth and for capital management purposes. Under ceded reinsurance, we remain liable to the underlying policyholder if a third-party reinsurer is unable to meet its obligations. On a Company-wide basis, we evaluate the financial condition of reinsurers and monitor the concentration of counterparty risk to mitigate this exposure. We enter into reinsurance agreements as the assuming entity as part of our normal product offerings (e.g., certain pension risk transfer products in the Retirement segment) or in order to facilitate an acquisition of a block of business.
The following table summarizes our use of reinsurance in each of our insurance reporting segments.
|
Segment
|
Primary type
of reinsurance
|
Purpose
|
|
Retirement
|
Assumed
|
Assumed reinsurance as part of our longevity reinsurance pension risk transfer product and in conjunction with our 2004 acquisition of CIGNA’s defined benefit and defined contribution business.
|
|
Group Insurance
|
Ceded
|
Ceded reinsurance on most products to limit losses from large claims, in response to client requests and for capital management purposes.
|
|
Individual Annuities
|
Ceded/Assumed
|
Ceded reinsurance to reduce exposure to our HDI v.3.0 variable annuity business issued between April 1, 2015 to December 31, 2016.
Assumed reinsurance in conjunction with our 2006 acquisition of The Allstate Corporation’s (“Allstate”) annuity business and internal ceded and assumed reinsurance as part of our risk and capital management activities.
|
|
Individual Life
|
Ceded/Assumed
|
Ceded reinsurance with both third-party reinsurers and affiliates covering a variety of products to mitigate mortality risk and for capital management purposes. On policies sold since 2000, we have reinsured a significant portion of the mortality risk assumed, with that portion varying over time depending on market factors and strategic objectives.
Assumed reinsurance in conjunction with our 2013 acquisition of the Hartford Life business.
|
|
International Insurance
|
Ceded
|
Ceded reinsurance with both third-party reinsurers and affiliates to mitigate mortality risk for certain protection products and for capital management purposes.
|
|
Closed Block
|
Ceded
|
Prudential Insurance reinsures substantially all of the outstanding liabilities of the Closed Block into a statutory guaranteed separate account of a wholly-owned subsidiary, Prudential Legacy Insurance Company of New Jersey (“PLIC”), primarily on a coinsurance basis. The reinsurance transaction provides a long-term and comprehensive capital framework for the Closed Block.
|
Intangible and Intellectual Property
We capture and protect the innovation in our financial services products by applying for federal business method patents and implementing trade secret controls, as appropriate. We also use numerous federal, state, common law and foreign servicemarks, including in particular “Prudential”, the “Prudential logo”, our “Rock” symbol and “PGIM”. We believe that the value associated with many of our patents and trade secrets, and the goodwill associated with many of our servicemarks are significant competitive assets.
Since 2004, we have had an agreement with Prudential plc of the United Kingdom (“U.K.”), with whom we have no affiliation, concerning the parties’ respective rights worldwide to use the names “Prudential” and “Pru.” The agreement restricts use of the “Prudential” and “Pru” name and mark in a number of countries outside the Americas, including Europe and most parts of Asia. Where these limitations apply, we combine our “Rock” symbol with alternative word marks. We believe that these limitations do not materially affect our ability to operate or expand internationally.
18
Regulation
Overview
Our businesses are subject to comprehensive regulation and supervision. The purpose of these regulations is primarily to protect our customers and the overall financial system and not necessarily our shareholders or debt holders. Many of the laws and regulations to which we are subject are regularly re-examined. Existing or future laws and regulations may become more restrictive or otherwise adversely affect our operations or profitability, increase compliance costs, or increase potential regulatory exposure. In recent years we have experienced, and expect to continue to experience, extensive changes in the laws and regulations, and regulatory frameworks applicable to our businesses in the U.S. and internationally. In particular, in October 2018 the Financial Stability Oversight Council (the “Council”) rescinded the Company’s designation as a non-bank financial company (a “Designated Financial Company”) subject to supervision by the Board of Governors of the Federal Reserve System (“FRB”) under the Dodd-Frank Wall Street Reform and Consumer Protection Act (“Dodd-Frank”) as discussed below. We cannot predict how current or future initiatives will further impact existing laws, regulations and regulatory frameworks.
In our international businesses, regulations may apply heightened requirements to non-domestic companies, which can reduce our flexibility as to intercompany transactions, investments and other aspects of business operations and adversely affect our liquidity and profitability. In some instances, regulators of a particular country may impose different, or more rigorous laws and requirements than in the U.S. or other countries to protect customers or their financial system from perceived systemic risk, including regulations governing privacy, consumer protection, employee protection, corporate governance and capital adequacy. In addition, certain of our international operations face political, legal, operational and other risks that we do not face in the U.S., including the risk of discriminatory regulation, labor issues in connection with workers’ associations and trade unions, nationalization or expropriation of assets, price controls and currency exchange controls or other restrictions that limit our ability to transfer funds from these operations out of the countries in which they operate or to convert local currencies we hold into U.S. dollars or other currencies. Some jurisdictions in which we operate joint ventures restrict our maximum percentage of ownership, which exposes us to additional operational, compliance, legal and joint venture partner risks and limits our array of potential remedies in the event of a breach by a partner.
The primary regulatory frameworks applicable to the Company are described further below under the following section headings:
|
•
|
Dodd-Frank Wall Street Reform and Consumer Protection Act
|
|
◦
|
Rescission of Designation
|
|
◦
|
Initiatives Regarding Dodd-Frank and Financial Regulation
|
|
•
|
ERISA
|
|
•
|
Fiduciary Rules and other Standards of Care
|
|
•
|
U.S. State Insurance Holding Company Regulation
|
|
•
|
U.S. Insurance Operations
|
|
◦
|
State Insurance Regulation
|
|
◦
|
U.S. Federal and State Securities Regulation Affecting Insurance Operations
|
|
•
|
International Insurance Regulation
|
|
•
|
U.S. Investment and Retirement Products and Investment Management Operations
|
|
•
|
U.S. Securities and Commodity Operations
|
|
•
|
International Investment and Retirement Products and Investment Management Operations
|
|
•
|
Derivatives Regulation
|
|
•
|
Privacy and Cybersecurity Regulation
|
|
•
|
Anti-Money Laundering and Anti-Bribery Laws
|
|
•
|
Environmental Laws and Regulations
|
|
•
|
Unclaimed Property Laws
|
|
•
|
Taxation
|
|
◦
|
U.S. Taxation
|
|
◦
|
International Taxation
|
|
•
|
International and Global Regulatory Initiatives
|
Several of our domestic and foreign regulators participate in an annual supervisory college facilitated by the New Jersey Department of Banking and Insurance (“NJDOBI”). The purpose of the supervisory college is to promote ongoing supervisory coordination, facilitate the sharing of information among regulators and enhance each regulator’s understanding of the Company’s risk profile. The most recent supervisory college was held in October 2018.
19
Dodd-Frank Wall Street Reform and Consumer Protection Act
Rescission of Designation
As a result of the Council’s rescission of the Company’s Designated Financial Company status, the Company is no longer subject to supervision and examination by the FRB or to the prudential standards applicable to Designated Financial Companies under Dodd-Frank. Accordingly, the Company will no longer incur FRB supervisory fees (which totaled approximately $24 million in each of the last three years) or certain consulting and other costs associated with FRB supervision.
The Council maintains the authority to designate entities, including the Company, for FRB supervision if it determines that either (i) material financial distress at the entity, or (ii) the nature, scope, size, scale, concentration, interconnectedness, or mix of the entity’s activities, could pose a threat to domestic financial stability. The Company continues to believe it does not meet the standards for designation.
Initiatives Regarding Dodd-Frank and Financial Regulation
In November 2017, the U.S. Department of the Treasury released a report titled “Financial Stability Oversight Council Designations,” with recommendations on the Council’s standards and processes for the designation and continued designation of Designated Financial Companies. In addition, in October 2017, the U.S. Department of the Treasury released a report titled “A Financial System That Creates Economic Opportunities - Asset Management and Insurance” which recommended, among other things, that primary federal and state regulators should focus on potential systemic risks arising from products and activities, and on implementing regulations that strengthen the asset management and insurance industries as a whole, rather than focus on an entity-based regulatory regime. The report also affirmed the role of the U.S. state-based system of insurance regulation. From time to time Congress has also introduced legislation which if enacted, would amend certain provisions of Dodd-Frank, including by requiring the Council to prioritize the use of an activities-based approach to mitigate identified systemic risks.
We cannot predict whether the Treasury reports, new legislation or other initiatives aimed at revising Dodd-Frank and regulation of the financial system will ultimately form the basis for changes to laws or regulations impacting the Company.
ERISA
The Employee Retirement Income Security Act (“ERISA”) is a comprehensive federal statute that applies to U.S. employee benefit plans sponsored by private employers and labor unions. Plans subject to ERISA include pension and profit sharing plans and welfare plans, including health, life and disability plans. ERISA provisions include reporting and disclosure rules, standards of conduct that apply to plan fiduciaries and prohibitions on transactions known as “prohibited transactions,” such as conflict-of-interest transactions and certain transactions between a benefit plan and a party in interest. ERISA also provides for civil and criminal penalties and enforcement. Our insurance, investment management and retirement businesses provide services to employee benefit plans subject to ERISA, including services where we may act as an ERISA fiduciary. In addition to ERISA regulation of businesses providing products and services to ERISA plans, we become subject to ERISA’s prohibited transaction rules for transactions with those plans, which may affect our ability to enter transactions, or the terms on which transactions may be entered, with those plans, even in businesses unrelated to those giving rise to party in interest status.
Fiduciary Rules and Other Standards of Care
The Company and our distributors are subject to rules regarding the standard of care applicable to sales of our products and the provision of advice to our customers. In recent years, many of these rules have been revised or reexamined, as described below. We cannot predict whether any proposed or new amendments to the existing regulatory framework will ultimately become applicable to our businesses. Any new standards issued by the U.S. Department of Labor (“DOL”), the Securities and Exchange Commission (“SEC”), the National Association of Insurance Commissioners (“NAIC”) or state regulators may affect our businesses, results of operations, cash flows and financial condition.
DOL Fiduciary Rules
In June 2018 a Fifth Circuit Court of Appeals decision became effective that vacated rules issued by the DOL that redefined who would be considered a “fiduciary” for purposes of transactions with qualified plans, plan participants and Individual Retirement Accounts (“IRAs”), and generally provided that investment advice to a plan participant or IRA owner would be treated as a fiduciary activity. The rules adversely impacted sales in our annuities and retirement business and resulted in increased compliance costs prior to the rules being vacated. We cannot predict whether the DOL will issue any new fiduciary rules or what impact they would
20
have on the Company.
SEC Best Interest Regulation
In April 2018, the SEC proposed a package of rulemakings and interpretative guidance that would, among other things, require broker-dealers to act in the best interest of retail customers when recommending securities transactions or investment strategies to them. The proposals would also clarify the SEC’s views of the fiduciary duty that investment advisers owe to their clients. If enacted in their current form, we believe the primary impact of the proposals would be to our Individual Annuities, Retirement, PGIM and Individual Life segments and our Prudential Advisors distribution system, which we include in the results of our Individual Life segment.
U.S. State Standard of Care Regulation
The NAIC has formed an Annuity Suitability Working Group, which is developing proposed revisions to the model suitability rule applicable to the sale of annuities. Amendments to the model rule could ultimately form the basis of amendments to state insurance law suitability rules applicable to our business. In addition, certain state regulators and legislatures have adopted or are considering adopting best interest standards. For example, in July 2018, the New York State Department of Financial Services (“NY DFS”) issued an amendment to its suitability regulations which will impose a best-interest standard on the sale of annuity and life insurance products in New York. The amendments are scheduled to become effective for annuity products on August 1, 2019 and for life insurance products on February 1, 2020. In addition, in October 2018 the New Jersey Bureau of Securities issued a proposal that would impose a fiduciary standard on all New Jersey investment professionals.
Japan Standard of Care Regulation
Outside the U.S., in 2017 the Japanese Financial Services Agency (“FSA”) announced the “Principles of Fiduciary Duty,” a set of recommended general principles for businesses to adopt when performing client related financial services. The principles have been adopted by The Prudential Life Insurance Company Ltd. (“Prudential of Japan”), Gibraltar Life, and Prudential Gibraltar Financial Life Insurance Company, Ltd. (“PGFL”). The FSA encourages voluntary adoption of these fiduciary principles as a best practice, but adoption is not required by regulation. Companies’ policies regarding their fiduciary duties can be tailored based on their specific business, such as target clients and complexity of products. Once companies adopt the principles and establish a policy, they are required to implement measures to ensure their employees fulfill their fiduciary duties, and periodically assess the measures’ effectiveness.
U.S. State Insurance Holding Company Regulation
We are subject to the insurance holding company laws in the states where our insurance subsidiaries are domiciled, which currently include New Jersey, Arizona, Connecticut and Indiana, or are treated as commercially domiciled, such as New York. These laws generally require each insurance company directly or indirectly owned by the holding company to register with the insurance department in the insurance company’s state of domicile and to furnish annually financial and other information about the operations of companies within the holding company system, including an assessment of the group’s risk management and current and future solvency position. Generally, all transactions affecting the insurers in the holding company system must be fair and reasonable and, if material, require prior notice and approval or non-disapproval by the state’s insurance department.
Change of Control
Most states, including the states in which our U.S. insurance companies are domiciled, have insurance laws that require regulatory approval of a direct or indirect change of control of an insurer or an insurer’s holding company. Laws such as these that apply to us prevent any person from acquiring control of Prudential Financial or of our insurance subsidiaries unless that person has filed a statement with specified information with the insurance regulators and has obtained their prior approval. Under most states’ statutes, acquiring 10% or more of the voting stock of an insurance company or its parent company is presumptively considered a change of control, although such presumption may be rebutted. Accordingly, any person who acquires 10% or more of the voting securities of Prudential Financial without the prior approval of the insurance regulators of the states in which our U.S. insurance companies are domiciled will be in violation of these states’ laws and may be subject to injunctive action requiring the disposition or seizure of those securities by the relevant insurance regulator or prohibiting the voting of those securities and to other actions determined by the relevant insurance regulator. In addition, many state insurance laws require prior notification to state insurance departments of a change in control of a non-domiciliary insurance company doing business in that state.
Group-Wide Supervision
21
NJDOBI acts as the group-wide supervisor of Prudential Financial pursuant to New Jersey legislation that authorizes group-wide supervision of internationally active insurance groups (“IAIGs”). The law, among other provisions, authorizes NJDOBI to examine Prudential Financial and its subsidiaries, including by ascertaining the financial condition of the insurance companies for purposes of assessing enterprise risk. In accordance with this authority, NJDOBI receives information about the Company’s operations beyond those of its New Jersey domiciled insurance subsidiaries.
Additional areas of focus regarding group-wide supervision of insurance holding companies include the following:
•
Group Capital Calculation
. The NAIC has formed a working group to develop a U.S. group capital calculation using a risk-based capital (“RBC”) aggregation methodology. In constructing the calculation, the working group is considering group capital developments undertaken by the FRB and the International Association of Insurance Supervisors (“IAIS”). The working group plans to develop a proposed calculation and begin field testing in 2019.
•
Macroprudential Framework
. The NAIC has established a new initiative to develop a macroprudential framework intended to: (1) improve state insurance regulators’ ability to monitor and respond to the impact of external financial and economic risks on insurers; (2) better monitor and respond to risk emanating from or amplified by insurers that might be transmitted externally; and (3) increase public awareness of NAIC/state monitoring capabilities regarding macroprudential trends. As part of this initiative, the areas identified by the NAIC for potential enhancement include liquidity reporting and stress testing, resolution and recovery, capital stress testing, and counterparty exposure and concentration.
•
Examination
. State insurance departments conduct periodic examinations of the books and records, financial reporting, policy filings and market conduct of insurance companies domiciled in their states, generally once every three to five years. Examinations are generally carried out in cooperation with the insurance departments of other states under guidelines promulgated by the NAIC. As group-wide supervisor, NJDOBI, along with our other insurance regulators, has expanded the periodic examinations to cover Prudential and all of its subsidiaries. In June 2018, NJDOBI, along with the insurance regulators of Arizona, Connecticut and Indiana, completed their first global consolidated group-wide examination of Prudential and its subsidiaries for the five-year period ended December 31, 2016 and had no reportable findings.
We cannot predict what, if any, additional requirements and compliance costs any new group-wide standards will impose on Prudential Financial.
U.S. Insurance Operations
State insurance laws regulate all aspects of our U.S. insurance businesses, and state insurance departments in the fifty states, the District of Columbia and various U.S. territories and possessions monitor our insurance operations. Prudential Insurance is domiciled in New Jersey and its principal insurance regulatory authority is the NJDOBI. Our other U.S. insurance companies are principally regulated by the insurance departments of the states in which they are domiciled. Generally, our insurance products must be approved by the insurance regulators in the state in which they are sold. Our insurance products are substantially affected by federal and state tax laws.
State Insurance Regulation
State insurance authorities have broad administrative powers with respect to all aspects of the insurance business including: (1) licensing to transact business; (2) licensing agents; (3) admittance of assets to statutory surplus; (4) regulating premium rates for certain insurance products; (5) approving policy forms; (6) regulating unfair trade and claims practices; (7) establishing reserve requirements and solvency standards; (8) fixing maximum interest rates on life insurance policy loans and minimum accumulation or surrender values; (9) regulating the type, amounts and valuations of investments permitted; (10) regulating reinsurance transactions, including the role of captive reinsurers; and (11) other matters.
State insurance laws and regulations require our U.S. insurance companies to file financial statements with state insurance departments everywhere they do business in accordance with accounting practices and procedures prescribed or permitted by these departments. The operations of our U.S. insurance companies and accounts are subject to examination by those departments at any time.
Financial Regulation
Dividend Payment Limitations.
New Jersey insurance law and the insurance laws of the other states in which our insurance
22
companies are domiciled regulate the amount of dividends that may be paid by Prudential Insurance and our other U.S. insurance companies. See Note 15 to the Consolidated Financial Statements for additional information.
Risk-Based Capital.
We are subject to RBC requirements that are designed to enhance regulation of insurers’ solvency. The RBC calculation, which regulators use to assess the sufficiency of an insurer’s statutory capital, measures the risk characteristics of a company’s assets, liabilities and certain off-balance sheet items. In general, RBC is calculated by applying factors to various asset, premium, claim, expense and reserve items. Within a given risk category, these factors are higher for those items with greater underlying risk and lower for items with lower underlying risk. Insurers that have less statutory capital than required are considered to have inadequate capital and are subject to varying degrees of regulatory action depending upon the level of capital inadequacy.
Areas of the RBC framework that have been subject to reexamination or revision include the following:
•
Tax Act Changes
. In June 2018, the NAIC’s Capital Adequacy Task Force approved revisions to the RBC framework in respect of the Tax Cuts and Jobs Act of 2017 (the “Tax Act of 2017”). The revisions apply to our domestic life insurance companies’ RBC ratios as of December 31, 2018. For a discussion of the impact of the Tax Act of 2017 and these changes on our RBC ratios, see “Management’s Discussion and Analysis of Financial Condition and Results of Operations—Liquidity and Capital Resources—Capital—Insurance Regulatory Capital.”
•
Bond Factors
. The NAIC’s Investment Risk-Based Capital Working Group is developing updates to the RBC factors for invested assets including expanding, for RBC purposes, the current NAIC designations from six to twenty.
•
Longevity/Mortality Risk
. The NAIC’s Longevity Risk Subgroup of the Life Insurance and Annuities Committee and Financial Condition Committee is developing recommendations to recognize longevity risk in statutory reserves and/or risk-based capital related to annuities. The Company assumes this longevity risk primarily in its Retirement and Individual Annuities businesses. The NAIC is also developing updates to the existing mortality risk factors in RBC.
•
Operational Risk
. In 2018 the NAIC adopted operational risk charges that will be effective for year-end 2018 RBC formulas and is continuing to consider whether to add an explicit growth risk charge to the RBC formula. The operational risk charges are not expected to materially impact our 2018 RBC ratios given that we expect to hold statutory capital consistent with or in excess of the thresholds established through these new charges.
Due to the ongoing nature of the NAIC’s activities regarding RBC, we cannot determine the ultimate timing of the proposed changes or their impact on RBC or on our financial position.
Insurance Reserves and Regulatory Capital.
State insurance laws require us to analyze the adequacy of our reserves annually. The respective appointed actuaries for each of our life insurance companies must each submit an opinion that our reserves, when considered in light of the assets we hold with respect to those reserves, make adequate provision for our contractual obligations and related expenses.
The reserving framework for certain of our products has undergone reexamination and revision in recent years, including in the following areas:
•
Principle-Based Reserving for Life Insurance Products
. In 2016, the NAIC adopted a principle-based reserving approach for life insurance products. Principle-based reserving replaces the reserving methods for life insurance products for which the current formulaic basis for reserves may not accurately reflect the risks or costs of the liability or obligations of the insurer. The principle-based reserving approach has a three-year phase-in period. At the Company's discretion, it may be applied to new individual life business beginning as early as January 1, 2017, but must be applied for all new individual life business issued January 1, 2020 and later. The Company may select different implementation dates for different products. Principle-based reserving will not affect reserves for policies in force prior to January 1, 2017.
The Company has introduced updated versions of several products in its individual life product portfolio in conjunction with the requirement to adopt principle-based reserving by January 1, 2020. Notably, the Company adopted principle-based reserving for its guaranteed universal life products and introduced updated versions of these products in 2017. The guaranteed universal life updated products support the principle-based statutory reserve level without the need for financing through captive reinsurance under Actuarial Guideline No. 48 (“AG 48”) or its successor, the Credit for Reinsurance Model Law and the Term and Universal Life Insurance Reserving Financing
23
Model Regulation. AG 48 prescribes an actuarial method to determine the portion of the assets held to support reserves for certain term and universal life policies that must be cash and rated securities, and the portion that may be financed or supported by other assets. The Company is continuing to assess the impact of principle-based reserving on projected statutory reserve levels and product pricing for its remaining portfolio of individual life product offerings, such as term and variable life insurance.
•
Variable Annuities Framework for Change
. In 2018, the NAIC adopted a framework for proposed revisions to the current Actuarial Guideline No. 43 (“AG 43”) and RBC “C-3 Phase II” system applicable to variable annuities reserve and capital requirements. Proposed changes include: (i) aligning economically-focused hedge assets with liability valuations; (ii) reforming standard scenarios for AG 43 and C3 Phase II; (iii) revising asset admissibility for derivatives and deferred tax assets; and (iv) standardizing capital market assumptions and aligning total asset requirements and reserves. The NAIC will seek to implement the revised framework in 2019 with a January 1, 2020 targeted effective date and an optional three-year phase-in. The Company does not expect material impacts to target capital levels from the revised framework.
During 2016, we recaptured the risks related to our variable annuities living benefit riders and certain retirement products that were previously reinsured to our captive reinsurance company in a series of transactions we collectively refer to as the “Variable Annuities Recapture.” While we completed the Variable Annuities Recapture in advance of definitive guidance from the NAIC's Variable Annuity Issues Working Group, we believe the Variable Annuities Recapture is reasonably aligned with the key concept changes planned under the framework.
•
New York Variable Annuity and Life Insurance Product Reserves
. As a result of an agreement with the NY DFS regarding our reserving methodologies for certain variable annuity and life insurance products, certain of our New York licensed insurance subsidiaries hold additional statutory reserves on a New York basis, which reduces their New York statutory surplus. None of our U.S. operating insurance companies are domiciled in New York, and these changes do not impact statutory reserves reported in our insurance subsidiaries’ states of domicile, or any states other than New York, and therefore do not impact RBC ratios; however, the agreed reserve methodologies may require us to increase our additional New York statutory reserves in the future. If we were required to establish material additional reserves on a New York statutory accounting basis or post material amounts of additional collateral with respect to annuity or insurance products, our ability to deploy capital held within our U.S. domestic insurance subsidiaries for other purposes could be affected.
•
Reinsurance
. The NAIC’s Statutory Accounting Principles Working Group is reviewing the statutory accounting rules regarding reinsurance credit, including with respect to the risk transfer requirements for yearly renewable term reinsurance agreements. Certain changes currently under consideration could adversely impact statutory reserve credit for our yearly renewable term reinsurance related to our group life insurance business.
The NAIC’s Life Actuarial Task Force is also evaluating changes to its Valuation Manual in respect of yearly renewable term reinsurance. Certain changes currently under consideration could adversely impact statutory reserve credit for yearly renewable term reinsurance related to our individual life insurance products being reserved using a principle-based approach.
•
Surplus Notes
. The NAIC’s Statutory Accounting Principles Working Group is evaluating changes to the accounting rules regarding surplus notes with linked assets. This change could result in the classification of the surplus notes as debt instead of surplus and require linked assets to be treated as non-admitted assets. These changes would materially adversely impact the statutory financial position of the Company’s captive reinsurance subsidiaries that use credit-linked note structures to finance Regulation XXX and Guideline AXXX reserves.
Captive Reinsurance Companies.
We have used captive reinsurance subsidiaries to finance the portion of the statutory reserves for term and universal life policies that we consider to be non-economic. If we are unsuccessful in obtaining additional financing as a result of market conditions, regulatory changes or otherwise, this could require us to increase prices, reduce our sales of certain life products, or modify certain products, any of which could adversely affect our competitiveness, capital and financial position and results of operations. See “Management’s Discussion and Analysis of Financial Condition and Results of Operations—Liquidity and Capital Resources—Capital—Financing Activities—Term and Universal Life Reserve Financing” for a discussion of our life product reserves and reserve financing.
24
Market Conduct Regulation
State insurance laws and regulations include numerous provisions governing the marketplace activities of insurers, including provisions governing the form and content of disclosure to consumers, illustrations, advertising, sales practices and complaint handling. State regulatory authorities generally enforce these provisions through periodic market conduct examinations.
Insurance Guaranty Association Assessments
Each state has insurance guaranty association laws under which insurers doing business in the state are members and may be assessed by state insurance guaranty associations for certain obligations of insolvent insurance companies to policyholders and claimants. Typically, states assess each member insurer in an amount related to the member insurer’s proportionate share of the line of business written by all member insurers in the state. Many states offer a reimbursement of such assessments in the form of credits against future years’ premium taxes. For the years ended December 31, 2018, 2017 and 2016, we paid $2.3 million, $12.6 million and $1.5 million, respectively, in assessments pursuant to state insurance guaranty association laws. The 2017 assessments reflected the Penn Treaty Network America Insurance Company insolvency, which was liquidated on March 1, 2017. While we cannot predict the amount and timing of future assessments on our U.S. insurance companies under these laws, we have established estimated reserves totaling approximately $33.4 million as of December 31, 2018, for future assessments relating to insurance companies that are currently subject to insolvency proceedings including Penn Treaty Network America Insurance Company, Executive Life of California and Lincoln Memorial Life Insurance Company.
In 2017, the NAIC approved amendments to the Life and Health Insurance Guaranty Association Model Act to address issues relating to long-term care insurance-related insolvencies. The amendments will spread costs from future long-term care insurance-related insolvencies across the entire health and life insurance industry, resulting in increased assessments for life insurers. The amended model law will become applicable to us as it is adopted by each state. Prior insolvencies will not be included under these amendments. Given our current market share of the impacted lines of business, we expect our cost related to future insolvencies, net of premium tax credits available under current state laws, would be a small percentage of the gross industry liability.
U.S. Federal and State Securities Regulation Affecting Insurance Operations
Our variable life insurance, variable annuity and mutual fund products generally are “securities” within the meaning of federal securities laws and may be required to be registered under the federal securities laws and subject to regulation by the SEC and the Financial Industry Regulatory Authority (“FINRA”). Certain of our insurance subsidiaries are subject to SEC public reporting and disclosure requirements based on offerings of these products. Federal and some state securities regulation similar to that discussed below under “—Investment Products and Investment Management Operations” and “—Securities and Commodities Regulation” affect investment advice, sales and related activities with respect to these products.
Our mutual funds, and in certain states our variable life insurance and variable annuity products, are also “securities” within the meaning of state securities laws. As securities, these products are subject to filing and certain other requirements. Also, sales activities with respect to these products generally are subject to state securities regulation. Such regulation may affect investment advice, sales and related activities for these products
.
Federal Insurance Office
Dodd-Frank established a Federal Insurance Office (“FIO”) within the Department of the Treasury headed by a director appointed by the Secretary of the Treasury. While the FIO does not have general supervisory or regulatory authority over the business of insurance, the FIO director performs various functions with respect to insurance, including serving as a non-voting member of the Council, monitoring the insurance sector and representing the U.S. on prudential aspects of international insurance matters, including at the IAIS.
International Insurance Regulation
Our international insurance operations are principally supervised by regulatory authorities in the jurisdictions in which they operate, including the Japanese Ministry of Finance and the Japanese FSA, the financial services regulator in Japan. In addition to Japan, we operate insurance companies in Argentina, Bermuda, Brazil, Italy, Korea, Mexico and Taiwan, and have insurance operations in China, India, Indonesia and Malaysia through joint ventures, and in Ghana through a strategic investment. The insurance regulatory bodies for these businesses typically oversee such issues as: (1) company licensing; (2) the licensing of insurance sales staff; (3) insurance product approvals; (4) sales practices; (5) claims payment practices; (6) permissible investments; (7) solvency and capital adequacy; and (8) insurance reserves, among other items. In some jurisdictions, for certain products,
25
regulators will also mandate premium rates (or components of pricing) or minimum guaranteed interest rates. Periodic examinations of insurance company books and records, financial reporting requirements, market conduct examinations and policy filing requirements are among the techniques used by these regulators to supervise our non-U.S. insurance businesses. Finally, insurance regulatory authorities in the various jurisdictions in which our insurance companies are domiciled, including Japan, must approve any change of control of Prudential Financial or the insurance companies organized under their laws.
Solvency Regulation
In order to monitor insurers’ solvency, regulatory authorities in the jurisdictions in which we operate outside the U.S. generally establish some form of minimum solvency requirements for insurance companies, similar in concept to the RBC ratios that are employed by U.S. insurance regulators. These solvency ratios are used by regulators to assess the sufficiency of an insurer’s capital and claims-paying ability and include the impact of transactions with affiliated entities. Certain jurisdictions require the disclosure of solvency ratios to the public. Insurers that have lower solvency ratios than the regulators require are considered to have inadequate capital and are subject to varying degrees of regulatory action depending upon the level of capital inadequacy.
Changes in solvency regulation from jurisdiction to jurisdiction may arise based on the regulatory standards developed by the Financial Stability Board (“FSB”), IAIS or authorities in the U.S. or the European Economic Area (“EEA”). FSB and IAIS developments are described below under “—International and Global Regulatory Initiatives.”
Japan Capital and Solvency Regulation.
Our Japan insurance operations are subject to a consolidated basis capital standard known as the Solvency Margin Ratio framework (“SMR”). This standard prescribes the manner in which an insurance company’s capital is calculated and is meant to respond to changes in financial markets, improve risk management practices of insurers and consider risks associated with the insurer’s subsidiaries. In 2016 and 2018, the FSA conducted a field test of a potential market based alternative to the SMR framework that closely aligned with components of the IAIS’s Risk-based Global Insurance Capital Standard (“ICS”), which is described below under “—Other International and Global Regulatory Initiatives.” The FSA may continue to explore potential alternatives or revisions to the existing SMR framework. We cannot predict whether changes to the SMR will be adopted, or if they will result in additional capital requirements and compliance costs.
Korea Accounting Standards, Capital and Solvency Regulation.
In 2017, the International Accounting Standards Board (“IASB”) released a new International Financial Reporting Standard (“IFRS”) for accounting for insurance contracts, which will apply to our operations in Korea and certain other jurisdictions. The new IFRS was initially scheduled to go into effect in 2021; however, in 2018 the IASB deferred the effective date to 2022. Korea’s Financial Supervisory Service and Financial Services Commission announced plans to enhance the liability adequacy test in June 2017 as part of its adoption effort. The enhancements require life insurers to set aside additional policy reserves in phases to support the transition to IFRS, which is expected to lead to an increase in the level of reserves insurers must hold. In Japan, changes in IFRS do not currently impact our operations as they are not required to report under IFRS.
Our Korea insurance operation is subject to RBC requirements that are based in part on financial statements prepared in accordance with current accounting requirements. In 2017 and 2018, the Financial Supervisory Service (“FSS”) of Korea conducted a field test of a potential market based alternative to the RBC framework that closely aligned with components of the IAIS’ ICS. The FSS will continue to explore potential alternatives or revisions to the existing RBC framework through further quantitative impact studies with the intention of implementing changes in parallel with its implementation of the new IFRS standards for accounting for insurance contracts. We cannot predict whether changes to the RBC framework will ultimately be adopted, or if they will result in additional capital requirements and compliance costs.
Dividend Payment Limitations
The insurance regulatory bodies in some of the countries where our international insurance businesses are located regulate the amount of dividends that they can pay to shareholders. See Note 15 to the Consolidated Financial Statements for additional information regarding the ability of our international subsidiaries to pay dividends to Prudential Financial.
Insurance Guaranty Fund Assessments
Certain of our international insurance operations, including those in Japan, may be subject to assessments, generally based on their proportionate share of business written in the relevant jurisdiction, for certain obligations of insolvent insurance companies to policyholders and claimants. As we cannot predict the timing of future assessments, they may materially affect the results of operations of our international insurance operations in particular quarterly or annual periods. Under the Japanese insurance guaranty law, all licensed life insurers in Japan are required to be members of and are assessed, on a pre-funded basis, by the Japan Policyholders Protection Corporation (“PPC”). These assessments generate a collective fund which is used to satisfy certain
26
obligations of insolvent insurance companies to policyholders and claimants. The PPC assesses each member in an amount related to its proportionate share of new business written by all member insurers. For the years ended December 31, 2018, 2017 and 2016, we paid approximately $22 million, $21 million and $22 million, respectively, based on fixed currency exchange rates, in assessments pursuant to Japanese insurance guaranty association laws.
U.S. Investment and Retirement Products and Investment Management Operations
Our investment products and services are subject to federal and state securities, fiduciary, including ERISA, and other laws and regulations. The SEC, FINRA, the Commodity Futures Trading Commission (“CFTC”), state securities commissions, state banking and insurance departments and the DOL are the principal U.S. regulators that regulate our investment management operations. In some cases our domestic U.S. investment operations are also subject to non-U.S. securities laws and regulations.
Some of the separate account, mutual fund and other pooled investment products offered by our businesses, in addition to being registered under the Securities Act, are registered as investment companies under the Investment Company Act of 1940, as amended, and the shares of certain of these entities are qualified for sale in some states and the District of Columbia. Separate account investment products are also subject to state insurance regulation as described above. We also have several subsidiaries that are registered as broker-dealers under the Securities Exchange Act of 1934 (“Exchange Act”), as amended, and are subject to federal and state regulation. In addition, we have subsidiaries that are investment advisers registered under the Investment Advisers Act of 1940, as amended. Our third-party advisors and licensed sales professionals within Prudential Advisors and other employees, insofar as they sell products that are securities, are subject to the Exchange Act and to examination requirements and regulation by the SEC, FINRA and state securities commissioners. Regulation and examination requirements also extend to various Prudential entities that employ or control those individuals.
Congress from time to time considers pension reform legislation that could decrease or increase the attractiveness of certain of our retirement products and services to retirement plan sponsors and administrators, or have an unfavorable or favorable effect on our ability to earn revenues from these products and services. Over time, these changes could hinder our sales of defined benefit pension products and services and cause sponsors to discontinue existing plans for which we provide investment management, administrative, or other services, but could increase the attractiveness of certain products we offer in connection with pension plans.
Congress is considering legislation that would improve and enhance the U.S.’s existing employer-provided retirement system. Among other things, certain policy measures, if enacted, would help promote plan coverage by expanding access to and use of Multiple Employer Plans; facilitate access to lifetime income disclosures for plan participants to better understand how their retirement savings translate into monthly lifetime income in retirement; improve upon the current annuity selection safe harbor; and provide lifetime income portability.
Finally, Federal and state banking laws also generally require regulatory approval for a change in control of Prudential Financial, Prudential Bank & Trust, FSB (“PB&T”) or Prudential Trust Company. The U.S. federal securities laws could also require reapproval or consent by customers of our investment advisory contracts upon a change of control, including for mutual funds included in annuity products.
U.S. Securities and Commodity Operations
We have subsidiaries that are broker-dealers, investment advisers, commodity pool operators or commodity trading advisers. The SEC, the CFTC, state securities authorities, FINRA, the National Futures Association (“NFA”), the Municipal Securities Rulemaking Board, and similar authorities are the principal regulators of these subsidiaries.
Our broker-dealer and commodities affiliates are members of, and are subject to regulation by, “self-regulatory organizations,” including FINRA and the NFA. Self-regulatory organizations conduct examinations of, and have adopted rules governing, their members. In addition, state securities and certain other regulators have regulatory and oversight authority over our registered broker-dealers. Broker-dealers and their sales forces in the U.S. and in certain other jurisdictions are subject to regulations that cover many aspects of the securities business, including sales methods and trading practices. The regulations cover the suitability of investments for individual customers, use and safekeeping of customers’ funds and securities, capital adequacy, recordkeeping, financial reporting and the conduct of directors, officers and employees. The SEC, CFTC and other governmental agencies and self-regulatory organizations, as well as state securities commissions in the U.S. and non-U.S. regulatory agencies, have the power to conduct administrative proceedings that can result in censure, fine, the issuance of cease-and-desist orders or suspension, termination or limitation of the activities of a broker-dealer, an investment adviser or commodities firm or its employees. Our U.S. registered broker-dealer subsidiaries are subject to federal net capital requirements that may limit the ability of these subsidiaries to pay dividends to Prudential Financial.
27
International Investment and Retirement Products and Investment Management Operations
Our non-insurance international operations are supervised primarily by regulatory authorities in the countries in which they operate. We operate investment-related businesses in, among other jurisdictions, Japan, Taiwan, the U.K., Ireland, Hong Kong, Mexico, Germany, Luxembourg, China and Singapore, and participate in investment-related joint ventures in India, Italy and China and a retirement related joint venture in Chile. These businesses may provide products such as investment management products and services, mutual funds, separately managed accounts and retirement products. The regulatory authorities for these businesses typically oversee such issues as: (1) company licensing; (2) the licensing of investment product sales staff; (3) sales practices; (4) solvency and capital adequacy; (5) mutual fund product approvals and related disclosures; and (6) securities, commodities and related laws, among other items. In some cases, our international investment operations are also subject to U.S. securities laws and regulations.
In June 2016, the U.K. approved a non-binding referendum to exit the European Union. The formal process for the U.K. to exit from the European Union remains subject to ongoing negotiation between the U.K. and the European Union on the timing and terms of the exit. The outcome of the negotiations will determine the ultimate impact of the exit on our operations and investments in those jurisdictions and may lead to volatility in currency exchange rates and asset prices, as well as changes in regulation. In the event the exit results in future restrictions on cross-border trade in financial services and products between the U.K. and the European Union, PGIM may incur additional expenses and operational burdens in order to ensure compliance with such restrictions. PGIM has implemented a number of steps to seek to ensure it is prepared, to the extent possible, for various outcomes, including forming new legal entities and applying for licenses and permissions in certain European Union countries, and engaging in client communications.
Derivatives Regulation
Prudential Financial and our subsidiaries use derivatives for various purposes, including hedging interest rate, foreign currency and equity market exposures. Dodd-Frank established a framework for regulation of the over-the-counter derivatives markets. This framework sets out requirements regarding the clearing and reporting of derivatives transactions, as well as collateral posting requirements for uncleared swaps. Affiliated swaps entered into between our subsidiaries are generally exempt from most of these requirements.
We continue to monitor the potential hedging cost impacts of new initial margin requirements that we will be required to comply with in 2020, and increased capital requirements for derivatives transactions that may be imposed on banks that are our counterparties. Additionally, the increased need to post cash collateral in connection with mandatorily cleared swaps may also require the liquidation of higher yielding assets for low yielding cash, resulting in a negative impact on investment income.
Privacy and Cybersecurity Regulation
We are subject to laws, regulations and directives that require financial institutions and other businesses to protect the security and confidentiality of personal information, including health-related and customer information, and to notify their customers and other individuals of their policies and practices relating to the collection and disclosure of health-related and customer information. In addition, we must comply with international privacy laws, regulations, and directives concerning the cross border transfer or use of employee and customer personal information. These laws, regulations and directives also:
|
•
|
provide additional protections regarding the use and disclosure of certain information such as social security numbers;
|
|
•
|
require notice to affected individuals, regulators and others if there is a breach of the security of certain personal information;
|
|
•
|
require financial institutions and creditors to implement effective programs to detect, prevent, and mitigate identity theft;
|
|
•
|
regulate the process by which financial institutions make telemarketing calls and send e-mail or fax messages to consumers and customers; and
|
|
•
|
prescribe the permissible uses of certain personal information, including customer information and consumer report information.
|
Financial regulators in the U.S. and international jurisdictions in which we operate continue to focus on data privacy and cybersecurity, including in proposed rulemaking, and have communicated heightened expectations and have increased emphasis in this area in their examinations of regulated entities. For example, the European Union’s General Data Protection Regulation (“GDPR”), which became effective in May 2018, confers additional privacy rights on individuals in the European Union and establishes penalties for violations. In addition, in the United States the Federal government has proposed a number of laws similar to the GDPR and California has enacted broad legislation effective in 2020 which is similar in many ways to the GDPR.
28
Internationally, a number of countries such as Brazil and Argentina have enacted or are considering enacting GDPR-like regulations.
In October 2017, the NAIC adopted the Insurance Data Security Model Law. The model law requires that insurance companies establish a cybersecurity program and includes specific technical safeguards as well as requirements regarding governance, incident planning, data management, system testing, vendor oversight and regulator notification. New York implemented a similar law in March 2017 and other states have either implemented the Model Law or are anticipated to implement it in the near future.
The Company is monitoring regulatory guidance and rulemaking in this area, and may be subject to increased compliance costs and regulatory requirements. In order to respond to the threat of security breaches and cyber-attacks, we have developed a program overseen by the Chief Information Security Officer and the Information Security Office that is designed to protect and preserve the confidentiality, integrity, and continued availability of all information owned by, or in the care of the Company. As part of this program, we also maintain an incident response plan. The program provides for the coordination of various corporate functions and governance groups, and serves as a framework for the execution of responsibilities across businesses and operational roles. The program establishes security standards for our technological resources, and includes training for employees, contractors and third parties. As part of the program, we conduct periodic exercises and a response readiness assessment with outside advisors to gain a third-party independent assessment of our technical program and our internal response preparedness. We regularly engage with the outside security community and monitor cyber threat information.
Anti-Money Laundering and Anti-Bribery Laws
Our businesses are subject to various anti-money laundering and financial transparency laws and regulations that seek to promote cooperation among financial institutions, regulators and law enforcement entities in identifying parties that may be involved in terrorism or money laundering. In addition, under current U.S. law and regulations we may be prohibited from dealing with certain individuals or entities in certain circumstances and we may be required to monitor customer activities, which may affect our ability to attract and retain customers. We are also subject to various laws and regulations relating to corrupt and illegal payments to government officials and others, including the U.S. Foreign Corrupt Practices Act and the U.K.’s Anti-Bribery Law. The obligation of financial institutions, including the Company, to identify their clients, to monitor for and report suspicious transactions, to monitor dealings with government officials, to respond to requests for information by regulatory authorities and law enforcement agencies, and to share information with other financial institutions, has required the implementation and maintenance of internal practices, procedures and controls.
Environmental Laws and Regulations
Federal, state and local environmental laws and regulations apply to our ownership and operation of real property. Inherent in owning and operating real property are the risks of hidden environmental liabilities and the costs of any required clean-up. Although unexpected environmental liabilities can always arise, we seek to minimize this risk by undertaking environmental assessments, among other measures prior to taking title to real estate.
Unclaimed Property Laws
We are subject to the laws and regulations of states and other jurisdictions concerning the identification, reporting and escheatment of unclaimed or abandoned funds, and we are subject to audit and examination for compliance with these requirements. For additional discussion of these matters, see Note 22 to the Consolidated Financial Statements.
Taxation
U.S. Taxation
The Company and certain domestic subsidiaries file a consolidated federal income tax return that includes both life insurance companies and non-life insurance companies. Certain other domestic subsidiaries file separate tax returns. The principal differences between the Company’s actual income tax expense and the applicable statutory federal income tax rate are generally deductions for non-taxable investment income, including the Dividends Received Deduction (“DRD”), foreign taxes applied at a different tax rate than the U.S. rate and certain tax credits. For tax years prior to 2018, the applicable statutory federal tax rate was 35%. For tax years starting in 2018, the applicable statutory federal income tax rate is 21%. In addition, as discussed further below, the tax attributes of our products may impact both the Company’s and our customers’ tax positions. See “Income Taxes” in Note 2 to the Consolidated Financial Statements and Note 15 to the Consolidated Financial Statements for a description of the Company’s tax position. As discussed further below, new tax legislation and other potential changes to the tax law may impact the Company’s tax position and the attractiveness of our products.
29
The Tax Act of 2017 was enacted into law on December 22, 2017 and was generally effective starting in 2018. The Tax Act of 2017 changes the taxation of businesses and individuals by lowering tax rates and broadening the tax base through the acceleration of taxable income and the deferral or elimination of certain deductions, as well as changing the system of taxation of earnings of foreign subsidiaries. The most significant changes for the Company are: (1) the reduction of the corporate tax rate from 35% to 21%; (2) revised methodologies for determining deductions for tax reserves and the DRD; (3) an increased capitalization and amortization period for acquisition costs related to certain products; and (4) the change from a worldwide deferred taxation system to a modified territorial system of taxation on applicable earnings of foreign subsidiaries, which includes (a) a new tax on earnings of foreign subsidiaries (the Global Intangible Low-Taxed Income (“GILTI”) provision ) and (b) a new alternative tax with respect to payments to non-U.S. affiliates that are at least 25% owned (the Base Erosion Anti-Abuse Tax (“BEAT”)). The lower corporate tax rate reduced the Company’s domestic statutory capital and risk-based capital. For additional details, see “Management’s Discussion and Analysis of Financial Condition and Results of Operations—Liquidity and Capital Resources—Capital—Insurance Regulatory Capital.”
The GILTI provision applies a minimum U.S. tax to earnings of foreign subsidiaries in excess of a 10% deemed return on tangible assets of consolidated foreign subsidiaries by imposing the U.S. tax rate to 50% of earnings of such foreign affiliates and provides for a partial foreign tax credit for foreign income taxes. The amount of tax in any period on GILTI can depend on annual differences between U.S. taxable income recognition rules and taxable income recognition rules in the country of operations and the overall taxable income of U.S. operations, as well as U.S. expense allocation rules which limit the amount of foreign tax credits that can be applied to reduce the U.S. tax on the GILTI. Under certain circumstance the taxable income of U.S. operations may cause more than 50% of earnings of foreign affiliates to be subject to the GILTI provision. In years that the U.S. consolidated PFI group incurs a net operating loss or has a loss from domestic businesses, the GILTI provision would operate to cause a loss of U.S. tax benefits for some or all of those losses, effectively increasing the tax on foreign earnings.
The BEAT provision could, under certain conditions, increase our tax expense. The BEAT is an alternative tax implicated if tax deductible payments from U.S. companies to foreign affiliates that are at least 25% owned exceed 3% of total U.S. tax deductions. If implicated, the BEAT taxes modified taxable income at a rate of 5% in 2018, increasing to 10% in 2019 and 12.5% in 2026 and is due if the calculated BEAT tax amount that is determined without the benefit of foreign and certain other tax credits is greater than the regular corporate tax in any given year. In general, modified taxable income is calculated by adding back to a taxpayer’s regular taxable income the amount of certain “base erosion tax benefits” with respect to payments to foreign affiliates, as well as the “base erosion percentage” of any net operating loss deductions. It is possible that benefit and claim payments made by our U.S. insurance business to our foreign affiliates on reinsurance assumed by the U.S. affiliates could be considered base erosion payments and, in the future, cause the U.S. consolidated PFI group to be subject to the BEAT.
During 2018 the Treasury Department and the Internal Revenue Service (“IRS”) promulgated Proposed Regulations on a number of provisions within or impacted by the Tax Act of 2017 including GILTI, foreign tax credits, net interest deductibility and the BEAT. The Treasury and IRS have requested comments on the Proposed Regulations. Our analysis of these Proposed Regulations is on-going and further guidance may be needed from the Treasury Department and the IRS to fully understand and implement several provisions. Other life insurance and financial services companies may benefit more or less from these tax law changes, which could impact the Company’s overall competitive position. Notwithstanding the enactment of the Tax Act of 2017, the President, Congress, as well as state and local governments, may continue to consider from time to time legislation that could increase the amount of corporate taxes we pay, thereby reducing earnings.
U.S. federal tax law generally permits tax deferral on the inside build-up of investment value of certain retirement savings, annuities and life insurance products until there is a contract distribution and, in general, excludes from taxation the death benefit paid under a life insurance contract. The Tax Act of 2017 did not change these rules, though it is possible that some individuals with overall lower effective tax rates could be less attracted to the tax deferral aspect of the Company’s products. The general reduction in individual tax rates and elimination of certain individual deductions may also impact the Company depending on whether current and potential customers have more or less after-tax income to save for retirement and manage their mortality and longevity risk through the purchase of the Company’s products. Congress from time to time may enact other changes to the tax law that could make our products less attractive to consumers, including legislation that would modify the tax favored treatment of retirement savings, life insurance and annuities products.
The products we sell have different tax characteristics and, in some cases, generate tax deductions and credits for the Company. Changes in either the U.S. or foreign tax laws may negatively impact the deductions and credits available to the Company, including the ability of the Company to claim foreign tax credits with respect to taxes withheld on our investments supporting separate account products. These changes would increase the Company’s actual tax expense and reduce its consolidated net income.
The profitability of certain products is significantly dependent on these characteristics and our ability to continue to generate taxable income, which is taken into consideration when pricing products and is a component of our capital management strategies.
30
Accordingly, changes in tax law, our ability to generate taxable income, or other factors impacting the availability or value of the tax characteristics generated by our products, could impact product pricing and returns or require us to reduce our sales of these products or implement other actions that could be disruptive to our businesses.
International Taxation
Our international businesses are subject to the tax laws and regulations of the countries in which they are organized and in which they operate. Foreign governments from time to time consider legislation that could impact the amount of taxes that we pay or impact the sales of our products. For example, the Organization of Economic Cooperation and Development continues to study model global base erosion tax options that may be considered and adopted by foreign governments. Such changes could negatively impact sales of our products or reduce our profits.
On December 19, 2017, South Korea enacted a 2018 tax reform bill that adds a new 25% corporate income tax bracket for taxable income in excess of ₩300 billion for tax years beginning on or after January 1, 2018. Taxable income in excess of ₩20 billion but less than ₩300 billion continues to be subject to a 22% corporate income tax. In addition, corporations continue to be subject to a local income surtax of 10% of the computed corporate income tax (e.g., 2.5% for the tax base in excess of ₩300 billion, 2.2% for the tax base between ₩20 billion and ₩300 billion). After taking into account this 10% local income tax surcharge on corporate tax, the 2018 tax reform bill increased the top corporate income tax rate in South Korea from 24.2% to 27.5%.
Prior to 2017, the Japan national corporate tax rate was reduced from 23.9% for tax years beginning on or after April 1, 2015, to 23.4% for tax years beginning on or after April 1, 2016, and to 23.2% for tax years beginning on or after April 1, 2018. In addition, there are local income taxes that are applied to our income earned in Japan. The Japanese consumption tax rate is currently 8% and is scheduled to increase to 10% on October 1, 2019. Insurance commissions paid to our Life Planners and Life Consultants are subject to consumption tax for individuals exceeding certain earnings thresholds; however, the tax is not charged on employee compensation (other than commissions) or insurance premiums.
International and Global Regulatory Initiatives
In addition to the adoption of Dodd-Frank in the United States, lawmakers around the world are actively exploring steps to avoid future financial crises. In many respects, this work is being led by the FSB, which consists of representatives of national financial authorities of the G20 nations. The G20, the FSB and related bodies have developed proposals to address such issues as financial group supervision, capital and solvency standards, systemic economic risk, corporate governance including executive compensation, and a host of related issues.
In July 2013, we along with eight other global insurers, were designated by the FSB as a global systemically important insurer (“G-SII”) through a quantitative methodology developed and implemented by the IAIS. Similar assessments were performed and subsequent G-SII designation lists were issued annually through November 2016. We remained designated as a G-SII throughout this period. In November 2017, the FSB announced that the list of G-SIIs identified in 2016 would stand until November 2018, at which point it would assess the progress made by the IAIS’ on the development of an Activities-Based Approach (“ABA”) to assessing and managing potential systemic risk in the insurance sector. Over the course of 2018, the IAIS’ work to develop an ABA evolved into the development of a Holistic Framework for Systemic Risk in the Insurance Sector (“Holistic Framework”). Key elements of the Holistic Framework include enhancements to IAIS policy measures pertaining to macroprudential surveillance, enterprise risk management, liquidity management, crisis management and recovery planning as well as the continuation of annual data collection and monitoring by the IAIS. The IAIS will finalize the Holistic Framework in 2019 for implementation in 2020. In November 2018, the FSB announced that it would not engage in an identification of G-SIIs based on progress made on the development of the Holistic Framework and that it will assess an IAIS recommendation to suspend G-SII identification from 2020 in November 2019. The FSB further announced that it will review the need to either discontinue or re-establish the annual identification of G-SIIs in November 2022.
In addition to its work on assessing and managing potential systemic risk, the IAIS is developing the Common Framework for the Supervision of Internationally Active Insurance Groups (“ComFrame”). Through ComFrame, the IAIS seeks to promote effective and globally consistent supervision of the insurance industry through uniform standards for insurer corporate governance, enterprise risk management and other control functions, group-wide supervision and group capital adequacy. The non-capital related components of ComFrame are being developed iteratively through a series of public consultations and are scheduled to be adopted by the IAIS in November 2019. The ICS, which is the capital adequacy component of ComFrame, is also being developed iteratively through both a series of public consultations and voluntary field tests. In November 2017, the IAIS announced an agreement among its members on the development and implementation of the ICS. Terms of the agreement include: adoption of the ICS by the IAIS in November 2019; a five-year monitoring phase beginning in 2020 during which IAIGs are to report ICS results to their group supervisory authorities; and implementation of the ICS at the jurisdictional level in 2025.
31
As a standard setting body, the IAIS does not have direct authority to require insurance companies to comply with the policy measures it develops, including the ICS and proposed policy measures within the Holistic Framework. However, if the policy measures were adopted by either our group supervisor or supervisors of our international operations or companies, we could become subject to these standards. Adoption of IAIS policy measures could impact the manner in which we deploy our capital, structure and manage our businesses, and otherwise operate both within the U.S. and abroad. The possibility of inconsistent and conflicting regulation of Prudential at the group level and the subsidiary level also exists as law makers and regulators in multiple jurisdictions simultaneously pursue these initiatives.
Employees
As of December 31, 2018, we had 50,492 employees and sales associates, including 29,506 located outside of the United States. We believe our relations with our employees and sales associates are satisfactory.
Available Information
Prudential Financial files periodic and current reports, proxy statements and other information with the SEC. Such reports, proxy statements and other information may be obtained through the SEC’s website (www.sec.gov).
You may also access our press releases, financial information and reports filed with the SEC (for example, our Annual Report on Form 10-K, our Quarterly Reports on Form 10-Q, our Current Reports on Form 8-K and any amendments to those Forms) online at www.investor.prudential.com. Copies of any documents on our website are available without charge, and reports filed with or furnished to the SEC will be available as soon as reasonably practicable after they are filed with or furnished to the SEC. The information found on our website is not part of this or any other report filed with or furnished to the SEC.
|
ITEM 1A.
|
RISK FACTORS
|
You should carefully consider the following risks. These risks are not exclusive, and additional risks to which we are subject include, but are not limited to, the factors mentioned under “Forward-Looking Statements” above and the risks of our businesses described elsewhere in this Annual Report on Form 10-K. Many of these risks are interrelated and could occur under similar business and economic conditions, and the occurrence of certain of them may in turn cause the emergence or exacerbate the effect of others. Such a combination could materially increase the severity of the impact of these risks on our businesses, results of operations, financial condition and liquidity.
Overview
The Company’s risk management framework documents the definition, potential manifestation, and management of its risks. The Company has categorized its risks into tactical and strategic risks. Tactical risks may cause damage to the Company, and the Company seeks to manage and mitigate them through models, metrics and the overall risk framework. The Company’s tactical risks include investment, insurance, market, liquidity, and operational risk. Strategic risks can cause the Company’s fundamental business model to change, either through a shift in the businesses in which it is engaged or a change in execution. The Company’s strategic risks include regulatory, technological changes and other external factors. These risks, as well as the sub-risks that may impact the Company, are discussed below. The Company’s risk management framework is described under “Management’s Discussion and Analysis of Financial Condition and Results of Operations—Risk Management.”
Investment Risk
Our investment portfolios are subject to the risk of loss due to default or deterioration in credit quality or value.
We are exposed to investment risk through our investments, which primarily consist of public and private fixed maturity securities, commercial mortgage and other loans, equity securities and alternative assets including private equity, hedge funds and real estate. For a discussion of our general account investments, see “Management’s Discussion and Analysis of Financial Condition and Results of Operations—General Account Investments.” We are also exposed to investment risk through a potential counterparty default.
32
Investment risk may result from (1) economic conditions, (2) adverse capital market conditions, including disruptions in individual market sectors or a lack of buyers in the marketplace, (3) volatility, (4) credit spread changes, (5) benchmark interest rate changes, (6) changes in foreign currency exchange rates and (7) declines in value of underlying collateral. These factors may impact the credit quality, liquidity and value of our investments and derivatives, potentially resulting in higher capital charges and unrealized or realized losses. Also, certain investments we hold, regardless of market conditions, are relatively illiquid and our ability to promptly sell these assets for their full value may be limited. Additionally, our valuation of investments may include methodologies, inputs and assumptions which are subject to change and different interpretation and could result in changes to investment valuations that may materially impact our results of operations or financial condition. For information about the valuation of our investments, see Note 6 to the Consolidated Financial Statements.
Our investment portfolio is subject to credit risk,
which is the risk that an obligor (or guarantor) is unable or unwilling to meet its contractual payment obligations on its fixed maturity security, loan or other obligations.
Credit risk may manifest in an idiosyncratic manner (i.e., specific to an individual borrower or industry) or through market-wide credit cycles. Financial deterioration of the obligor increases the risk of default and may increase the capital charges required under such regimes as the NAIC RBC, the FSA SMR or other constructs to hold the investment and in turn, potentially limit our overall capital flexibility. Credit defaults (as well as credit impairments, realized losses on credit-related sales, and increases in credit related reserves) may result in losses which adversely impact earnings, capital and our ability to appropriately match our liabilities and meet future obligations.
Our Company is subject to counterparty risk, which is
the risk that the counterparty to a transaction could default or deteriorate in creditworthiness before or at the final settlement of a transaction
.
In the normal course of business, we enter into financial contracts to manage risks (such as derivatives to manage market risk and reinsurance treaties to manage insurance risk), improve the return on investments (such as securities lending and repurchase transactions) and provide sources of liquidity or financing (such as credit agreements, securities lending agreements and repurchase agreements). These transactions expose the Company to counterparty risk. Counterparties include commercial banks, investment banks, broker-dealers and insurance and reinsurance companies. In the event of a counterparty deterioration or default, the magnitude of the losses will depend on then current market conditions and the length of time required to enter into a replacement transaction with a new counterparty. Losses are likely to be higher under stressed conditions.
Our investment portfolio is subject to equity risk, which is
the risk of loss due to deterioration in market value of public equity or alternative assets
.
We include public equity and alternative assets (including private equity, hedge funds and real estate) in our portfolio constructions, as these asset classes can provide returns over longer periods of time, aligning with the long-term nature of certain of our liabilities. Public equity and alternative assets have varying degrees of price transparency. Equities traded on stock exchanges (public equities) have significant price transparency, as transactions are often required to be disclosed publicly. Assets for which price transparency is more opaque include private equity (joint ventures/limited partnerships) and direct real estate. As these investments typically do not trade on public markets and indications of realizable market value may not be readily available, valuations can be infrequent and/or more volatile. A sustained decline in public equity and alternative markets may reduce the returns earned by our investment portfolio through lower than expected dividend income, property operating income, and capital gains, thereby adversely impacting earnings, capital, and product pricing assumptions. These assets may also produce volatility in earnings as a result of uneven distributions on the underlying investments.
Insurance Risk
We have significant liabilities for policyholders’ benefits which are subject to insurance risk. Insurance risk is the risk that actual experience deviates adversely from our best estimate insurance assumptions, including mortality, morbidity, and policyholder behavior assumptions
.
We provide a variety of insurance products, on both an individual and group basis, that are designed to help customers protect against a variety of financial uncertainties. Our insurance products protect customers against their potential risk of loss by transferring those risks to the Company, where those risks can be managed more efficiently through pooling and diversification over a larger number of independent exposures. During this transfer process, we assume the risk that actual losses experienced in our insurance products deviates significantly from what we expect. More specifically, insurance risk is concerned with the deviations that impact our future liabilities. Our profitability may decline if mortality experience, morbidity experience or policyholder behavior experience differ significantly from our expectations when we price our products. In addition, if we experience higher than expected claims our liquidity position may be adversely impacted, and we may incur losses on investments if we are required to sell assets in order to pay claims. If it is necessary to sell assets at a loss, our results of operations and financial condition could be adversely impacted. For a discussion of the impact of changes in insurance assumptions on our financial condition, see “Management’s Discussion and Analysis of Financial Condition and Results of Operations—Accounting Policies and Pronouncements—Application of Critical Accounting Estimates—Insurance Liabilities.”
33
Certain of our insurance products are subject to mortality risk, which is the risk that actual deaths experienced deviate adversely from our expectations
.
Mortality risk is a biometric risk that can manifest in the following ways:
|
•
|
Mortality calamity
is the risk that mortality rates in a single year deviate adversely from what is expected as the result of pandemics, natural or man-made disasters, military actions or terrorism. A mortality calamity event will reduce our earnings and capital and we may be forced to liquidate assets before maturity in order to pay the excess claims. Mortality calamity risk is more pronounced in respect of specific geographic areas (including major metropolitan centers, where we have concentrations of customers, including under group and individual life insurance), concentrations of employees or significant operations, and in respect of countries and regions in which we operate that are subject to a greater potential threat of military action or conflict. Ultimate losses would depend on several factors, including the rates of mortality and morbidity among various segments of the insured population, the collectability of reinsurance, the possible macroeconomic effects on our investment portfolio, the effect on lapses and surrenders of existing policies, as well as sales of new policies and other variables.
|
|
•
|
Mortality trend
is the risk that mortality improvements in the future deviate adversely from what is expected. Mortality trend is a long-term risk in that can emerge gradually over time. Longevity products, such as annuities, pension risk transfer and long-term care, experience adverse impacts due to higher-than-expected mortality improvement. Mortality products, such as life insurance, experience adverse impacts due to lower-than-expected improvement. If this risk were to emerge, the Company would update assumptions used to calculate reserves for in-force business, which may result in additional assets needed to meet the higher expected annuity claims or earlier expected life claims. An increase in reserves due to revised assumptions has an immediate impact on our results of operations and financial condition; however, economically the impact is generally long term as the excess outflow is paid over time.
|
|
•
|
Mortality base
is the risk that actual base mortality deviates adversely from what is expected in pricing and valuing our products. Base mortality risk can arise from a lack of credible data on which to base the assumptions.
|
Certain of our insurance products are subject to morbidity risk, which is
the risk that either incidence or continuation experience deviates adversely from what is expected
.
Morbidity risk is a biometric risk that can manifest in the following ways:
|
•
|
Morbidity incidence
is the risk that the rate at which policyholders become unhealthy (and qualify for benefits under insurance policies) deviates adversely from what is expected. We are primarily exposed to morbidity incidence risk through short-term disability products, long-term disability products, long-term care products, and the accident and health products we sell in Japan.
|
|
•
|
Morbidity continuation
is the risk that the length of time for which policyholders remain unhealthy deviates adversely from what is expected. This risk is primarily in our disability and long-term care products.
|
In each case, an increase in claims, or an increase in reserves due to revised morbidity assumptions can have an immediate impact on our results of operations and financial condition; however, economically the impact of morbidity risk for products that pay out for ongoing illness or disability generally emerges over the longer term as the morbidity claims are paid.
Certain of our insurance products are subject to policyholder behavior risk, which is
the risk that actual policyholder behavior deviates adversely from what is expected.
Policyholder behavior risk includes the following components:
|
•
|
Lapse calamity
is the risk that lapse rates over the short-term deviate adversely from what is expected, for example, surrenders of certain insurance products may increase following a downgrade of our financial strength ratings or adverse publicity. Only certain products are exposed to this risk. Products that offer a cash surrender value that resides in the general account, such as general account stable value products, could pose a potential short-term lapse calamity risk. Surrender of these products can impact liquidity, and it may be necessary in certain market conditions to sell assets to meet surrender demands. Lapse calamity can also impact our earnings through its impact on estimated future profits.
|
34
|
•
|
Policyholder behavior efficiency
is the risk that the behavior of our customers or policyholders deviates adversely from what is expected. Policyholder behavior efficiency risk arises through product features which provide some degree of choice or flexibility for the policyholder, which can impact the amount and/or timing of claims. Such choices include surrender, lapse, partial withdrawal, policy loan, utilization, and premium payment rates for contracts with flexible premiums. While some behavior is driven by macro factors such as market movements, policyholder behavior at a fundamental level is driven primarily by policyholders’ individual needs, which may differ significantly from product to product depending on many factors including the features offered, the approach taken to market each product, and competitor pricing. For example, persistency (the probability that a policy or contract will remain in force) within our annuities business may be significantly impacted by the value of guaranteed minimum benefits contained in many of our variable annuity products being higher than current account values in light of poor market performance as well as other factors. Many of our products also provide our customers with wide flexibility with respect to the amount and timing of premium deposits and the amount and timing of withdrawals from the policy’s value. Results may vary based on differences between actual and expected premium deposits and withdrawals for these products, especially if these product features are relatively new to the marketplace. The pricing of certain of our variable annuity products that contain certain living benefit guarantees is also based on assumptions about utilization rates, or the percentage of contracts that will utilize the benefit during the contract duration, including the timing of the first withdrawal. Results may vary based on differences between actual and expected benefit utilization. We may also be impacted by customers seeking to sell their benefits. In particular, the development of a secondary market for life insurance, including life settlements or “viaticals” and investor owned life insurance, and third-party investor strategies in the annuities business, could adversely affect the profitability of existing business and our pricing assumptions for new business. Policyholder behavior efficiency is generally a long-term risk that emerges over time. An increase in reserves due to revised assumptions has an immediate impact on our results of operations and financial condition; however, from an economic or cash flow perspective, the impact is generally long term as the excess outflow is paid over time.
|
Our ability to reprice products is limited and may not compensate for deviations from our expected insurance assumptions.
Although some of our products permit us to increase premiums or adjust other charges and credits during the life of the policy or contract, the adjustments permitted under the terms of the policies or contracts may not be sufficient to maintain profitability or may cause the policies or contracts to lapse. For example, for our long-term care insurance products, our assumptions for reserves for future policy benefits have factored in an estimate of the timing and amount of anticipated and yet-to-be-filed premium increases which will require state approval. Our actual experience obtaining pricing increases could be materially different than what we have assumed, resulting in further policy liability increases which could be material. Many of our products do not permit us to increase premiums or adjust other charges and credits or limit those adjustments during the life of the policy or contract. Even if permitted under the policy or contract, we may not be able or willing to raise premiums or adjust other charges sufficiently, or at all. Accordingly, significant deviations in actual experience from our pricing assumptions could have an adverse effect on the profitability of our products.
Market Risk
The profitability of many of our insurance and annuity products, as well as the fees we earn in our investment management business, are subject to market risk. Market risk is the risk of loss from changes in interest rates, equity prices and foreign currency exchange rates.
The profitability of many of our insurance and annuity products depends in part on the value of the separate accounts supporting these products, which can fluctuate substantially depending on market conditions. Market conditions resulting in reductions in the value of assets we manage has an adverse effect on the revenues and profitability of our investment management business, which depends on fees related primarily to the value of assets under management, and could decrease the value of our strategic investments.
Derivative instruments we use to hedge and manage foreign exchange, interest rate and equity market risks associated with our products and businesses, and other risks might not perform as intended or expected, resulting in higher than expected realized losses and stresses on liquidity. Market conditions can limit availability of hedging instruments, require us to post additional collateral, and further increase the cost of executing product related hedges and such costs may not be recovered in the pricing of the underlying products being hedged.
35
Market risk may limit opportunities for investment of available funds at appropriate returns, including due to the current low interest rate environment, or other factors, with possible negative impacts on our overall results. Limited opportunities for attractive investments may lead to holding cash for long periods of time and increased use of derivatives for duration management and other portfolio management purposes. The increased use of derivatives may increase the volatility of our U.S. GAAP results and our statutory capital.
Our investments, results of operations and financial condition may also be adversely affected by developments in the global economy, in the U.S. economy (including as a result of actions by the Federal Reserve with respect to monetary policy, and adverse political developments), and in the Japanese economy (including due to the effects of inflation or deflation, interest rate volatility, changes in the Japan sovereign credit rating, and material changes in the value of the Japanese yen relative to the U.S. dollar). Global, U.S. or Japanese economic activity and financial markets may in turn be negatively affected by adverse developments or conditions in specific geographical regions.
For a discussion of the impact of changes in market conditions on our financial condition see “Quantitative and Qualitative Disclosures About Market Risk.”
Our insurance and annuity products and certain of our investment products, and our investment returns, are subject to interest rate risk, which is the risk of loss arising from asset/liability duration mismatches within our general account investments as well as invested assets of other entities and operations
.
The risk of mismatch in asset/liability duration is mainly driven by the specific dynamics of product liabilities. Some product liabilities are expected to have only modest risk related to interest rates because cash flows can be matched by available assets in the investable space. The interest rate risk emerges primarily from their tail cash flows (30 years or more), which cannot be matched by assets for sale in the marketplace, exposing the Company to future reinvestment risk. Market-sensitive cash flows exist with other product liabilities including products whose cash flows can be linked to market performance through secondary guarantees, minimum crediting rates, and/or changes in insurance assumptions.
Our exposure to interest rates can manifest over years as in the case of earnings compression or in the short term by creating volatility in both earnings and capital. For example, some of our products expose us to the risk that changes in interest rates will reduce the spread between the amounts that we are required to pay under contracts and the rate of return we are able to earn on our general account investments supporting these contracts. When interest rates decline or remain low, as they have in recent years, we must invest in lower-yielding instruments, potentially reducing net investment income and constraining our ability to offer certain products. This risk is increased as more policyholders may retain their policies in a low rate environment. Since many of our policies and contracts have guaranteed minimum crediting rates or limit the resetting of crediting rates, the spreads could decrease or go negative.
Alternatively, when interest rates rise, we may not be able to replace the assets in our general account with the higher-yielding assets as quickly as needed to fund the higher crediting rates necessary to keep these products and contracts competitive. It is possible that fewer policyholders may retain their policies and annuity contracts as they pursue higher crediting rates, which could expose the Company to losses and liquidity stress. In addition, rising interest rates could cause a decline in the market value of fixed income assets the Company manages which in turn could result in lower asset management fees earned.
Our mitigation efforts with respect to interest rate risk are primarily focused on maintaining an investment portfolio with diversified maturities that has a key rate duration profile that is approximately equal to the key rate duration profile of our liability and surplus benchmarks; however, these benchmarks are based on estimates of the liability cash flow profiles which are complex and could turn out to be inaccurate, especially when markets are volatile. In addition, there are practical and capital market limitations on our ability to accomplish this matching. Due to these and other factors we may need to liquidate investments prior to maturity at a loss in order to satisfy liabilities or be forced to reinvest funds in a lower rate environment.
Our significant business operations outside the U.S. subject us to foreign exchange risk, which is
the risk of loss arising from assets that are invested in a different currency than the related liability, as well as the unhedged portion of the Company’s earnings from, and capital supporting, operations in a foreign currency
.
As a U.S.-based company with significant business operations outside of the U.S., particularly in Japan, we are exposed to foreign currency exchange rate risk related to these operations, as well as in our investment portfolio. Fluctuations in foreign currency exchange rates could adversely affect our profitability, financial condition and cash flows, as well as increase the volatility of our results of operations under U.S. GAAP. In the short-term, solvency margins in our Japan businesses can also be impacted by fluctuations in exchange rates.
36
For our International Insurance operations, our Retirement segment’s earnings on non-U.S. dollar-denominated longevity reinsurance contracts and PGIM’s investment activities based in currencies other than the U.S. dollar, changes in foreign currency exchange rates create risk that we may experience volatility in the U.S. dollar-equivalent earnings and equity of these operations. We seek to manage this risk through various hedging strategies, including the use of foreign currency hedges and through holding U.S. dollar-denominated securities in the investment portfolios of certain of these operations. Additionally, our Japanese insurance operations offer a variety of non-Japanese yen denominated products. We seek to mitigate this risk by holding investments in corresponding currencies. For certain of our international insurance operations outside of Japan, we elect to not hedge the risk of changes in our subsidiary equity investments due to foreign exchange rate movements.
For our domestic investment portfolios supporting our U.S. insurance operations and other proprietary investment portfolios, our foreign currency exchange rate risk arises primarily from investments that are denominated in foreign currencies. We manage this risk by hedging substantially all domestic foreign currency-denominated fixed-income investments into U.S. dollars. We generally do not hedge all of the foreign currency risk of our investments in equity securities of unaffiliated foreign entities. The value and liquidity of our foreign currency investments could be adversely affected by local market, economic and financial conditions. For example, our investments denominated in euro could be adversely affected by unfavorable economic conditions in Europe, including due to potential changes in the euro or to the structure or membership of the European Union, and in 2016 we experienced volatility in U.K. and other European Union related investments as a result of the U.K.’s referendum to exit the European Union.
There can be no assurance that our hedging and other strategies will effectively mitigate foreign exchange risk. For a discussion of our hedging program and the impact of foreign currency exchange rates on our business, see “Management’s Discussion and Analysis of Financial Condition and Results of Operations—Impact of Foreign Currency Exchange Rates.”
Guarantees within certain of our products, in particular our variable annuities and to a lesser extent certain individual life and international insurance products, are market sensitive and may decrease our earnings or increase the volatility of our results of operations or financial position under U.S. GAAP.
Certain of our products, particularly our variable annuity products and to a lesser extent certain individual life and international insurance products, include guarantees of minimum surrender values or income streams for stated periods or for life, which may be in excess of account values. Downturns in equity markets, increased equity volatility, increased credit spreads, or (as discussed above) reduced interest rates could result in an increase in the valuation of liabilities associated with such guarantees, resulting in increases in reserves and reductions in net income. We use a variety of hedging and risk management strategies, including product features, to mitigate these risks in part and we may periodically change our strategies over time. These strategies may, however, not be fully effective. In addition, we may be unable or may choose not to fully hedge these risks. Hedging instruments may not effectively offset the costs of guarantees or may otherwise be insufficient in relation to our obligations. Hedging instruments also may not change in value correspondingly with associated liabilities due to equity market or interest rate conditions, non-performance risk or other reasons. We may choose to hedge these risks on a basis that does not correspond to their anticipated or actual impact upon our results of operations or financial position under U.S. GAAP. Changes from period to period in the valuation of these policy benefits, and in the amount of our obligations effectively hedged, will result in volatility in our results of operations and financial position under U.S. GAAP and the statutory capital levels of our insurance subsidiaries. Estimates and assumptions we make in connection with hedging activities may fail to reflect or correspond to our actual long-term exposure from our guarantees. Further, the risk of increases in the costs of our guarantees not covered by our hedging and other capital and risk management strategies may become more significant due to changes in policyholder behavior driven by market conditions or other factors. The above factors, individually or collectively, may have a material adverse effect on our results of operations, financial condition or liquidity.
Our valuation of the liabilities for the minimum benefits contained in many of our variable annuity products requires us to consider the market perception of our risk of non-performance, and a decrease in our own credit spreads resulting from ratings upgrades or other events or market conditions could cause the recorded value of these liabilities to increase, which in turn could adversely affect our results of operations and financial position.
Liquidity Risk
As a financial services company, we are exposed to liquidity risk, which is the risk that the Company is unable to meet near-term obligations as they come due.
Liquidity risk is a manifestation of events that are driven by other risk types (market, insurance, investment, operational). A liquidity shortfall may arise in the event of insufficient funding sources or an immediate and significant need for cash or collateral. In addition, it is possible that expected liquidity sources, such as our credit facilities, may be unavailable or inadequate to satisfy the liquidity demands described below.
37
The Company has four primary sources of liquidity exposure and associated drivers that trigger material liquidity demand. Those sources are:
|
•
|
Derivative collateral market exposure:
Abrupt changes to interest rate, equity, and/or currency markets may increase collateral requirements to counterparties and create liquidity risk for the Company.
|
|
•
|
Asset liability mismatch:
There are liquidity risks associated with liabilities coming due prior to the matching asset cash flows. Structural maturities mismatch can occur in activities such as securities lending, where the liabilities are effectively overnight open transactions used to fund longer term assets.
|
|
•
|
Wholesale funding.
The Company depends upon the financial markets for funding (such as through the issuance of commercial paper, securities lending and repurchase arrangements and other forms of borrowings in the capital markets). These sources might not be available during times of stress, or may only be available on unfavorable terms, which can result in a decrease in our profitability and a significant reduction in our financial flexibility.
|
|
•
|
Insurance cash flows.
The Company faces potential liquidity risks from unexpected cash demands due to severe mortality calamity, customer withdrawals or lapse events. If such events were to occur, the Company may face unexpectedly high levels of claim payments to policyholders.
|
For a discussion of the Company’s liquidity and sources and uses of liquidity, including information about legal and regulatory limits on the ability of our subsidiaries to pay dividends, see “Management’s Discussion and Analysis of Financial Condition and Results of Operations—Liquidity and Capital Resources—Liquidity.”
Operational Risk
Our operations are exposed to the risk of loss resulting from inadequate or failed processes or systems, human error or misconduct, and as a result of external events.
An operational risk failure may result in one or more actual or potential impacts to the Company.
Operational Risk Types
|
•
|
Processes
- Processing failure; failure to safeguard or retain documents/records; errors in valuation/pricing models and processes; project management or execution failures; improper sales practices.
|
|
•
|
Systems
- Failures during the development and implementation of new systems; systems failures.
|
|
•
|
People
- Internal fraud, breaches of employment law, unauthorized activities; loss or lack of key personnel, inadequate training; inadequate supervision.
|
|
•
|
External Events
- External crime; outsourcing risk; vendor risk; natural and other disasters; changes in laws/regulations.
|
|
•
|
Legal
- Legal and regulatory compliance failures.
|
Potential Impacts
|
•
|
Financial losses
- The Company experiences a financial loss. This loss may originate from various causes including, but not limited to, transaction processing errors and fraud.
|
|
•
|
Customer impacts
- The Company may not be able to service customers. This may result if the Company is unable to continue operations during a business continuation event or if systems are compromised due to malware or virus.
|
|
•
|
Regulatory fines or sanctions
- When the Company fails to comply with applicable laws or regulations, regulatory fines or sanctions may be imposed. In addition, possible restrictions on business activities may result.
|
|
•
|
Legal actions
- Failure to comply with laws and regulations also exposes the Company to litigation risk. This may also result in financial losses.
|
Liabilities we may incur as a result of operational failures are described further under “Contingent Liabilities” in Note 22 to the Consolidated Financial Statements. In addition, certain pending regulatory and litigation matters affecting us, and certain risks to our businesses presented by such matters, are discussed in Note 22 to the Consolidated Financial Statements. We may become subject to additional regulatory and legal actions in the future.
Key Enterprise Operational Risks
- Key enterprise operational risks include the following:
38
We are subject to business continuation risk, which is the risk that our systems and data may be disrupted.
We depend heavily on our telecommunication, information technology and other operational systems and on the integrity and timeliness of data we use to run our businesses and service our customers. These systems may fail to operate properly or become disabled as a result of events or circumstances wholly or partly beyond our control. Further, we face the risk of operational and technology failures by others, including clearing agents, exchanges and other financial intermediaries and of vendors and parties to which we outsource the provision of services or business operations. We may experience a business continuation event as a result of:
|
•
|
Severe pandemic, either naturally occurring or intentionally manipulated pathogens.
|
|
•
|
Geo-political risks, including armed conflict and civil unrest.
|
|
•
|
Terrorist events.
|
|
•
|
A significant natural or accidental disaster.
|
We are subject to the risk that we may not adequately maintain information security
.
There continues to be significant and organized cyber-attack activity against western organizations, including but not limited to the financial services sector and no organization is fully immune to cyber-attacks. Risks related to cyber-attack arise in the following areas:
|
•
|
Protecting both “structured” and “unstructured” sensitive information is a constant need. However, some risks associated with trusted insiders (i.e., employees, consultants, or vendors who are authorized to access the Company’s systems) cannot be fully mitigated using technology or otherwise.
|
|
•
|
Unsuspecting employees represent a primary avenue for external parties to gain access to our network and systems. Many attacks, even from sophisticated actors, include rudimentary techniques such as coaxing an internal user to click on a malicious attachment or link to introduce malware or steal their username and password.
|
|
•
|
In the past, hackers went after credit and debit card data, which is easy to monetize. As credit card security improves, the hackers will look to other sources of monetization, specifically personally identifiable information or using cyber-attacks or the threat of cyber-attacks to extort money from companies. Insurance and retirement services companies are increasingly being targeted by hackers.
|
|
•
|
Nation-state sponsored organizations are engaged in cyber-attacks but not necessarily for monetization purposes. Nation states appear to be motivated by the desire to gain information about foreign citizens and governments or to influence or cause disruptions in commerce or political affairs.
|
|
•
|
We have also seen an increase in non-technical attempts to commit fraud or solicit information via call centers and interactive voice response systems, and we anticipate the attempts will become more common.
|
|
•
|
We rely on third parties to provide services as described further below. While we have certain standards for all vendors that provide us services, our vendors, and in turn, their own service providers, may become subject to a security breach, including as a result of their failure to perform in accordance with contractual arrangements.
|
We may not adequately ensure the privacy of sensitive data.
In the course of our ordinary business we collect, store and share with various third-parties (e.g., service providers, reinsurers, etc.) substantial amounts of private and confidential policyholder information, including in some instances sensitive health-related information. We are subject to the risk that the privacy of this information may be compromised, including as a result of an information security breach described above.
Third parties (outsourcing providers, vendors and suppliers and joint venture partners) present added operational risk to our enterprise.
The Company's business model relies heavily on the use of third parties to deliver contracted services in a broad range of areas. This presents the risk that the Company is unable to meet legal, regulatory, financial or customer obligations because third parties fail to deliver contracted services, or that the Company is exposed to reputational damage because third parties operate in a poorly controlled manner. We use affiliates and third-party vendors located outside the U.S. to provide certain services and functions, which also exposes us to business disruptions and political risks as a result of risks inherent in conducting business outside of the U.S. In our investments in which we hold a minority interest, or that are managed by third parties, we lack management and operational control over operations, which may subject us to additional operational, compliance and legal risks and prevent us from taking or causing to be taken actions to protect or increase the value of those investments. In those jurisdictions where we are constrained by law from owning a majority interest in jointly owned operations, our remedies in the event of a breach by a joint venture partner may be limited (e.g., we may have no ability to exercise a “call” option).
39
Affiliate and third-party distributors of our products present added regulatory, competitive and other risks to our enterprise.
Our products are sold primarily through our captive/affiliated distribution models and third-party distributing firms. Our captive/affiliated distribution models are made up of large numbers of decentralized sales personnel who are compensated based on commissions. The third-party distributing firms generally are not dedicated to us exclusively and may frequently recommend and/or market products of our competitors. Accordingly, we must compete intensely for their services. Our sales could be adversely affected if we are unable to attract, retain or motivate third-party distributing firms or if we do not adequately provide support, training, compensation, and education to this sales network regarding our products, or if our products are not competitive and not appropriately aligned with consumer needs. While third-party distributing firms have an independent regulatory accountability, some regulators have been clear with expectations that product manufacturers retain significant sales risk accountability.
In addition, there have been a number of investigations regarding the marketing practices of brokers and agents selling annuity and insurance products and the payments they receive. These investigations have resulted in enforcement actions against companies in our industry and brokers and agents marketing and selling those companies’ products. These investigations and enforcement actions could result in penalties and the imposition of corrective action plans and/or changes to industry practices, which could adversely affect our ability to market our products. Furthermore, if our products are distributed in an inappropriate manner, or to customers for whom they are unsuitable, or distributors of our products otherwise engage in misconduct, we may suffer reputational and other harm to our business and be subject to regulatory action.
Although we distribute our products through a wide variety of distribution channels, we do maintain relationships with certain key distributors. For example, a significant amount of our sales in Japan through banks is derived through a single major Japanese bank and a significant portion of our sales in Japan through Life Consultants is derived through a single association relationship. We periodically negotiate the terms of these relationships, and there can be no assurance that such terms will remain acceptable to us or such third parties. An interruption in certain key relationships could materially affect our ability to market our products and could have a material adverse effect on our business, operating results and financial condition. Distributors may elect to reduce or terminate their distribution relationships with us, including for such reasons as adverse developments in our business, adverse rating agency actions or concerns about market-related risks. We are also at risk that key distribution partners may merge, change their business models in ways that affect how our products are sold, or terminate their distribution contracts with us, or that new distribution channels could emerge and adversely impact the effectiveness of our distribution efforts. An increase in bank and broker-dealer consolidation activity could increase competition for access to distributors, result in greater distribution expenses and impair our ability to market products through these channels. Consolidation of distributors and/or other industry changes may also increase the likelihood that distributors will try to renegotiate the terms of any existing selling agreements to terms less favorable to us. Finally, we also may be challenged by new technologies and marketplace entrants that could interfere with our existing relationships.
As a financial services company, we are exposed to model risk, which is the risk of financial loss or reputational damage or adverse regulatory impacts caused by model errors or limitations, incorrect implementation of models, or misuse of or overreliance upon models.
Models are utilized by our businesses and corporate areas primarily to project future cash flows associated with pricing products, calculating reserves and valuing assets, as well as in evaluating risk and determining capital requirements, among other uses. These models may not operate properly and may rely on assumptions and projections that are inherently uncertain. As our businesses continue to grow and evolve, the number and complexity of models we utilize expands, increasing our exposure to error in the design, implementation or use of models, including the associated input data and assumptions.
Strategic Risk
We are subject to the risk of events that can cause our fundamental business model to change, either through a shift in the businesses in which we are engaged or a change in our execution.
In addition, tactical risks may become strategic risks. For example, interest rates remaining low for a long time may, at some point, cause us to change our sales goals, exit a certain business, and/or change our business model.
Changes in the regulatory landscape
may be unsettling to our business model.
New laws and regulations are being considered in the U.S. and our other countries of operation at an increasing pace, as there has been greater scrutiny on financial regulation over the past several years. Proposed or unforeseen changes in law or regulation may adversely impact our business. See “Business—Regulation” for a discussion of certain recently enacted and pending proposals by international, federal and state regulatory authorities and their potential impact on our business, including in the following areas:
|
•
|
Financial sector regulatory reform.
|
|
•
|
Tax laws (including U.S. federal, state, and non-U.S.), including BEAT and GILTI.
|
|
•
|
Fiduciary rules and other standards of care.
|
40
|
•
|
Our regulation under U.S. state insurance laws and developments regarding group-wide supervision and capital standards, RBC factors for invested assets and reserves for life insurance, variable annuities and other products.
|
|
•
|
Insurer capital standards in Japan, Korea and other non-U.S. jurisdictions.
|
|
•
|
Privacy and cybersecurity regulation.
|
Changes in accounting rules applicable to our business may also have an adverse impact on our results of operations or financial condition. For a discussion of accounting pronouncements and their potential impact on our business, including Accounting Standards Update (“ASU”) 2018-12, Financial Services - Insurance (Topic 944): Targeted Improvements to the Accounting for Long-Duration Contracts, see Note 2 to the Consolidated Financial Statements.
Technological changes
may be unsettling to our business model
.
We believe the following aspects of technological change would significantly impact our business model. There may be other unforeseen changes in technology which may have a significant impact on our business model.
|
•
|
Interaction with customers
. Technology is moving rapidly and as it does, it puts pressure on existing business models. Some of the changes we can anticipate are increased choices about how customers want to interact with the Company or how they want the Company to interact with them. Evolving customer preferences may drive a need to redesign products. Our distribution channels may change to become more automated, at the place and time of the customer’s choosing. Such changes clearly have the potential to disrupt our business model over the next 10 years.
|
|
•
|
Investment Portfolio
. Technology may have a significant impact on the companies in which the Company invests. For example, environmental concerns spur scientific inquiry which may re-position the relative attractiveness of wind or sun power over oil and gas. The transportation industry may favor alternative modes of conveyance of goods which may shift trucking or air transport out of favor. Consumers may change their purchasing behavior to favor online activity which would change the role of malls and retail properties.
|
|
•
|
Medical Advances
. The Company is exposed to the impact of medical advances in two major ways. Genetic testing and the availability of that information unequally to consumers and insurers can bring anti-selection risks. Specifically, data from genetic testing can give our prospective customers a clearer view into their future, allowing them to select products protecting them against likelihoods of mortality or longevity with more precision. Also, technologies that extend lives will challenge our actuarial assumptions especially in the annuity-based businesses.
|
Other factors may be unsettling to our business model. The following items are examples of those which, among others, could have a meaningful impact on our business.
|
•
|
Changes to either the policies and procedures the Company uses to locate guaranteed group annuity customers, or its reserving policies for its guaranteed group annuities, may result in increased operational expenses and complexity, and increases in reserves, which could adversely impact our results of operations and financial position.
The Company’s retirement business provides guaranteed group annuity benefits under group annuity and structured settlement contracts. Under our policies and procedures, we use internal and external tools and resources to locate customers covered by our guaranteed group annuity benefits. We also have policies on the development of our reserve estimates, and we believe that we are complying with our policies and procedures and meeting our obligations to customers. In light of industry focus on missing retirement customers, the Company has reviewed this issue closely and made enhancements to its processes. In addition, the Company continues to regularly review, test and enhance the processes and tools used to locate customers, and over time, such processes and tools are expected to continue to evolve. However, in the normal course of business, at any given time there are a small number of customers that we cannot locate. Ultimately, we could see greater standardization of what may currently be divergent practices across the industry. Changes to either the policies and procedures the Company uses to locate customers, or its reserving policies, may result in increased operational expenses and complexity, and increases in reserves, which could adversely impact our results of operations and financial position.
|
41
|
•
|
A downgrade in our financial strength or credit ratings could potentially, among other things, adversely impact our business prospects, results of operations, financial condition and liquidity
. For a discussion of our ratings and the potential impact of a ratings downgrade on our business, see “Management’s Discussion and Analysis of Financial Condition and Results of Operations—Liquidity and Capital Resources—Ratings.” We cannot predict what additional actions rating agencies may take, or what actions we may take in response to the actions of rating agencies, which could adversely affect our business. Our ratings could be downgraded at any time and without notice by any rating agency. In addition, a sovereign downgrade could result in a downgrade of our subsidiaries operating in that jurisdiction, and ultimately of Prudential Financial and our other subsidiaries. For example, in September 2015, S&P downgraded Japan's sovereign rating to A+ with a 'Stable' outlook citing uncertainties around the strength of economic growth and weak fiscal positions. As a result, S&P subsequently lowered the ratings of a number of institutions in Japan, including our Japanese insurance subsidiaries. It is possible that Japan’s sovereign rating could be subject to further downgrades, which would result in further downgrades of our insurance subsidiaries in Japan. Given the importance of our operations in Japan to our overall results, such downgrades could lead to a downgrade of Prudential Financial and our domestic insurance companies.
|
|
•
|
The elimination of London Inter-Bank Offered Rate (“LIBOR”) may adversely affect the interest rates on and value of certain derivatives and floating rate securities we hold and floating rate securities we have issued, the value and profitability of certain real estate lending and other activities conducted in PGIM, and any other assets or liabilities whose value is tied to LIBOR.
Actions by regulators have resulted in the establishment of alternative reference rates to LIBOR in most major currencies. On July 27, 2017, the U.K. Financial Conduct Authority announced that it intends to stop persuading or compelling banks to submit LIBOR rates after 2021. However, it remains unclear if, how and in what form, LIBOR will continue to exist. The U.S. Federal Reserve, based on the recommendations of the New York Federal Reserve’s Alternative Reference Rate Committee (constituted of major derivative market participants and their regulators), has begun publishing a Secured Overnight Funding Rate (“SOFR”) which is intended to replace U.S. dollar LIBOR, and SOFR-based investment products have been issued in the U.S. Proposals for alternative reference rates for other currencies have also been announced or have already begun publication. Markets are slowly developing in response to these new rates and questions around liquidity in these rates and how to appropriately adjust these rates to eliminate any economic value transfer at the time of transition remain a significant concern for us and others in the marketplace. The effect of any changes or reforms to LIBOR or discontinuation of LIBOR on new or existing financial instruments to which we have exposure or the activities in our businesses will vary depending on (1) existing fallback provisions in individual contracts and (2) whether, how, and when industry participants develop and widely adopt new reference rates and fallbacks for both legacy and new products or instruments. Accordingly, it is difficult to predict the full impact of the transition away from LIBOR on certain derivatives and floating rate securities we hold, securities we have issued, real estate lending, and other activities we conduct in PGIM, and any other assets or liabilities, as well as contractual rights and obligations, whose value is tied to LIBOR. The value or profitability of these products and instruments may be adversely affected.
|
|
•
|
The changing competitive landscape may adversely affect the Company.
In each of our businesses we face intense competition from insurance companies, asset managers and diversified financial institutions, both for the ultimate customers for our products and, in many businesses, for distribution through non-affiliated distribution channels. Technological advances, changing customer expectations, including related to digital offerings, or other changes in the marketplace may present opportunities for new or smaller competitors without established products or distribution channels to meet consumers’ increased expectations more efficiently than us. Fintech and insurtech companies have the potential to disrupt industries globally, and many participants have been partially funded by industry players. For example, in PGIM, we expect to see continued pressure on fees given the focus on passive investment and the growth of the robo-advice channel.
|
|
•
|
Climate change may increase the severity and frequency of calamities, or adversely affect our investment portfolio.
Climate change may increase the frequency and severity of weather related disasters and pandemics. In addition, climate change regulation may affect the prospects of companies and other entities whose securities we hold, or our willingness to continue to hold their securities. It may also impact other counterparties, including reinsurers, and affect the value of investments, including real estate investments we hold or manage for others. We cannot predict the long-term impacts on us from climate change or related regulation.
|
|
•
|
Market conditions and other factors may adversely impact product sales or increase expenses. Examples include:
|
|
◦
|
A change in market conditions, such as high inflation and high interest rates, could cause a change in consumer sentiment and behavior adversely affecting sales and persistency of our savings and protection products. Conversely, low inflation and low interest rates could cause persistency of these products to vary from that anticipated and adversely affect profitability. Similarly, changing economic conditions and unfavorable public perception of financial institutions can influence customer behavior, including increasing claims or surrenders in certain products.
|
42
|
◦
|
Sales of our investment-based and asset management products and services may decline, and lapses and surrenders of certain insurance products and withdrawals of assets from investment products may increase if a market downturn, increased market volatility or other market conditions result in customers becoming dissatisfied with their investments or products.
|
|
◦
|
Changes in our discount rate, expected rate of return, life expectancy, health care cost and assumptions regarding compensation increases for our pension and other postretirement benefit plans may result in increased expenses and reduce our profitability.
|
|
•
|
Our reputation may be adversely impacted if any of the risks described in this section are realized.
Reputational risk
could manifest from any of the risks as identified in the Company’s risk identification process. Failure to effectively manage risks across a broad range of risk issues exposes the Company to reputational harm. If the Company were to suffer a significant loss in reputation, both policyholders and counterparties could seek to exit existing relationships. Additionally, large changes in credit worthiness, especially credit ratings, could impact access to funding markets while creating additional collateral requirements for existing relationships. The mismanagement of any such risks may potentially damage our reputational asset. Our business is anchored in the strength of our brand, our alignment to our values, and our proven commitment to keep our promises to our customers. Any negative public perception, founded or otherwise, can be widely and rapidly shared over social media or other means, and could cause damage to our reputation.
|
|
ITEM 1B.
|
UNRESOLVED STAFF COMMENTS
|
None.
|
ITEM 2.
|
PROPERTIES
|
We own our headquarters building located at 751 Broad Street, Newark, New Jersey, which comprises approximately 0.6 million square feet. Excluding our headquarters building and properties used by the International Insurance division and the international investment operations of our PGIM segment, which are discussed below, as of December 31, 2018, we own eight and lease eleven other principal properties throughout the U.S., some of which are used for home office functions. Our domestic operations also lease 189 other locations throughout the U.S.
For our International Insurance segment, as of December 31, 2018, we own five home offices located in Japan, Korea, Taiwan, Brazil and Argentina, and lease four home offices located in Brazil, Italy, Mexico and Malaysia. We also own approximately 100 and lease approximately 530 other properties, primarily field offices, located throughout these same countries. For our PGIM segment, which includes our international investment operations, as of December 31, 2018, we lease two home offices located in Japan and Taiwan. We also lease 12 international principal properties located in Mexico, Japan, Hong Kong, Singapore, Korea, Germany, Australia, France, Luxembourg, the U.K. and China, in addition to six other branch and field offices within Europe and Asia.
We believe our properties are adequate and suitable for our business as currently conducted and are adequately maintained. The above properties do not include properties we own solely for investment purposes.
|
ITEM 3.
|
LEGAL PROCEEDINGS
|
See Note 22 to the Consolidated Financial Statements under “—Litigation and Regulatory Matters” for a description of certain pending litigation and regulatory matters affecting us, and certain risks to our businesses presented by such matters.
|
ITEM 4.
|
MINE SAFETY DISCLOSURES
|
Not applicable.
PART II
|
ITEM 5.
|
MARKET FOR REGISTRANT’S COMMON EQUITY, RELATED STOCKHOLDER MATTERS AND ISSUER PURCHASES OF EQUITY SECURITIES
|
General
43
Prudential Financial’s Common Stock trades on the New York Stock Exchange under the symbol “PRU.” On
January 31, 2019
, there were 1,257,264 registered holders of record for the Common Stock and 409 million shares outstanding.
Issuer Purchases of Equity Securities
The following table provides information about purchases by the Company during the three months ended
December 31, 2018
, of its Common Stock.
|
Period
|
Total Number of
Shares
Purchased(1)
|
Average
Price Paid
per Share
|
Total Number of
Shares Purchased
as Part of
Publicly Announced
Program(2)
|
Approximate Dollar Value of Shares that May Yet Be Purchased under the Program(2)
|
||||||||||
|
October 1, 2018 through October 31, 2018
|
1,279,296
|
|
$
|
98.33
|
|
1,271,136
|
|
|||||||
|
November 1, 2018 through November 30, 2018
|
1,332,660
|
|
$
|
93.98
|
|
1,329,967
|
|
|||||||
|
December 1, 2018 through December 31, 2018
|
1,489,122
|
|
$
|
84.10
|
|
1,486,327
|
|
|||||||
|
Total
|
4,101,078
|
|
$
|
91.75
|
|
4,087,430
|
|
$
|
0
|
|
||||
__________
|
(1)
|
Includes shares of Common Stock withheld from participants for income tax withholding purposes whose shares of restricted stock units vested during the period. Such restricted stock units were originally issued to participants pursuant to the Prudential Financial Inc. Omnibus Incentive Plan.
|
|
(2)
|
In December 2017, Prudential Financial’s Board of Directors authorized the Company to repurchase at management’s discretion up to $1.5 billion of its outstanding Common Stock during the period from January 1, 2018 through December 31, 2018.
|
In December 2018, Prudential Financial’s Board of Directors authorized the Company to repurchase, at management’s discretion, up to $2.0 billion of its outstanding Common Stock during the period from January 1, 2019 through December 31, 2019.
|
ITEM 6.
|
SELECTED FINANCIAL DATA
|
We derived the selected consolidated income statement data for the years ended December 31, 2018, 2017 and 2016 and the selected consolidated balance sheet data as of December 31, 2018 and 2017, from our Consolidated Financial Statements included elsewhere herein. We derived the selected consolidated income statement data for the years ended December 31, 2015 and 2014, and the selected consolidated balance sheet data as of December 31, 2016, 2015 and 2014, from consolidated financial statements not included herein.
Prior to January 1, 2018, the Company’s Gibraltar Life Insurance Company, Ltd. (“Gibraltar Life”) consolidated operations used a November 30 fiscal year end for purposes of inclusion in the Company’s Consolidated Financial Statements. The result of this reporting date difference was a one-month reporting lag for Gibraltar Life. As a result, the Company’s consolidated balance sheet as of December 31 previously included the assets and liabilities of Gibraltar Life as of November 30 for each respective year, and the Company’s consolidated income statement data for the years ended December 31 included Gibraltar Life’s results of operations for the twelve months ended November 30 for each respective year.
Effective January 1, 2018, the Company converted its Gibraltar Life operations to a December 31 fiscal year end. This action eliminated the one-month reporting lag so that the reporting dates and periods of financial balances and results of Gibraltar Life are consistent with those of the Company. The establishment of a new fiscal year end for Gibraltar Life is considered a change in accounting principle to a preferable method and requires retrospective application. The Company believes this change in accounting principle is preferable given that it aligns the reporting dates of Prudential Financial and its subsidiaries, which allows for a more timely and consistent basis of reporting the financial position and results of Gibraltar Life. In order to effect this elimination, the Company restated prior periods’ equity which increased “Retained Earnings” by approximately
$167 million
as of December 31, 2015, 2016 and 2017. The impact to the Statements of Operations, Statements of Cash Flows, Statements of Comprehensive Income and other balance sheet captions, as a result of the elimination of the reporting lag, was not material for any of the periods presented.
This selected consolidated financial information should be read in conjunction with our MD&A and Consolidated Financial Statements included elsewhere herein.
44
|
|
Year Ended December 31,
|
||||||||||||||||||
|
|
2018
|
2017
|
2016
|
2015
|
2014
|
||||||||||||||
|
|
(in millions, except per share and ratio information)
|
||||||||||||||||||
|
Income Statement Data:
|
|||||||||||||||||||
|
Revenues:
|
|||||||||||||||||||
|
Premiums
|
$
|
35,779
|
|
$
|
32,091
|
|
$
|
30,964
|
|
$
|
28,521
|
|
$
|
29,293
|
|
||||
|
Policy charges and fee income
|
6,002
|
|
5,303
|
|
5,906
|
|
5,972
|
|
6,179
|
|
|||||||||
|
Net investment income
|
16,176
|
|
16,435
|
|
15,520
|
|
14,829
|
|
15,256
|
|
|||||||||
|
Asset management and service fees
|
4,100
|
|
4,127
|
|
3,752
|
|
3,772
|
|
3,719
|
|
|||||||||
|
Other income (loss)
|
(1,042
|
)
|
1,301
|
|
443
|
|
0
|
|
(1,978
|
)
|
|||||||||
|
Realized investment gains (losses), net
|
1,977
|
|
432
|
|
2,194
|
|
4,025
|
|
1,636
|
|
|||||||||
|
Total revenues
|
62,992
|
|
59,689
|
|
58,779
|
|
57,119
|
|
54,105
|
|
|||||||||
|
Benefits and expenses:
|
|||||||||||||||||||
|
Policyholders’ benefits
|
39,404
|
|
33,794
|
|
33,632
|
|
30,627
|
|
31,587
|
|
|||||||||
|
Interest credited to policyholders’ account balances
|
3,196
|
|
3,822
|
|
3,761
|
|
3,479
|
|
4,263
|
|
|||||||||
|
Dividends to policyholders
|
1,336
|
|
2,091
|
|
2,025
|
|
2,212
|
|
2,716
|
|
|||||||||
|
Amortization of deferred policy acquisition costs
|
2,273
|
|
1,580
|
|
1,877
|
|
2,120
|
|
1,973
|
|
|||||||||
|
General and administrative expenses
|
11,949
|
|
11,915
|
|
11,779
|
|
10,912
|
|
11,807
|
|
|||||||||
|
Total benefits and expenses
|
58,158
|
|
53,202
|
|
53,074
|
|
49,350
|
|
52,346
|
|
|||||||||
|
Income (loss) from continuing operations before income taxes and equity in earnings of operating joint ventures
|
4,834
|
|
6,487
|
|
5,705
|
|
7,769
|
|
1,759
|
|
|||||||||
|
Total income tax expense (benefit)
|
822
|
|
(1,438
|
)
|
1,335
|
|
2,072
|
|
349
|
|
|||||||||
|
Income (loss) from continuing operations before equity in earnings of operating joint ventures
|
4,012
|
|
7,925
|
|
4,370
|
|
5,697
|
|
1,410
|
|
|||||||||
|
Equity in earnings of operating joint ventures, net of taxes
|
76
|
|
49
|
|
49
|
|
15
|
|
16
|
|
|||||||||
|
Income (loss) from continuing operations
|
4,088
|
|
7,974
|
|
4,419
|
|
5,712
|
|
1,426
|
|
|||||||||
|
Income (loss) from discontinued operations, net of taxes
|
0
|
|
0
|
|
0
|
|
0
|
|
12
|
|
|||||||||
|
Net income (loss)
|
4,088
|
|
7,974
|
|
4,419
|
|
5,712
|
|
1,438
|
|
|||||||||
|
Less: Income (loss) attributable to noncontrolling interests
|
14
|
|
111
|
|
51
|
|
70
|
|
57
|
|
|||||||||
|
Net income (loss) attributable to Prudential Financial, Inc.
|
$
|
4,074
|
|
$
|
7,863
|
|
$
|
4,368
|
|
$
|
5,642
|
|
$
|
1,381
|
|
||||
|
EARNINGS PER SHARE(1)
|
|||||||||||||||||||
|
Basic earnings per share—Common Stock:
|
|||||||||||||||||||
|
Income (loss) from continuing operations attributable to Prudential Financial, Inc.
|
$
|
9.64
|
|
$
|
18.19
|
|
$
|
9.85
|
|
$
|
12.37
|
|
$
|
3.23
|
|
||||
|
Income (loss) from discontinued operations, net of taxes
|
0.00
|
|
0.00
|
|
0.00
|
|
0.00
|
|
0.02
|
|
|||||||||
|
Net income (loss) attributable to Prudential Financial, Inc.
|
$
|
9.64
|
|
$
|
18.19
|
|
$
|
9.85
|
|
$
|
12.37
|
|
$
|
3.25
|
|
||||
|
Diluted earnings per share—Common Stock:
|
|||||||||||||||||||
|
Income (loss) from continuing operations attributable to Prudential Financial, Inc.
|
$
|
9.50
|
|
$
|
17.86
|
|
$
|
9.71
|
|
$
|
12.17
|
|
$
|
3.20
|
|
||||
|
Income (loss) from discontinued operations, net of taxes
|
0.00
|
|
0.00
|
|
0.00
|
|
0.00
|
|
0.03
|
|
|||||||||
|
Net income (loss) attributable to Prudential Financial, Inc.
|
$
|
9.50
|
|
$
|
17.86
|
|
$
|
9.71
|
|
$
|
12.17
|
|
$
|
3.23
|
|
||||
|
Dividends declared per share—Common Stock
|
$
|
3.60
|
|
$
|
3.00
|
|
$
|
2.80
|
|
$
|
2.44
|
|
$
|
2.17
|
|
||||
__________
|
(1)
|
For 2018, 2017, 2016 and 2015, represents consolidated earnings per share of Common Stock. For 2014, represents earnings of the Company’s former Financial Services Businesses per share of Common Stock.
|
45
|
|
As of December 31,
|
||||||||||||||||||
|
|
2018
|
2017
|
2016
|
2015
|
2014
|
||||||||||||||
|
|
(in millions)
|
||||||||||||||||||
|
Balance Sheet Data:
|
|||||||||||||||||||
|
Total investments excluding policy loans
|
$
|
467,229
|
|
$
|
457,980
|
|
$
|
432,485
|
|
$
|
405,535
|
|
$
|
408,274
|
|
||||
|
Separate account assets
|
279,136
|
|
306,617
|
|
287,636
|
|
285,570
|
|
296,435
|
|
|||||||||
|
Total assets
|
815,078
|
|
832,136
|
|
784,177
|
|
757,470
|
|
766,526
|
|
|||||||||
|
Future policy benefits and policyholders’ account balances
|
424,184
|
|
405,506
|
|
386,113
|
|
361,168
|
|
353,916
|
|
|||||||||
|
Separate account liabilities
|
279,136
|
|
306,617
|
|
287,636
|
|
285,570
|
|
296,435
|
|
|||||||||
|
Short-term debt
|
2,451
|
|
1,380
|
|
1,133
|
|
1,216
|
|
3,839
|
|
|||||||||
|
Long-term debt
|
17,378
|
|
17,172
|
|
18,041
|
|
19,594
|
|
19,702
|
|
|||||||||
|
Total liabilities
|
766,047
|
|
777,625
|
|
737,922
|
|
715,380
|
|
724,177
|
|
|||||||||
|
Prudential Financial, Inc. equity
|
48,617
|
|
54,236
|
|
46,030
|
|
42,057
|
|
41,770
|
|
|||||||||
|
Noncontrolling interests
|
414
|
|
275
|
|
225
|
|
33
|
|
579
|
|
|||||||||
|
Total equity
|
$
|
49,031
|
|
$
|
54,511
|
|
$
|
46,255
|
|
$
|
42,090
|
|
$
|
42,349
|
|
||||
46
|
ITEM 7.
|
MANAGEMENT’S DISCUSSION AND ANALYSIS OF FINANCIAL CONDITION AND RESULTS OF OPERATIONS
|
TABLE OF CONTENTS
|
|
Page
|
47
Certain of the statements included in this section constitute forward-looking statements within the meaning of the U.S. Private Securities Litigation Reform Act of 1995. Forward-looking statements are made based on management’s current expectations and beliefs concerning future developments and their potential effects upon Prudential Financial, Inc. and its subsidiaries. Prudential Financial, Inc.’s actual results may differ, possibly materially, from expectations or estimates reflected in such forward-looking statements. Certain important factors that could cause actual results to differ, possibly materially, from expectations or estimates reflected in such forward-looking statements can be found in the “Risk Factors” and “Forward-Looking Statements” sections herein.
Overview
Our principal operations are comprised of five divisions, which together encompass seven segments, and our Corporate and Other operations. The PGIM division is comprised of our PGIM segment (formerly named the Investment Management segment). The U.S. Workplace Solutions division consists of our Retirement and Group Insurance segments. The U.S. Individual Solutions division consists of our Individual Annuities and Individual Life segments. The International Insurance division consists of our International Insurance segment, and the Closed Block division consists of our Closed Block segment. Our Corporate and Other operations include corporate items and initiatives that are not allocated to business segments and businesses that have been or will be divested or placed in run-off.
Revenues and Expenses
We earn our revenues principally from insurance premiums; mortality, expense, asset management and administrative fees from insurance and investment products; and investment of general account and other funds. We receive premiums primarily from the sale of certain individual life insurance, group life and disability insurance, retirement and annuity contracts. We earn mortality, expense, and asset management fees primarily from the sale and servicing of separate account products including variable life insurance and variable annuities, and from the sale and servicing of other products including universal life insurance. We also earn asset management and administrative fees from the distribution, servicing and management of mutual funds, retirement products and other investment management products and services. Our operating expenses principally consist of insurance benefits provided and reserves established for anticipated future insurance benefits, general business expenses, dividends to policyholders, commissions and other costs of selling and servicing our products and interest credited on general account liabilities.
Profitability
Our profitability depends principally on our ability to price our insurance and annuity products at a level that enables us to earn a margin over the costs associated with providing benefits and administering those products. Profitability also depends on, among other items, our actuarial and policyholder behavior experience on insurance and annuity products, and our ability to attract and retain customer assets, generate and maintain favorable investment results, effectively deploy capital and utilize our tax capacity, and manage expenses.
Historically, the participating products included in the Closed Block have yielded lower returns on capital invested than many of our other businesses. As we have ceased offering domestic participating products, we expect that the proportion of the traditional participating products in our in-force business will gradually diminish as these older policies age, and we grow other businesses. However, the relatively lower returns to us on this existing block of business will continue to affect our consolidated results of operations for many years.
Outlook
Management expects that results in 2019 will continue to benefit from our differentiated mix of market-leading businesses that complement each other to provide competitive advantages. Our mix of high-quality protection, retirement and investment management businesses creates growth potential due to earnings diversification and the opportunity to provide customers with integrated cross-business solutions, as well as capital benefits from a balanced risk profile. While challenges exist in the form of a low interest rate environment (see “Impact of a Low Interest Rate Environment”), fee compression in certain of our businesses and other market factors, we expect that our choice of businesses coupled with strong execution will produce attractive returns.
48
We are well positioned to meet the needs of customers and tap into significant market opportunities through our U.S. Financial Wellness businesses, PGIM, our investment management business and our International Insurance business. U.S. Financial Wellness represents our Workplace Solutions and Individual Solutions businesses. We see an opportunity to address the evolving needs of individual customers, workplace clients, and society at large through our increasingly important financial wellness solutions. We possess the key components to execute on this strategy, including a workplace platform covering twenty million individuals; solutions that cover protection, retirement, savings, income, and investment needs; and a customer-centric approach with different ways to engage with our clients through multiple channels such as meeting with one of our financial advisors, calling or video-conferencing with an advisor, or interacting with us in a purely digital manner. Our goal is to meet our customers’ needs when, where and how they want. By leveraging technology and our scale, we can significantly expand the addressable market, build deeper and longer-lasting relationships with customers and clients, and make a meaningful difference in the financial wellness of their lives.
PGIM has also produced differentiated outcomes with strong investment performance that has led to consistently positive annual net institutional flows over the past sixteen years. In addition to providing solutions for its third-party clients, PGIM provides our U.S. Financial Wellness and International Insurance businesses with a competitive advantage through its investment expertise across a broad array of asset classes, including specialty classes such as real estate, private placements, and commercial mortgages.
Our International Insurance business includes our world-class Japanese life insurance operation and investments in high-growth markets with large populations such as Brazil, India, Indonesia and China. We approach these markets in a differentiated way, and that has led to steady overall growth, attractive returns and significant capital generation.
In summary, we feel confident about our prospects for the future supported by our integrated and complementary businesses. Specific outlook considerations for each of our businesses include the following:
|
•
|
U.S. Workplace Solutions.
In our Retirement business we continue to provide products that respond to the needs of plan sponsors to manage risk and control their benefit costs, while ensuring we maintain appropriate pricing and return expectations under changing market conditions. Our differentiated capabilities and demonstrated execution in the pension risk transfer business is expected to continue to generate attractive growth opportunities. We expect, however, that growth will not be linear given the episodic nature of larger cases, which is the segment of the market where we are most competitive and where the returns are the most compelling. In addition, while we foresee continuation of the spread and fee compression that we have been experiencing in our full-service business, we believe these are manageable headwinds. In our Group Insurance business, we are focused on expanding our Premier market segment, while maintaining a leadership position in the national segment. We are seeing benefits from our multi-year underwriting efforts, especially in our disability business where improved claims management and our continued pricing discipline have resulted in improvements to our benefits ratio. In both Retirement and Group Insurance, we believe our Financial Wellness platform provides meaningful differentiation in the market and is helping us build deeper customer relationships.
|
|
•
|
U.S. Individual Solutions.
Our Individual Annuities business remains focused on helping its customers meet their investment and retirement needs. We expect continued strong results and stable free cash flows, with near-term returns on assets above our long-term target. We expect to incur costs associated with our enhanced risk management strategy, but this program is expected to produce less volatile net income and cash flows, particularly in adverse scenarios. In addition, we expect a natural reduction in average fee rates due to the maturation of the existing block and due to sales of newer products which generally have lower rate structures. We expect the combination of these factors to cause our returns on assets to migrate to the long-term target over time. We continue to execute on our product diversification strategy and remain focused on a broad range of outcome-oriented solutions for customers. Our Individual Life business is continuing to execute on its product diversification strategy in order to maintain a diversified product mix and an attractive risk profile. We continue to deepen relationships with distribution partners while developing a more customer-oriented experience. Recent product actions could result in a slightly higher portion of sales in term and variable life as we remain committed to achieving a diversified product offering.
|
49
|
•
|
PGIM.
Our investment management business is focused on maintaining strong investment performance while leveraging both the scale of its approximately $1.2 trillion distinctive multi-manager model and Prudential enterprise relationships. PGIM is making targeted investments to further diversify its product offerings, expand its global investment and distribution footprint, selectively acquire new investment capabilities, and further strengthen external recognition as a leading global asset manager. These capabilities will enable PGIM to continue to meet our clients’ evolving needs and, in turn, to generate flows across multiple asset classes, client segments and geographies. Underpinning our growth strategy is our ability to continue to deliver robust investment performance, and to attract and retain high-caliber investment talent. While we are experiencing fee pressures, our average fee yield has remained relatively flat due to new flows coming into higher fee yielding strategies within fixed income, equities and alternatives such as real estate and private fixed income, and because of our diverse business profile.
|
|
•
|
International Insurance.
We continue to concentrate on deepening our presence in Japan and other markets in which we currently operate and expanding our distribution capabilities in emerging markets. We continue to focus on protection solutions and innovate as clients’ needs evolve. The returns on our death protection products are largely driven by mortality margins which helps mitigate the exposure of results to interest rates. We have seen a shift in sales mix with a greater emphasis on U.S. dollar-denominated products in Japan. We expect this trend to continue. We are also focused on achieving scale in select growth markets outsides of Japan. With regard to distribution, we are seeking to grow Life Planners in all countries where that model exists and to strategically expand the Bank and Independent Agency channel, however we may see a decline in Gibraltar Life Insurance Company, Ltd. (“Gibraltar Life”) Consultants as we continue to focus on increasing quality and productivity standards.
|
In order to capitalize on the growth opportunities in our domestic and international markets highlighted above, we continue to make investments in and across our businesses. These investments are focused on product development, distribution and technology. We are investing in product innovation through the use of data and digital initiatives to better understand and serve the needs of a customer base with changing demographics and to achieve a goal of offering a broader array of cost effective and easily comprehensible products. We are investing in expanding our distribution capabilities through a focus on customer experience and technology enabled advice and distribution, cross-business collaboration, further development of work site relationships with individuals and expanding our ability to offer relevant products and services to customers through whichever channels they choose. In addition, we are making investments in our information technology infrastructure in order to streamline processes and enhance the effectiveness of our administrative systems.
While we expect these strategic investments to ultimately generate business growth, they may result in elevated expenses in the near term. In addition, we expect the time periods required for these investments to generate returns to vary. These investments are being funded through a combination of operating cost efficiencies and the returns generated by our businesses, and we expect to be able to continue to absorb some of these investment costs through efficiency gains.
Industry Trends
Our U.S. and international businesses are impacted by financial markets, economic conditions, regulatory oversight, and a variety of trends that affect the industries where we compete.
Financial and Economic Environment.
U.S. Businesses
- As discussed further under “Impact of a Low Interest Rate Environment” below, interest rates in the U.S. remain lower than historical levels, which may continue to negatively impact our portfolio income yields and our net investment spread results. In addition, we are subject to financial impacts associated with movements in equity markets and the evolution of the credit cycle as discussed in “Segment Results of Operations” where applicable and more broadly in “Risk Factors”.
International Businesses
- Our international insurance operations, especially in Japan, continue to operate in a low interest rate environment. Although the local market in Japan has adapted to low interest rates, as discussed under “Impact of a Low Interest Rate Environment” below, the current reinvestment yields for certain blocks of business in our international insurance operations are now generally lower than the current portfolio yield supporting these blocks of business, which may negatively impact our net investment spread results. The continued low interest rate environment in the U.S. may also impact the relative attractiveness of U.S. dollar-denominated products to yen-denominated products in Japan. In addition, we are subject to financial impacts associated with movements in foreign currency rates, particularly the Japanese yen. Fluctuations in the value of the yen will continue to impact the relative attractiveness of both yen-denominated and non-yen denominated products. In addition, we are subject to financial impacts associated with movements in equity markets and the evolution of the credit cycle as discussed in “Segment Results of Operations” where applicable and more broadly in “Risk Factors”.
50
Demographics.
U.S. Businesses
- Customer demographics continue to evolve and new opportunities present themselves in different consumer segments such as the millennial and multicultural markets. Consumer expectations and preferences are changing. We believe existing customers and potential customers are increasingly looking for cost-effective solutions that they can easily understand and access through technology-enabled devices. At the same time, income protection, wealth accumulation and the needs of retiring baby boomers are continuing to shape the insurance industry. A persistent retirement security gap exists in terms of both savings and protection. Despite the ongoing phenomenon of the risk and responsibility of retirement savings shifting from employers to employees, employers are becoming increasingly focused on the financial wellness of the individuals they employ.
International Businesses
- Japan has an aging population as well as a large pool of household assets invested in low-yielding deposit and savings vehicles. The aging of Japan’s population, along with strains on government pension programs, have led to a growing demand for insurance products with a significant savings element to meet savings and retirement needs as the population prepares for retirement. We are seeing a similar shift to retirement-oriented products across other Asian markets, including Korea and Taiwan, each of which also has an aging population.
Regulatory Environment
. See “Business—Regulation” for a discussion of regulatory developments that may impact the Company and the associated risks.
Competitive Environment
. See “Business—” for a discussion of the competitive environment and the basis on which we compete in each of our segments.
Impact of a Low Interest Rate Environment
As a global financial services company, market interest rates are a key driver of our results of operations and financial condition. Changes in interest rates can affect our results of operations and/or our financial condition in several ways, including favorable or adverse impacts to:
|
•
|
investment-related activity, including: investment income returns, net interest margins, net investment spread results, new money rates, mortgage loan prepayments and bond redemptions;
|
|
•
|
insurance reserve levels, market experience true-ups and amortization of both deferred policy acquisition costs (“DAC”) and value of business acquired (“VOBA”);
|
|
•
|
customer account values, including their impact on fee income;
|
|
•
|
fair value of, and possible impairments on, intangible assets such as goodwill;
|
|
•
|
product offerings, design features, crediting rates and sales mix; and
|
|
•
|
policyholder behavior, including surrender or withdrawal activity.
|
See below for discussions related to the current interest rate environments in our two largest markets, the United States and Japan; the composition of our insurance liabilities and policyholder account balances; and the hypothetical impacts to our results if these interest rate environments are sustained.
U.S. Operations excluding the Closed Block Division
Interest rates in the U.S. have experienced a period of historically low levels in large part due to Federal Reserve efforts to assist with the economic recovery subsequent to the financial crisis of 2008. However, more recently market interest rates have begun to climb in conjunction with a series of Federal Reserve decisions to raise interest rates in response to a strengthening economy. While market conditions and events make uncertain the timing, amount and impact of any further monetary policy decisions by the Federal Reserve, a trend of rising interest rates may enhance our reinvestment yields, primarily for our investments in fixed maturity securities and commercial mortgage loans. As interest rates rise, our reinvestment yield may approach or exceed the overall portfolio yield. Conversely, if interest rates were to decline, our reinvestment yield may fall below our overall portfolio yield, resulting in an unfavorable impact to earnings.
For the general account supporting our U.S. Individual Solutions division, U.S. Workplace Solutions division, PGIM division and our Corporate and Other operations, we estimate annual principal payments and prepayments that we would be required to reinvest to be approximately 6.0% of the fixed maturity security and commercial mortgage loan portfolios through
2020
. The portion of the general account attributable to these operations has approximately
$198 billion
of such assets (based on net carrying value) as of
December 31, 2018
. The average portfolio yield for fixed maturity securities and commercial mortgage loans is approximately 4.3%, as of
December 31, 2018
.
51
Included in the
$198 billion
of fixed maturity securities and commercial mortgage loans are approximately
$113 billion
that are subject to call or redemption features at the issuer’s option and have a weighted average interest rate of approximately 4%. Of this
$113 billion
, approximately 64% contain provisions for prepayment premiums. If we reinvest scheduled payments or prepayments (not subject to a prepayment fee) at rates below the current portfolio yield, including in some cases at rates below those guaranteed under our insurance contracts, future operating results will be impacted to the extent we do not, or are unable to, reduce crediting rates on in-force blocks of business, or effectively utilize other asset/liability management strategies described below, in order to maintain current net interest margins.
The following table sets forth the insurance liabilities and policyholder account balances of our U.S. Operations excluding the Closed Block Division, by type, for the date indicated:
|
As of
December 31, 2018
|
|||
|
(in billions)
|
|||
|
Long-duration insurance products with fixed and guaranteed terms
|
$
|
124
|
|
|
Contracts with adjustable crediting rates subject to guaranteed minimums
|
57
|
|
|
|
Participating contracts where investment income risk ultimately accrues to contractholders
|
15
|
|
|
|
Total
|
$
|
196
|
|
The
$124 billion
above relates to long-duration products such as group annuities, structured settlements and other insurance products that have fixed and guaranteed terms, for which underlying assets may have to be reinvested at interest rates that are lower than portfolio rates. We seek to mitigate the impact of a prolonged low interest rate environment on these contracts through asset/liability management, as discussed further below.
The
$57 billion
above relates to contracts with crediting rates that may be adjusted over the life of the contract, subject to guaranteed minimums. Although we may have the ability to lower crediting rates for those contracts above guaranteed minimums, our willingness to do so may be limited by competitive pressures. The following table sets forth the related account values by range of guaranteed minimum crediting rates and the related range of the difference, in basis points (“bps”), between rates being credited to contractholders as of
December 31, 2018
, and the respective guaranteed minimums.
|
|
Account Values with Adjustable Crediting Rates Subject to Guaranteed Minimums:
|
|||||||||||||||||||||||
|
|
At
guaranteed
minimum
|
1-49
bps above
guaranteed
minimum
|
50-99
bps above
guaranteed
minimum
|
100-150
bps above
guaranteed
minimum
|
Greater than
150
bps above
guaranteed
minimum
|
Total
|
||||||||||||||||||
|
|
($ in billions)
|
|||||||||||||||||||||||
|
Range of Guaranteed Minimum Crediting Rates:
|
||||||||||||||||||||||||
|
Less than 1.00%
|
$
|
0.5
|
|
$
|
1.2
|
|
$
|
0.5
|
|
$
|
0.1
|
|
$
|
0.0
|
|
$
|
2.3
|
|
||||||
|
1.00% - 1.99%
|
1.0
|
|
4.1
|
|
11.1
|
|
2.1
|
|
0.6
|
|
18.9
|
|
||||||||||||
|
2.00% - 2.99%
|
1.3
|
|
0.7
|
|
1.9
|
|
1.1
|
|
0.7
|
|
5.7
|
|
||||||||||||
|
3.00% - 4.00%
|
26.7
|
|
2.0
|
|
0.2
|
|
0.2
|
|
0.0
|
|
29.1
|
|
||||||||||||
|
Greater than 4.00%
|
0.9
|
|
0.0
|
|
0.0
|
|
0.0
|
|
0.0
|
|
0.9
|
|
||||||||||||
|
Total(1)
|
$
|
30.4
|
|
$
|
8.0
|
|
$
|
13.7
|
|
$
|
3.5
|
|
$
|
1.3
|
|
$
|
56.9
|
|
||||||
|
Percentage of total
|
54
|
%
|
14
|
%
|
24
|
%
|
6
|
%
|
2
|
%
|
100
|
%
|
||||||||||||
__________
|
(1)
|
Includes approximately $0.85 billion related to contracts that impose a market value adjustment if the invested amount is not held to maturity.
|
The remaining
$15 billion
of insurance liabilities and policyholder account balances in these operations relates to participating contracts for which the investment income risk is expected to ultimately accrue to contractholders. The crediting rates for these contracts are periodically adjusted based on the return earned on the related assets.
Assuming a hypothetical scenario where the average 10-year U.S. Treasury rate is 2.70% for the period from January 1, 2019 through December 31, 2019, and credit spreads remain unchanged from levels as of December 31, 2018, we estimate that the impact to pre-tax adjusted operating income of reinvesting in such an environment, compared to reinvesting at current average portfolio yields, would not be significant.
52
In order to mitigate the unfavorable impact that a low interest rate environment has on our net interest margins, we employ a proactive asset/liability management program, which includes strategic asset allocation and hedging strategies within a disciplined risk management framework. These strategies seek to match the characteristics of our products, and to closely approximate the interest rate sensitivity of the assets with the estimated interest rate sensitivity of the product liabilities. Our asset/liability management program also helps manage duration gaps, currency and other risks between assets and liabilities through the use of derivatives. We adjust this dynamic process as products change, as customer behavior changes and as changes in the market environment occur. As a result, our asset/liability management process has permitted us to manage the interest rate risk associated with our products through several market cycles. Our interest rate exposure is also mitigated by our business mix, which includes lines of business for which fee-based and insurance underwriting earnings play a more prominent role in product profitability.
Closed Block Division
Substantially all of the
$58 billion
of general account assets in the Closed Block division support obligations and liabilities relating to the Closed Block policies only. See Note 14 to the Consolidated Financial Statements for further information on the Closed Block.
International Insurance Operations
While our international insurance operations have experienced a low interest rate environment for many years, the current reinvestment yields for certain blocks of business in our international insurance operations are generally lower than the current portfolio yield supporting these blocks of business. In recent years, the Bank of Japan’s monetary policy has resulted in even lower and, at times, negative yields for certain tenors of government bonds. Our international insurance operations employ a proactive asset/liability management program in order to mitigate, to the extent possible, the unfavorable impact that the current interest rate environment has on our net interest margins. In conjunction with this program, we have not purchased negative yielding assets to support the portfolio and we continue to purchase long-term bonds with tenors of 30 years or greater. Additionally, our diverse product portfolio in terms of currency mix and premium payment structure allows us to further mitigate the negative impact from this low interest rate environment. We regularly examine our product offerings and their profitability. As a result, we have repriced certain products, adjusted commissions for certain products and have discontinued sales of other products that do not meet our profit expectations. The impact of these actions, coupled with the strengthening of the yen against the U.S. dollar and introduction of certain new products, has resulted in an increase in sales of U.S. dollar-denominated products relative to products denominated in other currencies. For additional information on sales within our international insurance operations, see “—International Insurance Division—International Insurance—Sales Results,” below.
The following table sets forth the insurance liabilities and policyholder account balances of our Japanese operations, by type, for the date indicated:
|
As of
December 31, 2018
|
|||
|
|
(in billions)
|
||
|
Long-duration insurance products with fixed and guaranteed terms
|
$
|
120
|
|
|
Contracts with a market value adjustment if invested amount is not held to maturity
|
26
|
|
|
|
Contracts with adjustable crediting rates subject to guaranteed minimums
|
10
|
|
|
|
Total
|
$
|
156
|
|
The
$120 billion
above is predominantly comprised of long-duration insurance products that have fixed and guaranteed terms, for which underlying assets may have to be reinvested at interest rates that are lower than current portfolio yields. The remaining insurance liabilities and policyholder account balances include
$26 billion
related to contracts that impose a market value adjustment if the invested amount is not held to maturity and
$10 billion
related to contracts with crediting rates that may be adjusted over the life of the contract, subject to guaranteed minimums. Most of the current crediting rates on these contracts, however, are at or near contractual minimums. Although we have the ability in some cases to lower crediting rates for those contracts that are above guaranteed minimum crediting rates, the majority of this business has interest crediting rates that are determined by formula.
53
Assuming a hypothetical scenario within our Japanese and Korean operations where new money yields would be 25 bps lower than projected, and applying these lower new money yields to annualized investment of renewal premiums, proceeds from investment disposition and reinvestment of investment income, we estimate that the unfavorable impact would reduce adjusted operating income in 2019 by approximately $10 to $15 million. This hypothetical scenario excludes first-year premium, single pay premium, multi-currency fixed annuity cash flows, any potential benefit from repricing products and any impact from other factors, including but not limited to new business, contractholder behavior, changes in competitive conditions, changes in capital markets and the effect of derivative instruments.
Results of Operations
Consolidated Results of Operations
The following table summarizes net income (loss) for the periods presented.
|
|
Year ended December 31,
|
|||||||||||
|
|
2018
|
2017
|
2016
|
|||||||||
|
|
(in millions)
|
|||||||||||
|
Revenues
|
$
|
62,992
|
|
$
|
59,689
|
|
$
|
58,779
|
|
|||
|
Benefits and expenses
|
58,158
|
|
53,202
|
|
53,074
|
|
||||||
|
Income (loss) before income taxes and equity in earnings of operating joint ventures
|
4,834
|
|
6,487
|
|
5,705
|
|
||||||
|
Income tax expense (benefit)
|
822
|
|
(1,438
|
)
|
1,335
|
|
||||||
|
Income (loss) before equity in earnings of operating joint ventures
|
4,012
|
|
7,925
|
|
4,370
|
|
||||||
|
Equity in earnings of operating joint ventures, net of taxes
|
76
|
|
49
|
|
49
|
|
||||||
|
Net income (loss)
|
4,088
|
|
7,974
|
|
4,419
|
|
||||||
|
Less: Income attributable to noncontrolling interests
|
14
|
|
111
|
|
51
|
|
||||||
|
Net income (loss) attributable to Prudential Financial, Inc.
|
$
|
4,074
|
|
$
|
7,863
|
|
$
|
4,368
|
|
|||
2018
to
2017
Annual Comparison.
The
$3,789 million
decrease
in “Net income (loss) attributable to Prudential Financial, Inc.” reflected the following notable items:
|
•
|
$3,693 million unfavorable variance, primarily reflecting tax expense in the current year compared to a tax benefit in the prior year due to the impact of tax reform and certain other tax matters (see Note 15 to the Consolidated Financial Statements for additional information);
|
|
•
|
$1,427 million unfavorable variance, on a pre-tax basis, from adjustments to reserves as well as DAC and other costs, reflecting updates to the estimated profitability of our businesses, including the impact of our annual reviews and update of assumptions and other refinements. This excludes the impact associated with the variable annuity hedging program discussed below (see “—Results of Operations by Segment—U.S. Individual Solutions Division—Individual Annuities” for additional information); and
|
|
•
|
$221 million unfavorable variance, on a pre-tax basis, from a loss in the current period from our Divested and Run-off Businesses compared to income in the prior period, excluding the impact of our annual reviews and update of assumptions and other refinements, as discussed above.
|
Partially offsetting these decreases in “Net income (loss) attributable to Prudential Financial, Inc.” were the following items:
|
•
|
$917 million favorable variance from net pre-tax realized investment gains and losses for PFI excluding the Closed Block division, excluding the impact of the hedging program associated with certain variable annuities discussed below (see “—General Account Investments” for additional information); and
|
|
•
|
$635 million favorable variance, on a pre-tax basis, reflecting the net impact from changes in the value of our embedded derivatives and related hedge positions associated with certain variable annuities (see “—Results of Operations by Segment—U.S. Individual Solutions Division—Individual Annuities—Variable Annuity Risks and Risk Mitigants” for additional information).
|
54
2017
to
2016
Annual Comparison.
The $3,495 million increase in “Net income (loss) attributable to Prudential Financial, Inc.” reflected the following notable items:
|
•
|
$2,773 million favorable impact reflecting a tax benefit in 2017 compared to a tax expense in 2016 primarily as a result of tax reform (see Note 15 to the Consolidated Financial Statements for additional information);
|
|
•
|
$1,927 million net favorable variance, on a pre-tax basis, primarily from higher operating results from our business segments and income in 2017 from our Divested and Run-off Businesses compared to a loss in 2016;
|
|
•
|
$1,500 million favorable variance, on a pre-tax basis, reflecting changes to the way we manage interest rate risks for certain products. This variance is primarily attributed to changes in our Individual Annuities risk management strategy implemented in 2016, whereby we terminated the existing intercompany derivative transactions between our Corporate and Other operations and Individual Annuities related to managing interest rate risk and we now manage this risk within the Individual Annuities business segment (see “—Results of Operations by Segment—Corporate and Other—Capital Protection Framework” for additional information); and
|
|
•
|
$478 million favorable variance, on a pre-tax basis, from adjustments to DAC and other costs as well as reserves, reflecting updates to the estimated profitability of our businesses, including the impact of our annual reviews and update of assumptions and other refinements. This excludes the impact associated with the variable annuity hedging program discussed below (see “—Results of Operations by Segment—U.S. Individual Solutions Division—Individual Annuities” for additional information).
|
Partially offsetting these increases in “Net income (loss) attributable to Prudential Financial, Inc.” were the following items:
|
•
|
$2,373 million unfavorable variance, on a pre-tax basis, reflecting the net impact from changes in the value of our embedded derivatives and related hedge positions associated with certain variable annuities (see “—Results of Operations by Segment—U.S. Individual Solutions Division—Individual Annuities—Variable Annuity Risks and Risk Mitigants” for additional information); and
|
|
•
|
$810 million lower net pre-tax realized gains for PFI excluding the Closed Block division, and excluding the impact of the hedging program associated with certain variable annuities discussed above (see “—General Account Investments” for additional information).
|
Segment Results of Operations
We analyze the performance of our segments and Corporate and Other operations using a measure of segment profitability called adjusted operating income. See “—Segment Measures” for a discussion of adjusted operating income and its use as a measure of segment operating performance.
Shown below are the adjusted operating income contributions of each segment and Corporate and Other operations for the periods indicated and a reconciliation of this segment measure of performance to “Income (loss) before income taxes and equity in earnings of operating joint ventures” as presented in our Consolidated Statements of Operations.
55
|
|
Year ended December 31,
|
|||||||||||
|
|
2018
|
2017
|
2016
|
|||||||||
|
|
(in millions)
|
|||||||||||
|
Adjusted operating income before income taxes by segment:
|
||||||||||||
|
PGIM
|
$
|
959
|
|
$
|
979
|
|
$
|
787
|
|
|||
|
Total PGIM division
|
959
|
|
979
|
|
787
|
|
||||||
|
Retirement
|
1,049
|
|
1,244
|
|
1,012
|
|
||||||
|
Group Insurance
|
229
|
|
253
|
|
220
|
|
||||||
|
Total U.S. Workplace Solutions division
|
1,278
|
|
1,497
|
|
1,232
|
|
||||||
|
Individual Annuities
|
1,925
|
|
2,198
|
|
1,765
|
|
||||||
|
Individual Life
|
223
|
|
(191
|
)
|
79
|
|
||||||
|
Total U.S. Individual Solutions division
|
2,148
|
|
2,007
|
|
1,844
|
|
||||||
|
International Insurance
|
3,266
|
|
3,198
|
|
3,117
|
|
||||||
|
Total International Insurance division
|
3,266
|
|
3,198
|
|
3,117
|
|
||||||
|
Corporate and Other operations
|
(1,283
|
)
|
(1,437
|
)
|
(1,581
|
)
|
||||||
|
Total Corporate and Other
|
(1,283
|
)
|
(1,437
|
)
|
(1,581
|
)
|
||||||
|
Total segment adjusted operating income before income taxes
|
6,368
|
|
6,244
|
|
5,399
|
|
||||||
|
Reconciling items:
|
||||||||||||
|
Realized investment gains (losses), net, and related adjustments(1)
|
619
|
|
(602
|
)
|
989
|
|
||||||
|
Charges related to realized investment gains (losses), net(2)
|
(316
|
)
|
544
|
|
(466
|
)
|
||||||
|
Investment gains (losses) on assets supporting experience-rated contractholder liabilities, net(3)
|
(863
|
)
|
336
|
|
(17
|
)
|
||||||
|
Change in experience-rated contractholder liabilities due to asset value changes(4)
|
710
|
|
(151
|
)
|
21
|
|
||||||
|
Divested and Run-off Businesses(5):
|
||||||||||||
|
Closed Block division
|
(62
|
)
|
45
|
|
(132
|
)
|
||||||
|
Other Divested and Run-off Businesses
|
(1,535
|
)
|
38
|
|
(84
|
)
|
||||||
|
Equity in earnings of operating joint ventures and earnings attributable to noncontrolling interests(6)
|
(87
|
)
|
33
|
|
(5
|
)
|
||||||
|
Consolidated income (loss) before income taxes and equity in earnings of operating joint ventures
|
$
|
4,834
|
|
$
|
6,487
|
|
$
|
5,705
|
|
|||
__________
|
(1)
|
Represents “Realized investment gains (losses), net,” and related adjustments. See “—General Account Investments” and Note 21 to our Consolidated Financial Statements for additional information.
|
|
(2)
|
Includes charges that represent the impact of realized investment gains (losses), net, on the amortization of DAC and other costs, and on changes in reserves. Also includes charges resulting from payments related to market value adjustment features of certain of our annuity products and the impact of realized investment gains (losses), net, on the amortization of Unearned Revenue Reserves (“URR”).
|
|
(3)
|
Represents net investment gains (losses) on assets supporting experience-rated contractholder liabilities. See “—Experience-Rated Contractholder Liabilities, Assets Supporting Experience-Rated Contractholder Liabilities and Other Related Investments.”
|
|
(4)
|
Represents changes in contractholder liabilities due to asset value changes in the pool of investments supporting these experience-rated contracts. See “—Experience-Rated Contractholder Liabilities, Assets Supporting Experience-Rated Contractholder Liabilities and Other Related Investments.”
|
|
(5)
|
Represents the contribution to income (loss) of Divested and Run-off Businesses that have been or will be sold or exited, including businesses that have been placed in wind down, but that did not qualify for “discontinued operations” accounting treatment under U.S. GAAP. See “—Divested and Run-off Businesses.”
|
|
(6)
|
Equity in earnings of operating joint ventures are included in adjusted operating income but excluded from “Income (loss) before income taxes and equity in earnings of operating joint ventures” as they are reflected on an after-tax U.S. GAAP basis as a separate line in our Consolidated Statements of Operations. Earnings attributable to noncontrolling interests are excluded from adjusted operating income but included in “Income (loss) before income taxes and equity in earnings of operating joint ventures” as they are reflected on a U.S. GAAP basis as a separate line in our Consolidated Statements of Operations. Earnings attributable to noncontrolling interests represent the portion of earnings from consolidated entities that relates to the equity interests of minority investors.
|
Segment results for
2018
presented above reflect the following:
PGIM.
Segment results for
2018
decreased in comparison to
2017
, primarily reflecting lower net incentive fees and reduced strategic investing results, partially offset by higher asset management fees, net of related expenses.
Retirement.
Segment results for
2018
decreased
in comparison to
2017
, primarily reflecting lower net investment spread results, a net unfavorable comparative impact from our annual reviews and update of assumptions and other refinements and higher general and administrative expenses, partially offset by a higher contribution from reserve experience and the impact of business growth.
56
Group Insurance.
Segment results for
2018
decreased in comparison to
2017
, reflecting higher expenses, a lower contribution from net investment spread results and less favorable comparative net impacts from our annual reviews and update of assumptions and other refinements, partially offset by more favorable underwriting results in our group life and group disability businesses.
Individual Annuities.
Segment results for
2018
decreased in comparison to
2017
, primarily reflecting lower net investment spread results, higher capital hedge costs and higher distribution expenses, partially offset by lower amortization costs and reserve provisions as well as higher asset-based fee income.
Individual Life.
Segment results for
2018
increased in comparison to
2017
, primarily reflecting favorable comparative net impacts from our annual reviews and update of assumptions and other refinements, partially offset by lower underwriting results and a lower contribution from net investment spread results.
International Insurance.
Segment results for
2018
increased in comparison to
2017
, inclusive of favorable net impacts from foreign currency exchange rates and comparatively unfavorable net impacts from our annual reviews and update of assumptions and other refinements. Excluding these items, the increase in segment results primarily reflected business growth, lower expenses, including lower legal costs, partially offset by a lower contribution from net investment spread results and an unfavorable impact from mortality experience.
Corporate and Other operations.
Results for
2018
reflected decreased losses in comparison to
2017
, driven by lower levels of corporate expenses, higher income from our qualified pension plan and lower interest expense, partially offset by lower net investment income.
Closed Block Division.
Results for
2018
decreased
in comparison to
2017
, primarily driven by a decrease in net realized investment gains and related activity, and lower net investment income, partially offset by a favorable policyholder dividend obligation adjustment and an increase in net insurance activity.
Segment Measures
Adjusted Operating Income.
In managing our business, we analyze our segments’ operating performance using “adjusted operating income.” Adjusted operating income does not equate to “Income (loss) before income taxes and equity in earnings of operating joint ventures” or “Net income (loss)” as determined in accordance with U.S. GAAP, but is the measure of segment profit or loss we use to evaluate segment performance and allocate resources, and consistent with authoritative guidance, is our measure of segment performance. The adjustments to derive adjusted operating income are important to an understanding of our overall results of operations. Adjusted operating income is not a substitute for income determined in accordance with U.S. GAAP, and our definition of adjusted operating income may differ from that used by other companies. However, we believe that the presentation of adjusted operating income as we measure it for management purposes enhances the understanding of our results of operations by highlighting the results from ongoing operations and the underlying profitability of our businesses. See Note 21 to the Consolidated Financial Statements for further information on the presentation of segment results and our definition of adjusted operating income.
Annualized New Business Premiums.
In managing our Individual Life, Group Insurance and International Insurance businesses, we analyze annualized new business premiums, which do not correspond to revenues under U.S. GAAP. Annualized new business premiums measure the current sales performance of the business, while revenues primarily reflect the renewal persistency of policies written in prior years and net investment income, in addition to current sales. Annualized new business premiums include 10% of first year premiums or deposits from single pay products. No other adjustments are made for limited pay contracts.
The amount of annualized new business premiums for any given period can be significantly impacted by several factors, including but not limited to: addition of new products, discontinuation of existing products, changes in credited interest rates for certain products and other product modifications, changes in premium rates, changes in tax laws, changes in regulations or changes in the competitive environment. Sales volume may increase or decrease prior to certain of these changes becoming effective, and then fluctuate in the other direction following such changes.
Assets Under Management.
In managing our PGIM business, we analyze assets under management (which do not correspond directly to U.S. GAAP assets) because the principal source of revenues is fees based on assets under management. Assets under management represents the fair market value or account value of assets which we manage directly for institutional clients, retail clients, and for our general account, as well as assets invested in our products that are managed by third-party managers.
Account Values.
In managing our Individual Annuities and Retirement businesses, we analyze account values, which do not correspond to U.S. GAAP assets. Net sales (redemptions) in our Individual Annuities business and net additions (withdrawals) in our Retirement business do not correspond to revenues under U.S. GAAP, but are used as a relevant measure of business activity.
57
Impact of Foreign Currency Exchange Rates
Foreign currency exchange rate movements and related hedging strategies
As a U.S.-based company with significant business operations outside the U.S., particularly in Japan, we are subject to foreign currency exchange rate movements that could impact our U.S. dollar (“USD”)-equivalent earnings and shareholder return on equity. Our USD-equivalent earnings could be materially affected by currency fluctuations from period to period, even if earnings on a local currency basis are relatively constant. Our USD-equivalent equity is impacted as the value of our investment in international operations may also fluctuate based on changes in foreign currency exchange rates. We seek to mitigate these impacts through various hedging strategies, including the use of derivative contracts and by holding USD-denominated assets in certain of our foreign subsidiaries.
In order to reduce earnings volatility from foreign currency exchange rate movements, we enter into forward currency derivative contracts to effectively fix the currency exchange rates for a portion of our prospective non-USD-denominated earnings streams. This forward currency hedging program is primarily associated with our insurance operations in Japan and Korea.
In order to reduce equity volatility from foreign currency exchange rate movements, we primarily utilize a yen hedging strategy that calibrates the hedge level to preserve the relative contribution of our yen-based business to the Company’s overall return on equity on a leverage neutral basis. We implement this hedging strategy utilizing a variety of instruments, including USD-denominated assets, foreign currency derivative contracts, and dual currency and synthetic dual currency investments held locally in our Japanese insurance subsidiaries. The total hedge level may vary based on our periodic assessment of the relative contribution of our yen-based business to the Company’s overall return on equity.
The table below presents the aggregate amount of instruments that serve to hedge the impact of foreign currency exchange movements on our USD-equivalent shareholder return on equity from our Japanese insurance subsidiaries as of the dates indicated.
|
|
December 31,
|
|||||||
|
|
2018
|
2017
|
||||||
|
|
(in billions)
|
|||||||
|
Foreign currency hedging instruments:
|
||||||||
|
Hedging USD-equivalent earnings:
|
||||||||
|
Forward currency contracts (notional amount outstanding)
|
$
|
1.3
|
|
$
|
1.6
|
|
||
|
Hedging USD-equivalent equity:
|
||||||||
|
USD-denominated assets held in yen-based entities(1)
|
13.5
|
|
13.8
|
|
||||
|
Dual currency and synthetic dual currency investments(2)
|
0.6
|
|
0.6
|
|
||||
|
Total USD-equivalent equity foreign currency hedging instruments
|
14.1
|
|
14.4
|
|
||||
|
Total foreign currency hedges
|
$
|
15.4
|
|
$
|
16.0
|
|
||
__________
|
(1)
|
Includes USD-denominated fixed maturities at amortized cost plus any related accrued investment income, as well as USD notional amount of foreign currency derivative contracts outstanding. Note this amount represents only those USD assets serving to hedge the impact of foreign currency volatility on equity. Separate from this program, our Japanese operations also have $48.9 billion and $41.2 billion as of December 31, 2018 and 2017, respectively, of USD-denominated assets supporting USD-denominated liabilities related to USD-denominated products.
|
|
(2)
|
Dual currency and synthetic dual currency investments are held by our yen-based entities in the form of fixed maturities and loans with a yen-denominated principal component and USD-denominated interest income. The amounts shown represent the present value of future USD-denominated cash flows.
|
The USD-denominated investments that hedge the impact of foreign currency exchange rate movements on USD-equivalent earnings and shareholder return on equity from our Japanese insurance operations are reported within yen-based entities and, as a result, foreign currency exchange rate movements will impact their value reported within our yen-based Japanese insurance entities. We seek to mitigate the risk that future unfavorable foreign currency exchange rate movements will decrease the value of these USD-denominated investments reported within our yen-based Japanese insurance entities, and therefore negatively impact their equity and regulatory solvency margins, by having our Japanese insurance operations enter into currency hedging transactions. Those hedges are with a subsidiary of Prudential Financial. These hedging strategies have the economic effect of moving the change in value of these USD-denominated investments due to foreign currency exchange rate movements from our Japanese yen-based entities to our USD-based entities.
58
These USD-denominated investments also pay a coupon which is generally higher than what a similar yen-denominated investment would pay. The incremental impact of this higher yield on our USD-denominated investments, as well as our dual currency and synthetic dual currency investments, will vary over time, and is dependent on the duration of the underlying investments as well as interest rate environments in both the U.S. and Japan at the time of the investments.
Impact of foreign currency exchange rate movements on segment results of operations
The financial results of our International Insurance and PGIM segments reflect the impact of intercompany arrangements with our Corporate and Other operations pursuant to which certain of these segments’ non-USD earnings are translated at fixed currency exchange rates. The financial results of our Retirement segment reflected the impact of an intercompany foreign currency exchange arrangement with our Corporate and Other operations in 2016 and 2017 prior to its termination effective January 1, 2018. This foreign currency exchange risk is now managed within our Retirement segment using a strategy that may include external hedges. Results of our Corporate and Other operations include any differences between the translation adjustments recorded by the segments at the fixed currency exchange rate versus the actual average rate during the period. In addition, specific to our International Insurance segment where we hedge certain currencies, the results of our Corporate and Other operations also include the impact of any gains or losses recorded from the forward currency contracts that settled during the period, which include the impact of any over or under hedging of actual earnings that differ from projected earnings.
For International Insurance, the fixed currency exchange rates are generally determined in connection with a foreign currency income hedging program designed to mitigate the impact of exchange rate changes on the segment’s USD-equivalent earnings. Pursuant to this program, our Corporate and Other operations execute forward currency contracts with third parties to sell the net exposure of projected earnings for certain currencies in exchange for USD at specified exchange rates. The maturities of these contracts correspond with the future periods (typically on a three-year rolling basis) in which the identified non-USD-denominated earnings are expected to be generated. In establishing the level of non-USD-denominated earnings that will be hedged through this program, we exclude the anticipated level of USD-denominated earnings that will be generated by USD-denominated products and investments. For the twelve months ended December 31, 2018, approximately 18% of the segment’s earnings were yen-based and, as of December 31, 2018, we have hedged 100%, 72% and 28% of expected yen-based earnings for 2019, 2020 and 2021, respectively. To the extent currently unhedged, our International Insurance segment’s future expected USD-equivalent of yen-based earnings will be impacted by yen exchange rate movements.
As a result of these arrangements, our International Insurance segment’s results for 2018, 2017 and 2016 reflect the impact of translating yen-denominated earnings at fixed currency exchange rates of 111, 112, 106 yen per U.S. dollar, respectively, and Korean won-denominated earnings at fixed currency exchange rates of 1150, 1130, and 1100 Korean won per U.S. dollar, respectively. We expect our 2019 results to reflect the impact of translating yen-denominated earnings at a fixed currency exchange rate of 105 yen per U.S. dollar and Korean won-denominated earnings at a fixed currency exchange rate of 1110 won per U.S. dollar. Since determination of the fixed currency exchange rates for a given year is impacted by changes in foreign currency exchange rates over time, the segment’s future earnings will ultimately be impacted by these changes in exchange rates. For PGIM and certain other currencies within International Insurance, the fixed currency exchange rates for the current year are predetermined during the third quarter of the prior year using forward currency exchange rates.
The table below presents, for the periods indicated, the increase (decrease) to revenues and adjusted operating income for the International Insurance, PGIM and Retirement segments and for Corporate and Other operations, reflecting the impact of these intercompany arrangements.
|
|
Year ended December 31,
|
|||||||||||
|
|
2018
|
2017
|
2016
|
|||||||||
|
|
(in millions)
|
|||||||||||
|
Segment impacts of intercompany arrangements:
|
||||||||||||
|
International Insurance
|
$
|
10
|
|
$
|
3
|
|
$
|
23
|
|
|||
|
PGIM
|
0
|
|
0
|
|
6
|
|
||||||
|
Retirement(1)
|
0
|
|
2
|
|
9
|
|
||||||
|
Impact of intercompany arrangements(2)
|
10
|
|
5
|
|
38
|
|
||||||
|
Corporate and Other operations:
|
||||||||||||
|
Impact of intercompany arrangements(2)
|
(10
|
)
|
(5
|
)
|
(38
|
)
|
||||||
|
Settlement gains (losses) on forward currency contracts(3)
|
(13
|
)
|
(16
|
)
|
38
|
|
||||||
|
Net benefit (detriment) to Corporate and Other operations
|
(23
|
)
|
(21
|
)
|
0
|
|
||||||
|
Net impact on consolidated revenues and adjusted operating income
|
$
|
(13
|
)
|
$
|
(16
|
)
|
$
|
38
|
|
|||
__________
59
|
(1)
|
Effective January 1, 2018 the intercompany arrangement between our Corporate and Other operations and Retirement was terminated and this risk is now managed within our Retirement segment using a strategy that may include external hedges.
|
|
(2)
|
Represents the difference between non-USD-denominated earnings translated on the basis of weighted average monthly currency exchange rates versus fixed currency exchange rates determined in connection with the foreign currency income hedging program.
|
|
(3)
|
As of December 31, 2018, 2017 and 2016, the notional amounts of these forward currency contracts within our Corporate and Other operations were $2.6 billion, $2.8 billion and $2.7 billion, respectively, of which $1.3 billion, $1.5 billion and $1.6 billion, respectively, were related to our Japanese insurance operations.
|
Impact of products denominated in non-local currencies on U.S. GAAP earnings
While our international insurance operations offer products denominated in local currency, several also offer products denominated in non-local currencies, most notably our Japanese operations, which offer USD- and Australian dollar (“AUD”)-denominated products. The non-local currency-denominated insurance liabilities related to these products are supported by investments denominated in corresponding currencies, including a significant portion designated as available-for-sale. While the impact from foreign currency exchange rate movements on these non-local currency-denominated assets and liabilities is economically matched, differences in the accounting for changes in the value of these assets and liabilities due to changes in foreign currency exchange rate movements have historically resulted in volatility in U.S. GAAP earnings.
In the first quarter of 2015 we implemented a structure in Gibraltar Life’s operations that disaggregated the USD- and AUD-denominated businesses into separate divisions, each with its own functional currency that aligns with the underlying products and investments. The result of this alignment was to reduce differences in the accounting for changes in the value of these assets and liabilities that arise due to changes in foreign currency exchange rate movements. For the USD- and AUD-denominated assets that were transferred under this structure, the net cumulative unrealized investment gains associated with foreign exchange remeasurement that were recorded in “Accumulated other comprehensive income (loss)” (“AOCI”) totaled $6.0 billion and will be recognized in earnings within “Realized investment gains (losses), net” over time as these assets mature or are sold. As of December 31, 2018, the remaining net cumulative unrealized investment gains balance related to these assets was $3.2 billion. Absent the sale of any of these assets prior to their stated maturity, approximately 9% of the $3.2 billion balance will be recognized in 2019, approximately 12% will be recognized in 2020, and a majority of the remaining balance will be recognized from 2021 through 2024.
Highly inflationary economy in Argentina
Our insurance operations in Argentina, Prudential of Argentina (“POA”), have historically utilized the Argentine peso as the functional currency given it is the currency of the primary economic environment in which the entity operates. During 2018, Argentina experienced a cumulative inflation rate that exceeded 100% over a 3-year period. As a result, Argentina’s economy was deemed to be highly inflationary resulting in reporting changes effective July 1, 2018. Under U.S. GAAP, the financial statements of a foreign entity in a highly inflationary economy are to be remeasured as if its functional currency (formerly the Argentine peso) is the reporting currency of its parent reporting entity (the USD) on a prospective basis. While this changed how the results of POA are remeasured and/or translated into the USD, the impact to our financial statements was not material nor is it expected to be material in future periods given the relative size of our POA operations. It should also be noted that due to the macroeconomic environment in Argentina, POA’s sales are predominantly denominated in USD and therefore substantially all of POA’s balance sheet consists of USD-denominated product liabilities supported by USD-denominated assets. As a result, this accounting change serves to reduce the remeasurement impact reflected in net income given that the functional currency and currency in which the assets and liabilities are denominated will be more closely aligned.
Accounting Policies & Pronouncements
Application of Critical Accounting Estimates
The preparation of financial statements in conformity with U.S. GAAP requires the application of accounting policies that often involve a significant degree of judgment. Management, on an ongoing basis, reviews estimates and assumptions used in the preparation of financial statements. If management determines that modifications in assumptions and estimates are appropriate given current facts and circumstances, the Company’s results of operations and financial position as reported in the Consolidated Financial Statements could change significantly.
The following sections discuss the accounting policies applied in preparing our financial statements that management believes are most dependent on the application of estimates and assumptions and require management’s most difficult, subjective, or complex judgments.
Insurance Assets
Deferred Policy Acquisition Costs and Deferred Sales Inducements
60
We capitalize costs that are directly related to the acquisition or renewal of insurance and annuity contracts. These costs primarily include commissions, as well as costs of policy issuance and underwriting and certain other expenses that are directly related to successfully negotiated contracts. We have also deferred costs associated with sales inducements related to our variable and fixed annuity contracts primarily within our Individual Annuities segment. Sales inducements are amounts that are credited to the policyholders’ account balances mainly as an inducement to purchase the contract. For additional information about sales inducements, see Note 12 to the Consolidated Financial Statements. We generally amortize DAC and deferred sales inducements (“DSI”) over the expected lives of the contracts, based on our estimates of the level and timing of gross premiums, gross profits, or gross margins, depending on the type of contract. As described in more detail below, in calculating DAC and DSI amortization, we are required to make assumptions about investment returns, mortality, persistency, and other items that impact our estimates of the level and timing of gross margins, gross profits, or gross premiums. We also periodically evaluate the recoverability of our DAC and DSI. For certain contracts, this evaluation is performed as part of our premium deficiency testing, as discussed further below in “—Insurance Liabilities—Future Policy Benefits.” As of December 31,
2018
, DAC and DSI for PFI excluding the Closed Block division were $19.8 billion and $1.0 billion, respectively, and DAC in our Closed Block division was $264 million.
Amortization methodologies
Gross Premiums
. DAC associated with the non-participating term life policies of our Individual Life segment and the whole life, term life, endowment and health policies of our International Insurance segment is primarily amortized in proportion to gross premiums. Gross premiums are defined as the premiums charged to a policyholder for an insurance contract.
Gross Profits.
DAC and DSI associated with the variable and universal life policies of our Individual Life and International Insurance segments and the variable and fixed annuity contracts of our Individual Annuities and International Insurance segments are generally amortized over the expected lives of these policies in proportion to total gross profits. Total gross profits include both actual gross profits and estimates of gross profits for future periods. Gross profits are defined as i) amounts assessed for mortality, contract administration, surrender charges, and other assessments plus amounts earned from investment of policyholder balances less ii) benefit claims in excess of policyholder balances, costs incurred for contract administration, the net cost of reinsurance for certain businesses, interest credited to policyholder balances and other credits. If significant negative gross profits are expected in any periods, the amount of insurance in force is generally substituted as the base for computing amortization. For variable annuities in our Individual Annuities segment, U.S. GAAP gross profits and amortization rates also include the impacts of the embedded derivatives associated with certain of the optional living benefit features of our variable annuity contracts and related hedging activities. For additional information on the significant inputs to the valuation models for these embedded derivatives including capital market assumptions and actuarially determined assumptions, see below “—Insurance Liabilities—Future Policy Benefits.” In calculating amortization expense, we estimate the amounts of gross profits that will be included in our U.S. GAAP results and in adjusted operating income, and utilize these estimates to calculate distinct amortization rates and expense amounts. We also regularly evaluate and adjust the related DAC and DSI balances with a corresponding charge or credit to current period earnings for the impact of actual gross profits and changes in our projections of estimated future gross profits on our DAC and DSI amortization rates. Adjustments to the DAC and DSI balances include the impact to our estimate of total gross profits of the annual review of assumptions, our quarterly adjustments for current period experience, and our quarterly adjustments for market performance. Each of these adjustments is further discussed below in “—Annual assumptions review and quarterly adjustments.”
Gross Margins
. DAC associated with the traditional participating products of our Closed Block is amortized over the expected lives of those contracts in proportion to estimated gross margins. Gross margins are defined as: i) amounts received from premiums, earned from investment of policyholder balances and other assessments, less ii) benefits claims paid, costs for contract administration, changes in the net level premium reserve for death and endowment benefits, annual policyholder dividends and other credits. We evaluate our estimates of future gross margins and adjust the related DAC balance with a corresponding charge or credit to current period earnings for the effects of actual gross margins and changes in our expected future gross margins. DAC adjustments for these participating products generally have not created significant volatility in our results of operations since many of the factors that affect gross margins are also included in the determination of our dividends to these policyholders and, during most years, the Closed Block has recognized a cumulative policyholder dividend obligation expense in “Policyholders’ dividends,” for the excess of actual cumulative earnings over expected cumulative earnings as determined at the time of demutualization. However, if actual cumulative earnings fall below expected cumulative earnings in future periods, thereby eliminating the cumulative policyholder dividend obligation expense, changes in gross margins and DAC amortization would result in a net impact to the Closed Block results of operations. As of December 31,
2018
, the excess of actual cumulative earnings over the expected cumulative earnings was
$2,252 million
.
The amortization methodologies for products not discussed above primarily relate to less significant DAC and DSI balances associated with products in our Group Insurance and Retirement segments, which comprised approximately
2% of the Company’s total DAC and DSI balances as of December 31,
2018
.
61
Annual assumptions review and quarterly adjustments
Annually, we perform a comprehensive review of the assumptions used in estimating gross profits for future periods. Over the last several years, the Company’s most significant assumption updates resulting in a change to expected future gross profits and the amortization of DAC and DSI have been related to lapse and other contractholder behavior assumptions, mortality, and revisions to expected future rates of returns on investments. These assumptions may also cause potential significant variability in amortization expense in the future. The impact on our results of operations of changes in these assumptions can be offsetting and we are unable to predict their movement or offsetting impact over time.
The quarterly adjustments for current period experience referred to above reflect the impact of differences between actual gross profits for a given period and the previously estimated expected gross profits for that period. To the extent each period’s actual experience differs from the previous estimate for that period, the assumed level of total gross profits may change. In these cases, we recognize a cumulative adjustment to all previous periods’ amortization, also referred to as an experience true-up adjustment.
The quarterly adjustments for market performance referred to above reflect the impact of changes to our estimate of total gross profits to reflect actual fund performance and market conditions. A significant portion of gross profits for our variable annuity contracts and, to a lesser degree, our variable life policies are dependent upon the total rate of return on assets held in separate account investment options. This rate of return influences the fees we earn on variable annuity and variable life policies, costs we incur associated with the guaranteed minimum death and guaranteed minimum income benefit features related to our variable annuity contracts and expected claims to be paid on variable life contracts, as well as other sources of profit. Returns that are higher than our expectations for a given period produce higher than expected account balances, which increase the future fees we expect to earn on variable annuity and variable life policies and decrease the future costs we expect to incur associated with the guaranteed minimum death and guaranteed minimum income benefit features related to our variable annuity contracts and expected claims to be paid on variable life contracts. The opposite occurs when returns are lower than our expectations. The changes in future expected gross profits are used to recognize a cumulative adjustment to all prior periods’ amortization.
The near-term future equity rate of return assumption used in evaluating DAC and other costs for our domestic variable annuity and variable life insurance products is derived using a reversion to the mean approach, a common industry practice. Under this approach, we consider historical equity returns and adjust projected equity returns over an initial future period of five years (the “near-term”) so that equity returns converge to the long-term expected rate of return. If the near-term projected future rate of return is greater than our near-term maximum future rate of return of 15.0%, we use our maximum future rate of return. As of December 31,
2018
, our variable annuities and variable life insurance businesses assume an 8.0% long-term equity expected rate of return and a 7.6% near-term mean reversion equity expected rate of return.
The weighted average rate of return assumptions consider many factors specific to each business, including asset durations, asset allocations and other factors. We generally update the near-term equity rates of return and our estimate of total gross profits each quarter to reflect the result of the reversion to the mean approach. We generally update the future interest rates used to project fixed income returns annually and in any quarter when interest rates vary significantly from these assumptions. As a result of our
2018
annual reviews and update of assumptions and other refinements, we kept our long-term expectation of the 10-year U.S. Treasury rate unchanged from last year and continue to grade to 3.75% over ten years. In Japan, we reduced the long-term expected return on 10-year Japanese Government Bonds by 20 basis points and now grade to 1.30% over ten years.
These market performance related adjustments to our estimate of total gross profits result in cumulative adjustments to prior amortization, reflecting the application of the new required rate of amortization to all prior periods’ gross profits.
Value of Business Acquired
62
In addition to DAC and DSI, we also recognize an asset for VOBA. VOBA is an intangible asset which represents an adjustment to the stated value of acquired in-force insurance contract liabilities to present them at fair value, determined as of the acquisition date. VOBA is amortized over the expected life of the acquired contracts using the same methodology and assumptions used to amortize DAC and DSI (see “—Deferred Policy Acquisition Costs and Deferred Sales Inducements” above for additional information). VOBA is also subject to recoverability testing. As of December 31,
2018
, VOBA was
$1.9 billion
, and included
$1.1 billion
related to the acquisition from American International Group (“AIG”) of AIG Star Life Insurance Co., Ltd, AIG Edison Life Insurance Company, AIG Financial Assurance Japan K.K. and AIG Edison Service Co., Ltd. (collectively, the “Star and Edison Businesses”) in 2011, and
$0.5 billion
related to the acquisition of The Hartford Financial Services Group’s individual life insurance business in 2013. The remaining $0.3 billion primarily relates to previously-acquired traditional life, deferred annuity, defined contribution and defined benefit businesses. The VOBA associated with the in-force contracts of the Star and Edison Businesses is less sensitive to assumption changes, as the majority is amortized in proportion to gross premiums which are more predictably stable compared to gross profits.
Insurance Liabilities
Future Policy Benefits
Future Policy Benefit Reserves, including Unpaid Claims and Claim Adjustment Expenses
We establish reserves for future policy benefits to, or on behalf of, policyholders using methodologies prescribed by U.S. GAAP. The reserving methodologies used include the following:
|
•
|
For most long-duration contracts, we utilize a net premium valuation methodology in measuring the liability for future policy benefits. Under this methodology, a liability for future policy benefits is accrued when premium revenue is recognized. The liability, which represents the present value of future benefits to be paid to or on behalf of policyholders and related expenses less the present value of future net premiums (portion of the gross premium required to provide for all benefits and expenses), is estimated using methods that include assumptions applicable at the time the insurance contracts are made with provisions for the risk of adverse deviation, as appropriate. Original assumptions continue to be used in subsequent accounting periods to determine changes in the liability for future policy benefits (often referred to as the “lock-in concept”) unless a premium deficiency exists. The result of the net premium valuation methodology is that the liability at any point in time represents an accumulation of the portion of premiums received to date expected to be needed to fund future benefits (i.e., net premiums received to date), less any benefits and expenses already paid. The liability does not necessarily reflect the full policyholder obligation the Company expects to pay at the conclusion of the contract since a portion of that obligation would be funded by net premiums received in the future and would be recognized in the liability at that time. We perform premium deficiency tests using best estimate assumptions as of the testing date without provisions for adverse deviation. If the liabilities determined based on these best estimate assumptions are greater than the net reserves (i.e., GAAP reserves net of any DAC, DSI or VOBA asset), the existing net reserves are adjusted by first reducing these assets by the amount of the deficiency or to zero through a charge to current period earnings. If the deficiency is more than these asset balances for insurance contracts, we then increase the net reserves by the excess, again through a charge to current period earnings. If a premium deficiency is recognized, the assumptions as of the premium deficiency test date are locked in and used in subsequent valuations and the net reserves continue to be subject to premium deficiency testing. In addition, for limited-payment contracts, future policy benefit reserves also include a deferred profit liability representing gross premiums received in excess of net premiums. The deferred profits are generally recognized in revenue in a constant relationship with insurance in force or with the amount of expected future benefit payments.
|
|
•
|
For certain contract features, such as those related to guaranteed minimum death benefits (“GMDB”), guaranteed minimum income benefits (“GMIB”) and no-lapse guarantees, a liability is established when associated assessments (which include all policy charges including charges for administration, mortality, expense, surrender, and other. regardless of how characterized) are recognized. This liability is established using current best estimate assumptions and is based on the ratio of the present value of total expected excess payments (i.e., payments in excess of account value) over the life of the contract divided by the present value of total expected assessments (i.e., benefit ratio). The liability equals the current benefit ratio multiplied by cumulative assessments recognized to date, plus interest, less cumulative excess payments to date. Similar to as described above for DAC, the reserves are subject to adjustments based on annual reviews of assumptions and quarterly adjustments for experience, including market performance. These adjustments reflect the impact on the benefit ratio of using actual historical experience from the issuance date to the balance sheet date plus updated estimates of future experience. The updated benefit ratio is then applied to all prior periods’ assessments to derive an adjustment to the reserve recognized through a benefit or charge to current period earnings.
|
63
|
•
|
For certain product guarantees, primarily certain optional living benefit features of the variable annuity products in our Individual Annuities segment including guaranteed minimum accumulation benefits (“GMAB”), guaranteed minimum withdrawal benefits (“GMWB”) and guaranteed minimum income and withdrawal benefits (“GMIWB”), the benefits are accounted for as embedded derivatives using a fair value accounting framework. The fair value of these contracts is calculated as the present value of expected future benefit payments to contractholders less the present value of assessed rider fees attributable to the embedded derivative feature. Under U.S. GAAP, the fair values of these benefit features are based on assumptions a market participant would use in valuing these embedded derivatives. Changes in the fair value of the embedded derivatives are recorded quarterly through a benefit or charge to current period earnings.
|
The assumptions used in establishing reserves are generally based on the Company’s experience, industry experience and/or other factors, as applicable. We typically update our actuarial assumptions, such as mortality, morbidity, retirement and policyholder behavior assumptions, annually, unless a material change is observed in an interim period that we feel is indicative of a long-term trend. Generally, we do not expect trends to change significantly in the short-term and, to the extent these trends may change, we expect such changes to be gradual over the long-term. In a sustained low interest rate environment, there is an increased likelihood that the reserves determined based on best estimate assumptions may be greater than the net liabilities.
The following paragraphs provide additional details about the reserves established by each of our segments:
International Insurance.
The reserves for future policy benefits of our International Insurance segment, which as of December 31,
2018
, represented 45% of our total future policy benefit reserves, primarily relate to non-participating whole life and term life products and endowment contracts, and are generally calculated using the net premium valuation methodology, as described above. The primary assumptions used in determining expected future benefits and expenses include mortality, lapse, morbidity, investment yield and maintenance expense assumptions. Reserves also include claims reported but not yet paid, and claims incurred but not yet reported. In addition, future policy benefit reserves for certain contracts also include amounts related to our deferred profit liability, as described above.
Retirement.
The reserves for future policy benefits of our Retirement segment, which as of December 31,
2018
, represented 23% of our total future policy benefit reserves, primarily relate to our non-participating life contingent group annuity and structured settlement products and are generally calculated using the net premium valuation methodology, as described above. The primary assumptions used in establishing these reserves include mortality, retirement, maintenance expense and investment yield assumptions. In addition, future policy benefit reserves for certain contracts also include amounts related to our deferred profit liability, as described above.
Individual Annuities.
The reserves for future policy benefits of our Individual Annuities segment, which as of December 31,
2018
, represented
4% of our total future policy benefit reserves, primarily relate to reserves for the GMDB and GMIB features of our variable annuities, and for the optional living benefit features that are accounted for as embedded derivatives. As discussed above, in establishing reserves for GMDBs and GMIBs, we utilize current best estimate assumptions. The primary assumptions used in establishing these reserves generally include annuitization, lapse, withdrawal and mortality assumptions, as well as interest rate and equity market return assumptions. Lapse rates are adjusted at the contract level based on the in-the-moneyness of the living benefit and reflect other factors, such as the applicability of any surrender charges. Lapse rates are reduced when contracts are more in-the-money. Lapse rates are also generally assumed to be lower for the period where surrender charges apply. For life contingent payout annuity contracts, we establish reserves using best estimate assumptions with provisions for adverse deviations as of inception or best estimate assumptions as of the most recent loss recognition event.
The reserves for certain optional living benefit features, including GMAB, GMWB and GMIWB are accounted for as embedded derivatives at fair value, as described above. This methodology could result in either a liability or contra-liability balance, given changing capital market conditions and various actuarial assumptions. Since there is no observable active market for the transfer of these obligations, the valuations are calculated using internally-developed models with option pricing techniques. The models are based on a risk neutral valuation framework and incorporate premiums for risks inherent in valuation techniques, inputs, and the general uncertainty around the timing and amount of future cash flows. The significant inputs to the valuation models for these embedded derivatives include capital market assumptions, such as interest rate levels and volatility assumptions, the Company’s market-perceived risk of its own non-performance risk (“NPR”), as well as actuarially determined assumptions, including mortality rates and contractholder behavior, such as lapse rates, benefit utilization rates and withdrawal rates. Capital market inputs and actual contractholders’ account values are updated each quarter based on capital market conditions as of the end of the quarter, including interest rates, equity markets and volatility. In the risk neutral valuation, the initial swap curve drives the total returns used to grow the contractholders’ account values. The Company’s discount rate assumption is based on the London Inter-Bank Offered Rate swap curve adjusted for an additional spread, which includes an estimate of NPR. Actuarial assumptions, including contractholder behavior and mortality, are reviewed at least annually, and updated based upon emerging experience, future expectations and other data, including any observable market data, such as available industry studies or market transactions
64
such as acquisitions and reinsurance transactions. For additional information regarding the valuation of these optional living benefit features, see Note 6 to the Consolidated Financial Statements.
Individual Life.
The reserves for future policy benefits of our Individual Life segment, which as of December 31,
2018
, represented 5% of our total future policy benefit reserves, primarily relate to term life, universal life and variable life products. For term life contracts, the future policy benefit reserves are generally calculated using the net premium valuation methodology, as described above. The primary assumptions used in determining expected future benefits and expenses include mortality, lapse, investment yield and maintenance expense assumptions. For variable and universal life products, which include universal life contracts that contain no-lapse guarantees, reserves for future policy benefits are primarily established using the reserving methodology for GMDB and GMIB contracts. As discussed above, in establishing reserves for GMDBs and GMIBs, we utilize current best estimate assumptions. The primary assumptions used in establishing these reserves generally include mortality, lapse, and premium pattern, as well as interest rate and equity market return assumptions. Reserves also include claims reported but not yet paid, and claims incurred but not yet reported.
Group Insurance.
The reserves for future policy benefits of our Group Insurance segment, which as of December 31,
2018
, represented 2% of our total future policy benefit reserves, primarily relate to reserves for group life and disability benefits. For short-duration contracts, a liability is established when the claim is incurred. The reserves for group life and disability benefits include our liability of $2.6 billion for unpaid claims and claim adjustment expenses for our Group Insurance segment as of December 31,
2018
, which relates primarily to the group long-term disability product. This liability represents our estimate of future disability claim payments and expenses as well as estimates of claims that have been incurred, but have not yet been reported, as of the balance sheet date. The liability is determined as the present value of expected future claim payments and expenses. The primary assumptions used in determining expected future claim payments are claim termination factors, an assumed interest rate and expected Social Security offsets.
The remaining reserves for future policy benefits for group life and disability benefits relate primarily to our group life business, and include reserves for Waiver of Premium, Claims In Course of Settlement and Claims Incurred But Not Reported. The Waiver of Premium reserve is calculated as the present value of future benefits and utilizes assumptions such as expected mortality and recovery rates. The Claims In Course of Settlement reserve is based on the inventory of claims that have been reported but not yet paid. The Claims Incurred But Not Reported reserve is estimated using expected patterns of claims reporting.
Corporate and Other operations.
The reserves for future policy benefits of our Corporate & Other operations, which as of December 31,
2018
, represented 3% of our total future policy benefit reserves, primarily relate to our long-term care products and are generally calculated using the net premium valuation methodology, as described above. Most contracts have recorded a premium deficiency reserve, for which we use assumptions as of the most recent premium deficiency reserve establishment. The primary assumptions used in establishing these reserves include interest rate, morbidity, mortality, lapse, premium rate increase and maintenance expense assumptions. In addition, certain less significant reserves for our long-term care products, such as our disabled life reserves, are established using current best estimate actuarial assumptions.
Closed Block Division.
The future policy benefit reserves for the traditional participating life insurance products of the Closed Block division, which as of December 31,
2018
, represented 18% of our total future policy benefit reserves are determined using the net premium valuation methodology, as described above. Under this method, the future policy benefit reserves are accrued as a level proportion of the premium paid by the policyholder. In applying this method, we use mortality assumptions to determine our expected future benefits and expected future premiums, and apply an interest rate to determine the present value of both of these amounts. The mortality assumptions are based on standard industry mortality tables that were used to determine the cash surrender value of the policies, and the interest rates used are the interest rates used to calculate the cash surrender value of the policies.
Profits Followed by Losses
In certain instances, the policyholder liability for a particular line of business may not be deficient in the aggregate to trigger loss recognition, but the pattern of earnings may be such that profits are expected to be recognized in earlier years followed by losses in later years. In these situations, accounting standards require that an additional liability (Profits Followed by Losses or “PFL” liability) be recognized by an amount necessary to sufficiently offset the losses that would be recognized in later years. The PFL liability is based on our current estimate of the present value of the amount necessary to offset losses anticipated in future periods. Because the liability is measured on a discounted basis, there will also be accretion into future earnings through an interest charge, and the liability will ultimately be released into earnings as an offset to future losses. Historically, the Company’s PFL liability has been predominantly associated with certain universal life contracts that measure net GAAP reserves using current best estimate assumptions and accordingly, has been updated each quarter using current in-force and market data and as part of the annual assumption update. At the target accrual date (i.e., date of peak deficiency), the PFL liability transitions to a premium deficiency reserve and, for universal life products, will continue to be updated each quarter using current in-force and market data and as part of the annual assumption update.
65
Policyholders’ Account Balances
Unearned Revenue Reserve
Policyholders’ account balances liability represents the contract value that has accrued to the benefit of the policyholder as of the balance sheet date. This liability is primarily associated with the accumulated account deposits, plus interest credited, less policyholder withdrawals and other charges assessed against the account balance, as applicable. Our URR, also reported as a component of “Policyholders’ account balances,” was $3.4 billion as of December 31,
2018
. This reserve primarily relates to variable and universal life products within our Individual Life and International Insurance segments and represents policy charges for services to be provided in future periods. The charges are deferred as unearned revenue and are generally amortized over the expected life of the contract in proportion to the product’s estimated gross profits, similar to DAC and DSI as discussed above.
Sensitivities for Insurance Assets and Liabilities
The following table summarizes the impact that could result on each of the listed financial statement balances for the specified segments from changes in certain assumptions that may be considered reasonably likely to occur. The information below is for illustrative purposes and includes only the hypothetical direct impact on December 31,
2018
balances of changes in a single assumption and not changes in any combination of assumptions. The figures below are presented in aggregate for those segments that are expected to experience a significant impact as a result of the corresponding assumption change. Changes in excess of the amounts illustrated may occur in future periods. A description of the estimates and assumptions used in the preparation of each of these financial statement balances is provided further above. For traditional long duration and limited payment contracts, U.S. GAAP requires the original assumptions used when the contracts are issued to be locked-in and that those assumptions be used in all future liability calculations as long as the resulting liabilities are adequate to provide for the future benefits and expenses (i.e., there is no premium deficiency). Therefore, these products are not reflected in the sensitivity table below unless the hypothetical change in assumption would result in an adverse impact that would cause a premium deficiency. Similarly, the impact of any favorable change in assumptions for traditional long duration and limited payment contracts is not reflected in the table below given that the current assumption is required to remain locked-in, and instead the positive impacts would be recognized into net income over the life of the policies in force.
The impacts presented within this table exclude the following:
|
•
|
The impacts of our asset liability management strategy which seeks to offset the changes in the balances presented within this table and is primarily comprised of investments and derivatives. See further below for a discussion of the estimates and assumptions involved with the application of U.S. GAAP accounting policies for these instruments and “Quantitative and Qualitative Disclosures about Market Risk” for hypothetical impacts on related balances as a result of changes in certain significant assumptions.
|
|
•
|
The impacts of our Long-Term Care business, a component of our Divested and Run-off Businesses within our Corporate and Other operations. Long-Term Care sensitivities are presented separately in the immediately following table (see “—Sensitivities for the Long-Term Care business within our Corporate and Other operations”). While the accounting for long-term care products typically follows the locked-in assumptions model described above, as a result of our 2018 annual review and update of assumptions this business recognized a premium deficiency and unlocked and updated the assumption model to use a current set of best estimate assumptions. Given this unique fact pattern for this business, sensitivities are presented separately in order to provide stand-alone and supplementary information.
|
66
|
|
December 31, 2018
|
|||||||||||
|
Increase (Decrease) in
|
||||||||||||
|
|
Deferred Policy Acquisition Costs, Deferred Sales Inducements and Value of Business Acquired
|
Future Policy Benefits and Policyholders’ Account Balances(1)
|
Net Impact
|
|||||||||
|
(in millions)
|
||||||||||||
|
Hypothetical change in current assumptions:
|
||||||||||||
|
Long-term interest rate(2):
|
||||||||||||
|
Increase by 25 basis points
|
$
|
45
|
|
$
|
(50
|
)
|
$
|
95
|
|
|||
|
Decrease by 25 basis points
|
$
|
(45
|
)
|
$
|
50
|
|
$
|
(95
|
)
|
|||
|
Long-term equity expected rate of return(3):
|
||||||||||||
|
Increase by 50 basis points
|
$
|
180
|
|
$
|
(60
|
)
|
$
|
240
|
|
|||
|
Decrease by 50 basis points
|
$
|
(185
|
)
|
$
|
60
|
|
$
|
(245
|
)
|
|||
|
NPR credit spread(4):
|
||||||||||||
|
Increase by 50 basis points
|
$
|
(315
|
)
|
$
|
(1,515
|
)
|
$
|
1,200
|
|
|||
|
Decrease by 50 basis points
|
$
|
345
|
|
$
|
1,650
|
|
$
|
(1,305
|
)
|
|||
|
Mortality(5):
|
||||||||||||
|
Increase by 1%
|
$
|
(45
|
)
|
$
|
(60
|
)
|
$
|
15
|
|
|||
|
Decrease by 1%
|
$
|
45
|
|
$
|
65
|
|
$
|
(20
|
)
|
|||
|
Lapse(6):
|
||||||||||||
|
Increase by 10%
|
$
|
(140
|
)
|
$
|
(610
|
)
|
$
|
470
|
|
|||
|
Decrease by 10%
|
$
|
140
|
|
$
|
630
|
|
$
|
(490
|
)
|
|||
__________
|
(1)
|
Includes GMDB/GMIB reserves, embedded derivative liabilities for certain living benefit guaranteed features, reserves for products with a premium deficiency, PFL liability, and URR.
|
|
(2)
|
Represents the impact of a parallel shift in the long-term interest rate yield curve for the Individual Life segment and the Japanese insurance operations.
|
|
(3)
|
Represents the impact of an increase or decrease in the long-term equity expected rate of return for the Individual Annuities segment.
|
|
(4)
|
Represents the impact of an increase or decrease in the NPR credit spread for the Individual Annuities segment.
|
|
(5)
|
Represents the impact of an increase or decrease in mortality rates for the Individual Life and Individual Annuities segments.
|
|
(6)
|
Represents the impact of an increase or decrease in lapse rates for the Individual Life and Individual Annuities segments.
|
Sensitivities for the Long-Term Care business within our Corporate and Other operations
The following table summarizes certain significant assumptions made in establishing reserves for long-term care products and the net impact that could result from changes in these assumptions should they occur. Under U.S. GAAP, reserves for long-term care products are generally calculated using the locked-in assumptions concept described above. As such, the adverse hypothetical impacts illustrated in the table below are those that would increase our best estimate reserves and, when compared to our GAAP reserves, may cause a premium deficiency that would require us to unlock our assumptions and record a charge to net income. The favorable hypothetical impacts in the table below would decrease our best estimate reserves but they would not result in an immediate decrease to our GAAP reserves (given that we would be required to leave the current assumptions locked-in) and instead the positive impacts would be recognized into net income over the life of the policies in force.
The information below is for illustrative purposes and includes the impacts of changes in a single assumption and not changes in any combination of assumptions. As a result of emerging future experience, impacts from changes in the significant assumptions in excess of the amounts illustrated may occur in future periods.
67
|
|
December 31, 2018
|
|||||
|
|
Current Assumption
|
Assumption Change
|
Increase (Decrease) in Best Estimate Reserve (in millions)
|
|||
|
Assumption:
|
||||||
|
Morbidity Improvement
|
None
|
Include improvement:
1% per year for 10 years / 20 years
|
($900) - ($1,400)
|
|||
|
Mortality Improvement
|
1% per year for 20 years
|
Decrease the duration of the 1% improvement per year: 10 years to none
|
($300) - ($850)
|
|||
|
Expected Future Claim Costs / Base Morbidity
|
Based on Company and industry experience. No reflection of future claim management efficiencies
|
Increase / decrease in expected future claim costs: +5% to -5%
|
$525 - ($525)
|
|||
|
Average Ultimate Lapse Rate
|
Individual: 0.8%
Group: 0.6%
|
-10 basis points to +10 basis points
|
$125 - ($125)
|
|||
|
Investment Rate(1)
|
Weighted average of 5.39%
|
-25 basis points to +25 basis points
|
$425 - ($425)
|
|||
|
Future Premium Rate Increases
|
Approximately $1.2 billion for the rate increase program assumed in reserves(2)
|
Decrease / increase unapproved rate increases by: -10% to +10%
|
$120 - ($120)
|
|||
__________
|
(1)
|
Investment rate reflects the expected investment yield over the life of the block of business, and is derived from the portfolio yield, current reinvestment
rates and our intermediate and long-term assumption for investment yields.
|
|
(2)
|
Includes future premium rate increases and benefit reductions in lieu of rate increases not yet approved.
|
Goodwill
As of December 31,
2018
, our goodwill balance of
$863 million
is primarily reflected in the following reporting units:
$455 million
related to our Retirement Full Service business,
$233 million
related to our PGIM business, $154 million related to our Gibraltar Life and Other operations and $11 million related to our Life Planner operations.
We test goodwill for impairment on an annual basis, as of December 31 of each year, or more frequently if events or circumstances indicate the potential for impairment is more likely than not. The goodwill impairment analysis is performed at the reporting unit level which is equal to or one level below our operating segments. Although accounting guidance provides for an optional qualitative assessment for testing goodwill impairment, all four reporting units elected to perform the quantitative two step test. For additional information on goodwill and the process for testing goodwill for impairment, see Note 2 and Note 10 to the Consolidated Financial Statements.
The Life Planner operations, the Gibraltar Life and Other operations, and the PGIM segment completed a quantitative impairment analysis using an earnings multiple approach. The earnings multiple approach indicates the value of a business based on comparison to publicly-traded comparable companies in similar lines of business. Each comparable company is analyzed based on various factors, including, but not limited to, financial risk, size, geographic diversification, profitability, adequate financial data, and an actively traded stock price. A multiple of price to earnings is developed for the comparable companies using independent analysts’ consensus estimates for each company’s 2019 forecasted earnings. The multiples are then aggregated and a mean and median multiple is calculated for the group. The lower of the mean or median multiple is then applied to the 2019 forecasted earnings of the reporting unit to develop a value. A control premium is then added to determine a total estimated fair value for the reporting unit.
68
In the Retirement Full Service business, the quantitative impairment analysis was completed using a discounted cash flow approach. This approach calculates the value of a business by applying a discount rate reflecting the market expected rate of return of the reporting unit to its projected future cash flows. These projected future cash flows were based on our internal forecasts, an expected growth rate and a terminal value. The reporting unit expected rate of return represents the required rate of return on its total capitalization. The process of deriving reporting unit specific required rates of return begins with the calculation of an overall Company Weighted Average Cost of Capital, which includes the calculation of the required return on equity using a Capital Asset Pricing Model (“CAPM”). The CAPM is a generally accepted method for estimating an equity investor’s return requirement, and hence a company’s cost of equity capital. The calculation using the CAPM begins with the long-term risk-free rate of return, then applies a market risk premium for large company common stock, as well as company specific adjustments to address volatility versus the market. The Company then determines reporting unit specific required rates of return based on their relative volatilities, benchmarks results against reporting unit comparable companies, and ensures that the sum of the reporting unit required returns (after considering the impact of unallocated Corporate costs and capital) add up to the overall Company required return. This process results in reporting unit specific discount rates which are then applied to the expected future cash flows of the Retirement Full Service business to estimate fair value.
After completion of the first step of the quantitative tests, the fair values exceeded the carrying amounts for each of the four reporting units and we concluded there was no impairment as of December 31,
2018
. PGIM, Life Planner operations, Gibraltar Life and Other operations, and Retirement Full Service had estimated fair values that exceeded their carrying amounts by a weighted average of 231%. Completion of the second step of the quantitative analysis is therefore not necessary.
Estimating the fair value of reporting units is a subjective process that involves the use of significant estimates by management. For all reporting units tested, market declines or other events impacting the fair value of these businesses, including discount rates, interest rates and growth rate assumptions or increases in the level of equity required to support these businesses, could result in goodwill impairments, resulting in a charge to income.
Valuation of Investments, Including Derivatives, and the Recognition of Other-than-Temporary Impairments
Our investment portfolio consists of public and private fixed maturity securities, commercial mortgage and other loans, equity securities, other invested assets, and derivative financial instruments. Derivatives are financial instruments whose values are derived from interest rates, foreign exchange rates, financial indices or the values of securities or commodities. Derivative financial instruments we generally use include swaps, futures, forwards and options and may be exchange-traded or contracted in the over-the-counter (“OTC”) market. We are also party to financial instruments that contain derivative instruments that are “embedded” in the financial instruments. Management believes the following accounting policies related to investments, including derivatives, are most dependent on the application of estimates and assumptions. Each of these policies is discussed further within other relevant disclosures related to the investments and derivatives, as referenced below:
|
•
|
Valuation of investments, including derivatives;
|
|
•
|
Recognition of other-than-temporary impairments (“OTTI”); and
|
|
•
|
Determination of the valuation allowance for losses on commercial mortgage and other loans.
|
We present at fair value in the statements of financial position our debt security investments classified as available-for-sale, investments classified as trading such as our assets supporting experience-rated contractholder liabilities and certain fixed maturities, equity securities, and certain investments within “Other invested assets,” such as derivatives. For additional information regarding the key estimates and assumptions surrounding the determination of fair value of fixed maturity and equity securities, as well as derivative instruments, embedded derivatives and other investments, see Note 6 to the Consolidated Financial Statements and “—Valuation of Assets and Liabilities—Fair Value of Assets and Liabilities.”
For our investments classified as available-for-sale, the impact of changes in fair value is recorded as an unrealized gain or loss in AOCI, a separate component of equity. For our investments classified as trading, equity securities, and derivatives, the impact of changes in fair value is recorded within “Other income (loss).” In addition, investments classified as available-for-sale, as well as those classified as held-to-maturity, are subject to impairment reviews to identify when a decline in value is other-than-temporary. For a discussion of our policies regarding other-than-temporary declines in investment value and the related methodology for recording OTTI of fixed maturity securities, see Note 2 to the Consolidated Financial Statements.
Commercial mortgage and other loans are carried primarily at unpaid principal balances, net of unamortized deferred loan origination fees and expenses and unamortized premiums or discounts and a valuation allowance for losses. For a discussion of our policies regarding the valuation allowance for commercial mortgage and other loans, see Note 2 to the Consolidated Financial Statements.
69
Pension and Other Postretirement Benefits
We sponsor pension and other postretirement benefit plans covering employees who meet specific eligibility requirements. Our net periodic costs for these plans consider an assumed discount (interest) rate, an expected rate of return on plan assets, expected increases in compensation levels, mortality and trends in health care costs. Of these assumptions, our expected rate of return assumptions and our discount rate assumptions have historically had the most significant effect on our net period costs associated with these plans.
We determine our expected rate of return on plan assets based upon a building block approach that considers inflation, real return, term premium, credit spreads, equity risk premium and capital appreciation as well as expenses, the effect of active management and the effect of rebalancing for the equity, debt and real estate asset mix applied on a weighted average basis to our pension asset portfolio. See Note 17 to our Consolidated Financial Statements for our actual asset allocations by asset category and the asset allocation ranges prescribed by our investment policy guidelines for both our pension and other postretirement benefit plans. Our assumed long-term rate of return for 2018 was 6.25% for our domestic pension plans and 7.00% for our other postretirement benefit plans. Given the amount of plan assets as of December 31, 2017, the beginning of the measurement year, if we had assumed an expected rate of return for both our domestic pension and other domestic postretirement benefit plans that was 100 bps higher or 100 bps lower than the rates we assumed, the change in our net periodic costs would have been as shown in the table below. The information provided in the table below considers only changes in our assumed long-term rate of return given the level and mix of invested assets at the beginning of the measurement year, without consideration of possible changes in any of the other assumptions described above that could ultimately accompany any changes in our assumed long-term rate of return.
|
|
For the year ended December 31, 2018
|
|||||||
|
|
Increase/(Decrease) in Net
Periodic Pension Cost
|
Increase/(Decrease) in Net
Periodic Other Postretirement Cost
|
||||||
|
|
(in millions)
|
|||||||
|
Increase in expected rate of return by 100 bps
|
$
|
(128
|
)
|
$
|
(16
|
)
|
||
|
Decrease in expected rate of return by 100 bps
|
$
|
128
|
|
$
|
16
|
|
||
Foreign pension plans represent 5% of plan assets at the beginning of 2018. An increase in expected rate of return by 100 bps would result in a decrease in net periodic pension costs of $6 million; conversely, a decrease in expected rate of return by 100 bps would result in an increase in net periodic pension costs of $6 million.
We determine our discount rate, used to value the pension and postretirement benefit obligations, based upon rates commensurate with current yields on high quality corporate bonds. See Note 17 to the Consolidated Financial Statements for information regarding the December 31, 2017 methodology we employed to determine our discount rate for 2018. Our assumed discount rate for 2018 was 3.65% for our domestic pension plans and 3.60% for our other domestic postretirement benefit plans. Given the amount of pension and postretirement obligations as of December 31, 2017, the beginning of the measurement year, if we had assumed a discount rate for both our domestic pension and other postretirement benefit plans that was 100 bps higher or 100 bps lower than the rates we assumed, the change in our net periodic costs would have been as shown in the table below. The information provided in the table below considers only changes in our assumed discount rate without consideration of possible changes in any of the other assumptions described above that could ultimately accompany any changes in our assumed discount rate.
|
|
For the year ended December 31, 2018
|
|||||||
|
|
Increase/(Decrease) in Net
Periodic Pension Cost
|
Increase/(Decrease) in Net
Periodic Other Postretirement Cost
|
||||||
|
|
(in millions)
|
|||||||
|
Increase in discount rate by 100 bps
|
$
|
(114
|
)
|
$
|
(7
|
)
|
||
|
Decrease in discount rate by 100 bps
|
$
|
134
|
|
$
|
6
|
|
||
Foreign pension plans represent 14% of plan obligations at the beginning of 2018. An increase in discount rate by 100 bps would result in a decrease in net periodic pension costs of $17 million; conversely, a decrease in discount rate by 100 bps would result in an increase in net periodic pension costs of $2 million.
70
Given the application of the authoritative guidance for accounting for pensions, and the deferral and amortization of actuarial gains and losses arising from changes in our assumed discount rate, the change in net periodic pension cost arising from an increase in the assumed discount rate by 100 bps would not always be expected to equal the change in net periodic pension cost arising from a decrease in the assumed discount rate by 100 bps.
For a discussion of our expected rate of return on plan assets and discount rate for our qualified pension plan in 2018, see “—Results of Operations by Segment—Corporate and Other.”
For purposes of calculating pension income from our own qualified pension plan for the year ended December 31, 2019, we will increase the discount rate to 4.30% from 3.65% in 2018. The expected rate of return on plan assets will increase to 6.50% in 2019 from 6.25% in 2018, and the assumed rate of increase in compensation will remain unchanged at 4.5%.
In addition to the effect of changes in our assumptions, the net periodic cost or benefit from our pension and other postretirement benefit plans may change due to factors such as actual experience being different from our assumptions, special benefits to terminated employees, or changes in benefits provided under the plans.
At December 31, 2018, the sensitivity of our domestic and foreign pension and postretirement obligations to a 100 basis point change in discount rate was as follows:
|
|
December 31, 2018
|
|||||||
|
|
Increase/(Decrease) in
Pension Benefits Obligation
|
Increase/(Decrease) in
Accumulated Postretirement
Benefits Obligation
|
||||||
|
|
(in millions)
|
|||||||
|
Increase in discount rate by 100 bps
|
$
|
(1,333
|
)
|
$
|
(172
|
)
|
||
|
Decrease in discount rate by 100 bps
|
$
|
1,515
|
|
$
|
190
|
|
||
Taxes on Income
Our effective tax rate is based on income, non-taxable and non-deductible items, tax credits, statutory tax rates and tax planning opportunities available in the various jurisdictions in which we operate. Inherent in determining our annual tax rate are judgments regarding business plans, planning opportunities and expectations about future outcomes. The Dividend Received Deduction (“DRD”) is a major reason for the difference between the Company’s effective tax rate and the U.S. federal statutory rate. The DRD is an estimate that incorporates the prior and current year information, as well as the current year’s equity market performance. Both the current estimate of the DRD and the DRD in future periods can vary based on factors such as, but not limited to, changes in the amount of dividends received that are eligible for the DRD, changes in the amount of distributions received from underlying fund investments, changes in the account balances of variable life and annuity contracts, and the Company’s taxable income before the DRD.
In December 2017, Securities and Exchange Commission
(“SEC”) staff issued “Staff Accounting Bulletin
118, Income Tax Accounting Implications of the Tax Cuts and Jobs Act” (“SAB 118”), which allowed the registrants to record provisional amounts during a ‘measurement period’ not to extend beyond one year. Under the relief provided by SAB 118, a company could recognize provisional amounts when it did not have the necessary information available, prepared or analyzed in reasonable detail to complete its accounting for the change in tax law. See Note 15 to the Consolidated Financial Statements for a discussion of provisional amounts related to The United States Tax Cuts and Jobs Act of 2017 (“Tax Act of 2017”) included in “Total income tax expense (benefit) before equity in earnings of operating joint ventures” in 2017 and adjustments to provisional amounts recorded in 2018.
The Tax Act of 2017 includes a provision causing post-1986 unremitted foreign earnings of at least 10% owned non-U.S. affiliates to be included in the Company’s U.S. income tax base, with an election to pay the associated tax on an eight-year installment basis. Unremitted foreign earnings from certain operations in foreign jurisdictions that impose a withholding tax on dividends are considered to be permanently reinvested for purposes of determining the applicable withholding tax expense. See Note 15 to the Consolidated Financial Statements for a discussion of unremitted earnings for which the Company provides U.S. income taxes.
An increase or decrease in our effective tax rate by one percentage point would have resulted in a decrease or increase in our 2018 “Total income tax expense (benefit)” of $48 million.
71
Contingencies
A contingency is an existing condition that involves a degree of uncertainty that will ultimately be resolved upon the occurrence of future events. Under U.S. GAAP, accruals for contingencies are required to be established when the future event is probable and its impact can be reasonably estimated, such as in connection with an unresolved legal matter. The initial reserve reflects management’s best estimate of the probable cost of ultimate resolution of the matter and is revised accordingly as facts and circumstances change and, ultimately, when the matter is brought to closure.
Other Accounting Policies
Accounting for Certain Reinsurance Contracts in our Individual Life business
In 2017, we recognized a charge of $237 million in our Individual Life segment, reflecting a change in our estimate of reinsurance cash flows associated with universal life products as well as a change in our method of reflecting these cash flows in the financial statements. Under our previous method of accounting, with the exception of recoveries pertaining to no lapse guarantees, we generally recognized reinsurance cash flows (e.g., premiums and recoveries) as they occurred. Under our new method, the expected reinsurance cash flows are recognized more ratably over the life of the underlying reinsured policies. In conjunction with this change, we revised how reinsurance is reflected in estimated gross profits used for the amortization of URR, DAC and VOBA. The change represents a change in accounting estimate effected by a change in accounting principle and is included within our annual reviews and update of assumptions and other refinements. The change in accounting estimate reflected insights gained from revised cashflow modeling enabled by a systems conversion, which prompted the change to a preferable accounting method. We view this new methodology as preferable as we believe it better reflects the economics of our reinsurance transactions by aligning the results of our reinsurance activity more closely to the underlying direct insurance activity and by better reflecting the profit pattern of this business for purposes of the amortization of the balances noted above.
Adoption of New Accounting Pronouncements
On August 15, 2018, the Financial Accounting Standards Board issued Accounting Standards Update (“ASU”) 2018-12,
Financial Services - Insurance (Topic 944): Targeted Improvements to the Accounting for Long-Duration Contracts
, which is expected to have a significant impact on the Company’s Consolidated Financial Statements and Notes to the Consolidated Financial Statements. The ASU is effective January 1, 2021 (with early adoption permitted), and will impact, at least to some extent, the accounting and disclosure requirements for all long-duration insurance and investment contracts issued by the Company. See Note 2 to the Consolidated Financial Statements for a more detailed discussion of ASU 2018-12, as well as other accounting pronouncements issued but not yet adopted and newly adopted accounting pronouncements.
Results of Operations by Segment
PGIM Division
PGIM
Business Update
We regularly review our existing businesses and may seek to deploy capital in support of our strategy or to exit an operation if it is determined that it no longer aligns with our broader strategy.
|
•
|
In the fourth quarter of 2018, we reached a preliminary agreement with Dewan Housing Finance Corporation Limited (“DHFL”) to acquire its stake in our 50/50 joint venture, DHFL Pramerica Asset Managers (“DPAM”), an India-based asset management company. Upon close of the transaction, DPAM will become a wholly-owned business with no change to the scope of its business. The transaction, which is subject to signing of definitive documentation, customary closing conditions and regulatory and other approvals, is currently expected to close during the first half of 2019.
|
|
•
|
In the fourth quarter of 2018, we entered into an agreement to acquire Wadhwani Asset Management LLP (“WAM”), a London-based quantitative macro-focused investment management firm. As a result of this transaction, which closed in January 2019, WAM will become part of our QMA business.
|
|
•
|
In the second quarter of 2018, we exited our PGIM Brazil operations including the sale of our minority interest in a Brazilian asset management joint venture. The results of this divested business and impact of the sale are reflected in our Corporate and Other operations (see “—Results of Operations by Segment—Divested and Run-off Businesses—Divested and Run-off Businesses Included in Corporate and Other” for additional information).
|
72
Operating Results
The following table sets forth the PGIM segment’s operating results for the periods indicated.
|
|
Year ended December 31,
|
|||||||||||
|
|
2018
|
2017
|
2016
|
|||||||||
|
|
(in millions)
|
|||||||||||
|
Operating results(1):
|
||||||||||||
|
Revenues
|
$
|
3,294
|
|
$
|
3,355
|
|
$
|
2,961
|
|
|||
|
Expenses
|
2,335
|
|
2,376
|
|
2,174
|
|
||||||
|
Adjusted operating income
|
959
|
|
979
|
|
787
|
|
||||||
|
Realized investment gains (losses), net, and related adjustments
|
(10
|
)
|
(4
|
)
|
(6
|
)
|
||||||
|
Equity in earnings of operating joint ventures and earnings attributable to noncontrolling interests
|
(21
|
)
|
95
|
|
45
|
|
||||||
|
Income (loss) before income taxes and equity in earnings of operating joint ventures
|
$
|
928
|
|
$
|
1,070
|
|
$
|
826
|
|
|||
__________
|
(1)
|
Certain of our PGIM segment’s investment activities are based in currencies other than the U.S. dollar and are therefore subject to foreign currency exchange rate risk. For each of the periods presented, the financial results of our PGIM segment include the impact of an intercompany arrangement with our Corporate and Other operations designed to mitigate the impact of exchange rate changes on the segment’s U.S. dollar-equivalent earnings. For more information related to this intercompany arrangement, see “—Results of Operations—Impact of Foreign Currency Exchange Rates,” above.
|
Adjusted Operating Income
2018 to 2017 Annual Comparison.
Adjusted operating income
decreased
$20 million
. The decrease primarily reflected lower other related revenues, net of associated expenses, driven by lower net performance-based incentive fees and lower strategic investing results due to less favorable investment performance. Also contributing to the decrease was higher non-compensation expenses supporting business growth. Partially offsetting these decreases were higher asset management fees, net of related expenses, driven by an increase in average assets under management as a result of equity market appreciation and continued strong fixed income flows, partially offset by equity outflows.
2017 to 2016 Annual Comparison.
Adjusted operating income increased $192 million. The increase primarily reflected higher asset management fees, net of related expenses, driven by an increase in average assets under management as a result of net fixed income inflows, market appreciation, and a favorable fee rate modification within certain real estate funds that occurred in the third quarter of 2016. Also contributing to the increase were higher other related revenues, net of associated expenses, driven by higher strategic investing results due to favorable investment performance, higher net performance-based incentive fees, and an increase in commercial mortgage agency loan originations. These increases were partially offset by higher expenses.
Revenues and Expenses
The following table sets forth the PGIM segment’s revenues, presented on a basis consistent with the table above under “—Operating Results,” by type.
73
|
|
Year ended December 31,
|
|||||||||||
|
|
2018
|
2017
|
2016
|
|||||||||
|
|
(in millions)
|
|||||||||||
|
Revenues by type:
|
||||||||||||
|
Asset management fees by source:
|
||||||||||||
|
Institutional customers
|
$
|
1,204
|
|
$
|
1,147
|
|
$
|
1,046
|
|
|||
|
Retail customers(1)
|
867
|
|
800
|
|
707
|
|
||||||
|
General account
|
471
|
|
470
|
|
474
|
|
||||||
|
Total asset management fees
|
2,542
|
|
2,417
|
|
2,227
|
|
||||||
|
Other related revenues by source:
|
||||||||||||
|
Incentive fees
|
59
|
|
197
|
|
108
|
|
||||||
|
Transaction fees
|
33
|
|
27
|
|
19
|
|
||||||
|
Strategic investing
|
57
|
|
88
|
|
25
|
|
||||||
|
Commercial mortgage(2)
|
121
|
|
127
|
|
103
|
|
||||||
|
Total other related revenues(3)
|
270
|
|
439
|
|
255
|
|
||||||
|
Service, distribution and other revenues(4)
|
482
|
|
499
|
|
479
|
|
||||||
|
Total revenues
|
$
|
3,294
|
|
$
|
3,355
|
|
$
|
2,961
|
|
|||
__________
|
(1)
|
Consists of fees from: individual mutual funds and variable annuities and variable life insurance separate account assets; funds invested in proprietary mutual funds through our defined contribution plan products; and third-party sub-advisory relationships. Revenues from fixed annuities and the fixed-rate accounts of variable annuities and variable life insurance are included in the general account.
|
|
(2)
|
Includes mortgage origination and spread lending revenues from our commercial mortgage origination and servicing business.
|
|
(3)
|
Future revenues will be impacted by the level and diversification of our strategic investments, the commercial real estate market, and other domestic and international markets.
|
|
(4)
|
Includes payments from Wells Fargo under an agreement dated as of July 30, 2004, implementing arrangements with respect to money market mutual funds in connection with the combination of our retail securities brokerage and clearing operations with those of Wells Fargo. The agreement extends for ten years after termination of the Wachovia Securities joint venture, which occurred on December 31, 2009. The revenue from Wells Fargo under this agreement was $70 million in
2018
, $80 million in
2017
and $84 million in
2016
.
|
2018 to 2017 Annual Comparison.
Revenues
decreased
$61 million
. Total asset management fees
increased
$125 million
primarily driven by an increase in average assets under management as a result of equity market appreciation and continued strong fixed income flows, partially offset by equity outflows. This increase was more than offset by a decrease of
$169 million
in other related revenues due to lower gross performance-based incentive fees and lower strategic investing results driven by less favorable investment performance.
Expenses
decreased
$41 million
, reflecting lower compensation attributable to lower earnings, partially offset by an increase in non-compensation expenses due to business growth.
2017 to 2016 Annual Comparison.
Revenues increased $394 million. Total asset management fees increased $190 million primarily as a result of net inflows within fixed income, market appreciation, and the impact of a favorable fee rate modification within certain real estate funds. Other related revenues increased $184 million primarily due to an increase in gross performance-based incentive fees related to certain fixed income funds, higher strategic investing results driven by favorable investment performance, and an increase in commercial mortgage agency loan originations. Service, distribution and other revenues increased $20 million reflecting higher net investment income and other revenue related to certain consolidated funds.
Expenses increased $202 million, primarily reflecting higher compensation attributable to higher earnings, as well as an increase in non-compensation related expenses.
Assets Under Management
The following table sets forth assets under management by asset class and source as of the dates indicated.
74
|
|
December 31,
|
|||||||||||
|
|
2018
|
2017
|
2016
|
|||||||||
|
|
(in billions)
|
|||||||||||
|
Assets Under Management (at fair value):
|
||||||||||||
|
Institutional customers:
|
||||||||||||
|
Equity
|
$
|
54.7
|
|
$
|
68.0
|
|
$
|
59.3
|
|
|||
|
Fixed income
|
395.1
|
|
379.4
|
|
332.2
|
|
||||||
|
Real estate
|
43.7
|
|
42.1
|
|
40.0
|
|
||||||
|
Institutional customers(1)
|
493.5
|
|
489.5
|
|
431.5
|
|
||||||
|
Retail customers:
|
||||||||||||
|
Equity
|
112.9
|
|
132.4
|
|
112.4
|
|
||||||
|
Fixed income
|
125.2
|
|
111.5
|
|
94.5
|
|
||||||
|
Real estate
|
2.0
|
|
1.7
|
|
2.3
|
|
||||||
|
Retail customers(2)
|
240.1
|
|
245.6
|
|
209.2
|
|
||||||
|
General account:
|
||||||||||||
|
Equity
|
5.1
|
|
5.8
|
|
6.4
|
|
||||||
|
Fixed income
|
420.8
|
|
412.5
|
|
391.3
|
|
||||||
|
Real estate
|
1.9
|
|
1.9
|
|
1.7
|
|
||||||
|
General account
|
427.8
|
|
420.2
|
|
399.4
|
|
||||||
|
Total PGIM assets under management
|
$
|
1,161.4
|
|
$
|
1,155.3
|
|
$
|
1,040.1
|
|
|||
|
Assets under management within other reporting segments(3)
|
215.9
|
|
238.3
|
|
223.7
|
|
||||||
|
Total PFI assets under management
|
$
|
1,377.3
|
|
$
|
1,393.6
|
|
$
|
1,263.8
|
|
|||
__________
|
(1)
|
Consists of third-party institutional assets and group insurance contracts.
|
|
(2)
|
Consists of: individual mutual funds and variable annuities and variable life insurance separate account assets; funds invested in proprietary mutual funds through our defined contribution plan products; and third-party sub-advisory relationships. Fixed annuities and the fixed-rate accounts of variable annuities and variable life insurance are included in the general account.
|
|
(3)
|
These amounts primarily include certain assets related to annuity and variable life products in our U.S. Individual Solutions division, retirement and group life products in our U.S. Workplace Solutions division and certain general account assets of our International Insurance division. These assets are not directly managed by PGIM, but rather are invested in non-proprietary funds or are managed by either the divisions themselves or our Chief Investment Officer Organization.
|
The following table sets forth the component changes in PGIM’s assets under management by asset source for the periods indicated.
75
|
|
December 31,
|
|||||||||||
|
2018
|
2017
|
2016
|
||||||||||
|
|
(in billions)
|
|||||||||||
|
Institutional Customers:
|
||||||||||||
|
Beginning assets under management
|
$
|
489.5
|
|
$
|
431.5
|
|
$
|
389.1
|
|
|||
|
Net additions (withdrawals), excluding money market activity:
|
||||||||||||
|
Third-party
|
14.1
|
|
11.6
|
|
5.3
|
|
||||||
|
Third-party via affiliates(1)
|
(0.5
|
)
|
2.4
|
|
0.8
|
|
||||||
|
Total
|
13.6
|
|
14.0
|
|
6.1
|
|
||||||
|
Market appreciation (depreciation)(2)
|
(10.3
|
)
|
42.9
|
|
24.2
|
|
||||||
|
Other increases (decreases)(3)
|
0.7
|
|
1.1
|
|
12.1
|
|
||||||
|
Ending assets under management
|
$
|
493.5
|
|
$
|
489.5
|
|
$
|
431.5
|
|
|||
|
Retail Customers:
|
||||||||||||
|
Beginning assets under management
|
$
|
245.6
|
|
$
|
209.2
|
|
$
|
197.3
|
|
|||
|
Net additions (withdrawals), excluding money market activity:
|
||||||||||||
|
Third-party
|
(0.4
|
)
|
4.1
|
|
0.4
|
|
||||||
|
Third-party via affiliates(1)
|
2.3
|
|
(2.0
|
)
|
(0.5
|
)
|
||||||
|
Total
|
1.9
|
|
2.1
|
|
(0.1
|
)
|
||||||
|
Market appreciation (depreciation)(2)
|
(7.2
|
)
|
34.6
|
|
9.1
|
|
||||||
|
Other increases (decreases)(3)
|
(0.2
|
)
|
(0.3
|
)
|
2.9
|
|
||||||
|
Ending assets under management
|
$
|
240.1
|
|
$
|
245.6
|
|
$
|
209.2
|
|
|||
|
General Account:
|
||||||||||||
|
Beginning assets under management
|
$
|
420.2
|
|
$
|
399.4
|
|
$
|
376.7
|
|
|||
|
Net additions (withdrawals), excluding money market activity:
|
||||||||||||
|
Third-party
|
0.0
|
|
0.0
|
|
0.0
|
|
||||||
|
Affiliated
|
9.2
|
|
3.9
|
|
8.9
|
|
||||||
|
Total
|
9.2
|
|
3.9
|
|
8.9
|
|
||||||
|
Market appreciation (depreciation)(2)
|
(4.2
|
)
|
15.1
|
|
13.3
|
|
||||||
|
Other increases (decreases)(3)
|
2.6
|
|
1.8
|
|
0.5
|
|
||||||
|
Ending assets under management
|
$
|
427.8
|
|
$
|
420.2
|
|
$
|
399.4
|
|
|||
__________
|
(1)
|
Represents assets that our PGIM segment manages for the benefit of other reporting segments within the Company. Additions and withdrawals of these assets are attributable to third-party product inflows and outflows in other reporting segments.
|
|
(2)
|
Includes income reinvestment, where applicable.
|
|
(3)
|
Includes the effect of foreign exchange rate changes, net money market activity primarily related to cash collateral received or released in conjunction with our Annuities’ living benefits hedging program, and the impact of acquired business. The impact from foreign currency fluctuations, which primarily impact the general account, resulted in gains of $1.2 billion, $4.7 billion and $2.7 billion for the years ended
December 31, 2018
,
2017
and
2016
, respectively.
|
Strategic Investments
The following table sets forth the strategic investments of the PGIM segment at carrying value (including the value of derivative instruments used to mitigate equity market and currency risk) by asset class and source as of the dates indicated.
|
|
December 31,
|
|||||||
|
|
2018
|
2017
|
||||||
|
|
(in millions)
|
|||||||
|
Co-Investments:
|
||||||||
|
Real estate
|
$
|
207
|
|
$
|
185
|
|
||
|
Fixed income
|
438
|
|
584
|
|
||||
|
Seed Investments:
|
||||||||
|
Real estate
|
50
|
|
50
|
|
||||
|
Public equity
|
738
|
|
658
|
|
||||
|
Fixed income
|
272
|
|
309
|
|
||||
|
Total
|
$
|
1,705
|
|
$
|
1,786
|
|
||
76
The decrease in strategic investments was primarily driven by relatively lower performance in certain strategies and sales of investments in U.S. collateralized loan obligations (“CLOs”) due to risk retention rules that were vacated in April 2018. This decrease was partially offset by investments in new CLOs and seed investments in new mutual funds, exchange-traded funds and undertakings for collective investment in transferable securities (“UCITs”).
U.S. Workplace Solutions Division
Retirement
Operating Results
The following table sets forth the Retirement segment’s operating results for the periods indicated.
|
|
Year ended December 31,
|
||||||||||
|
|
2018
|
2017
|
2016
|
||||||||
|
|
(in millions)
|
||||||||||
|
Operating results(1):
|
|||||||||||
|
Revenues
|
$
|
16,825
|
|
$
|
13,843
|
|
$
|
12,876
|
|
||
|
Benefits and expenses
|
15,776
|
|
12,599
|
|
11,864
|
|
|||||
|
Adjusted operating income
|
1,049
|
|
1,244
|
|
1,012
|
|
|||||
|
Realized investment gains (losses), net, and related adjustments
|
(249
|
)
|
(62
|
)
|
(281
|
)
|
|||||
|
Related charges
|
(5
|
)
|
(90
|
)
|
(272
|
)
|
|||||
|
Investment gains (losses) on assets supporting experience-rated contractholder liabilities, net
|
(588
|
)
|
118
|
|
(21
|
)
|
|||||
|
Change in experience-rated contractholder liabilities due to asset value changes
|
435
|
|
67
|
|
25
|
|
|||||
|
Income (loss) before income taxes and equity in earnings of operating joint ventures
|
$
|
642
|
|
$
|
1,277
|
|
$
|
463
|
|
||
__________
|
(1)
|
Certain of our Retirement segment’s non-U.S. dollar-denominated earnings are from longevity reinsurance contracts, which are denominated in British pounds sterling, and are therefore subject to foreign currency exchange rate risk. For the years ended December 31, 2017 and 2016, the financial results of our Retirement segment include the impact of an intercompany arrangement with our Corporate and Other operations designed to mitigate the impact of exchange rate changes on the segment’s U.S. dollar-equivalent earnings. Effective January 1, 2018 this intercompany arrangement was terminated and the foreign currency exchange rate risk is now managed within our Retirement segment using a strategy that may include external hedges. The impact of the agreement and the termination was not significant to the segment’s results. For more information related to this intercompany arrangement, see “—Results of Operations—Impact of Foreign Currency Exchange Rates,” above.
|
Adjusted Operating Income
2018
to
2017
Annual Comparison.
Adjusted operating income
decreased
$195 million
. Results for 2018 and 2017 reflected a net
charge
of
$68 million
and
$20 million
, respectively, from our annual reviews and update of assumptions and other refinements. Excluding these impacts, adjusted operating income
decreased
$147 million
, primarily driven by lower net investment spread results and higher general and administrative expenses, partially offset by more favorable reserve experience. The decrease in net investment spread results primarily reflected lower income on non-coupon investments and lower net prepayment fee income, partially offset by growth in average account values, including growth within our pension risk transfer business. The increase in general and administrative expenses was primarily driven by higher operating expenses driven by business growth. The higher contribution from reserve experience primarily reflected higher mortality gains on a comparative basis for existing contracts.
2017
to
2016
Annual Comparison.
Adjusted operating income increased $232 million. Results for 2017 and 2016 reflected a net charge of $20 million and a net benefit of $6 million, respectively, from our annual reviews and update of assumptions and other refinements. Excluding this unfavorable comparative impact, adjusted operating income increased $258 million, primarily driven by higher net investment spread results, a higher contribution from reserve experience and higher fee income. The increase in net investment spread results primarily reflected higher income on non-coupon investments, higher invested assets and net prepayment fee income, partially offset by lower reinvestment rates net of crediting rate actions on full service general account stable value products. The higher contribution from reserve experience primarily reflected higher mortality gains on a comparative basis for existing contracts and growth within our pension risk transfer business. Higher fee income primarily reflected growth in full service average account values driven by market appreciation.
Revenues, Benefits and Expenses
77
2018
to
2017
Annual Comparison.
Revenues
increased
$2,982 million
. Premiums
increased
$3,053 million
, primarily driven by new pension risk transfer transactions. This increase in premiums resulted in a corresponding increase in policyholders’ benefits, as discussed below. Net investment income
decreased
$105 million
, primarily reflecting lower income on non-coupon investments and lower net prepayment fee income, partially offset by higher asset balances, including growth within our pension risk transfer business.
Benefits and expenses
increased
$3,177 million
. Excluding the impact of our annual reviews and update of assumptions, as discussed above, benefits and expenses increased $3,129 million primarily driven by an increase in policyholders’ benefits, including the change in policy reserves, related to the increase in premiums discussed above.
2017
to
2016
Annual Comparison.
Revenues increased $967 million. Premiums increased $699 million, primarily driven by new pension risk transfer transactions. This increase in premiums resulted in a corresponding increase in policyholders’ benefits, as discussed below. Net investment income increased $219 million, primarily reflecting higher income on non-coupon investments and higher invested assets, partially offset by lower reinvestment rates. Policy charges and fee income, asset management and service fees and other income increased $49 million, primarily driven by higher fee income from growth in full service average account values driven by market appreciation.
Benefits and expenses increased $735 million. Excluding the impact of our annual reviews and update of assumptions and other refinements, as discussed above, benefits and expenses increased $709 million primarily driven by an increase in policyholders’ benefits, including the change in policy reserves, related to the increase in premiums discussed above.
Account Values
Account values are a significant driver of our operating results, and are primarily driven by net additions (withdrawals) and the impact of market changes. The income we earn on most of our fee-based products varies with the level of fee-based account values, since many policy fees are determined by these values. The investment income and interest we credit to policyholders on our spread-based products varies with the level of general account values. To a lesser extent, changes in account values impact our pattern of amortization of DAC and VOBA and general and administrative expenses. The following table shows the changes in the account values and net additions (withdrawals) of Retirement segment products for the periods indicated. Net additions (withdrawals) are plan sales and participant deposits or additions, as applicable, minus plan and participant withdrawals and benefits. Account values include both internally- and externally-managed client balances as the total balances drive revenue for the Retirement segment. For more information on internally-managed balances, see “—PGIM.”
|
|
Year ended December 31,
|
|||||||||||
|
|
2018
|
2017
|
2016
|
|||||||||
|
|
(in millions)
|
|||||||||||
|
Full Service:
|
||||||||||||
|
Beginning total account value
|
$
|
234,616
|
|
$
|
202,802
|
|
$
|
188,961
|
|
|||
|
Deposits and sales
|
33,116
|
|
29,527
|
|
21,928
|
|
||||||
|
Withdrawals and benefits
|
(26,429
|
)
|
(24,811
|
)
|
(20,127
|
)
|
||||||
|
Change in market value, interest credited and interest income and other activity
|
(9,634
|
)
|
27,098
|
|
12,040
|
|
||||||
|
Ending total account value
|
$
|
231,669
|
|
$
|
234,616
|
|
$
|
202,802
|
|
|||
|
Institutional Investment Products:
|
||||||||||||
|
Beginning total account value
|
$
|
194,492
|
|
$
|
183,376
|
|
$
|
179,964
|
|
|||
|
Additions(1)
|
21,310
|
|
21,630
|
|
16,140
|
|
||||||
|
Withdrawals and benefits
|
(15,409
|
)
|
(17,406
|
)
|
(12,161
|
)
|
||||||
|
Change in market value, interest credited and interest income
|
3,303
|
|
5,190
|
|
5,299
|
|
||||||
|
Other(2)
|
(2,937
|
)
|
1,702
|
|
(5,866
|
)
|
||||||
|
Ending total account value
|
$
|
200,759
|
|
$
|
194,492
|
|
$
|
183,376
|
|
|||
__________
|
(1)
|
Additions primarily include: group annuities calculated based on premiums received; longevity reinsurance contracts calculated as the present value of future projected benefits; and investment-only stable value contracts calculated as the fair value of customers’ funds held in a client-owned trust.
|
|
(2)
|
“Other” activity includes the effect of foreign exchange rate changes associated with our British pounds sterling denominated longevity reinsurance business and changes in asset balances for externally-managed accounts. For the years ended December 31, 2018 and 2017, “other” activity also includes $3,497 million in receipts offset by $3,457 million in payments and $4,782 million in receipts offset by $4,375 million in payments, respectively, related to funding agreements backed by commercial paper which typically have maturities of less than 90 days.
|
2018
to
2017
Annual Comparison.
The decrease in full service account values primarily reflected the unfavorable changes in the market value of customer funds, partially offset by positive net plan sales.
78
The increase in institutional investment products account values primarily reflected net additions from pension risk transfer transactions.
2017
to
2016
Annual Comparison.
The increase in full service account values primarily reflected the favorable changes in the market value of customer funds and the addition of a significant defined contribution transaction. The increase in net additions was primarily driven by higher large plan sales, partially offset by higher large plan lapses.
The increase in institutional investment products account values primarily reflected net additions from pension risk transfer transactions, interest credited on customer funds and the impact from foreign currency fluctuations on longevity reinsurance account values, partially offset by net withdrawals from investment-only stable value accounts. The increase in net additions was primarily driven by higher net additions related to pension risk transfer transactions, partially offset by investment-only stable value accounts, which reflected net withdrawals in 2017 compared to net additions in 2016.
Group Insurance
Business Update
During the second quarter of 2018, we entered into a yearly renewable term reinsurance agreement with certain external counterparties to reinsure a portion of the mortality risk associated with our group life business. This resulted in a reduction in risk-based capital required to be held in the segment. Under U.S. GAAP, this agreement is accounted for under deposit accounting. Following this transaction, we expect a modest negative impact on the segment’s adjusted operating income as a result of risk charge expenses associated with this reinsurance arrangement and a reduction in investment income because we were able to release capital from the segment as a result of the transaction.
Operating Results
The following table sets forth the Group Insurance segment’s operating results and benefits and administrative operating expense ratios for the periods indicated.
|
|
Year ended December 31,
|
|||||||||||
|
|
2018
|
2017
|
2016
|
|||||||||
|
|
(in millions)
|
|||||||||||
|
Operating results:
|
||||||||||||
|
Revenues
|
$
|
5,685
|
|
$
|
5,471
|
|
$
|
5,343
|
|
|||
|
Benefits and expenses
|
5,456
|
|
5,218
|
|
5,123
|
|
||||||
|
Adjusted operating income
|
229
|
|
253
|
|
220
|
|
||||||
|
Realized investment gains (losses), net, and related adjustments
|
(38
|
)
|
(53
|
)
|
(8
|
)
|
||||||
|
Related charges
|
0
|
|
0
|
|
(6
|
)
|
||||||
|
Income (loss) before income taxes and equity in earnings of operating joint ventures
|
$
|
191
|
|
$
|
200
|
|
$
|
206
|
|
|||
|
Benefits ratio(1):
|
||||||||||||
|
Group life(2)
|
87.2
|
%
|
88.9
|
%
|
89.1
|
%
|
||||||
|
Group disability(2)
|
75.8
|
%
|
71.8
|
%
|
75.7
|
%
|
||||||
|
Total Group insurance(2)
|
84.9
|
%
|
85.8
|
%
|
86.7
|
%
|
||||||
|
Administrative operating expense ratio(3):
|
||||||||||||
|
Group life
|
12.2
|
%
|
11.2
|
%
|
10.6
|
%
|
||||||
|
Group disability
|
27.0
|
%
|
29.4
|
%
|
31.4
|
%
|
||||||
|
Total Group Insurance
|
15.1
|
%
|
14.6
|
%
|
14.3
|
%
|
||||||
__________
|
(1)
|
Ratio of policyholder benefits to earned premiums plus policy charges and fee income.
|
|
(2)
|
Benefits ratios reflect the impacts of our annual reviews and update of assumptions and other refinements. Excluding these impacts, the group life, group disability and total Group Insurance benefits ratios were
87.4%
,
77.8%
and
85.5%
for
2018
, respectively,
88.7%
,
78.9%
and
86.9%
for
2017
, respectively, and
88.5%
,
82.9%
and
87.5%
for
2016
, respectively.
|
|
(3)
|
Ratio of general and administrative expenses (excluding commissions) to gross premiums plus policy charges and fee income.
|
Adjusted Operating Income
79
2018 to 2017 Annual Comparison.
Adjusted operating income
decreased
$
24 million
, including an unfavorable comparative net impact from our annual reviews and update of assumptions and other refinements. Results for 2018 included a $31 million net benefit from these updates while results for 2017 included a $55 million net benefit from these updates. The net benefit in both periods was primarily driven by favorable experience related to our group disability business. Excluding the effect of these items, adjusted operating income was in line with the prior year, reflecting more favorable underwriting results in our group life and group disability businesses primarily driven by business growth, offset by higher expenses, including expenses related to business growth, and a lower contribution from net investment spread results driven by lower income on non-coupon investments.
2017 to 2016 Annual Comparison.
Adjusted operating income increased $33 million, including favorable comparative net impacts from our annual reviews and update of assumptions and other refinements. Results for 2017 included a $55 million net benefit from these updates while results for 2016 included a $41 million net benefit. The net benefit in both periods was primarily driven by favorable experience related to our group disability business. Excluding the effect of these items, adjusted operating income increased $19 million, primarily reflecting favorable underwriting results in our group disability business and a higher contribution from net investment spread results, partially offset by higher expenses.
Revenues, Benefits and Expenses
2018 to 2017 Annual Comparison
. Revenues
increased
$
214 million
. Excluding an unfavorable comparative impact of $5 million resulting from our annual reviews and update of assumptions and other refinements, as discussed above, revenues increased $219 million. The increase primarily reflected higher premiums and policy charges and fee income driven by business growth in both our group life and group disability businesses, partially offset by lower income on non-coupon investments.
Benefits and expenses
increased
$
238 million
. Excluding an unfavorable comparative impact of $19 million resulting from our annual reviews and update of assumptions and other refinements, as discussed above, benefits and expenses increased $219 million. The increase primarily reflected higher policyholders’ benefits and changes in reserves driven by the growth in premiums discussed above, and an increase in general and administrative expenses driven by higher operating expenses from business growth and the termination of a third-party underwriting service provider contract in the second quarter of 2018.
2017 to 2016 Annual Comparison
. Revenues increased $128 million. Excluding an unfavorable comparative impact of $37 million resulting from our annual reviews and update of assumptions and other refinements, revenues increased $165 million. The increase reflected $135 million of higher premiums and policy charges and fee income, primarily driven by the increase in new business in both our group life and group disability businesses, as well as higher premiums on experience-rated contracts in our group life business with corresponding offsets in benefits and expenses. Net investment income increased $29 million primarily driven by higher income from non-coupon investments.
Benefits and expenses increased $95 million. Excluding a favorable comparative impact of $51 million resulting from our annual reviews and update of assumptions and other refinements, benefits and expenses increased $146 million. This increase primarily reflected higher policyholders’ benefits and changes in reserves, driven by higher benefits on group life experience-rated contracts, as discussed above, higher benefit payments in our group disability business and our non-experience rated group life contracts, and higher general and administrative expenses.
Sales Results
The following table sets forth the Group Insurance segment’s annualized new business premiums, as defined under “—Segment Measures” above, for the periods indicated.
|
|
Year ended December 31,
|
|||||||||||
|
|
2018
|
2017
|
2016
|
|||||||||
|
|
(in millions)
|
|||||||||||
|
Annualized new business premiums(1):
|
||||||||||||
|
Group life
|
$
|
376
|
|
$
|
287
|
|
$
|
316
|
|
|||
|
Group disability
|
183
|
|
153
|
|
119
|
|
||||||
|
Total
|
$
|
559
|
|
$
|
440
|
|
$
|
435
|
|
|||
__________
|
(1)
|
Amounts exclude new premiums resulting from rate changes on existing policies, from additional coverage under our Servicemembers’ Group Life Insurance contract and from excess premiums on group universal life insurance that build cash value but do not purchase face amounts.
|
2018 to 2017 Annual Comparison.
Total annualized new business premiums increased $119 million reflecting continued growth through sales to new and existing clients in both our group life and group disability businesses.
80
2017 to 2016 Annual Comparison.
Total annualized new business premiums increased $5 million primarily driven by sales to new clients in our group disability business, partially offset by lower sales in our group life business, which included a large client sale in 2016.
U.S. Individual Solutions Division
Individual Annuities
The Individual Annuities segment includes both variable and fixed annuities that may include optional guaranteed living benefits riders (e.g., GMIB, GMAB, GMWB and GMIWB), and/or GMDB. We also offer fixed annuities that provide a guarantee of principal and interest credited at rates we determine (subject to certain contractual minimums) or at rates based upon the performance of an index (subject to caps). We derive our revenue mainly from fee income generated on variable annuity account values, as the investment return on these contractholder funds is generally attributed directly to the contractholder. We also earn investment income on general account assets supporting annuity account values and certain other management fees. Our expenses primarily consist of interest credited and other benefits to contractholders, amortization of DAC and other costs, non-deferred expenses related to the selling and servicing of the various products we offer, costs of managing certain risks associated with these products, changes in the reserves for benefit guarantees and other general business expenses. These drivers of our business results are generally included in adjusted operating income, with exceptions related to certain guarantees, as discussed below.
The U.S. GAAP accounting and our adjusted operating income treatment for our guarantees differ depending upon the specific contractual features. Under U.S. GAAP, the reserves for GMDB and GMIB are calculated based on best estimates applying our actuarial and capital markets return assumptions in accordance with an insurance fulfillment accounting framework. Under this framework, a liability is established over time representing the portion of fees collected that is expected to be used to satisfy the obligation to pay benefits in future periods. The risks associated with these benefit features are retained and results are included in adjusted operating income in a manner generally consistent with U.S. GAAP.
In contrast, certain of our guaranteed living benefit riders (e.g., GMAB, GMWB and GMIWB) are accounted for under U.S. GAAP as embedded derivatives and reported using a fair value accounting framework. These benefit features are carried at fair value, based on estimates of assumptions a market participant would use in valuing these embedded derivatives, and the change in fair value during each reporting period is recorded within “Realized investment gains (losses), net.”
For purposes of measuring segment performance, adjusted operating income excludes the changes in fair value and instead reflects the performance of these riders using an insurance fulfillment accounting framework. Under this framework, adjusted operating income recognized each period reflects the rider fees earned during the period, less the portion of such fees estimated to be required to cover future benefit payments and hedging costs. For more information on how we determine the portion of fees needed to cover estimated future benefit payments and hedging costs, see “Variable Annuity Risks and Risk Mitigants” below.
Operating Results
The following table sets forth the Individual Annuities segment’s operating results for the periods indicated.
|
|
Year ended December 31,
|
|||||||||||
|
|
2018
|
2017
|
2016
|
|||||||||
|
|
(in millions)
|
|||||||||||
|
Operating results:
|
||||||||||||
|
Revenues
|
$
|
4,966
|
|
$
|
5,110
|
|
$
|
4,666
|
|
|||
|
Benefits and expenses
|
3,041
|
|
2,912
|
|
2,901
|
|
||||||
|
Adjusted operating income
|
1,925
|
|
2,198
|
|
1,765
|
|
||||||
|
Realized investment gains (losses), net, and related adjustments
|
846
|
|
(1,157
|
)
|
2,031
|
|
||||||
|
Related charges
|
(407
|
)
|
577
|
|
68
|
|
||||||
|
Income (loss) before income taxes and equity in earnings of operating joint ventures
|
$
|
2,364
|
|
$
|
1,618
|
|
$
|
3,864
|
|
|||
81
Adjusted Operating Income
2018
to
2017
Annual Comparison.
Adjusted operating income decreased $273 million. Excluding the impacts of changes in the estimated profitability of the business, discussed below, adjusted operating income decreased $56 million. The decrease was primarily driven by lower net investment spread results reflecting lower investment income on non-coupon investments, higher capital hedge costs, and higher distribution expenses due to increased sales. Partially offsetting these decreases were lower amortization costs and reserve provisions as well as higher asset-based fee income, net of associated costs. The increase in the net asset-based fee income reflected higher average variable annuity account values due to market appreciation and favorable impacts related to our living benefit guarantees, partially offset by negative net flows and the impact of certain products reaching contractual milestones for fee tier reduction.
The impacts of changes in the estimated profitability of the business include adjustments to the amortization of DAC and other costs as well as to the reserves for certain living and/or death benefit features of our variable annuity products. These adjustments resulted in a net charge of $34 million and a net benefit of $183 million in 2018 and 2017, respectively, reflecting the net impact of hedge effectiveness relative to our assumptions, as well as a net benefit resulting from our annual reviews and update of assumptions and other refinements. Additionally, the net benefit of $183 million also reflected the net impact of equity market performance on contractholder accounts.
2017
to
2016
Annual Comparison.
Adjusted operating income increased $433 million. Excluding the impacts of changes in the estimated profitability of the business, discussed below, adjusted operating income increased $388 million. The increase was primarily driven by higher asset-based fee income, net of associated costs, lower amortization costs and reserve provisions, and higher net investment spread results. The increase in asset-based fee income, net of a related increase in asset-based commissions, reflects higher average variable annuity account values due to market appreciation; and the impact of greater efficiencies in managing product risks associated with the Asset Liability Management strategy that was implemented in the third quarter of 2016. The increase in net investment spread results reflects higher investment income on non-coupon investments as well as a higher level of invested assets.
The adjustments to the amortization of DAC and other costs and to the reserves for certain living and/or death benefit features of our variable annuity products resulted in a net benefit of $183 million in 2017, as discussed above, and a net benefit of $138 million in 2016 primarily reflecting the net impact of equity market performance on contractholder accounts, hedge effectiveness relative to our assumptions, and a net benefit resulting from our annual reviews and update of assumptions and other refinements.
Revenues, Benefits and Expenses
2018
to
2017
Annual Comparison.
Revenues decreased $144 million. Excluding a $93 million net decrease related to the impacts of certain changes in our estimated profitability of the business, as discussed above, revenues decreased $51 million. The decrease is primarily due to a decrease in net investment spread results reflecting lower investment income on non-coupon investments, as well as a decrease in asset management and services fees and other income attributable to higher capital hedge costs. These decreases were partially offset by an increase in premiums reflecting an increase in annuitizations of our variable annuity contracts, with offsets in policyholders’ benefits, as discussed below. Also contributing to the partial offset was an increase in policy charges and fee income reflecting higher average variable annuity account values due to market appreciation and favorable impacts related to our living benefit guarantees, partially offset by
negative net flows and the impact of certain products reaching contractual milestones for fee tier reduction.
Benefits and expenses increased $129 million. Excluding a $124 million net increase related to the impacts of certain changes in our estimated profitability of the business, as discussed above, benefits and expenses increased $5 million. General and administrative expenses, net of capitalization, increased $27 million due to higher distribution expenses driven by higher sales, as well as higher technology costs. Policyholders’ benefits, including changes in reserves, increased $9 million primarily due to higher reserve provisions and annuitizations, as discussed above. These increases were partially offset by a decrease of $17 million in interest credited to policyholders’ account balance, and a decrease of $11 million in amortization of acquisition costs.
2017
to
2016
Annual Comparison.
Revenues increased $444 million. Excluding an $85 million net increase related to the impacts of certain changes in our estimated profitability of the business, as discussed above, revenues increased $359 million. Higher average variable annuity account values and the impact from refinements to our risk management strategy drove increases in policy charges and fee income, and asset management and service fees and other income. The increase in net investment income was driven by higher income from non-coupon investments and a higher level of invested assets.
82
Benefits and expenses increased $11 million. Excluding a $40 million net increase related to the impacts of certain changes in our estimated profitability of the business, as discussed above, benefits and expenses decreased $29 million, primarily driven by a decrease in policyholders’ benefits, including changes in reserves. Partially offsetting this decrease were higher general and administrative expenses, net of capitalization, primarily driven by higher asset management costs and higher asset-based commissions due to higher average account values, as well as from higher net operating expenses, including those supporting business growth initiatives.
Account Values
Account values are a significant driver of our operating results. Since most fees are determined by the level of separate account assets, fee income varies according to the level of account values. Additionally, our fee income generally drives other items such as the pattern of amortization of DAC and other costs. Account values are driven by net flows from new business sales, surrenders, withdrawals and benefit payments, policy charges and the impact of positive or negative market value changes. The annuity industry’s competitive and regulatory landscapes, which have been dynamic over the last few years, may impact our net flows, including new business sales. The following table sets forth account value information for the periods indicated.
|
|
Year ended December 31,
|
|||||||||||
|
|
2018
|
2017
|
2016
|
|||||||||
|
|
(in millions)
|
|||||||||||
|
Total Individual Annuities(1):
|
||||||||||||
|
Beginning total account value
|
$
|
168,626
|
|
$
|
156,783
|
|
$
|
152,945
|
|
|||
|
Sales
|
8,270
|
|
5,894
|
|
8,054
|
|
||||||
|
Surrenders and withdrawals
|
(11,688
|
)
|
(9,821
|
)
|
(7,881
|
)
|
||||||
|
Net sales (withdrawals)
|
(3,418
|
)
|
(3,927
|
)
|
173
|
|
||||||
|
Benefit payments
|
(2,084
|
)
|
(1,873
|
)
|
(1,794
|
)
|
||||||
|
Net flows
|
(5,502
|
)
|
(5,800
|
)
|
(1,621
|
)
|
||||||
|
Change in market value, interest credited and other activity
|
(8,341
|
)
|
21,355
|
|
9,012
|
|
||||||
|
Policy charges
|
(3,703
|
)
|
(3,712
|
)
|
(3,553
|
)
|
||||||
|
Ending total account value
|
$
|
151,080
|
|
$
|
168,626
|
|
$
|
156,783
|
|
|||
__________
|
(1)
|
Includes variable and fixed annuities sold as retail investment products. Investments sold through defined contribution plan products are included with such products within the Retirement segment. Variable annuity account values were $147.3 billion, $165.1 billion and $153.3 billion as of December 31,
2018
,
2017
and
2016
, respectively. Fixed annuity account values were $3.7 billion as of December 31,
2018
, and $3.5 billion as of December 31,
2017
and
2016
.
|
2018
to
2017
Annual Comparison.
The decrease in account values during 2018 was predominantly driven by unfavorable changes in the market value of contractholder funds. This decrease was slightly offset by an increase in net sales reflecting higher gross sales, partially offset by higher surrenders and withdrawals as well as benefit payments and policy charges that were generally in line with prior periods.
2017
to
2016
Annual Comparison.
The increase in account values during 2017 was predominantly driven by favorable changes in the market value of contractholder funds. Net sales for 2017 decreased compared to 2016 reflecting lower gross sales and higher surrenders and withdrawals. The decline in gross sales for 2017 compared to 2016 was largely driven by the continued impact stemming from the evolving U.S. Department of Labor fiduciary rules and an industry shift away from variable annuity products
.
Variable Annuity Risks and Risk Mitigants
The primary risk exposures of our variable annuity contracts relate to actual deviations from, or changes to, the assumptions used in the original pricing of these products, including capital markets assumptions such as equity market returns, interest rates and market volatility, along with actuarial assumptions such as contractholder mortality, the timing and amount of annuitization and withdrawals, and contract lapses. For these risk exposures, achievement of our expected returns and profitability is subject to the risk that actual experience will differ from the assumptions used in the original pricing of these products. We currently manage our exposure to certain risks driven by fluctuations in capital markets primarily through a combination of Product Design Features, an Asset Liability Management Strategy, a Capital Hedge Program and External Reinsurance.
Product Design Features
83
A portion of the variable annuity contracts that we offer include an automatic rebalancing feature, also referred to as an asset transfer feature. This feature is implemented at the contract level, and transfers assets between certain variable investment sub-accounts selected by the annuity contractholder and, depending on the benefit feature, a fixed-rate account in the general account or a bond fund sub-account within the separate accounts. The automatic rebalancing feature associated with currently-sold highest daily benefit products uses a designated bond fund sub-account within the separate accounts. The transfers are based on a static mathematical formula used with the particular benefit which considers a number of factors, including, but not limited to, the impact of investment performance on the contractholder’s total account value. The objective of the automatic rebalancing feature is to reduce our exposure to equity market risk and market volatility. Other product design features we utilize include, among others, asset allocation restrictions, minimum issuance age requirements and certain limitations on the amount of contractholder deposits, as well as a required minimum allocation to our general account for certain of our products. We continue to introduce products that diversify our risk profile and have incorporated provisions in product design allowing frequent revisions of key pricing elements for certain of our products. In addition, there is diversity in our fee arrangements, as certain fees are primarily based on the benefit guarantee amount, the contractholder account value and/or premiums, which helps preserve certain revenue streams when market fluctuations cause account values to decline.
Asset Liability Management (“ALM”) Strategy (including fixed income instruments and derivatives)
Under our historical hedging program to manage certain capital market risks associated with certain variable annuity living benefit guarantees, we utilized the U.S. GAAP valuation, with certain modifications, to derive a hedge target that was more reflective of our best estimate of future benefit payments, net of fees collected. Derivative positions were entered into that sought to offset the change in value of the hedge target.
During the third quarter of 2016, we implemented a new ALM strategy that utilizes a combination of both traditional fixed income instruments and derivatives to help defray potential claims associated with our variable annuity living benefit guarantees. The economic liability we manage with this ALM strategy consists of expected living benefit claims under less severe market conditions, which are managed through the accumulation of fixed income instruments, and potential living benefit claims resulting from more severe market conditions, which are hedged using derivative instruments. For the portion of our ALM strategy executed with derivatives, we enter into a range of exchange-traded, cleared, and OTC equity and interest rate derivatives, including, but not limited to: equity and treasury futures; total return and interest rate swaps; and options, including equity options, swaptions, and floors and caps. The intent of this strategy is to more efficiently manage the capital and liquidity associated with these products while continuing to mitigate fluctuations in net income due to movements in capital markets.
The change in hedge strategy had no impact on how we value or account for the living benefit guarantees under U.S. GAAP. However, under the ALM strategy that began in the third quarter of 2016, adjusted operating income includes the fees earned that are in excess of the estimated portion of fees required to cover expected claims and hedge costs for the economic liability. The portion of fees required to cover such costs is updated quarterly to reflect updated estimates and actual experience. The effectiveness of our hedging program as measured by comparing the change in value of our hedging assets to the change in value of the liability we are attempting to hedge will ultimately be reflected in adjusted operating income over time through the inclusion of actual hedge costs. Expected costs are updated periodically along with our expectation of claims. For adjusted operating income purposes, DAC and other costs are fully amortized over the life of the contracts proportional to our actual and estimated gross profits under the adjusted operating income framework described above. Overall, we generally expect this strategy to result in a higher portion of fees being recognized in adjusted operating income than under our prior strategy.
The following table provides a reconciliation between the liability reported under U.S. GAAP and the economic liability we manage through our ALM strategy.
|
|
As of December 31,
|
|||||||
|
|
2018
|
2017
|
||||||
|
|
(in millions)
|
|||||||
|
U.S. GAAP liability (including non-performance risk)
|
$
|
8,860
|
|
$
|
8,663
|
|
||
|
Non-performance risk adjustment
|
4,619
|
|
3,228
|
|
||||
|
Subtotal
|
13,479
|
|
11,891
|
|
||||
|
Adjustments including risk margins and valuation methodology differences
|
(4,084
|
)
|
(2,742
|
)
|
||||
|
Economic liability managed through the ALM strategy
|
$
|
9,395
|
|
$
|
9,149
|
|
||
As of December 31, 2018, our fixed income instruments and derivative assets exceed the economic liability within the entities in which the risks reside.
84
Under our ALM strategy, we expect differences in the U.S. GAAP net income impact between the changes in value of the fixed income instruments and derivatives, as compared to the changes in the embedded derivative liability these assets support. These differences can be primarily attributed to three distinct areas:
|
•
|
Different valuation methodologies in measuring the liability we intend to cover with fixed income instruments and derivatives versus the liability reported under U.S. GAAP
—The valuation methodology utilized in estimating the economic liability we intend to defray with fixed income instruments and derivatives is different from that required to be utilized to measure the liability under U.S. GAAP. Additionally, the valuation of the economic liability excludes certain items that are included within the U.S. GAAP liability, such as NPR (in order to maximize protection irrespective of the possibility of our own default), as well as risk margins (required by U.S. GAAP but different from our best estimate).
|
|
•
|
Different accounting treatment between liabilities and assets supporting those liabilities
—Under U.S. GAAP, changes in value of the embedded derivative liability and derivative instruments used to hedge a portion of the economic liability are immediately reflected in net income. In contrast, changes in fair value of fixed income instruments that support a portion of the economic liability are designated as available-for-sale and are recorded as unrealized gains (losses) in other comprehensive income rather than within net income.
|
|
•
|
General hedge results
—For the derivative portion of the ALM strategy, the net hedging impact (the extent to which the changes in value of the hedging instruments offset the change in value of the portion of the economic liability we are hedging) may be impacted by a number of factors including: cash flow timing differences between our hedging instruments and the corresponding portion of the economic liability we are hedging, basis differences attributable to actual underlying contractholder funds to be hedged versus hedgeable indices, rebalancing costs related to dynamic rebalancing of hedging instruments as markets move, certain elements of the economic liability that may not be hedged (including certain actuarial assumptions), and implied and realized market volatility on the hedge positions relative to the portion of the economic liability we seek to hedge.
|
The following table illustrates the net impact to our Consolidated Statements of Operations from changes in the U.S. GAAP embedded derivative liability and hedge positions under the ALM strategy, and the related amortization of DAC and other costs, that are excluded from adjusted operating income.
|
|
Year ended December 31,
|
|||||||||||
|
|
2018
|
2017
|
2016
|
|||||||||
|
(in millions)(1)
|
||||||||||||
|
Excluding impact of assumption updates and other refinements:
|
||||||||||||
|
Net hedging impact(2)(3)
|
$
|
(234
|
)
|
$
|
620
|
|
$
|
(692
|
)
|
|||
|
Change in portions of U.S. GAAP liability, before NPR(4)
|
(959
|
)
|
2,477
|
|
1,745
|
|
||||||
|
Change in the NPR adjustment
|
1,472
|
|
(3,890
|
)
|
(1,097
|
)
|
||||||
|
Net impact from changes in the U.S. GAAP embedded derivative and hedge positions-reported in Individual Annuities
|
279
|
|
(793
|
)
|
(44
|
)
|
||||||
|
Related benefit (charge) to amortization of DAC and other costs
|
(190
|
)
|
159
|
|
243
|
|
||||||
|
Net impact of assumption updates and other refinements
|
(173
|
)
|
(85
|
)
|
1,455
|
|
||||||
|
Net impact from changes in the U.S. GAAP embedded derivative and hedge positions, after the impact of NPR, DAC and other costs-reported in Individual Annuities(3)
|
$
|
(84
|
)
|
$
|
(719
|
)
|
$
|
1,654
|
|
|||
__________
|
(1)
|
Positive amount represents income; negative amount represents a loss.
|
|
(2)
|
Net hedging impact represents the difference between the change in fair value of the risk we seek to hedge using derivatives and the change in fair value of the derivatives utilized with respect to that risk.
|
|
(3)
|
Excludes $(1,523) million for 2016 representing the impact of managing interest rate risk through our Capital Protection Framework prior to the introduction of our new ALM strategy in the third quarter of 2016. Because the decision to manage this risk through the Capital Protection Framework was based on the capital considerations of the Company as a whole, the impact was reported in Corporate and Other operations. See “—Corporate and Other.”
|
|
(4)
|
Represents risk margins and valuation methodology differences between the economic liability managed by the ALM strategy and the U.S. GAAP liability, as well as the portion of the economic liability managed with fixed income instruments.
|
The net loss of $84 million for 2018 primarily reflected the impact of a $173 million charge from our annual review and update of assumptions, driven by modifications to both our actuarial assumptions, including updates to expected withdrawal rates, as well as to economic assumptions. These charges were largely offset by changes in the U.S. GAAP embedded derivative and hedge positions as a result of credit spreads widening, partially offset by declining rates and unfavorable equity markets.
85
The net loss of $719 million for 2017 primarily reflected the net impact of a $793 million loss from changes in the U.S. GAAP embedded derivative and hedge positions, predominantly driven by a decrease in the NPR adjustment due to tightening of credit spreads used in measuring our living benefits contracts. Partially offsetting this decrease were an increase in the portions of the U.S. GAAP liability before NPR that are excluded from our hedge target and, to a lesser extent, a benefit from net hedging impacts, primarily driven by fund outperformance and favorable liability basis.
The net gain of $1,654 million for 2016 primarily reflected the impact of a $1,455 million benefit from our annual review and update of assumptions, driven by modifications to both our actuarial assumptions, including updates to expected withdrawal rates, as well as economic assumptions. The net gain also reflected the changes in the portions of the U.S. GAAP liability before NPR that are excluded from our hedge target. This impact was partially offset by changes in the NPR adjustment, primarily driven by tightening of credit spreads. To a lesser extent, results also reflected net hedging impacts, primarily driven by unfavorable liability basis. Each of these items had corresponding partial offsets included in the related impacts to amortization of DAC and other costs. Amortization of DAC and other costs also included a benefit of $515 million related to changes in our estimate of total gross profits as a result of the implementation of the new ALM strategy in the third quarter of 2016 described above.
Through March 31, 2016, we reinsured living benefit guarantees issued by our domestic statutory life insurance companies to a captive reinsurance company, Pruco Reinsurance, Ltd. (“Pruco Re”), in order to facilitate the capital markets hedging program for these living benefit guarantees. Effective April 1, 2016, these living benefit guarantees and certain retirement products were recaptured and then reinsured to certain of our domestic statutory life insurance companies. The ALM strategy described above is executed within these domestic insurance companies. After the foregoing transactions, Pruco Re no longer had any material active reinsurance with affiliates. On September 30, 2016, Pruco Re was merged with and into Prudential Annuities Life Assurance Corporation (“PALAC”).
Capital Hedge Program
During 2017, we commenced a capital hedge program within the Individual Annuities segment to further hedge equity market impacts. The program is intended to protect a portion of the overall capital position of the variable annuities business against its exposure to the equity markets. The capital hedge program is conducted using equity derivatives which include equity call and put options, total return swaps and futures contracts. The changes in value of these derivatives are recognized in adjusted operating income over the expected duration of the capital hedge program.
External Reinsurance
As of December 31, 2018, $2.9 billion of Highest Daily Lifetime Income (“HDI”) v.3.0 account values are reinsured to Union Hamilton Reinsurance Ltd., an external counterparty, pursuant to a quota share agreement that covered approximately 50% of new business between April 1, 2015 and December 31, 2016. HDI v.3.0 is the current version of our “highest daily” living benefits guarantee that is available with our Prudential Premier
®
Retirement Variable Annuity. New sales of HDI v.3.0 subsequent to December 31, 2016 are not covered by this external reinsurance agreement.
Product Specific Risks and Risk Mitigants
For certain living benefits guarantees, claims will primarily represent the funding of contractholder lifetime withdrawals after the cumulative withdrawals have first exhausted the contractholder account value. Due to the age of the in-force block, limited claim payments have occurred to date, and they are not expected to increase significantly within the next five years, based upon current assumptions. The timing and amount of future claims will depend on actual returns on contractholder account value and actual contractholder behavior relative to our assumptions. The majority of our current living benefits guarantees provide for guaranteed lifetime contractholder withdrawal payments inclusive of a “highest daily” contract value guarantee. Our Prudential Defined Income
(“PDI”) variable annuity complements our variable annuity products with the highest daily benefit and provides for guaranteed lifetime contractholder withdrawal payments, but restricts contractholder asset allocation to a single bond fund sub-account within the separate accounts.
The majority of our variable annuity contracts with living benefits guarantees, and all new contracts sold with our highest daily living benefits feature, include risk mitigants in the form of an automatic rebalancing feature and/or inclusion in our ALM strategy. We may also utilize external reinsurance as a form of additional risk mitigation. The risks associated with the guaranteed benefits of certain legacy products that were sold prior to our development of the automatic rebalancing feature are also managed through our ALM strategy. Certain legacy GMAB products include the automatic rebalancing feature, but are not included in the ALM strategy. The PDI product and contracts with the GMIB feature have neither risk mitigant. Certain risks associated with PDI are managed through the limitation of contractholder asset allocations to a single bond fund sub-account.
86
For our GMDBs, we provide a benefit payable in the event of death. Our base GMDB is generally equal to a return of cumulative deposits adjusted for any partial withdrawals. Certain products include an optional enhanced GMDB based on the greater of a minimum return on the contract value or an enhanced value. We have retained the risk that the total amount of death benefit payable may be greater than the contractholder account value; however, a substantial portion of the account values associated with GMDBs are subject to an automatic rebalancing feature because the contractholder also selected a living benefit guarantee which includes an automatic rebalancing feature. All of the variable annuity account values with living benefit guarantees also contain GMDBs. The living and death benefit features for these contracts cover the same insured life and, consequently, we have insured both the longevity and mortality risk on these contracts.
The following table sets forth the risk management profile of our living benefit guarantees and GMDB features as of the periods indicated.
|
|
December 31,
|
||||||||||||||||||||
|
|
2018
|
2017
|
2016
|
||||||||||||||||||
|
Account Value
|
% of Total
|
Account Value
|
% of Total
|
Account Value
|
% of Total
|
||||||||||||||||
|
|
(in millions)
|
||||||||||||||||||||
|
Living benefit/GMDB features(1):
|
|||||||||||||||||||||
|
Both ALM strategy and automatic rebalancing(2)
|
$
|
101,496
|
|
69
|
%
|
$
|
114,686
|
|
69
|
%
|
$
|
106,585
|
|
69
|
%
|
||||||
|
ALM strategy only
|
7,520
|
|
5
|
%
|
9,317
|
|
6
|
%
|
9,409
|
|
6
|
%
|
|||||||||
|
Automatic rebalancing only
|
804
|
|
1
|
%
|
1,003
|
|
1
|
%
|
1,168
|
|
1
|
%
|
|||||||||
|
External reinsurance(3)
|
2,873
|
|
2
|
%
|
3,227
|
|
2
|
%
|
2,932
|
|
2
|
%
|
|||||||||
|
PDI
|
11,237
|
|
7
|
%
|
9,996
|
|
5
|
%
|
7,926
|
|
5
|
%
|
|||||||||
|
Other Products
|
2,306
|
|
2
|
%
|
2,791
|
|
2
|
%
|
2,730
|
|
2
|
%
|
|||||||||
|
Total living benefit/GMDB features
|
$
|
126,236
|
|
$
|
141,020
|
|
$
|
130,750
|
|
||||||||||||
|
GMDB features and other(4)
|
21,103
|
|
14
|
%
|
24,133
|
|
15
|
%
|
22,545
|
|
15
|
%
|
|||||||||
|
Total variable annuity account value
|
$
|
147,339
|
|
$
|
165,153
|
|
$
|
153,295
|
|
||||||||||||
_________
|
(1)
|
All contracts with living benefit guarantees also contain GMDB features, covering the same insured contract.
|
|
(2)
|
Contracts with living benefits that are included in our ALM strategy and that have an automatic rebalancing feature.
|
|
(3)
|
Represents contracts subject to reinsurance transaction with external counterparty covering certain new HDI v.3.0 business for the period April 1, 2015 through December 31, 2016. These contracts with living benefits also have an automatic rebalancing feature.
|
|
(4)
|
Includes contracts that have a GMDB feature and do not have an automatic rebalancing feature.
|
Individual Life
Operating Results
The following table sets forth the Individual Life segment’s operating results for the periods indicated.
|
|
Year ended December 31,
|
|||||||||||
|
|
2018
|
2017
|
2016
|
|||||||||
|
|
(in millions)
|
|||||||||||
|
Operating results:
|
||||||||||||
|
Revenues
|
$
|
5,831
|
|
$
|
4,974
|
|
$
|
5,355
|
|
|||
|
Benefits and expenses
|
5,608
|
|
5,165
|
|
5,276
|
|
||||||
|
Adjusted operating income
|
223
|
|
(191
|
)
|
79
|
|
||||||
|
Realized investment gains (losses), net, and related adjustments
|
(318
|
)
|
96
|
|
58
|
|
||||||
|
Related charges
|
79
|
|
101
|
|
(223
|
)
|
||||||
|
Income (loss) before income taxes and equity in earnings of operating joint ventures
|
$
|
(16
|
)
|
$
|
6
|
|
$
|
(86
|
)
|
|||
Adjusted Operating Income
87
2018
to
2017
Annual Comparison.
Adjusted operating income
increased
$414 million
, primarily reflecting favorable comparative net impacts from our annual reviews and update of assumptions and other refinements. Results for 2018 included a
$65 million
net
charge
from this annual review, mainly driven by unfavorable impacts related to lapse and mortality rate assumptions. Results for 2017 included a
$653 million
net
charge
from this annual review mainly driven by a charge related to modeling refinements as a result of a valuation systems conversion, including a change in the method of accounting for reinsurance associated with certain long-duration insurance contracts, and changes in lapse rate assumptions. Excluding these impacts, adjusted operating income
decreased
$174 million
, primarily reflecting lower underwriting results, driven by the unfavorable ongoing impact of our annual reviews and updates of assumptions and other refinements, partially offset by less unfavorable mortality experience, net of reinsurance. The decrease was also driven by a lower contribution from net investment spread results primarily due to lower income on non-coupon investments.
2017
to
2016
Annual Comparison.
Adjusted operating income decreased $270 million, primarily reflecting unfavorable comparative net impacts from our annual reviews and update of assumptions and other refinements. Results for 2017 included a $653 million net charge from this annual review, as discussed above. Results for 2016 included a $420 million net charge from this annual review, mainly driven by a charge to accrue a liability to offset the present value of losses expected to be recognized in later years and a charge related to an out of period adjustment, partially offset by a net benefit from the impacts of other refinements. Excluding these impacts, adjusted operating income decreased $37 million, primarily reflecting the unfavorable ongoing impact of our second quarter 2017 annual review and update of assumptions and other refinements, higher general and administrative expenses, including expenses related to business growth initiatives, and an unfavorable impact from mortality experience, net of reinsurance. These decreases were partially offset by a higher contribution from net investment spread results.
Revenues, Benefits and Expenses
2018
to
2017
Annual Comparison.
Revenues
increased
$857 million
. Excluding the impact of our annual reviews and update of assumptions and other refinements, as discussed above, revenues
increased
$80 million
. This increase was primarily driven by an increase in net investment income from higher average invested assets, resulting from continued business growth, and higher investment income from unaffiliated reserve financing activity, which resulted in a corresponding increase in interest expense, as discussed below, partially offset by lower income on non-coupon investments. Also contributing to this increase was higher premiums driven by continued business growth. These increases were partially offset by lower revenues reflecting higher ceded net reinsurance premiums, as a result of the unfavorable ongoing impact of the second quarter 2017 change in the method of accounting for reinsurance, which was partially offset by related lower benefits and expenses, as discussed below.
Benefits and expenses
increased
$443 million
. Excluding the impact of our annual reviews and update of assumptions and other refinements, as discussed above, benefits and expenses
increased
$254 million
. This increase was primarily related to higher general and administrative expenses, net of capitalization, reflecting increased VOBA amortization and higher operating expenses, higher reserve financing costs, as discussed above, higher policyholders’ benefits and interest credited to account balances attributable to continued business growth, and increased DAC amortization. These increases were partially offset by the favorable ongoing impact of the second quarter 2017 change in the method of accounting for reinsurance, which was more than offset by the related unfavorable impact in revenues, as discussed above.
2017
to
2016
Annual Comparison.
Revenues decreased $381 million. Excluding the impact of our annual reviews and update of assumptions and other refinements, as discussed above, revenues increased $152 million. This increase was primarily driven by an increase in net investment income from higher average invested assets, resulting from continued business growth, higher investment income from unaffiliated reserve financing activity, which resulted in a corresponding increase in interest expense, as discussed below, and higher income on non-coupon investments, partially offset by lower prepayment fee income. Also contributing to this increase was higher premiums driven by continued business growth. These increases were partially offset by lower revenues reflecting higher ceded net reinsurance premiums, as a result of the unfavorable ongoing impact of the second quarter 2017 change in the method of accounting for reinsurance, which was partially offset by related lower benefits and expenses, as discussed below.
Benefits and expenses decreased $111 million. Excluding the impact of our annual reviews and update of assumptions and other refinements, as discussed above, benefits and expenses increased $189 million. This increase was primarily related to higher general and administrative expenses, net of capitalization, reflecting higher operating expenses including business growth initiatives, higher reserve financing costs, as discussed above, and higher policyholders’ benefits and interest credited to account balances attributable to continued business growth and an unfavorable impact from mortality experience, partially offset by the favorable ongoing impact of the second quarter 2017 change in the method of accounting for reinsurance, which was more than offset by the related unfavorable impact in revenues, as discussed above.
Sales Results
88
The following table sets forth individual life insurance annualized new business premiums, as defined under “—Results of Operations—Segment Measures” above, by distribution channel and product, for the periods indicated.
|
|
2018
|
2017
|
2016
|
|||||||||||||||||||||||||||||||||
|
|
Prudential
Advisors
|
Third
Party
|
Total
|
Prudential
Advisors
|
Third
Party
|
Total
|
Prudential
Advisors
|
Third
Party
|
Total
|
|||||||||||||||||||||||||||
|
|
(in millions)
|
|||||||||||||||||||||||||||||||||||
|
Term Life
|
$
|
28
|
|
$
|
185
|
|
$
|
213
|
|
$
|
30
|
|
$
|
183
|
|
$
|
213
|
|
$
|
32
|
|
$
|
168
|
|
$
|
200
|
|
|||||||||
|
Guaranteed Universal Life(1)
|
8
|
|
89
|
|
97
|
|
16
|
|
140
|
|
156
|
|
24
|
|
219
|
|
243
|
|
||||||||||||||||||
|
Other Universal Life(1)
|
45
|
|
105
|
|
150
|
|
37
|
|
88
|
|
125
|
|
34
|
|
61
|
|
95
|
|
||||||||||||||||||
|
Variable Life
|
54
|
|
109
|
|
163
|
|
35
|
|
95
|
|
130
|
|
26
|
|
66
|
|
92
|
|
||||||||||||||||||
|
Total
|
$
|
135
|
|
$
|
488
|
|
$
|
623
|
|
|
$
|
118
|
|
$
|
506
|
|
$
|
624
|
|
$
|
116
|
|
$
|
514
|
|
$
|
630
|
|
||||||||
__________
|
(1)
|
Single pay life premiums and excess (unscheduled) premiums are included in annualized new business premiums based on a 10% credit and represented approximately 7%, 15% and 13% of Guaranteed Universal Life and 0%, 1% and 3% of Other Universal Life annualized new business premiums for the years ended
December 31, 2018
,
2017
and
2016
, respectively.
|
2018
to
2017
Annual Comparison.
Total annualized new business premiums were in line with the prior year as lower guaranteed universal life sales were offset by higher sales of variable life and other universal life products, as a result of certain distribution, product design and pricing actions implemented to enhance product mix diversification and in response to the adoption in 2017 of the principle-based reserving method for new guaranteed universal life products.
2017
to
2016
Annual Comparison.
Total annualized new business premiums decreased $6 million, primarily driven by lower guaranteed universal life sales, partially offset by higher sales across other products, as a result of certain distribution and product actions implemented to enhance product mix diversification.
International Insurance Division
International Insurance
Business Update
We regularly review our existing international businesses and may seek to deploy capital in support of our strategy or to exit an operation if it is determined that it no longer aligns with our broader international strategy.
|
•
|
In June 2018, we entered into a definitive agreement to sell our Pramerica of Italy subsidiary, subject to regulatory approvals and customary closing conditions. In February 2019, the agreement was terminated and we continue to explore strategic alternatives. The results of this business and the impact of an anticipated sale are reflected in our Corporate and Other operations (see “—Results of Operations by Segment—Divested and Run-off Businesses—Divested and Run-off Businesses Included in Corporate and Other” for additional information).
|
|
•
|
In January 2018, we entered into a definitive agreement to sell our Pramerica of Poland subsidiary. This transaction closed in October 2018 and resulted in a gain that was reflected in our Corporate and Other operations (see “—Results of Operations by Segment—Divested and Run-off Businesses—Divested and Run-off Businesses Included in Corporate and Other” for additional information).
|
Operating Results
The results of our International Insurance operations are translated on the basis of weighted average monthly exchange rates, inclusive of the effects of the intercompany arrangement discussed in “—Results of Operations—Impact of Foreign Currency Exchange Rates” above. To provide a better understanding of operating performance within the International Insurance segment, where indicated below, we have analyzed our results of operations excluding the effect of the year over year change in foreign currency exchange rates. Our results of operations, excluding the effect of foreign currency fluctuations, were derived by translating foreign currencies to U.S. dollars at uniform exchange rates for all periods presented, including for constant dollar information discussed below. The exchange rates used were Japanese yen at a rate of 111 yen per U.S. dollar and Korean won at a rate of 1150 won per U.S. dollar, both of which were determined in connection with the foreign currency income hedging program discussed in “—Results of Operations—Impact of Foreign Currency Exchange Rates” above. In addition, for constant dollar information discussed below, activity denominated in U.S. dollars is generally reported based on the amounts as transacted in U.S. dollars. Annualized new business premiums presented on a constant exchange rate basis in the “Sales Results” section below reflect translation based on these same uniform exchange rates.
89
The following table sets forth the International Insurance segment’s operating results for the periods indicated.
|
|
Year ended December 31,
|
|||||||||||
|
|
2018
|
2017
|
2016
|
|||||||||
|
|
(in millions)
|
|||||||||||
|
Operating results:
|
||||||||||||
|
Revenues:
|
||||||||||||
|
Life Planner operations
|
$
|
11,176
|
|
$
|
10,644
|
|
$
|
9,986
|
|
|||
|
Gibraltar Life and Other operations
|
11,058
|
|
10,916
|
|
11,023
|
|
||||||
|
Total revenues
|
22,234
|
|
21,560
|
|
21,009
|
|
||||||
|
Benefits and expenses:
|
||||||||||||
|
Life Planner operations
|
9,586
|
|
9,151
|
|
8,447
|
|
||||||
|
Gibraltar Life and Other operations
|
9,382
|
|
9,211
|
|
9,445
|
|
||||||
|
Total benefits and expenses
|
18,968
|
|
18,362
|
|
17,892
|
|
||||||
|
Adjusted operating income:
|
||||||||||||
|
Life Planner operations
|
1,590
|
|
1,493
|
|
1,539
|
|
||||||
|
Gibraltar Life and Other operations
|
1,676
|
|
1,705
|
|
1,578
|
|
||||||
|
Total adjusted operating income
|
3,266
|
|
3,198
|
|
3,117
|
|
||||||
|
Realized investment gains (losses), net, and related adjustments
|
172
|
|
985
|
|
992
|
|
||||||
|
Related charges
|
10
|
|
(18
|
)
|
(32
|
)
|
||||||
|
Investment gains (losses) on assets supporting experience-rated contractholder liabilities, net
|
(275
|
)
|
218
|
|
4
|
|
||||||
|
Change in experience-rated contractholder liabilities due to asset value changes
|
275
|
|
(218
|
)
|
(4
|
)
|
||||||
|
Equity in earnings of operating joint ventures and earnings attributable to noncontrolling interests
|
(69
|
)
|
(43
|
)
|
(47
|
)
|
||||||
|
Income (loss) before income taxes and equity in earnings of operating joint ventures
|
$
|
3,379
|
|
$
|
4,122
|
|
$
|
4,030
|
|
|||
Adjusted Operating Income
2018 to 2017 Annual Comparison.
Adjusted operating income from our Life Planner operations
increased
$97 million
including a net
favorable
impact of
$4 million
from currency fluctuations, inclusive of the currency hedging program discussed above. Both periods also include the impact of our annual reviews and update of assumptions and other refinements, which resulted in a $49 million net charge in 2018 compared to a $67 million net charge in 2017. The net charge in both 2018 and 2017 was primarily driven by the impact from unfavorable economic assumption updates driven by a lower long-term interest rate assumption in Japan.
Excluding the effect of these items, adjusted operating income from our Life Planner operations
increased
$75 million
, primarily reflecting the growth of business in force in our Japan, Korea and Brazil operations, and lower expenses, including lower legal costs. These increases were partially offset by an unfavorable impact from mortality experience and a lower contribution from net investment results, driven by the impact of lower reinvestment rates, lower income on non-coupon investments and lower prepayment fee income, partially offset by higher average invested assets resulting from continued business growth.
Adjusted operating income from our Gibraltar Life and Other operations
decreased
$29 million
including a net
favorable
impact of
$4 million
from currency fluctuations, inclusive of the currency hedging program discussed above. Both periods also include the impact of our annual reviews and update of assumptions and other refinements, which resulted in a $32 million net charge in 2018 compared to a $21 million net benefit in 2017.
Excluding the effect of these items, adjusted operating income from our Gibraltar Life and Other operations
increased
$20 million
, primarily reflecting the growth of business in force, driven by sales of U.S. dollar-denominated products, and a favorable impact from mortality experience. These increases were partially offset by a lower contribution from net investment results driven by the impact of lower income on non-coupon investments, lower prepayment fee income and lower reinvestment rates, partially offset by higher average invested assets resulting from continued business growth. These net increases were also partially offset by higher expenses, including expenses related to business growth initiatives.
90
2017 to 2016 Annual Comparison.
Adjusted operating income from our Life Planner operations
decreased
$46 million
including a net
unfavorable
impact of
$39 million
from currency fluctuations, inclusive of the currency hedging program discussed above. Both periods also include the impact of our annual reviews and update of assumptions and other refinements, which resulted in a $67 million net charge in 2017, including impacts from unfavorable economic assumption updates driven by a lower long-term interest rate assumption in Japan, compared to a $38 million net charge in 2016.
Excluding the effect of these items, adjusted operating income from our Life Planner operations
increased
$22 million
, primarily reflecting the growth of business in force in our Japan and Brazil operations, improved policyholder experience, and a higher contribution from net investment results, primarily from higher income on non-coupon investments and higher net prepayment fee income, partially offset by lower reinvestment rates. These favorable impacts were partially offset by higher expenses, including legal costs and expenses supporting business growth.
Adjusted operating income from our Gibraltar Life and Other operations
increased
$127 million
including a net
favorable
impact of
$2 million
from currency fluctuations, inclusive of the currency hedging program discussed above. Both periods also include the impact of our annual reviews and update of assumptions and other refinements, which resulted in a $21 million net benefit in 2017 compared to a $34 million net charge in 2016.
Excluding the effect of these items, adjusted operating income from our Gibraltar Life and Other operations
increased
$70 million
, primarily reflecting the growth of business in force, including higher earnings from our indirect investment in Administradora de Fondos de Pensiones Habitat S.A. which reflected twelve months of income in 2017 compared to ten months of income in 2016, improved policyholder experience and more favorable comparative mortality experience. These favorable impacts were partially offset by the absence of a gain on the sale of a home office property in Japan in 2016.
Revenues, Benefits and Expenses
2018 to 2017 Annual Comparison.
Revenues from our Life Planner operations
increased
$532 million
including a net
favorable
impact of
$6 million
from currency fluctuations and a comparatively favorable net impact of $3 million from our annual reviews and update of assumptions and other refinements. Excluding these items, revenues increased $523 million, primarily driven by higher premiums and policy charges and fee income related to the growth of business in force.
Benefits and expenses from our Life Planner operations
increased
$435 million
including a net
unfavorable
impact of
$2 million
from currency fluctuations and a comparatively favorable net impact of $15 million from our annual reviews and update of assumptions and other refinements. Excluding these items, benefits and expenses increased $448 million. This increase primarily reflects higher policyholders’ benefits, including changes in reserves, driven by business growth, and an unfavorable impact from mortality experience, partially offset by lower general and administrative expenses, net of capitalization, including lower legal costs.
Revenues from our Gibraltar Life and Other operations
increased
$142 million
, including a net
favorable
impact of
$83 million
from currency fluctuations and a comparatively unfavorable net impact of $13 million from our annual reviews and update of assumptions and other refinements. Excluding these items, revenues increased $72 million primarily driven by the growth of business in force.
Benefits and expenses from our Gibraltar Life and Other operations
increased
$171 million
including a net
unfavorable
impact of
$79 million
from currency fluctuations and a comparatively unfavorable net impact of $40 million from our annual reviews and update of assumptions and other refinements. Excluding these items, benefits and expenses increased $52 million, primarily driven by higher general and administrative expenses, net of capitalization, including expenses related to business growth initiatives, partially offset by a decrease in policyholders’ benefits, including changes in reserves, related to a favorable impact from mortality experience.
2017 to 2016 Annual Comparison.
Revenues from our Life Planner operations
increased
$658 million
including a net
unfavorable
impact of
$60 million
from currency fluctuations and a comparatively favorable net impact of $15 million from our annual reviews and update of assumptions and other refinements. Excluding these items, revenues increased $703 million. This increase was primarily driven by higher premiums and policy charges and fee income related to growth of business in force and higher net investment income primarily reflecting higher income on non-coupon investments and higher net prepayment fee income, partially offset by lower reinvestment rates.
91
Benefits and expenses from our Life Planner operations
increased
$704 million
including a net
favorable
impact of
$21 million
from currency fluctuations and a comparatively unfavorable net impact of $44 million from our annual reviews and update of assumptions and other refinements. Excluding these items, benefits and expenses increased $681 million. This increase primarily reflects higher policyholder benefits, including changes in reserves, driven by business growth, and higher general and administrative expenses, net of capitalization, driven by higher operating expenses, including legal costs and expenses supporting business growth.
Revenues from our Gibraltar Life and Other operations
decreased
$107 million
, including a net
unfavorable
impact of
$153 million
from currency fluctuations and a comparatively favorable net impact of $13 million from our annual reviews and update of assumptions and other refinements. Excluding these items, revenues increased $33 million. This increase was primarily driven by higher premiums and policy charges and fee income related to the growth of business in force and higher net investment income.
Benefits and expenses from our Gibraltar Life and Other operations
decreased
$234 million
including a net
favorable
impact of
$155 million
from currency fluctuations and a comparatively favorable net impact of $42 million from our annual reviews and update of assumptions and other refinements. Excluding these items, benefits and expenses decreased $37 million, driven by a decrease in policyholder benefits, including changes in reserves, related to improved policyholder experience and more favorable comparative mortality experience.
Sales Results
The following table sets forth annualized new business premiums, as defined under “—Results of Operations—Segment Measures” above, on an actual and constant exchange rate basis for the periods indicated.
|
|
Year ended December 31,
|
|||||||||||
|
|
2018
|
2017
|
2016
|
|||||||||
|
|
(in millions)
|
|||||||||||
|
Annualized new business premiums:
|
||||||||||||
|
On an actual exchange rate basis:
|
||||||||||||
|
Life Planner operations
|
$
|
1,257
|
|
$
|
1,391
|
|
$
|
1,276
|
|
|||
|
Gibraltar Life(1)
|
1,483
|
|
1,595
|
|
1,726
|
|
||||||
|
Total(1)
|
$
|
2,740
|
|
$
|
2,986
|
|
$
|
3,002
|
|
|||
|
On a constant exchange rate basis:
|
||||||||||||
|
Life Planner operations
|
1,250
|
|
1,373
|
|
1,262
|
|
||||||
|
Gibraltar Life(1)
|
1,481
|
|
1,599
|
|
1,710
|
|
||||||
|
Total(1)
|
$
|
2,731
|
|
$
|
2,972
|
|
$
|
2,972
|
|
|||
___
_______
|
(1)
|
Amounts are presented on a consistent basis reflecting the elimination of the one-month reporting lag for Gibraltar Life and Other operations.
|
The amount of annualized new business premiums and the sales mix in terms of types and currency denomination of products for any given period can be significantly impacted by several factors, including but not limited to: the addition of new products, discontinuation of existing products, changes in credited interest rates for certain products and other product modifications, changes in premium rates, changes in interest rates or fluctuations in currency markets, changes in tax laws, changes in life insurance regulations or changes in the competitive environment. Sales volume may increase or decrease prior to certain of these changes becoming effective, and then fluctuate in the other direction following such changes.
Our diverse product portfolio in Japan, in terms of currency mix and premium payment structure, allows us to adapt to changing market and competitive dynamics, including the extremely low interest rate environment. We regularly examine our product offerings and their related profitability and, as a result, we have repriced or discontinued sales of certain products that do not meet our profit expectations. The impact of these actions, coupled with the introduction of certain new products, has generally resulted in an increase in sales of products denominated in U.S. dollars relative to products denominated in other currencies.
2018 to 2017 Annual Comparison.
The table below presents annualized new business premiums on a constant exchange rate basis, by product category and distribution channel, for the periods indicated.
92
|
|
Year Ended December 31, 2018
|
Year Ended December 31, 2017
|
||||||||||||||||||||||||||||||||||||||
|
|
Life
|
Accident
&
Health
|
Retirement
(1)
|
Annuity
|
Total
|
Life
|
Accident
&
Health
|
Retirement
(1)
|
Annuity
|
Total
|
||||||||||||||||||||||||||||||
|
|
(in millions)
|
|||||||||||||||||||||||||||||||||||||||
|
Life Planner
|
$
|
699
|
|
$
|
118
|
|
$
|
344
|
|
$
|
89
|
|
$
|
1,250
|
|
$
|
812
|
|
$
|
122
|
|
$
|
353
|
|
$
|
86
|
|
$
|
1,373
|
|
||||||||||
|
Gibraltar Life(2):
|
||||||||||||||||||||||||||||||||||||||||
|
Life Consultants
|
308
|
|
44
|
|
101
|
|
329
|
|
782
|
|
369
|
|
50
|
|
113
|
|
211
|
|
743
|
|
||||||||||||||||||||
|
Banks
|
412
|
|
1
|
|
29
|
|
38
|
|
480
|
|
525
|
|
1
|
|
31
|
|
58
|
|
615
|
|
||||||||||||||||||||
|
Independent Agency
|
113
|
|
10
|
|
62
|
|
34
|
|
219
|
|
134
|
|
19
|
|
66
|
|
22
|
|
241
|
|
||||||||||||||||||||
|
Subtotal(2)
|
833
|
|
55
|
|
192
|
|
401
|
|
1,481
|
|
1,028
|
|
70
|
|
210
|
|
291
|
|
1,599
|
|
||||||||||||||||||||
|
Total
|
$
|
1,532
|
|
$
|
173
|
|
$
|
536
|
|
$
|
490
|
|
$
|
2,731
|
|
$
|
1,840
|
|
$
|
192
|
|
$
|
563
|
|
$
|
377
|
|
$
|
2,972
|
|
||||||||||
__________
|
(1)
|
Includes retirement income, endowment and savings variable universal life.
|
|
(2)
|
Amounts are presented on a consistent basis reflecting the elimination of the one-month reporting lag for Gibraltar Life and Other operations.
|
Annualized new business premiums, on a constant exchange rate basis, from our Life Planner operations decreased $123 million, primarily reflecting sales in our Japan operations in the prior year period in advance of premium rate increases on yen-based products in the second quarter of 2017 and lower sales of these yen-based products post repricing. The decrease was partially offset by higher sales of U.S. dollar-denominated products in our Japan operations.
Annualized new business premiums, on a constant exchange rate basis, from our Gibraltar Life operations decreased $118 million. Life Consultants sales increased $39 million, primarily reflecting higher sales of U.S. dollar-denominated annuity products and U.S. dollar-denominated life products. The increase was partially offset by lower sales of yen-denominated life products after the second quarter of 2017 repricing discussed above. Bank channel sales decreased $135 million, primarily from lower sales of U.S. dollar-denominated life products due to increased competition in recurring pay life products and the discontinuation of a single pay life product in the fourth quarter of 2017. Independent Agency sales decreased $22 million, primarily reflecting lower sales of yen-denominated life products after the second quarter of 2017 repricing discussed above and increased competition, partially offset by higher sales of U.S. dollar-denominated life and annuity products.
2017 to 2016 Annual Comparison.
The table below presents annualized new business premiums on a constant exchange rate basis, by product and distribution channel, for the periods indicated.
|
|
Year Ended December 31, 2017
|
Year Ended December 31, 2016
|
||||||||||||||||||||||||||||||||||||||
|
|
Life
|
Accident
&
Health
|
Retirement
(1)
|
Annuity
|
Total
|
Life
|
Accident
&
Health
|
Retirement
(1)
|
Annuity
|
Total
|
||||||||||||||||||||||||||||||
|
|
(in millions)
|
|||||||||||||||||||||||||||||||||||||||
|
Life Planner
|
$
|
812
|
|
$
|
122
|
|
$
|
353
|
|
$
|
86
|
|
1,373
|
|
$
|
741
|
|
$
|
115
|
|
$
|
331
|
|
$
|
75
|
|
1,262
|
|
||||||||||||
|
Gibraltar Life(2):
|
||||||||||||||||||||||||||||||||||||||||
|
Life Consultants
|
369
|
|
50
|
|
113
|
|
211
|
|
743
|
|
354
|
|
53
|
|
118
|
|
211
|
|
736
|
|
||||||||||||||||||||
|
Banks
|
525
|
|
1
|
|
31
|
|
58
|
|
615
|
|
518
|
|
1
|
|
67
|
|
130
|
|
716
|
|
||||||||||||||||||||
|
Independent Agency
|
134
|
|
19
|
|
66
|
|
22
|
|
241
|
|
128
|
|
21
|
|
72
|
|
37
|
|
258
|
|
||||||||||||||||||||
|
Subtotal(2)
|
1,028
|
|
70
|
|
210
|
|
291
|
|
1,599
|
|
1,000
|
|
75
|
|
257
|
|
378
|
|
1,710
|
|
||||||||||||||||||||
|
Total
|
$
|
1,840
|
|
$
|
192
|
|
$
|
563
|
|
$
|
377
|
|
$
|
2,972
|
|
$
|
1,741
|
|
$
|
190
|
|
$
|
588
|
|
$
|
453
|
|
$
|
2,972
|
|
||||||||||
__________
|
(1)
|
Includes retirement income, endowment and savings variable universal life.
|
|
(2)
|
Amounts are presented on a consistent basis reflecting the elimination of the one-month reporting lag for Gibraltar Life and Other operations.
|
Annualized new business premiums, on a constant exchange rate basis, from our Life Planner operations increased $111 million. Growth in Life Planner headcount in our Japan operation resulted in an increase in U.S. dollar-denominated whole life and retirement products and yen-denominated term life and retirement products. The increase also reflected higher sales in our Brazil operations across various product lines as Life Planner count continued to grow.
93
Annualized new business premiums, on a constant exchange rate basis, from our Gibraltar Life operations decreased $111 million. Life Consultant sales increased $7 million primarily from higher sales of U.S. dollar-denominated whole life products resulting from the introduction of a new recurring pay life product in the second quarter of 2017. This increase was partially offset by lower sales of yen-denominated whole life and term life products. Bank channel sales decreased $101 million primarily from lower sales of yen-denominated term life and whole life products following the premium rate increases on yen-based products in April of 2017, the suspension of sales of yen-denominated annuity products in April 2016 in response to the low interest rate environment and lower sales of U.S. dollar- and Australian dollar-denominated annuity products due to increased competition and product actions. This decrease was partially offset by higher sales of U.S. dollar-denominated whole life products. Independent Agency sales decreased $17 million primarily reflecting lower sales of yen-denominated whole life and term life products after the April 2017 repricing and lower sales of Australian dollar-denominated annuity products. The decrease was partially offset by higher sales of U.S. dollar-denominated whole life products.
Sales Force
The following table sets forth the number of Life Planners and Life Consultants for the periods indicated.
|
|
As of December 31,
|
||||||||
|
|
2018
|
2017
|
2016
|
||||||
|
Life Planners:
|
|||||||||
|
Japan
|
4,183
|
|
3,941
|
|
3,824
|
|
|||
|
All other countries
|
3,786
|
|
3,890
|
|
3,856
|
|
|||
|
Gibraltar Life Consultants
|
7,964
|
|
8,326
|
|
8,884
|
|
|||
|
Total
|
15,933
|
|
16,157
|
|
16,564
|
|
|||
2018 to 2017 Comparison.
The number of Life Planners increased by 138, driven by an increase of 242 in Japan as a result of recruiting efforts and fewer terminations. Life Planners decreased by 104 in other operations, primarily as a result of the absence of Life Planners in Italy and Poland (as discussed above under “—Business Update”), partially offset by an increase in Brazil as a result of improved recruiting efforts. The number of Gibraltar Life Consultants decreased by 362, primarily reflecting more selective recruiting efforts and retention standards.
2017 to 2016 Comparison.
The number of Life Planners increased by 151, driven by an increase of 117 in Japan as a result of improved recruiting efforts and fewer terminations. Life Planners increased by 34 in other operations, primarily in Brazil as a result of recruiting efforts, partially offset by a decrease in Korea and Taiwan as a result of more selective recruiting efforts and retention standards. The number of Gibraltar Life Consultants decreased by 558, primarily reflecting more selective recruiting efforts and retention standards.
Corporate and Other
Corporate and Other includes corporate operations, after allocations to our business segments, and Divested and Run-off Businesses other than those that qualify for “discontinued operations” accounting treatment under U.S. GAAP.
|
|
Year ended December 31,
|
|||||||||||
|
|
2018
|
2017
|
2016
|
|||||||||
|
|
(in millions)
|
|||||||||||
|
Operating results:
|
||||||||||||
|
Capital debt interest expense
|
$
|
(726
|
)
|
$
|
(705
|
)
|
$
|
(686
|
)
|
|||
|
Investment income, net of operating debt interest expense
|
86
|
|
96
|
|
1
|
|
||||||
|
Pension and employee benefits
|
195
|
|
157
|
|
103
|
|
||||||
|
Other corporate activities(1)
|
(838
|
)
|
(985
|
)
|
(999
|
)
|
||||||
|
Adjusted operating income
|
(1,283
|
)
|
(1,437
|
)
|
(1,581
|
)
|
||||||
|
Realized investment gains (losses), net, and related adjustments
|
216
|
|
(407
|
)
|
(1,797
|
)
|
||||||
|
Related charges
|
7
|
|
(26
|
)
|
(1
|
)
|
||||||
|
Divested and Run-off Businesses
|
(1,535
|
)
|
38
|
|
(84
|
)
|
||||||
|
Equity in earnings of operating joint ventures and earnings attributable to noncontrolling interests
|
4
|
|
(19
|
)
|
(3
|
)
|
||||||
|
Income (loss) before income taxes and equity in earnings of operating joint ventures
|
$
|
(2,591
|
)
|
$
|
(1,851
|
)
|
$
|
(3,466
|
)
|
|||
94
__________
|
(1)
|
Includes consolidating adjustments.
|
2018 to 2017 Annual Comparison.
The loss from Corporate and Other operations, on an adjusted operating income basis,
decreased
$154 million. Net charges from other corporate activities
decreased
$147 million
, primarily reflecting lower costs for employee compensation plans tied to Company stock and equity market performance, partially offset by increased expenses, including expenses related to corporate initiatives. Results for investment income, net of operating debt interest expense, decreased
$10 million
, including lower net investment income driven by transfers of investments in the second quarter of 2018 to support higher capital requirements in the Long-Term Care Run-off business, partially offset by higher income on non-coupon investments and highly liquid assets, and lower operating debt interest expense. Capital debt interest expense
increased
$21 million
, reflecting higher debt balances from debt issuances in the third quarter of 2017 and the first and third quarters of 2018, partially offset by the extinguishment of junior subordinated debt in the second quarter of 2018 and a senior debt maturity in the fourth quarter of 2017.
Results from pension and employee benefits
increased
$38 million
, primarily reflecting higher income from our qualified pension plan, including higher expected earnings on plan assets and lower interest costs on plan obligations driven by a decline in interest rates in 2017.
For purposes of calculating pension income from our qualified pension plan for the year ended
December 31,
2019
, we will increase the discount rate from 3.65% to 4.30% as of
December 31, 2018
. The expected rate of return on plan assets will increase from 6.25% in 2018 to 6.50% in 2019. The assumed rate of increase in compensation will remain unchanged at 4.50%. Giving effect to the foregoing assumptions and other factors, we expect income from our qualified pension plan in
2019
to be approximately $50 million to $55 million lower than
2018
levels. The decrease is driven by lower expected returns on plan assets due to lower than expected plan fixed income asset growth in
2018
as well as higher interest costs on the plan obligation due to the higher discount rate.
For purposes of calculating postretirement benefit expenses for the year ended
December 31,
2019
, we will increase the discount rate from 3.60% to 4.30% as of
December 31, 2018
. The expected rate of return on plan assets will remain unchanged at 7.00%. Giving effect to the foregoing assumptions and other factors, we expect postretirement benefit expenses in
2019
to be approximately $30 million to $35 million higher than
2018
levels. The increase in expenses is driven by lower expected returns on plan assets due to lower than expected asset growth in 2018, as well as higher interest costs on the plan obligation due to the higher discount rate.
In
2019
, pension and other postretirement benefit service costs related to active employees will continue to be allocated to our business segments. For further information regarding our pension and postretirement plans, see Note 17 to the Consolidated Financial Statements.
2017 to 2016 Annual Comparison.
The loss from Corporate and Other operations, on an adjusted operating income basis,
decreased
$144 million. Results for investment income, net of operating debt interest expense, improved $95 million, primarily reflecting lower operating debt interest expense, including efforts in 2016 to reduce leverage through senior debt maturities and early extinguishment of debt, and higher investment income, driven by the absence of a non-coupon investment loss incurred in the prior year and higher income on highly liquid assets. Net charges from other corporate activities
decreased
$14 million, reflecting the absence of costs incurred in the prior year associated with the early extinguishment of certain debt, partially offset by increases in other corporate expenses, including higher costs for employee compensation plans tied to equity market and Company performance, and increased expenses related to corporate initiatives. Capital debt interest expense
increased
$19 million, primarily resulting from a junior subordinated debt issuance in the third quarter of 2017.
Results from pension and employee benefits increased $54 million, primarily reflecting higher income from our qualified pension plan, including higher expected earnings on plan assets and lower interest costs on plan obligations driven by a decline in interest rates in 2016.
Capital Protection Framework
“Realized investment gains (losses), net and related adjustments,” which are excluded from adjusted operating income, included a net gain of $121 and net losses of $154 million and $1,649 million for the years ended December 31, 2018, 2017 and 2016, respectively, primarily related to impacts of interest rate movements, which are considered within our Capital Protection Framework. The favorable changes in 2018 and 2017 results compared to 2016 are primarily attributed to changes in our Individual Annuities risk management strategy implemented in 2016, whereby we terminated the existing intercompany derivative transactions between Corporate and Other operations and the Individual Annuities business segment related to managing interest rate risk and we now manage this risk within the Individual Annuities business segment. The net loss in 2016, while the intercompany
95
derivative transactions between Corporate and Other operations and the Individual Annuities business segment were in place, primarily resulted from our utilization of capital management strategies to manage a portion of our interest rate risk and reflects changes in interest rates with respect to the exposures outstanding in 2016. For more information on our Individual Annuities risk management strategy, see “—Individual Annuities.” For more information on our Capital Protection Framework, see “—Liquidity and Capital Resources—Capital Protection Framework.”
Divested and Run-off Businesses
Divested and Run-off Businesses Included in Corporate and Other
Income from our Divested and Run-off Businesses includes results from several businesses that have been or will be sold or exited, including businesses that have been placed in wind down status that do not qualify for “discontinued operations” accounting treatment under U.S. GAAP. The results of these Divested and Run-off Businesses are reflected in our Corporate and Other operations, but are excluded from adjusted operating income. A summary of the results of the Divested and Run-off Businesses reflected in our Corporate and Other operations is as follows for the periods indicated:
|
|
Year ended December 31,
|
|||||||||||
|
|
2018
|
2017
|
2016
|
|||||||||
|
|
(in millions)
|
|||||||||||
|
Long-Term Care
|
$
|
(1,458
|
)
|
$
|
42
|
|
$
|
(74
|
)
|
|||
|
Other
|
(77
|
)
|
(4
|
)
|
(10
|
)
|
||||||
|
Total Divested and Run-off Businesses income (loss) excluded from adjusted operating income
|
$
|
(1,535
|
)
|
$
|
38
|
|
$
|
(84
|
)
|
|||
Long-Term Care.
Results for the year ended
December 31, 2018
decreased compared to 2017, primarily reflecting unfavorable comparative net impacts from our annual reviews and update of assumptions and other refinements. Results for 2018 include a $1,458 million net charge from these updates including the removal of our assumption of expected future morbidity improvement, reflecting unfavorable morbidity experience relative to prior expectations. Excluding these impacts, results for 2018 decreased compared to 2017, primarily reflecting net realized investment losses in the current period compared to net realized investment gains in the prior year period driven by an unfavorable comparative change in market values of derivatives used for duration management. Also contributing to the decrease was a decline in the market value of investments in equity securities in the current period which, effective January 1, 2018 as a result of ASU 2016-01, are reported in net income as opposed to other comprehensive income. Results for the year ended December 31, 2017 increased compared to 2016 primarily reflecting net realized investment gains in 2017 compared to net realized investment losses in 2016.
Other
. Results for the year ended December 31, 2018 decreased in comparison to the prior year period primarily reflecting losses related to an anticipated sale of our Pramerica of Italy subsidiary and the exit of our PGIM Brazil operations, partially offset by a gain related to the sale of our Pramerica of Poland subsidiary (see “—Results of Operations by Segment—International Insurance Division—International Insurance” and “—Results of Operations by Segment—PGIM Division—PGIM” for additional information).
Closed Block Division
The Closed Block division includes certain in-force traditional domestic participating life insurance and annuity products and assets that are used for the payment of benefits and policyholder dividends on these policies (collectively, the “Closed Block”), as well as certain related assets and liabilities. We no longer offer these traditional domestic participating policies. See Note 14 to the Consolidated Financial Statements for additional details.
96
Each year, the Board of Directors of Prudential Insurance determines the dividends payable on participating policies for the following year based on the experience of the Closed Block, including investment income, net realized and unrealized investment gains (losses), mortality experience and other factors. Although Closed Block experience for dividend action decisions is based upon statutory results, at the time the Closed Block was established, we developed, as required by U.S. GAAP, an actuarial calculation of the timing of the maximum future earnings from the policies included in the Closed Block. If actual cumulative earnings in any given period are greater than the cumulative earnings we expected, we record this excess as a policyholder dividend obligation. We will subsequently pay this excess to Closed Block policyholders as an additional dividend unless it is otherwise offset by future Closed Block performance that is less favorable than we originally expected. The policyholder dividends we charge to expense within the Closed Block division will include any change in our policyholder dividend obligation that we recognize for the excess of actual cumulative earnings in any given period over the cumulative earnings we expected in addition to the actual policyholder dividends declared by the Board of Directors of Prudential Insurance.
As of December 31,
2018
, the excess of actual cumulative earnings over the expected cumulative earnings was $2,252 million, which was recorded as a policyholder dividend obligation. Actual cumulative earnings, as required by U.S. GAAP, reflect the recognition of realized investment gains and losses in the current period, as well as changes in assets and related liabilities that support the Closed Block policies. Additionally, the accumulation of net unrealized investment gains that have arisen subsequent to the establishment of the Closed Block have been reflected as a policyholder dividend obligation of $899 million at December 31,
2018
, to be paid to Closed Block policyholders unless offset by future experience, with a corresponding amount reported in AOCI.
Operating Results
The following table sets forth the Closed Block division’s results for the periods indicated.
|
|
Year ended December 31,
|
||||||||||
|
|
2018
|
2017
|
2016
|
||||||||
|
|
(in millions)
|
||||||||||
|
U.S. GAAP results:
|
|||||||||||
|
Revenues
|
$
|
4,678
|
|
$
|
5,826
|
|
$
|
5,669
|
|
||
|
Benefits and expenses
|
4,740
|
|
5,781
|
|
5,801
|
|
|||||
|
Income (loss) before income taxes and equity in earnings of operating joint ventures
|
$
|
(62
|
)
|
$
|
45
|
|
$
|
(132
|
)
|
||
Income (loss) Before Income Taxes and Equity in Earnings of Operating Joint Ventures
2018
to
2017
Annual Comparison
. Income (loss) before income taxes and equity in earnings of operating joint ventures
decreased
$
107 million
. Results for
2018
primarily reflected a
$554 million
decrease
in net realized investment gains and related activity, primarily due to a decline in equity investment values and lower gains from sales of fixed maturities, partially offset by favorable changes in the value of derivatives used in risk management activities. Net investment income
decreased
$365 million
, primarily driven by lower income on non-coupon investments, lower reinvestments yields and lower prepayment income. Net insurance activity results increased $144 million, primarily as a result of a decrease in the 2018 dividend scale and runoff of policies in force. As a result of the above and other variances, a $508 million reduction in the policyholder dividend obligation was recorded in
2018
, compared to a $143 million increase in
2017
. If actual cumulative earnings fall below expected cumulative earnings in future periods, earnings volatility in the Closed Block division, which is primarily due to changes in investment results, may not be offset by changes in the cumulative earnings policyholder dividend obligation. For a discussion of Closed Block division realized investment gains (losses), net, see “—General Account Investments—Realized Investment Gains and Losses.”
2017 to 2016 Annual Comparison
. Income (loss) before income taxes and equity in earnings of operating joint ventures increased $177 million. Results for 2017 primarily reflected a $175 million increase in net realized investment gains and related activity, primarily due to higher gains from sales of equity securities and fixed maturities, partially offset by unfavorable changes in the value of derivatives used in risk management activities. Net insurance activity results increased $92 million, primarily as a result of a decrease in the 2018 dividend scale, partially offset by the runoff of policies in force and higher benefit payments. Net investment income increased $75 million, primarily driven by higher income on non-coupon investments and higher prepayment income, partially offset by lower reinvestment rates. As a result of the above and other variances, a $143 million increase in the policyholder dividend obligation was recorded in 2017, compared to $48 million reduction in 2016.
Revenues, Benefits and Expenses
2018
to
2017
Annual Comparison.
Revenues
decreased
$
1,148 million
primarily due to decreases of
$404 million
in net realized investment gains,
$365 million
in net investment income and
$150 million
in other revenue, which are discussed above, as well as a decrease of
$225 million
in premiums due to run-off of policies in force.
97
Benefits and expenses
decreased
$
1,041 million
. Dividends to policyholders decreased
$771 million
reflecting a decrease in the policyholder dividend obligation expense driven by a reduction in the 2018 dividend scale as well as changes in cumulative earnings. Policyholders’ benefits, including changes in reserves, decreased $247 million primarily due to the run-off of policies in force, as discussed above.
2017 to 2016 Annual Comparison.
Revenues increased $157 million, primarily due to increases of $100 million in net realized investment gains, $75 million in other revenue and $75 million in net investment income, as discussed above. Partially offsetting these increases was a decrease in premiums of $94 million, primarily due to run-off of policies in force.
Benefits and expenses decreased $20 million. Policyholders’ benefits, including changes in reserves, decreased $63 million primarily due to the runoff of policies in force, as discussed above. Partially offsetting this decrease was an increase in dividends to policyholders of $66 million, reflecting an increase in the policyholder dividend obligation expense due to changes in cumulative earnings.
Income Taxes
The differences between income taxes expected at the U.S. federal statutory income tax rate of 21% applicable for 2018 and 35% applicable for the periods prior to 2018, and the reported income tax (benefit) expense are provided in the following table:
|
|
Year Ended December 31,
|
|||||||||||
|
|
2018
|
2017
|
2016
|
|||||||||
|
|
(in millions)
|
|||||||||||
|
Expected federal income tax expense (benefit) at federal statutory rate
|
$
|
1,015
|
|
$
|
2,270
|
|
$
|
1,997
|
|
|||
|
Non-taxable investment income
|
(246
|
)
|
(369
|
)
|
(352
|
)
|
||||||
|
Foreign taxes at other than U.S. rate
|
349
|
|
(249
|
)
|
(172
|
)
|
||||||
|
Low-income housing and other tax credits
|
(112
|
)
|
(126
|
)
|
(118
|
)
|
||||||
|
Changes in tax law
|
(321
|
)
|
(2,858
|
)
|
0
|
|
||||||
|
Other
|
137
|
|
(106
|
)
|
(20
|
)
|
||||||
|
Reported income tax expense (benefit)
|
$
|
822
|
|
$
|
(1,438
|
)
|
$
|
1,335
|
|
|||
|
Effective tax rate
|
17.0
|
%
|
(22.2
|
)%
|
23.4
|
%
|
||||||
Effective Tax Rate
The effective tax rate is the ratio of “Total income tax expense (benefit)” divided by “Income before income taxes and equity in earnings of operating joint ventures.” Our effective tax rate for fiscal years 2018, 2017 and 2016 was 17.0%, (22.2)%, and 23.4%, respectively. For a detailed description of the nature of each significant reconciling item, see Note 15 to the Consolidated Financial Statements. The decrease in the effective tax rate from 23.4% in 2016 to (22.2)% in 2017, and the increase in the effective tax rate from (22.2)% in 2017 to 17.0% in 2018 was primarily driven by the impacts of the Tax Act of 2017.
Unrecognized Tax Benefits
The Company’s liability for income taxes includes the liability for unrecognized tax benefits and interest that relate to tax years still subject to review by the Internal Revenue Service or other taxing authorities. The completion of review or the expiration of the Federal statute of limitations for a given audit period could result in an adjustment to the liability for income taxes. The total unrecognized benefit as of December 31, 2018, 2017 and 2016 was $20 million, $45 million and $26 million, respectively. We do not anticipate any significant changes within the next twelve months to our total unrecognized tax benefits related to tax years for which the statute of limitations has not expired.
Income Tax Expense vs. Income Tax Paid in Cash
Income tax expense recorded under U.S. GAAP routinely differs from the income taxes paid in cash in any given year. Income tax expense recorded under U.S. GAAP is based on income reported in our Consolidated Statements of Operations for the current period and it includes both current and deferred taxes. Income taxes paid during the year include tax installments made for the current year as well as tax payments and refunds related to prior periods.
98
For additional information on income tax related items, see “Business—Regulation” and Note 15 to the Consolidated Financial Statements.
Experience-Rated Contractholder Liabilities,
Assets Supporting Experience-Rated Contractholder Liabilities and Other Related Investments
Certain products included in the Retirement and International Insurance segments are experience-rated in that investment results associated with these products are expected to ultimately accrue to contractholders. The majority of investments supporting these experience-rated products are carried at fair value. These investments are reflected on the Consolidated Statements of Financial Position as “Assets supporting experience-rated contractholder liabilities, at fair value.” Realized and unrealized gains (losses) for these investments are reported in “Other income (loss).” Interest and dividend income for these investments is reported in “Net investment income.” To a lesser extent, these experience-rated products are also supported by derivatives and commercial mortgage and other loans. The derivatives that support these experience-rated products are reflected on the Consolidated Statements of Financial Position as “Other invested assets” and are carried at fair value, and the realized and unrealized gains (losses) are reported in “Realized investment gains (losses), net.” The commercial mortgage and other loans that support these experience-rated products are carried at unpaid principal, net of unamortized discounts and an allowance for losses, and are reflected on the Consolidated Statements of Financial Position as “Commercial mortgage and other loans.” Gains (losses) on sales and changes in the valuation allowance for commercial mortgage and other loans are reported in “Realized investment gains (losses), net.”
Our Retirement segment has two types of experience-rated products that are supported by assets supporting experience-rated contractholder liabilities and other related investments. Fully participating products are those for which the entire return on underlying investments is passed back to the policyholders through a corresponding adjustment to the related liability, primarily classified in the Consolidated Statements of Financial Position as “Policyholders’ account balances.” The adjustment to the liability is based on changes in the fair value of all of the related assets, including commercial mortgage and other loans, which are carried at amortized cost, less any valuation allowance. Partially participating products are those for which only a portion of the return on underlying investments is passed back to the policyholders over time through changes to the contractual crediting rates. The crediting rates are typically reset semiannually, often subject to a minimum crediting rate, and returns are required to be passed back within ten years.
In our International Insurance segment, the experience-rated products are fully participating. As a result, the entire return on the underlying investments is passed back to policyholders through a corresponding adjustment to the related liability.
Adjusted operating income excludes net investment gains (losses) on assets supporting experience-rated contractholder liabilities, related derivatives and commercial mortgage and other loans. This is consistent with the exclusion of realized investment gains (losses) with respect to other investments supporting insurance liabilities managed on a consistent basis. In addition, to be consistent with the historical treatment of charges related to realized investment gains (losses) on investments, adjusted operating income also excludes the change in contractholder liabilities due to asset value changes in the pool of investments (including changes in the fair value of commercial mortgage and other loans) supporting these experience-rated contracts, which are reflected in “Interest credited to policyholders’ account balances.” The result of this approach is that adjusted operating income for these products includes net fee revenue and interest spread we earn on these experience-rated contracts, and excludes changes in fair value of the pool of investments, both realized and unrealized, that we expect will ultimately accrue to the contractholders.
The following table sets forth the impact on results for the periods indicated of these items that are excluded from adjusted operating income:
99
|
|
Year ended December 31,
|
|||||||||||
|
|
2018
|
2017
|
2016
|
|||||||||
|
|
(in millions)
|
|||||||||||
|
Retirement Segment:
|
||||||||||||
|
Investment gains (losses) on:
|
||||||||||||
|
Assets supporting experience-rated contractholder liabilities, net
|
$
|
(588
|
)
|
$
|
118
|
|
$
|
(21
|
)
|
|||
|
Derivatives
|
103
|
|
(168
|
)
|
(10
|
)
|
||||||
|
Commercial mortgages and other loans
|
13
|
|
(7
|
)
|
5
|
|
||||||
|
Change in experience-rated contractholder liabilities due to asset value changes(1)(2)
|
435
|
|
67
|
|
25
|
|
||||||
|
Net gains (losses)
|
$
|
(37
|
)
|
$
|
10
|
|
$
|
(1
|
)
|
|||
|
International Insurance Segment:
|
||||||||||||
|
Investment gains (losses) on assets supporting experience-rated contractholder liabilities, net
|
$
|
(275
|
)
|
$
|
218
|
|
$
|
4
|
|
|||
|
Change in experience-rated contractholder liabilities due to asset value changes
|
275
|
|
(218
|
)
|
(4
|
)
|
||||||
|
Net gains (losses)
|
$
|
0
|
|
$
|
0
|
|
$
|
0
|
|
|||
|
Total:
|
||||||||||||
|
Investment gains (losses) on:
|
||||||||||||
|
Assets supporting experience-rated contractholder liabilities, net
|
$
|
(863
|
)
|
$
|
336
|
|
$
|
(17
|
)
|
|||
|
Derivatives
|
103
|
|
(168
|
)
|
(10
|
)
|
||||||
|
Commercial mortgages and other loans
|
13
|
|
(7
|
)
|
5
|
|
||||||
|
Change in experience-rated contractholder liabilities due to asset value changes(1)(2)
|
710
|
|
(151
|
)
|
21
|
|
||||||
|
Net gains (losses)
|
$
|
(37
|
)
|
$
|
10
|
|
$
|
(1
|
)
|
|||
__________
|
(1)
|
Decreases to contractholder liabilities due to asset value changes are limited by certain floors and therefore do not reflect cumulative declines in recorded asset values of $99 million, $18 million and $10 million as of December 31,
2018
,
2017
and
2016
, respectively. We have recovered and expect to recover in future periods these declines in recorded asset values through subsequent increases in recorded asset values or reductions in crediting rates on contractholder liabilities.
|
|
(2)
|
Included in the amounts above related to the change in the liability to contractholders as a result of commercial mortgage and other loans are a decrease of $23 million, a decrease of $21 million and an increase of $4 million for the years ended December 31,
2018
,
2017
and
2016
, respectively. As prescribed by U.S. GAAP, changes in the fair value of commercial mortgage and other loans held for investment in our general account, other than when associated with impairments, are not recognized in income in the current period, while the impact of these changes in fair value are reflected as a change in the liability to fully participating contractholders in the current period.
|
The net impacts, for the Retirement segment, of changes in experience-rated contractholder liabilities and investment gains (losses) on assets supporting experience-rated contractholder liabilities and other related investments reflect timing differences between the recognition of the mark-to-market adjustments and the recognition of the recovery of these adjustments in future periods through subsequent increases in asset values or reductions in crediting rates on contractholder liabilities for partially participating products. These impacts also reflect the difference between the fair value of the underlying commercial mortgages and other loans and the amortized cost, less any valuation allowance, of these loans, as described above.
Valuation of Assets and Liabilities
Fair Value of Assets and Liabilities
The authoritative guidance related to fair value measurement establishes a framework that includes a three-level hierarchy used to classify the inputs used in measuring fair value. The level in the hierarchy within which the fair value falls is determined based on the lowest level input that is significant to the measurement. The fair values of assets and liabilities classified as Level 3 include at least one significant unobservable input in the measurement. See Note 6 to the Consolidated Financial Statements for an additional description of the valuation hierarchy levels as well as for the balances of assets and liabilities measured at fair value on a recurring basis by hierarchy level presented on a consolidated basis.
The table below presents the balances of assets and liabilities measured at fair value on a recurring basis, as of the periods indicated, and the portion of such assets and liabilities that are classified in Level 3 of the valuation hierarchy. The table also provides details about these assets and liabilities excluding those held in the Closed Block division. We believe the amounts excluding the Closed Block division are most relevant to an understanding of our operations that are pertinent to investors in Prudential Financial because substantially all Closed Block division assets support obligations and liabilities relating to the Closed Block policies only. See Note 14 to the Consolidated Financial Statements for further information on the Closed Block.
100
|
|
As of December 31, 2018
|
As of December 31, 2017
|
|||||||||||||||||||||||||||||
|
|
PFI excluding Closed Block Division
|
Closed Block
Division
|
PFI excluding Closed Block Division
|
Closed Block
Division
|
|||||||||||||||||||||||||||
|
|
Total at
Fair Value
|
Total
Level 3(1)
|
Total at
Fair Value
|
Total
Level 3(1)
|
Total at
Fair Value
|
Total
Level 3(1)
|
Total at
Fair Value
|
Total
Level 3(1)
|
|||||||||||||||||||||||
|
|
(in millions)
|
||||||||||||||||||||||||||||||
|
Fixed maturities, available-for-sale
|
$
|
314,911
|
|
$
|
3,455
|
|
$
|
38,745
|
|
$
|
780
|
|
$
|
305,518
|
|
$
|
7,557
|
|
$
|
41,262
|
|
$
|
2,139
|
|
|||||||
|
Assets supporting experience-rated contractholder liabilities:
|
|||||||||||||||||||||||||||||||
|
Fixed maturities
|
19,579
|
|
818
|
|
0
|
|
0
|
|
20,209
|
|
1,408
|
|
0
|
|
0
|
|
|||||||||||||||
|
Equity securities
|
1,460
|
|
1
|
|
0
|
|
0
|
|
1,643
|
|
4
|
|
0
|
|
0
|
|
|||||||||||||||
|
All other(2)
|
215
|
|
0
|
|
0
|
|
0
|
|
137
|
|
7
|
|
0
|
|
0
|
|
|||||||||||||||
|
Subtotal
|
21,254
|
|
819
|
|
0
|
|
0
|
|
21,989
|
|
1,419
|
|
0
|
|
0
|
|
|||||||||||||||
|
Fixed maturities, trading
|
3,048
|
|
204
|
|
195
|
|
2
|
|
3,307
|
|
155
|
|
200
|
|
1
|
|
|||||||||||||||
|
Equity securities
|
4,316
|
|
604
|
|
1,784
|
|
67
|
|
4,855
|
|
712
|
|
2,479
|
|
83
|
|
|||||||||||||||
|
Commercial mortgage and other loans
|
763
|
|
0
|
|
0
|
|
0
|
|
593
|
|
0
|
|
0
|
|
0
|
|
|||||||||||||||
|
Other invested assets(3)
|
1,404
|
|
263
|
|
5
|
|
0
|
|
1,330
|
|
137
|
|
2
|
|
0
|
|
|||||||||||||||
|
Short-term investments
|
5,040
|
|
65
|
|
453
|
|
24
|
|
5,351
|
|
8
|
|
436
|
|
0
|
|
|||||||||||||||
|
Cash equivalents
|
9,027
|
|
59
|
|
451
|
|
18
|
|
7,722
|
|
0
|
|
577
|
|
0
|
|
|||||||||||||||
|
Other assets
|
25
|
|
25
|
|
0
|
|
0
|
|
14
|
|
13
|
|
0
|
|
0
|
|
|||||||||||||||
|
Separate account assets
|
254,066
|
|
1,534
|
|
0
|
|
0
|
|
280,393
|
|
2,122
|
|
0
|
|
0
|
|
|||||||||||||||
|
Total assets
|
$
|
613,854
|
|
$
|
7,028
|
|
$
|
41,633
|
|
$
|
891
|
|
$
|
631,072
|
|
$
|
12,123
|
|
$
|
44,956
|
|
$
|
2,223
|
|
|||||||
|
Future policy benefits
|
$
|
8,926
|
|
$
|
8,926
|
|
$
|
0
|
|
$
|
0
|
|
$
|
8,720
|
|
$
|
8,720
|
|
$
|
0
|
|
$
|
0
|
|
|||||||
|
Other liabilities(3)
|
191
|
|
56
|
|
0
|
|
0
|
|
688
|
|
50
|
|
0
|
|
0
|
|
|||||||||||||||
|
Notes issued by consolidated variable interest entities (“VIEs”)
|
595
|
|
595
|
|
0
|
|
0
|
|
1,196
|
|
1,196
|
|
0
|
|
0
|
|
|||||||||||||||
|
Total liabilities
|
$
|
9,712
|
|
$
|
9,577
|
|
$
|
0
|
|
$
|
0
|
|
$
|
10,604
|
|
$
|
9,966
|
|
$
|
0
|
|
$
|
0
|
|
|||||||
__________
|
(1)
|
Level 3 assets expressed as a percentage of total assets measured at fair value on a recurring basis for PFI excluding the Closed Block division and for the Closed Block division totaled
1.1%
and
2.1%
, respectively, as of
December 31, 2018
and
1.9%
and
4.9%
, respectively, as of
December 31, 2017
.
|
|
(2)
|
“All other” represents cash equivalents and short-term investments.
|
|
(3)
|
“Other invested assets” and “Other liabilities” primarily include derivatives. The amounts include the impact of netting subject to master netting agreements.
|
The determination of fair value, which for certain assets and liabilities is dependent on the application of estimates and assumptions, can have a significant impact on our results of operations and may require the application of a greater degree of judgment depending on market conditions, as the ability to value assets and liabilities can be significantly impacted by a decrease in market activity or a lack of transactions executed in an orderly manner. The following sections provide information regarding certain assets and liabilities which are valued using Level 3 inputs and could have a significant impact on our results of operations.
Fixed Maturity and Equity Securities
Fixed maturity securities included in Level 3 in our fair value hierarchy are generally priced based on internally-developed valuations or indicative broker quotes. For certain private fixed maturity and equity securities, the internal valuation models use significant unobservable inputs and, accordingly, such securities are included in Level 3 in our fair value hierarchy. Level 3 fixed maturity securities for PFI excluding the Closed Block division included approximately
$1.9 billion
of public fixed maturities as of
December 31, 2018
with values primarily based on indicative broker quotes, and approximately
$2.5 billion
of private fixed maturities, with values primarily based on internally-developed models. Significant unobservable inputs used included: issue specific spread adjustments, material non-public financial information, management judgment, estimation of future earnings and cash flows, default rate assumptions, liquidity assumptions and indicative quotes from market makers. These inputs are usually considered unobservable, as not all market participants have access to this data.
101
The Company’s determination to classify assets and liabilities within Level 3 is based on significance of the unobservable inputs in the overall fair value measurement. Periodically, transfers between levels are made to reflect changes in observability of inputs and market activity. During the second quarter of 2018,
$5,078 million
of investments in CLOs reported as “Asset-backed securities” were transferred from Level 3 to Level 2 as market activity, liquidity and overall observability of valuation inputs of CLOs has increased. All transfers are generally reported at the value as of the beginning of the quarter in which transfers occur for any such assets still held at the end of the quarter.
The impact that fair value changes of fixed maturity securities (and equity securities prior to January 1, 2018) have on the results of operations is dependent on the classification of the security as trading, available-for-sale, or held-to-maturity. For investments classified as trading, changes in fair value are recorded within “Other income (loss).” For investments classified as available-for-sale, changes in fair value are recorded as an unrealized gain or loss in AOCI, a separate component of equity. Investments classified as held-to-maturity are carried at amortized cost and the changes in fair value have no impact on the results of operations. Effective January 1, 2018, as a result of the adoption of ASU 2016-01 (see Note 2), the classifications above no longer apply to equity securities and changes in fair value are recorded within “Other income (loss).”
Separate Account Assets
Separate account assets included in Level 3 primarily include corporate securities and commercial mortgage loans. The valuation of corporate securities is determined as described above for fixed maturity and equity securities. See Note 6 to the Consolidated Financial Statements for additional information on the valuation of commercial mortgage loans. Separate account liabilities are reported at contract value and not at fair value.
Variable Annuity Living Benefit Features
Future policy benefits classified in Level 3 primarily include liabilities related to guarantees associated with the living benefit features of certain variable annuity contracts offered by our Individual Annuities segment, including GMAB, GMWB and GMIWB. These benefits are accounted for as embedded derivatives and carried at fair value with changes in fair value included in “Realized investment gains (losses), net.” The fair values of the GMAB, GMWB and GMIWB liabilities are calculated as the present value of future expected benefit payments to customers less the present value of future rider fees attributable to the embedded derivative feature. This methodology could result in either a liability or contra-liability balance, based on capital market conditions and various policyholder behavior assumptions. Since there is no observable active market for the transfer of these obligations, the valuations are calculated using internally-developed models with option pricing techniques. These models utilize significant assumptions that are primarily unobservable, including assumptions as to lapse rates, NPR, utilization rates, withdrawal rates, mortality rates and equity market volatility. Future policy benefits classified as Level 3 for PFI excluding the Closed Block division were a net liability of
$8.9 billion
as of
December 31, 2018
. For additional information, see “—Results of Operations by Segment—U.S. Individual Solutions Division—Individual Annuities.”
Notes Issued by Consolidated VIEs
As discussed in Note 4 to the Consolidated Financial Statements, notes issued by consolidated VIEs represent non-recourse notes issued by certain asset-backed investment vehicles, primarily CLOs, which we are required to consolidate. We have elected the fair value option for these notes, which are valued based on corresponding bank loan collateral.
For additional information about the key estimates and assumptions used in our determination of fair value, see Note 6 to the Consolidated Financial Statements.
General Account Investments
We maintain diversified investment portfolios in our general account to support our liabilities to customers as well as our other general liabilities. Investments and other assets that do not support general account liabilities, and are therefore excluded from our general account, are as follows:
|
•
|
assets of our derivative operations;
|
|
•
|
assets of our investment management operations, including investments managed for third-parties; and
|
|
•
|
those assets classified as “Separate account assets” on our balance sheet.
|
The general account portfolios are managed pursuant to the distinct objectives and investment policy statements of PFI excluding the Closed Block division and of the Closed Block division. The primary investment objectives of PFI excluding the Closed Block division include:
102
|
•
|
hedging and otherwise managing the market risk characteristics of the major product liabilities and other obligations of the Company;
|
|
•
|
optimizing investment income yield within risk constraints over time; and
|
|
•
|
for certain portfolios, optimizing total return, including both investment income yield and capital appreciation, within risk constraints over time, while managing the market risk exposures associated with the corresponding product liabilities.
|
We pursue our objective to optimize investment income yield for PFI excluding the Closed Block division over time through:
|
•
|
the investment of net operating cash flows, including new product premium inflows, and proceeds from investment sales, repayments and prepayments into investments with attractive risk-adjusted yields; and
|
|
•
|
the sale of investments, where appropriate, either to meet various cash flow needs or to manage the portfolio's risk exposure profile with respect to duration, credit, currency and other risk factors, while considering the impact on taxes and capital.
|
The primary investment objectives of the Closed Block division include:
|
•
|
providing for the reasonable dividend expectations of the participating policyholders within the Closed Block division; and
|
|
•
|
optimizing total return, including both investment income yield and capital appreciation, within risk constraints, while managing the market risk exposures associated with the major products in the Closed Block division.
|
Our portfolio management approach, while emphasizing our investment income yield and asset/liability risk management objectives, also takes into account the capital and tax implications of portfolio activity and our assertions regarding our ability and intent to hold debt securities to recovery. For a further discussion of our OTTI policies, including our assertions regarding any intention or requirement to sell debt securities before anticipated recovery, see “—Realized Investment Gains and Losses—Impairments” below.
Management of Investments
The Investment Committee of our Board of Directors (“Board”) oversees our proprietary investments, including our general account portfolios, and regularly reviews performance and risk positions. Our Chief Investment Officer Organization (“CIO Organization”) develops investment policies subject to risk limits proposed by our Enterprise Risk Management (“ERM”) group for the general account portfolios of our domestic and international insurance subsidiaries and directs and oversees management of the general account portfolios within risk limits and exposure ranges approved annually by the Investment Committee.
The CIO Organization, including related functions within our insurance subsidiaries, works closely with product actuaries and ERM to understand the characteristics of our products and their associated market risk exposures. This information is incorporated into the development of target asset portfolios that manage market risk exposures associated with the liability characteristics and establish investment risk exposures, within tolerances prescribed by Prudential’s investment risk limits, on which we expect to earn an attractive risk-adjusted return. We develop asset strategies for specific classes of product liabilities and attributed or accumulated surplus, each with distinct risk characteristics. Market risk exposures associated with the liabilities include interest rate risk, which is addressed through the duration characteristics of the target asset mix, and currency risk, which is addressed by the currency profile of the target asset mix. In certain of our smaller markets outside of the U.S. and Japan, capital markets limitations hinder our ability to hedge interest rate exposure to the same extent we do for our U.S. and Japan businesses and lead us to accept a higher degree of interest rate risk in these smaller portfolios. General account portfolios typically include allocations to credit and other investment risks as a means to enhance investment yields and returns over time.
Most of our products can be categorized into the following three classes:
|
•
|
interest-crediting products for which the rates credited to customers are periodically adjusted to reflect market and competitive forces and actual investment experience, such as fixed annuities and universal life insurance;
|
|
•
|
participating individual and experience-rated group products in which customers participate in actual investment and business results through annual dividends, interest or return of premium; and
|
|
•
|
products with fixed or guaranteed terms, such as traditional whole life and endowment products, guaranteed investment contracts (“GICs”), funding agreements and payout annuities.
|
103
Our total investment portfolio is composed of a number of operating portfolios. Each operating portfolio backs a specific set of liabilities, and the portfolios have a target asset mix that supports the liability characteristics, including duration, cash flow, liquidity needs and other criteria. As of December 31, 2018, the average duration of our domestic general account investment portfolios attributable to PFI excluding the Closed Block division, including the impact of derivatives, was between 6 and 7 years. As of December 31, 2018, the average duration of our international general account portfolios attributable to our Japanese insurance operations, including the impact of derivatives, was between 11 and 12 years and represented a blend of yen-denominated and U.S. dollar and Australian dollar-denominated investments, which have distinct average durations supporting the insurance liabilities we have issued in those currencies. Our asset/liability management process has enabled us to manage our portfolios through several market cycles.
We implement our portfolio strategies primarily through investment in a broad range of fixed income assets, including government and agency securities, public and private corporate bonds and structured securities and commercial mortgage loans. In addition, we hold allocations of non-coupon investments, which include equity securities and other invested assets such as LPs/LLCs, real estate held through direct ownership, derivative instruments, and seed money investments in separate accounts.
We manage our public fixed maturity portfolio to a risk profile directed or overseen by the CIO Organization and ERM groups and to a profile that also reflects the market environments impacting both our domestic and international insurance portfolios. The return that we earn on the portfolio will be reflected in investment income and in realized gains or losses on investments.
We use privately-placed corporate debt securities and commercial mortgage loans, which consist of mortgages on diversified properties in terms of geography, property type and borrowers, to enhance the yield on our portfolio and to improve the overall diversification of the portfolios. Private placements typically offer enhanced yields due to an illiquidity premium and generally offer enhanced credit protection in the form of covenants. Our origination capability offers the opportunity to lead transactions and gives us the opportunity for better terms, including covenants and call protection, and to take advantage of innovative deal structures.
Derivative strategies are employed in the context of our risk management framework to enhance our ability to manage interest rate and currency risk exposures of the asset portfolio relative to the liabilities and to manage credit and equity positions in the investment portfolios. For a discussion of our risk management process, see “Quantitative and Qualitative Disclosures About Market Risk” below.
Our portfolio asset allocation reflects our emphasis on diversification across asset classes, sectors and issuers. The CIO Organization, directly and through related functions within the insurance subsidiaries, implements portfolio strategies primarily through various investment management units within Prudential’s PGIM segment. Activities of the PGIM segment on behalf of the general account portfolios are directed and overseen by the CIO Organization and monitored by ERM for compliance with investment risk limits.
Portfolio Composition
Our investment portfolio consists of public and private fixed maturity securities, commercial mortgage and other loans, policy loans and non-coupon investments as defined above. The composition of our general account reflects, within the discipline provided by our risk management approach, our need for competitive results and the selection of diverse investment alternatives available primarily through our PGIM segment. The size of our portfolio enables us to invest in asset classes that may be unavailable to the typical investor.
Effective January 1, 2018, the Company adopted ASU 2016-01,
Financial Instruments
—
Overall (Subtopic 825-10): Recognition and Measurement of Financial Assets and Liabilities
which impacted the Company’s accounting and presentation related to equity investments. For additional details regarding the adoption of ASU 2016-01, see Note 2 to the Consolidated Financial Statements.
104
The following tables set forth the composition of the investments of our general account apportioned between PFI excluding the Closed Block division and the Closed Block division, as of the dates indicated:
|
|
December 31, 2018
|
||||||||||||||
|
|
PFI Excluding
Closed Block Division
|
Closed Block
Division
|
Total
|
||||||||||||
|
|
($ in millions)
|
||||||||||||||
|
Fixed maturities:
|
|||||||||||||||
|
Public, available-for-sale, at fair value
|
$
|
269,109
|
|
64.8
|
%
|
$
|
26,203
|
|
$
|
295,312
|
|
||||
|
Public, held-to-maturity, at amortized cost
|
1,745
|
|
0.4
|
|
0
|
|
1,745
|
|
|||||||
|
Private, available-for-sale, at fair value
|
45,328
|
|
10.9
|
|
12,542
|
|
57,870
|
|
|||||||
|
Private, held-to-maturity, at amortized cost
|
268
|
|
0.1
|
|
0
|
|
268
|
|
|||||||
|
Fixed maturities, trading, at fair value
|
1,893
|
|
0.5
|
|
195
|
|
2,088
|
|
|||||||
|
Assets supporting experience-rated contractholder liabilities, at fair value
|
21,254
|
|
5.1
|
|
0
|
|
21,254
|
|
|||||||
|
Equity securities, at fair value
|
3,849
|
|
0.9
|
|
1,784
|
|
5,633
|
|
|||||||
|
Commercial mortgage and other loans, at book value
|
50,251
|
|
12.1
|
|
8,782
|
|
59,033
|
|
|||||||
|
Policy loans, at outstanding balance
|
7,606
|
|
1.8
|
|
4,410
|
|
12,016
|
|
|||||||
|
Other invested assets(1)
|
8,407
|
|
2.0
|
|
3,316
|
|
11,723
|
|
|||||||
|
Short-term investments
|
5,948
|
|
1.4
|
|
478
|
|
6,426
|
|
|||||||
|
Total general account investments
|
415,658
|
|
100.0
|
%
|
57,710
|
|
473,368
|
|
|||||||
|
Invested assets of other entities and operations(2)
|
5,877
|
|
0
|
|
5,877
|
|
|||||||||
|
Total investments
|
$
|
421,535
|
|
|
|
$
|
57,710
|
|
$
|
479,245
|
|
||||
|
|
December 31, 2017
|
||||||||||||||
|
|
PFI Excluding
Closed Block Division
|
Closed Block
Division
|
Total
|
||||||||||||
|
|
($ in millions)
|
||||||||||||||
|
Fixed maturities:
|
|||||||||||||||
|
Public, available-for-sale, at fair value
|
$
|
260,430
|
|
64.7
|
%
|
$
|
27,448
|
|
$
|
287,878
|
|
||||
|
Public, held-to-maturity, at amortized cost
|
1,747
|
|
0.4
|
|
0
|
|
1,747
|
|
|||||||
|
Private, available-for-sale, at fair value
|
44,479
|
|
11.1
|
|
13,814
|
|
58,293
|
|
|||||||
|
Private, held-to-maturity, at amortized cost
|
302
|
|
0.1
|
|
0
|
|
302
|
|
|||||||
|
Fixed maturities, trading, at fair value
|
1,589
|
|
0.4
|
|
200
|
|
1,789
|
|
|||||||
|
Assets supporting experience-rated contractholder liabilities, at fair value
|
22,097
|
|
5.5
|
|
0
|
|
22,097
|
|
|||||||
|
Equity securities, at fair value
|
4,276
|
|
1.1
|
|
2,479
|
|
6,755
|
|
|||||||
|
Commercial mortgage and other loans, at book value
|
46,394
|
|
11.5
|
|
9,017
|
|
55,411
|
|
|||||||
|
Policy loans, at outstanding balance
|
7,348
|
|
1.8
|
|
4,543
|
|
11,891
|
|
|||||||
|
Other invested assets(1)
|
7,510
|
|
1.9
|
|
3,159
|
|
10,669
|
|
|||||||
|
Short-term investments
|
6,103
|
|
1.5
|
|
631
|
|
6,734
|
|
|||||||
|
Total general account investments
|
402,275
|
|
100.0
|
%
|
61,291
|
|
463,566
|
|
|||||||
|
Invested assets of other entities and operations(2)
|
6,305
|
|
0
|
|
6,305
|
|
|||||||||
|
Total investments(3)
|
$
|
408,580
|
|
|
|
$
|
61,291
|
|
$
|
469,871
|
|
||||
__________
|
(1)
|
Other invested assets consist of investments in LPs/LLCs, investment real estate held through direct ownership, derivative instruments and other miscellaneous investments. For additional information regarding these investments, see “—Other Invested Assets” below.
|
|
(2)
|
Includes invested assets of our investment management and derivative operations. Excludes assets of our investment management operations that are managed for third-parties and those assets classified as “Separate account assets” on our balance sheet. For additional information regarding these investments, see “—Invested Assets of Other Entities and Operations” below.
|
|
(3)
|
Prior period amounts have been reclassified to conform to current period presentation. For additional information, see Note 2 to the Consolidated Financial Statements.
|
105
The increase in general account investments attributable to PFI excluding the Closed Block division in
2018
was primarily due to the reinvestment of net investment income and net business inflows, partially offset by an increase in U.S. interest rates and credit spread widening. For information regarding the methodology used in determining the fair value of our fixed maturities, see Note 6 to the Consolidated Financial Statements.
As of
December 31, 2018
and
2017
, 43% and 42%, respectively, of our general account investments attributable to PFI excluding the Closed Block division related to our Japanese insurance operations. The following table sets forth the composition of the investments of our Japanese insurance operations’ general account, as of the dates indicated:
|
December 31,
|
||||||||
|
|
2018
|
2017
|
||||||
|
|
(in millions)
|
|||||||
|
Fixed maturities:
|
||||||||
|
Public, available-for-sale, at fair value
|
$
|
133,084
|
|
$
|
128,332
|
|
||
|
Public, held-to-maturity, at amortized cost
|
1,745
|
|
1,747
|
|
||||
|
Private, available-for-sale, at fair value
|
16,222
|
|
14,538
|
|
||||
|
Private, held-to-maturity, at amortized cost
|
268
|
|
302
|
|
||||
|
Fixed maturities, trading, at fair value
|
328
|
|
257
|
|
||||
|
Assets supporting experience-rated contractholder liabilities, at fair value
|
2,441
|
|
2,586
|
|
||||
|
Equity securities, at fair value
|
1,972
|
|
2,151
|
|
||||
|
Commercial mortgage and other loans, at book value
|
17,228
|
|
14,268
|
|
||||
|
Policy loans, at outstanding balance
|
2,715
|
|
2,545
|
|
||||
|
Other invested assets(1)
|
1,957
|
|
2,021
|
|
||||
|
Short-term investments
|
451
|
|
244
|
|
||||
|
Total Japanese general account investments(2)
|
$
|
178,411
|
|
$
|
168,991
|
|
||
__________
|
(1)
|
Other invested assets consist of investments in LPs/LLCs, investment real estate held through direct ownership, derivative instruments and other miscellaneous investments.
|
|
(2)
|
Prior period amounts have been reclassified to conform to current period presentation. For additional information, see Note 2 to the Consolidated Financial Statements.
|
The increase in general account investments related to our Japanese insurance operations in
2018
was primarily attributable to net business inflows, the reinvestment of net investment income, and the translation impact of the yen strengthening against the U.S. dollar, partially offset by an increase in U.S. interest rates.
As of December 31, 2018, our Japanese insurance operations had $64.9 billion, at carrying value, of investments denominated in U.S. dollars, including $2.5 billion that were hedged to yen through third-party derivative contracts and $50.0 billion that support liabilities denominated in U.S. dollars, with the remainder hedging our foreign currency exchange rate exposure on U.S. dollar-equivalent equity. As of December 31, 2017, our Japanese insurance operations had $62.6 billion, at carrying value, of investments denominated in U.S. dollars, including $5.8 billion that were hedged to yen through third-party derivative contracts and $43.8 billion that support liabilities denominated in U.S. dollars, with the remainder hedging our foreign currency exchange rate exposure on U.S. dollar-equivalent equity. The $2.3 billion increase in the carrying value of U.S. dollar-denominated investments from December 31, 2017 was primarily attributable to portfolio growth as a result of net business inflows and the reinvestment of net investment income, partially offset by the reduction of the U.S. dollar investments hedged back to yen through third-party derivatives.
Our Japanese insurance operations had $10.1 billion and $11.4 billion, at carrying value, of investments denominated in Australian dollars that support liabilities denominated in Australian dollars, as of December 31, 2018 and 2017, respectively. The $1.3 billion decrease in the carrying value of Australian dollar-denominated investments from December 31, 2017, was primarily attributable to the translation impact of the Australian dollar weakening against the U.S. dollar and portfolio reduction as a result of net business outflows. For additional information regarding U.S. and Australian dollar investments held in our Japanese insurance operations and a discussion of our yen hedging strategy, see “
—
Results of Operations by Segment
—
Impact of Foreign Currency Exchange Rates” above.
Investment Results
106
The following tables set forth the investment results of our general account apportioned between PFI excluding the Closed Block division and the Closed Block division, for the periods indicated. The yields are based on net investment income as reported under U.S. GAAP and as such do not include certain interest-related items, such as settlements of duration management swaps which are included in “Realized investment gains (losses), net.”
107
|
Year Ended December 31, 2018
|
||||||||||||||||||||||||||||
|
PFI Excluding Closed Block Division and Japanese Operations
|
Japanese Insurance Operations
|
PFI Excluding Closed Block Division
|
Closed Block Division
|
Total(5)
|
||||||||||||||||||||||||
|
Yield(1)
|
Amount
|
Yield(1)
|
Amount
|
Yield(1)
|
Amount
|
Amount
|
Amount
|
|||||||||||||||||||||
|
($ in millions)
|
||||||||||||||||||||||||||||
|
Fixed maturities(2)
|
4.68
|
%
|
$
|
7,004
|
|
2.93
|
%
|
$
|
3,707
|
|
3.87
|
%
|
$
|
10,711
|
|
$
|
1,692
|
|
$
|
12,403
|
|
|||||||
|
Assets supporting experience-rated contractholder liabilities
|
3.62
|
|
674
|
|
1.81
|
|
46
|
|
3.41
|
|
720
|
|
0
|
|
720
|
|
||||||||||||
|
Equity securities
|
2.28
|
|
48
|
|
3.45
|
|
72
|
|
2.86
|
|
120
|
|
45
|
|
165
|
|
||||||||||||
|
Commercial mortgage and other loans
|
4.03
|
|
1,299
|
|
3.96
|
|
623
|
|
4.01
|
|
1,922
|
|
407
|
|
2,329
|
|
||||||||||||
|
Policy loans
|
5.44
|
|
258
|
|
3.92
|
|
101
|
|
4.91
|
|
359
|
|
263
|
|
622
|
|
||||||||||||
|
Short-term investments and cash equivalents
|
2.20
|
|
265
|
|
2.83
|
|
33
|
|
2.25
|
|
298
|
|
30
|
|
328
|
|
||||||||||||
|
Gross investment income
|
4.36
|
|
9,548
|
|
3.04
|
|
4,582
|
|
3.82
|
|
14,130
|
|
2,437
|
|
16,567
|
|
||||||||||||
|
Investment expenses
|
(0.15
|
)
|
(397
|
)
|
(0.13
|
)
|
(237
|
)
|
(0.14
|
)
|
(634
|
)
|
(204
|
)
|
(838
|
)
|
||||||||||||
|
Investment income after investment expenses
|
4.21
|
%
|
9,151
|
|
2.91
|
%
|
4,345
|
|
3.68
|
%
|
13,496
|
|
2,233
|
|
15,729
|
|
||||||||||||
|
Other invested assets(3)
|
221
|
|
93
|
|
314
|
|
55
|
|
369
|
|
||||||||||||||||||
|
Investment results of other entities and operations(4)
|
78
|
|
0
|
|
78
|
|
0
|
|
78
|
|
||||||||||||||||||
|
Total investment income
|
$
|
9,450
|
|
$
|
4,438
|
|
$
|
13,888
|
|
$
|
2,288
|
|
$
|
16,176
|
|
|||||||||||||
|
Year Ended December 31, 2017
|
||||||||||||||||||||||||||||
|
PFI Excluding Closed Block Division and Japanese Operations
|
Japanese Insurance Operations
|
PFI Excluding Closed Block Division
|
Closed Block Division
|
Total(5)
|
||||||||||||||||||||||||
|
Yield(1)
|
Amount
|
Yield(1)
|
Amount
|
Yield(1)
|
Amount
|
Amount
|
Amount
|
|||||||||||||||||||||
|
($ in millions)
|
||||||||||||||||||||||||||||
|
Fixed maturities(2)
|
4.61
|
%
|
$
|
6,464
|
|
3.06
|
%
|
$
|
3,624
|
|
3.90
|
%
|
$
|
10,088
|
|
$
|
1,770
|
|
$
|
11,858
|
|
|||||||
|
Assets supporting experience-rated contractholder liabilities
|
3.61
|
|
695
|
|
1.73
|
|
41
|
|
3.40
|
|
736
|
|
0
|
|
736
|
|
||||||||||||
|
Equity securities
|
5.75
|
|
247
|
|
2.91
|
|
79
|
|
4.65
|
|
326
|
|
50
|
|
376
|
|
||||||||||||
|
Commercial mortgage and other loans
|
4.13
|
|
1,285
|
|
4.05
|
|
515
|
|
4.10
|
|
1,800
|
|
449
|
|
2,249
|
|
||||||||||||
|
Policy loans
|
5.41
|
|
250
|
|
4.00
|
|
97
|
|
4.92
|
|
347
|
|
271
|
|
618
|
|
||||||||||||
|
Short-term investments and cash equivalents
|
1.31
|
|
158
|
|
1.25
|
|
14
|
|
1.31
|
|
172
|
|
25
|
|
197
|
|
||||||||||||
|
Gross investment income
|
4.02
|
|
9,099
|
|
3.11
|
|
4,370
|
|
3.66
|
|
13,469
|
|
2,565
|
|
16,034
|
|
||||||||||||
|
Investment expenses
|
(0.14
|
)
|
(306
|
)
|
(0.12
|
)
|
(184
|
)
|
(0.13
|
)
|
(490
|
)
|
(177
|
)
|
(667
|
)
|
||||||||||||
|
Investment income after investment expenses
|
3.88
|
%
|
8,793
|
|
2.99
|
%
|
4,186
|
|
3.53
|
%
|
12,979
|
|
2,388
|
|
15,367
|
|
||||||||||||
|
Other invested assets(3)
|
498
|
|
132
|
|
630
|
|
265
|
|
895
|
|
||||||||||||||||||
|
Investment results of other entities and operations(4)
|
173
|
|
0
|
|
173
|
|
0
|
|
173
|
|
||||||||||||||||||
|
Total investment income
|
$
|
9,464
|
|
$
|
4,318
|
|
$
|
13,782
|
|
$
|
2,653
|
|
$
|
16,435
|
|
|||||||||||||
108
|
Year Ended December 31, 2016
|
||||||||||||||||||||||||||||
|
PFI Excluding Closed Block Division and Japanese Operations
|
Japanese Insurance Operations
|
PFI Excluding Closed Block Division
|
Closed Block Division
|
Total(5)
|
||||||||||||||||||||||||
|
Yield(1)
|
Amount
|
Yield(1)
|
Amount
|
Yield(1)
|
Amount
|
Amount
|
Amount
|
|||||||||||||||||||||
|
($ in millions)
|
||||||||||||||||||||||||||||
|
Fixed maturities(2)
|
4.63
|
%
|
$
|
6,043
|
|
3.14
|
%
|
$
|
3,472
|
|
3.95
|
%
|
$
|
9,515
|
|
$
|
1,696
|
|
$
|
11,211
|
|
|||||||
|
Assets supporting experience-rated contractholder liabilities
|
3.80
|
|
721
|
|
1.75
|
|
37
|
|
3.59
|
|
758
|
|
0
|
|
758
|
|
||||||||||||
|
Equity securities
|
5.40
|
|
232
|
|
2.46
|
|
75
|
|
4.18
|
|
307
|
|
59
|
|
366
|
|
||||||||||||
|
Commercial mortgage and other loans
|
4.35
|
|
1,306
|
|
4.23
|
|
445
|
|
4.32
|
|
1,751
|
|
476
|
|
2,227
|
|
||||||||||||
|
Policy loans
|
5.49
|
|
252
|
|
4.05
|
|
95
|
|
5.00
|
|
347
|
|
280
|
|
627
|
|
||||||||||||
|
Short-term investments and cash equivalents
|
0.67
|
|
113
|
|
0.78
|
|
9
|
|
0.68
|
|
122
|
|
20
|
|
142
|
|
||||||||||||
|
Gross investment income
|
4.26
|
|
8,667
|
|
3.19
|
|
4,133
|
|
3.84
|
|
12,800
|
|
2,531
|
|
15,331
|
|
||||||||||||
|
Investment expenses
|
(0.13
|
)
|
(248
|
)
|
(0.12
|
)
|
(165
|
)
|
(0.14
|
)
|
(413
|
)
|
(156
|
)
|
(569
|
)
|
||||||||||||
|
Investment income after investment expenses
|
4.13
|
%
|
8,419
|
|
3.07
|
%
|
3,968
|
|
3.70
|
%
|
12,387
|
|
2,375
|
|
14,762
|
|
||||||||||||
|
Other invested assets(3)
|
|
|
344
|
|
|
|
129
|
|
|
|
473
|
|
203
|
|
676
|
|
||||||||||||
|
Investment results of other entities and operations(4)
|
82
|
|
0
|
|
82
|
|
0
|
|
82
|
|
||||||||||||||||||
|
Total investment income
|
$
|
8,845
|
|
$
|
4,097
|
|
$
|
12,942
|
|
$
|
2,578
|
|
$
|
15,520
|
|
|||||||||||||
__________
|
(1)
|
The denominator in the yield percentage is based on quarterly average carrying values for all asset types except for fixed maturities which are based on amortized cost. Amounts for fixed maturities, short-term investments and cash equivalents are also netted for securities lending activity (i.e., income netted for rebate expenses and asset values netted for securities lending liabilities). A yield is not presented for other invested assets as it is not considered a meaningful measure of investment performance. Yields exclude investment income and assets related to other invested assets. Prior period yields have been revised to conform to current period presentation.
|
|
(2)
|
Includes fixed maturity securities classified as available-for-sale and held-to-maturity and excludes fixed maturity securities classified as trading, which are included in other invested assets.
|
|
(3)
|
Other invested assets consist of investments in LPs/LLCs, investment real estate held through direct ownership, derivative instruments, fixed maturities classified as trading and other miscellaneous investments.
|
|
(4)
|
Includes net investment income of our investment management operations.
|
|
(5)
|
The total yield was 3.77%, 3.68% and 3.82% for the years ended
December 31, 2018
,
2017
and
2016
, respectively.
|
The increase in investment income after investment expenses yield attributable to our general account investments, excluding both the Closed Block division and the Japanese insurance operations’ portfolio, for
2018
compared to
2017
was primarily the result of higher fixed income reinvestment rates.
The decrease in investment income after investment expenses yield attributable to our general account investments, excluding both the Closed Block division and the Japanese insurance operations’ portfolio, for
2017
compared to
2016
was primarily the result of lower fixed income reinvestment rates.
The decrease in investment income after investment expenses yield on the Japanese insurance operations’ portfolio for 2018 compared to 2017 was primarily attributable to lower fixed income reinvestment rates and lower fixed maturity prepayment fees and call premiums.
The decrease in investment income after investment expenses yield on the Japanese insurance operations’ portfolio for 2017 compared to 2016 was primarily attributable to lower fixed income reinvestment rates, partially offset by higher fixed maturity prepayment fees and call premiums.
Both the U.S. dollar-denominated and Australian dollar-denominated fixed maturities that are not hedged to yen through third-party derivative contracts provide a yield that is substantially higher than the yield on comparable yen-denominated fixed maturities. The average amortized cost of U.S. dollar-denominated fixed maturities that are not hedged to yen through third-party derivative contracts was approximately $44.3 billion and $41.4 billion, for the years ended December 31, 2018 and 2017, respectively. The majority of U.S. dollar-denominated fixed maturities support liabilities that are denominated in U.S. dollars. The average amortized cost of Australian dollar-denominated fixed maturities that are not hedged to yen through third-party derivative
109
contracts was approximately $9.8 billion and $10.2 billion, for the years ended December 31, 2018 and 2017, respectively. The Australian dollar-denominated fixed maturities support liabilities that are denominated in Australian dollars. For additional information regarding U.S. and Australian dollar investments held in our Japanese insurance operations, see “
—
Results of Operations
—
Impact of Foreign Currency Exchange Rates” above.
Realized Investment Gains and Losses
The following table sets forth “Realized investment gains (losses), net” by investment type of our general account apportioned between PFI excluding Closed Block division and the Closed Block division as well as related charges and adjustments, for the periods indicated:
110
|
|
Years Ended December 31,
|
|||||||||||
|
|
2018
|
2017
|
2016
|
|||||||||
|
|
(in millions)
|
|||||||||||
|
PFI excluding Closed Block Division:
|
||||||||||||
|
Realized investment gains (losses), net:
|
||||||||||||
|
Due to foreign exchange movements on securities approaching maturity
|
$
|
(23
|
)
|
$
|
(36
|
)
|
$
|
(4
|
)
|
|||
|
Due to securities actively marketed for sale
|
(24
|
)
|
(12
|
)
|
(29
|
)
|
||||||
|
Due to credit or adverse conditions of the respective issuer(1)
|
(169
|
)
|
(121
|
)
|
(111
|
)
|
||||||
|
OTTI losses on fixed maturities recognized in earnings(2)
|
(216
|
)
|
(169
|
)
|
(144
|
)
|
||||||
|
Net gains (losses) on sales and maturities
|
504
|
|
577
|
|
761
|
|
||||||
|
Fixed maturity securities(3)
|
288
|
|
408
|
|
617
|
|
||||||
|
OTTI losses on equity securities recognized in earnings(4)
|
0
|
|
(23
|
)
|
(61
|
)
|
||||||
|
Net gains (losses) on sales and maturities(6)
|
0
|
|
588
|
|
188
|
|
||||||
|
Equity securities(5)
|
0
|
|
565
|
|
127
|
|
||||||
|
Commercial mortgage and other loans
|
(15
|
)
|
(2
|
)
|
2
|
|
||||||
|
Derivative instruments
|
1,249
|
|
(1,061
|
)
|
1,011
|
|
||||||
|
OTTI losses on other invested assets recognized in earnings(7)
|
(7
|
)
|
(19
|
)
|
(57
|
)
|
||||||
|
Other net gains (losses)
|
106
|
|
18
|
|
6
|
|
||||||
|
Other
|
99
|
|
(1
|
)
|
(51
|
)
|
||||||
|
Subtotal
|
1,621
|
|
(91
|
)
|
1,706
|
|
||||||
|
Investment results of other entities and operations(8)
|
226
|
|
(11
|
)
|
54
|
|
||||||
|
Total — PFI excluding Closed Block Division
|
1,847
|
|
(102
|
)
|
1,760
|
|
||||||
|
Related adjustments
|
(1,228
|
)
|
(500
|
)
|
(771
|
)
|
||||||
|
Realized investment gains (losses), net, and related adjustments
|
619
|
|
(602
|
)
|
989
|
|
||||||
|
Related charges
|
(316
|
)
|
544
|
|
(466
|
)
|
||||||
|
Realized investment gains (losses), net, and related charges and adjustments
|
$
|
303
|
|
$
|
(58
|
)
|
$
|
523
|
|
|||
|
Closed Block Division:
|
||||||||||||
|
Realized investment gains (losses), net:
|
||||||||||||
|
Due to foreign exchange movements on securities approaching maturity
|
$
|
(28
|
)
|
$
|
(15
|
)
|
$
|
(13
|
)
|
|||
|
Due to securities actively marketed for sale
|
(9
|
)
|
(13
|
)
|
0
|
|
||||||
|
Due to credit or adverse conditions of the respective issuer(1)
|
(26
|
)
|
(70
|
)
|
(65
|
)
|
||||||
|
OTTI losses on fixed maturities recognized in earnings(2)
|
(63
|
)
|
(98
|
)
|
(78
|
)
|
||||||
|
Net gains (losses) on sales and maturities(6)
|
3
|
|
271
|
|
127
|
|
||||||
|
Fixed maturity securities(3)
|
(60
|
)
|
173
|
|
49
|
|
||||||
|
OTTI losses on equity securities recognized in earnings(4)
|
0
|
|
(4
|
)
|
(13
|
)
|
||||||
|
Net gains (losses) on sales and maturities
|
0
|
|
505
|
|
262
|
|
||||||
|
Equity securities(5)
|
0
|
|
501
|
|
249
|
|
||||||
|
Commercial mortgage and other loans
|
(6
|
)
|
0
|
|
1
|
|
||||||
|
Derivative instruments
|
193
|
|
(128
|
)
|
162
|
|
||||||
|
OTTI losses on other invested assets recognized in earnings(7)
|
(1
|
)
|
(14
|
)
|
(28
|
)
|
||||||
|
Other net gains (losses)
|
4
|
|
2
|
|
1
|
|
||||||
|
Other
|
3
|
|
(12
|
)
|
(27
|
)
|
||||||
|
Subtotal — Closed Block Division
|
130
|
|
534
|
|
434
|
|
||||||
|
Consolidated PFI realized investment gains (losses), net
|
$
|
1,977
|
|
$
|
432
|
|
$
|
2,194
|
|
|||
111
__________
|
(1)
|
Represents circumstances where we believe credit events or other adverse conditions of the respective issuers have caused or will lead to a deficiency in the contractual cash flows related to the investment. The amount of the impairment recorded in earnings is the difference between the amortized cost of the debt security and the net present value of its projected future cash flows discounted at the effective interest rate implicit in the debt security prior to impairment.
|
|
(2)
|
Excludes the portion of OTTI recorded in OCI, representing any difference between the fair value of the impaired debt security and the net present value of its projected future cash flows at the time of impairment.
|
|
(3)
|
Includes fixed maturity securities classified as available-for-sale and held-to-maturity and excludes fixed maturity securities classified as trading.
|
|
(4)
|
Effective January 1, 2018, the identification of OTTI for equity securities is no longer needed as all of these investments are now measured at fair value with changes in fair value reported in earnings.
|
|
(5)
|
Effective January 1, 2018, realized gains (losses) on equity securities are recorded within “Other income (loss).”
|
|
(6)
|
During 2016, fixed maturity prepayment fees and call premiums were reclassified to “Net investment income.” Prior periods were not restated. The impact of this change was immaterial.
|
|
(7)
|
Primarily includes OTTI related to investments in LPs/LLCs and real estate held through direct ownership.
|
|
(8)
|
Includes “realized investment gains (losses), net” of our investment management operations.
|
2018 to 2017 Annual Comparison
Net gains on sales and maturities of fixed maturity securities were $504 million and $577 million for the years ended December 31, 2018 and 2017, respectively, primarily driven by the impact of foreign currency exchange rate movements of U.S. and Australian dollar-denominated securities that matured or were sold within our International Insurance segment.
Net realized gains on derivative instruments of $1,249 million, for the year ended December 31, 2018, primarily included:
|
•
|
$575 million of gains on foreign currency hedges due to U.S. dollar and Japanese yen appreciation;
|
|
•
|
$529 million of gains on product-related embedded derivatives and related hedge positions associated with certain variable annuity contracts;
|
|
•
|
$363 million of gains on capital hedges due to decreases in equity indices;
|
|
•
|
$150 million of gains for fees earned on fee-based synthetic GICs; and
|
|
•
|
$362 million of losses on interest rate derivatives due to increases in swap and U.S. Treasury rates.
|
Net realized losses on derivative instruments of $1,061 million, for the year ended December 31, 2017, primarily included:
|
•
|
$869 million of losses on product-related embedded derivatives and related hedge positions associated with certain variable annuity contracts;
|
|
•
|
$462 million of losses on foreign currency hedges due to U.S. dollar depreciation;
|
|
•
|
$350 million of losses on capital hedges due to increases in equity indices;
|
|
•
|
$370 million of gains on interest rate derivatives due to decreases in long-term interest rates;
|
|
•
|
$152 million of gains for fees earned on fee-based synthetic GICs; and
|
|
•
|
$26 million of gains on foreign currency hedges due to Japanese yen appreciation.
|
For a discussion of living benefit guarantees and related hedge positions in our Individual Annuities segment, see “—Results of Operations by Segment—U.S. Individual Solutions Division—Individual Annuities” above.
Related adjustments include the portions of “Realized investment gains (losses), net” that are included in adjusted operating income and the portions of “Other income (loss)” and “Net investment income” that are excluded from adjusted operating income. These adjustments are made to arrive at “Realized investment gains (losses), net, and related adjustments” which are excluded from adjusted operating income. Results for the years ended December 31, 2018 and 2017 reflected related adjustments of net negative $1,228 million and $500 million, respectively. Both periods’ results were driven by settlements and changes in values of interest rate and currency derivatives. 2018 results also include the change in fair value of equity securities recorded within “Other income (loss).”
Charges that relate to “Realized investment gains (losses), net” are also excluded from adjusted operating income and may be reflected as net charges or net benefits. Results for the year ended December 31, 2018 reflected a net related charge of $316 million, compared to a net related benefit of $544 million for the year ended December 31, 2017. Both periods’ results were driven by the impact of derivative activity on the amortization of DAC and other costs and certain policyholder reserves.
2017 to 2016 Annual Comparison
Net realized gains on sales and maturities of fixed maturity securities were $577 million and $761 million for the years ended December 31, 2017 and 2016, respectively, primarily driven by sales and maturities of U.S. dollar-denominated securities within International Insurance segment.
Net realized gains on derivative instruments of $1,011 million, for the year ended December 31, 2016, primarily included:
112
|
•
|
$523 million of gains on product-related embedded derivatives and related hedge positions associated with certain variable annuity contracts;
|
|
•
|
$364 million of gains on foreign currency hedges due to U.S. dollar and Japanese yen appreciation; and
|
|
•
|
$157 million of gains for fees earned on fee-based synthetic GICs.
|
For a discussion of living benefit guarantees and related hedge positions in our Individual Annuities segment, see “—Results of Operations by Segment—U.S. Individual Solutions Division—Individual Annuities” above.
Related adjustments for the years ended December 31, 2017 and 2016 included net negative related adjustments of $500 million and $771 million, respectively. Both periods’ results were primarily driven by settlements and changes in values of interest rate and currency derivatives.
Related charges for the year ended December 31, 2017 included a net related benefit of $544 million, compared to net related charge of $466 million for the year ended December 31, 2016. Both periods’ results were driven by the impact of derivative activity on the amortization of DAC and other costs and certain policyholder reserves.
Impairments
The level of OTTI generally reflects economic conditions and is expected to increase when economic conditions worsen and to decrease when economic conditions improve. Historically, the causes of OTTI have been specific to each individual issuer and have not directly resulted in impairments to other securities within the same industry or geographic region. We may also realize additional credit and interest rate-related losses through sales of investments pursuant to our credit risk and portfolio management objectives.
We maintain separate monitoring processes for public and private fixed maturities and create watch lists to highlight securities that require special scrutiny and management. For private placements, our credit and portfolio management processes help ensure prudent controls over valuation and management. We have separate pricing and authorization processes to establish “checks and balances” for new investments. We apply consistent standards of credit analysis and due diligence for all transactions, whether they originate through our own in-house origination staff or through agents. Our regional offices closely monitor the portfolios in their regions. We set all valuation standards centrally, and we assess the fair value of all investments quarterly. Our public and private fixed maturity investment managers formally review all public and private fixed maturity holdings on a quarterly basis and more frequently when necessary to identify potential credit deterioration whether due to ratings downgrades, unexpected price variances and/or company or industry-specific concerns.
For LPs/LLCs accounted for using the equity method, the carrying value of these investments is written down or impaired
to fair value when a decline in value is considered to be other-than-temporary. For additional information regarding our OTTI
policies, see Note 2 to the Consolidated Financial Statements.
Retail-Related Investments
As of
December 31, 2018
, PFI excluding the Closed Block division had retail-related investments of approximately
$14 billion
consisting primarily of
$6 billion
of corporate fixed maturities of which
88%
were considered investment grade;
$7 billion
of commercial mortgage loans with a weighted-average loan-to-value ratio of approximately
51%
and weighted-average debt service coverage ratio of
2.45
times; and
$1 billion
of real estate held through direct ownership and real estate-related LPs/LLCs.
In addition, we held approximately
$9 billion
of commercial mortgage-backed securities, of which approximately
84%
and
16%
were rated AAA (super-senior) and AA, respectively, and comprised of diversified collateral pools. Approximately
30%
of the collateral pools were comprised of retail-related investments, with no pools solely collateralized by retail-related investments. For additional information regarding commercial mortgage-backed securities, see “—Fixed Maturity Securities—Fixed Maturity Securities Credit Quality” below.
General Account Investments of PFI excluding Closed Block Division
In the following sections, we provide details about our investment portfolio, excluding investments held in the Closed Block division. We believe the details of the composition of our investment portfolio excluding the Closed Block division are most relevant to an understanding of our operations that are pertinent to investors in Prudential Financial, Inc. because substantially all Closed Block division assets support obligations and liabilities relating to the Closed Block policies only. See Note 14 to the Consolidated Financial Statements for further information on the Closed Block.
Fixed Maturity Securities
113
In the following sections, we provide details about our fixed maturity securities portfolio, which excludes fixed maturity securities classified as assets supporting experienced-rated contractholder liabilities and classified as trading.
Fixed Maturity Securities by Contractual Maturity Date
The following table sets forth the breakdown of the amortized cost of our fixed maturity securities portfolio by contractual maturity, as of the date indicated:
|
|
December 31, 2018
|
||||||
|
|
Amortized
Cost
|
% of Total
|
|||||
|
|
($ in millions)
|
||||||
|
Corporate & government securities:
|
|||||||
|
Maturing in 2019
|
$
|
7,540
|
|
2.6
|
%
|
||
|
Maturing in 2020
|
12,378
|
|
4.2
|
|
|||
|
Maturing in 2021
|
11,672
|
|
4.0
|
|
|||
|
Maturing in 2022
|
10,316
|
|
3.5
|
|
|||
|
Maturing in 2023
|
12,705
|
|
4.3
|
|
|||
|
Maturing in 2024
|
11,805
|
|
4.0
|
|
|||
|
Maturing in 2025
|
11,871
|
|
4.0
|
|
|||
|
Maturing in 2026
|
12,125
|
|
4.1
|
|
|||
|
Maturing in 2027
|
13,044
|
|
4.4
|
|
|||
|
Maturing in 2028
|
10,576
|
|
3.6
|
|
|||
|
Maturing in 2029
|
7,423
|
|
2.5
|
|
|||
|
Maturing in 2030 and beyond
|
151,693
|
|
51.4
|
|
|||
|
Total corporate & government securities
|
273,148
|
|
92.6
|
|
|||
|
Asset-backed securities
|
9,803
|
|
3.3
|
|
|||
|
Commercial mortgage-backed securities
|
8,953
|
|
3.0
|
|
|||
|
Residential mortgage-backed securities
|
3,205
|
|
1.1
|
|
|||
|
Total fixed maturities
|
$
|
295,109
|
|
100.0
|
%
|
||
Fixed Maturity Securities and Unrealized Gains and Losses by Industry Category
The following table sets forth the composition of the portion of our fixed maturity securities portfolio by industry category attributable to PFI excluding the Closed Block division and the associated gross unrealized gains and losses, as of the dates indicated:
114
|
|
December 31, 2018
|
December 31, 2017
|
|||||||||||||||||||||||||||||
|
Industry(1)
|
Amortized
Cost
|
Gross
Unrealized
Gains(2)
|
Gross
Unrealized
Losses(2)
|
Fair
Value
|
Amortized
Cost
|
Gross
Unrealized
Gains(2)
|
Gross
Unrealized
Losses(2)
|
Fair
Value
|
|||||||||||||||||||||||
|
|
(in millions)
|
||||||||||||||||||||||||||||||
|
Corporate securities:
|
|||||||||||||||||||||||||||||||
|
Finance
|
$
|
29,831
|
|
$
|
726
|
|
$
|
724
|
|
$
|
29,833
|
|
$
|
25,906
|
|
$
|
1,646
|
|
$
|
84
|
|
$
|
27,468
|
|
|||||||
|
Consumer non-cyclical
|
24,136
|
|
1,172
|
|
748
|
|
24,560
|
|
24,812
|
|
2,359
|
|
140
|
|
27,031
|
|
|||||||||||||||
|
Utility
|
22,179
|
|
1,073
|
|
624
|
|
22,628
|
|
22,265
|
|
2,196
|
|
118
|
|
24,343
|
|
|||||||||||||||
|
Capital goods
|
11,623
|
|
561
|
|
386
|
|
11,798
|
|
11,232
|
|
1,076
|
|
52
|
|
12,256
|
|
|||||||||||||||
|
Consumer cyclical
|
11,001
|
|
429
|
|
330
|
|
11,100
|
|
11,011
|
|
972
|
|
77
|
|
11,906
|
|
|||||||||||||||
|
Foreign agencies
|
5,946
|
|
785
|
|
91
|
|
6,640
|
|
5,619
|
|
996
|
|
17
|
|
6,598
|
|
|||||||||||||||
|
Energy
|
11,753
|
|
524
|
|
553
|
|
11,724
|
|
10,621
|
|
998
|
|
137
|
|
11,482
|
|
|||||||||||||||
|
Communications
|
6,163
|
|
455
|
|
234
|
|
6,384
|
|
6,266
|
|
782
|
|
77
|
|
6,971
|
|
|||||||||||||||
|
Basic industry
|
5,431
|
|
238
|
|
158
|
|
5,511
|
|
6,061
|
|
590
|
|
37
|
|
6,614
|
|
|||||||||||||||
|
Transportation
|
8,633
|
|
428
|
|
225
|
|
8,836
|
|
8,179
|
|
777
|
|
28
|
|
8,928
|
|
|||||||||||||||
|
Technology
|
3,855
|
|
155
|
|
99
|
|
3,911
|
|
4,373
|
|
318
|
|
33
|
|
4,658
|
|
|||||||||||||||
|
Industrial other
|
3,764
|
|
151
|
|
154
|
|
3,761
|
|
3,866
|
|
348
|
|
23
|
|
4,191
|
|
|||||||||||||||
|
Total corporate securities
|
144,315
|
|
6,697
|
|
4,326
|
|
146,686
|
|
140,211
|
|
13,058
|
|
823
|
|
152,446
|
|
|||||||||||||||
|
Foreign government(3)
|
97,087
|
|
16,942
|
|
301
|
|
113,728
|
|
88,539
|
|
15,848
|
|
291
|
|
104,096
|
|
|||||||||||||||
|
Residential mortgage-backed(4)
|
3,205
|
|
120
|
|
31
|
|
3,294
|
|
3,801
|
|
191
|
|
10
|
|
3,982
|
|
|||||||||||||||
|
Asset-backed
|
9,803
|
|
122
|
|
62
|
|
9,863
|
|
8,389
|
|
214
|
|
7
|
|
8,596
|
|
|||||||||||||||
|
Commercial mortgage-backed
|
8,953
|
|
87
|
|
86
|
|
8,954
|
|
8,850
|
|
188
|
|
64
|
|
8,974
|
|
|||||||||||||||
|
U.S. Government
|
22,290
|
|
2,563
|
|
569
|
|
24,284
|
|
16,591
|
|
3,005
|
|
306
|
|
19,290
|
|
|||||||||||||||
|
State & Municipal
|
9,456
|
|
607
|
|
63
|
|
10,000
|
|
8,945
|
|
1,016
|
|
6
|
|
9,955
|
|
|||||||||||||||
|
Total(5)
|
$
|
295,109
|
|
$
|
27,138
|
|
$
|
5,438
|
|
$
|
316,809
|
|
$
|
275,326
|
|
$
|
33,520
|
|
$
|
1,507
|
|
$
|
307,339
|
|
|||||||
__________
|
(1)
|
Investment data has been classified based on standard industry categorizations for domestic public holdings and similar classifications by industry for all other holdings.
|
|
(2)
|
Includes
$359 million
of gross unrealized gains and less than
$1 million
of gross unrealized losses, as of
December 31, 2018
, compared to
$381 million
of gross unrealized gains and less than
$1 million
of gross unrealized losses, as of
December 31, 2017
, on securities classified as held-to-maturity.
|
|
(3)
|
As of
December 31, 2018
and
2017
, based on amortized cost,
76%
and
75%
, respectively, represent Japanese government bonds held by our Japanese insurance operations with no other individual country representing more than
11%
of the balance.
|
|
(4)
|
As of both
December 31, 2018
and
2017
, based on amortized cost, more than
99%
were rated A or higher.
|
|
(5)
|
Excluded from the table above are securities held outside the general account in other entities and operations. For additional information regarding investments held outside the general account, see “—Invested Assets of Other Entities and Operations” below.
|
The decrease in net unrealized gains from
December 31, 2017
to
December 31, 2018
was primarily due to an increase in U.S. interest rates and credit spread widening.
Fixed Maturity Securities Credit Quality
The Securities Valuation Office (“SVO”) of the National Association of Insurance Commissioners (“NAIC”) evaluates the investments of insurers for statutory reporting purposes and assigns fixed maturity securities to one of six categories called “NAIC Designations.” In general, NAIC Designations of “1” highest quality, or “2” high quality, include fixed maturities considered investment grade, which include securities rated Baa3 or higher by Moody's Investor Service, Inc. (“Moody’s”) or BBB- or higher by Standard & Poor's Rating Services (“S&P”). NAIC Designations of “3” through “6” generally include fixed maturities referred to as below investment grade, which include securities rated Ba1 or lower by Moody’s and BB+ or lower by S&P. The NAIC Designations for commercial mortgage-backed securities and non-agency residential mortgage-backed securities, including our asset-backed securities collateralized by sub-prime mortgages, are based on security level expected losses as modeled by an independent third-party (engaged by the NAIC) and the statutory carrying value of the security, including any purchase discounts or impairment charges previously recognized.
115
As a result of time lags between the funding of investments, the finalization of legal documents, and the completion of the SVO filing process, the fixed maturity portfolio includes certain securities that have not yet been designated by the SVO as of each balance sheet date. Pending receipt of SVO designations, the categorization of these securities by NAIC Designation is based on the expected ratings indicated by internal analysis.
Investments of our international insurance companies are not subject to NAIC guidelines. Investments of our Japanese insurance operations are regulated locally by the Financial Services Agency (“FSA”), an agency of the Japanese government. The FSA has its own investment quality criteria and risk control standards. Our Japanese insurance companies comply with the FSA’s credit quality review and risk monitoring guidelines. The credit quality ratings of the investments of our Japanese insurance companies are based on ratings assigned by nationally recognized credit rating agencies, including Moody’s and S&P, or rating equivalents based on ratings assigned by Japanese credit ratings agencies.
The following table sets forth our fixed maturity portfolio by NAIC Designation or equivalent ratings attributable to PFI excluding the Closed Block division, as of the dates indicated:
|
December 31, 2018
|
December 31, 2017
|
|||||||||||||||||||||||||||||||
|
NAIC Designation(1)(2)
|
Amortized
Cost
|
Gross
Unrealized
Gains(3)
|
Gross
Unrealized
Losses(3)(4)
|
Fair
Value
|
Amortized
Cost
|
Gross
Unrealized
Gains(3)
|
Gross
Unrealized
Losses(3)(4)
|
Fair
Value
|
||||||||||||||||||||||||
|
|
(in millions)
|
|||||||||||||||||||||||||||||||
|
1
|
$
|
222,290
|
|
$
|
24,138
|
|
$
|
2,568
|
|
$
|
243,860
|
|
$
|
207,791
|
|
$
|
27,550
|
|
$
|
925
|
|
$
|
234,416
|
|
||||||||
|
2
|
55,768
|
|
2,267
|
|
1,999
|
|
56,036
|
|
50,751
|
|
4,560
|
|
335
|
|
54,976
|
|
||||||||||||||||
|
Subtotal High or Highest Quality Securities(5)
|
278,058
|
|
26,405
|
|
4,567
|
|
299,896
|
|
258,542
|
|
32,110
|
|
1,260
|
|
289,392
|
|
||||||||||||||||
|
3
|
10,149
|
|
330
|
|
408
|
|
10,071
|
|
10,201
|
|
670
|
|
79
|
|
10,792
|
|
||||||||||||||||
|
4
|
5,254
|
|
291
|
|
368
|
|
5,177
|
|
4,681
|
|
501
|
|
105
|
|
5,077
|
|
||||||||||||||||
|
5
|
1,395
|
|
99
|
|
77
|
|
1,417
|
|
1,666
|
|
225
|
|
57
|
|
1,834
|
|
||||||||||||||||
|
6
|
253
|
|
13
|
|
18
|
|
248
|
|
236
|
|
14
|
|
6
|
|
244
|
|
||||||||||||||||
|
Subtotal Other Securities(6)(7)
|
17,051
|
|
733
|
|
871
|
|
16,913
|
|
16,784
|
|
1,410
|
|
247
|
|
17,947
|
|
||||||||||||||||
|
Total fixed maturities
|
$
|
295,109
|
|
$
|
27,138
|
|
$
|
5,438
|
|
$
|
316,809
|
|
$
|
275,326
|
|
$
|
33,520
|
|
$
|
1,507
|
|
$
|
307,339
|
|
||||||||
__________
|
(1)
|
Reflects equivalent ratings for investments of the international insurance operations.
|
|
(2)
|
Includes, as of
December 31, 2018
and
2017
,
1,744
securities with amortized cost of
$9,079 million
(fair value,
$9,135 million
) and
982
securities with amortized cost of
$6,022 million
(fair value,
$6,217 million
), respectively, that have been categorized based on expected NAIC Designations pending receipt of SVO ratings.
|
|
(3)
|
Includes
$359 million
of gross unrealized gains and less than
$1 million
of gross unrealized losses, as of
December 31, 2018
, compared to
$381 million
of gross unrealized gains and less than
$1 million
of gross unrealized losses, as of
December 31, 2017
, on securities classified as held-to-maturity.
|
|
(4)
|
As of
December 31, 2018
, includes gross unrealized losses of
$591 million
on public fixed maturities and
$280 million
on private fixed maturities considered to be other than high or highest quality and, as of
December 31, 2017
, includes gross unrealized losses of
$156 million
on public fixed maturities and
$91 million
on private fixed maturities considered to be other than high or highest quality.
|
|
(5)
|
On an amortized cost basis, as of
December 31, 2018
, includes
$238,824 million
of public fixed maturities and
$39,234 million
of private fixed maturities and, as of
December 31, 2017
, includes
$222,763 million
of public fixed maturities and
$35,779 million
of private fixed maturities.
|
|
(6)
|
On an amortized cost basis, as of
December 31, 2018
, includes
$10,588 million
of public fixed maturities and
$6,463 million
of private fixed maturities and, as of
December 31, 2017
, includes
$9,975 million
of public fixed maturities and
$6,809 million
of private fixed maturities.
|
|
(7)
|
On an amortized cost basis, as of
December 31, 2018
, securities considered below investment grade based on lowest of external rating agency ratings, total
$19,154 million
, or approximately
6%
of the total fixed maturities, and include securities considered high or highest quality by the NAIC based on the rules described above.
|
Asset-Backed and Commercial Mortgage-Backed Securities
116
The following table sets forth information pertaining to asset-backed and commercial mortgage-backed securities within our fixed maturity available-for-sale portfolio attributable to PFI excluding the Closed Block division:
|
December 31, 2018
|
December 31, 2017
|
||||||||||||||||||||||||||||||
|
Asset-Backed
Securities(2)
|
Commercial Mortgage-Backed Securities(3)
|
Asset-Backed
Securities(2)
|
Commercial Mortgage-Backed Securities(3)
|
||||||||||||||||||||||||||||
|
Lowest Rating Agency Rating(1)
|
Amortized Cost
|
Fair Value
|
Amortized Cost
|
Fair Value
|
Amortized Cost
|
Fair Value
|
Amortized Cost
|
Fair Value
|
|||||||||||||||||||||||
|
(in millions)
|
|||||||||||||||||||||||||||||||
|
AAA
|
$
|
9,188
|
|
$
|
9,151
|
|
$
|
7,523
|
|
$
|
7,528
|
|
$
|
7,613
|
|
$
|
7,686
|
|
$
|
8,002
|
|
$
|
8,125
|
|
|||||||
|
AA
|
405
|
|
430
|
|
1,415
|
|
1,410
|
|
419
|
442
|
816
|
818
|
|||||||||||||||||||
|
A
|
30
|
|
36
|
|
6
|
|
7
|
|
40
|
46
|
23
|
22
|
|||||||||||||||||||
|
BBB
|
15
|
|
15
|
|
9
|
|
9
|
|
42
|
43
|
9
|
9
|
|||||||||||||||||||
|
BB and below
|
165
|
|
231
|
|
0
|
|
0
|
|
275
|
379
|
0
|
0
|
|||||||||||||||||||
|
Total(4)
|
$
|
9,803
|
|
$
|
9,863
|
|
$
|
8,953
|
|
$
|
8,954
|
|
$
|
8,389
|
|
$
|
8,596
|
|
$
|
8,850
|
|
$
|
8,974
|
|
|||||||
__________
|
(1)
|
The table above provides ratings as assigned by nationally recognized rating agencies as of
December 31, 2018
, including S&P, Moody’s, Fitch Ratings Inc. (“Fitch”) and Morningstar.
|
|
(2)
|
Includes collateralized loan obligations, credit-tranched securities collateralized by sub-prime mortgages, auto loans, credit cards, education loans and other asset types.
|
|
(3)
|
As of
December 31, 2018
and
2017
, based on amortized cost,
96%
and
95%
, respectively, were securities with vintages of 2013 or later.
|
|
(4)
|
Excludes fixed maturity securities classified as “Assets supporting experience-rated contractholder liabilities” and “Fixed maturities, trading”, as well as securities held outside the general account in other entities and operations.
|
Included in “Asset-backed securities” above are investments in collateralized loan obligations (“CLOs”). The following table sets forth information pertaining to these investments in CLOs within our fixed maturity available-for-sale portfolio attributable to PFI excluding the Closed Block division:
|
December 31, 2018
|
December 31, 2017
|
||||||||||||||
|
Collateralized Loan Obligations
|
|||||||||||||||
|
Lowest Rating Agency Rating(1)
|
Amortized Cost
|
Fair Value
|
Amortized Cost
|
Fair Value
|
|||||||||||
|
(in millions)
|
|||||||||||||||
|
AAA
|
$
|
7,355
|
|
$
|
7,318
|
|
$
|
6,609
|
|
$
|
6,679
|
|
|||
|
AA
|
0
|
|
0
|
|
0
|
|
0
|
|
|||||||
|
A
|
0
|
|
0
|
|
0
|
|
0
|
|
|||||||
|
BBB
|
0
|
|
0
|
|
0
|
|
0
|
|
|||||||
|
BB and below
|
0
|
|
0
|
|
0
|
|
0
|
|
|||||||
|
Total(2)
|
$
|
7,355
|
|
$
|
7,318
|
|
$
|
6,609
|
|
$
|
6,679
|
|
|||
__________
|
(1)
|
The table above provides ratings as assigned by nationally recognized rating agencies as of
December 31, 2018
, including S&P, Moody’s, Fitch and Morningstar.
|
|
(2)
|
Excludes fixed maturity securities classified as “Assets supporting experience-rated contractholder liabilities” and “Fixed maturities, trading”, as well as securities held outside the general account in other entities and operations.
|
Assets Supporting Experience-Rated Contractholder Liabilities
For information regarding the composition of “Assets supporting experience-rated contractholder liabilities,” see Note 3 to the Consolidated Financial Statements.
Commercial Mortgage and Other Loans
Investment Mix
The following table sets forth the composition of our commercial mortgage and other loans portfolio attributable to PFI excluding the Closed Block division, as of the dates indicated:
117
|
|
December 31, 2018
|
December 31, 2017
|
||||||
|
|
(in millions)
|
|||||||
|
Commercial mortgage and agricultural property loans
|
$
|
49,524
|
|
$
|
45,623
|
|
||
|
Uncollateralized loans
|
658
|
|
661
|
|
||||
|
Residential property loans
|
158
|
|
196
|
|
||||
|
Other collateralized loans
|
17
|
|
5
|
|
||||
|
Total recorded investment gross of allowance(1)
|
50,357
|
|
46,485
|
|
||||
|
Allowance for credit losses
|
(106
|
)
|
(91
|
)
|
||||
|
Total net commercial mortgage and other loans(2)
|
$
|
50,251
|
|
$
|
46,394
|
|
||
__________
|
(1)
|
As a percentage of recorded investment gross of allowance, more than
99%
of these assets were current as of both
December 31, 2018
and
2017
.
|
|
(2)
|
Excluded from the table above are commercial mortgage and other loans held outside the general account in other entities and operations. For additional information regarding commercial mortgage and other loans held outside the general account, see “—Invested Assets of Other Entities and Operations” below.
|
We originate commercial mortgage and agricultural property loans using a dedicated investment staff through our various regional offices in the U.S. and international offices primarily in London and Tokyo. All loans are underwritten consistently to our standards using a proprietary quality rating system that has been developed from our experience in real estate and mortgage lending.
Uncollateralized loans primarily represent corporate loans which do not meet the definition of a security under authoritative accounting guidance.
Residential property loans primarily include Japanese recourse loans. Upon default of these recourse loans, we can make a claim against the personal assets of the property owner, in addition to the mortgaged property. These loans are also backed by third-party guarantors.
Other collateralized loans include consumer loans.
Composition of Commercial Mortgage and Agricultural Property Loans
Our commercial mortgage and agricultural property loan portfolio strategy emphasizes diversification by property type and geographic location. The following tables set forth the breakdown of the gross carrying values of commercial mortgage and agricultural property loans attributable to PFI excluding the Closed Block division by geographic region and property type, as of the dates indicated:
118
|
|
December 31, 2018
|
December 31, 2017
|
||||||||||||
|
|
Gross
Carrying
Value
|
% of
Total
|
Gross
Carrying
Value
|
% of
Total
|
||||||||||
|
|
($ in millions)
|
|||||||||||||
|
Commercial mortgage and agricultural property loans by region:
|
||||||||||||||
|
U.S. Regions(1):
|
||||||||||||||
|
Pacific
|
$
|
16,553
|
|
33.4
|
%
|
$
|
14,965
|
|
32.8
|
%
|
||||
|
South Atlantic
|
8,633
|
|
17.4
|
|
8,666
|
|
19.0
|
|
||||||
|
Middle Atlantic
|
6,088
|
|
12.3
|
|
5,776
|
|
12.7
|
|
||||||
|
East North Central
|
2,813
|
|
5.7
|
|
2,440
|
|
5.3
|
|
||||||
|
West South Central
|
5,044
|
|
10.2
|
|
4,671
|
|
10.2
|
|
||||||
|
Mountain
|
2,508
|
|
5.0
|
|
2,027
|
|
4.5
|
|
||||||
|
New England
|
1,879
|
|
3.8
|
|
1,774
|
|
3.9
|
|
||||||
|
West North Central
|
476
|
|
1.0
|
|
641
|
|
1.4
|
|
||||||
|
East South Central
|
595
|
|
1.2
|
|
612
|
|
1.3
|
|
||||||
|
Subtotal-U.S.
|
44,589
|
|
90.0
|
|
41,572
|
|
91.1
|
|
||||||
|
Europe
|
3,077
|
|
6.2
|
|
2,528
|
|
5.5
|
|
||||||
|
Asia
|
733
|
|
1.5
|
|
619
|
|
1.4
|
|
||||||
|
Other
|
1,125
|
|
2.3
|
|
904
|
|
2.0
|
|
||||||
|
Total commercial mortgage and agricultural property loans
|
$
|
49,524
|
|
100.0
|
%
|
$
|
45,623
|
|
100.0
|
%
|
||||
__________
|
(1)
|
Regions as defined by the United States Census Bureau.
|
|
|
December 31, 2018
|
December 31, 2017
|
||||||||||||
|
|
Gross
Carrying
Value
|
% of
Total
|
Gross
Carrying
Value
|
% of
Total
|
||||||||||
|
|
($ in millions)
|
|||||||||||||
|
Commercial mortgage and agricultural property loans by property type:
|
||||||||||||||
|
Industrial
|
$
|
10,490
|
|
21.2
|
%
|
$
|
8,444
|
|
18.5
|
%
|
||||
|
Retail
|
6,693
|
|
13.5
|
|
6,595
|
|
14.5
|
|
||||||
|
Office
|
10,971
|
|
22.1
|
|
10,020
|
|
22.0
|
|
||||||
|
Apartments/Multi-Family
|
13,818
|
|
27.9
|
|
12,993
|
|
28.5
|
|
||||||
|
Other
|
3,255
|
|
6.6
|
|
3,336
|
|
7.3
|
|
||||||
|
Agricultural properties
|
2,710
|
|
5.5
|
|
2,526
|
|
5.5
|
|
||||||
|
Hospitality
|
1,587
|
|
3.2
|
|
1,709
|
|
3.7
|
|
||||||
|
Total commercial mortgage and agricultural property loans
|
$
|
49,524
|
|
100.0
|
%
|
$
|
45,623
|
|
100.0
|
%
|
||||
Loan-to-value and debt service coverage ratios are measures commonly used to assess the quality of commercial mortgage and agricultural property loans. The loan-to-value ratio compares the amount of the loan to the fair value of the underlying property collateralizing the loan and is commonly expressed as a percentage. A loan-to-value ratio less than 100% indicates an excess of collateral value over the loan amount. Loan-to-value ratios greater than 100% indicate that the loan amount exceeds the collateral value. The debt service coverage ratio compares a property’s net operating income to its debt service payments. Debt service coverage ratios less than 1.0 times indicate that property operations do not generate enough income to cover the loan’s current debt payments. A debt service coverage ratio greater than 1.0 times indicates an excess of net operating income over the debt service payments.
119
As of
December 31, 2018
, our commercial mortgage and agricultural property loans attributable to PFI excluding the Closed Block division had a weighted-average debt service coverage ratio of
2.42
times and a weighted-average loan-to-value ratio of
56%
. As of
December 31, 2018
,
97%
of commercial mortgage and agricultural property loans were fixed rate loans. For those commercial mortgage and agricultural property loans that were originated in
2018
, the weighted-average debt service coverage ratio was
2.39
times, and the weighted-average loan-to-value ratio was
64%
.
The values utilized in calculating these loan-to-value ratios are developed as part of our periodic review of the commercial mortgage and agricultural property loan portfolio, which includes an internal evaluation of the underlying collateral value. Our periodic review also includes a quality re-rating process, whereby we update the internal quality rating originally assigned at underwriting based on the proprietary quality rating system mentioned above. As discussed below, the internal quality rating is a key input in determining our allowance for credit losses.
For loans with collateral under construction, renovation or lease-up, a stabilized value and projected net operating income are used in the calculation of the loan-to-value and debt service coverage ratios. Our commercial mortgage and agricultural property loan portfolio included
$0.7 billion
and approximately
$1.0 billion
of such loans as of
December 31, 2018
and
2017
, respectively. All else being equal, these loans are inherently riskier than those collateralized by properties that have already stabilized. As of
December 31, 2018
, there were no loan-specific reserves related to these loans. In addition, these unstabilized loans are included in the calculation of our portfolio reserve as discussed below.
The following table sets forth the gross carrying value of our commercial mortgage and agricultural property loans attributable to PFI excluding the Closed Block division by loan-to-value and debt service coverage ratios, as of the date indicated:
|
|
December 31, 2018
|
|||||||||||||||
|
|
Debt Service Coverage Ratio
|
|||||||||||||||
|
|
>
1.2x
|
1.0x
to
< 1.2x
|
< 1.0x
|
Total
Commercial Mortgage and Agricultural Property
Loans
|
||||||||||||
|
Loan-to-Value Ratio
|
(in millions)
|
|||||||||||||||
|
0%-59.99%
|
$
|
26,977
|
|
$
|
607
|
|
$
|
195
|
|
$
|
27,779
|
|
||||
|
60%-69.99%
|
14,260
|
|
543
|
|
0
|
|
14,803
|
|
||||||||
|
70%-79.99%
|
5,850
|
|
621
|
|
31
|
|
6,502
|
|
||||||||
|
80% or greater
|
317
|
|
113
|
|
10
|
|
440
|
|
||||||||
|
Total commercial mortgage and agricultural property loans
|
$
|
47,404
|
|
$
|
1,884
|
|
$
|
236
|
|
$
|
49,524
|
|
||||
The following table sets forth the breakdown of our commercial mortgage and agricultural property loans attributable to PFI excluding the Closed Block division by year of origination, as of the date indicated:
|
|
December 31, 2018
|
||||||
|
Gross
Carrying
Value
|
% of
Total
|
||||||
|
Year of Origination
|
($ in millions)
|
||||||
|
2018
|
$
|
8,989
|
|
18.2
|
%
|
||
|
2017
|
7,958
|
|
16.1
|
|
|||
|
2016
|
7,028
|
|
14.2
|
|
|||
|
2015
|
6,750
|
|
13.6
|
|
|||
|
2014
|
5,998
|
|
12.1
|
|
|||
|
2013
|
5,558
|
|
11.2
|
|
|||
|
2012
|
3,009
|
|
6.1
|
|
|||
|
2011 & Prior
|
4,234
|
|
8.5
|
|
|||
|
Total commercial mortgage and agricultural property loans
|
$
|
49,524
|
|
100.0
|
%
|
||
120
Commercial Mortgage and Other Loans by Contractual Maturity Date
The following table sets forth the breakdown of our commercial mortgage and other loans portfolio by contractual maturity, as of the date indicated:
|
|
December 31, 2018
|
||||||
|
|
Gross
Carrying Value
|
% of Total
|
|||||
|
Vintage
|
($ in millions)
|
||||||
|
Maturing in 2019
|
$
|
1,415
|
|
2.8
|
%
|
||
|
Maturing in 2020
|
3,414
|
|
6.8
|
|
|||
|
Maturing in 2021
|
3,584
|
|
7.1
|
|
|||
|
Maturing in 2022
|
3,623
|
|
7.2
|
|
|||
|
Maturing in 2023
|
3,836
|
|
7.6
|
|
|||
|
Maturing in 2024
|
4,909
|
|
9.7
|
|
|||
|
Maturing in 2025
|
6,375
|
|
12.7
|
|
|||
|
Maturing in 2026
|
4,323
|
|
8.6
|
|
|||
|
Maturing in 2027
|
4,394
|
|
8.7
|
|
|||
|
Maturing in 2028
|
5,016
|
|
10.0
|
|
|||
|
Maturing in 2029
|
1,905
|
|
3.8
|
|
|||
|
Maturing in 2030 and beyond
|
7,563
|
|
15.0
|
|
|||
|
Total commercial mortgage and other loans
|
$
|
50,357
|
|
100.0
|
%
|
||
Commercial Mortgage and Other Loans Quality
The commercial mortgage and other loans portfolio is reviewed on an ongoing basis. If certain criteria are met, loans are assigned to either of the following “watch list” categories:
(1) “Closely Monitored,” which includes a variety of considerations, such as when loan metrics fall below acceptable levels, the borrower is not cooperative or has requested a material modification, or the portfolio manager has directed a change in category; or
(2) “Not in Good Standing,” which includes loans in default or with a high probability of loss of principal, such as when the loan is in the process of foreclosure or the borrower is in bankruptcy.
Our workout and special servicing professionals manage the loans on the watch list.
We establish an allowance for credit losses to provide for the risk of credit losses inherent in the lending process. The allowance includes loan-specific reserves for loans that are determined to be impaired as a result of our loan review process and a portfolio reserve for probable incurred but not specifically identified losses for loans which are not on the watch list. We define an impaired loan as a loan for which we estimate it is probable that amounts due according to the contractual terms of the loan agreement will not be collected. The loan-specific portion of the allowance for credit losses is based on our assessment as to ultimate collectability of loan principal and interest. Allowances for credit losses for an impaired loan are recorded based on the present value of expected future cash flows discounted at the loan’s effective interest rate, or based on the fair value of the collateral if the loan is collateral dependent. The portfolio reserve for incurred but not specifically identified losses considers the current credit composition of the portfolio based on the internal quality ratings mentioned above. The portfolio reserves are determined using past loan experience, including historical credit migration, loss probability and loss severity factors by property type. These factors are reviewed and updated as appropriate. The allowance for credit losses for commercial mortgage and other loans can increase or decrease from period to period based on these factors.
The following table sets forth the change in allowance for credit losses for our commercial mortgage and other loans portfolio, as of the dates indicated:
121
|
|
December 31, 2018
|
December 31, 2017
|
||||||
|
|
(in millions)
|
|||||||
|
Allowance, beginning of year
|
$
|
91
|
|
$
|
90
|
|
||
|
Addition to (release of) allowance for credit losses
|
15
|
|
1
|
|
||||
|
Charge-offs, net of recoveries
|
0
|
|
0
|
|
||||
|
Change in foreign exchange
|
0
|
|
0
|
|
||||
|
Allowance, end of period
|
$
|
106
|
|
$
|
91
|
|
||
|
Loan-specific reserve
|
$
|
11
|
|
$
|
5
|
|
||
|
Portfolio reserve
|
$
|
95
|
|
$
|
86
|
|
||
The allowance for credit losses as of
December 31, 2018
increased compared to
December 31, 2017
primarily due to additions to the loan-specific reserve from credit quality deterioration of certain loans in the portfolio.
Equity Securities
The equity securities attributable to PFI excluding the Closed Block division consist principally of investments in common and preferred stock of publicly-traded companies, as well as mutual fund shares. The following table sets forth the composition of our equity securities portfolio and the associated gross unrealized gains and losses, as of the dates indicated:
|
|
December 31, 2018
|
December 31, 2017
|
||||||||||||||||||||||||||||||
|
|
Cost
|
Gross
Unrealized
Gains
|
Gross
Unrealized
Losses
|
Fair
Value
|
Cost
|
Gross
Unrealized
Gains
|
Gross
Unrealized
Losses
|
Fair
Value
|
||||||||||||||||||||||||
|
|
(in millions)
|
|||||||||||||||||||||||||||||||
|
Mutual funds
|
$
|
769
|
|
$
|
87
|
|
$
|
13
|
|
$
|
843
|
|
$
|
778
|
|
$
|
157
|
|
$
|
0
|
|
$
|
935
|
|
||||||||
|
Other common stocks
|
2,353
|
|
751
|
|
118
|
|
2,986
|
|
2,215
|
|
1,145
|
|
30
|
|
3,330
|
|
||||||||||||||||
|
Non-redeemable preferred stocks
|
24
|
|
0
|
|
4
|
|
20
|
|
11
|
|
1
|
|
1
|
|
11
|
|
||||||||||||||||
|
Equity securities, at fair value(1)(2)
|
$
|
3,146
|
|
$
|
838
|
|
$
|
135
|
|
$
|
3,849
|
|
$
|
3,004
|
|
$
|
1,303
|
|
$
|
31
|
|
$
|
4,276
|
|
||||||||
|
(1)
|
Amounts presented exclude investments in private equity and hedge funds and other investments which are reported in “Other invested assets.”
|
|
(2)
|
Prior period amounts have been reclassified to conform to current period presentation. For additional information, see Note 2 to the Consolidated Financial Statements.
|
The net change in unrealized gains (losses) from equity securities attributable to PFI excluding Closed Block division still held at period end, recorded within “Other income (loss),” was $(569) million as of
December 31, 2018
.
Other Invested Assets
The following table sets forth the composition of “Other invested assets” attributable to PFI excluding the Closed Block division, as of the dates indicated:
122
|
|
December 31, 2018
|
December 31, 2017
|
||||||
|
(in millions)
|
||||||||
|
LPs/LLCs:
|
||||||||
|
Equity method:
|
||||||||
|
Private equity
|
$
|
2,318
|
|
$
|
2,067
|
|
||
|
Hedge funds
|
836
|
|
400
|
|
||||
|
Real estate-related
|
544
|
|
268
|
|
||||
|
Subtotal equity method
|
3,698
|
|
2,735
|
|
||||
|
Fair value:
|
||||||||
|
Private equity
|
938
|
|
731
|
|
||||
|
Hedge funds
|
1,256
|
|
1,361
|
|
||||
|
Real estate-related
|
44
|
|
63
|
|
||||
|
Subtotal fair value(1)
|
2,238
|
|
2,155
|
|
||||
|
Total LPs/LLCs
|
5,936
|
|
4,890
|
|
||||
|
Real estate held through direct ownership(2)
|
1,777
|
|
1,875
|
|
||||
|
Derivative instruments
|
42
|
|
113
|
|
||||
|
Other(3)
|
652
|
|
632
|
|
||||
|
Total other invested assets(4)
|
$
|
8,407
|
|
$
|
7,510
|
|
||
__________
|
(1)
|
As of
December 31, 2017
,
$794 million
was accounted for using the cost method.
|
|
(2)
|
As of
December 31, 2018
and
2017
, real estate held through direct ownership had mortgage debt of
$776 million
and
$799 million
, respectively.
|
|
(3)
|
Primarily includes leveraged leases, and member and activity stock held in the Federal Home Loan Banks of New York and Boston. For additional information regarding our holdings in the Federal Home Loan Banks of New York and Boston, see Note 16 to the Consolidated Financial Statements.
|
|
(4)
|
Prior period amounts have been reclassified to conform to current period presentation. For additional information, see Note 2 to the Consolidated Financial Statements.
|
Invested Assets of Other Entities and Operations
“Invested Assets of Other Entities and Operations” presented below includes investments held outside the general account and primarily represents investments associated with our investment management operations and derivative operations. Our derivative operations act on behalf of affiliates primarily to manage interest rate, foreign currency, credit and equity exposures. Assets within our investment management operations that are managed for third parties and those assets classified as “Separate account assets” on our balance sheet are not included.
|
|
December 31, 2018
|
December 31, 2017
|
||||||
|
|
(in millions)
|
|||||||
|
Fixed maturities:
|
||||||||
|
Public, available-for-sale, at fair value(1)
|
$
|
473
|
|
$
|
608
|
|
||
|
Private, available-for-sale, at fair value
|
1
|
|
1
|
|
||||
|
Fixed maturities, trading, at fair value(1)
|
1,155
|
|
1,718
|
|
||||
|
Equity securities, at fair value
|
605
|
|
574
|
|
||||
|
Commercial mortgage and other loans, at book value(2)
|
797
|
|
634
|
|
||||
|
Other invested assets(1)
|
2,803
|
|
2,704
|
|
||||
|
Short-term investments
|
43
|
|
66
|
|
||||
|
Total investments(3)
|
$
|
5,877
|
|
$
|
6,305
|
|
||
|
(1)
|
As of December 31, 2018 and 2017, balances include investments in collateralized loan obligations with fair value of $408 million and $563 million respectively.
|
|
(2)
|
Book value is generally based on unpaid principal balance, net of any allowance for credit losses, or at fair value, when the fair value option has been elected.
|
|
(3)
|
Prior period amounts have been reclassified to conform to current period presentation. For additional information, see Note 2 to the Consolidated Financial Statements.
|
123
Fixed Maturities, Trading
“Fixed maturities, trading, at fair value” are primarily related to assets associated with consolidated variable interest entities for which the Company is the investment manager. The assets of the consolidated variable interest entities are generally offset by liabilities for which the fair value option has been elected. For further information on these consolidated variable interest entities, see Note 4 to the Consolidated Financial Statements.
Commercial Mortgage and Other Loans
Our investment management operations include our commercial mortgage operations, which provide mortgage origination, investment management and servicing for our general account, institutional clients, the Federal Housing Administration and government-sponsored entities such as Fannie Mae and Freddie Mac.
The mortgage loans of our commercial mortgage operations are included in “Commercial mortgage and other loans.” Derivatives and other hedging instruments related to our commercial mortgage operations are primarily included in “Other invested assets.”
Other Invested Assets
“Other invested assets” primarily include assets of our derivative operations used to manage interest rate, foreign currency, credit and equity exposures.
Furthermore, other invested assets include strategic investments made as part of our investment management operations. We make these strategic investments in real estate, as well as fixed income, public equity and real estate securities, including controlling interests. Certain of these investments are made primarily for purposes of co-investment in our managed funds and structured products. Other strategic investments are made with the intention to sell or syndicate to investors, including our general account, or for placement in funds and structured products that we offer and manage (seed investments). As part of our investment management operations, we also make loans to our managed funds that are secured by equity commitments from investors or assets of the funds. “Other invested assets” also includes certain assets in consolidated investment funds where the Company is deemed to exercise control over the funds.
Liquidity and Capital Resources
Overview
Liquidity refers to the ability to generate sufficient cash resources to meet the payment obligations of the Company. Capital refers to the long-term financial resources available to support the operations of our businesses, fund business growth, and provide a cushion to withstand adverse circumstances. Our ability to generate and maintain sufficient liquidity and capital depends on the profitability of our businesses, general economic conditions and our access to the capital markets and the alternate sources of liquidity and capital described herein.
Effective and prudent liquidity and capital management is a priority across the organization. Management monitors the liquidity of Prudential Financial and its subsidiaries on a daily basis and projects borrowing and capital needs over a multi-year time horizon through our periodic planning process. We believe that cash flows from the sources of funds available to us are sufficient to satisfy the current liquidity requirements of Prudential Financial and its subsidiaries, including under reasonably foreseeable stress scenarios. We have a capital management framework in place that governs the allocation of capital and approval of capital uses. We also employ a Capital Protection Framework to ensure the availability of capital resources to maintain adequate capitalization on a consolidated basis for our insurance subsidiaries under various stress scenarios.
Our businesses are subject to comprehensive regulation and supervision by domestic and international regulators. These regulations currently include, or may include in the future requirements and limitations (many of which are the subject of ongoing rule-making) relating to capital, leverage, liquidity, stress-testing, overall risk management, credit exposure reporting and credit concentration. For information on these regulatory initiatives and their potential impact on us, see “Business—Regulation.”
During 2018, we took the following significant actions that impacted our liquidity and capital position:
|
•
|
We repurchased $1.5 billion of shares of our Common Stock and declared aggregate Common Stock dividends of $1.5 billion;
|
|
•
|
We issued $1.6 billion of junior subordinated notes and $1.0 billion of medium-term notes to be utilized for general corporate purposes, which included refinancing portions of our medium-term notes maturing during 2018;
|
124
|
•
|
We redeemed our $600 million 8.875% Fixed-to-Floating Rate Junior Subordinated Note due 2068;
|
|
•
|
We obtained additional financing for Regulation XXX reserves by entering into a new captive financing facility for $1.6 billion, of which $550 million was outstanding as of December 31, 2018;
|
|
•
|
We obtained additional financing for Guideline AXXX reserves by increasing an existing captive financing facility by $1 billion, for a total of $2 billion, of which $1,466 million was outstanding as of December 31, 2018; and
|
|
•
|
We entered into a yearly renewable term reinsurance agreement which resulted in a reduction in risk-based capital required to be held in our Group Insurance segment.
|
Capital
Our capital management framework is primarily based on statutory Risk-Based Capital (“RBC”) and solvency margin measures. Due to our diverse mix of businesses and applicable regulatory requirements, we apply certain refinements to the framework that are designed to more appropriately reflect risks associated with our businesses on a consistent basis across the Company.
We seek to capitalize all of our subsidiaries and businesses in accordance with their ratings targets, and we believe Prudential Financial’s capitalization and use of financial leverage are consistent with those ratings targets. Our long-term senior debt rating targets for Prudential Financial are “A” for S&P, Moody’s, and Fitch, and “a” for A.M. Best Company (“A.M. Best”). Our financial strength rating targets for our life insurance companies are “AA/Aa/AA” for S&P, Moody’s and Fitch, respectively, and “A+” for A.M. Best. Some entities may currently be rated below these targets, and not all life insurance companies are rated by each of these rating agencies. See “—Ratings” below for a description of the potential impacts of ratings downgrades.
Capital Governance
Our capital management framework is ultimately reviewed and approved by our Board. The Board has adopted a Capital Policy that authorizes our Chairman and Chief Executive Officer and Vice Chairman to approve certain capital actions on behalf of the Company and to further delegate authority with respect to capital actions to appropriate officers. Any capital commitment that exceeds the authority granted to senior management under the capital policy is separately authorized by the Board.
In addition, our Capital and Finance Committee (“CFC”) reviews the use and allocation of capital above certain threshold amounts to promote the efficient use of capital, consistent with our strategic objectives, ratings aspirations and other goals and targets. This management committee provides a multi-disciplinary due diligence review of specific initiatives or transactions requiring the use of capital, including mergers and acquisitions. The CFC also reviews our annual capital plan (and updates to this plan), as well as our capital, liquidity and financial position, borrowing plans, and related matters prior to the discussion of these items with the Board.
Capitalization
The primary components of the Company’s capitalization consist of equity and outstanding capital debt, including junior subordinated debt. As shown in the table below, as of
December 31, 2018
, the Company had
$51.1 billion
in capital, all of which was available to support the aggregate capital requirements of its divisions and its Corporate and Other operations. Based on our assessment of these businesses and operations, we believe this level of capital is consistent with our ratings targets.
|
|
December 31,
|
|||||||
|
|
2018
|
2017
|
||||||
|
|
(in millions)
|
|||||||
|
Equity(1)(2)
|
$
|
37,711
|
|
$
|
37,162
|
|
||
|
Junior subordinated debt (including hybrid securities)
|
7,568
|
|
6,622
|
|
||||
|
Other capital debt
|
5,793
|
|
5,402
|
|
||||
|
Total capital
|
$
|
51,072
|
|
$
|
49,186
|
|
||
__________
|
(1)
|
Amounts attributable to Prudential Financial, excluding AOCI.
|
|
(2)
|
Prior period amount has been restated to conform to current period presentation. See Note 1 and Note 2 to our Consolidated Financial Statements for details.
|
Insurance Regulatory Capital
We manage Prudential Insurance, The Prudential Life Insurance Company, Ltd. (“Prudential of Japan”), Gibraltar Life, and other significant insurance subsidiaries to regulatory capital levels consistent with our “AA” ratings targets. We utilize the RBC ratio as a primary measure of the capital adequacy of our domestic insurance subsidiaries and the solvency margin ratio as a primary measure of the capital adequacy of our Japanese insurance subsidiaries.
125
RBC is calculated based on statutory financial statements and risk formulas consistent with the practices of the NAIC. RBC considers, among other things, risks related to the type and quality of the invested assets, insurance-related risks associated with an insurer’s products and liabilities, interest rate risks and general business risks. RBC ratio calculations are intended to assist insurance regulators in measuring an insurer’s solvency and ability to pay future claims. The reporting of RBC measures is not intended for the purpose of ranking any insurance company or for use in connection with any marketing, advertising or promotional activities, but is available to the public.
The table below presents the RBC ratios of our most significant domestic insurance subsidiaries as of
December 31, 2017
, the most recent statutory fiscal year-end for these subsidiaries for which RBC information has been filed.
|
Ratio (1)
|
|
|
|
Prudential Insurance(2)
|
410
|
%
|
|
PALAC
|
1,034
|
%
|
|
Composite Major U.S. Insurance Subsidiaries(3)
|
529
|
%
|
__________
|
(1)
|
The RBC ratio calculations are intended to assist insurance regulators in measuring an insurer’s solvency and ability to pay future claims. The reporting of RBC measures is not intended for the purpose of ranking any insurance company or for use in connection with any marketing, advertising or promotional activities, but is available to the public.
|
|
(2)
|
Includes Prudential Retirement Insurance and Annuity Company (“PRIAC”), Pruco Life Insurance Company (“Pruco Life”), Pruco Life Insurance Company of New Jersey (“PLNJ”), which is a subsidiary of Pruco Life, and Prudential Legacy Insurance Company of New Jersey (“PLIC”).
|
|
(3)
|
Includes Prudential Insurance and its subsidiaries, as noted above, and Prudential Annuities Life Assurance Corporation (“PALAC”). Composite RBC is not reported to regulators and is based on the summation of total adjusted capital and risk charges for the included companies as determined under statutory accounting and RBC guidance to calculate a composite numerator and denominator, respectively, for purposes of calculating the composite ratio.
|
In June 2018, the Capital Adequacy Task Force of the NAIC approved revisions to the NAIC RBC framework as a result of the adoption of the Tax Act of 2017 and the corresponding reduction of the corporate tax rate from 35% to 21%. The revisions apply to the calculation of our domestic insurance life insurance companies’ RBC ratios as of December 31, 2018. While there is no impact on our ability to pay claims, the revisions to the RBC framework for the reduction of the corporate tax rate under the Tax Act of 2017 have the effect of increasing certain RBC factors, resulting in an overall decrease in insurers’ RBC ratios. Also, our statutory capital position has been adversely impacted by the increase in reserves for our Long-Term Care business resulting from our annual reviews and update of assumptions and other refinements (see “—Results of Operations by Segment—Divested and Run-off Businesses” for additional information). Although not yet filed, we expect our RBC ratios as of
December 31, 2018
to be above our “AA” financial strength target levels.
Similar to the RBC ratios that are employed by U.S. insurance regulators, regulatory authorities in the international jurisdictions in which we operate generally establish some form of minimum solvency margin requirements for insurance companies based on local statutory accounting practices. These solvency margins are a primary measure of the capital adequacy of our international insurance operations. Maintenance of our solvency margins at certain levels is also important to our competitive positioning, as in certain jurisdictions, such as Japan, these solvency margins are required to be disclosed to the public and therefore impact the public perception of an insurer’s financial strength.
The table below presents the solvency margin ratios of our most significant international insurance subsidiaries as of September 30,
2018
, the most recent date for which this information is available.
|
Ratio
|
|
|
|
Prudential of Japan consolidated(1)
|
877
|
%
|
|
Gibraltar Life consolidated(2)
|
948
|
%
|
__________
|
(1)
|
Includes Prudential Trust Co., Ltd., a subsidiary of Prudential of Japan.
|
|
(2)
|
Includes Prudential Gibraltar Financial Life Insurance Co., Ltd. (“PGFL”), a subsidiary of Gibraltar Life.
|
Although not yet filed, we expect the solvency margin ratio for each of these subsidiaries to be greater than 700% (3.5 times the regulatory required minimums) as of
December 31, 2018
.
126
All of our domestic and significant international insurance subsidiaries have capital levels that substantially exceed the minimum level required by applicable insurance regulations. Our regulatory capital levels may be affected in the future by changes to the applicable regulations, proposals for which are currently under consideration by both domestic and international insurance regulators. For further information on the calculation of RBC and solvency margin ratios, as well as regulatory minimums, see Note 18 to the Consolidated Financial Statements.
Capital Protection Framework
We employ a Capital Protection Framework (the “Framework”) to ensure that sufficient capital resources are available to maintain adequate capitalization on a consolidated basis for our insurance subsidiaries under various stress scenarios. The Framework incorporates the potential impacts from market related stresses, including equity markets, real estate, interest rates, credit losses, and foreign currency exchange rates. In evaluating these potential impacts, we assess risk holistically at the enterprise level, recognizing that our business mix may produce results that partially offset on a net basis. The Framework is integrated with our Risk Management Framework (see “—Risk Management—Risk Measurement and Monitoring” for additional information).
The Framework accommodates periodic volatility within ranges that we deem acceptable, while also providing for additional potential sources of capital, including on-balance sheet capital capacity and contingent sources of capital. We believe we currently have access to sufficient resources to maintain adequate capitalization under a range of potential stress scenarios.
Captive Reinsurance Companies
We use captive reinsurance companies to more effectively manage our reserves and capital on an economic basis and to enable the aggregation and transfer of risks. Our captive reinsurance companies assume business from affiliates only. To support the risks they assume, our captives are capitalized to a level we believe is consistent with the “AA” financial strength rating targets of our insurance subsidiaries. All of our captives are subject to internal policies governing their activities. In the normal course of business we contribute capital to the captives to support business growth and other needs. Prudential Financial has also entered into support agreements with several of the captives in connection with financing arrangements.
Our domestic life insurance subsidiaries are subject to a regulation entitled “Valuation of Life Insurance Policies Model Regulation,” commonly known as “Regulation XXX,” and a supporting guideline entitled “The Application of the Valuation of Life Insurance Policies Model Regulation,” commonly known as “Guideline AXXX.” The regulation and supporting guideline require insurers to establish statutory reserves for term and universal life insurance policies with long-term premium guarantees at a level that exceeds what our actuarial assumptions for this business would otherwise require. We use captive reinsurance companies to finance the portion of the reserves for this business that we consider to be non-economic as described below under “—Financing Activities—Subsidiary borrowings—Financing of regulatory reserves associated with domestic life insurance products.”
Shareholder Distributions
Share Repurchase Program and Shareholder Dividends
In December 2017, the Board authorized the Company to repurchase at management’s discretion up to
$1.5 billion
of its outstanding Common Stock during the period from January 1, 2018 through December 31, 2018. In December 2018, the Board authorized the Company to repurchase at management’s discretion up to
$2.0 billion
of its outstanding Common Stock during the period from January 1, 2019 through December 31, 2019. The timing and amount of share repurchases are determined by management based on market conditions and other considerations, including any increased capital needs of our businesses due to, among other things, changes in regulatory capital requirements and opportunities for growth and acquisitions. Repurchases may be executed in the open market, through derivative, accelerated repurchase and other negotiated transactions and through plans designed to comply with Rule 10b5-1(c) under The Securities Exchange Act of 1934.
The following table sets forth information about declarations of Common Stock dividends, as well as repurchases of shares of Prudential Financial’s Common Stock, for each of the quarterly periods in
2018
and for the prior four years.
|
|
Dividend Amount
|
Shares Repurchased
|
|||||||||||||
|
Quarterly period ended:
|
Per Share
|
Aggregate
|
Shares
|
Total Cost
|
|||||||||||
|
|
(in millions, except per share data)
|
||||||||||||||
|
December 31, 2018
|
$
|
0.90
|
|
$
|
376
|
|
4.1
|
|
$
|
375
|
|
||||
|
September 30, 2018
|
$
|
0.90
|
|
$
|
380
|
|
3.8
|
|
$
|
375
|
|
||||
|
June 30, 2018
|
$
|
0.90
|
|
$
|
382
|
|
3.7
|
|
$
|
375
|
|
||||
|
March 31, 2018
|
$
|
0.90
|
|
$
|
387
|
|
3.3
|
|
$
|
375
|
|
||||
127
|
|
Dividend Amount
|
Shares Repurchased
|
|||||||||||||
|
Year ended:
|
Per Share
|
Aggregate
|
Shares
|
Total Cost
|
|||||||||||
|
|
(in millions, except per share data)
|
||||||||||||||
|
December 31, 2018
|
$
|
3.60
|
|
$
|
1,525
|
|
14.9
|
|
$
|
1,500
|
|
||||
|
December 31, 2017
|
$
|
3.00
|
|
$
|
1,300
|
|
11.5
|
|
$
|
1,250
|
|
||||
|
December 31, 2016
|
$
|
2.80
|
|
$
|
1,245
|
|
25.1
|
|
$
|
2,000
|
|
||||
|
December 31, 2015
|
$
|
2.44
|
|
$
|
1,115
|
|
12.1
|
|
$
|
1,000
|
|
||||
|
December 31, 2014
|
$
|
2.17
|
|
$
|
1,005
|
|
11.6
|
|
$
|
1,000
|
|
||||
In addition, on February 6, 2019, the Board declared a cash dividend of
$1.00 per share of Common Stock, payable on March 14, 2019 to shareholders of record as of February 20, 2019.
Liquidity
The principles of our liquidity management framework are described in an enterprise-wide Liquidity Management Policy that is reviewed and approved by the Board. Liquidity management and stress testing are performed on a legal entity basis as the ability to transfer funds between subsidiaries is limited due in part to regulatory restrictions. Liquidity needs are determined through daily and quarterly cash flow forecasting at the holding company and within our operating subsidiaries. A minimum balance of highly liquid assets of at least $1.3 billion is targeted to ensure that adequate liquidity is available at Prudential Financial to cover fixed expenses in the event that we experience reduced cash flows from our operating subsidiaries at a time when access to capital markets is also not available. This targeted minimum balance is reviewed and approved annually by the Board.
We seek to mitigate the risk of having limited or no access to financing due to stressed market conditions by generally pre-funding debt in advance of maturity. We mitigate the refinancing risk associated with our debt that is used to fund operating needs by matching the term of debt with the assets financed. To ensure adequate liquidity in stress scenarios, stress testing is performed for our major operating subsidiaries. We seek to further mitigate liquidity risk by maintaining our access to alternative sources of liquidity, as discussed below.
Liquidity of Prudential Financial
The principal sources of funds available to Prudential Financial, the parent holding company, are dividends, returns of capital and loans from subsidiaries, and proceeds from debt issuances and certain stock-based compensation activity. These sources of funds may be supplemented by Prudential Financial’s access to the capital markets as well as the “—Alternative Sources of Liquidity” described below.
The primary uses of funds at Prudential Financial include servicing debt, making capital contributions and loans to subsidiaries, paying declared shareholder dividends and repurchasing outstanding shares of Common Stock executed under authority from the Board.
As of
December 31, 2018
, Prudential Financial had highly liquid assets with a carrying value totaling $6,199 million. Highly liquid assets predominantly include cash, short-term investments, U.S. Treasury securities, obligations of other U.S. government authorities and agencies, and/or foreign government bonds. We maintain an intercompany liquidity account that is designed to optimize the use of cash by facilitating the lending and borrowing of funds between Prudential Financial and its subsidiaries on a daily basis. Excluding net borrowings from this intercompany liquidity account, Prudential Financial had highly liquid assets of
$5,548 million
as of
December 31, 2018
, an increase of $1,172 million from
December 31, 2017
.
The following table sets forth Prudential Financial’s principal sources and uses of highly liquid assets, excluding net borrowings from our intercompany liquidity account, for the periods indicated.
128
|
|
Year Ended December 31,
|
|||||||
|
|
2018
|
2017
|
||||||
|
|
(in millions)
|
|||||||
|
Sources:
|
||||||||
|
Dividends and/or returns of capital from subsidiaries(1)
|
$
|
4,058
|
|
$
|
3,124
|
|
||
|
Proceeds from the issuance of debt
|
2,531
|
|
743
|
|
||||
|
Proceeds from stock-based compensation and exercise of stock options
|
312
|
|
491
|
|
||||
|
Interest income from subsidiaries on intercompany agreements, net of interest paid
|
215
|
|
230
|
|
||||
|
Net income tax receipts
|
231
|
|
213
|
|
||||
|
Net receipts under intercompany loan agreements(2)
|
173
|
|
190
|
|
||||
|
Total sources
|
7,520
|
|
4,991
|
|
||||
|
Uses:
|
||||||||
|
Common stock dividends(3)
|
$
|
1,521
|
|
$
|
1,296
|
|
||
|
Share repurchases
|
1,500
|
|
1,250
|
|
||||
|
Capital contributions to subsidiaries(4)
|
874
|
|
1,135
|
|
||||
|
Interest paid on external debt
|
890
|
|
907
|
|
||||
|
Repayments on external debt
|
1,443
|
|
480
|
|
||||
|
Other, net
|
120
|
|
100
|
|
||||
|
Total uses
|
6,348
|
|
5,168
|
|
||||
|
Net increase (decrease) in highly liquid assets
|
$
|
1,172
|
|
$
|
(177
|
)
|
||
__________
|
(1)
|
See “Item 15—Schedule II—Notes to Condensed Financial Information of Registrant—Dividends and Returns of Capital” for dividends and returns of capital by company.
|
|
(2)
|
2018
includes net receipts from subsidiaries of $750 million from Gibraltar Universal Life Reinsurance Company, $202 million from PGIM Holding Company and $100 million from Prudential Arizona Reinsurance Universal Company offset by net payments of $623 million to international subsidiaries, $150 million to Dryden Arizona Reinsurance Term Company, $100 million to Prudential Universal Reinsurance Company, and $6 million to other subsidiaries
.
2017
includes net receipts from subsidiaries of $1,323 million from international subsidiaries offset by net payments of $500 million to Prudential Universal Reinsurance Company, $350 million to Prudential Arizona Reinsurance Universal Company, $274 million to PGIM Holding Company subsidiaries, and $9 million to other subsidiaries
.
|
|
(3)
|
Includes cash payments made on dividends declared in prior periods.
|
|
(4)
|
2018
includes capital contributions of $590 million to The Prudential Insurance Company of America (“PICA”), $284 million to international insurance subsidiaries.
2017
includes capital contributions of $965 million to international insurance subsidiaries, $149 million to PICA, and $21 million to PGIM Holding Company subsidiaries.
|
Restrictions on Dividends and Returns of Capital from Subsidiaries
Our insurance companies are subject to limitations on the payment of dividends and other transfers of funds to Prudential Financial and other affiliates under applicable insurance law and regulation. Also, more generally, the payment of dividends by any of our subsidiaries is subject to declaration by their Board of Directors and can be affected by market conditions and other factors. See Note 18 to the Consolidated Financial Statements for details on specific dividend restrictions.
Domestic insurance subsidiaries.
Prudential Insurance is permitted to pay ordinary dividends based on calculations specified under New Jersey insurance law, subject to prior notification to the New Jersey Department of Banking and Insurance (“NJDOBI”). Any distributions above this amount in any twelve-month period are considered to be “extraordinary” dividends, and the approval of the NJDOBI is required prior to payment. The laws regulating dividends of the states where our other domestic insurance companies are domiciled are similar, but not identical, to New Jersey’s. During 2018, Prudential Financial received extraordinary dividends of $1,025 million from PALAC.
International insurance subsidiaries.
Capital redeployment from our international insurance subsidiaries is subject to local regulatory requirements in the international jurisdictions in which they operate. Our most significant international insurance subsidiaries, Prudential of Japan and Gibraltar Life, are permitted to pay common stock dividends based on calculations specified by Japanese insurance law, subject to prior notification to the FSA. Dividends in excess of these amounts and other forms of capital distribution require the prior approval of the FSA. In addition to paying common stock dividends, international insurance operations may return capital to Prudential Financial through or facilitated by other means, such as the repayment of subordinated debt or preferred stock obligations held by Prudential Financial or other affiliates, affiliated lending, affiliated derivatives and reinsurance with U.S.-based affiliates and, commencing in 2019, a Bermuda-based affiliate. The regulatory fiscal year end for both Prudential of Japan and Gibraltar Life is March 31,
2019
, after which time the common stock dividend amount permitted to be paid without prior approval from the FSA can be determined.
For the year ended
December 31, 2018
, Prudential Financial received $2,062 million from Prudential International Insurance Holdings, the domestic parent of our international insurance subsidiaries, all of which was received from Prudential Holdings of Japan, Inc. (“PHJ”), the parent of the Company’s Japanese operations. Of this amount, $260 million was sent to PHJ from its
129
subsidiaries in 2016 and had been retained at PHJ since that time. PHJ received the remaining $1,802 million as a common stock dividend from its subsidiaries in 2018.
Other subsidiaries.
The ability of our investment management subsidiaries and the majority of our other operating subsidiaries to pay dividends is largely unrestricted from a regulatory standpoint.
Liquidity of Insurance Subsidiaries
We manage the liquidity of our insurance operations to ensure stable, reliable and cost-effective sources of cash flows to meet all of our obligations. Liquidity within each of our insurance subsidiaries is provided by a variety of sources, including portfolios of liquid assets. The investment portfolios of our subsidiaries are integral to the overall liquidity of our insurance operations. We segment our investment portfolios and employ an asset/liability management approach specific to the requirements of each of our product lines. This enhances the discipline applied in managing the liquidity, as well as the interest rate and credit risk profiles, of each portfolio in a manner consistent with the unique characteristics of the product liabilities.
Liquidity is measured against internally-developed benchmarks that take into account the characteristics of both the asset portfolio and the liabilities that they support. We consider attributes of the various categories of liquid assets (for example, type of asset and credit quality) in calculating internal liquidity measures to evaluate our insurance operations’ liquidity under various stress scenarios, including company-specific and market-wide events. We continue to believe that cash generated by ongoing operations and the liquidity profile of our assets provide sufficient liquidity under reasonably foreseeable stress scenarios for each of our insurance subsidiaries.
Cash Flow
The principal sources of liquidity for our insurance subsidiaries are premiums, investment and fee income, and investment maturities and sales associated with our insurance and annuity operations, as well as internal and external borrowings. The principal uses of that liquidity include benefits, claims and dividends paid to policyholders, and payments to policyholders and contractholders in connection with surrenders, withdrawals and net policy loan activity. Other uses of liquidity may include commissions, general and administrative expenses, purchases of investments, the payment of dividends to the parent holding company, hedging and reinsurance activity and payments in connection with financing activities.
In each of our major insurance subsidiaries, we believe that the cash flows from operations are adequate to satisfy current liquidity requirements. The continued adequacy of this liquidity will depend upon factors such as future securities market conditions, changes in interest rate levels, policyholder perceptions of our financial strength, policyholder behavior, catastrophic events and the relative safety and attractiveness of competing products, each of which could lead to reduced cash inflows or increased cash outflows. Our insurance operations’ cash flows from investment activities result from repayments of principal, proceeds from maturities and sales of invested assets and investment income, net of amounts reinvested. The primary liquidity risks with respect to these cash flows are the risk of default by debtors or bond insurers, our counterparties’ willingness to extend repurchase and/or securities lending arrangements, commitments to invest and market volatility. We closely manage these risks through our credit risk management process and regular monitoring of our liquidity position.
Domestic insurance operations.
In managing the liquidity of our domestic insurance operations, we consider the risk of policyholder and contractholder withdrawals of funds earlier than our assumptions when selecting assets to support these contractual obligations. We use surrender charges and other contract provisions to mitigate the extent, timing and profitability impact of withdrawals of funds by customers. The following table sets forth the liabilities for future policy benefits and policyholders’ account balances of certain of our domestic insurance subsidiaries as of the dates indicated.
|
|
December 31,
|
|||||||
|
|
2018
|
2017
|
||||||
|
|
(in billions)
|
|||||||
|
Prudential Insurance
|
$
|
207.0
|
|
$
|
197.9
|
|
||
|
PLIC
|
52.6
|
|
53.2
|
|
||||
|
Pruco Life
|
41.5
|
|
38.7
|
|
||||
|
PRIAC
|
25.8
|
|
26.4
|
|
||||
|
PALAC
|
14.7
|
|
14.0
|
|
||||
|
Other(1)
|
(91.0
|
)
|
(87.3
|
)
|
||||
|
Total future policy benefits and policyholders’ account balances(2)
|
$
|
250.6
|
|
$
|
242.9
|
|
||
__________
|
(1)
|
Includes the impact of intercompany eliminations.
|
|
(2)
|
Amounts are reflected gross of affiliated reinsurance recoverables.
|
130
The liabilities presented above are primarily supported by invested assets in our general account. As noted above, when selecting assets to support these contractual obligations, we consider the risk of policyholder and contractholder withdrawals of funds earlier than our assumptions. As a result, assets will include both liquid assets, as discussed below, and other assets that we believe adequately support our liabilities.
For Prudential Insurance and other subsidiaries, the liabilities presented above primarily include annuity reserves and deposit liabilities and individual life insurance policy reserves. Individual life insurance policies may impose surrender charges and policyholders may be subject to a new underwriting process in order to obtain a new insurance policy. Prudential Insurance’s reserves for group annuity contracts primarily relate to pension risk transfer contracts, which are generally not subject to early withdrawal. For our individual annuity contracts, to encourage persistency, most of our variable and fixed annuities have surrender or withdrawal charges for a specified number of years. In addition, certain fixed annuities impose a market value adjustment if the invested amount is not held to maturity. The living benefit features of our variable annuities also encourage persistency because the potential value of the living benefit is fully realized only if the contract persists.
For PRIAC, the liabilities presented above primarily include reserves for stable value contracts. Although many of these contracts are subject to discretionary withdrawal, withdrawals are typically at the market value of the underlying assets. Risk is further reduced by the high persistency of clients driven in part by our competitive position in our target markets and contractual provisions such as deferred payouts.
Gross account withdrawals for our domestic insurance operations’ products in 2018 were generally consistent with our assumptions in asset/liability management, and the associated cash outflows did not have a material adverse impact on our overall liquidity.
International insurance operations.
As with our domestic operations, in managing the liquidity of our international insurance operations, we consider the risk of policyholder and contractholder withdrawals of funds earlier than our assumptions in selecting assets to support these contractual obligations. The following table sets forth the liabilities for future policy benefits and policyholders’ account balances of certain of our international insurance subsidiaries as of the dates indicated.
|
|
December 31,
|
|||||||
|
|
2018
|
2017
|
||||||
|
|
(in billions)
|
|||||||
|
Prudential of Japan(1)
|
$
|
51.6
|
|
$
|
47.1
|
|
||
|
Gibraltar Life(2)
|
104.3
|
|
99.6
|
|
||||
|
All other international insurance subsidiaries(3)
|
17.7
|
|
15.9
|
|
||||
|
Total future policy benefits and policyholders’ account balances(4)
|
$
|
173.6
|
|
$
|
162.6
|
|
||
__________
|
(1)
|
As of
December 31, 2018
and
2017
, $13.4 billion and $11.8 billion, respectively, of the insurance-related liabilities for Prudential of Japan are associated with U.S. dollar-denominated products that are coinsured to our domestic insurance operations and supported by U.S. dollar-denominated assets.
|
|
(2)
|
Includes PGFL.
|
|
(3)
|
Represents our international insurance operations, excluding Japan.
|
|
(4)
|
Amounts are reflected gross of affiliated reinsurance recoverables.
|
The liabilities presented above are primarily supported by invested assets in our general account. When selecting assets to support these contractual obligations, we consider the risk of policyholder and contractholder withdrawals of funds earlier than our assumptions. As a result, assets will include both liquid assets, as discussed below, and other assets that we believe adequately support our liabilities.
We believe most of the longer-term recurring pay individual life insurance policies sold by our Japanese operations do not have significant withdrawal risk because policyholders may incur surrender charges and must undergo a new underwriting process to obtain a new insurance policy.
Gibraltar Life sells fixed annuities, denominated in U.S. and Australian dollars, that may be subject to increased surrenders should the yen depreciate in relation to these currencies or if interest rates in Australia and the U.S. decline relative to Japan. A significant portion of the liabilities associated with these contracts include a market value adjustment feature, which mitigates the profitability impact from surrenders. As of
December 31, 2018
, products with a market value adjustment feature represented $25.9 billion of our Japan operations’ insurance-related liabilities, which included $22.2 billion attributable to non-yen denominated fixed annuities.
Liquid Assets
131
Liquid assets include cash and cash equivalents, short-term investments, U.S. Treasury securities, fixed maturities that are not designated as held-to-maturity and public equity securities. In addition to access to substantial investment portfolios, our insurance companies’ liquidity is managed through access to a variety of instruments available for funding and/or managing cash flow mismatches, including from time to time those arising from claim levels in excess of projections. Our ability to utilize assets and liquidity between our subsidiaries is limited by regulatory and other constraints. We believe that ongoing operations and the liquidity profile of our assets provide sufficient liquidity under reasonably foreseeable stress scenarios for each of our insurance subsidiaries.
The following table sets forth the fair value of certain of our domestic insurance operations’ portfolio of liquid assets, as of the dates indicated.
|
|
December 31, 2018
|
|
||||||||||||||||||||||||||
|
|
Prudential
Insurance
|
PLIC
|
PRIAC
|
PALAC
|
Pruco Life
|
Total
|
December 31, 2017
|
|||||||||||||||||||||
|
|
(in billions)
|
|||||||||||||||||||||||||||
|
Cash and short-term investments
|
$
|
5.0
|
|
$
|
0.9
|
|
$
|
0.3
|
|
$
|
4.5
|
|
$
|
0.4
|
|
$
|
11.1
|
|
$
|
11.7
|
|
|||||||
|
Fixed maturity investments(1):
|
||||||||||||||||||||||||||||
|
High or highest quality
|
110.7
|
|
34.8
|
|
19.2
|
|
9.6
|
|
4.9
|
|
179.2
|
|
175.1
|
|
||||||||||||||
|
Other than high or highest quality
|
6.6
|
|
2.4
|
|
1.4
|
|
0.5
|
|
0.4
|
|
11.3
|
|
13.8
|
|
||||||||||||||
|
Subtotal
|
117.3
|
|
37.2
|
|
20.6
|
|
10.1
|
|
5.3
|
|
190.5
|
|
188.9
|
|
||||||||||||||
|
Public equity securities, at fair value
|
0.1
|
|
1.8
|
|
0.0
|
|
0.0
|
|
0.0
|
|
1.9
|
|
2.8
|
|
||||||||||||||
|
Total
|
$
|
122.4
|
|
$
|
39.9
|
|
$
|
20.9
|
|
$
|
14.6
|
|
$
|
5.7
|
|
$
|
203.5
|
|
$
|
203.4
|
|
|||||||
__________
|
(1)
|
Excludes fixed maturities designated as held-to-maturity. Classified by NAIC or equivalent rating.
|
The following table sets forth the fair value of our international insurance operations’ portfolio of liquid assets, as of the dates indicated.
|
|
December 31, 2018
|
|
||||||||||||||||||
|
|
Prudential
of Japan
|
Gibraltar
Life(1)
|
All
Other(2)
|
Total
|
December 31, 2017
|
|||||||||||||||
|
|
(in billions)
|
|||||||||||||||||||
|
Cash and short-term investments
|
$
|
0.7
|
|
$
|
2.2
|
|
$
|
1.2
|
|
$
|
4.1
|
|
$
|
4.2
|
|
|||||
|
Fixed maturity investments(3):
|
||||||||||||||||||||
|
High or highest quality(4)
|
40.0
|
|
90.2
|
|
18.9
|
|
149.1
|
|
145.2
|
|
||||||||||
|
Other than high or highest quality
|
0.8
|
|
3.6
|
|
1.8
|
|
6.2
|
|
6.0
|
|
||||||||||
|
Subtotal
|
40.8
|
|
93.8
|
|
20.7
|
|
155.3
|
|
151.2
|
|
||||||||||
|
Public equity securities
|
1.7
|
|
1.6
|
|
0.7
|
|
4.0
|
|
4.5
|
|
||||||||||
|
Total
|
$
|
43.2
|
|
$
|
97.6
|
|
$
|
22.6
|
|
$
|
163.4
|
|
$
|
159.9
|
|
|||||
__________
|
(1)
|
Includes PGFL.
|
|
(2)
|
Represents our international insurance operations, excluding Japan.
|
|
(3)
|
Excludes fixed maturities designated as held-to-maturity. Classified by NAIC or equivalent rating.
|
|
(4)
|
As of
December 31, 2018
, $112.3 billion, or 75%, were invested in government or government agency bonds.
|
Given the size and liquidity profile of our investment portfolios, we believe that claim experience, including policyholder withdrawals and surrenders, varying from our projections does not constitute a significant liquidity risk. Our asset/liability management process takes into account the expected maturity of investments and expected claim payments as well as the specific nature and risk profile of the liabilities. To the extent we need to pay claims in excess of projections, we may borrow temporarily or sell investments sooner than anticipated to pay these claims, which may result in increased borrowing costs or realized investment gains or losses, including from changes in interest rates or credit spreads. The payment of claims and sale of investments earlier than anticipated would have an impact on the reported level of cash flow from operating, investing, and financing activities, in our financial statements. Historically, there has been no significant variation between the expected maturities of our investments and the payment of claims.
Liquidity associated with other activities
132
Hedging activities associated with Individual Annuities
For the portion of our Individual Annuities’ ALM strategy executed through hedging, as well as the capital hedge program, we enter into a range of exchange-traded, cleared and other OTC equity and interest rate derivatives in order to hedge certain capital market risks related to more severe market conditions. For a full discussion of our Individual Annuities’ risk management strategy, see “—Results of Operations by Segment—U.S. Individual Solutions Division—Individual Annuities.” This portion of our Individual Annuities’ ALM strategy and capital hedge program requires access to liquidity to meet payment obligations relating to these derivatives, such as payments for periodic settlements, purchases, maturities and terminations. These liquidity needs can vary materially due to, among other items, changes in interest rates, equity markets, mortality and policyholder behavior.
The hedging portion of our Individual Annuities’ ALM strategy and capital hedge program may also result in derivative related collateral postings to (when we are in a net pay position) or from (when we are in a net receive position) counterparties. The net collateral position depends on changes in interest rates and equity markets related to the amount of the exposures hedged. Depending on market conditions, the collateral posting requirements can result in material liquidity needs when we are in a net pay position. As of
December 31, 2018
, the derivatives comprising the hedging portion of our ALM strategy and capital hedge program were in a net receive position of $2.9 billion compared to a net receive position of $3.3 billion as of
December 31, 2017
. The change in collateral position was primarily driven by an increase in interest rates.
Foreign exchange hedging activities
We employ various hedging strategies to manage potential exposure to foreign currency exchange rate movements, particularly those associated with the yen. Our overall yen hedging strategy calibrates the hedge level to preserve the relative contribution of our yen-based business to the Company’s overall return on equity on a leverage neutral basis. The hedging strategy includes two primary components:
Income Hedges—We hedge a portion of our prospective yen-based earnings streams by entering into external forward currency derivative contracts that effectively fix the currency exchange rates for that portion of earnings, thereby reducing volatility from foreign currency exchange rate movements. As of
December 31, 2018
, we have hedged 100%, 72% and 28% of expected yen-based earnings for 2019, 2020 and 2021, respectively.
Equity Hedges—We hold both internal and external hedges primarily to hedge our U.S. dollar-equivalent equity. These hedges also mitigate volatility in the solvency margins of yen-based subsidiaries resulting from changes in the market value of their U.S. dollar-denominated investments hedging our U.S. dollar-equivalent equity attributable to changes in the yen-U.S. dollar exchange rate.
For additional information on our hedging strategy, see “—Results of Operations—Impact of Foreign Currency Exchange Rates.”
Cash settlements from these hedging activities result in cash flows between subsidiaries of Prudential Financial and either international-based subsidiaries or external parties. The cash flows are dependent on changes in foreign currency exchange rates and the notional amount of the exposures hedged. For example, a significant yen depreciation over an extended period of time could result in net cash inflows, while a significant yen appreciation could result in net cash outflows. The following tables set forth information about net cash settlements and the net asset or liability resulting from these hedging activities related to the yen and other currencies.
|
|
Year ended December 31,
|
|||||||
|
Cash Settlements:
|
2018
|
2017
|
||||||
|
|
(in millions)
|
|||||||
|
Income Hedges (External)(1)
|
$
|
(13
|
)
|
$
|
(16
|
)
|
||
|
Equity Hedges:
|
||||||||
|
Internal(2)
|
105
|
|
54
|
|
||||
|
External(3)
|
246
|
|
(192
|
)
|
||||
|
Total Equity Hedges
|
$
|
351
|
|
$
|
(138
|
)
|
||
|
Total Cash Settlements
|
$
|
338
|
|
$
|
(154
|
)
|
||
133
|
|
As of December 31,
|
|||||||
|
Assets (Liabilities):
|
2018
|
2017
|
||||||
|
|
(in millions)
|
|||||||
|
Income Hedges (External)(4)
|
$
|
67
|
|
$
|
(42
|
)
|
||
|
Equity Hedges:
|
||||||||
|
Internal(2)
|
436
|
|
623
|
|
||||
|
External(5)
|
78
|
|
303
|
|
||||
|
Total Equity Hedges(6)
|
$
|
514
|
|
$
|
926
|
|
||
|
Total Assets (Liabilities)
|
$
|
581
|
|
$
|
884
|
|
||
__________
|
(1)
|
Includes non-yen related cash settlements of $(11) million, primarily denominated in Korean won and $(14) million, primarily denominated in Brazilian real and Chilean peso, for the year ended
December 31, 2018
and
2017
, respectively.
|
|
(2)
|
Represents internal transactions between international-based and U.S.-based entities. Amounts noted are from the U.S.-based entities’ perspectives.
|
|
(3)
|
Includes non-yen related cash settlements of $2 million, in Korean won for the year ended December 31, 2018
|
|
(4)
|
Includes non-yen related assets of $44 million, primarily denominated in Australian dollar and Brazilian real, and liabilities of $(65) million primarily denominated in Korean won and Australian dollar as of
December 31, 2018
and
2017
, respectively.
|
|
(5)
|
Includes non-yen related liabilities of $(2) million, denominated in Korean won as of December 31, 2018.
|
|
(6)
|
As of
December 31, 2018
, approximately $524 million, $262 million and $(272) million of the net market value is scheduled to settle in 2019, 2020 and thereafter, respectively. The net market value of the assets (liabilities) will vary with changing market conditions to the extent there are no corresponding offsetting positions.
|
PGIM operations
The principal sources of liquidity for our fee-based PGIM businesses include asset management fees and commercial mortgage origination and servicing fees. The principal uses of liquidity include general and administrative expenses and distributions of dividends and returns of capital to Prudential Financial. The primary liquidity risks for our fee-based PGIM businesses relate to their profitability, which is impacted by market conditions and our investment management performance. We believe the cash flows from our fee-based PGIM businesses are adequate to satisfy the current liquidity requirements of these operations, as well as requirements that could arise under reasonably foreseeable stress scenarios, which are monitored through the use of internal measures.
The principal sources of liquidity for our strategic investments held in our PGIM businesses are cash flows from investments, the ability to liquidate investments, and available borrowing lines from internal sources, including Prudential Financial and Prudential Funding, LLC (“Prudential Funding”), a wholly-owned subsidiary of Prudential Insurance. The primary liquidity risks include the inability to sell assets in a timely manner, declines in the value of assets and credit defaults. There were no material changes to the liquidity position of our PGIM operations during 2018.
Alternative Sources of Liquidity
In addition to the sources of liquidity discussed above, and asset-based financing as discussed below, Prudential Financial and certain subsidiaries have access to other sources of liquidity, including syndicated, unsecured committed credit facilities, membership in the Federal Home Loan Banks, commercial paper programs, and a put option agreement. See Note 16 to our Consolidated Financial Statements for more information on these sources of liquidity.
Asset-based Financing
We conduct asset-based or secured financing within our insurance and other subsidiaries, including transactions such as securities lending, repurchase agreements and mortgage dollar rolls, to earn spread income, to borrow funds, or to facilitate trading activity. These programs are primarily driven by portfolio holdings of securities that are lendable based on counterparty demand for these securities in the marketplace. The collateral received in connection with these programs is primarily used to purchase securities in the short-term spread portfolios of our insurance entities. Investments held in the short-term spread portfolios include cash and cash equivalents, short-term investments (primarily corporate bonds), mortgage loans and fixed maturities (primarily CLOs and other structured securities), with a weighted average life at time of purchase by the short-term portfolios of four years or less. Floating rate assets comprise the majority of our short-term spread portfolio. These short-term portfolios are subject to specific investment policy statements, which among other things, do not allow for significant asset/liability interest rate duration mismatch.
The following table sets forth our liabilities under asset-based or secured financing programs as of the dates indicated.
134
|
|
December 31, 2018
|
December 31, 2017
|
|||||||||||||||||||||
|
|
PFI
Excluding Closed Block Division |
Closed
Block Division |
Consolidated
|
PFI
Excluding Closed Block Division |
Closed
Block Division |
Consolidated
|
|||||||||||||||||
|
|
($ in millions)
|
||||||||||||||||||||||
|
Securities sold under agreements to repurchase
|
$
|
6,982
|
|
$
|
2,968
|
|
$
|
9,950
|
|
$
|
4,960
|
|
$
|
3,440
|
|
$
|
8,400
|
|
|||||
|
Cash collateral for loaned securities
|
3,063
|
|
866
|
|
3,929
|
|
3,203
|
|
1,151
|
|
4,354
|
|
|||||||||||
|
Securities sold but not yet purchased
|
9
|
|
0
|
|
9
|
|
3
|
|
0
|
|
3
|
|
|||||||||||
|
Total(1)
|
$
|
10,054
|
|
$
|
3,834
|
|
$
|
13,888
|
|
$
|
8,166
|
|
$
|
4,591
|
|
$
|
12,757
|
|
|||||
|
Portion of above securities that may be returned to the Company overnight requiring immediate return of the cash collateral
|
$
|
3,939
|
|
$
|
983
|
|
$
|
4,922
|
|
$
|
3,838
|
|
$
|
1,393
|
|
$
|
5,231
|
|
|||||
|
Weighted average maturity, in days(2)
|
7
|
|
3
|
|
12
|
|
3
|
|
|||||||||||||||
__________
|
(1)
|
The daily weighted average outstanding balance for the year ended
December 31, 2018
and
2017
was $9,653 million and $8,279 million, respectively, for PFI excluding the Closed Block division, and $4,343 million and $4,894 million, respectively, for the Closed Block division.
|
|
(2)
|
Excludes securities that may be returned to the Company overnight.
|
As of
December 31, 2018
, our domestic insurance entities had assets eligible for the asset-based or secured financing programs of $111.6 billion, of which $14.5 billion were on loan. Taking into account market conditions and outstanding loan balances as of
December 31, 2018
, we believe approximately $14.2 billion of the remaining eligible assets are readily lendable, including approximately $9.9 billion relating to PFI excluding the Closed Block division, of which $2.3 billion relates to certain separate accounts and may only be used for financing activities related to those accounts, and the remaining $4.3 billion relating to the Closed Block division.
Financing Activities
As of
December 31, 2018
and
2017
, total short-term and long-term debt of the Company on a consolidated basis was
$19.8 billion
and
$18.6 billion
, respectively. We may, from time to time, seek to redeem or repurchase our outstanding debt securities through open market purchases, individually negotiated transactions or otherwise. Any such actions will depend on prevailing market conditions, our liquidity position and other factors. The following table sets forth total consolidated borrowings of the Company as of the dates indicated.
|
|
December 31, 2018
|
December 31, 2017
|
|||||||||||||||||||||
|
|
Prudential
Financial
|
Subsidiaries |
Consolidated
|
Prudential
Financial
|
Subsidiaries |
Consolidated
|
|||||||||||||||||
|
(in millions)
|
|||||||||||||||||||||||
|
General obligation short-term debt:
|
|||||||||||||||||||||||
|
Commercial paper
|
$
|
15
|
|
$
|
727
|
|
$
|
742
|
|
$
|
50
|
|
$
|
500
|
|
$
|
550
|
|
|||||
|
Current portion of long-term debt
|
1,100
|
|
499
|
|
1,599
|
|
830
|
|
0
|
|
830
|
|
|||||||||||
|
Subtotal
|
1,115
|
|
1,226
|
|
2,341
|
|
880
|
|
500
|
|
1,380
|
|
|||||||||||
|
General obligation long-term debt:
|
|||||||||||||||||||||||
|
Senior debt
|
8,630
|
|
173
|
|
8,803
|
|
8,738
|
|
173
|
|
8,911
|
|
|||||||||||
|
Junior subordinated debt
|
7,511
|
|
57
|
|
7,568
|
|
6,566
|
|
56
|
|
6,622
|
|
|||||||||||
|
Surplus notes (1)
|
0
|
|
341
|
|
341
|
|
0
|
|
840
|
|
840
|
|
|||||||||||
|
Subtotal
|
16,141
|
|
571
|
|
16,712
|
|
15,304
|
|
1,069
|
|
16,373
|
|
|||||||||||
|
Total general obligations
|
17,256
|
|
1,797
|
|
19,053
|
|
16,184
|
|
1,569
|
|
17,753
|
|
|||||||||||
|
Limited and non-recourse borrowings (2)
|
|
|
|
|
|
|
|
|
|
|
|
|
|||||||||||
|
Short-term debt
|
0
|
|
53
|
|
53
|
|
0
|
|
0
|
|
0
|
|
|||||||||||
|
Current portion of long-term debt
|
0
|
|
57
|
|
57
|
|
0
|
|
0
|
|
0
|
|
|||||||||||
|
Long-term debt
|
0
|
|
666
|
|
666
|
|
0
|
|
799
|
|
799
|
|
|||||||||||
|
Subtotal
|
0
|
|
776
|
|
776
|
|
0
|
|
799
|
|
799
|
|
|||||||||||
|
Total borrowings
|
$
|
17,256
|
|
$
|
2,573
|
|
$
|
19,829
|
|
$
|
16,184
|
|
$
|
2,368
|
|
$
|
18,552
|
|
|||||
__________
|
(1)
|
Amounts are net of assets under set-off arrangements of $9,095 million and $7,287 million as of December 31, 2018 and 2017, respectively.
|
135
|
(2)
|
Limited and non-recourse borrowing represents mortgage debt of our subsidiaries that has recourse only to real estate investment property.
|
As of
December 31, 2018
and
2017
, we were in compliance with all debt covenants related to the borrowings in the table above. For further information on our short- and long-term debt obligations, see Note 16 to our Consolidated Financial Statements.
Based on the use of proceeds, we classify our borrowings as capital debt, investment-related debt, and debt related to specified businesses. Capital debt, which is debt utilized to meet the capital requirements of our businesses, was $13.4 billion and $12.0 billion as of December 31, 2018 and 2017, respectively. Investment-related debt of $3.9 billion and $4.0 billion as of December 31, 2018 and 2017, respectively, consists of debt issued to finance specific investment assets or portfolios of investment assets, the proceeds from which will service the debt. Specifically, this includes institutional spread lending investment portfolios, assets supporting reserve requirements under Regulation XXX and Guideline AXXX as described below, as well as funding for institutional and insurance company portfolio cash flow timing differences. Our remaining borrowings are utilized for business funding to meet specific purposes, which may include funding new business acquisition costs associated with our individual annuities business, operating needs associated with hedging our individual annuities products as discussed above and activities associated with our investment management business.
Prudential Financial Borrowings
Long-term borrowings are conducted primarily by Prudential Financial. It borrows these funds to meet its capital and other funding needs, as well as the capital and funding needs of its subsidiaries. Prudential Financial maintains a shelf registration statement with the SEC that permits the issuance of public debt, equity and hybrid securities. As a “Well-Known Seasoned Issuer” under SEC rules, Prudential Financial’s shelf registration statement provides for automatic effectiveness upon filing and has no stated issuance capacity.
Prudential Financial’s borrowings increased $1.1 billion from
December 31, 2017
, driven by the issuance of $1.5 billion of junior subordinated debt and $1 billion of senior debt, partially offset by senior debt maturities of $0.7 billion, redemption of $0.6 billion of junior subordinated debt, and $0.1 billion of retail note maturities. For more information on long-term debt, see Note 16 to our Consolidated Financial Statements.
Subsidiary Borrowings
Subsidiary borrowings principally consist of commercial paper borrowings by Prudential Funding, asset-based financing and real estate investment financing. Borrowings of our subsidiaries increased $0.2 billion from
December 31, 2017
due to an increase in commercial paper outstanding.
Term and Universal Life Reserve Financing
Regulation XXX and Guideline AXXX require domestic life insurers to establish statutory reserves for term and universal life insurance policies with long-term premium guarantees that are consistent with the statutory reserves required for other individual life policies with similar guarantees. Many market participants believe that these levels of reserves are excessive relative to the levels reasonably required to maintain solvency for moderately adverse experience. The difference between the statutory reserve and the amount necessary to maintain solvency for moderately adverse experience is considered to be the non-economic portion of the statutory reserve.
We use captive reinsurance subsidiaries to finance the portion of the statutory reserves required to be held by our domestic life insurance companies under Regulation XXX and Guideline AXXX that we consider to be non-economic. The financing arrangements involve the reinsurance of term and universal life business to our captive reinsurers and the issuance of surplus notes by those captives that are treated as capital for statutory purposes. These surplus notes are subordinated to policyholder obligations, and the payment of principal and interest on the surplus notes can only be made with prior insurance regulatory approval.
136
We have entered into agreements with external counterparties providing for the issuance of surplus notes by our captive reinsurers in return for the receipt of credit-linked notes (“Credit-Linked Note Structures”). As of December 31, 2018, we had Credit-Linked Note Structures with an aggregate issuance capacity of $13,750 million, of which $11,445 million was outstanding, as compared to an aggregate issuance capacity of $11,100 million, of which $9,487 million was outstanding, as of December 31, 2017. Under the agreements, the captive receives in exchange for the surplus notes one or more credit-linked notes issued by a special-purpose affiliate of the Company with an aggregate principal amount equal to the surplus notes outstanding. The captive holds the credit-linked notes as assets supporting Regulation XXX or Guideline AXXX non-economic reserves, as applicable. The captive can redeem the principal amount of the outstanding credit-linked notes for cash upon the occurrence of, and in an amount necessary to remedy, a specified liquidity stress event affecting the captive. Under the agreements, the external counterparties have agreed to fund any such payments under the credit-linked notes in return for the receipt of fees. Under certain of the transactions, Prudential Financial has agreed to make capital contributions to the captive to reimburse it for investment losses in excess of specified amounts and/or has agreed to reimburse the external counterparties for any payments made under the credit-linked notes. To date, no such payments under the credit-linked notes have been required. Under these transactions, because valid rights of set-off exist, interest and principal payments on the surplus notes and on the credit-linked notes are settled on a net basis, and the surplus notes are reflected in the Company’s total consolidated borrowings on a net basis.
The following table summarizes our Credit-Linked Note Structures, which are reported on a net basis, as of
December 31, 2018
.
|
|
Surplus Notes
|
Outstanding as of
December 31, 2018
|
|||||||||||
|
Credit-Linked Note Structures:
|
Original
Issue Dates
|
Maturity
Dates
|
Facility
Size
|
||||||||||
|
|
($ in millions)
|
||||||||||||
|
XXX
|
2011-2014
|
2021-2024
|
$
|
1,750
|
|
(1)
|
$
|
1,750
|
|
||||
|
AXXX
|
2013
|
2033
|
3,129
|
|
3,500
|
|
|||||||
|
XXX
|
2014-2018
|
2021-2034
|
2,350
|
|
(2)
|
2,500
|
|
||||||
|
XXX
|
2014-2017
|
2024-2037
|
2,200
|
|
2,400
|
|
|||||||
|
AXXX
|
2017
|
2037
|
1,466
|
|
2,000
|
|
|||||||
|
XXX
|
2018
|
2038
|
550
|
|
1,600
|
|
|||||||
|
Total Credit-Linked Note Structures
|
$
|
11,445
|
|
$
|
13,750
|
|
|||||||
__________
|
(1)
|
Prudential Financial has agreed to reimburse any amounts paid under the credit-linked notes issued in this structure.
|
|
(2)
|
The $2.35 billion of surplus notes represents an intercompany transaction that eliminates upon consolidation. Prudential Financial has agreed to reimburse amounts paid under credit-linked notes issued in this structure up to $1.0 billion.
|
As of
December 31, 2018
, we also had outstanding an aggregate of $2.3 billion of debt issued for the purpose of financing Regulation XXX and Guideline AXXX non-economic reserves, of which approximately $0.6 billion relates to Regulation XXX reserves and approximately $1.7 billion relates to Guideline AXXX reserves. In addition, as of December 31, 2018, for purposes of financing Guideline AXXX reserves, one of our captives had approximately $4.0 billion of surplus notes outstanding that were issued to affiliates.
The Company has introduced updated versions of several products in its individual life product portfolio in conjunction with the requirement to adopt principle-based reserving by January 1, 2020. Notably, the Company adopted principle-based reserving for its guaranteed universal life products and introduced updated versions of these products in 2017. The guaranteed universal life updated products support the principle-based statutory reserve level without the need for financing through captive reinsurance. The Company is continuing to assess the impact of principle-based reserving on projected statutory reserve levels and product pricing for its remaining portfolio of individual life product offerings.
Ratings
Financial strength ratings (which are sometimes referred to as “claims-paying” ratings) and credit ratings are important factors affecting public confidence in an insurer and its competitive position in marketing products. Our credit ratings are also important for our ability to raise capital through the issuance of debt and for the cost of such financing. Nationally Recognized Statistical Ratings Organizations continually review the financial performance and financial condition of the entities they rate, including Prudential Financial and its rated subsidiaries.
137
A downgrade in the credit or financial strength ratings of Prudential Financial or its rated subsidiaries could potentially, among other things, limit our ability to market products, reduce our competitiveness, increase the number or value of policy surrenders and withdrawals, increase our borrowing costs and potentially make it more difficult to borrow funds, adversely affect the availability of financial guarantees, such as letters of credit, cause additional collateral requirements or other required payments under certain agreements, allow counterparties to terminate derivative agreements and/or hurt our relationships with creditors, distributors, or trading counterparties thereby potentially negatively affecting our profitability, liquidity, and/or capital. In addition, we consider our own risk of non-performance in determining the fair value of our liabilities. Therefore, changes in our credit or financial strength ratings may affect the fair value of our liabilities.
Financial strength ratings represent the opinions of rating agencies regarding the financial ability of an insurance company to meet its obligations under an insurance policy. Credit ratings represent the opinions of rating agencies regarding an entity’s ability to repay its indebtedness. The following table summarizes the ratings for Prudential Financial and certain of its subsidiaries as of the date of this filing.
|
|
|
A.M.
Best(1)
|
|
S&P(2)
|
|
Moody’s(3)
|
|
Fitch(4)
|
|
Last review date
|
|
12/13/2018
|
|
11/20/2018
|
|
11/15/2017
|
|
10/18/2018
|
|
Current outlook
|
|
Stable
|
|
Stable*
|
|
Positive
|
|
Stable
|
|
Financial Strength Ratings:
|
|
|
|
|||||
|
The Prudential Insurance Company of America
|
|
A+
|
|
AA-
|
|
A1
|
|
AA-
|
|
Pruco Life Insurance Company
|
|
A+
|
|
AA-
|
|
A1
|
|
AA-
|
|
Pruco Life Insurance Company of New Jersey
|
|
A+
|
|
AA-
|
|
NR**
|
|
AA-
|
|
Prudential Annuities Life Assurance Corporation
|
|
A+
|
|
AA-
|
|
NR
|
|
AA-
|
|
Prudential Retirement Insurance and Annuity Company
|
|
A+
|
|
AA-
|
|
A1
|
|
AA-
|
|
The Prudential Life Insurance Company Ltd. (Prudential of Japan)
|
|
NR
|
|
A+
|
|
NR
|
|
NR
|
|
Gibraltar Life Insurance Company, Ltd.
|
|
NR
|
|
A+
|
|
NR
|
|
NR
|
|
The Prudential Gibraltar Financial Life Insurance Co. Ltd
|
|
NR
|
|
A+
|
|
NR
|
|
NR
|
|
Prudential Life Insurance Co. of Taiwan, Inc.(5)
|
|
NR
|
|
twAAA
|
|
NR
|
|
NR
|
|
Credit Ratings:
|
|
|
|
|||||
|
Prudential Financial, Inc.:
|
|
|
|
|
||||
|
Short-term borrowings
|
|
AMB-1
|
A-1
|
P-2
|
F1
|
|||
|
Long-term senior debt
|
|
a-
|
A
|
Baa1
|
A-
|
|||
|
Junior subordinated long-term debt
|
|
bbb
|
BBB+
|
Baa2
|
BBB
|
|||
|
The Prudential Insurance Company of America:
|
|
|
|
|
||||
|
Capital and surplus notes
|
|
a
|
A
|
A3
|
A
|
|||
|
Prudential Funding, LLC:
|
|
|
|
|
||||
|
Short-term debt
|
|
AMB-1
|
A-1+
|
P-1
|
F1+
|
|||
|
Long-term senior debt
|
|
a+
|
AA-
|
A2
|
A+
|
|||
|
PRICOA Global Funding I:
|
|
|
|
|
||||
|
Long-term senior debt
|
|
aa-
|
AA-
|
A1
|
AA-
|
|||
__________
* The Current ‘Stable’ Outlook on Prudential’s ratings corresponds to all S&P rated Prudential entities except for Prudential’s Japanese Subsidiaries (The Prudential Life Insurance Company Ltd., Gibraltar Life Insurance Company, Ltd., and The Prudential Gibraltar Financial Life Insurance Co. Ltd.), which have ‘Positive’ Outlooks.
** “NR” indicates not rated.
|
(1)
|
A.M. Best Company, which we refer to as A.M. Best, financial strength ratings for insurance companies range from “A++ (superior)” to “D (Poor)”. A rating of A+ is the second highest of thirteen rating categories. A.M. Best long-term credit ratings range from “aaa (exceptional)” to “c (Poor)”. A.M. Best short-term credit ratings range from “AMB-1+”, which represents the strongest ability to repay short-term debt obligations, to “AMB-4 (Questionable)”.
|
|
(2)
|
Standard & Poor’s Rating Services, which we refer to as S&P, financial strength ratings for insurance companies range from “AAA (extremely strong)” to “D (default)”. A rating of AA- is the fourth highest of twenty-three rating categories. S&P’s long-term issue credit ratings range from “AAA (extremely strong)” to “D (default)”. S&P short-term ratings range from “A-1 (highest category)” to “D (default)”.
|
|
(3)
|
Moody’s Investors Service, Inc., which we refer to as Moody’s, insurance financial strength ratings range from “Aaa (exceptional)” to “C (lowest)”. A rating of A1 is the fifth highest of twenty-one rating categories. Numeric modifiers are used to refer to the ranking within the group—with 1 being the highest and 3 being the lowest. These modifiers are used to indicate relative strength within a category. Moody’s long-term credit ratings range from “Aaa (highest)” to “C (default)”. Moody’s short-term ratings range from “Prime-1 (P-1)”, which represents a superior ability for repayment of short-term debt obligations, to “Prime-3 (P-3)”, which represents an acceptable ability for repayment of such obligations. Issuers rated “Not Prime” do not fall within any of the Prime rating categories.
|
|
(4)
|
Fitch Ratings Inc., which we refer to as Fitch, financial strength ratings range from “AAA (exceptionally strong)” to “C (distressed)”. A rating of AA- is the fourth highest of twenty-one rating categories. Fitch long-term credit ratings range from “AAA (highest credit quality)”, which denotes exceptionally strong capacity for timely payment of financial commitments, to “D (default)”. Short-term ratings range from “F1+ (highest credit quality)” to “D (default)”.
|
|
(5)
|
This rating for Prudential Life Insurance Company of Taiwan, Inc. was upgraded to “twAAA” from “twAA+” in November of 2018 by Taiwan Ratings Corporation, an S&P Global Company.
|
138
The ratings set forth above reflect current opinions of each rating agency. Each rating should be evaluated independently of any other rating. These ratings are not directed toward shareholders and do not in any way reflect evaluations of the safety and security of the Common Stock. These ratings are reviewed periodically and may be changed at any time by the rating agencies. As a result, we cannot assure stakeholders that we will maintain our current ratings in the future.
Rating agencies use an “outlook” statement for both industry sectors and individual companies. For an industry sector, a stable outlook generally implies that over the next 12 to 18 months the rating agency expects ratings to remain unchanged among companies in the sector. In 2018, A.M. Best revised the Rating Outlook on the U.S. life insurance industry from Negative to Stable. Fitch, Moody’s, and S&P maintained their outlook for the U.S. life insurance sector at Stable. For a particular company, an outlook generally indicates a medium- or long-term trend (generally six months to two years) in credit fundamentals, which if continued, may lead to a rating change. These indicators are not necessarily a precursor of a rating change nor do they preclude a rating agency from changing a rating at any time without notice. A.M. Best, Fitch, and S&P have the Company’s ratings on Stable outlook. Moody’s has the ratings of Prudential Financial and its insurance subsidiaries on Positive outlook.
The following is a summary of the significant changes or actions in ratings and rating outlooks for our Company, as well as for the life insurance industry and sector, that have occurred from January 1,
2018
through the date of this filing:
In April 2018, S&P revised the company outlook for Prudential of Japan, Gibraltar Life and PGFL from Stable to Positive, which resulted from S&P’s revised outlook on the Japan sovereign credit rating from Stable to Positive.
In November 2018, Prudential Life Insurance Co. of Taiwan’s Issuer Credit Rating and Financial Strength Rating was upgraded from “twAA+” to “twAAA” by Taiwan Rating Corp., an S&P Global Company. This upgrade reflects the revised assessment of Prudential Taiwan’s increased importance to Prudential Financial, from “strategically important” to “highly strategic”.
Requirements to post collateral or make other payments because of ratings downgrades under certain agreements, including derivative agreements, can be satisfied in cash or by posting permissible securities held by the subsidiaries subject to the agreements. In addition, a ratings downgrade by A.M. Best to “A-” for our domestic life insurance companies would require Prudential Insurance to either post collateral or a letter of credit in the amount of approximately $1.4 billion, based on the level of statutory reserves related to the variable annuity business acquired from Allstate. We believe that the posting of such collateral would not be a material liquidity event for Prudential Insurance.
Contractual Obligations
The table below summarizes the future estimated cash payments related to certain contractual obligations as of
December 31, 2018
. The estimated payments reflected in this table are based on management’s estimates and assumptions about these obligations. Because these estimates and assumptions are necessarily subjective, the actual cash outflows in future periods will vary, possibly materially, from those reflected in the table. In addition, we do not believe that our cash flow requirements can be adequately assessed based solely upon an analysis of these obligations, as the table below does not contemplate all aspects of our cash inflows, such as the level of cash flow generated by certain of our investments, nor all aspects of our cash outflows.
|
|
Estimated Payments Due by Period
|
|||||||||||||||||||
|
|
Total
|
2019
|
2020-2021
|
2022-2023
|
2024 and thereafter
|
|||||||||||||||
|
|
(in millions)
|
|||||||||||||||||||
|
Short-term and long-term debt obligations(1)
|
$
|
39,905
|
|
$
|
3,420
|
|
$
|
3,690
|
|
$
|
1,969
|
|
$
|
30,826
|
|
|||||
|
Operating and capital lease obligations(2)
|
685
|
|
168
|
|
239
|
|
140
|
|
138
|
|
||||||||||
|
Purchase obligations:
|
||||||||||||||||||||
|
Commitments to purchase or fund investments(3)
|
7,088
|
|
4,020
|
|
1,833
|
|
868
|
|
367
|
|
||||||||||
|
Commercial mortgage loan commitments(4)
|
3,299
|
|
3,166
|
|
133
|
|
0
|
|
0
|
|
||||||||||
|
Other liabilities:
|
||||||||||||||||||||
|
Insurance liabilities(5)
|
1,142,301
|
|
44,161
|
|
66,657
|
|
66,945
|
|
964,538
|
|
||||||||||
|
Other(6)
|
14,035
|
|
13,906
|
|
76
|
|
53
|
|
0
|
|
||||||||||
|
Total
|
$
|
1,207,313
|
|
$
|
68,841
|
|
$
|
72,628
|
|
$
|
69,975
|
|
$
|
995,869
|
|
|||||
__________
|
(1)
|
The estimated payments due by period for long-term debt reflects the contractual maturities of principal, as disclosed in Note 16 to the Consolidated Financial Statements, as well as estimated future interest payments. The payment of principal and estimated future interest for short-term debt are reflected in estimated payments due in
2019
. The estimate for future interest payments includes the effect of derivatives that qualify for hedge accounting treatment. See Note 16 to the Consolidated Financial Statements for additional information concerning our short-term and long-term debt.
|
139
|
(2)
|
The estimated payments due by period for operating and capital leases reflect the future minimum lease payments under non-cancelable operating and capital leases, as disclosed in Note 22 to the Consolidated Financial Statements.
|
|
(3)
|
As discussed in Note 22 to the Consolidated Financial Statements, we have commitments to purchase or fund investments, some of which are contingent upon events or circumstances not under our control, including those at the discretion of our counterparties. The timing of the fulfillment of certain of these commitments cannot be estimated, therefore the settlements of these obligations are reflected in estimated payments due in less than one year. Commitments to purchase or fund investments include
$147 million
that we anticipate will ultimately be funded from our separate accounts.
|
|
(4)
|
As discussed in Note 22 to the Consolidated Financial Statements, loan commitments of our commercial mortgage operations, which are legally binding commitments to extend credit to a counterparty, have been reflected in the contractual obligations table above principally based on the expiration date of the commitment; however, it is possible these loan commitments could be funded prior to their expiration date. In certain circumstances the counterparty may also extend the date of the expiration in exchange for a fee.
|
|
(5)
|
The estimated cash flows due by period for insurance liabilities reflect future estimated cash payments to be made to policyholders and others for future policy benefits, policyholders’ account balances, policyholder’s dividends, reinsurance payables and separate account liabilities, net of premium receipts and reinsurance recoverables. These future estimated cash flows for current policies in force generally reflect our best estimate economic and actuarial assumptions. These cash flows are undiscounted with respect to interest. The sum of the cash flows shown for all years in the table of
$1,142 billion
exceeds the corresponding liability amounts of approximately
$711 billion
included in the Consolidated Financial Statements as of
December 31, 2018
. Separate account liabilities are legally insulated from general account obligations, and it is generally expected these liabilities will be fully funded by separate account assets and their related cash flows. We have made significant assumptions to determine the future estimated cash flows related to the underlying policies and contracts. Due to the significance of the assumptions used, actual cash flows will differ, possibly materially, from these estimates.
|
|
(6)
|
The estimated payments due by period for other liabilities includes securities sold under agreements to repurchase, cash collateral for loaned securities, liabilities for unrecognized tax benefits, bank customer liabilities, and other miscellaneous liabilities. Amounts presented in the table also exclude
$955 million
of notes issued by consolidated VIE’s which recourse for these obligations is limited to the assets of the respective VIE and do not have recourse to the general credit of the company.
|
We also enter into agreements to purchase goods and services in the normal course of business; however, these purchase obligations are not material to our consolidated results of operations or financial position as of
December 31, 2018
.
Off-Balance Sheet Arrangements
Guarantees and Other Contingencies
In the course of our business, we provide certain guarantees and indemnities to third parties pursuant to which we may be contingently required to make payments in the future. See Note 22 to the Consolidated Financial Statements for additional information.
Other Contingent Commitments
We also have other commitments, some of which are contingent upon events or circumstances not under our control, including those at the discretion of our counterparties. See Note 22 to the Consolidated Financial Statements for additional information regarding these commitments. For further discussion of certain of these commitments that relate to our separate accounts, also see “—Liquidity associated with other activities—PGIM operations.”
Other Off-Balance Sheet Arrangements
In 2013, we entered into a put option agreement with a Delaware trust that gives Prudential Financial the right, at any time over a ten-year period, to issue up to $1.5 billion of senior notes to the trust in return for principal and interest strips of U.S. Treasury securities that are held by the trust. See Note 16 to our Consolidated Financial Statements for more information on this put option agreement. In 2014, Prudential Financial entered into financing transactions, pursuant to which it issued $500 million of limited recourse notes and, in return, obtained $500 million of asset-backed notes from a Delaware master trust and ultimately contributed the asset-backed notes to its subsidiary, PRIAC. As of
December 31, 2018
, no principal payments have been received or are currently due on the asset-backed notes and, as a result, there was no payment obligation under the limited recourse notes. Accordingly, none of the notes are reflected in the Company’s Consolidated Financial Statements as of that date.
Other than as described above, we do not have retained or contingent interests in assets transferred to unconsolidated entities, or variable interests in unconsolidated entities or other similar transactions, arrangements or relationships that serve as credit, liquidity or market risk support, that we believe are reasonably likely to have a material effect on our financial condition, changes in financial condition, revenues or expenses, results of operations, liquidity, capital expenditures or our access to or requirements for capital resources. In addition, other than the agreements referred to above, we do not have relationships with any unconsolidated entities that are contractually limited to narrow activities that facilitate our transfer of or access to associated assets.
140
Risk Management
Overview
We employ a risk governance structure, overseen by senior management and our Board and managed by Enterprise Risk Management (“ERM”), to provide a common framework for evaluating the risks embedded in and across our businesses and corporate centers, developing risk appetites, managing these risks and identifying current and future risk challenges and opportunities. For a discussion of the risks of our businesses, see “Risk Factors”.
Risk Governance Framework
Each of our businesses has a risk governance structure that is supported by a framework at the corporate level. Generally, our businesses are authorized to make day-to-day risk decisions that are consistent with enterprise risk policies and limits, and subject to enterprise oversight. Our governance structure is comprised of the Board and its committees, management committees and ERM and is designed to support this framework.
Board of Directors Oversight
Our Board oversees our risk profile and management’s processes for assessing and managing risk. The Board also reviews strategic risks and opportunities facing the Company. Certain specific categories of risk are assigned to Board committees that report back to the full Board, as summarized below:
|
•
|
Audit Committee: oversees insurance risk and operational risks, including model risk, as well as risks related to financial controls, legal, regulatory and compliance risks, and the overall risk management governance structure and risk management function.
|
|
•
|
Compensation Committee: oversees our compensation programs so that incentives are aligned with appropriate risk taking.
|
|
•
|
Corporate Governance and Business Ethics Committee: oversees our corporate governance procedures and practices, ethics and conflict of interest policies, political contributions, lobbying expenses and overall political strategy, as well as our strategy and reputation regarding environmental stewardship, sustainability and corporate social responsibility.
|
|
•
|
Finance Committee: oversees liquidity risk, including risks involving our capital and liquidity management, the incurrence and repayment of borrowings, the capital structure, the funding of benefit plans and statutory insurance reserves. The Finance Committee reviews and recommends for approval to the Board our capital plan. The Finance Committee also receives regular updates on the sources and uses of capital relative to plan, as well as on our Capital Protection Framework.
|
|
•
|
Investment Committee: oversees investment risk and market risk and the strength of the investment function. The Investment Committee approves investment and market risk limits based on asset class, issuer, credit quality and geography.
|
|
•
|
Risk Committee: oversees the governance of significant risks throughout the Company and the establishment and ongoing monitoring of our risk profile, risk capacity and risk appetite. The Risk Committee also serves to coordinate the risk oversight functions of the other committees of the Board.
|
Management Oversight
Our primary risk management committee is the Enterprise Risk Committee (“ERC”). Currently, the ERC is chaired by our Chief Risk Officer and otherwise comprised of the Vice Chairman, Chief Operating Officers for the U.S. and International Businesses, General Counsel, Chief Financial Officer, Chief Investment Officer and Chief Actuary. Our Chief Auditor also attends meetings of the ERC. The ERC’s mandate is to review significant risks that impact us and approve, or recommend to the Board for approval, our risk management policies and limits to keep our risk profile consistent with our strategy.
The ERC is supported by six Risk Oversight Committees aligned with our tactical risks, each of which is comprised of subject matter experts and dedicated to one of the following risk types: investment, market, insurance, operational, model and liquidity. These Risk Oversight Committees report their activities to the ERC, and significant matters or matters where there are unresolved points of view are reviewed and brought to the ERC. The Risk Oversight Committees provide an opportunity to evaluate complex issues by subject matter experts within the various risk areas. They evaluate the adequacy and effectiveness of risk mitigation options, identify stakeholders of risks and issues, review material assumptions for reasonability and consistency across the Company and, working with the different risk areas, develop recommendations for risk limits, among other responsibilities.
141
Each of our businesses and significant corporate centers maintains its own risk committee. The business risk committees serve as a forum for leaders within each business to identify, assess and resolve risk and exposure issues and to review new products and initiatives, prior to such issues being reviewed by the Risk Oversight Committees and/or the ERC as appropriate. Corporate center risk committees assess and monitor risks associated with the relevant corporate centers, set standards and exercise oversight over specific risks.
Enterprise Risk Management Oversight
ERM manages a comprehensive framework for assessing the risks embedded in and across our businesses so that the Company can manage these risks effectively, evaluate current and future risk challenges and opportunities, and enhance shareholder value. ERM operates independently and is responsible for recommending policies, limits and standards for all risks. It oversees these risks under the guidance of the ERC and Risk Oversight Committees. Additionally, ERM works with our businesses and corporate centers with an objective of comprehensive identification, monitoring and management of risks that we may face. The ERM infrastructure is generally aligned by risk type, with certain groups within ERM working across risk types.
Risk Identification
We rely on a combination of activities and processes to provide analysis and seek assurance that all material risks have been identified and managed as appropriate. There are three levels of activities that seek to ensure that changes in risk levels or new risks to the Company are identified and escalated as appropriate: (1) business activities, (2) corporate center activities, and (3) processes involving senior management and the Board.
|
•
|
Businesses: Each business area has a risk committee that meets periodically to allow senior leaders to discuss and evaluate current, new, and anticipatory risks in their own operations. Businesses are required to develop and maintain documented operational risk inventories which facilitate the identification of current operational risk exposures. Anticipatory risks are identified, assessed and monitored for potential future risks which could significantly impact the businesses or the overall Company.
|
|
•
|
Corporate Centers: The corporate centers review the results of the business activities and examine risks from an enterprise view across businesses under normal and stressed conditions. As a result, the corporate centers, particularly ERM, use several processes and activities to identify and assess the risks of the Company.
|
|
•
|
Senior Management and the Board: Senior management plays a critical role in reviewing the risk profile of the Company, including by identifying impacts to the business strategy of new or changed risks, and risks in any new strategies under consideration. These risks are discussed with the ERC as appropriate, and with the Board, if significant. As discussed above, the Board oversees the Company’s risk profile and management’s processes for assessing and managing risk, both as a full Board and through its committees.
|
Risk Measurement and Monitoring
Our Risk Appetite Framework (“RAF”) is a comprehensive process designed to reasonably ensure that all risks taken across the Company align with the Company’s capacity and willingness to take those risks. Using common metrics allows for a cohesive assessment of risk, resources and strategy, and supports management and the Board in making well-informed business decisions. The Company has a comprehensive stress testing framework, which serves as the foundation for the RAF. The RAF evaluates the Company’s exposure under various stress metrics and stress severities. The RAF provides a dynamic assessment of stress impacts and resources available to absorb these impacts under comprehensive stress scenarios. The Company’s capital management framework is integrated with the RAF to determine the amount of capital the Company needs to hold given the risks taken.
ITEM 7A. QUANTITATIVE AND QUALITATIVE DISCLOSURES ABOUT MARKET RISK
Market Risk
Market risk is defined as the risk of loss from changes in interest rates, equity prices and foreign currency exchange rates resulting from asset/liability mismatches where the change in the value of our liabilities is not offset by the change in value of our assets.
142
For additional information regarding the potential impacts of interest rate and other market fluctuations, as well as general economic and market conditions on our businesses and profitability, see Item 1A. “Risk Factors” above. For additional information regarding the overall management of our general account investments and our asset mix strategies, see “Management’s Discussion and Analysis of Financial Condition and Results of Operations—General Account Investments—Management of Investments” above. For additional information regarding our liquidity and capital resources, which may be impacted by changing market risks, see “Management’s Discussion and Analysis of Financial Condition and Results of Operations—Liquidity and Capital Resources” above.
Market Risk Management
Management of market risk, which we consider to be a combination of both investment risk and market risk exposures, includes the identification and measurement of various forms of risk, the establishment of risk thresholds and the creation of processes intended to maintain risks within these thresholds while optimizing returns on the underlying assets or liabilities.
Our risk management process utilizes a variety of tools and techniques, including:
|
•
|
Measures of price sensitivity to market changes (e.g., interest rates, equity index prices, foreign exchange);
|
|
•
|
Asset/liability management;
|
|
•
|
Stress scenario testing;
|
|
•
|
Hedging programs; and
|
|
•
|
Risk management governance, including policies, limits, and a committee that oversees investment and market risk. For additional information regarding our overall risk management framework and governance structure, see “Management’s Discussion and Analysis of Financial Condition and Results of Operations—Risk Management” above.
|
Market Risk Mitigation
Risk mitigation takes three primary forms:
|
•
|
Asset/Liability Management: Managing assets to liability-based measures. For example, investment policies identify target durations for assets based on liability characteristics and asset portfolios are managed to within ranges around them. This mitigates potential unanticipated economic losses from interest rate movements.
|
|
•
|
Hedging: Using derivatives to offset risk exposures. For example, for our variable annuities, potential living benefit claims resulting from more severe market conditions are hedged using derivative instruments.
|
|
•
|
Management of portfolio concentration risk. For example, ongoing monitoring and management at the enterprise level of key rate, currency and other concentration risks support diversification efforts to mitigate exposure to individual markets and sources of risk.
|
Market Risk Related to Interest Rates
We perform liability-driven investing and engage in careful asset/liability management. Asset/liability mismatches create the risk that changes in liability values will differ from the changes in the value of the related assets. Additionally, changes in interest rates may impact other items including, but not limited to, the following:
|
•
|
Net investment spread between the amounts that we are required to pay and the rate of return we are able to earn on investments for certain products supported by general account investments;
|
|
•
|
Asset-based fees earned on assets under management or contractholder account values;
|
|
•
|
Estimated total gross profits and the amortization of deferred policy acquisition and other costs;
|
|
•
|
Net exposure to the guarantees provided under certain products; and
|
|
•
|
Capital levels of our regulated entities.
|
We use duration and convexity analyses to measure price sensitivity to interest rate changes. Duration measures the relative sensitivity of the fair value of a financial instrument to changes in interest rates. Convexity measures the rate of change of duration with respect to changes in interest rates. We use asset/liability management and derivative strategies to manage our interest rate exposure by legal entity by matching the relative sensitivity of asset and liability values to interest rate changes, or controlling “duration mismatch” of assets and liability duration targets. In certain markets, capital market limitations that hinder our ability to acquire assets that approximate the duration of some of our liabilities are considered in setting duration targets. We consider risk-based capital and tax implications as well as current market conditions in our asset/liability management strategies.
143
We assess the impact of interest rate movements on the value of our financial assets, financial liabilities and derivatives using hypothetical test scenarios that assume either upward or downward 100 basis point parallel shifts in the yield curve from prevailing interest rates, reflecting changes in either credit spreads or the risk-free rate. The following table sets forth the net estimated potential loss in fair value on these financial instruments from a hypothetical 100 basis point upward shift as of
December 31, 2018
and
2017
. This table is presented on a gross basis and excludes offsetting impacts to insurance liabilities that are not considered financial liabilities under U.S GAAP. This scenario results in the greatest net exposure to interest rate risk of the hypothetical scenarios tested at those dates. While the test scenario is for illustrative purposes only and does not reflect our expectations regarding future interest rates or the performance of fixed income markets, it is a near-term, reasonably possible hypothetical change that illustrates the potential impact of such events. These test scenarios do not measure the changes in value that could result from non-parallel shifts in the yield curve which we would expect to produce different changes in discount rates for different maturities. As a result, the actual loss in fair value from a 100 basis point change in interest rates could be different from that indicated by these calculations. The estimated changes in fair values do not include separate account assets.
|
|
As of December 31, 2018
|
As of December 31, 2017
|
||||||||||||||||||||||
|
|
Notional
|
Fair
Value
|
Hypothetical
Change in
Fair Value
|
Notional
|
Fair
Value
|
Hypothetical
Change in
Fair Value
|
||||||||||||||||||
|
|
(in millions)
|
|||||||||||||||||||||||
|
Financial assets with interest rate risk:
|
||||||||||||||||||||||||
|
Fixed maturities(1)
|
$
|
378,850
|
|
$
|
(37,691
|
)
|
$
|
372,926
|
|
$
|
(36,554
|
)
|
||||||||||||
|
Commercial mortgage and other loans
|
59,978
|
|
(2,936
|
)
|
57,341
|
|
(2,832
|
)
|
||||||||||||||||
|
Derivatives with interest rate risk:
|
||||||||||||||||||||||||
|
Swaps
|
$
|
201,872
|
|
5,164
|
|
(4,455
|
)
|
$
|
210,137
|
|
4,735
|
|
(3,824
|
)
|
||||||||||
|
Futures
|
15,139
|
|
13
|
|
(778
|
)
|
24,502
|
|
24
|
|
(1,081
|
)
|
||||||||||||
|
Options
|
83,198
|
|
(337
|
)
|
387
|
|
54,522
|
|
188
|
|
188
|
|
||||||||||||
|
Forwards
|
26,220
|
|
230
|
|
(256
|
)
|
25,948
|
|
(94
|
)
|
0
|
|
||||||||||||
|
Synthetic GICs
|
79,215
|
|
2
|
|
0
|
|
77,290
|
|
(1
|
)
|
(1
|
)
|
||||||||||||
|
Variable annuity and other living benefit feature embedded derivatives(2)
|
(8,926
|
)
|
5,030
|
|
(8,720
|
)
|
5,706
|
|
||||||||||||||||
|
Financial liabilities with interest rate risk(3):
|
||||||||||||||||||||||||
|
Short-term and long-term debt
|
(20,484
|
)
|
3,095
|
|
(21,144
|
)
|
3,180
|
|
||||||||||||||||
|
Policyholders’ account balances—investment contracts
|
(98,428
|
)
|
3,367
|
|
(100,186
|
)
|
3,561
|
|
||||||||||||||||
|
Net estimated potential loss
|
$
|
(34,237
|
)
|
$
|
(31,657
|
)
|
||||||||||||||||||
__________
|
(1)
|
Includes assets classified as “Fixed maturities, available-for-sale, at fair value,” “Assets supporting experience-rated contractholder liabilities, at fair value” and “Fixed maturities, trading, at fair value.” Approximately
$354 billion
and
$370 billion
as of
December 31, 2018
and
2017
, respectively, of fixed maturities are classified as available-for-sale.
|
|
(2)
|
Excludes any offsetting impact of derivative instruments purchased to hedge changes in the embedded derivatives. Amounts reported net of third-party reinsurance.
|
|
(3)
|
Excludes approximately
$324 billion
and
$306 billion
as of
December 31, 2018
and
2017
, respectively, of insurance reserve and deposit liabilities which are not considered financial liabilities. We believe that the interest rate sensitivities of these insurance liabilities would serve as an offset to the net interest rate risk of the financial assets and liabilities, including investment contracts.
|
Under U.S. GAAP, the fair value of the embedded derivatives for certain variable annuity and other living benefit features, reflected in the table above, includes the impact of the market’s perception of our NPR. For more information on NPR related to the sensitivity of the embedded derivatives to our NPR credit spread, see “Management’s Discussion and Analysis of Financial Condition and Results of Operations—Accounting Policies & Pronouncements—Application of Critical Accounting Estimates—Sensitivities for Insurance Assets and Liabilities” above.
For an additional discussion of our variable annuity optional living benefit guarantees accounted for as embedded derivatives and related derivatives used to hedge the changes in fair value of these embedded derivatives, see “Market Risk Related to Certain Variable Annuity Products” below. For additional information about the key estimates and assumptions used in our determination of fair value, see Note 6 to the Consolidated Financial Statements. For information on the impacts of a sustained low interest rate environment, see “Management’s Discussion and Analysis of Financial Condition and Results of Operations—Executive Summary—Impact of a Low Interest Rate Environment” above.
Market Risk Related to Equity Prices
144
We have exposure to equity risk through asset/liability mismatches, including our investments in equity securities held in our general account investment portfolio and unhedged exposure in our insurance liabilities, principally related to certain variable annuity living benefit feature embedded derivatives. Our equity-based derivatives primarily hedge the equity risk embedded in these living benefit feature embedded derivatives, and are also part of our capital hedging program. Changes in equity prices create risk that the resulting changes in asset values will differ from the changes in the value of the liabilities relating to the underlying or hedged products. Additionally, changes in equity prices may impact other items including, but not limited to, the following:
|
•
|
Asset-based fees earned on assets under management or contractholder account value;
|
|
•
|
Estimated total gross profits and the amortization of deferred policy acquisition and other costs; and
|
|
•
|
Net exposure to the guarantees provided under certain products.
|
We manage equity risk against benchmarks in respective markets. We benchmark our return on equity holdings against a blend of market indices, mainly the S&P 500 and Russell 2000 for U.S. equities. We benchmark foreign equities against the Tokyo Price Index, and the MSCI EAFE, a market index of European, Australian, and Far Eastern equities. We target price sensitivities that approximate those of the benchmark indices.
We estimate our equity risk from a hypothetical 10% decline in equity benchmark market levels. The following table sets forth the net estimated potential loss in fair value from such a decline as of
December 31, 2018
and
2017
. While these scenarios are for illustrative purposes only and do not reflect our expectations regarding future performance of equity markets or of our equity portfolio, they represent near-term reasonably possible hypothetical changes that illustrate the potential impact of such events. These scenarios consider only the direct impact on fair value of declines in equity benchmark market levels and not changes in asset-based fees recognized as revenue, changes in our estimates of total gross profits used as a basis for amortizing deferred policy acquisition and other costs, or changes in any other assumptions such as market volatility or mortality, utilization or persistency rates in our variable annuity contracts that could also impact the fair value of our living benefit features. In addition, these scenarios do not reflect the impact of basis risk, such as potential differences in the performance of the investment funds underlying the variable annuity products relative to the market indices we use as a basis for developing our hedging strategy. The impact of basis risk could result in larger differences between the change in fair value of the equity-based derivatives and the related living benefit features in comparison to these scenarios. In calculating these amounts, we exclude separate account equity securities.
|
|
As of December 31, 2018
|
As of December 31, 2017
|
||||||||||||||||||||||
|
|
Notional
|
Fair
Value
|
Hypothetical
Change in
Fair Value
|
Notional
|
Fair
Value
|
Hypothetical
Change in
Fair Value
|
||||||||||||||||||
|
|
(in millions)
|
|||||||||||||||||||||||
|
Equity securities(1)
|
$
|
7,560
|
|
$
|
(756
|
)
|
$
|
8,972
|
|
$
|
(897
|
)
|
||||||||||||
|
Equity-based derivatives(2)
|
$
|
77,143
|
|
867
|
|
1,528
|
|
$
|
52,275
|
|
(128
|
)
|
1,373
|
|
||||||||||
|
Variable annuity and other living benefit feature embedded derivatives(2)(3)
|
(8,926
|
)
|
(1,497
|
)
|
(8,720
|
)
|
(1,423
|
)
|
||||||||||||||||
|
Net estimated potential loss
|
$
|
(725
|
)
|
$
|
(947
|
)
|
||||||||||||||||||
__________
|
(1)
|
Includes equity securities classified as “Assets supporting experience-rated contractholder liabilities” and “Equity securities, at fair value.”
|
|
(2)
|
The notional and fair value of equity-based derivatives and the fair value of variable annuity and other living benefit feature embedded derivatives are also reflected in amounts under “Market Risk Related to Interest Rates” above, and are not cumulative.
|
|
(3)
|
Excludes any offsetting impact of derivative instruments purchased to hedge changes in the embedded derivatives. Amounts reported net of third-party reinsurance.
|
Market Risk Related to Foreign Currency Exchange Rates
As a U.S.-based company with significant business operations outside of the U.S., particularly in Japan, we are exposed to foreign currency exchange rate risk related to these operations, as well as in our general account investment portfolio and other proprietary investment portfolios.
145
For our international insurance operations, changes in foreign currency exchange rates create risk that we may experience volatility in the U.S. dollar-equivalent earnings and equity of these operations. We actively manage this risk through various hedging strategies, including the use of foreign currency hedges and through holding U.S. dollar-denominated securities in the investment portfolios of certain of these operations. Additionally, our Japanese insurance operations offer a variety of non-yen denominated products which are supported by investments in corresponding currencies. While these non-yen denominated assets are economically matched to the currency of the product liabilities, the accounting treatment may differ for changes in the value of these assets and liabilities due to moves in foreign currency exchange rates, resulting in volatility in reported U.S. GAAP earnings. This volatility has been mitigated by disaggregating the U.S. and Australian dollar-denominated businesses in Gibraltar Life into separate divisions, each with its own functional currency that aligns with the underlying products and investments. For certain of our international insurance operations outside of Japan, we elect to not hedge the risk of changes in our equity investments due to foreign exchange rate movements. For further information, see “Management’s Discussion and Analysis of Financial Condition and Results of Operations—Impact of Foreign Currency Exchange Rates—Impact of products denominated in non-local currencies on U.S. GAAP earnings” above.
For our domestic general account investment portfolios supporting our U.S. insurance operations and other proprietary investment portfolios, our foreign currency exchange rate risk arises primarily from investments that are denominated in foreign currencies. We manage this risk by hedging substantially all domestic foreign currency denominated fixed income investments into U.S. dollars. We generally do not hedge all of the foreign currency risk of our investments in equity securities of unaffiliated foreign entities.
We manage our foreign currency exchange rate risks within specified limits, and estimate our exposure, excluding equity in our Japanese insurance operations, to a hypothetical 10% change in foreign currency exchange rates. The following table sets forth the net estimated potential loss in fair value from such a change as of December 31,
2018
and
2017
. While these scenarios are for illustrative purposes only and do not reflect our expectations regarding future changes in foreign exchange markets, they represent reasonably possible near-term hypothetical changes that illustrate the potential impact of such events.
|
|
As of December 31, 2018
|
As of December 31, 2017
|
||||||||||||||||
|
|
Fair
Value
|
Hypothetical
Change in
Fair Value
|
Fair
Value
|
Hypothetical
Change in
Fair Value
|
||||||||||||||
|
|
(in millions)
|
|||||||||||||||||
|
Unhedged portion of equity investment in international subsidiaries and foreign currency denominated investments in domestic general account portfolio
|
$
|
5,414
|
|
$
|
541
|
|
$
|
6,345
|
|
$
|
(635
|
)
|
||||||
For additional information, see “Management’s Discussion and Analysis of Financial Condition and Results of Operations—General Account Investments—Portfolio Composition” and “Management’s Discussion and Analysis of Financial Condition and Results of Operations—Results of Operations by Segment—International Insurance Division” above.
Derivatives
We use derivative financial instruments primarily to reduce market risk from changes in interest rates, equity prices and foreign currency exchange rates, including their use to alter interest rate or foreign currency exposures arising from mismatches between assets and liabilities. Our derivatives primarily include swaps, futures, options and forward contracts that are exchange-traded or contracted in the OTC market.
Our derivatives also include interest rate guarantees we provide on our synthetic GIC products. Synthetic GICs simulate the performance of traditional insurance-related GICs but are accounted for as derivatives under U.S. GAAP due to the fact that the policyholders own the underlying assets, and we only provide a book value “wrap” on the customers’ funds, which are held in a client-owned trust. Since these wraps provide payment of guaranteed principal and interest to the customer, changes in interest rates create risk such that declines in the market value of customers’ funds would increase our net exposure to these guarantees; however, our obligation is limited to payments that are in excess of the existing customers’ fund value. Additionally, we have the ability to periodically reset crediting rates, subject to a 0% minimum floor, as well as the ability to increase prices. Further, our contract provisions provide that, although participants may withdraw funds at book value, contractholder withdrawals may only occur at market value immediately, or at book value over time. These factors, among others, result in these contracts experiencing minimal changes in fair value, despite a more significant notional value.
146
Our derivatives also include those that are embedded in certain financial instruments, and primarily relate to certain optional living benefit features associated with our variable annuity products, as discussed in more detail in “Market Risk Related to Certain Variable Annuity Products” below. For additional information on our derivative activities, see Note 5 to the Consolidated Financial Statements.
Market Risk Related to Certain Variable Annuity Products
The primary risk exposures of our variable annuity contracts relate to actual deviations from, or changes to, the assumptions used in the original pricing of these products, including capital markets assumptions, such as equity market returns, interest rates and market volatility and actuarial assumptions. For our capital markets assumptions, we manage our exposure to the risk created by capital markets fluctuations through a combination of product design elements, such as an automatic rebalancing element and inclusion of certain optional living benefits in our living benefits hedging program. In addition, we consider external reinsurance a form of risk mitigation as well as our capital hedge program. Certain variable annuity optional living benefit features are accounted for as embedded derivatives and recorded at fair value. The market risk sensitivities associated with U.S. GAAP values of both the embedded derivatives and the related derivatives used to hedge the changes in fair value of these embedded derivatives are provided under “Market Risk Related to Interest Rates” and “Market Risk Related to Equity Prices” above.
For additional information regarding our risk management strategies, including our living benefit hedging program and other product design elements, see “Management’s Discussion and Analysis of Financial Condition and Results of Operations—Results of Operations by Segment—Individual Annuities” above.
147
ITEM 8. FINANCIAL STATEMENTS AND SUPPLEMENTARY DATA
CONSOLIDATED FINANCIAL STATEMENTS
TABLE OF CONTENTS
|
|
Page
|
148
Management’s Annual Report on Internal Control Over Financial Reporting
Management of Prudential Financial, Inc. (together with its consolidated subsidiaries, the “Company”) is responsible for establishing and maintaining adequate internal control over financial reporting. Management conducted an assessment of the effectiveness, as of December 31, 2018, of the Company’s internal control over financial reporting, based on the framework established in
Internal Control—Integrated Framework (2013)
issued by the Committee of Sponsoring Organizations of the Treadway Commission (“COSO”). Based on our assessment under that framework, management concluded that the Company’s internal control over financial reporting was effective as of December 31, 2018.
Our internal control over financial reporting is a process designed by or under the supervision of our principal executive and principal financial officers to provide reasonable assurance regarding the reliability of financial reporting and the preparation of financial statements for external purposes in accordance with generally accepted accounting principles. Our internal control over financial reporting includes policies and procedures that (1) pertain to the maintenance of records that, in reasonable detail, accurately and fairly reflect transactions and dispositions of assets; (2) provide reasonable assurance that transactions are recorded as necessary to permit preparation of financial statements in accordance with generally accepted accounting principles, and that receipts and expenditures are being made only in accordance with authorizations of management and the directors of the Company; and (3) provide reasonable assurance regarding prevention or timely detection of unauthorized acquisition, use, or disposition of the Company’s assets that could have a material effect on our financial statements.
Because of its inherent limitations, internal control over financial reporting may not prevent or detect misstatements. Also, projections of any evaluation of effectiveness to future periods are subject to the risk that controls may become inadequate because of changes in conditions, or that the degree of compliance with the policies or procedures may deteriorate.
The effectiveness of the Company’s internal control over financial reporting as of December 31, 2018, has been audited by PricewaterhouseCoopers LLP, an independent registered public accounting firm, as stated in their report appearing herein.
February 15, 2019
149
Report of Independent Registered Public Accounting Firm
To
the Board of Directors and Shareholders of
Prudential Financial, Inc.:
Opinions on the Financial Statements and Internal Control over Financial Reporting
We have audited the accompanying consolidated statements of financial position of Prudential Financial, Inc. and its subsidiaries (the “Company”) as of December 31, 2018 and 2017,
and the related consolidated statements of operations, comprehensive income, equity and cash flows for each of the three years in the period ended December 31, 2018, including the related notes and financial statement schedules listed in the index appearing under Item 15.2 (collectively referred to as the “consolidated financial statements”).
We also have audited the Company's internal control over financial reporting as of December 31, 2018, based on criteria established in
Internal Control - Integrated Framework
(2013)
issued by the Committee of Sponsoring Organizations of the Treadway Commission (COSO).
In our opinion, the consolidated
financial statements referred to above present fairly, in all material respects, the financial position of the Company as of December 31, 2018
and 2017,
and the results of its operations and its cash flows for each of the three years in the period ended December 31, 2018
in conformity with accounting principles generally accepted in the United States of America. Also in our opinion, the Company maintained, in all material respects, effective internal control over financial reporting as of December 31, 2018, based on criteria established in
Internal Control - Integrated Framework
(2013)
issued by the COSO.
Changes in Accounting Principles
As discussed in Note 2 to the consolidated financial statements, the Company changed the manner in which it accounts for certain financial assets and liabilities and the manner in which it accounts for certain tax effects originally recognized in accumulated other comprehensive income in 2018 and the manner in which it accounts for certain reinsurance costs in 2017. As discussed in Note 1 to the consolidated financial statements, Gibraltar Life Insurance Company, Ltd., a wholly owned subsidiary of the Company, changed its year end in 2018.
Basis for Opinions
The Company's management is responsible for these consolidated financial statements, for maintaining effective internal control over financial reporting, and for its assessment of the effectiveness of internal control over financial reporting, included in the accompanying Management's Annual Report on Internal Control over Financial Reporting. Our responsibility is to express opinions on the Company’s consolidated financial statements and on the Company's internal control over financial reporting based on our audits. We are a public accounting firm registered with the Public Company Accounting Oversight Board (United States) (PCAOB) and are required to be independent with respect to the Company in accordance with the U.S. federal securities laws and the applicable rules and regulations of the Securities and Exchange Commission and the PCAOB.
We conducted our audits in accordance with the standards of the PCAOB. Those standards require that we plan and perform the audits to obtain reasonable assurance about whether the consolidated financial statements are free of material misstatement, whether due to error or fraud, and whether effective internal control over financial reporting was maintained in all material respects.
Our audits of the consolidated financial statements included performing procedures to assess the risks of material misstatement of the consolidated financial statements, whether due to error or fraud, and performing procedures that respond to those risks. Such procedures included examining, on a test basis, evidence regarding the amounts and disclosures in the consolidated financial statements. Our audits also included evaluating the accounting principles used and significant estimates made by management, as well as evaluating the overall presentation of the consolidated
financial statements. Our audit of internal control over financial reporting included obtaining an understanding of internal control over financial reporting, assessing the risk that a material weakness exists, and testing and evaluating the design and operating effectiveness of internal control based on the assessed risk. Our audits also included performing such other procedures as we considered necessary in the circumstances. We believe that our audits provide a reasonable basis for our opinions.
Definition and Limitations of Internal Control over Financial Reporting
A company’s internal control over financial reporting is a process designed to provide reasonable assurance regarding the reliability of financial reporting and the preparation of financial statements for external purposes in accordance with generally accepted accounting principles. A company’s internal control over financial reporting includes those policies and procedures that
150
(i) pertain to the maintenance of records that, in reasonable detail, accurately and fairly reflect the transactions and dispositions of the assets of the company; (ii) provide reasonable assurance that transactions are recorded as necessary to permit preparation of financial statements in accordance with generally accepted accounting principles, and that receipts and expenditures of the company are being made only in accordance with authorizations of management and directors of the company; and (iii) provide reasonable assurance regarding prevention or timely detection of unauthorized acquisition, use, or disposition of the company’s assets that could have a material effect on the financial statements.
Because of its inherent limitations, internal control over financial reporting may not prevent or detect misstatements. Also, projections of any evaluation of effectiveness to future periods are subject to the risk that controls may become inadequate because of changes in conditions, or that the degree of compliance with the policies or procedures may deteriorate.
/s/ PricewaterhouseCoopers LLP
New York, New York
February 15, 2019
We have served as the Company’s auditor since 1996, which includes periods before the Company became subject to SEC reporting requirements.
151
PRUDENTIAL FINANCIAL, INC.
Consolidated Statements of Financial Position
December 31,
2018
and
2017
(in millions, except share amounts)
|
2018
|
2017
|
||||||
|
ASSETS
|
|||||||
|
Fixed maturities, available-for-sale, at fair value (amortized cost: 2018 – $331,745; 2017 – $312,385)(1)
|
$
|
353,656
|
|
$
|
346,780
|
|
|
|
Fixed maturities, held-to-maturity, at amortized cost (fair value: 2018 – $2,372; 2017 – $2,430)(1)
|
2,013
|
|
2,049
|
|
|||
|
Fixed maturities, trading, at fair value (amortized cost: 2018 – $3,392; 2017 – $3,509)(1)(2)
|
3,243
|
|
3,507
|
|
|||
|
Assets supporting experience-rated contractholder liabilities, at fair value(1)(2)
|
21,254
|
|
22,097
|
|
|||
|
Equity securities, at fair value (cost: 2018 – $5,219; 2017 – $5,154)(1)(2)
|
6,238
|
|
7,329
|
|
|||
|
Commercial mortgage and other loans (includes $763 and $593 measured at fair value under the fair value option as of December 31, 2018 and 2017, respectively)(1)
|
59,830
|
|
56,045
|
|
|||
|
Policy loans
|
12,016
|
|
11,891
|
|
|||
|
Other invested assets (includes $5,524 and $3,159 measured at fair value as of December 31, 2018 and 2017, respectively)(1)(2)
|
14,526
|
|
13,373
|
|
|||
|
Short-term investments(2)
|
6,469
|
|
6,800
|
|
|||
|
Total investments
|
479,245
|
|
469,871
|
|
|||
|
Cash and cash equivalents(1)
|
15,353
|
|
14,490
|
|
|||
|
Accrued investment income(1)
|
3,318
|
|
3,325
|
|
|||
|
Deferred policy acquisition costs
|
20,058
|
|
18,992
|
|
|||
|
Value of business acquired
|
1,850
|
|
1,591
|
|
|||
|
Other assets(1)
|
16,118
|
|
17,250
|
|
|||
|
Separate account assets
|
279,136
|
|
306,617
|
|
|||
|
TOTAL ASSETS
|
$
|
815,078
|
|
$
|
832,136
|
|
|
|
LIABILITIES AND EQUITY
|
|||||||
|
LIABILITIES
|
|||||||
|
Future policy benefits
|
$
|
273,846
|
|
$
|
257,317
|
|
|
|
Policyholders’ account balances
|
150,338
|
|
148,189
|
|
|||
|
Policyholders’ dividends
|
4,110
|
|
6,411
|
|
|||
|
Securities sold under agreements to repurchase
|
9,950
|
|
8,400
|
|
|||
|
Cash collateral for loaned securities
|
3,929
|
|
4,354
|
|
|||
|
Income taxes
|
7,936
|
|
9,648
|
|
|||
|
Short-term debt
|
2,451
|
|
1,380
|
|
|||
|
Long-term debt
|
17,378
|
|
17,172
|
|
|||
|
Other liabilities(1)
|
16,018
|
|
16,619
|
|
|||
|
Notes issued by consolidated variable interest entities (includes $595 and $1,196 measured at fair value under the fair value option as of December 31, 2018 and 2017, respectively)(1)
|
955
|
|
1,518
|
|
|||
|
Separate account liabilities
|
279,136
|
|
306,617
|
|
|||
|
Total liabilities
|
766,047
|
|
777,625
|
|
|||
|
COMMITMENTS AND CONTINGENT LIABILITIES (See Note 22)
|
|
|
|||||
|
EQUITY
|
|||||||
|
Preferred Stock ($.01 par value; 10,000,000 shares authorized; none issued)
|
0
|
|
0
|
|
|||
|
Common Stock ($.01 par value; 1,500,000,000 shares authorized; 660,111,339 shares issued as of both December 31, 2018 and 2017)
|
6
|
|
6
|
|
|||
|
Additional paid-in capital
|
24,828
|
|
24,769
|
|
|||
|
Common Stock held in treasury, at cost (249,398,887 and 237,559,118 shares as of December 31, 2018 and 2017, respectively)
|
(17,593
|
)
|
(16,284
|
)
|
|||
|
Accumulated other comprehensive income (loss)
|
10,906
|
|
17,074
|
|
|||
|
Retained earnings
|
30,470
|
|
28,671
|
|
|||
|
Total Prudential Financial, Inc. equity
|
48,617
|
|
54,236
|
|
|||
|
Noncontrolling interests
|
414
|
|
275
|
|
|||
|
Total equity
|
49,031
|
|
54,511
|
|
|||
|
TOTAL LIABILITIES AND EQUITY
|
$
|
815,078
|
|
$
|
832,136
|
|
|
|
(1)
|
See Note 4 for details of balances associated with variable interest entities.
|
|
(2)
|
Prior period amounts have been reclassified to conform to current period presentation. See “Adoption of ASU 2016-01” in Note 2 for details.
|
See Notes to Consolidated Financial Statements
152
PRUDENTIAL FINANCIAL, INC.
Consolidated Statements of Operations
Years Ended December 31,
2018
,
2017
and
2016
(in millions, except per share amounts)
|
2018
|
2017
|
2016
|
|||||||||
|
REVENUES
|
|||||||||||
|
Premiums
|
$
|
35,779
|
|
$
|
32,091
|
|
$
|
30,964
|
|
||
|
Policy charges and fee income
|
6,002
|
|
5,303
|
|
5,906
|
|
|||||
|
Net investment income
|
16,176
|
|
16,435
|
|
15,520
|
|
|||||
|
Asset management and service fees
|
4,100
|
|
4,127
|
|
3,752
|
|
|||||
|
Other income (loss)
|
(1,042
|
)
|
1,301
|
|
443
|
|
|||||
|
Realized investment gains (losses), net:
|
|||||||||||
|
Other-than-temporary impairments on fixed maturity securities
|
(279
|
)
|
(289
|
)
|
(269
|
)
|
|||||
|
Other-than-temporary impairments on fixed maturity securities transferred to other comprehensive income
|
0
|
|
22
|
|
47
|
|
|||||
|
Other realized investment gains (losses), net
|
2,256
|
|
699
|
|
2,416
|
|
|||||
|
Total realized investment gains (losses), net
|
1,977
|
|
432
|
|
2,194
|
|
|||||
|
Total revenues
|
62,992
|
|
59,689
|
|
58,779
|
|
|||||
|
BENEFITS AND EXPENSES
|
|||||||||||
|
Policyholders’ benefits
|
39,404
|
|
33,794
|
|
33,632
|
|
|||||
|
Interest credited to policyholders’ account balances
|
3,196
|
|
3,822
|
|
3,761
|
|
|||||
|
Dividends to policyholders
|
1,336
|
|
2,091
|
|
2,025
|
|
|||||
|
Amortization of deferred policy acquisition costs
|
2,273
|
|
1,580
|
|
1,877
|
|
|||||
|
General and administrative expenses
|
11,949
|
|
11,915
|
|
11,779
|
|
|||||
|
Total benefits and expenses
|
58,158
|
|
53,202
|
|
53,074
|
|
|||||
|
INCOME (LOSS) BEFORE INCOME TAXES AND EQUITY IN EARNINGS OF OPERATING JOINT VENTURES
|
4,834
|
|
6,487
|
|
5,705
|
|
|||||
|
Total income tax expense (benefit)
|
822
|
|
(1,438
|
)
|
1,335
|
|
|||||
|
INCOME (LOSS) BEFORE EQUITY IN EARNINGS OF OPERATING JOINT VENTURES
|
4,012
|
|
7,925
|
|
4,370
|
|
|||||
|
Equity in earnings of operating joint ventures, net of taxes
|
76
|
|
49
|
|
49
|
|
|||||
|
NET INCOME (LOSS)
|
4,088
|
|
7,974
|
|
4,419
|
|
|||||
|
Less: Income (loss) attributable to noncontrolling interests
|
14
|
|
111
|
|
51
|
|
|||||
|
NET INCOME (LOSS) ATTRIBUTABLE TO PRUDENTIAL FINANCIAL, INC.
|
$
|
4,074
|
|
$
|
7,863
|
|
$
|
4,368
|
|
||
|
EARNINGS PER SHARE
|
|||||||||||
|
Basic earnings per share-Common Stock:
|
|||||||||||
|
Net income (loss) attributable to Prudential Financial, Inc.
|
$
|
9.64
|
|
$
|
18.19
|
|
$
|
9.85
|
|
||
|
Diluted earnings per share-Common Stock:
|
|||||||||||
|
Net income (loss) attributable to Prudential Financial, Inc.
|
$
|
9.50
|
|
$
|
17.86
|
|
$
|
9.71
|
|
||
|
Dividends declared per share of Common Stock
|
$
|
3.60
|
|
$
|
3.00
|
|
$
|
2.80
|
|
||
See Notes to Consolidated Financial Statements
153
PRUDENTIAL FINANCIAL, INC.
Consolidated Statements of Comprehensive Income
Years Ended December 31,
2018
,
2017
and
2016
(in millions)
|
2018
|
2017
|
2016
|
|||||||||
|
NET INCOME (LOSS)
|
$
|
4,088
|
|
$
|
7,974
|
|
$
|
4,419
|
|
||
|
Other comprehensive income (loss), before tax:
|
|||||||||||
|
Foreign currency translation adjustments for the period
|
(68
|
)
|
751
|
|
256
|
|
|||||
|
Net unrealized investment gains (losses)
|
(8,393
|
)
|
2,397
|
|
3,683
|
|
|||||
|
Defined benefit pension and postretirement unrecognized periodic benefit (cost)
|
(320
|
)
|
71
|
|
(254
|
)
|
|||||
|
Total
|
(8,781
|
)
|
3,219
|
|
3,685
|
|
|||||
|
Less: Income tax expense (benefit) related to other comprehensive income (loss)
|
(1,812
|
)
|
784
|
|
1,305
|
|
|||||
|
Other comprehensive income (loss), net of taxes
|
(6,969
|
)
|
2,435
|
|
2,380
|
|
|||||
|
Comprehensive income (loss)
|
(2,881
|
)
|
10,409
|
|
6,799
|
|
|||||
|
Less: Comprehensive income (loss) attributable to noncontrolling interests
|
19
|
|
93
|
|
95
|
|
|||||
|
Comprehensive income (loss) attributable to Prudential Financial, Inc.
|
$
|
(2,900
|
)
|
$
|
10,316
|
|
$
|
6,704
|
|
||
See Notes to Consolidated Financial Statements
154
PRUDENTIAL FINANCIAL, INC.
Consolidated Statements of Equity
Years Ended December 31,
2018
,
2017
and
2016
(in millions)
|
Common
Stock
|
Additional
Paid-in
Capital
|
Retained
Earnings
|
Common
Stock
Held In
Treasury
|
Accumulated
Other
Comprehensive
Income (Loss)
|
Total
Prudential
Financial, Inc.
Equity
|
Noncontrolling
Interests
|
Total
Equity
|
||||||||||||||||||||||||
|
Balance, December 31, 2015
|
$
|
6
|
|
$
|
24,482
|
|
$
|
18,931
|
|
$
|
(13,814
|
)
|
$
|
12,285
|
|
$
|
41,890
|
|
$
|
33
|
|
$
|
41,923
|
|
|||||||
|
Elimination of Gibraltar Life reporting lag
|
167
|
|
167
|
|
|
167
|
|
||||||||||||||||||||||||
|
Cumulative effect of adoption of accounting changes
|
11
|
|
11
|
|
(30
|
)
|
(19
|
)
|
|||||||||||||||||||||||
|
Common Stock acquired
|
(2,000
|
)
|
(2,000
|
)
|
(2,000
|
)
|
|||||||||||||||||||||||||
|
Class B Stock repurchase adjustment
|
(119
|
)
|
(119
|
)
|
(119
|
)
|
|||||||||||||||||||||||||
|
Contributions from noncontrolling interests
|
7
|
|
7
|
|
|||||||||||||||||||||||||||
|
Distributions to noncontrolling interests
|
(351
|
)
|
(351
|
)
|
|||||||||||||||||||||||||||
|
Consolidations/(deconsolidations) of noncontrolling interests
|
471
|
|
471
|
|
|||||||||||||||||||||||||||
|
Stock-based compensation programs
|
124
|
|
498
|
|
622
|
|
622
|
|
|||||||||||||||||||||||
|
Dividends declared on Common Stock
|
(1,245
|
)
|
(1,245
|
)
|
(1,245
|
)
|
|||||||||||||||||||||||||
|
Comprehensive income:
|
|||||||||||||||||||||||||||||||
|
Net income (loss)
|
4,368
|
|
4,368
|
|
51
|
|
4,419
|
|
|||||||||||||||||||||||
|
Other comprehensive income (loss), net of tax
|
2,336
|
|
2,336
|
|
44
|
|
2,380
|
|
|||||||||||||||||||||||
|
Total comprehensive income (loss)
|
6,704
|
|
95
|
|
6,799
|
|
|||||||||||||||||||||||||
|
Balance, December 31, 2016
|
6
|
|
24,606
|
|
22,113
|
|
(15,316
|
)
|
14,621
|
|
46,030
|
|
225
|
|
46,255
|
|
|||||||||||||||
|
Cumulative effect of adoption of accounting changes
|
5
|
|
(5
|
)
|
0
|
|
0
|
|
|||||||||||||||||||||||
|
Common Stock acquired
|
(1,250
|
)
|
(1,250
|
)
|
(1,250
|
)
|
|||||||||||||||||||||||||
|
Contributions from noncontrolling interests
|
10
|
|
10
|
|
|||||||||||||||||||||||||||
|
Distributions to noncontrolling interests
|
(50
|
)
|
(50
|
)
|
|||||||||||||||||||||||||||
|
Consolidations/(deconsolidations) of noncontrolling interests
|
(3
|
)
|
(3
|
)
|
|||||||||||||||||||||||||||
|
Stock-based compensation programs
|
158
|
|
282
|
|
440
|
|
440
|
|
|||||||||||||||||||||||
|
Dividends declared on Common Stock
|
(1,300
|
)
|
(1,300
|
)
|
(1,300
|
)
|
|||||||||||||||||||||||||
|
Comprehensive income:
|
|||||||||||||||||||||||||||||||
|
Net income (loss)
|
7,863
|
|
7,863
|
|
111
|
|
7,974
|
|
|||||||||||||||||||||||
|
Other comprehensive income (loss), net of tax
|
2,453
|
|
2,453
|
|
(18
|
)
|
2,435
|
|
|||||||||||||||||||||||
|
Total comprehensive income (loss)
|
10,316
|
|
93
|
|
10,409
|
|
|||||||||||||||||||||||||
|
Balance, December 31, 2017
|
6
|
|
24,769
|
|
28,671
|
|
(16,284
|
)
|
17,074
|
|
54,236
|
|
275
|
|
54,511
|
|
|||||||||||||||
|
Cumulative effect of adoption of ASU 2016-01
|
904
|
|
(847
|
)
|
57
|
|
57
|
|
|||||||||||||||||||||||
|
Cumulative effect of adoption of ASU 2018-02
|
(1,653
|
)
|
1,653
|
|
0
|
|
0
|
|
|||||||||||||||||||||||
|
Common Stock acquired
|
(1,500
|
)
|
(1,500
|
)
|
(1,500
|
)
|
|||||||||||||||||||||||||
|
Contributions from noncontrolling interests
|
147
|
|
147
|
|
|||||||||||||||||||||||||||
|
Distributions to noncontrolling interests
|
(27
|
)
|
(27
|
)
|
|||||||||||||||||||||||||||
|
Stock-based compensation programs
|
59
|
|
191
|
|
250
|
|
250
|
|
|||||||||||||||||||||||
|
Dividends declared on Common Stock
|
(1,526
|
)
|
(1,526
|
)
|
(1,526
|
)
|
|||||||||||||||||||||||||
|
Comprehensive income:
|
|||||||||||||||||||||||||||||||
|
Net income (loss)
|
4,074
|
|
4,074
|
|
14
|
|
4,088
|
|
|||||||||||||||||||||||
|
Other comprehensive income (loss), net of tax
|
(6,974
|
)
|
(6,974
|
)
|
5
|
|
(6,969
|
)
|
|||||||||||||||||||||||
|
Total comprehensive income (loss)
|
(2,900
|
)
|
19
|
|
(2,881
|
)
|
|||||||||||||||||||||||||
|
Balance, December 31, 2018
|
$
|
6
|
|
$
|
24,828
|
|
$
|
30,470
|
|
$
|
(17,593
|
)
|
$
|
10,906
|
|
$
|
48,617
|
|
$
|
414
|
|
$
|
49,031
|
|
|||||||
See Notes to Consolidated Financial Statements
155
PRUDENTIAL FINANCIAL, INC.
Consolidated Statements of Cash Flows
Years Ended December 31,
2018
,
2017
and
2016
(in millions)
|
2018
|
2017
|
2016
|
||||||||||
|
CASH FLOWS FROM OPERATING ACTIVITIES
|
||||||||||||
|
Net income (loss)
|
$
|
4,088
|
|
$
|
7,974
|
|
$
|
4,419
|
|
|||
|
Adjustments to reconcile net income (loss) to net cash provided by operating activities:
|
||||||||||||
|
Realized investment (gains) losses, net
|
(1,977
|
)
|
(432
|
)
|
(2,194
|
)
|
||||||
|
Policy charges and fee income
|
(2,248
|
)
|
(2,476
|
)
|
(1,907
|
)
|
||||||
|
Interest credited to policyholders’ account balances
|
3,196
|
|
3,822
|
|
3,761
|
|
||||||
|
Depreciation and amortization
|
161
|
|
222
|
|
318
|
|
||||||
|
(Gains) losses on assets supporting experience-rated contractholder liabilities, net
|
863
|
|
(336
|
)
|
17
|
|
||||||
|
Change in:
|
||||||||||||
|
Deferred policy acquisition costs
|
(597
|
)
|
(1,240
|
)
|
(968
|
)
|
||||||
|
Future policy benefits and other insurance liabilities
|
16,481
|
|
10,940
|
|
10,584
|
|
||||||
|
Income taxes
|
49
|
|
(1,619
|
)
|
618
|
|
||||||
|
Derivatives, net
|
968
|
|
(2,268
|
)
|
1,067
|
|
||||||
|
Other, net(1)
|
680
|
|
(1,127
|
)
|
(839
|
)
|
||||||
|
Cash flows from (used in) operating activities(1)
|
21,664
|
|
13,460
|
|
14,876
|
|
||||||
|
CASH FLOWS FROM INVESTING ACTIVITIES
|
||||||||||||
|
Proceeds from the sale/maturity/prepayment of:
|
||||||||||||
|
Fixed maturities, available-for-sale
|
59,675
|
|
58,244
|
|
49,713
|
|
||||||
|
Fixed maturities, held-to-maturity
|
94
|
|
155
|
|
271
|
|
||||||
|
Fixed maturities, trading(1)
|
623
|
|
1,406
|
|
1,511
|
|
||||||
|
Assets supporting experience-rated contractholder liabilities(1)
|
27,383
|
|
39,057
|
|
32,158
|
|
||||||
|
Equity securities(1)
|
3,771
|
|
4,718
|
|
3,866
|
|
||||||
|
Commercial mortgage and other loans
|
6,474
|
|
6,076
|
|
6,342
|
|
||||||
|
Policy loans
|
2,309
|
|
2,403
|
|
2,277
|
|
||||||
|
Other invested assets(1)
|
1,549
|
|
1,332
|
|
1,133
|
|
||||||
|
Short-term investments(1)
|
33,846
|
|
29,328
|
|
43,813
|
|
||||||
|
Payments for the purchase/origination of:
|
||||||||||||
|
Fixed maturities, available-for-sale
|
(77,234
|
)
|
(68,667
|
)
|
(66,857
|
)
|
||||||
|
Fixed maturities, held-to-maturity
|
(9
|
)
|
0
|
|
0
|
|
||||||
|
Fixed maturities, trading(1)
|
(1,080
|
)
|
(1,839
|
)
|
(2,880
|
)
|
||||||
|
Assets supporting experience-rated contractholder liabilities(1)
|
(27,315
|
)
|
(39,031
|
)
|
(33,297
|
)
|
||||||
|
Equity securities(1)
|
(3,254
|
)
|
(2,990
|
)
|
(3,334
|
)
|
||||||
|
Commercial mortgage and other loans
|
(10,328
|
)
|
(8,857
|
)
|
(8,548
|
)
|
||||||
|
Policy loans
|
(1,970
|
)
|
(1,929
|
)
|
(1,882
|
)
|
||||||
|
Other invested assets
|
(2,664
|
)
|
(1,780
|
)
|
(1,923
|
)
|
||||||
|
Short-term investments(1)
|
(33,336
|
)
|
(28,405
|
)
|
(43,483
|
)
|
||||||
|
Acquisitions, net of cash acquired
|
0
|
|
(64
|
)
|
(532
|
)
|
||||||
|
Derivatives, net
|
26
|
|
(391
|
)
|
314
|
|
||||||
|
Other, net(1)
|
(188
|
)
|
(723
|
)
|
(356
|
)
|
||||||
|
Cash flows from (used in) investing activities(1)
|
(21,628
|
)
|
(11,957
|
)
|
(21,694
|
)
|
||||||
|
CASH FLOWS FROM FINANCING ACTIVITIES
|
||||||||||||
|
Policyholders’ account deposits
|
28,791
|
|
26,462
|
|
29,642
|
|
||||||
|
Policyholders’ account withdrawals
|
(27,287
|
)
|
(25,657
|
)
|
(24,143
|
)
|
||||||
|
Net change in securities sold under agreements to repurchase and cash collateral for loaned securities
|
1,125
|
|
815
|
|
561
|
|
||||||
|
Cash dividends paid on Common Stock
|
(1,521
|
)
|
(1,296
|
)
|
(1,300
|
)
|
||||||
|
Net change in financing arrangements (maturities 90 days or less)
|
199
|
|
38
|
|
292
|
|
||||||
|
Common Stock acquired
|
(1,500
|
)
|
(1,250
|
)
|
(2,000
|
)
|
||||||
|
Class B stock acquired
|
0
|
|
0
|
|
(119
|
)
|
||||||
|
Common Stock reissued for exercise of stock options
|
132
|
|
246
|
|
426
|
|
||||||
|
Proceeds from the issuance of debt (maturities longer than 90 days)
|
2,934
|
|
1,225
|
|
2,742
|
|
||||||
|
Repayments of debt (maturities longer than 90 days)
|
(1,810
|
)
|
(1,827
|
)
|
(2,753
|
)
|
||||||
|
Excess tax benefits from share-based payment arrangements
|
0
|
|
0
|
|
21
|
|
||||||
|
Other, net
|
(282
|
)
|
(14
|
)
|
(168
|
)
|
||||||
|
Cash flows from (used in) financing activities
|
781
|
|
(1,258
|
)
|
3,201
|
|
||||||
|
Effect of foreign exchange rate changes on cash balances
|
142
|
|
110
|
|
50
|
|
||||||
|
NET INCREASE (DECREASE) IN CASH, CASH EQUIVALENTS, RESTRICTED CASH AND RESTRICTED CASH EQUIVALENT(1)
|
959
|
|
355
|
|
(3,567
|
)
|
||||||
|
CASH, CASH EQUIVALENTS, RESTRICTED CASH AND RESTRICTED CASH EQUIVALENT, BEGINNING OF YEAR(1)
|
14,536
|
|
14,181
|
|
17,748
|
|
||||||
|
CASH, CASH EQUIVALENTS, RESTRICTED CASH AND RESTRICTED CASH EQUIVALENT, END OF YEAR(1)
|
$
|
15,495
|
|
$
|
14,536
|
|
$
|
14,181
|
|
|||
156
PRUDENTIAL FINANCIAL, INC.
Consolidated Statements of Cash Flows
Years Ended December 31,
2018
,
2017
and
2016
(in millions)
|
2018
|
2017
|
2016
|
||||||||||
|
SUPPLEMENTAL CASH FLOW INFORMATION
|
||||||||||||
|
Income taxes paid, net of refunds
|
$
|
760
|
|
$
|
185
|
|
$
|
770
|
|
|||
|
Interest paid
|
$
|
1,443
|
|
$
|
1,248
|
|
$
|
1,257
|
|
|||
|
NON-CASH TRANSACTIONS DURING THE YEAR
|
||||||||||||
|
Treasury Stock shares issued for stock-based compensation programs
|
$
|
138
|
|
$
|
104
|
|
$
|
115
|
|
|||
|
Significant Pension Risk Transfer transactions:
|
||||||||||||
|
Assets received, excluding cash and cash equivalents
|
$
|
816
|
|
$
|
2,726
|
|
$
|
3,228
|
|
|||
|
Liabilities assumed
|
8,395
|
|
6,155
|
|
5,003
|
|
||||||
|
Net cash received
|
$
|
7,579
|
|
$
|
3,429
|
|
$
|
1,775
|
|
|||
|
Acquisitions:
|
||||||||||||
|
Assets acquired, excluding cash and cash equivalents
|
$
|
0
|
|
$
|
196
|
|
$
|
0
|
|
|||
|
Liabilities assumed
|
0
|
|
132
|
|
0
|
|
||||||
|
Net cash paid on acquisition
|
$
|
0
|
|
$
|
64
|
|
$
|
0
|
|
|||
|
RECONCILIATION TO STATEMENT OF FINANCIAL POSITION
|
||||||||||||
|
Cash and cash equivalents
|
$
|
15,353
|
|
$
|
14,490
|
|
$
|
14,127
|
|
|||
|
Restricted cash and restricted cash equivalents (included in “Other assets”)
|
142
|
|
46
|
|
54
|
|
||||||
|
Total cash, cash equivalents restricted cash and restricted cash equivalents
|
$
|
15,495
|
|
$
|
14,536
|
|
$
|
14,181
|
|
|||
_____________
|
(1)
|
Prior period amounts have been reclassified to conform to current period presentation. See Note 2 for details.
|
See Notes to Consolidated Financial Statements
157
PRUDENTIAL FINANCIAL, INC.
Notes to Consolidated Financial Statements
|
1.
|
BUSINESS AND BASIS OF PRESENTATION
|
Prudential Financial, Inc. (“Prudential Financial” or “PFI”) and its subsidiaries (collectively, “Prudential” or the “Company”) provide a wide range of insurance, investment management, and other financial products and services to both individual and institutional customers throughout the United States and in many other countries. Principal products and services provided include life insurance, annuities, retirement-related services, mutual funds and investment management.
The Company’s principal operations are comprised of
five
divisions, which together encompass
seven
segments, and its Corporate and Other operations. The PGIM division is comprised of the PGIM segment, the global investment management business of the Company (retitled from the “Investment Management division” and the “Investment Management segment” effective in the second quarter of 2018). The U.S. Workplace Solutions division consists of the Retirement and Group Insurance segments. The U.S. Individual Solutions division consists of the Individual Annuities and Individual Life segments. The International Insurance division is comprised of the International Insurance segment, and the Closed Block division is comprised of the Closed Block segment. The Closed Block division is accounted for as a divested business that is reported separately from the divested and run-off businesses that are included in the Company’s Corporate and Other operations. The Company’s Corporate and Other operations include corporate items and initiatives that are not allocated to business segments and businesses that have been or will be divested or placed in run-off, excluding the Closed Block division.
Basis of Presentation
The Company’s Consolidated Financial Statements have been prepared in accordance with accounting principles generally accepted in the United States of America (“U.S. GAAP”). The Company’s Consolidated Financial Statements include the accounts of Prudential Financial, entities over which the Company exercises control, including majority-owned subsidiaries and minority-owned entities such as limited partnerships in which the Company is the general partner, and variable interest entities (“VIEs”) in which the Company is considered the primary beneficiary. See Note 4 for more information on the Company’s consolidated variable interest entities. Intercompany balances and transactions have been eliminated.
Elimination of Gibraltar Life Reporting Lag
Prior to January 1, 2018, the Company’s Gibraltar Life Insurance Company, Ltd. (“Gibraltar Life”) consolidated operations used a November 30 fiscal year end for purposes of inclusion in the Company’s Consolidated Financial Statements. The result of this reporting date difference was a one-month reporting lag for Gibraltar Life. As a result, the Company’s consolidated balance sheet as of December 31,
2017
, previously included the assets and liabilities of Gibraltar Life as of November 30, 2017, and the Company’s consolidated income statement data for the years ended December 31,
2017
and
2016
, included Gibraltar Life’s results of operations for the twelve months ended November 30 for each respective year.
Effective January 1, 2018, the Company converted its Gibraltar Life operations to a December 31 fiscal year end. This action eliminated the one-month reporting lag so that the reporting dates and periods of financial balances and results of Gibraltar Life are consistent with those of the Company. The establishment of a new fiscal year end for Gibraltar Life is considered a change in accounting principle to a preferable method and requires retrospective application. The Company believes this change in accounting principle is preferable given that it aligns the reporting dates of Prudential Financial and its subsidiaries, which allows for a more timely and consistent basis of reporting the financial position and results of Gibraltar Life. In order to effect this elimination, the Company restated prior periods’ equity which increased “Retained earnings” by approximately
$167 million
as of December 31, 2015, 2016 and 2017. The impact to the Statements of Operations, Statements of Cash Flows, Statements of Comprehensive Income and other balance sheet captions, as a result of the elimination of the reporting lag, was not material for any of the periods presented.
Use of Estimates
The preparation of financial statements in conformity with U.S. GAAP requires management to make estimates and assumptions that affect the reported amounts of assets and liabilities and disclosure of contingent assets and liabilities as of the date of the financial statements and the reported amounts of revenues and expenses during the reporting period. Actual results could differ from those estimates.
158
The most significant estimates include those used in determining deferred policy acquisition costs (“DAC”) and related amortization; value of business acquired (“VOBA”) and its amortization; amortization of deferred sales inducements (“DSI”); measurement of goodwill and any related impairment; valuation of investments including derivatives and the recognition of other-than-temporary impairments (“OTTI”); future policy benefits including guarantees; pension and other postretirement benefits; provision for income taxes and valuation of deferred tax assets; and accruals for contingent liabilities, including estimates for losses in connection with unresolved legal and regulatory matters.
Out of Period Adjustments
As previously disclosed in its Annual Report on Form 10-K for the year ended December 31, 2016, during 2016, the Company recorded out of period adjustments that resulted in an aggregate net decrease of
$134 million
to “Income (loss) before income taxes and equity in earnings of operating joint ventures” for the year ended December 31, 2016. Such adjustments primarily consisted of a charge of
$141 million
to increase reserves, net of a related increase in DAC, for certain universal life products within the Individual Life business. Management evaluated the adjustments, both individually and in the aggregate, and concluded that they were not material to any previously reported quarterly or annual financial statements. For additional information on the impact of these adjustments to the Company’s operating segments, see Note 21.
Reclassifications
Certain amounts in prior periods have been reclassified to conform to the current period presentation.
|
2.
|
SIGNIFICANT ACCOUNTING POLICIES AND PRONOUNCEMENTS
|
ASSETS
Fixed maturities, available-for-sale, at fair value
and
Fixed maturities, held-to-maturity, at amortized cost
are comprised of bonds, notes and redeemable preferred stock. Fixed maturities classified as “available-for-sale” are carried at fair value. See Note 6 for additional information regarding the determination of fair value. The associated unrealized gains and losses, net of tax, and the effect on DAC, VOBA, DSI, future policy benefits, policyholders’ account balances and policyholders’ dividends that would result from the realization of unrealized gains and losses, are included in “Accumulated other comprehensive income (loss)” (“AOCI”). Fixed maturities that the Company has both the positive intent and ability to hold to maturity are carried at amortized cost and classified as “held-to-maturity.” The purchased cost of fixed maturities is adjusted for amortization of premiums and accretion of discounts to maturity or, if applicable, call date.
Interest income, and amortization of premium and accretion of discount are included in “Net investment income” under the effective yield method. Additionally, prepayment premiums are also included in “Net investment income.” For mortgage-backed and asset-backed securities, the effective yield is based on estimated cash flows, including interest rate and prepayment assumptions based on data from widely accepted third-party data sources or internal estimates. In addition to interest rate and prepayment assumptions, cash flow estimates also vary based on other assumptions regarding the underlying collateral, including default rates and changes in value. These assumptions can significantly impact income recognition and the amount of OTTI recognized in earnings and other comprehensive income (loss) (“OCI”). For high credit quality mortgage-backed and asset-backed securities (those rated AA or above), cash flows are provided quarterly, and the amortized cost and effective yield of the securities are adjusted as necessary to reflect historical prepayment experience and changes in estimated future prepayments. The adjustments to amortized cost are recorded as a charge or credit to “Net investment income” in accordance with the retrospective method. For mortgage-backed and asset-backed securities rated below AA, or those for which an OTTI has been recorded, the effective yield is adjusted prospectively for any changes in estimated cash flows. See the discussion below on realized investment gains and losses for a description of the accounting for impairments.
Fixed maturities, trading, at fair value
consists of fixed maturities with embedded features and assets contained within consolidated variable interest entities. Realized and unrealized gains and losses on these investments are reported in “Other income (loss),” and interest and dividend income from these investments is reported in “Net investment income.”
Assets supporting experience-rated contractholder liabilities, at fair value
includes invested assets that consist of fixed maturities, equity securities, short-term investments and cash equivalents, that support certain products included in the Retirement and International Insurance segments which are experience-rated, meaning that the investment results associated with these products are expected to ultimately accrue to contractholders. Realized and unrealized gains and losses for these investments are reported in “Other income (loss).” Interest and dividend income from these investments is reported in “Net investment income.”
159
Equity securities, at fair value
is comprised of common stock, mutual fund shares and non-redeemable preferred stock, which are carried at fair value. Realized and unrealized gains and losses on these investments are reported in “Other income (loss),” and dividend income is reported in “Net investment income” on the ex-dividend date.
Commercial mortgage and other loans
consists of commercial mortgage loans, agricultural property loans, loans backed by residential properties, as well as certain other collateralized and uncollateralized loans. Loans backed by residential properties primarily include recourse loans held by the Company’s international insurance businesses. Uncollateralized loans primarily represent reverse dual currency loans and corporate loans held by the Company’s international insurance businesses.
Commercial mortgage and other loans originated and held for investment are generally carried at unpaid principal balance, net of unamortized deferred loan origination fees and expenses, and net of an allowance for losses. The Company carries certain commercial mortgage loans originated within the Company’s commercial mortgage operations at fair value where the fair value option has been elected. Loans held for sale where the Company has not elected the fair value option are carried at the lower of cost or fair value. Commercial mortgage and other loans acquired, including those related to the acquisition of a business, are recorded at fair value when purchased, reflecting any premiums or discounts to unpaid principal balances. Interest income, and the amortization of the related premiums or discounts, are included in “Net investment income” under the effective yield method. Prepayment fees are also included in “Net investment income.”
Impaired loans include those loans for which it is probable that amounts due will not all be collected according to the contractual terms of the loan agreement. The Company defines “past due” as principal or interest not collected at least 30 days past the scheduled contractual due date. Interest received on loans that are past due, including impaired and non-impaired loans as well as loans that were previously modified in a troubled debt restructuring, is either applied against the principal or reported as net investment income based on the Company’s assessment as to the collectability of the principal. See Note 3 for additional information about the Company’s past due loans.
The Company discontinues accruing interest on loans after the loans become 90 days delinquent as to principal or interest payments, or earlier when the Company has doubts about collectability. When the Company discontinues accruing interest on a loan, any accrued but uncollectible interest on the loan and other loans backed by the same collateral, if any, is charged to interest income in the same period. Generally, a loan is restored to accrual status only after all delinquent interest and principal are brought current and, in the case of loans where the payment of interest has been interrupted for a substantial period, or the loan has been modified, a regular payment performance has been established.
The Company reviews the performance and credit quality of the commercial mortgage and other loan portfolio on an on-going basis. Loans are placed on watch list status based on a predefined set of criteria and are assigned one of two categories. Loans are classified as “closely monitored” when it is determined that there is a collateral deficiency or other credit events that may lead to a potential loss of principal or interest. Loans “not in good standing” are those loans where the Company has concluded that there is a high probability of loss of principal, such as when the loan is delinquent or in the process of foreclosure. As described below, in determining the allowance for losses, the Company evaluates each loan on the watch list to determine if it is probable that amounts due will not be collected according to the contractual terms of the loan agreement.
Loan-to-value and debt service coverage ratios are measures commonly used to assess the quality of commercial mortgage loans. The loan-to-value ratio compares the amount of the loan to the fair value of the underlying property collateralizing the loan, and is commonly expressed as a percentage. Loan-to-value ratios greater than
100%
indicate that the loan amount exceeds the collateral value. A loan-to-value ratio less than
100%
indicates an excess of collateral value over the loan amount. The debt service coverage ratio compares a property’s net operating income to its debt service payments. Debt service coverage ratios less than
1.0
times indicate that property operations do not generate enough income to cover the loan’s current debt payments. A debt service coverage ratio greater than 1.0 times indicates an excess of net operating income over the debt service payments. The values utilized in calculating these ratios are developed as part of the Company’s periodic review of the commercial mortgage loan and agricultural property loan portfolios, which includes an internal appraisal of the underlying collateral value. The Company’s periodic review also includes a quality re-rating process, whereby the internal quality rating originally assigned at underwriting is updated based on current loan, property and market information using a proprietary quality rating system. The loan-to-value ratio is the most significant of several inputs used to establish the internal credit rating of a loan which in turn drives the allowance for losses. Other key factors considered in determining the internal credit rating include debt service coverage ratios, amortization, loan term, and estimated market value growth rate and volatility for the property type and region. See Note 3 for additional information related to the loan-to-value ratios and debt service coverage ratios related to the Company’s commercial mortgage and agricultural loan portfolios.
160
Loans backed by residential properties and uncollateralized loans are also reviewed periodically. Each loan is assigned an internal or external credit rating. Internal credit ratings take into consideration various factors including financial ratios and qualitative assessments based on non-financial information. In cases where there are personal or third-party guarantors, the credit quality of the guarantor is also reviewed. These factors are used in developing the allowance for losses. Based on the diversity of the loans in these categories and their immateriality, the Company has not disclosed the credit quality indicators related to these loans in Note 3.
For those loans not reported at fair value, the allowance for losses includes a loan specific reserve for each impaired loan that has a specifically identified loss and a portfolio reserve for probable incurred but not specifically identified losses. For impaired commercial mortgage and other loans, the allowances for losses are determined based on the present value of expected future cash flows discounted at the loan’s effective interest rate, or based upon the fair value of the collateral if the loan is collateral dependent. The portfolio reserves for probable incurred but not specifically identified losses in the commercial mortgage and agricultural loan portfolios consider the current credit composition of the portfolio based on an internal quality rating, as described above. The portfolio reserves are determined using past loan experience, including historical credit migration, loss probability and loss severity factors by property type. These factors are reviewed and updated as appropriate.
The allowance for losses on commercial mortgage and other loans can increase or decrease from period to period based on the factors noted above. “Realized investment gains (losses), net” includes changes in the allowance for losses and changes in value for loans accounted for under the fair value option. “Realized investment gains (losses), net” also includes gains and losses on sales, certain restructurings, and foreclosures.
When a commercial mortgage or other loan is deemed to be uncollectible, any specific valuation allowance associated with the loan is reversed and a direct write-down of the carrying amount of the loan is made. The carrying amount of the loan is not adjusted for subsequent recoveries in value.
Commercial mortgage and other loans are occasionally restructured in a troubled debt restructuring. These restructurings generally include one or more of the following: full or partial payoffs outside of the original contract terms; changes to interest rates; extensions of maturity; or additions or modifications to covenants. Additionally, the Company may accept assets in full or partial satisfaction of the debt as part of a troubled debt restructuring. When restructurings occur, they are evaluated individually to determine whether the restructuring or modification constitutes a “troubled debt restructuring” as defined by authoritative accounting guidance. If the borrower is experiencing financial difficulty and the Company has granted a concession, the restructuring, including those that involve a partial payoff or the receipt of assets in full satisfaction of the debt is deemed to be a troubled debt restructuring. Based on the Company’s credit review process described above, these loans generally would have been deemed impaired prior to the troubled debt restructuring, and specific allowances for losses would have been established prior to the determination that a troubled debt restructuring has occurred.
In a troubled debt restructuring where the Company receives assets in full satisfaction of the debt, any specific valuation allowance is reversed and a direct write-down of the loan is recorded for the amount of the allowance, and any additional loss, net of recoveries, or any gain is recorded for the difference between the fair value of the assets received and the recorded investment in the loan. When assets are received in partial settlement, the same process is followed, and the remaining loan is evaluated prospectively for impairment based on the credit review process noted above. When a loan is restructured in a troubled debt restructuring, the impairment of the loan is remeasured using the modified terms and the loan’s original effective yield, and the allowance for loss is adjusted accordingly. Subsequent to the modification, income is recognized prospectively based on the modified terms of the loans in accordance with the income recognition policy noted above. Additionally, the loan continues to be subject to the credit review process noted above.
In situations where a loan has been restructured in a troubled debt restructuring and the loan has subsequently defaulted, this factor is considered when evaluating the loan for a specific allowance for losses in accordance with the credit review process noted above.
See Note 3 for additional information about commercial mortgage and other loans that have been restructured in a troubled debt restructuring.
Policy loans
represent funds loaned to policyholders up to the cash surrender value of the associated insurance policies and are carried at the unpaid principal balances due to the Company from the policyholders. Interest income on policy loans is recognized in “Net investment income” at the contract interest rate when earned. Policy loans are fully collateralized by the cash surrender value of the associated insurance policies.
161
Other invested assets
consists of the Company’s non-coupon investments in limited partnerships and limited liability companies (“LPs/LLCs”), other than operating joint ventures, as well as wholly-owned investment real estate, derivative assets and other investments. LPs/LLCs interests are accounted for using either the equity method of accounting, or at fair value with changes in fair value reported in “Other income (loss).” The Company’s income from investments in LPs/LLCs accounted for using the equity method, other than the Company’s investments in operating joint ventures, is included in “Net investment income.” The carrying value of these investments is written down, or impaired, to fair value when a decline in value is considered to be other-than-temporary. In applying the equity method (including assessment for OTTI), the Company uses financial information provided by the investee, generally on a one to three-month lag. For the investments reported at fair value with changes in fair value reported in current earnings, the associated realized and unrealized gains and losses are reported in “Other income (loss).” The Company consolidates LPs/LLCs in certain other instances where it is deemed to exercise control, or is considered the primary beneficiary of a variable interest entity. See Note 4 for additional information about VIEs.
The Company’s wholly-owned investment real estate consists of real estate which the Company has the intent to hold for the production of income as well as real estate held for sale. Real estate which the Company has the intent to hold for the production of income is carried at depreciated cost less any write-downs to fair value for impairment losses and is reviewed for impairment whenever events or circumstances indicate that the carrying value may not be recoverable. Real estate held for sale is carried at the lower of depreciated cost or fair value less estimated selling costs and is not further depreciated once classified as such. An impairment loss is recognized when the carrying value of the investment real estate exceeds the estimated undiscounted future cash flows (excluding interest charges) from the investment. At that time, the carrying value of the investment real estate is written down to fair value. Decreases in the carrying value of investment real estate held for the production of income due to OTTI are recorded in “Realized investment gains (losses), net.” Depreciation on real estate held for the production of income is computed using the straight-line method over the estimated useful lives of the properties and is included in “Net investment income.”
Short-term investments
primarily consist of highly liquid debt instruments with a maturity of twelve months or less and greater than three months when purchased, other than those debt instruments meeting this definition that are included in “Assets supporting experience-rated contractholder liabilities, at fair value.” These investments are generally carried at fair value or amortized cost that approximates fair value and include certain money market investments, funds managed similar to regulated money market funds, short-term debt securities issued by government-sponsored entities and other highly liquid debt instruments.
Realized investment gains (losses)
are computed using the specific identification method with the exception of some of the Company’s International Insurance businesses’ portfolios, where the average cost method is used. Realized investment gains and losses are generated from numerous sources, including the sales of fixed maturity securities, investments in joint ventures and limited partnerships and other types of investments, as well as adjustments to the cost basis of investments for net OTTI recognized in earnings. Realized investment gains and losses also reflect changes in the allowance for losses on commercial mortgage and other loans, fair value changes on commercial mortgage loans carried at fair value, and fair value changes on embedded derivatives and free-standing derivatives that do not qualify for hedge accounting treatment. See
“Derivative Financial Instruments”
below for additional information regarding the accounting for derivatives.
The Company’s available-for-sale and held-to-maturity securities with unrealized losses are reviewed quarterly to identify OTTI in value. In evaluating whether a decline in value is other-than-temporary, the Company considers several factors including, but not limited to the following: (1) the extent and the duration of the decline; (2) the reasons for the decline in value (credit event, currency or interest-rate related, including general credit spread widening); and (3) the financial condition of and near-term prospects of the issuer.
An OTTI is recognized in earnings for a debt security in an unrealized loss position when either (1) the Company has the intent to sell the debt security or (2) it is more likely than not the Company will be required to sell the debt security before its anticipated recovery. For all debt securities in unrealized loss positions that do not meet either of these two criteria, the Company analyzes its ability to recover the amortized cost by comparing the net present value of projected future cash flows with the amortized cost of the security. The net present value is calculated by discounting the Company’s best estimate of projected future cash flows at the effective interest rate implicit in the debt security prior to impairment. The Company may use the estimated fair value of collateral as a proxy for the net present value if it believes that the security is dependent on the liquidation of collateral for recovery of its investment. If the net present value is less than the amortized cost of the investment, an OTTI is recognized. In addition to the above-mentioned circumstances, the Company also recognizes an OTTI in earnings when a non-functional currency denominated security in an unrealized loss position due to currency exchange rates is not expected to recover in value before maturity.
162
When an OTTI of a debt security has occurred, the amount of the OTTI recognized in earnings depends on whether the Company intends to sell the security or more likely than not will be required to sell the security before recovery of its amortized cost basis. If the debt security meets either of these two criteria or the unrealized losses due to changes in foreign currency exchange rates are not expected to be recovered before maturity, the OTTI recognized in earnings is equal to the entire difference between the security’s amortized cost basis and its fair value at the impairment measurement date. For OTTI of debt securities that do not meet these criteria, the net amount recognized in earnings is equal to the difference between the amortized cost of the debt security and its net present value calculated as described above. Any difference between the fair value and the net present value of the debt security at the impairment measurement date is recorded in “Other comprehensive income (loss).” Unrealized gains or losses on securities for which an OTTI has been recognized in earnings is tracked as a separate component of AOCI.
The split between the amount of an OTTI recognized in “Other comprehensive income (loss)” and the net amount recognized in earnings for debt securities is driven principally by assumptions regarding the amount and timing of projected cash flows. For mortgage-backed and asset-backed securities, cash flow estimates consider the payment terms of the underlying assets backing a particular security, including interest rate and prepayment assumptions based on data from widely accepted third-party data sources or internal estimates. In addition to interest rate and prepayment assumptions, cash flow estimates also include other assumptions regarding the underlying collateral including default rates and recoveries, which vary based on the asset type and geographic location, as well as the vintage year of the security. For structured securities, the payment priority within the tranche structure is also considered. For all other debt securities, cash flow estimates are driven by assumptions regarding probability of default and estimates regarding timing and amount of recoveries associated with a default. The Company has developed these estimates using information based on its historical experience as well as using market observable data, such as industry analyst reports and forecasts, sector credit ratings and other data relevant to the collectability of a security, such as the general payment terms of the security and the security’s position within the capital structure of the issuer.
The new cost basis of an impaired security is not adjusted for subsequent increases in estimated fair value. In periods subsequent to the recognition of an OTTI, the impaired security is accounted for as if it had been purchased on the measurement date of the impairment. For debt securities, the discount (or reduced premium) based on the new cost basis may be accreted into net investment income in future periods, including increases in cash flow on a prospective basis. In certain cases where there are decreased cash flow expectations, the security is reviewed for further cash flow impairments.
Unrealized investment gains and losses are also considered in determining certain other balances, including DAC, VOBA, DSI, certain future policy benefits, policyholders’ account balances, policyholders’ dividends and deferred tax assets or liabilities. These balances are adjusted, as applicable, for the impact of unrealized gains or losses on investments as if these gains or losses had been realized, with corresponding credits or charges included in AOCI. Each of these balances is discussed in greater detail below.
Cash and cash equivalents
include cash on hand, amounts due from banks, certain money market investments, funds managed similar to regulated money market funds, other debt instruments with maturities of three months or less when purchased, other than cash equivalents that are included in “Assets supporting experience-rated contractholder liabilities, at fair value,” and receivables related to securities purchased under agreements to resell (see also “
Securities sold under agreements to repurchase
” below).
Accrued investment income
primarily includes accruals of interest and dividend income from investments that have been earned but not yet received.
Deferred policy acquisition costs
are costs related directly to the successful acquisition of new and renewal insurance and annuity business that have been deferred to the extent such costs are deemed recoverable from future profits. Such DAC primarily includes commissions, costs of policy issuance and underwriting, and certain other expenses that are directly related to successfully negotiated contracts. In each reporting period, capitalized DAC is amortized to “Amortization of DAC,” net of the accrual of imputed interest on DAC balances. DAC is subject to periodic recoverability testing. DAC, for applicable products, is adjusted for the impact of unrealized gains or losses on investments as if these gains or losses had been realized, with corresponding credits or charges included in AOCI.
For traditional participating life insurance which are included in the Closed Block, DAC is amortized over the expected life of the contracts in proportion to gross margins based on historical and anticipated future experience, which is evaluated regularly. The effect of changes in estimated gross margins on unamortized DAC is reflected in the period such estimated gross margins are revised on a retrospective basis. DAC related to non-participating traditional individual life insurance and longevity reinsurance contracts is amortized in proportion to gross premiums.
163
DAC related to universal and variable life products and fixed and variable deferred annuity products are generally deferred and amortized over the expected life of the contracts in proportion to gross profits arising principally from investment margins, mortality and expense margins, and surrender charges, based on historical and anticipated future experience, which is updated periodically. The Company uses a reversion to the mean approach for equities to derive future equity return assumptions. However, if the projected equity return calculated using this approach is greater than the maximum equity return assumption, the maximum equity return is utilized. Gross profits also include impacts from the embedded derivatives associated with certain of the optional living benefit features of the Company’s variable annuity contracts and related hedging activities. Total gross profits include both actual gross profits and estimates of gross profits for future periods. The Company regularly evaluates and adjusts DAC balances with a corresponding charge or credit to current period earnings, representing a cumulative adjustment to all prior periods’ amortization, for the impact of actual gross profits and changes in the Company’s projections of estimated future gross profits. Adjustments to DAC balances include: (i) annual review of assumptions that reflect the comprehensive review of the assumptions used in estimating gross profits for future periods, (ii) quarterly adjustments for current period experience (also referred to as “experience true-up” adjustments) that reflect the impact of differences between actual gross profits for a given period and the previously estimated expected gross profits for that period, and (iii) quarterly adjustments for market performance (also referred to as “experience unlocking”) that reflect the impact of changes to the Company’s estimate of total gross profits to reflect actual fund performance and market conditions.
For group annuity contracts (other than single premium group annuities), acquisition costs are generally deferred and amortized over the expected life of the contracts in proportion to gross profits. For group corporate-, bank- and trust-owned life insurance contracts, acquisition costs are generally deferred and amortized in proportion to lives insured. For single premium immediate annuities with life contingencies, single premium group annuities, including non-participating group annuity contracts, and single premium structured settlements with life contingencies, all acquisition costs are charged to expense immediately because generally all premiums are received at the inception of the contract. For funding agreement notes contracts, single premium structured settlement contracts without life contingencies, and single premium immediate annuities without life contingencies, acquisition expenses are deferred and amortized over the expected life of the contracts using the interest method. For other group life and disability insurance contracts and guaranteed investment contracts (“GICs”), acquisition costs are expensed as incurred.
For some products, policyholders can elect to modify product benefits, features, rights or coverages by exchanging a contract for a new contract or by amendment, endorsement, or rider to a contract, or by the election of a feature or coverage within a contract. These transactions are known as internal replacements. If policyholders surrender traditional life insurance policies in exchange for life insurance policies that do not have fixed and guaranteed terms, the Company immediately charges to expense the remaining unamortized DAC on the surrendered policies. For other internal replacement transactions, except those that involve the addition of a nonintegrated contract feature that does not change the existing base contract, the unamortized DAC is immediately charged to expense if the terms of the new policies are not substantially similar to those of the former policies. If the new terms are substantially similar to those of the earlier policies, the DAC is retained with respect to the new policies and amortized over the expected life of the new policies. See Note 7 for additional information regarding DAC.
Value of business acquired
represents identifiable intangible assets to which a portion of the purchase price in a business acquisition is attributed under the application of purchase accounting. VOBA represents an adjustment to the stated value of in-force insurance contract liabilities to present them at fair value, determined as of the acquisition date. VOBA balances are subject to recoverability testing, in the manner in which they were acquired. The Company has established a VOBA asset primarily for its acquired life insurance products, accident and health products with fixed benefits, deferred annuity contracts, and defined contribution and defined benefit businesses. As of December 31, 2018, the majority of the VOBA balance relates to the 2011 acquisition of AIG Star Life Insurance Co., Ltd, AIG Edison Life Insurance Company, AIG Financial Assurance Japan K.K. and AIG Edison Service Co., Ltd. (collectively, the “Star and Edison Businesses”) and the 2013 acquisition of The Hartford Financial Services Group’s individual life insurance business (“the Hartford Life Business”). The Company amortizes VOBA over the anticipated life of the acquired contracts using the same methodology and assumptions used to amortize DAC. The Company records amortization of VOBA in “General and administrative expenses.” VOBA, for applicable products, is adjusted for the impact of unrealized gains or losses on investments as if these gains or losses had been realized, with corresponding credits or charges included in AOCI. See Note 8 for additional information regarding VOBA.
Other assets
consist primarily of prepaid pension benefit costs (see Note 17), certain restricted assets, trade receivables, goodwill and other intangible assets, DSI, the Company’s investments in operating joint ventures, property and equipment, reinsurance recoverables (see discussion below in “
Reinsurance
”), and receivables resulting from sales of securities that had not yet settled at the balance sheet date.
164
Property and equipment are carried at cost less accumulated depreciation. Depreciation is determined using the straight-line method over the estimated useful lives of the related assets, which generally range from
3
to
40
years.
As a result of certain acquisitions, the Company recognizes an asset for goodwill representing the excess of cost over the net fair value of the assets acquired and liabilities assumed. Goodwill is assigned to reporting units at the date the goodwill is initially recorded. A reporting unit is an operating segment or a unit one level below the operating segment, if discrete financial information is prepared and regularly reviewed by management at that level. Once goodwill has been assigned to reporting units, it no longer retains its association with a particular acquisition, and all of the activities within a reporting unit, whether acquired or organically grown, are available to support the value of the goodwill.
The Company tests goodwill for impairment annually as of December 31 and more frequently if an event occurs or circumstances change that would more likely than not reduce the fair value of a reporting unit below its carrying amount. Accounting guidance provides for an optional qualitative assessment for testing goodwill impairment that may allow companies to skip the quantitative two-step test. The Company has elected the quantitative two-step test that is performed at the reporting unit level. The first step, used to identify potential impairment, involves comparing each reporting unit’s fair value to its carrying value including goodwill. If the fair value of a reporting unit exceeds its carrying value, the applicable goodwill is considered not to be impaired. If the carrying value exceeds fair value, there is an indication of a potential impairment and the second step of the test is performed to measure the amount of impairment.
The second step involves calculating an implied fair value of goodwill for each reporting unit for which the first step indicated impairment. The implied fair value of goodwill is determined in the same manner as the amount of goodwill recognized in a business combination, which is the excess of the fair value of the reporting unit, as determined in the first step, over the aggregate fair values of the individual assets, liabilities and identifiable intangibles as if the reporting unit was being acquired in a business combination. If the implied fair value of goodwill in the “pro forma” business combination accounting as described above exceeds the goodwill assigned to the reporting unit, there is no impairment. If the goodwill assigned to a reporting unit exceeds the implied fair value of the goodwill, an impairment charge is recorded in “General and administrative expenses” for the excess. An impairment loss recognized cannot exceed the amount of goodwill assigned to a reporting unit, and the loss establishes a new basis in the goodwill. Subsequent reversal of goodwill impairment losses is not permitted. Management is required to make significant estimates in determining the fair value of a reporting unit including, but not limited to: projected earnings, comparative market multiples, and the risk rate at which future net cash flows are discounted.
The Company offered various types of sales inducements to policyholders related to fixed and variable deferred annuity contracts. The Company defers sales inducements and amortizes them over the expected life of the policy using the same methodology and assumptions used to amortize DAC. Sales inducement balances are subject to periodic recoverability testing. The Company records amortization of DSI in “Interest credited to policyholders’ account balances.” DSI, for applicable products, is adjusted for the impact of unrealized gains or losses on investments as if these gains or losses had been realized, with corresponding credits or charges included in AOCI. See Note 12 for additional information regarding sales inducements.
Identifiable intangible assets primarily include customer relationships and mortgage servicing rights and are recorded net of accumulated amortization. The Company tests identifiable intangible assets for impairment on an annual basis as of December 31 of each year or whenever events or circumstances suggest that the carrying value of an identifiable intangible asset may exceed the sum of the undiscounted cash flows expected to result from its use and eventual disposition. If this condition exists and the carrying value of an identifiable intangible asset exceeds its fair value, the excess is recognized as an impairment and is recorded as a charge against net income. Measuring intangible assets requires the use of estimates. Significant estimates include the projected net cash flow attributable to the intangible asset and the risk rate at which future net cash flows are discounted for purposes of estimating fair value, as applicable. See Note 10 for additional information regarding identifiable intangible assets.
Investments in operating joint ventures are generally accounted for under the equity method. The carrying value of these investments is written down, or impaired, to fair value when a decline in value is considered to be other-than-temporary. See Note 9 for additional information on investments in operating joint ventures.
165
Separate account assets
represent segregated funds that are invested for certain policyholders, pension funds and other customers. The assets consist primarily of equity securities, fixed maturities, real estate-related investments, real estate mortgage loans, short-term investments and derivative instruments and are reported at fair value. The assets of each account are legally segregated and are not subject to claims that arise out of any other business of the Company. Investment risks associated with market value changes are borne by the customers, except to the extent of minimum guarantees made by the Company with respect to certain accounts. The investment income and realized investment gains or losses from separate account assets generally accrue to the policyholders and are not included in the Company’s results of operations. Mortality, policy administration and surrender charges assessed against the accounts are included in “Policy charges and fee income.” Asset management fees charged to the accounts are included in “Asset management and service fees.” Seed money that the Company invests in separate accounts is reported in the appropriate general account asset line. Investment income and realized investment gains or losses from seed money invested in separate accounts accrues to the Company and is included in the Company’s results of operations. See Note 12 for additional information regarding separate account arrangements with contractual guarantees. See also “
Separate account liabilities”
below.
LIABILITIES
Future policy benefits
liability is primarily comprised of the present value of estimated future payments to or on behalf of policyholders, where the timing and amount of payment depends on policyholder mortality or morbidity, less the present value of future net premiums. For individual traditional participating life insurance products, the mortality and interest rate assumptions applied are those used to calculate the policies’ guaranteed cash surrender values. For life insurance, other than individual traditional participating life insurance, and annuity and disability products, expected mortality and morbidity are generally based on Company experience, industry data and/or other factors. Interest rate assumptions are based on factors such as market conditions and expected investment returns. Although mortality, morbidity and interest rate assumptions are “locked-in” upon the issuance of new insurance or annuity business with fixed and guaranteed terms, significant changes in experience or assumptions may require the Company to provide for expected future losses on a product by establishing premium deficiency reserves. Premium deficiency reserves are established, if necessary, when the liability for future policy benefits plus the present value of expected future gross premiums are determined to be insufficient to provide for expected future policy benefits and expenses. Premium deficiency reserves do not include a provision for the risk of adverse deviation. In determining if a premium deficiency related to short-duration contracts exists, the Company considers, among other factors, anticipated investment income. Any adjustments to future policy benefit reserves related to net unrealized gains on securities classified as available-for-sale are included in AOCI. In certain instances, the policyholder liability for a particular line of business may not be deficient in the aggregate to trigger loss recognition, but the pattern of earnings may be such that profits are expected to be recognized in earlier years followed by losses in later years. In these situations, accounting standards require that an additional liability (Profits Followed by Losses or “PFL” liability) be recognized by an amount necessary to sufficiently offset the losses that would be recognized in later years. Currently, PFL liabilities are predominantly associated with certain universal life contracts that measure GAAP reserves using a dynamic approach, and accordingly, are updated each quarter, using current in-force and market data, and as part of the annual assumption update, such that the liability as of each measurement date represents the Company’s current estimate of the present value of the amount necessary to offset anticipated future losses. See Note 11 for additional information regarding future policy benefits.
The Company’s liability for future policy benefits also includes a liability for unpaid claims and claim adjustment expenses. The Company does not establish claim liabilities until a loss has been incurred. However, unpaid claims and claim adjustment expenses include estimates of claims that the Company believes have been incurred but have not yet been reported as of the balance sheet date. The Company’s liability for future policy benefits also includes net liabilities for guarantee benefits related to certain long-duration life and annuity contracts, which are discussed more fully in Note 12, and deferred profits.
Policyholders’ account balances
liability represents the contract value that has accrued to the benefit of the policyholder as of the balance sheet date. This liability is primarily associated with the accumulated account deposits, plus interest credited, less policyholder withdrawals and other charges assessed against the account balance, as applicable. These policyholders’ account balances also include provision for benefits under non-life contingent payout annuities and certain unearned revenues. See Note 11 for additional information regarding policyholders’ account balances.
166
Policyholders’ dividends
liability includes dividends payable to policyholders and the policyholder dividend obligation associated with the participating policies included in the Closed Block. The dividends payable for participating policies included in the Closed Block are determined at the end of each year for the following year by the Board of Directors of the Prudential Insurance Company of America (“Prudential Insurance”) based on its statutory results, capital position, ratings, and the emerging experience of the Closed Block. The policyholder dividend obligation represents amounts expected to be paid to Closed Block policyholders as an additional policyholder dividend unless otherwise offset by future Closed Block performance. Any adjustments to the policyholder dividend obligation related to net unrealized gains (losses) on securities classified as available-for-sale are included in AOCI. For additional information on the policyholder dividend obligation, see Note 14. The dividends payable for policies other than the participating policies included in the Closed Block include dividends payable in accordance with certain group and individual insurance policies.
Securities sold under agreements to repurchase
represent liabilities associated with securities repurchase agreements which are used primarily to earn spread income, to borrow funds, or to facilitate trading activity. As part of securities repurchase agreements, the Company transfers U.S. government and government agency securities to a third-party, and receives cash as collateral. For securities repurchase agreements used to earn spread income, the cash received is typically invested in cash equivalents, short-term investments or fixed maturities. Receivables associated with securities purchased under agreements to resell are generally reflected as cash equivalents (see also “
Cash and cash equivalents
” above). As part of securities resale agreements, the Company invests cash and receives as collateral U.S. government securities or other debt securities.
Securities repurchase and resale agreements that satisfy certain criteria are treated as secured borrowing or secured lending arrangements. These agreements are carried at the amounts at which the securities will be subsequently resold or reacquired, as specified in the respective transactions. For securities purchased under agreements to resell, the Company’s policy is to take possession or control of the securities either directly or through a third-party custodian. These securities are valued daily and additional securities or cash collateral is received, or returned, when appropriate to protect against credit exposure. Securities to be resold are the same, or substantially the same, as the securities received. The majority of these transactions are with large brokerage firms and large banks. For securities sold under agreements to repurchase, the market value of the securities to be repurchased is monitored, and additional collateral is obtained where appropriate, to protect against credit exposure. The Company obtains collateral in an amount at least equal to
95%
of the fair value of the securities sold. Securities to be repurchased are the same, or substantially the same, as those sold. The majority of these transactions are with highly rated money market funds. Income and expenses related to these transactions executed within the insurance companies used to earn spread income are reported as “Net investment income;” however, for transactions used for funding purposes, the associated borrowing cost is reported as interest expense (included in “General and administrative expenses”). Income and expenses related to these transactions executed within the Company’s derivative operations are reported in “Other income (loss).”
Cash collateral for loaned securities
represent liabilities to return cash proceeds from security lending transactions. Securities lending transactions are used primarily to earn spread income or to borrow funds. As part of securities lending transactions, the Company transfers U.S. and foreign debt and equity securities, as well as U.S. government and government agency securities, and receives cash as collateral. Cash proceeds from securities lending transactions are used to earn spread income, and are typically invested in cash equivalents, short-term investments or fixed maturities. Securities lending transactions are treated as financing arrangements and are recorded at the amount of cash received. The Company obtains collateral in an amount equal to
102%
and
105%
of the fair value of the domestic and foreign securities, respectively. The Company monitors the market value of the securities loaned on a daily basis with additional collateral obtained as necessary. Substantially all of the Company’s securities lending transactions are with large brokerage firms and large banks. Income and expenses associated with securities lending transactions used to earn spread income are reported as “Net investment income;” however, for securities lending transactions used for funding purposes the associated rebate is reported as interest expense (included in “General and administrative expenses”).
The Company also enters into securities lending transactions where non-cash collateral, typically Japanese government bonds, is received. The collateral received is not reported on the Company’s Consolidated Statements of Financial Position. In these transactions, the Company receives a fee and obtains collateral in an amount equal to
102%
and
105%
of the fair value of the domestic and foreign securities, respectively. The Company monitors the market value of the securities loaned on a daily basis with additional collateral obtained as necessary. Substantially all of these transactions are with large brokerage firms and large banks. Income is reported as “Net investment income.”
Income taxes
liability primarily represents the net deferred tax liability and the Company’s estimated taxes payable for the current year and open audit years.
167
The Company and its includible domestic subsidiaries file a consolidated federal income tax return that includes both life insurance companies and non-life insurance companies. Certain other domestic subsidiaries file separate tax returns. Subsidiaries operating outside the U.S. are taxed, and income tax expense is recorded, based on applicable foreign statutes. See Note 15 for a discussion of certain non-U.S. jurisdictions for which the Company assumes repatriation of earnings.
Items required by tax regulations to be included in the tax return may differ from the items reflected in the financial statements. As a result, the effective tax rate reflected in the financial statements may be different than the actual rate applied on the tax return. Some of these differences are permanent such as expenses that are not deductible in the Company’s tax return, and some differences are temporary, reversing over time, such as valuation of insurance reserves. Temporary differences create deferred tax assets and liabilities. Deferred tax assets generally represent items that can be used as a tax deduction or credit in future years for which the Company has already recorded the tax benefit in the Company’s Consolidated Statements of Operations. Deferred tax liabilities generally represent tax expense recognized in the Company’s financial statements for which payment has been deferred, or expenditures for which the Company has already taken a deduction in the Company’s tax return but have not yet been recognized in the Company’s financial statements.
Deferred income taxes are recognized, based on enacted rates, when assets and liabilities have different values for financial statement and tax reporting purposes. The application of U.S. GAAP requires the Company to evaluate the recoverability of the Company’s deferred tax assets and establish a valuation allowance if necessary to reduce the Company’s deferred tax assets to an amount that is more likely than not expected to be realized. Considerable judgment is required in determining whether a valuation allowance is necessary, and if so, the amount of such valuation allowance. See Note 15 for a discussion of factors considered when evaluating the need for a valuation allowance.
The U.S. Tax Cuts and Jobs Act of 2017 (“Tax Act of 2017”) includes two new tax provisions that could impact the Company’s effective tax rate and cash tax payments in future periods. The Base Erosion and Anti-Abuse Tax (“BEAT”) taxes modified taxable income at a rate of 5% in 2018, increasing to 10% in 2019 and 12.5% in 2026 and is due if the calculated BEAT amount that is determined without the benefit of foreign and certain tax credits is greater than the regular corporate tax in any given year. In general, modified taxable income is calculated by adding back to a taxpayer’s regular taxable income the amount of certain “base erosion tax benefits” with respect to payments to foreign affiliates, as well as the “base erosion percentage” of any net operating loss deductions. It is possible that benefit and claim payments made by our U.S. insurance business to our foreign affiliates on reinsurance assumed by the U.S. affiliates could be considered base erosion payments and, in the future, cause the U.S. consolidated PFI group to be subject to the BEAT. The Global Intangible Low-Taxed Income (“GILTI”) provision applies a minimum U.S. tax to earnings of consolidated foreign subsidiaries in excess of a 10% deemed return on tangible assets of foreign subsidiaries by imposing the U.S. tax rate to 50% of earnings of such foreign affiliates and provides for a partial foreign tax credit for foreign income taxes. The amount of tax in any period on GILTI can depend on annual differences between U.S. taxable income recognition rules and taxable income recognition rules in the country of operations and the overall taxable income of U.S. operations, as well as U.S. expense allocation rules which limit the amount of foreign tax credits that can be applied to reduce the U.S. tax on the GILTI provision. Under certain circumstances the taxable income of U.S. operations may cause more than 50% of earnings of foreign affiliates to be subject to the GILTI provision. In years that the U.S. consolidated PFI group incurs a net operating loss or has a loss from domestic businesses, the GILTI provision would operate to cause a loss of U.S. tax benefits for some or all of those losses, effectively increasing the tax on foreign earnings. The Company accounts for the effects of the BEAT and GILTI provisions as a period cost if and when incurred.
In December of 2017, Securities and Exchange Commission (“SEC”) staff issued “SAB 118, Income Tax Accounting Implications of the Tax Cuts and Jobs Act” (“SAB 118”), which allowed registrants to record provisional amounts during a ‘measurement period’ not to extend beyond one year. Under the relief provided by SAB 118, a company could recognize provisional amounts when it did not have the necessary information available, prepared or analyzed in reasonable detail to complete its accounting for the change in tax law. See Note 15 to the Consolidated Financial Statements for a discussion of provisional amounts related to the Tax Act of 2017 recorded in 2017 and adjustments to provisional amounts recorded in 2018.
168
U.S. GAAP prescribes a comprehensive model for how a company should recognize, measure, present, and disclose in its financial statements uncertain tax positions that a company has taken or expects to take on tax returns. The application of this guidance is a two-step process. First, the Company determines whether it is more likely than not, based on the technical merits, that the tax position will be sustained upon examination. If a tax position does not meet the more likely than not recognition threshold, the benefit of that position is not recognized in the financial statements. The second step is measurement. The Company measures the tax position as the largest amount of benefit that is greater than
50 percent
likely of being realized upon ultimate resolution with a taxing authority that has full knowledge of all relevant information. This measurement considers the amounts and probabilities of the outcomes that could be realized upon ultimate settlement using the facts, circumstances, and information available at the reporting date.
The Company’s liability for income taxes includes a liability for unrecognized tax benefits, interest and penalties which relate to tax years still subject to review by the Internal Revenue Service (“IRS”) or other taxing jurisdictions. Audit periods remain open for review until the statute of limitations has passed. Generally, for tax years which produce net operating losses, capital losses or tax credit carryforwards (“tax attributes”), the statute of limitations does not close, to the extent of these tax attributes, until the expiration of the statute of limitations for the tax year in which they are fully utilized. The completion of review or the expiration of the statute of limitations for a given audit period could result in an adjustment to the liability for income taxes. The Company classifies all interest and penalties related to tax uncertainties as income tax expense. See Note 15 for additional information regarding income taxes.
Short-term and long-term debt
liabilities are primarily carried at an amount equal to unpaid principal balance, net of unamortized discount or premium and debt issue costs. Original-issue discount or premium and debt-issue costs are recognized as a component of interest expense over the period the debt is expected to be outstanding, using the interest method of amortization. Interest expense is generally presented within “General and administrative expenses” in the Company’s Consolidated Statements of Operations. Interest expense may also be reported within “Net investment income” for certain activity, as prescribed by specialized industry guidance. Short-term debt is debt coming due in the next twelve months, including that portion of debt otherwise classified as long-term. The short-term debt caption may exclude short-term debt items for which the Company has the intent and ability to refinance on a long-term basis in the near-term. See Note 16 for additional information regarding short-term and long-term debt.
Other liabilities
consist primarily of trade payables, pension and other employee benefit liabilities (see Note 17), derivative liabilities (see “
Derivative Financial Instruments
” below), reinsurance payables (see discussion below in “
Reinsurance
”), and payables resulting from purchases of securities that had not yet settled at the balance sheet date.
Notes issued by consolidated variable interest entities
represent notes issued by certain asset-backed investment vehicles, primarily collateralized loan obligations (“CLOs”), which the Company is required to consolidate. The creditors of these VIEs do not have recourse to the Company in excess of the assets contained within the VIEs. The Company has elected the fair value option for the majority of these notes, and has based the fair value on the corresponding bank loan collateral. Changes in fair value are reported in “Other income (loss).”
Separate account liabilities
primarily represent the contractholder’s account balance in separate account assets and to a lesser extent borrowings of the separate account, and will be equal and offsetting to total separate account assets. See also “
Separate account assets”
above.
Commitments and contingent liabilities
are accrued if it is probable that a liability has been incurred and an amount is reasonably estimable. Management evaluates whether there are incremental legal or other costs directly associated with the ultimate resolution of the matter that are reasonably estimable and, if so, they are included in the accrual. These accruals are generally reported in “Other liabilities.”
REVENUES AND BENEFITS AND EXPENSES
Insurance Revenue and Expense Recognition
Premiums from individual life products, other than universal and variable life contracts, and health insurance and long-term care products are recognized when due. When premiums are due over a significantly shorter period than the period over which benefits are provided, any gross premium in excess of the net premium (i.e., the portion of the gross premium required to provide for all expected future benefits and expenses) is generally deferred and recognized into revenue in a constant relationship to insurance in force. Benefits are recorded as an expense when they are incurred. A liability for future policy benefits is recorded when premiums are recognized using the net level premium valuation methodology.
169
Premiums from non-participating group annuities with life contingencies, single premium structured settlements with life contingencies and single premium immediate annuities with life contingencies are recognized when due. When premiums are due over a significantly shorter period than the period over which benefits are provided, any gross premium in excess of the net premium is generally deferred and recognized into revenue based on expected future benefit payments. Benefits are recorded as an expense when they are incurred. A liability for future policy benefits is recorded when premiums are recognized using the net level premium valuation methodology.
Certain individual annuity contracts provide the contractholder a guarantee that the benefit received upon death or annuitization will be no less than a minimum prescribed amount. These benefits are accounted for as insurance contracts. The Company also provides contracts with certain living benefits which are considered embedded derivatives. See Note 12 for additional information regarding these contracts.
Amounts received as payment for universal or variable group and individual life contracts, deferred fixed or variable annuities, structured settlements and other contracts without life contingencies, and participating group annuities are reported as deposits to “Policyholders’ account balances” and/or “Separate account liabilities.” Revenues from these contracts are reflected in “Policy charges and fee income” consisting primarily of fees assessed during the period against the policyholders’ account balances for mortality and other benefit charges, policy administration charges and surrender charges. In addition to fees, the Company earns investment income from the investment of deposits in the Company’s general account portfolio. Fees assessed that represent compensation to the Company for services to be provided in future periods and certain other fees are generally deferred and amortized into revenue over the life of the related contracts in proportion to estimated gross profits. Benefits and expenses for these products include claims in excess of related account balances, expenses of contract administration, interest credited to policyholders’ account balances and amortization of DAC, DSI and VOBA.
For group life, other than universal and variable group life contracts, and disability insurance, premiums are generally recognized over the period to which the premiums relate in proportion to the amount of insurance protection provided. Claim and claim adjustment expenses are recognized when incurred.
Asset management and service fees
principally includes asset-based asset management fees, which are recognized in the period in which the services are performed. In certain asset management fee arrangements, the Company is entitled to receive performance-based incentive fees when the return on assets under management exceeds certain benchmark returns or other performance targets. The Company may be required to return all, or part, of such performance-based incentive fee depending on future performance of these assets relative to performance benchmarks. The Company records performance-based incentive fee revenue when the contractual terms of the asset management fee arrangement have been satisfied and it is probable that a significant reversal in the amount of the fee will not occur. Under this principle the Company records a deferred performance-based incentive fee liability to the extent it receives cash related to the performance-based incentive fee prior to meeting the revenue recognition criteria delineated above.
Other income (loss)
includes realized and unrealized gains or losses from investments classified “Fixed maturities, trading,” “Assets supporting experience-rated contractholder liabilities, at fair value,” “Equity securities, at fair value,” and “Other invested assets” that are measured at fair value and consolidated entities that follow specialized investment company fair value accounting. “Other income (loss)” also includes gains and losses primarily related to the remeasurement of foreign currency denominated assets and liabilities, as discussed in more detail under “Foreign Currency” below.
OTHER ACCOUNTING POLICIES
Share-Based Payments
The Company applies the fair value-based measurement method in accounting for share-based payment transactions with employees except for equity instruments held by employee share ownership plans. Excess tax benefits (deficits) are recorded in earnings and represent the cumulative difference between the actual tax benefit realized and the amount of deferred tax assets recorded attributable to shared-based payment transactions.
The Company accounts for non-employee stock options using the fair value method in accordance with authoritative guidance and related interpretations on accounting for equity instruments that are issued to other than employees for acquiring, or in conjunction with selling, goods or services.
Earnings Per Share
170
Earnings per share of Common Stock for 2018, 2017 and 2016 reflects the consolidated earnings of Prudential Financial. Basic earnings per share is computed by dividing available income attributable to common shareholders by the weighted average number of common shares outstanding for the period. Diluted earnings per share includes the effect of all dilutive potential common shares that were outstanding during the period. See Note 19 for additional information.
Foreign Currency
The currency in which the Company prepares its financial statements (the “reporting currency”) is the U.S. dollar. Assets, liabilities and results of foreign operations are recorded based on the functional currency of each foreign operation. The determination of the functional currency is based on economic facts and circumstances pertaining to each foreign operation. The local currencies of the Company’s foreign operations are typically their functional currencies with the most significant exception being the Company’s Japanese operations where multiple functional currencies exist.
There are two distinct processes for expressing these foreign transactions and balances in the Company’s financial statements: foreign currency measurement and foreign currency translation. Foreign currency measurement is the process by which transactions in foreign currencies are expressed in the functional currency. Gains and losses resulting from foreign currency measurement are reported in current earnings in “Other income (loss).” Foreign currency translation is the process of expressing a foreign entity’s functional currency financial statements in the reporting currency. Assets and liabilities of foreign operations and subsidiaries reported in currencies other than U.S. dollars are translated at the exchange rate in effect at the end of the period. Revenues, benefits and other expenses are translated at the average rate prevailing during the period. The effects of translating the statements of operations and financial position of non-U.S. entities with functional currencies other than the U.S. dollar are included, net of related qualifying hedge gains and losses and income taxes, in “Foreign currency translation adjustment,” a component of AOCI.
Derivative Financial Instruments
Derivatives are financial instruments whose values are derived from interest rates, foreign exchange rates, financial indices, values of securities or commodities, credit spreads, market volatility, expected returns, and liquidity. Values can also be affected by changes in estimates and assumptions, including those related to counterparty behavior and non-performance risk (“NPR”) used in valuation models. Derivative financial instruments generally used by the Company include swaps, futures, forwards and options and may be exchange-traded or contracted in the over-the-counter (“OTC”) market. Derivative positions are carried at fair value, generally by obtaining quoted market prices or through the use of valuation models.
Derivatives are used to manage the interest rate and currency characteristics of assets or liabilities and to mitigate volatility of expected non-functional currency earnings and net investments in foreign operations resulting from changes in currency exchange rates. Additionally, derivatives may be used to seek to reduce exposure to interest rate, credit, foreign currency and equity risks associated with assets held or expected to be purchased or sold, and liabilities incurred or expected to be incurred. As discussed in detail below and in Note 5, all realized and unrealized changes in fair value of derivatives are recorded in current earnings, with the exception of the effective portion of cash flow hedges and effective hedges of net investments in foreign operations. The Company may also enter into intercompany derivatives, the results of which ultimately eliminate in consolidation over the term of the instrument; however, where applicable, derivative results are included in business gross profits which may impact the pattern by which DAC and other assets are amortized. Cash flows from derivatives are reported in the operating, investing, or financing activities sections in the Consolidated Statements of Cash Flows based on the nature and purpose of the derivative.
Derivatives are recorded either as assets, within “Other invested assets,” or as liabilities, within “Other liabilities,” except for embedded derivatives which are recorded with the associated host contract. The Company nets the fair value of all derivative financial instruments with counterparties for which a master netting arrangement has been executed.
The Company designates derivatives as either (1) a hedge of the fair value of a recognized asset or liability or unrecognized firm commitment (“fair value” hedge); (2) a hedge of a forecasted transaction or of the variability of cash flows to be received or paid related to a recognized asset or liability (“cash flow” hedge); (3) a foreign currency fair value or cash flow hedge (“foreign currency” hedge); (4) a hedge of a net investment in a foreign operation; or (5) a derivative that does not qualify for hedge accounting.
To qualify for hedge accounting treatment, a derivative must be highly effective in mitigating the designated risk of the hedged item. Effectiveness of the hedge is formally assessed at inception and throughout the life of the hedging relationship. Even if a derivative qualifies for hedge accounting treatment, there may be an element of ineffectiveness of the hedge. Under such circumstances, the ineffective portion is recorded in “Realized investment gains (losses), net.”
171
The Company formally documents at inception all relationships between hedging instruments and hedged items, as well as its risk-management objective and strategy for undertaking various hedge transactions. This process includes linking all derivatives designated as fair value, cash flow, or foreign currency hedges to specific assets and liabilities on the balance sheet or to specific firm commitments or forecasted transactions. Hedges of a net investment in a foreign operation are linked to the specific foreign operation.
When a derivative is designated as a fair value hedge and is determined to be highly effective, changes in its fair value, along with changes in the fair value of the hedged asset or liability (including losses or gains on firm commitments), are reported on a net basis in the Consolidated Statements of Operations, generally in “Realized investment gains (losses), net.” When swaps are used in hedge accounting relationships, periodic settlements are recorded in the same Consolidated Statements of Operations line as the related settlements of the hedged items.
When a derivative is designated as a cash flow hedge and is determined to be highly effective, changes in its fair value are recorded in AOCI until earnings are affected by the variability of cash flows being hedged (e.g., when periodic settlements on a variable-rate asset or liability are recorded in earnings). At that time, the related portion of deferred gains or losses on the derivative instrument is reclassified and reported in the Consolidated Statements of Operations line item associated with the hedged item.
When a derivative is designated as a foreign currency hedge and is determined to be highly effective, changes in its fair value are recorded either in current period earnings if the hedge transaction is a fair value hedge (e.g., a hedge of a recognized foreign currency asset or liability) or in AOCI if the hedge transaction is a cash flow hedge (e.g., a foreign currency denominated forecasted transaction). When a derivative is used as a hedge of a net investment in a foreign operation, its change in fair value, to the extent effective as a hedge, is accounted for in the same manner as a translation adjustment (i.e., reported in the cumulative translation adjustment account within AOCI).
If it is determined that a derivative no longer qualifies as an effective fair value or cash flow hedge or management removes the hedge designation, the derivative will continue to be carried on the balance sheet at its fair value, with changes in fair value recognized currently in “Realized investment gains (losses), net.” In this scenario, the hedged asset or liability under a fair value hedge will no longer be adjusted for changes in fair value and the existing basis adjustment is amortized to the Consolidated Statements of Operations line associated with the asset or liability. The component of AOCI related to discontinued cash flow hedges is reclassified to the Consolidated Statements of Operations line associated with the hedged cash flows consistent with the earnings impact of the original hedged cash flows.
When hedge accounting is discontinued because the hedged item no longer meets the definition of a firm commitment, or because it is probable that the forecasted transaction will not occur by the end of the specified time period, the derivative will continue to be carried on the balance sheet at its fair value, with changes in fair value recognized currently in “Realized investment gains (losses), net.” Any asset or liability that was recorded pursuant to recognition of the firm commitment is removed from the balance sheet and recognized currently in “Realized investment gains (losses), net.” Gains and losses that were in AOCI pursuant to the cash flow hedge of a forecasted transaction are recognized immediately in “Realized investment gains (losses), net.”
If a derivative does not qualify for hedge accounting, all changes in its fair value, including net receipts and payments, are included in “Realized investment gains (losses), net” without considering changes in the fair value of the economically associated assets or liabilities.
The Company is a party to financial instruments that contain derivative instruments that are “embedded” in the financial instruments. At inception, the Company assesses whether the economic characteristics of the embedded instrument are clearly and closely related to the economic characteristics of the remaining component of the financial instrument (i.e., the host contract) and whether a separate instrument with the same terms as the embedded instrument would meet the definition of a derivative instrument. When it is determined that (1) the embedded instrument possesses economic characteristics that are not clearly and closely related to the economic characteristics of the host contract and (2) a separate instrument with the same terms would qualify as a derivative instrument, the embedded instrument qualifies as an embedded derivative that is separated from the host contract, carried at fair value, and changes in its fair value are included in “Realized investment gains (losses), net.” For certain financial instruments that contain an embedded derivative that otherwise would need to be bifurcated and reported at fair value, the Company may elect to carry the entire instrument at fair value and report it within “Other invested assets” or “Other liabilities.”
Reinsurance
172
For each of its reinsurance contracts, the Company determines if the contract provides indemnification against loss or liability relating to insurance risk in accordance with applicable accounting standards. The Company reviews all contractual features, particularly those that may limit the amount of insurance risk to which the reinsurer is subject or features that delay the timely reimbursement of claims.
The Company participates in reinsurance arrangements in various capacities as either the ceding entity or as the reinsurer (i.e., assuming entity). See Note 13 for additional information about the Company’s reinsurance arrangements. Reinsurance assumed business is generally accounted for consistent with direct business. Amounts currently recoverable under reinsurance agreements are included in “Other assets” and amounts payable are included in “Other liabilities.” Revenues and benefits and expenses include amounts assumed under reinsurance agreements and are reflected net of reinsurance ceded.
Reinsurance ceded arrangements do not discharge the Company as the primary insurer. Ceded balances would represent a liability of the Company in the event the reinsurers were unable to meet their obligations to the Company under the terms of the reinsurance agreements. Reinsurance premiums, commissions, expense reimbursements, benefits and reserves related to reinsured long-duration contracts under coinsurance arrangements are accounted for over the life of the underlying reinsured contracts using assumptions consistent with those used to account for the underlying contracts. Coinsurance arrangements contrast with the Company’s yearly renewable term arrangements, where only mortality risk is transferred to the reinsurer and premiums are paid to the reinsurer to reinsure that risk
.
The mortality risk that is reinsured under yearly renewable term arrangements represents the difference between the stated death benefits in the underlying reinsured contracts and the corresponding reserves or account value carried by the Company on those same contracts. The premiums paid to the reinsurer are based upon negotiated amounts, not on the actual premiums paid by the underlying contract holders to the Company. As yearly renewable term arrangements are usually entered into by the Company with the expectation that the contracts will be in force for the lives of the underlying policies, they are considered to be long-duration reinsurance contracts. The cost of reinsurance for universal life products is generally recognized based on the gross assessments of the underlying direct policies. The cost of reinsurance for term insurance products is generally recognized in proportion to yearly renewable term premiums over the life of the underlying polices. The cost of reinsurance related to short-duration reinsurance contracts is accounted for over the reinsurance contract period.
If the Company determines that a reinsurance agreement does not expose the reinsurer to a reasonable possibility of a significant loss from insurance risk, the Company records the agreement using the deposit method of accounting. Deposits received are included in Other liabilities and deposits made are included in Other assets. As amounts are paid or received, consistent with the underlying contracts, the deposit assets or liabilities are adjusted. Interest on such deposits is recorded as Other income (loss) or General and administrative expenses, as appropriate.
Accounting for Certain Reinsurance Contracts in the Individual Life Business
In 2017, the Company recognized a charge of
$237 million
in the Individual Life segment, reflecting a change in estimate of reinsurance cash flows associated with universal life products as well as a change in method of reflecting these cash flows in the financial statements. Under the previous method of accounting, with the exception of recoveries pertaining to no lapse guarantees, reinsurance cash flows (e.g., premiums and recoveries) were generally recognized as they occurred. Under the new method, the expected reinsurance cash flows are recognized more ratably over the life of the underlying reinsured policies. In conjunction with this change, the way in which reinsurance is reflected in estimated gross profits used for the amortization of unearned revenue reserves, DAC and VOBA was also revised. The change represents a change in accounting estimate effected by a change in accounting principle and is included within the Company’s annual reviews and update of assumptions and other refinements. The change in accounting estimate reflected insights gained from revised cashflow modeling enabled by a systems conversion, which prompted the change to a preferable accounting method. This new methodology is viewed as preferable as the Company believes it better reflects the economics of reinsurance transactions by aligning the results of reinsurance activity more closely to the underlying direct insurance activity and by better reflecting the profit pattern of this business for purposes of the amortization of the balances noted above.
RECENT ACCOUNTING PRONOUNCEMENTS
Changes to U.S. GAAP are established by the Financial Accounting Standards Board (“FASB”) in the form of Accounting Standards Updates (“ASU”) to the FASB Accounting Standards Codification. The Company considers the applicability and impact of all ASU. ASU listed below include those that have been adopted during the current fiscal year and/or those that have been issued but not yet adopted as of the date of this filing. ASU not listed below were assessed and determined to be either not applicable or not material.
Adoption of ASU 2016-01
173
Effective January 1, 2018, the Company adopted ASU 2016-01,
Financial Instruments - Overall (Subtopic 825-10): Recognition and Measurement of Financial Assets and Liabilities
using a modified retrospective method. Adoption of this ASU impacted the Company’s accounting and presentation related to equity investments. The most significant impact is that the changes in fair value of equity securities previously classified as “available for sale” are to be reported in net income within “Other income (loss)” in the Consolidated Statements of Operations. Prior to this, the changes in fair value on equity securities classified as “available for sale” were reported in “Accumulated other comprehensive income (loss).”
The impacts of this ASU on the Company’s Consolidated Financial Statements can be categorized as follows: (1) Changes to the presentation within the Consolidated Statements of Financial Position; (2) Cumulative-effect Adjustment Upon Adoption; and (3) Changes to Accounting Policies. Each of these components is described below.
(1) Changes to the presentation within the Consolidated Statements of Financial Position
Because of the fundamental accounting changes as described in section “—(3) Changes to Accounting Policies” below, the Company determined that changes to the presentation of certain balances in the investment section of the Company’s Consolidated Statements of Financial Position were also necessary to maintain clarity and logical presentation. The table below illustrates these changes by presenting the balances as previously reported in the Company’s Annual Report on Form 10-K for the year ended December 31, 2017 and the reclassifications that were made, along with a footnote explanation of each reclassification.
|
December 31, 2017
|
||||||||||||||||||||||||
|
As previously reported
|
Reclassifications
|
As currently reported
|
||||||||||||||||||||||
|
Consolidated Statement of Financial Position Line Items
|
(1)
|
(2)
|
(3)
|
(4)
|
||||||||||||||||||||
|
(in millions)
|
||||||||||||||||||||||||
|
Fixed maturities, available-for-sale, at fair value
|
$
|
346,780
|
|
$
|
346,780
|
|
||||||||||||||||||
|
Fixed maturities, held-to-maturity, at amortized cost
|
2,049
|
|
2,049
|
|
||||||||||||||||||||
|
* Fixed maturities, trading, at fair value
|
0
|
|
3,507
|
|
3,507
|
|
||||||||||||||||||
|
Trading account assets supporting insurance liabilities, at fair value
|
22,097
|
|
(22,097
|
)
|
0
|
|
||||||||||||||||||
|
* Assets supporting experience-rated contractholder liabilities, at fair value
|
0
|
|
22,097
|
|
22,097
|
|
||||||||||||||||||
|
Other trading account assets, at fair value
|
5,752
|
|
(5,752
|
)
|
0
|
|
||||||||||||||||||
|
Equity securities, available-for-sale, at fair value
|
6,174
|
|
(6,174
|
)
|
0
|
|
||||||||||||||||||
|
* Equity securities, at fair value
|
0
|
|
6,174
|
|
1,155
|
|
7,329
|
|
||||||||||||||||
|
Commercial mortgage and other loans
|
56,045
|
|
56,045
|
|
||||||||||||||||||||
|
Policy loans
|
11,891
|
|
11,891
|
|
||||||||||||||||||||
|
Other long-term investments
|
12,308
|
|
(12,308
|
)
|
0
|
|
||||||||||||||||||
|
* Other invested assets
|
0
|
|
1,065
|
|
12,308
|
|
13,373
|
|
||||||||||||||||
|
Short-term investments
|
6,775
|
|
25
|
|
6,800
|
|
||||||||||||||||||
|
Total investments
|
$
|
469,871
|
|
$
|
0
|
|
$
|
0
|
|
$
|
0
|
|
$
|
0
|
|
$
|
469,871
|
|
||||||
*
—
New line item effective January 1, 2018.
Strikethrough
—
Eliminated line item effective January 1, 2018.
________
|
(1)
|
Retitled “Trading account assets supporting insurance liabilities, at fair value” to “Assets supporting experience-rated contractholder liabilities, at fair value” as equity securities are included in this line item, and they can no longer be described as trading.
|
|
(2)
|
Retitled “Equity securities, available-for-sale, at fair value” to “Equity securities, at fair value” as equity securities can no longer be described as available-for-sale.
|
|
(3)
|
Eliminated the line item “Other trading account assets, at fair value” and reclassified each component to another line item.
|
|
(4)
|
Retitled “Other long-term investments” to “Other invested assets.”
|
(2) Cumulative-effect Adjustment Upon Adoption
The provisions of ASU 2016-01 require that the Company apply the amendments through a cumulative-effect adjustment to the Consolidated Statements of Financial Position as of the beginning of the fiscal year of adoption. The following table illustrates the impact on the Company’s Consolidated Statement of Financial Position as a result of recording this cumulative-effect adjustment on January 1, 2018.
174
|
Summary of ASU 2016-01 Transition Impacts on the Consolidated Statement
|
|||
|
of Financial Position upon Adoption on January 1, 2018
|
|||
|
(in millions)
|
|||
|
Increase / (Decrease)
|
|||
|
Other invested assets
|
$
|
229
|
|
|
Total assets
|
$
|
229
|
|
|
Policyholders’ dividends
|
$
|
157
|
|
|
Income taxes
|
15
|
|
|
|
Total liabilities
|
172
|
|
|
|
Accumulated other comprehensive income (loss)
|
(847
|
)
|
|
|
Retained earnings
|
904
|
|
|
|
Total equity
|
57
|
|
|
|
Total liabilities and equity
|
$
|
229
|
|
(3) Changes to Accounting Policies
The narrative description of our significant accounting policies at the beginning of this Note reflects our policies as of December 31, 2018, including policies associated with the adoption of ASU 2016-01.
Adoption of ASU 2014-09
Effective January 1, 2018, the Company adopted ASU 2014-09,
Revenue from Contracts with Customers (Topic 606),
using a modified retrospective method. The core principle of this ASU is that an entity should recognize revenue to depict the transfer of promised goods or services to customers in an amount that reflects the consideration to which the entity expects to be entitled in exchange for those goods or services. This core principle is assessed via application of a five-step revenue recognition model that is detailed within the ASU.
There was no material impact to the financial statements at the date of adoption of this ASU. The prospective impact primarily affects revenue recognition policies pertaining to the Company’s investment management business. This revenue is classified within the “Asset management and service fees” line item in the Consolidated Statements of Operations. Adoption of this standard has no impact on revenues related to financial instruments and insurance contracts (some of which may be reflected within “Asset management and service fees”) given that these types of revenues were specifically scoped out of this ASU.
For the year ended December 31, 2018, 2017 and 2016, respectively, asset management and service fee revenues included
$3,438 million
,
$3,328 million
and
$3,068 million
of asset-based management fees,
$56 million
,
$194 million
and
$106 million
of performance-based incentive fees, and
$606 million
,
$605 million
and
$578 million
of other fees. These fees predominantly relate to investment management activities but also include certain asset-based fees associated with insurance contracts. In accordance with the provisions of the ASU, the comparative information for the prior period was not restated and continues to be reported under the accounting standards in effect for that period.
175
Other ASU adopted during the year ended December 31, 2018
|
Standard
|
Description
|
Effective date and method of adoption
|
Effect on the financial statements or other significant matters
|
|||
|
ASU 2016-15
,
Statement of Cash
Flows (Topic 230):
Classification of Certain Cash Receipts and Cash
Payments (a
Consensus of the
Emerging Issues
Task Force)
|
This ASU addresses diversity in practice in how certain cash receipts and cash payments are presented and classified in the statement of cash flows. The standard provides clarity on the treatment of eight specifically defined types of cash inflows and outflows.
|
January 1, 2018 using the retrospective method (with early adoption permitted provided that all amendments are adopted in the same period).
|
Adoption of the ASU did not have a significant impact on the Company’s Consolidated Financial Statements and Notes to the Consolidated Financial Statements.
|
|||
|
ASU 2016-18
,
Statement of Cash Flows (Topic 230): Restricted Cash
|
In November 2016, the FASB issued this ASU to address diversity in practice from entities classifying and presenting transfers between cash and restricted cash as operating, investing, or financing activities, or as a combination of those activities in the Statement of Cash Flows. The ASU requires entities to show the changes in the total of cash, cash equivalents, restricted cash and restricted cash equivalents in the Statement of Cash Flows. As a result, transfers between such categories will no longer be presented in the Statement of Cash Flows.
|
January 1, 2018 using the retrospective method (with early adoption permitted).
|
Adoption of the ASU did not have a significant impact on the Company’s Consolidated Financial Statements and Notes to the Consolidated Financial Statements.
|
|||
|
ASU 2018-02,
Income Statement - Reporting Comprehensive Income (Topic 220): Reclassification of Certain Tax Effects from Accumulated Other Comprehensive Income (Loss)
|
In February 2018, this ASU was issued following the enactment of the Tax Act of 2017. This ASU allows an entity to elect a reclassification from AOCI to retained earnings for stranded effects resulting from the Tax Act of 2017.
|
January 1, 2019 with early adoption permitted. The ASU should be applied either in the period of adoption or retrospectively to each period in which the effect of the change in the U.S. federal corporate income tax rate in the Tax Act of 2017 is recognized.
|
The Company early adopted the ASU effective January 1, 2018 and elected to apply the ASU in the period of adoption subsequent to recording the adoption impacts of ASU 2016-01 as described above. As a result, the Company reclassified stranded effects resulting from the Tax Act of 2017 by increasing AOCI and decreasing retained earnings, each by $1,653 million. Stranded effects unrelated to the Tax Act of 2017 are generally released from AOCI when an entire portfolio of the type of item related to the stranded effect is liquidated, sold or extinguished (i.e., portfolio approach).
|
|||
ASU issued but not yet adopted as of December 31, 2018
—
ASU 2018-12
ASU 2018-12,
Financial Services - Insurance (Topic 944): Targeted Improvements to the Accounting for Long-Duration Contracts,
was issued by the FASB on August 15, 2018 and is expected to have a significant impact on the Company’s Consolidated Financial Statements and Notes to the Consolidated Financial Statements. The ASU is effective January 1, 2021 (with early adoption permitted), and will impact, at least to some extent, the accounting and disclosure requirements for all long-duration insurance and investment contracts issued by the Company. Outlined below are four key areas of change, although there are other less significant changes not noted below. In addition to the impacts to the balance sheet upon adoption, the Company also expects an impact to how earnings emerge thereafter.
176
|
ASU 2018-12 Amended Topic
|
Description
|
Method of adoption
|
Effect on the financial statements or other significant matters
|
|||
|
Cash flow assumptions used to measure the liability for future policy benefits for non-participating traditional and limited-pay insurance products
|
Requires an entity to review, and if necessary, update the cash flow assumptions used to measure the liability for future policy benefits, for both changes in future assumptions and actual experience, at least annually using a retrospective update method with a cumulative catch-up adjustment recorded in a separate line item in the Consolidated Statements of Operations.
|
An entity may choose one of two adoption methods for the liability for future policy benefits: (1) a modified retrospective transition method whereby the entity will apply the amendments to contracts in force as of the beginning of the earliest period presented on the basis of their existing carrying amounts, adjusted for the removal of any related amounts in AOCI or (2) a full retrospective transition method.
|
The options for method of adoption and the impacts of such methods are under assessment.
|
|||
|
Discount rate assumption used to measure the liability for future policy benefits for non-participating traditional and limited-pay insurance products
|
Requires discount rate assumptions to be based on an upper-medium grade fixed income instrument yield and will be required to be updated each quarter with the impact recorded through OCI.
|
As noted above, an entity may choose either a modified retrospective transition method or full retrospective transition method for the liability for future policy benefits. Under either method, for balance sheet remeasurement purposes, the liability for future policy benefits will be remeasured using current discount rates as of the beginning of the earliest period presented with the impact recorded as a cumulative effect adjustment to AOCI.
|
Upon adoption, under either transition method, there will be an adjustment to AOCI as a result of remeasuring in-force contract liabilities using current upper-medium grade fixed income instrument yields. The adjustment upon adoption will largely reflect the difference between the discount rate locked-in at contract inception versus current discount rates at transition. The magnitude of such adjustment is currently being assessed.
|
|||
|
Amortization of deferred acquisition costs (DAC) and other balances
|
Requires DAC and other balances, such as unearned revenue reserves and DSI, to be amortized on a constant level basis over the expected term of the related contract, independent of expected profitability.
|
An entity may apply one of two adoption methods: (1) a modified retrospective transition method whereby the entity will apply the amendments to contracts in force as of the beginning of the earliest period presented on the basis of their existing carrying amounts, adjusted for the removal of any related amounts in AOCI or (2) if an entity chooses a full retrospective transition method for its future policy benefits, as described above, it is required to also use a retrospective transition method for DAC and other balances.
|
The options for method of adoption and the impacts of such methods are under assessment. Under the modified retrospective transition method, the Company would not expect a significant impact to the balance sheet, other than the impact of the removal of any related amounts in AOCI.
|
|||
|
Market Risk Benefits
|
Requires an entity to measure all market risk benefits (e.g., living benefit and death benefit guarantees associated with variable annuities) at fair value with changes in value attributable to changes in an entity’s NPR recognized in OCI.
|
An entity will apply a retrospective transition method which will include a cumulative-effect adjustment on the balance sheet as of the earliest period presented.
|
Upon adoption, the Company expects an impact to retained earnings for the difference between the fair value and carrying value of benefits not currently measured at fair value (e.g., Guaranteed Minimum Death Benefits (“GMDB”) on variable annuities) and an impact from reclassifying the cumulative effect of changes in NPR from retained earnings to AOCI. The magnitude of such adjustments is currently being assessed.
|
|||
177
Other ASU issued but not yet adopted as of December 31, 2018
|
Standard
|
Description
|
Effective date and method of adoption
|
Effect on the financial statements or other significant matters
|
|||
|
ASU 2016-02
,
Leases (Topic 842)
|
This ASU ensures that assets and liabilities from all outstanding lease contracts are recognized on the balance sheet (with limited exception). The ASU substantially changes a Lessee’s accounting for leases and requires the recording on balance sheet of a “right-of-use” asset and liability to make lease payments for most leases. A Lessee will continue to recognize expense in its income statement in a manner similar to the requirements under the current lease accounting standard. For Lessors, the standard modifies classification criteria and accounting for sales-type and direct financing leases and requires a Lessor to derecognize the carrying value of the leased asset that is considered to have been transferred to a Lessee and record a lease receivable and residual asset (“receivable and residual” approach). The standard also eliminates the real estate specific provisions of the current standard (i.e., sale-leaseback).
|
January 1, 2019 using either the modified retrospective method with a cumulative effect adjustment as of the earliest period presented or the optional transition method with a cumulative effect adjustment recorded as of the beginning of the fiscal year of adoption. Early adoption is permitted.
|
Upon adoption, the Company expects to apply the optional transition method and record a right-of-use asset and liability of approximately $600 million related to existing operating leases. Any new lease arrangements and/or significant modifications entered into subsequent to the adoption date will be accounted for in accordance with the new standard.
|
|||
|
ASU 2016-13
,
Financial Instruments-Credit Losses (Topic326):
Measurement of
Credit Losses on
Financial
Instruments
|
This ASU provides a new current expected credit loss model to account for credit losses on certain financial assets and off-balance sheet exposures (e.g., loans held for investment, debt securities held to maturity, reinsurance receivables, net investments in leases and loan commitments). The model requires an entity to estimate lifetime credit losses related to such financial assets and exposures based on relevant information about past events, current conditions, and reasonable and supportable forecasts that affect the collectability of the reported amount. The standard also modifies the current OTTI standard for available-for-sale debt securities to require the use of an allowance rather than a direct write down of the investment, and replaces the existing standard for purchased credit deteriorated loans and debt securities.
|
January 1, 2020 using the modified retrospective method which will include a cumulative-effect adjustment on the balance sheet as of the beginning of the fiscal year of adoption. However, prospective application is required for purchased credit deteriorated assets previously accounted for under ASU 310-30 and for debt securities for which an OTTI was recognized prior to the date of adoption. Early adoption is permitted beginning January 1, 2019.
|
The Company is currently assessing the impact of the ASU on the Company’s Consolidated Financial Statements and Notes to the Consolidated Financial Statements.
|
|||
|
ASU 2017-04,
Intangibles - Goodwill and Other (Topic 350): Simplifying the Test for Goodwill Impairment
|
This ASU simplifies the subsequent measurement of goodwill by eliminating Step 2 from the goodwill impairment test in current U.S. GAAP, which measures a goodwill impairment by comparing the implied fair value of a reporting unit’s goodwill with the carrying amount of the goodwill. Under the ASU, a goodwill impairment should be recorded for the amount by which the carrying amount of a reporting unit exceeds its fair value (capped by the total amount of goodwill allocated to the reporting unit).
|
January 1, 2020 using the prospective method (with early adoption permitted).
|
The Company does not expect the adoption of the ASU to have a significant impact on the Company’s Consolidated Financial Statements and Notes to the Consolidated Financial Statements.
|
|||
178
|
Standard
|
Description
|
Effective date and method of adoption
|
Effect on the financial statements or other significant matters
|
|||
|
ASU 2017-08
, Receivables -Nonrefundable Fees and Other Costs (Subtopic 310-20) Premium Amortization on Purchased Callable Debt Securities
|
This ASU requires certain premiums on callable debt securities to be amortized to the earliest call date.
|
January 1, 2019 using the modified retrospective method (with early adoption permitted) which will include a cumulative-effect adjustment on the balance sheet as of the beginning of the fiscal year of adoption.
|
Adoption of the ASU will not have a significant impact on the Company’s Consolidated Financial Statements and Notes to the Consolidated Financial Statements.
|
|||
|
ASU 2017-12
,
Derivatives and Hedging (Topic 815): Targeted Improvements to Accounting for Hedging Activities
|
This ASU makes targeted changes to the existing hedge accounting model to better portray the economics of an entity’s risk management activities and to simplify the use of hedge accounting.
|
January 1, 2019 using the modified retrospective method (with early adoption permitted) which will include a cumulative-effect adjustment on the balance sheet as of the beginning of the fiscal year of adoption.
|
Adoption of the ASU will not have a significant impact on the Company’s Consolidated Financial Statements and Notes to the Consolidated Financial Statements.
|
|||
|
3.
|
INVESTMENTS
|
Fixed Maturity Securities
The following tables set forth the composition of fixed maturity securities (excluding investments classified as trading), as of the dates indicated:
|
|
December 31, 2018
|
||||||||||||||||||
|
|
Amortized
Cost
|
Gross
Unrealized
Gains
|
Gross
Unrealized
Losses
|
Fair
Value
|
OTTI
in AOCI(4)
|
||||||||||||||
|
|
(in millions)
|
||||||||||||||||||
|
Fixed maturities, available-for-sale:
|
|||||||||||||||||||
|
U.S. Treasury securities and obligations of U.S. government authorities and agencies
|
$
|
28,242
|
|
$
|
2,994
|
|
$
|
642
|
|
$
|
30,594
|
|
$
|
0
|
|
||||
|
Obligations of U.S. states and their political subdivisions
|
9,880
|
|
676
|
|
63
|
|
10,493
|
|
0
|
|
|||||||||
|
Foreign government bonds
|
96,710
|
|
16,714
|
|
314
|
|
113,110
|
|
0
|
|
|||||||||
|
U.S. corporate public securities
|
82,257
|
|
3,912
|
|
2,754
|
|
83,415
|
|
(2
|
)
|
|||||||||
|
U.S. corporate private securities(1)
|
32,450
|
|
1,151
|
|
581
|
|
33,020
|
|
0
|
|
|||||||||
|
Foreign corporate public securities
|
27,671
|
|
2,061
|
|
531
|
|
29,201
|
|
(3
|
)
|
|||||||||
|
Foreign corporate private securities
|
25,314
|
|
434
|
|
1,217
|
|
24,531
|
|
0
|
|
|||||||||
|
Asset-backed securities(2)
|
12,888
|
|
162
|
|
77
|
|
12,973
|
|
(160
|
)
|
|||||||||
|
Commercial mortgage-backed securities
|
13,396
|
|
99
|
|
180
|
|
13,315
|
|
0
|
|
|||||||||
|
Residential mortgage-backed securities(3)
|
2,937
|
|
99
|
|
32
|
|
3,004
|
|
(1
|
)
|
|||||||||
|
Total fixed maturities, available-for-sale(1)
|
$
|
331,745
|
|
$
|
28,302
|
|
$
|
6,391
|
|
$
|
353,656
|
|
$
|
(166
|
)
|
||||
179
|
|
December 31, 2018
|
||||||||||||||
|
|
Amortized
Cost
|
Gross
Unrealized
Gains
|
Gross
Unrealized
Losses
|
Fair
Value
|
|||||||||||
|
|
(in millions)
|
||||||||||||||
|
Fixed maturities, held-to-maturity:
|
|||||||||||||||
|
Foreign government bonds
|
$
|
885
|
|
$
|
269
|
|
$
|
0
|
|
$
|
1,154
|
|
|||
|
Foreign corporate public securities
|
668
|
|
64
|
|
0
|
|
732
|
|
|||||||
|
Foreign corporate private securities(5)
|
95
|
|
3
|
|
0
|
|
98
|
|
|||||||
|
Residential mortgage-backed securities(3)
|
365
|
|
23
|
|
0
|
|
388
|
|
|||||||
|
Total fixed maturities, held-to-maturity(5)
|
$
|
2,013
|
|
$
|
359
|
|
$
|
0
|
|
$
|
2,372
|
|
|||
__________
|
(1)
|
Excludes notes with amortized cost of
$4,216 million
(fair value,
$4,216 million
), which have been offset with the associated payables under a netting agreement.
|
|
(2)
|
Includes credit-tranched securities collateralized by loan obligations, sub-prime mortgages, auto loans, credit cards, education loans and other asset types.
|
|
(3)
|
Includes publicly-traded agency pass-through securities and collateralized mortgage obligations.
|
|
(4)
|
Represents the amount of unrealized losses remaining in AOCI, from the impairment measurement date. Amount excludes
$356 million
of net unrealized gains on impaired available-for-sale securities and
$1 million
of net unrealized gains on impaired held-to-maturity securities relating to changes in the value of such securities subsequent to the impairment measurement date.
|
|
(5)
|
Excludes notes with amortized cost of
$4,879 million
(fair value,
$4,879 million
), which have been offset with the associated payables under a netting agreement.
|
|
|
December 31, 2017
|
||||||||||||||||||
|
|
Amortized
Cost
|
Gross
Unrealized
Gains
|
Gross
Unrealized
Losses
|
Fair
Value
|
OTTI
in AOCI(4)
|
||||||||||||||
|
|
(in millions)
|
||||||||||||||||||
|
Fixed maturities, available-for-sale:
|
|||||||||||||||||||
|
U.S. Treasury securities and obligations of U.S. government authorities and agencies
|
$
|
22,837
|
|
$
|
3,647
|
|
$
|
346
|
|
$
|
26,138
|
|
$
|
0
|
|
||||
|
Obligations of U.S. states and their political subdivisions
|
9,366
|
|
1,111
|
|
6
|
|
10,471
|
|
0
|
|
|||||||||
|
Foreign government bonds
|
88,062
|
|
15,650
|
|
293
|
|
103,419
|
|
0
|
|
|||||||||
|
U.S. corporate public securities
|
81,967
|
|
8,671
|
|
414
|
|
90,224
|
|
(10
|
)
|
|||||||||
|
U.S. corporate private securities(1)
|
31,852
|
|
2,051
|
|
169
|
|
33,734
|
|
(13
|
)
|
|||||||||
|
Foreign corporate public securities
|
26,389
|
|
3,118
|
|
99
|
|
29,408
|
|
(5
|
)
|
|||||||||
|
Foreign corporate private securities
|
23,322
|
|
1,242
|
|
337
|
|
24,227
|
|
0
|
|
|||||||||
|
Asset-backed securities(2)
|
11,965
|
|
278
|
|
10
|
|
12,233
|
|
(237
|
)
|
|||||||||
|
Commercial mortgage-backed securities
|
13,134
|
|
238
|
|
91
|
|
13,281
|
|
0
|
|
|||||||||
|
Residential mortgage-backed securities(3)
|
3,491
|
|
165
|
|
11
|
|
3,645
|
|
(2
|
)
|
|||||||||
|
Total fixed maturities, available-for-sale(1)
|
$
|
312,385
|
|
$
|
36,171
|
|
$
|
1,776
|
|
$
|
346,780
|
|
$
|
(267
|
)
|
||||
|
|
December 31, 2017
|
||||||||||||||
|
|
Amortized
Cost
|
Gross
Unrealized
Gains
|
Gross
Unrealized
Losses
|
Fair
Value
|
|||||||||||
|
|
(in millions)
|
||||||||||||||
|
Fixed maturities, held-to-maturity:
|
|||||||||||||||
|
Foreign government bonds
|
$
|
865
|
|
$
|
265
|
|
$
|
0
|
|
$
|
1,130
|
|
|||
|
Foreign corporate public securities
|
654
|
|
82
|
|
0
|
|
736
|
|
|||||||
|
Foreign corporate private securities(5)
|
84
|
|
2
|
|
0
|
|
86
|
|
|||||||
|
Residential mortgage-backed securities(3)
|
446
|
|
32
|
|
0
|
|
478
|
|
|||||||
|
Total fixed maturities, held-to-maturity(5)
|
$
|
2,049
|
|
$
|
381
|
|
$
|
0
|
|
$
|
2,430
|
|
|||
180
__________
|
(1)
|
Excludes notes with amortized cost of
$2,660 million
(fair value,
$2,660 million
), which have been offset with the associated payables under a netting agreement.
|
|
(2)
|
Includes credit-tranched securities collateralized by loan obligations, sub-prime mortgages, auto loans, credit cards, education loans and other asset types.
|
|
(3)
|
Includes publicly-traded agency pass-through securities and collateralized mortgage obligations.
|
|
(4)
|
Represents the amount of unrealized losses remaining in AOCI, from the impairment measurement date. Amount excludes
$553 million
of net unrealized gains on impaired available-for-sale securities and
$2 million
of net unrealized gains on impaired held-to-maturity securities relating to changes in the value of such securities subsequent to the impairment measurement date.
|
|
(5)
|
Excludes notes with amortized cost of
$4,627 million
(fair value,
$4,913 million
), which have been offset with the associated payables under a netting agreement.
|
The following tables set forth the fair value and gross unrealized losses aggregated by investment category and length of time that individual fixed maturity securities had been in a continuous unrealized loss position, as of the dates indicated:
|
|
December 31, 2018
|
|||||||||||||||||||||||
|
|
Less Than
Twelve Months |
Twelve Months
or More |
Total
|
|||||||||||||||||||||
|
|
Fair
Value |
Gross
Unrealized Losses |
Fair
Value |
Gross
Unrealized Losses |
Fair
Value |
Gross
Unrealized Losses |
||||||||||||||||||
|
|
(in millions)
|
|||||||||||||||||||||||
|
Fixed maturities(1):
|
||||||||||||||||||||||||
|
U.S. Treasury securities and obligations of U.S. government authorities and agencies
|
$
|
3,007
|
|
$
|
67
|
|
$
|
6,986
|
|
$
|
575
|
|
$
|
9,993
|
|
$
|
642
|
|
||||||
|
Obligations of U.S. states and their political subdivisions
|
1,725
|
|
25
|
|
999
|
|
38
|
|
2,724
|
|
63
|
|
||||||||||||
|
Foreign government bonds
|
2,369
|
|
136
|
|
3,515
|
|
178
|
|
5,884
|
|
314
|
|
||||||||||||
|
U.S. corporate public securities
|
34,064
|
|
1,570
|
|
13,245
|
|
1,184
|
|
47,309
|
|
2,754
|
|
||||||||||||
|
U.S. corporate private securities
|
8,923
|
|
225
|
|
7,985
|
|
356
|
|
16,908
|
|
581
|
|
||||||||||||
|
Foreign corporate public securities
|
7,363
|
|
308
|
|
2,928
|
|
223
|
|
10,291
|
|
531
|
|
||||||||||||
|
Foreign corporate private securities
|
12,218
|
|
692
|
|
4,468
|
|
525
|
|
16,686
|
|
1,217
|
|
||||||||||||
|
Asset-backed securities
|
8,255
|
|
70
|
|
669
|
|
7
|
|
8,924
|
|
77
|
|
||||||||||||
|
Commercial mortgage-backed securities
|
1,781
|
|
14
|
|
4,733
|
|
166
|
|
6,514
|
|
180
|
|
||||||||||||
|
Residential mortgage-backed securities
|
194
|
|
1
|
|
1,042
|
|
31
|
|
1,236
|
|
32
|
|
||||||||||||
|
Total
|
$
|
79,899
|
|
$
|
3,108
|
|
$
|
46,570
|
|
$
|
3,283
|
|
$
|
126,469
|
|
$
|
6,391
|
|
||||||
__________
|
(1)
|
Includes
$13 million
of fair value and less than
$1 million
of gross unrealized losses, which are not reflected in AOCI, on securities classified as held-to-maturity, as of December 31,
2018
.
|
181
|
|
December 31, 2017
|
|||||||||||||||||||||||
|
|
Less Than
Twelve Months |
Twelve Months
or More |
Total
|
|||||||||||||||||||||
|
|
Fair
Value |
Gross
Unrealized Losses |
Fair
Value |
Gross
Unrealized Losses |
Fair
Value |
Gross
Unrealized Losses |
||||||||||||||||||
|
|
(in millions)
|
|||||||||||||||||||||||
|
Fixed maturities(1):
|
||||||||||||||||||||||||
|
U.S. Treasury securities and obligations of U.S. government authorities and agencies
|
$
|
3,450
|
|
$
|
28
|
|
$
|
6,391
|
|
$
|
318
|
|
$
|
9,841
|
|
$
|
346
|
|
||||||
|
Obligations of U.S. states and their political subdivisions
|
44
|
|
0
|
|
287
|
|
6
|
|
331
|
|
6
|
|
||||||||||||
|
Foreign government bonds
|
4,417
|
|
55
|
|
2,937
|
|
238
|
|
7,354
|
|
293
|
|
||||||||||||
|
U.S. corporate public securities
|
7,914
|
|
110
|
|
6,831
|
|
304
|
|
14,745
|
|
414
|
|
||||||||||||
|
U.S. corporate private securities
|
4,596
|
|
76
|
|
2,009
|
|
93
|
|
6,605
|
|
169
|
|
||||||||||||
|
Foreign corporate public securities
|
2,260
|
|
21
|
|
1,678
|
|
78
|
|
3,938
|
|
99
|
|
||||||||||||
|
Foreign corporate private securities
|
1,213
|
|
20
|
|
5,339
|
|
317
|
|
6,552
|
|
337
|
|
||||||||||||
|
Asset-backed securities
|
564
|
|
2
|
|
366
|
|
8
|
|
930
|
|
10
|
|
||||||||||||
|
Commercial mortgage-backed securities
|
2,593
|
|
17
|
|
2,212
|
|
74
|
|
4,805
|
|
91
|
|
||||||||||||
|
Residential mortgage-backed securities
|
584
|
|
4
|
|
286
|
|
7
|
|
870
|
|
11
|
|
||||||||||||
|
Total
|
$
|
27,635
|
|
$
|
333
|
|
$
|
28,336
|
|
$
|
1,443
|
|
$
|
55,971
|
|
$
|
1,776
|
|
||||||
__________
|
(1)
|
Includes
$12 million
of fair value and less than
$1 million
of gross unrealized losses, which are not reflected in AOCI, on securities classified as held-to-maturity, as of December 31,
2017
.
|
As of December 31,
2018
and
2017
, the gross unrealized losses on fixed maturity securities were composed of
$5,391 million
and
$1,470 million
, respectively, related to “1” highest quality or “2” high quality securities based on the National Association of Insurance Commissioners (“NAIC”) or equivalent rating and
$1,000 million
and
$306 million
, respectively, related to other than high or highest quality securities based on NAIC
or equivalent rating. As of December 31,
2018
, the
$3,283 million
of gross unrealized losses of twelve months or more were concentrated in U.S. government bonds and in the Company’s corporate securities within the utility, consumer non-cyclical and finance sectors. As of December 31,
2017
, the
$1,443 million
of gross unrealized losses of twelve months or more were concentrated in U.S. government bonds, foreign government bonds and in the Company’s corporate securities within the energy, utility, and consumer non-cyclical sectors. In accordance with its policy described in Note 2, the Company concluded that an adjustment to earnings for OTTI for these fixed maturity securities was not warranted at either December 31,
2018
or
2017
. These conclusions were based on a detailed analysis of the underlying credit and cash flows on each security. Gross unrealized losses are primarily attributable to general credit spread widening, increases in interest rates and foreign currency exchange rate movements. As of December 31,
2018
, the Company did not intend to sell these securities, and it was not more likely than not that the Company would be required to sell these securities before the anticipated recovery of the remaining amortized cost basis.
The following table sets forth the amortized cost and fair value of fixed maturities by contractual maturities, as of the date indicated:
182
|
December 31, 2018
|
||||||||||||||||
|
|
Available-for-Sale
|
Held-to-Maturity
|
||||||||||||||
|
|
Amortized
Cost
|
Fair
Value
|
Amortized
Cost
|
Fair
Value
|
||||||||||||
|
|
(in millions)
|
|||||||||||||||
|
Fixed maturities:
|
||||||||||||||||
|
Due in one year or less
|
$
|
8,943
|
|
$
|
9,336
|
|
$
|
26
|
|
$
|
26
|
|
||||
|
Due after one year through five years
|
54,419
|
|
56,705
|
|
154
|
|
158
|
|
||||||||
|
Due after five years through ten years
|
66,490
|
|
69,635
|
|
586
|
|
649
|
|
||||||||
|
Due after ten years(1)
|
172,672
|
|
188,688
|
|
882
|
|
1,151
|
|
||||||||
|
Asset-backed securities
|
12,888
|
|
12,973
|
|
0
|
|
0
|
|
||||||||
|
Commercial mortgage-backed securities
|
13,396
|
|
13,315
|
|
0
|
|
0
|
|
||||||||
|
Residential mortgage-backed securities
|
2,937
|
|
3,004
|
|
365
|
|
388
|
|
||||||||
|
Total
|
$
|
331,745
|
|
$
|
353,656
|
|
$
|
2,013
|
|
$
|
2,372
|
|
||||
__________
|
(1)
|
Excludes available-for-sale notes with amortized cost of
$4,216 million
(fair value,
$4,216 million
) and held-to-maturity notes with amortized cost of
$4,879 million
(fair value,
$4,879 million
), which have been offset with the associated payables under a netting agreement.
|
Actual maturities may differ from contractual maturities because issuers may have the right to call or prepay obligations. Asset-backed, commercial mortgage-backed and residential mortgage-backed securities are shown separately in the table above, as they do not have a single maturity date.
The following table sets forth the sources of fixed maturity proceeds and related investment gains (losses), as well as losses on impairments of fixed maturities, for the periods indicated:
|
Years Ended December 31,
|
||||||||||||
|
2018
|
2017
|
2016
|
||||||||||
|
|
(in millions)
|
|||||||||||
|
Fixed maturities, available-for-sale:
|
||||||||||||
|
Proceeds from sales(1)
|
$
|
38,230
|
|
$
|
34,002
|
|
$
|
29,878
|
|
|||
|
Proceeds from maturities/prepayments
|
21,207
|
|
24,460
|
|
19,710
|
|
||||||
|
Gross investment gains from sales and maturities
|
1,412
|
|
1,548
|
|
1,433
|
|
||||||
|
Gross investment losses from sales and maturities
|
(905
|
)
|
(700
|
)
|
(545
|
)
|
||||||
|
OTTI recognized in earnings(2)
|
(279
|
)
|
(267
|
)
|
(222
|
)
|
||||||
|
Fixed maturities, held-to-maturity:
|
||||||||||||
|
Proceeds from maturities/prepayments(3)
|
$
|
94
|
|
$
|
153
|
|
$
|
272
|
|
|||
__________
|
(1)
|
Includes
$(238) million
,
$218 million
and
$(125) million
of non-cash related proceeds due to the timing of trade settlements for the years ended December 31,
2018
,
2017
and
2016
, respectively.
|
|
(2)
|
Excludes the portion of OTTI amounts remaining in “Other comprehensive income (loss)”, representing any difference between the fair value of the impaired debt security and the net present value of its projected future cash flows at the time of impairment.
|
|
(3)
|
Includes less than
$(1) million
,
$(2) million
and
$1 million
of non-cash related proceeds due to the timing of trade settlements for the years ended December 31,
2018
,
2017
and
2016
, respectively.
|
The following table sets forth a rollforward of pre-tax amounts remaining in OCI related to fixed maturity securities with credit loss impairments recognized in earnings, for the periods indicated:
183
|
|
Years Ended December 31,
|
|||||||
|
|
2018
|
2017
|
||||||
|
|
(in millions)
|
|||||||
|
Credit loss impairments:
|
||||||||
|
Balance, beginning of period
|
$
|
319
|
|
$
|
359
|
|
||
|
New credit loss impairments
|
1
|
|
10
|
|
||||
|
Additional credit loss impairments on securities previously impaired
|
0
|
|
11
|
|
||||
|
Increases due to the passage of time on previously recorded credit losses
|
10
|
|
15
|
|
||||
|
Reductions for securities which matured, paid down, prepaid or were sold during the period
|
(162
|
)
|
(58
|
)
|
||||
|
Reductions for securities impaired to fair value during the period(1)
|
(24
|
)
|
(13
|
)
|
||||
|
Accretion of credit loss impairments previously recognized due to an increase in cash flows expected to be collected
|
(4
|
)
|
(5
|
)
|
||||
|
Balance, end of period
|
$
|
140
|
|
$
|
319
|
|
||
__________
|
(1)
|
Represents circumstances where the Company determined in the current period that it intends to sell the security or it is more likely than not that it will be required to sell the security before recovery of the security’s amortized cost.
|
Assets Supporting Experience-Rated Contractholder Liabilities
The following table sets forth the composition of “Assets supporting experience-rated contractholder liabilities,” as of the dates indicated:
|
|
December 31, 2018
|
December 31, 2017
|
||||||||||||||
|
|
Amortized
Cost or Cost
|
Fair
Value
|
Amortized
Cost or Cost
|
Fair
Value
|
||||||||||||
|
|
(in millions)
|
|||||||||||||||
|
Short-term investments and cash equivalents
|
$
|
215
|
|
$
|
215
|
|
$
|
245
|
|
$
|
245
|
|
||||
|
Fixed maturities:
|
||||||||||||||||
|
Corporate securities
|
13,258
|
|
13,119
|
|
13,816
|
|
14,073
|
|
||||||||
|
Commercial mortgage-backed securities
|
2,346
|
|
2,324
|
|
2,294
|
|
2,311
|
|
||||||||
|
Residential mortgage-backed securities(1)
|
828
|
|
811
|
|
961
|
|
966
|
|
||||||||
|
Asset-backed securities(2)
|
1,649
|
|
1,665
|
|
1,363
|
|
1,392
|
|
||||||||
|
Foreign government bonds
|
1,087
|
|
1,083
|
|
1,050
|
|
1,057
|
|
||||||||
|
U.S. government authorities and agencies and obligations of U.S. states
|
538
|
|
577
|
|
357
|
|
410
|
|
||||||||
|
Total fixed maturities(3)
|
19,706
|
|
19,579
|
|
19,841
|
|
20,209
|
|
||||||||
|
Equity securities
|
1,378
|
|
1,460
|
|
1,278
|
|
1,643
|
|
||||||||
|
Total assets supporting experience-rated contractholder liabilities(4)
|
$
|
21,299
|
|
$
|
21,254
|
|
$
|
21,364
|
|
$
|
22,097
|
|
||||
__________
|
(1)
|
Includes publicly-traded agency pass-through securities and collateralized mortgage obligations.
|
|
(2)
|
Includes credit-tranched securities collateralized by sub-prime mortgages, auto loans, credit cards, education loans and other asset types. Includes collateralized loan obligations at fair value of
$1,028 million
and
$943 million
as of
December 31, 2018
and
2017
, respectively, all of which were rated AAA.
|
|
(3)
|
As a percentage of amortized cost,
93%
and
92%
of the portfolio was considered high or highest quality based on NAIC or equivalent ratings, as of
December 31, 2018
and
2017
, respectively.
|
|
(4)
|
As a percentage of amortized cost,
78%
and
80%
of the portfolio consisted of public securities as of
December 31, 2018
and
2017
, respectively.
|
The net change in unrealized gains (losses) from assets supporting experience-rated contractholder liabilities still held at period end, recorded within “Other income (loss),” was
$(778) million
,
$300 million
and
$75 million
during the years ended December 31,
2018
,
2017
and
2016
, respectively.
184
Equity Securities
The net change in unrealized gains (losses) from equity securities, still held at period end, recorded within “Other income (loss),” was
$(1,157) million
during the year ended December 31,
2018
. The net change in unrealized gains (losses) from equity securities, still held at period end, recorded within “Other comprehensive income (loss),” was
$(494) million
and
$760 million
during the years ended December 31,
2017
and
2016
, respectively.
Concentrations of Financial Instruments
The Company monitors its concentrations of financial instruments and mitigates credit risk by maintaining a diversified investment portfolio which limits exposure to any one issuer.
As of the dates indicated, the Company’s exposure to concentrations of credit risk of single issuers greater than 10% of the Company’s stockholders’ equity included securities of the U.S. government and certain U.S. government agencies and securities guaranteed by the U.S. government, as well as the securities disclosed below:
|
|
December 31, 2018
|
December 31, 2017
|
||||||||||||||
|
|
Amortized
Cost
|
Fair
Value
|
Amortized
Cost
|
Fair
Value
|
||||||||||||
|
(in millions)
|
||||||||||||||||
|
Investments in Japanese government and government agency securities:
|
||||||||||||||||
|
Fixed maturities, available-for-sale
|
$
|
71,952
|
|
$
|
84,461
|
|
$
|
64,628
|
|
$
|
76,311
|
|
||||
|
Fixed maturities, held-to-maturity
|
864
|
|
1,127
|
|
844
|
|
1,103
|
|
||||||||
|
Fixed maturities, trading
|
22
|
|
22
|
|
23
|
|
23
|
|
||||||||
|
Assets supporting experience-rated contractholder liabilities
|
691
|
|
697
|
|
657
|
|
667
|
|
||||||||
|
Total
|
$
|
73,529
|
|
$
|
86,307
|
|
$
|
66,152
|
|
$
|
78,104
|
|
||||
|
December 31, 2018
|
December 31, 2017
|
|||||||||||||||
|
Amortized
Cost
|
Fair
Value
|
Amortized
Cost
|
Fair
Value
|
|||||||||||||
|
(in millions)
|
||||||||||||||||
|
Investments in South Korean government and government agency securities:
|
||||||||||||||||
|
Fixed maturities, available-for-sale
|
$
|
10,339
|
|
$
|
12,586
|
|
$
|
9,425
|
|
$
|
10,989
|
|
||||
|
Fixed maturities, held-to-maturity
|
0
|
|
0
|
|
0
|
|
0
|
|
||||||||
|
Fixed maturities, trading
|
0
|
|
0
|
|
0
|
|
0
|
|
||||||||
|
Assets supporting experience-rated contractholder liabilities
|
15
|
|
15
|
|
15
|
|
15
|
|
||||||||
|
Total
|
$
|
10,354
|
|
$
|
12,601
|
|
$
|
9,440
|
|
$
|
11,004
|
|
||||
Commercial Mortgage and Other Loans
The following table sets forth the composition of “Commercial mortgage and other loans,” as of the dates indicated:
185
|
|
December 31, 2018
|
December 31, 2017
|
||||||||||||
|
|
Amount
(in millions)
|
% of
Total
|
Amount
(in millions)
|
% of
Total
|
||||||||||
|
Commercial mortgage and agricultural property loans by property type:
|
||||||||||||||
|
Office
|
$
|
13,280
|
|
22.4
|
%
|
$
|
12,670
|
|
22.9
|
%
|
||||
|
Retail
|
8,639
|
|
14.6
|
|
8,543
|
|
15.5
|
|
||||||
|
Apartments/Multi-Family
|
16,538
|
|
28.0
|
|
15,465
|
|
28.0
|
|
||||||
|
Industrial
|
11,574
|
|
19.6
|
|
9,451
|
|
17.1
|
|
||||||
|
Hospitality
|
1,931
|
|
3.3
|
|
2,067
|
|
3.7
|
|
||||||
|
Other
|
3,846
|
|
6.5
|
|
3,888
|
|
7.0
|
|
||||||
|
Total commercial mortgage loans
|
55,808
|
|
94.4
|
|
52,084
|
|
94.2
|
|
||||||
|
Agricultural property loans
|
3,316
|
|
5.6
|
|
3,203
|
|
5.8
|
|
||||||
|
Total commercial mortgage and agricultural property loans by property type
|
59,124
|
|
100.0
|
%
|
55,287
|
|
100.0
|
%
|
||||||
|
Allowance for credit losses
|
(123
|
)
|
(100
|
)
|
||||||||||
|
Total net commercial mortgage and agricultural property loans by property type
|
59,001
|
|
55,187
|
|
||||||||||
|
Other loans:
|
||||||||||||||
|
Uncollateralized loans
|
660
|
|
663
|
|
||||||||||
|
Residential property loans
|
157
|
|
196
|
|
||||||||||
|
Other collateralized loans
|
17
|
|
5
|
|
||||||||||
|
Total other loans
|
834
|
|
864
|
|
||||||||||
|
Allowance for credit losses
|
(5
|
)
|
(6
|
)
|
||||||||||
|
Total net other loans
|
829
|
|
858
|
|
||||||||||
|
Total commercial mortgage and other loans(1)
|
$
|
59,830
|
|
$
|
56,045
|
|
||||||||
__________
|
(1)
|
Includes loans held for sale which are carried at fair value and are collateralized primarily by apartment complexes. As of December 31,
2018
and
2017
, the net carrying value of these loans was
$763 million
and
$593 million
, respectively.
|
As of December 31,
2018
, the commercial mortgage and agricultural property loans were secured by properties geographically dispersed throughout the United States (with the largest concentrations in California (
28%
), Texas (
9%
) and New York (
8%
) and included loans secured by properties in Europe (
6%
), Australia (
1%
) and Asia (
1%
)).
The following tables set forth the activity in the allowance for credit losses for commercial mortgage and other loans, as of the dates indicated:
186
|
Commercial
Mortgage
Loans
|
Agricultural
Property
Loans
|
Residential
Property
Loans
|
Other
Collateralized
Loans
|
Uncollateralized
Loans
|
Total
|
|||||||||||||||||||
|
|
(in millions)
|
|||||||||||||||||||||||
|
Balance at December 31, 2015
|
$
|
97
|
|
$
|
2
|
|
$
|
3
|
|
$
|
0
|
|
$
|
10
|
|
$
|
112
|
|
||||||
|
Addition to (release of) allowance for credit losses
|
0
|
|
0
|
|
(1
|
)
|
0
|
|
(5
|
)
|
(6
|
)
|
||||||||||||
|
Charge-offs, net of recoveries
|
(1
|
)
|
0
|
|
0
|
|
0
|
|
0
|
|
(1
|
)
|
||||||||||||
|
Change in foreign exchange
|
0
|
|
0
|
|
0
|
|
0
|
|
1
|
|
1
|
|
||||||||||||
|
Balance at December 31, 2016
|
96
|
|
2
|
|
2
|
|
0
|
|
6
|
|
106
|
|
||||||||||||
|
Addition to (release of) allowance for credit losses
|
2
|
|
1
|
|
(1
|
)
|
0
|
|
(1
|
)
|
1
|
|
||||||||||||
|
Charge-offs, net of recoveries
|
(1
|
)
|
0
|
|
0
|
|
0
|
|
0
|
|
(1
|
)
|
||||||||||||
|
Change in foreign exchange
|
0
|
|
0
|
|
0
|
|
0
|
|
0
|
|
0
|
|
||||||||||||
|
Balance at December 31, 2017
|
97
|
|
3
|
|
1
|
|
0
|
|
5
|
|
106
|
|
||||||||||||
|
Addition to (release of) allowance for credit losses
|
23
|
|
0
|
|
(1
|
)
|
0
|
|
0
|
|
22
|
|
||||||||||||
|
Charge-offs, net of recoveries
|
0
|
|
0
|
|
0
|
|
0
|
|
0
|
|
0
|
|
||||||||||||
|
Change in foreign exchange
|
0
|
|
0
|
|
0
|
|
0
|
|
0
|
|
0
|
|
||||||||||||
|
Balance at December 31, 2018
|
$
|
120
|
|
$
|
3
|
|
$
|
0
|
|
$
|
0
|
|
$
|
5
|
|
$
|
128
|
|
||||||
The following tables set forth the allowance for credit losses and the recorded investment in commercial mortgage and other loans, as of the dates indicated:
|
|
December 31, 2018
|
|||||||||||||||||||||||
|
|
Commercial
Mortgage
Loans
|
Agricultural
Property
Loans
|
Residential
Property
Loans
|
Other
Collateralized
Loans
|
Uncollateralized
Loans
|
Total
|
||||||||||||||||||
|
|
(in millions)
|
|||||||||||||||||||||||
|
Allowance for credit losses:
|
||||||||||||||||||||||||
|
Individually evaluated for impairment
|
$
|
19
|
|
$
|
0
|
|
$
|
0
|
|
$
|
0
|
|
$
|
0
|
|
$
|
19
|
|
||||||
|
Collectively evaluated for impairment
|
101
|
|
3
|
|
0
|
|
0
|
|
5
|
|
109
|
|
||||||||||||
|
Total ending balance(1)
|
$
|
120
|
|
$
|
3
|
|
$
|
0
|
|
$
|
0
|
|
$
|
5
|
|
$
|
128
|
|
||||||
|
Recorded investment(2):
|
||||||||||||||||||||||||
|
Individually evaluated for impairment
|
$
|
67
|
|
$
|
35
|
|
$
|
0
|
|
$
|
0
|
|
$
|
2
|
|
$
|
104
|
|
||||||
|
Collectively evaluated for impairment
|
55,741
|
|
3,281
|
|
157
|
|
17
|
|
658
|
|
59,854
|
|
||||||||||||
|
Total ending balance(1)
|
$
|
55,808
|
|
$
|
3,316
|
|
$
|
157
|
|
$
|
17
|
|
$
|
660
|
|
$
|
59,958
|
|
||||||
__________
|
(1)
|
As of December 31,
2018
, there were
no
loans acquired with deteriorated credit quality.
|
|
(2)
|
Recorded investment reflects the carrying value gross of related allowance.
|
187
|
|
December 31, 2017
|
|||||||||||||||||||||||
|
|
Commercial
Mortgage
Loans
|
Agricultural
Property
Loans
|
Residential
Property
Loans
|
Other
Collateralized
Loans
|
Uncollateralized
Loans
|
Total
|
||||||||||||||||||
|
|
(in millions)
|
|||||||||||||||||||||||
|
Allowance for credit losses:
|
||||||||||||||||||||||||
|
Individually evaluated for impairment
|
$
|
7
|
|
$
|
0
|
|
$
|
0
|
|
$
|
0
|
|
$
|
0
|
|
$
|
7
|
|
||||||
|
Collectively evaluated for impairment
|
90
|
|
3
|
|
1
|
|
0
|
|
5
|
|
99
|
|
||||||||||||
|
Total ending balance(1)
|
$
|
97
|
|
$
|
3
|
|
$
|
1
|
|
$
|
0
|
|
$
|
5
|
|
$
|
106
|
|
||||||
|
Recorded investment(2):
|
||||||||||||||||||||||||
|
Individually evaluated for impairment
|
$
|
75
|
|
$
|
39
|
|
$
|
0
|
|
$
|
0
|
|
$
|
2
|
|
$
|
116
|
|
||||||
|
Collectively evaluated for impairment
|
52,009
|
|
3,164
|
|
196
|
|
5
|
|
661
|
|
56,035
|
|
||||||||||||
|
Total ending balance(1)
|
$
|
52,084
|
|
$
|
3,203
|
|
$
|
196
|
|
$
|
5
|
|
$
|
663
|
|
$
|
56,151
|
|
||||||
__________
|
(1)
|
As of December 31,
2017
, there were
no
loans acquired with deteriorated credit quality.
|
|
(2)
|
Recorded investment reflects the carrying value gross of related allowance.
|
The following tables set forth certain key credit quality indicators based upon the recorded investment gross of allowance for credit losses, as of the date indicated:
|
Commercial mortgage loans
|
|
|||||||||||||||
|
December 31, 2018
|
||||||||||||||||
|
|
Debt Service Coverage Ratio
|
|||||||||||||||
|
|
>
1.2X
|
1.0X to <1.2X
|
< 1.0X
|
Total
|
||||||||||||
|
(in millions)
|
||||||||||||||||
|
Loan-to-Value Ratio:
|
||||||||||||||||
|
0%-59.99%
|
$
|
30,325
|
|
$
|
538
|
|
$
|
161
|
|
$
|
31,024
|
|
||||
|
60%-69.99%
|
16,538
|
|
621
|
|
0
|
|
17,159
|
|
||||||||
|
70%-79.99%
|
6,324
|
|
754
|
|
41
|
|
7,119
|
|
||||||||
|
80% or greater
|
332
|
|
142
|
|
32
|
|
506
|
|
||||||||
|
Total commercial mortgage loans
|
$
|
53,519
|
|
$
|
2,055
|
|
$
|
234
|
|
$
|
55,808
|
|
||||
|
Agricultural property loans
|
|
|
|
|
||||||||||||
|
|
December 31, 2018
|
|||||||||||||||
|
Debt Service Coverage Ratio
|
||||||||||||||||
|
|
>
1.2X
|
1.0X to <1.2X
|
< 1.0X
|
Total
|
||||||||||||
|
|
(in millions)
|
|||||||||||||||
|
Loan-to-Value Ratio:
|
||||||||||||||||
|
0%-59.99%
|
$
|
2,997
|
|
$
|
198
|
|
$
|
57
|
|
$
|
3,252
|
|
||||
|
60%-69.99%
|
64
|
|
0
|
|
0
|
|
64
|
|
||||||||
|
70%-79.99%
|
0
|
|
0
|
|
0
|
|
0
|
|
||||||||
|
80% or greater
|
0
|
|
0
|
|
0
|
|
0
|
|
||||||||
|
Total agricultural property loans
|
$
|
3,061
|
|
$
|
198
|
|
$
|
57
|
|
$
|
3,316
|
|
||||
188
|
Total commercial mortgage and agricultural property loans
|
|
|
|
|
||||||||||||
|
December 31, 2018
|
||||||||||||||||
|
|
Debt Service Coverage Ratio
|
|||||||||||||||
|
|
>
1.2X
|
1.0X to <1.2X
|
< 1.0X
|
Total
|
||||||||||||
|
(in millions)
|
||||||||||||||||
|
Loan-to-Value Ratio:
|
||||||||||||||||
|
0%-59.99%
|
$
|
33,322
|
|
$
|
736
|
|
$
|
218
|
|
$
|
34,276
|
|
||||
|
60%-69.99%
|
16,602
|
|
621
|
|
0
|
|
17,223
|
|
||||||||
|
70%-79.99%
|
6,324
|
|
754
|
|
41
|
|
7,119
|
|
||||||||
|
80% or greater
|
332
|
|
142
|
|
32
|
|
506
|
|
||||||||
|
Total commercial mortgage and agricultural property loans
|
$
|
56,580
|
|
$
|
2,253
|
|
$
|
291
|
|
$
|
59,124
|
|
||||
The following tables set forth certain key credit quality indicators based upon the recorded investment gross of allowance for credit losses, as of the date indicated:
|
Commercial mortgage loans
|
|
|
|
|
||||||||||||
|
|
December 31, 2017
|
|||||||||||||||
|
Debt Service Coverage Ratio
|
||||||||||||||||
|
|
>
1.2X
|
1.0X to <1.2X
|
< 1.0X
|
Total
|
||||||||||||
|
|
(in millions)
|
|||||||||||||||
|
Loan-to-Value Ratio:
|
||||||||||||||||
|
0%-59.99%
|
$
|
30,082
|
|
$
|
639
|
|
$
|
251
|
|
$
|
30,972
|
|
||||
|
60%-69.99%
|
13,658
|
|
530
|
|
121
|
|
14,309
|
|
||||||||
|
70%-79.99%
|
5,994
|
|
514
|
|
29
|
|
6,537
|
|
||||||||
|
80% or greater
|
93
|
|
54
|
|
119
|
|
266
|
|
||||||||
|
Total commercial mortgage loans
|
$
|
49,827
|
|
$
|
1,737
|
|
$
|
520
|
|
$
|
52,084
|
|
||||
|
Agricultural property loans
|
|
|
|
|
||||||||||||
|
|
December 31, 2017
|
|||||||||||||||
|
|
Debt Service Coverage Ratio
|
|||||||||||||||
|
|
>
1.2X
|
1.0X to <1.2X
|
< 1.0X
|
Total
|
||||||||||||
|
|
(in millions)
|
|||||||||||||||
|
Loan-to-Value Ratio:
|
||||||||||||||||
|
0%-59.99%
|
$
|
2,988
|
|
$
|
170
|
|
$
|
5
|
|
$
|
3,163
|
|
||||
|
60%-69.99%
|
40
|
|
0
|
|
0
|
|
40
|
|
||||||||
|
70%-79.99%
|
0
|
|
0
|
|
0
|
|
0
|
|
||||||||
|
80% or greater
|
0
|
|
0
|
|
0
|
|
0
|
|
||||||||
|
Total agricultural property loans
|
$
|
3,028
|
|
$
|
170
|
|
$
|
5
|
|
$
|
3,203
|
|
||||
189
|
Total commercial mortgage and agricultural property loans
|
|
|
|
|
||||||||||||
|
|
December 31, 2017
|
|||||||||||||||
|
Debt Service Coverage Ratio
|
||||||||||||||||
|
|
>
1.2X
|
1.0X to <1.2X
|
< 1.0X
|
Total
|
||||||||||||
|
|
(in millions)
|
|||||||||||||||
|
Loan-to-Value Ratio:
|
||||||||||||||||
|
0%-59.99%
|
$
|
33,070
|
|
$
|
809
|
|
$
|
256
|
|
$
|
34,135
|
|
||||
|
60%-69.99%
|
13,698
|
|
530
|
|
121
|
|
14,349
|
|
||||||||
|
70%-79.99%
|
5,994
|
|
514
|
|
29
|
|
6,537
|
|
||||||||
|
80% or greater
|
93
|
|
54
|
|
119
|
|
266
|
|
||||||||
|
Total commercial mortgage and agricultural property loans
|
$
|
52,855
|
|
$
|
1,907
|
|
$
|
525
|
|
$
|
55,287
|
|
||||
The following tables set forth an aging of past due commercial mortgage and other loans based upon the recorded investment gross of allowance for credit losses, as well as the amount of commercial mortgage and other loans on non-accrual status, as of the dates indicated:
|
|
December 31, 2018
|
|||||||||||||||||||||||||||
|
|
Current
|
30-59 Days
Past Due
|
60-89 Days
Past Due
|
90 Days or More Past Due(1)
|
Total Past
Due
|
Total
Loans
|
Non-Accrual
Status(2)
|
|||||||||||||||||||||
|
|
(in millions)
|
|||||||||||||||||||||||||||
|
Commercial mortgage loans
|
$
|
55,808
|
|
$
|
0
|
|
$
|
0
|
|
$
|
0
|
|
$
|
0
|
|
$
|
55,808
|
|
$
|
66
|
|
|||||||
|
Agricultural property loans
|
3,301
|
|
0
|
|
0
|
|
15
|
|
15
|
|
3,316
|
|
18
|
|
||||||||||||||
|
Residential property loans
|
154
|
|
1
|
|
0
|
|
2
|
|
3
|
|
157
|
|
3
|
|
||||||||||||||
|
Other collateralized loans
|
17
|
|
0
|
|
0
|
|
0
|
|
0
|
|
17
|
|
0
|
|
||||||||||||||
|
Uncollateralized loans
|
660
|
|
0
|
|
0
|
|
0
|
|
0
|
|
660
|
|
0
|
|
||||||||||||||
|
Total
|
$
|
59,940
|
|
$
|
1
|
|
$
|
0
|
|
$
|
17
|
|
$
|
18
|
|
$
|
59,958
|
|
$
|
87
|
|
|||||||
__________
|
(1)
|
As of
December 31, 2018
, there were
no
loans in this category accruing interest.
|
|
(2)
|
For additional information regarding the Company’s policies for accruing interest on loans, see Note 2.
|
|
|
December 31, 2017
|
|||||||||||||||||||||||||||
|
|
Current
|
30-59 Days
Past Due
|
60-89 Days
Past Due
|
90 Days or More Past Due(1)
|
Total Past
Due
|
Total
Loans
|
Non-Accrual
Status(2)
|
|||||||||||||||||||||
|
|
(in millions)
|
|||||||||||||||||||||||||||
|
Commercial mortgage loans
|
$
|
52,084
|
|
$
|
0
|
|
$
|
0
|
|
$
|
0
|
|
$
|
0
|
|
$
|
52,084
|
|
$
|
71
|
|
|||||||
|
Agricultural property loans
|
3,201
|
|
0
|
|
0
|
|
2
|
|
2
|
|
3,203
|
|
23
|
|
||||||||||||||
|
Residential property loans
|
191
|
|
3
|
|
0
|
|
2
|
|
5
|
|
196
|
|
2
|
|
||||||||||||||
|
Other collateralized loans
|
5
|
|
0
|
|
0
|
|
0
|
|
0
|
|
5
|
|
0
|
|
||||||||||||||
|
Uncollateralized loans
|
663
|
|
0
|
|
0
|
|
0
|
|
0
|
|
663
|
|
0
|
|
||||||||||||||
|
Total
|
$
|
56,144
|
|
$
|
3
|
|
$
|
0
|
|
$
|
4
|
|
$
|
7
|
|
$
|
56,151
|
|
$
|
96
|
|
|||||||
__________
|
(1)
|
As of
December 31, 2017
, there were
no
loans in this category accruing interest.
|
|
(2)
|
For additional information regarding the Company’s policies for accruing interest on loans, see Note 2.
|
Other Invested Assets
The following table sets forth the composition of “Other invested assets,” as of the dates indicated:
190
|
December 31,
|
||||||||
|
2018
|
2017
|
|||||||
|
|
(in millions)
|
|||||||
|
LPs/LLCs:
|
||||||||
|
Equity method:
|
||||||||
|
Private equity
|
$
|
3,182
|
|
$
|
2,954
|
|
||
|
Hedge funds
|
1,337
|
|
803
|
|
||||
|
Real estate-related
|
1,207
|
|
972
|
|
||||
|
Subtotal equity method
|
5,726
|
|
4,729
|
|
||||
|
Fair value:
|
||||||||
|
Private equity
|
1,684
|
|
1,325
|
|
||||
|
Hedge funds
|
2,135
|
|
2,419
|
|
||||
|
Real estate-related
|
296
|
|
247
|
|
||||
|
Subtotal fair value(1)
|
4,115
|
|
3,991
|
|
||||
|
Total LPs/LLCs
|
9,841
|
|
8,720
|
|
||||
|
Real estate held through direct ownership(2)
|
2,466
|
|
2,409
|
|
||||
|
Derivative instruments
|
1,155
|
|
1,214
|
|
||||
|
Other(3)
|
1,064
|
|
1,030
|
|
||||
|
Total other invested assets(4)
|
$
|
14,526
|
|
$
|
13,373
|
|
||
__________
|
(1)
|
As of December 31,
2017
,
$1,572 million
was accounted for using the cost method.
|
|
(2)
|
As of December 31,
2018
and
2017
, real estate held through direct ownership had mortgage debt of
$776 million
and
$799 million
, respectively.
|
|
(3)
|
Primarily includes strategic investments made by investment management operations, leveraged leases and member and activity stock held in the Federal Home Loan Banks of New York and Boston. For additional information regarding the Company’s holdings in the Federal Home Loan Banks of New York and Boston, see Note 16.
|
|
(4)
|
Prior period amounts have been reclassified to conform to current period presentation. For additional information, see Note 2.
|
In certain investment structures, the Company’s investment management business invests with other co-investors in an investment fund referred to as a feeder fund. In these structures, the invested capital of several feeder funds is pooled together and used to purchase ownership interests in another fund, referred to as a master fund. The master fund utilizes this invested capital and, in certain cases, other debt financing, to purchase various classes of assets on behalf of its investors. Specialized industry accounting for investment companies calls for the feeder fund to reflect its investment in the master fund as a single net asset equal to its proportionate share of the net assets of the master fund, regardless of its level of interest in the master fund. In cases where the Company consolidates the feeder fund, it retains the feeder fund’s net asset presentation and reports the consolidated feeder fund’s proportionate share of the net assets of the master fund in “Other invested assets,” with any unaffiliated investors’ non-controlling interest in the feeder fund reported in “Other liabilities” or “Noncontrolling interests.” The consolidated feeder funds’ investments in these master funds, reflected on this net asset basis, totaled
$349 million
and
$451 million
as of December 31,
2018
and
2017
, respectively. There was
$199 million
and
$310 million
of unaffiliated interest in the consolidated feeder funds as of December 31,
2018
and
2017
, respectively, and the master funds had gross assets of
$122,376 million
and
$82,126 million
, respectively, and gross liabilities of
$119,697 million
and
$79,185 million
, respectively, which are not included on the Company’s balance sheet.
Equity Method Investments
The following tables set forth summarized combined financial information for significant LP/LLC interests accounted for under the equity method, including the Company’s investments in operating joint ventures that are described in more detail in Note 9. Changes between periods in the tables below reflect changes in the activities within the operating joint ventures and LPs/LLCs, as well as changes in the Company’s level of investment in such entities.
191
|
|
December 31,
|
|||||||
|
|
2018
|
2017
|
||||||
|
|
(in millions)
|
|||||||
|
STATEMENTS OF FINANCIAL POSITION
|
||||||||
|
Total assets(1)
|
$
|
78,546
|
|
$
|
62,292
|
|
||
|
Total liabilities(2)
|
$
|
8,293
|
|
$
|
15,225
|
|
||
|
Partners’ capital
|
70,253
|
|
47,067
|
|
||||
|
Total liabilities and partners’ capital
|
$
|
78,546
|
|
$
|
62,292
|
|
||
|
Total liabilities and partners’ capital included above
|
$
|
6,265
|
|
$
|
5,515
|
|
||
|
Equity in LP/LLC interests not included above
|
790
|
|
696
|
|
||||
|
Carrying value
|
$
|
7,055
|
|
$
|
6,211
|
|
||
__________
|
(1)
|
Assets consist primarily of investments in real estate, investments in securities and other miscellaneous assets.
|
|
(2)
|
Liabilities consist primarily of third-party-borrowed funds, securities repurchase agreements and other miscellaneous liabilities.
|
|
|
Years Ended December 31,
|
|||||||||||
|
|
2018
|
2017
|
2016
|
|||||||||
|
|
(in millions)
|
|||||||||||
|
STATEMENTS OF OPERATIONS
|
||||||||||||
|
Total revenue(1)
|
$
|
6,264
|
|
$
|
6,392
|
|
$
|
5,360
|
|
|||
|
Total expenses(2)
|
(3,222
|
)
|
(2,300
|
)
|
(1,995
|
)
|
||||||
|
Net earnings (losses)
|
$
|
3,042
|
|
$
|
4,092
|
|
$
|
3,365
|
|
|||
|
Equity in net earnings (losses) included above
|
$
|
233
|
|
$
|
409
|
|
$
|
247
|
|
|||
|
Equity in net earnings (losses) of LP/LLC interests not included above
|
14
|
|
123
|
|
103
|
|
||||||
|
Total equity in net earnings (losses)
|
$
|
247
|
|
$
|
532
|
|
$
|
350
|
|
|||
__________
|
(1)
|
Revenue consists of income from investments in real estate, investments in securities and other income.
|
|
(2)
|
Expenses consist primarily of interest expense, investment management fees, salary expenses and other expenses.
|
Net Investment Income
The following table sets forth “Net investment income” by investment type, for the periods indicated:
|
Years Ended December 31,
|
||||||||||||
|
2018
|
2017
|
2016
|
||||||||||
|
|
(in millions)
|
|||||||||||
|
Fixed maturities, available-for-sale(1)
|
$
|
11,989
|
|
$
|
11,482
|
|
$
|
10,920
|
|
|||
|
Fixed maturities, held-to-maturity(1)
|
226
|
|
215
|
|
208
|
|
||||||
|
Fixed maturities, trading
|
143
|
|
163
|
|
209
|
|
||||||
|
Assets supporting experience-rated contractholder liabilities, at fair value
|
722
|
|
736
|
|
758
|
|
||||||
|
Equity securities, at fair value
|
164
|
|
398
|
|
385
|
|
||||||
|
Commercial mortgage and other loans
|
2,352
|
|
2,267
|
|
2,243
|
|
||||||
|
Policy loans
|
622
|
|
617
|
|
627
|
|
||||||
|
Other invested assets
|
519
|
|
1,117
|
|
731
|
|
||||||
|
Short-term investments and cash equivalents
|
345
|
|
203
|
|
145
|
|
||||||
|
Gross investment income
|
17,082
|
|
17,198
|
|
16,226
|
|
||||||
|
Less: investment expenses
|
(906
|
)
|
(763
|
)
|
(706
|
)
|
||||||
|
Net investment income(2)
|
$
|
16,176
|
|
$
|
16,435
|
|
$
|
15,520
|
|
|||
192
__________
|
(1)
|
Includes income on credit-linked notes which are reported on the same financial statement line items as related surplus notes, as conditions are met for right to offset.
|
|
(2)
|
Prior period amounts have been reclassified to conform to current period presentation.
|
The carrying value of non-income producing assets included
$156 million
in available-for-sale fixed maturities;
$18 million
in assets supporting experience-rated contractholder liabilities and less than
$1 million
in other invested assets, as of December 31,
2018
. Non-income producing assets represent investments that had not produced income for the twelve months preceding December 31,
2018
.
Realized Investment Gains (Losses), Net
The following table sets forth “Realized investment gains (losses), net” by investment type, for the periods indicated:
|
Years Ended December 31,
|
||||||||||||
|
2018
|
2017
|
2016
|
||||||||||
|
|
(in millions)
|
|||||||||||
|
Fixed maturities(1)
|
$
|
228
|
|
$
|
581
|
|
$
|
666
|
|
|||
|
Equity securities(2)
|
0
|
|
1,066
|
|
376
|
|
||||||
|
Commercial mortgage and other loans
|
49
|
|
70
|
|
55
|
|
||||||
|
Investment real estate
|
84
|
|
12
|
|
15
|
|
||||||
|
LPs/LLCs
|
17
|
|
(23
|
)
|
(94
|
)
|
||||||
|
Derivatives(3)
|
1,597
|
|
(1,275
|
)
|
1,175
|
|
||||||
|
Other
|
2
|
|
1
|
|
1
|
|
||||||
|
Realized investment gains (losses), net
|
$
|
1,977
|
|
$
|
432
|
|
$
|
2,194
|
|
|||
__________
|
(1)
|
Includes fixed maturity securities classified as available-for-sale and held-to-maturity and excludes fixed maturity securities classified as trading.
|
|
(2)
|
Effective January 1, 2018, realized gains (losses) on equity securities are recorded within “Other income (loss).”
|
|
(3)
|
Includes the hedged items offset in qualifying fair value hedge accounting relationships.
|
Net Unrealized Gains (Losses) on Investments within AOCI
The following table sets forth net unrealized gains (losses) on investments, as of the dates indicated:
|
December 31,
|
||||||||||||
|
2018
|
2017
|
2016
|
||||||||||
|
|
(in millions)
|
|||||||||||
|
Fixed maturity securities, available-for-sale—with OTTI
|
$
|
190
|
|
$
|
286
|
|
$
|
312
|
|
|||
|
Fixed maturity securities, available-for-sale—all other
|
21,721
|
|
34,109
|
|
28,526
|
|
||||||
|
Equity securities, available-for-sale(1)
|
0
|
|
2,027
|
|
2,599
|
|
||||||
|
Derivatives designated as cash flow hedges(2)
|
811
|
|
(39
|
)
|
1,316
|
|
||||||
|
Other investments(3)
|
(2
|
)
|
15
|
|
(21
|
)
|
||||||
|
Net unrealized gains (losses) on investments
|
$
|
22,720
|
|
$
|
36,398
|
|
$
|
32,732
|
|
|||
__________
|
(1)
|
Effective January 1, 2018, unrealized gains (losses) on equity securities are recorded within “Other income (loss).”
|
|
(2)
|
For more information on cash flow hedges, see Note 5.
|
|
(3)
|
As of December 31,
2018
, there were
no
net unrealized losses on held-to-maturity securities that were previously transferred from available-for-sale. Includes net unrealized gains on certain joint ventures that are strategic in nature and are included in “Other assets.”
|
Repurchase Agreements and Securities Lending
In the normal course of business, the Company sells securities under agreements to repurchase and enters into securities lending transactions. The following table sets forth the composition of “Securities sold under agreements to repurchase,” as of the dates indicated:
193
|
December 31, 2018
|
December 31, 2017
|
||||||||||||||||||||||
|
Remaining Contractual Maturities of the Agreements
|
Remaining Contractual Maturities of the Agreements
|
||||||||||||||||||||||
|
Overnight & Continuous
|
Up to 30 Days
|
Total
|
Overnight & Continuous
|
Up to 30 Days
|
Total
|
||||||||||||||||||
|
(in millions)
|
|||||||||||||||||||||||
|
U.S. Treasury securities and obligations of U.S. government authorities and agencies
|
$
|
975
|
|
$
|
8,614
|
|
$
|
9,589
|
|
$
|
911
|
|
$
|
7,349
|
|
$
|
8,260
|
|
|||||
|
U.S. corporate public securities
|
19
|
|
0
|
|
19
|
|
1
|
|
0
|
|
1
|
|
|||||||||||
|
Foreign corporate public securities
|
0
|
|
0
|
|
0
|
|
0
|
|
0
|
|
0
|
|
|||||||||||
|
Residential mortgage-backed securities
|
0
|
|
342
|
|
342
|
|
0
|
|
139
|
|
139
|
|
|||||||||||
|
Equity securities
|
0
|
|
0
|
|
0
|
|
0
|
|
0
|
|
0
|
|
|||||||||||
|
Total securities sold under agreements to
repurchase(1)
|
$
|
994
|
|
$
|
8,956
|
|
$
|
9,950
|
|
$
|
912
|
|
$
|
7,488
|
|
$
|
8,400
|
|
|||||
__________
|
(1)
|
The Company did not have agreements with remaining contractual maturities of thirty days or greater, as of the dates indicated.
|
The following table sets forth the composition of “Cash collateral for loaned securities” which represents the liability to return cash collateral received for the following types of securities loaned, as of the dates indicated:
|
December 31, 2018
|
December 31, 2017
|
||||||||||||||||||||||
|
Remaining Contractual Maturities of the Agreements
|
Remaining Contractual Maturities of the Agreements
|
||||||||||||||||||||||
|
Overnight & Continuous
|
Up to 30 Days
|
Total
|
Overnight & Continuous
|
Up to 30 Days
|
Total
|
||||||||||||||||||
|
(in millions)
|
|||||||||||||||||||||||
|
U.S. Treasury securities and obligations of U.S. government authorities and agencies
|
$
|
105
|
|
$
|
0
|
|
$
|
105
|
|
$
|
87
|
|
$
|
35
|
|
$
|
122
|
|
|||||
|
Obligations of U.S. states and their political subdivisions
|
88
|
|
0
|
|
88
|
|
103
|
|
0
|
|
103
|
|
|||||||||||
|
Foreign government bonds
|
325
|
|
0
|
|
325
|
|
335
|
|
0
|
|
335
|
|
|||||||||||
|
U.S. corporate public securities
|
2,563
|
|
0
|
|
2,563
|
|
2,961
|
|
0
|
|
2,961
|
|
|||||||||||
|
Foreign corporate public securities
|
693
|
|
0
|
|
693
|
|
655
|
|
0
|
|
655
|
|
|||||||||||
|
Residential mortgage-backed securities
|
0
|
|
0
|
|
0
|
|
0
|
|
0
|
|
0
|
|
|||||||||||
|
Equity securities
|
155
|
|
0
|
|
155
|
|
178
|
|
0
|
|
178
|
|
|||||||||||
|
Total cash collateral for loaned securities(1)
|
$
|
3,929
|
|
$
|
0
|
|
$
|
3,929
|
|
$
|
4,319
|
|
$
|
35
|
|
$
|
4,354
|
|
|||||
__________
|
(1)
|
The Company did not have agreements with remaining contractual maturities of thirty days or greater, as of the dates indicated.
|
Securities Pledged
The Company pledges as collateral investment securities it owns to unaffiliated parties through certain transactions, including securities lending, securities sold under agreements to repurchase, collateralized borrowings and postings of collateral with derivative counterparties. The following table sets forth the carrying value of investments pledged to third parties, as of the dates indicated:
194
|
December 31,
|
||||||||
|
2018
|
2017
|
|||||||
|
|
(in millions)
|
|||||||
|
Fixed maturities(1)
|
$
|
15,319
|
|
$
|
13,303
|
|
||
|
Fixed maturities, trading
|
0
|
|
0
|
|
||||
|
Assets supporting experience-rated contractholder liabilities
|
123
|
|
369
|
|
||||
|
Separate account assets
|
2,811
|
|
2,992
|
|
||||
|
Equity securities
|
152
|
|
172
|
|
||||
|
Total securities pledged(2)
|
$
|
18,405
|
|
$
|
16,836
|
|
||
__________
|
(1)
|
Includes fixed maturity securities classified as available-for-sale and held-to-maturity and excludes fixed maturity securities classified as trading.
|
|
(2)
|
Prior period amounts have been reclassified to conform to current period presentation.
|
The following table sets forth the carrying amount of the associated liabilities supported by the pledged collateral, as of the dates indicated:
|
December 31,
|
||||||||
|
2018
|
2017
|
|||||||
|
|
(in millions)
|
|||||||
|
Securities sold under agreements to repurchase
|
$
|
9,950
|
|
$
|
8,400
|
|
||
|
Cash collateral for loaned securities
|
3,929
|
|
4,354
|
|
||||
|
Separate account liabilities
|
2,867
|
|
3,064
|
|
||||
|
Policyholders’ account balances(1)
|
0
|
|
436
|
|
||||
|
Total liabilities supported by the pledged collateral
|
$
|
16,746
|
|
$
|
16,254
|
|
||
__________
|
(1)
|
Represents amounts supporting outstanding funding agreements.
|
In the normal course of its business activities, the Company accepts collateral that can be sold or repledged. The primary sources of this collateral are securities in customer accounts, securities purchased under agreements to resell and postings of collateral from OTC derivative counterparties. The fair value of this collateral was approximately
$5,309 million
as of
December 31, 2018
(the largest components of which included
$986 million
of securities and
$4,323 million
of cash from OTC derivative counterparties) and
$5,126 million
as of
December 31, 2017
(the largest components of which included
$599 million
of securities and
$4,527 million
of cash from OTC derivative counterparties). A portion of the aforementioned securities, for both periods, had either been sold or repledged.
Assets on Deposit, Held in Trust, and Restricted as to Sale
The following table provides assets on deposit, assets held in trust, and securities restricted as to sale, as of the dates indicated:
|
December 31,
|
||||||||
|
2018
|
2017
|
|||||||
|
|
(in millions)
|
|||||||
|
Assets on deposit with governmental authorities or trustees
|
$
|
27
|
|
$
|
28
|
|
||
|
Assets held in voluntary trusts(1)
|
609
|
|
606
|
|
||||
|
Assets held in trust related to reinsurance and other agreements(2)
|
13,259
|
|
13,301
|
|
||||
|
Securities restricted as to sale(3)
|
40
|
|
59
|
|
||||
|
Total assets on deposit, assets held in trust and securities restricted as to sale
|
$
|
13,935
|
|
$
|
13,994
|
|
||
__________
|
(1)
|
Represents assets held in voluntary trusts established primarily to fund guaranteed dividends to certain policyholders and to fund certain employee benefits.
|
|
(2)
|
Represents assets held in trust related to reinsurance agreements excluding reinsurance agreements between wholly-owned subsidiaries. Assets valued at $
16.1
billion and $
12.9
billion were held in trust related to reinsurance agreements between wholly-owned subsidiaries as of December 31, 2018 and 2017, respectively.
|
|
(3)
|
Includes member and activity-based stock associated with memberships in the Federal Home Loan Banks of New York and Boston.
|
195
|
4.
|
VARIABLE INTEREST ENTITIES
|
In the normal course of its activities, the Company enters into relationships with various special-purpose entities and other entities that are deemed to be VIEs. A VIE is an entity that either (1) has equity investors that lack certain essential characteristics of a controlling financial interest (including the ability to control activities of the entity, the obligation to absorb the entity’s expected losses and the right to receive the entity’s expected residual returns) or (2) lacks sufficient equity to finance its own activities without financial support provided by other entities, which in turn would be expected to absorb at least some of the expected losses of the VIE.
The Company is the primary beneficiary if the Company has (1) the power to direct the activities of the VIE that most significantly impact the economic performance of the entity and (2) the obligation to absorb losses of the entity that could be potentially significant to the VIE or the right to receive benefits from the entity that could be potentially significant. If the Company determines that it is the VIE’s primary beneficiary, it consolidates the VIE.
Consolidated Variable Interest Entities
The Company is the investment manager of certain asset-backed investment vehicles, commonly referred to as CLOs, and certain other vehicles for which the Company earns fee income for investment management services. The Company may sell or syndicate investments through these vehicles, principally as part of the strategic investing activity of the Company’s investment management businesses. Additionally, the Company may invest in securities issued by these vehicles. The Company is also the investment manager of certain investment structures whose beneficial interests are wholly-owned by consolidated subsidiaries.
The Company has analyzed these relationships and determined that for certain CLOs and other investment structures it is the primary beneficiary and consolidates these entities. This analysis includes a review of (1) the Company’s rights and responsibilities as investment manager and (2) variable interests (if any) held by the Company. The assets of these VIEs are restricted and must be used first to settle liabilities of the VIE. The Company is not required to provide, and has not provided, material financial or other support to any of these VIEs.
Additionally, the Company is the primary beneficiary of certain VIEs in which the Company has invested, as part of its investment activities, but for which it is not the investment manager. These include structured investments issued by a VIE that manages yen-denominated investments coupled with cross-currency coupon swap agreements thereby creating synthetic dual currency investments. The Company’s involvement in the structuring of these investments combined with its economic interest indicates that the Company is the primary beneficiary. The Company has not provided material financial support or other support that was not contractually required to these VIEs.
The table below reflects the carrying amount and balance sheet caption in which the assets and liabilities of consolidated VIEs are reported. The liabilities primarily comprise obligations under debt instruments issued by the VIEs. The creditors of these VIEs do not have recourse to the Company in excess of the assets contained within the VIEs.
196
|
|
Consolidated VIEs for which
the Company is the
Investment Manager(1)(2)
|
Other Consolidated VIEs(1)
|
||||||||||||||
|
|
December 31,
|
December 31,
|
||||||||||||||
|
|
2018
|
2017
|
2018
|
2017
|
||||||||||||
|
|
(in millions)
|
|||||||||||||||
|
Fixed maturities, available-for-sale
|
$
|
73
|
|
$
|
69
|
|
$
|
282
|
|
$
|
275
|
|
||||
|
Fixed maturities, held-to-maturity
|
95
|
|
83
|
|
831
|
|
810
|
|
||||||||
|
Fixed maturities, trading
|
1,076
|
|
1,623
|
|
0
|
|
0
|
|
||||||||
|
Assets supporting experience-rated contractholder liabilities
|
0
|
|
0
|
|
8
|
|
9
|
|
||||||||
|
Equity securities
|
41
|
|
28
|
|
0
|
|
0
|
|
||||||||
|
Commercial mortgage and other loans
|
730
|
|
617
|
|
0
|
|
0
|
|
||||||||
|
Other invested assets
|
1,526
|
|
1,390
|
|
77
|
|
97
|
|
||||||||
|
Cash and cash equivalents
|
131
|
|
164
|
|
0
|
|
0
|
|
||||||||
|
Accrued investment income
|
5
|
|
7
|
|
4
|
|
4
|
|
||||||||
|
Other assets
|
463
|
|
440
|
|
721
|
|
150
|
|
||||||||
|
Total assets of consolidated VIEs
|
$
|
4,140
|
|
$
|
4,421
|
|
$
|
1,923
|
|
$
|
1,345
|
|
||||
|
Other liabilities
|
$
|
295
|
|
$
|
433
|
|
$
|
17
|
|
$
|
0
|
|
||||
|
Notes issued by consolidated VIEs(3)
|
955
|
|
1,518
|
|
0
|
|
0
|
|
||||||||
|
Total liabilities of consolidated VIEs
|
$
|
1,250
|
|
$
|
1,951
|
|
$
|
17
|
|
$
|
0
|
|
||||
__________
|
(1)
|
Prior period amounts have been reclassified to conform to current period presentation. See “Adoption of ASU 2016-01” in Note 2 for details.
|
|
(2)
|
Total assets of consolidated VIEs reflect
$2,013 million
and
$1,716 million
as of December 31, 2018 and 2017, respectively, related to VIEs whose beneficial interests are wholly-owned by consolidated subsidiaries.
|
|
(3)
|
Recourse is limited to the assets of the respective VIE and does not extend to the general credit of the Company.
As of
December 31, 2018
and December 31, 2017, the maturities of these obligations were greater than
five
years.
|
Unconsolidated Variable Interest Entities
The Company has determined that it is not the primary beneficiary of certain VIEs for which it is the investment manager. These VIEs consist primarily of CLOs and investment funds for which the Company has determined that it is not the primary beneficiary as it does not have both (1) the power to direct the activities of the VIE that most significantly impact the economic performance of the entity and (2) the obligation to absorb losses of the entity that could be potentially significant to the VIE or the right to receive benefits from the entity that could be potentially significant. The Company’s maximum exposure to loss resulting from its relationship with unconsolidated VIEs for which it is the investment manager is limited to its investment in the VIEs, which was
$836 million
and
$1,013 million
at
December 31, 2018
and
2017
, respectively. These investments are reflected in “Fixed maturities, available-for-sale,” “Fixed maturities, trading,” “Equity securities” and “Other invested assets.” There are
no
liabilities associated with these unconsolidated VIEs on the Company’s Consolidated Statements of Financial Position.
In the normal course of its activities, the Company will invest in LPs/LLCs, which include hedge funds, private equity funds and real estate-related funds and may or may not be VIEs. The Company’s maximum exposure to loss on these investments, both VIEs and non-VIEs, is limited to the amount of its investment. The Company has determined that it is not required to consolidate these entities because either (1) it does not control them or (2) it does not have the obligation to absorb losses of the entities that could be potentially significant to the entities or the right to receive benefits from the entities that could be potentially significant. The Company classifies these investments as “Other invested assets” and its maximum exposure to loss associated with these entities was
$9,841 million
and
$8,720 million
as of
December 31, 2018
and
2017
, respectively.
In addition, in the normal course of its activities, the Company will invest in structured investments including VIEs for which it is not the investment manager. These structured investments typically invest in fixed income investments and are managed by third parties and include asset-backed securities, commercial mortgage-backed securities and residential mortgage-backed securities. The Company’s maximum exposure to loss on these structured investments, both VIEs and non-VIEs, is limited to the amount of its investment. See Note 3 for details regarding the carrying amounts and classification of these assets. The Company has not provided material financial or other support that was not contractually required to these structures. The Company has determined that it is not the primary beneficiary of these structures due to the fact that it does not control these entities.
197
|
5.
|
DERIVATIVE INSTRUMENTS
|
Types of Derivative Instruments and Derivative Strategies
Interest Rate Contracts
Interest rate swaps, options and futures are used by the Company to reduce risks from changes in interest rates, manage interest rate exposures arising from mismatches between assets and liabilities and to hedge against changes in their values it owns or anticipates acquiring or selling.
Swaps may be attributed to specific assets or liabilities or to a portfolio of assets or liabilities. Under interest rate swaps, the Company agrees with counterparties to exchange, at specified intervals, the difference between fixed-rate and floating-rate interest amounts calculated by reference to an agreed upon notional principal amount.
The Company also uses interest rate swaptions, caps, and floors to manage interest rate risk. A swaption is an option to enter into a swap with a forward starting effective date. The Company pays a premium for purchased swaptions and receives a premium for written swaptions. In an interest rate cap, the buyer receives payments at the end of each period in which the interest rate exceeds the agreed strike price. Similarly, in an interest rate floor, the buyer receives payments at the end of each period in which the interest rate is below the agreed strike price. Swaptions, caps and floors are included in interest rate options.
In standardized exchange-traded interest rate futures transactions, the Company purchases or sells a specified number of contracts, the values of which are determined by the daily market values of underlying referenced investments. The Company enters into exchange-traded futures with regulated futures commission’s merchants who are members of a trading exchange.
Equity Contracts
Equity options, total return swaps, and futures are used by the Company to manage its exposure to the equity markets which impacts the value of assets and liabilities it owns or anticipates acquiring or selling.
Equity index options are contracts which will settle in cash based on differentials in the underlying indices at the time of exercise and the strike price. The Company uses combinations of purchases and sales of equity index options to hedge the effects of adverse changes in equity indices within a predetermined range.
Total return swaps are contracts whereby the Company agrees with counterparties to exchange, at specified intervals, the difference between the return on an asset (or market index) and London Inter-Bank Offered Rate (“LIBOR”) plus an associated funding spread based on a notional amount. The Company generally uses total return swaps to hedge the effect of adverse changes in equity indices.
In standardized exchange-traded equity futures transactions, the Company purchases or sells a specified number of contracts, the values of which are determined by the daily market values of underlying referenced equity indices. The Company enters into exchange-traded futures with regulated futures commission’s merchants who are members of a trading exchange.
Foreign Exchange Contracts
Currency derivatives, including currency futures, options, forwards and swaps, are used by the Company to reduce risks from changes in currency exchange rates with respect to investments denominated in foreign currencies that the Company either holds or intends to acquire or sell, and to hedge the currency risk associated with net investments in foreign operations and anticipated earnings of its foreign operations.
Under currency forwards, the Company agrees with counterparties to deliver a specified amount of an identified currency at a specified future date. Typically, the price is agreed upon at the time of the contract and payment for such a contract is made at the specified future date. As noted above, the Company uses currency forwards to mitigate the impact of changes in currency exchange rates on U.S. dollar-equivalent earnings generated by certain of its non-U.S. businesses, primarily its international insurance and investment operations. The Company executes forward sales of the hedged currency in exchange for U.S. dollars at a specified exchange rate. The maturities of these forwards correspond with the future periods in which the non-U.S. dollar-denominated earnings are expected to be generated.
198
Under currency swaps, the Company agrees with counterparties to exchange, at specified intervals, the difference between one currency and another at an exchange rate and calculated by reference to an agreed principal amount. Generally, the principal amount of each currency is exchanged at the beginning and termination of the currency swap by each party.
Credit Contracts
The Company writes credit default swaps to gain exposure similar to investment in public fixed maturity cash instruments. With these derivatives the Company sells credit protection on a single name reference, or certain index reference, and in return receives a quarterly premium. This premium or credit spread generally corresponds to the difference between the yield on the referenced names (or an index’s referenced names) public fixed maturity cash instruments and swap rates, at the time the agreement is executed. If there is an event of default by the referenced name or one of the referenced names in the index, as defined by the agreement, then the Company is obligated to pay the referenced amount of the contract to the counterparty and receive in return the referenced defaulted security or similar security or (in the case of a credit default index) pay the referenced amount less the auction recovery rate. See credit derivatives written section for further discussion of guarantees. In addition to selling credit protection, the Company has purchased credit protection using credit derivatives in order to hedge specific credit exposures in the Company’s investment portfolio.
Other Contracts
“To Be Announced” (“TBA”) Forward Contracts.
The Company uses TBA forward contracts to gain exposure to the investment risk and return of mortgage-backed securities. TBA transactions can help the Company enhance the return on its investment portfolio, and can provide a more liquid and cost-effective method of achieving these goals than purchasing or selling individual mortgage-backed pools. Typically, the price is agreed upon at the time of the contract and payment for such a contract is made at a specified future date. Additionally, pursuant to the Company’s mortgage dollar roll program, TBAs or mortgage-backed securities are transferred to counterparties with a corresponding agreement to repurchase them at a future date. These transactions do not qualify as secured borrowings and are accounted for as derivatives.
Loan Commitments.
In its mortgage operations, the Company enters into commitments to fund commercial mortgage loans at specified interest rates and other applicable terms within specified periods of time. These commitments are legally binding agreements to extend credit to a counterparty. Loan commitments for loans that will be held for sale are recognized as derivatives and recorded at fair value. The determination of the fair value of loan commitments accounted for as derivatives considers various factors including, among others, terms of the related loan, the intended exit strategy for the loans based upon either securitization valuation models or investor purchase commitments, prevailing interest rates, origination income or expense, and the value of service rights. Loan commitments that relate to the origination of mortgage loans that will be held for investment are not accounted for as derivatives and accordingly are not recognized in the Company’s financial statements. See Note 22 for additional information.
Embedded Derivatives.
The Company sells certain products (for example, variable annuities) which may include guaranteed benefit features that are accounted for as embedded derivatives. These embedded derivatives are marked to market through “Realized investment gains (losses), net” based on the change in value of the underlying contractual guarantees, which are determined using valuation models. The Company maintains a portfolio of derivative instruments that is intended to offset certain risks related to the above products’ features. The derivatives may include, but are not limited to equity options, total return swaps, interest rate swaptions, caps, floors and other instruments.
Synthetic Guarantees.
The Company sells synthetic GICs, through both full service and investment-only sales channels, to investment vehicles primarily used by qualified defined contribution pension plans. The synthetic GICs are issued in respect of assets that are owned by the trustees of such plans, who invest the assets according to the contract terms agreed to with the Company. The contracts establish participant balances and credit interest thereon. The participant balances are supported by the underlying assets. In connection with certain participant-initiated withdrawals, the contract guarantees that after all underlying assets are liquidated, any remaining participant balances will be paid by the Company. Under U.S. GAAP, these contracts are accounted for as derivatives and recorded at fair value.
Primary Risks Managed by Derivatives
199
The table below provides a summary of the gross notional amount and fair value of derivatives contracts by the primary underlying risks, excluding embedded derivatives and associated reinsurance recoverables. Many derivative instruments contain multiple underlying risks. The fair value amounts below represent the gross fair value of derivative contracts prior to taking into account the netting effects of master netting agreements, cash collateral and NPR. This netting impact results in total derivative assets of
$1,148 million
and
$1,205 million
as of December 31,
2018
and
2017
, respectively, and total derivative liabilities of
$127 million
and
$643 million
as of December 31,
2018
and
2017
, respectively, reflected in the Consolidated Statements of Financial Position.
|
|
December 31, 2018
|
December 31, 2017
|
|||||||||||||||||||||
|
Primary Underlying/
Instrument Type
|
|
Gross Fair Value
|
|
Gross Fair Value
|
|||||||||||||||||||
|
Notional
|
Assets
|
Liabilities
|
Notional
|
Assets
|
Liabilities
|
||||||||||||||||||
|
|
(in millions)
|
||||||||||||||||||||||
|
Derivatives Designated as Hedge Accounting Instruments:
|
|||||||||||||||||||||||
|
Interest Rate
|
|||||||||||||||||||||||
|
Interest Rate Swaps
|
$
|
3,885
|
|
$
|
305
|
|
$
|
(67
|
)
|
$
|
3,204
|
|
$
|
271
|
|
$
|
(88
|
)
|
|||||
|
Interest Rate Forwards
|
600
|
|
26
|
|
0
|
|
0
|
|
0
|
|
0
|
|
|||||||||||
|
Foreign Currency
|
|||||||||||||||||||||||
|
Foreign Currency Forwards
|
722
|
|
26
|
|
(2
|
)
|
545
|
|
0
|
|
(8
|
)
|
|||||||||||
|
Currency/Interest Rate
|
|||||||||||||||||||||||
|
Foreign Currency Swaps
|
20,724
|
|
1,520
|
|
(358
|
)
|
17,732
|
|
766
|
|
(735
|
)
|
|||||||||||
|
Total Qualifying Hedges
|
$
|
25,931
|
|
$
|
1,877
|
|
$
|
(427
|
)
|
$
|
21,481
|
|
$
|
1,037
|
|
$
|
(831
|
)
|
|||||
|
Derivatives Not Qualifying as Hedge Accounting Instruments:
|
|||||||||||||||||||||||
|
Interest Rate
|
|||||||||||||||||||||||
|
Interest Rate Swaps
|
$
|
140,963
|
|
$
|
5,792
|
|
$
|
(3,435
|
)
|
$
|
158,552
|
|
$
|
7,958
|
|
$
|
(3,509
|
)
|
|||||
|
Interest Rate Futures
|
13,991
|
|
23
|
|
(2
|
)
|
23,792
|
|
25
|
|
(1
|
)
|
|||||||||||
|
Interest Rate Options
|
24,002
|
|
147
|
|
(314
|
)
|
18,456
|
|
167
|
|
(203
|
)
|
|||||||||||
|
Interest Rate Forwards
|
5,049
|
|
72
|
|
0
|
|
1,498
|
|
6
|
|
(2
|
)
|
|||||||||||
|
Foreign Currency
|
|||||||||||||||||||||||
|
Foreign Currency Forwards
|
19,849
|
|
246
|
|
(138
|
)
|
23,905
|
|
164
|
|
(254
|
)
|
|||||||||||
|
Foreign Currency Options
|
2
|
|
0
|
|
0
|
|
59
|
|
0
|
|
0
|
|
|||||||||||
|
Currency/Interest Rate
|
|||||||||||||||||||||||
|
Foreign Currency Swaps
|
13,784
|
|
773
|
|
(421
|
)
|
13,777
|
|
822
|
|
(414
|
)
|
|||||||||||
|
Credit
|
|||||||||||||||||||||||
|
Credit Default Swaps
|
5,207
|
|
33
|
|
(23
|
)
|
1,314
|
|
21
|
|
(5
|
)
|
|||||||||||
|
Equity
|
|||||||||||||||||||||||
|
Equity Futures
|
1,141
|
|
0
|
|
(8
|
)
|
710
|
|
2
|
|
(2
|
)
|
|||||||||||
|
Equity Options
|
58,693
|
|
384
|
|
(554
|
)
|
36,007
|
|
588
|
|
(364
|
)
|
|||||||||||
|
Total Return Swaps
|
17,309
|
|
1,131
|
|
(86
|
)
|
15,558
|
|
17
|
|
(369
|
)
|
|||||||||||
|
Other
|
|||||||||||||||||||||||
|
Other(1)
|
508
|
|
0
|
|
0
|
|
0
|
|
0
|
|
0
|
|
|||||||||||
|
Synthetic GICs
|
79,215
|
|
2
|
|
0
|
|
77,290
|
|
0
|
|
(1
|
)
|
|||||||||||
|
Total Non-Qualifying Derivatives
|
$
|
379,713
|
|
$
|
8,603
|
|
$
|
(4,981
|
)
|
$
|
370,918
|
|
$
|
9,770
|
|
$
|
(5,124
|
)
|
|||||
|
Total Derivatives(2)
|
$
|
405,644
|
|
$
|
10,480
|
|
$
|
(5,408
|
)
|
$
|
392,399
|
|
$
|
10,807
|
|
$
|
(5,955
|
)
|
|||||
__________
|
(1)
|
“Other” primarily includes derivative contracts used to improve the balance of the Company’s tail longevity and mortality risk. Under these contracts, the Company’s gains (losses) are capped at the notional amount.
|
200
|
(2)
|
Excludes embedded derivatives and associated reinsurance recoverables which contain multiple underlying risks. The fair value of these embedded derivatives was a net liability of
$8,959 million
and
$8,748 million
as of December 31,
2018
, and
2017
, respectively, primarily included in “Future policy benefits.”
|
Most of the Company’s derivatives do not qualify for hedge accounting for various reasons. For example: (i) derivatives that economically hedge embedded derivatives do not qualify for hedge accounting because changes in the fair value of the embedded derivatives are already recorded in net income; (ii) derivatives that are utilized as macro hedges of the Company’s exposure to various risks typically do not qualify for hedge accounting because they do not meet the criteria required under portfolio hedge accounting rules; and (iii) synthetic GIC, which are product standalone derivatives, do not qualify as hedging instruments under hedge accounting rules.
Offsetting Assets and Liabilities
The following table presents recognized derivative instruments (excluding embedded derivatives and associated reinsurance recoverables), and repurchase and reverse repurchase agreements that are offset in the Consolidated Statements of Financial Position, and/or are subject to an enforceable master netting arrangement or similar agreement, irrespective of whether they are offset in the Consolidated Statements of Financial Position.
|
|
December 31, 2018
|
|||||||||||||||||||
|
|
Gross
Amounts of
Recognized
Financial
Instruments
|
Gross
Amounts
Offset in the
Statements of
Financial
Position
|
Net Amounts
Presented in
the Statements
of Financial
Position
|
Financial
Instruments/
Collateral(1)
|
Net
Amount
|
|||||||||||||||
|
|
(in millions)
|
|||||||||||||||||||
|
Offsetting of Financial Assets:
|
||||||||||||||||||||
|
Derivatives(1)
|
$
|
10,407
|
|
$
|
(9,331
|
)
|
$
|
1,076
|
|
$
|
(614
|
)
|
$
|
462
|
|
|||||
|
Securities purchased under agreement to resell
|
986
|
|
0
|
|
986
|
|
(986
|
)
|
0
|
|
||||||||||
|
Total Assets
|
$
|
11,393
|
|
$
|
(9,331
|
)
|
$
|
2,062
|
|
$
|
(1,600
|
)
|
$
|
462
|
|
|||||
|
Offsetting of Financial Liabilities:
|
||||||||||||||||||||
|
Derivatives(1)
|
$
|
5,387
|
|
$
|
(5,281
|
)
|
$
|
106
|
|
$
|
(45
|
)
|
$
|
61
|
|
|||||
|
Securities sold under agreement to repurchase
|
9,950
|
|
0
|
|
9,950
|
|
(9,950
|
)
|
0
|
|
||||||||||
|
Total Liabilities
|
$
|
15,337
|
|
$
|
(5,281
|
)
|
$
|
10,056
|
|
$
|
(9,995
|
)
|
$
|
61
|
|
|||||
|
|
December 31, 2017
|
|||||||||||||||||||
|
|
Gross
Amounts of
Recognized
Financial
Instruments
|
Gross
Amounts
Offset in the
Statements of
Financial
Position
|
Net Amounts
Presented in
the Statements
of Financial
Position
|
Financial
Instruments/
Collateral(1)
|
Net
Amount
|
|||||||||||||||
|
|
(in millions)
|
|||||||||||||||||||
|
Offsetting of Financial Assets:
|
||||||||||||||||||||
|
Derivatives(1)
|
$
|
10,710
|
|
$
|
(9,600
|
)
|
$
|
1,110
|
|
$
|
(625
|
)
|
$
|
485
|
|
|||||
|
Securities purchased under agreement to resell
|
240
|
|
0
|
|
240
|
|
(240
|
)
|
0
|
|
||||||||||
|
Total Assets
|
$
|
10,950
|
|
$
|
(9,600
|
)
|
$
|
1,350
|
|
$
|
(865
|
)
|
$
|
485
|
|
|||||
|
Offsetting of Financial Liabilities:
|
||||||||||||||||||||
|
Derivatives(1)
|
$
|
5,948
|
|
$
|
(5,312
|
)
|
$
|
636
|
|
$
|
(588
|
)
|
$
|
48
|
|
|||||
|
Securities sold under agreement to repurchase
|
8,400
|
|
0
|
|
8,400
|
|
(8,400
|
)
|
0
|
|
||||||||||
|
Total Liabilities
|
$
|
14,348
|
|
$
|
(5,312
|
)
|
$
|
9,036
|
|
$
|
(8,988
|
)
|
$
|
48
|
|
|||||
__________
|
(1)
|
Amounts exclude the excess of collateral received/pledged from/to the counterparty.
|
201
For information regarding the rights of offset associated with the derivative assets and liabilities in the table above, see “
—
Counterparty Credit Risk” below. For securities purchased under agreements to resell and securities sold under agreements to repurchase, the Company monitors the value of the securities and maintains collateral, as appropriate, to protect against credit exposure. Where the Company has entered into repurchase and resale agreements with the same counterparty, in the event of default, the Company would generally be permitted to exercise rights of offset. For additional information on the Company’s accounting policy for securities repurchase and resale agreements, see Note 2.
Cash Flow, Fair Value and Net Investment Hedges
The primary derivative instruments used by the Company in its fair value, cash flow and net investment hedge accounting relationships are interest rate swaps, currency swaps and currency forwards. These instruments are only designated for hedge accounting in instances where the appropriate criteria are met. The Company does not use futures, options, credit, equity or embedded derivatives in any of its fair value, cash flow or net investment hedge accounting relationships.
The following table provides the financial statement classification and impact of derivatives used in qualifying and non-qualifying hedge relationships, excluding the offset of the hedged item in an effective hedge relationship.
|
|
Year Ended December 31, 2018
|
|||||||||||||||||||||||||||
|
|
Realized
Investment
Gains
(Losses)
|
Net
Investment
Income
|
Other
Income
(Loss)
|
Interest
Expense
|
Interest
Credited
To Policyholders’
Account
Balances
|
Policyholders’ Benefits
|
AOCI(1)
|
|||||||||||||||||||||
|
(in millions)
|
||||||||||||||||||||||||||||
|
Derivatives Designated as Hedge Accounting Instruments:
|
||||||||||||||||||||||||||||
|
Fair value hedges
|
||||||||||||||||||||||||||||
|
Interest Rate
|
$
|
(65
|
)
|
$
|
(9
|
)
|
$
|
0
|
|
$
|
0
|
|
$
|
(65
|
)
|
$
|
35
|
|
$
|
0
|
|
|||||||
|
Currency
|
6
|
|
0
|
|
0
|
|
0
|
|
0
|
|
0
|
|
0
|
|
||||||||||||||
|
Total fair value hedges
|
(59
|
)
|
(9
|
)
|
0
|
|
0
|
|
(65
|
)
|
35
|
|
0
|
|
||||||||||||||
|
Cash flow hedges
|
||||||||||||||||||||||||||||
|
Interest Rate
|
0
|
|
0
|
|
0
|
|
(1
|
)
|
0
|
|
0
|
|
32
|
|
||||||||||||||
|
Currency
|
0
|
|
0
|
|
0
|
|
0
|
|
0
|
|
0
|
|
20
|
|
||||||||||||||
|
Currency/Interest Rate
|
0
|
|
217
|
|
257
|
|
0
|
|
0
|
|
0
|
|
798
|
|
||||||||||||||
|
Total cash flow hedges
|
0
|
|
217
|
|
257
|
|
(1
|
)
|
0
|
|
0
|
|
850
|
|
||||||||||||||
|
Net investment hedges
|
||||||||||||||||||||||||||||
|
Currency
|
0
|
|
0
|
|
0
|
|
0
|
|
0
|
|
0
|
|
6
|
|
||||||||||||||
|
Currency/Interest Rate
|
0
|
|
0
|
|
0
|
|
0
|
|
0
|
|
0
|
|
0
|
|
||||||||||||||
|
Total net investment hedges
|
0
|
|
0
|
|
0
|
|
0
|
|
0
|
|
0
|
|
6
|
|
||||||||||||||
|
Derivatives Not Qualifying as Hedge Accounting Instruments:
|
||||||||||||||||||||||||||||
|
Interest Rate
|
(1,139
|
)
|
0
|
|
0
|
|
0
|
|
0
|
|
0
|
|
0
|
|
||||||||||||||
|
Currency
|
349
|
|
0
|
|
(1
|
)
|
0
|
|
0
|
|
0
|
|
0
|
|
||||||||||||||
|
Currency/Interest Rate
|
433
|
|
0
|
|
3
|
|
0
|
|
0
|
|
0
|
|
0
|
|
||||||||||||||
|
Credit
|
(55
|
)
|
0
|
|
0
|
|
0
|
|
0
|
|
0
|
|
0
|
|
||||||||||||||
|
Equity
|
1,121
|
|
0
|
|
0
|
|
0
|
|
0
|
|
0
|
|
0
|
|
||||||||||||||
|
Other
|
0
|
|
0
|
|
0
|
|
0
|
|
0
|
|
0
|
|
0
|
|
||||||||||||||
|
Embedded Derivatives
|
966
|
|
0
|
|
0
|
|
0
|
|
0
|
|
0
|
|
0
|
|
||||||||||||||
|
Total non-qualifying hedges
|
1,675
|
|
0
|
|
2
|
|
0
|
|
0
|
|
0
|
|
0
|
|
||||||||||||||
|
Total
|
$
|
1,616
|
|
$
|
208
|
|
$
|
259
|
|
$
|
(1
|
)
|
$
|
(65
|
)
|
$
|
35
|
|
$
|
856
|
|
|||||||
202
|
|
Year Ended December 31, 2017
|
||||||||||||||||||||||
|
|
Realized
Investment
Gains
(Losses)
|
Net
Investment
Income
|
Other
Income
(Loss)
|
Interest
Expense
|
Interest
Credited
To
Policyholders’
Account
Balances
|
AOCI(1)
|
|||||||||||||||||
|
|
(in millions)
|
||||||||||||||||||||||
|
Derivatives Designated as Hedge Accounting Instruments:
|
|||||||||||||||||||||||
|
Fair value hedges
|
|||||||||||||||||||||||
|
Interest Rate
|
$
|
16
|
|
$
|
(19
|
)
|
$
|
0
|
|
$
|
0
|
|
$
|
(1
|
)
|
$
|
0
|
|
|||||
|
Currency
|
(6
|
)
|
0
|
|
0
|
|
0
|
|
0
|
|
0
|
|
|||||||||||
|
Total fair value hedges
|
10
|
|
(19
|
)
|
0
|
|
0
|
|
(1
|
)
|
0
|
|
|||||||||||
|
Cash flow hedges
|
|||||||||||||||||||||||
|
Interest Rate
|
0
|
|
0
|
|
0
|
|
(3
|
)
|
0
|
|
7
|
|
|||||||||||
|
Currency
|
0
|
|
0
|
|
0
|
|
0
|
|
0
|
|
(3
|
)
|
|||||||||||
|
Currency/Interest Rate
|
0
|
|
189
|
|
(303
|
)
|
0
|
|
0
|
|
(1,359
|
)
|
|||||||||||
|
Total cash flow hedges
|
0
|
|
189
|
|
(303
|
)
|
(3
|
)
|
0
|
|
(1,355
|
)
|
|||||||||||
|
Net investment hedges
|
|||||||||||||||||||||||
|
Currency
|
0
|
|
0
|
|
0
|
|
0
|
|
0
|
|
(9
|
)
|
|||||||||||
|
Currency/Interest Rate
|
0
|
|
0
|
|
0
|
|
0
|
|
0
|
|
0
|
|
|||||||||||
|
Total net investment hedges
|
0
|
|
0
|
|
0
|
|
0
|
|
0
|
|
(9
|
)
|
|||||||||||
|
Derivatives Not Qualifying as Hedge Accounting Instruments:
|
|||||||||||||||||||||||
|
Interest Rate
|
1,161
|
|
0
|
|
0
|
|
0
|
|
0
|
|
0
|
|
|||||||||||
|
Currency
|
(340
|
)
|
0
|
|
0
|
|
0
|
|
0
|
|
0
|
|
|||||||||||
|
Currency/Interest Rate
|
(250
|
)
|
0
|
|
(5
|
)
|
0
|
|
0
|
|
0
|
|
|||||||||||
|
Credit
|
13
|
|
0
|
|
0
|
|
0
|
|
0
|
|
0
|
|
|||||||||||
|
Equity
|
(2,498
|
)
|
0
|
|
0
|
|
0
|
|
0
|
|
0
|
|
|||||||||||
|
Other
|
0
|
|
0
|
|
0
|
|
0
|
|
0
|
|
0
|
|
|||||||||||
|
Embedded Derivatives
|
644
|
|
0
|
|
0
|
|
0
|
|
0
|
|
0
|
|
|||||||||||
|
Total non-qualifying hedges
|
(1,270
|
)
|
0
|
|
(5
|
)
|
0
|
|
0
|
|
0
|
|
|||||||||||
|
Total
|
$
|
(1,260
|
)
|
$
|
170
|
|
$
|
(308
|
)
|
$
|
(3
|
)
|
$
|
(1
|
)
|
$
|
(1,364
|
)
|
|||||
203
|
|
Year Ended December 31, 2016
|
|||||||||||||||||||||||
|
|
Realized
Investment
Gains (Losses)
|
Net
Investment
Income
|
Other
Income
(Loss)
|
Interest
Expense
|
Interest
Credited
To Policyholders’
Account
Balances
|
AOCI(1)
|
||||||||||||||||||
|
(in millions)
|
||||||||||||||||||||||||
|
Derivatives Designated as Hedge Accounting Instruments:
|
||||||||||||||||||||||||
|
Fair value hedges
|
||||||||||||||||||||||||
|
Interest Rate
|
$
|
26
|
|
$
|
(31
|
)
|
$
|
0
|
|
$
|
0
|
|
$
|
0
|
|
$
|
0
|
|
||||||
|
Currency
|
21
|
|
(1
|
)
|
0
|
|
0
|
|
0
|
|
0
|
|
||||||||||||
|
Total fair value hedges
|
47
|
|
(32
|
)
|
0
|
|
0
|
|
0
|
|
0
|
|
||||||||||||
|
Cash flow hedges
|
||||||||||||||||||||||||
|
Interest Rate
|
0
|
|
0
|
|
0
|
|
(5
|
)
|
0
|
|
(1
|
)
|
||||||||||||
|
Currency/Interest Rate
|
0
|
|
123
|
|
269
|
|
0
|
|
0
|
|
152
|
|
||||||||||||
|
Total cash flow hedges
|
0
|
|
123
|
|
269
|
|
(5
|
)
|
0
|
|
151
|
|
||||||||||||
|
Net investment hedges
|
||||||||||||||||||||||||
|
Currency(2)
|
5
|
|
0
|
|
0
|
|
0
|
|
0
|
|
(5
|
)
|
||||||||||||
|
Currency/Interest Rate
|
0
|
|
0
|
|
0
|
|
0
|
|
0
|
|
0
|
|
||||||||||||
|
Total net investment hedges
|
5
|
|
0
|
|
0
|
|
0
|
|
0
|
|
(5
|
)
|
||||||||||||
|
Derivatives Not Qualifying as Hedge Accounting Instruments:
|
||||||||||||||||||||||||
|
Interest Rate
|
1,564
|
|
0
|
|
0
|
|
0
|
|
0
|
|
0
|
|
||||||||||||
|
Currency
|
463
|
|
0
|
|
1
|
|
0
|
|
0
|
|
0
|
|
||||||||||||
|
Currency/Interest Rate
|
10
|
|
0
|
|
3
|
|
0
|
|
0
|
|
0
|
|
||||||||||||
|
Credit
|
32
|
|
0
|
|
0
|
|
0
|
|
0
|
|
0
|
|
||||||||||||
|
Equity
|
(2,171
|
)
|
0
|
|
0
|
|
0
|
|
0
|
|
0
|
|
||||||||||||
|
Other
|
(1
|
)
|
0
|
|
0
|
|
0
|
|
0
|
|
0
|
|
||||||||||||
|
Embedded Derivatives
|
1,260
|
|
0
|
|
0
|
|
0
|
|
0
|
|
0
|
|
||||||||||||
|
Total non-qualifying hedges
|
1,157
|
|
0
|
|
4
|
|
0
|
|
0
|
|
0
|
|
||||||||||||
|
Total
|
$
|
1,209
|
|
$
|
91
|
|
$
|
273
|
|
$
|
(5
|
)
|
$
|
0
|
|
$
|
146
|
|
||||||
__________
|
(1)
|
Amounts deferred in AOCI.
|
|
(2)
|
Relates to the sale of equity method investments.
|
For the years ended
December 31, 2018
,
2017
, and
2016
, the ineffective portion of derivatives accounted for using hedge accounting were de minimis to the Company’s results of operations. Also, there were no material amounts reclassified into earnings relating to instances in which the Company discontinued cash flow hedge accounting because the forecasted transaction did not occur by the anticipated date or within the additional time period permitted by the authoritative guidance for the accounting for derivatives and hedging. In addition, there were no instances in which the Company discontinued fair value hedge accounting due to a hedged firm commitment no longer qualifying as a fair value hedge.
Presented below is a rollforward of current period cash flow hedges in AOCI before taxes:
204
|
|
(in millions)
|
||
|
Balance, December 31, 2015
|
$
|
1,165
|
|
|
Net deferred gains (losses) on cash flow hedges from January 1 to December 31, 2016
|
602
|
|
|
|
Amount reclassified into current period earnings
|
(451
|
)
|
|
|
Balance, December 31, 2016
|
1,316
|
|
|
|
Net deferred gains (losses) on cash flow hedges from January 1 to December 31, 2017
|
(1,373
|
)
|
|
|
Amount reclassified into current period earnings
|
18
|
|
|
|
Balance, December 31, 2017
|
(39
|
)
|
|
|
Net deferred gains (losses) on cash flow hedges from January 1 to December 31, 2018
|
1,401
|
|
|
|
Amount reclassified into current period earnings
|
(551
|
)
|
|
|
Balance, December 31, 2018
|
$
|
811
|
|
The changes in fair value of cash flow hedges are deferred in AOCI and are included in “Net unrealized investment gains (losses)” in the Consolidated Statements of Comprehensive Income; these amounts are then reclassified to earnings when the hedged item affects earnings. Using December 31,
2018
values, it is estimated that a pre-tax gain of approximately
$268 million
will be reclassified from AOCI to earnings during the subsequent twelve months ending December 31,
2019
, offset by amounts pertaining to the hedged items.
The exposures the Company is hedging with these qualifying cash flow hedges include the variability of future cash flows from forecasted transactions denominated in foreign currencies, the purchases of invested assets, and the receipt or payment of variable interest on existing financial instruments. The maximum length of time over which the Company is hedging its exposure to the variability in future cash flows for forecasted transactions is
5 years
.
For effective net investment hedges, the amounts, before applicable taxes, recorded in the cumulative translation adjustment account within AOCI were
$532 million
in
2018
,
$526 million
in
2017
, and
$536 million
in
2016
.
Credit Derivatives
Credit derivatives, where the Company has written credit protection on a single name reference, had outstanding notional amounts of
$110 million
and
$114 million
as of December 31,
2018
and
2017
, respectively. These credit derivatives are reported at fair value as an asset of
$1 million
and an asset of
$2 million
, as of December 31,
2018
and
2017
, respectively. As of
December 31, 2018
, the notional amount of these credit derivatives had the following NAIC ratings:
$36 million
in NAIC 1;
$61 million
in NAIC 2;
$5 million
in NAIC 3;
$2 million
in NAIC 4;
$1 million
in NAIC 5 and
$5 million
in NAIC 6. The Company has also written credit protection on certain index references with notional amounts of
$4,953 million
and
$1,022 million
, reported at fair value as an asset of
$10 million
and
$18 million
as of December 31,
2018
and
2017
, respectively.
As of December 31, 2018
, the notional amount of these credit derivatives had the following NAIC ratings:
$50 million
in NAIC 1;
$4,393 million
in NAIC 3; and
$510 million
in NAIC 6. NAIC designations are based on the lowest rated single name reference included in the index.
The Company’s maximum amount at risk under these credit derivatives equals the aforementioned notional amounts and assumes the value of the underlying referenced securities become worthless. These single name credit derivatives have maturities of less than
6 years
, while the credit protection on the index references have maturities of less than
29 years
.
In addition to writing credit protection, the Company has purchased credit protection using credit derivatives in order to hedge specific credit exposures in the Company’s investment portfolio. As of
December 31,
2018
and
2017
, the Company had
$145 million
and
$178 million
of outstanding notional amounts, reported at fair value as a liability of
$1 million
and
$5 million
, respectively.
Counterparty Credit Risk
The Company is exposed to credit-related losses in the event of non-performance by counterparties to financial derivative transactions with a positive fair value. The Company manages credit risk by: (i) entering into derivative transactions with highly rated major international financial institutions and other creditworthy counterparties governed by master netting agreements, as applicable; (ii) trading through central clearing and OTC parties; (iii) obtaining collateral, such as cash and securities, when appropriate; and (iv) setting limits on single party credit exposures which are subject to periodic management review.
205
Substantially all of the Company’s derivative agreements have zero thresholds which require daily full collateralization by the party in a liability position. In addition, certain of the Company’s derivative agreements contain credit-risk related contingent features; if the credit rating of one of the parties to the derivative agreement is to fall below a certain level, the party with positive fair value could request termination at the then fair value or demand immediate full collateralization from the party whose credit rating fell and is in a net liability position.
As of December 31, 2018, there were no net liability derivative positions with counterparties with credit risk-related contingent features; as such, all derivatives have been appropriately collateralized by the Company or the counterparty in accordance with the terms of the derivative agreements.
|
6.
|
FAIR VALUE OF ASSETS AND LIABILITIES
|
Fair Value Measurement
—Fair value represents the price that would be received to sell an asset or paid to transfer a liability in an orderly transaction between market participants at the measurement date. The authoritative fair value guidance establishes a framework for measuring fair value that includes a hierarchy used to classify the inputs used in measuring fair value. The level in the fair value hierarchy within which the fair value measurement falls is determined based on the lowest level input that is significant to the fair value measurement. The levels of the fair value hierarchy are as follows:
Level 1—Fair value is based on unadjusted quoted prices in active markets that are accessible to the Company for identical assets or liabilities. The Company’s Level 1 assets and liabilities primarily include certain cash equivalents and short-term investments, equity securities and derivative contracts that trade on an active exchange market.
Level 2—Fair value is based on significant inputs, other than quoted prices included in Level 1, that are observable for the asset or liability, either directly or indirectly, for substantially the full term of the asset or liability through corroboration with observable market data. Level 2 inputs include quoted market prices in active markets for similar assets and liabilities, quoted market prices in markets that are not active for identical or similar assets or liabilities, and other market observable inputs. The Company’s Level 2 assets and liabilities include: fixed maturities (corporate public and private bonds, most government securities, certain asset-backed and mortgage-backed securities, etc.), certain equity securities (mutual funds, which do not trade in active markets because they are not publicly available), certain commercial mortgage loans, short-term investments and certain cash equivalents (primarily commercial paper), and certain OTC derivatives.
Level 3—Fair value is based on at least one significant unobservable input for the asset or liability. The assets and liabilities in this category may require significant judgment or estimation in determining the fair value. The Company’s Level 3 assets and liabilities primarily include: certain private fixed maturities and equity securities, certain manually priced public equity securities and fixed maturities, certain highly structured OTC derivative contracts, certain consolidated real estate funds for which the Company is the general partner and embedded derivatives resulting from certain products with guaranteed benefits.
Assets and Liabilities by Hierarchy Level
—The tables below present the balances of assets and liabilities reported at fair value on a recurring basis, as of the dates indicated.
206
|
|
As of December 31, 2018
|
||||||||||||||||||
|
|
Level 1
|
Level 2
|
Level 3
|
Netting(1)
|
Total
|
||||||||||||||
|
|
(in millions)
|
||||||||||||||||||
|
Fixed maturities, available-for-sale:
|
|||||||||||||||||||
|
U.S. Treasury securities and obligations of U.S. government authorities and agencies
|
$
|
0
|
|
$
|
30,513
|
|
$
|
81
|
|
$
|
$
|
30,594
|
|
||||||
|
Obligations of U.S. states and their political subdivisions
|
0
|
|
10,488
|
|
5
|
|
10,493
|
|
|||||||||||
|
Foreign government bonds
|
0
|
|
112,985
|
|
125
|
|
113,110
|
|
|||||||||||
|
U.S. corporate public securities
|
0
|
|
83,282
|
|
133
|
|
83,415
|
|
|||||||||||
|
U.S. corporate private securities(2)
|
0
|
|
31,265
|
|
1,755
|
|
33,020
|
|
|||||||||||
|
Foreign corporate public securities
|
0
|
|
29,148
|
|
53
|
|
29,201
|
|
|||||||||||
|
Foreign corporate private securities
|
0
|
|
23,787
|
|
744
|
|
24,531
|
|
|||||||||||
|
Asset-backed securities(3)
|
0
|
|
11,726
|
|
1,247
|
|
12,973
|
|
|||||||||||
|
Commercial mortgage-backed securities
|
0
|
|
13,302
|
|
13
|
|
13,315
|
|
|||||||||||
|
Residential mortgage-backed securities
|
0
|
|
2,925
|
|
79
|
|
3,004
|
|
|||||||||||
|
Subtotal
|
0
|
|
349,421
|
|
4,235
|
|
353,656
|
|
|||||||||||
|
Assets supporting experience-rated contractholder liabilities:
|
|||||||||||||||||||
|
U.S. Treasury securities and obligations of U.S. government authorities and agencies
|
0
|
|
381
|
|
0
|
|
381
|
|
|||||||||||
|
Obligations of U.S. states and their political subdivisions
|
0
|
|
196
|
|
0
|
|
196
|
|
|||||||||||
|
Foreign government bonds
|
0
|
|
858
|
|
225
|
|
1,083
|
|
|||||||||||
|
Corporate securities
|
0
|
|
12,675
|
|
444
|
|
13,119
|
|
|||||||||||
|
Asset-backed securities(3)
|
0
|
|
1,516
|
|
149
|
|
1,665
|
|
|||||||||||
|
Commercial mortgage-backed securities
|
0
|
|
2,324
|
|
0
|
|
2,324
|
|
|||||||||||
|
Residential mortgage-backed securities
|
0
|
|
811
|
|
0
|
|
811
|
|
|||||||||||
|
Equity securities
|
1,222
|
|
237
|
|
1
|
|
1,460
|
|
|||||||||||
|
All other(5)
|
0
|
|
215
|
|
0
|
|
215
|
|
|||||||||||
|
Subtotal
|
1,222
|
|
19,213
|
|
819
|
|
21,254
|
|
|||||||||||
|
Fixed maturities, trading
|
0
|
|
3,037
|
|
206
|
|
3,243
|
|
|||||||||||
|
Equity securities
|
4,819
|
|
610
|
|
671
|
|
6,100
|
|
|||||||||||
|
Commercial mortgage and other loans
|
0
|
|
763
|
|
0
|
|
763
|
|
|||||||||||
|
Other invested assets(6)
|
23
|
|
10,454
|
|
263
|
|
(9,331
|
)
|
1,409
|
|
|||||||||
|
Short-term investments
|
2,713
|
|
2,691
|
|
89
|
|
5,493
|
|
|||||||||||
|
Cash equivalents
|
2,848
|
|
6,553
|
|
77
|
|
9,478
|
|
|||||||||||
|
Other assets
|
0
|
|
0
|
|
25
|
|
25
|
|
|||||||||||
|
Separate account assets(7)(8)
|
39,534
|
|
212,998
|
|
1,534
|
|
254,066
|
|
|||||||||||
|
Total assets
|
$
|
51,159
|
|
$
|
605,740
|
|
$
|
7,919
|
|
$
|
(9,331
|
)
|
$
|
655,487
|
|
||||
|
Future policy benefits(9)
|
$
|
0
|
|
$
|
0
|
|
$
|
8,926
|
|
$
|
$
|
8,926
|
|
||||||
|
Other liabilities
|
18
|
|
5,398
|
|
56
|
|
(5,281
|
)
|
191
|
|
|||||||||
|
Notes issued by consolidated VIEs
|
0
|
|
0
|
|
595
|
|
595
|
|
|||||||||||
|
Total liabilities
|
$
|
18
|
|
$
|
5,398
|
|
$
|
9,577
|
|
$
|
(5,281
|
)
|
$
|
9,712
|
|
||||
207
|
|
As of December 31, 2017
|
||||||||||||||||||
|
|
Level 1
|
Level 2
|
Level 3
|
Netting(1)
|
Total
|
||||||||||||||
|
|
(in millions)
|
||||||||||||||||||
|
Fixed maturities, available-for-sale:
|
|||||||||||||||||||
|
U.S. Treasury securities and obligations of U.S. government authorities and agencies
|
$
|
0
|
|
$
|
26,086
|
|
$
|
52
|
|
$
|
$
|
26,138
|
|
||||||
|
Obligations of U.S. states and their political subdivisions
|
0
|
|
10,466
|
|
5
|
|
10,471
|
|
|||||||||||
|
Foreign government bonds
|
0
|
|
103,271
|
|
148
|
|
103,419
|
|
|||||||||||
|
U.S. corporate public securities
|
0
|
|
90,115
|
|
109
|
|
90,224
|
|
|||||||||||
|
U.S. corporate private securities(2)
|
0
|
|
31,845
|
|
1,889
|
|
33,734
|
|
|||||||||||
|
Foreign corporate public securities
|
0
|
|
29,329
|
|
79
|
|
29,408
|
|
|||||||||||
|
Foreign corporate private securities
|
0
|
|
23,528
|
|
699
|
|
24,227
|
|
|||||||||||
|
Asset-backed securities(3)
|
0
|
|
5,629
|
|
6,604
|
|
12,233
|
|
|||||||||||
|
Commercial mortgage-backed securities
|
0
|
|
13,268
|
|
13
|
|
13,281
|
|
|||||||||||
|
Residential mortgage-backed securities
|
0
|
|
3,547
|
|
98
|
|
3,645
|
|
|||||||||||
|
Subtotal
|
0
|
|
337,084
|
|
9,696
|
|
346,780
|
|
|||||||||||
|
Assets supporting experience-rated contractholder liabilities(4):
|
|||||||||||||||||||
|
U.S. Treasury securities and obligations of U.S. government authorities and agencies
|
0
|
|
201
|
|
0
|
|
201
|
|
|||||||||||
|
Obligations of U.S. states and their political subdivisions
|
0
|
|
208
|
|
0
|
|
208
|
|
|||||||||||
|
Foreign government bonds
|
0
|
|
834
|
|
223
|
|
1,057
|
|
|||||||||||
|
Corporate securities
|
0
|
|
13,611
|
|
462
|
|
14,073
|
|
|||||||||||
|
Asset-backed securities(3)
|
0
|
|
670
|
|
722
|
|
1,392
|
|
|||||||||||
|
Commercial mortgage-backed securities
|
0
|
|
2,311
|
|
0
|
|
2,311
|
|
|||||||||||
|
Residential mortgage-backed securities
|
0
|
|
965
|
|
1
|
|
966
|
|
|||||||||||
|
Equity securities
|
1,381
|
|
258
|
|
4
|
|
1,643
|
|
|||||||||||
|
All other(5)
|
25
|
|
105
|
|
7
|
|
137
|
|
|||||||||||
|
Subtotal
|
1,406
|
|
19,163
|
|
1,419
|
|
21,988
|
|
|||||||||||
|
Fixed maturities, trading(4)
|
0
|
|
3,351
|
|
156
|
|
3,507
|
|
|||||||||||
|
Equity securities(4)
|
5,978
|
|
556
|
|
795
|
|
7,329
|
|
|||||||||||
|
Commercial mortgage and other loans
|
0
|
|
593
|
|
0
|
|
593
|
|
|||||||||||
|
Other invested assets(4)(6)
|
32
|
|
10,768
|
|
137
|
|
(9,600
|
)
|
1,337
|
|
|||||||||
|
Short-term investments(4)
|
3,931
|
|
1,850
|
|
8
|
|
5,789
|
|
|||||||||||
|
Cash equivalents(4)
|
1,900
|
|
6,398
|
|
0
|
|
8,298
|
|
|||||||||||
|
Other assets
|
0
|
|
1
|
|
13
|
|
14
|
|
|||||||||||
|
Separate account assets(7)(8)
|
45,397
|
|
232,874
|
|
2,122
|
|
280,393
|
|
|||||||||||
|
Total assets
|
$
|
58,644
|
|
$
|
612,638
|
|
$
|
14,346
|
|
$
|
(9,600
|
)
|
$
|
676,028
|
|
||||
|
Future policy benefits(9)
|
$
|
0
|
|
$
|
0
|
|
$
|
8,720
|
|
$
|
$
|
8,720
|
|
||||||
|
Other liabilities
|
4
|
|
5,946
|
|
50
|
|
(5,312
|
)
|
688
|
|
|||||||||
|
Notes issued by consolidated VIEs
|
0
|
|
0
|
|
1,196
|
|
1,196
|
|
|||||||||||
|
Total liabilities
|
$
|
4
|
|
$
|
5,946
|
|
$
|
9,966
|
|
$
|
(5,312
|
)
|
$
|
10,604
|
|
||||
__________
|
(1)
|
“Netting” amounts represent cash collateral of
$4,050 million
and
$4,288 million
as of
December 31, 2018
and
2017
, respectively, and the impact of offsetting asset and liability positions held with the same counterparty, subject to master netting arrangements.
|
|
(2)
|
Excludes notes with both fair value and carrying amount of
$4,216 million
and
$2,660 million
, as of
December 31, 2018
and
2017
, respectively, which have been offset with the associated payables under a netting agreement.
|
|
(3)
|
Includes credit-tranched securities collateralized by syndicated bank loans, sub-prime mortgages, auto loans, credit cards, education loans and other asset types.
|
|
(4)
|
Prior period amounts have been reclassified to conform to current period presentation. See Note 2 for details.
|
|
(5)
|
All other represents cash equivalents and short-term investments.
|
|
(6)
|
Other invested assets excluded from the fair value hierarchy include certain hedge funds, private equity funds and other funds for which fair value is measured at net asset value (“NAV”) per share (or its equivalent) as a practical expedient. At
December 31, 2018
and
2017
, the fair values of such investments were
$4,115 million
and
$1,969 million
respectively.
|
208
|
(7)
|
Separate account assets included in the fair value hierarchy exclude investments in entities that calculate NAV per share (or its equivalent) as a practical expedient. Such investments excluded from the fair value hierarchy include investments in real estate, hedge funds and other invested assets. At
December 31, 2018
and
2017
, the fair values of such investments were
$25,070 million
and
$26,224 million
, respectively.
|
|
(8)
|
Separate account assets represent segregated funds that are invested for certain customers. Investment risks associated with market value changes are borne by the customers, except to the extent of minimum guarantees made by the Company with respect to certain accounts. Separate account liabilities are not included in the above table as they are reported at contract value and not fair value in the Company’s Consolidated Statements of Financial Position.
|
|
(9)
|
As of
December 31, 2018
, the net embedded derivative liability position of
$8.9 billion
includes
$0.7 billion
of embedded derivatives in an asset position and
$9.6 billion
of embedded derivatives in a liability position. As of
December 31, 2017
, the net embedded derivative liability position of
$8.7 billion
includes
$0.9 billion
of embedded derivatives in an asset position and
$9.6 billion
of embedded derivatives in a liability position.
|
The methods and assumptions the Company uses to estimate the fair value of assets and liabilities measured at fair value on a recurring basis are summarized below.
Fixed Maturity Securities
—The fair values of the Company’s public fixed maturity securities are generally based on prices obtained from independent pricing services. Prices for each security are generally sourced from multiple pricing vendors, and a vendor hierarchy is maintained by asset type based on historical pricing experience and vendor expertise. The Company ultimately uses the price from the pricing service highest in the vendor hierarchy based on the respective asset type. The pricing hierarchy is updated for new financial products and recent pricing experience with various vendors. Consistent with the fair value hierarchy described above, securities with validated quotes from pricing services are generally reflected within Level 2, as they are primarily based on observable pricing for similar assets and/or other market observable inputs. Typical inputs used by these pricing services include but are not limited to, reported trades, benchmark yields, issuer spreads, bids, offers, and/or estimated cash flow, prepayment speeds and default rates. If the pricing information received from third-party pricing services is deemed not reflective of market activity or other inputs observable in the market, the Company may challenge the price through a formal process with the pricing service or classify the securities as Level 3. If the pricing service updates the price to be more consistent with the presented market observations, the security remains within Level 2.
Internally-developed valuations or indicative broker quotes are also used to determine fair value in circumstances where vendor pricing is not available, or where the Company ultimately concludes that pricing information received from the independent pricing services is not reflective of market activity. If the Company concludes the values from both pricing services and brokers are not reflective of market activity, it may override the information with an internally-developed valuation. As of
December 31, 2018
and
2017
, overrides on a net basis were not material. Pricing service overrides, internally-developed valuations and indicative broker quotes are generally included in Level 3 in the fair value hierarchy.
The Company conducts several specific price monitoring activities. Daily analyses identify price changes over predetermined thresholds defined at the financial instrument level. Various pricing integrity reports are reviewed on a daily and monthly basis to determine if pricing is reflective of market activity or if it would warrant any adjustments. Other procedures performed include, but are not limited to, reviews of third-party pricing services methodologies, reviews of pricing trends and back testing.
The fair values of private fixed maturities, which are originated by internal private asset managers, are primarily determined using discounted cash flow models. These models primarily use observable inputs that include Treasury or similar base rates plus estimated credit spreads to value each security. The credit spreads are obtained through a survey of private market intermediaries who are active in both primary and secondary transactions, and consider, among other factors, the credit quality and the reduced liquidity associated with private placements. Internal adjustments are made to reflect variation in observed sector spreads. Since most private placements are valued using standard market observable inputs and inputs derived from, or corroborated by, market observable data including, but not limited to observed prices and spreads for similar publicly-traded issues, they have been reflected within Level 2. For certain private fixed maturities, the discounted cash flow model may incorporate significant unobservable inputs, which reflect the Company’s own assumptions about the inputs that market participants would use in pricing the asset. To the extent management determines that such unobservable inputs are significant to the price of a security, a Level 3 classification is made.
Assets Supporting Experience-Rated Contractholder Liabilities
—Assets supporting experience-rated contractholder liabilities consist primarily of fixed maturity securities, equity securities and derivatives whose fair values are determined consistent with similar instruments described above under “Fixed Maturity Securities” and below under “Equity Securities” and “Derivative Instruments.”
209
Equity Securities
—Equity securities consist principally of investments in common and preferred stock of publicly-traded companies, perpetual preferred stock, privately-traded securities, as well as mutual fund shares. The fair values of most publicly-traded equity securities are based on quoted market prices in active markets for identical assets and are classified within Level 1 in the fair value hierarchy. Estimated fair values for most privately traded equity securities are determined using discounted cash flow, earnings multiple and other valuation models that require a substantial level of judgment around inputs and therefore are classified within Level 3. The fair values of mutual fund shares that transact regularly (but do not trade in active markets because they are not publicly available) are based on transaction prices of identical fund shares and are classified within Level 2 in the fair value hierarchy. The fair values of perpetual preferred stock are based on inputs obtained from independent pricing services that are primarily based on indicative broker quotes. As a result, the fair values of perpetual preferred stock are classified as Level 3.
Commercial Mortgage and Other Loans
—The fair value of loans held and accounted for using the fair value option is determined utilizing pricing indicators from the whole loan market, where investors are committed to purchase these loans at a predetermined price, which is considered the principal exit market for these loans. The Company evaluates the valuation inputs used for these assets, including the existence of predetermined exit prices, the terms of the loans, prevailing interest rates and credit risk, and deems the primary pricing inputs are Level 2 inputs in the fair value hierarchy.
Other Invested Assets
—Other invested assets primarily include investments in LPs/LLCs, derivatives and certain limited partnerships which are consolidated because the Company is either deemed to exercise control or considered the primary beneficiary of a variable interest entity. These entities are primarily investment companies and follow specialized industry accounting whereby their assets are carried at fair value. The investments held by these entities include various feeder fund investments in underlying master funds (whose underlying holdings generally include public fixed maturities, equity securities and mutual funds), as well as wholly-owned real estate held within other investment funds. For the unconsolidated fund investments, the fair value is primarily determined by the fund managers and is measured at net asset value (“NAV”) as a practical expedient.
Other Assets
—Other assets reflected in Level 3 include reinsurance recoverables which are carried at fair value and relate to the reinsurance of the Company’s living benefit guarantees on certain variable annuity contracts. The methods and assumptions used to estimate the fair value are consistent with those described below under “Future Policy Benefits.”
Derivative Instruments
—Derivatives are recorded at fair value either as assets, within “Assets supporting experience-rated contractholder liabilities,” or “Other invested assets, at fair value,” or as liabilities, within “Other liabilities,” except for embedded derivatives which are recorded with the associated host contract. The fair values of derivative contracts can be affected by changes in interest rates, foreign exchange rates, commodity prices, credit spreads, market volatility, expected returns, NPR, liquidity and other factors. For derivative positions included within Level 3 of the fair value hierarchy, liquidity valuation adjustments are made to reflect the cost of exiting significant risk positions, and consider the bid-ask spread, maturity, complexity and other specific attributes of the underlying derivative position.
The Company’s exchange-traded futures and options include Treasury futures, Eurodollar futures, commodity futures, Eurodollar options and commodity options. Exchange-traded futures and options are valued using quoted prices in active markets and are classified within Level 1 in the fair value hierarchy.
The majority of the Company’s derivative positions are traded in the OTC derivative market and are classified within Level 2 in the fair value hierarchy. OTC derivatives classified within Level 2 are valued using models that utilize actively quoted or observable market input values from external market data providers, third-party pricing vendors and/or recent trading activity. The Company’s policy is to use mid-market pricing in determining its best estimate of fair value. The fair values of most OTC derivatives, including interest rate and cross-currency swaps, currency forward contracts, commodity swaps, commodity forward contracts, single name credit default swaps, loan commitments held for sale and TBA forward contracts on highly rated mortgage-backed securities issued by U.S. government sponsored entities are determined using discounted cash flow models. The fair values of European style option contracts are determined using Black-Scholes option pricing models. These models’ key inputs include the contractual terms of the respective contract, along with significant observable inputs, including interest rates, currency rates, credit spreads, equity prices, index dividend yields, NPR, volatility and other factors.
The Company’s cleared interest rate swaps and credit derivatives linked to an index are valued using models that utilize actively quoted or observable market inputs, including Overnight Indexed Swap discount rates, obtained from external market data providers, third-party pricing vendors and/or recent trading activity. These derivatives are classified as Level 2 in the fair value hierarchy.
210
The majority of the Company’s derivative agreements are with highly rated major international financial institutions. To reflect the market’s perception of its own and the counterparty’s NPR, the Company incorporates additional spreads over LIBOR into the discount rate used in determining the fair value of OTC derivative assets and liabilities that are not otherwise collateralized.
Derivatives classified as Level 3 include look-back equity options and other structured products. These derivatives are valued based upon models, such as Monte Carlo simulation models and other techniques that utilize significant unobservable inputs. Level 3 methodologies are validated through periodic comparison of the Company’s fair values to external broker-dealer values.
Cash Equivalents and Short-Term Investments
—Cash equivalents and short-term investments include money market instruments, commercial paper and other highly liquid debt instruments. Certain money market instruments are valued using unadjusted quoted prices in active markets that are accessible for identical assets and are primarily classified as Level 1. The remaining instruments in this category are generally fair valued based on market observable inputs and these investments have primarily been classified within Level 2.
Separate Account Assets
—Separate account assets include mutual funds, fixed maturity securities, treasuries, equity securities, real estate and commercial mortgage loans for which values are determined consistent with similar instruments described above under “Fixed Maturity Securities,” “Equity Securities” and “Commercial Mortgage and Other Loans.”
Notes issued by Consolidated VIEs
—These notes are based on the fair values of corresponding bank loan collateral. Since the notes are valued based on reference collateral, they are classified as Level 3. See Note 4 and “Fair Value Option” below for additional information.
Other Liabilities
—Other liabilities include certain derivative instruments, including embedded derivatives associated with certain “Policyholders’ account balances.” The fair values are primarily determined consistent with similar derivative instruments described above under “Derivative Instruments.”
Future Policy Benefits
—The liability for future policy benefits is related to guarantees primarily associated with the living benefit features of certain variable annuity contracts offered by the Company’s Individual Annuities segment, including guaranteed minimum accumulation benefits (“GMAB”), guaranteed withdrawal benefits (“GMWB”) and guaranteed minimum income and withdrawal benefits (“GMIWB”), accounted for as embedded derivatives. The fair values of these liabilities are calculated as the present value of future expected benefit payments to customers less the present value of future expected rider fees attributable to the embedded derivative feature. This methodology could result in either a liability or contra-liability balance, given changing capital market conditions and various actuarial assumptions. Since there is no observable active market for the transfer of these obligations, the valuations are calculated using internally-developed models with option pricing techniques. The models are based on a risk neutral valuation framework and incorporate premiums for risks inherent in valuation techniques, inputs, and the general uncertainty around the timing and amount of future cash flows. The determination of these risk premiums requires the use of management’s judgment.
The significant inputs to the valuation models for these embedded derivatives include capital market assumptions, such as interest rate levels and volatility assumptions, the Company’s market-perceived NPR, as well as actuarially determined assumptions, including contractholder behavior, such as lapse rates, benefit utilization rates, withdrawal rates, and mortality rates. Since many of these assumptions are unobservable and are considered to be significant inputs to the liability valuation, the liability included in future policy benefits has been reflected within Level 3 in the fair value hierarchy
.
Capital market inputs and actual policyholders’ account values are updated each quarter based on capital market conditions as of the end of the quarter, including interest rates, equity markets and volatility. In the risk neutral valuation, the initial swap curve drives the total return used to grow the policyholders’ account values. The Company’s discount rate assumption is based on the LIBOR swap curve adjusted for an additional spread relative to LIBOR to reflect NPR.
Actuarial assumptions, including contractholder behavior and mortality, are reviewed at least annually, and updated based upon emerging experience, future expectations and other data, including any observable market data. These assumptions are generally updated annually unless a material change that the Company feels is indicative of a long-term trend is observed in an interim period.
Quantitative Information Regarding Internally
-
Priced Level 3 Assets and Liabilities
—The tables below present quantitative information on significant internally-priced Level 3 assets and liabilities.
211
|
|
As of December 31, 2018
|
||||||||||||||||
|
|
Fair Value
|
Valuation
Techniques
|
Unobservable Inputs
|
Minimum
|
|
Maximum
|
Weighted
Average
|
Impact of
Increase in
Input on
Fair
Value(1)
|
|||||||||
|
|
(in millions)
|
|
|
|
|
|
|
|
|||||||||
|
Assets:
|
|||||||||||||||||
|
Corporate securities(2)
|
$
|
1,392
|
|
Discounted cash flow
|
Discount rate
|
0.57%
|
—
|
|
20%
|
8.58
|
%
|
Decrease
|
|||||
|
Market comparables
|
EBITDA multiples(3)
|
4.5X
|
—
|
|
8.5X
|
8.1X
|
Increase
|
||||||||||
|
|
|
Liquidation
|
Liquidation value
|
11.77%
|
—
|
|
94.00%
|
32.16
|
%
|
Increase
|
|||||||
|
Separate account assets-commercial mortgage loans(4)
|
$
|
785
|
|
Discounted cash flow
|
Spread
|
1.12%
|
—
|
|
2.55%
|
1.29
|
%
|
Decrease
|
|||||
|
Liabilities:
|
|||||||||||||||||
|
Future policy benefits(5)
|
$
|
8,926
|
|
Discounted cash flow
|
Lapse rate(6)
|
1%
|
—
|
|
13%
|
Decrease
|
|||||||
|
Spread over LIBOR(7)
|
0.36%
|
—
|
|
1.60%
|
Decrease
|
||||||||||||
|
Utilization rate(8)
|
50%
|
—
|
|
97%
|
Increase
|
||||||||||||
|
Withdrawal rate
|
See table footnote (9) below.
|
||||||||||||||||
|
Mortality rate(10)
|
0%
|
—
|
|
15%
|
Decrease
|
||||||||||||
|
|
|
|
Equity volatility curve
|
18%
|
—
|
|
22%
|
|
Increase
|
||||||||
|
|
As of December 31, 2017
|
|||||||||||||||
|
|
Fair Value
|
Valuation
Techniques
|
Unobservable Inputs
|
Minimum
|
|
Maximum
|
Weighted
Average
|
Impact of
Increase in
Input on
Fair
Value(1)
|
||||||||
|
|
(in millions)
|
|
|
|
|
|
|
|
||||||||
|
Assets:
|
||||||||||||||||
|
Corporate securities(2)
|
$
|
1,352
|
|
Discounted cash flow
|
Discount rate
|
0.65%
|
—
|
|
22%
|
7.20%
|
Decrease
|
|||||
|
Market comparables
|
EBITDA multiples(3)
|
7.4X
|
—
|
|
7.4X
|
7.4X
|
Increase
|
|||||||||
|
|
|
Liquidation
|
Liquidation value
|
13.10%
|
—
|
|
25.00%
|
14.68%
|
Increase
|
|||||||
|
Separate account assets-commercial mortgage loans(4)
|
$
|
821
|
|
Discounted cash flow
|
Spread
|
1.08%
|
—
|
|
2.78%
|
1.20%
|
Decrease
|
|||||
|
Liabilities:
|
||||||||||||||||
|
Future policy benefits(5)
|
$
|
8,270
|
|
Discounted cash flow
|
Lapse rate(6)
|
1%
|
—
|
|
12%
|
Decrease
|
||||||
|
Spread over LIBOR(7)
|
0.12%
|
—
|
|
1.10%
|
Decrease
|
|||||||||||
|
Utilization rate(8)
|
52%
|
—
|
|
97%
|
Increase
|
|||||||||||
|
Withdrawal rate
|
See table footnote (9) below.
|
|||||||||||||||
|
Mortality rate(10)
|
0%
|
—
|
|
14%
|
Decrease
|
|||||||||||
|
|
|
|
Equity volatility curve
|
13%
|
—
|
|
24%
|
|
Increase
|
|||||||
__________
212
|
(1)
|
Conversely, the impact of a decrease in input would have the opposite impact on fair value as that presented in the table.
|
|
(2)
|
Includes assets classified as fixed maturities available-for-sale, assets supporting experience-rated contractholder liabilities and fixed maturities, trading.
|
|
(3)
|
Represents multiples of earnings before interest, taxes, depreciation and amortization (“EBITDA”), and are amounts used when the Company has determined that market participants would use such multiples when valuing the investments.
|
|
(4)
|
Changes in the fair value of separate account assets are borne by customers and thus are offset by changes in separate account liabilities on the Company’s Consolidated Statements of Financial Position. As a result, changes in value associated with these investments are not reflected in the Company’s Consolidated Statements of Operations.
|
|
(5)
|
Future policy benefits primarily represent general account liabilities for the living benefit features of the Company’s variable annuity contracts which are accounted for as embedded derivatives. Since the valuation methodology for these liabilities uses a range of inputs that vary at the contract level over the cash flow projection period, presenting a range, rather than weighted average, is a more meaningful representation of the unobservable inputs used in the valuation.
|
|
(6)
|
Lapse rates are adjusted at the contract level based on the in-the-moneyness of the living benefit and reflect other factors, such as the applicability of any surrender charges. Lapse rates are reduced when contracts are more in-the-money. Lapse rates are also generally assumed to be lower for the period where surrender charges apply.
|
|
(7)
|
The spread over the LIBOR swap curve represents the premium added to the proxy for the risk-free rate (LIBOR) to reflect our estimates of rates that a market participant would use to value the living benefit contracts in both the accumulation and payout phases. This spread includes an estimate of NPR, which is the risk that the obligation will not be fulfilled by the Company. NPR is primarily estimated by utilizing the credit spreads associated with issuing funding agreements, adjusted for any illiquidity risk premium. In order to reflect the financial strength ratings of the Company, credit spreads associated with funding agreements, as opposed to credit spread associated with debt, are utilized in developing this estimate because both funding agreements and living benefit contracts are insurance liabilities and are therefore senior to debt.
|
|
(8)
|
The utilization rate assumption estimates the percentage of contracts that will utilize the benefit during the contract duration, and begin lifetime withdrawals at various time intervals from contract inception. The remaining contractholders are assumed to either begin lifetime withdrawals immediately or never utilize the benefit. Utilization assumptions may vary by product type, tax status, and age. The impact of changes in these assumptions is highly dependent on the product type, the age of the contractholder at the time of the sale, and the timing of the first lifetime income withdrawal. Range reflects the utilization rate for the vast majority of business with living benefits.
|
|
(9)
|
The withdrawal rate assumption estimates the magnitude of annual contractholder withdrawals relative to the maximum allowable amount under the contract. These assumptions vary based on the age of the contractholder, the tax status of the contract and the duration since the contractholder began lifetime withdrawals. As of both
December 31, 2018
and
2017
, the minimum withdrawal rate assumption is
78%
and the maximum withdrawal rate assumption may be greater than
100%
. The fair value of the liability will generally increase the closer the withdrawal rate is to 100% and decrease as the withdrawal rate moves further away from 100%.
|
|
(10)
|
Range reflects the mortality rate for the vast majority of business with living benefits, with policyholders ranging from
50
to
90
years old. While the majority of living benefits have a minimum age requirement, certain benefits do not have an age restriction. This results in contractholders for certain benefits with mortality rates approaching
0%
. Based on historical experience, the Company applies a set of age and duration specific mortality rate adjustments compared to standard industry tables. A mortality improvement assumption is also incorporated into the overall mortality table.
|
Interrelationships Between Unobservable Inputs
—
In addition to the sensitivities of fair value measurements to changes in each unobservable input in isolation, as reflected in the table above, interrelationships between these inputs may also exist, such that a change in one unobservable input may give rise to a change in another or multiple inputs. Examples of such interrelationships for significant internally-priced Level 3 assets and liabilities are as follows:
Corporate Securities
—The rate used to discount future cash flows reflects current risk-free rates plus credit and liquidity spread requirements that market participants would use to value an asset. The discount rate may be influenced by many factors, including market cycles, expectations of default, collateral, term, and asset complexity. Each of these factors can influence discount rates, either in isolation, or in response to other factors.
Future Policy Benefits
—The Company expects efficient benefit utilization and withdrawal rates to generally be correlated with lapse rates. However, behavior is generally highly dependent on the facts and circumstances surrounding the individual contractholder, such as their liquidity needs or tax situation, which could drive lapse behavior independent of other contractholder behavior assumptions. To the extent more efficient contractholder behavior results in greater in-the-moneyness at the contract level, lapse rates may decline for those contracts. Similarly, to the extent that increases in equity volatility are correlated with overall declines in the capital markets, lapse rates may decline as contracts become more in-the-money.
Changes in Level 3 Assets and Liabilities
––The following tables describe changes in fair values of Level 3 assets and liabilities as of the dates indicated, as well as the portion of gains or losses included in income attributable to unrealized gains or losses related to those assets and liabilities still held at the end of their respective periods. When a determination is made to classify assets and liabilities within Level 3, the determination is based on significance of the unobservable inputs in the overall fair value measurement. All transfers are based on changes in the observability of the valuation inputs, including the availability of pricing service information that the Company can validate. Transfers into Level 3 are generally the result of unobservable inputs utilized within valuation methodologies and the use of indicative broker quotes for assets that were previously valued using observable inputs. Transfers out of Level 3 are generally due to the use of observable inputs in valuation methodologies as well as the availability of pricing service information for certain assets that the Company can validate. During the second quarter of 2018,
$5,078 million
of investments in CLOs reported as “Asset-backed securities” were transferred from Level 3 to Level 2 as market activity, liquidity and overall observability of valuation inputs of CLOs have increased.
213
|
|
Year Ended December 31, 2018(1)
|
||||||||||||||||||||||||||||||||
|
Fair Value, beginning of period
|
Total realized and unrealized gains (losses)
|
Purchases
|
Sales
|
Issuances
|
Settlements
|
Other(6)
|
Transfers into
Level 3
|
Transfers out of Level 3
|
Fair Value, end of period
|
Unrealized gains (losses) for assets still held(7)
|
|||||||||||||||||||||||
|
(in millions)
|
|||||||||||||||||||||||||||||||||
|
Fixed maturities, available-for-sale:
|
|||||||||||||||||||||||||||||||||
|
U.S. government
|
$
|
52
|
|
$
|
0
|
|
$
|
29
|
|
$
|
0
|
|
$
|
0
|
|
$
|
0
|
|
$
|
0
|
|
$
|
0
|
|
$
|
0
|
|
$
|
81
|
|
$
|
0
|
|
|
U.S. states
|
5
|
|
0
|
|
0
|
|
0
|
|
0
|
|
0
|
|
0
|
|
0
|
|
0
|
|
5
|
|
0
|
|
|||||||||||
|
Foreign government
|
148
|
|
(3
|
)
|
5
|
|
0
|
|
0
|
|
0
|
|
(9
|
)
|
20
|
|
(36
|
)
|
125
|
|
0
|
|
|||||||||||
|
Corporate securities(2)
|
2,776
|
|
(110
|
)
|
919
|
|
(25
|
)
|
0
|
|
(991
|
)
|
(15
|
)
|
485
|
|
(354
|
)
|
2,685
|
|
(60
|
)
|
|||||||||||
|
Structured securities(3)
|
6,715
|
|
(40
|
)
|
2,808
|
|
(612
|
)
|
0
|
|
(1,589
|
)
|
1
|
|
1,212
|
|
(7,156
|
)
|
1,339
|
|
0
|
|
|||||||||||
|
Assets supporting experience-rated contractholder liabilities:
|
|||||||||||||||||||||||||||||||||
|
Foreign government
|
223
|
|
7
|
|
0
|
|
0
|
|
0
|
|
(5
|
)
|
0
|
|
0
|
|
0
|
|
225
|
|
1
|
|
|||||||||||
|
Corporate securities(2)
|
462
|
|
(35
|
)
|
147
|
|
0
|
|
0
|
|
(179
|
)
|
0
|
|
72
|
|
(23
|
)
|
444
|
|
(37
|
)
|
|||||||||||
|
Structured securities(3)
|
723
|
|
(1
|
)
|
97
|
|
0
|
|
0
|
|
(165
|
)
|
0
|
|
33
|
|
(538
|
)
|
149
|
|
(2
|
)
|
|||||||||||
|
Equity securities
|
4
|
|
0
|
|
0
|
|
(3
|
)
|
0
|
|
0
|
|
0
|
|
0
|
|
0
|
|
1
|
|
0
|
|
|||||||||||
|
All other activity
|
7
|
|
(2
|
)
|
91
|
|
(3
|
)
|
0
|
|
(93
|
)
|
0
|
|
0
|
|
0
|
|
0
|
|
0
|
|
|||||||||||
|
Other assets:
|
|||||||||||||||||||||||||||||||||
|
Fixed maturities, trading
|
156
|
|
6
|
|
96
|
|
(59
|
)
|
0
|
|
(3
|
)
|
3
|
|
13
|
|
(6
|
)
|
206
|
|
8
|
|
|||||||||||
|
Equity securities
|
795
|
|
(6
|
)
|
66
|
|
(100
|
)
|
0
|
|
(82
|
)
|
18
|
|
5
|
|
(25
|
)
|
671
|
|
(19
|
)
|
|||||||||||
|
Other invested assets
|
137
|
|
4
|
|
136
|
|
(18
|
)
|
0
|
|
0
|
|
4
|
|
0
|
|
0
|
|
263
|
|
3
|
|
|||||||||||
|
Short-term investments
|
8
|
|
0
|
|
287
|
|
0
|
|
0
|
|
(201
|
)
|
(5
|
)
|
0
|
|
0
|
|
89
|
|
(1
|
)
|
|||||||||||
|
Cash equivalents
|
0
|
|
(1
|
)
|
95
|
|
(2
|
)
|
0
|
|
(15
|
)
|
0
|
|
0
|
|
0
|
|
77
|
|
0
|
|
|||||||||||
|
Other assets
|
13
|
|
(34
|
)
|
46
|
|
0
|
|
0
|
|
0
|
|
0
|
|
0
|
|
0
|
|
25
|
|
(34
|
)
|
|||||||||||
|
Separate account assets(4)
|
2,122
|
|
(64
|
)
|
587
|
|
(36
|
)
|
0
|
|
(358
|
)
|
0
|
|
287
|
|
(1,004
|
)
|
1,534
|
|
(52
|
)
|
|||||||||||
|
Liabilities:
|
|||||||||||||||||||||||||||||||||
|
Future policy benefits
|
(8,720
|
)
|
947
|
|
0
|
|
0
|
|
(1,153
|
)
|
0
|
|
0
|
|
0
|
|
0
|
|
(8,926
|
)
|
611
|
|
|||||||||||
|
Other liabilities
|
(50
|
)
|
32
|
|
0
|
|
0
|
|
(48
|
)
|
9
|
|
1
|
|
0
|
|
0
|
|
(56
|
)
|
33
|
|
|||||||||||
|
Notes issued by consolidated VIEs
|
(1,196
|
)
|
14
|
|
0
|
|
0
|
|
0
|
|
0
|
|
587
|
|
0
|
|
0
|
|
(595
|
)
|
14
|
|
|||||||||||
|
|
Year Ended December 31, 2018(1)
|
||||||||||||||||||||||||
|
Total realized and unrealized gains (losses)
|
Unrealized gains (losses) for assets still held(7)
|
||||||||||||||||||||||||
|
Realized investment gains (losses), net
|
Other income (loss)
|
Interest credited to policyholders’ account balances
|
Included in other comprehensive income (losses)
|
Net investment income
|
Realized investment gains (losses), net
|
Other income
(loss)
|
Interest credited to policyholders’ account balances
|
||||||||||||||||||
|
(in millions)
|
|||||||||||||||||||||||||
|
Fixed maturities, available-for-sale
|
$
|
(29
|
)
|
$
|
0
|
|
$
|
0
|
|
$
|
(141
|
)
|
$
|
17
|
|
$
|
(60
|
)
|
$
|
0
|
|
$
|
0
|
|
|
|
Assets supporting experience-rated contractholder liabilities
|
0
|
|
(39
|
)
|
0
|
|
0
|
|
8
|
|
0
|
|
(38
|
)
|
0
|
|
|||||||||
|
Other assets:
|
|||||||||||||||||||||||||
|
Fixed maturities, trading
|
0
|
|
5
|
|
0
|
|
0
|
|
1
|
|
0
|
|
8
|
|
0
|
|
|||||||||
|
Equity securities
|
0
|
|
(6
|
)
|
0
|
|
0
|
|
0
|
|
0
|
|
(19
|
)
|
0
|
|
|||||||||
|
Other invested assets
|
4
|
|
0
|
|
0
|
|
0
|
|
0
|
|
2
|
|
1
|
|
0
|
|
|||||||||
|
Short-term investments
|
0
|
|
0
|
|
0
|
|
0
|
|
0
|
|
(1
|
)
|
0
|
|
0
|
|
|||||||||
|
Cash equivalents
|
(1
|
)
|
0
|
|
0
|
|
0
|
|
0
|
|
0
|
|
0
|
|
0
|
|
|||||||||
|
Other assets
|
(34
|
)
|
0
|
|
0
|
|
0
|
|
0
|
|
(34
|
)
|
0
|
|
0
|
|
|||||||||
|
Separate account assets(4)
|
0
|
|
0
|
|
(66
|
)
|
0
|
|
2
|
|
0
|
|
0
|
|
(52
|
)
|
|||||||||
|
Liabilities:
|
|||||||||||||||||||||||||
|
Future policy benefits
|
947
|
|
0
|
|
0
|
|
0
|
|
0
|
|
611
|
|
0
|
|
0
|
|
|||||||||
|
Other liabilities
|
32
|
|
0
|
|
0
|
|
0
|
|
0
|
|
33
|
|
0
|
|
0
|
|
|||||||||
|
Notes issued by consolidated VIEs
|
14
|
|
0
|
|
0
|
|
0
|
|
0
|
|
14
|
|
0
|
|
0
|
|
|||||||||
214
|
|
Year Ended December 31, 2017(8)
|
||||||||||||||||||||||||||||||||
|
Fair Value, beginning of period
|
Total realized and unrealized gains (losses)
|
Purchases
|
Sales
|
Issuances
|
Settlements
|
Other(6)
|
Transfers into
Level 3
|
Transfers out of Level 3
|
Fair Value, end of period
|
Unrealized gains (losses) for assets still held(7)
|
|||||||||||||||||||||||
|
(in millions)
|
|||||||||||||||||||||||||||||||||
|
Fixed maturities, available-for-sale:
|
|||||||||||||||||||||||||||||||||
|
U.S. government
|
$
|
0
|
|
$
|
0
|
|
$
|
42
|
|
$
|
0
|
|
$
|
0
|
|
$
|
0
|
|
$
|
10
|
|
$
|
0
|
|
$
|
0
|
|
$
|
52
|
|
$
|
0
|
|
|
U.S. states
|
5
|
|
0
|
|
7
|
|
0
|
|
0
|
|
0
|
|
0
|
|
0
|
|
(7
|
)
|
5
|
|
0
|
|
|||||||||||
|
Foreign government
|
124
|
|
(1
|
)
|
0
|
|
0
|
|
0
|
|
0
|
|
3
|
|
39
|
|
(17
|
)
|
148
|
|
0
|
|
|||||||||||
|
Corporate securities(2)
|
2,173
|
|
(96
|
)
|
525
|
|
(173
|
)
|
0
|
|
(781
|
)
|
(48
|
)
|
1,498
|
|
(322
|
)
|
2,776
|
|
(154
|
)
|
|||||||||||
|
Structured securities(3)
|
4,555
|
|
88
|
|
4,967
|
|
(645
|
)
|
0
|
|
(2,756
|
)
|
36
|
|
3,933
|
|
(3,463
|
)
|
6,715
|
|
0
|
|
|||||||||||
|
Assets supporting experience-rated contractholder liabilities(5):
|
|||||||||||||||||||||||||||||||||
|
Foreign government
|
227
|
|
0
|
|
0
|
|
0
|
|
0
|
|
(4
|
)
|
0
|
|
0
|
|
0
|
|
223
|
|
(5
|
)
|
|||||||||||
|
Corporate securities(2)
|
154
|
|
(31
|
)
|
123
|
|
(2
|
)
|
0
|
|
(114
|
)
|
(3
|
)
|
353
|
|
(18
|
)
|
462
|
|
(33
|
)
|
|||||||||||
|
Structured securities(3)
|
290
|
|
4
|
|
615
|
|
(19
|
)
|
0
|
|
(319
|
)
|
0
|
|
548
|
|
(396
|
)
|
723
|
|
4
|
|
|||||||||||
|
Equity securities
|
0
|
|
0
|
|
0
|
|
0
|
|
0
|
|
0
|
|
4
|
|
0
|
|
0
|
|
4
|
|
0
|
|
|||||||||||
|
All other activity
|
0
|
|
0
|
|
46
|
|
0
|
|
0
|
|
(39
|
)
|
0
|
|
0
|
|
0
|
|
7
|
|
0
|
|
|||||||||||
|
Other assets:
|
|||||||||||||||||||||||||||||||||
|
Fixed maturities, trading(5)
|
76
|
|
(1
|
)
|
72
|
|
(11
|
)
|
0
|
|
(41
|
)
|
9
|
|
84
|
|
(32
|
)
|
156
|
|
(1
|
)
|
|||||||||||
|
Equity securities(5)
|
752
|
|
44
|
|
61
|
|
(52
|
)
|
0
|
|
(47
|
)
|
33
|
|
38
|
|
(34
|
)
|
795
|
|
34
|
|
|||||||||||
|
Other invested assets(5)
|
8
|
|
1
|
|
0
|
|
0
|
|
39
|
|
(1
|
)
|
76
|
|
14
|
|
0
|
|
137
|
|
0
|
|
|||||||||||
|
Short-term investments
|
1
|
|
0
|
|
30
|
|
0
|
|
0
|
|
(23
|
)
|
(1
|
)
|
1
|
|
0
|
|
8
|
|
0
|
|
|||||||||||
|
Cash equivalents
|
0
|
|
2
|
|
93
|
|
0
|
|
0
|
|
(99
|
)
|
0
|
|
4
|
|
0
|
|
0
|
|
0
|
|
|||||||||||
|
Other assets
|
0
|
|
(20
|
)
|
33
|
|
0
|
|
0
|
|
0
|
|
0
|
|
0
|
|
0
|
|
13
|
|
(21
|
)
|
|||||||||||
|
Separate account assets(4)
|
1,849
|
|
83
|
|
1,122
|
|
(98
|
)
|
0
|
|
(725
|
)
|
0
|
|
353
|
|
(462
|
)
|
2,122
|
|
78
|
|
|||||||||||
|
Liabilities:
|
|||||||||||||||||||||||||||||||||
|
Future policy benefits
|
(8,238
|
)
|
637
|
|
0
|
|
0
|
|
(1,117
|
)
|
0
|
|
(2
|
)
|
0
|
|
0
|
|
(8,720
|
)
|
372
|
|
|||||||||||
|
Other liabilities
|
(22
|
)
|
(37
|
)
|
0
|
|
0
|
|
0
|
|
4
|
|
5
|
|
0
|
|
0
|
|
(50
|
)
|
(37
|
)
|
|||||||||||
|
Notes issued by consolidated VIEs
|
(1,839
|
)
|
(4
|
)
|
0
|
|
0
|
|
0
|
|
0
|
|
647
|
|
0
|
|
0
|
|
(1,196
|
)
|
(4
|
)
|
|||||||||||
|
|
Year Ended December 31, 2017(8)
|
||||||||||||||||||||||||
|
Total realized and unrealized gains (losses)
|
Unrealized gains (losses) for assets still held(7)
|
||||||||||||||||||||||||
|
Realized investment gains (losses), net
|
Other income (loss)
|
Interest credited to policyholders’ account balances
|
Included in other comprehensive income (losses)
|
Net investment income
|
Realized investment gains (losses), net
|
Other income
(loss)
|
Interest credited to policyholders’ account balances
|
||||||||||||||||||
|
(in millions)
|
|||||||||||||||||||||||||
|
Fixed maturities, available-for-sale
|
$
|
(23
|
)
|
$
|
0
|
|
$
|
0
|
|
$
|
(12
|
)
|
$
|
26
|
|
$
|
(154
|
)
|
$
|
0
|
|
$
|
0
|
|
|
|
Assets supporting experience-rated contractholder liabilities(5)
|
0
|
|
(35
|
)
|
0
|
|
0
|
|
8
|
|
0
|
|
(34
|
)
|
0
|
|
|||||||||
|
Other assets:
|
|||||||||||||||||||||||||
|
Fixed maturities, trading(5)
|
0
|
|
(2
|
)
|
0
|
|
0
|
|
1
|
|
0
|
|
(1
|
)
|
0
|
|
|||||||||
|
Equity securities(5)
|
2
|
|
25
|
|
0
|
|
17
|
|
0
|
|
(4
|
)
|
38
|
|
0
|
|
|||||||||
|
Other invested assets(5)
|
1
|
|
0
|
|
0
|
|
0
|
|
0
|
|
0
|
|
0
|
|
0
|
|
|||||||||
|
Short-term investments
|
0
|
|
0
|
|
0
|
|
0
|
|
0
|
|
0
|
|
0
|
|
0
|
|
|||||||||
|
Cash equivalents
|
0
|
|
0
|
|
0
|
|
0
|
|
2
|
|
0
|
|
0
|
|
0
|
|
|||||||||
|
Other assets
|
(20
|
)
|
0
|
|
0
|
|
0
|
|
0
|
|
(21
|
)
|
0
|
|
0
|
|
|||||||||
|
Separate account assets(4)
|
0
|
|
0
|
|
81
|
|
0
|
|
2
|
|
0
|
|
0
|
|
78
|
|
|||||||||
|
Liabilities:
|
|||||||||||||||||||||||||
|
Future policy benefits
|
637
|
|
0
|
|
0
|
|
0
|
|
0
|
|
372
|
|
0
|
|
0
|
|
|||||||||
|
Other liabilities
|
(37
|
)
|
0
|
|
0
|
|
0
|
|
0
|
|
(37
|
)
|
0
|
|
0
|
|
|||||||||
|
Notes issued by consolidated VIEs
|
(4
|
)
|
0
|
|
0
|
|
0
|
|
0
|
|
(4
|
)
|
0
|
|
0
|
|
|||||||||
215
The following tables summarize the portion of changes in fair values of Level 3 assets and liabilities included in earnings and OCI for the year ended
December 31, 2016
, as well as the portion of gains or losses included in income attributable to unrealized gains or losses related to those assets and liabilities still held as of
December 31, 2016
.
|
|
Year Ended December 31, 2016(8)
|
||||||||||||||||||||||||
|
Total realized and unrealized gains (losses)
|
Unrealized gains (losses) for assets still held(7)
|
||||||||||||||||||||||||
|
Realized investment gains (losses), net
|
Other income (loss)
|
Interest credited to policyholders’ account balances
|
Included in other comprehensive income (losses)
|
Net investment income
|
Realized investment gains (losses), net
|
Other income
(loss)
|
Interest credited to policyholders’ account balances
|
||||||||||||||||||
|
(in millions)
|
|||||||||||||||||||||||||
|
Fixed maturities, available-for-sale
|
$
|
(121
|
)
|
$
|
0
|
|
$
|
0
|
|
$
|
50
|
|
$
|
24
|
|
$
|
(110
|
)
|
$
|
0
|
|
$
|
0
|
|
|
|
Assets supporting experience-rated contractholder liabilities(5)
|
0
|
|
(18
|
)
|
0
|
|
0
|
|
5
|
|
0
|
|
(17
|
)
|
0
|
|
|||||||||
|
Other assets:
|
|||||||||||||||||||||||||
|
Fixed maturities, trading(5)
|
0
|
|
(8
|
)
|
0
|
|
0
|
|
0
|
|
0
|
|
(2
|
)
|
0
|
|
|||||||||
|
Equity securities(5)
|
52
|
|
8
|
|
0
|
|
(75
|
)
|
0
|
|
0
|
|
3
|
|
0
|
|
|||||||||
|
Other invested assets(5)
|
(1
|
)
|
1
|
|
0
|
|
0
|
|
(1
|
)
|
(1
|
)
|
1
|
|
0
|
|
|||||||||
|
Short-term investments
|
0
|
|
0
|
|
0
|
|
0
|
|
0
|
|
0
|
|
0
|
|
0
|
|
|||||||||
|
Cash equivalents
|
0
|
|
0
|
|
0
|
|
0
|
|
0
|
|
0
|
|
0
|
|
0
|
|
|||||||||
|
Other assets
|
(30
|
)
|
0
|
|
0
|
|
0
|
|
0
|
|
(30
|
)
|
0
|
|
0
|
|
|||||||||
|
Separate account assets(4)
|
1
|
|
0
|
|
22
|
|
0
|
|
17
|
|
0
|
|
0
|
|
3
|
|
|||||||||
|
Liabilities:
|
|||||||||||||||||||||||||
|
Future policy benefits
|
1,252
|
|
0
|
|
0
|
|
0
|
|
0
|
|
1,046
|
|
0
|
|
0
|
|
|||||||||
|
Other liabilities
|
(8
|
)
|
0
|
|
0
|
|
0
|
|
0
|
|
(9
|
)
|
0
|
|
0
|
|
|||||||||
|
Notes issued by consolidated VIEs
|
(23
|
)
|
(14
|
)
|
0
|
|
0
|
|
0
|
|
(23
|
)
|
(14
|
)
|
0
|
|
|||||||||
__________
|
(1)
|
Current period amounts include one additional month of activity related to the elimination of Gibraltar Life’s reporting lag.
|
|
(2)
|
Includes U.S. corporate public, U.S. corporate private, foreign corporate public and foreign corporate private securities.
|
|
(3)
|
Includes asset-backed, commercial mortgage-backed and residential mortgage-backed securities.
|
|
(4)
|
Separate account assets represent segregated funds that are invested for certain customers. Investment risks associated with market value changes are borne by the customers, except to the extent of minimum guarantees made by the Company with respect to certain accounts. Separate account liabilities are not included in the above table as they are reported at contract value and not fair value in the Company’s Consolidated Statements of Financial Position.
|
|
(5)
|
Prior period amounts have been reclassified to conform to current period presentation. See Note 2 for details.
|
|
(6)
|
Other, for the periods ended
December 31, 2018
and
2017
, primarily represent deconsolidation of a VIE, reclassifications of certain assets between reporting categories and foreign currency translation.
|
|
(7)
|
Unrealized gains or losses related to assets still held at the end of the period do not include amortization or accretion of premiums and discounts.
|
|
(8)
|
Prior period amounts have been updated to conform to current period presentation.
|
216
Derivative Fair Value Information
The following tables present the balances of derivative assets and liabilities measured at fair value on a recurring basis, as of the date indicated, by primary underlying risk. These tables include NPR and exclude embedded derivatives and associated reinsurance recoverables. The derivative assets and liabilities shown below are included in “Other invested assets” or “Other liabilities” in the tables contained within the sections “—Assets and Liabilities by Hierarchy Level” and “—Changes in Level 3 Assets and Liabilities,” above.
|
|
As of December 31, 2018
|
|||||||||||||||||||
|
|
Level 1
|
Level 2
|
Level 3
|
Netting(1)
|
Total
|
|||||||||||||||
|
|
(in millions)
|
|||||||||||||||||||
|
Derivative assets:
|
||||||||||||||||||||
|
Interest Rate
|
$
|
23
|
|
$
|
6,341
|
|
$
|
2
|
|
$
|
$
|
6,366
|
|
|||||||
|
Currency
|
0
|
|
273
|
|
0
|
|
273
|
|
||||||||||||
|
Credit
|
0
|
|
33
|
|
0
|
|
33
|
|
||||||||||||
|
Currency/Interest Rate
|
0
|
|
2,292
|
|
0
|
|
2,292
|
|
||||||||||||
|
Equity
|
0
|
|
1,515
|
|
0
|
|
1,515
|
|
||||||||||||
|
Commodity
|
0
|
|
0
|
|
0
|
|
0
|
|
||||||||||||
|
Netting(1)
|
(9,331
|
)
|
(9,331
|
)
|
||||||||||||||||
|
Total derivative assets
|
$
|
23
|
|
$
|
10,454
|
|
$
|
2
|
|
$
|
(9,331
|
)
|
$
|
1,148
|
|
|||||
|
Derivative liabilities:
|
||||||||||||||||||||
|
Interest Rate
|
$
|
2
|
|
$
|
3,818
|
|
$
|
0
|
|
$
|
$
|
3,820
|
|
|||||||
|
Currency
|
0
|
|
140
|
|
0
|
|
140
|
|
||||||||||||
|
Credit
|
0
|
|
23
|
|
0
|
|
23
|
|
||||||||||||
|
Currency/Interest Rate
|
0
|
|
778
|
|
0
|
|
778
|
|
||||||||||||
|
Equity
|
7
|
|
640
|
|
0
|
|
647
|
|
||||||||||||
|
Commodity
|
0
|
|
0
|
|
0
|
|
0
|
|
||||||||||||
|
Netting(1)
|
(5,281
|
)
|
(5,281
|
)
|
||||||||||||||||
|
Total derivative liabilities
|
$
|
9
|
|
$
|
5,399
|
|
$
|
0
|
|
$
|
(5,281
|
)
|
$
|
127
|
|
|||||
217
|
|
As of December 31, 2017
|
|||||||||||||||||||
|
|
Level 1
|
Level 2
|
Level 3
|
Netting(1)
|
Total
|
|||||||||||||||
|
|
(in millions)
|
|||||||||||||||||||
|
Derivative assets:
|
||||||||||||||||||||
|
Interest Rate
|
$
|
25
|
|
$
|
8,399
|
|
$
|
0
|
|
$
|
$
|
8,424
|
|
|||||||
|
Currency
|
0
|
|
165
|
|
0
|
|
165
|
|
||||||||||||
|
Credit
|
0
|
|
21
|
|
0
|
|
21
|
|
||||||||||||
|
Currency/Interest Rate
|
0
|
|
1,588
|
|
0
|
|
1,588
|
|
||||||||||||
|
Equity
|
2
|
|
595
|
|
10
|
|
607
|
|
||||||||||||
|
Commodity
|
0
|
|
0
|
|
0
|
|
0
|
|
||||||||||||
|
Netting(1)
|
(9,600
|
)
|
(9,600
|
)
|
||||||||||||||||
|
Total derivative assets
|
$
|
27
|
|
$
|
10,768
|
|
$
|
10
|
|
$
|
(9,600
|
)
|
$
|
1,205
|
|
|||||
|
Derivative liabilities:
|
||||||||||||||||||||
|
Interest Rate
|
$
|
1
|
|
$
|
3,800
|
|
$
|
3
|
|
$
|
$
|
3,804
|
|
|||||||
|
Currency
|
0
|
|
262
|
|
0
|
|
262
|
|
||||||||||||
|
Credit
|
0
|
|
5
|
|
0
|
|
5
|
|
||||||||||||
|
Currency/Interest Rate
|
0
|
|
1,149
|
|
0
|
|
1,149
|
|
||||||||||||
|
Equity
|
2
|
|
733
|
|
0
|
|
735
|
|
||||||||||||
|
Commodity
|
0
|
|
0
|
|
0
|
|
0
|
|
||||||||||||
|
Netting(1)
|
(5,312
|
)
|
(5,312
|
)
|
||||||||||||||||
|
Total derivative liabilities
|
$
|
3
|
|
$
|
5,949
|
|
$
|
3
|
|
$
|
(5,312
|
)
|
$
|
643
|
|
|||||
__________
|
(1)
|
“Netting” amounts represent cash collateral and the impact of offsetting asset and liability positions held with the same counterparty, subject to master netting agreement.
|
Changes in Level 3 derivative assets and liabilities
—The following tables provide a summary of the changes in fair value of Level 3 derivative assets and liabilities as of the dates indicated, as well as the portion of gains or losses included in income attributable to unrealized gains or losses related to those assets and liabilities still held at the end of their respective periods.
|
Year Ended December 31, 2018
|
|||||||||||||||||||||||||||||||||
|
Fair Value, beginning of period
|
Total realized and unrealized gains (losses) (4)
|
Purchases
|
Sales
|
Issuances
|
Settlements
|
Other(1)
|
Transfers into
Level 3 (2) |
Transfers out of Level 3 (2)
|
Fair Value, end of period
|
Unrealized gains (losses) for assets still held (4)
|
|||||||||||||||||||||||
|
(in millions)
|
|||||||||||||||||||||||||||||||||
|
Net Derivative - Equity
|
$
|
10
|
|
$
|
1
|
|
$
|
0
|
|
$
|
0
|
|
$
|
0
|
|
$
|
0
|
|
$
|
(11
|
)
|
$
|
0
|
|
$
|
0
|
|
$
|
0
|
|
$
|
0
|
|
|
Net Derivative - Interest Rate
|
(3
|
)
|
5
|
|
0
|
|
0
|
|
0
|
|
0
|
|
0
|
|
0
|
|
0
|
|
2
|
|
5
|
|
|||||||||||
|
Year Ended December 31, 2017(5)
|
|||||||||||||||||||||||||||||||||
|
Fair Value, beginning of period
|
Total realized and unrealized gains (losses) (4)
|
Purchases
|
Sales
|
Issuances
|
Settlements
|
Other(3)
|
Transfers into
Level 3 (2) |
Transfers out of Level 3 (2)
|
Fair Value, end of period
|
Unrealized gains (losses) for assets still held (4)
|
|||||||||||||||||||||||
|
(in millions)
|
|||||||||||||||||||||||||||||||||
|
Net Derivative - Equity
|
$
|
0
|
|
$
|
0
|
|
$
|
0
|
|
$
|
0
|
|
$
|
0
|
|
$
|
0
|
|
$
|
10
|
|
$
|
0
|
|
$
|
0
|
|
$
|
10
|
|
$
|
0
|
|
|
Net Derivative - Interest Rate
|
4
|
|
(7
|
)
|
0
|
|
0
|
|
0
|
|
0
|
|
0
|
|
0
|
|
0
|
|
(3
|
)
|
(7
|
)
|
|||||||||||
218
|
Year Ended December 31, 2016(5)
|
|||||||||||||||||||||||||||||||||
|
Fair Value, beginning of period
|
Total realized and unrealized gains (losses) (4)
|
Purchases
|
Sales
|
Issuances
|
Settlements
|
Other(6)
|
Transfers into
Level 3 (2) |
Transfers out of Level 3 (2)
|
Fair Value, end of period
|
Unrealized gains (losses) for assets still held (4)
|
|||||||||||||||||||||||
|
(in millions)
|
|||||||||||||||||||||||||||||||||
|
Net Derivative - Equity
|
$
|
32
|
|
$
|
0
|
|
$
|
0
|
|
$
|
0
|
|
$
|
0
|
|
$
|
0
|
|
$
|
(32
|
)
|
$
|
0
|
|
$
|
0
|
|
$
|
0
|
|
$
|
0
|
|
|
Net Derivative - Interest Rate
|
5
|
|
(1
|
)
|
0
|
|
0
|
|
0
|
|
0
|
|
0
|
|
0
|
|
0
|
|
4
|
|
0
|
|
|||||||||||
__________
|
(1)
|
Represents conversion of warrants to equity shares.
|
|
(2)
|
Transfers into or out of Level 3 are generally reported at the value as of the beginning of the quarter in which the transfers occur for any such positions still held at the end of the quarter.
|
|
(3)
|
Related to warrants received in restructuring a certain asset that resulted in reclassification of reporting category.
|
|
(4)
|
Total realized and unrealized gains (losses) as well as unrealized gains (losses) for assets still held at the end of the period are recorded in “Realized investment gains (losses), net.”
|
|
(5)
|
Prior period amounts have been updated to conform to current period presentation.
|
|
(6)
|
Related to private warrants reclassified from derivatives to trading securities.
|
Nonrecurring Fair Value Measurements
—The following table represents information for assets measured at fair value on a nonrecurring basis. The fair value measurement is nonrecurring as these assets are measured at fair value only when there is a triggering event (e.g., an evidence of impairment). Assets included in the table are those that were impaired during the respective reporting periods and that are still held as of the reporting date. The estimated fair values for these amounts were determined using significant unobservable inputs (Level 3).
|
Year Ended December 31,
|
|||||||||||
|
2018
|
2017
|
2016
|
|||||||||
|
(in millions)
|
|||||||||||
|
Realized investment gains (losses) net:
|
|||||||||||
|
Commercial mortgage loans(1)
|
$
|
(12
|
)
|
$
|
(2
|
)
|
$
|
(5
|
)
|
||
|
Mortgage servicing rights(2)
|
$
|
10
|
|
$
|
7
|
|
$
|
(1
|
)
|
||
|
Cost method investments(3)
|
$
|
0
|
|
$
|
(29
|
)
|
$
|
(85
|
)
|
||
|
Year Ended December 31,
|
|||||||
|
2018
|
2017
|
||||||
|
(in millions)
|
|||||||
|
Carrying value after measurement as of period end
|
|||||||
|
Commercial mortgage loans(1):
|
$
|
47
|
|
$
|
64
|
|
|
|
Mortgage servicing rights(2):
|
$
|
73
|
|
$
|
60
|
|
|
|
Cost method investments(3):
|
$
|
0
|
|
$
|
150
|
|
|
__________
|
(1)
|
Commercial mortgage loans are valued based on discounted cash flows utilizing market rates or the fair value of the underlying real estate collateral.
|
|
(2)
|
Mortgage servicing rights are valued using a discounted cash flow model. The model incorporates assumptions for servicing revenues, which are adjusted for expected prepayments, delinquency rates, escrow deposit income and estimated loan servicing expenses. The discount rates incorporated into the model are determined based on the estimated returns a market participant would require for this business plus a liquidity and risk premium. This estimate includes available relevant data from any active market sales of mortgage servicing rights.
|
|
(3)
|
Due to the adoption of ASU 2016-01 effective January 1, 2018, LPs/LLCs (formerly accounted for under the cost method) are carried at fair value at each reporting date with changes in fair value reported in “Other income (loss).” Therefore, these assets are no longer reported in this table because they are no longer carried at fair value on a non-recurring basis.
|
Fair Value Option
219
The fair value option allows the Company to elect fair value as an alternative measurement for selected financial assets and financial liabilities not otherwise reported at fair value. Such elections have been made by the Company to help mitigate volatility in earnings that result from different measurement attributes. Electing the fair value option also allows the Company to achieve consistent accounting for certain assets and liabilities. Changes in fair value are reflected in “Realized investment gains (losses), net” for commercial mortgage and other loans and “Other income (loss)” for other invested assets and notes issued by consolidated VIEs. Changes in fair value due to instrument-specific credit risk are estimated using changes in credit spreads and quality ratings for the period reported. Interest income on commercial mortgage and other loans is included in “Net investment income.” Interest income on these loans is recorded based on the effective interest rates as determined at the closing of the loan.
The following tables present information regarding assets and liabilities where the fair value option has been elected.
|
|
Year Ended December 31,
|
||||||||||
|
|
2018
|
2017
|
2016
|
||||||||
|
|
(in millions)
|
||||||||||
|
Assets:
|
|||||||||||
|
Other invested assets(2):
|
|||||||||||
|
Changes in fair value
|
$
|
0
|
|
$
|
147
|
|
$
|
58
|
|
||
|
Liabilities:
|
|||||||||||
|
Notes issued by consolidated VIEs:
|
|||||||||||
|
Changes in fair value
|
$
|
(14
|
)
|
$
|
4
|
|
$
|
37
|
|
||
|
|
Year Ended December 31,
|
||||||||||
|
|
2018
|
2017
|
2016
|
||||||||
|
|
(in millions)
|
||||||||||
|
Commercial mortgage and other loans:
|
|||||||||||
|
Interest income
|
$
|
18
|
|
$
|
13
|
|
$
|
10
|
|
||
|
Notes issued by consolidated VIEs:
|
|||||||||||
|
Interest expense
|
$
|
36
|
|
$
|
75
|
|
$
|
120
|
|
||
|
|
Year Ended December 31,
|
||||||
|
|
2018
|
2017
|
|||||
|
|
(in millions)
|
||||||
|
Commercial mortgage and other loans(1):
|
|||||||
|
Fair value as of period end
|
$
|
763
|
|
$
|
593
|
|
|
|
Aggregate contractual principal as of period end
|
$
|
754
|
|
$
|
582
|
|
|
|
Other invested assets(2):
|
|||||||
|
Fair value as of period end
|
$
|
0
|
|
$
|
1,945
|
|
|
|
Other assets:
|
|||||||
|
Fair value as of period end
|
10
|
|
0
|
|
|||
|
Notes issued by consolidated VIEs:
|
|||||||
|
Fair value as of period end
|
$
|
595
|
|
$
|
1,196
|
|
|
|
Aggregate contractual principal as of period end
|
$
|
632
|
|
$
|
1,233
|
|
|
__________
|
(1)
|
As of
December 31, 2018
, for loans for which the fair value option has been elected, there were
no
loans in non-accrual status and
none
of the loans were more than 90 days past due and still accruing.
|
|
(2)
|
Effective January 1, 2018,
LPs/LLCs are reported at fair value due to adoption of ASU 2016-01, which in prior period were reported at fair value option. See Note 2 for details.
|
Fair Value of Financial Instruments
220
The table below presents the carrying amount and fair value by fair value hierarchy level of certain financial instruments that are not reported at fair value. The financial instruments presented below are reported at carrying value on the Company’s Consolidated Statements of Financial Position. In some cases, as described below, the carrying amount equals or approximates fair value.
|
|
December 31, 2018(1)
|
||||||||||||||||||
|
|
Fair Value
|
Carrying
Amount(2)
|
|||||||||||||||||
|
|
Level 1
|
Level 2
|
Level 3
|
Total
|
Total
|
||||||||||||||
|
|
(in millions)
|
||||||||||||||||||
|
Assets:
|
|||||||||||||||||||
|
Fixed maturities, held-to-maturity(3)
|
$
|
0
|
|
$
|
1,468
|
|
$
|
904
|
|
$
|
2,372
|
|
$
|
2,013
|
|
||||
|
Assets supporting experience-rated contractholder liabilities
|
0
|
|
0
|
|
0
|
|
0
|
|
0
|
|
|||||||||
|
Commercial mortgage and other loans
|
0
|
|
109
|
|
59,106
|
|
59,215
|
|
59,067
|
|
|||||||||
|
Policy loans
|
0
|
|
0
|
|
12,016
|
|
12,016
|
|
12,016
|
|
|||||||||
|
Other invested assets
|
0
|
|
40
|
|
0
|
|
40
|
|
40
|
|
|||||||||
|
Short-term investments
|
951
|
|
25
|
|
0
|
|
976
|
|
976
|
|
|||||||||
|
Cash and cash equivalents
|
4,871
|
|
1,004
|
|
0
|
|
5,875
|
|
5,875
|
|
|||||||||
|
Accrued investment income
|
0
|
|
3,318
|
|
0
|
|
3,318
|
|
3,318
|
|
|||||||||
|
Other assets
|
141
|
|
2,189
|
|
483
|
|
2,813
|
|
2,813
|
|
|||||||||
|
Total assets
|
$
|
5,963
|
|
$
|
8,153
|
|
$
|
72,509
|
|
$
|
86,625
|
|
$
|
86,118
|
|
||||
|
Liabilities:
|
|||||||||||||||||||
|
Policyholders’ account balances—investment contracts
|
$
|
0
|
|
$
|
31,422
|
|
$
|
67,006
|
|
$
|
98,428
|
|
$
|
99,829
|
|
||||
|
Securities sold under agreements to repurchase
|
0
|
|
9,950
|
|
0
|
|
9,950
|
|
9,950
|
|
|||||||||
|
Cash collateral for loaned securities
|
0
|
|
3,929
|
|
0
|
|
3,929
|
|
3,929
|
|
|||||||||
|
Short-term debt
|
0
|
|
1,854
|
|
658
|
|
2,512
|
|
2,451
|
|
|||||||||
|
Long-term debt(5)
|
1,734
|
|
15,057
|
|
1,181
|
|
17,972
|
|
17,378
|
|
|||||||||
|
Notes issued by consolidated VIEs
|
0
|
|
0
|
|
360
|
|
360
|
|
360
|
|
|||||||||
|
Other liabilities
|
0
|
|
6,338
|
|
510
|
|
6,848
|
|
6,848
|
|
|||||||||
|
Separate account liabilities—investment contracts
|
0
|
|
66,914
|
|
26,022
|
|
92,936
|
|
92,936
|
|
|||||||||
|
Total liabilities
|
$
|
1,734
|
|
$
|
135,464
|
|
$
|
95,737
|
|
$
|
232,935
|
|
$
|
233,681
|
|
||||
221
|
|
December 31, 2017(1)
|
||||||||||||||||||
|
|
Fair Value
|
Carrying
Amount(2)
|
|||||||||||||||||
|
|
Level 1
|
Level 2
|
Level 3
|
Total
|
Total
|
||||||||||||||
|
|
(in millions)
|
||||||||||||||||||
|
Assets:
|
|||||||||||||||||||
|
Fixed maturities, held-to-maturity(3)
|
$
|
0
|
|
$
|
1,484
|
|
$
|
946
|
|
$
|
2,430
|
|
$
|
2,049
|
|
||||
|
Assets supporting experience-rated contractholder liabilities(4)
|
58
|
|
51
|
|
0
|
|
109
|
|
109
|
|
|||||||||
|
Commercial mortgage and other loans
|
0
|
|
129
|
|
56,619
|
|
56,748
|
|
55,452
|
|
|||||||||
|
Policy loans
|
1
|
|
0
|
|
11,890
|
|
11,891
|
|
11,891
|
|
|||||||||
|
Short-term investments
|
989
|
|
22
|
|
0
|
|
1,011
|
|
1,011
|
|
|||||||||
|
Cash and cash equivalents
|
5,997
|
|
195
|
|
0
|
|
6,192
|
|
6,192
|
|
|||||||||
|
Accrued investment income
|
0
|
|
3,325
|
|
0
|
|
3,325
|
|
3,325
|
|
|||||||||
|
Other assets
|
45
|
|
2,385
|
|
685
|
|
3,115
|
|
3,115
|
|
|||||||||
|
Total assets
|
$
|
7,090
|
|
$
|
7,591
|
|
$
|
70,140
|
|
$
|
84,821
|
|
$
|
83,144
|
|
||||
|
Liabilities:
|
|||||||||||||||||||
|
Policyholders’ account balances—investment contracts
|
$
|
0
|
|
$
|
33,045
|
|
$
|
67,141
|
|
$
|
100,186
|
|
$
|
99,948
|
|
||||
|
Securities sold under agreements to repurchase
|
0
|
|
8,400
|
|
0
|
|
8,400
|
|
8,400
|
|
|||||||||
|
Cash collateral for loaned securities
|
0
|
|
4,354
|
|
0
|
|
4,354
|
|
4,354
|
|
|||||||||
|
Short-term debt
|
0
|
|
1,384
|
|
0
|
|
1,384
|
|
1,380
|
|
|||||||||
|
Long-term debt(5)
|
1,296
|
|
16,369
|
|
2,095
|
|
19,760
|
|
17,172
|
|
|||||||||
|
Notes issued by consolidated VIEs
|
0
|
|
0
|
|
322
|
|
322
|
|
322
|
|
|||||||||
|
Other liabilities
|
0
|
|
6,002
|
|
715
|
|
6,717
|
|
6,717
|
|
|||||||||
|
Separate account liabilities—investment contracts
|
0
|
|
71,336
|
|
30,490
|
|
101,826
|
|
101,826
|
|
|||||||||
|
Total liabilities
|
$
|
1,296
|
|
$
|
140,890
|
|
$
|
100,763
|
|
$
|
242,949
|
|
$
|
240,119
|
|
||||
__________
|
(1)
|
The information presented as of
December 31, 2017
, excludes certain hedge funds, private equity funds and other funds that were accounted for using the cost method and for which the fair value was measured at NAV per share (or its equivalent) as a practical expedient. The fair value and the carrying value of these cost method investments were
$1,795 million
and
$1,571 million
, respectively. Due to the adoption of ASU 2016-01 effective January 1, 2018, these assets are carried at fair value at each reporting date with changes in fair value reported in “Other income (loss).” Therefore, as of
December 31, 2018
, these assets are excluded from this table but are reported in the fair value recurring measurement table.
|
|
(2)
|
Carrying values presented herein differ from those in the Company’s Consolidated Statements of Financial Position because certain items within the respective financial statement captions are not considered financial instruments or out of scope under authoritative guidance relating to disclosures of the fair value of financial instruments.
|
|
(3)
|
Excludes notes with fair value of
$4,879 million
(carrying amount of
$4,879 million
) and
$4,913 million
(carrying amount of
$4,627 million
) as of both
December 31, 2018
and
2017
, respectively, which have been offset with the associated payables under a netting agreement.
|
|
(4)
|
Prior period amounts have been reclassified to conform to current period presentation. See Note 2 for details.
|
|
(5)
|
Includes notes with fair value of
$9,095 million
(carrying amount of
$9,095 million
) and
$7,577 million
(carrying amount of
$7,287 million
) as of both
December 31, 2018
and
2017
, respectively, which have been offset with the associated receivables under a netting agreement.
|
The fair values presented above have been determined by using available market information and by applying market valuation methodologies, as described in more detail below.
Fixed Maturities, Held-to-Maturity
The fair values of public fixed maturity securities are generally based on prices from third-party pricing services, which are reviewed for reasonableness; however, for certain public fixed maturity securities and investments in private placement fixed maturity securities, this information is either not available or not reliable. For these public fixed maturity securities, the fair value is based on indicative broker quotes, if available, or determined using a discounted cash flow model or other internally-developed models. For private fixed maturities, fair value is determined using a discounted cash flow model. In determining the fair value of certain fixed maturity securities, the discounted cash flow model may also use unobservable inputs, which reflect the Company’s own assumptions about the inputs market participants would use in pricing the security.
Commercial Mortgage and Other Loans
222
The fair value of most commercial mortgage loans is based upon the present value of the expected future cash flows discounted at the appropriate U.S. Treasury rate or foreign government bond rate (for non-U.S. dollar-denominated loans) plus an appropriate credit spread for loans of similar quality, average life and currency. The quality ratings for these loans, a primary determinant of the credit spreads and a significant component of the pricing process, are based on an internally-developed methodology. Certain commercial mortgage loans are valued incorporating other factors, including the terms of the loans, the principal exit strategies for the loans, prevailing interest rates and credit risk.
Policy Loans
The Company’s valuation technique for policy loans is to discount cash flows at the current policy loan coupon rate. Policy loans are fully collateralized by the cash surrender value of underlying insurance policies. As a result, the carrying value of the policy loans approximates the fair value.
Short-Term Investments, Cash and Cash Equivalents, Accrued Investment Income and Other Assets
The Company believes that due to the short-term nature of certain assets, the carrying value approximates fair value. These assets include: certain short-term investments, which are not securities, recorded at amortized cost and include quality loans; cash and cash equivalent instruments; accrued investment income; and other assets that meet the definition of financial instruments, including receivables, such as reinsurance recoverables, unsettled trades, accounts receivable and restricted cash.
Policyholders’ Account Balances—Investment Contracts
Only the portion of policyholders’ account balances related to products that are investment contracts (those without significant mortality or morbidity risk) are reflected in the table above. For fixed deferred annuities, single premium endowments, payout annuities and other similar contracts without life contingencies, fair values are generally derived using discounted projected cash flows based on interest rates that are representative of the Company’s financial strength ratings, and hence reflect the Company’s NPR. For GICs, funding agreements, structured settlements without life contingencies and other similar products, fair values are generally derived using discounted projected cash flows based on interest rates being offered for similar contracts with maturities consistent with those of the contracts being valued. For those balances that can be withdrawn by the customer at any time without prior notice or penalty, the fair value is the amount estimated to be payable to the customer as of the reporting date, which is generally the carrying value. For defined contribution and defined benefit contracts and certain other products, the fair value is the market value of the assets supporting the liabilities.
Securities Sold Under Agreements to Repurchase
The Company receives collateral for selling securities under agreements to repurchase, or pledges collateral under agreements to resell. Repurchase and resale agreements are also generally short-term in nature and, therefore, the carrying amounts of these instruments approximate fair value.
Cash Collateral for Loaned Securities
Cash collateral for loaned securities represents the collateral received or paid in connection with loaning or borrowing securities, similar to the securities sold under agreement to repurchase above. Due to the short-term nature of these transactions, the carrying value approximates fair value.
Debt
The fair value of short-term and long-term debt, as well as notes issued by consolidated VIEs, is generally determined by either prices obtained from independent pricing services, which are validated by the Company, or discounted cash flow models. With the exception of the notes issued by consolidated VIEs for which recourse is limited to the assets of the respective VIE and does not extend to the general credit of the Company, the fair values of these instruments consider the Company’s NPR. Discounted cash flow models predominately use market observable inputs such as the borrowing rates currently available to the Company for debt and financial instruments with similar terms and remaining maturities. For commercial paper issuances and other debt with a maturity of less than 90 days, the carrying value approximates fair value.
Other Liabilities
223
Other liabilities are primarily payables, such as reinsurance payables, unsettled trades, drafts and accrued expense payables. Due to the short-term until settlement of most of these liabilities, the Company believes that carrying value approximates fair value.
Separate Account Liabilities—Investment Contracts
Only the portion of separate account liabilities related to products that are investment contracts are reflected in the table above. Separate account liabilities are recorded at the amount credited to the contractholder, which reflects the change in fair value of the corresponding separate account assets including contractholder deposits less withdrawals and fees; therefore, carrying value approximates fair value.
|
7.
|
DEFERRED POLICY ACQUISITION COSTS
|
The balances of and changes in DAC as of and for the years ended December 31, are as follows:
|
2018
|
2017
|
2016
|
|||||||||
|
|
(in millions)
|
||||||||||
|
Balance, beginning of year
|
$
|
18,992
|
|
$
|
17,661
|
|
$
|
16,718
|
|
||
|
Capitalization of commissions, sales and issue expenses
|
2,870
|
|
2,820
|
|
2,845
|
|
|||||
|
Amortization—Impact of assumption and experience unlocking and true-ups
|
(217
|
)
|
247
|
|
445
|
|
|||||
|
Amortization—All other
|
(2,056
|
)
|
(1,827
|
)
|
(2,322
|
)
|
|||||
|
Change in unrealized investment gains and losses
|
519
|
|
(190
|
)
|
(199
|
)
|
|||||
|
Foreign currency translation
|
(32
|
)
|
281
|
|
174
|
|
|||||
|
Other(1)
|
(18
|
)
|
0
|
|
0
|
|
|||||
|
Balance, end of year
|
$
|
20,058
|
|
$
|
18,992
|
|
$
|
17,661
|
|
||
__________
|
(1)
|
Represents the sale of our Pramerica of Poland subsidiary of
$(38) million
and the impact of the elimination of Gibraltar Life’s one-month reporting lag of
$20 million
.
|
|
8.
|
VALUE OF BUSINESS ACQUIRED
|
The balances of and changes in VOBA as of and for the years ended December 31, are as follows:
|
2018
|
2017
|
2016
|
|||||||||
|
|
(in millions)
|
||||||||||
|
Balance, beginning of year
|
$
|
1,591
|
|
$
|
2,314
|
|
$
|
2,828
|
|
||
|
Amortization—Impact of assumption and experience unlocking and true-ups
|
0
|
|
(56
|
)
|
(246
|
)
|
|||||
|
Amortization—All other
|
(276
|
)
|
(311
|
)
|
(351
|
)
|
|||||
|
Change in unrealized investment gains and losses
|
455
|
|
(456
|
)
|
(112
|
)
|
|||||
|
Interest
|
69
|
|
75
|
|
81
|
|
|||||
|
Foreign currency translation
|
23
|
|
25
|
|
114
|
|
|||||
|
Other(1)
|
(12
|
)
|
0
|
|
0
|
|
|||||
|
Balance, end of year
|
$
|
1,850
|
|
$
|
1,591
|
|
$
|
2,314
|
|
||
__________
|
(1)
|
Represents the impact of the elimination of Gibraltar Life’s one-month reporting lag.
|
The following table provides VOBA balances and the weighted average remaining expected life for the year ended
December 31, 2018
.
224
|
VOBA
Balance
|
Weighted Average Remaining Expected Life in Years
|
||||
|
($ in millions)
|
|||||
|
CIGNA
|
$
|
238
|
|
12
|
|
|
Prudential Annuities Holding Co.
|
$
|
36
|
|
6
|
|
|
Gibraltar Life
|
$
|
1,071
|
|
9
|
|
|
Aoba Life
|
$
|
0
|
|
7
|
|
|
The Hartford Life Business
|
$
|
500
|
|
11
|
|
|
Gibraltar BSN Life Berhad
|
$
|
5
|
|
7
|
|
The following table provides the interest accrual rates varying by acquisition for the years ended December 31.
|
2018
|
2017
|
2016
|
|||||||||
|
CIGNA
|
6.40%
|
6.40%
|
6.40%
|
||||||||
|
Prudential Annuities Holding Co.
|
5.96%
|
5.96%
|
6.00%
|
||||||||
|
Gibraltar Life
|
1.28%
|
to
|
2.87%
|
1.28%
|
to
|
2.87%
|
1.28%
|
to
|
2.87%
|
||
|
Aoba Life
|
2.60%
|
2.60%
|
2.60%
|
||||||||
|
The Hartford Life Business
|
3.00%
|
to
|
6.17%
|
3.00%
|
to
|
6.17%
|
3.00%
|
to
|
6.17%
|
||
|
Gibraltar BSN Life Berhad
|
4.07%
|
to
|
5.51%
|
4.07%
|
to
|
5.51%
|
4.07%
|
to
|
5.51%
|
||
The following table provides estimated future amortization, net of interest, for the periods indicated.
|
2019
|
2020
|
2021
|
2022
|
2023
|
|||||||||||||||
|
|
(in millions)
|
||||||||||||||||||
|
Estimated future VOBA amortization
|
$
|
182
|
|
$
|
164
|
|
$
|
150
|
|
$
|
134
|
|
$
|
119
|
|
||||
|
9.
|
INVESTMENTS IN OPERATING JOINT VENTURES
|
The Company has made investments in certain joint ventures that are strategic in nature and made other than for the sole purpose of generating investment income. These investments are accounted for under the equity method of accounting and are included in “Other assets” in the Company’s Consolidated Statements of Financial Position. The earnings from these investments are included on an after-tax basis in “Equity in earnings of operating joint ventures, net of taxes” in the Company’s Consolidated Statements of Operations. The Company has made these investments through its PGIM and International Insurance segments, and its Corporate and Other operations. The summarized financial information for the Company’s operating joint ventures has been included in the summarized combined financial information for all significant equity method investments shown in Note 3.
The following table sets forth information related to the Company’s investments in operating joint ventures as of, and for, the years ended December 31:
|
2018
|
2017
|
2016
|
||||||||||
|
|
(in millions)
|
|||||||||||
|
Investment in operating joint ventures
|
$
|
1,329
|
|
$
|
1,483
|
|
$
|
994
|
|
|||
|
Dividends received from operating joint ventures
|
$
|
93
|
|
$
|
63
|
|
$
|
60
|
|
|||
|
After-tax equity in earnings of operating joint ventures
|
$
|
76
|
|
$
|
49
|
|
$
|
49
|
|
|||
The increase in investment in operating joint ventures for 2017, compared to 2016, primarily reflects the impact of the Company’s investments in Enterprise Group Limited in Ghana and CT Corp in Indonesia.
For the years ended December 31,
2018
,
2017
and
2016
, the Company recognized
$32 million
,
$36 million
and
$32 million
, respectively, of asset management fee income for services the Company provided to these operating joint ventures.
225
Acquisition of Deutsche Bank’s India Asset Management Business
In March 2016, the Company and Dewan Housing Finance Corporation Limited (“DHFL”), its asset management joint venture partner in India, acquired Deutsche Bank’s India asset management business through the joint venture DHFL Pramerica Asset Managers (“DPAM”). This acquisition did not have a material impact on the Company’s financial results. In the fourth quarter of 2018, the Company reached a preliminary agreement to acquire DHFL’s stake in DPAM. Upon close of the transaction, DPAM will become a wholly-owned business with no change to the scope of its business. The transaction, which is subject to signing of definitive documentation, customary closing conditions and regulatory and other approvals, is currently expected to close during the first half of 2019.
Acquisition of Administradora de Fondos de Pensiones Habitat S.A.
In March 2016, the Company completed the purchase of an indirect
40%
ownership interest in Administradora de Fondos de Pensiones Habitat S.A. (“AFP Habitat”), a leading provider of retirement services in Chile, from Inversiones La Construcción S.A. (“ILC”), the investment subsidiary of the Chilean Construction Chamber. The Company paid
899.90
Chilean pesos per share, for a total purchase price of approximately
$532 million
based on exchange rates at the share acquisition date. The Company and ILC now equally own an indirect controlling stake in AFP Habitat through a joint holding company. The Company’s investment is accounted for under the equity method and is recorded within “Other assets.” This acquisition enables the Company to participate in the growing Chilean pension market.
|
10.
|
GOODWILL AND OTHER INTANGIBLES
|
The changes in the carrying value of goodwill by reportable segment are as follows:
|
Retirement
|
PGIM
|
International
Insurance
|
Other
|
Total
|
|||||||||||||||
|
|
(in millions)
|
||||||||||||||||||
|
Goodwill balance, December 31, 2015:
|
$
|
444
|
|
$
|
231
|
|
$
|
149
|
|
$
|
0
|
|
$
|
824
|
|
||||
|
Effect of foreign currency translation
|
0
|
|
(1
|
)
|
10
|
|
0
|
|
9
|
|
|||||||||
|
Goodwill balance, December 31, 2016:
|
444
|
|
230
|
|
159
|
|
0
|
|
833
|
|
|||||||||
|
Effect of foreign currency translation
|
0
|
|
5
|
|
5
|
|
0
|
|
10
|
|
|||||||||
|
Goodwill balance, December 31, 2017:
|
444
|
|
235
|
|
164
|
|
0
|
|
843
|
|
|||||||||
|
Acquisitions
|
11
|
|
0
|
|
0
|
|
11
|
|
22
|
|
|||||||||
|
Effect of foreign currency translation
|
0
|
|
(2
|
)
|
0
|
|
0
|
|
(2
|
)
|
|||||||||
|
Goodwill balance, December 31, 2018:
|
$
|
455
|
|
$
|
233
|
|
$
|
164
|
|
$
|
11
|
|
$
|
863
|
|
||||
The Company tests goodwill for impairment annually as of December 31 and more frequently if an event occurs or circumstances change that would more likely than not reduce the fair value of a reporting unit below its carrying amount, as discussed in further detail in Note 2. The Company performed goodwill impairment testing using the quantitative two-step approach for all reporting units that had goodwill at December 31,
2018
and
2017
. There are no impairments or accumulated impairment losses recorded in the periods presented above for goodwill.
Other Intangibles
Other intangible balances at December 31, are as follows:
|
|
2018
|
2017
|
|||||||||||||||||||||
|
|
Gross Carrying Amount
|
Accumulated
Amortization
|
Net Carrying Amount
|
Gross Carrying Amount
|
Accumulated
Amortization
|
Net Carrying Amount
|
|||||||||||||||||
|
|
(in millions)
|
||||||||||||||||||||||
|
Subject to amortization:
|
|||||||||||||||||||||||
|
Mortgage servicing rights
|
$
|
689
|
|
$
|
(423
|
)
|
$
|
266
|
|
$
|
623
|
|
$
|
(382
|
)
|
$
|
241
|
|
|||||
|
Customer relationships
|
173
|
|
(120
|
)
|
53
|
|
174
|
|
(116
|
)
|
58
|
|
|||||||||||
|
Other
|
114
|
|
(87
|
)
|
27
|
|
149
|
|
(109
|
)
|
40
|
|
|||||||||||
|
Not subject to amortization
|
2
|
|
N/A
|
|
2
|
|
3
|
|
N/A
|
|
3
|
|
|||||||||||
|
Total
|
$
|
348
|
|
$
|
342
|
|
|||||||||||||||||
226
The fair values of net mortgage servicing rights were
$295 million
and
$256 million
at December 31,
2018
and
2017
, respectively. Amortization expense for other intangibles was
$61 million
,
$51 million
and
$116 million
for the years ending December 31,
2018
,
2017
and
2016
, respectively. Amortization expense for other intangibles is expected to be approximately
$49 million
in
2019
,
$46 million
in
2020
,
$41 million
in
2021
,
$37 million
in
2022
and
$33 million
in
2023
. The amortization expense amounts listed above for
2018
,
2017
and
2016
do not include impairments recorded for mortgage servicing rights or other intangibles. See the nonrecurring fair value measurements section of Note 6 for more information regarding these impairments.
|
11.
|
POLICYHOLDERS’ LIABILITIES
|
Future Policy Benefits
Future policy benefits at December 31 for the years indicated are as follows:
|
2018
|
2017
|
||||||
|
|
(in millions)
|
||||||
|
Life insurance
|
$
|
180,749
|
|
$
|
172,586
|
|
|
|
Individual and group annuities and supplementary contracts
|
72,624
|
|
67,090
|
|
|||
|
Other contract liabilities
|
17,665
|
|
14,849
|
|
|||
|
Subtotal future policy benefits excluding unpaid claims and claim settlement expenses
|
271,038
|
|
254,525
|
|
|||
|
Unpaid claims and claim settlement expenses
|
2,808
|
|
2,792
|
|
|||
|
Total future policy benefits
|
$
|
273,846
|
|
$
|
257,317
|
|
|
Life insurance liabilities include reserves for death and endowment policy benefits, terminal dividends and certain health benefits. Individual and group annuities and supplementary contracts liabilities include reserves for life contingent immediate annuities and life contingent group annuities. Other contract liabilities include unearned premiums and certain other reserves for group, annuities and individual life and health products.
Future policy benefits for individual participating traditional life insurance are based on the net level premium method, calculated using the guaranteed mortality and nonforfeiture interest rates which range from
2.5%
to
7.5%
. Participating insurance represented
2%
and
3%
of direct individual life insurance in force at December 31,
2018
and
2017
, respectively, and
12%
,
14%
and
14%
of direct individual life insurance premiums for
2018
,
2017
and
2016
, respectively.
Future policy benefits for individual non-participating traditional life insurance policies, group and individual long-term care policies and individual health insurance policies are generally equal to the present value of future benefit payments and related expenses, less the present value of future net premiums. Assumptions as to mortality, morbidity and persistency are based on the Company’s experience, industry data, and/or other factors, when the basis of the reserve is established. Interest rates used in the determination of the present values range from
0.1%
to
9.5%
; less than
1%
of the reserves are based on an interest rate in excess of 8%.
Future policy benefits for individual and group annuities and supplementary contracts with life contingencies are generally equal to the present value of expected future payments. Assumptions as to mortality are based on the Company’s experience, industry data, and/or other factors, when the basis of the reserve is established. The interest rates used in the determination of the present values range from
(0.1)%
to
11.3%
; less than
1%
of the reserves are based on an interest rate in excess of 8%.
Future policy benefits for other contract liabilities are generally equal to the present value of expected future payments based on the Company’s experience, except for example, certain group insurance coverages for which future policy benefits are equal to gross unearned premium reserves. The interest rates used in the determination of the present values range from
1.0%
to
7.3%
.
The Company’s liability for future policy benefits is also inclusive of liabilities for guaranteed benefits related to certain long-duration life and annuity contracts. Liabilities for guaranteed benefits with embedded derivative features are primarily in “other contract liabilities” in the table above. The remaining liabilities for guaranteed benefits are primarily reflected with the underlying contract. See Note 12 for additional information regarding liabilities for guaranteed benefits related to certain long-duration life and annuity contracts.
227
Premium deficiency reserves included in “Future policy benefits” are established, if necessary, when the liability for future policy benefits plus the present value of expected future gross premiums are determined to be insufficient to provide for expected future policy benefits and expenses. Additionally, in certain instances the policyholder liability for a particular line of business may not be deficient in the aggregate to trigger loss recognition, but the pattern of earnings may be such that profits are expected to be recognized in earlier years followed by losses in later years. In these situations, accounting standards require that an additional PFL liability be recognized by an amount necessary to sufficiently offset the losses that would be recognized in later years. Premium deficiency reserves have been recorded for the group single premium annuity business, which consists of limited-payment, long-duration traditional, non-participating annuities; structured settlements; single premium immediate annuities with life contingencies; long-term care; certain individual health policies; and certain interest-sensitive life products.
Unpaid claims and claim settlement expenses primarily reflect the Company’s estimate of future disability claim payments and expenses as well as estimates of claims incurred but not yet reported as of the balance sheet date related to group disability products. Unpaid claim liabilities that are discounted use interest rates ranging from
2.6%
to
6.4%
.
Policyholders’ Account Balances
Policyholders’ account balances at December 31 for the years indicated are as follows:
|
2018
|
2017
|
||||||
|
|
(in millions)
|
||||||
|
Individual annuities
|
$
|
43,309
|
|
$
|
41,449
|
|
|
|
Group annuities
|
27,618
|
|
28,152
|
|
|||
|
Guaranteed investment contracts and guaranteed interest accounts
|
13,558
|
|
14,002
|
|
|||
|
Funding agreements
|
3,785
|
|
4,631
|
|
|||
|
Interest-sensitive life contracts
|
39,228
|
|
36,879
|
|
|||
|
Dividend accumulation and other
|
22,840
|
|
23,076
|
|
|||
|
Total policyholders’ account balances
|
$
|
150,338
|
|
$
|
148,189
|
|
|
Policyholders’ account balances primarily represent an accumulation of account deposits plus credited interest less withdrawals, expense charges and mortality charges, if applicable. These policyholders’ account balances also include provisions for benefits under non-life contingent payout annuities. Included in “Funding agreements” at December 31,
2018
and
2017
are
$3,755 million
and
$4,165 million
, respectively, related to the Company’s Funding Agreement Notes Issuance Program (“FANIP”). Under this program, which has a maximum authorized amount of
$15 billion
of medium-term notes and
$3 billion
of commercial paper, Delaware statutory trusts issue short-term commercial paper and/or medium-term notes to investors that are secured by funding agreements issued to the trusts by Prudential Insurance. The outstanding commercial paper and notes have fixed or floating interest rates that range from
0.0%
to
3.5%
and original maturities ranging from
two months
to
five years
. Included in the amounts at December 31,
2018
and
2017
is the medium-term note liability, which is carried at amortized cost, of
$2,764 million
and
$3,211 million
, respectively and short-term note liability of
$997
million and
$957
million, respectively.
Also included in “Funding agreements” are collateralized funding agreements issued to the Federal Home Loan Bank of New York (“FHLBNY”), which at December 31,
2018
and
2017
totaled
$0
and
$436 million
, respectively. These obligations, which are carried at amortized cost, have fixed or floating interest rates that range from
1.2%
to
2.1%
and original maturities ranging from
five
to
seven
years. For additional details on the FHLBNY program, see Note 16.
Interest crediting rates range from
0%
to
7.5%
for interest-sensitive life contracts and from
0%
to
13.3%
for contracts other than interest-sensitive life. Less than
1%
of policyholders’ account balances have interest crediting rates in excess of 8%.
228
|
12.
|
CERTAIN LONG-DURATION CONTRACTS WITH GUARANTEES
|
The Company issues variable annuity contracts through its separate accounts for which investment income and investment gains and losses accrue directly to, and investment risk is borne by, the contractholder. The Company also issues variable annuity contracts with general and separate account options where the Company contractually guarantees to the contractholder a return of no less than total deposits made to the contract adjusted for any partial withdrawals (“return of net deposits”). In certain of these variable annuity contracts, the Company also contractually guarantees to the contractholder a return of no less than (1) total deposits made to the contract adjusted for any partial withdrawals plus a minimum return (“minimum return”), and/or (2) the highest contract value on a specified date adjusted for any withdrawals (“contract value”). These guarantees include benefits that are payable in the event of death, annuitization or at specified dates during the accumulation period and withdrawal and income benefits payable during specified periods. The Company also issues annuity contracts with market value adjusted investment options (“MVAs”), which provide for a return of principal plus a fixed rate of return if held-to-maturity, or, alternatively, a “market adjusted value” if surrendered prior to maturity or if funds are reallocated to other investment options. The market value adjustment may result in a gain or loss to the Company, depending on crediting rates or an indexed rate at surrender, as applicable. The Company also issues fixed deferred and immediate annuity contracts, some without MVA, that have a guaranteed credited rate and annuity benefit.
In addition, the Company issues certain variable life, variable universal life and universal life contracts where the Company contractually guarantees to the contractholder a death benefit even when there is insufficient value to cover monthly mortality and expense charges, whereas otherwise the contract would typically lapse (“no-lapse guarantee”). Variable life and variable universal life contracts are offered with general and separate account options.
The assets supporting the variable portion of all variable annuities are carried at fair value and reported as “Separate account assets” with an equivalent amount reported as “Separate account liabilities.” Amounts assessed against the contractholders for mortality, administration, and other services are included within revenue in “Policy charges and fee income” and changes in liabilities for minimum guarantees are generally included in “Policyholders’ benefits” or “Realized investment gains (losses), net.”
For those guarantees of benefits that are payable in the event of death, the net amount at risk is generally defined as the current guaranteed minimum death benefit in excess of the current account balance at the balance sheet date. The Company’s primary risk exposures for these contracts relates to actual deviations from, or changes to, the assumptions used in the original pricing of these products, including fixed income and equity market returns, contract lapses and contractholder mortality.
For guarantees of benefits that are payable at annuitization, the net amount at risk is generally defined as the present value of the minimum guaranteed annuity payments available to the contractholder determined in accordance with the terms of the contract in excess of the current account balance. The Company’s primary risk exposures for these contracts relates to actual deviations from, or changes to, the assumptions used in the original pricing of these products, including fixed income and equity market returns, timing of annuitization, contract lapses and contractholder mortality.
For guarantees of benefits that are payable at withdrawal, the net amount at risk is generally defined as the present value of the minimum guaranteed withdrawal payments available to the contractholder determined in accordance with the terms of the contract in excess of the current account balance. For guarantees of accumulation balances, the net amount at risk is generally defined as the guaranteed minimum accumulation balance minus the current account balance. The Company’s primary risk exposures for these contracts relates to actual deviations from, or changes to, the assumptions used in the original pricing of these products, including equity market returns, interest rates, market volatility and contractholder behavior.
229
The Company’s contracts with guarantees may offer more than one type of guarantee in each contract; therefore, the amounts listed may not be mutually exclusive. The liabilities related to the net amount at risk are reflected within “Future policy benefits.” As of December 31,
2018
and
2017
, the Company had the following guarantees associated with these contracts, by product and guarantee type:
|
|
December 31, 2018
|
December 31, 2017
|
|||||||||||||
|
|
In the Event
of Death
|
At Annuitization /
Accumulation(1)
|
In the Event
of Death
|
At Annuitization /
Accumulation(1)
|
|||||||||||
|
|
($ in millions)
|
||||||||||||||
|
Annuity Contracts
|
|||||||||||||||
|
Return of net deposits
|
|||||||||||||||
|
Account value
|
$
|
115,988
|
|
$
|
21
|
|
$
|
129,231
|
|
$
|
100
|
|
|||
|
Net amount at risk
|
$
|
922
|
|
$
|
0
|
|
$
|
288
|
|
$
|
0
|
|
|||
|
Average attained age of contractholders
|
66 years
|
|
72 years
|
|
66 years
|
|
66 years
|
|
|||||||
|
Minimum return or contract value
|
|||||||||||||||
|
Account value
|
$
|
30,631
|
|
$
|
131,261
|
|
$
|
35,431
|
|
$
|
146,319
|
|
|||
|
Net amount at risk
|
$
|
5,066
|
|
$
|
8,235
|
|
$
|
2,611
|
|
$
|
3,762
|
|
|||
|
Average attained age of contractholders
|
68 years
|
|
67 years
|
|
68 years
|
|
66 years
|
|
|||||||
|
Average period remaining until earliest expected annuitization
|
N/A
|
|
0.10 years
|
|
N/A
|
|
0.24 years
|
|
|||||||
__________
|
(1)
|
Includes income and withdrawal benefits.
|
|
|
December 31,
|
||||||
|
|
2018
|
2017
|
|||||
|
|
In the Event of Death
|
||||||
|
|
($ in millions)
|
||||||
|
Variable Life, Variable Universal Life and Universal Life Contracts
|
|||||||
|
Separate account value
|
$
|
8,752
|
|
$
|
9,365
|
|
|
|
General account value
|
$
|
16,903
|
|
$
|
15,969
|
|
|
|
Net amount at risk
|
$
|
246,644
|
|
$
|
241,598
|
|
|
|
Average attained age of contractholders
|
55 years
|
|
55 years
|
|
|||
Account balances of variable annuity contracts with guarantees were invested in separate account investment options as follows:
|
|
December 31,
|
||||||
|
|
2018
|
2017
|
|||||
|
|
(in millions)
|
||||||
|
Equity funds
|
$
|
78,626
|
|
$
|
93,798
|
|
|
|
Bond funds
|
57,477
|
|
58,939
|
|
|||
|
Balanced funds
|
1,370
|
|
1,382
|
|
|||
|
Money market funds
|
3,122
|
|
4,391
|
|
|||
|
Total
|
$
|
140,595
|
|
$
|
158,510
|
|
|
In addition to the amounts invested in separate account investment options above,
$8,104 million
at December 31,
2018
, and
$8,308 million
at December 31,
2017
, of account balances of variable annuity contracts with guarantees, inclusive of contracts with MVA features, were invested in general account investment options. For the years ended December 31,
2018
,
2017
and
2016
, there were no transfers of assets, other than cash, from the general account to any separate account, and accordingly no gains or losses recorded.
230
Liabilities for Guarantee Benefits
The table below summarizes the changes in general account liabilities for guarantees. The liabilities for guaranteed GMDB, and guaranteed minimum income benefits (“GMIB”) are included in “Future policy benefits” and the related changes in the liabilities are included in “Policyholders’ benefits.” GMAB, GMWB and GMIWB are accounted for as embedded derivatives and are recorded at fair value within “Future policy benefits.” Changes in the fair value of these derivatives, including changes in the Company’s own risk of non-performance, along with any fees attributed or payments made relating to the derivative, are recorded in “Realized investment gains (losses), net.” See Note 6 for additional information regarding the methodology used in determining the fair value of these embedded derivatives. The Company maintains a portfolio of derivative investments that serve as a partial hedge of the risks associated with these products, for which the changes in fair value are also recorded in “Realized investment gains (losses), net.” This portfolio of derivative investments does not qualify for hedge accounting treatment under U.S. GAAP. Additionally, the Company externally reinsures the guaranteed benefit features associated with certain contracts. See Note 13 for further information regarding the external reinsurance arrangement.
|
|
GMDB
|
GMIB
|
GMAB/GMWB/GMIWB
|
||||||||||||
|
|
Variable Life,
Variable Universal Life
and Universal Life
|
Annuity
|
Annuity
|
Annuity
|
|||||||||||
|
|
(in millions)
|
||||||||||||||
|
Balance at December 31, 2015
|
$
|
3,150
|
|
$
|
714
|
|
$
|
440
|
|
$
|
8,433
|
|
|||
|
Incurred guarantee benefits(1)
|
927
|
|
98
|
|
(18
|
)
|
(194
|
)
|
|||||||
|
Paid guarantee benefits
|
(36
|
)
|
(91
|
)
|
(15
|
)
|
0
|
|
|||||||
|
Change in unrealized investment gains and losses
|
102
|
|
0
|
|
49
|
|
0
|
|
|||||||
|
Other(2)
|
0
|
|
0
|
|
18
|
|
(1
|
)
|
|||||||
|
Balance at December 31, 2016
|
4,143
|
|
721
|
|
474
|
|
8,238
|
|
|||||||
|
Incurred guarantee benefits(1)
|
685
|
|
37
|
|
(20
|
)
|
479
|
|
|||||||
|
Paid guarantee benefits
|
(15
|
)
|
(74
|
)
|
(15
|
)
|
0
|
|
|||||||
|
Change in unrealized investment gains and losses
|
290
|
|
13
|
|
(30
|
)
|
0
|
|
|||||||
|
Other(2)
|
7
|
|
0
|
|
10
|
|
4
|
|
|||||||
|
Balance at December 31, 2017
|
5,110
|
|
697
|
|
419
|
|
8,721
|
|
|||||||
|
Incurred guarantee benefits(1)
|
791
|
|
125
|
|
(14
|
)
|
206
|
|
|||||||
|
Paid guarantee benefits
|
(77
|
)
|
(88
|
)
|
(5
|
)
|
0
|
|
|||||||
|
Change in unrealized investment gains and losses
|
(406
|
)
|
(20
|
)
|
(20
|
)
|
0
|
|
|||||||
|
Other(2)
|
0
|
|
(1
|
)
|
(2
|
)
|
0
|
|
|||||||
|
Balance at December 31, 2018
|
$
|
5,418
|
|
$
|
713
|
|
$
|
378
|
|
$
|
8,927
|
|
|||
__________
|
(1)
|
Incurred guarantee benefits include the portion of assessments established as additions to reserves as well as changes in estimates affecting the reserves. Also includes changes in the fair value of features considered to be derivatives.
|
|
(2)
|
Other primarily represents foreign currency translation.
|
The GMDB liability is determined each period end by estimating the accumulated value of a portion of the total assessments to date less the accumulated value of the guaranteed death benefits in excess of the account balance. The GMIB liability associated with variable annuities is determined each period by estimating the accumulated value of a portion of the total assessments to date less the accumulated value of the projected income benefits in excess of the account balance. The portion of assessments used is chosen such that, at issue the present value of expected death benefits or expected income benefits in excess of the projected account balance and the portion of the present value of total expected assessments over the lifetime of the contracts are equal. The GMIB liability associated with fixed annuities is determined each period by estimating the present value of projected income benefits in excess of the account balance. The Company regularly evaluates the estimates used and adjusts the GMDB and GMIB liability balances, with an associated charge or credit to earnings, if actual experience or other evidence suggests that earlier estimates should be revised.
The GMAB features provide the contractholder with a guaranteed return of initial account value or an enhanced value if applicable. The most significant of the Company’s GMAB features are the guaranteed return option features, which includes an automatic rebalancing element that reduces the Company’s exposure to these guarantees. The GMAB liability is calculated as the present value of future expected payments in excess of the account balance less the present value of future expected rider fees attributable to the embedded derivative feature.
231
The GMWB features provide the contractholder with access to a guaranteed remaining balance if the account value is reduced to zero through a combination of market declines and withdrawals. The guaranteed remaining balance is generally equal to the protected value under the contract, which is initially established as the greater of the account value or cumulative deposits when withdrawals commence, less cumulative withdrawals. The contractholder also has the option, after a specified time period, to reset the guaranteed remaining balance to the then current account value, if greater. The contractholder accesses the guaranteed remaining balance through payments over time, subject to maximum annual limits. The GMWB liability is calculated as the present value of future expected payments to customers less the present value of future expected rider fees attributable to the embedded derivative feature.
The GMIWB features, taken collectively, provide a contractholder two optional methods to receive guaranteed minimum payments over time, a “withdrawal” option or an “income” option. The withdrawal option (which was available under only one of the GMIWBs and is no longer offered) guarantees that a contractholder can withdraw an amount each year until the cumulative withdrawals reach a total guaranteed balance. The income option (which varies among the Company’s GMIWBs) in general guarantees the contractholder the ability to withdraw an amount each year for life (or for joint lives, in the case of any spousal version of the benefit) where such amount is equal to a percentage of a protected value under the benefit. The contractholder also has the potential to increase this annual amount, based on certain subsequent increases in account value that may occur. The GMIWB can be elected by the contractholder upon issuance of an appropriate deferred variable annuity contract or at any time following contract issue prior to annuitization. Certain GMIWB features include an automatic rebalancing element that reduces the Company’s exposure to these guarantees. The GMIWB liability is calculated as the present value of future expected payments to customers less the present value of future expected rider fees attributable to the embedded derivative feature.
Sales Inducements
The Company defers sales inducements and amortizes them over the anticipated life of the policy using the same methodology and assumptions used to amortize DAC. DSI is included in “Other assets.” The Company has offered various types of sales inducements including: (1) a bonus whereby the policyholder’s initial account balance is increased by an amount equal to a specified percentage of the customer’s initial deposit; (2) additional credits after a certain number of years a contract is held; and (3) enhanced interest crediting rates that are higher than the normal general account interest rate credited in certain product lines. Changes in DSI, reported as “Interest credited to policyholders’ account balances,” are as follows:
|
|
Sales Inducements
|
||
|
|
(in millions)
|
||
|
Balance at December 31, 2015
|
$
|
1,189
|
|
|
Capitalization
|
47
|
|
|
|
Amortization—Impact of assumption and experience unlocking and true-ups
|
118
|
|
|
|
Amortization—All other
|
(231
|
)
|
|
|
Change in unrealized investment gains and losses
|
4
|
|
|
|
Balance at December 31, 2016
|
1,127
|
|
|
|
Capitalization
|
2
|
|
|
|
Amortization—Impact of assumption and experience unlocking and true-ups
|
157
|
|
|
|
Amortization—All other
|
(105
|
)
|
|
|
Change in unrealized investment gains and losses
|
(13
|
)
|
|
|
Balance at December 31, 2017
|
1,168
|
|
|
|
Capitalization
|
3
|
|
|
|
Amortization—Impact of assumption and experience unlocking and true-ups
|
(6
|
)
|
|
|
Amortization—All other
|
(166
|
)
|
|
|
Change in unrealized investment gains and losses
|
25
|
|
|
|
Balance at December 31, 2018
|
$
|
1,024
|
|
|
13.
|
REINSURANCE
|
The Company participates in reinsurance with third parties primarily to provide additional capacity for future growth, limit the maximum net loss potential arising from large risks and acquire or dispose of businesses.
232
Effective April 1, 2015, the Company entered into an agreement with Union Hamilton Reinsurance, Ltd. (“Union Hamilton”) an external counterparty, to reinsure approximately
50%
of the Prudential Premier® Retirement Variable Annuity with Highest Daily Lifetime Income (“HDI”) v.3.0 business, a guaranteed benefit feature. This reinsurance agreement covered most new HDI v.3.0 variable annuity business issued between April 1, 2015 and December 31, 2016 on a quota share basis, with Union Hamilton’s cumulative quota share amounting to
$2.9 billion
of new rider premiums as of December 31, 2016. Reinsurance on business subject to this agreement remains in force for the duration of the underlying annuity contracts. New sales subsequent to December 31, 2016 are not covered by this external reinsurance agreement. These guaranteed benefit features are accounted for as embedded derivatives.
In January 2013, the Company acquired the Hartford Life Business through reinsurance transactions with three subsidiaries of Hartford Financial Services Group, Inc. (“Hartford Financial”). Under the related agreements, the Company provided reinsurance for approximately
700,000
life insurance policies with net retained face amount in force of approximately
$141 billion
. The Company acquired the general account business through a coinsurance arrangement and, for certain types of general account policies, a modified coinsurance arrangement. The Company acquired the separate account business through a modified coinsurance arrangement. In December 2017, Hartford Financial announced a definitive agreement to sell a group of operating subsidiaries, which includes two of the Company’s counterparties to these reinsurance arrangements. The sale occurred in May 2018 and there was no impact to the terms, rights or obligations of the Company, or operation of these reinsurance arrangements, as a result of this change in control of such counterparties.
Since 2011, the Company has entered into several reinsurance agreements to assume pension liabilities in the United Kingdom. Under these arrangements, the Company assumes the longevity risk associated with the pension benefits of certain specified beneficiaries.
In 2006, the Company acquired the variable annuity business of The Allstate Corporation (“Allstate”) through a reinsurance transaction. The reinsurance arrangements with Allstate include a coinsurance arrangement associated with the general account liabilities assumed and a modified coinsurance arrangement associated with the separate account liabilities assumed. The reinsurance payable, which represents the Company’s obligation under the modified coinsurance arrangement, is netted with the reinsurance receivable in the Consolidated Statements of Financial Position.
In 2004, the Company acquired the retirement business of CIGNA and subsequently entered into various reinsurance arrangements. The Company still has indemnity coinsurance and modified coinsurance without assumption arrangements in effect related to this acquisition.
For the domestic business, life and disability reinsurance is accomplished through various plans of reinsurance, primarily yearly renewable term, per person excess, excess of loss, and coinsurance. On policies sold since 2000, the Company has reinsured a significant portion of the individual life mortality risk. Placement of reinsurance is accomplished primarily on an automatic basis with some specific risks reinsured on a facultative basis. The Company is authorized and has historically retained up to
$30 million
per life, but reduced its operating retention limit to
$20 million
per life in 2013. Retention in excess of the operating limit is on an exception basis.
The international business primarily uses reinsurance to obtain experience with respect to certain new product offerings and to a lesser extent, to mitigate mortality risk for certain protection products and for capital management purposes.
Reinsurance amounts included in the Consolidated Statements of Operations for premiums, policy charges and fee income, and policyholders’ benefits for the years ended December 31, are as follows:
233
|
2018
|
2017
|
2016
|
|||||||||
|
|
(in millions)
|
||||||||||
|
Direct premiums
|
$
|
35,048
|
|
$
|
31,797
|
|
$
|
30,654
|
|
||
|
Reinsurance assumed
|
2,574
|
|
2,105
|
|
2,073
|
|
|||||
|
Reinsurance ceded
|
(1,843
|
)
|
(1,811
|
)
|
(1,763
|
)
|
|||||
|
Premiums
|
$
|
35,779
|
|
$
|
32,091
|
|
$
|
30,964
|
|
||
|
Direct policy charges and fee income
|
$
|
5,245
|
|
$
|
4,541
|
|
$
|
5,031
|
|
||
|
Reinsurance assumed
|
1,189
|
|
1,176
|
|
1,243
|
|
|||||
|
Reinsurance ceded
|
(432
|
)
|
(414
|
)
|
(368
|
)
|
|||||
|
Policy charges and fee income
|
$
|
6,002
|
|
$
|
5,303
|
|
$
|
5,906
|
|
||
|
Direct policyholders’ benefits
|
$
|
38,079
|
|
$
|
33,261
|
|
$
|
32,957
|
|
||
|
Reinsurance assumed
|
3,659
|
|
3,230
|
|
3,110
|
|
|||||
|
Reinsurance ceded
|
(2,334
|
)
|
(2,697
|
)
|
(2,435
|
)
|
|||||
|
Policyholders’ benefits
|
$
|
39,404
|
|
$
|
33,794
|
|
$
|
33,632
|
|
||
Reinsurance recoverables at December 31, are as follows:
|
2018
|
2017
|
||||||
|
|
(in millions)
|
||||||
|
Individual and group annuities(1)
|
$
|
499
|
|
$
|
698
|
|
|
|
Life insurance(2)
|
4,335
|
|
4,290
|
|
|||
|
Other reinsurance
|
162
|
|
171
|
|
|||
|
Total reinsurance recoverables
|
$
|
4,996
|
|
$
|
5,159
|
|
|
__________
|
(1)
|
Primarily represents reinsurance recoverables established under the reinsurance arrangements associated with the acquisition of the retirement business of CIGNA. The Company has recorded reinsurance recoverables related to the acquisition of the retirement business of CIGNA of
$481 million
and
$682 million
at December 31,
2018
and
2017
, respectively. Also included is
$15 million
and
$13 million
of reinsurance recoverables at December 31,
2018
and
2017
, respectively, established under the reinsurance agreement with Union Hamilton related to the ceding of certain embedded derivative liabilities associated with the Company’s guaranteed benefits.
|
|
(2)
|
Includes
$2,035 million
and
$2,145 million
of reinsurance recoverables established at December 31,
2018
and
2017
, respectively, under the reinsurance arrangements associated with the acquisition of the Hartford Life Business. The Company has also recorded reinsurance payables related to the Hartford Life Business acquisition of
$1,259 million
and
$1,301 million
at December 31,
2018
and
2017
, respectively.
|
Excluding the reinsurance recoverable associated with the acquisition of the Hartford Life Business and the retirement business of CIGNA,
four
major reinsurance companies account for approximately
55%
of the reinsurance recoverable at December 31,
2018
. The Company periodically reviews the financial condition of its reinsurers, amounts recoverable therefrom, and unearned reinsurance premium, in order to reduce its exposure to loss from reinsurer insolvencies. If deemed necessary, the Company obtains collateral in the form of a trust, letter of credit, or funds withheld arrangement to ensure collectability; otherwise, an allowance for uncollectible reinsurance is recorded. Under the Company’s longevity reinsurance transactions, the Company obtains collateral from its counterparties to mitigate counterparty default risk.
|
14.
|
CLOSED BLOCK
|
On the date of demutualization, Prudential Insurance established a closed block for certain in-force participating insurance policies and annuity products, along with corresponding assets used for the payment of benefits and policyholders’ dividends on these products, (collectively the “Closed Block”), and ceased offering these participating products. The recorded assets and liabilities were allocated to the Closed Block at their historical carrying amounts. The Closed Block forms the principal component of the Closed Block division. See Note 21 for financial information on the Closed Block division. The insurance policies and annuity contracts comprising the Closed Block are managed in accordance with the Plan of Reorganization approved by the New Jersey Department of Banking and Insurance (“NJDOBI”) on December 18, 2001, and Prudential Insurance is directly obligated for the insurance policies and annuity contracts in the Closed Block.
234
The policies included in the Closed Block are specified individual life insurance policies and individual annuity contracts that were in force on the date of demutualization and for which Prudential Insurance is currently paying or expects to pay experience-based policy dividends. Assets have been allocated to the Closed Block in an amount that has been determined to produce cash flows which, together with revenues from policies included in the Closed Block, are expected to be sufficient to support obligations and liabilities relating to these policies, including provision for payment of benefits, certain expenses and taxes and to provide for continuation of the policyholder dividend scales in effect in 2000, assuming experience underlying such scales continues. To the extent that, over time, cash flows from the assets allocated to the Closed Block and claims and other experience related to the Closed Block are, in the aggregate, more or less favorable than what was assumed when the Closed Block was established, total dividends paid to Closed Block policyholders may be greater than or less than the total dividends that would have been paid to these policyholders if the policyholder dividend scales in effect in 2000 had been continued. Any cash flows in excess of amounts assumed will be available for distribution over time to Closed Block policyholders and will not be available to shareholders. If the Closed Block has insufficient funds to make guaranteed policy benefit payments, such payments will be made from Prudential Insurance’s assets outside of the Closed Block. The Closed Block will continue in effect as long as any policy in the Closed Block remains in force unless, with the consent of the New Jersey insurance regulator, it is terminated earlier.
The excess of Closed Block liabilities over Closed Block assets at the date of the demutualization (adjusted to eliminate the impact of related amounts in AOCI) represented the estimated maximum future earnings at that date from the Closed Block expected to result from operations attributed to the Closed Block after income taxes. In establishing the Closed Block, the Company developed an actuarial calculation of the timing of such maximum future earnings. If actual cumulative earnings of the Closed Block from inception through the end of any given period are greater than the expected cumulative earnings, only the expected earnings will be recognized in income. Any excess of actual cumulative earnings over expected cumulative earnings will represent undistributed accumulated earnings attributable to policyholders, which are recorded as a policyholder dividend obligation. The policyholder dividend obligation represents amounts to be paid to Closed Block policyholders as an additional policyholder dividend unless otherwise offset by future Closed Block performance that is less favorable than originally expected. If the actual cumulative earnings of the Closed Block from its inception through the end of any given period are less than the expected cumulative earnings of the Closed Block, the Company will recognize only the actual earnings in income.
As of December 31,
2018
and
2017
, the Company recognized a policyholder dividend obligation of
$2,252 million
and
$1,790 million
, respectively, to Closed Block policyholders for the excess of actual cumulative earnings over the expected cumulative earnings. Additionally, accumulated net unrealized investment gains that have arisen subsequent to the establishment of the Closed Block have been reflected as a policyholder dividend obligation of
$899 million
and
$3,656 million
at December 31,
2018
and
2017
, respectively, to be paid to Closed Block policyholders unless offset by future experience, with a corresponding amount reported in AOCI.
On December 9, 2016, Prudential Insurance’s Board of Directors approved a continuation of the dividends payable on Closed Block policies for 2017. On December 8, 2017, Prudential Insurance’s Board of Directors acted to decrease the 2018 dividends payable on Closed Block policies. On December 7, 2018, Prudential Insurance’s Board of Directors approved a continuation of the dividends payable on Closed Block policies for 2019. These actions resulted in an increase of approximately
$32 million
for the year ended December 31, 2016 and a decrease of approximately
$86 million
for both years ending December 31, 2017 and 2018 in the liability for policyholders’ dividends recognized.
Closed Block liabilities and assets designated to the Closed Block at December 31, as well as maximum future earnings to be recognized from these liabilities and assets, are as follows:
235
|
2018
|
2017
|
|||||||
|
|
(in millions)
|
|||||||
|
Closed Block liabilities
|
||||||||
|
Future policy benefits
|
$
|
48,282
|
|
$
|
48,870
|
|
||
|
Policyholders’ dividends payable
|
812
|
|
829
|
|
||||
|
Policyholders’ dividend obligation
|
3,150
|
|
5,446
|
|
||||
|
Policyholders’ account balances
|
5,061
|
|
5,146
|
|
||||
|
Other Closed Block liabilities
|
3,955
|
|
5,070
|
|
||||
|
Total Closed Block liabilities
|
61,260
|
|
65,361
|
|
||||
|
Closed Block assets
|
||||||||
|
Fixed maturities, available-for-sale, at fair value
|
38,538
|
|
41,043
|
|
||||
|
Fixed maturities, trading, at fair value(1)
|
195
|
|
339
|
|
||||
|
Equity securities, at fair value(1)
|
1,784
|
|
2,340
|
|
||||
|
Commercial mortgage and other loans
|
8,782
|
|
9,017
|
|
||||
|
Policy loans
|
4,410
|
|
4,543
|
|
||||
|
Other invested assets(1)
|
3,316
|
|
3,159
|
|
||||
|
Short-term investments
|
477
|
|
632
|
|
||||
|
Total investments
|
57,502
|
|
61,073
|
|
||||
|
Cash and cash equivalents
|
467
|
|
789
|
|
||||
|
Accrued investment income
|
466
|
|
474
|
|
||||
|
Other Closed Block assets
|
105
|
|
249
|
|
||||
|
Total Closed Block assets
|
58,540
|
|
62,585
|
|
||||
|
Excess of reported Closed Block liabilities over Closed Block assets
|
2,720
|
|
2,776
|
|
||||
|
Portion of above representing accumulated other comprehensive income (loss):
|
||||||||
|
Net unrealized investment gains (losses)
|
857
|
|
3,627
|
|
||||
|
Allocated to policyholder dividend obligation
|
(899
|
)
|
(3,656
|
)
|
||||
|
Future earnings to be recognized from Closed Block assets and Closed Block liabilities
|
$
|
2,678
|
|
$
|
2,747
|
|
||
__________
|
(1)
|
Prior period amounts have been reclassified to conform to current period presentation. See Note 2 for details.
|
Information regarding the policyholder dividend obligation is as follows:
|
2018
|
2017
|
|||||||
|
|
(in millions)
|
|||||||
|
Balance, January 1
|
$
|
5,446
|
|
$
|
4,658
|
|
||
|
Cumulative-effect adjustment from the adoption of ASU 2016-01(1)
|
157
|
|
0
|
|
||||
|
Impact from earnings allocable to policyholder dividend obligation
|
(508
|
)
|
142
|
|
||||
|
Change in net unrealized investment gains (losses) allocated to policyholder dividend obligation
|
(1,945
|
)
|
646
|
|
||||
|
Balance, December 31
|
$
|
3,150
|
|
$
|
5,446
|
|
||
__________
|
(1)
|
See Note 2 for details.
|
236
Closed Block revenues and benefits and expenses for the years ended December 31, are as follows:
|
2018
|
2017
|
2016
|
||||||||||
|
|
(in millions)
|
|||||||||||
|
Revenues
|
||||||||||||
|
Premiums
|
$
|
2,301
|
|
$
|
2,524
|
|
$
|
2,619
|
|
|||
|
Net investment income
|
2,298
|
|
2,669
|
|
2,597
|
|
||||||
|
Realized investment gains (losses), net
|
130
|
|
534
|
|
433
|
|
||||||
|
Other income (loss)
|
(39
|
)
|
113
|
|
36
|
|
||||||
|
Total Closed Block revenues
|
4,690
|
|
5,840
|
|
5,685
|
|
||||||
|
Benefits and Expenses
|
||||||||||||
|
Policyholders’ benefits
|
2,972
|
|
3,220
|
|
3,283
|
|
||||||
|
Interest credited to policyholders’ account balances
|
132
|
|
133
|
|
132
|
|
||||||
|
Dividends to policyholders
|
1,236
|
|
2,007
|
|
1,941
|
|
||||||
|
General and administrative expenses
|
364
|
|
382
|
|
402
|
|
||||||
|
Total Closed Block benefits and expenses
|
4,704
|
|
5,742
|
|
5,758
|
|
||||||
|
Closed Block revenues, net of Closed Block benefits and expenses, before income taxes
|
(14
|
)
|
98
|
|
(73
|
)
|
||||||
|
Income tax expense (benefit)
|
(78
|
)
|
43
|
|
(120
|
)
|
||||||
|
Closed Block revenues, net of Closed Block benefits and expenses and income taxes
|
$
|
64
|
|
$
|
55
|
|
$
|
47
|
|
|||
|
15.
|
INCOME TAXES
|
The following schedule discloses significant components of income tax expense (benefit) for each year presented:
|
Year Ended December 31,
|
||||||||||||
|
2018
|
2017
|
2016
|
||||||||||
|
(in millions)
|
||||||||||||
|
Current tax expense (benefit):
|
||||||||||||
|
U.S.
|
$
|
(346
|
)
|
$
|
(47
|
)
|
$
|
31
|
|
|||
|
State and local
|
7
|
|
11
|
|
9
|
|
||||||
|
Foreign
|
681
|
|
594
|
|
595
|
|
||||||
|
Total current tax expense (benefit)
|
342
|
|
558
|
|
635
|
|
||||||
|
Deferred tax expense (benefit):
|
||||||||||||
|
U.S.
|
(634
|
)
|
(2,552
|
)
|
132
|
|
||||||
|
State and local
|
1
|
|
0
|
|
5
|
|
||||||
|
Foreign
|
1,113
|
|
556
|
|
563
|
|
||||||
|
Total deferred tax expense (benefit)
|
480
|
|
(1,996
|
)
|
700
|
|
||||||
|
Total income tax expense (benefit) on income (loss) before equity in earnings of operating joint ventures
|
822
|
|
(1,438
|
)
|
1,335
|
|
||||||
|
Income tax expense (benefit) on equity in earnings of operating joint ventures
|
31
|
|
33
|
|
11
|
|
||||||
|
Income tax expense (benefit) on discontinued operations
|
0
|
|
0
|
|
0
|
|
||||||
|
Income tax expense (benefit) reported in equity related to:
|
||||||||||||
|
Other comprehensive income (loss)
|
(1,812
|
)
|
784
|
|
1,305
|
|
||||||
|
Stock-based compensation programs
|
0
|
|
(2
|
)
|
(30
|
)
|
||||||
|
Total income taxes
|
$
|
(959
|
)
|
$
|
(623
|
)
|
$
|
2,621
|
|
|||
Reconciliation of Expected Tax at Statutory Rates to Reported Income Tax Expense (Benefit)
The differences between income taxes expected at the U.S. federal statutory income tax rate of
21%
applicable for 2018 and
35%
applicable for the periods prior to 2018, and the reported income tax expense (benefit) are summarized as follows:
237
|
Year Ended December 31,
|
||||||||||||
|
2018
|
2017
|
2016
|
||||||||||
|
|
(in millions)
|
|||||||||||
|
Expected federal income tax expense (benefit)
|
$
|
1,015
|
|
$
|
2,270
|
|
$
|
1,997
|
|
|||
|
Non-taxable investment income
|
(246
|
)
|
(369
|
)
|
(352
|
)
|
||||||
|
Foreign taxes at other than U.S. rate
|
349
|
|
(249
|
)
|
(172
|
)
|
||||||
|
Low-income housing and other tax credits
|
(112
|
)
|
(126
|
)
|
(118
|
)
|
||||||
|
Changes in tax law
|
(321
|
)
|
(2,858
|
)
|
0
|
|
||||||
|
Other
|
137
|
|
(106
|
)
|
(20
|
)
|
||||||
|
Reported income tax expense (benefit)
|
$
|
822
|
|
$
|
(1,438
|
)
|
$
|
1,335
|
|
|||
|
Effective tax rate
|
17.0
|
%
|
(22.2
|
)%
|
23.4
|
%
|
||||||
The effective tax rate is the ratio of “Total income tax expense (benefit)” divided by “Income before income taxes and equity in earnings of operating joint ventures.” The Company’s effective tax rate for fiscal years 2018, 2017 and 2016 was
17.0%
,
(22.2)%
and
23.4%
, respectively. The following is a description of items that had the most significant impact on the difference between the Company’s statutory U.S. federal income tax rate of
21%
applicable for 2018 and
35%
applicable for the periods prior to 2018, and the Company’s effective tax rate during the periods presented:
Changes in Tax Law
.
The following is a list of notable changes in tax law that impacted the Company’s effective tax rate for the periods presented:
Tax Act of 2017 -
On December 22, 2017, the Tax Act of 2017 was enacted into U.S. law. As a result, the Company recognized a
$2,880 million
tax benefit in “Total income tax expense (benefit)” in the Company’s Consolidated Statements of Operations for the year ended December 31, 2017. In accordance with SEC Staff Accounting Bulletin 118, in 2017 the Company recorded the effects of the Tax Act of 2017 using reasonable estimates due to the need for further analysis of the provisions within the Tax Act of 2017 and collection, preparation and analysis of relevant data necessary to complete the accounting. During 2018, the Company completed the collection, preparation and analysis of data relevant to the Tax Act of 2017, and interpreted any additional guidance issued by the IRS, U.S. Department of the Treasury, or other standard-setting organizations, and recognized a
$153 million
reduction in income tax expense primarily related to refinements of our provisional estimates of earnings of affiliated foreign companies subject to the one-time toll charge.
The financial statement impact related to the adoption of Tax Act of 2017 for the twelve months ended December 31, 2017 and twelve months ended December 31, 2018 was as follows:
|
Twelve Months Ended December 31, 2017
|
Twelve Months Ended December 31, 2018
|
Total
|
||||||||||
|
(in millions)
|
||||||||||||
|
Deferred tax revaluation from tax law change
|
$
|
(1,592
|
)
|
$
|
7
|
|
$
|
(1,585
|
)
|
|||
|
Adoption of modified territorial system
|
(1,785
|
)
|
(24
|
)
|
(1,809
|
)
|
||||||
|
Deemed repatriation
|
497
|
|
(136
|
)
|
361
|
|
||||||
|
Total provision for income tax expense (benefit)
|
$
|
(2,880
|
)
|
$
|
(153
|
)
|
$
|
(3,033
|
)
|
|||
2018 Industry Issue Resolution (IIR).
In August 2018, the IRS released a Directive to provide guidance on the tax reserving for guaranteed benefits within variable annuity contracts and principle-based reserves on certain life insurance contracts. Adopting the methodology specified in the Directive resulted in an accelerated deduction for the Company’s 2017 tax return, that would have otherwise been deductible in future years. Prior to the adoption of this Directive, the Company accounted for these future deductions as deferred tax assets measured using the current
21%
corporate income tax rate. Upon adoption of the Directive, the tax benefits were revalued using the
35%
tax rate applicable for the 2017 tax year in which they will now be recognized resulting in a reduction in income tax expense of
$198 million
.
238
South Korea Tax Reform Bill.
On December 19, 2017, South Korea enacted a 2018 tax reform bill that adds a new 25% corporate income tax bracket for taxable income in excess of ₩300 billion for tax years beginning on or after January 1, 2018. Taxable income in excess of ₩20 billion but less than ₩300 billion continues to be subject to a 22% corporate income tax. In addition, corporations continue to be subject to a local income surtax of 10% of the computed corporate income tax before the application of tax credits and exemptions (i.e., 2.5% for the tax base in excess of ₩300 billion, 2.2% for the tax base between ₩20 billion and ₩300 billion). After taking into account this 10% local income tax surcharge on corporate tax, the 2018 tax reform bill increased the top corporate income tax rate in South Korea from 24.2% to 27.5%. As a result, the Company recognized a
$26 million
tax expense in 2017 related to remeasuring Korea’s deferred tax assets and liabilities.
Non-Taxable Investment Income
.
The U.S. Dividends Received Deduction (“DRD”) reduces the amount of dividend income subject to U.S. tax and accounts for most of the non-taxable investment income shown in the table above. More specifically, the U.S. DRD constitutes
$127 million
of the total
$246 million
of 2018 non-taxable investment income,
$280 million
of the total
$369 million
of 2017 non-taxable investment income, and
$266 million
of the total
$352 million
of 2016 non-taxable investment income. The DRD for the current period was estimated using information from 2017, current year investment results, and current year’s equity market performance. The actual current year DRD can vary based on factors such as, but not limited to, changes in the amount of dividends received that are eligible for the DRD, changes in the amount of distributions received from fund investments, changes in the account balances of variable life and annuity contracts, and the Company’s taxable income before the DRD.
Foreign Taxes at Other Than U.S. Rates
.
The statutory income tax rate in the Company’s two largest non-U.S. tax jurisdictions is approximately
28%
in Japan and
24.2%
in Korea as compared to the U.S. federal income tax rate of
21%
applicable for 2018 and
35%
applicable for the periods prior to 2018.
Brazil Full Inclusion.
The Company made a tax election, effective for the 2017 tax year, to subject earnings from its insurance operations in Brazil to tax in the U.S. in the tax year earned, net of related tax credits. This election will have the effect of reducing the rate at which the Company will incur taxes on these earnings from the approximately
45%
tax rate in Brazil to the
21%
tax rate in the U.S., which in turn will reduce the amount of associated income tax expense in 2018 and thereafter. In conjunction with this election, the Company remeasured its related deferred tax assets from the previous
45%
rate in Brazil to the new rate of
21%
in the U.S., which resulted in additional income tax expense at the time of election. The net effect of the lower tax rate and the remeasurement of the deferred tax assets was a net increase in income tax expense of
$34 million
.
Low-Income Housing and Other Tax Credits
.
These amounts include incentives within the U.S. tax code for the development of affordable housing aiming at low-income Americans. The Company routinely make such investments that generate a tax credit which reduces the Company’s effective tax rate.
Other
.
This line item represents insignificant reconciling items that are individually less than
5%
of the computed expected federal income tax expense (benefit) and have therefore been aggregated for purposes of this reconciliation in accordance with relevant disclosure guidance.
239
Schedule of Deferred Tax Assets and Deferred Tax Liabilities
|
As of December 31,
|
||||||||
|
2018
|
2017
|
|||||||
|
(in millions)
|
||||||||
|
Deferred tax assets:
|
||||||||
|
Insurance reserves
|
$
|
0
|
|
$
|
821
|
|
||
|
Policyholders’ dividends
|
733
|
|
1,262
|
|
||||
|
Net operating and capital loss carryforwards
|
155
|
|
281
|
|
||||
|
Refundable AMT credits
|
205
|
|
0
|
|
||||
|
Employee benefits
|
693
|
|
635
|
|
||||
|
Investments
|
1,002
|
|
862
|
|
||||
|
Other
|
39
|
|
0
|
|
||||
|
Deferred tax assets before valuation allowance
|
2,827
|
|
3,861
|
|
||||
|
Valuation allowance
|
(117
|
)
|
(214
|
)
|
||||
|
Deferred tax assets after valuation allowance
|
2,710
|
|
3,647
|
|
||||
|
Deferred tax liabilities:
|
||||||||
|
Insurance reserves
|
719
|
|
0
|
|
||||
|
Net unrealized investment gains
|
5,961
|
|
9,062
|
|
||||
|
Deferred policy acquisition costs
|
3,888
|
|
3,625
|
|
||||
|
Value of business acquired
|
461
|
|
414
|
|
||||
|
Other(1)
|
0
|
|
160
|
|
||||
|
Deferred tax liabilities
|
11,029
|
|
13,261
|
|
||||
|
Net deferred tax liability
|
$
|
(8,319
|
)
|
$
|
(9,614
|
)
|
||
__________
|
(1)
|
Prior period amounts have been reclassified to conform to current period presentation.
|
The application of U.S. GAAP requires the Company to evaluate the recoverability of deferred tax assets and establish a valuation allowance if necessary to reduce the deferred tax asset to an amount that is more likely than not expected to be realized. Considerable judgment is required in determining whether a valuation allowance is necessary, and if so, the amount of such valuation allowance. In evaluating the need for a valuation allowance, the Company considers many factors, including: (1) the nature of the deferred tax assets and liabilities; (2) whether they are ordinary or capital; (3) in which tax jurisdictions they were generated and the timing of their reversal; (4) taxable income in prior carryback years as well as projected taxable earnings exclusive of reversing temporary differences and carryforwards; (5) the length of time that carryovers can be utilized in the various taxing jurisdictions; (6) any unique tax rules that would impact the utilization of the deferred tax assets; and (7) any tax planning strategies that the Company would employ to avoid a tax benefit from expiring unused. Although realization is not assured, management believes it is more likely than not that the deferred tax assets, net of valuation allowances, will be realized.
A valuation allowance has been recorded against deferred tax assets related to state and local taxes and foreign operations. Adjustments to the valuation allowance are made to reflect changes in management’s assessment of the amount of the deferred tax asset that is realizable and the amount of deferred tax asset actually realized during the year. The valuation allowance includes amounts recorded in connection with deferred tax assets as follows:
240
|
State
|
Foreign Operations
|
Total
|
||||||||||
|
(in millions)
|
||||||||||||
|
Balance at January 1, 2016
|
$
|
99
|
|
$
|
34
|
|
$
|
133
|
|
|||
|
Charged to costs and expenses
|
74
|
|
(6
|
)
|
68
|
|
||||||
|
Other adjustments
|
(35
|
)
|
(3
|
)
|
(38
|
)
|
||||||
|
Balance at December 31, 2016
|
138
|
|
25
|
|
163
|
|
||||||
|
Charged to costs and expenses
|
63
|
|
3
|
|
66
|
|
||||||
|
Other adjustments
|
(5
|
)
|
(10
|
)
|
(15
|
)
|
||||||
|
Balance at December 31, 2017
|
196
|
|
18
|
|
214
|
|
||||||
|
Charged to costs and expenses
|
24
|
|
(6
|
)
|
18
|
|
||||||
|
Other adjustments
|
(114
|
)
|
(1
|
)
|
(115
|
)
|
||||||
|
Balance at December 31, 2018
|
$
|
106
|
|
$
|
11
|
|
$
|
117
|
|
|||
The following table sets forth the amount and expiration dates of federal, state and foreign operating losses, capital loss and tax credit carryforwards for tax purposes, as of the periods indicated:
|
As of December 31,
|
||||||||
|
2018
|
2017
|
|||||||
|
(in millions)
|
||||||||
|
Federal net operating and capital loss carryforwards
|
$
|
0
|
|
$
|
0
|
|
||
|
State net operating and capital loss carryforwards(1)
|
$
|
2,152
|
|
$
|
5,806
|
|
||
|
Foreign operating loss carryforwards(2)
|
$
|
52
|
|
$
|
58
|
|
||
__________
|
(1)
|
Expires between 2019 and 2038.
|
|
(2)
|
$17 million
expires between 2021 and 2035 and
$35 million
has an unlimited carryforward.
|
Consistent with the Tax Act of 2017, the Company provides applicable U.S. income tax for all unremitted earnings of the Company’s foreign affiliates. For certain foreign affiliates organized in withholding tax jurisdictions, the Company considers the unremitted foreign earnings of those affiliates to be indefinitely reinvested, and therefore does not provide for the withholding tax when calculating its current and deferred tax obligations. For certain other foreign affiliates organized in withholding tax jurisdictions, the Company does not consider unremitted earnings indefinitely reinvested, and therefore provides for foreign withholding tax when calculating its current and deferred tax obligations. The following table summarizes the Company’s indefinite reinvestment assertions for jurisdictions in which the Company operates that impose a withholding tax on dividends or may be subject to other foreign country tax upon a remittance:
|
Unremitted earnings
are
indefinitely reinvested
|
Unremitted earnings
are not
indefinitely reinvested
|
|
Insurance operations in Chile, China, and Taiwan and non-insurance operations in Korea and certain operations in Luxembourg
|
Insurance operations in Argentina, Indonesia, Italy, Ghana, and Poland, and non-insurance operations in China, Italy and Taiwan, as well as partially for the insurance operation in Korea
|
241
During the fourth quarter of 2017, in light of and for the period after the Tax Act of 2017, the Company determined that all unremitted earnings of the Company’s foreign operations are not considered indefinitely reinvested for purposes of determining U.S. tax liability, as well as determining whether the unremitted earnings of the Company’s foreign operations are considered indefinitely reinvested for purposes of determining its foreign withholding tax liability, as described above. Prior to the enactment of the Tax Act of 2017, for the Japanese insurance operations, the Company provided for U.S. income taxes on pre-2014 U.S. GAAP earnings, post-2013 realized and unrealized capital gains, and an additional amount from Gibraltar Life and Prudential Gibraltar Financial Life Insurance Co. Ltd. (“PGFL”), not to exceed the deferred tax asset recorded in the Statement of Financial Position as of the acquisition date for PGFL and the Star and Edison Businesses. The Company had no change to its U.S. tax in “Income (loss) before equity in earnings of operating joint ventures” during 2017. During the first and second quarters of 2018, respectively, the Company determined that the earnings of its Polish and Italian insurance operation would be repatriated to the U.S. Accordingly, earnings of the Polish and Italian insurance operations were not considered indefinitely reinvested, and the Company recognized an income tax expense of
$10 million
during 2018. During the first and fourth quarters of 2018, the Company determined that a portion of the earnings of its Korean insurance operation would be repatriated to the U.S. Accordingly, a portion of the earnings of the Korean insurance operation were not considered indefinitely reinvested, and the Company recognized an income tax expense of
$14 million
in “Income (loss) before equity in earnings of operating joint ventures” during 2018.
The following table sets forth the undistributed earnings of foreign subsidiaries, where the Company assumes indefinite reinvestment of such earnings and for which, in 2018, 2017, and 2016, U.S. deferred taxes have not been provided, and for which, in 2017 and 2018, foreign deferred withholding taxes have not been provided. The net tax liability that may arise if the 2018 earnings were remitted can range from $0 to $199 million which includes any foreign exchange impacts.
|
At December 31,
|
||||||||||||
|
2018
|
2017
|
2016
|
||||||||||
|
|
(in millions)
|
|||||||||||
|
Undistributed earnings of foreign subsidiaries (assuming indefinite reinvestment for U.S. tax purposes)(1)
|
N/A
|
|
N/A
|
|
$
|
4,231
|
|
|||||
|
Undistributed earnings of foreign subsidiaries (assuming indefinite reinvestment only for Withholding or other non-U.S. Taxes)
|
$
|
2,475
|
|
$
|
2,603
|
|
N/A
|
|
||||
__________
|
(1)
|
Consistent with the Tax Act of 2017, the Company provides U.S. income tax for all unremitted earnings of the Company’s foreign affiliates as of December 31, 2017.
|
The Company’s “Income (loss) before income taxes and equity in earnings of operating joint ventures” includes income from domestic operations of
$1,447 million
,
$2,541 million
and
$1,242 million
, and income (loss) from foreign operations of
$3,387 million
,
$3,945 million
and
$4,463 million
for the years ended December 31,
2018
,
2017
and
2016
, respectively.
Tax Audit and Unrecognized Tax Benefits
The Company’s liability for income taxes includes the liability for unrecognized tax benefits and interest that relate to tax years still subject to review by the IRS or other taxing authorities. The completion of review or the expiration of the Federal statute of limitations for a given audit period could result in an adjustment to the liability for income taxes.
The following table reconciles the total amount of unrecognized tax benefits at the beginning and end of the periods indicated.
242
|
2018
|
2017
|
2016
|
||||||||||
|
|
(in millions)
|
|||||||||||
|
Balance at January 1,
|
$
|
45
|
|
$
|
26
|
|
$
|
6
|
|
|||
|
Increases in unrecognized tax benefits—prior years
|
20
|
|
11
|
|
10
|
|
||||||
|
(Decreases) in unrecognized tax benefits—prior years
|
0
|
|
(5
|
)
|
0
|
|
||||||
|
Increases in unrecognized tax benefits—current year
|
0
|
|
14
|
|
10
|
|
||||||
|
(Decreases) in unrecognized tax benefits—current year
|
0
|
|
0
|
|
0
|
|
||||||
|
Settlements with taxing authorities
|
(45
|
)
|
(1
|
)
|
0
|
|
||||||
|
Balance at December 31,
|
$
|
20
|
|
$
|
45
|
|
$
|
26
|
|
|||
|
Unrecognized tax benefits that, if recognized, would favorably impact the effective rate
|
$
|
0
|
|
$
|
45
|
|
$
|
26
|
|
|||
The Company does not anticipate any significant changes within the next twelve months to its total unrecognized tax benefits related to tax years for which the statute of limitations has not expired.
The Company classifies all interest and penalties related to tax uncertainties as income tax expense (benefit). The amounts recognized in the consolidated financial statements for tax-related interest and penalties for the years ended December 31 are as follows:
|
2018
|
2017
|
2016
|
||||||||||
|
|
(in millions)
|
|||||||||||
|
Interest and penalties recognized in the Consolidated Statements of Operations
|
$
|
1
|
|
$
|
(3
|
)
|
$
|
1
|
|
|||
|
2018
|
2017
|
|||||||
|
|
(in millions)
|
|||||||
|
Interest and penalties recognized in liabilities in the Consolidated Statements of Financial Position
|
$
|
1
|
|
$
|
1
|
|
||
Listed below are the tax years that remain subject to examination, by major tax jurisdiction, as of December 31,
2018
:
|
Major Tax Jurisdiction
|
|
Open Tax Years
|
|
United States
|
|
2015-2017
|
|
Japan
|
|
Fiscal years ended March 31, 2014-2018
|
|
Korea
|
|
2013-2017
|
The Company is participating in the IRS’s Compliance Assurance Program. Under this program, the IRS assigns an examination team to review completed transactions as they occur in order to reach agreement with the Company on how they should be reported in the relevant tax returns. If disagreements arise, accelerated resolutions programs are available to resolve the disagreements in a timely manner before the tax return is filed.
Some of the Company’s affiliates in Japan file a consolidated tax return, while others file separate tax returns. The Company’s affiliates in Japan are subject to audits by the local taxing authority. The general statute of limitations is
five years
from when the return is filed. During 2016, the Tokyo Regional Taxation Bureau concluded a routine tax audit of the tax returns of the Company’s affiliates in Japan for their tax years ended March 31, 2013 to March 31, 2015. These activities had no material impact on the Company’s
2016
,
2017
or
2018
results.
The Company’s affiliates in South Korea file separate tax returns and are subject to audits by the local taxing authority. The general statute of limitations is
five years
from when the return is filed. The Korean National Tax Service did not conduct a tax audit of the tax returns of Prudential of Korea during the reporting period.
243
|
16.
|
SHORT-TERM AND LONG-TERM DEBT
|
Short-term Debt
The table below presents the Company’s short-term debt at December 31, for the years indicated as follows:
|
2018
|
2017
|
||||||
|
|
($ in millions)
|
||||||
|
Commercial paper:
|
|||||||
|
Prudential Financial
|
$
|
15
|
|
$
|
50
|
|
|
|
Prudential Funding, LLC
|
727
|
|
500
|
|
|||
|
Subtotal commercial paper
|
742
|
|
550
|
|
|||
|
Mortgage Debt(1)
|
53
|
|
0
|
|
|||
|
Current portion of long-term debt(2)
|
1,656
|
|
830
|
|
|||
|
Total short-term debt(3)
|
$
|
2,451
|
|
$
|
1,380
|
|
|
|
Supplemental short-term debt information:
|
|||||||
|
Portion of commercial paper borrowings due overnight
|
$
|
301
|
|
$
|
277
|
|
|
|
Daily average commercial paper outstanding
|
$
|
1,554
|
|
$
|
1,110
|
|
|
|
Weighted average maturity of outstanding commercial paper, in days
|
12
|
|
22
|
|
|||
|
Weighted average interest rate on outstanding short-term debt(4)
|
1.90
|
%
|
0.99
|
%
|
|||
__________
|
(1)
|
Includes
$53 million
of mortgage debt denominated in foreign currency at December 31, 2018.
|
|
(2)
|
Includes
$57 million
of debt that has recourse only to real estate property held for investment by subsidiaries at December 31, 2018.
|
|
(3)
|
Includes Prudential Financial debt of
$1,115 million
and
$880 million
at December 31,
2018
and
2017
, respectively.
|
|
(4)
|
Excludes the current portion of long-term debt.
|
At December 31,
2018
and
2017
, the Company was in compliance with all covenants related to the above debt.
Commercial Paper
Prudential Financial has a commercial paper program with an authorized capacity of
$3.0 billion
. Prudential Financial’s commercial paper borrowings have generally been used to fund the working capital needs of Prudential Financial’s subsidiaries and provide short-term liquidity at Prudential Financial.
Prudential Funding, LLC (“Prudential Funding”), a wholly-owned subsidiary of Prudential Insurance, has a commercial paper program, with an authorized capacity of
$7.0 billion
. Prudential Funding commercial paper borrowings generally have served as an additional source of financing to meet the working capital needs of Prudential Insurance and its subsidiaries. Prudential Funding also lends to other subsidiaries of Prudential Financial up to limits agreed with the NJDOBI. Prudential Funding maintains a support agreement with Prudential Insurance whereby Prudential Insurance has agreed to maintain Prudential Funding’s tangible net worth at a positive level. Additionally, Prudential Financial has issued a subordinated guarantee covering Prudential Funding’s
$7.0 billion
commercial paper program.
Federal Home Loan Bank of New York
Prudential Insurance is a member of the FHLBNY. Membership allows Prudential Insurance access to the FHLBNY’s financial services, including the ability to obtain collateralized loans and to issue collateralized funding agreements. Under applicable law, the funding agreements issued to the FHLBNY have priority claim status above debt holders of Prudential Insurance. FHLBNY borrowings and funding agreements are collateralized by qualifying mortgage-related assets or U.S. Treasury securities, the fair value of which must be maintained at certain specified levels relative to outstanding borrowings. FHLBNY membership requires Prudential Insurance to own member stock and borrowings require the purchase of activity-based stock in an amount equal to
4.5%
of outstanding borrowings. Under FHLBNY guidelines, if any of Prudential Insurance’s financial strength ratings decline below A-/A3/A- Negative by S&P/Moody’s/Fitch, respectively, and the FHLBNY does not receive written assurances from the NJDOBI regarding Prudential Insurance’s solvency, new borrowings from the FHLBNY would be limited to a term of
90 days
or less. Currently there are no restrictions on the term of borrowings from the FHLBNY. All FHLBNY stock purchased by Prudential Insurance is classified as restricted general account investments within “Other invested assets,” and the carrying value of these investments was
$29.9 million
and
$49 million
as of December 31,
2018
and
2017
, respectively.
244
NJDOBI permits Prudential Insurance to pledge collateral to the FHLBNY in an amount of up to
5%
of its prior year-end statutory net admitted assets, excluding separate account assets. Based on Prudential Insurance’s statutory net admitted assets as of December 31,
2017
, the
5%
limitation equates to a maximum amount of eligible assets of
$6.4 billion
and an estimated maximum borrowing capacity (after taking into account required collateralization levels) of approximately
$5.6 billion
. Nevertheless, FHLBNY borrowings are subject to the FHLBNY’s discretion and to the availability of qualifying assets at Prudential Insurance.
Prudential Insurance had
no
advances outstanding under the FHLBNY facility as of December 31,
2018
.
Federal Home Loan Bank of Boston
Prudential Retirement Insurance and Annuity Company (“PRIAC”) is a member of the Federal Home Loan Bank of Boston (“FHLBB”). Membership allows PRIAC access to collateralized advances which will be classified in “Short-term debt” or “Long-term debt,” depending on the maturity date of the obligation. PRIAC’s membership in FHLBB requires the ownership of member stock and borrowings from FHLBB require the purchase of activity-based stock in an amount between
3.0%
and
4.5%
of outstanding borrowings, depending on the maturity date of the obligation. All FHLBB stock purchased by PRIAC is classified as restricted general account investments within “Other invested assets,” and the carrying value of these investments was
$10 million
as of
December 31, 2018
and
2017
. As of December 31,
2018
, PRIAC had
no
advances outstanding under the FHLBB facility.
Under Connecticut state insurance law, without the prior consent of the Connecticut Insurance Department, the amount of assets insurers may pledge to secure debt obligations is limited to the lesser of 5% of prior-year statutory admitted assets or 25% of prior-year statutory surplus, resulting in a maximum borrowing capacity for PRIAC under the FHLBB facility of approximately
$241 million
as of
December 31, 2018
.
Surplus Notes
The Company’s fixed-rate surplus notes include
$500 million
of exchangeable surplus notes issued in a private placement in 2009 with an interest rate of
5.36%
per annum and due September 2019. The surplus notes became exchangeable at the option of the holder, in whole but not in part, for shares of Prudential Financial Common Stock beginning on September 18, 2014. The initial exchange rate for the surplus notes was
10.1235
shares of Common Stock per each
$1,000
principal amount of surplus notes. This was equivalent to
5.1 million
shares and an initial exchange price per share of Common Stock of
$98.78
. The exchange rate is subject to customary anti-dilution adjustments and is accordingly revalued during the fourth quarter of each year. As of December 31, 2018, the exchange rate is
12.1719
shares of Common Stock per each
$1,000
principal amount of surplus notes. This is equivalent to
6.09 million
shares and an exchange price per share of Common Stock of
$82.16
. The exchange rate is also subject to a make-whole decrease in the event of an exchange prior to maturity (except upon a fundamental business combination or a continuing payment default), that will result in a reduction in the number of shares issued upon exchange (per
$1,000
principal amount of surplus notes) determined by dividing a prescribed cash reduction value (which will decline over the life of the surplus notes, from
$102.62
for an exercise on September 18, 2014, to zero for an exercise at maturity) by the price of the Common Stock at the time of exchange. As of December 31, 2018, this reduction value is
$23.77
per
$1,000
principal amount of surplus notes. In addition, the exchange rate is subject to a customary make-whole increase in connection with an exchange of the surplus notes upon a fundamental business combination where
10%
or more of the consideration in that business combination consists of cash, other property or securities that are not listed on a U.S. national securities exchange. These exchangeable surplus notes are not redeemable by Prudential Insurance prior to maturity, except in connection with a fundamental business combination involving Prudential Financial, in which case the surplus notes will be redeemable by Prudential Insurance, subject to the noteholders’ right to exchange the surplus notes instead, at par or, if greater, a make-whole redemption price.
Credit Facilities
As of December 31,
2018
, the Company maintained syndicated, unsecured committed credit facilities as described below.
|
Borrower
|
Original
Term
|
Expiration
Date
|
Capacity
|
Amount Outstanding
|
|||||||
|
|
|
|
(in millions)
|
||||||||
|
Prudential Financial and Prudential Funding
|
5 years
|
Jul 2022
|
$
|
4,000
|
|
$
|
0
|
|
|||
|
Prudential Holdings of Japan, Inc.
|
3 years
|
Sep 2019
|
¥
|
100,000
|
|
¥
|
0
|
|
|||
245
The
$4.0 billion
five
-year credit facility contains customary representations and warranties, covenants and events of default and borrowings are not contingent on the borrowers’ credit ratings nor subject to material adverse change clauses. Borrowings under this facility are conditioned on the continued satisfaction of customary conditions, including Prudential Financial’s maintenance of consolidated net worth of at least
$20.958 billion
, which is calculated as U.S. GAAP equity, excluding AOCI, equity of noncontrolling interests and equity attributable to the Closed Block. The Company expects that it may borrow under the facility from time to time to fund its working capital needs. In addition, amounts under this credit facility may be drawn in the form of standby letters of credit that can be used to meet the Company’s operating needs.
The
¥100 billion
three
-year facility was entered into by Prudential Holdings of Japan, Inc. (“PHJ”)in September 2016. This facility also contains customary representations and warranties, covenants, and events of default and borrowings are not contingent on the borrower’s credit ratings nor subject to material adverse change clauses. The
¥100 billion
three
-year facility also contains a
two
-year term-out option.
Borrowings under each of these credit facilities may be used for general corporate purposes.
As of December 31, 2018
, the Company was in compliance with the covenants under each of these credit facilities.
In addition to the above credit facilities, the Company had access to
$277 million
of certain other lines of credit at December 31,
2018
, of which
$85 million
was for the sole use of certain real estate separate accounts. The separate account facilities include loan-to-value ratio requirements and other financial covenants, and recourse on obligations under these facilities is limited to the assets of the applicable separate account. At December 31,
2018
,
$5 million
of these credit facilities were used. The Company also has access to uncommitted lines of credit from financial institutions.
Put Option Agreement for Senior Debt Issuance
In November 2013, Prudential Financial entered into a
ten
-year put option agreement with a Delaware trust upon the completion of the sale of
$1.5 billion
of trust securities by that Delaware trust in a Rule 144A private placement. The trust invested the proceeds from the sale of the trust securities in a portfolio of principal and interest strips of U.S. Treasury securities. The put option agreement provides Prudential Financial the right to sell to the trust at any time up to
$1.5 billion
of
4.419%
senior notes due November 2023 and receive in exchange a corresponding amount of the principal and interest strips of U.S. Treasury securities held by the trust. In return, the Company agreed to pay a semi-annual put premium to the trust at a rate of
1.777%
per annum applied to the unexercised portion of the put option. The put option agreement with the trust provides Prudential Financial with a source of liquid assets.
The put option described above will be exercised automatically in full upon the Company’s failure to make certain payments to the trust, such as paying the put option premium or reimbursing the trust for its expenses, if the Company’s failure to pay is not cured within
30 days
, and upon an event involving its bankruptcy. The Company is also required to exercise the put option if its consolidated stockholders’ equity, calculated in accordance with U.S. GAAP but excluding AOCI, falls below
$7.0 billion
, subject to adjustment in certain cases. The Company has a one-time right to unwind a prior voluntary exercise of the put option by repurchasing all of the senior notes then held by the trust in exchange for principal and interest strips of U.S. Treasury securities. Finally, any of the
4.419%
senior notes that Prudential Financial issues may be redeemed prior to their maturity at par or, if greater, a make-whole price, following a voluntary exercise in full of the put option.
246
Long-term Debt
The table below presents the Company’s long-term debt at December 31, for the years indicated as follows:
|
|
Maturity
Dates
|
Rate(1)
|
December 31,
|
||||||||
|
2018
|
2017
|
||||||||||
|
|
|
|
($ in millions)
|
||||||||
|
Fixed-rate notes:
|
|||||||||||
|
Surplus notes
|
2025
|
8.30%
|
$
|
341
|
|
$
|
840
|
|
|||
|
Surplus notes subject to set-off arrangements
|
2021-2038
|
3.52%-5.26%
|
6,895
|
|
5,187
|
|
|||||
|
Senior notes
|
2019-2049
|
2.35%-11.31%
|
8,774
|
|
8,882
|
|
|||||
|
Mortgage debt(2)
|
2020-2027
|
0.89%-3.85%
|
237
|
|
226
|
|
|||||
|
Floating-rate notes:
|
|||||||||||
|
Surplus notes subject to set-off arrangements
|
2024-2037
|
2.74%-3.80%
|
2,200
|
|
2,100
|
|
|||||
|
Senior notes
|
2020
|
4.04%-4.95%
|
29
|
|
29
|
|
|||||
|
Mortgage debt(3)
|
2020-2025
|
0.26%-5.17%
|
429
|
|
573
|
|
|||||
|
Junior subordinated notes(4)
|
2042-2068
|
1.07%-5.88%
|
7,568
|
|
6,622
|
|
|||||
|
Subtotal
|
26,473
|
|
24,459
|
|
|||||||
|
Less: assets under set-off arrangements(5)
|
9,095
|
|
7,287
|
|
|||||||
|
Total long-term debt(6)
|
17,378
|
|
17,172
|
|
|||||||
__________
|
(1)
|
Ranges of interest rates are for the year ended December 31,
2018
.
|
|
(2)
|
Includes
$101 million
and $
107 million
of debt denominated in foreign currency at December 31,
2018
and
2017
, respectively.
|
|
(3)
|
Includes
$206 million
and $
245 million
of debt denominated in foreign currency at December 31,
2018
and
2017
, respectively.
|
|
(4)
|
Includes Prudential Financial debt of
$7,511 million
and subsidiary debt of
$57 million
denominated in foreign currency at December 31, 2018.
|
|
(5)
|
Assets under set-off arrangements represent a reduction in the amount of surplus notes included in long-term debt, resulting from an arrangement where valid rights of set-off exist and it is the intent of both parties to settle on a net basis under legally enforceable arrangements. These assets include available-for-sale securities that are valued at market.
|
|
(6)
|
Includes Prudential Financial debt of
$16,141 million
and
$15,304 million
at December 31,
2018
and
2017
, respectively.
|
At December 31,
2018
and
2017
, the Company was in compliance with all debt covenants related to the borrowings in the table above.
The following table presents the contractual maturities of the Company’s long-term debt as of December 31,
2018
:
|
|
Calendar Year
|
|
|||||||||||||||||||||
|
|
2020
|
2021
|
2022
|
2023
|
2024 and
thereafter
|
Total
|
|||||||||||||||||
|
|
(in millions)
|
||||||||||||||||||||||
|
Long-term debt
|
$
|
1,390
|
|
$
|
559
|
|
$
|
73
|
|
$
|
244
|
|
$
|
15,112
|
|
$
|
17,378
|
|
|||||
Surplus Notes
As of December 31,
2018
, the Company had
$341 million
of fixed-rate surplus notes outstanding. These notes are subordinated to other Prudential Insurance borrowings and policyholder obligations, and the payment of interest and principal may only be made with the prior approval of the NJDOBI. The NJDOBI could prohibit the payment of the interest and principal on the surplus notes if certain statutory capital requirements are not met. At December 31,
2018
and
2017
, the Company met these statutory capital requirements.
247
From 2011 through 2013, a captive reinsurance subsidiary entered into agreements providing for the issuance and sale of up to
$2 billion
of
ten
-year fixed-rate surplus notes. The aggregate amount available to be issued under these agreements was reduced to
$1.75 billion
in 2018. Under the agreements, the captive receives in exchange for the surplus notes one or more credit-linked notes issued by a special-purpose subsidiary of the Company in an aggregate principal amount equal to the surplus notes issued. The captive holds the credit-linked notes as assets supporting the non-economic portion of the statutory reserve required to be held by the Company’s domestic insurance subsidiaries under Regulation XXX in connection with the reinsurance of term life insurance policies through the captive. The non-economic portion of the statutory reserve equals the difference between the statutory reserve required under Regulation XXX and the amount the Company considers necessary to maintain solvency for moderately adverse experience. The principal amount of the outstanding credit-linked notes is redeemable by the captive in cash upon the occurrence of, and in an amount necessary to remedy, a specified liquidity stress event affecting the captive. Under the agreements, external counterparties have agreed to fund any such payment under the credit-linked notes in return for a fee. Prudential Financial has agreed to make capital contributions to the captive to reimburse it for investment losses in excess of specified amounts and has agreed to reimburse the external counterparties for any payments under the credit-linked notes that are funded by those counterparties. As of December 31,
2018
, an aggregate of
$1.75 billion
of surplus notes were outstanding under these agreements and no such payments under the credit-linked notes have been required.
In December 2013, a captive reinsurance subsidiary entered into a
twenty
-year financing facility with external counterparties providing for the issuance and sale of a surplus note for the financing of non-economic reserves required under Guideline AXXX. The current financing capacity available under the facility is
$3.5 billion
, but can be increased to a maximum potential size of
$4.5 billion
. The captive receives in exchange for the surplus note one or more credit-linked notes issued by a special-purpose affiliate in an aggregate principal amount equal to the surplus note. The principal amount of the outstanding credit-linked notes is redeemable by the captive in cash upon the occurrence of, and in an amount necessary to remedy, a specified liquidity stress event, and the external counterparties have agreed to fund any such payment. Prudential Financial has agreed to reimburse the captive for investment losses in excess of specified amounts; however, Prudential Financial has no other reimbursement obligations to the external counterparties under this facility. As of December 31,
2018
, an aggregate of
$3.13 billion
of surplus notes were outstanding under the facility and no credit-linked note payments have been required.
In December 2014, a captive reinsurance subsidiary entered into a financing facility with external counterparties, pursuant to which the captive agreed to issue and sell a surplus note with a
ten
-year term in an aggregate principal amount of up to
$1.75 billion
in return for an equal principal amount of credit-linked notes issued by a special-purpose affiliate. In December 2017, the Company increased the maximum potential size of the facility to
$2.4 billion
, of which
$650 million
has a
twenty
-year term. The captive holds the credit-linked notes as assets supporting non-economic reserves required to be held by the Company’s domestic insurance subsidiaries under Regulation XXX. The principal amount of the outstanding credit-linked notes is redeemable by the captive in cash upon the occurrence of, and in an amount necessary to remedy, a specified liquidity stress event affecting the captive. Under the agreements, external counterparties have agreed to fund any such payment under the credit-linked notes in return for a fee. Prudential Financial has no reimbursement obligations to the external counterparties under this facility. As of December 31,
2018
, an aggregate of
$2.20 billion
of surplus notes were outstanding under the facility and no credit-linked note payments have been required.
Another captive reinsurance subsidiary maintains a financing facility with external counterparties, pursuant to which the captive has outstanding $
2.5 billion
in principal amount of surplus notes and received in return an equal principal amount of credit-linked notes issued by a special-purpose affiliate. In November 2017, we repaid
$500 million
of senior notes issued by a special purpose affiliate and held by one of the external counterparties. The remaining term of the financing is
sixteen
years. The captive holds the credit-linked notes as assets supporting non-economic reserves required to be held by the Company’s domestic insurance subsidiaries under Regulation XXX. The captive can redeem the credit-linked notes in cash upon the occurrence of, and in an amount necessary to remedy, a liquidity stress event affecting the captive. External counterparties have agreed to fund any such credit-linked notes payments in an amount of up to
$2.5 billion
. Prudential Financial has agreed to make capital contributions to the captive and to the special-purpose affiliate to reimburse them for investment losses in excess of specified amounts. Prudential Financial has also agreed to reimburse one of the external counterparties for any payments under the credit-linked notes funded by it in an amount of up to
$1.0 billion
.
In March 2017, a captive reinsurance subsidiary entered into a
twenty
-year financing facility with external counterparties providing for the issuance and sale of a surplus note for the financing of non-economic reserves required under Guideline AXXX. The initial financing capacity available under the facility is
$1.0 billion
. The captive receives in exchange for the surplus note one or more credit-linked notes issued by a special-purpose affiliate in an aggregate principal amount equal to the surplus note. The principal amount of the outstanding credit-linked notes is redeemable by the captive in cash upon the occurrence of, and in an amount necessary to remedy, a specified liquidity stress event, and the external counterparties have agreed to fund any such
248
payment. In June 2018, the Company amended this captive financing facility by increasing the maximum potential size of the facility to
$2.0 billion
. Prudential Financial has no reimbursement obligations to the external counterparties under this facility. As of December 31, 2018, an aggregate of
$1.5 billion
of surplus notes were outstanding under the facility and
no
credit-linked note payments have been required.
During the first quarter of 2018, the Company established a new
$1.6 billion
captive financing facility to finance non-economic reserves required under Regulation XXX. Similar to the Company’s other captive financing facilities, a captive reinsurance subsidiary issues surplus notes under the facility in exchange for credit-linked notes issued by a special-purpose affiliate that are held to support non-economic reserves. The credit-linked notes are redeemable for cash upon the occurrence of a liquidity stress event affecting the captive and external counterparties have agreed to fund these payments. As of December 31, 2018,
$550 million
of surplus notes were outstanding under the facility and no credit-linked note payments have been required.
Under each of the above transactions for the captive reinsurance subsidiaries, because valid rights of set-off exist, interest and principal payments on the surplus notes and on the credit-linked notes are settled on a net basis, and the surplus notes are reflected in the Company’s total consolidated borrowings on a net basis. The surplus notes for the captive reinsurance subsidiaries described above are subordinated to policyholder obligations, and the payment of principal on the surplus notes may only be made with prior approval of the Arizona Department of Insurance. The payment of interest on the surplus notes has been approved by the Arizona Department of Insurance, subject to its ability to withdraw that approval.
In February 2015, Prudential Legacy Insurance Company of New Jersey (“PLIC”) entered into a
twenty
-year financing facility with certain external counterparties and a special-purpose company affiliate, pursuant to which PLIC may, at its option and subject to the satisfaction of customary conditions, issue and sell to the affiliate up to
$4.0 billion
in aggregate principal amount of surplus notes, in return for an equal principal amount of credit-linked notes. Upon issuance, PLIC would hold any credit-linked notes as assets to finance future statutory surplus needs within PLIC.
As of December 31, 2018
, there were no surplus notes outstanding under the facility.
Senior Notes
Medium-Term Notes Program.
The Company maintains a medium-term notes program under its shelf registration statement with an authorized issuance capacity of
$20.0 billion
. As of December 31,
2018
, the outstanding balance of medium-term notes under this program was
$7.97 billion
, an increase of
$0.3 billion
from December 31,
2017
. The increase was due to the issuance of
$600 million
of medium-term notes with an interest rate of
3.878%
maturing in March 2028 and
$400 million
of notes with an interest rate of
4.418%
maturing in 2048, offset by
$700 million
of maturities in August 2018.
Retail Medium-Term Notes Program.
The Company maintains a retail medium-term notes program under its shelf registration statement with an authorized issuance capacity of
$5.0 billion
. As of December 31,
2018
, the outstanding balance of the program was
$314 million
.
The weighted average interest rate on outstanding senior notes issued under these programs, including the effect of interest rate hedging activity, was
5.04%
and
5.22%
for the years ended
December 31, 2018
and
2017
, respectively, excluding the effect of debt issued to consolidated subsidiaries.
Funding Agreement Notes Issuance Program (“FANIP”).
The Company maintains a FANIP in which statutory trusts issue medium-term notes and commercial paper secured by funding agreements issued to the trusts by Prudential Insurance. These obligations are included in “Policyholders’ account balances” and not included in the foregoing table. See Note 11 for further discussion of these obligations.
Mortgage Debt
. As of December 31,
2018
, the Company’s subsidiaries had long-term mortgage debt of
$776 million
that has recourse only to real estate property held for investment by those subsidiaries. This represents a decrease of
$24 million
from December 31,
2017
, primarily due to new borrowings in
2018
of $
118 million
, offset by foreign exchange fluctuations of $
17 million
and
$125 million
of prepayment activity.
Junior Subordinated Notes
Certain of Prudential Financial’s junior subordinated notes outstanding are considered hybrid securities that receive enhanced equity treatment from the rating agencies. These notes outstanding, along with their key terms, are as follows:
249
|
Issue Date
|
Principal
Amount
|
Initial
Interest
Rate
|
Investor
Type
|
Optional
Redemption
Date
|
Interest Rate
Subsequent to Optional
Redemption Date
|
Maturity Date
|
||||||||
|
|
($ in millions)
|
|
|
|
|
|
||||||||
|
Aug-12
|
$
|
1,000
|
|
5.88
|
%
|
Institutional
|
9/15/2022
|
LIBOR + 4.18%
|
9/15/2042
|
|||||
|
Nov-12
|
$
|
1,500
|
|
5.63
|
%
|
Institutional
|
6/15/2023
|
LIBOR + 3.92%
|
6/15/2043
|
|||||
|
Dec-12
|
$
|
575
|
|
5.75
|
%
|
Retail
|
12/4/2017
|
5.75%
|
12/15/2052
|
|||||
|
Mar-13
|
$
|
710
|
|
5.70
|
%
|
Retail
|
3/15/2018
|
5.70%
|
3/15/2053
|
|||||
|
Mar-13
|
$
|
500
|
|
5.20
|
%
|
Institutional
|
3/15/2024
|
LIBOR + 3.04%
|
3/15/2044
|
|||||
|
May-15
|
$
|
1,000
|
|
5.38
|
%
|
Institutional
|
5/15/2025
|
LIBOR + 3.03%
|
3/15/2045
|
|||||
|
Sep-17
|
$
|
750
|
|
4.50
|
%
|
Institutional
|
9/15/2027
|
LIBOR + 2.38%
|
9/15/2047
|
|||||
|
Aug-18
|
$
|
565
|
|
5.63
|
%
|
Retail
|
8/13/2023
|
5.63%
|
8/13/2058
|
|||||
|
Sep-18
|
$
|
1,000
|
|
5.70
|
%
|
Institutional
|
9/15/2028
|
LIBOR + 2.67%
|
9/15/2048
|
|||||
The Company has the right to defer interest payments on these notes for specified periods, typically
5
to
10
years without resulting in a default, during which time interest will be compounded. On or after the optional redemption dates, Prudential Financial may redeem the notes at par plus accrued and unpaid interest. Prior to those optional redemption dates, redemptions generally are subject to a make-whole price; however, the Company may redeem the notes prior to these dates at par upon the occurrence of certain events, such as, for the notes issued in 2012 and later, a future change in the regulatory capital treatment of the notes with respect to the Company.
In April 2018, the Company redeemed all of the
$600 million
outstanding aggregate principal amount of its
8.88%
junior subordinated notes due 2068 and incurred a make-whole fee of
$6 million
.
Limited Recourse Notes.
In 2014, the Company entered into financing transactions pursuant to which it issued
$500 million
of limited recourse notes and, in return, obtained
$500 million
of asset-backed notes issued by a designated series of a Delaware master trust. The asset-backed notes mature from 2019 through 2025; however, the maturity date of a portion of the notes may be extended by the Company through 2028, subject to conditions.
The master trust’s payment obligations under each of the asset-backed notes are secured by corresponding payment obligations of a third-party financial institution and a portfolio of specified assets that have an aggregate value at least equal to the principal amount of the applicable asset-backed note. The principal amount of each asset-backed note is payable to PRIAC in cash at any time upon demand by PRIAC or, if not earlier paid, at maturity. Each of the limited recourse notes obligates Prudential Financial to reimburse the applicable third-party financial institution for any principal payments received on the corresponding asset-backed note, but there is no obligation to reimburse any portion of a principal payment that is needed by PRIAC to pay then current claims to its policyholders. Each limited recourse note bears interest at a rate equal to the rate on the corresponding asset-backed note, plus an amount representing fees payable to the applicable third-party financial institution. As of December 31,
2018
, no principal payments have been received or are currently due on the asset-backed notes and, as a result, there was no payment obligation under the limited recourse notes. Accordingly, the notes are not reflected in the Company’s Consolidated Financial Statements as of
December 31, 2018
.
Interest Expense
In order to modify exposure to interest rate and currency exchange rate movements, the Company utilizes derivative instruments, primarily interest rate swaps, in conjunction with some of its debt issues. The impact of these derivative instruments is not reflected in the rates presented in the tables above. For those derivative instruments that qualify for hedge accounting treatment, interest expense increased by
$1 million
,
$3 million
and
$5 million
for the years ended December 31,
2018
,
2017
and
2016
, respectively. See Note 5 for additional information on the Company’s use of derivative instruments.
Interest expense for short-term and long-term debt was
$1,423 million
,
$1,334 million
and
$1,324 million
for the years ended December 31,
2018
,
2017
and
2016
, respectively. This includes interest expense of
$23 million
for the year ended December 31,
2018
,
$15 million
for the year ended December 31,
2017
, and
$11 million
for the year ended December 31,
2016
, reported in “Net investment income.” The interest expense for the year ended December 31, 2016 includes prepayment premiums and fees totaling
$36 million
on debt repurchased through a tender offer.
250
|
17.
|
EMPLOYEE BENEFIT PLANS
|
Pension and Other Postretirement Plans
The Company has funded and non-funded non-contributory defined benefit pension plans (“Pension Benefits”), which cover substantially all of its employees. For some employees, benefits are based on final average earnings and length of service, while benefits for other employees are based on an account balance that takes into consideration age, service and earnings during their career.
The Company provides certain health care and life insurance benefits for its retired employees, their beneficiaries and covered dependents (“Other Postretirement Benefits”). The health care plan is contributory; the life insurance plan is non-contributory. Substantially all of the Company’s U.S. employees may become eligible to receive other postretirement benefits if they retire after age
55
with at least
10
years of service or under certain circumstances after age
50
with at least
20
years of continuous service.
Prepaid benefits costs and accrued benefit liabilities are included in “Other assets” and “Other liabilities,” respectively, in the Company’s Consolidated Statements of Financial Position. The status of these plans as of December 31,
2018
and
2017
is summarized below:
251
|
|
Pension Benefits
|
Other Postretirement Benefits
|
||||||||||||||
|
|
2018
|
2017
|
2018
|
2017
|
||||||||||||
|
|
(in millions)
|
|||||||||||||||
|
Change in benefit obligation
|
||||||||||||||||
|
Benefit obligation at the beginning of period
|
$
|
(13,838
|
)
|
$
|
(12,917
|
)
|
$
|
(1,996
|
)
|
$
|
(2,084
|
)
|
||||
|
Service cost
|
(314
|
)
|
(284
|
)
|
(23
|
)
|
(20
|
)
|
||||||||
|
Interest cost
|
(448
|
)
|
(476
|
)
|
(70
|
)
|
(82
|
)
|
||||||||
|
Plan participants’ contributions
|
0
|
|
0
|
|
(25
|
)
|
(30
|
)
|
||||||||
|
Medicare Part D subsidy receipts
|
0
|
|
0
|
|
(9
|
)
|
(9
|
)
|
||||||||
|
Amendments
|
(3
|
)
|
0
|
|
(32
|
)
|
(9
|
)
|
||||||||
|
Actuarial gains (losses), net
|
611
|
|
(871
|
)
|
96
|
|
69
|
|
||||||||
|
Settlements
|
27
|
|
57
|
|
0
|
|
0
|
|
||||||||
|
Special termination benefits
|
(1
|
)
|
(4
|
)
|
0
|
|
0
|
|
||||||||
|
Benefits paid
|
797
|
|
723
|
|
182
|
|
172
|
|
||||||||
|
Foreign currency changes and other
|
(16
|
)
|
(66
|
)
|
1
|
|
(3
|
)
|
||||||||
|
Benefit obligation at end of period
|
$
|
(13,185
|
)
|
$
|
(13,838
|
)
|
$
|
(1,876
|
)
|
$
|
(1,996
|
)
|
||||
|
Change in plan assets
|
||||||||||||||||
|
Fair value of plan assets at beginning of period
|
$
|
13,655
|
|
$
|
12,861
|
|
$
|
1,615
|
|
$
|
1,531
|
|
||||
|
Actual return on plan assets
|
(224
|
)
|
1,329
|
|
(70
|
)
|
212
|
|
||||||||
|
Employer contributions
|
219
|
|
202
|
|
44
|
|
14
|
|
||||||||
|
Plan participants’ contributions
|
0
|
|
0
|
|
25
|
|
30
|
|
||||||||
|
Disbursement for settlements
|
(27
|
)
|
(57
|
)
|
0
|
|
0
|
|
||||||||
|
Benefits paid
|
(797
|
)
|
(723
|
)
|
(182
|
)
|
(172
|
)
|
||||||||
|
Foreign currency changes and other
|
(19
|
)
|
43
|
|
0
|
|
0
|
|
||||||||
|
Fair value of plan assets at end of period
|
$
|
12,807
|
|
$
|
13,655
|
|
$
|
1,432
|
|
$
|
1,615
|
|
||||
|
Funded status at end of period
|
$
|
(378
|
)
|
$
|
(183
|
)
|
$
|
(444
|
)
|
$
|
(381
|
)
|
||||
|
Amounts recognized in the Statements of Financial Position
|
||||||||||||||||
|
Prepaid benefit cost
|
$
|
2,458
|
|
$
|
2,645
|
|
$
|
4
|
|
$
|
0
|
|
||||
|
Accrued benefit liability
|
(2,836
|
)
|
(2,828
|
)
|
(448
|
)
|
(381
|
)
|
||||||||
|
Net amount recognized
|
$
|
(378
|
)
|
$
|
(183
|
)
|
$
|
(444
|
)
|
$
|
(381
|
)
|
||||
|
Items recorded in “Accumulated other comprehensive income (loss)” not yet recognized as a component of net periodic (benefit) cost:
|
||||||||||||||||
|
Transition obligation
|
$
|
0
|
|
$
|
0
|
|
$
|
0
|
|
$
|
0
|
|
||||
|
Prior service cost
|
(15
|
)
|
(22
|
)
|
41
|
|
10
|
|
||||||||
|
Net actuarial loss
|
3,829
|
|
3,611
|
|
408
|
|
344
|
|
||||||||
|
Net amount not recognized
|
$
|
3,814
|
|
$
|
3,589
|
|
$
|
449
|
|
$
|
354
|
|
||||
|
Accumulated benefit obligation
|
$
|
(12,560
|
)
|
$
|
(13,190
|
)
|
$
|
(1,877
|
)
|
$
|
(1,995
|
)
|
||||
In addition to the plan assets above, the Company in 2007 established an irrevocable trust, commonly referred to as a “rabbi trust,” for the purpose of holding assets of the Company to be used to satisfy its obligations with respect to certain non-qualified retirement plans (
$1,208 million
and
$1,283 million
benefit obligation at December 31,
2018
and
2017
, respectively). Assets held in the rabbi trust are available to the general creditors of the Company in the event of insolvency or bankruptcy. The Company may from time to time in its discretion make contributions to the trust to fund accrued benefits payable to participants in one or more of the plans, and, in the case of a change in control of the Company, as defined in the trust agreement, the Company will be required to make contributions to the trust to fund the accrued benefits, vested and unvested, payable on a pre-tax basis to participants in the plans. The Company did not make any discretionary payments to the trust in 2018 and 2017. As of December 31,
2018
and
2017
, the assets in the trust had a carrying value of
$861 million
and
$881 million
, respectively.
The Company also maintains a separate rabbi trust for the purpose of holding assets of the Company to be used to satisfy its obligations with respect to certain other non-qualified retirement plans (
$72 million
and
$81 million
benefit obligation at December 31,
2018
and
2017
, respectively), as well as certain cash-based deferred compensation arrangements. As of December 31,
2018
and
2017
, the assets in the trust had a carrying value of
$102 million
and
$120 million
, respectively.
252
Pension benefits for foreign plans comprised
15%
and
14%
of the ending benefit obligation for both
2018
and
2017
, respectively. Foreign pension plans comprised
5%
of the ending fair value of plan assets for both
2018
and
2017
. There are no material foreign postretirement plans.
Information for pension plans with a projected benefit obligation in excess of plan assets
|
2018
|
2017
|
|||||||
|
|
(in millions)
|
|||||||
|
Projected benefit obligation
|
$
|
2,895
|
|
$
|
2,875
|
|
||
|
Fair value of plan assets
|
$
|
59
|
|
$
|
47
|
|
||
Information for pension plans with an accumulated benefit obligation in excess of plan assets
|
2018
|
2017
|
|||||||
|
|
(in millions)
|
|||||||
|
Accumulated benefit obligation
|
$
|
2,697
|
|
$
|
2,655
|
|
||
|
Fair value of plan assets
|
$
|
6
|
|
$
|
0
|
|
||
There were no purchases of annuity contracts in
2018
and
2017
from Prudential Insurance. The approximate future annual benefit payment payable by Prudential Insurance for all annuity contracts was
$18 million
and
$21 million
as of December 31,
2018
and
2017
, respectively.
Components of Net Periodic Benefit Cost
The Company uses market related value to determine components of net periodic (benefit) cost. Market related value recognizes certain changes in fair value of plan assets over a period of five years. Changes in the fair value of U.S. equities, international equities, real estate and other assets are recognized over a five year period. However, changes in the fair value for fixed maturity assets (including short-term investments) are recognized immediately for the purposes of market related value.
Net periodic (benefit) cost included in “General and administrative expenses” in the Company’s Consolidated Statements of Operations for the years ended December 31, includes the following components:
|
|
Pension Benefits
|
Other Postretirement
Benefits
|
||||||||||||||||||||||
|
|
2018
|
2017
|
2016
|
2018
|
2017
|
2016
|
||||||||||||||||||
|
|
(in millions)
|
|||||||||||||||||||||||
|
Service cost
|
$
|
314
|
|
$
|
284
|
|
$
|
253
|
|
$
|
23
|
|
$
|
20
|
|
$
|
19
|
|
||||||
|
Interest cost
|
448
|
|
476
|
|
498
|
|
70
|
|
82
|
|
91
|
|
||||||||||||
|
Expected return on plan assets
|
(817
|
)
|
(781
|
)
|
(754
|
)
|
(108
|
)
|
(102
|
)
|
(105
|
)
|
||||||||||||
|
Amortization of transition obligation
|
0
|
|
0
|
|
0
|
|
0
|
|
0
|
|
0
|
|
||||||||||||
|
Amortization of prior service cost
|
(4
|
)
|
(3
|
)
|
(6
|
)
|
1
|
|
0
|
|
(2
|
)
|
||||||||||||
|
Amortization of actuarial (gain) loss, net
|
213
|
|
191
|
|
181
|
|
17
|
|
36
|
|
41
|
|
||||||||||||
|
Settlements
|
8
|
|
13
|
|
7
|
|
0
|
|
0
|
|
0
|
|
||||||||||||
|
Special termination benefits(1)
|
1
|
|
4
|
|
2
|
|
0
|
|
0
|
|
0
|
|
||||||||||||
|
Net periodic (benefit) cost
|
$
|
163
|
|
$
|
184
|
|
$
|
181
|
|
$
|
3
|
|
$
|
36
|
|
$
|
44
|
|
||||||
__________
|
(1)
|
Certain employees were provided special termination benefits under non-qualified plans in the form of unreduced early retirement benefits as a result of their involuntary termination.
|
Changes in Accumulated Other Comprehensive Income (Loss)
The benefit obligation is based upon actuarial assumptions such as discount, termination, retirement, mortality and salary growth rates. Changes at year-end in these actuarial assumptions, along with experience changes based on updated participant census data are deferred in AOCI. Plan assets generate actuarial gains and losses when actual returns on plan assets differ from expected returns on plan assets, and these differences are also deferred in AOCI. The cumulative deferred gain (loss) within AOCI is amortized into earnings if it exceeds 10% of the greater of the benefit obligation or plan assets at the beginning of the year, and the amortization period is based upon the actuarially calculated expected future years of service for a given plan.
253
The amounts recorded in AOCI as of the end of the period, which have not yet been recognized as a component of net periodic (benefit) cost, and the related changes in these items during the period that are recognized in “Other comprehensive income (loss)” are as follows:
|
|
Pension Benefits
|
Other Postretirement
Benefits
|
||||||||||||||||||||||
|
|
Transition
Obligation
|
Prior
Service
Cost
|
Net
Actuarial
(Gain) Loss
|
Transition
Obligation
|
Prior
Service
Cost
|
Net
Actuarial
(Gain) Loss
|
||||||||||||||||||
|
|
(in millions)
|
|||||||||||||||||||||||
|
Balance, December 31, 2015
|
$
|
0
|
|
$
|
(33
|
)
|
$
|
3,173
|
|
$
|
0
|
|
$
|
(1
|
)
|
$
|
621
|
|
||||||
|
Amortization for the period
|
0
|
|
6
|
|
(181
|
)
|
0
|
|
2
|
|
(41
|
)
|
||||||||||||
|
Deferrals for the period
|
0
|
|
3
|
|
473
|
|
0
|
|
0
|
|
(23
|
)
|
||||||||||||
|
Impact of foreign currency changes and other
|
0
|
|
(1
|
)
|
16
|
|
0
|
|
0
|
|
0
|
|
||||||||||||
|
Balance, December 31, 2016
|
0
|
|
(25
|
)
|
3,481
|
|
0
|
|
1
|
|
557
|
|
||||||||||||
|
Amortization for the period
|
0
|
|
3
|
|
(191
|
)
|
0
|
|
0
|
|
(36
|
)
|
||||||||||||
|
Deferrals for the period
|
0
|
|
0
|
|
323
|
|
0
|
|
9
|
|
(179
|
)
|
||||||||||||
|
Impact of foreign currency changes and other
|
0
|
|
0
|
|
(2
|
)
|
0
|
|
0
|
|
2
|
|
||||||||||||
|
Balance, December 31, 2017
|
0
|
|
(22
|
)
|
3,611
|
|
0
|
|
10
|
|
344
|
|
||||||||||||
|
Amortization for the period
|
0
|
|
4
|
|
(213
|
)
|
0
|
|
(1
|
)
|
(17
|
)
|
||||||||||||
|
Deferrals for the period
|
0
|
|
3
|
|
430
|
|
0
|
|
32
|
|
82
|
|
||||||||||||
|
Impact of foreign currency changes and other
|
0
|
|
0
|
|
1
|
|
0
|
|
0
|
|
(1
|
)
|
||||||||||||
|
Balance, December 31, 2018
|
$
|
0
|
|
$
|
(15
|
)
|
$
|
3,829
|
|
$
|
0
|
|
$
|
41
|
|
$
|
408
|
|
||||||
The amounts included in AOCI expected to be recognized as components of net periodic (benefit) cost in
2019
are as follows:
|
Pension
Benefits
|
Other
Postretirement
Benefits
|
|||||||
|
|
(in millions)
|
|||||||
|
Amortization of prior service cost
|
$
|
(4
|
)
|
$
|
4
|
|
||
|
Amortization of actuarial (gain) loss, net
|
215
|
|
24
|
|
||||
|
Total
|
$
|
211
|
|
$
|
28
|
|
||
The Company’s assumptions related to the calculation of the domestic benefit obligation (end of period) and the determination of net periodic (benefit) cost (beginning of period) are presented in the table below:
|
|
Pension Benefits
|
Other Postretirement Benefits
|
||||||||||||||||
|
|
2018
|
2017
|
2016
|
2018
|
2017
|
2016
|
||||||||||||
|
Weighted average assumptions
|
||||||||||||||||||
|
Discount rate (beginning of period)
|
3.65
|
%
|
4.15
|
%
|
4.50
|
%
|
3.60
|
%
|
4.05
|
%
|
4.35
|
%
|
||||||
|
Discount rate (end of period)
|
4.30
|
%
|
3.65
|
%
|
4.15
|
%
|
4.30
|
%
|
3.60
|
%
|
4.05
|
%
|
||||||
|
Rate of increase in compensation levels (beginning of period)
|
4.50
|
%
|
4.50
|
%
|
4.50
|
%
|
N/A
|
|
N/A
|
|
N/A
|
|
||||||
|
Rate of increase in compensation levels (end of period)
|
4.50
|
%
|
4.50
|
%
|
4.50
|
%
|
N/A
|
|
N/A
|
|
N/A
|
|
||||||
|
Expected return on plan assets (beginning of period)
|
6.25
|
%
|
6.25
|
%
|
6.25
|
%
|
7.00
|
%
|
7.00
|
%
|
7.00
|
%
|
||||||
|
Health care cost trend rates (beginning of period)
|
N/A
|
|
N/A
|
|
N/A
|
|
6.20
|
%
|
6.60
|
%
|
7.00
|
%
|
||||||
|
Health care cost trend rates (end of period)
|
N/A
|
|
N/A
|
|
N/A
|
|
6.00
|
%
|
6.20
|
%
|
6.60
|
%
|
||||||
|
For 2018, 2017 and 2016, the ultimate health care cost trend rate after gradual decrease until: 2024, 2021, 2021, (beginning of period)
|
N/A
|
|
N/A
|
|
N/A
|
|
5.00
|
%
|
5.00
|
%
|
5.00
|
%
|
||||||
|
For 2018, 2017 and 2016, the ultimate health care cost trend rate after gradual decrease until: 2024, 2024, 2021 (end of period)
|
N/A
|
|
N/A
|
|
N/A
|
|
5.00
|
%
|
5.00
|
%
|
5.00
|
%
|
||||||
254
The domestic discount rate used to value the pension and postretirement obligations at December 31,
2018
and December 31,
2017
is based upon the value of a portfolio of Aa-rated investments whose cash flows would be available to pay the benefit obligation’s cash flows when due. The December 31,
2018
portfolio is selected from a compilation of approximately
590
Aa-rated bonds across the full range of maturities. Since yields can vary widely at each maturity point, the Company generally avoids using the highest and lowest yielding bonds at the maturity points, so as to avoid relying on bonds that might be mispriced or misrated. This refinement process generally results in having a distribution from the
10th
to
90th
percentile. The Aa-rated portfolio is then selected and, accordingly, its value is a measure of the benefit obligation. A single equivalent discount rate is calculated to equate the value of the Aa-rated portfolio to the cash flows for the benefit obligation. The result is rounded to the nearest 5 basis points and the benefit obligation is recalculated using the rounded discount rate.
The pension and postretirement expected long-term rates of return on plan assets for
2018
were determined based upon an approach that considered the allocation of plan assets as of December 31, 2017. Expected returns are estimated by asset class as noted in the discussion of investment policies and strategies below. Expected returns on asset classes are developed using a building-block approach that is forward looking and are not strictly based upon historical returns. The building blocks for equity returns include inflation, real return, a term premium, an equity risk premium, capital appreciation, expenses, the effect of active management and the effect of rebalancing. The building blocks for fixed maturity returns include inflation, real return, a term premium, credit spread, capital appreciation, effect of active management, expenses and the effect of rebalancing.
The Company applied the same approach to the determination of the expected rate of return on plan assets in
2019
. The expected rate of return for
2019
is
6.50%
and
7.00%
for pension and postretirement, respectively.
The assumptions for foreign pension plans are based on local markets. There are no material foreign postretirement plans.
Assumed health care cost trend rates have a significant effect on the amounts reported for the health care plan. A one-percentage point increase and decrease in assumed health care cost trend rates would have the following effects:
|
|
Other Postretirement
Benefits
|
|||
|
|
(in millions)
|
|||
|
One percentage point increase
|
||||
|
Increase in total service and interest costs
|
$
|
6
|
|
|
|
Increase in postretirement benefit obligation
|
$
|
123
|
|
|
|
One percentage point decrease
|
||||
|
Decrease in total service and interest costs
|
$
|
5
|
|
|
|
Decrease in postretirement benefit obligation
|
$
|
98
|
|
|
Plan Assets
The investment goal of the domestic pension plan assets is to generate an above benchmark return on a diversified portfolio of stocks, bonds and other investments. The cash requirements of the pension obligation, which include a traditional formula principally representing payments to annuitants and a cash balance formula that allows lump sum payments and annuity payments, are designed to be met by the bonds and short-term investments in the portfolio. The pension plan risk management practices include guidelines for asset concentration, credit rating and liquidity. The pension plan does not invest in leveraged derivatives. Derivatives such as futures contracts are used to reduce transaction costs and change asset concentration, while interest rate swaps and futures are used to adjust duration.
The investment goal of the domestic postretirement plan assets is to generate an above benchmark return on a diversified portfolio of stocks, bonds, and other investments, while meeting the cash requirements for the postretirement obligation that includes a medical benefit including prescription drugs, a dental benefit and a life benefit. The postretirement plan risk management practices include guidelines for asset concentration, credit rating, liquidity and tax efficiency. The postretirement plan does not invest in leveraged derivatives. Derivatives such as futures contracts are used to reduce transaction costs and change asset concentration, while interest rate swaps and futures are used to adjust duration.
The plan fiduciaries for the Company’s pension and postretirement plans have developed guidelines for asset allocations reflecting a percentage of total assets by asset class, which are reviewed on an annual basis. Asset allocation targets as of December 31,
2018
are as follows:
255
|
|
Pension
|
Postretirement
|
||||||||||
|
|
Minimum
|
Maximum
|
Minimum
|
Maximum
|
||||||||
|
Asset Category
|
||||||||||||
|
U.S. Equities
|
2
|
%
|
9
|
%
|
26
|
%
|
61
|
%
|
||||
|
International Equities
|
2
|
%
|
9
|
%
|
2
|
%
|
20
|
%
|
||||
|
Fixed Maturities
|
53
|
%
|
66
|
%
|
10
|
%
|
54
|
%
|
||||
|
Short-term Investments
|
0
|
%
|
12
|
%
|
0
|
%
|
40
|
%
|
||||
|
Real Estate
|
2
|
%
|
17
|
%
|
0
|
%
|
0
|
%
|
||||
|
Other
|
6
|
%
|
27
|
%
|
0
|
%
|
0
|
%
|
||||
To implement the investment strategy, plan assets are invested in funds that primarily invest in securities that correspond to one of the asset categories under the investment guidelines. However, at any point in time, some of the assets in a fund may be of a different nature than the specified asset category.
Assets held with Prudential Insurance are in either pooled separate accounts or single client separate accounts. Pooled separate accounts hold assets for multiple investors. Each investor owns a “unit of account.” Single client separate accounts hold assets for only one investor, the domestic qualified pension plan, and each security in the fund is treated as individually owned. Assets held with a bank are either in common/collective trusts or single client trusts. Common or collective trusts hold assets for more than one investor. Each investor owns a “unit of account.” Single client trusts hold assets for only one investor, the domestic qualified pension plan, and each security in the fund is treated as individually owned.
There were
no
investments in Prudential Financial Common Stock as of December 31,
2018
and December 31,
2017
for either the pension or postretirement plans.
The authoritative guidance around fair value established a framework for measuring fair value. Fair value is disclosed using a fair value hierarchy that prioritizes the inputs to valuation techniques used to measure fair value, as described in Note 6.
The following describes the valuation methodologies used for pension and postretirement plans assets measured at fair value.
Insurance Company Pooled Separate Accounts, Common or Collective Trusts, and United Kingdom Insurance Pooled Funds
—Insurance company pooled separate accounts are invested via group annuity contracts issued by Prudential Insurance. Assets are represented by a “unit of account.” The redemption value of those units is based on a per unit value whose value is the result of the accumulated values of underlying investments. The underlying investments are valued in accordance with the corresponding valuation method for the investments held.
Equities
—See Note 6 for a discussion of the valuation methodologies for equity securities.
U.S. Government Securities (both Federal and State & Other), Non–U.S. Government Securities
,
and Corporate Debt
—See Note 6 for a discussion of the valuation methodologies for fixed maturity securities.
Interest Rate Swaps
—See Note 6 for a discussion of the valuation methodologies for derivative instruments.
Guaranteed Investment Contracts
—The value is based on contract cash flows and available market rates for similar investments.
Registered Investment Companies (Mutual Funds)
—Securities are priced at the NAV of shares.
Unrealized Gain (Loss) on Investment of Securities Lending Collateral
—This value is the contractual position relative to the investment of securities lending collateral.
Real Estate
—The values are determined through an independent appraisal process. The estimate of fair value is based on three approaches; (1) current cost of reproducing the property less deterioration and functional/economic obsolescence; (2) discounting a series of income streams and reversion at a specific yield or by directly capitalizing a single year income estimate by an appropriate factor; and (3) value indicated by recent sales of comparable properties in the market. Each approach requires the exercise of subjective judgment.
Short-term Investments
—Securities are valued initially at cost and thereafter adjusted for amortization of any discount or premium (i.e., amortized cost). Amortized cost approximates fair value.
256
Partnerships
—Valued at the NAV of shares. The NAV is used as a practical expedient to estimate fair value. The value of interests owned in partnerships is based on valuations of the underlying investments that include private placements, structured debt, real estate, equities, fixed maturities, commodities and other investments.
Hedge Funds
—Valued at the NAV of shares. The NAV is used as a practical expedient to estimate fair value. The value of interests in hedge funds is based on the underlying investments that include equities, debt and other investments.
Variable Life Insurance Policies
—These assets are held in group and individual variable life insurance policies issued by Prudential Insurance. Group policies are invested in Insurance Company Pooled Separate Accounts. Individual policies are invested in Registered Investment Companies (Mutual Funds). The value of interest in these policies is the cash surrender value of the policies based on the underlying investments.
Pension plan asset allocations in accordance with the investment guidelines are as follows:
257
|
|
As of December 31, 2018
|
|||||||||||||||||||
|
|
Level 1
|
Level 2
|
Level 3
|
NAV Practical Expedient
|
Total
|
|||||||||||||||
|
|
(in millions)
|
|||||||||||||||||||
|
U.S. Equities:
|
||||||||||||||||||||
|
Pooled separate accounts(1)
|
$
|
0
|
|
$
|
448
|
|
$
|
0
|
|
$
|
0
|
|
$
|
448
|
|
|||||
|
Common/collective trusts(1)
|
0
|
|
70
|
|
0
|
|
0
|
|
70
|
|
||||||||||
|
Subtotal
|
518
|
|
||||||||||||||||||
|
International Equities:
|
||||||||||||||||||||
|
Pooled separate accounts(2)
|
0
|
|
315
|
|
0
|
|
0
|
|
315
|
|
||||||||||
|
Common/collective trusts(3)
|
0
|
|
283
|
|
0
|
|
0
|
|
283
|
|
||||||||||
|
United Kingdom insurance pooled funds(4)
|
0
|
|
42
|
|
0
|
|
0
|
|
42
|
|
||||||||||
|
Subtotal
|
640
|
|
||||||||||||||||||
|
Fixed Maturities:
|
||||||||||||||||||||
|
Pooled separate accounts(5)
|
0
|
|
1,326
|
|
0
|
|
0
|
|
1,326
|
|
||||||||||
|
Common/collective trusts(6)
|
0
|
|
485
|
|
0
|
|
0
|
|
485
|
|
||||||||||
|
U.S. government securities (federal):
|
||||||||||||||||||||
|
Mortgage-backed
|
0
|
|
1
|
|
0
|
|
0
|
|
1
|
|
||||||||||
|
Other U.S. government securities
|
0
|
|
712
|
|
0
|
|
0
|
|
712
|
|
||||||||||
|
U.S. government securities (state & other)
|
0
|
|
519
|
|
0
|
|
0
|
|
519
|
|
||||||||||
|
Non-U.S. government securities
|
0
|
|
7
|
|
0
|
|
0
|
|
7
|
|
||||||||||
|
United Kingdom insurance pooled funds(7)
|
0
|
|
289
|
|
0
|
|
0
|
|
289
|
|
||||||||||
|
Corporate Debt:
|
||||||||||||||||||||
|
Corporate bonds(8)
|
0
|
|
3,476
|
|
2
|
|
0
|
|
3,478
|
|
||||||||||
|
Asset-backed
|
0
|
|
24
|
|
0
|
|
0
|
|
24
|
|
||||||||||
|
Collateralized Mortgage Obligations(9)
|
0
|
|
474
|
|
0
|
|
0
|
|
474
|
|
||||||||||
|
Collateralized Loan Obligations
|
0
|
|
293
|
|
0
|
|
0
|
|
293
|
|
||||||||||
|
Interest rate swaps (Notional amount: $1,694)
|
0
|
|
11
|
|
0
|
|
0
|
|
11
|
|
||||||||||
|
Guaranteed investment contract
|
0
|
|
53
|
|
0
|
|
0
|
|
53
|
|
||||||||||
|
Other(10)
|
299
|
|
5
|
|
62
|
|
0
|
|
366
|
|
||||||||||
|
Unrealized gain (loss) on investment of securities:
|
||||||||||||||||||||
|
lending collateral(11)
|
0
|
|
0
|
|
0
|
|
0
|
|
0
|
|
||||||||||
|
Subtotal
|
8,038
|
|
||||||||||||||||||
|
Short-term Investments:
|
||||||||||||||||||||
|
Pooled separate accounts
|
0
|
|
74
|
|
0
|
|
0
|
|
74
|
|
||||||||||
|
United Kingdom insurance pooled funds
|
0
|
|
3
|
|
0
|
|
0
|
|
3
|
|
||||||||||
|
Subtotal
|
77
|
|
||||||||||||||||||
|
Real Estate:
|
||||||||||||||||||||
|
Pooled separate accounts(12)
|
0
|
|
0
|
|
760
|
|
0
|
|
760
|
|
||||||||||
|
Partnerships
|
0
|
|
0
|
|
0
|
|
478
|
|
478
|
|
||||||||||
|
Subtotal
|
1,238
|
|
||||||||||||||||||
|
Other:
|
||||||||||||||||||||
|
Partnerships
|
0
|
|
0
|
|
0
|
|
831
|
|
831
|
|
||||||||||
|
Hedge funds
|
0
|
|
0
|
|
0
|
|
1,465
|
|
1,465
|
|
||||||||||
|
Subtotal
|
2,296
|
|
||||||||||||||||||
|
Total
|
$
|
299
|
|
$
|
8,910
|
|
$
|
824
|
|
$
|
2,774
|
|
$
|
12,807
|
|
|||||
258
|
|
As of December 31, 2017
|
|||||||||||||||||||
|
|
Level 1
|
Level 2
|
Level 3
|
NAV Practical Expedient
|
Total
|
|||||||||||||||
|
|
(in millions)
|
|||||||||||||||||||
|
U.S. Equities:
|
||||||||||||||||||||
|
Pooled separate accounts(1)
|
$
|
0
|
|
$
|
552
|
|
$
|
0
|
|
$
|
0
|
|
$
|
552
|
|
|||||
|
Common/collective trusts(1)
|
0
|
|
79
|
|
0
|
|
0
|
|
79
|
|
||||||||||
|
Subtotal
|
631
|
|
||||||||||||||||||
|
International Equities:
|
||||||||||||||||||||
|
Pooled separate accounts(2)
|
0
|
|
365
|
|
0
|
|
0
|
|
365
|
|
||||||||||
|
Common/collective trusts(3)
|
0
|
|
315
|
|
0
|
|
0
|
|
315
|
|
||||||||||
|
United Kingdom insurance pooled funds(4)
|
0
|
|
56
|
|
0
|
|
0
|
|
56
|
|
||||||||||
|
Subtotal
|
736
|
|
||||||||||||||||||
|
Fixed Maturities:
|
||||||||||||||||||||
|
Pooled separate accounts(5)
|
0
|
|
1,319
|
|
38
|
|
0
|
|
1,357
|
|
||||||||||
|
Common/collective trusts(6)
|
0
|
|
509
|
|
0
|
|
0
|
|
509
|
|
||||||||||
|
U.S. government securities (federal):
|
||||||||||||||||||||
|
Mortgage-backed
|
0
|
|
1
|
|
0
|
|
0
|
|
1
|
|
||||||||||
|
Other U.S. government securities
|
0
|
|
1,402
|
|
0
|
|
0
|
|
1,402
|
|
||||||||||
|
U.S. government securities (state & other)
|
0
|
|
556
|
|
0
|
|
0
|
|
556
|
|
||||||||||
|
Non-U.S. government securities
|
0
|
|
10
|
|
0
|
|
0
|
|
10
|
|
||||||||||
|
United Kingdom insurance pooled funds(7)
|
0
|
|
324
|
|
0
|
|
0
|
|
324
|
|
||||||||||
|
Corporate Debt:
|
||||||||||||||||||||
|
Corporate bonds(8)
|
0
|
|
3,621
|
|
1
|
|
0
|
|
3,622
|
|
||||||||||
|
Asset-backed
|
0
|
|
5
|
|
0
|
|
0
|
|
5
|
|
||||||||||
|
Collateralized Mortgage Obligations(9)
|
0
|
|
492
|
|
0
|
|
0
|
|
492
|
|
||||||||||
|
Interest rate swaps (Notional amount: $1,498)
|
0
|
|
12
|
|
0
|
|
0
|
|
12
|
|
||||||||||
|
Guaranteed investment contract
|
0
|
|
47
|
|
0
|
|
0
|
|
47
|
|
||||||||||
|
Other(10)
|
578
|
|
1
|
|
39
|
|
0
|
|
618
|
|
||||||||||
|
Unrealized gain (loss) on investment of securities:
|
||||||||||||||||||||
|
lending collateral(11)
|
0
|
|
0
|
|
0
|
|
0
|
|
0
|
|
||||||||||
|
Subtotal
|
8,955
|
|
||||||||||||||||||
|
Short-term Investments:
|
||||||||||||||||||||
|
Pooled separate accounts
|
0
|
|
56
|
|
0
|
|
0
|
|
56
|
|
||||||||||
|
United Kingdom insurance pooled funds
|
0
|
|
1
|
|
0
|
|
0
|
|
1
|
|
||||||||||
|
Subtotal
|
57
|
|
||||||||||||||||||
|
Real Estate:
|
||||||||||||||||||||
|
Pooled separate accounts(12)
|
0
|
|
0
|
|
714
|
|
0
|
|
714
|
|
||||||||||
|
Partnerships
|
0
|
|
0
|
|
0
|
|
435
|
|
435
|
|
||||||||||
|
Subtotal
|
1,149
|
|
||||||||||||||||||
|
Other:
|
||||||||||||||||||||
|
Partnerships
|
0
|
|
0
|
|
0
|
|
706
|
|
706
|
|
||||||||||
|
Hedge funds
|
0
|
|
0
|
|
0
|
|
1,421
|
|
1,421
|
|
||||||||||
|
Subtotal
|
2,127
|
|
||||||||||||||||||
|
Total
|
$
|
578
|
|
$
|
9,723
|
|
$
|
792
|
|
$
|
2,562
|
|
$
|
13,655
|
|
|||||
__________
|
(1)
|
These categories invest in U.S. equity funds whose objective is to track or outperform various indexes.
|
|
(2)
|
This category invests in a large cap international equity funds whose objective is to track an index.
|
|
(3)
|
This category invests in international equity funds, primarily large cap, whose objective is to outperform various indexes. This category also includes a global equity fund, primarily focused on new market leaders with sustainable competitive advantage.
|
|
(4)
|
This category invests in an international equity fund whose objective is to track an index.
|
|
(5)
|
This category invests in bond funds, primarily highly rated private placement securities.
|
|
(6)
|
This category invests in bond funds, primarily highly rated public securities whose objective is to outperform an index.
|
259
|
(7)
|
This category invests in bond funds, primarily highly rated corporate securities.
|
|
(8)
|
This category invests in highly rated corporate securities.
|
|
(9)
|
This category invests in highly rated Collateralized Mortgage Obligations.
|
|
(10)
|
Primarily cash and cash equivalents, short-term investments, payables and receivables, and open future contract positions (including fixed income collateral).
|
|
(11)
|
The contractual net value of the investment of securities lending collateral invested primarily in short-term bond funds is
$157 million
and
$411 million
and the liability for securities lending collateral is
$157 million
and
$411 million
for the years ended December 31, 2018 and 2017, respectively.
|
|
(12)
|
This category invests in commercial real estate and real estate securities funds, whose objective is to outperform an index.
|
Changes in Fair Value of Level 3 Pension Assets
|
|
Year Ended December 31, 2018
|
|||||||||||||||
|
|
Fixed
Maturities–
Pooled
Separate
Accounts
|
Fixed
Maturities–
Corporate Debt–
Corporate Bonds
|
Fixed
Maturities–
Other
|
Real Estate–
Pooled
Separate
Accounts
|
||||||||||||
|
|
(in millions)
|
|||||||||||||||
|
Fair Value, beginning of period
|
$
|
38
|
|
$
|
1
|
|
$
|
39
|
|
$
|
714
|
|
||||
|
Actual Return on Assets:
|
||||||||||||||||
|
Relating to assets still held at the reporting date
|
0
|
|
0
|
|
0
|
|
56
|
|
||||||||
|
Relating to assets sold during the period
|
0
|
|
0
|
|
0
|
|
8
|
|
||||||||
|
Purchases, sales and settlements
|
(38
|
)
|
(1
|
)
|
23
|
|
(18
|
)
|
||||||||
|
Transfers in and/or out of Level 3
|
0
|
|
2
|
|
0
|
|
0
|
|
||||||||
|
Fair Value, end of period
|
$
|
0
|
|
$
|
2
|
|
$
|
62
|
|
$
|
760
|
|
||||
|
|
Year Ended December 31, 2017
|
|||||||||||||||
|
|
Fixed
Maturities–
Pooled
Separate
Accounts
|
Fixed
Maturities–
Corporate Debt–
Corporate Bonds
|
Fixed
Maturities–
Other
|
Real Estate–
Pooled
Separate
Accounts
|
||||||||||||
|
|
(in millions)
|
|||||||||||||||
|
Fair Value, beginning of period
|
$
|
36
|
|
$
|
0
|
|
$
|
49
|
|
$
|
666
|
|
||||
|
Actual Return on Assets:
|
||||||||||||||||
|
Relating to assets still held at the reporting date
|
2
|
|
0
|
|
0
|
|
50
|
|
||||||||
|
Relating to assets sold during the period
|
0
|
|
0
|
|
0
|
|
6
|
|
||||||||
|
Purchases, sales and settlements
|
0
|
|
0
|
|
(10
|
)
|
(8
|
)
|
||||||||
|
Transfers in and/or out of Level 3
|
0
|
|
1
|
|
0
|
|
0
|
|
||||||||
|
Fair Value, end of period
|
$
|
38
|
|
$
|
1
|
|
$
|
39
|
|
$
|
714
|
|
||||
Postretirement plan asset allocations in accordance with the investment guidelines are as follows:
260
|
|
As of December 31, 2018
|
|||||||||||||||||||
|
|
Level 1
|
Level 2
|
Level 3
|
NAV Practical Expedient
|
Total
|
|||||||||||||||
|
|
(in millions)
|
|||||||||||||||||||
|
U.S. Equities:
|
||||||||||||||||||||
|
Variable Life Insurance Policies(1)
|
$
|
0
|
|
$
|
538
|
|
$
|
0
|
|
$
|
0
|
|
$
|
538
|
|
|||||
|
Common trusts(2)
|
0
|
|
75
|
|
0
|
|
0
|
|
75
|
|
||||||||||
|
Equities
|
25
|
|
6
|
|
0
|
|
0
|
|
31
|
|
||||||||||
|
Subtotal
|
644
|
|
||||||||||||||||||
|
International Equities:
|
||||||||||||||||||||
|
Variable Life Insurance Policies(3)
|
0
|
|
91
|
|
0
|
|
0
|
|
91
|
|
||||||||||
|
Common trusts(4)
|
0
|
|
53
|
|
0
|
|
0
|
|
53
|
|
||||||||||
|
Equities
|
0
|
|
6
|
|
0
|
|
0
|
|
6
|
|
||||||||||
|
Subtotal
|
150
|
|
||||||||||||||||||
|
Fixed Maturities:
|
||||||||||||||||||||
|
Variable Life Insurance Policies(5)
|
0
|
|
157
|
|
0
|
|
0
|
|
157
|
|
||||||||||
|
Common trusts(5)
|
0
|
|
130
|
|
0
|
|
0
|
|
130
|
|
||||||||||
|
U.S. government securities (federal):
|
||||||||||||||||||||
|
Other U.S. government securities
|
0
|
|
25
|
|
0
|
|
0
|
|
25
|
|
||||||||||
|
Corporate Debt:
|
||||||||||||||||||||
|
Corporate bonds(6)
|
0
|
|
120
|
|
0
|
|
0
|
|
120
|
|
||||||||||
|
Asset-backed
|
0
|
|
26
|
|
1
|
|
0
|
|
27
|
|
||||||||||
|
Collateralized Mortgage Obligations(7)
|
0
|
|
17
|
|
1
|
|
0
|
|
18
|
|
||||||||||
|
Collateralized Loan Obligations(8)
|
0
|
|
18
|
|
0
|
|
0
|
|
18
|
|
||||||||||
|
Interest rate swaps (Notional amount: $188)
|
0
|
|
(1
|
)
|
0
|
|
0
|
|
(1
|
)
|
||||||||||
|
Other(9)
|
3
|
|
0
|
|
3
|
|
0
|
|
6
|
|
||||||||||
|
Subtotal
|
500
|
|
||||||||||||||||||
|
Short-term Investments:
|
||||||||||||||||||||
|
Registered investment companies
|
138
|
|
0
|
|
0
|
|
0
|
|
138
|
|
||||||||||
|
Subtotal
|
138
|
|
||||||||||||||||||
|
Total
|
$
|
166
|
|
$
|
1,261
|
|
$
|
5
|
|
$
|
0
|
|
$
|
1,432
|
|
|||||
261
|
|
As of December 31, 2017
|
|||||||||||||||||||
|
|
Level 1
|
Level 2
|
Level 3
|
NAV Practical Expedient
|
Total
|
|||||||||||||||
|
|
(in millions)
|
|||||||||||||||||||
|
U.S. Equities:
|
||||||||||||||||||||
|
Variable Life Insurance Policies(1)
|
$
|
0
|
|
$
|
605
|
|
$
|
0
|
|
$
|
0
|
|
$
|
605
|
|
|||||
|
Common trusts(2)
|
0
|
|
182
|
|
0
|
|
0
|
|
182
|
|
||||||||||
|
Equities
|
0
|
|
2
|
|
0
|
|
0
|
|
2
|
|
||||||||||
|
Subtotal
|
789
|
|
||||||||||||||||||
|
International Equities:
|
||||||||||||||||||||
|
Variable Life Insurance Policies(3)
|
0
|
|
106
|
|
0
|
|
0
|
|
106
|
|
||||||||||
|
Common trusts(4)
|
0
|
|
110
|
|
0
|
|
0
|
|
110
|
|
||||||||||
|
Subtotal
|
216
|
|
||||||||||||||||||
|
Fixed Maturities:
|
||||||||||||||||||||
|
Variable Life Insurance Policies(5)
|
0
|
|
163
|
|
0
|
|
0
|
|
163
|
|
||||||||||
|
Common trusts(5)
|
0
|
|
52
|
|
0
|
|
0
|
|
52
|
|
||||||||||
|
U.S. government securities (federal):
|
||||||||||||||||||||
|
Other U.S. government securities
|
0
|
|
87
|
|
0
|
|
0
|
|
87
|
|
||||||||||
|
Non-U.S. government securities
|
0
|
|
2
|
|
0
|
|
0
|
|
2
|
|
||||||||||
|
Corporate Debt:
|
||||||||||||||||||||
|
Corporate bonds(6)
|
0
|
|
151
|
|
0
|
|
0
|
|
151
|
|
||||||||||
|
Asset-backed
|
0
|
|
28
|
|
0
|
|
0
|
|
28
|
|
||||||||||
|
Collateralized Mortgage Obligations(7)
|
0
|
|
27
|
|
2
|
|
0
|
|
29
|
|
||||||||||
|
Collateralized Loan Obligations(8)
|
0
|
|
28
|
|
2
|
|
0
|
|
30
|
|
||||||||||
|
Other(9)
|
6
|
|
0
|
|
5
|
|
0
|
|
11
|
|
||||||||||
|
Subtotal
|
553
|
|
||||||||||||||||||
|
Short-term Investments:
|
||||||||||||||||||||
|
Registered investment companies
|
57
|
|
0
|
|
0
|
|
0
|
|
57
|
|
||||||||||
|
Subtotal
|
57
|
|
||||||||||||||||||
|
Total
|
$
|
63
|
|
$
|
1,543
|
|
$
|
9
|
|
$
|
0
|
|
$
|
1,615
|
|
|||||
__________
|
(1)
|
This category invests in U.S. equity funds, primarily large cap equities whose objective is to track an index via pooled separate accounts and registered investment companies.
|
|
(2)
|
This category invests in U.S. equity funds, primarily large cap equities.
|
|
(3)
|
This category invests in international equity funds, primarily large cap international equities whose objective is to track an index.
|
|
(4)
|
This category fund invests in large cap international equity fund whose objective is to outperform an index.
|
|
(5)
|
This category invests in U.S. government and corporate bond funds.
|
|
(6)
|
This category invests in highly rated corporate bonds.
|
|
(7)
|
This category invests in highly rated Collateralized Mortgage Obligations.
|
|
(8)
|
This category invests in highly rated CLOs.
|
|
(9)
|
Cash and cash equivalents, short-term investments, payables and receivables and open future contract positions (including fixed income collateral).
|
Changes in Fair Value of Level 3 Postretirement Assets
262
|
|
Year Ended December 31, 2018
|
|||||||||||||||
|
|
Fixed
Maturities–
Corporate Debt–
Asset-backed
|
Fixed
Maturities–
Corporate Debt–
Collateralized Mortgage Obligations
|
Fixed
Maturities–
Corporate Debt–
Collateralized Loan Obligations
|
Fixed
Maturities–
Other
|
||||||||||||
|
|
(in millions)
|
|||||||||||||||
|
Fair Value, beginning of period
|
$
|
0
|
|
$
|
2
|
|
$
|
2
|
|
$
|
5
|
|
||||
|
Actual Return on Assets:
|
||||||||||||||||
|
Relating to assets still held at the reporting date
|
0
|
|
0
|
|
0
|
|
0
|
|
||||||||
|
Relating to assets sold during the period
|
0
|
|
0
|
|
0
|
|
0
|
|
||||||||
|
Purchases, sales and settlements
|
(1
|
)
|
(1
|
)
|
0
|
|
(2
|
)
|
||||||||
|
Transfers in and/or out of Level 3(1)
|
2
|
|
0
|
|
(2
|
)
|
0
|
|
||||||||
|
Fair Value, end of period
|
$
|
1
|
|
$
|
1
|
|
$
|
0
|
|
$
|
3
|
|
||||
|
|
Year Ended December 31, 2017
|
|||||||||||||||
|
|
Fixed
Maturities–
Corporate Debt–
Asset-backed
|
Fixed
Maturities–
Corporate Debt–
Collateralized Mortgage Obligations
|
Fixed
Maturities–
Corporate Debt–
Collateralized Loan Obligations
|
Fixed
Maturities–
Other
|
||||||||||||
|
|
(in millions)
|
|||||||||||||||
|
Fair Value, beginning of period
|
$
|
1
|
|
$
|
5
|
|
$
|
0
|
|
$
|
5
|
|
||||
|
Actual Return on Assets:
|
||||||||||||||||
|
Relating to assets still held at the reporting date
|
0
|
|
0
|
|
0
|
|
0
|
|
||||||||
|
Relating to assets sold during the period
|
0
|
|
0
|
|
0
|
|
0
|
|
||||||||
|
Purchases, sales and settlements
|
0
|
|
(3
|
)
|
2
|
|
0
|
|
||||||||
|
Transfers in and/or out of Level 3(1)
|
(1
|
)
|
0
|
|
0
|
|
0
|
|
||||||||
|
Fair Value, end of period
|
$
|
0
|
|
$
|
2
|
|
$
|
2
|
|
$
|
5
|
|
||||
__________
|
(1)
|
The transfers from level 3 to level 2 are due to the availability of external pricing sources.
|
A summary of pension and postretirement plan asset allocation as of the year ended December 31, are as follows:
|
|
Pension
Percentage of Plan Assets
|
Postretirement
Percentage of Plan Assets
|
||||||||||
|
|
2018
|
2017
|
2018
|
2017
|
||||||||
|
Asset Category
|
||||||||||||
|
U.S. Equities
|
4
|
%
|
5
|
%
|
43
|
%
|
49
|
%
|
||||
|
International Equities
|
5
|
|
5
|
|
10
|
|
13
|
|
||||
|
Fixed Maturities
|
63
|
|
66
|
|
37
|
|
34
|
|
||||
|
Short-term Investments
|
0
|
|
0
|
|
10
|
|
4
|
|
||||
|
Real Estate
|
10
|
|
8
|
|
0
|
|
0
|
|
||||
|
Other
|
18
|
|
16
|
|
0
|
|
0
|
|
||||
|
Total
|
100
|
%
|
100
|
%
|
100
|
%
|
100
|
%
|
||||
The expected benefit payments for the Company’s pension and postretirement plans, as well as the expected Medicare Part D subsidy receipts related to the Company’s postretirement plan, for the years indicated are as follows:
263
|
Pension Benefit
Payments
|
Other
Postretirement
Benefit Payments
|
Other
Postretirement
Benefits–
Medicare Part
D Subsidy
Receipts
|
||||||||||
|
|
(in millions)
|
|||||||||||
|
2019
|
$
|
830
|
|
$
|
145
|
|
$
|
8
|
|
|||
|
2020
|
776
|
|
147
|
|
8
|
|
||||||
|
2021
|
799
|
|
149
|
|
8
|
|
||||||
|
2022
|
833
|
|
150
|
|
8
|
|
||||||
|
2023
|
847
|
|
150
|
|
7
|
|
||||||
|
2024-2028
|
4,523
|
|
733
|
|
35
|
|
||||||
|
Total
|
$
|
8,608
|
|
$
|
1,474
|
|
$
|
74
|
|
|||
The Company anticipates that it will make cash contributions in
2019
of approximately
$260 million
to the pension plans and approximately
$10 million
to the postretirement plans.
Postemployment Benefits
The Company accrues postemployment benefits for income continuance and health and life benefits provided to former or inactive employees who are not retirees. The net accumulated liability for these benefits at December 31,
2018
and
2017
was
$1 million
and
$0 million
, respectively, and is included in “Other liabilities.”
Other Employee Benefits
The Company sponsors voluntary savings plans for employees (401(k) plans). The plans provide for salary reduction contributions by employees and matching contributions by the Company of up to
4%
of annual salary. The matching contributions by the Company included in “General and administrative expenses” were
$89 million
,
$74 million
and
$72 million
for the years ended December 31,
2018
,
2017
and
2016
, respectively.
|
18.
|
EQUITY
|
Preferred Stock
As of December 31,
2018
,
2017
and
2016
, the Company had
10,000,000
shares of preferred stock authorized but
none
issued or outstanding.
Common Stock
On the date of demutualization in December 2001, Prudential Financial completed an initial public offering of its Common Stock. The shares of Common Stock issued were in addition to shares of Common Stock the Company distributed to policyholders as part of the demutualization. The Common Stock is traded on the New York Stock Exchange under the symbol “PRU”. Through December 31, 2014, the Common Stock reflected the performance of the Company’s former Financial Services Businesses which excluded the Closed Block Business. As a result of the Class B Repurchase described in the following paragraph, beginning in 2015, the Common Stock reflects the consolidated performance of Prudential Financial. In the event of a liquidation, dissolution or winding-up of the Company, holders of Common Stock would be entitled to receive a proportionate share of the net assets of the Company that remain after paying all liabilities and the liquidation preferences of any preferred stock.
264
Also on the date of demutualization, Prudential Financial completed the sale, through a private placement, of
2.0 million
shares of Class B Stock at a price of
$87.50
per share. The Class B Stock was a separate class of common stock not traded publicly, which reflected the performance of the Company’s former Closed Block Business. On January 2, 2015, pursuant to a share repurchase agreement entered into on December 1, 2014, between the Company and the holders of the Class B Stock, the Company repurchased and canceled all of the shares of the Class B Stock for an aggregate cash purchase price of
$651 million
, resulting in the elimination of the Class B Stock held in treasury, a
$484 million
decrease in “Retained earnings” and a
$167 million
decrease in “Additional paid-in capital.” In accordance with the terms of the Share Repurchase Agreement, the holders of the Class B Stock subsequently exercised their right to dispute the calculation of the purchase price. This dispute was resolved during the first quarter of 2016, resulting in an increase to the cash purchase price of
$119 million
, bringing the total aggregate purchase price to
$770 million
. The increase to the cash purchase price resulted in a corresponding decrease in “Retained earnings.”
The changes in the number of shares of Common Stock issued, held in treasury and outstanding, are as follows for the periods indicated:
|
|
Common Stock
|
||||||||
|
|
Issued
|
Held In
Treasury
|
Outstanding
|
||||||
|
|
|||||||||
|
|
(in millions)
|
||||||||
|
Balance, December 31, 2015
|
660.1
|
|
213.0
|
|
447.1
|
|
|||
|
Common Stock issued
|
0.0
|
|
0.0
|
|
0.0
|
|
|||
|
Common Stock acquired
|
0.0
|
|
25.1
|
|
(25.1
|
)
|
|||
|
Stock-based compensation programs(1)
|
0.0
|
|
(7.6
|
)
|
7.6
|
|
|||
|
Balance, December 31, 2016
|
660.1
|
|
230.5
|
|
429.6
|
|
|||
|
Common Stock issued
|
0.0
|
|
0.0
|
|
0.0
|
|
|||
|
Common Stock acquired
|
0.0
|
|
11.5
|
|
(11.5
|
)
|
|||
|
Stock-based compensation programs(1)
|
0.0
|
|
(4.5
|
)
|
4.5
|
|
|||
|
Balance, December 31, 2017
|
660.1
|
|
237.5
|
|
422.6
|
|
|||
|
Common Stock issued
|
0.0
|
|
0.0
|
|
0.0
|
|
|||
|
Common Stock acquired
|
0.0
|
|
14.9
|
|
(14.9
|
)
|
|||
|
Stock-based compensation programs(1)
|
0.0
|
|
(3.0
|
)
|
3.0
|
|
|||
|
Balance, December 31, 2018
|
660.1
|
|
249.4
|
|
410.7
|
|
|||
__________
|
(1)
|
Represents net shares issued from treasury pursuant to the Company’s stock-based compensation programs.
|
Additional paid-in capital
Additional paid-in capital is primarily comprised of the cumulative excess between: (a) the total cash received by the Company in conjunction with past issuances of Common Stock shares or Common Stock shares reissued from treasury in conjunction with the Company’s stock-based compensation program and (b) the total par value associated with those shares (
$.01
per share).
Common stock held in treasury
Common Stock held in treasury represents the Company’s previously issued shares of stock which have been repurchased by the Company but not retired. These shares are accounted for at the cost at which they were acquired. Common Stock held in treasury is typically impacted by repurchases of shares under the Board of Directors approved share repurchase program and by reissuances of shares associated with our stock-based compensation programs which are accounted for at average cost upon reissuance. Gains resulting from the reissuance of Common Stock held in treasury are credited to Additional paid-in capital. Losses resulting from the reissuance of Common Stock held in treasury are charged first to Additional paid-in capital to the extent the Company has previously recorded gains on treasury share transactions, then to Retained earnings.
The Board of Directors may from time to time, at its discretion, authorize management to repurchase shares of Common Stock of the Company. The timing and amount of share repurchases are determined by management based upon market conditions and other considerations, and repurchases may be executed in the open market, through derivative, accelerated repurchase and other negotiated transactions and through prearranged trading plans complying with Rule 10b5-1(c) under the Securities Exchange Act of 1934 (the “Exchange Act”). Numerous factors could affect the timing and amount of any future repurchases under the share repurchase authorization, including increased capital needs of the Company due to changes in regulatory capital requirements, opportunities for growth and acquisitions, and the effect of adverse market conditions on the segments.
265
The following table summarizes share repurchases for each of the past three years as well as the share repurchase authorization for 2019 which was approved by the Board of Directors in December 2018.
|
January 1, 2019 -
December 31, 2019
|
|
January 1, 2018 -
December 31, 2018
|
|
January 1, 2017 -
December 31, 2017
|
|
January 1, 2016 -
December 31, 2016
|
|
|||||||||
|
Total Board authorized share repurchase amount ($ in billions)
|
$
|
2.0
|
|
$
|
1.5
|
|
$
|
1.25
|
|
$
|
2.0
|
|
||||
|
Total number of shares repurchased under this authorization as of the period end (in millions)
|
N/A*
|
|
14.9
|
|
11.5
|
|
25.1
|
|
||||||||
__________
* Share repurchase authorization for a future period.
Accumulated Other Comprehensive Income (Loss)
AOCI represents the cumulative OCI items that are reported separate from net income and detailed on the Consolidated Statements of Comprehensive Income. Each of the components that comprise OCI are described in further detail in Note 2 (Foreign Currency Translation Adjustment and Net Unrealized Investment Gains (Losses)) and Note 17 (Pension and Postretirement Unrecognized Net Periodic Benefit (Cost)). The balance of and changes in each component of AOCI as of and for the years ended December 31, are as follows:
|
|
Accumulated Other Comprehensive Income (Loss)
Attributable to Prudential Financial, Inc.
|
||||||||||||||
|
|
Foreign
Currency
Translation
Adjustment
|
Net Unrealized
Investment
Gains
(Losses)(1)
|
Pension and
Postretirement
Unrecognized Net
Periodic Benefit (Cost)
|
Total Accumulated Other Comprehensive Income (Loss)
|
|||||||||||
|
|
(in millions)
|
||||||||||||||
|
Balance, December 31, 2015
|
$
|
(1,087
|
)
|
$
|
15,773
|
|
$
|
(2,401
|
)
|
$
|
12,285
|
|
|||
|
Change in OCI before reclassifications
|
199
|
|
5,176
|
|
(468
|
)
|
4,907
|
|
|||||||
|
Amounts reclassified from AOCI
|
13
|
|
(1,493
|
)
|
214
|
|
(1,266
|
)
|
|||||||
|
Income tax benefit (expense)
|
(98
|
)
|
(1,285
|
)
|
78
|
|
(1,305
|
)
|
|||||||
|
Balance, December 31, 2016
|
(973
|
)
|
18,171
|
|
(2,577
|
)
|
14,621
|
|
|||||||
|
Change in OCI before reclassifications
|
768
|
|
4,026
|
|
(153
|
)
|
4,641
|
|
|||||||
|
Amounts reclassified from AOCI
|
1
|
|
(1,629
|
)
|
224
|
|
(1,404
|
)
|
|||||||
|
Income tax benefit (expense)
|
(65
|
)
|
(600
|
)
|
(119
|
)
|
(784
|
)
|
|||||||
|
Balance, December 31, 2017
|
(269
|
)
|
19,968
|
|
(2,625
|
)
|
17,074
|
|
|||||||
|
Change in OCI before reclassifications
|
(74
|
)
|
(7,614
|
)
|
(547
|
)
|
(8,235
|
)
|
|||||||
|
Amounts reclassified from AOCI
|
1
|
|
(779
|
)
|
227
|
|
(551
|
)
|
|||||||
|
Income tax benefit (expense)
|
9
|
|
1,735
|
|
68
|
|
1,812
|
|
|||||||
|
Cumulative effect of adoption of ASU 2016-01
|
0
|
|
(847
|
)
|
0
|
|
(847
|
)
|
|||||||
|
Cumulative effect of adoption of ASU 2018-02
|
(231
|
)
|
2,282
|
|
(398
|
)
|
1,653
|
|
|||||||
|
Balance, December 31, 2018
|
$
|
(564
|
)
|
$
|
14,745
|
|
$
|
(3,275
|
)
|
$
|
10,906
|
|
|||
__________
|
(1)
|
Includes cash flow hedges of
$811 million
,
$(39) million
and
$1,316 million
as of December 31,
2018
,
2017
, and
2016
, respectively.
|
266
Reclassifications out of Accumulated Other Comprehensive Income (Loss)
|
|
Years Ended December 31,
|
Affected line item in Consolidated
Statements of Operations
|
|||||||||||
|
|
2018
|
2017
|
2016
|
||||||||||
|
|
(in millions)
|
|
|||||||||||
|
Amounts reclassified from AOCI(1)(2):
|
|||||||||||||
|
Foreign currency translation adjustment:
|
|||||||||||||
|
Foreign currency translation adjustment
|
$
|
(1
|
)
|
$
|
(3
|
)
|
$
|
(13
|
)
|
Realized investment gains (losses), net
|
|||
|
Foreign currency translation adjustment
|
0
|
|
2
|
|
0
|
|
Other income (loss)
|
||||||
|
Total foreign currency translation adjustment
|
(1
|
)
|
(1
|
)
|
(13
|
)
|
|||||||
|
Net unrealized investment gains (losses):
|
|||||||||||||
|
Cash flow hedges—Interest Rate
|
1
|
|
(2
|
)
|
(5
|
)
|
(3)
|
||||||
|
Cash flow hedges—Currency
|
7
|
|
0
|
|
0
|
|
(3)
|
||||||
|
Cash flow hedges—Currency/Interest rate
|
543
|
|
(16
|
)
|
456
|
|
(3)
|
||||||
|
Net unrealized investment gains (losses) on available-for-sale securities
|
228
|
|
1,647
|
|
1,042
|
|
|||||||
|
Total net unrealized investment gains (losses)
|
779
|
|
1,629
|
|
1,493
|
|
(4)
|
||||||
|
Amortization of defined benefit items:
|
|||||||||||||
|
Prior service cost
|
3
|
|
3
|
|
8
|
|
(5)
|
||||||
|
Actuarial gain (loss)
|
(230
|
)
|
(227
|
)
|
(222
|
)
|
(5)
|
||||||
|
Total amortization of defined benefit items
|
(227
|
)
|
(224
|
)
|
(214
|
)
|
|||||||
|
Total reclassifications for the period
|
$
|
551
|
|
$
|
1,404
|
|
$
|
1,266
|
|
||||
__________
|
(1)
|
All amounts are shown before tax.
|
|
(2)
|
Positive amounts indicate gains/benefits reclassified out of AOCI. Negative amounts indicate losses/costs reclassified out of AOCI.
|
|
(3)
|
See Note 5 for additional information on cash flow hedges.
|
|
(4)
|
See table below for additional information on unrealized investment gains (losses), including the impact on deferred policy acquisition and other costs, future policy benefits and policyholders’ dividends.
|
|
(5)
|
See Note 17 for information on employee benefit plans.
|
267
Net Unrealized Investment Gains (Losses)
Net unrealized investment gains (losses) on securities classified as available-for-sale and certain other invested assets and other assets are included in the Company’s Consolidated Statements of Financial Position as a component of AOCI. Changes in these amounts include reclassification adjustments to exclude from “Other comprehensive income (loss)” those items that are included as part of “Net income” for a period that had been part of “Other comprehensive income (loss)” in earlier periods. The amounts for the periods indicated below, split between amounts related to fixed maturity securities on which an OTTI loss has been recognized, and all other net unrealized investment gains (losses), are as follows:
Net Unrealized Investment Gains (Losses) on Fixed Maturity Securities on which an OTTI loss has been recognized
|
Net Unrealized
Gains (Losses)
on Investments
|
DAC, DSI, VOBA and Reinsurance Recoverables
|
Future Policy
Benefits, Policyholders’
Account
Balances and Reinsurance Payables
|
Policyholders’
Dividends
|
Deferred
Income
Tax
(Liability)
Benefit
|
Accumulated Other Comprehensive Income (Loss)
Related to Net
Unrealized
Investment
Gains (Losses)
|
||||||||||||||||||
|
|
(in millions)
|
||||||||||||||||||||||
|
Balance, December 31, 2015
|
$
|
234
|
|
$
|
6
|
|
$
|
14
|
|
$
|
(31
|
)
|
$
|
(77
|
)
|
$
|
146
|
|
|||||
|
Net investment gains (losses) on investments arising during the period
|
93
|
|
(31
|
)
|
62
|
|
|||||||||||||||||
|
Reclassification adjustment for (gains) losses included in net income
|
1
|
|
0
|
|
1
|
|
|||||||||||||||||
|
Reclassification adjustment for OTTI losses excluded from net income(1)
|
(16
|
)
|
5
|
|
(11
|
)
|
|||||||||||||||||
|
Impact of net unrealized investment (gains) losses on DAC, DSI and VOBA
|
(11
|
)
|
3
|
|
(8
|
)
|
|||||||||||||||||
|
Impact of net unrealized investment (gains) losses on future policy benefits and policyholders’ account balances
|
(20
|
)
|
(3
|
)
|
(23
|
)
|
|||||||||||||||||
|
Impact of net unrealized investment (gains) losses on policyholders’ dividends
|
(16
|
)
|
6
|
|
(10
|
)
|
|||||||||||||||||
|
Balance, December 31, 2016
|
312
|
|
(5
|
)
|
(6
|
)
|
(47
|
)
|
(97
|
)
|
157
|
|
|||||||||||
|
Net investment gains (losses) on investments arising during the period
|
79
|
|
(22
|
)
|
57
|
|
|||||||||||||||||
|
Reclassification adjustment for (gains) losses included in net income
|
(85
|
)
|
23
|
|
(62
|
)
|
|||||||||||||||||
|
Reclassification adjustment for OTTI losses excluded from net income(1)
|
(20
|
)
|
5
|
|
(15
|
)
|
|||||||||||||||||
|
Impact of net unrealized investment (gains) losses on DAC, DSI, VOBA and reinsurance recoverables
|
3
|
|
(1
|
)
|
2
|
|
|||||||||||||||||
|
Impact of net unrealized investment (gains) losses on future policy benefits, policyholders’ account balances and reinsurance payables
|
9
|
|
(2
|
)
|
7
|
|
|||||||||||||||||
|
Impact of net unrealized investment (gains) losses on policyholders’ dividends
|
1
|
|
0
|
|
1
|
|
|||||||||||||||||
|
Balance, December 31, 2017
|
286
|
|
(2
|
)
|
3
|
|
(46
|
)
|
(94
|
)
|
147
|
|
|||||||||||
|
Net investment gains (losses) on investments arising during the period
|
(19
|
)
|
8
|
|
(11
|
)
|
|||||||||||||||||
|
Reclassification adjustment for (gains) losses included in net income
|
(76
|
)
|
33
|
|
(43
|
)
|
|||||||||||||||||
|
Reclassification adjustment for OTTI losses excluded from net income(1)
|
(2
|
)
|
1
|
|
(1
|
)
|
|||||||||||||||||
|
Impact of net unrealized investment (gains) losses on DAC, DSI, VOBA and reinsurance recoverables
|
1
|
|
0
|
|
1
|
|
|||||||||||||||||
|
Impact of net unrealized investment (gains) losses on future policy benefits, policyholders’ account balances and reinsurance payables
|
1
|
|
0
|
|
1
|
|
|||||||||||||||||
|
Impact of net unrealized investment (gains) losses on policyholders’ dividends
|
23
|
|
(9
|
)
|
14
|
|
|||||||||||||||||
|
Balance, December 31, 2018
|
$
|
189
|
|
$
|
(1
|
)
|
$
|
4
|
|
$
|
(23
|
)
|
$
|
(61
|
)
|
$
|
108
|
|
|||||
__________
|
(1)
|
Represents “transfers in” related to the portion of OTTI losses recognized during the period that were not recognized in earnings for securities with no prior OTTI loss.
|
268
All Other Net Unrealized Investment Gains (Losses) in AOCI
|
Net Unrealized
Gains (Losses) on Investments(1) |
DAC, DSI, VOBA and Reinsurance Recoverables
|
Future Policy
Benefits, Policyholders’
Account
Balances and Reinsurance Payables
|
Policyholders’
Dividends |
Deferred
Income Tax (Liability) Benefit |
Accumulated Other Comprehensive Income (Loss)
Related to Net Unrealized Investment Gains (Losses) |
||||||||||||||||||
|
|
(in millions)
|
||||||||||||||||||||||
|
Balance, December 31, 2015
|
$
|
28,240
|
|
$
|
(760
|
)
|
$
|
(1,082
|
)
|
$
|
(2,802
|
)
|
$
|
(7,969
|
)
|
$
|
15,627
|
|
|||||
|
Net investment gains (losses) on investments arising during the period
|
5,658
|
|
(1,910
|
)
|
3,748
|
|
|||||||||||||||||
|
Reclassification adjustment for (gains) losses included in net income
|
(1,494
|
)
|
504
|
|
(990
|
)
|
|||||||||||||||||
|
Reclassification adjustment for OTTI losses excluded from net income(2)
|
16
|
|
(5
|
)
|
11
|
|
|||||||||||||||||
|
Impact of net unrealized investment (gains) losses on DAC, DSI and VOBA
|
(296
|
)
|
93
|
|
(203
|
)
|
|||||||||||||||||
|
Impact of net unrealized investment (gains) losses on future policy benefits and policyholders’ account balances
|
(54
|
)
|
(9
|
)
|
(63
|
)
|
|||||||||||||||||
|
Impact of net unrealized investment (gains) losses on policyholders’ dividends
|
(178
|
)
|
62
|
|
(116
|
)
|
|||||||||||||||||
|
Balance, December 31, 2016
|
32,420
|
|
(1,056
|
)
|
(1,136
|
)
|
(2,980
|
)
|
(9,234
|
)
|
18,014
|
|
|||||||||||
|
Net investment gains (losses) on investments arising during the period
|
5,216
|
|
(1,425
|
)
|
3,791
|
|
|||||||||||||||||
|
Reclassification adjustment for (gains) losses included in net income
|
(1,544
|
)
|
421
|
|
(1,123
|
)
|
|||||||||||||||||
|
Reclassification adjustment for OTTI losses excluded from net income(2)
|
20
|
|
(5
|
)
|
15
|
|
|||||||||||||||||
|
Impact of net unrealized investment (gains) losses on DAC, DSI, VOBA and reinsurance recoverables
|
(524
|
)
|
191
|
|
(333
|
)
|
|||||||||||||||||
|
Impact of net unrealized investment (gains) losses on future policy benefits, policyholders’ account balances and reinsurance payables
|
(107
|
)
|
25
|
|
(82
|
)
|
|||||||||||||||||
|
Impact of net unrealized investment (gains) losses on policyholders’ dividends
|
(651
|
)
|
190
|
|
(461
|
)
|
|||||||||||||||||
|
Balance, December 31, 2017
|
36,112
|
|
(1,580
|
)
|
(1,243
|
)
|
(3,631
|
)
|
(9,837
|
)
|
19,821
|
|
|||||||||||
|
Net investment gains (losses) on investments arising during the period
|
(10,838
|
)
|
2,893
|
|
(7,945
|
)
|
|||||||||||||||||
|
Reclassification adjustment for (gains) losses included in net income
|
(703
|
)
|
303
|
|
(400
|
)
|
|||||||||||||||||
|
Reclassification adjustment for OTTI losses excluded from net income(2)
|
2
|
|
(1
|
)
|
1
|
|
|||||||||||||||||
|
Impact of net unrealized investment (gains) losses on DAC, DSI, VOBA and reinsurance recoverables
|
842
|
|
(263
|
)
|
579
|
|
|||||||||||||||||
|
Impact of net unrealized investment (gains) losses on future policy benefits, policyholders’ account balances and reinsurance payables
|
452
|
|
(186
|
)
|
266
|
|
|||||||||||||||||
|
Impact of net unrealized investment (gains) losses on policyholders’ dividends
|
1,924
|
|
(874
|
)
|
1,050
|
|
|||||||||||||||||
|
Cumulative effect of adoption of ASU 2016-01
|
(2,042
|
)
|
813
|
|
212
|
|
(1,017
|
)
|
|||||||||||||||
|
Cumulative effect of adoption of ASU 2018-02
|
2,282
|
|
2,282
|
|
|||||||||||||||||||
|
Balance, December 31, 2018
|
$
|
22,531
|
|
$
|
(738
|
)
|
$
|
(791
|
)
|
$
|
(894
|
)
|
$
|
(5,471
|
)
|
$
|
14,637
|
|
|||||
__________
|
(1)
|
Includes cash flow hedges. See Note 5 for information on cash flow hedges.
|
|
(2)
|
Represents “transfers out” related to the portion of OTTI losses recognized during the period that were not recognized in earnings for securities with no prior OTTI loss.
|
Retained earnings
269
Retained earnings primarily represents the cumulative net income earned by the Company that has been retained by the Company as of the reporting date. Other unique items, included but not limited to the adoption of new accounting standards updates, may also impact retained earnings. In any given period, retained earnings may increase due to net income and may decrease due to net losses or the declaration of dividends. The declaration and payment of dividends on the Common Stock is limited by New Jersey corporate law, pursuant to which Prudential Financial is prohibited from paying a Common Stock dividend if, after giving effect to that dividend, either (a) the Company would be unable to pay its debts as they become due in the usual course of its business or (b) the Company’s total assets would be less than its liabilities. In addition, the terms of the Company’s outstanding junior subordinated debt include a “dividend stopper” provision that restricts the payment of dividends on the Common Stock if interest payments are not made on the junior subordinated debt.
Other than the above limitations, the Company’s Retained earnings balance is free of restrictions for the payment of Common Stock dividends; however, Common Stock dividends will be dependent upon financial conditions, results of operations, cash needs, future prospects and other factors, including cash available to Prudential Financial, the parent holding company. The principal sources of funds available to Prudential Financial are dividends and returns of capital from its subsidiaries, loans from its subsidiaries, repayments of operating loans from its subsidiaries, and cash and other highly liquid assets. The primary uses of funds at Prudential Financial include servicing its debt, operating expenses, capital contributions and loans to subsidiaries, the payment of declared shareholder dividends and repurchases of outstanding shares of Common Stock if executed under Board authority. As of December 31,
2018
, Prudential Financial had highly liquid assets (excluding amounts held in an intercompany liquidity account) of
$5,548 million
predominantly including cash, short-term investments, U.S. Treasury securities, obligations of other U.S. government authorities and agencies, and/or foreign government bonds.
Future cash available at Prudential Financial to support the payment of future Common Stock dividends is dependent on the receipt of dividends or other funds from its subsidiaries, the majority of which are subject to comprehensive regulation, including limitations on their payment of dividends and other transfers of funds, which are discussed in this Note further below.
Non-controlling interests
For certain subsidiaries, the Company owns a controlling interest that is less than
100%
ownership of the subsidiary but must consolidate
100%
of the subsidiary’s financial statements in accordance with U.S. GAAP. Non-controlling interests represent the portion of equity ownership in a consolidated subsidiary that is not attributable to the Company.
Insurance Subsidiaries - Statutory Financial Information and Restrictions on Payments of Dividends
U.S. Insurance Subsidiaries - Statutory Financial Information
The Company’s domestic insurance subsidiaries are required to prepare statutory financial statements in accordance with statutory accounting practices prescribed or permitted by the insurance department of the state of domicile. Statutory accounting practices primarily differ from U.S. GAAP by charging policy acquisition costs to expense as incurred, establishing future policy benefit liabilities using different actuarial assumptions as well as valuing investments and certain assets and accounting for deferred taxes on a different basis.
The risk-based capital (“RBC”) ratio is a primary measure by which the Company and its insurance regulators evaluate the capital adequacy of Prudential Insurance and the Company’s other domestic insurance subsidiaries. RBC is determined by NAIC-prescribed formulas that consider, among other things, risks related to the type and quality of the invested assets, insurance-related risks associated with an insurer’s products and liabilities, interest rate risks and general business risks. Insurers that have less statutory capital than required are considered to have inadequate capital and are subject to varying degrees of regulatory action depending upon the level of capital inadequacy. The Company expects to report RBC ratios as of December 31,
2018
above the regulatory required minimums that would require corrective action and above our “AA” financial strength target levels for both Prudential Insurance and Prudential Annuities Life Assurance Corporation (“PALAC”).
The following table summarizes certain statutory financial information for the Company’s two largest U.S. insurance subsidiaries for the periods indicated:
270
|
Prudential Insurance
|
PALAC
|
|||||||||||||||||||||||
|
In millions and presented as of or for the year ended
|
December 31, 2018
|
December 31, 2017
|
December 31, 2016
|
December 31, 2018
|
December 31, 2017
|
December 31, 2016
|
||||||||||||||||||
|
Statutory net income (loss)
|
$
|
1,324
|
|
$
|
(217
|
)
|
$
|
5,214
|
|
$
|
(852
|
)
|
$
|
3,911
|
|
$
|
(2,018
|
)
|
||||||
|
Statutory capital and surplus
|
$
|
10,465
|
|
$
|
9,948
|
|
$
|
11,290
|
|
$
|
6,396
|
|
$
|
8,059
|
|
$
|
5,718
|
|
||||||
U.S. Insurance Subsidiaries - Restrictions on Payment of Dividends to Prudential Financial, the Parent Holding Company
With respect to Prudential Insurance, a New Jersey domiciled insurance subsidiary which is also the Company’s primary domestic insurance subsidiary, New Jersey insurance law provides that, except in the case of extraordinary dividends (as described below), all dividends or other distributions paid by Prudential Insurance may be paid only from unassigned surplus, as determined pursuant to statutory accounting principles, less cumulative unrealized investment gains and losses and revaluation of assets as of the prior calendar year-end. As of December 31,
2018
, Prudential Insurance’s unassigned surplus less applicable adjustments for cumulative unrealized investment gains was
$8,067 million
. Prudential Insurance must give prior notification to the NJDOBI of its intent to pay any such dividend or distribution. Also, if any dividend, together with other dividends or distributions made within the preceding twelve months, exceeds the greater of (i)
10%
of statutory capital and surplus as of the preceding December 31 or (ii) its statutory net gain from operations excluding realized investment gains and losses for the twelve-month period ending on the preceding December 31, the dividend is considered to be an “extraordinary dividend” and requires the prior approval of the NJDOBI. Under New Jersey insurance law, Prudential Insurance is permitted to pay an ordinary dividend of up to
$1,404 million
in 2019, without prior approval of the NJDOBI.
The laws regulating dividends of the states where the Company’s other domestic insurance subsidiaries are domiciled are similar, but not identical, to New Jersey. With respect to PALAC, an Arizona domiciled insurance subsidiary of the Company, Arizona insurance law provides that if any dividend, together with other dividends or distributions made within the preceding twelve months, exceeds the lesser of (i)
10%
of statutory capital and surplus as of the preceding December 31 or (ii) its statutory net gain from operations excluding realized investment gains and losses for the twelve month period ending on the preceding December 31, the dividend is considered to be an “extraordinary dividend” and requires prior approval of the Arizona Department of Insurance. Under Arizona law, PALAC is not permitted to pay an ordinary dividend in 2019 without prior approval of the Arizona Department of Insurance.
International Insurance Subsidiaries - Statutory Financial Information
The Company’s international insurance subsidiaries prepare financial statements in accordance with local regulatory requirements. These statutory accounting practices differ from U.S. GAAP primarily by charging policy acquisition costs to expense as incurred and establishing future policy benefit liabilities using different actuarial assumptions, as well as valuing investments and certain assets and accounting for deferred taxes on a different basis.
The Japan Financial Services Agency (“FSA”) utilizes a solvency margin ratio to evaluate the capital adequacy of Japanese insurance companies. The solvency margin ratio considers the level of solvency margin capital to a solvency margin risk amount, which is calculated in a similar manner to RBC. As of December 31,
2018
, the Company expects The Prudential Life Insurance Company Ltd. (“Prudential of Japan”) and Gibraltar Life both had solvency margin capital in excess of
3.5
times the regulatory required minimums that would require corrective action.
All of the Company’s domestic and international insurance subsidiaries have capital and surplus levels that exceed their respective regulatory minimum requirements, and none utilized prescribed or permitted practices that vary materially from the practices prescribed by the NAIC or equivalent regulatory bodies for results reported as of December 31,
2018
and
2017
, respectively, or for the years ended December 31,
2018
,
2017
and
2016
, respectively.
International Insurance Subsidiaries - Restrictions on Payment of Dividends to Prudential Financial, the Parent Holding Company
271
The Company’s international insurance operations are subject to dividend restrictions from the regulatory authorities in the jurisdictions in which they operate. With respect to Prudential of Japan and Gibraltar Life, the Company’s most significant international insurance subsidiaries, both of which are domiciled in Japan, Japan insurance law provides that common stock dividends may be paid in an amount of up to
83%
of prior fiscal year statutory after-tax earnings, after certain reserving thresholds are met, including providing for policyholder dividends. If statutory retained earnings exceed
100%
of statutory paid-in capital,
100%
of prior year statutory after-tax earnings may be paid, after reserving thresholds are met. Dividends in excess of these amounts and other forms of capital distribution require the prior approval of the FSA. Additionally, Prudential of Japan and Gibraltar Life must give prior notification to the FSA of their intent to pay any dividend or distribution. In addition to paying common stock dividends, Prudential of Japan and Gibraltar Life may return capital to Prudential Financial through other means, such as the repayment of subordinated debt or preferred stock obligations held by Prudential Financial or other affiliates and affiliated lending, derivatives and reinsurance.
For the year ended
December 31, 2018
, Prudential Financial received
$2,062 million
from Prudential International Insurance Holdings, the domestic parent of our international insurance subsidiaries, all of which was received from PHJ, the parent of the Company’s Japanese operations. Of this amount,
$260 million
was sent to PHJ from its subsidiaries in 2016 and had been retained at PHJ since that time. PHJ received the remaining
$1,802 million
as a common stock dividend from its subsidiaries in 2018. The current regulatory fiscal year end for both Prudential of Japan and Gibraltar Life is March 31,
2019
, after which time the common stock dividend amount permitted to be paid without prior approval from the FSA can be determined.
In addition, although prior regulatory approval may not be required by law for the payment of dividends up to the limitations described above, in practice, the Company would typically discuss any dividend payments with the applicable regulatory authority prior to payment. Additionally, the payment of dividends by the Company’s subsidiaries is subject to declaration by their Board of Directors and may be affected by market conditions and other factors.
|
19.
|
EARNINGS PER SHARE
|
A reconciliation of the numerators and denominators of the basic and diluted per share computations of Common Stock based on the consolidated earnings of Prudential Financial for the years ended December 31, is as follows:
272
|
|
2018
|
2017
|
2016
|
||||||||||||||||||||||||||||||
|
|
Income
|
Weighted
Average
Shares
|
Per Share
Amount
|
Income
|
Weighted
Average
Shares
|
Per Share
Amount
|
Income
|
Weighted
Average
Shares
|
Per Share
Amount
|
||||||||||||||||||||||||
|
|
(in millions, except per share amounts)
|
||||||||||||||||||||||||||||||||
|
Basic earnings per share
|
|||||||||||||||||||||||||||||||||
|
Net income (loss)
|
$
|
4,088
|
|
$
|
7,974
|
|
$
|
4,419
|
|
||||||||||||||||||||||||
|
Less: Income (loss) attributable to noncontrolling interests
|
14
|
|
111
|
|
51
|
|
|||||||||||||||||||||||||||
|
Less: Dividends and undistributed earnings allocated to participating unvested share-based payment awards
|
48
|
|
95
|
|
50
|
|
|||||||||||||||||||||||||||
|
Net income (loss) attributable to Prudential Financial available to holders of Common Stock
|
$
|
4,026
|
|
417.6
|
|
$
|
9.64
|
|
$
|
7,768
|
|
427.0
|
|
$
|
18.19
|
|
$
|
4,318
|
|
438.2
|
|
$
|
9.85
|
|
|||||||||
|
Effect of dilutive securities and compensation programs
|
|||||||||||||||||||||||||||||||||
|
Add: Dividends and undistributed earnings allocated to participating unvested share-based payment awards—Basic
|
$
|
48
|
|
$
|
95
|
|
$
|
50
|
|
||||||||||||||||||||||||
|
Less: Dividends and undistributed earnings allocated to participating unvested share-based payment awards—Diluted
|
47
|
|
94
|
|
49
|
|
|||||||||||||||||||||||||||
|
Stock options
|
1.5
|
|
2.1
|
|
1.8
|
|
|||||||||||||||||||||||||||
|
Deferred and long-term compensation programs
|
1.2
|
|
1.1
|
|
0.9
|
|
|||||||||||||||||||||||||||
|
Exchangeable Surplus Notes
|
21
|
|
5.9
|
|
17
|
|
5.8
|
|
17
|
|
5.7
|
|
|||||||||||||||||||||
|
Diluted earnings per share
|
|||||||||||||||||||||||||||||||||
|
Net income (loss) attributable to Prudential Financial available to holders of Common Stock
|
$
|
4,048
|
|
426.2
|
|
$
|
9.50
|
|
$
|
7,786
|
|
436.0
|
|
$
|
17.86
|
|
$
|
4,336
|
|
446.6
|
|
$
|
9.71
|
|
|||||||||
Unvested share-based payment awards that contain nonforfeitable rights to dividends are participating securities and included in the computation of earnings per share pursuant to the two-class method. Under this method, earnings attributable to Prudential Financial are allocated between Common Stock and the participating awards, as if the awards were a second class of stock. During periods of net income available to holders of Common Stock, the calculation of earnings per share excludes the income attributable to participating securities in the numerator and the dilutive impact of these securities from the denominator. In the event of a net loss available to holders of Common Stock, undistributed earnings are not allocated to participating securities and the denominator excludes the dilutive impact of these securities as they do not share in the losses of the Company. Undistributed earnings allocated to participating unvested share-based payment awards for the years ended December 31,
2018
,
2017
and
2016
, as applicable, were based on
4.9 million
,
5.2 million
and
5.1 million
of such awards, respectively, weighted for the period they were outstanding.
Stock options and shares related to deferred and long-term compensation programs that are considered antidilutive are excluded from the computation of diluted earnings per share. Stock options are considered antidilutive based on application of the treasury stock method or in the event of a net loss available to holders of Common Stock. Shares related to deferred and long-term compensation programs are considered antidilutive in the event of a net loss available to holders of Common Stock. For the years ended December 31, the number of stock options and shares related to deferred and long-term compensation programs that were considered antidilutive and were excluded from the computation of diluted earnings per share, weighted for the portion of the period they were outstanding, are as follows:
273
|
|
2018
|
2017
|
2016
|
||||||||||||||||||
|
|
Shares
|
Exercise
Price Per
Share
|
Shares
|
Exercise
Price Per
Share
|
Shares
|
Exercise
Price Per
Share
|
|||||||||||||||
|
|
(in millions, except per share amounts, based on
weighted average)
|
||||||||||||||||||||
|
Antidilutive stock options based on application of the treasury stock method
|
0.7
|
|
$
|
108.34
|
|
0.3
|
|
$
|
110.18
|
|
2.7
|
|
$
|
83.97
|
|
||||||
|
Antidilutive stock options due to net loss available to holders of Common Stock
|
0.0
|
|
0.0
|
|
0.0
|
|
|||||||||||||||
|
Antidilutive shares based on application of the treasury stock method
|
0.0
|
|
0.1
|
|
0.0
|
|
|||||||||||||||
|
Antidilutive shares due to net loss available to holders of Common Stock
|
0.0
|
|
0.0
|
|
0.0
|
|
|||||||||||||||
|
Total antidilutive stock options and shares
|
0.7
|
|
0.4
|
|
2.7
|
|
|||||||||||||||
In September 2009, the Company issued
$500 million
of surplus notes with an interest rate of
5.36%
per annum which are exchangeable at the option of the note holders for shares of Common Stock. The initial exchange rate for the surplus notes was
10.1235
shares of Common Stock per each
$1,000
principal amount of surplus notes. This was equivalent to
5.1 million
shares and an initial exchange price per share of Common Stock of
$98.78
. The exchange rate is subject to customary anti-dilution adjustments and is accordingly revalued during the fourth quarter of each year. As of
December 31, 2018
, the exchange rate is equal to
12.1719
shares of Common Stock per each
$1,000
principal amount of surplus notes. This is equivalent to
6.09 million
shares and an exchange price per share of Common Stock of
$82.16
. In calculating diluted earnings per share under the if-converted method, the potential shares that would be issued assuming a hypothetical exchange, weighted for the period the notes are outstanding, are added to the denominator, and the related interest expense, net of tax, is excluded from the numerator, if the overall effect is dilutive.
|
20.
|
SHARE-BASED PAYMENTS
|
Omnibus Incentive Plan
Prudential Financial, Inc.’s Omnibus Incentive Plan provides stock-based awards including stock options, stock appreciation rights, restricted stock shares, restricted stock units, stock settled performance shares, and cash settled performance units. Dividend equivalents are generally provided on restricted stock shares and restricted stock units outstanding as of the record date. Dividend equivalents are generally accrued on target performance shares and units outstanding as of the record date. These dividend equivalents are paid only on the performance shares and units released up to a maximum of the target number of shares and units awarded. Generally, the requisite service period is the vesting period. There were
20,625,484
authorized shares available for grant under the Omnibus Plan as of December 31,
2018
.
Compensation Costs
Compensation cost for restricted stock units, performance shares and performance units granted to employees is measured by the share price of the underlying Common Stock at the date of grant.
Compensation cost for employee stock options is based on the fair values estimated on the grant date. The fair value of each stock option award is estimated using a binomial option pricing model on the date of grant for stock options issued to employees. The weighted average grant date assumptions used in the binomial option valuation model are as follows:
|
2018
|
2017
|
2016
|
|||||||
|
Expected volatility
|
35.39
|
%
|
35.29
|
%
|
38.36
|
%
|
|||
|
Expected dividend yield
|
2.88
|
%
|
2.84
|
%
|
3.92
|
%
|
|||
|
Expected term
|
5.49 years
|
|
5.60 years
|
|
5.61 years
|
|
|||
|
Risk-free interest rate
|
2.64
|
%
|
2.06
|
%
|
1.25
|
%
|
|||
Expected volatilities are based on historical volatility of the Company’s Common Stock and implied volatilities from traded options on the Company’s Common Stock. The Company uses historical data and expectations of future exercise patterns to estimate option exercises and employee terminations within the valuation model. The expected term of options granted represents
274
the period of time that options granted are expected to be outstanding. The risk-free rate for periods associated with the expected term of the option is based on the U.S. Treasury yield curve in effect at the time of grant.
The following chart summarizes the compensation cost recognized and the related income tax benefit for stock options, restricted stock units, performance shares and performance units for the years ended December 31:
|
|
2018
|
2017
|
2016
|
|||||||||||||||||||||
|
|
Total
Compensation Cost
Recognized
|
Income Tax
Benefit
|
Total
Compensation Cost
Recognized
|
Income Tax
Benefit
|
Total
Compensation Cost
Recognized
|
Income Tax
Benefit
|
||||||||||||||||||
|
|
(in millions)
|
|||||||||||||||||||||||
|
Employee stock options
|
$
|
13
|
|
$
|
3
|
|
$
|
12
|
|
$
|
5
|
|
$
|
19
|
|
$
|
7
|
|
||||||
|
Employee restricted stock units
|
139
|
|
32
|
|
142
|
|
51
|
|
126
|
|
47
|
|
||||||||||||
|
Employee performance shares and performance units
|
3
|
|
1
|
|
109
|
|
41
|
|
57
|
|
21
|
|
||||||||||||
|
Total
|
$
|
155
|
|
$
|
36
|
|
$
|
263
|
|
$
|
97
|
|
$
|
202
|
|
$
|
75
|
|
||||||
Compensation costs related to stock-based compensation plans capitalized in deferred acquisition costs for the years ended December 31,
2018
,
2017
and
2016
were de minimis.
Stock Options
Each stock option granted has an exercise price at the fair market value of the Company’s Common Stock on the date of grant and has a maximum term of
10 years
. Generally, one third of the option grant vests in each of the first
three
years.
A summary of the status of the Company’s stock option grants is as follows:
|
|
Employee Stock Options
|
||||||
|
|
Shares
|
Weighted Average
Exercise Price
|
|||||
|
Outstanding at December 31, 2017
|
4,729,402
|
|
$
|
67.38
|
|
||
|
Granted
|
447,986
|
|
104.42
|
|
|||
|
Exercised
|
(565,806
|
)
|
57.91
|
|
|||
|
Forfeited
|
(23,197
|
)
|
91.73
|
|
|||
|
Expired
|
(4,141
|
)
|
83.70
|
|
|||
|
Outstanding at December 31, 2018
|
4,584,244
|
|
$
|
72.03
|
|
||
|
Exercisable at December 31, 2018
|
3,496,493
|
|
$
|
65.96
|
|
||
The weighted average grant date fair value of employee stock options granted during the years ended December 31,
2018
,
2017
and
2016
was
$27.11
,
$27.91
and
$14.81
, respectively.
The total intrinsic value (i.e., market price of the stock less the option exercise price) of employee stock options exercised during the years ended December 31,
2018
,
2017
and
2016
was
$28 million
,
$109 million
, and
$120 million
, respectively.
The weighted average remaining contractual term and the aggregate intrinsic value of stock options outstanding and exercisable as of December 31,
2018
is as follows:
|
|
December 31, 2018
|
|||||
|
|
Employee Stock Options
|
|||||
|
|
Weighted Average
Remaining
Contractual Term
|
Aggregate
Intrinsic Value
|
||||
|
|
(in years)
|
(in millions)
|
||||
|
Outstanding
|
4.93
|
$
|
66
|
|
||
|
Exercisable
|
4.24
|
$
|
59
|
|
||
Restricted Stock Units, Performance Share Awards and Performance Unit Awards
275
A restricted stock unit is an unfunded, unsecured right to receive a share of the Company’s Common Stock at the end of a specified period of time, which is subject to forfeiture and transfer restrictions. Generally, the restrictions will lapse on the third anniversary of the date of grant. Performance shares and performance units are awards denominated in the Company’s Common Stock. The number of units is determined over the performance period, and may be adjusted based on the satisfaction of certain performance goals for the Company. Performance share awards are payable in the Company’s Common Stock. Performance unit awards are payable in cash.
A summary of the Company’s restricted stock units, performance shares and performance unit awards is as follows:
|
Restricted
Stock
Units
|
Weighted
Average Grant
Date Fair Value
|
Performance
Share and
Performance
Unit Awards(1)
|
Weighted
Average Grant
Date Fair Value
|
|||||||||||
|
Restricted at December 31, 2017(2)
|
5,142,041
|
|
$
|
82.00
|
|
1,820,332
|
|
$
|
114.98
|
|
||||
|
Granted(2)
|
1,416,097
|
|
106.32
|
|
592,462
|
|
81.55
|
|
||||||
|
Forfeited
|
(150,965
|
)
|
94.14
|
|
(48,832
|
)
|
98.06
|
|
||||||
|
Performance adjustment(3)
|
56,221
|
|
106.89
|
|
||||||||||
|
Released
|
(1,646,259
|
)
|
78.41
|
|
(611,108
|
)
|
106.89
|
|
||||||
|
Restricted at December 31, 2018(2)
|
4,760,914
|
|
$
|
90.09
|
|
1,809,075
|
|
$
|
81.55
|
|
||||
__________
|
(1)
|
Performance share and performance unit awards reflect the target units awarded, reduced for forfeitures and releases to date. The actual number of units to be awarded at the end of each performance period will range between
0%
and
125%
of the target number of units granted, based upon a measure of the reported performance for the Company relative to stated goals. Performance awards granted to senior management in 2018 include a stated goal related to diversity & inclusion that can modify the performance result by +/- 10%.
|
|
(2)
|
For performance share and performance unit awards, the grant date is the same as the date the grant vests. The features of the grant are such that a mutual understanding of the key terms and conditions of the award between the employee and employer have not been reached until the grant is vested. Consequently, the weighted average grant date fair value as of December 31,
2018
and December 31,
2017
is the closing stock price of Prudential Financial’s common stock on those dates.
|
|
(3)
|
Represents the difference between the target units granted and the actual units awarded based upon the attainment of performance goals for the Company.
|
The fair market value of restricted stock units, performance shares and performance units released for the years ended December 31,
2018
,
2017
and
2016
was
$238 million
,
$196 million
and
$128 million
, respectively.
The weighted average grant date fair value for restricted stock units granted during the years ended December 31,
2018
,
2017
and
2016
was
$106.32
,
$110.39
and
$64.12
, respectively. The weighted average grant date fair value for performance shares and performance units granted during the years ended December 31,
2018
,
2017
and
2016
was
$81.55
,
$114.98
and
$104.06
, respectively.
Unrecognized Compensation Cost
Unrecognized compensation cost for stock options as of December 31,
2018
was
$2 million
with a weighted average recognition period of
1.58 years
. Unrecognized compensation cost for restricted stock units, performance shares and performance units as of December 31,
2018
was
$137 million
with a weighted average recognition period of
1.66 years
.
Tax Benefits Realized
The tax benefit realized for exercises of stock options during the years ended December 31,
2018
,
2017
and
2016
was
$7 million
,
$39 million
and
$41 million
, respectively.
The tax benefit realized upon vesting of restricted stock units, performance shares and performance units for the years ended December 31,
2018
,
2017
and
2016
was
$49 million
,
$70 million
and
$46 million
, respectively.
Settlement of Awards
The Company’s policy is to issue shares from Common Stock held in treasury upon exercise of stock options, the release of restricted stock units and performance shares. The Company uses cash to settle performance units. The amount of cash used to settle performance units during the years ended December 31,
2018
,
2017
and
2016
was
$29 million
,
$27 million
and
$18 million
, respectively.
|
21.
|
SEGMENT INFORMATION
|
276
Segments
The Company operates through
five
divisions, which together encompass
seven
reportable segments, and its Corporate and Other operations.
PGIM division.
The PGIM division consists of the PGIM segment, which provides a broad array of asset management and advisory services related to public and private fixed income, public equity and real estate, commercial mortgage origination and servicing, and mutual funds and other retail services to institutional, private and sub-advisory clients (including mutual funds), insurance company separate accounts, government sponsored entities and the Company’s general account.
U.S. Workplace Solutions division.
The U.S. Workplace Solutions division consists of the Retirement and Group Insurance segments. The Retirement segment provides a broad range of retirement investment and income products and services to retirement plan sponsors in the public, private and not-for-profit sectors. The Group Insurance segment provides a full range of group life, long-term and short-term group disability, and group corporate-, bank- and trust-owned life insurance in the U.S., primarily to institutional clients for use in connection with employee plans and affinity groups.
U.S. Individual Solutions division.
The U.S. Individual Solutions division consists of the Individual Annuities and Individual Life segments. The Individual Annuities segment develops and distributes individual variable and fixed annuity products, primarily to the U.S. mass affluent and affluent markets. The Individual Life segment develops and distributes individual variable life, term life and universal life insurance products primarily to the U.S. mass middle, mass affluent and affluent markets.
International Insurance division.
The International Insurance division consists of the International Insurance segment, which develops and distributes individual life insurance, retirement and related products to the mass affluent and affluent markets in Japan, Korea and other foreign countries through its Life Planner operations. In addition, similar products are offered to the broad middle income and mass affluent markets across Japan and the Company’s joint ventures in various foreign countries through Life Consultants, the proprietary distribution channel of the Company’s Gibraltar Life operation, as well as other channels, including banks and independent agencies.
Closed Block division
. The Closed Block division includes certain in-force participating insurance and annuity products and corresponding assets that are used for the payment of benefits, expenses and policyholders’ dividends related to these products, as well as certain related assets and liabilities. In connection with demutualization, the Company ceased offering these participating products. The Closed Block division is accounted for as a divested business that is reported separately from the divested and run-off businesses that are included in the Company’s Corporate and Other operations. See Note 14 for additional information on the Closed Block.
Corporate and Other operations.
Corporate and Other operations includes corporate items and initiatives that are not allocated to business segments, and divested and run-off businesses. Corporate operations consist primarily of: (1) capital that is not deployed in any business segment; (2) investments not allocated to business segments, including debt-financed investment portfolios, and tax credit investments and other tax-enhanced investments financed by business segments; (3) capital debt that is used or will be used to meet the capital requirements of the Company and the related interest expense; (4) the Company’s qualified and non-qualified pension and other employee benefit plans, after allocations to business segments; (5) corporate-level activities, after allocations to business segments, including strategic expenditures, corporate governance, corporate advertising, philanthropic activities, deferred compensation, and costs related to certain contingencies and enhanced regulatory supervision; (6) certain retained obligations relating to pre-demutualization policyholders; (7) the Company’s ownership interest in a life insurance joint venture in China; (8) the Company’s Capital Protection Framework; (9) the foreign currency income hedging program used to hedge certain non-U.S. dollar-denominated earnings in the International Insurance segment; (10) the impact of intercompany arrangements with the PGIM segment to translate certain non-U.S. dollar-denominated earnings at fixed currency exchange rates; and (11) transactions with and between other segments, including the elimination of intercompany transactions for consolidation purposes.
Segment Accounting Policies.
The accounting policies of the segments are the same as those described in Note 2. Results for each segment include earnings on attributed equity established at a level which management considers necessary to support each segment’s risks. Operating expenses specifically identifiable to a particular segment are allocated to that segment as incurred. Operating expenses not identifiable to a specific segment that are incurred in connection with the generation of segment revenues are generally allocated based upon the segment’s historical percentage of general and administrative expenses.
For information related to the adoption of new accounting pronouncements, see Note 2. The segments’ results in prior years have been revised for these items, as applicable, to conform to the current year presentation.
277
Adjusted Operating Income
The Company analyzes the operating performance of each segment using “adjusted operating income.” Adjusted operating income does not equate to “Income (loss) before income taxes and equity in earnings of operating joint ventures” or “Net income (loss)” as determined in accordance with U.S. GAAP but is the measure of segment profit or loss used by the Company’s chief operating decision maker to evaluate segment performance and allocate resources and, consistent with authoritative guidance, is the measure of segment performance presented below. Adjusted operating income is calculated by adjusting each segment’s “Income (loss) before income taxes and equity in earnings of operating joint ventures” for the following items, which are described in greater detail below:
|
•
|
realized investment gains (losses), net, and related adjustments and charges;
|
|
•
|
net investment gains (losses) on assets supporting experience-rated contractholder liabilities and changes in experience-rated contractholder liabilities due to asset value changes;
|
|
•
|
divested and run-off businesses; and
|
|
•
|
equity in earnings of operating joint ventures and earnings attributable to noncontrolling interests.
|
These items are important to an understanding of overall results of operations. Adjusted operating income is not a substitute for income determined in accordance with U.S. GAAP, and the Company’s definition of adjusted operating income may differ from that used by other companies. However, the Company believes that the presentation of adjusted operating income as measured for management purposes enhances the understanding of results of operations by highlighting the results from ongoing operations and the underlying profitability factors of its businesses.
As discussed in Note 1, during 2016, the Company recorded certain out of period adjustments. These adjustments resulted in a decrease in pre-tax adjusted operating income of
$114 million
for the year ended December 31, 2016, principally consisting of a net decrease of
$153 million
for the Individual Life Insurance segment. Management evaluated the adjustments, both individually and in the aggregate, and concluded that they were not material to any previously reported quarterly or annual financial statements.
Beginning in the first quarter of 2018, as a result of the adoption of ASU 2016-01 (see Note 2), changes in the fair value of equity securities are included in net income, but are excluded from adjusted operating income. These changes in fair value are classified as related adjustments within “Realized investment gains (losses), net, and related adjustments” reconciling item in the tables below.
Realized investment gains (losses), net, and related charges and adjustments
Realized investment gains (losses), net
Adjusted operating income excludes “Realized investment gains (losses), net,” except for certain items described below. Significant activity excluded from adjusted operating income includes impairments and credit-related gains (losses) from sales of securities, the timing of which depends largely on market credit cycles and can vary considerably across periods, and interest rate-related gains (losses) from sales of securities, which are largely subject to the Company’s discretion and influenced by market opportunities, as well as the Company’s tax and capital profile. Additionally, adjusted operating income generally excludes realized investment gains (losses) from products that contain embedded derivatives, and from associated derivative portfolios that are part of an asset/liability management program related to the risk of those products. However, the effectiveness of the hedging program will ultimately be reflected in adjusted operating income over time. Trends in the underlying profitability of the Company’s businesses can be more clearly identified without the fluctuating effects of these transactions.
The following table sets forth the significant components of “Realized investment gains (losses), net” that are included in adjusted operating income and, as a result, are reflected as adjustments to “Realized investment gains (losses), net” for purposes of calculating adjusted operating income:
278
|
|
Year Ended December 31,
|
|||||||||||
|
|
2018
|
2017
|
2016
|
|||||||||
|
|
(in millions)
|
|||||||||||
|
Net gains (losses) from(1):
|
||||||||||||
|
Terminated hedges of foreign currency earnings
|
$
|
(15
|
)
|
$
|
(15
|
)
|
$
|
39
|
|
|||
|
Current period yield adjustments
|
$
|
367
|
|
$
|
434
|
|
$
|
466
|
|
|||
|
Principal source of earnings
|
$
|
219
|
|
$
|
(8
|
)
|
$
|
74
|
|
|||
__________
|
(1)
|
In addition to the items in the table above, “Realized investment gains (losses), net, and related charges and adjustments” also includes an adjustment to reflect “Realized investment gains (losses), net” related to divested and run-off businesses. See “Divested and Run-off businesses” discussed below.
|
Terminated Hedges of Foreign Currency Earnings.
The amounts shown in the table above primarily reflect the impact of an intercompany arrangement between Corporate and Other operations and the International Insurance segment, pursuant to which the non-U.S. dollar-denominated earnings in all countries for a particular year, including its interim reporting periods, are translated at fixed currency exchange rates. The fixed rates are determined in connection with a currency hedging program designed to mitigate the risk that unfavorable rate changes will reduce the segment’s U.S. dollar-equivalent earnings. Pursuant to this program, the Company’s Corporate and Other operations may execute forward currency contracts with third-parties to sell the net exposure of projected earnings from the hedged currency in exchange for U.S. dollars at a specified exchange rate. The maturities of these contracts correspond with the future periods in which the identified non-U.S. dollar-denominated earnings are expected to be generated. These contracts do not qualify for hedge accounting under U.S. GAAP, so the resulting profits or losses are recorded in “Realized investment gains (losses), net.” When the contracts are terminated in the same period that the expected earnings emerge, the resulting positive or negative cash flow effect is included in adjusted operating income.
Current Period Yield Adjustments.
The Company uses interest rate and currency swaps and other derivatives to manage interest and currency exchange rate exposures arising from mismatches between assets and liabilities, including duration mismatches. For derivative contracts that do not qualify for hedge accounting treatment, the periodic swap settlements, as well as certain other derivative related yield adjustments are recorded in “Realized investment gains (losses), net,” and are included in adjusted operating income to reflect the after-hedge yield of the underlying instruments. In certain instances, when these derivative contracts are terminated or offset before their final maturity, the resulting realized gains or losses are recognized in adjusted operating income over periods that generally approximate the expected terms of the derivatives or underlying instruments in order for adjusted operating income to reflect the after-hedge yield of the underlying instruments. Included in the amounts shown in the table above are gains (losses) on certain derivative contracts that were terminated or offset before their final maturity of
$19 million
,
$53 million
and
$49 million
for the years ended
2018
,
2017
and
2016
, respectively. As of December 31,
2018
, there was a
$212 million
deferred net gain related to certain derivative contracts that were terminated or offset before their final maturity, primarily in the International Insurance segment. Also included in the amounts shown in the table above are fees related to synthetic GICs of
$146 million
,
$159 million
and
$158 million
for the years ended
2018
,
2017
and
2016
, respectively. Synthetic GICs are accounted for as derivatives under U.S. GAAP and, therefore, these fees are recorded in “Realized investment gains (losses), net.” See Note 5 for additional information on synthetic GICs.
Principal Source of Earnings.
The Company conducts certain activities for which realized investment gains (losses) are a principal source of earnings for its businesses and are therefore included in adjusted operating income, particularly within the Company’s PGIM segment. For example, PGIM’s strategic investing business makes investments for sale or syndication to other investors or for placement or co-investment in the Company’s managed funds and structured products. The realized investment gains (losses) associated with the sale of these strategic investments, as well as the majority of derivative results, are a principal activity for this business and included in adjusted operating income. In addition, the realized investment gains (losses) associated with loans originated by the Company’s commercial mortgage operations, as well as related derivative results and retained mortgage servicing rights, are a principal activity for this business and are therefore included in adjusted operating income.
Adjustments related to Realized investment gains (losses), net
The following table sets forth certain other items excluded from adjusted operating income and reflected as an adjustment to “Realized investment gains (losses), net” for purposes of calculating adjusted operating income:
279
|
|
Year Ended December 31,
|
|||||||||||
|
|
2018
|
2017
|
2016
|
|||||||||
|
|
(in millions)
|
|||||||||||
|
Net gains (losses) from:
|
||||||||||||
|
Investments carried at fair value through net income
|
$
|
(417
|
)
|
$
|
184
|
|
$
|
(95
|
)
|
|||
|
Foreign currency exchange movements
|
$
|
(289
|
)
|
$
|
(135
|
)
|
$
|
(154
|
)
|
|||
|
Other activities
|
$
|
(41
|
)
|
$
|
(20
|
)
|
$
|
(18
|
)
|
|||
Investments carried at fair value through net income.
The Company has certain investments in its general account portfolios that are carried at fair value with changes in fair value reported in “Other income (loss).” Examples include the Company’s investments in equity securities and fixed maturities designated as trading. Consistent with the exclusion of realized investment gains (losses) with respect to other investments managed on a consistent basis, the net gains or losses on these investments are excluded from adjusted operating income.
Foreign Currency Exchange Movements.
The Company has certain assets and liabilities for which, under U.S. GAAP, the changes in value, including those associated with changes in foreign currency exchange rates during the period, are recorded in “Other income (loss).” To the extent the foreign currency exposure on these assets and liabilities is economically hedged or considered part of the Company’s capital funding strategies for its international subsidiaries, the change in value included in “Other income (loss)” is excluded from adjusted operating income. The insurance liabilities are supported by investments denominated in corresponding currencies, including a significant portion designated as available-for-sale. While these non-yen denominated assets and liabilities are economically hedged, unrealized gains (losses) on available-for-sale investments, including those arising from foreign currency exchange rate movements, are recorded in AOCI under U.S. GAAP, while the non-yen denominated liabilities are remeasured for foreign currency exchange rate movements, with the related change in value recorded in earnings within “Other income (loss).” Due to this non-economic volatility that has been reflected in U.S. GAAP earnings, the change in value recorded within “Other income (loss)” is excluded from adjusted operating income.
Other Activities.
The Company excludes certain other items from adjusted operating income that are consistent with similar adjustments described above.
Charges related to realized investment gains (losses), net
Charges that relate to realized investment gains (losses) are also excluded from adjusted operating income, and include the following:
|
•
|
The portion of the amortization of DAC, VOBA, unearned revenue reserves and DSI for certain products that is related to net realized investment gains (losses).
|
|
•
|
Policyholder dividends and interest credited to policyholders’ account balances that relate to certain life policies that pass back certain realized investment gains (losses) to the policyholder, and reserves for future policy benefits for certain policies that are affected by net realized investment gains (losses).
|
|
•
|
Market value adjustments paid or received upon a contractholder’s surrender of certain of the Company’s annuity products as these amounts mitigate the net realized investment gains or losses incurred upon the disposition of the underlying invested assets.
|
Investment gains (losses) on assets supporting experience-rated contractholder liabilities and changes in experience-rated contractholder liabilities due to asset value changes
Certain products included in the Retirement and International Insurance segments are experience-rated in that investment results associated with these products are expected to ultimately accrue to contractholders. The majority of investments supporting these experience-rated products are carried at fair value, with realized and unrealized gains (losses) reported in “Other income (loss).” To a lesser extent, these experience-rated products are also supported by derivatives and commercial mortgage and other loans. The derivatives are carried at fair value, with realized and unrealized gains (losses) reported in “Realized investment gains (losses), net.” The commercial mortgage and other loans are carried at unpaid principal, net of unamortized discounts and an allowance for losses, with gains (losses) on sales and changes in the valuation allowance for commercial mortgage and other loans reported in “Realized investment gains (losses), net.”
280
Adjusted operating income excludes net investment gains (losses) on assets supporting experience-rated contractholder liabilities, related derivatives and commercial mortgage and other loans. This is consistent with the exclusion of realized investment gains (losses) with respect to other investments supporting insurance liabilities managed on a consistent basis. In addition, to be consistent with the historical treatment of charges related to realized investment gains (losses) on investments, adjusted operating income also excludes the change in contractholder liabilities due to asset value changes in the pool of investments (including changes in the fair value of commercial mortgage and other loans) supporting these experience-rated contracts, which are reflected in “Interest credited to policyholders’ account balances.” The result of this approach is that adjusted operating income for these products includes net fee revenue and interest spread we earn on these experience-rated contracts, and excludes changes in fair value of the pool of investments, both realized and unrealized, that we expect will ultimately accrue to the contractholders.
Divested and Run-off businesses
The contribution to income (loss) of divested and run-off businesses that have been or will be sold or exited, including businesses that have been placed in wind down, but that did not qualify for “discontinued operations” accounting treatment under U.S. GAAP, are excluded from adjusted operating income as the results of divested and run-off businesses are not considered relevant to understanding the Company’s ongoing operating results.
The Closed Block division, which is comprised of the Closed Block segment is accounted for as a divested business because it consists primarily of certain participating insurance and annuity products that the Company ceased selling at demutualization in 2001. See Note 14 for further information on the Closed Block.
Equity in earnings of operating joint ventures and earnings attributable to noncontrolling interests
Equity in earnings of operating joint ventures, on a pre-tax basis, are included in adjusted operating income as these results are a principal source of earnings. These earnings are reflected on a U.S. GAAP basis on an after-tax basis as a separate line on the Company’s Consolidated Statements of Operations.
Earnings attributable to noncontrolling interests are excluded from adjusted operating income. Earnings attributable to noncontrolling interests represents the portion of earnings from consolidated entities that relates to the equity interests of minority investors, and are reflected on a U.S. GAAP basis as a separate line on the Company’s Consolidated Statements of Operations.
Reconciliation of adjusted operating income and net income (loss)
The table below reconciles adjusted operating income before income taxes to income before income taxes and equity in earnings of operating joint ventures:
281
|
|
Year ended December 31,
|
|||||||||||
|
|
2018
|
2017
|
2016
|
|||||||||
|
|
(in millions)
|
|||||||||||
|
Adjusted operating income before income taxes by segment:
|
||||||||||||
|
PGIM
|
$
|
959
|
|
$
|
979
|
|
$
|
787
|
|
|||
|
Total PGIM division(1)
|
959
|
|
979
|
|
787
|
|
||||||
|
Retirement
|
1,049
|
|
1,244
|
|
1,012
|
|
||||||
|
Group Insurance
|
229
|
|
253
|
|
220
|
|
||||||
|
Total U.S. Workplace Solutions division(1)
|
1,278
|
|
1,497
|
|
1,232
|
|
||||||
|
Individual Annuities
|
1,925
|
|
2,198
|
|
1,765
|
|
||||||
|
Individual Life
|
223
|
|
(191
|
)
|
79
|
|
||||||
|
Total U.S. Individual Solutions division(1)
|
2,148
|
|
2,007
|
|
1,844
|
|
||||||
|
International Insurance
|
3,266
|
|
3,198
|
|
3,117
|
|
||||||
|
Total International Insurance division
|
3,266
|
|
3,198
|
|
3,117
|
|
||||||
|
Corporate and Other operations
|
(1,283
|
)
|
(1,437
|
)
|
(1,581
|
)
|
||||||
|
Total Corporate and Other
|
(1,283
|
)
|
(1,437
|
)
|
(1,581
|
)
|
||||||
|
Total segment adjusted operating income before income taxes
|
6,368
|
|
6,244
|
|
5,399
|
|
||||||
|
Reconciling Items:
|
||||||||||||
|
Realized investment gains (losses), net, and related adjustments
|
619
|
|
(602
|
)
|
989
|
|
||||||
|
Charges related to realized investment gains (losses), net
|
(316
|
)
|
544
|
|
(466
|
)
|
||||||
|
Investment gains (losses) on assets supporting experience-rated contractholder liabilities, net
|
(863
|
)
|
336
|
|
(17
|
)
|
||||||
|
Change in experience-rated contractholder liabilities due to asset value changes
|
710
|
|
(151
|
)
|
21
|
|
||||||
|
Divested and Run-off businesses:
|
||||||||||||
|
Closed Block division
|
(62
|
)
|
45
|
|
(132
|
)
|
||||||
|
Other Divested and Run-off businesses
|
(1,535
|
)
|
38
|
|
(84
|
)
|
||||||
|
Equity in earnings of operating joint ventures and earnings attributable to noncontrolling interests
|
(87
|
)
|
33
|
|
(5
|
)
|
||||||
|
Consolidated income (loss) before income taxes and equity in earnings of operating joint ventures
|
$
|
4,834
|
|
$
|
6,487
|
|
$
|
5,705
|
|
|||
__________
|
(1)
|
2016 divisional subtotals are presented on a basis consistent with the Company’s new organizational structure implemented in 2017. Individual segment results and consolidated totals remain unchanged.
|
The Individual Annuities segment results reflect DAC as if the individual annuity business is a stand-alone operation. The elimination of intersegment costs capitalized in accordance with this policy is included in consolidating adjustments within Corporate and Other operations.
282
Reconciliation of select financial information
The tables below present certain financial information for the Company’s reportable segments:
|
|
||||||||
|
|
As of December 31,
|
|||||||
|
|
2018
|
2017
|
||||||
|
(in millions)
|
||||||||
|
Total Assets:
|
||||||||
|
PGIM
|
$
|
47,690
|
|
$
|
49,944
|
|
||
|
Total PGIM division
|
47,690
|
|
49,944
|
|
||||
|
Retirement
|
175,525
|
|
183,629
|
|
||||
|
Group Insurance
|
41,727
|
|
41,575
|
|
||||
|
Total U.S. Workplace Solutions division
|
217,252
|
|
225,204
|
|
||||
|
Individual Annuities
|
167,899
|
|
183,666
|
|
||||
|
Individual Life
|
83,739
|
|
83,985
|
|
||||
|
Total U.S. Individual Solutions division
|
251,638
|
|
267,651
|
|
||||
|
International Insurance
|
222,633
|
|
211,647
|
|
||||
|
Total International Insurance division
|
222,633
|
|
211,647
|
|
||||
|
Corporate and Other operations
|
16,826
|
|
14,556
|
|
||||
|
Total Corporate and Other
|
16,826
|
|
14,556
|
|
||||
|
Closed Block
|
59,039
|
|
63,134
|
|
||||
|
Total Closed Block division
|
59,039
|
|
63,134
|
|
||||
|
Total per Consolidated Statements of Financial Position
|
$
|
815,078
|
|
$
|
832,136
|
|
||
283
|
|
Year Ended December 31, 2018
|
|||||||||||||||||||||||||||
|
|
Revenues
|
Net
Investment
Income
|
Policyholders’
Benefits
|
Interest
Credited to
Policyholders’
Account
Balances
|
Dividends to
Policyholders
|
Interest
Expense
|
Amortization
of DAC
|
|||||||||||||||||||||
|
|
(in millions)
|
|||||||||||||||||||||||||||
|
PGIM
|
$
|
3,294
|
|
$
|
73
|
|
$
|
0
|
|
$
|
0
|
|
$
|
0
|
|
$
|
40
|
|
$
|
8
|
|
|||||||
|
Total PGIM division
|
3,294
|
|
73
|
|
0
|
|
0
|
|
0
|
|
40
|
|
8
|
|
||||||||||||||
|
Retirement
|
16,825
|
|
4,377
|
|
13,215
|
|
1,430
|
|
0
|
|
35
|
|
33
|
|
||||||||||||||
|
Group Insurance
|
5,685
|
|
616
|
|
4,241
|
|
282
|
|
0
|
|
2
|
|
5
|
|
||||||||||||||
|
Total U.S. Workplace Solutions division
|
22,510
|
|
4,993
|
|
17,456
|
|
1,712
|
|
0
|
|
37
|
|
38
|
|
||||||||||||||
|
Individual Annuities
|
4,966
|
|
694
|
|
370
|
|
335
|
|
0
|
|
67
|
|
511
|
|
||||||||||||||
|
Individual Life
|
5,831
|
|
2,033
|
|
2,489
|
|
766
|
|
37
|
|
714
|
|
368
|
|
||||||||||||||
|
Total U.S. Individual Solutions division
|
10,797
|
|
2,727
|
|
2,859
|
|
1,101
|
|
37
|
|
781
|
|
879
|
|
||||||||||||||
|
International Insurance
|
22,234
|
|
5,245
|
|
14,009
|
|
907
|
|
62
|
|
21
|
|
1,233
|
|
||||||||||||||
|
Total International Insurance division
|
22,234
|
|
5,245
|
|
14,009
|
|
907
|
|
62
|
|
21
|
|
1,233
|
|
||||||||||||||
|
Corporate and Other operations
|
(705
|
)
|
452
|
|
(12
|
)
|
0
|
|
0
|
|
535
|
|
(44
|
)
|
||||||||||||||
|
Total Corporate and Other
|
(705
|
)
|
452
|
|
(12
|
)
|
0
|
|
0
|
|
535
|
|
(44
|
)
|
||||||||||||||
|
Total
|
58,130
|
|
13,490
|
|
34,312
|
|
3,720
|
|
99
|
|
1,414
|
|
2,114
|
|
||||||||||||||
|
Reconciling items:
|
||||||||||||||||||||||||||||
|
Realized investment gains (losses), net, and related adjustments
|
619
|
|
(41
|
)
|
0
|
|
0
|
|
0
|
|
0
|
|
0
|
|
||||||||||||||
|
Charges related to realized investment gains (losses), net
|
(274
|
)
|
0
|
|
(75
|
)
|
40
|
|
0
|
|
0
|
|
118
|
|
||||||||||||||
|
Investment gains (losses) on assets supporting experience-rated contractholder liabilities, net
|
(863
|
)
|
0
|
|
0
|
|
0
|
|
0
|
|
0
|
|
0
|
|
||||||||||||||
|
Change in experience-rated contractholder liabilities due to assets value changes
|
0
|
|
0
|
|
0
|
|
(710
|
)
|
0
|
|
0
|
|
0
|
|
||||||||||||||
|
Divested and Run-off businesses:
|
||||||||||||||||||||||||||||
|
Closed Block division
|
4,678
|
|
2,288
|
|
2,972
|
|
132
|
|
1,236
|
|
2
|
|
35
|
|
||||||||||||||
|
Other Divested and Run-off businesses
|
805
|
|
439
|
|
2,195
|
|
14
|
|
1
|
|
4
|
|
6
|
|
||||||||||||||
|
Equity in earnings of operating joint ventures and earnings attributable to noncontrolling interests
|
(103
|
)
|
0
|
|
0
|
|
0
|
|
0
|
|
0
|
|
0
|
|
||||||||||||||
|
Total per Consolidated Statements of Operations
|
$
|
62,992
|
|
$
|
16,176
|
|
|
$
|
39,404
|
|
|
$
|
3,196
|
|
|
$
|
1,336
|
|
|
$
|
1,420
|
|
|
$
|
2,273
|
|
||
284
|
|
Year Ended December 31, 2017
|
|||||||||||||||||||||||||||
|
|
Revenues
|
Net
Investment
Income
|
Policyholders’
Benefits
|
Interest
Credited to
Policyholders’
Account
Balances
|
Dividends to
Policyholders
|
Interest
Expense
|
Amortization
of DAC
|
|||||||||||||||||||||
|
|
(in millions)
|
|||||||||||||||||||||||||||
|
PGIM
|
$
|
3,355
|
|
$
|
170
|
|
$
|
0
|
|
$
|
0
|
|
$
|
0
|
|
$
|
27
|
|
$
|
11
|
|
|||||||
|
Total PGIM
|
3,355
|
|
170
|
|
0
|
|
0
|
|
0
|
|
27
|
|
11
|
|
||||||||||||||
|
Retirement
|
13,843
|
|
4,482
|
|
10,035
|
|
1,507
|
|
0
|
|
26
|
|
26
|
|
||||||||||||||
|
Group Insurance
|
5,471
|
|
637
|
|
4,073
|
|
274
|
|
0
|
|
5
|
|
14
|
|
||||||||||||||
|
Total U.S. Workplace Solutions division
|
19,314
|
|
5,119
|
|
14,108
|
|
1,781
|
|
0
|
|
31
|
|
40
|
|
||||||||||||||
|
Individual Annuities
|
5,110
|
|
742
|
|
318
|
|
330
|
|
0
|
|
70
|
|
464
|
|
||||||||||||||
|
Individual Life
|
4,974
|
|
1,948
|
|
2,100
|
|
719
|
|
36
|
|
648
|
|
483
|
|
||||||||||||||
|
Total U.S. Individual Solutions division
|
10,084
|
|
2,690
|
|
2,418
|
|
1,049
|
|
36
|
|
718
|
|
947
|
|
||||||||||||||
|
International Insurance
|
21,560
|
|
5,027
|
|
13,440
|
|
899
|
|
48
|
|
13
|
|
1,138
|
|
||||||||||||||
|
Total International Insurance division
|
21,560
|
|
5,027
|
|
13,440
|
|
899
|
|
48
|
|
13
|
|
1,138
|
|
||||||||||||||
|
Corporate and Other operations
|
(667
|
)
|
493
|
|
21
|
|
0
|
|
0
|
|
533
|
|
(43
|
)
|
||||||||||||||
|
Total Corporate and Other
|
(667
|
)
|
493
|
|
21
|
|
0
|
|
0
|
|
533
|
|
(43
|
)
|
||||||||||||||
|
Total
|
53,646
|
|
13,499
|
|
29,987
|
|
3,729
|
|
84
|
|
1,322
|
|
2,093
|
|
||||||||||||||
|
Reconciling items:
|
||||||||||||||||||||||||||||
|
Realized investment gains (losses), net, and related adjustments
|
(602
|
)
|
(38
|
)
|
0
|
|
0
|
|
0
|
|
0
|
|
0
|
|
||||||||||||||
|
Charges related to realized investment gains (losses), net
|
(215
|
)
|
0
|
|
(69
|
)
|
(191
|
)
|
0
|
|
0
|
|
(550
|
)
|
||||||||||||||
|
Investment gains (losses) on assets supporting experience-rated contractholder liabilities, net
|
336
|
|
0
|
|
0
|
|
0
|
|
0
|
|
0
|
|
0
|
|
||||||||||||||
|
Change in experience-rated contractholder liabilities due to assets value changes
|
0
|
|
0
|
|
0
|
|
151
|
|
0
|
|
0
|
|
0
|
|
||||||||||||||
|
Divested and Run-off businesses:
|
||||||||||||||||||||||||||||
|
Closed Block division
|
5,826
|
|
2,653
|
|
3,219
|
|
133
|
|
2,007
|
|
1
|
|
37
|
|
||||||||||||||
|
Other Divested and Run-off businesses
|
775
|
|
321
|
|
657
|
|
0
|
|
0
|
|
4
|
|
0
|
|
||||||||||||||
|
Equity in earnings of operating joint ventures and earnings attributable to noncontrolling interests
|
(77
|
)
|
0
|
|
0
|
|
0
|
|
0
|
|
0
|
|
0
|
|
||||||||||||||
|
Total per Consolidated Statements of Operations
|
$
|
59,689
|
|
$
|
16,435
|
|
$
|
33,794
|
|
$
|
3,822
|
|
$
|
2,091
|
|
$
|
1,327
|
|
$
|
1,580
|
|
|||||||
285
|
|
Year Ended December 31, 2016
|
|||||||||||||||||||||||||||
|
|
Revenues
|
Net
Investment
Income
|
Policyholders’
Benefits
|
Interest
Credited to
Policyholders’
Account
Balances
|
Dividends to
Policyholders
|
Interest
Expense
|
Amortization
of DAC
|
|||||||||||||||||||||
|
|
(in millions)
|
|||||||||||||||||||||||||||
|
PGIM
|
$
|
2,961
|
|
$
|
80
|
|
$
|
0
|
|
$
|
0
|
|
$
|
0
|
|
$
|
15
|
|
$
|
15
|
|
|||||||
|
Total PGIM division(1)
|
2,961
|
|
80
|
|
0
|
|
0
|
|
0
|
|
15
|
|
15
|
|
||||||||||||||
|
Retirement
|
12,876
|
|
4,263
|
|
9,328
|
|
1,473
|
|
0
|
|
19
|
|
33
|
|
||||||||||||||
|
Group Insurance
|
5,343
|
|
608
|
|
4,032
|
|
263
|
|
0
|
|
5
|
|
6
|
|
||||||||||||||
|
Total U.S. Workplace Solutions division(1)
|
18,219
|
|
4,871
|
|
13,360
|
|
1,736
|
|
0
|
|
24
|
|
39
|
|
||||||||||||||
|
Individual Annuities
|
4,666
|
|
698
|
|
306
|
|
362
|
|
0
|
|
71
|
|
484
|
|
||||||||||||||
|
Individual Life
|
5,355
|
|
1,822
|
|
2,750
|
|
680
|
|
35
|
|
583
|
|
115
|
|
||||||||||||||
|
Total U.S. Individual Solutions division(1)
|
10,021
|
|
2,520
|
|
3,056
|
|
1,042
|
|
35
|
|
654
|
|
599
|
|
||||||||||||||
|
International Insurance
|
21,009
|
|
4,759
|
|
13,183
|
|
920
|
|
49
|
|
8
|
|
1,068
|
|
||||||||||||||
|
Total International Insurance division
|
21,009
|
|
4,759
|
|
13,183
|
|
920
|
|
49
|
|
8
|
|
1,068
|
|
||||||||||||||
|
Corporate and Other operations
|
(636
|
)
|
465
|
|
26
|
|
0
|
|
0
|
|
614
|
|
(49
|
)
|
||||||||||||||
|
Total Corporate and Other
|
(636
|
)
|
465
|
|
26
|
|
0
|
|
0
|
|
614
|
|
(49
|
)
|
||||||||||||||
|
Total
|
51,574
|
|
12,695
|
|
29,625
|
|
3,698
|
|
84
|
|
1,315
|
|
1,672
|
|
||||||||||||||
|
Reconciling items:
|
||||||||||||||||||||||||||||
|
Realized investment gains (losses), net, and related adjustments
|
989
|
|
(31
|
)
|
0
|
|
0
|
|
0
|
|
0
|
|
0
|
|
||||||||||||||
|
Charges related to realized investment gains (losses), net
|
19
|
|
0
|
|
131
|
|
(50
|
)
|
0
|
|
0
|
|
168
|
|
||||||||||||||
|
Investment gains (losses) on assets supporting experience-rated contractholder liabilities, net
|
(17
|
)
|
0
|
|
0
|
|
0
|
|
0
|
|
0
|
|
0
|
|
||||||||||||||
|
Change in experience-rated contractholder liabilities due to assets value changes
|
0
|
|
0
|
|
0
|
|
(21
|
)
|
0
|
|
0
|
|
0
|
|
||||||||||||||
|
Divested and Run-off businesses:
|
||||||||||||||||||||||||||||
|
Closed Block division
|
5,669
|
|
2,578
|
|
3,282
|
|
134
|
|
1,941
|
|
2
|
|
37
|
|
||||||||||||||
|
Other Divested and Run-off businesses
|
602
|
|
278
|
|
594
|
|
0
|
|
0
|
|
3
|
|
0
|
|
||||||||||||||
|
Equity in earnings of operating joint ventures and earnings attributable to noncontrolling interests
|
(57
|
)
|
0
|
|
0
|
|
0
|
|
0
|
|
0
|
|
0
|
|
||||||||||||||
|
Total per Consolidated Statements of Operations
|
$
|
58,779
|
|
$
|
15,520
|
|
$
|
33,632
|
|
$
|
3,761
|
|
$
|
2,025
|
|
$
|
1,320
|
|
$
|
1,877
|
|
|||||||
__________
|
(1)
|
2016 divisional subtotals are presented on a basis consistent with the Company’s new organizational structure implemented in 2017. Individual segment results and consolidated totals remain unchanged.
|
286
Revenues, calculated in accordance with U.S. GAAP, for the years ended December 31, include the following associated with the Company’s foreign and domestic operations:
|
2018
|
2017
|
2016
|
||||||||||
|
|
(in millions)
|
|||||||||||
|
Domestic operations
|
$
|
40,603
|
|
$
|
36,573
|
|
$
|
36,079
|
|
|||
|
Foreign operations, total
|
$
|
22,389
|
|
$
|
23,116
|
|
$
|
22,700
|
|
|||
|
Foreign operations, Japan
|
$
|
19,125
|
|
$
|
19,589
|
|
$
|
19,768
|
|
|||
|
Foreign operations, Korea
|
$
|
1,495
|
|
$
|
1,567
|
|
$
|
1,439
|
|
|||
Management has determined the intersegment revenues with reference to market rates. Intersegment revenues are eliminated in consolidation in Corporate and Other. The PGIM segment revenues include intersegment revenues, primarily consisting of asset-based management and administration fees, for the years ended December 31, as follows:
|
2018
|
2017
|
2016
|
||||||||||
|
|
(in millions)
|
|||||||||||
|
PGIM segment intersegment revenues
|
$
|
731
|
|
$
|
717
|
|
$
|
682
|
|
|||
Segments may also enter into internal derivative contracts with other segments. For adjusted operating income, each segment accounts for the internal derivative results consistent with the manner in which that segment accounts for other similar external derivatives.
|
22.
|
COMMITMENTS AND CONTINGENT LIABILITIES
|
Leases
The Company occupies leased office space in many locations under various long-term leases and has entered into numerous leases covering the long-term use of computers and other equipment. Rental expense, net of sub-lease income, incurred for the years ended December 31,
2018
,
2017
and
2016
was
$265 million
,
$258 million
and
$252 million
, respectively.
The following table presents, at December 31,
2018
, the Company’s future minimum lease payments under non-cancelable operating and capital leases along with associated sub-lease income:
|
Operating and
Capital Leases(1)
|
Sub-lease
Income
|
|||||||
|
|
(in millions)
|
|||||||
|
2019
|
$
|
168
|
|
$
|
1
|
|
||
|
2020
|
133
|
|
1
|
|
||||
|
2021
|
106
|
|
1
|
|
||||
|
2022
|
82
|
|
0
|
|
||||
|
2023
|
58
|
|
0
|
|
||||
|
2024 and thereafter
|
138
|
|
0
|
|
||||
|
Total
|
$
|
685
|
|
$
|
3
|
|
||
|
(1)
|
Future minimum lease payments under capital leases were $
26
million as of December 31,
2018
.
|
Occasionally, for business reasons, the Company may exit certain non-cancelable operating leases prior to their expiration. In these instances, the Company’s policy is to accrue, at the time it ceases to use the property being leased, the future rental expense net of any expected sub-lease income, and to release this reserve over the remaining commitment period. Of the total non-cancelable operating and capital leases amounts listed above, there were
no
such accruals as of December 31,
2018
. There were
no
accruals of sub-lease income as of December 31,
2018
.
Commercial Mortgage Loan Commitments
287
|
|
December 31,
|
|||||||
|
|
2018
|
2017
|
||||||
|
|
(in millions)
|
|||||||
|
Total outstanding mortgage loan commitments
|
$
|
3,299
|
|
$
|
2,772
|
|
||
|
Portion of commitment where prearrangement to sell to investor exists
|
$
|
1,490
|
|
$
|
435
|
|
||
In connection with the Company’s commercial mortgage operations, it originates commercial mortgage loans. Commitments for loans that will be held for sale are recognized as derivatives and recorded at fair value. In certain of these transactions, the Company pre-arranges that it will sell the loan to an investor, including to government sponsored entities as discussed below, after the Company funds the loan.
Commitments to Purchase Investments (excluding Commercial Mortgage Loans)
|
|
December 31,
|
|||||||
|
|
2018
|
2017
|
||||||
|
|
(in millions)
|
|||||||
|
Expected to be funded from the general account and other operations outside the separate accounts
|
$
|
6,941
|
|
$
|
6,319
|
|
||
|
Expected to be funded from separate accounts
|
$
|
147
|
|
$
|
141
|
|
||
The Company has other commitments to purchase or fund investments, some of which are contingent upon events or circumstances not under the Company’s control, including those at the discretion of the Company’s counterparties. The Company anticipates a portion of these commitments will ultimately be funded from its separate accounts.
Indemnification of Securities Lending Transactions
|
|
December 31,
|
|||||||
|
|
2018
|
2017
|
||||||
|
|
(in millions)
|
|||||||
|
Indemnification provided to certain securities lending clients
|
$
|
5,399
|
|
$
|
4,619
|
|
||
|
Fair value of related collateral associated with above indemnifications
|
$
|
5,503
|
|
$
|
4,722
|
|
||
|
Accrued liability associated with guarantee
|
$
|
0
|
|
$
|
0
|
|
||
In the normal course of business, the Company may facilitate securities lending transactions on behalf of certain client accounts (collectively, “the accounts”). In certain of these arrangements, the Company has provided an indemnification to the accounts to hold them harmless against losses caused by counterparty (i.e., borrower) defaults associated with the securities lending activity facilitated by the Company. Collateral is provided by the counterparty to the accounts at the inception of the loan equal to or greater than
102%
of the fair value of the loaned securities and the collateral is maintained daily at
102%
or greater of the fair value of the loaned securities. The Company is only at risk if the counterparty to the securities lending transaction defaults and the value of the collateral held is less than the value of the securities loaned to such counterparty. The Company believes the possibility of any payments under these indemnities is remote.
Credit Derivatives Written
As discussed further in Note 5, the Company writes credit derivatives under which the Company is obligated to pay the counterparty the referenced amount of the contract and receive in return the defaulted security or similar security.
Guarantees of Asset Values
288
|
|
December 31,
|
|||||||
|
|
2018
|
2017
|
||||||
|
|
(in millions)
|
|||||||
|
Guaranteed value of third parties’ assets
|
$
|
79,215
|
|
$
|
77,290
|
|
||
|
Fair value of collateral supporting these assets
|
$
|
77,897
|
|
$
|
77,651
|
|
||
|
Asset (liability) associated with guarantee, carried at fair value
|
$
|
2
|
|
$
|
(1
|
)
|
||
Certain contracts underwritten by the Retirement segment include guarantees related to financial assets owned by the guaranteed party. These contracts are accounted for as derivatives and carried at fair value. The collateral supporting these guarantees is not reflected on the Consolidated Statements of Financial Position.
Indemnification of Serviced Mortgage Loans
|
|
December 31,
|
|||||||
|
|
2018
|
2017
|
||||||
|
|
(in millions)
|
|||||||
|
Maximum exposure under indemnification agreements for mortgage loans serviced by the Company
|
$
|
1,828
|
|
$
|
1,609
|
|
||
|
First-loss exposure portion of above
|
$
|
543
|
|
$
|
483
|
|
||
|
Accrued liability associated with guarantees
|
$
|
17
|
|
$
|
14
|
|
||
As part of the commercial mortgage activities of the Company’s PGIM segment, the Company provides commercial mortgage origination, underwriting and servicing for certain government sponsored entities, such as Fannie Mae and Freddie Mac. The Company has agreed to indemnify the government sponsored entities for a portion of the credit risk associated with certain of the mortgages it services through a delegated authority arrangement. Under these arrangements, the Company originates multi-family mortgages for sale to the government sponsored entities based on underwriting standards they specify, and makes payments to them for a specified percentage share of losses they incur on certain loans serviced by the Company. The Company’s percentage share of losses incurred generally varies from
2%
to
20%
of the loan balance, and is typically based on a first-loss exposure for a stated percentage of the loan balance, plus a shared exposure with the government sponsored entity for any losses in excess of the stated first-loss percentage, subject to a contractually specified maximum percentage. The Company determines the liability related to this exposure using historical loss experience, and the size and remaining life of the asset. The Company services
$14,335 million
and
$12,892 million
of mortgages subject to these loss-sharing arrangements as of December 31,
2018
and
2017
, respectively, all of which are collateralized by first priority liens on the underlying multi-family residential properties. As of December 31,
2018
, these mortgages had a weighted-average debt service coverage ratio of
1.83
times and a weighted-average loan-to-value ratio of
62%
. As of December 31,
2017
, these mortgages had a weighted-average debt service coverage ratio of
1.82
times and a weighted-average loan-to-value ratio of
59%
. The Company had
no
losses related to indemnifications that were settled for years ended December 31,
2018
,
2017
, and
2016
.
Other Guarantees
|
|
December 31,
|
|||||||
|
|
2018
|
2017
|
||||||
|
|
(in millions)
|
|||||||
|
Other guarantees where amount can be determined
|
$
|
77
|
|
$
|
31
|
|
||
|
Accrued liability for other guarantees and indemnifications
|
$
|
0
|
|
$
|
0
|
|
||
The Company is also subject to other financial guarantees and indemnity arrangements. The Company has provided indemnities and guarantees related to acquisitions, dispositions, investments and other transactions that are triggered by, among other things, breaches of representations, warranties or covenants provided by the Company. These obligations are typically subject to various time limitations, defined by the contract or by operation of law, such as statutes of limitation. In some cases, the maximum potential obligation is subject to contractual limitations, while in other cases such limitations are not specified or applicable. Included above are
$13 million
and
$31 million
as of December 31,
2018
and
2017
, respectively, of yield maintenance guarantees related to certain investments the Company sold. The Company does not expect to make any payments on these guarantees and is not carrying any liabilities associated with these guarantees.
289
Since certain of these obligations are not subject to limitations, it is not possible to determine the maximum potential amount due under these guarantees. The accrued liabilities identified above do not include retained liabilities associated with sold businesses.
Insolvency Assessments
Most of the jurisdictions in which the Company is admitted to transact business require insurers doing business within the jurisdiction to participate in guarantee associations, which are organized to pay contractual benefits owed pursuant to insurance policies issued by impaired, insolvent or failed insurers. These associations levy assessments, up to prescribed limits, on all member insurers in a particular state on the basis of the proportionate share of the premiums written by member insurers in the lines of business in which the impaired, insolvent or failed insurer engaged. Some states permit member insurers to recover assessments paid through full or partial premium tax offsets. In addition, Japan has established the Japan Policyholders Protection Corporation as a contingency to protect policyholders against the insolvency of life insurance companies in Japan through assessments to companies licensed to provide life insurance.
Assets and liabilities held for insolvency assessments were as follows:
|
|
December 31,
|
|||||||
|
|
2018
|
2017
|
||||||
|
|
(in millions)
|
|||||||
|
Other assets:
|
||||||||
|
Premium tax offset for future undiscounted assessments
|
$
|
54
|
|
$
|
64
|
|
||
|
Premium tax offset currently available for paid assessments
|
3
|
|
6
|
|
||||
|
Total
|
$
|
57
|
|
$
|
70
|
|
||
|
Other liabilities:
|
||||||||
|
Insolvency assessments
|
$
|
39
|
|
$
|
39
|
|
||
Contingent Liabilities
On an ongoing basis, the Company reviews its operations including, but not limited to, practices and procedures for meeting obligations to our customers and other parties. This review may result in the modification or enhancement of processes, including concerning the timing or computation of payments to customers and other parties. In certain cases, if appropriate, the Company may offer customers or other parties remediation and may incur charges, including the cost of such remediation, administrative costs and regulatory fines.
The Company is subject to the laws and regulations of states and other jurisdictions concerning the identification, reporting and escheatment of unclaimed or abandoned funds, and is subject to audit and examination for compliance with these requirements. For additional discussion of these matters, see “—Litigation and Regulatory Matters” below.
It is possible that the results of operations or the cash flow of the Company in a particular quarterly or annual period could be materially affected as a result of payments in connection with the matters discussed above or other matters depending, in part, upon the results of operations or cash flow for such period. Management believes, however, that ultimate payments in connection with these matters, after consideration of applicable reserves and rights to indemnification, should not have a material adverse effect on the Company’s financial position.
Litigation and Regulatory Matters
The Company is subject to legal and regulatory actions in the ordinary course of its businesses. Pending legal and regulatory actions include proceedings relating to aspects of the Company’s businesses and operations that are specific to it and proceedings that are typical of the businesses in which it operates, including in both cases businesses that have been either divested or placed in wind down status. Some of these proceedings have been brought on behalf of various alleged classes of complainants. In certain of these matters, the plaintiffs are seeking large and/or indeterminate amounts, including punitive or exemplary damages. The outcome of litigation or a regulatory matter, and the amount or range of potential loss at any particular time, is often inherently uncertain.
The Company establishes accruals for litigation and regulatory matters when it is probable that a loss has been incurred and the amount of that loss can be reasonably estimated. For litigation and regulatory matters where a loss may be reasonably possible, but not probable, or is probable but not reasonably estimable, no accrual is established but the matter, if potentially material, is
290
disclosed, including matters discussed below. The Company estimates that as of December 31,
2018
, the aggregate range of reasonably possible losses in excess of accruals established for those litigation and regulatory matters for which such an estimate currently can be made is less than
$250 million
. Any estimate is not an indication of expected loss, if any, or the Company’s maximum possible loss exposure on such matters. The Company reviews relevant information with respect to its litigation and regulatory matters on a quarterly and annual basis and updates its accruals, disclosures and estimates of reasonably possible loss based on such reviews.
Labor and Employment Matters
Prudential of Brazil Labor and Employment Matters
Prudential of Brazil (“POB”) sells insurance products to consumers through life planner franchisees (“Life Planners”), who are engaged as independent life insurance brokers and not as employees. When a Life Planner’s contractual relationship with POB is terminated, in many cases the Life Planner commences a labor suit against POB alleging entitlement to employment related benefits. POB is a defendant in numerous such lawsuits in Brazil brought by former Life Planners, and has been subject to regulatory actions challenging the validity of POB's franchise model. POB has recently modified its franchise model to, among other things, mitigate the labor risk involving Life Planners. POB may continue to become subject to additional Life Planner labor suits and regulatory actions in the future notwithstanding the steps that POB has taken to attempt to mitigate the labor risk.
Individual Annuities, Individual Life and Group Insurance
Wells Fargo MyTerm Sales
In December 2016, the Company announced that it suspended sales of its MyTerm life insurance product through Wells Fargo pending completion of a Company-initiated review of how the product was being sold through Wells Fargo. The Company has offered to reimburse the full amount of premium with interest, to any Wells Fargo customers with concerns about the way in which the product was purchased. Wells Fargo distributed the product from June 2014 until sales were suspended, and Prudential Financial’s total annualized new business premiums associated with sales through Wells Fargo were approximately
$4 million
. Annualized new business premiums include 100% of scheduled first year premiums for policies sold during this period.
The Company has received inquiries, requests for information, subpoenas and a civil investigative demand related to this matter from state and federal regulators, including its lead state insurance regulator, NJDOBI, state attorneys general and federal legislators, and is responding to these requests. The Company has also received shareholder demands for certain books and records under New Jersey law. Litigation related to this matter is described below. The Company may become subject to additional regulatory inquiries and other investigations and actions, shareholder demands and litigation related to this matter. The Company has provided notice to Wells Fargo that it may seek indemnification under the MyTerm distribution agreement between the parties. In December 2017, NJDOBI ended its investigation and concluded that there was no evidence of improper activity by Prudential regarding the sale and marketing of MyTerm policies to Wells Fargo customers. In November 2018, the Company and Wells Fargo resolved the Company’s claims emanating from the MyTerm distribution agreement. This matter is now closed.
Broderick v. The Prudential Insurance Company of America, et al.
In December 2016, a complaint entitled
Julie Han Broderick, Darron Smith and Thomas Schreck v. The Prudential Insurance Company of America, et al.,
was filed in the Superior Court of New Jersey, Law Division - Essex County. The complaint: (i) alleges that defendants terminated plaintiffs’ employment for engaging in whistleblowing conduct involving the sale of MyTerm policies through Wells Fargo and violated New Jersey’s Conscientious Employee Protection Act; and (ii) seeks back and front pay, compensatory and punitive damages and attorneys’ fees and costs. In January 2017, defendants filed an answer to the complaint.
Huffman v. The Prudential Insurance Company of America
In September 2010,
Huffman v. The Prudential Insurance Company of America
, a purported nationwide class action brought on behalf of beneficiaries of group life insurance contracts owned by the Employee Retirement Income Security Act (“ERISA”)-governed employee welfare benefit plans was filed in the United States District Court for the Eastern District of Pennsylvania, challenging the use of retained asset accounts in employee welfare benefit plans to settle death benefit claims as a violation of ERISA and seeking injunctive relief and disgorgement of profits. In July 2011, Prudential Insurance’s motion for judgment on the pleadings was denied. In February 2012, plaintiffs filed a motion to certify the class. In April 2012, the court stayed the case pending the outcome of a case involving another insurer that is before the Third Circuit Court of Appeals. In August 2014, the court lifted the stay, and in September 2014, plaintiffs filed a motion seeking leave to amend the complaint. In July 2015, the court granted plaintiffs’ motion to file an amended complaint. Plaintiffs’ amended complaint added
two
new class representatives, a new
291
common law breach of fiduciary duty claim, and a prohibited transactions claim under Section 406(a)(1)(C) of ERISA. In August 2015, Prudential Insurance filed its answer to the first amended complaint. In February 2016, plaintiffs filed a class certification motion. In September 2016, plaintiffs’ motion for class certification was denied, and in October 2016, plaintiffs filed a motion for reconsideration. In December 2016, the motion for reconsideration was denied. In February 2017, all parties filed motions for summary judgment. In December 2017, the court granted plaintiffs’ motion for summary judgment as to their breach of fiduciary duty claims under ERISA, dismissed plaintiffs’ state law claim, and denied the motions for summary judgment on the prohibited transaction claim. In December 2017, plaintiffs filed a motion to alter or amend the prior orders denying class certification. In January 2018, the court denied in part, and granted in part, plaintiffs’ class certification motion and certified a class limited to participants in the two employer plans involving the named plaintiffs. In February 2018, Prudential Insurance filed a petition with the Third Circuit Court of Appeals seeking permission to appeal the class certification decision. In April 2018, the Third Circuit Court of Appeals denied Prudential Insurance’s request for leave to appeal the class certification decision. In November 2018, the court issued an order granting preliminary approval of plaintiffs’ proposed Settlement and Distribution Plan.
Behfarin v. Pruco Life
In July 2017, a putative class action complaint entitled
Richard Behfarin v. Pruco Life Insurance Company
was filed in the United States District Court for the Central District of California, alleging that the Company imposes charges on owners of universal life policies to cure defaults and/or reinstate lapses, that are inconsistent with the applicable universal life policy. The complaint includes claims for breach of contract, breach of implied covenant of good faith and fair dealing, and violation of California law, and seeks unspecified damages along with declaratory and injunctive relief. In September 2017, the Company filed its answer to the complaint. In September 2018, plaintiff filed a motion for class certification.
Escheatment Litigation
State of West Virginia ex. Rel. John D. Perdue v. The Prudential Insurance Company of America
In September 2012, the State of West Virginia, through its State Treasurer, filed a lawsuit against Prudential Insurance in the Circuit Court of Putnam County, West Virginia. The complaint alleges violations of the West Virginia Uniform Unclaimed Property Fund Act by failing to properly identify and report all unclaimed insurance policy proceeds which should either be paid to beneficiaries or escheated to West Virginia. The complaint seeks to examine the records of Prudential Insurance to determine compliance with the West Virginia Uniform Unclaimed Property Fund Act, and to assess penalties and costs in an undetermined amount. In June 2015, the West Virginia Supreme Court issued a decision: (i) reversing the trial court’s dismissal of the West Virginia Treasurer’s complaint alleging violations of West Virginia’s unclaimed property law; and (ii) remanding the case to the Circuit Court of Putnam County for proceedings consistent with its decision. In July 2015, a petition for rehearing was filed with the West Virginia Supreme Court. In September 2015, the West Virginia Supreme Court of Appeals denied Prudential Insurance’s rehearing petition. In November 2015, Prudential Insurance filed its answer. In September 2018, the case was dismissed with prejudice. This matter is now closed.
State of West Virginia ex. Rel. John D. Perdue v. Pruco Life
In October 2012, the State of West Virginia commenced a second action against Pruco Life making the same allegations stated in the action against Prudential Insurance. In April 2013, Pruco Life filed motions to dismiss the complaints in both of the West Virginia actions. In December 2013, the court granted Pruco Life’s motions and dismissed the complaints with prejudice. In January 2014, the State of West Virginia appealed the decisions. In June 2015, the West Virginia Supreme Court issued a decision: (i) reversing the trial court’s dismissal of the West Virginia Treasurer’s complaint alleging violations of West Virginia’s unclaimed property law; and (ii) remanding the case to the Circuit Court of Putnam County for proceedings consistent with its decision. In July 2015, a petition for rehearing was filed with the West Virginia Supreme Court. In September 2015, the West Virginia Supreme Court of Appeals denied Pruco Life’s rehearing petition. In November 2015, Pruco Life filed its answer. In September 2018, the case was dismissed with prejudice. This matter is now closed.
Total Asset Recovery Services, LLC v. MetLife, Inc., et al., Prudential Financial, Inc., The Prudential Insurance Company of America, and Prudential Insurance Agency, LLC
In December 2017, Total Asset Recovery Services, LLC, on behalf of the State of New York, filed a Second Amended Complaint in the Supreme Court of the State of New York, County of New York, against, among other
19
defendants, Prudential Financial, Inc., The Prudential Insurance Company of America and Prudential Insurance Agency, LLC, alleging that the Company failed to escheat life insurance proceeds in violation of the New York False Claims Act. The second amended complaint seeks
292
injunctive relief, compensatory damages, civil penalties, treble damages, prejudgment interest, attorneys’ fees and costs. In May 2018, defendants filed a motion to dismiss the Second Amended Complaint.
Other Matters
Rosen v. PRIAC, et al.
In December 2015, a putative class action complaint entitled
Richard A. Rosen,
on behalf of the Ferguson Enterprises, Inc. 401(k) Retirement Savings Plan and On behalf of All Other Similarly Situated Employee Benefit Plans v. PRIAC, Prudential Bank & Trust, FSB and Prudential Investment Management Services, LLC
was filed in the United States District Court, District of Connecticut. The complaint: (i) seeks certification of a class of all ERISA-covered employee pension benefit plans with which Prudential has maintained a contractual relationship based on a group annuity contract or group funding agreement; and (ii) alleges that the defendants breached their fiduciary obligations by accepting revenue sharing payments from investment vehicles in its separate accounts and/or by accepting excessive compensation by crediting rates on stable value accounts that are less than PRIAC’s internal rate of return. In April 2016, plaintiff filed an amended complaint: (i) removing Prudential Investment Management Services, LLC, as a defendant; (ii) withdrawing all claims concerning Stable Value Accounts; and (iii) adding as defendants the employer/sponsor of plaintiff’s retirement plan (Ferguson Enterprises, Inc.), and the investment advisor for plaintiff’s retirement plan (Capital Partners, LLC d/b/a Captrust Financial Advisors). In May 2016, the Muir v. PRIAC complaint was consolidated with this lawsuit. In June 2016, PRIAC, along with the other named defendants, filed motions to dismiss the amended complaint. In December 2016, the court granted defendants’ motions to dismiss with prejudice. In January 2017, plaintiff filed a Notice of Appeal to the Second Circuit. In March 2017, plaintiff filed a voluntary notice of dismissal with prejudice as to Ferguson Enterprises, Inc. and Capital Partners, LLC d/b/a Captrust Financial Advisors. In October 2017, a three judge panel from the Second Circuit Court of Appeals affirmed the judgment of the district court, and plaintiff subsequently filed a petition for rehearing before the entire Court of Appeals. In December 2017, the Court of Appeals denied plaintiff’s request for a rehearing. In March 2018, plaintiff’s time to appeal the decision of the Court of Appeals expired. This case is now closed.
Residential Mortgage-Backed Securities (“RMBS”) Trustee Litigation
In June 2014, the Company, together with
nine
other institutional investors, filed
six
actions in New York state court against certain RMBS trustees. The actions, which are brought derivatively on behalf of more than
2,200
RMBS trusts, seek unspecified damages attributable to the trustees’ alleged failure to: (i) enforce the trusts’ respective repurchase rights against sellers of defective mortgage loans; and (ii) properly monitor the respective mortgage loan servicers. The complaints assert claims for breach of contract, breach of fiduciary duty, negligence and violations of the Trust Indenture Act of 1939. In July 2014, the Company amended its complaint against each of the
six
defendants. In November 2014, the Company filed amended complaints against each of the trustee bank defendants in federal court in the Southern District of New York. In December 2014, the New York State Court actions were dismissed without prejudice upon the Company’s request. The
six
actions described above are captioned:
PICA et al. v. Bank of New York Mellon (“BONYM”)
In March 2015, defendants filed a motion to dismiss the amended complaint. In March 2016, the court issued a decision involving BONYM’s motion to dismiss: (i) denying the motion to dismiss the Pooling and Servicing Agreement (“PSA”) trust claims for lack of jurisdiction; (ii) denying the motion regarding claims for violations of the Trust Indenture Act of 1939 and breach of contract; and (iii) granting the motion regarding claims for negligence and breach of fiduciary duty.
PICA et al. v. Citibank N.A.
In February 2015, defendants filed a motion to dismiss the amended complaint. In September 2015, the court issued a decision involving Citibank's motion to dismiss: (i) with respect to the PSA trusts, granting the motion and declining to exercise supplemental jurisdiction; (ii) with respect to the Indenture trusts, denying the motion regarding claims for breach of contract, violations of the Trust Indenture Act of 1939, negligence and breach of fiduciary duty concerning the duty to avoid conflicts of interest; and (iii) with respect to the Indenture trusts, granting the motion to dismiss claims for negligence and breach of fiduciary duty concerning the duty of care. In November 2015, the Company, together with other institutional investors, filed a complaint in New York State Supreme Court, captioned
Fixed Income Shares: Series M, et al. v. Citibank N.A.
, asserting claims relating to the PSA trusts. In February 2016, Citibank filed a motion to dismiss the state court complaint. In August 2016, plaintiffs filed an amended complaint in state court, and in September 2016, Citibank filed a motion to dismiss the amended complaint and plaintiffs filed in federal court a motion for class certification. In April 2017, Citibank filed a motion for summary judgment in the federal court action. In June 2017, the state court issued a decision regarding defendants’ motion to dismiss the amended complaint: (i) sustaining plaintiffs’ breach of contract claims concerning Citibank’s pre-Event of Default obligations; (ii) dismissing plaintiffs’ breach of contract
293
claims concerning Citibank’s post-Event of Default obligations; (iii) sustaining plaintiffs’ implied covenant of good faith and fair dealing claim; (iv) dismissing plaintiffs’ claim for breach of fiduciary duty; and (v) dismissing plaintiffs’ claim for breach of duty to avoid conflicts of interest. In July 2017, Citibank filed an appeal to the Appellate Division of the Supreme Court of New York, First Department, from the June 2017 decision denying, in part, its motion to dismiss. In January 2018, the First Department: (i) affirmed the trial court’s ruling upholding the breach of contract claim based on the trustee’s failure to give written notice of breaches of representations and warranties; and (ii) reversed the trial court’s order that sustained plaintiffs’ breach of contract and implied covenant of good faith and fair dealing claims concerning servicing violations. In March 2018, the federal court granted Citibank’s motion for summary judgment. In April 2018, plaintiffs filed a notice of appeal to the U.S. Court of Appeals for the Second Circuit from the March 2018 decision granting summary judgment.
PICA et al. v. Deutsche Bank, et al.
In April 2015, defendants filed a motion to dismiss the amended complaint. In January 2016, the court issued a decision involving Deutsche Bank’s motion to dismiss: (i) with respect to the PSA trusts, granting the motion and declining to exercise supplemental jurisdiction; and (ii) with respect to the Indenture trusts, granting leave for plaintiffs to file an amended complaint. In February 2016, the Company, together with other institutional investor plaintiffs, filed an amended complaint in federal court. In March 2016, the Company, together with other institutional investors, filed a complaint in California State Superior Court, captioned
BlackRock Balanced Capital Portfolio (FI), et al. v. Deutsche Bank Trust Company Americas
, asserting claims relating to the PSA trusts. In May 2016, the Company, together with other institutional investors, filed an amended class action complaint in California State Superior Court. In July 2016, defendant filed a motion to dismiss the amended federal court complaint. In August 2016, defendant filed a demurrer and motion to strike the amended state court class action complaint. In October 2016, the court issued a decision regarding defendants’ motion to dismiss: (i) sustaining plaintiffs’ breach of contract claims concerning the trust at issue; (ii) dismissing plaintiffs’ tort claims for breach of fiduciary duty; and (iii) dismissing plaintiffs’ claims of breach of duty to avoid conflicts of interest. The court granted plaintiffs’ leave to file an amended complaint. In January 2017, the federal court issued a decision involving Deutsche Bank’s motion to dismiss: (i) granting the motion with respect to plaintiff’s conflicts of interest claims; and (ii) denying the motion with respect to plaintiffs’ representations-and-warranties claims, servicer-notification claims, event-of-default claims and Trust Indenture Act claims. In February 2017, the court issued a decision regarding defendants’ motion to dismiss the amended complaint: (i) sustaining plaintiffs’ breach of contract claims concerning the failure to remedy known servicing violations as to all
sixty-two
trusts at issue; (ii) sustaining plaintiffs’ breach of contract claims concerning the failure to enforce seller representation and warranty claims as to
forty-one
trusts, and dismissing such claims as to the remaining
twenty-one
trusts; (iii) dismissing plaintiffs’ claim for breach of fiduciary duty; and (iv) dismissing plaintiffs’ claim for breach of duty to avoid conflicts of interest. In January 2018, plaintiffs filed motions for class certification in the state and federal court actions. In May 2018, plaintiffs’ motion for class certification was denied in the state court action. In June 2018, plaintiffs filed a Notice of Appeal to the California Court of Appeal of the denial of their class certification motion. In December 2018, the California Court of Appeal entered the parties’ stipulation dismissing plaintiffs’ appeal of the class certification decision. In December 2018, the federal court action was dismissed with prejudice. In January 2019, the state court action was dismissed with prejudice.
PICA et al. v. HSBC, et al
.
In January 2015, defendants filed a motion to dismiss the amended complaint. In June 2015, the court granted in part, and denied in part, defendants’ motion to dismiss the complaint for failure to state a claim and granted leave to file an amended complaint. In July 2015, plaintiffs filed an amended complaint. In January 2017, plaintiffs filed a motion seeking class certification and appointing class representatives and class counsel. In February 2018, the court denied plaintiffs’ motion for class certification and plaintiffs filed a petition with the Second Circuit Court of Appeals seeking permission to appeal the class certification decision. In May 2018, the Second Circuit denied plaintiffs’ request for permission to appeal the denial of their class certification motion.
PICA et al. v. U.S. Bank N.A.
In February 2015, defendants filed a motion to dismiss the amended complaint. In May 2015, the court granted defendants’ motion to dismiss: (i) declining to exercise supplemental jurisdiction regarding claims involving the PSA trusts; and (ii) granting leave for plaintiffs to file an amended complaint asserting direct claims involving the Indenture trusts. In June 2015, the Company, together with other institutional investors, filed a complaint in New York State Supreme court, captioned
BlackRock Balanced Capital Portfolio (FI), et al. v. U.S. Bank Nat’l Ass’n
, asserting claims relating to the PSA trusts. In July 2015, plaintiffs filed with the court an amended complaint asserting direct claims relating to the Indenture trusts. In August 2015, defendant filed a motion to dismiss the amended class action complaint in the federal court action. In September 2015, defendant filed a motion to dismiss the class action complaint in the state court action. In February 2016, the federal district court issued a decision involving U.S. Bank’s motion to dismiss: (i) upholding the breach of contract and Trust Indenture Act claims; and (ii) dismissing the breach of fiduciary duty and extra-contractual claims. In September 2016, the Company together with other institutional investor plaintiffs
294
filed an amended complaint in state court. In October 2016, U.S. Bank filed a motion to dismiss the amended state court complaint. In November 2016, plaintiffs filed in federal court motions seeking class certification and appointing class representatives and class counsel. In January 2018, the state court issued a decision on U.S. Bank’s motion to dismiss the amended complaint: (i) upholding the representation and warranty breach of contract claims for all
770
trusts; (ii) upholding the breach of contract claims related to servicer violations for
77
trusts; and (iii) dismissing the breach of fiduciary duty, negligence, and implied covenant of good faith and fair dealing claims. In January 2018, the court denied plaintiffs’ motion for class certification in the federal court action. In February 2018, the federal court entered a stipulated order: (i) dismissing all claims involving
three
trusts with prejudice; (ii) with respect to
twenty
trusts, dismissing with prejudice the Trust Indenture Act (“TIA”) claims for lack of standing, and the breach of contract claims without prejudice; and (iii) dismissing without prejudice the TIA and breach of contract claims concerning the
four
remaining trusts. In February 2018, U.S. Bank filed an appeal from the state court’s order concerning U.S. Bank’s motion to dismiss the amended complaint. In March 2018, plaintiffs filed a cross-appeal of the state court’s order concerning the motion to dismiss. In August 2018, plaintiffs filed a second class action complaint in New York state court against U.S. Bank, as trustee, asserting claims for breach of contract, breach of fiduciary duty, breach of the implied covenant of good faith and fair dealing, and breach of duty of care. In October 2018, the New York State Supreme Court, First Department, modified the lower court’s January 2018 order, by dismissing plaintiffs’ breach of contract claims for servicer violations involving
56
of
77
trusts, and otherwise affirmed the remainder of the lower court’s January 2018 order.
PICA et al. v. Wells Fargo Bank, et al
.
In April 2015, defendants filed a motion to dismiss the amended complaint. In January 2016, the court issued a decision involving Wells Fargo’s motion to dismiss: (i) with respect to the PSA trusts, granting the motion and declining to exercise supplemental jurisdiction; and (ii) with respect to the Indenture trusts, granting leave for plaintiffs to file an amended complaint. In February 2016, the Company, together with other institutional investor plaintiffs, filed an amended complaint in federal court. In March 2016, the Company, together with other institutional investors, filed a complaint in California State Superior court, captioned
BlackRock Balanced Capital Portfolio (FI), et al. v. Wells Fargo Bank, Nat’l Ass’n
., asserting claims relating to the PSA trusts. In May 2016, defendant filed a motion to dismiss or to stay the state court action. In July 2016, defendant filed a motion to dismiss the amended complaint filed previously in federal court. In October 2016, the court dismissed the state court complaint. In December 2016, the Company, together with other institutional investors, filed a complaint in New York State Court, captioned
BlackRock Core Bond Portfolio, et al. v. Wells Fargo Bank, Nat’l Ass’n.,
asserting claims related to the PSA trusts. In March 2017, the federal court issued an order concerning defendant’s motion to dismiss as to the Indenture trusts: (i) sustaining plaintiffs’ breach of contract claims; plaintiffs’ claims for violations of the Trust Indenture Act of 1939; and plaintiffs’ claims for breach of the duty to avoid conflicts of interest; and (ii) dismissing plaintiffs’ claims for breach of fiduciary duty as duplicative of the sustained contract claims. In May 2017, Wells Fargo filed a third-party complaint for contribution against PGIM, Inc., alleging that, in the event the Prudential plaintiff Funds prevail on their claims for damages against Wells Fargo, PGIM must contribute to the award due to PGIM’s alleged breach of fiduciary duties owed to the Funds in managing the Funds’ RMBS investments. In June 2017, Wells Fargo filed a motion to dismiss the complaint in New York State Court. In October 2017, PGIM filed a motion to dismiss the third-party complaint filed by Wells Fargo seeking contribution. In January 2018, plaintiffs filed a motion for class certification in the federal court action. In November 2018, plaintiffs filed an amended complaint in New York state court against Wells Fargo, as trustee, asserting claims for breach of contract, breach of fiduciary duty, breach of the implied covenant of good faith and fair dealing, breach of duty of due care, and violation of the Trust Indenture Act of 1939.
LIBOR Litigation
Prudential Investment Portfolios 2, f/k/a Dryden Core Investment Fund, o/b/o Prudential Core Short-Term Bond Fund and Prudential Core Taxable Money Market Fund v. Bank of America Corporation, et al.
In May 2014, Prudential Investment Portfolios 2, on behalf of the Prudential Core Short-Term Bond Fund and the Prudential Core Taxable Money Market Fund (the “Funds”), filed an action against
ten
banks in the United States District Court for the District of New Jersey asserting that the banks participated in the setting of LIBOR, a major benchmark interest rate. The complaint alleges that the defendant banks manipulated LIBOR, and asserts, among other things, claims for common law fraud, negligent misrepresentation, breach of contract, intentional interference with contract and with prospective economic relations, unjust enrichment, breaches of the New Jersey Civil Racketeer Influenced and Corrupt Organizations Act (“RICO”) statute, and violations of the Sherman Act. In June 2014, the United States Judicial Panel on Multidistrict Litigation transferred the action to the United States District Court for the Southern District of New York, where it has been consolidated for pre-trial purposes with other pending LIBOR-related actions. In October 2014, the Funds filed an amended complaint. In November 2014, the defendants filed a motion to dismiss the amended complaint. In August 2015, the court issued a decision granting in part, and denying in part, defendants' motions to dismiss. The court dismissed certain of the Funds' claims, including those alleging fraud based on offering material
295
statements; New Jersey RICO; and express breach of contract. The court upheld certain of the Funds' claims, including those alleging fraud based on false LIBOR submissions to the British Bankers’ Association; negligent misrepresentation; unjust enrichment; and breach of the implied covenant of good faith and fair dealing. Following the August 2015 decision, granting in part defendants' motions to dismiss, in September 2015, Prudential filed the following LIBOR complaints: (i) in the Southern District of New York, captioned
Prudential Investment Portfolios 2 et al. v. Barclays Bank PLC, et al.
(the “New York Complaint”), naming as defendants Barclays Bank PLC, Barclays Capital Inc., Barclays PLC, Citibank, N.A., Citigroup Funding Inc., Credit Suisse AG, Credit Suisse Group AG, Credit Suisse (USA) Inc., Deutsche Bank AG, HSBC Bank plc, HSBC Holdings PLC, JPMorgan Chase & Co., JPMorgan Chase Bank, N.A., Royal Bank of Canada, and The Royal Bank of Scotland PLC. These defendants were dismissed from the original LIBOR action on jurisdictional grounds. The New York complaint reasserts the causes of action brought in the original LIBOR action; and (ii) in the Western district of North Carolina, captioned
Prudential Investment Portfolios 2 et al. v. Bank of America Corporation et al
. (the “North Carolina Complaint”), naming as defendants Bank of America Corporation and Bank of America, N.A. These defendants were dismissed from the original LIBOR action on jurisdictional grounds. The North Carolina Complaint reasserts the causes of action brought in the original LIBOR action. Both the New York Complaint and the North Carolina Complaint have been transferred for pre-trial purposes to the LIBOR multi-district litigation presided over by Judge Buchwald in the U.S. District Court for the Southern District of New York. In May 2016, the Second Circuit Court of Appeals vacated the district court’s dismissal of the LIBOR plaintiffs’ antitrust claims and remanded to the district court the question of whether plaintiffs possess standing as “efficient enforcers” of applicable antitrust laws. In July 2016, defendants filed a joint motion to dismiss all antitrust claims based on lack of standing and lack of personal jurisdiction. In December 2016, the motion was granted in part and denied in part. In January 2017, the United States Supreme Court denied defendants’ petition for certiorari. In February 2017, the court clarified its December 2016 order, holding that antitrust claims only exist against panel banks, not their affiliates. This clarification resulted in the Funds’ New Jersey antitrust claims being dismissed for lack of personal jurisdiction. The Funds antitrust claims in the New York and North Carolina actions remain pending. In July 2017, the Funds obtained an entry of judgment on the New Jersey antitrust claims dismissed on personal jurisdiction grounds. In July 2017, the Funds filed with the Second Circuit Court an appeal from the dismissal of their New Jersey anti-trust claims.
Regulatory Matters
Unclaimed Property
In 2011, the New York Attorney General subpoenaed the Company, along with other companies, regarding its unclaimed property procedures and may ultimately seek remediation and other relief, including damages. Additionally, in 2011 the New York Office of Unclaimed Funds commenced an audit of the Company’s compliance with New York’s unclaimed property laws.
Securities Lending and Foreign Tax Reclaim Matter
In 2016, the Company self-reported to the SEC and the U.S. Department of Labor (“DOL”), and notified other regulators, that in some cases it failed to maximize securities lending income for the benefit of certain separate account investments due to a long-standing restriction benefiting the Company that limited the availability of loanable securities. The Company has removed the restriction and implemented a remediation plan for the benefit of customers. As part of the Company’s review of this matter, in 2018 it further self-reported to the SEC, and notified other regulators, that in some cases it failed to timely process foreign tax reclaims for the separate account investments. The Company has corrected the foreign tax reclaim process and has implemented a remediation plan for the benefit of customers.
The DOL’s review of the securities lending matter is closed. The Company is cooperating with the SEC in its review of the securities lending and foreign tax reclaim matters (which includes a review of the remediation plans) and has entered into discussions with the SEC staff regarding a possible settlement of the securities lending matter that would potentially involve charges under the Investment Advisers Act and financial remedies. We cannot predict the outcome of the discussions with the SEC regarding the foreign tax reclaim matter or the possible settlement of the securities lending matter.
Summary
The Company’s litigation and regulatory matters are subject to many uncertainties, and given their complexity and scope, their outcome cannot be predicted. It is possible that the Company’s results of operations or cash flow in a particular quarterly or annual period could be materially affected by an ultimate unfavorable resolution of pending litigation and regulatory matters depending, in part, upon the results of operations or cash flow for such period. In light of the unpredictability of the Company’s litigation and regulatory matters, it is also possible that in certain cases an ultimate unfavorable resolution of one or more pending litigation or regulatory matters could have a material adverse effect on the Company’s financial position. Management believes, however, that, based on information currently known to it, the ultimate outcome of all pending litigation and regulatory matters,
296
after consideration of applicable reserves and rights to indemnification, is not likely to have a material adverse effect on the Company’s financial position.
297
|
23.
|
QUARTERLY RESULTS OF OPERATIONS (UNAUDITED)
|
The unaudited quarterly results of operations for the years ended
December 31, 2018
and
2017
are summarized in the table below:
|
|
Three Months Ended
|
|||||||||||||||
|
|
March 31
|
June 30
|
September 30
|
December 31
|
||||||||||||
|
|
(in millions, except per share amounts)
|
|||||||||||||||
|
2018
|
||||||||||||||||
|
Total revenues
|
$
|
13,757
|
|
$
|
14,655
|
|
$
|
16,148
|
|
$
|
18,432
|
|
||||
|
Total benefits and expenses
|
12,064
|
|
14,405
|
|
14,310
|
|
17,379
|
|
||||||||
|
Net income (loss)
|
1,364
|
|
200
|
|
1,675
|
|
849
|
|
||||||||
|
Less: Income attributable to noncontrolling interests
|
1
|
|
3
|
|
3
|
|
7
|
|
||||||||
|
Net income (loss) attributable to Prudential Financial, Inc.
|
$
|
1,363
|
|
$
|
197
|
|
$
|
1,672
|
|
$
|
842
|
|
||||
|
Basic earnings per share—Common Stock(1)(2):
|
||||||||||||||||
|
Net income (loss) attributable to Prudential Financial, Inc.
|
$
|
3.19
|
|
$
|
0.46
|
|
$
|
3.97
|
|
$
|
2.01
|
|
||||
|
Diluted earnings per share—Common Stock(1)(2):
|
||||||||||||||||
|
Net income (loss) attributable to Prudential Financial, Inc.
|
$
|
3.14
|
|
$
|
0.46
|
|
$
|
3.90
|
|
$
|
1.99
|
|
||||
|
2017
|
||||||||||||||||
|
Total revenues
|
$
|
13,670
|
|
$
|
13,441
|
|
$
|
16,313
|
|
$
|
16,265
|
|
||||
|
Total benefits and expenses
|
11,928
|
|
12,833
|
|
13,292
|
|
15,149
|
|
||||||||
|
Net income (loss)
|
1,372
|
|
496
|
|
2,241
|
|
3,865
|
|
||||||||
|
Less: Income attributable to noncontrolling interests
|
3
|
|
5
|
|
3
|
|
100
|
|
||||||||
|
Net income (loss) attributable to Prudential Financial, Inc.
|
$
|
1,369
|
|
$
|
491
|
|
$
|
2,238
|
|
$
|
3,765
|
|
||||
|
Basic earnings per share—Common Stock(1):
|
||||||||||||||||
|
Net income (loss) attributable to Prudential Financial, Inc.
|
$
|
3.14
|
|
$
|
1.13
|
|
$
|
5.19
|
|
$
|
8.78
|
|
||||
|
Diluted earnings per share—Common Stock(1):
|
||||||||||||||||
|
Net income (loss) attributable to Prudential Financial, Inc.
|
$
|
3.09
|
|
$
|
1.12
|
|
$
|
5.09
|
|
$
|
8.61
|
|
||||
__________
|
(1)
|
Quarterly earnings per share amounts may not add to the full year amounts due to the averaging of shares.
|
|
(2)
|
Basic and Diluted earnings per share of Common Stock for the second quarter of 2018 reflected a net charge in the Long-Term Care business as a result of the Company’s
annual reviews and update of assumptions and other refinements.
|
|
24.
|
SUBSEQUENT EVENTS
|
Common Stock Dividend Declaration
On February 6, 2019, Prudential Financial’s Board of Directors declared a cash dividend of
$1.00
per share of Common Stock, payable on March 14, 2019 to shareholders of record as of February 20, 2019.
298
ITEM 9. CHANGES IN AND DISAGREEMENTS WITH ACCOUNTANTS ON ACCOUNTING AND FINANCIAL DISCLOSURE
None.
ITEM 9A. CONTROLS AND PROCEDURES
Management’s Annual Report on Internal Control Over Financial Reporting and the report of the Company’s independent registered public accounting firm on the effectiveness of internal control over financial reporting as of
December 31, 2018
are included in Part II, Item 8 of this Annual Report on Form 10-K.
In order to ensure that the information we must disclose in our filings with the SEC is recorded, processed, summarized, and reported on a timely basis, the Company’s management, including our Chief Executive Officer and Chief Financial Officer, have reviewed and evaluated the effectiveness of our disclosure controls and procedures, as defined in Exchange Act Rule 13a-15(e), as of
December 31, 2018
. Based on such evaluation, the Chief Executive Officer and Chief Financial Officer have concluded that, as of
December 31, 2018
, our disclosure controls and procedures were effective. No change in our internal control over financial reporting, as defined in Exchange Act Rule 13a-15(f), occurred during the quarter ended
December 31, 2018
, that has materially affected, or is reasonably likely to materially affect, our internal control over financial reporting.
ITEM 9B. OTHER INFORMATION
None.
PART III
|
ITEM 10.
|
DIRECTORS, EXECUTIVE OFFICERS AND CORPORATE GOVERNANCE
|
The names of the executive officers of Prudential Financial and their respective ages and positions, as of February 15, 2019, were as follows:
|
Name
|
Age
|
Title
|
Other Public Directorships
|
|||
|
Charles F. Lowrey
|
61
|
Chief Executive Officer and President
|
None
|
|||
|
Robert M. Falzon
|
59
|
Vice Chairman
|
None
|
|||
|
Mark B. Grier
|
66
|
Vice Chairman
|
None
|
|||
|
Timothy P. Harris
|
58
|
Executive Vice President and General Counsel
|
None
|
|||
|
Kenneth Y. Tanji
|
52
|
Executive Vice President and Chief Financial Officer
|
None
|
|||
|
Scott G. Sleyster
|
59
|
Executive Vice President and Chief Operating Officer, International Businesses
|
None
|
|||
|
Stephen Pelletier
|
65
|
Executive Vice President and Chief Operating Officer, U.S. Businesses
|
None
|
|||
|
Lucien A. Alziari
|
59
|
Executive Vice President and Chief Human Resources Officer
|
C&J Clark
International Ltd.
|
|||
|
Barbara G. Koster
|
64
|
Senior Vice President and Chief Information Officer
|
Dime Community
Bancshares, Inc.
|
|||
|
Candace J. Woods
|
58
|
Senior Vice President and Chief Actuary
|
None
|
|||
|
Nicholas C. Silitch
|
57
|
Senior Vice President and Chief Risk Officer
|
None
|
|||
|
Timothy L. Schmidt
|
60
|
Senior Vice President and Chief Investment Officer
|
None
|
|||
Biographical information about Prudential Financial’s executive officers is as follows:
Charles F. Lowrey
was elected Chief Executive Officer, President and Director of Prudential Financial and Prudential Insurance in December 2018. Previously, he served as Executive Vice President and Chief Operating Officer, International Businesses, of Prudential Financial and Prudential Insurance from March 2014 to November 2018. He served as Executive Vice President and Chief Operating Officer, U.S. Businesses, of Prudential Financial and Prudential Insurance from February 2011 to March 2014. He also served as Chief Executive Officer and President of Prudential Investment Management, Inc. from January 2008 to February 2011; and as Chief Executive Officer of Prudential Real Estate Investors, our real estate investment management and advisory business from February 2002 to January 2008. He joined the Company in March 2001, after serving as a managing director and head of the Americas for J.P. Morgan’s Real Estate and Lodging Investment Banking group, where he began his investment banking career in 1988. He also spent four years as a managing partner of an architecture and development firm he founded in New York City.
299
Robert M. Falzon
was elected Vice Chairman of Prudential Financial and Prudential Insurance in December 2018. Previously, he served as Executive Vice President and Chief Financial Officer of Prudential Financial and Prudential Insurance from March 2013 to November 2018. Mr. Falzon has been with Prudential since 1983, serving in various positions. He served as Senior Vice President and Treasurer of Prudential Insurance and Prudential Financial from 2010 to 2013. Previously he had been a managing director at Prudential Real Estate Investors (“PREI”), head of PREI’s Global Merchant Banking Group and Chief Executive Officer of its European business; a managing director at Prudential Securities; and regional vice president at Prudential Capital Group.
Mark B. Grier
was elected Director of Prudential Financial in January 2008 and has served as Vice Chairman since August 2002. He served as a director of Prudential Financial from December 1999 to January 2001, Executive Vice President from December 2000 to August 2002 and as Vice President of Prudential Financial from January 2000 to December 2000. He served as Chief Financial Officer of Prudential Insurance from May 1995 to June 1997. Since May 1995 he has variously served as Executive Vice President, Corporate Governance; Executive Vice President, Financial Management; Vice Chairman, Financial Management; and Vice Chairman, International. Prior to joining Prudential, Mr. Grier was an executive with Chase Manhattan Corporation.
Timothy P. Harris
was elected Executive Vice President and General Counsel for Prudential Financial and Prudential Insurance in October 2015. He served as the Deputy General Counsel and Chief Legal Officer, U.S. Businesses, from 2008 to 2015. He has served in various supervisory positions since 1999, including Chief Investment Counsel from 2005 through 2008, Chief Legal Officer of Prudential Annuities and Chief Legal Officer for Retirement Services and Prudential Asia. Mr. Harris was the Chief Risk Officer for Prudential Investments from 1999 to 2003. Prior to joining Prudential, he was associated with Cadwalader, Wickersham & Taft in New York, where he provided transactional and regulatory advice to investment banks, broker-dealers, banks and commodities firms.
Kenneth Y. Tanji
was elected Executive Vice President and Chief Financial Officer of Prudential Financial and Prudential Insurance in December 2018. Prior to this role, he was Senior Vice President and Treasurer of Prudential Financial and Prudential Insurance from March 2013 to November 2018. In 2013, he served as Chief Financial Officer of Prudential’s International Insurance business. Previously, he was Senior Financial Officer of Prudential Annuities and was Prudential’s business representative for its retail brokerage joint venture with Wachovia Securities from 2003 through 2009. He also served as Vice President of Finance for Prudential’s asset management business and held various positions with Prudential Securities’ Private Client and Debt Capital Markets Groups. Mr. Tanji joined Prudential in 1988.
Scott G. Sleyster
was elected Executive Vice President and Chief Operating Officer, International Businesses, of Prudential Financial and Prudential Insurance in December 2018. Previously, he served as Senior Vice President and Chief Investment Officer of Prudential Insurance and Prudential Financial. Mr. Sleyster has been with Prudential since 1987, serving in a variety of positions, including head of Prudential’s Full Service Retirement business, President of Prudential’s Guaranteed Products business, Chief Financial Officer for Prudential’s Employee Benefits Division, and has held roles in Prudential’s Treasury, Derivatives and Investment Management units.
Stephen Pelletier
was elected Executive Vice President and Chief Operating Officer, U.S. Businesses, of Prudential Financial and Prudential Insurance in March of 2014. He served as the Chief Executive Officer of Prudential Group Insurance from July of 2013 to March of 2014. Mr. Pelletier has been with Prudential since 1992, serving in various positions including President of Prudential Annuities and Chairman and Chief Executive Officer of Prudential International Investments.
Lucien A. Alziari
is Executive Vice President and Chief Human Resources Officer for Prudential Financial and Prudential Insurance. Starting in June 2017, he served as Senior Vice President and Chief Human Resources Officer for Prudential Financial and Prudential Insurance. From 2012 to the beginning of 2017, Mr. Alziari served as Executive Vice President and Chief Human Resources Officer of A.P. Moller-Maersk. From 2004 to 2012, he was the Chief Human Resources Officer and Head of Corporate Responsibility for Avon Products, Inc. Prior to Avon Products, Inc., Mr. Alziari held roles with Mars Confectionary in the United Kingdom and PepsiCo Inc. in New York, Vienna and Dubai.
Barbara G. Koster
was elected Senior Vice President, Operations and Systems, of Prudential Financial in May 2011 and has been a Senior Vice President of Prudential Insurance since February 2004. Ms. Koster joined Prudential in November 1995 as the Vice President and Chief Information Officer of Individual Life Insurance Systems and was appointed as the Chief Information Officer of Prudential in 2004. Prior to joining Prudential, Ms. Koster held several positions with Chase Manhattan Bank, including that of President of Chase Access Services.
Candace J. Woods
was elected Senior Vice President and Chief Actuary of Prudential Financial and Prudential Insurance in November 2017. Prior to her current role, Ms. Woods served as Vice President and Chief Actuary for the actuarial center of
300
excellence within Prudential Insurance. Also, Ms. Woods served as Vice President and Actuary from 2012 to 2013 and Vice President and Chief Actuary from 2013 to 2017 for Prudential’s International Insurance businesses.
Nicholas C. Silitch
was elected Senior Vice President and Chief Risk Officer of Prudential Financial and Prudential Insurance in May 2012. He joined Prudential in 2010 as Chief Credit Officer and head of investment risk management. Prior to joining Prudential, Mr. Silitch held the position of Chief Risk Officer of the Alternative Investment Services, Broker Dealer Services and Pershing businesses within Bank of New York Mellon.
Timothy L. Schmidt
was elected Senior Vice President and Chief Investment Officer of Prudential Financial and Prudential Insurance in December 2018. Previously, he was the head of Global Portfolio Management for Prudential from 2012 to 2018. Before that, Mr. Schmidt was responsible for the overall asset/liability management for Prudential’s Retirement and Group Insurance businesses. Prior to joining Prudential in July 2010, he served as Chief Financial Officer for MetLife’s Individual Business and had headed MetLife’s Wealth Strategy Group. Earlier in his 25-year tenure at MetLife, Schmidt held various positions in the investment organization, including head of MetLife’s Portfolio Management Unit, as well as its Structured Finance and Government Securities unit.
We have adopted a code of business conduct and ethics, known as “Making the Right Choices,” which applies to our Chief Executive Officer, Chief Financial Officer and our Principal Accounting Officer, as well as to our directors and all other employees. Making the Right Choices is posted on our website at www.investor.prudential.com. Our code of business conduct and ethics, any amendments and any waiver granted to any of our directors or executive officers are available free of charge on our website at www.investor.prudential.com.
In addition, we have adopted Corporate Governance Guidelines, which we refer to as our “Corporate Governance Principles and Practices.” Our Corporate Governance Principles and Practices are available free of charge on our website at www.investor.prudential.com.
Certain of the information called for by this item is hereby incorporated herein by reference to the relevant portions of Prudential Financial’s definitive proxy statement for the Annual Meeting of Shareholders to be held on May 14, 2019, to be filed by Prudential Financial with the Securities and Exchange Commission pursuant to Regulation 14A within 120 days after December 31, 2018 (the “Proxy Statement”).
|
ITEM 11.
|
EXECUTIVE COMPENSATION
|
The information called for by this item is hereby incorporated herein by reference to the relevant portions of the Proxy Statement.
ITEM 12. SECURITY OWNERSHIP OF CERTAIN BENEFICIAL OWNERS AND MANAGEMENT AND RELATED STOCKHOLDER MATTERS
The following table provides information as of
December 31, 2018
, regarding securities authorized for issuance under our equity compensation plans. All outstanding awards relate to our Common Stock. For additional information about our equity compensation plans, see Note 20 to the Consolidated Financial Statements included in this Annual Report on Form 10-K.
301
|
(a)
|
(b)
|
(c)
|
|||||||||
|
Number of securities to be issued upon exercise of outstanding options, warrants and rights
|
Weighted-average exercise price of outstanding options, warrants and rights
|
Number of securities remaining available for future issuance under equity compensation plans (excluding securities reflected in (a))
|
|||||||||
|
Equity compensation plans approved by security holders—Omnibus Plan
|
10,415,228
|
|
(1)
|
$
|
72.03
|
|
(2)
|
20,625,484
|
|
||
|
Equity compensation plans approved by security holders—Director Plan
|
169,780
|
|
2,474
|
|
|||||||
|
Equity compensation plans approved by security holders—PSPP(3)
|
12,420,456
|
|
|||||||||
|
Total equity compensation plans approved by security holders
|
10,585,008
|
|
33,048,414
|
|
|||||||
|
Equity compensation plans not approved by security holders
|
0
|
|
0
|
|
|||||||
|
Grand Total
|
10,585,008
|
|
33,048,414
|
|
|||||||
__________
|
(1)
|
Represents 4,584,244 outstanding Options, 4,779,709 outstanding Restricted Units and 1,051,275 outstanding Performance Shares as of
December 31, 2018
under our Omnibus Plan. The number of Performance Shares represents the number of shares that would be received based on maximum performance, reduced for cancellations and releases through
December 31, 2018
. The actual number of shares the Compensation Committee will award at the end of each performance period will range between 0% and 125% of the target number of units granted, based upon a measure of the reported performance of the Company relative to stated goals. Performance awards granted to senior management in 2018 include a stated goal related to diversity & inclusion that can modify the performance result by +/- 10%. The outstanding Performance Units will be settled only in cash and do not reduce the number of shares authorized under the Omnibus Plan, and so they are not reflected in this table.
|
|
(2)
|
Represents the weighted average exercise price of the Options disclosed in column (a). The weighted average remaining contractual term of these Options is 4.93 years.
|
|
(3)
|
The Prudential Financial, Inc. Employee Stock Purchase Plan is a qualified Employee Stock Purchase Plan under Section 423 of the Code, pursuant to which up to 26,367,235 shares of Common Stock were authorized for issuance, all of which have been registered on Form S-8. Under the plan, employees may purchase shares based upon quarterly offering periods at an amount equal to the lesser of (1) 85% of the closing market price of the Common Stock on the first day of the quarterly offering period, or (2) 85% of the closing market price of the Common Stock on the last day of the quarterly offering period.
|
The other information called for by this item is hereby incorporated herein by reference to the relevant portions of the Proxy Statement.
|
ITEM 13.
|
CERTAIN RELATIONSHIPS AND RELATED TRANSACTIONS, AND DIRECTOR INDEPENDENCE
|
The information called for by this item is hereby incorporated herein by reference to the relevant portions of the Proxy Statement.
302
|
ITEM 14.
|
PRINCIPAL ACCOUNTANT FEES AND SERVICES
|
The information called for by this item is hereby incorporated herein by reference to the relevant portions of the Proxy Statement.
PART IV
|
ITEM 15.
|
EXHIBITS, FINANCIAL STATEMENT SCHEDULES
|
The following documents are filed as part of this report:
|
|
|
Page
|
|
1.
|
||
|
2.
|
Financial Statement Schedules:
|
|
|
Any remaining schedules provided for in the applicable SEC regulations are omitted because they are either inapplicable or the relevant information is provided elsewhere within this Form 10-K.
|
||
3. Exhibits:
See the accompanying Exhibit Index.
303
PRUDENTIAL FINANCIAL, INC.
Schedule I
Summary of Investments Other Than Investments in Related Parties
As of December 31,
2018
(in millions)
|
Type of Investment
|
Amortized Cost or Cost(1)
|
Fair
Value
|
Amount
Shown in the
Balance Sheet
|
|||||||||
|
Fixed maturities, available-for-sale:
|
||||||||||||
|
Bonds:
|
||||||||||||
|
U.S. Treasury securities and obligations of U.S. government authorities and agencies
|
$
|
28,242
|
|
$
|
30,594
|
|
$
|
30,594
|
|
|||
|
Obligations of U.S. states and their political subdivisions
|
9,880
|
|
10,493
|
|
10,493
|
|
||||||
|
Foreign governments
|
96,710
|
|
113,110
|
|
113,110
|
|
||||||
|
Asset-backed securities
|
12,888
|
|
12,973
|
|
12,973
|
|
||||||
|
Residential mortgage-backed securities
|
2,937
|
|
3,004
|
|
3,004
|
|
||||||
|
Commercial mortgage-backed securities
|
13,396
|
|
13,315
|
|
13,315
|
|
||||||
|
Public utilities
|
26,159
|
|
26,799
|
|
26,799
|
|
||||||
|
Certificates of deposit
|
20
|
|
21
|
|
21
|
|
||||||
|
All other corporate bonds
|
140,953
|
|
142,768
|
|
142,768
|
|
||||||
|
Redeemable preferred stock
|
560
|
|
579
|
|
579
|
|
||||||
|
Total fixed maturities, available-for-sale
|
$
|
331,745
|
|
$
|
353,656
|
|
$
|
353,656
|
|
|||
|
Fixed maturities, held-to-maturity:
|
||||||||||||
|
Bonds:
|
||||||||||||
|
Foreign governments
|
$
|
885
|
|
$
|
1,154
|
|
$
|
885
|
|
|||
|
Residential mortgage-backed securities
|
0
|
|
0
|
|
0
|
|
||||||
|
Commercial mortgage-backed securities
|
365
|
|
388
|
|
365
|
|
||||||
|
All other corporate bonds
|
763
|
|
830
|
|
763
|
|
||||||
|
Total fixed maturities, held-to-maturity
|
$
|
2,013
|
|
$
|
2,372
|
|
$
|
2,013
|
|
|||
|
Equity securities:
|
||||||||||||
|
Common stocks:
|
||||||||||||
|
Other common stocks
|
$
|
3,631
|
|
$
|
4,595
|
|
$
|
4,595
|
|
|||
|
Mutual funds
|
1,278
|
|
1,318
|
|
1,318
|
|
||||||
|
Nonredeemable preferred stocks
|
30
|
|
26
|
|
26
|
|
||||||
|
Perpetual preferred stocks
|
280
|
|
299
|
|
299
|
|
||||||
|
Total equity securities, at fair value
|
$
|
5,219
|
|
$
|
6,238
|
|
$
|
6,238
|
|
|||
|
Fixed maturities, trading
|
$
|
3,392
|
|
$
|
3,243
|
|
$
|
3,243
|
|
|||
|
Assets supporting experience-rated contractholder liabilities(2)(3)
|
21,254
|
|
21,254
|
|
||||||||
|
Commercial mortgage and other loans(4)
|
59,830
|
|
59,830
|
|
||||||||
|
Policy loans
|
12,016
|
|
12,016
|
|
||||||||
|
Short-term investments
|
6,469
|
|
6,469
|
|
||||||||
|
Other invested assets
|
14,526
|
|
14,526
|
|
||||||||
|
Total investments
|
$
|
456,464
|
|
$
|
479,245
|
|
||||||
__________
|
(1)
|
For fixed maturities available-for-sale and held-to-maturity, original cost reduced by repayments and impairments and adjusted for amortization of premiums and accretion of discounts.
|
|
(2)
|
At fair value.
|
|
(3)
|
See Note 3 to the Consolidated Financial Statements for the composition of the Company’s “Assets supporting experience-rated contractholder liabilities, at fair value.”
|
|
(4)
|
At carrying value, which is net of allowance for credit losses. Includes collateralized commercial mortgage and other loans of
$59,175 million
and uncollateralized loans of
$655 million
.
|
304
PRUDENTIAL FINANCIAL, INC.
Schedule II
Condensed Financial Information of Registrant
Condensed Statements of Financial Positions as of December 31,
2018
and
2017
(in millions)
|
2018
|
2017
|
|||||||
|
ASSETS
|
||||||||
|
Investment contracts from subsidiaries
|
$
|
1
|
|
$
|
1
|
|
||
|
Fixed maturities, available for sale, at fair value (amortized cost: 2018- $1,354; 2017- $1,218)
|
1,387
|
|
1,250
|
|
||||
|
Equity securities, at fair value (cost: 2018- $25; 2017- $0)
|
25
|
|
0
|
|
||||
|
Other invested assets
|
3,537
|
|
2,330
|
|
||||
|
Total investments
|
4,950
|
|
3,581
|
|
||||
|
Cash and cash equivalents
|
1,327
|
|
1,677
|
|
||||
|
Due from subsidiaries
|
1,601
|
|
1,500
|
|
||||
|
Loans receivable from subsidiaries
|
7,044
|
|
7,846
|
|
||||
|
Investment in subsidiaries
|
57,934
|
|
63,456
|
|
||||
|
Property, plant and equipment
|
502
|
|
529
|
|
||||
|
Other assets
|
511
|
|
550
|
|
||||
|
TOTAL ASSETS
|
$
|
73,869
|
|
$
|
79,139
|
|
||
|
LIABILITIES AND EQUITY
|
||||||||
|
LIABILITIES
|
||||||||
|
Due to subsidiaries
|
$
|
2,117
|
|
$
|
2,205
|
|
||
|
Loans payable to subsidiaries
|
5,260
|
|
5,738
|
|
||||
|
Short-term debt
|
1,115
|
|
880
|
|
||||
|
Long-term debt
|
16,141
|
|
15,304
|
|
||||
|
Income taxes payable
|
0
|
|
5
|
|
||||
|
Other liabilities
|
619
|
|
771
|
|
||||
|
Total liabilities
|
25,252
|
|
24,903
|
|
||||
|
EQUITY
|
||||||||
|
Preferred Stock ($.01 par value; 10,000,000 shares authorized; none issued)
|
0
|
|
0
|
|
||||
|
Common Stock ($.01 par value; 1,500,000,000 shares authorized; 660,111,339 shares issued as of both December 31, 2018 and 2017)
|
6
|
|
6
|
|
||||
|
Additional paid-in capital
|
24,828
|
|
24,769
|
|
||||
|
Common Stock held in treasury, at cost (249,398,887 and 237,559,118 shares as of December 31, 2018 and 2017, respectively)
|
(17,593
|
)
|
(16,284
|
)
|
||||
|
Accumulated other comprehensive income (loss)
|
10,906
|
|
17,074
|
|
||||
|
Retained earnings
|
30,470
|
|
28,671
|
|
||||
|
Total equity
|
48,617
|
|
54,236
|
|
||||
|
TOTAL LIABILITIES AND EQUITY
|
$
|
73,869
|
|
$
|
79,139
|
|
||
See Notes to Condensed Financial Information of Registrant
305
PRUDENTIAL FINANCIAL, INC.
Schedule II
Condensed Financial Information of Registrant
Condensed Statements of Operations for the Years Ended December 31,
2018
,
2017
and
2016
(in millions)
|
2018
|
2017
|
2016
|
||||||||||
|
REVENUES
|
||||||||||||
|
Net investment income
|
$
|
168
|
|
$
|
92
|
|
$
|
61
|
|
|||
|
Realized investment gains (losses), net
|
106
|
|
(73
|
)
|
(126
|
)
|
||||||
|
Affiliated interest revenue
|
374
|
|
379
|
|
353
|
|
||||||
|
Other income (loss)
|
(7
|
)
|
(79
|
)
|
(2
|
)
|
||||||
|
Total revenues
|
641
|
|
319
|
|
286
|
|
||||||
|
EXPENSES
|
||||||||||||
|
General and administrative expenses
|
126
|
|
126
|
|
101
|
|
||||||
|
Interest expense
|
1,087
|
|
1,057
|
|
1,106
|
|
||||||
|
Total expenses
|
1,213
|
|
1,183
|
|
1,207
|
|
||||||
|
INCOME (LOSS) BEFORE INCOME TAXES AND EQUITY IN EARNINGS OF SUBSIDIARIES
|
(572
|
)
|
(864
|
)
|
(921
|
)
|
||||||
|
Total income tax expense (benefit)
|
(130
|
)
|
(397
|
)
|
(320
|
)
|
||||||
|
INCOME (LOSS) BEFORE EQUITY IN EARNINGS OF SUBSIDIARIES
|
(442
|
)
|
(467
|
)
|
(601
|
)
|
||||||
|
Equity in earnings of subsidiaries
|
4,516
|
|
8,330
|
|
4,969
|
|
||||||
|
NET INCOME (LOSS)
|
$
|
4,074
|
|
$
|
7,863
|
|
$
|
4,368
|
|
|||
|
Other Comprehensive Income (loss)
|
(6,974
|
)
|
|
2,453
|
|
|
2,336
|
|
||||
|
TOTAL COMPREHENSIVE INCOME (LOSS)
|
$
|
(2,900
|
)
|
$
|
10,316
|
|
$
|
6,704
|
|
|||
See Notes to Condensed Financial Information of Registrant
306
PRUDENTIAL FINANCIAL, INC.
Schedule II
Condensed Financial Information of Registrant
Condensed Statements of Cash Flows for the Years Ended December 31,
2018
,
2017
and
2016
(in millions)
|
2018
|
2017
|
2016
|
||||||||||
|
CASH FLOWS FROM OPERATING ACTIVITIES
|
||||||||||||
|
Net income (loss)
|
$
|
4,074
|
|
$
|
7,863
|
|
$
|
4,368
|
|
|||
|
Adjustments to reconcile net income to cash provided by operating activities:
|
||||||||||||
|
Equity in earnings of subsidiaries
|
(4,516
|
)
|
(8,330
|
)
|
(4,969
|
)
|
||||||
|
Realized investment (gains) losses, net
|
(106
|
)
|
73
|
|
126
|
|
||||||
|
Dividends received from subsidiaries
|
2,975
|
|
1,975
|
|
2,828
|
|
||||||
|
Property, plant and equipment
|
(4
|
)
|
(1
|
)
|
(13
|
)
|
||||||
|
Change in:
|
||||||||||||
|
Due to/from subsidiaries, net
|
(1
|
)
|
213
|
|
(5,109
|
)
|
||||||
|
Other, operating(1)
|
115
|
|
(149
|
)
|
204
|
|
||||||
|
Cash flows from (used in) operating activities(1)
|
2,537
|
|
1,644
|
|
(2,565
|
)
|
||||||
|
CASH FLOWS FROM INVESTING ACTIVITIES
|
||||||||||||
|
Proceeds from the sale/maturity of:
|
||||||||||||
|
Fixed maturities, available-for-sale
|
234
|
|
740
|
|
0
|
|
||||||
|
Short-term investments
|
18,708
|
|
15,973
|
|
17,575
|
|
||||||
|
Payments for the purchase of:
|
||||||||||||
|
Equity securities, at fair value
|
(25
|
)
|
0
|
|
0
|
|
||||||
|
Fixed maturities, available for sale
|
(370
|
)
|
(865
|
)
|
(1,106
|
)
|
||||||
|
Short-term investments
|
(19,914
|
)
|
(15,087
|
)
|
(19,111
|
)
|
||||||
|
Capital contributions to subsidiaries
|
(874
|
)
|
(1,135
|
)
|
(2,018
|
)
|
||||||
|
Returns of capital contributions from subsidiaries
|
1,083
|
|
1,150
|
|
2,755
|
|
||||||
|
Loans to subsidiaries, net of maturities
|
803
|
|
(1,127
|
)
|
(596
|
)
|
||||||
|
Other, investing
|
0
|
|
61
|
|
1
|
|
||||||
|
Cash flows from (used in) investing activities
|
(355
|
)
|
(290
|
)
|
(2,500
|
)
|
||||||
|
CASH FLOWS FROM FINANCING ACTIVITIES
|
||||||||||||
|
Cash dividends paid on Common Stock
|
(1,521
|
)
|
(1,296
|
)
|
(1,300
|
)
|
||||||
|
Common Stock acquired
|
(1,500
|
)
|
(1,250
|
)
|
(2,000
|
)
|
||||||
|
Common Stock reissued for exercise of stock options
|
132
|
|
246
|
|
426
|
|
||||||
|
Proceeds from the issuance of debt (maturities longer than 90 days)
|
2,531
|
|
742
|
|
30
|
|
||||||
|
Repayments of debt (maturities longer than 90 days)
|
(1,443
|
)
|
(480
|
)
|
(1,319
|
)
|
||||||
|
Repayments of loans from subsidiaries
|
(728
|
)
|
(310
|
)
|
(390
|
)
|
||||||
|
Proceeds from loans payable to subsidiaries
|
99
|
|
1,627
|
|
1,405
|
|
||||||
|
Net change in financing arrangements (maturities of 90 days or less)
|
(36
|
)
|
(16
|
)
|
14
|
|
||||||
|
Excess tax benefits from share-based payment arrangements
|
0
|
|
0
|
|
10
|
|
||||||
|
Other, financing(1)
|
(66
|
)
|
(68
|
)
|
(132
|
)
|
||||||
|
Cash flows from (used in) financing activities(1)
|
(2,532
|
)
|
(805
|
)
|
(3,256
|
)
|
||||||
|
NET INCREASE (DECREASE) IN CASH AND CASH EQUIVALENTS
|
(350
|
)
|
549
|
|
(8,321
|
)
|
||||||
|
CASH AND CASH EQUIVALENTS, BEGINNING OF YEAR
|
1,677
|
|
1,128
|
|
9,449
|
|
||||||
|
CASH AND CASH EQUIVALENTS, END OF YEAR
|
$
|
1,327
|
|
$
|
1,677
|
|
$
|
1,128
|
|
|||
|
SUPPLEMENTAL CASH FLOW INFORMATION
|
||||||||||||
|
Cash paid during the period for interest
|
$
|
1,014
|
|
$
|
1,019
|
|
$
|
1,002
|
|
|||
|
Cash paid (refunds received) during the period for taxes
|
$
|
(231
|
)
|
$
|
(213
|
)
|
$
|
(544
|
)
|
|||
|
NON-CASH TRANSACTIONS DURING THE YEAR
|
||||||||||||
|
Non-cash capital contributions to subsidiaries
|
$
|
(22
|
)
|
$
|
(17
|
)
|
$
|
(4,158
|
)
|
|||
|
Non-cash dividends/returns of capital from subsidiaries
|
$
|
101
|
|
$
|
0
|
|
$
|
4,142
|
|
|||
|
Treasury Stock shares issued for stock-based compensation programs
|
$
|
138
|
|
$
|
104
|
|
$
|
115
|
|
|||
__________
|
(1)
|
Prior period amounts are presented on a basis consistent with current period presentation, reflecting the adoption of ASU 2016-09. See Note 2 to the Consolidated Financial Statements for additional information.
|
See Notes to Condensed Financial Information of Registrant
307
PRUDENTIAL FINANCIAL, INC.
Schedule II
Condensed Financial Information of Registrant
Notes to Condensed Financial Information of Registrant
1. ORGANIZATION AND PRESENTATION
Prudential Financial, Inc. (“Prudential Financial”) was incorporated on December 28, 1999, as a wholly-owned subsidiary of The Prudential Insurance Company of America (“Prudential Insurance”). On December 18, 2001, Prudential Insurance converted from a mutual life insurance company to a stock life insurance company and became an indirect, wholly-owned subsidiary of Prudential Financial.
The condensed financial information of Prudential Financial, Inc. (the “Parent Company”) should be read in conjunction with the consolidated financial statements of Prudential Financial, Inc. and its subsidiaries and the notes thereto (the “Consolidated Financial Statements”). The condensed financial statements of Prudential Financial reflect its direct wholly-owned subsidiaries using the equity method of accounting.
Certain amounts in prior years have been reclassified to conform to the current year presentation.
2. OTHER INVESTMENTS
Prudential Financial’s other investments as of December 31,
2018
and 2017 consisted primarily of highly liquid debt investments and intercompany enterprise liquidity account funds.
3. DEBT
A summary of Prudential Financial’s short- and long-term debt is as follows:
|
December 31,
|
|||||||||||
|
Maturity
Dates
|
Rate(1)
|
2018
|
2017
|
||||||||
|
|
|
|
($ in millions)
|
||||||||
|
Short-term debt:
|
|||||||||||
|
Commercial paper(2)
|
$
|
15
|
|
$
|
50
|
|
|||||
|
Current portion of long-term debt
|
1,100
|
|
830
|
|
|||||||
|
Total short-term debt
|
$
|
1,115
|
|
$
|
880
|
|
|||||
|
Long-term debt:
|
|||||||||||
|
Fixed rate senior notes
|
2020-2049
|
3.50%-6.63%
|
$
|
8,601
|
|
$
|
8,709
|
|
|||
|
Floating rate senior notes
|
2020
|
4.04%-4.95%
|
29
|
|
29
|
|
|||||
|
Junior subordinated notes
|
2042-2058
|
4.50%-5.88%
|
7,511
|
|
6,566
|
|
|||||
|
Total long-term debt
|
$
|
16,141
|
|
$
|
15,304
|
|
|||||
__________
|
(1)
|
Ranges of interest rates are for the year ended December 31,
2018
.
|
|
(2)
|
The weighted average interest rate on outstanding commercial paper was
1.98%
and
1.15%
at December 31,
2018
and
2017
, respectively.
|
Long-term Debt
In order to modify exposure to interest rate movements, Prudential Financial utilizes derivative instruments, primarily interest rate swaps, in conjunction with some of its debt issues. The impact of these derivative instruments is not reflected in the rates presented in the table above. For those derivatives that qualify for hedge accounting treatment, interest expense increased by
$0 million
,
$1 million
, and
$2 million
for each of the years ended December 31,
2018
,
2017
and 2016, respectively.
Schedule of Long-term Debt Maturities
The following table presents Prudential Financial’s contractual maturities for long-term debt as of December 31,
2018
:
308
|
|
Calendar Year
|
|
|||||||||||||||||||||
|
|
2020
|
2021
|
2022
|
2023
|
2024 and
thereafter
|
Total
|
|||||||||||||||||
|
|
($ in millions)
|
||||||||||||||||||||||
|
Long-term debt
|
$
|
1,179
|
|
$
|
400
|
|
$
|
0
|
|
$
|
0
|
|
$
|
14,562
|
|
$
|
16,141
|
|
|||||
4. DIVIDENDS AND RETURNS OF CAPITAL
For the years ended December 31, Prudential Financial received cash dividends and/or returns of capital from the following companies:
|
2018
|
2017
|
2016
|
||||||||||
|
|
(in millions)
|
|||||||||||
|
Pruco Reinsurance
|
$
|
0
|
|
$
|
0
|
|
$
|
1,298
|
|
|||
|
Prudential Annuities Holding Company
|
175
|
|
145
|
|
98
|
|
||||||
|
International Insurance and Investments Holding Companies
|
2,270
|
|
546
|
|
1,171
|
|
||||||
|
Prudential Insurance Company of America
|
0
|
|
1,000
|
|
900
|
|
||||||
|
PGIM Holding Company
|
578
|
|
467
|
|
746
|
|
||||||
|
Prudential Annuities Life Assurance Corporation
|
1,025
|
|
950
|
|
1,140
|
|
||||||
|
Other Holding Companies
|
10
|
|
16
|
|
231
|
|
||||||
|
Total
|
$
|
4,058
|
|
$
|
3,124
|
|
$
|
5,584
|
|
|||
5. COMMITMENTS AND GUARANTEES
Prudential Financial has issued a subordinated guarantee covering a subsidiary’s domestic commercial paper program. As of December 31,
2018
, there was
$727 million
outstanding under this commercial paper program.
Prudential Financial has provided guarantees of the payment of principal and interest on intercompany loans between affiliates. As of December 31,
2018
, Prudential Financial had issued guarantees of outstanding loans totaling
$3.9 billion
between International Insurance subsidiaries and other affiliates.
In 2013, Prudential Financial entered into a
$500 million
indemnity and guarantee agreement with Wells Fargo Bank Northwest, N.A. Under this agreement, Prudential Financial guaranteed obligations with respect to an affiliated loan from PICA to an affiliate. The loan proceeds were utilized to construct Prudential’s new home office in Newark, New Jersey.
Prudential Financial is also subject to other financial guarantees, net worth maintenance agreements and indemnity arrangements, including those made in the normal course of businesses guaranteeing the performance of, or representations made by, Prudential Financial subsidiaries. Prudential Financial has provided indemnities and guarantees related to acquisitions and dispositions, investments, debt issuances and other transactions, including those provided as part of its ongoing operations that are triggered by, among other things, breaches of representations, warranties or covenants provided by Prudential Financial or its subsidiaries. These obligations are typically subject to various time limitations, defined by the contract or by operation of law, such as statutes of limitation. In some cases, the maximum potential obligation is subject to contractual limitations, while in other cases such limitations are not specified or applicable. Since certain of these obligations are not subject to limitations, it is not possible to determine the maximum potential amount due under these guarantees. At December 31,
2018
, Prudential Financial has no accrued liabilities associated with other financial guarantees and indemnity arrangements.
6. REDEMPTION OF CLASS B SHARES
From demutualization through
December 31, 2014
, Prudential Financial had two classes of common stock outstanding. The Common Stock, which is publicly-traded (NYSE:PRU), reflected the performance of the Financial Services Businesses, while the Class B Stock, which was issued through a private placement and did not trade on any exchange, reflected the performance of the Closed Block Business.
On
January 2, 2015
, pursuant to a Share Repurchase Prudential Agreement entered into on
December 1, 2014
, between the Company and the holders of the Class B stock, the Company repurchased and canceled all of the shares of the Class B Stock for an aggregate cash purchase price of
$651 million
, resulting in the elimination of the Class B stock held in treasury, a
$484 million
decrease in “Retained Earnings” and a
$167 million
decrease in “Additional paid-in-capital.”
309
In accordance with the terms of the Share Repurchase agreement, the holders of the Class B Stock subsequently exercised their right to dispute the calculation of the purchase price. This dispute was resolved during the first quarter of
2016
, resulting in an increase to the cash purchase price of
$119 million
, bringing the total aggregate purchase price to
$770 million
. The increase to the cash purchase price resulted in a corresponding decrease in “Retained Earnings.”
310
PRUDENTIAL FINANCIAL, INC.
Schedule III
Supplementary Insurance Information
As of and for the Year Ended December 31,
2018
(in millions)
|
Segment
|
Deferred
Policy
Acquisition
Costs
|
Future
Policy
Benefits,
Losses,
Claims,
Expenses
|
Unearned
Premiums
|
Other
Policy Claims
and Benefits
Payable
|
Premiums,
Policy
Charges
and Fee
Income
|
Net
Investment
Income
|
Benefits,
Claims,
Losses
and
Settlement
Expenses
|
Amortization
of DAC
|
Other
Operating
Expenses
|
||||||||||||||||||||||||||
|
PGIM
|
$
|
0
|
|
$
|
0
|
|
$
|
0
|
|
$
|
0
|
|
$
|
0
|
|
$
|
73
|
|
$
|
0
|
|
$
|
8
|
|
$
|
2,298
|
|
||||||||
|
PGIM Division
|
0
|
|
0
|
|
0
|
|
0
|
|
0
|
|
73
|
|
0
|
|
8
|
|
2,298
|
|
|||||||||||||||||
|
Retirement
|
153
|
|
64,750
|
|
0
|
|
47,766
|
|
11,582
|
|
4,394
|
|
14,209
|
|
39
|
|
1,100
|
|
|||||||||||||||||
|
Group Insurance
|
158
|
|
4,691
|
|
236
|
|
9,089
|
|
4,994
|
|
604
|
|
4,523
|
|
5
|
|
927
|
|
|||||||||||||||||
|
U.S. Workplace Solutions Division
|
311
|
|
69,441
|
|
236
|
|
56,855
|
|
16,576
|
|
4,998
|
|
18,732
|
|
44
|
|
2,027
|
|
|||||||||||||||||
|
Individual Annuities
|
4,984
|
|
11,057
|
|
0
|
|
8,886
|
|
2,792
|
|
683
|
|
734
|
|
658
|
|
1,824
|
|
|||||||||||||||||
|
Individual Life
|
6,103
|
|
14,320
|
|
0
|
|
27,792
|
|
2,985
|
|
2,040
|
|
3,229
|
|
353
|
|
1,907
|
|
|||||||||||||||||
|
U.S. Individual Solutions Division
|
11,087
|
|
25,377
|
|
0
|
|
36,678
|
|
5,777
|
|
2,723
|
|
3,963
|
|
1,011
|
|
3,731
|
|
|||||||||||||||||
|
International Insurance
|
8,715
|
|
122,810
|
|
84
|
|
51,003
|
|
16,700
|
|
5,219
|
|
14,704
|
|
1,220
|
|
2,760
|
|
|||||||||||||||||
|
International Insurance Division
|
8,715
|
|
122,810
|
|
84
|
|
51,003
|
|
16,700
|
|
5,219
|
|
14,704
|
|
1,220
|
|
2,760
|
|
|||||||||||||||||
|
Corporate and Other Operations
|
(319
|
)
|
7,616
|
|
0
|
|
889
|
|
427
|
|
875
|
|
2,197
|
|
(45
|
)
|
769
|
|
|||||||||||||||||
|
Total PFI excluding Closed Block Division
|
19,794
|
|
225,244
|
|
320
|
|
145,425
|
|
39,480
|
|
13,888
|
|
39,596
|
|
2,238
|
|
11,585
|
|
|||||||||||||||||
|
Closed Block Division
|
264
|
|
48,282
|
|
0
|
|
9,023
|
|
2,301
|
|
2,288
|
|
4,340
|
|
35
|
|
364
|
|
|||||||||||||||||
|
Total
|
$
|
20,058
|
|
$
|
273,526
|
|
$
|
320
|
|
$
|
154,448
|
|
$
|
41,781
|
|
$
|
16,176
|
|
$
|
43,936
|
|
$
|
2,273
|
|
$
|
11,949
|
|
||||||||
311
PRUDENTIAL FINANCIAL, INC.
Schedule III
Supplementary Insurance Information
As of and for the Year Ended December 31,
2017
(in millions)
|
Segment
|
Deferred
Policy
Acquisition
Costs
|
Future
Policy
Benefits,
Losses,
Claims
Expenses
|
Unearned
Premiums
|
Other Policy
Claims and
Benefits
Payable
|
Premiums,
Policy
Charges
and
Fee Income
|
Net
Investment
Income
|
Benefits,
Claims,
Losses
and
Settlement
Expenses
|
Amortization of
DAC
|
Other
Operating
Expenses
|
||||||||||||||||||||||||||
|
PGIM
|
$
|
0
|
|
$
|
0
|
|
$
|
0
|
|
$
|
0
|
|
$
|
0
|
|
$
|
170
|
|
$
|
0
|
|
$
|
11
|
|
$
|
2,239
|
|
||||||||
|
PGIM Division
|
0
|
|
0
|
|
0
|
|
0
|
|
0
|
|
170
|
|
0
|
|
11
|
|
2,239
|
|
|||||||||||||||||
|
Retirement
|
146
|
|
59,330
|
|
0
|
|
49,269
|
|
8,517
|
|
4,536
|
|
11,576
|
|
16
|
|
1,031
|
|
|||||||||||||||||
|
Group Insurance
|
162
|
|
4,688
|
|
228
|
|
8,983
|
|
4,748
|
|
630
|
|
4,347
|
|
14
|
|
857
|
|
|||||||||||||||||
|
U.S. Workplace Solutions Division
|
308
|
|
64,018
|
|
228
|
|
58,252
|
|
13,265
|
|
5,166
|
|
15,923
|
|
30
|
|
1,888
|
|
|||||||||||||||||
|
Individual Annuities
|
5,130
|
|
10,797
|
|
0
|
|
8,551
|
|
2,805
|
|
727
|
|
368
|
|
0
|
|
1,791
|
|
|||||||||||||||||
|
Individual Life
|
5,405
|
|
13,649
|
|
0
|
|
25,884
|
|
2,277
|
|
1,933
|
|
2,774
|
|
382
|
|
1,888
|
|
|||||||||||||||||
|
U.S. Individual Solutions Division
|
10,535
|
|
24,446
|
|
0
|
|
34,435
|
|
5,082
|
|
2,660
|
|
3,142
|
|
382
|
|
3,679
|
|
|||||||||||||||||
|
International Insurance
|
8,214
|
|
114,437
|
|
78
|
|
50,483
|
|
16,190
|
|
5,005
|
|
14,604
|
|
1,138
|
|
2,838
|
|
|||||||||||||||||
|
International Insurance Division
|
8,214
|
|
114,437
|
|
78
|
|
50,483
|
|
16,190
|
|
5,005
|
|
14,604
|
|
1,138
|
|
2,838
|
|
|||||||||||||||||
|
Corporate and Other Operations
|
(364
|
)
|
5,240
|
|
0
|
|
9
|
|
331
|
|
781
|
|
679
|
|
(18
|
)
|
886
|
|
|||||||||||||||||
|
Total PFI excluding Closed Block Division
|
18,693
|
|
208,141
|
|
306
|
|
143,179
|
|
34,868
|
|
13,782
|
|
34,348
|
|
1,543
|
|
11,530
|
|
|||||||||||||||||
|
Closed Block Division
|
299
|
|
48,870
|
|
0
|
|
11,421
|
|
2,526
|
|
2,653
|
|
5,359
|
|
37
|
|
385
|
|
|||||||||||||||||
|
Total
|
$
|
18,992
|
|
$
|
257,011
|
|
$
|
306
|
|
$
|
154,600
|
|
$
|
37,394
|
|
$
|
16,435
|
|
$
|
39,707
|
|
$
|
1,580
|
|
$
|
11,915
|
|
||||||||
312
PRUDENTIAL FINANCIAL, INC.
Schedule III
Supplementary Insurance Information
As of and for the Year Ended December 31,
2016
(in millions)
|
Segment
|
Deferred
Policy
Acquisition
Costs
|
Future
Policy
Benefits,
Losses,
Claims,
Expenses
|
Unearned
Premiums
|
Other
Policy Claims
and Benefits
Payable
|
Premiums,
Policy
Charges
and Fee
Income
|
Net
Investment
Income
|
Benefits,
Claims,
Losses
and
Settlement
Expenses
|
Amortization of
DAC
|
Other
Operating
Expenses
|
||||||||||||||||||||||||||
|
PGIM
|
$
|
0
|
|
$
|
0
|
|
$
|
0
|
|
$
|
0
|
|
$
|
0
|
|
$
|
80
|
|
$
|
0
|
|
$
|
15
|
|
$
|
2,095
|
|
||||||||
|
PGIM Division(1)
|
0
|
|
0
|
|
0
|
|
0
|
|
0
|
|
80
|
|
0
|
|
15
|
|
2,095
|
|
|||||||||||||||||
|
Retirement
|
132
|
|
55,661
|
|
0
|
|
49,770
|
|
7,808
|
|
4,275
|
|
10,958
|
|
124
|
|
1,031
|
|
|||||||||||||||||
|
Group Insurance
|
175
|
|
4,710
|
|
220
|
|
8,858
|
|
4,649
|
|
610
|
|
4,302
|
|
6
|
|
822
|
|
|||||||||||||||||
|
U.S. Workplace Solutions Division(1)
|
307
|
|
60,371
|
|
220
|
|
58,628
|
|
12,457
|
|
4,885
|
|
15,260
|
|
130
|
|
1,853
|
|
|||||||||||||||||
|
Individual Annuities
|
4,871
|
|
10,311
|
|
0
|
|
8,601
|
|
2,721
|
|
700
|
|
614
|
|
462
|
|
1,749
|
|
|||||||||||||||||
|
Individual Life
|
5,279
|
|
12,057
|
|
0
|
|
25,021
|
|
2,941
|
|
1,815
|
|
3,414
|
|
216
|
|
1,929
|
|
|||||||||||||||||
|
U.S. Individual Solutions Division(1)
|
10,150
|
|
22,368
|
|
0
|
|
33,622
|
|
5,662
|
|
2,515
|
|
4,028
|
|
678
|
|
3,678
|
|
|||||||||||||||||
|
International Insurance
|
7,208
|
|
103,853
|
|
77
|
|
47,862
|
|
15,813
|
|
4,759
|
|
14,155
|
|
1,065
|
|
2,677
|
|
|||||||||||||||||
|
International Insurance Division
|
7,208
|
|
103,853
|
|
77
|
|
47,862
|
|
15,813
|
|
4,759
|
|
14,155
|
|
1,065
|
|
2,677
|
|
|||||||||||||||||
|
Corporate and Other Operations
|
(340
|
)
|
4,738
|
|
0
|
|
11
|
|
318
|
|
703
|
|
618
|
|
(48
|
)
|
1,069
|
|
|||||||||||||||||
|
Total PFI excluding Closed Block Division
|
17,325
|
|
191,330
|
|
297
|
|
140,123
|
|
34,250
|
|
12,942
|
|
34,061
|
|
1,840
|
|
11,372
|
|
|||||||||||||||||
|
Closed Block Division
|
336
|
|
49,281
|
|
0
|
|
10,793
|
|
2,620
|
|
2,578
|
|
5,357
|
|
37
|
|
407
|
|
|||||||||||||||||
|
Total
|
$
|
17,661
|
|
$
|
240,611
|
|
$
|
297
|
|
$
|
150,916
|
|
$
|
36,870
|
|
$
|
15,520
|
|
$
|
39,418
|
|
$
|
1,877
|
|
$
|
11,779
|
|
||||||||
_________
_
|
(1)
|
Prior period divisional subtotals are presented on a basis consistent with the Company’s new organizational structure. Individual segment results and consolidated totals remain unchanged. See Note 1 to the Consolidated Financial Statements for additional information.
|
313
PRUDENTIAL FINANCIAL, INC.
Schedule IV
Reinsurance
For the Years Ended December 31,
2018
,
2017
and
2016
($ in millions)
|
Gross
Amount
|
Ceded to
Other
Companies
|
Assumed
from
Other
Companies
|
Net
Amount
|
Percentage
of Amount
Assumed
to Net
|
|||||||||||||||
|
2018
|
|||||||||||||||||||
|
Life Insurance Face Amount In Force
|
$
|
5,144,843
|
|
$
|
1,227,142
|
|
$
|
197,343
|
|
$
|
4,115,044
|
|
4.8
|
%
|
|||||
|
Premiums:
|
|||||||||||||||||||
|
Life Insurance
|
$
|
32,248
|
|
$
|
1,792
|
|
$
|
2,574
|
|
$
|
33,030
|
|
7.8
|
%
|
|||||
|
Accident and Health Insurance
|
2,800
|
|
51
|
|
0
|
|
2,749
|
|
0.0
|
|
|||||||||
|
Total Premiums
|
$
|
35,048
|
|
$
|
1,843
|
|
$
|
2,574
|
|
$
|
35,779
|
|
7.2
|
%
|
|||||
|
2017
|
|||||||||||||||||||
|
Life Insurance Face Amount In Force
|
$
|
3,733,997
|
|
$
|
767,499
|
|
$
|
207,083
|
|
$
|
3,173,581
|
|
6.5
|
%
|
|||||
|
Premiums:
|
|||||||||||||||||||
|
Life Insurance
|
$
|
29,035
|
|
$
|
1,761
|
|
$
|
2,105
|
|
$
|
29,379
|
|
7.2
|
%
|
|||||
|
Accident and Health Insurance
|
2,762
|
|
50
|
|
0
|
|
2,712
|
|
0.0
|
|
|||||||||
|
Total Premiums
|
$
|
31,797
|
|
$
|
1,811
|
|
$
|
2,105
|
|
$
|
32,091
|
|
6.6
|
%
|
|||||
|
2016
|
|||||||||||||||||||
|
Life Insurance Face Amount In Force
|
$
|
3,652,206
|
|
$
|
706,918
|
|
$
|
218,262
|
|
$
|
3,163,550
|
|
6.9
|
%
|
|||||
|
Premiums:
|
|||||||||||||||||||
|
Life Insurance
|
$
|
27,857
|
|
$
|
1,719
|
|
$
|
2,073
|
|
$
|
28,211
|
|
7.3
|
%
|
|||||
|
Accident and Health Insurance
|
2,797
|
|
44
|
|
0
|
|
2,753
|
|
0.0
|
|
|||||||||
|
Total Premiums
|
$
|
30,654
|
|
$
|
1,763
|
|
$
|
2,073
|
|
$
|
30,964
|
|
6.7
|
%
|
|||||
314
|
ITEM 16.
|
FORM 10-K SUMMARY
|
None.
315
GLOSSARY
Throughout this Annual Report on Form 10-K, the Company may use certain abbreviations, acronyms and terms which are defined below.
|
Prudential Entities
|
||||
|
Company
|
Prudential Financial, Inc. and its subsidiaries
|
POB
|
Prudential of Brazil
|
|
|
Gibraltar Life
|
Gibraltar Life Insurance Company, Ltd.
|
PRIAC
|
Prudential Retirement Insurance and Annuity Company
|
|
|
PALAC
|
Prudential Annuities Life Assurance Corporation
|
Pruco Life
|
Pruco Life Insurance Company
|
|
|
PB&T
|
Prudential Bank & Trust, FSB
|
Pruco Re
|
Pruco Reinsurance, Ltd.
|
|
|
PFI
|
Prudential Financial, Inc. and its subsidiaries
|
Prudential
|
Prudential Financial, Inc. and its subsidiaries
|
|
|
PGFL
|
Prudential Gibraltar Financial Life Insurance Co., Ltd.
|
Prudential Financial
|
Prudential Financial, Inc.
|
|
|
PGIM
|
The Global Investment Management Businesses of Prudential Financial, Inc.
|
Prudential Funding
|
Prudential Funding, LLC
|
|
|
PHJ
|
Prudential Holdings of Japan, Inc.
|
Prudential Insurance/PICA
|
The Prudential Insurance Company of America
|
|
|
PLIC
|
Prudential Legacy Insurance Company of New Jersey
|
Prudential of Japan
|
The Prudential Life Insurance Company Ltd.
|
|
|
PLNJ
|
Pruco Life Insurance Company of New Jersey
|
Registrant
|
Prudential Financial, Inc.
|
|
316
|
Defined Terms
|
||||
|
AIG
|
American International Group
|
FSS
|
Financial Supervisory Service of Korea
|
|
|
Allstate
|
The Allstate Corporation
|
GDPR
|
The European Union’s General Data Protection Regulation
|
|
|
A.M. Best
|
A.M. Best Company
|
Guideline AXXX
|
The Application of the Valuation of Life Insurance Policies Model Regulation
|
|
|
AFP Habitat
|
Administradora de Fondos de Pensiones Habitat S.A.
|
Hartford Financial
|
Hartford Financial Services Group, Inc.
|
|
|
Board
|
Prudential Financial's Board of Directors
|
Hartford Life Business
|
The Hartford Financial Services Group's individual life insurance business acquired by Prudential Financial
|
|
|
CIO Organization
|
Chief Investment Officer Organization
|
ICS
|
The IAIS’s Risk-based Global Insurance Capital Standard
|
|
|
Closed Block
|
Certain in-force traditional domestic participating insurance and annuity products and corresponding assets that are used for the payment of benefits and policyholders' dividends on these products
|
Liberty Mutual
|
Liberty Mutual Group
|
|
|
ComFrame
|
The common framework for the supervision of Internationally Active Insurance Groups
|
Moody's
|
Moody's Investor Service, Inc.
|
|
|
Council
|
Financial Stability Oversight Council
|
Regulation XXX
|
Valuation of Life Insurance Policies Model Regulation
|
|
|
Designated Financial Companies
|
Non-bank financial companies that are subject to stricter standards and supervision
|
S&P
|
Standard & Poor's Rating Services
|
|
|
Dodd-Frank
|
Dodd-Frank Wall Street Reform and Consumer Protection Act
|
SAB 118
|
Staff Accounting Bulletin 118, Income Tax Accounting Implications of the Tax Cuts and Jobs Act
|
|
|
Enterprise Group
|
Enterprise Group Limited and affiliates
|
Star and Edison Businesses
|
AIG Star Life Insurance Co., Ltd, AIG Edison Life Insurance Company, AIG
Financial Assurance Japan K.K. and AIG Edison Service Co., Ltd., collectively |
|
|
Exchange Act
|
The Securities Exchange Act of 1934
|
Tax Act of 2017
|
The United States Tax Cuts and Jobs Act of 2017
|
|
|
Fitch
|
Fitch Ratings Inc.
|
Union Hamilton
|
Union Hamilton Reinsurance, Ltd.
|
|
|
Framework
|
Prudential's capital protection framework
|
U.S. GAAP
|
Accounting principles generally accepted in the United States of America
|
|
|
FRB
|
Board of Governors of the Federal Reserve System
|
Variable Annuities Recapture
|
A series of transactions that recaptured the risks related to variable annuities living benefits riders and certain retirement products that were previously reinsured to our captive reinsurance company
|
|
317
|
Acronyms
|
||||
|
ABA
|
Activities-Based Approach
|
IAIS
|
International Association of Insurance Supervisors
|
|
|
AG 43
|
Actuarial Guideline No. 43
|
IASB
|
International Accounting Standards Board
|
|
|
AG 48
|
Actuarial Guideline No. 48
|
IFRS
|
International Financial Reporting Standards
|
|
|
ALM
|
Asset Liability Management
|
ILC
|
Inversiones La Construccion S.A.
|
|
|
AOCI
|
Accumulated Other Comprehensive Income
|
IRAs
|
Individual Retirement Accounts
|
|
|
ASU
|
Accounting Standards Updates
|
IRS
|
Internal Revenue Service
|
|
|
BEAT
|
Base Erosion and Anti-Abuse Tax
|
LIBOR
|
London Inter-Bank Offered Rate
|
|
|
BONYM
|
Bank of New York Mellon
|
LPP
|
Legacy Protection Plus
|
|
|
bps
|
Basis Points
|
MD&A
|
Management's Discussion and Analysis of Financial Condition and Results of Operations
|
|
|
CAPM
|
Capital Asset Pricing Model
|
MVA
|
Market Value Adjusted Investment Options
|
|
|
CFC
|
Capital and Finance Committee
|
NAIC
|
National Association of Insurance Commissioners
|
|
|
CFTC
|
Commodity Futures Trading Commission
|
NAV
|
Net Asset Value
|
|
|
CLOs
|
Collateralized Loan Obligations
|
NFA
|
National Futures Association
|
|
|
COSO
|
Committee of Sponsoring Organizations of the Treadway Commission
|
NJDOBI
|
New Jersey Department of Banking and Insurance
|
|
|
DAC
|
Deferred Policy Acquisition Costs
|
NPR
|
Non-Performance Risk
|
|
|
DOL
|
U.S. Department of Labor
|
NY DFS
|
New York State Department of Financial Services
|
|
|
DRD
|
Dividend Received Deduction
|
NYSE
|
New York Stock Exchange
|
|
|
DSI
|
Deferred Sales Inducements
|
OCI
|
Other Comprehensive Income (Loss)
|
|
|
EBITDA
|
Earnings Before Interest, Taxes, Depreciation and Amortization
|
OTC
|
Over-The-Counter
|
|
|
EEA
|
European Economic Area
|
OTTI
|
Other-Than-Temporary Impairments
|
|
|
ERC
|
Enterprise Risk Committee
|
PCAOB
|
Public Company Accounting Oversight Board
|
|
|
ERISA
|
Employee Retirement Income Security Act
|
PDI
|
Prudential Defined Income Variable Annuity
|
|
|
ERM
|
Enterprise Risk Management
|
PFL
|
Profits Followed by Losses
|
|
|
FANIP
|
Funding Agreement Notes Issuance Program
|
PPC
|
Japan Policyholders Protection Corporation
|
|
|
FASB
|
Financial Accounting Standards Board
|
PPI
|
Prudential Premier® Investment Variable Annuity
|
|
|
FHLBB
|
Federal Home Loan Bank of Boston
|
PSA
|
Pooling and Servicing Agreement
|
|
|
FHLBNY
|
Federal Home Loan Bank of New York
|
RAF
|
Risk Appetite Framework
|
|
|
FINRA
|
Financial Industry Regulatory Authority
|
RBC
|
Risk-Based Capital
|
|
|
FIO
|
Federal Insurance Office
|
RICO
|
Racketeer Influenced and Corrupt Organizations Act
|
|
|
FSA
|
Financial Services Agency
|
RMBS
|
Residential Mortgage-Backed Securities
|
|
|
FSB
|
Financial Stability Board
|
SEC
|
Securities and Exchange Commission
|
|
|
GICs
|
Guaranteed Investment Contracts
|
SMR
|
Solvency Margin Ratio
|
|
|
GIFT
|
Guaranteed Income For Tomorrow
|
SOFR
|
Secured Overnight Funding Rate
|
|
|
GILTI
|
Global Intangible Low-Taxed Income
|
SVO
|
Securities Valuation Office
|
|
|
GMAB
|
Guaranteed Minimum Accumulation Benefits
|
TBA
|
To Be Announced
|
|
|
GMDB
|
Guaranteed Minimum Death Benefits
|
U.K.
|
The United Kingdom
|
|
|
GMIB
|
Guaranteed Minimum Income Benefits
|
URR
|
Unearned Revenue Reserve
|
|
|
GMIWB
|
Guaranteed Minimum Income and Withdrawal Benefits
|
U.S.
|
The United States of America
|
|
|
GMWB
|
Guaranteed Minimum Withdrawal Benefits
|
USD
|
United States Dollar
|
|
|
G-SII
|
Global Systemically Important Insurer
|
VIEs
|
Variable Interest Entities
|
|
|
HDI
|
Highest Daily Lifetime Income
|
VOBA
|
Value of Business Acquired
|
|
|
IAIG
|
Internationally Active Insurance Groups
|
|||
318
EXHIBIT INDEX
Pursuant to the rules and regulations of the Securities and Exchange Commission, the Company has filed certain agreements as exhibits to this Annual Report on Form 10-K. These agreements may contain representations and warranties by the parties. These representations and warranties have been made solely for the benefit of the other party or parties to such agreements and (i) may have been qualified by disclosures made to such other party or parties, (ii) were made only as of the date of such agreements or such other date(s) as may be specified in such agreements and are subject to more recent developments, which may not be fully reflected in the Company’s public disclosure, (iii) may reflect the allocation of risk among the parties to such agreements and (iv) may apply materiality standards different from what may be viewed as material to investors. Accordingly, these representations and warranties may not describe the Company’s actual state of affairs at the date hereof and should not be relied upon.
|
|
||
|
|
||
|
|
||
|
|
||
|
4.2
|
|
Upon the request of the Securities and Exchange Commission, the Registrant will furnish copies of all instruments defining the rights of holders of long-term debt of the Registrant.
|
|
|
||
|
|
||
|
|
||
|
|
||
|
|
||
|
|
||
|
|
||
319
|
|
||
320
321
|
|
||
322
|
|
||
|
|
||
|
|
||
|
|
||
|
|
||
|
|
||
|
|
||
|
101.INS—XBRL
|
|
Instance Document.
|
|
101.SCH—XBRL
|
|
Taxonomy Extension Schema Document.
|
|
101.CAL—XBRL
|
|
Taxonomy Extension Calculation Linkbase Document.
|
|
101.LAB—XBRL
|
|
Taxonomy Extension Label Linkbase Document.
|
|
101.PRE—XBRL
|
|
Taxonomy Extension Presentation Linkbase Document.
|
|
101.DEF—XBRL
|
|
Taxonomy Extension Definition Linkbase Document.
|
|
*
|
This exhibit is a management contract or compensatory plan or arrangement.
|
Prudential Financial, Inc. will furnish upon request a copy of any exhibit listed above upon the payment of a reasonable fee covering the expense of furnishing the copy. Requests should be directed to:
Shareholder Services
Prudential Financial, Inc.
751 Broad Street, 21st Floor
Newark, New Jersey 07102
SIGNATURES
Pursuant to the requirements of Section 13 or 15(d) of the Securities Exchange Act of 1934, the registrant has duly caused this report to be signed on its behalf by the undersigned, thereunto duly authorized, in the city of Newark, and state of New Jersey, on the 15
th
day of February, 2019.
|
Prudential Financial, Inc.
|
||
|
By:
|
|
/
S
/ Kenneth Y. Tanji
|
|
Name:
|
|
Kenneth Y. Tanji
|
|
Title:
|
|
Executive Vice President
|
323
Pursuant to the requirements of the Securities Exchange Act of 1934, this report has been signed below by the following persons on behalf of the registrant and in the capacities indicated on February 15, 2019:
|
Name
|
|
Title
|
|
/
S
/ Charles F. Lowrey
|
|
Chief Executive Officer,
|
|
Charles F. Lowrey
|
President and Director
|
|
|
/
S
/ Kenneth Y. Tanji
|
Executive Vice President and Chief Financial Officer
|
|
|
Kenneth Y. Tanji
|
(Principal Financial Officer)
|
|
|
/
S
/ R
OBERT
D. A
XEL
|
Senior Vice President and
|
|
|
Robert D. Axel
|
Principal Accounting Officer
|
|
|
T
HOMAS
J. B
ALTIMORE
, J
R
.*
|
Director
|
|
|
Thomas J. Baltimore, Jr.
|
||
|
G
ILBERT
F. C
ASELLAS
*
|
Director
|
|
|
Gilbert F. Casellas
|
||
|
M
ARK
B. G
RIER
*
|
Director
|
|
|
Mark B. Grier
|
||
|
M
ARTINA
H
UND
-M
EJEAN
*
|
Director
|
|
|
Martina Hund-Mejean
|
||
|
K
ARL
J. K
RAPEK
*
|
Director
|
|
|
Karl J. Krapek
|
||
|
P
ETER
R. L
IGHTE
*
|
Director
|
|
|
Peter R. Lighte
|
||
|
G
EORGE
P
AZ
*
|
Director
|
|
|
George Paz
|
||
|
S
ANDRA
P
IANALTO
*
|
Director
|
|
|
Sandra Pianalto
|
||
|
C
HRISTINE
A. P
OON
*
|
Director
|
|
|
Christine A. Poon
|
||
|
D
OUGLAS
A. S
COVANNER
*
|
Director
|
|
|
Douglas A. Scovanner
|
||
|
J
OHN
R. S
TRANGFELD
*
|
Director
|
|
|
John R. Strangfeld
|
||
|
M
ICHAEL
A. T
ODMAN
*
|
Director
|
|
|
Michael A. Todman
|
||
|
By:*
|
/S/ Kenneth Y. Tanji
|
|
|
Attorney-in-fact
|
||
324
TABLE OF CONTENTS
Part IItem 1. BusinessItem 1A. Risk FactorsItem 1B. Unresolved Staff CommentsItem 2. PropertiesItem 3. Legal ProceedingsItem 4. Mine Safety DisclosuresPart IIItem 5. Market For Registrant S Common Equity, Related Stockholder Matters and Issuer Purchases Of Equity SecuritiesItem 6. Selected Financial DataItem 7. Management S Discussion and Analysis Of Financial Condition and Results Of OperationsItem 7A. Quantitative and Qualitative Disclosures About Market RiskItem 8. Financial Statements and Supplementary DataItem 9. Changes in and Disagreements with Accountants on Accounting and Financial DisclosureItem 9A. Controls and ProceduresItem 9B. Other InformationPart IIIItem 10. Directors, Executive Officers and Corporate GovernanceItem 11. Executive CompensationItem 12. Security Ownership Of Certain Beneficial Owners and Management and Related Stockholder MattersItem 13. Certain Relationships and Related Transactions, and Director IndependenceItem 14. Principal Accountant Fees and ServicesPart IVItem 15. Exhibits, Financial Statement SchedulesItem 16. Form 10-k Summary