PURE STORAGE, INC.
10-Ks and 10-Qs
|
|
|
|
|
|
|
|
|
|
|
|
|
|
|
|
|
|
|
|
|
|
|
|
|
|
|
|
|
|
|
|
|
|
|
|
|
|
|
|
|
|
|
|
|
|
|
|
|
|
|
|
|
|
|
|
|
|
|
|
|
|
|
|
|
|
|
|
|
|
|
|
|
|
|
|
|
|
|
|
|
|
|
|
|
|
|
|
|
|
|
|
|
|
|
|
|
|
|
|
|
|
|
|
|
|
|
|
|
|
|
|
|
|
|
|
|
|
|
|
|
|
|
|
|
|
|
|
|
|
|
|
|
|
|
|
|
|
|
|
|
|
|
|
|
|
|
|
|
|
|
|
|
|
|
|
|
UNITED STATES
SECURITIES AND EXCHANGE COMMISSION
Washington, D.C. 20549
FORM 10-K
(Mark One)
|
x
|
ANNUAL REPORT PURSUANT TO SECTION 13 OR 15(d) OF THE SECURITIES EXCHANGE ACT OF 1934
|
For the year ended
January 31, 2019
OR
|
o
|
TRANSITION REPORT PURSUANT TO SECTION 13 OR 15(d) OF THE SECURITIES EXCHANGE ACT OF 1934 FOR THE TRANSITION PERIOD FROM TO
|
Commission File Number 001-37570
Pure Storage, Inc.
(Exact Name of Registrant as Specified in its Charter)
|
Delaware
|
27-1069557
|
|
(State or other jurisdiction of
incorporation or organization)
|
(I.R.S. Employer
Identification No.)
|
650 Castro Street, Suite 400
Mountain View, California 94041
(Address of principal executive offices, including zip code)
(800) 379-7873
(Registrant’s telephone number, including area code)
Securities registered pursuant to Section 12(b) of the Act:
|
Title of each class
|
Name of each exchange on which registered
|
|
Class A Common Stock, par value $0.0001 per share
|
New York Stock Exchange
|
Securities registered pursuant to Section 12(g) of the Act: None
Indicate by check mark if the registrant is a well-known seasoned issuer, as defined in Rule 405 of the Securities Act. YES
x
NO
¨
Indicate by check mark if the registrant is not required to file reports pursuant to Section 13 or 15(d) of the Act. YES
¨
NO
x
Indicate by check mark whether the registrant: (1) has filed all reports required to be filed by Section 13 or 15(d) of the Securities Exchange Act of 1934 (Exchange Act) during the preceding 12 months (or for such shorter period that the registrant was required to file such reports), and (2) has been subject to such filing requirements for the past 90 days. YES
x
NO
¨
Indicate by check mark whether the registrant has submitted electronically every Interactive Data File required to be submitted pursuant to Rule 405 of Regulation S-T (§232.405 of this chapter) during the preceding 12 months (or for such shorter period that the registrant was required to submit such files). YES
x
NO
¨
Indicate by check mark if disclosure of delinquent filers pursuant to Item 405 of Regulation S-K (§229.405 of this chapter) is not contained herein, and will not be contained, to the best of registrant’s knowledge, in definitive proxy or information statements incorporated by reference in Part III of this Form 10-K or any amendment to this Form 10-K.
¨
Indicate by check mark whether the registrant is a large accelerated filer, an accelerated filer, a non-accelerated filer, a smaller reporting company, or emerging growth company. See the definition of “large accelerated filer”, “accelerated filer”, “smaller reporting company”, and "emerging growth company" in Rule 12b-2 of the Exchange Act. (Check one):
|
Large accelerated filer
|
|
x
|
|
Accelerated filer
|
|
¨
|
|
|
|
|
|
|||
|
Non-accelerated filer
|
|
¨
|
|
Small reporting company
|
|
¨
|
|
Emerging growth company
|
¨
|
|||||
If an emerging growth company, indicate by check mark if the registrant has elected not to use the extended transition period for complying with any new or revised financial accounting standards provided pursuant to section 13(a) of the Exchange Act.
¨
Indicate by check mark whether the registrant is a shell company (as defined in Rule 12b-2 of the Exchange Act). YES
¨
NO
x
The aggregate market value of the voting and non-voting common equity held by non-affiliates of the registrant as of July 31, 2018, the last business day of the registrant's most recently completed second quarter, was approximately $4.6 billion based upon the closing price reported for such date by the New York Stock Exchange. Shares of the registrant's Class A and Class B common stock held by each executive officer, director and holder of 10% or more of the outstanding Class A and Class B common stock have been excluded from this calculation because such persons may be deemed affiliates. This determination of executive officer or affiliate status is not necessarily a conclusive determination for any other purpose.
As of
March 18, 2019
, the registrant had
244,930,555
shares of Class A common stock outstanding.
Documents Incorporated by Reference
Portions of the registrant’s proxy statement for its
2019
annual meeting of stockholders are incorporated by reference into Part III of this Annual Report on Form 10-K where indicated. Such proxy statement will be filed with the Securities and Exchange Commission within 120 days of the registrant’s fiscal year ended
January 31, 2019
.
Table of Contents
|
|
|
Page
|
|
|
|
|
|
PART I
|
|
|
|
Item 1.
|
||
|
Item 1A.
|
||
|
Item 1B.
|
||
|
Item 2.
|
||
|
Item 3.
|
||
|
Item 4.
|
||
|
|
|
|
|
PART II
|
|
|
|
Item 5.
|
||
|
Item 6.
|
||
|
Item 7.
|
||
|
Item 7A.
|
||
|
Item 8.
|
||
|
Item 9.
|
||
|
Item 9A.
|
||
|
Item 9B.
|
||
|
|
|
|
|
PART III
|
|
|
|
Item 10.
|
||
|
Item 11.
|
||
|
Item 12.
|
||
|
Item 13.
|
||
|
Item 14.
|
||
|
|
|
|
|
PART IV
|
|
|
|
Item 15.
|
||
2
NOTE ABOUT FORWARD-LOOKING STATEMENTS
This Annual Report on Form 10-K contains forward-looking statements within the meaning of Section 27A of the Securities Act of 1933, as amended (the Securities Act), and Section 21E of the Securities Exchange Act of 1934, as amended (the Exchange Act), about us and our industry that involve substantial risks and uncertainties. All statements other than statements of historical facts contained in this report, including statements regarding our future results of operations and financial condition, business strategy and plans and objectives of management for future operations, are forward-looking statements. In some cases, forward-looking statements may be identified by words such as “anticipate,” “believe,” “continue,” “could,” “design,” “estimate,” “expect,” “intend,” “may,” “plan,” “potentially,” “predict,” “project,” “should,” “will” or the negative of these terms or other similar expressions.
Forward-looking statements contained in this Annual Report on Form 10-K include, but are not limited to, statements regarding our ability to sustain or manage our profitability, expansion and growth, our expectations that average sales prices may decrease over time, our plans to expand and continue to invest internationally, our plans to expand the research and development organization as well as the sales and marketing function and channel programs, our expectations regarding fluctuations in our revenue and operating results, our expectations that we may continue to experience losses despite significant revenue growth, our ability to successfully attract, motivate, and retain qualified personnel and maintain our culture, our expectations regarding our technological leadership and market opportunity, our ability to realize benefits from our investments, our ability to innovate and introduce new or enhanced products, our expectations regarding product acceptance and our technologies, products and solutions, our competitive position and the effects of competition and industry dynamics, including those of retrofitted or new products from incumbent vendors, hyperconverged products, defined as server compute and storage combined within a single chassis, or public cloud, our expectations concerning relationships with third parties, including partners, customers and contract manufacturers, the adequacy of our intellectual property rights, and expectations concerning pending legal proceedings and related costs.
We have based these forward-looking statements largely on our current expectations and projections about future events and financial trends that we believe may affect our financial condition, results of operations, business strategy, and financial needs. These forward-looking statements are subject to a number of known and unknown risks, uncertainties and assumptions, including risks described in the section titled “Risk Factors.” These risks are not exhaustive. Other sections of this report include additional factors that could harm our business and financial performance. Moreover, we operate in a very competitive and rapidly changing environment. New risk factors emerge from time to time, and it is not possible for our management to predict all risk factors nor can we assess the impact of all factors on our business or the extent to which any factor, or combination of factors, may cause actual results to differ from those contained in, or implied by, any forward-looking statements.
Investors should not rely upon forward-looking statements as predictions of future events. We cannot assure investors that the events and circumstances reflected in the forward-looking statements will be achieved or occur. Although we believe that the expectations reflected in the forward-looking statements are reasonable, we cannot guarantee future results, levels of activity, performance or achievements. Except as required by law, we undertake no obligation to update publicly any forward-looking statements for any reason after the date of this report or to conform these statements to actual results or to changes in our expectations. Investors should read this Annual Report on Form 10-K and the documents that we reference in this Annual Report on Form 10-K and have filed as exhibits to this report with the understanding that our actual future results, levels of activity, performance and achievements may be materially different from what we expect. We qualify all of our forward-looking statements by these cautionary statements.
3
WHERE INVESTORS CAN FIND MORE INFORMATION
Investors should note that we announce material financial information to our investors using our investor relations website, press releases, Securities and Exchange Commission (SEC) filings and public conference calls and webcasts. We also use the following social media channels as a means of disclosing information about the company, our products, our planned financial and other announcements and attendance at upcoming investor and industry conferences, and other matters and for complying with our disclosure obligations under Regulation FD:
Pure Storage Twitter Account (twitter.com/PureStorage)
Pure Storage Company Blog (blog.purestorage.com)
Pure Storage Facebook Page (facebook.com/PureStorage)
Pure Storage LinkedIn Page (linkedin.com/company/pure-storage)
The information we post through these social media channels may be deemed material. Accordingly, investors should monitor these accounts and our company blog, in addition to following our press releases, public conference calls and webcasts, and filings with the SEC. This list may be updated from time to time. The information we post through these channels is not a part of this Annual Report on Form 10-K. These channels may be updated from time to time on Pure Storage's investor relations website.
4
PART I
Item 1. Business.
Overview
We help innovators to build a better world with data. As data continues to grow and organizations strive to mine intelligence from data and the need for real-time analytics increases, we are focused on delivering software-defined data storage solutions that are uniquely fast and cloud-capable, enabling customers to maximize the value of data, gain competitive advantage and keep pace with cutting edge developments. Our innovative data platform replaces storage systems designed for mechanical disk with all-flash systems optimized end-to-end for solid-state memory. Our
Pure1
cloud-based support and management platform simplifies storage administration, while real-time scanning enables us to find and fix issues before they have an impact. Our innovative business model replaces the traditional forklift upgrade cycle with an
Evergreen Storage
subscription model for hardware and software innovation, support and maintenance.
We were incorporated in October 2009 and are headquartered in Mountain View, California, with operations throughout the world. Our primary offerings include our
FlashArray
and
FlashBlade
products, inclusive of our
Purity Operating Environment
(
Purity OE
) software, our
Pure1
cloud-based management and support software,
FlashStack and Artificial Intelligence Ready Infrastructure (AIRI)
, our joint converged Infrastructure offerings, and
Evergreen Storage Service (ES2)
, a cloud-like, storage consumption offering that enables customers to purchase on-premises or offsite-hosted private storage on a pay-per-month-per-terabyte basis after a baseline commitment. In addition, in November 2018, we announced the launch of our
Cloud Data Services
, a suite of new cloud offerings that will enable customers to invest in a single storage architecture that unifies application deployments on-premises and on the cloud.
We have experienced substantial growth over the past three years; our revenue was
$739.2 million
,
$1,024.8 million
, and
$1,359.8 million
for the years ended
January 31, 2017
,
2018
and
2019
, respectively. As of
January 31, 2019
, we had over
2,800
employees globally.
Since launching in May 2012, our customer base has grown to over
5,800
customers, including over 40% of the Fortune 500. Our customers include enterprise and commercial organizations, cloud, Global Systems Integrators, and service providers across a diverse set of industry verticals, consumer web, education, energy, financial services, governments, healthcare, manufacturing, media, retail and telecommunications. Our data services are used for a broad set of use cases, including database applications, large-scale analytics, artificial intelligence / machine learning, private and public cloud infrastructure and webscale applications, virtual server infrastructure and virtual desktop infrastructure. Our data platform helps customers scale their businesses through real-time and more accurate analytics, increase employee productivity, improve operational efficiency, and deliver more compelling user experiences to their customers and partners.
Our sales force works collaboratively with our global network of distribution and channel partners, which provides us broad sales reach while maintaining direct customer engagement.
Recent Developments
In March 2018, we announced Artificial Intelligence Ready Infrastructure (AIRI), the industry’s first AI-ready converged infrastructure solution, in partnership with NVIDIA.
In April 2018, we issued $575.0 million of 0.125% convertible senior notes due 2023 (the Notes), in a private placement and received proceeds of $562.1 million, after deducting the underwriters' discounts and commissions. The Notes are unsecured obligations that do not contain any financial covenants or restrictions on the payments of dividends, the incurrence of indebtedness, or the issuance or repurchase of securities by us or any of our subsidiaries. See further discussion in Note 6 in Part II, Item 8 of this Annual Report on Form 10-K.
In May 2018, we held Pure//Accelerate, our annual user conference, and introduced a number of new product and service offerings including:
|
•
|
New FlashArray//X, delivering 100% NVMe-capable storage across our FlashArray product line, with the ability to unite SAN and DAS into a single, consolidated, shared, and more efficient data-center architecture.
|
|
•
|
AIRI Mini, enabling customers to gain competitive advantage through AI at a price point accessible for many organizations.
|
5
|
•
|
Evergreen Storage Service (ES2), a cloud-like, storage consumption offering that enables customers to purchase on-premises or offsite-hosted private storage on a pay-per-month-per-terabyte basis, after a baseline commitment.
|
In August 2018, we acquired StorReduce, Inc., a cloud-first software-defined storage solution. This technology formed the basis of our ObjectEngine offering launched in November 2018.
In November 2018, we announced the launch of our Cloud Data Services, a suite of cloud offerings that will enable customers to invest in a single storage architecture that unifies application deployments on-premises and on the cloud.
Innovative Technology and Business Model
We deliver our data platform via our flash-optimized software,
Purity OE
, modular and scalable all-flash hardware platforms,
FlashArray
and
FlashBlade
, as well as our
Pure1
cloud-based management and support platform. We also offer converged infrastructure solutions,
FlashStack and AIRI
. Our entire data platform is powered by innovative software that is cloud-connected for management from anywhere and supported by our
Evergreen Storage
business model. Similar to what customers expect from the public cloud, with
Pure1
and
Evergreen Storage
, our customers benefit from near zero administration and a subscription to the latest technology, but with much higher performance and lower cost.
Software Optimized for Solid-State Memory
The heart of our data platform is our proprietary
Purity OE
software that implements enterprise-class storage services such as data reduction, encryption and data protection, as well as protocol services such as block, file and object. Variants of
Purity OE
have been optimized for both our
FlashArray
and
FlashBlade
platforms. Our
Purity OE
software employs variable block size data reduction algorithms and can deliver up to two to five times better data reduction as compared to leading competitive products, resulting in an average of 5-to-1 data reduction across a wide range of use cases and data types. Our software implements strong data-at-rest encryption of all data, all the time, and is designed to maintain performance through failures and enables our arrays to be easily upgraded without scheduled downtime, setting new expectations for storage resiliency. With our
DirectFlash
architecture, recent versions of
Purity OE
have been optimized to speak directly to raw NAND Flash, enabling us to overcome the inefficiencies of prior commodity SSD architectures.
Hardware Optimized for Solid-State Memory
The hardware underlying our
FlashArray
and
FlashBlade
products is designed to maximize the performance and density of flash, optimize our advanced software services, and minimize overall solution cost for customers. Our platforms are designed to be modular and upgradable over time, enabling our vision of
Evergreen Storage
and eliminating the 3 to 5 year forklift refresh cycle of legacy storage systems. Our platform's design allows us to periodically deliver both processor and flash upgrades, and enables customers to adopt these advances without data migration, downtime or performance impact. This also enables a business model of ongoing up-sell to enable customers to easily expand capacity and performance as their data needs grow.
Our platforms are designed to maximize the performance of flash, leveraging native high bandwidth and low latency PCIe/NVMe networking and to be extremely simple and reliable without sacrificing the scalability and upgradability of an enterprise array. Because we design both our
FlashArray
and
FlashBlade
products in-house, and develop all of our
Purity OE
software specifically for our hardware, we are able to realize end-to-end optimizations between software and flash storage, such as true global flash management with
DirectFlash
software and
FlashArray//X's
end-to-end NVMe optimization. This allows us to deliver solutions with high density, power efficiency and tight integration for simplicity, all at a lower cost.
Pure1 Management, Support and Analytics
Pure1
is a cloud-based management and support offering that enables our customers, our support staff and our partners to seamlessly and securely collaborate to maximize the reliability of the Pure Storage platform while minimizing management overhead and cost to the customer. This cloud-based platform removes the need for dedicated storage management infrastructure, enables customers to monitor a global storage deployment from a mobile device and simplifies integration with other data center management solutions.
Pure1
's
Global Insight
technology also employs
6
cutting-edge real-time analytics and machine learning technologies to predictively identify potential issues with our platform, enabling our support organization to proactively resolve support incidents before they start - leading to higher uptime and availability for our data platform, and features powered by
Pure1 META
enable customers to predict both capacity and performance and get intelligent advice on workload deployment, interaction and optimization.
Innovative Business Model
In addition to our product leadership and differentiated customer experience, our innovative business model helps us achieve our vision of
Evergreen Storage
. We believe that the traditional storage business model is expensive, resource intensive and detrimentally impacts customer operations. Our alternative approach is designed to eliminate this pain. We offer a simple all-inclusive software model and a new approach to the storage array purchase and expansion lifecycle, allowing customers to incrementally improve array performance and capacity as needed, dramatically reducing cost and risk, while increasing predictability. This enables customers to both extend the useful life of their hardware and avoid the cost and risk of recurring data migration. We believe that it will be difficult for legacy storage vendors to entirely copy our business-model innovations given their disk-based product architectures, the inflexibility of hardware upgrades to their platforms, and dependence on complex licensing programs and regular forklift array replacement upgrades.
Our Customers
We target a variety of large and mid-size commercial enterprises, federal, state, and local governments, schools and healthcare organizations globally. Our customer base includes over
5,800
organizations as of
January 31, 2019
, including over
40%
of the Fortune 500. We have deployed our platform at customers across multiple industry verticals. Our platform has been deployed in some of the largest and most sophisticated enterprises in the world as well as smaller organizations with limited IT expertise or budget, including hospitals, municipalities and school districts. Hundreds of our customers have invested in excess of a million dollars leveraging our platform across their business-critical applications. We define a customer as an end user that purchases our products and services either from one of our channel partners or from us directly. No end user customer represented more than 10% of our revenue for the year ended
January 31, 2019
.
Sales and Marketing
Sales
.
We sell our data solutions predominantly through a channel-fulfilled sales model. Our sales organization supports our channel partners and is responsible for large-account penetration, global account coordination and overall market development. Our channel partners help market and sell our products, typically with assistance from our sales force. This joint sales approach provides us with the benefit of direct relationships with substantially all of our customers and expands our reach through the relationships of our channel partners. In certain geographies we sell through a two-tier distribution model. We also sell to service providers that deploy our products and offer cloud-based storage services to their customers. We intend to continue to invest in the channel to add more partners and to expand our reach to customers through our channel partners' relationships. One channel partner represented 11% of our revenue for the year ended
January 31, 2019
.
We intend to continue to expand our partner relationships to further extend our sales coverage and to invest in education, training and other programs to increase the ability of our channel partners to sell our products independently. We expect to continue to grow our sales organization and expand our international sales presence. Generally, our sales representatives have become more productive the longer they are with us, with limited productivity in their first few quarters as they learn to sell our products, participate in classroom and field training and build a customer base. We optimize our sales management efforts to help our sales representatives maximize their productivity throughout their tenure. Our sales organization is supported by sales engineers with deep technical expertise and responsibility for pre-sales technical support, solutions engineering and technical training.
Technology Alliances.
We work closely with technology partners that help us deliver an ecosystem of world-class solutions to our customers and ensure the efficient deployment and support of their environments. Our technology partners include application partners such as Microsoft, Oracle and SAP, cloud partners such as AWS and Microsoft Azure, and infrastructure partners such as Arista, Cisco, NVIDIA and VMware. In addition, we work closely with our technology partners through co-marketing and lead-generation activities in an effort to broaden our marketing reach and help us win new customers and retain existing ones.
7
Marketing.
Our marketing is focused on building our brand reputation and market awareness, communicating product advantages, driving customer demand and generating leads for our sales force and channel partners. Our marketing effort consists primarily of product, field, channel, solutions and digital marketing and public relations.
Research and Development
Our research and development efforts are focused on improving our existing products and developing new products. Our products integrate both software and hardware innovations, and accordingly, our research and development teams employ both software and hardware engineers in the design, development, testing, certification and support of our products. Our research and development teams are primarily based in Mountain View, California, and Bellevue, Washington. We also design, test and certify our products to ensure interoperability with a variety of third-party software, servers, operating systems and network components. We plan to continue to dedicate significant resources to our ongoing research and development efforts.
Research and development expenses were
$245.8 million
,
$279.2 million
and
$349.9 million
for the years ended
January 31, 2017
,
2018
and
2019
.
Manufacturing
Our contract manufacturers manufacture, assemble, test and package our products in accordance with our specifications. We provide our contract manufacturers a rolling forecast for anticipated orders, which our contract manufacturers use to build finished products. The product mix and volumes are adjusted based on anticipated demand and actual sales and shipments in prior periods. Our contract manufacturers are generally able to respond to changes in our product mix or volume without significant delay or increased costs. We work closely with our contract manufacturers to meet our product delivery requirements and to manage the manufacturing process and quality control.
Backlog
We typically accept and ship orders within a short time frame. In general, customers may cancel or reschedule orders without penalty, and delivery schedules requested by customers in their purchase orders vary based upon each customer’s particular needs. As a result, we do not believe that our backlog at any particular time is a reliable indicator of future revenue.
Seasonality
Consistent with the seasonality of enterprise IT as a whole, we generally experience the lowest demand for our products and services in the first quarter of our fiscal year and the greatest demand for our products and services in the last quarter of our fiscal year. Furthermore, we typically focus investments into our sales organization, along with significant product launches, in the first half of our fiscal year. As a result, we expect that our business and results of operations will fluctuate from quarter to quarter, reflecting seasonally softer revenue and operating margin in the first half of our fiscal year, followed by a stronger second half, the relative impact of which will grow as we operate at a larger scale.
Competition
We operate in the intensely competitive data storage market that is characterized by constant change and innovation. Changes in the application requirements, data center infrastructure trends and the broader technology landscape, result in evolving customer requirements for capacity, performance scalability and enterprise features of storage systems. Our main competitors include legacy vendors, such as Dell EMC, Hitachi Vantara, HP Enterprise, IBM, and NetApp, that offer a broad range of systems targeting various use cases and end markets and have the technical and financial resources to bring competitive products to market.
In addition, we compete against cloud providers and vendors of hyperconverged products. Some large-scale cloud providers, known for developing storage systems internally, are expanding and offer alternatives to our products for a variety of customer workloads. Our market attracts new startups and more highly specialized vendors, as well as larger vendors that may continue to acquire or bundle their products more effectively. All of our competitors utilize a broad range of competitive strategies.
We believe the principal competitive factors in the storage market are as follows:
8
|
•
|
Product features and enhancements, including ease of use, performance, reliability, scalability, and complementary product offerings;
|
|
•
|
Product pricing and total cost of ownership;
|
|
•
|
Product interoperability with customer networks and backup software;
|
|
•
|
Global sales and distribution capability, including an ability to build and maintain senior customer relationships;
|
|
•
|
Ability to take advantage of improvements in industry standard components; and
|
|
•
|
Customer support and service.
|
We believe we generally compete favorably with our competitors on the basis of these factors as a result of our hardware and software, product capabilities, ability to deliver the benefits of all-flash storage to a broad set of customers, management simplicity, ease of use and differentiated customer support. However, many of our competitors have substantially greater financial, technical and other resources, greater name recognition, larger sales and marketing budgets, broader distribution and larger and more mature intellectual property portfolios.
Intellectual Property
Our success depends in part upon our ability to protect our core technology and intellectual property. To establish and protect our proprietary rights, we rely on a combination of intellectual property rights, including patents, trademarks, copyrights, trade secret laws, license agreements, confidentiality procedures, employee disclosure and invention assignment agreements and other contractual rights.
We have over 800 issued patents and patent applications in the United States and foreign countries. We also license technology from third parties when we believe it will facilitate our product offerings or business.
Employees
We believe the expertise of our people and our culture is a key enabler of our technology leadership. We had over
2,800
employees worldwide as of
January 31, 2019
. As of
January 31, 2019
, we had
786
,
1,430
and
246
employees in research and development, sales and marketing and general and administrative functions, respectively, with the remainder primarily related to support and manufacturing operations. None of our employees is represented by a labor union or covered by a collective bargaining arrangement.
Corporate Information
We were incorporated in Delaware in October 2009 as OS76, Inc. In January 2010, we changed our name to Pure Storage, Inc. Our website address is www.purestorage.com. Information contained on or accessible through our website is not a part of this report and the inclusion of our website address in this report is an inactive textual reference only.
Pure Storage,
the
“P”
logo,
AIRI, DirectFlash, Evergreen
,
FlashArray, FlashBlade
,
FlashStack, ObjectEngine, Pure1, Purity Operating Environment
and other trade names, trademarks or service marks of Pure Storage appearing in this report are the property of Pure Storage. Trade names, trademarks and service marks of other companies appearing in this report are the property of their respective holders.
Available Information
We make available, free of charge through our website, our annual reports on Form 10-K, quarterly reports on Form 10-Q and current reports on Form 8-K, and amendments to those reports, filed or furnished pursuant to Sections 13(a) or Section 15(d) of the Securities Exchange Act of 1934, as amended, as soon as reasonably practicable after they have been electronically filed with, or furnished to, the SEC. In addition, the SEC maintains an internet site (http://www.sec.gov) that contains reports, proxy and information statements, and other information regarding issuers that file electronically with the SEC.
Item 1A. Risk Factors.
9
Investing in our Class A common stock involves a high degree of risk. Investors should carefully consider the risks and uncertainties described below, together with all of the other information contained in this report, including our consolidated financial statements and the related notes appearing in this annual report, before deciding to invest in our Class A common stock. If any of the following risks actually occur, it could harm our business, prospects, operating results and financial condition. In such event, the trading price of our Class A common stock could decline and investors might lose all or part of their investment.
Risks Related to Our Business and Industry
We have experienced rapid growth in prior periods, and we may not be able to sustain or manage future growth effectively.
We have significantly expanded our overall business, customer base, headcount, channel partner relationships and operations in prior periods, and we anticipate that we will continue to expand and experience growth in future periods. For example, we delivered year-over-year revenue growth of
33%
for the year ended
January 31, 2019
and our headcount increased from over
1,700
to over
2,100
for the period as of
January 31, 2017
to
January 31, 2018
, and to over
2,800
employees as of
January 31, 2019
. Our future operating results will depend to a large extent on our ability to successfully sustain our growth and manage our anticipated expansion. To sustain and manage our growth successfully, we believe that we must, among other things, effectively:
|
•
|
maintain and extend our product leadership;
|
|
•
|
recruit, hire, train and manage qualified personnel;
|
|
•
|
maintain and further develop our partner relationships;
|
|
•
|
enhance and expand our distribution and supply chain infrastructure;
|
|
•
|
expand our support capabilities;
|
|
•
|
forecast and control expenses;
|
|
•
|
enhance and expand our international operations; and
|
|
•
|
implement, improve and maintain our internal systems, procedures and controls.
|
We expect that our future growth will continue to place a significant strain on our managerial, administrative, operational, financial and other resources. We will incur costs associated with this future growth prior to realizing the anticipated benefits, and the return on these investments may be lower, may develop more slowly than we expect or may never materialize. Investors should not consider our revenue growth in prior quarterly or annual periods as indicative of our future performance. In future periods, we may not achieve similar percentage revenue growth rates as we have achieved in some past periods. If we are unable to manage our growth successfully, we may not be able to take advantage of market opportunities or release new products or enhancements in a timely manner, and we may fail to satisfy customers’ expectations, maintain product quality, execute on our business plan or adequately respond to competitive pressures, each of which could adversely impact our growth and affect our business and operating results.
We intend to continue focusing on revenue growth and increasing our market penetration and international presence by investing heavily in our business and this may put pressure on near-term profitability.
Our strategy is to continue investing in marketing, sales, support and research and development. We believe continuing to invest heavily in our business is critical to our future success and meeting our growth objectives. We anticipate that our operating costs and expenses will continue to increase in absolute terms. Even if we achieve or maintain significant revenue growth, we may continue to experience losses, forgoing near-term profitability on a U.S. GAAP basis.
We have not achieved profitability for any year since our inception. We incurred a net loss of $
178.4 million
for the year ended
January 31, 2019
, and we had an accumulated deficit of $
1,081.9 million
as of
January 31, 2019
. Our operating expenses largely are based on anticipated revenue, and a high percentage of our expenses are, and will continue to be, fixed in the short term. If we fail to adequately increase revenue and manage costs, we may not achieve or maintain profitability in the future. As a result, our business could be harmed and our operating results could suffer.
Our revenue growth rate in recent periods may not be indicative of our future performance.
10
We were founded in October 2009, but have generated substantially all of our revenue in our last four fiscal years.
Investors should not consider our revenue growth in prior quarterly or annual periods as indicative of our future performance. In future periods, we may not achieve similar percentage revenue growth rates as we have achieved in some past periods. If we are unable to maintain adequate revenue or revenue growth, our stock price could be volatile, and it may be difficult to achieve and maintain profitability.
The market for all-flash storage products is rapidly evolving, which makes it difficult to forecast customer adoption rates and demand for our products.
The market for all-flash storage products is rapidly evolving. Our future financial performance depends on the continued growth of this market and on our ability to adapt to competitive dynamics and emerging customer demands and trends. Incumbent vendors promote storage products retrofitted with flash, which may reduce the perceived value of purpose-built, all-flash products. It is difficult to predict with any precision customer adoption rates of flash, customer demand for our products or the future growth rate and size of our market.
Our products may never reach mass adoption, and changes or advances in alternative technologies or adoption of cloud storage offerings not utilizing our data solutions could adversely affect the demand for our products. For instance, offerings from large public cloud providers are expanding quickly and may serve as alternatives to our products for a variety of customer workloads. Since these providers are known for developing storage systems internally, this trend could reduce the demand for storage systems developed by original equipment manufacturers, such as us. Further, although flash storage has a number of advantages as compared to other data storage alternatives, flash storage has certain limitations as well, including more limited methods for data recovery and reduced performance gains for certain uses, such as sequential input/output transactions. A slowing in or reduced demand for all-flash storage products caused by technological challenges, alternative technologies and products or any other reason would result in a lower revenue growth rate or decreased revenue, either of which would negatively impact our business and operating results.
We face intense competition from established companies and new entrants.
We face intense competition from a number of established companies that sell competitive storage products. These competitors include Dell EMC, HP Enterprise, Hitachi Vantara, IBM, NetApp, and others. Our competitors may have:
|
•
|
greater name and brand recognition and longer operating histories;
|
|
•
|
larger sales and marketing and customer support budgets and resources;
|
|
•
|
broader distribution and established relationships with distribution partners and customers;
|
|
•
|
the ability to bundle storage products with other products and services to address customers’ requirements;
|
|
•
|
greater resources to make acquisitions;
|
|
•
|
larger and more mature product and intellectual property portfolios; and
|
|
•
|
substantially greater financial, technical and other resources.
|
We also compete against cloud providers and vendors of hyperconverged products. These providers are growing and expanding their product offerings, potentially displacing some demand for our products. In addition, some of our competitors offer bundled products and services in order to reduce the initial cost of their storage products. Further, some of our competitors offer their storage products either at significant discounts or even for free in competing against us and in response to our efforts to market the overall benefits and technological merits of our products and programs.
Many competitors have developed competing all-flash storage technologies. For example, several of our competitors have introduced all-flash storage products with performance-focused designs and/or with data reduction technologies that directly compete with our products, or have introduced business programs that attempt to compete with our innovative programs, such as our
Evergreen Storage
model. We expect our competitors to continue to improve the performance of their products, reduce their prices and introduce new features, services and technologies that may, or that they may claim to, offer greater value compared to our products. In addition, our competitors may develop enhancements to, or future generations of, competitive products that may render our products or technologies obsolete or less competitive. These and other competitive pressures may prevent us from competing successfully against current or future competitors.
11
Our business may be harmed by trends in the overall external storage market.
Despite ongoing data growth, the external storage market in which we compete has not experienced substantial
growth in the past few years due to a combination of technology transitions, increased storage efficiency, and changing economic and business environments. Customers are rethinking how they consume IT, increasing spending toward public cloud, software as a service, hyperconverged and converged infrastructure and software-defined storage. The future impact of these trends on both short-term and long-term growth of the overall external storage market is uncertain. Reductions in the overall external storage market, or the specific markets in which we compete would harm our business and operating results
.
Many of our competitors have long-standing relationships with key decision makers at current and prospective customers, which may inhibit our ability to compete.
Many of our competitors benefit from established brand awareness and long-standing relationships with key decision makers at our current and prospective customers. Our competitors often leverage these existing relationships to discourage customers from evaluating or purchasing our products. Additionally, most of our prospective customers have existing storage products supplied by our competitors who have an advantage in retaining the customer because, among other things, they already understand the customer’s IT infrastructure, user demands and needs. In the event that we are unable to successfully sell our products to new customers or persuade our customers to continue purchasing our products, we will not be able to maintain or increase our market share and revenue, which could adversely affect our business and operating results.
Our ability to increase our revenue depends on our ability to attract, motivate and retain sales, engineering and other key personnel, including our management team, and any failure to attract, motivate and retain these employees could harm our business, operating results and financial condition.
Our ability to increase our revenue depends on our ability to attract, motivate, and retain qualified sales, engineering and other key employees, including our management. These positions may require candidates with specific backgrounds in software and the storage industry, and competition for employees with such expertise is intense. We have from time to time experienced, and we expect to continue to experience, difficulty in hiring and retaining highly skilled employees with appropriate qualifications. To the extent that we are successful in hiring to fill these positions, we need a significant amount of time to train new employees before they become effective and efficient in performing their jobs. From time to time, there may be changes in our management team, which could create short term uncertainty. Members of our management team, including our executive officers, are generally employed on an at-will basis, which means that they could terminate their employment with us at any time. If we are unable to attract, motivate and retain qualified sales, engineering and other key employees, including our management, our business and operating results could suffer.
If we fail to adequately expand and optimize our sales force, our growth will be impeded.
We need to continue to expand and optimize our sales organization in order to grow our customer base and our business. We plan to continue to expand and train our sales force, both domestically and internationally. We must design and implement effective sales incentive programs, and it can take time before our sales representatives are fully trained and productive. If we are unable to hire, develop and retain qualified sales personnel or if new sales personnel are unable to achieve desired productivity levels in a reasonable period of time, we may not be able to realize the expected benefits of these investments or increase our revenue.
If we fail to develop and introduce new or enhanced products successfully, our ability to attract and retain customers could be harmed.
We operate in a dynamic environment characterized by rapidly changing technologies and industry standards and technological obsolescence. To compete successfully, we must design, develop, market and sell new or enhanced products that provide increasingly higher levels of performance, capacity and reliability and that meet the cost expectations of our customers, which is a complex and uncertain process. We believe that we must continue to dedicate significant resources to our research and development efforts to maintain or expand our competitive position. Our investments may take longer to generate revenue or may generate less revenue than we anticipate. The introduction of new products by our competitors, or the emergence of alternative technologies or industry standards could render our existing or future products obsolete or less competitive.
12
As we introduce new or enhanced products, we must successfully manage product launches and transitions to the next generations of our products, and encourage our customers to adopt new products and features. For example, we announced our suite of
Cloud Data Services
last year. If we are not able to successfully manage the development and release of new or enhanced products, our business, operating results and financial condition could be harmed. Similarly, if we fail to introduce new or enhanced products, such as new or improved software features, that meet our customers' needs in a timely or cost-effective fashion, we may lose market share and our operating results could be adversely affected.
If we fail to successfully maintain or grow our relationships with channel partners, our business, operating results and financial condition could be harmed.
Our future success is highly dependent upon our ability to establish and maintain successful relationships with our channel partners. In addition to selling our products, our partners may offer installation, post-sale service and support in their local markets. In markets where we rely on partners more heavily, we have less contact with our customers and less control over the sales process and the quality and responsiveness of our partners. As a result, it may be more difficult for us to ensure the proper delivery and installation of our products or the quality or responsiveness of the support and services being offered. Any failure on our part to effectively identify, train and manage our channel partners and to monitor their sales activity, as well as the customer support and services provided to our customers, could harm our business, operating results and financial condition.
Our channel partners may choose to discontinue offering our products and services or may not devote sufficient attention and resources toward selling our products and services. We typically enter into non-exclusive, written agreements with our channel partners. These agreements generally have a one-year, self-renewing term, have no minimum sales commitment and do not prohibit our channel partners from offering products and services that compete with ours. Additionally, our competitors provide incentives to our existing and potential channel partners to use, purchase or offer their products and services or to prevent or reduce sales of our products and services. The occurrence of any of these events could harm our business, operating results and financial condition.
Our sales cycles can be long and unpredictable and our sales efforts require considerable time and expense, making it difficult for us to predict future sales.
Our sales efforts involve educating our customers about the use and benefits of our products. Larger customers often undertake an evaluation process that can result in a lengthy sales cycle. We spend substantial time and resources on our sales efforts without any assurance that our efforts will produce any sales. In addition, product purchases are frequently subject to budget constraints, multiple approvals and unplanned administrative and other delays. A substantial portion of our quarterly sales typically occurs during the last several weeks of the quarter, which we believe largely reflects customer buying patterns of products similar to ours and other products in the technology industry generally. Since we do not recognize revenue from a sale until control is transferred and the performance obligations are satisfied, a substantial portion of our sales late in a quarter may negatively impact the recognition of the associated revenue. Furthermore, our products come with a 30-day money back guarantee, allowing a customer to return a product within 30 days of receipt if the customer is not satisfied with its purchase for any reason. These factors, among others, make it difficult for us to predict when customers will purchase our products, which may adversely affect our operating results and cause our operating results to fluctuate. In addition, if sales expected from a specific customer for a particular quarter are not realized in that quarter or at all, our operating results may suffer.
Our gross margins are impacted by a variety of factors and vary from period to period, making them difficult to predict with certainty.
Our gross margins fluctuate from period to period due primarily to product costs, customer mix and product mix. A variety of factors may cause our gross margins to fluctuate and make them difficult to predict, including:
|
•
|
demand for our products;
|
|
•
|
sales and marketing initiatives, discount levels, rebates and competitive pricing;
|
|
•
|
changes in customer, geographic or product mix, including mix of product configurations;
|
|
•
|
the cost of components, including NAND and DRAM flash, and freight;
|
|
•
|
new product introductions and enhancements, potentially with initial sales at relatively small volumes and higher product costs;
|
13
|
•
|
excess inventory levels or purchase obligations as a result of changes in demand forecasts or product transitions;
|
|
•
|
an increase in product returns, order rescheduling and cancellations;
|
|
•
|
the timing of technical support service contracts and contract renewals;
|
|
•
|
inventory stocking requirements to mitigate supply constraints, accommodate unforeseen demand or support new product introductions; and
|
|
•
|
product quality and serviceability issues.
|
If we are unable to manage these factors effectively, our gross margins may decline, and fluctuations in gross margins may make it difficult to manage our business and achieve or maintain profitability, which could materially harm our business, operating results and financial condition.
Our operating results may fluctuate significantly, which could make our future results difficult to predict and could cause our operating results to fall below expectations.
Our operating results may fluctuate due to a variety of factors, many of which are outside of our control. As a result, comparing our results on a period-to-period basis may not be meaningful.
Factors that are difficult to predict and that could cause our operating results to fluctuate include:
|
•
|
the timing and magnitude of orders, shipments and acceptance of our products in any quarter, including product returns, order rescheduling and cancellations by our customers;
|
|
•
|
fluctuations in demand and prices for our products;
|
|
•
|
seasonality in our business or the markets we serve;
|
|
•
|
our ability to control the costs of the components we use in our hardware products;
|
|
•
|
our ability to timely adopt subsequent generations of components into our hardware products;
|
|
•
|
disruption in our supply chains, component availability and related procurement costs;
|
|
•
|
reductions in customers’ budgets for IT purchases;
|
|
•
|
changes in industry standards in the data storage industry;
|
|
•
|
our ability to develop, introduce and ship in a timely manner new products and product enhancements that meet customer requirements;
|
|
•
|
our ability to effectively manage product transitions as we introduce new products;
|
|
•
|
any change in the competitive dynamics of our markets, including new entrants or discounting of product prices;
|
|
•
|
our ability to control costs, including our operating expenses; and
|
|
•
|
future accounting pronouncements and changes in accounting policies.
|
The occurrence of any one of these risks could negatively affect our operating results in any particular quarter.
Our company culture has contributed to our success, and if we cannot maintain this culture as we grow, we could lose the innovation, creativity and teamwork fostered by our culture, and our business may be harmed.
We believe that our company culture has been a critical contributor to our success. Our culture fosters innovation, creativity, teamwork, passion for customers and focus on execution, and facilitates critical knowledge transfer and knowledge sharing. In particular, we believe that the difference between our sales, support and engineering cultures, relative to those of incumbent vendors, is a key competitive advantage and differentiator for our customers and partners. As we grow and change, we may find it difficult to maintain these important aspects of our company culture, which could limit our ability to innovate and operate effectively. Any failure to preserve our culture could also negatively affect our ability to retain and recruit personnel, continue to perform at current levels or execute on our business strategy.
Our long-term success depends, in part, on sales outside of the United States, which is susceptible to risks associated with international operations.
14
We maintain operations outside of the United States, which we have been expanding and intend to continue to expand in the future. Conducting and expanding international operations subjects us to new risks that we do not generally face in the United States. These include:
|
•
|
exposure to foreign currency exchange rate risk;
|
|
•
|
difficulties in collecting payments internationally, and managing and staffing international operations;
|
|
•
|
establishing relationships with channel partners in international locations;
|
|
•
|
increased travel, infrastructure and legal compliance costs associated with international locations;
|
|
•
|
burdens of complying with a wide variety of laws associated with international operations, including taxes and customs;
|
|
•
|
significant fines, penalties and collateral consequences if we or our partners fail to comply with anti-bribery laws;
|
|
•
|
heightened risk of improper, unfair or corrupt business practices in certain geographies;
|
|
•
|
potentially adverse tax consequences, including repatriation of earnings;
|
|
•
|
increased financial accounting and reporting burdens and complexities;
|
|
•
|
political, social and economic instability abroad, terrorist attacks and security concerns in general; and
|
|
•
|
reduced or varied protection for intellectual property rights in some countries.
|
The occurrence of any one of these risks could negatively affect our international operations and, consequently, our business, operating results and financial condition generally.
The sales prices of our products and services may fluctuate or decline, which may reduce our gross profits, revenue growth, and adversely impact our financial results.
The sales prices of our products and services may fluctuate or decline for a variety of reasons, including competitive pricing pressures, discounts, cost of components, a change in our mix of products and services, and the introduction of competing products or services or promotional programs. Competition continues to increase in the markets in which we participate, and we expect competition to further increase in the future, thereby leading to increased pricing pressures. Larger competitors may reduce the price of products or services that compete with ours or may bundle them with other products and services. Additionally, although we price our products and services predominantly in U.S. dollars, currency fluctuations in certain countries and regions may negatively impact actual prices that partners and customers are willing to pay in those countries and regions. Furthermore, we anticipate that the prices for our products will decrease over product life cycles. If we are required to decrease our prices to be competitive and are not able to offset this decrease by increases in the volume of sales or the sales of new products with higher margins, our gross margins and operating results could be adversely affected
.
We derive the majority of our revenue from our FlashArray products, and a decline in demand for these products would cause our revenue to grow more slowly or to decline.
Our
FlashArray
products have historically accounted for the majority of our revenue and will continue to comprise a significant portion of our revenue for the foreseeable future. As a result, our revenue could be reduced by any decline or fluctuation in demand for our products, regardless of the reason. If the market for all-flash storage products grows slower than anticipated or if demand for our products slows or declines, we may not be able to increase our revenue or achieve and maintain profitability.
If we are unable to sell renewals of our support subscription services to our customers, our future revenue and operating results will be harmed.
Existing customers may not renew their support subscription agreements after the initial period, and given our limited operating history, we may not be able to accurately predict our renewal rates. Our customers’ renewal rates may decline or fluctuate as a result of a number of factors, including their available budget and the level of their satisfaction with our products, customer support and pricing compared to that offered by our competitors. If our customers renew their contracts, they may renew on terms that are less economically beneficial to us. If our customers do not renew their agreements or renew on less favorable terms, our revenue may grow more slowly than expected, if at all.
15
We expect that revenue from subscription agreements will increase as a percentage of total revenue over time, and because we recognize this revenue over the term of the relevant contract period, downturns or upturns in sales of support subscriptions are not immediately reflected in full in our results of operations.
We expect that our revenue from support subscription agreements will increase as a percentage of total revenue over time. We are also increasing the number of our subscription-based offerings, such as ES2 although it is more difficult to predict the rate at which customers will adopt, and the rate at which our revenue will grow from, these new offerings. We recognize support subscription revenue ratably over the term of the relevant service period. As a result, much of the subscription revenue we report each quarter is derived from agreements that we sold in prior quarters. Consequently, a decline in new or renewed subscription agreements in any one quarter will not be fully reflected in revenue in that quarter but will negatively affect our revenue in future quarters. Accordingly, the effect of significant downturns in sales of subscriptions is not reflected in full in our results of operations until future periods. It is also difficult for us to rapidly increase our subscription revenue through additional sales in any period, as revenue from renewals must be recognized ratably over the applicable service period.
Our products are highly technical and may contain defects, which could cause data unavailability, loss or corruption that might, in turn, result in liability and harm to our reputation and business.
Our products are highly technical and complex and are often used to store information critical to our customers’ business operations. Our products may contain errors, defects or security vulnerabilities that could result in data unavailability, loss, corruption or other harm to our customers. Some errors in our products may only be discovered after they have been installed and used by customers. Any errors, defects or security vulnerabilities in our products could result in a loss of revenue, injury to our reputation, loss of customers or increased service and warranty costs, any of which could adversely affect our business and operating results. In addition, errors or failures in the products of third-party technology vendors may be attributed to us and may harm our reputation.
We could face claims for product liability, tort or breach of warranty. Many of our contracts with customers contain provisions relating to warranty disclaimers and liability limitations, which may be difficult to enforce. Defending a lawsuit, regardless of its merit, would be costly and might divert management’s attention and adversely affect the market’s perception of us and our products. Our business liability insurance coverage could prove inadequate with respect to a claim and future coverage may be unavailable on acceptable terms or at all. These product-related issues could result in claims against us, and our business, operating results and financial condition could be harmed.
Our brand name and our business may be harmed by the marketing strategies of our competitors.
Because of the early stage of our business, we believe that building and maintaining brand recognition and customer goodwill is critical to our success. Our efforts in this area have, on occasion, been hampered by the marketing efforts of our competitors, which have included negative or misleading statements about us and our products. If we are unable to effectively respond to the marketing efforts of our competitors and protect our brand and customer goodwill now or in the future, our business will be adversely affected.
Our products must interoperate with third party operating systems, software applications and hardware, and if we are unable to ensure that our products interoperate with third party software and hardware, we may lose or fail to increase our market share and may experience reduced demand for our products.
Our products must interoperate with our customers’ infrastructure, specifically networks, servers, software and operating systems, which are offered by a wide variety of vendors. When new or updated versions of these operating systems or applications are introduced, we must sometimes develop updated versions of our software so that our products interoperate properly. For example, our
Pure1
cloud-based management and support includes connectors to virtualization platforms, allowing our customers to manage our products within native management tools, such as VMware and OpenStack. We may not deliver or maintain interoperability quickly, cost-effectively or at all. These efforts require capital investment and engineering resources. If we fail to maintain compatibility of our products with these infrastructure components, our customers may not be able to fully utilize our products, and we may, among other consequences, lose or fail to increase our market share and experience reduced demand for our products, which may harm our business, operating results and financial condition.
Our products must conform to industry standards in order to be accepted by customers in our markets.
16
Generally, our products comprise only a part of a data center. The servers, network, software and other components and systems of a data center must comply with established industry standards in order to interoperate and function efficiently together. We depend on companies that provide other systems in a data center to conform to prevailing industry standards. These companies are often significantly larger and more influential in driving industry standards than we are. Some industry standards may not be widely adopted or implemented uniformly, and competing standards may emerge that may be preferred by our customers. If larger companies do not conform to the same industry standards that we do, or if competing standards emerge, sales of our products could be adversely affected, which may harm our business.
Our ability to successfully market and sell our products is dependent in part on ease of use and the quality of our support offerings, and any failure to offer high-quality installation and technical support could harm our business.
Once our products are deployed by our customers, customers depend on our support organization to resolve technical issues relating to our products. Our ability to provide effective support is largely dependent on our ability to attract, train and retain qualified personnel, as well as to engage with qualified support partners that provide a similar level of customer support. In addition, our sales process is highly dependent on our product and business reputation and on recommendations from our existing customers. Although our products are designed to be interoperable with existing servers and systems, we may need to provide customized installation and configuration support to our customers before our products become fully operational in their environments. Any failure to maintain, or a market perception that we do not maintain, high-quality installation and technical support could harm our reputation, our ability to sell our products to existing and prospective customers and our business.
We rely on contract manufacturers to manufacture our products, and if we fail to manage our relationships with our contract manufacturers successfully, our business could be negatively impacted.
We rely on a limited number of contract manufacturers to manufacture our products. Our reliance on contract manufacturers reduces our control over the assembly process, and exposes us to risks, such as reduced control over quality assurance, costs and product supply. If we fail to manage our relationships with these contract manufacturers effectively, or if these contract manufacturers experience delays, disruptions, capacity constraints or quality control problems, our ability to timely ship products to our customers could be impaired, potentially on short notice, and our competitive position, reputation and financial results could be harmed. If we are required, for whatever reason, to change contract manufacturers or assume internal manufacturing operations, we may lose revenue, incur increased costs and damage our customer relationships. Qualifying a new contract manufacturer and commencing production is expensive and time-consuming. We may need to increase our component purchases, contract manufacturing capacity and internal test and quality functions if we experience increased demand. The inability of our contract manufacturers to provide us with adequate supplies of high-quality products could cause a delay in our order fulfillment, and our business, operating results and financial condition may be harmed.
We rely on a limited number of suppliers, and in some cases single-source suppliers, and any disruption or termination of our supply arrangements could delay shipments of our products and could harm our relationships with current and prospective customers.
We rely on a limited number of suppliers, and in some cases, on single-source suppliers, for several key components of our products, and we have not generally entered into agreements for the long-term purchase of these components. For example, the CPUs utilized in our products are supplied by Intel Corporation (Intel), and neither we nor our contract manufacturers have an agreement with Intel for the procurement of these CPUs. Instead, we purchase the CPUs either directly from Intel or through a reseller on a purchase order basis. Intel or its resellers could stop selling to us at any time or could raise their prices without notice.
This reliance on a limited number of suppliers and the lack of any guaranteed sources of supply exposes us to several risks, including:
|
•
|
the inability to obtain an adequate supply of key components, including solid-state drives;
|
|
•
|
price volatility for the components of our products;
|
|
•
|
failure of a supplier to meet our quality or production requirements;
|
|
•
|
failure of a supplier of key components to remain in business or adjust to market conditions; and
|
|
•
|
consolidation among suppliers, resulting in some suppliers exiting the industry or discontinuing the manufacture of components.
|
17
Further, some of the components in our products are sourced from component suppliers outside the United States. The portion of our products that are sourced outside the United States may subject us to additional logistical risks or risks associated with complying with local rules and regulations in foreign countries. Significant changes to existing international trade agreements could lead to sourcing or logistics disruption resulting from import delays or the imposition of increased tariffs on our sourcing partners. For example, there have been discussions regarding potential significant changes to U.S. trade policies, legislation, treaties and tariffs, and the United States and Chinese governments have announced import tariffs by both countries. If any new legislation and/or regulations are implemented, or if existing trade agreements are renegotiated or terminated, or if tariffs are imposed on foreign-sourced or U.S. goods, it may be inefficient and expensive for us to alter our business operations in order to adapt to or comply with such changes. Such operational changes could have a material adverse effect on our business, financial condition, results of operations or cash flows.
As a result of these risks, we cannot assure investors that we will be able to obtain enough of these key components in the future or that the cost of these components will not increase. If our supply of components is disrupted or delayed, or if we need to replace our existing suppliers, there can be no assurance that additional components will be available when required or that components will be available on terms that are favorable to us, which could extend our lead times, increase the costs of our components and harm our business, operating results and financial condition. We may not be able to continue to procure components at reasonable prices, which may require us to enter into longer-term contracts with component suppliers to obtain components at competitive prices. Any of the foregoing disruptions could increase our costs and decrease our gross margins, harming our business, operating results and financial condition.
Managing the supply of our products and their components is complex. Insufficient supply and inventory may result in lost sales opportunities or delayed revenue, while excess inventory may harm our gross margins.
Our third-party contract manufacturers procure components and build our products based on our forecasts, and we generally do not hold inventory for a prolonged period of time. These forecasts are based on estimates of future demand for our products, which are in turn based on historical trends and analyses from our sales and marketing organizations, adjusted for overall market conditions. In order to reduce manufacturing lead times and plan for adequate component supply, from time to time we may issue orders for components and products that are non-cancelable and non-returnable. Our inventory management systems and related supply chain visibility tools may be inadequate to enable us to make accurate forecasts and effectively manage the supply of our products and components. We have, in the past, had to write off inventory in connection with transitions to new product models. If we ultimately determine that we have excess supply, we may have to reduce our prices and write down or write off excess or obsolete inventory, which in turn could result in lower gross margins. Alternatively, insufficient supply levels may lead to shortages that result in delayed revenue, reduced product margins or loss of sales opportunities altogether. If we are unable to effectively manage our supply and inventory, our results of operations could be adversely affected.
Adverse economic conditions may harm our revenues and profitability.
Our operations and performance depend in part on worldwide economic conditions and the economic health of our current and prospective customers. Global economic uncertainty and political and fiscal challenges in the United States and abroad can arise suddenly and affect the rate of information technology spending and could adversely affect our customers' ability or willingness to purchase our products and services. For example, in 2019, the growth rate in the economy of the European Union, China, or the United States, trade relations between the United States and China, political uncertainty in the Middle East and other geopolitical events could directly or indirectly affect our business. Additionally, the United Kingdom's exit from the European Union remains subject to the successful conclusion of a final withdrawal agreement between the parties. In the absence of such an agreement, there would be no transitional provisions and a "hard" exit by Great Britain from the European Union could lead to adverse global economic consequences. Weak economic conditions would likely adversely impact our business, operating results and financial condition in a number of ways, including by reducing sales, lengthening sales cycles and lowering prices of our products and services.
Third-party claims that we infringe their intellectual property rights could be costly and harm our business.
There is a substantial amount of intellectual property litigation in the flash-based storage industry, and we may become party to, or threatened with, litigation or other adversarial proceedings regarding intellectual property rights with respect to our technology. Third parties may assert infringement claims against us based on existing or future intellectual property rights. The outcome of intellectual property litigation is subject to uncertainties that cannot be
18
adequately quantified in advance. We have been, and may in the future be, subject to claims that we infringe upon the intellectual property rights of other intellectual property holders, particularly as we grow and face increasing competition.
Any intellectual property rights claim against us or our customers, suppliers, and channel partners, with or without merit, could be time-consuming and expensive to litigate or settle, could divert management’s resources and attention from operating our business and could force us to acquire intellectual property rights and licenses, which may involve substantial royalty payments. Further, a party making such a claim, if successful, could secure a judgment that requires us to pay substantial damages, including treble damages and attorneys’ fees if we are found to have willfully infringed a patent. An adverse determination also could invalidate our intellectual property rights and prevent us from manufacturing and selling our products and may require that we procure or develop substitute products that do not infringe, which could require significant effort and expense. We may not be able to re-engineer our products successfully to avoid infringement, and we may have to seek a license for the infringed technology, which may not be available on reasonable terms or at all, may significantly increase our operating expenses or may require us to restrict our business activities in one or more respects. Even if we were able to obtain a license, it could be non-exclusive, thereby giving our competitors access to the same technologies licensed to us. Claims that we have misappropriated the confidential information or trade secrets of third parties could have a similar negative impact on our business. Any of these events could harm our business and financial condition.
We currently have a number of agreements in effect pursuant to which we have agreed to defend, indemnify and hold harmless our customers, suppliers and channel partners from damages and costs which may arise from the infringement by our products of third-party patents, trademarks or other proprietary rights. The scope of these indemnity obligations varies, but may, in some instances, include indemnification for damages and expenses, including attorneys’ fees. Our insurance may not cover intellectual property infringement claims. A claim that our products infringe a third party’s intellectual property rights could harm our relationships with our customers, deter future customers from purchasing our products and expose us to costly litigation and settlement expenses. Even if we are not a party to any litigation between a customer and a third party relating to infringement by our products, an adverse outcome in any such litigation could make it more difficult for us to defend our products against intellectual property infringement claims in any subsequent litigation in which we are a named party. Any of these results could harm our brand and financial condition.
The success of our business depends in part on our ability to protect and enforce our intellectual property rights.
We rely on a combination of patent, copyright, service mark, trademark and trade secret laws, as well as confidentiality procedures and contractual restrictions, to establish and protect our proprietary rights, all of which provide only limited protection. We have over 800 issued patents and patent applications in the United States and foreign countries. We cannot assure investors that future patents issued to us, if any, will give us the protection that we seek, if at all, or that any patents issued to us will not be challenged, invalidated, circumvented or held to be unenforceable. Our issued patents and any patents that may issue in the future may not provide sufficiently broad protection or may not be enforceable. Changes to the patent laws in the United States and other jurisdictions could also diminish the value of our patents and patent applications or narrow the scope of our patent protection. We cannot be certain that the steps we have taken will prevent unauthorized use of our technology or the reverse engineering of our technology. Moreover, others may independently develop technologies competitive to ours or infringe our intellectual property. Furthermore, any of our trademarks may be challenged by others or invalidated through administrative process or litigation.
Protecting against the unauthorized use of our intellectual property, products and other proprietary rights is expensive and difficult. Litigation may be necessary in the future to enforce or defend our intellectual property rights or to determine the validity and scope of the proprietary rights of others. Any such litigation could result in substantial costs and diversion of management’s resources and attention, either of which could harm our business, operating results and financial condition. Further, many of our current and potential competitors have the ability to dedicate substantially greater resources than us to defend intellectual property infringement claims and enforce their intellectual property rights. Accordingly, we may not be able to prevent third parties from infringing upon or misappropriating our intellectual property. Effective patent, trademark, service mark, copyright and trade secret protection may not be available in every country in which our products are available. An inability to adequately protect and enforce our intellectual property and other proprietary rights could harm our business and financial condition.
Our use of open source software could impose limitations on our ability to commercialize our products.
19
We use open source software in our products and expect to continue to use open source software in the future. Although we monitor our use of open source software, the terms of many open source licenses have not been interpreted by U.S. or foreign courts, and there is a risk that such licenses could be construed in a manner that imposes unanticipated conditions or restrictions on our ability to market our products. From time to time, we may face claims from third parties claiming ownership of, or demanding release of, the open source software or derivative works that we have developed using such software, which could include our proprietary source code, or otherwise seeking to enforce the terms of the applicable open source license. These claims could result in litigation and could require us to make our software source code freely available, seek licenses from third parties in order to continue offering our products for certain uses or cease offering the implicated solutions unless and until we can re-engineer them to avoid infringement. This re-engineering process could require significant additional research and development resources, and we may be required to discontinue providing some of our software in the event re-engineering cannot be accomplished on a timely basis, any of which could harm our business, operating results and financial condition.
If we suffer a cybersecurity or other security breach, we may lose customers and incur significant liabilities.
In the ordinary course of business, we store sensitive data on our internal systems, networks and servers, which may include intellectual property, our proprietary business information and that of our customers, suppliers and business partners and sales data, which may include personally identifiable information. Additionally, we design and sell products that allow our customers to store our customers’ data. The security of our own networks and the intrusion protection features of our products are both critical to our operations and business strategy.
We devote significant resources to network security, data encryption and other security measures to protect our systems and data, but these security measures cannot provide absolute security. For example, we use encryption and authentication technologies to secure the transmission and storage of data and prevent third party access to data or accounts, but these security measures are subject to third party security breaches, employee error, malfeasance, faulty password management or other irregularities. Any destructive or intrusive breach of our internal systems could result in the information stored on our networks being accessed, publicly disclosed, lost or stolen. Additionally, an effective attack on our products could disrupt the proper functioning of our products, allow unauthorized access to sensitive, proprietary or confidential information of ours or our customers, disrupt or temporarily interrupt customers’ operations or cause other destructive outcomes, including the theft of information sufficient to engage in fraudulent transactions. The risk that these types of events could seriously harm our business is likely to increase as we expand our network of channel partners, resellers and authorized service providers and operate in more countries. The economic costs to us to eliminate or alleviate cyber or other security problems, viruses, worms, malicious software systems and security vulnerabilities could be significant and may be difficult to anticipate or measure because the damage may differ based on the identity and motive of the programmer or hacker, which are often difficult to identify. If any of these types of security breaches, actual or perceived, were to occur and we were to be unable to protect sensitive data, our relationships with our business partners and customers could be materially damaged, our reputation and brand could be materially harmed, use of our products could decrease and we could be exposed to a risk of loss or litigation and possible liability.
We may acquire other businesses which could require significant management attention, disrupt our business, dilute stockholder value, and adversely affect our operating results.
We may, from time to time, acquire complementary products, technologies or businesses. For example, in August 2018, we acquired StorReduce, Inc. We also may enter into relationships with other businesses in order to expand our product offerings, which could involve preferred or exclusive licenses, additional channels of distribution or discount pricing or investments in other companies. Negotiating these transactions can be time-consuming, difficult and expensive, and our ability to close these transactions may be subject to third-party or government approvals, which are beyond our control. Consequently, we can make no assurance that these transactions, once undertaken and announced, will close.
These kinds of acquisitions or investments may result in unforeseen operating difficulties and expenditures. In particular, we may encounter difficulties assimilating or integrating the businesses, technologies, products, personnel or operations of acquired companies, particularly if the key personnel of the acquired business choose not to work for us, and we may have difficulty retaining the customers of any acquired business. Acquisitions may also disrupt our ongoing business, divert our resources and require significant management attention that would otherwise be available for development of our business. Any acquisition or investment could expose us to unknown liabilities. Moreover, we cannot assure investors that the anticipated benefits of any acquisition or investment will be realized. In connection with these types of transactions, we may issue additional equity securities that would dilute our stockholders, use cash that we may need in the future to operate our business, incur debt on terms unfavorable to us or that we are unable to repay, incur large charges or substantial liabilities, encounter difficulties integrating diverse business cultures and
20
become subject to adverse tax consequences, substantial depreciation or deferred compensation charges. These challenges related to acquisitions or investments could harm our business and financial condition.
We may require additional capital to support business growth, and this capital might not be available on acceptable terms, or at all.
We intend to continue to make investments to support our business growth and may require additional funds to respond to business challenges, including the need to develop new products or enhance our existing products, enhance our operating infrastructure and acquire complementary businesses and technologies. Accordingly, we may need to engage in equity or debt financings to secure additional funds. If we raise additional funds through further issuances of equity or convertible debt securities, our stockholders could suffer significant dilution, and any new equity securities we issue could have rights, preferences and privileges superior to those of holders of our common stock. Any debt financing in the future could involve additional restrictive covenants relating to our capital raising activities and other financial and operational matters, which may make it more difficult for us to obtain additional capital and to pursue business opportunities, including potential acquisitions. We may not be able to obtain additional financing on terms favorable to us, if at all. If we are unable to obtain adequate financing or financing on terms satisfactory to us, when we require it, our ability to support our business growth and to respond to business challenges could be significantly limited and our prospects and financial condition could be harmed.
We are exposed to the credit risk of some of our customers, which could harm our business, operating results and financial condition.
Most of our sales are made on an open credit basis. We monitor individual customer payment capability when we grant open credit arrangements and may limit these open credit arrangements based on perceived creditworthiness. We also maintain allowances we believe are adequate to cover exposure for doubtful accounts. Although we have programs in place that are designed to monitor and mitigate these risks, we cannot assure investors these programs will be effective in managing our credit risks, especially as we expand our business internationally. If we are unable to adequately control these risks, our business, operating results and financial condition could be harmed.
Sales to U.S. federal, state and local governments are subject to a number of challenges and risks that may adversely impact our business.
Sales to U.S. federal, state and local governmental agencies may in the future account for a significant portion of our revenue.
|
•
|
Selling to governmental agencies can be highly competitive, expensive and time consuming, often requiring significant upfront time and expense without any assurance that such efforts will generate a sale;
|
|
•
|
Government certification requirements applicable to our products may change and in doing so restrict our ability to sell into the U.S. federal government sector until we have attained the revised certification;
|
|
•
|
Government demand and payment for our products and services may be impacted by public sector budgetary cycles and funding authorizations, including in connection with an extended federal government shutdown, with funding reductions or delays adversely affecting public sector demand for our products and services;
|
|
•
|
We sell our products to governmental agencies through our channel partners, and these agencies may have statutory, contractual or other legal rights to terminate contracts with our distributors and resellers for convenience or due to a default, and any such termination may adversely impact our future results of operations; and
|
|
•
|
Governments routinely investigate and audit government contractors’ administrative processes, and any unfavorable audit could result in the government refusing to continue buying our products, which would adversely impact our revenue and results of operations, or institute fines or civil or criminal liability if the audit uncovers improper or illegal activities.
|
Finally, governments may require certain products to be manufactured in the United States and other relatively high-cost manufacturing locations, and we may not manufacture all products in locations that meet these requirements, affecting our ability to sell these products to governmental agencies.
21
We need to maintain effective internal control over financial reporting in accordance with Section 404 of the Sarbanes-Oxley Act, and the failure to do so could have a material adverse effect on our business and stock price.
The Sarbanes-Oxley Act requires, among other things, that we maintain effective internal control over financial reporting and disclosure controls and procedures. We are required to perform system and process evaluation and testing of our internal control over financial reporting to allow management to report on the effectiveness of our internal control over financial reporting, as required by Section 404 of the Sarbanes-Oxley Act, (Section 404). Our independent registered public accounting firm also needs to attest to the effectiveness of our internal control over financial reporting. We continue to take steps to develop our finance and accounting function, such as hiring additional personnel and implementing additional tools and improvements to policies and procedures. Our compliance with Section 404 may require us to continue to incur substantial expense and expend significant management efforts. If we are unable to comply with the requirements of Section 404 in a timely manner, or if we or our independent registered public accounting firm notes or identifies deficiencies in our internal control over financial reporting that are deemed to be material weaknesses, the price of our Class A common stock could decline and we could be subject to sanctions or investigations by the SEC, or other regulatory authorities, which would require additional financial and management resources.
Our international operations, as well as U.S. tax reform, could expose us to potentially adverse tax consequences.
The Tax Cuts and Jobs Act (the Tax Act) was signed into law on December 22, 2017. The new legislation decreased the U.S. corporate federal income tax rate from 35% to 21% effective January 1, 2018. The Tax Act also includes a number of other provisions including the elimination of loss carrybacks and limitations on the use of future losses, limitations on the deductibility of executive compensation, limitation or modification on the deductibility of certain business expenses, the transition of U.S. international taxation from a worldwide tax system to a territorial system, and the introduction of a base erosion and anti-abuse tax. Regulations have been issued to provide interpretive guidance on certain provisions of the Tax Act, but there are still uncertainties as regulations have not been issued for all provisions, and certain proposed regulations have not been finalized. The issuance of additional proposed and final regulations could have a material adverse effect on our cash tax liabilities, results of operations, and financial condition.
We generally conduct our international operations through wholly-owned subsidiaries and report our taxable income in various jurisdictions worldwide based upon our business operations in those jurisdictions. Given the passage of the Tax Act and other global tax developments, we continue to evaluate our corporate structure and intercompany relationships. Future changes to U.S. and global tax laws may adversely impact our effective tax rate.
Our intercompany relationships are, and after the implementation of any changes to our corporate structure will continue to be, subject to complex transfer pricing regulations administered by taxing authorities in various jurisdictions. The relevant taxing authorities may disagree with our determinations as to the income and expenses attributable to specific jurisdictions. If such a disagreement were to occur, and our position were not sustained, we could be required to pay additional taxes, interest and penalties, which could result in tax charges, higher effective tax rates, reduced cash flows and lower overall profitability of our operations.
Failure to comply with governmental laws and regulations could harm our business.
Our business is subject to regulation by various federal, state, local and foreign governmental agencies, including agencies responsible for monitoring and enforcing employment and labor laws, workplace safety, product safety, environmental laws, consumer protection laws, anti-bribery laws, import/export controls, federal securities laws and tax laws and regulations. In certain jurisdictions, these regulatory requirements may be more stringent than in the United States. For example, the European Union has adopted certain directives to facilitate the recycling of electrical and electronic equipment sold in the European Union, including the Restriction on the Use of Certain Hazardous Substances in Electrical and Electronic Equipment directive and the Waste Electrical and Electronic Equipment directive.
Changes in applicable laws, regulations and standards could harm our business, operating results and financial condition.
For example, we have been subject to the EU General Data Protection Regulation, or GDPR, since May 2018. The GDPR may requires us to make further change our policies and procedures in the future beyond what we have already done. Our business could be impacted, to some extent, by the United Kingdom's exit from the European Union and related changes in law and regulation. We made changes to our data protection compliance program to prepare for the GDPR and will continue to monitor the implementation and evolution of global data protection regulations, but if we are not compliant with GDPR requirements, we may be subject to significant fines and our business may be harmed. In addition, the California Consumer Privacy Act places additional requirements on the handling of personal
22
data. The potential effects of this legislation are far-reaching and may require us to modify our data processing practices and policies and to incur substantial costs and expenses. Customers may choose to implement technological solutions to comply with such regulations that impact the performance and competitiveness of our products and solutions.
Noncompliance with applicable regulations or requirements could subject us to investigations, sanctions, mandatory product recalls, enforcement actions, disgorgement of profits, fines, damages, civil and criminal penalties or injunctions. If any governmental sanctions are imposed, or if we do not prevail in any possible civil or criminal litigation, our business, operating results and financial condition could be harmed. Even the perception of privacy concerns, whether or not valid, may harm our reputation and inhibit competitiveness and adoption of our products by current and future customers. In addition, responding to any action will likely result in a significant diversion of management’s attention and resources and an increase in professional fees. Enforcement actions and sanctions could harm our business, operating results and financial condition.
Governmental regulations affecting the import or export of products could negatively affect our revenue.
The U.S. and various foreign governments have imposed controls, export license requirements and restrictions on the import or export of some technologies, especially encryption technology. From time to time, governmental agencies have proposed additional regulation of encryption technology, such as requiring the escrow of imports or exports. If we fail to obtain required import or export approval for our products, our international and domestic sales could be harmed and our revenue may be adversely affected. In many cases, we rely on vendors and channel partners to handle logistics associated with the import and export of our products, so our visibility and control over these matters may be limited. In addition, failure to comply with such regulations could result in penalties, costs and restrictions on export privileges, which could harm our business, operating results and financial condition.
Our business is subject to the risks of earthquakes, fires, floods and other natural catastrophic events, and to interruption by man-made factors such as computer viruses or terrorism.
We and our suppliers have operations in locations, including our headquarters in California, that are subject to earthquakes, fires, floods and other natural catastrophic events, such as severe weather and geological events, which could disrupt our operations or the operations of our customers and suppliers. Our customers affected by a natural disaster could postpone or cancel orders of our products, which could negatively impact our business. Moreover, should any of our key suppliers fail to deliver components to us as a result of a natural disaster, we may be unable to purchase these components in necessary quantities or may be forced to purchase components in the open market at significantly higher costs. We may also be forced to purchase components in advance of our normal supply chain demand to avoid potential market shortages. Our business interruption insurance may be insufficient to compensate us for losses due to a significant natural disaster or due to man-made factors. Any natural catastrophic events may also prevent our employees from being able to reach our offices in any jurisdiction around the world, and therefore impede our ability to conduct business as usual.
In addition, acts of terrorism or malicious computer viruses could cause disruptions in our or our customers’ businesses or the economy as a whole. To the extent that these disruptions result in delays or cancellations of customer orders or the deployment of our products, our business, operating results and financial condition could be harmed.
Risks Related to Our Notes
We may not have the ability to raise the funds necessary to settle conversions of the Notes or to repurchase the Notes upon a fundamental change, and our future debt may contain limitations on our ability to pay cash upon conversion or repurchase of the Notes.
Holders of the Notes will have the right to require us to repurchase all or a portion of their Notes upon the occurrence of a fundamental change at a repurchase price equal to 100% of the principal amount of the Notes to be repurchased, plus accrued and unpaid special interest, if any, to, but excluding, the fundamental change repurchase date. In addition, if a make-whole fundamental change (as defined in the indenture for the Notes) occurs prior to the maturity date of the Notes, we will in some cases be required to increase the conversion rate for a holder that elects to convert its Notes in connection with such make-whole fundamental change. Upon a conversion of the Notes, unless we elect to deliver solely shares of our Class A common stock to settle such conversion (other than paying cash in lieu of delivering any fractional share), we will be required to make cash payments in respect of the Notes being converted. However, we may not have enough available cash or be able to obtain financing at the time we are required to make repurchases of Notes surrendered therefor or pay cash with respect to Notes being converted.
23
In addition, our ability to repurchase or to pay cash upon conversion of the Notes may be limited by law, regulatory authority or agreements governing our future indebtedness. Our failure to repurchase the Notes at a time when the repurchase is required by the indenture governing the Notes or to pay cash upon conversion of the Notes as required by the indenture would constitute a default under the indenture. A default under the indenture or the fundamental change itself could also lead to a default under agreements governing our future indebtedness. If the payment of the related indebtedness were to be accelerated after any applicable notice or grace periods, we may not have sufficient funds to repay the indebtedness and repurchase the Notes or to pay cash upon conversion of the Notes.
Servicing our debt will require a significant amount of cash, and we may not have sufficient cash flow from our business to pay our substantial debt.
Our ability to make scheduled payments of the principal of, to pay interest on or to refinance our indebtedness, including the amounts payable under the Notes, depends on our future performance, which is subject to economic, financial, competitive and other factors beyond our control. Our business may not continue to generate cash flow from operations in the future sufficient to service our debt and make necessary capital expenditures. If we are unable to generate such cash flow, we may be required to adopt one or more alternatives, such as selling assets, restructuring debt or obtaining additional equity capital on terms that may be onerous or highly dilutive. Our ability to refinance our indebtedness will depend on the capital markets and our financial condition at such time. We may not be able to engage in any of these activities or engage in these activities on desirable terms, which could result in a default on our debt obligations.
We may still incur substantially more debt or take other actions that would diminish our ability to make payments on the Notes when due.
We and our subsidiaries may incur substantial additional debt in the future, subject to the restrictions contained in our future debt instruments, some of which may be secured debt. We are not restricted under the terms of the indenture governing the Notes from incurring additional debt, securing existing or future debt, recapitalizing our debt or taking a number of other actions that could have the effect of diminishing our ability to make payments on the Notes when due. Furthermore, the indenture prohibits us from engaging in certain mergers or acquisitions unless, among other things, the surviving entity assumes our obligations under the Notes and the indenture. These and other provisions in the indenture could deter or prevent a third party from acquiring us even when the acquisition may be favorable to holders of the Notes.
The conditional conversion feature of the Notes, if triggered, may adversely affect our financial condition and operating results.
In the event the conditional conversion feature of the Notes is triggered, holders of the Notes will be entitled to convert the Notes at any time during specified periods at their option. If one or more holders elect to convert their Notes, unless we elect to satisfy our conversion obligation by delivering solely shares of our common stock (other than by paying cash in lieu of delivering any fractional share), we may settle all or a portion of our conversion obligation in cash, which could adversely affect our liquidity. In addition, even if holders do not elect to convert their Notes, we could be required under applicable accounting rules to reclassify all or a portion of the outstanding principal of the Notes as a current rather than long-term liability, which would result in a material reduction of our net working capital.
If we are unable to use the treasury stock method in accounting for the shares issuable upon conversion of the Notes, then our diluted earnings per share would be adversely affected.
Under certain circumstances, convertible debt instruments (such as the Notes) that may be settled entirely or partly in cash are currently accounted for utilizing the treasury stock method, the effect of which is that the shares issuable upon conversion of the Notes are not included in the calculation of diluted earnings per share except to the extent that the conversion value of the Notes exceeds their principal amount. Under the treasury stock method, for diluted earnings per share purposes, the transaction is accounted for as if the number of shares of common stock that would be necessary to settle such excess, if we elected to settle such excess in shares, are issued. We cannot be sure that the accounting standards in the future will continue to permit the use of the treasury stock method. If we are unable to use the treasury stock method in accounting for the shares issuable upon conversion of the Notes, then our diluted earnings per share would be adversely affected.
The capped call transactions may affect the value of the Notes and our common stock.
24
In connection with the Notes, we entered into capped call transactions with certain financial institutions (the option counterparties). The capped call transactions are expected generally to reduce the potential dilution upon any conversion of the Notes and/or offset any cash payments we are required to make in excess of the principal amount upon conversion of the Notes, with such reduction and/or offset subject to a cap.
In connection with establishing their initial hedges of the capped call transactions, the option counterparties and/or their respective affiliates purchased shares of our Class A common stock and/or entered into various derivative transactions with respect to our Class A common stock. This activity could have increased (or reduced the size of any decrease in) the market price of our Class A common stock or the Notes at that time.
In addition, the option counterparties and/or their respective affiliates may modify their hedge positions by entering into or unwinding various derivatives with respect to our Class A common stock and/or purchasing or selling our Class A common stock in secondary market transactions (and are likely to do so during any observation period related to a conversion of notes or following any repurchase of notes by us on any fundamental change repurchase date or otherwise). This activity could also cause or avoid an increase or a decrease in the price of our Class A common stock or the Notes.
The potential effect, if any, of these transactions and activities on the price of our Class A common stock or the Notes will depend in part on market conditions and cannot be ascertained at this time. Any of these activities could adversely affect the value of our Class A common stock.
Risks Related to Our Common Stock
The trading price of our Class A common stock has been and may continue to be highly volatile, and an active, liquid, and orderly market for our Class A common stock may not be sustained.
The trading price of our Class A common stock has been, and will likely continue to be, highly volatile. Since shares of our Class A common stock were sold in our initial public offering in October 2015 at a price of
$17.00
per share, our closing stock price has ranged from
$9.40
to
$28.66
, through
March 1, 2019
. Some of the factors, many of which are beyond our control, affecting our volatility may include:
|
•
|
price and volume fluctuations in the overall stock market from time to time;
|
|
•
|
significant volatility in the market price and trading volume of technology companies in general and of companies in our industry;
|
|
•
|
actual or anticipated changes in our results of operations or fluctuations in our operating results;
|
|
•
|
whether our operating results meet the expectations of securities analysts or investors;
|
|
•
|
issuance or new or updated research or reports by securities analysts, including the publication of unfavorable reports or change in recommendation or downgrading of our Class A common stock
;
|
|
•
|
actual or anticipated developments in our competitors’ businesses or the competitive landscape generally;
|
|
•
|
litigation involving us, our industry or both;
|
|
•
|
general economic conditions and trends;
|
|
•
|
major catastrophic events;
|
|
•
|
sales of large blocks of our stock; or
|
|
•
|
departures of key personnel.
|
In several recent situations where the price of a stock has been volatile, holders of that stock have instituted securities class action litigation against the company that issued the stock. If any of our stockholders were to bring a lawsuit against us, the defense and disposition of the lawsuit could be costly and divert the time and attention of our management and harm our business, operating results and financial condition.
If securities analysts do not publish research or reports about our business, or if they downgrade our stock, the price of our stock could decline.
25
The trading market for our Class A common stock will likely be influenced by research and reports that securities or industry analysts publish about us or our business. In the event securities or industry analysts cover our company and one or more of these analysts downgrades our stock, lowers their price target, or publishes unfavorable or inaccurate research about our business, our stock price would likely decline. If one or more of these analysts ceases coverage of our company or fails to publish reports on us regularly, demand for our stock could decrease, which could cause our stock price and trading volume to decline.
We have never paid dividends on our common stock and we do not anticipate paying any cash dividends in the foreseeable future.
We have never declared or paid any dividends on our common stock. We intend to retain any earnings to finance the operation and expansion of our business, and we do not anticipate paying any cash dividends in the future. As a result, investors may only receive a return on their investment in our Class A common stock if the market price of our common stock increases.
Provisions in our amended and restated certificate of incorporation and amended and restated bylaws and under Delaware law might discourage, delay or prevent a change of control of our company or changes in our management and, therefore, depress the price of our Class A common stock.
Our amended and restated certificate of incorporation and amended and restated bylaws contain provisions that could depress the trading price of our Class A common stock by acting to discourage, delay or prevent a change of control of our company or changes in our management that the stockholders of our company may deem advantageous. These provisions:
|
•
|
establish a classified board of directors so that not all members of our board of directors are elected at one time;
|
|
•
|
authorize the issuance of “blank check” preferred stock that our board of directors could issue to increase the number of outstanding shares to discourage a takeover attempt;
|
|
•
|
prohibit stockholder action by written consent, which requires all stockholder actions to be taken at a meeting of our stockholders;
|
|
•
|
prohibit stockholders from calling a special meeting of our stockholders;
|
|
•
|
provide that the board of directors is expressly authorized to make, alter or repeal our bylaws; and
|
|
•
|
establish advance notice requirements for nominations for elections to our board of directors or for proposing matters that can be acted upon by stockholders at stockholder meetings.
|
Additionally, we are subject to Section 203 of the Delaware General Corporation Law, which generally prohibits a Delaware corporation from engaging in any of a broad range of business combinations with any “interested” stockholder for a period of three years following the date on which the stockholder became an “interested” stockholder and which may discourage, delay, or prevent a change of control of our company.
Any provision of our amended and restated certificate of incorporation, bylaws or Delaware law that has the effect of delaying or deterring a change in control could limit the opportunity for our stockholders to receive a premium for their shares of our common stock, and could also affect the price that some investors are willing to pay for our Class A common stock.
Our amended and restated certificate of incorporation provides that the Court of Chancery of the State of Delaware will be the exclusive forum for substantially all disputes between us and our stockholders, which could limit our stockholders’ ability to obtain a favorable judicial forum for disputes with us or our directors, officers or employees.
Our amended and restated certificate of incorporation provides that the Court of Chancery of the State of Delaware is the exclusive forum for any derivative action or proceeding brought on our behalf; any action asserting a breach of fiduciary duty; any action asserting a claim against us arising pursuant to the Delaware General Corporation Law, our amended and restated certificate of incorporation or our bylaws; or any action asserting a claim against us that is governed by the internal affairs doctrine. The choice of forum provision may limit a stockholder’s ability to bring a claim in a judicial forum that it finds favorable for disputes with us or our directors, officers or other employees, which may discourage such lawsuits against us and our directors, officers and other employees. If a court were to find the choice of forum provision contained in our amended and restated certificate of incorporation to be inapplicable or unenforceable
26
in an action, we may incur additional costs associated with resolving such action in other jurisdictions, which could harm our business and financial condition.
Item 1B. Unresolved Staff Comments.
Not applicable.
Item 2. Properties
Our corporate headquarters are located in Mountain View, California. We also maintain offices in multiple locations in the United States and internationally in Africa, Asia, Australia, Europe, and South America, as well as Canada and Mexico. We lease all of our facilities and do not own any real property. We have added and expect to add facilities as we grow our employee base and expand geographically. We believe that our facilities are adequate to meet our needs for the immediate future, and that, should it be needed, suitable additional space will be available to accommodate expansion of our operations.
27
Item 3. Legal Proceedings.
The information set forth under the "Legal Matters" subheading in Note 7 of our Notes to Consolidated Financial Statements in Part II, Item 8 of this Annual Report on Form 10-K is incorporated herein by reference.
In addition, we may from time to time, be involved in various legal proceedings arising from the normal course of business, and an unfavorable resolution of any of these matters could materially affect our future results of operations, cash flows or financial position.
Item 4. Mine Safety Disclosures.
Not applicable.
28
PART II
Item 5. Market for Registrant’s Common Equity, Related Stockholder Matters and Issuer Purchases of Equity Securities.
Market Information for Common Stock
Our Class A common stock trades publicly on the New York Stock Exchange (NYSE) under the ticker symbol “PSTG.” We previously had two classes of common stock outstanding — Class A common stock and Class B common stock. In December 2018, all outstanding shares of our Class B common stock automatically converted into the same number of shares of our Class A common stock. Prior to such date, our Class B common stock was not listed nor traded on any stock exchange.
Holders of Record
As of
January 31, 2019
, there were 76 holders of record of our Class A common stock. This figure does not include a substantially greater number of “street name” holders or beneficial holders of our common stock whose shares are held of record by banks, brokers and other financial institutions.
Dividend Policy
We have never declared or paid cash dividends on our common stock. We currently intend to retain all available funds and any future earnings for use in the operation of our business and do not anticipate paying any dividends in the foreseeable future. Any future determination to declare dividends will be made at the discretion of our board of directors, subject to applicable laws, and will depend on our financial condition, operating results, capital requirements, general business conditions and other factors that our board of directors may deem relevant.
Sale of Unregistered Securities and Use of Proceeds
Unregistered Sales of Equity Securities
Not applicable.
Use of Proceeds
Not applicable.
Purchases of Equity Securities by the Issuer
None.
Trading Plans
Our Insider Trading Policy permits directors, officers, and other employees covered under the policy to establish, subject to certain conditions and limitations set forth in the policy, written trading plans which are intended to comply with Rule 10b5-1 under the Exchange Act, which permits automatic trading of common stock of Pure Storage, Inc. or trading of common stock by an independent person (such as a stockbroker) who is not aware of material, nonpublic information at the time of the trade.
Stock Performance Graph and Cumulative Total Return
This performance graph shall not be deemed “soliciting material” or to be “filed” with the SEC for purposes of Section 18 of the Exchange Act, or otherwise subject to the liabilities under that Section, and shall not be deemed to be incorporated by reference into any filing of Pure Storage, Inc. under the Securities Act or the Exchange Act.
The following graph compares the cumulative total return to stockholders on our Class A common stock relative to the cumulative total returns of the NYSE Composite Index and NYSE Arca Tech 100 Index. The graph assumes that $100 (with reinvestment of all dividends) was invested in our Class A common stock and in each index on October 7,
29
2015, the date our Class A common stock began trading on the NYSE, and its relative performance is tracked through
January 31, 2019
. The returns shown are based on historical results and are not intended to suggest future performance.
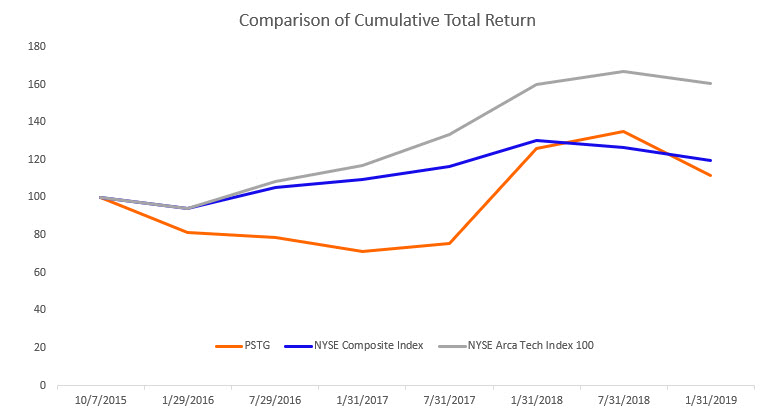
30
Item 6. Selected Financial Data.
The selected consolidated statements of operations data for the years ended
January 31, 2017
,
2018
and
2019
and the consolidated balance sheet data as of
January 31, 2018
and
2019
are derived from our audited consolidated financial statements included elsewhere in this Annual Report on Form 10-K. The consolidated statement of operations data for the years ended January 31, 2015 and 2016 and the consolidated balance sheet data as of January 31, 2015, 2016 and 2017 are derived from our audited consolidated financial statements not included in this Annual Report on Form 10-K. The selected consolidated financial data below should be read in conjunction with the section entitled “Management’s Discussion and Analysis of Financial Condition and Results of Operations” and our consolidated financial statements and related notes included elsewhere in this report. Our historical results are not necessarily indicative of the results that may be expected in any future period.
|
|
Year Ended January 31,
|
||||||||||||||||||
|
|
2015
|
2016
|
2017
|
2018
|
2019
|
||||||||||||||
|
(*)
|
(*)
|
(*As Adjusted)
|
(*As Adjusted)
|
||||||||||||||||
|
|
(in thousands, except per share data)
|
||||||||||||||||||
|
Consolidated Statements of Operations Data:
|
|
|
|
|
|
|
|||||||||||||
|
Revenue:
|
|
|
|
|
|
|
|||||||||||||
|
Product
|
$
|
154,836
|
|
$
|
375,733
|
|
$
|
614,458
|
|
$
|
834,454
|
|
$
|
1,075,586
|
|
||||
|
Support subscription
|
19,615
|
|
64,600
|
|
124,713
|
|
190,308
|
|
284,238
|
|
|||||||||
|
Total revenue
|
174,451
|
|
440,333
|
|
739,171
|
|
1,024,762
|
|
1,359,824
|
|
|||||||||
|
Cost of revenue:
|
|
|
|
|
|||||||||||||||
|
Product
(1)
|
63,425
|
|
132,870
|
|
194,150
|
|
275,242
|
|
352,054
|
|
|||||||||
|
Support subscription
(1)
|
14,127
|
|
35,023
|
|
58,129
|
|
78,539
|
|
105,474
|
|
|||||||||
|
Total cost of revenue
|
77,552
|
|
167,893
|
|
252,279
|
|
353,781
|
|
457,528
|
|
|||||||||
|
Gross profit
|
96,899
|
|
272,440
|
|
486,892
|
|
670,981
|
|
902,296
|
|
|||||||||
|
Operating expenses:
|
|
|
|
|
|||||||||||||||
|
Research and development
(1)
|
92,707
|
|
166,645
|
|
245,817
|
|
279,196
|
|
349,936
|
|
|||||||||
|
Sales and marketing
(1)
|
152,320
|
|
240,574
|
|
347,695
|
|
464,049
|
|
584,111
|
|
|||||||||
|
General and administrative
(1) (2)
|
32,354
|
|
75,402
|
|
84,652
|
|
95,170
|
|
137,506
|
|
|||||||||
|
Legal settlement
(3)
|
—
|
|
—
|
|
30,000
|
|
—
|
|
—
|
|
|||||||||
|
Total operating expenses
|
277,381
|
|
482,621
|
|
708,164
|
|
838,415
|
|
1,071,553
|
|
|||||||||
|
Loss from operations
|
(180,482
|
)
|
(210,181
|
)
|
(221,272
|
)
|
(167,434
|
)
|
(169,257
|
)
|
|||||||||
|
Other income (expense), net
|
(1,412
|
)
|
(2,002
|
)
|
1,627
|
|
11,445
|
|
(8,016
|
)
|
|||||||||
|
Loss before provision for income taxes
|
(181,894
|
)
|
(212,183
|
)
|
(219,645
|
)
|
(155,989
|
)
|
(177,273
|
)
|
|||||||||
|
Provision for income taxes
|
1,337
|
|
1,569
|
|
1,887
|
|
3,889
|
|
1,089
|
|
|||||||||
|
Net loss
|
$
|
(183,231
|
)
|
$
|
(213,752
|
)
|
$
|
(221,532
|
)
|
$
|
(159,878
|
)
|
$
|
(178,362
|
)
|
||||
|
Net loss per share attributable to common stockholders, basic and diluted
|
$
|
(6.56
|
)
|
$
|
(2.59
|
)
|
$
|
(1.14
|
)
|
$
|
(0.76
|
)
|
$
|
(0.77
|
)
|
||||
|
Weighted-average shares used in computing net loss per share attributable to common stockholders, basic and diluted
|
27,925
|
|
82,460
|
|
194,714
|
|
211,609
|
|
232,042
|
|
|||||||||
_________________________________
*The consolidated statements of operations data for the years ended January 31, 2017, 2018, and 2019 reflects the adoption of Accounting Standards Codification 606,
Revenue from Contracts with Customers
(ASC 606). For further information, see Note 2 in Part II, Item 8 of this report. The consolidated statements of operations data for the years ended January 31, 2015 and 2016 do not reflect the adoption of ASC 606.
|
(1)
|
Includes stock-based compensation expense as follows:
|
31
|
|
Year Ended January 31,
|
||||||||||||||||||
|
|
2015
|
2016
|
2017
|
2018
|
2019
|
||||||||||||||
|
|
(in thousands)
|
||||||||||||||||||
|
Cost of revenue—product
|
$
|
303
|
|
$
|
276
|
|
$
|
601
|
|
$
|
1,630
|
|
$
|
2,951
|
|
||||
|
Cost of revenue—support subscription
|
1,273
|
|
2,388
|
|
5,639
|
|
9,050
|
|
12,378
|
|
|||||||||
|
Research and development
|
22,512
|
|
31,135
|
|
63,495
|
|
71,229
|
|
92,484
|
|
|||||||||
|
Sales and marketing
|
22,466
|
|
16,966
|
|
34,317
|
|
47,687
|
|
66,350
|
|
|||||||||
|
General and administrative
|
6,479
|
|
7,460
|
|
12,616
|
|
21,077
|
|
36,482
|
|
|||||||||
|
Total stock-based compensation expense
|
$
|
53,033
|
|
$
|
58,225
|
|
$
|
116,668
|
|
$
|
150,673
|
|
$
|
210,645
|
|
||||
Stock-based compensation expense for the year ended January 31, 2015 included $27.6 million of cash paid for the repurchase of common stock in excess of fair value.
|
(2)
|
Includes a one-time charge of $11.9 million for an equity grant to the Pure Good Foundation for the year ended January 31, 2016.
|
|
(3)
|
Represents a one-time charge for our legal settlement with Dell, Inc. For further information, see Note 7 in Part II, Item 8 of this report.
|
|
|
As of January 31,
|
||||||||||||||||||
|
|
2015
|
2016
|
2017
|
2018
|
2019
|
||||||||||||||
|
(*)
|
(*)
|
(*As Adjusted)
|
(*As Adjusted)
|
||||||||||||||||
|
|
(in thousands)
|
||||||||||||||||||
|
Consolidated Balance Sheet Data:
|
|
|
|
|
|
|
|||||||||||||
|
Cash and cash equivalents
|
$
|
192,707
|
|
$
|
604,742
|
|
$
|
183,675
|
|
$
|
244,057
|
|
$
|
447,990
|
|
||||
|
Marketable securities
|
—
|
|
—
|
|
362,986
|
|
353,289
|
|
749,482
|
|
|||||||||
|
Working capital
|
224,362
|
|
603,538
|
|
526,043
|
|
580,788
|
|
1,192,011
|
|
|||||||||
|
Total assets
|
356,290
|
|
870,783
|
|
928,352
|
|
1,123,995
|
|
1,973,025
|
|
|||||||||
|
Deferred revenue, current and non-current portion
|
73,669
|
|
216,204
|
|
272,963
|
|
374,102
|
|
535,920
|
|
|||||||||
|
Convertible senior notes, net
|
—
|
|
—
|
|
—
|
|
—
|
|
449,828
|
|
|||||||||
|
Convertible preferred stock
|
543,940
|
|
—
|
|
—
|
|
—
|
|
—
|
|
|||||||||
|
Total stockholders’ (deficit) equity
|
(299,830
|
)
|
563,354
|
|
537,201
|
|
574,401
|
|
737,780
|
|
|||||||||
_________________________________
*The consolidated balance sheet data as of January 31, 2017, 2018, and 2019 reflects the adoption of ASC 606. For further information, see Note 2 in Part II, Item 8 of this report. The consolidated balance sheet data as of January 31, 2015 and 2016 do not reflect the adoption of ASC 606.
32
Item 7. Management’s Discussion and Analysis of Financial Condition and Results of Operations.
Investors should read the following discussion and analysis of our financial condition and results of operations together with the section titled “Selected Consolidated Financial Data” and the consolidated financial statements and related notes included elsewhere in this Annual Report on Form 10-K. This discussion contains forward-looking statements based upon current expectations that involve risks and uncertainties. Our actual results may differ materially from those anticipated in these forward-looking statements as a result of various factors, including those discussed in the section titled” Risk Factors” and in other parts of this Annual Report on Form 10-K. See also the section titled “Note Regarding Forward-Looking Statements” in this report. Our fiscal year end is January 31.
Overview
We help innovators to build a better world with data. As data continues to grow and organizations strive to mine intelligence from data and the need for real-time analytics increases, we are focused on delivering software-defined data storage solutions that are uniquely fast and cloud-capable, enabling customers to maximize the value of data, gain competitive advantage and keep pace with cutting edge developments. Our innovative data platform replaces storage systems designed for mechanical disk with all-flash systems optimized end-to-end for solid-state memory. Our
Pure1
cloud-based support and management platform simplifies storage administration, while real-time scanning enables us to find and fix issues before they have an impact. Our innovative business model replaces the traditional forklift upgrade cycle with an
Evergreen Storage
subscription model for hardware and software innovation, support and maintenance.
We were incorporated in October 2009 and are headquartered in Mountain View, California, with operations throughout the world. Our primary offerings include our
FlashArray
and
FlashBlade
products, inclusive of our
Purity Operating Environment
(
Purity OE
) software, our
Pure1
cloud-based management and support software,
FlashStack and Artificial Intelligence Ready Infrastructure (AIRI)
, our joint converged Infrastructure offerings, and
Evergreen Storage Service (ES2)
, a cloud-like, storage consumption offering that enables customers to purchase on-premises or offsite-hosted private storage on a pay-per-month-per-terabyte basis, after a baseline commitment. In addition, in November 2018, we announced the launch of our
Cloud Data Services
, a suite of new cloud offerings that will enable customers to invest in a single storage architecture that unifies application deployments on-premises and on the cloud.
Since launching in May 2012, our customer base has grown to over
5,800
customers, including over
40%
of the Fortune 500. Our customers include enterprise and commercial organizations, cloud, Global Systems Integrators, and service providers across a diverse set of industry verticals, consumer web, education, energy, financial services, governments, healthcare, manufacturing, media, retail and telecommunications. Our data services are used for a broad set of use cases, including database applications, large-scale analytics, artificial intelligence / machine learning, private and public cloud infrastructure and webscale applications, virtual server infrastructure and virtual desktop infrastructure. Our data platform helps customers scale their businesses through real-time and more accurate analytics, increase employee productivity, improve operational efficiency, and deliver more compelling user experiences to their customers and partners. We define a customer as an end user that purchases our products and services either from one of our channel partners or from us directly. No end user customer represented 10% or more of revenue in the years ended
January 31, 2017
,
2018
and
2019
.
We have experienced substantial growth over the past three years, with revenue increasing from $
739.2 million
for the year ended
January 31, 2017
to
$1,024.8 million
for the year ended
January 31, 2018
and to
$1,359.8 million
for the year ended
January 31, 2019
, representing year-over-year revenue growth of
39%
and
33%
for our two most recent years. We expect that our revenue growth rate will continue to decline as our business scales, even if our revenue continues to grow in absolute terms. We have continued to make significant expenditures and investments, including in personnel-related costs, sales and marketing, infrastructure and operations, and have incurred net losses in each period since our inception, including net losses of
$221.5 million
,
$159.9 million
and
$178.4 million
, respectively, for the years ended
January 31, 2017
,
2018
and
2019
.
Since our founding, we have invested heavily in growing our business. Our headcount increased from over
2,100
employees as of
January 31, 2018
to over
2,800
employees as of
January 31, 2019
. We intend to continue to invest in our research and development organization to extend our technology leadership, enhance the functionality of our existing products and introduce new products. By investing in research and development, we believe we will be well positioned to continue our rapid growth and take advantage of our large market opportunity.
We also intend to continue to invest in and expand our sales and marketing functions and channel programs, including expanding our global network of channel partners and carrying out associated marketing activities in key
33
geographies. By investing in sales and technical training, demand generation and partner programs, we believe we can enable many of our partners to independently identify, qualify, sell and upgrade customers, with limited involvement from us.
In addition, we intend to expand and continue to invest in our international operations, which we believe will be an important factor in our continued growth. Our revenue generated from customers outside the United States was
23%
,
25%
and
28%
of our total revenue for the years ended
January 31, 2017
,
2018
and
2019
.
As a result of our strategy to increase our investments in research and development, sales, marketing, support and international expansion, we expect to continue to incur operating losses and negative cash flows from operations in the near future and may require additional capital resources to execute strategic initiatives to grow our business.
Our Business Model
Our sales force works collaboratively with our global network of distribution and channel partners, which provides us broad sales reach while maintaining direct customer engagement and is responsible for large account penetration, global account coordination and overall market development. Our channel partners help market and sell our products, typically with assistance from our sales force. This joint sales approach provides us with the benefit of direct relationships with substantially all of our customers and expands our reach through the relationships of our channel partners. In certain geographies we sell through a two-tier distribution model. We also sell to service providers that deploy our products and offer cloud-based storage services to their customers. We intend to continue to invest in the channel to add more partners and to expand our reach to customers through our channel partners’ relationships. One channel partner represented 11% of revenue for the years ended
January 31, 2017
and
January 31, 2019
. No channel partner represented 10% or more of revenue for the year ended
January 31, 2018
.
Our business model enables customers to broadly adopt flash for a wide variety of workloads in their data centers, with some of our most innovative customers adopting all-flash data centers. We have not charged separately for software, meaning that when a customer buys a
FlashArray, FlashBlade
,
FlashStack
, or
AIRI,
all operating software functionality is included in the base purchase price, and the customer is entitled to updates and new features to the operating software as long as the customer maintains an active support subscription agreement. By keeping our business model simple and efficient, we allow customers to buy more products and expand their footprint more easily while allowing us to reduce our sales and marketing costs
.
To deliver on the next level of operational simplicity and support excellence, we designed
Pure1
, our integrated cloud-based management and support platform.
Pure1
enables our customers, support staff and partners to collaborate to achieve the best customer experience and is included with an active support subscription agreement. In addition, our
Evergreen Storage Service
program provides our customers who continually maintain active and eligible maintenance and support for three years with an included controller refresh with each additional three year support subscription renewal. In this way, our customers improve and extend the service life of their arrays, we reduce our cost of support by keeping the array modern and we encourage capacity expansion. In accordance with revenue recognition accounting guidance, we recognize the allocated revenue of the controllers and expense the related cost in the period in which we ship these controllers.
The combination of our high-performance, all-flash products, our exceptional support and our innovative business model has had a substantial impact on customer success and loyalty and is a strong driver of both initial purchase and additional purchases of our products. For customers that have been with us for at least 12 months as of
January 31, 2019
, for every $1 of initial product purchase, our top 25 customers on average spent approximately $11 on new product purchases in the first 18 months following their initial purchase.
Trends in Our Business and Industry
Demand for Data in the Multi-Cloud Era Environment
In today’s multi-cloud environment, data is the strategic core that enables competitiveness and differentiation for businesses -- collecting vast amounts of data, analyzing it rapidly, discovering new insights, and ultimately delivering new innovations and experiences otherwise impossible without data. We continue to make significant investments in our business to enable data-centric architecture to support today and tomorrow’s volume and velocity of data and to ensure the performance and reliability required for new data-driven applications, while substantially reducing costs
34
and complexity for our customers. We believe that the shift in consumption models, like our ES2 offering, and in deployment models, as demonstrated by the desire for hybrid deployment technologies like our
Cloud Data Services
, are at the core of the trend toward multi-cloud environments. Data-centric architecture supports a wide range of classic business applications as well as modern webscale-architecture applications so that our customers can manage their existing applications more efficiently while they modernize their applications both on-premise and in the cloud
.
Adoption of All-Flash Storage Systems
Organizations are increasingly replacing traditional disk-based systems with all-flash storage systems, including those based on NVMe technologies, due to their higher performance, reliability and efficiency. Flash continues to penetrate the data center at a rapid rate, and our success depends on the adoption of all-flash storage systems. To the extent more organizations recognize the benefits of all-flash storage and the adoption of all-flash storage increases, our target customer base will expand, and demand for all-flash storage will rise.
Adding New Customers and Expanding Sales to Our Existing Customer Base
In order to capture long-term strategic opportunities, we intend to continue to target new customers, including large enterprises, service providers and government organizations, by continuing to invest in our field sales force and extending our relationships with key channel partners. We also expect that a substantial portion of our future sales will continue to be sales to existing customers, including expansion of existing arrays.
Seasonality in our Business Operations
Consistent with the seasonality of enterprise IT as a whole, we generally experience the lowest demand for our products and services in the first quarter of our fiscal year and the greatest demand for our products and services in the last quarter of our fiscal year. Furthermore, we typically focus investments into our sales organization, along with significant product launches, in the first half of our fiscal year. As a result, we expect that our business and results of operations will fluctuate from quarter to quarter, reflecting seasonally softer revenue and operating margin in the first half of our fiscal year, followed by a stronger second half, the relative impact of which will grow as we operate at a larger scale.
Components of Results of Operations
Revenue
We derive revenue from the sale of our
FlashArray and FlashBlade
products and support subscription services. Provided that all other revenue recognition criteria have been met, we typically recognize product revenue upon transfer of control to our customers and the satisfaction of our performance obligations. Products are typically shipped directly by us to customers, and our channel partners do not stock our inventory. We expect our product revenue may vary from period to period based on, among other things, the timing and size of orders and delivery of products and the impact of significant transactions.
We provide our support subscription services pursuant to support subscription agreements, which involve customer support, hardware maintenance and software upgrades for a period of generally one to six years. Support subscription services includes our ES2 offering. We recognize revenue from support subscription agreements ratably over the contractual service period. We expect our support subscription revenue to increase as we add new customers and our existing customers renew support subscription agreements.
Cost of Revenue
Cost of product revenue primarily consists of costs paid to our third-party contract manufacturers, which includes the costs of our components, and personnel costs associated with our manufacturing operations. Personnel costs consist of salaries, bonuses and stock-based compensation expense. Our cost of product revenue also includes allocated overhead costs
,
inventory write-offs, amortization of intangible assets pertaining to developed technology, and freight. Allocated overhead costs consist of certain employee benefits and facilities-related costs. We expect our cost of product revenue to increase in absolute dollars as our product revenue increases.
Cost of support subscription revenue primarily consists of personnel costs associated with our customer support organization, parts replacement costs, allocated overhead costs and depreciation of computer equipment used for our
35
ES2 offering. We expect our cost of support subscription revenue to increase in absolute dollars, as our support subscription revenue increases.
Operating Expenses
Our operating expenses consist of research and development, sales and marketing and general and administrative expenses. Salaries and personnel-related costs, including stock-based compensation expense, are the most significant component of each category of operating expenses. Operating expenses also include allocated overhead costs for employee benefits and facilities-related costs.
Research and Development
.
Research and development expense consists primarily of employee compensation and related expenses, prototype expenses, depreciation associated with assets acquired for research and development, third-party engineering and contractor support costs, as well as allocated overhead. We expect our research and development expense to increase in absolute dollars and it may decrease as a percentage of revenue, as we continue to invest in new and existing products and build upon our technology leadership.
Sales and Marketing
.
Sales and marketing expense consists primarily of employee compensation and related expenses, sales commissions, marketing programs, travel and entertainment expenses as well as allocated overhead. Marketing programs consist of advertising, events, corporate communications and brand-building activities. We expect our sales and marketing expense to increase in absolute dollars and it may decrease as a percentage of revenue, as we expand our sales force and increase our marketing resources, expand into new markets and further develop our channel program.
General and Administrative.
General and administrative expense consists primarily of compensation and related expenses for administrative functions including finance, legal, human resources, IT and fees for third-party professional services as well as amortization of intangible assets pertaining to defensive technology patents and allocated overhead. We expect our general and administrative expense to increase in absolute dollars and it may decrease as a percentage of revenue, as we continue to invest in the growth of our business.
Other Income (Expense), Net
Other income (expense), net consists primarily of interest income earned on cash, cash equivalents and marketable securities, interest expense from convertible notes and gains (losses) from foreign currency transactions.
Provision for Income Taxes
Provision for income taxes consists primarily of income taxes in certain foreign jurisdictions in which we conduct business and state income taxes in the United States. We have recorded no U.S. federal income tax and provided a full valuation allowance for U.S. deferred tax assets, which mainly includes net operating loss, carryforwards and tax credits related primarily to research and development. We expect to maintain this full valuation allowance for the foreseeable future as it is more likely than not that the deferred tax assets will not be realized based on our history of losses.
36
Results of Operations
The following tables set forth our results of operations for the periods presented in dollars and as a percentage of our total revenue (in thousands):
|
|
Year Ended January 31,
|
||||||||||
|
|
2017
|
2018
|
2019
|
||||||||
|
|
(As Adjusted*)
|
(As Adjusted*)
|
|||||||||
|
Consolidated Statements of Operations Data:
|
|
|
|
|
|
|
|||||
|
Revenue:
|
|
|
|
|
|
|
|||||
|
Product
|
$
|
614,458
|
|
$
|
834,454
|
|
$
|
1,075,586
|
|
||
|
Support subscription
|
124,713
|
|
190,308
|
|
284,238
|
|
|||||
|
Total revenue
|
739,171
|
|
1,024,762
|
|
1,359,824
|
|
|||||
|
Cost of revenue:
|
|
|
|
|
|||||||
|
Product
(1)
|
194,150
|
|
275,242
|
|
352,054
|
|
|||||
|
Support subscription
(1)
|
58,129
|
|
78,539
|
|
105,474
|
|
|||||
|
Total cost of revenue
|
252,279
|
|
353,781
|
|
457,528
|
|
|||||
|
Gross profit
|
486,892
|
|
|
670,981
|
|
902,296
|
|
||||
|
Operating expenses:
|
|
|
|
|
|||||||
|
Research and development
(1)
|
245,817
|
|
279,196
|
|
349,936
|
|
|||||
|
Sales and marketing
(1)
|
347,695
|
|
464,049
|
|
584,111
|
|
|||||
|
General and administrative
(1)
|
84,652
|
|
95,170
|
|
137,506
|
|
|||||
|
Legal settlement
(2)
|
30,000
|
|
—
|
|
—
|
|
|||||
|
Total operating expenses
|
708,164
|
|
838,415
|
|
1,071,553
|
|
|||||
|
Loss from operations
|
(221,272
|
)
|
(167,434
|
)
|
(169,257
|
)
|
|||||
|
Other income (expense), net
|
1,627
|
|
11,445
|
|
(8,016
|
)
|
|||||
|
Loss before provision for income taxes
|
(219,645
|
)
|
(155,989
|
)
|
(177,273
|
)
|
|||||
|
Provision for income taxes
|
1,887
|
|
3,889
|
|
1,089
|
|
|||||
|
Net loss
|
$
|
(221,532
|
)
|
|
$
|
(159,878
|
)
|
$
|
(178,362
|
)
|
|
_________________________________
* As adjusted to reflect the impact of the full retrospective adoption of ASC 606. For further information, see Note 2 in Part II, Item 8 of this report.
|
(1)
|
Includes stock-based compensation expense as follows (in thousands):
|
|
|
Year Ended January 31,
|
||||||||||
|
|
2017
|
2018
|
2019
|
||||||||
|
Cost of revenue—product
|
$
|
601
|
|
$
|
1,630
|
|
$
|
2,951
|
|
||
|
Cost of revenue—support subscription
|
5,639
|
|
9,050
|
|
12,378
|
|
|||||
|
Research and development
|
63,495
|
|
71,229
|
|
92,484
|
|
|||||
|
Sales and marketing
|
34,317
|
|
47,687
|
|
66,350
|
|
|||||
|
General and administrative
|
12,616
|
|
21,077
|
|
36,482
|
|
|||||
|
Total stock-based compensation expense
|
$
|
116,668
|
|
$
|
150,673
|
|
$
|
210,645
|
|
||
(2) Represents a one-time charge for our legal settlement with Dell, Inc. For further information, see Note 7 in Part II, Item 8 of this report.
37
|
|
Year Ended January 31,
|
|||||||
|
|
2017
|
2018
|
2019
|
|||||
|
(As Adjusted*)
|
(As Adjusted*)
|
|||||||
|
Consolidated Statements of Operations Data:
|
||||||||
|
Revenue:
|
||||||||
|
Product
|
83
|
%
|
81
|
%
|
79
|
%
|
||
|
Support subscription
|
17
|
|
19
|
|
21
|
|
||
|
Total revenue
|
100
|
|
100
|
|
100
|
|
||
|
Cost of revenue:
|
||||||||
|
Product
|
26
|
|
27
|
|
26
|
|
||
|
Support subscription
|
8
|
|
8
|
|
8
|
|
||
|
Total cost of revenue
|
34
|
|
35
|
|
34
|
|
||
|
Gross profit
|
66
|
|
65
|
|
66
|
|
||
|
Operating expenses:
|
||||||||
|
Research and development
|
34
|
|
27
|
|
25
|
|
||
|
Sales and marketing
|
47
|
|
45
|
|
43
|
|
||
|
General and administrative
|
11
|
|
9
|
|
10
|
|
||
|
Legal settlement
|
4
|
|
—
|
|
—
|
|
||
|
Total operating expenses
|
96
|
|
81
|
|
78
|
|
||
|
Loss from operations
|
(30
|
)
|
(16
|
)
|
(12
|
)
|
||
|
Other income (expense), net
|
—
|
|
1
|
|
(1
|
)
|
||
|
Loss before provision for income taxes
|
(30
|
)
|
(15
|
)
|
(13
|
)
|
||
|
Provision for income taxes
|
—
|
|
—
|
|
—
|
|
||
|
Net loss
|
(30
|
)%
|
(15
|
)%
|
(13
|
)%
|
||
_________________________________
* As adjusted to reflect the impact of the full retrospective adoption of ASC 606. For further information, see Note 2 in Part II, Item 8 of this report.
Revenue
|
|
Year Ended January 31,
|
Change
|
Year Ended January 31,
|
Change
|
||||||||||||||||||||||||||
|
|
2017
|
2018
|
$
|
%
|
2018
|
2019
|
$
|
%
|
||||||||||||||||||||||
|
(dollars in thousands)
|
(As Adjusted*)
|
(As Adjusted*)
|
(As Adjusted*)
|
|||||||||||||||||||||||||||
|
Product revenue
|
$
|
614,458
|
|
$
|
834,454
|
|
$
|
219,996
|
|
36
|
%
|
$
|
834,454
|
|
$
|
1,075,586
|
|
$
|
241,132
|
|
29
|
%
|
||||||||
|
Support subscription revenue
|
124,713
|
|
190,308
|
|
65,595
|
|
53
|
%
|
190,308
|
|
284,238
|
|
93,930
|
|
49
|
%
|
||||||||||||||
|
Total revenue
|
$
|
739,171
|
|
$
|
1,024,762
|
|
$
|
285,591
|
|
39
|
%
|
$
|
1,024,762
|
|
$
|
1,359,824
|
|
$
|
335,062
|
|
33
|
%
|
||||||||
_____________________________________
* As adjusted to reflect the impact of the full retrospective adoption of ASC 606. For further information, see Note 2 in Part II, Item 8 of this report.
Total revenue
increased
by
$335.1 million
, or
33%
, during the year ended
January 31, 2019
compared to the year ended
January 31, 2018
. The
increase
in product revenue was driven by repeat purchases from existing customers and a growing number of new customers. The number of customers grew from over
4,500
as of
January 31, 2018
to over
5,800
as of
January 31, 2019
. The
increase
in support subscription revenue was primarily driven by an increase in maintenance and support subscription agreements sold with increased product sales, as well as increased recognition of deferred support subscription revenue contracts.
Total revenue
increased
by
$285.6 million
, or
39%
, during the year ended January 31, 2018 compared to the year ended January 31, 2017. The
increase
in product revenue was primarily driven by repeat purchases from existing customers and a growing number of new customers. The number of customers grew from over 3,000 as of January 31, 2016 to over 4,500 as of January 31, 2018. The
increase
in support subscription revenue was primarily driven by an increase in maintenance and support subscription agreements sold with increased product sales, as well as increased recognition of deferred support subscription revenue contracts.
38
Cost of Revenue and Gross Margin
|
|
Year Ended January 31,
|
Change
|
Year Ended January 31,
|
Change
|
||||||||||||||||||||||||||
|
|
2017
|
2018
|
$
|
%
|
2018
|
2019
|
$
|
%
|
||||||||||||||||||||||
|
(dollars in thousands)
|
(As Adjusted*)
|
(As Adjusted*)
|
(As Adjusted*)
|
|||||||||||||||||||||||||||
|
Product cost of revenue
|
$
|
194,150
|
|
$
|
275,242
|
|
$
|
81,092
|
|
42
|
%
|
$
|
275,242
|
|
$
|
352,054
|
|
$
|
76,812
|
|
28
|
%
|
||||||||
|
Support subscription cost of revenue
|
58,129
|
|
78,539
|
|
20,410
|
|
35
|
%
|
78,539
|
|
105,474
|
|
26,935
|
|
34
|
%
|
||||||||||||||
|
Total cost of revenue
|
$
|
252,279
|
|
$
|
353,781
|
|
$
|
101,502
|
|
40
|
%
|
$
|
353,781
|
|
$
|
457,528
|
|
$
|
103,747
|
|
29
|
%
|
||||||||
|
Product gross margin
|
68.4
|
%
|
67.0
|
%
|
|
|
|
|
67.0
|
%
|
67.3
|
%
|
|
|
|
|
||||||||||||||
|
Support subscription gross margin
|
53.4
|
%
|
58.7
|
%
|
|
|
|
|
58.7
|
%
|
62.9
|
%
|
|
|
|
|
||||||||||||||
|
Total gross margin
|
65.9
|
%
|
65.5
|
%
|
|
|
|
|
65.5
|
%
|
66.4
|
%
|
|
|
|
|
||||||||||||||
____________________________
* As adjusted to reflect the impact of the full retrospective adoption of ASC 606. For further information, see Note 2 in Part II, Item 8 of this report
Cost of revenue
increased
by
$103.7 million
, or
29%
, for the year ended
January 31, 2019
compared to the year ended
January 31, 2018
. The
increase
in product cost of revenue was primarily driven by increased sales and, to a lesser extent, by the increased costs in our manufacturing operations associated with increased headcount. The
increase
in support subscription cost of revenue was primarily attributable to costs in our customer support organization as we continue to scale our business. Total headcount in these functions increased
35%
from
January 31, 2018
to
January 31, 2019
.
Total gross margin remained relatively consistent during the years ended
January 31, 2018
and
2019
. Product gross margin
increased
0.3
percentage point from the year ended
January 31, 2018
to the year ended
January 31, 2019
. Support subscription gross margin
increased
4.2
percentage points from the year ended
January 31, 2018
to the year ended
January 31, 2019
primarily driven by increased recognition of deferred support subscription revenue resulting from the increase in our customer base, as well as efficiencies gained as we scale in our support organization globally.
Cost of revenue
increased
by
$101.5 million
, or
40%
, for the year ended
January 31, 2018
compared to the year ended
January 31, 2017
. The
increase
in product cost of revenue was primarily driven by increased sales and, to a lesser extent, by the increased costs in our manufacturing operations associated with increased headcount. The increase in support subscription cost of revenue was primarily attributable to costs in our customer support organization as we continue to scale our business. Total headcount in these functions increased 44% from
January 31, 2017
to
January 31, 2018
.
Total gross margin remained relatively consistent during the years ended January 31, 2017 and 2018. Product gross margin
decreased
1.4
percentage points from the year ended January 31, 2017 to the year ended January 31, 2018, primarily driven by a shift in the mix of products sold as the proportion of revenue from
FlashBlade
increased. Support subscription gross margin
increased
5.3
percentage points from the year ended January 31, 2017 to the year ended January 31, 2018 primarily driven by increased recognition of deferred support revenue resulting from the increase in our customer base, as well as efficiencies gained as we scale in our support organization globally.
39
Operating Expenses
Research and Development
|
|
Year Ended January 31,
|
Change
|
Year Ended January 31,
|
Change
|
|||||||||||||||||||||||||
|
|
2017
|
2018
|
$
|
%
|
2018
|
2019
|
$
|
%
|
|||||||||||||||||||||
|
(dollars in thousands)
|
|||||||||||||||||||||||||||||
|
Research and development
|
$
|
245,817
|
|
$
|
279,196
|
|
$
|
33,379
|
|
14
|
%
|
$
|
279,196
|
|
$
|
349,936
|
|
$
|
70,740
|
|
25
|
%
|
|||||||
Research and development expense
increased
by
$70.7 million
, or
25%
, during the year ended
January 31, 2019
compared to the year ended
January 31, 2018
, as we continued to develop technologies to enhance and expand our product offerings. The increase was primarily driven by a $60.6 million increase in employee compensation and related costs, including a $21.3 million increase in stock-based compensation expense, as headcount increased by
33%
from
January 31, 2018
to
January 31, 2019
. The increase in stock-based compensation expense was also due to restricted stock units granted to employees from the StorReduce acquisition in August 2018. The remainder of the increase was primarily attributable to a $6.2 million increase in outside service expenses, and $5.6 million increase in office and related costs.
Research and development expense increased by $33.4 million, or 14%, during the year ended January 31, 2018 compared to the year ended January 31, 2017, as we continued to develop new technologies and enhance our current product offerings such as our
FlashBlade
and
FlashArray//X
products. The increase was primarily driven by a $29.3 million increase in employee compensation and related costs, including a $7.7 million increase in stock-based compensation expense, as headcount increased by 7% from January 31, 2017 to January 31, 2018. The remainder of the increase was primarily attributable to a $6.1 million increase in depreciation and equipment expense, partially offset by a $2.4 million decrease in prototype and related expenses.
Sales and Marketing
|
|
Year Ended January 31,
|
Change
|
Year Ended January 31,
|
Change
|
|||||||||||||||||||||||||
|
|
2017
|
2018
|
$
|
%
|
2018
|
2019
|
$
|
%
|
|||||||||||||||||||||
|
(dollars in thousands)
|
(As Adjusted*)
|
(As Adjusted*)
|
(As Adjusted*)
|
||||||||||||||||||||||||||
|
Sales and marketing
|
$
|
347,695
|
|
$
|
464,049
|
|
$
|
116,354
|
|
33
|
%
|
$
|
464,049
|
|
$
|
584,111
|
|
$
|
120,062
|
|
26
|
%
|
|||||||
____________________________
* As adjusted to reflect the impact of the full retrospective adoption of ASC 606. For further information, see Note 2 in Part II, Item 8 of this report
Sales and marketing expense
increased
by
$120.1 million
, or
26%
, during the year ended
January 31, 2019
compared to the year ended
January 31, 2018
, as we continue to grow our sales force and expand international presence. The increase was primarily driven by an increase of $93.3 million in employee compensation and related costs, including a $15.0 million increase in sales commission expense and a $18.7 million increase in stock-based compensation expense, as headcount increased by
36%
from
January 31, 2018
to
January 31, 2019
. The remainder of the increase was primarily attributable to a $7.0 million increase in outside service expense, a $6.9 million increase in marketing and brand awareness program costs, a $6.8 million increase in travel expense and a $6.2 million increase in office and related costs.
Sales and marketing expense
increased
by
$116.4 million
, or
33%
, during the year ended January 31, 2018 compared to the year ended January 31, 2017, as we continue to grow our sales force and expand international presence. The increase was primarily driven by an increase of $87.8 million in employee compensation and related costs, including a $31.5 million increase in sales commission expense and a $13.4 million increase in stock-based compensation expense, as headcount increased by 30% from January 31, 2017 to January 31, 2018. The remainder of the increase was primarily attributable to a $10.5 million increase in marketing and brand awareness program costs and a $7.1 million increase in office and related costs.
40
General and Administrative
|
|
Year Ended January 31,
|
Change
|
Year Ended January 31,
|
Change
|
|||||||||||||||||||||||||
|
|
2017
|
2018
|
$
|
%
|
2018
|
2019
|
$
|
%
|
|||||||||||||||||||||
|
(dollars in thousands)
|
|||||||||||||||||||||||||||||
|
General and administrative
|
$
|
84,652
|
|
$
|
95,170
|
|
$
|
10,518
|
|
12
|
%
|
$
|
95,170
|
|
$
|
137,506
|
|
$
|
42,336
|
|
44
|
%
|
|||||||
General and administrative expense
increased
by
$42.3 million
, or
44%
, during the year ended
January 31, 2019
compared to the year ended
January 31, 2018
. The increase was primarily driven by an increase of $28.8 million in employee compensation and related costs, including an increase of $15.4 million in stock-based compensation expense, as we increased our headcount by
32%
from
January 31, 2018
to
January 31, 2019
. The remainder of the increase was primarily attributable to $7.0 million office and related costs and an increase of $6.1 million in outside service expenses.
General and administrative expense
increased
by
$10.5 million
, or
12%
, during the year ended January 31, 2018 compared to the year ended January 31, 2017. The increase was primarily driven by an increase of $17.3 million in employee compensation and related costs, including an increase of $8.5 million in stock-based compensation expense, as we increased our headcount by 27% from January 31, 2017 to January 31, 2018. The increase was partially offset by a $8.2 million decrease in outside service expenses primarily driven by lower legal fees incurred in fiscal year 2018.
Other Income (Expense), Net
|
|
Year Ended January 31,
|
Change
|
Year Ended January 31,
|
Change
|
|||||||||||||||||||
|
|
2017
|
2018
|
$
|
2018
|
2019
|
$
|
|||||||||||||||||
|
(dollars in thousands)
|
|||||||||||||||||||||||
|
Other income (expense), net
|
$
|
1,627
|
|
$
|
11,445
|
|
$
|
9,818
|
|
$
|
11,445
|
|
$
|
(8,016
|
)
|
$
|
(19,461
|
)
|
|||||
Other income (expense), net
decreased
during the year ended
January 31, 2019
compared to the year ended
January 31, 2018
primarily attributable to interest expense of $21.6 million related to the Notes and an $11.2 million increase in net losses from foreign currency transactions as U.S. dollars strengthened relative to certain foreign currencies, partially offset by an increase in interest income of $12.6 million from our cash, cash equivalents and marketable securities.
Other income (expense), net increased during the year ended January 31, 2018 compared to the year ended January 31, 2017 primarily attributable to an $8.6 million increase in net gains from foreign currency transactions as U.S. dollars weakened relative to certain foreign currencies and a $1.2 million increase in interest income from our cash, cash equivalents and marketable securities.
Provision for Income Taxes
|
|
Year Ended January 31,
|
Change
|
Year Ended January 31,
|
Change
|
|||||||||||||||||||||||||
|
|
2017
|
2018
|
$
|
%
|
2018
|
2019
|
$
|
%
|
|||||||||||||||||||||
|
(dollars in thousands)
|
|||||||||||||||||||||||||||||
|
Provision for income taxes
|
$
|
1,887
|
|
$
|
3,889
|
|
$
|
2,002
|
|
106
|
%
|
$
|
3,889
|
|
$
|
1,089
|
|
$
|
(2,800
|
)
|
(72
|
)%
|
|||||||
The provision for income taxes
decreased
during the year ended
January 31, 2019
compared to the year ended
January 31, 2018
primarily attributable to a $3.7 million U.S. valuation allowance release related to the StorReduce acquisition, partially offset by higher foreign income taxes.
The provision for income taxes increased during the year ended January 31, 2018 compared to the year ended January 31, 2017 primarily related to a $1.8 million increase in foreign income taxes due to higher foreign profits and a reduction in excess tax benefits related to our foreign stock-based activities.
41
Quarterly Results of Operations
The following sets forth selected unaudited quarterly consolidated statements of operations data for each of the eight quarters in the period ended
January 31, 2019
, as well as the percentage that each line item represents of our revenue for each quarter. The information for each of these quarters has been prepared on a basis consistent with our audited annual consolidated financial statements included elsewhere in this report and, in the opinion of management, includes all adjustments of a normal, recurring nature that are necessary for the fair presentation of the results of operations for these periods in accordance with generally accepted accounting principles in the United States. This data should be read in conjunction with our audited consolidated financial statements and related notes included elsewhere in this report. These historical quarterly operating results are not necessarily indicative of the results that may be expected for a full fiscal year or any future period.
|
|
Three Months Ended
|
||||||||||||||||||||||||||||||
|
|
April 30, 2017
|
July 31, 2017
|
October 31, 2017
|
January 31, 2018
|
April 30, 2018
|
July 31, 2018
|
October 31, 2018
|
January 31, 2019
|
|||||||||||||||||||||||
|
(*As Adjusted)
|
(*As Adjusted)
|
(*As Adjusted)
|
(*As Adjusted)
|
||||||||||||||||||||||||||||
|
|
(unaudited, in thousands)
|
||||||||||||||||||||||||||||||
|
Consolidated Statements of Operations Data:
|
|
|
|
|
|
|
|
|
|
|
|
|
|||||||||||||||||||
|
Revenue:
|
|
|
|
|
|
|
|
|
|
|
|
|
|
|
|||||||||||||||||
|
Product
|
$
|
142,850
|
|
$
|
179,669
|
|
$
|
227,772
|
|
$
|
284,163
|
|
$
|
195,449
|
|
$
|
241,137
|
|
$
|
298,863
|
|
$
|
340,137
|
|
|||||||
|
Support subscription
|
39,795
|
|
45,001
|
|
49,819
|
|
55,693
|
|
60,496
|
|
67,747
|
|
73,916
|
|
82,079
|
|
|||||||||||||||
|
Total revenue
|
182,645
|
|
224,670
|
|
277,591
|
|
339,856
|
|
255,945
|
|
308,884
|
|
372,779
|
|
422,216
|
|
|||||||||||||||
|
Cost of revenue:
|
|
|
|
|
|
|
|
|
|
|
|
|
|
|
|
|
|||||||||||||||
|
Product
(1)
|
46,645
|
|
57,252
|
|
75,392
|
|
95,953
|
|
66,420
|
|
78,262
|
|
96,610
|
|
110,762
|
|
|||||||||||||||
|
Support subscription
(1)
|
16,903
|
|
19,199
|
|
20,467
|
|
21,970
|
|
23,210
|
|
24,457
|
|
27,049
|
|
30,758
|
|
|||||||||||||||
|
Total cost of revenue
|
63,548
|
|
76,451
|
|
95,859
|
|
117,923
|
|
89,630
|
|
102,719
|
|
123,659
|
|
141,520
|
|
|||||||||||||||
|
Gross profit
|
119,097
|
|
148,219
|
|
181,732
|
|
221,933
|
|
166,315
|
|
206,165
|
|
249,120
|
|
280,696
|
|
|||||||||||||||
|
Operating expenses:
|
|
|
|
|
|
|
|
|
|
|
|
|
|
|
|
|
|||||||||||||||
|
Research and development
(1)
|
65,428
|
|
69,361
|
|
68,927
|
|
75,480
|
|
78,492
|
|
84,031
|
|
90,783
|
|
96,630
|
|
|||||||||||||||
|
Sales and marketing
(1)
|
91,763
|
|
117,552
|
|
116,971
|
|
137,763
|
|
122,367
|
|
143,749
|
|
146,903
|
|
171,092
|
|
|||||||||||||||
|
General and administrative
(1)
|
20,096
|
|
22,162
|
|
25,406
|
|
27,506
|
|
27,330
|
|
33,591
|
|
38,651
|
|
37,934
|
|
|||||||||||||||
|
Total operating expenses
|
177,287
|
|
209,075
|
|
211,304
|
|
240,749
|
|
228,189
|
|
261,371
|
|
276,337
|
|
305,656
|
|
|||||||||||||||
|
Loss from operations
|
(58,190
|
)
|
(60,856
|
)
|
(29,572
|
)
|
(18,816
|
)
|
(61,874
|
)
|
(55,206
|
)
|
(27,217
|
)
|
(24,960
|
)
|
|||||||||||||||
|
Other income (expense), net
|
1,995
|
|
3,266
|
|
1,138
|
|
5,046
|
|
(999
|
)
|
(4,032
|
)
|
(2,889
|
)
|
(96
|
)
|
|||||||||||||||
|
Loss before provision for income taxes
|
(56,195
|
)
|
(57,590
|
)
|
(28,434
|
)
|
(13,770
|
)
|
(62,873
|
)
|
(59,238
|
)
|
(30,106
|
)
|
(25,056
|
)
|
|||||||||||||||
|
Income tax provision
|
964
|
|
821
|
|
970
|
|
1,134
|
|
1,431
|
|
885
|
|
(1,926
|
)
|
699
|
|
|||||||||||||||
|
Net loss
|
$
|
(57,159
|
)
|
$
|
(58,411
|
)
|
$
|
(29,404
|
)
|
$
|
(14,904
|
)
|
$
|
(64,304
|
)
|
$
|
(60,123
|
)
|
$
|
(28,180
|
)
|
$
|
(25,755
|
)
|
|||||||
_________________________________
* As adjusted to reflect the impact of the full retrospective adoption of ASC 606. For further information, see Note 2 in Part II, Item 8 of this report.
|
(1)
|
Includes stock-based compensation expense as follows:
|
42
|
|
Three Months Ended
|
||||||||||||||||||||||||||||||
|
|
April 30, 2017
|
July 31, 2017
|
October 31, 2017
|
January 31, 2018
|
April 30, 2018
|
July 31, 2018
|
October 31, 2018
|
January 31, 2019
|
|||||||||||||||||||||||
|
|
(unaudited, in thousands)
|
||||||||||||||||||||||||||||||
|
Cost of revenue—product
|
$
|
397
|
|
$
|
358
|
|
$
|
143
|
|
$
|
732
|
|
$
|
608
|
|
$
|
720
|
|
$
|
862
|
|
$
|
761
|
|
|||||||
|
Cost of revenue—support subscription
|
1,774
|
|
2,245
|
|
2,422
|
|
2,609
|
|
2,684
|
|
2,929
|
|
3,327
|
|
3,438
|
|
|||||||||||||||
|
Research and development
|
15,588
|
|
17,971
|
|
18,073
|
|
19,597
|
|
21,090
|
|
22,232
|
|
24,634
|
|
24,528
|
|
|||||||||||||||
|
Sales and marketing
|
10,626
|
|
11,439
|
|
12,104
|
|
13,518
|
|
13,940
|
|
17,269
|
|
18,681
|
|
16,460
|
|
|||||||||||||||
|
General and administrative
|
3,834
|
|
4,825
|
|
6,121
|
|
6,297
|
|
5,633
|
|
10,504
|
|
10,825
|
|
9,520
|
|
|||||||||||||||
|
Total stock-based compensation
|
$
|
32,219
|
|
$
|
36,838
|
|
$
|
38,863
|
|
$
|
42,753
|
|
$
|
43,955
|
|
$
|
53,654
|
|
$
|
58,329
|
|
$
|
54,707
|
|
|||||||
|
|
Three Months Ended
|
||||||||||||||||||||||
|
|
April 30, 2017
|
July 31, 2017
|
October 31, 2017
|
January 31, 2018
|
April 30, 2018
|
July 31, 2018
|
October 31, 2018
|
January 31, 2019
|
|||||||||||||||
|
(*As Adjusted)
|
(*As Adjusted)
|
(*As Adjusted)
|
(*As Adjusted)
|
||||||||||||||||||||
|
|
(unaudited, in thousands)
|
||||||||||||||||||||||
|
Percentage of Revenue Data:
|
|
|
|
|
|
|
|
|
|
|
|
|
|
|
|||||||||
|
Revenue:
|
|
|
|
|
|
|
|
|
|
|
|
|
|
|
|||||||||
|
Product
|
78
|
%
|
80
|
%
|
82
|
%
|
84
|
%
|
76
|
%
|
78
|
%
|
80
|
%
|
81
|
%
|
|||||||
|
Support subscription
|
22
|
|
20
|
|
18
|
|
16
|
|
24
|
|
22
|
|
20
|
|
19
|
|
|||||||
|
Total revenue
|
100
|
|
100
|
|
100
|
|
100
|
|
100
|
|
100
|
|
100
|
|
100
|
|
|||||||
|
Cost of revenue:
|
|
|
|
|
|
|
|
|
|
|
|
|
|
|
|
|
|||||||
|
Product
|
26
|
|
25
|
|
27
|
|
28
|
|
26
|
|
25
|
|
26
|
|
26
|
|
|||||||
|
Support subscription
|
9
|
|
9
|
|
8
|
|
7
|
|
9
|
|
8
|
|
7
|
|
8
|
|
|||||||
|
Total cost of revenue
|
35
|
|
34
|
|
35
|
|
35
|
|
35
|
|
33
|
|
33
|
|
34
|
|
|||||||
|
Gross margin
|
65
|
|
66
|
|
65
|
|
65
|
|
65
|
|
67
|
|
67
|
|
66
|
|
|||||||
|
Operating expenses:
|
|
|
|
|
|
|
|
|
|
|
|
|
|
|
|
|
|||||||
|
Research and development
|
36
|
|
31
|
|
25
|
|
22
|
|
31
|
|
27
|
|
24
|
|
23
|
|
|||||||
|
Sales and marketing
|
50
|
|
52
|
|
42
|
|
41
|
|
48
|
|
47
|
|
40
|
|
40
|
|
|||||||
|
General and administrative
|
11
|
|
10
|
|
9
|
|
8
|
|
10
|
|
11
|
|
10
|
|
9
|
|
|||||||
|
Total operating expenses
|
97
|
|
93
|
|
76
|
|
71
|
|
89
|
|
85
|
|
74
|
|
72
|
|
|||||||
|
Loss from operations
|
(32
|
)
|
(27
|
)
|
(11
|
)
|
(6
|
)
|
(24
|
)
|
(18
|
)
|
(7
|
)
|
(6
|
)
|
|||||||
|
Other income (expense), net
|
1
|
|
1
|
|
1
|
|
2
|
|
(1
|
)
|
(1
|
)
|
(1
|
)
|
—
|
|
|||||||
|
Loss before provision for income taxes
|
(31
|
)
|
(26
|
)
|
(10
|
)
|
(4
|
)
|
(25
|
)
|
(19
|
)
|
(8
|
)
|
(6
|
)
|
|||||||
|
Income tax provision (benefit)
|
—
|
|
—
|
|
1
|
|
—
|
|
—
|
|
—
|
|
—
|
|
—
|
|
|||||||
|
Net loss
|
(31
|
)%
|
(26
|
)%
|
(11
|
)%
|
(4
|
)%
|
(25
|
)%
|
(19
|
)%
|
(8
|
)%
|
(6
|
)%
|
|||||||
_________________________________
* As adjusted to reflect the impact of the full retrospective adoption of ASC 606. For further information, see Note 2 in Part II, Item 8 of this report.
Liquidity and Capital Resources
As of
January 31, 2019
, we had cash, cash equivalents and marketable securities of
$1,197.5 million
. Our cash and cash equivalents primarily consist of bank deposits and money market accounts. Our marketable securities generally consist of highly rated debt instruments of the U.S. government and its agencies, debt instruments of highly rated corporations and debt instruments issued by foreign governments, and asset-backed securities. We have generated significant operating losses as reflected in our accumulated deficit of
$1,081.9 million
. We may continue to incur operating losses and negative cash flows from operations in the near future and may require additional capital resources to execute strategic initiatives to grow our business.
We believe our existing cash, cash equivalents and marketable securities will be sufficient to fund our operating and capital needs for at least the next 12 months. Our future capital requirements will depend on many factors including
43
our growth rate, the timing and extent of spending to support development efforts, the expansion of sales and marketing and international operation activities, the addition of office space, the timing of new product introductions and the continuing market acceptance of our products and services, and the timing and settlement election of the Notes. We may continue to enter into arrangements to acquire or invest in complementary businesses, services and technologies, including intellectual property rights. For example, we acquired StorReduce, a cloud-first software-defined solution, in August 2018. We may be required to seek additional equity or debt financing. In the event that additional financing is required from outside sources, we may not be able to raise it on terms acceptable to us or at all. If we are unable to raise additional capital when desired, our business, operating results and financial condition would be adversely affected.
In April 2018, we issued $575.0 million of 0.125% convertible senior notes due 2023, in a private placement and received proceeds of $562.1 million, after deducting the underwriters' discounts and commissions. The Notes are unsecured obligations that do not contain any financial covenants or restrictions on the payments of dividends, the incurrence of indebtedness, or the issuance or repurchase of securities by us or any of our subsidiaries. The Notes mature on April 15, 2023 unless repurchased or redeemed by us or converted in accordance with their terms prior to the maturity date. The Notes are convertible for up to 21,884,155 shares of our Class A common stock at an initial conversion rate of approximately 38.0594 shares of common stock per $1,000 principal amount, which is equal to an initial conversion price of approximately $26.27 per share of common stock, subject to adjustment.
Holders may surrender their Notes for conversion at their option at any time prior to the close of business on the business day immediately preceding October 15, 2022, only under specific circumstances. On or after October 15, 2022 until the close of business on the second scheduled trading day immediately preceding the maturity date, holders may convert all or any portion of their Notes at any time regardless of the foregoing conditions. Upon conversion, holders will receive cash, shares of our Class A common stock, or a combination of cash and shares of our Class A common stock, at our election. We intend to settle the principal of the Notes in cash. See further discussion in Note 6 in Part II, Item 8 of this report.
As of
January 31, 2018
and
2019
, we had letters of credit in the aggregate amount of $9.6 million and
$10.8 million
in connection with our facility leases. The letters of credit are collateralized by restricted cash and mature at various dates through
August 2029
.
The following table summarizes our cash flows for the periods presented (in thousands):
|
|
Year Ended January 31,
|
||||||||||
|
|
2017
|
2018
|
2019
|
||||||||
|
|
(As Adjusted*)
|
(As Adjusted*)
|
|||||||||
|
Net cash provided by (used in) operating activities
|
$
|
(14,362
|
)
|
$
|
72,756
|
|
$
|
164,423
|
|
||
|
Net cash used in investing activities
|
(441,623
|
)
|
(57,159
|
)
|
(511,344
|
)
|
|||||
|
Net cash provided by financing activities
|
40,518
|
|
46,814
|
|
551,914
|
|
|||||
____________________________
* As adjusted to reflect the impact of the full retrospective adoption of ASC 606. For further information, see Note 2 in Part II, Item 8 of this report.
Operating Activities
Net cash provided by operating activities during the year ended
January 31, 2019
was
$164.4 million
, which resulted from non-cash charges for stock-based compensation of $210.6 million, $70.9 million for depreciation and amortization, $21.0 million for the amortization of the debt discount and debt issuance costs associated with our Notes and net cash inflows of
$45.3 million
from changes in operating assets and liabilities, partially offset by our net loss of
$178.4 million
. The net cash inflows from changes in operating assets and liabilities was primarily the result of a
$161.7 million
increase in deferred revenue and a
$66.1 million
increase in accrued compensation and other liabilities and accounts payable, partially offset by a
$135.6 million
increase in accounts receivable, a $27.7 million increase in deferred commissions, a
$12.3 million
increase in inventory, and a $7.0 million increase in prepaid expenses and other assets. The increases in accounts receivable, deferred revenue, and deferred commissions were primarily attributable to revenue growth during the year ended
January 31, 2019
. The increases in accounts payable, accrued compensation and other liabilities, inventory, and prepaid expenses and other assets were primarily driven by increased activities to support overall business growth.
Net cash provided by operating activities during the year ended
January 31, 2018
was
$72.8 million
, which resulted from non-cash charges for stock-based compensation expense of $150.7 million, $61.7 million for depreciation
44
and amortization and net cash inflows of $18.2 million from changes in operating assets and liabilities, partially offset by our net loss of
$159.9 million
. The net cash inflows from changes in operating assets and liabilities was primarily the result of a
$101.1 million
increase in deferred revenue and a $55.9 million increase in accounts payable and accrued compensation and other liabilities, partially offset by a $74.5 million increase in accounts receivable, $28.0 million increase in deferred commissions, $23.8 million increase in prepaid expenses and other assets, and a $12.6 million increase in inventory. The increases in accounts receivable, deferred revenue, and deferred commissions were primarily attributable to revenue growth during the year ended
January 31, 2018
. The increases in accounts payable, accrued compensation and other liabilities, inventory, and prepaid expenses and other assets were primarily driven by increased activities to support overall business growth.
Net cash used in operating activities during the year ended
January 31, 2017
was
$14.4 million
, which resulted from a net loss of
$221.5 million
, including a $30.0 million one-time legal settlement payment, partially offset by non-cash charges for stock-based compensation expense of $116.7 million, $50.2 million for depreciation and amortization and net cash inflows of $38.7 million from changes in operating assets and liabilities. The net cash inflows from changes in operating assets and liabilities was primarily the result of a
$75.7 million
increase in deferred revenue and a $30.0 million increase in accrued compensation and other liabilities and accounts payable, partially offset by a $44.0 million increase in accounts receivable, $13.1 million increase in deferred commissions, $6.1 million increase in prepaid expenses and other assets and a $3.8 million increase in inventory. The increases in accounts receivable, deferred revenue and deferred commissions were primarily due to new sales order growth during the year ended
January 31, 2017
. The increases in inventory, accrued compensation and other liabilities, accounts payable and prepaid expenses and other assets were primarily driven by increased activities to support overall business growth.
Investing Activities
Net cash used in investing activities during the year ended
January 31, 2019
of
$511.3 million
resulted primarily from net purchases of marketable securities of
$392.2 million
, capital expenditures of
$100.2 million
and net cash paid for our acquisition of StorReduce of $13.9 million in August 2018.
Net cash used in investing activities during the year ended
January 31, 2018
of
$57.2 million
resulted from capital expenditures of
$65.1 million
, partially offset by the net proceeds from sales and maturities of marketable securities of $7.9 million.
Net cash used in investing activities during the year ended
January 31, 2017
of
$441.6 million
resulted from net purchases of marketable securities of $363.9 million, capital expenditures of $76.8 million, as well as the purchase of a portfolio of technology patents for $1.0 million.
Financing Activities
Net cash provided by financing activities of
$551.9 million
during the year ended
January 31, 2019
was primarily due to
$562.1 million
of net proceeds from the issuance of the Notes,
$47.8 million
of proceeds from the exercise of stock options and
$33.4 million
of proceeds from issuance of common stock under our ESPP, partially offset by payment for the purchase of capped calls of
$64.6 million
and the repurchase of our common stock for
$20.0 million
in connection with the Notes and the repayment of
$6.1 million
of debt assumed in connection with our acquisition of StorReduce.
Net cash provided by financing activities of $46.8 million for the year ended
January 31, 2018
was primarily due to
$24.7 million
of proceeds from the exercise of stock options and
$22.1 million
of proceeds from issuance of common stock under ESPP.
Net cash provided by financing activities of
$40.5 million
during the year ended
January 31, 2017
was primarily due to
$25.6 million
of proceeds from issuance of common stock under ESPP and
$14.9 million
of proceeds from the exercise of stock options.
Contractual Obligations and Commitments
The following table sets forth our non-cancelable contractual obligations and commitments as of
January 31, 2019
.
45
|
|
Payment Due by Period
|
|||||||||||||||||||
|
|
Total
|
Less Than
1 Year |
1-3 Years
|
3-5 Years
|
More Than
5 Years |
|||||||||||||||
|
|
(in thousands)
|
|||||||||||||||||||
|
Convertible senior notes due 2023
(1)
|
$
|
578,235
|
|
$
|
719
|
|
$
|
1,438
|
|
$
|
576,078
|
|
$
|
—
|
|
|||||
|
Operating leases
|
149,567
|
|
31,297
|
|
52,954
|
|
35,220
|
|
30,096
|
|
||||||||||
|
Purchase obligations
|
21,389
|
|
3,062
|
|
18,327
|
|
—
|
|
—
|
|
||||||||||
|
Total
|
$
|
749,191
|
|
$
|
35,078
|
|
$
|
72,719
|
|
$
|
611,298
|
|
$
|
30,096
|
|
|||||
_________________________________
(1) Consists of principal and interest payments.
Purchase orders are not included in the table above. Our purchase orders represent authorizations to purchase rather than binding agreements. The contractual commitment amounts in the table above are associated with agreements that are enforceable and legally binding. Obligations under contracts that we can cancel without a significant penalty are not included in the table above.
As of
January 31, 2018
and
2019
, the aggregate future minimum payments under non-cancelable operating leases was approximately $113.0 million and
$149.6 million
.
In April 2018, we issued
$575.0 million
of
0.125%
convertible senior notes due 2023, in a private placement and received proceeds of
$562.1 million
, after deducting the underwriters' discounts and commissions. The Notes are unsecured obligations that do not contain any financial covenants or restrictions on the payments of dividends, the incurrence of indebtedness, or the issuance or repurchase of securities by us or any of our subsidiaries. See further discussion in Note 6 in Part II, Item 8 of this annual report.
Off-Balance Sheet Arrangements
Through
January 31, 2019
, we did not have any relationships with any entities or financial partnerships, such as structured finance or special purpose entities established for the purpose of facilitating off-balance sheet arrangements or other purposes.
Provision for Income Taxes
As of
January 31, 2019
, we had U.S. federal and state net operating loss (NOL) carryforwards of
$772.1 million
and
$451.5 million
, that expire commencing in
2029
. Under Section 382 of the U.S. Internal Revenue Code of 1986, a corporation that undergoes an “ownership change” is subject to limitations on its ability to utilize its pre-change NOLs to offset future taxable income. In February 2019, we completed an analysis through January 2019 to evaluate whether there are any limitations of our NOLs and concluded no limitations currently exist. While we do not have any limitations currently existing, an ownership change that would result in limitations, regulatory changes, such as suspension on the use of NOLs, could result in the expiration of our NOLs or otherwise cause them to be unavailable to offset future income tax liabilities.
Critical Accounting Policies and Estimates
Our consolidated financial statements are prepared in accordance with U.S. generally accepted accounting principles (GAAP). The preparation of these financial statements requires us to make estimates and assumptions that affect the reported amounts of assets, liabilities, revenue, expenses, and related disclosures. We evaluate our estimates and assumptions on an ongoing basis. Our estimates are based on historical experience and various other assumptions that we believe to be reasonable under the circumstances. Our actual results could differ from these estimates.
The critical accounting estimates, assumptions and judgments that we believe have the most significant impact on our consolidated financial statements are described below.
Revenue Recognition
We derive revenue from two sources: (1) product revenue which includes hardware and embedded software and (2) support subscription revenue which includes customer support, our ES2 offering, hardware maintenance, and software upgrades on a when-and-if-available basis.
46
Our product revenue is derived from the sale of storage hardware and operating system software that is integrated into the hardware. We typically recognize product revenue upon transfer of control to our customers. Products are typically shipped directly by us to customers, and our channel partners do not stock our inventory.
Our support subscription revenue is derived from the sale of support subscription, which includes the right to receive unspecified software upgrades and enhancements on a when-and-if-available basis, bug fixes, parts replacement services related to the hardware, as well as access to our cloud-based management and support platform. Support subscription revenue is also derived from the sale of our ES2 offering. Revenue related to support subscription is recognized ratably over the contractual term, which generally ranges from one to six years and represents our performance obligations period. The vast majority of our products are sold with support subscription agreements, which typically commence upon transfer of control of the corresponding products to our customers. Costs to service the support subscription are expensed as incurred. In addition, our
Evergreen Storage
program provides our customers who continually maintain active support subscription agreements for three years with an included controller refresh with each additional three year support subscription renewal. In accordance with revenue recognition guidance, the controller refresh represents an additional performance obligation and the allocated revenue is recognized in the period in which these controllers are shipped.
We recognize revenue upon the transfer of promised goods or services to customers in an amount that reflects the consideration we expect to be entitled to in exchange for those goods or services. This is achieved through applying the following five-step approach:
|
•
|
Identification of the contract, or contracts, with a customer
|
|
•
|
Identification of the performance obligations in the contract
|
|
•
|
Determination of the transaction price
|
|
•
|
Allocation of the transaction price to the performance obligations in the contract
|
|
•
|
Recognition of revenue when, or as, we satisfy a performance obligation
|
When applying this five-step approach, we apply judgment in determining the customer's ability and intention to pay, which is based on a variety of factors including the customer's historical payment experience and/or published credit and financial information pertaining to the customer. To the extent a customer contract includes multiple promised goods or services, we determine whether promised goods or services are capable of being distinct in the context of the contract to be accounted for as a separate performance obligation. The transaction price is determined based on the consideration which we will be entitled to in exchange for transferring goods or services to the customer. We allocate the transaction price to each performance obligation for contracts that contain multiple performance obligations based on a relative standalone selling price which is determined based on the price at which the performance obligation is sold separately, or if not observable through past transactions, is estimated taking into account available information such as market conditions and internally approved pricing guidelines related to the performance obligations.
Deferred Commissions
Deferred commissions consist of incremental costs paid to our sales force to obtain customer contracts. Deferred commissions related to product revenue are recognized upon transfer of control to customers and deferred commissions related to support subscription revenue are amortized over an expected useful life of six years. We determine the expected useful life based on an estimated benefit period by evaluating our technology development life cycle, expected customer relationship period and other factors. We classify deferred commissions as current and non-current on our consolidated balance sheets based on the timing of when we expect to recognize the expense. Amortization of deferred commissions is included in sales and marketing expense in the consolidated statements of operations.
Stock-Based Compensation
We measure and recognize compensation expense for all stock-based awards granted to our employees, including restricted stock units (RSUs), restricted stock, stock options and purchase rights granted under our 2015 ESPP, based on the estimated fair value of the award on the grant date. We use the Black-Scholes option pricing model to estimate the fair value of stock option awards and purchase rights granted under our 2015 ESPP. RSUs and restricted stock are measured at the fair market value of the underlying stock at the grant date. We recognize the fair value of stock-based awards as stock-based compensation expense on a straight line basis over the requisite service period for stock options, RSUs and restricted stock or, in the case of purchase rights granted under our 2015 ESPP, over the offering period. For stock-based awards granted to employees with a performance condition, we recognize stock-based compensation expense for these awards under the accelerated attribution method over the requisite
47
service period when management determines it is probable that the performance condition will be satisfied. We account for forfeitures as they occur.
Our use of the Black-Scholes option pricing model requires the input of highly subjective assumptions, including the fair value of the underlying common stock, expected term of the option, expected volatility of the price of our common stock, risk-free interest rates and the expected dividend yield of our common stock. The assumptions used in our option pricing model represent management’s best estimates. These estimates involve inherent uncertainties and the application of management’s judgment.
These assumptions and estimates are as follows:
|
•
|
Fair Value of Common Stock.
We use the market closing price for our Class A common stock as reported on the New York Stock Exchange on the date of grant.
|
|
•
|
Expected Term.
The expected term represents the period that our stock-based awards are expected to be outstanding. The expected term assumptions were determined based on the vesting terms, exercise terms and contractual lives of the options and ESPP purchase rights.
|
|
•
|
Expected Volatility.
Starting in fiscal 2019, the expected volatility for ESPP purchase rights is based on the historical volatility of our Class A common stock for a period equivalent to the expected term of the ESPP purchase rights. Prior to fiscal 2019, since we had limited trading history of our common stock, the expected volatility for options and ESPP purchase rights was determined based on the historical stock volatilities of our comparable companies. Comparable companies consist of public companies in our industry which are similar in size, stage of life cycle and financial leverage.
|
|
•
|
Risk-Free Interest Rate.
The risk-free interest rate is based on the implied yield available on U.S. Treasury zero-coupon issues with remaining terms similar to the expected term on the options and ESPP purchase rights.
|
|
•
|
Dividend Rate.
We have never declared or paid any cash dividends and do not plan to pay cash dividends in the foreseeable future, and, therefore, use an expected dividend yield of zero.
|
See Note 9 of our Notes to Consolidated Financial Statements included in Part II, Item 8 of this Annual Report on Form 10-K for other information regarding the assumptions used in the Black-Scholes option-pricing model to determine the fair value of our stock options and ESPP purchase rights.
We will continue to use judgment in evaluating the assumptions related to our stock-based compensation on a prospective basis.
Recent Accounting Pronouncements
Refer to “Recent Accounting Pronouncements” in Note 2 of our Notes to Consolidated Financial Statements included in Part II, Item 8 of this Annual Report on Form 10-K.
Item 7A. Quantitative and Qualitative Disclosures about Market Risk.
We have operations both within the United States and internationally, and we are exposed to market risk in the ordinary course of our business.
Interest Rate Risk
Our cash, cash equivalents and marketable securities primarily consist of bank deposits and money market accounts, U.S. government notes and U.S. agency notes, and highly rated corporate debt. As of
January 31, 2018
and
2019
, we had cash, cash equivalents and marketable securities of
$597.3 million
and
$1,197.5 million
. The carrying amount of our cash equivalents reasonably approximates fair value, due to the short maturities of these instruments. The primary objectives of our investment activities are the preservation of capital, the fulfillment of liquidity needs and the fiduciary control of cash and investments. We do not enter into investments for trading or speculative purposes. Our investments are exposed to market risk due to a fluctuation in interest rates, which may affect our interest income and the fair market value of our investments.
We considered the historical volatility of short-term interest rates and determined that it was reasonably possible that an adverse change of 100 basis points could be experienced in the near term. A hypothetical 1.00% (100 basis points) increase in interest rates would have resulted in a decrease in the fair value of our marketable securities of approximately
$6.9 million
as of
January 31, 2019
.
48
Foreign Currency Risk
Our sales contracts are primarily denominated in U.S. dollars with a small number of contracts denominated in foreign currencies. A portion of our operating expenses are incurred outside the United States and denominated in foreign currencies and are subject to fluctuations due to changes in foreign currency exchange rates, particularly changes in the British pound and Euro. Additionally, fluctuations in foreign currency exchange rates may cause us to recognize transaction gains and losses in our statement of operations. Given the impact of foreign currency exchange rates has not been material to our historical operating results, we have not entered into any derivative or hedging transactions, but we may do so in the future if our exposure to foreign currency exchange should become more significant.
We considered the historical trends in currency exchange rates and determined that it was reasonably possible that adverse changes in exchange rates of 10% of all currencies could be experienced in the near term. These reasonably possible adverse changes in exchange rates of 10% were applied to total monetary assets and liabilities denominated in currencies other than U.S. dollar at
January 31, 2019
to compute the adverse impact these changes would have had on our loss before income taxes in the near term. These changes would have resulted in an adverse impact on loss before income taxes of approximately
$6.4 million
as of
January 31, 2019
.
49
Item 8. Financial Statements and Supplementary Data.
PURE STORAGE, INC.
INDEX TO CONSOLIDATED FINANCIAL STATEMENTS
|
|
Page
|
50
REPORT OF INDEPENDENT REGISTERED PUBLIC ACCOUNTING FIRM
To the stockholders and the Board of Directors of Pure Storage, Inc.
Opinion on the Financial Statements
We have audited the accompanying consolidated balance sheets of Pure Storage, Inc. and subsidiaries (the "Company") as of
January 31, 2018
and
2019
, the related consolidated statements of operations, comprehensive loss, stockholders' equity, and cash flows, for each of the three years in the period ended
January 31, 2019
, and the related notes (collectively referred to as the "financial statements").
In our opinion, the financial statements present fairly, in all material respects, the financial position of the Company as of
January 31, 2018
and
2019
, and the results of its operations and its cash flows for each of the three years in the period ended
January 31, 2019
, in conformity with accounting principles generally accepted in the United States of America.
We have also audited, in accordance with the standards of the Public Company Accounting Oversight Board (United States) (PCAOB), the Company's internal control over financial reporting as of
January 31, 2019
, based on criteria established in
Internal Control - Integrated Framework (2013)
issued by the Committee of Sponsoring Organizations of the Treadway Commission and our report dated
March 26, 2019
, expressed an unqualified opinion on the Company's internal control over financial reporting.
Change in Accounting Principle
As discussed in Note 2 to the financial statements, the Company has changed its method of accounting for revenue from contracts with customers in fiscal year 2019 due to the adoption of Financial Accounting Standards Board, issued Accounting Standards Update No. 2014-09,
Revenue from Contracts with Customers
(ASC 606). The Company adopted the standard using the full retrospective approach.
Basis for Opinion
These financial statements are the responsibility of the Company's management. Our responsibility is to express an opinion on the Company's financial statements based on our audits. We are a public accounting firm registered with the PCAOB and are required to be independent with respect to the Company in accordance with the U.S. federal securities laws and the applicable rules and regulations of the Securities and Exchange Commission and the PCAOB.
We conducted our audits in accordance with the standards of the PCAOB. Those standards require that we plan and perform the audit to obtain reasonable assurance about whether the financial statements are free of material misstatement, whether due to error or fraud. Our audits included performing procedures to assess the risks of material misstatement of the financial statements, whether due to error or fraud, and performing procedures that respond to those risks. Such procedures included examining, on a test basis, evidence regarding the amounts and disclosures in the financial statements. Our audits also included evaluating the accounting principles used and significant estimates made by management, as well as evaluating the overall presentation of the financial statements. We believe that our audits provide a reasonable basis for our opinion.
/S/ DELOITTE & TOUCHE LLP
San Jose, California
March 26, 2019
We have served as the Company's auditor since 2013.
51
REPORT OF INDEPENDENT REGISTERED PUBLIC ACCOUNTING FIRM
To the stockholders and the Board of Directors of Pure Storage, Inc.
Opinion on Internal Control over Financial Reporting
We have audited the internal control over financial reporting of Pure Storage, Inc. and subsidiaries (the "Company") as of
January 31, 2019
, based on criteria established in
Internal Control - Integrated Framework (2013)
issued by the Committee of Sponsoring Organizations of the Treadway Commission (COSO). In our opinion, the Company maintained, in all material respects, effective internal control over financial reporting as of
January 31, 2019
, based on criteria established in
Internal Control - Integrated Framework (2013)
issued by COSO.
We have also audited, in accordance with the standards of the Public Company Accounting Oversight Board (United States) (PCAOB), the consolidated financial statements as of and for the year ended
January 31, 2019
, of the Company and our report dated
March 26, 2019
expressed an unqualified opinion on those financial statements and included an explanatory paragraph related to the Company’s change in method of accounting for revenue from contracts with customers in fiscal year 2019 due to the adoption of Accounting Standards Update No. 2014-09,
Revenue from Contracts with Customers
(ASC 606).
Basis for Opinion
The Company's management is responsible for maintaining effective internal control over financial reporting and for its assessment of the effectiveness of internal control over financial reporting, included in the accompanying Management’s Report on Internal Control over Financial Reporting. Our responsibility is to express an opinion on the Company's internal control over financial reporting based on our audit. We are a public accounting firm registered with the PCAOB and are required to be independent with respect to the Company in accordance with the U.S. federal securities laws and the applicable rules and regulations of the Securities and Exchange Commission and the PCAOB.
We conducted our audit in accordance with the standards of the PCAOB. Those standards require that we plan and perform the audit to obtain reasonable assurance about whether effective internal control over financial reporting was maintained in all material respects. Our audit included obtaining an understanding of internal control over financial reporting, assessing the risk that a material weakness exists, testing and evaluating the design and operating effectiveness of internal control based on the assessed risk, and performing such other procedures as we considered necessary in the circumstances. We believe that our audit provides a reasonable basis for our opinion.
Definition and Limitations of Internal Control over Financial Reporting
A company's internal control over financial reporting is a process designed to provide reasonable assurance regarding the reliability of financial reporting and the preparation of financial statements for external purposes in accordance with generally accepted accounting principles. A company's internal control over financial reporting includes those policies and procedures that (1) pertain to the maintenance of records that, in reasonable detail, accurately and fairly reflect the transactions and dispositions of the assets of the company; (2) provide reasonable assurance that transactions are recorded as necessary to permit preparation of financial statements in accordance with generally accepted accounting principles, and that receipts and expenditures of the company are being made only in accordance with authorizations of management and directors of the company; and (3) provide reasonable assurance regarding prevention or timely detection of unauthorized acquisition, use, or disposition of the company's assets that could have a material effect on the financial statements.
Because of its inherent limitations, internal control over financial reporting may not prevent or detect misstatements. Also, projections of any evaluation of effectiveness to future periods are subject to the risk that controls may become inadequate because of changes in conditions, or that the degree of compliance with the policies or procedures may deteriorate.
/S/ DELOITTE & TOUCHE LLP
San Jose, California
March 26, 2019
52
PURE STORAGE, INC.
Consolidated Balance Sheets
(in thousands, except per share data)
|
|
January 31,
|
||||||
|
|
2018
|
2019
|
|||||
|
(As Adjusted*)
|
|||||||
|
ASSETS
|
|
|
|
|
|||
|
Current assets:
|
|
|
|
|
|||
|
Cash and cash equivalents
|
$
|
244,057
|
|
$
|
447,990
|
|
|
|
Marketable securities
|
353,289
|
|
749,482
|
|
|||
|
Accounts receivable, net of allowance of $1,062 and $660 as of January 31, 2018 and 2019
|
243,001
|
|
378,729
|
|
|||
|
Inventory
|
34,497
|
|
44,687
|
|
|||
|
Deferred commissions, current
|
21,088
|
|
29,244
|
|
|||
|
Prepaid expenses and other current assets
|
47,552
|
|
51,695
|
|
|||
|
Total current assets
|
943,484
|
|
1,701,827
|
|
|||
|
Property and equipment, net
|
89,142
|
|
125,353
|
|
|||
|
Deferred commissions, non-current
|
66,225
|
|
85,729
|
|
|||
|
Intangible assets, net
|
5,057
|
|
20,118
|
|
|||
|
Goodwill
|
—
|
|
10,997
|
|
|||
|
Deferred income taxes, non-current
|
1,060
|
|
1,060
|
|
|||
|
Restricted cash
|
14,763
|
|
15,823
|
|
|||
|
Other assets, non-current
|
4,264
|
|
12,118
|
|
|||
|
Total assets
|
$
|
1,123,995
|
|
$
|
1,973,025
|
|
|
|
LIABILITIES AND STOCKHOLDERS’ EQUITY
|
|
|
|
|
|||
|
Current liabilities:
|
|
|
|
|
|||
|
Accounts payable
|
$
|
84,420
|
|
$
|
103,462
|
|
|
|
Accrued compensation and benefits
|
59,898
|
|
99,910
|
|
|||
|
Accrued expenses and other liabilities
|
27,149
|
|
39,860
|
|
|||
|
Deferred revenue, current
|
191,229
|
|
266,584
|
|
|||
|
Total current liabilities
|
362,696
|
|
509,816
|
|
|||
|
Convertible senior notes, net
|
—
|
|
449,828
|
|
|||
|
Deferred revenue, non-current
|
182,873
|
|
269,336
|
|
|||
|
Other liabilities, non-current
|
4,025
|
|
6,265
|
|
|||
|
Total liabilities
|
549,594
|
|
1,235,245
|
|
|||
|
Commitments and contingencies (Note 7)
|
|
|
|
|
|||
|
Stockholders’ equity:
|
|
|
|
|
|||
|
Preferred stock, par value of $0.0001 per share— 20,000 shares
authorized as of January 31, 2018 and 2019; no shares issued and outstanding as of January 31, 2018 and 2019 |
—
|
|
—
|
|
|||
|
Class A and Class B common stock, par value of $0.0001 per share— 2,250,000 (Class A 2,000,000, Class B 250,000) shares authorized as of January 31, 2018 and 2019; 220,979 (Class A 129,502, Class B 91,477) and 243,524 Class A shares issued and outstanding as of January 31, 2018 and 2019
|
22
|
|
24
|
|
|||
|
Additional paid-in capital
|
1,479,883
|
|
1,820,043
|
|
|||
|
Accumulated other comprehensive loss
|
(1,917
|
)
|
(338
|
)
|
|||
|
Accumulated deficit
|
(903,587
|
)
|
(1,081,949
|
)
|
|||
|
Total stockholders’ equity
|
574,401
|
|
737,780
|
|
|||
|
Total liabilities and stockholders’ equity
|
$
|
1,123,995
|
|
$
|
1,973,025
|
|
|
* As adjusted to reflect the impact of the full retrospective adoption of ASC 606 - see Note 2.
See the accompanying notes to the consolidated financial statements.
53
PURE STORAGE, INC.
Consolidated Statements of Operations
(in thousands, except per share data)
|
|
Year Ended January 31,
|
||||||||||
|
|
2017
|
2018
|
2019
|
||||||||
|
(As Adjusted*)
|
(As Adjusted*)
|
||||||||||
|
Revenue:
|
|
|
|
|
|
|
|||||
|
Product
|
$
|
614,458
|
|
$
|
834,454
|
|
$
|
1,075,586
|
|
||
|
Support subscription
|
124,713
|
|
190,308
|
|
284,238
|
|
|||||
|
Total revenue
|
739,171
|
|
1,024,762
|
|
1,359,824
|
|
|||||
|
Cost of revenue:
|
|
|
|
|
|||||||
|
Product
|
194,150
|
|
275,242
|
|
352,054
|
|
|||||
|
Support subscription
|
58,129
|
|
78,539
|
|
105,474
|
|
|||||
|
Total cost of revenue
|
252,279
|
|
353,781
|
|
457,528
|
|
|||||
|
Gross profit
|
486,892
|
|
670,981
|
|
902,296
|
|
|||||
|
Operating expenses:
|
|
|
|
|
|||||||
|
Research and development
|
245,817
|
|
279,196
|
|
349,936
|
|
|||||
|
Sales and marketing
|
347,695
|
|
464,049
|
|
584,111
|
|
|||||
|
General and administrative
|
84,652
|
|
95,170
|
|
137,506
|
|
|||||
|
Legal settlement
|
30,000
|
|
—
|
|
—
|
|
|||||
|
Total operating expenses
|
708,164
|
|
838,415
|
|
1,071,553
|
|
|||||
|
Loss from operations
|
(221,272
|
)
|
(167,434
|
)
|
(169,257
|
)
|
|||||
|
Other income (expense), net
|
1,627
|
|
11,445
|
|
(8,016
|
)
|
|||||
|
Loss before provision for income taxes
|
(219,645
|
)
|
(155,989
|
)
|
(177,273
|
)
|
|||||
|
Provision for income taxes
|
1,887
|
|
3,889
|
|
1,089
|
|
|||||
|
Net loss
|
$
|
(221,532
|
)
|
$
|
(159,878
|
)
|
$
|
(178,362
|
)
|
||
|
Net loss per share attributable to common stockholders, basic and diluted
|
$
|
(1.14
|
)
|
$
|
(0.76
|
)
|
$
|
(0.77
|
)
|
||
|
Weighted-average shares used in computing net loss per share attributable to common stockholders, basic and diluted
|
194,714
|
|
211,609
|
|
232,042
|
|
|||||
*As adjusted to reflect the impact of the full retrospective adoption of ASC 606 - see Note 2.
See the accompanying notes to the consolidated financial statements.
54
PURE STORAGE, INC.
Consolidated Statements of Comprehensive Loss
(in thousands)
|
|
Year Ended January 31,
|
||||||||||
|
|
2017
|
2018
|
2019
|
||||||||
|
(As Adjusted*)
|
|
(As Adjusted*)
|
|
||||||||
|
Net loss
|
$
|
(221,532
|
)
|
$
|
(159,878
|
)
|
$
|
(178,362
|
)
|
||
|
Other comprehensive loss:
|
|||||||||||
|
Change in unrealized net gain (loss) on available-for-sale securities
|
(562
|
)
|
(1,355
|
)
|
1,579
|
|
|||||
|
Comprehensive loss
|
$
|
(222,094
|
)
|
$
|
(161,233
|
)
|
$
|
(176,783
|
)
|
||
* As adjusted to reflect the impact of the full retrospective adoption of ASC 606 - see Note 2.
See the accompanying notes to consolidated financial statements.
55
PURE STORAGE, INC.
Consolidated Statements of Stockholders’ Equity
(in thousands)
|
|
Common Stock
|
Additional
Paid-In Capital |
Accumulated
Other
Comprehensive
Loss
|
Accumulated Deficit
|
Total Stockholders' Equity
|
||||||||||||||||||
|
|
Shares
|
Amount
|
|||||||||||||||||||||
|
Balance—January 31, 2016
|
190,509
|
|
$
|
19
|
|
$
|
1,118,670
|
|
$
|
—
|
|
$
|
(555,335
|
)
|
$
|
563,354
|
|
||||||
|
Cumulative effect adjustment from adoption of ASU 2016-09
|
—
|
|
—
|
|
2,079
|
|
—
|
|
(2,079
|
)
|
—
|
|
|||||||||||
|
Cumulative effect adjustment from adoption of ASC 606
|
—
|
|
—
|
|
—
|
|
35,237
|
|
35,237
|
|
|||||||||||||
|
Issuance of common stock upon exercise of stock options
|
10,180
|
|
1
|
|
15,030
|
|
—
|
|
—
|
|
15,031
|
|
|||||||||||
|
Stock-based compensation expense
|
—
|
|
—
|
|
116,668
|
|
—
|
|
—
|
|
116,668
|
|
|||||||||||
|
Vesting of early exercised stock options
|
—
|
|
—
|
|
3,399
|
|
—
|
|
—
|
|
3,399
|
|
|||||||||||
|
Vesting of restricted stock units
|
1,238
|
|
—
|
|
—
|
|
—
|
|
—
|
|
—
|
|
|||||||||||
|
Common stock issued under employee stock purchase plan
|
2,437
|
|
—
|
|
25,606
|
|
—
|
|
—
|
|
25,606
|
|
|||||||||||
|
Other comprehensive loss
|
—
|
|
—
|
|
—
|
|
(562
|
)
|
—
|
|
(562
|
)
|
|||||||||||
|
Net loss, as adjusted from adoption of ASC 606
|
—
|
|
—
|
|
—
|
|
—
|
|
(221,532
|
)
|
(221,532
|
)
|
|||||||||||
|
Balance—January 31, 2017
|
204,364
|
|
$
|
20
|
|
$
|
1,281,452
|
|
$
|
(562
|
)
|
$
|
(743,709
|
)
|
$
|
537,201
|
|
||||||
|
Issuance of common stock upon exercise of stock options
|
8,814
|
|
1
|
|
24,580
|
|
—
|
|
—
|
|
24,581
|
|
|||||||||||
|
Stock-based compensation expense
|
—
|
|
—
|
|
150,673
|
|
—
|
|
—
|
|
150,673
|
|
|||||||||||
|
Vesting of early exercised stock options
|
—
|
|
—
|
|
1,042
|
|
—
|
|
—
|
|
1,042
|
|
|||||||||||
|
Vesting of restricted stock units
|
5,278
|
|
1
|
|
(1
|
)
|
—
|
|
—
|
|
—
|
|
|||||||||||
|
Common stock issued under employee stock purchase plan
|
2,523
|
|
—
|
|
22,137
|
|
—
|
|
—
|
|
22,137
|
|
|||||||||||
|
Other comprehensive loss
|
—
|
|
—
|
|
—
|
|
(1,355
|
)
|
—
|
|
(1,355
|
)
|
|||||||||||
|
Net loss, as adjusted from adoption of ASC 606
|
—
|
|
—
|
|
—
|
|
—
|
|
(159,878
|
)
|
(159,878
|
)
|
|||||||||||
|
Balance—January 31, 2018
|
220,979
|
|
$
|
22
|
|
$
|
1,479,883
|
|
$
|
(1,917
|
)
|
$
|
(903,587
|
)
|
$
|
574,401
|
|
||||||
|
Issuance of common stock upon exercise of stock options
|
9,397
|
|
1
|
|
47,749
|
|
—
|
|
—
|
|
47,750
|
|
|||||||||||
|
Stock-based compensation expense
|
—
|
|
—
|
|
210,645
|
|
—
|
|
—
|
|
210,645
|
|
|||||||||||
|
Vesting of early exercised stock options
|
—
|
|
—
|
|
320
|
|
—
|
|
—
|
|
320
|
|
|||||||||||
|
Vesting of restricted stock units
|
8,378
|
|
1
|
|
(1
|
)
|
—
|
|
—
|
|
—
|
|
|||||||||||
|
Net issuance of restricted stock
|
2,398
|
|
—
|
|
—
|
|
—
|
|
—
|
|
—
|
|
|||||||||||
|
Tax withholding on vesting of restricted stock
|
—
|
|
—
|
|
(632
|
)
|
—
|
|
—
|
|
(632
|
)
|
|||||||||||
|
Common stock issued under employee stock purchase plan
|
3,381
|
|
—
|
|
33,444
|
|
—
|
|
—
|
|
33,444
|
|
|||||||||||
|
Repurchase of common stock
|
(1,009
|
)
|
—
|
|
(20,000
|
)
|
—
|
|
—
|
|
(20,000
|
)
|
|||||||||||
|
Purchase of capped calls
|
—
|
|
—
|
|
(64,630
|
)
|
—
|
|
—
|
|
(64,630
|
)
|
|||||||||||
|
Equity component of convertible senior notes, net
|
—
|
|
—
|
|
133,265
|
|
—
|
|
—
|
|
133,265
|
|
|||||||||||
|
Other comprehensive gain
|
—
|
|
—
|
|
—
|
|
1,579
|
|
—
|
|
1,579
|
|
|||||||||||
|
Net loss
|
—
|
|
—
|
|
—
|
|
—
|
|
(178,362
|
)
|
(178,362
|
)
|
|||||||||||
|
Balance—January 31, 2019
|
243,524
|
|
$
|
24
|
|
$
|
1,820,043
|
|
$
|
(338
|
)
|
$
|
(1,081,949
|
)
|
$
|
737,780
|
|
||||||
See the accompanying notes to the consolidated financial statements.
56
PURE STORAGE, INC.
Consolidated Statements of Cash Flows
(in thousands)
|
|
Year Ended January 31,
|
||||||||||
|
|
2017
|
2018
|
2019
|
||||||||
|
(As Adjusted*)
|
(As Adjusted*)
|
||||||||||
|
CASH FLOWS FROM OPERATING ACTIVITIES
|
|||||||||||
|
Net loss
|
$
|
(221,532
|
)
|
$
|
(159,878
|
)
|
$
|
(178,362
|
)
|
||
|
Adjustments to reconcile net loss to net cash provided by (used in) operating activities:
|
|
|
|
|
|||||||
|
Depreciation and amortization
|
50,203
|
|
61,744
|
|
70,878
|
|
|||||
|
Amortization of debt discount and debt issuance costs
|
—
|
|
—
|
|
21,031
|
|
|||||
|
Stock-based compensation expense
|
116,668
|
|
150,673
|
|
210,645
|
|
|||||
|
Deferred income tax
|
(308
|
)
|
(216
|
)
|
(3,696
|
)
|
|||||
|
Other
|
1,892
|
|
2,270
|
|
(1,343
|
)
|
|||||
|
Changes in operating assets and liabilities, net of effects of acquisition:
|
|
|
|
|
|||||||
|
Accounts receivable, net
|
(44,049
|
)
|
(74,505
|
)
|
(135,649
|
)
|
|||||
|
Inventory
|
(3,776
|
)
|
(12,595
|
)
|
(12,289
|
)
|
|||||
|
Deferred commissions
|
(13,080
|
)
|
(27,978
|
)
|
(27,660
|
)
|
|||||
|
Prepaid expenses and other assets
|
(6,133
|
)
|
(23,799
|
)
|
(6,972
|
)
|
|||||
|
Accounts payable
|
10,644
|
|
29,278
|
|
14,293
|
|
|||||
|
Accrued compensation and other liabilities
|
19,381
|
|
26,622
|
|
51,810
|
|
|||||
|
Deferred revenue
|
75,728
|
|
101,140
|
|
161,737
|
|
|||||
|
Net cash provided by (used in) operating activities
|
(14,362
|
)
|
72,756
|
|
164,423
|
|
|||||
|
CASH FLOWS FROM INVESTING ACTIVITIES
|
|
|
|
|
|
|
|||||
|
Purchases of property and equipment
|
(76,773
|
)
|
(65,060
|
)
|
(100,246
|
)
|
|||||
|
Acquisition, net of cash acquired
|
—
|
|
—
|
|
(13,899
|
)
|
|||||
|
Purchase of other investment
|
—
|
|
—
|
|
(5,000
|
)
|
|||||
|
Purchase of intangible assets
|
(1,000
|
)
|
—
|
|
—
|
|
|||||
|
Purchases of marketable securities
|
(526,717
|
)
|
(202,656
|
)
|
(665,357
|
)
|
|||||
|
Sales of marketable securities
|
114,354
|
|
66,489
|
|
19,878
|
|
|||||
|
Maturities of marketable securities
|
48,513
|
|
144,068
|
|
253,280
|
|
|||||
|
Net cash used in investing activities
|
(441,623
|
)
|
(57,159
|
)
|
(511,344
|
)
|
|||||
|
CASH FLOWS FROM FINANCING ACTIVITIES
|
|
|
|
|
|
|
|||||
|
Net proceeds from exercise of stock options
|
14,912
|
|
24,677
|
|
47,771
|
|
|||||
|
Proceeds from issuance of common stock under employee stock purchase plan
|
25,606
|
|
22,137
|
|
33,444
|
|
|||||
|
Proceeds from issuance of convertible senior notes, net of issuance costs
|
—
|
|
—
|
|
562,062
|
|
|||||
|
Payment for purchase of capped calls
|
—
|
|
—
|
|
(64,630
|
)
|
|||||
|
Repayment of debt assumed from acquisition
|
—
|
|
—
|
|
(6,101
|
)
|
|||||
|
Tax withholding on vesting of restricted stock
|
—
|
|
—
|
|
(632
|
)
|
|||||
|
Repurchase of common stock
|
—
|
|
—
|
|
(20,000
|
)
|
|||||
|
Net cash provided by financing activities
|
40,518
|
|
46,814
|
|
551,914
|
|
|||||
|
Net increase (decrease) in cash, cash equivalents and restricted cash
|
(415,467
|
)
|
62,411
|
|
204,993
|
|
|||||
|
Cash, cash equivalents and restricted cash, beginning of year
|
611,876
|
|
196,409
|
|
258,820
|
|
|||||
|
Cash, cash equivalents and restricted cash, end of year
|
$
|
196,409
|
|
$
|
258,820
|
|
$
|
463,813
|
|
||
|
CASH, CASH EQUIVALENTS AND RESTRICTED CASH AT END OF YEAR
|
|||||||||||
|
Cash and cash equivalents
|
$
|
183,675
|
|
$
|
244,057
|
|
$
|
447,990
|
|
||
|
Restricted cash
|
$
|
12,734
|
|
$
|
14,763
|
|
$
|
15,823
|
|
||
|
Cash, cash equivalents and restricted cash, end of year
|
$
|
196,409
|
|
$
|
258,820
|
|
$
|
463,813
|
|
||
|
SUPPLEMENTAL DISCLOSURES OF CASH FLOW INFORMATION
|
|
|
|
|
|||||||
|
Cash paid for interest
|
$
|
—
|
|
$
|
—
|
|
$
|
371
|
|
||
|
Cash paid for income taxes
|
$
|
2,866
|
|
$
|
3,090
|
|
$
|
4,696
|
|
||
|
SUPPLEMENTAL DISCLOSURES OF NON-CASH
INVESTING AND FINANCING INFORMATION |
|
|
|
|
|
|
|||||
|
Property and equipment purchased but not yet paid
|
$
|
7,414
|
|
$
|
9,940
|
|
$
|
13,873
|
|
||
|
Acquisition consideration held back to satisfy potential indemnification claims
|
$
|
—
|
|
$
|
—
|
|
$
|
3,725
|
|
||
|
Vesting of early exercised stock options
|
$
|
3,399
|
|
$
|
1,042
|
|
$
|
320
|
|
||
* As adjusted to reflect the impact of ASU 2016-18 and the full retrospective adoption of ASC 606 - see Note 2.
See the accompanying notes to the consolidated financial statements.
57
PURE STORAGE, INC.
Notes to Consolidated Financial Statements
Note 1. Business Overview
Organization and Description of Business
Pure Storage, Inc. (the Company, we, us, or other similar pronouns) was originally incorporated in the state of Delaware in October 2009 under the name OS76, Inc. In January 2010, we changed our name to Pure Storage, Inc. We are headquartered in Mountain View, California and have wholly owned subsidiaries throughout the world.
We help innovators to build a better world with data. Our innovative data platform replaces storage systems designed for mechanical disk with all-flash systems optimized end-to-end for solid-state memory. Our
Pure1
cloud-based support and management platform simplifies storage administration, while real-time scanning enables us to find and fix issues before they have an impact. Our innovative business model replaces the traditional forklift upgrade cycle with an
Evergreen Storage
subscription model to hardware and software innovation, support and maintenance.
Note 2. Basis of Presentation and Summary of Significant Accounting Policies
Principles of Consolidation
The consolidated financial statements include the accounts of the Company and our wholly owned subsidiaries and have been prepared in conformity with accounting principles generally accepted in the United States (U.S. GAAP). All intercompany balances and transactions have been eliminated in consolidation.
Foreign Currency
The functional currency of our foreign subsidiaries is the U.S. dollar. Transactions denominated in currencies other than the functional currency are remeasured to the functional currency at the average exchange rate in effect during the period. At the end of each reporting period, monetary assets and liabilities are remeasured using exchange rates in effect at the balance sheet date. Non-monetary assets and liabilities are remeasured at historical exchange rates. Foreign currency transaction gains and losses are recorded in other income (expense), net in the consolidated statements of operations.
Use of Estimates
The preparation of financial statements in conformity with U.S. GAAP requires management to make estimates and assumptions that affect the amounts reported and disclosed in the financial statements and accompanying notes. Actual results could differ from these estimates. Such estimates include, but are not limited to, the determination of standalone selling price for revenue arrangements with multiple performance obligations, useful lives of intangible assets, property and equipment, the period of benefit for deferred contract costs for commissions, stock-based compensation, provision for income taxes including related reserves, valuation of intangible assets and goodwill, and contingent liabilities. Management bases its estimates on historical experience and on various other assumptions which management believes to be reasonable, the results of which form the basis for making judgments about the carrying values of assets and liabilities.
Concentration Risk
Financial instruments that are exposed to concentration of credit risk consist primarily of cash and cash equivalents, marketable securities, and accounts receivable. As of
January 31, 2018
and
2019
, the majority of our cash and cash equivalents have been invested with three financial institutions and such deposits exceed federally insured limits. Management believes that the financial institutions that hold our investments are financially sound and, accordingly, are subject to minimal credit risk. We define a customer as an end user that purchases our products and services from
one
of our channel partners or from us directly. The majority of our revenue and accounts receivable are derived from the United States across a multitude of industries. We perform ongoing evaluations to determine customer credit. As of
January 31, 2019
, we had one channel partner that represented
10%
of total accounts receivable on that date. As of
January 31, 2018
, no channel partner represented
10%
or more of total accounts receivable on that date.
No
channel partner represented
10%
or more of revenue for the year ended
January 31, 2018
.
One
channel partner represented
11%
of revenue for the years ended
January 31, 2017
and
2019
.
No
end user customer represented
10%
or more of revenue for the years ended
January 31, 2017
,
2018
and
2019
. We rely on a limited number of suppliers for our contract manufacturing and certain raw material components. In instances where suppliers fail to perform their
58
obligations, we may be unable to find alternative suppliers or satisfactorily deliver our products to our customers on time.
Cash and Cash Equivalents
Cash and cash equivalents consist of cash in banks and highly liquid investments, primarily money market accounts, purchased with an original maturity of three months or less.
Marketable Securities
We classify our marketable securities as available-for-sale at the time of purchase and reevaluate such classification at each balance sheet date. We may sell these securities at any time for use in current operations even if they have not yet reached maturity. As a result, we classify our securities, including those with maturities beyond twelve months, as current assets in the consolidated balance sheets. We carry these securities at fair value and record unrealized gains and losses in other comprehensive income (loss), which is reflected as a component of stockholders' equity. We evaluate our securities to assess whether those with unrealized loss positions are other than temporarily impaired. We consider impairments to be other than temporary if they are related to deterioration in credit risk or if it is likely we will sell the securities before the recovery of their cost basis. Realized gains and losses from the sale of marketable securities and declines in value deemed to be other than temporary are determined based on the specific identification method. Realized gains and losses are reported in other income (expense), net in the consolidated statements of operations.
Fair Value of Financial Instruments
The carrying value of our financial instruments, including cash equivalents, accounts receivable, accounts payable and accrued liabilities, approximates fair value.
Accounts Receivable and Allowance
Accounts receivable are recorded at the invoiced amount, and stated at realizable value, net of an allowance for doubtful accounts. Credit is extended to customers based on an evaluation of their financial condition and other factors. We generally do not require collateral or other security to support accounts receivable. We perform ongoing credit evaluations of our customers and maintain an allowance for doubtful accounts.
We assess the collectability of the accounts by taking into consideration the aging of our trade receivables, historical experience, and management judgment. We write off trade receivables against the allowance when management determines a balance is uncollectible and no longer actively pursues collection of the receivable.
The following table presents the changes in the allowance for doubtful accounts:
|
|
Year Ended January 31,
|
||||||||||
|
|
2017
|
2018
|
2019
|
||||||||
|
|
(in thousands)
|
||||||||||
|
Allowance for doubtful accounts, beginning balance
|
$
|
944
|
|
$
|
2,000
|
|
$
|
1,062
|
|
||
|
Provision, net
|
1,394
|
|
482
|
|
(79
|
)
|
|||||
|
Writeoffs
|
(338
|
)
|
(1,420
|
)
|
(323
|
)
|
|||||
|
Allowance for doubtful accounts, ending balance
|
$
|
2,000
|
|
$
|
1,062
|
|
$
|
660
|
|
||
Restricted Cash
Restricted cash is comprised of cash collateral for letters of credit related to our leases and for a vendor credit card program. As of
January 31, 2018
and
2019
, we had restricted cash of
$14.8 million
and
$15.8 million
, which was included in other assets, non-current in the consolidated balance sheets.
Inventory
Inventory consists of finished goods and component parts, which are purchased from contract manufacturers. Product demonstration units, which we regularly sell, are the primary component of our inventories. Inventories are stated at the lower of cost or net realizable value. Cost is determined using the specific identification method for finished
59
goods and weighted-average method for component parts. We account for excess and obsolete inventory by reducing the carrying value to the estimated net realizable value of the inventory based upon management’s assumptions about future demand and market conditions. In addition, we record a liability for firm, non-cancelable and unconditional purchase commitments with contract manufacturers and suppliers for quantities in excess of future demand forecasts consistent with excess and obsolete inventory valuations. As of
January 31, 2019
, we did not record any liability related to the above. Inventory write-offs were insignificant for the years ended
January 31, 2017
,
2018
and
2019
.
Property and Equipment
Property and equipment are stated at cost less accumulated depreciation and amortization. Depreciation and amortization is computed using the straight-line method over the estimated useful lives of the respective assets (test equipment—
2 years
, computer equipment and software—
2
to
3 years
, furniture and fixtures—
7 years
). Leasehold improvements are amortized over the
shorter of their estimated useful lives or the remaining lease term
. Depreciation commences once the asset is placed in service.
Business Combination
We allocate the purchase price to the assets acquired and liabilities assumed based on their estimated fair values. The excess of the purchase price over the fair values of the assets acquired and liabilities assumed is recorded as goodwill. During the measurement period, which may be up to one year from the acquisition date, we may record adjustments to the estimated fair value of the assets acquired and liabilities assumed, with the corresponding offset to goodwill. The results of operations of an acquired business is included in our consolidated financial statements from the date of acquisition. Acquisition-related expenses are expensed as incurred.
Goodwill
Goodwill represents the excess of the purchase price consideration over the estimated fair value of the tangible and intangible assets acquired and liabilities assumed in a business combination. Goodwill is evaluated for impairment annually in the fourth quarter of our fiscal year as a single reporting unit, and whenever events or changes in circumstances indicate the carrying value of goodwill may not be recoverable. We may elect to qualitatively assess whether it is more likely than not that the fair value of our reporting unit is less than its carrying value. If we opt not to qualitatively assess, a two step goodwill impairment test is performed. The first step compares our reporting unit's carrying value, including goodwill, to its fair value calculated based on our enterprise value. If the carrying value exceeds its fair value, the second step compares the carrying value of the goodwill to its implied fair value. If the carrying value exceeds the implied fair value, an impairment loss is recognized for the excess. We did not recognize any impairment of goodwill in the year ended January 31, 2019.
Purchased Intangible Assets
Purchased intangible assets with finite lives are stated at cost, net of accumulated amortization. We amortize our intangible assets on a straight-line basis over an estimated useful life of
five
to
seven
years.
Impairment of Long-Lived Assets
We review our long-lived assets, including property and equipment, and finite-lived intangible assets for impairment whenever events or changes in circumstances indicate the carrying amount of an asset may not be recoverable. We measure the recoverability of these assets by comparing the carrying amounts to the future undiscounted cash flows the assets are expected to generate. If the total of the future undiscounted cash flows is less than the carrying amount of an asset, we record an impairment charge for the amount by which the carrying amount of the asset exceeds its fair market value. There have been
no
impairment charges recorded in any of the periods presented in the consolidated financial statements.
Convertible Senior Notes
In accounting for the issuance of our convertible senior notes (the Notes), we separated the Notes into liability and equity components. The carrying amount of the liability component was determined by measuring the fair value of a similar liability that does not have an associated convertible feature. The carrying amount of the equity component representing the conversion option was calculated by deducting the fair value of the liability component from the principal amount of the Notes as a whole. The difference between the principal amount of the Notes and the liability
60
component (the debt discount) is amortized to interest expense in the consolidated statements of operations using the effective interest method over the term of the Notes. The equity component of the Notes is included in additional paid-in capital in the consolidated balance sheets and is not remeasured as long as it continues to meet the conditions for equity classification. In accounting for the transaction costs related to the issuance of the Notes, we allocated the total amount incurred to the liability and equity components using the same proportions as the initial carrying value of the Notes. Transaction costs attributable to the liability component were netted with the principal amount of the Notes in the consolidated balance sheets and are being amortized to interest expense in the consolidated statements of operations using the effective interest method over the term of the Notes. Transaction costs attributable to the equity component were netted with the equity component of the Notes in additional paid-in capital in the consolidated balance sheets.
Deferred Commissions
Deferred commissions consist of incremental costs paid to our sales force to obtain customer contracts. Deferred commissions related to product revenue are recognized upon transfer of control to customers and deferred commissions related to support subscription revenue are amortized over an expected useful life of
si
x years. We determine the expected useful life based on an estimated benefit period by evaluating our technology development life cycle, expected customer relationship period and other factors. We classify deferred commissions as current and non-current on our consolidated balance sheets based on the timing of when we expect to recognize the expense. Amortization of deferred commissions is included in sales and marketing expense in the consolidated statements of operations.
Changes in total deferred commissions during the periods presented are as follows (in thousands):
|
Year Ended January 31, 2018
|
Year Ended January 31, 2019
|
||||||
|
Beginning balance
(1)
|
$
|
59,394
|
|
$
|
87,313
|
|
|
|
Additions
|
121,752
|
|
131,084
|
|
|||
|
Recognition of deferred commissions
|
(93,833
|
)
|
(103,424
|
)
|
|||
|
Ending balance
|
$
|
87,313
|
|
$
|
114,973
|
|
|
____________________
(1)
Balance as of
January 31, 2018
was adjusted to reflect the full retrospective adoption of ASC 606
.
During the years ended
January 31, 2017
,
2018
and
2019
, we recognized sales commission expenses of
$71.3 million
,
$102.9 million
, and
$118.4 million
. Of the
$115.0 million
total deferred commissions balance as of
January 2019
, we expect to recognize approximately
25%
as commission expense over the next 12 months and the remainder thereafter.
There was no impairment related to capitalized commissions for the years ended
January 31, 2017
,
2018
and
2019
.
Deferred Revenue
Deferred revenue primarily consists of amounts that have been invoiced but that have not yet been recognized as revenue and performance obligations pertaining to support subscription services. The current portion of deferred revenue represents the amounts that are expected to be recognized as revenue within one year of the consolidated balance sheet dates.
Changes in total deferred revenue during the periods presented are as follows (in thousands):
|
Year Ended January 31, 2018
|
Year Ended January 31, 2019
|
||||||
|
Beginning balance
(1)
|
$
|
272,963
|
|
$
|
374,102
|
|
|
|
Additions
|
298,686
|
|
448,471
|
|
|||
|
Recognition of deferred revenue
|
(197,547
|
)
|
(286,653
|
)
|
|||
|
Ending balance
|
$
|
374,102
|
|
$
|
535,920
|
|
|
____________________
(1)
Balance as of
January 31, 2018
was adjusted to reflect the full retrospective adoption of ASC 606.
61
During the years ended
January 31, 2018
and
2019
, we recognized
$136.6 million
and
$191.1 million
in revenue pertaining to deferred revenue as of the beginning of each period.
Total contracted but not recognized revenue was
$558.2 million
as of January 31, 2019. Contracted but not recognized revenue consists of both deferred revenue and non-cancelable amounts that will be invoiced and recognized as revenue in future periods. Of the
$558.2 million
contracted but not recognized revenue as of January 31, 2019, we expect to recognize approximately 49% over the next 12 months, and the remainder thereafter.
Revenue Recognition
We derive revenue from two sources: (1) product revenue which includes hardware and embedded software and (2) support subscription revenue which includes customer support, hardware maintenance, and software upgrades on a when-and-if-available basis. Support subscription revenue also includes our ES2 offering.
Our product revenue is derived from the sale of storage hardware and operating system software that is integrated into the hardware. We typically recognize product revenue upon transfer of control to our customers. Products are typically shipped directly by us to customers, and our channel partners do not stock our inventory.
Our support subscription revenue is derived from the sale of support subscription, which includes the right to receive unspecified software upgrades and enhancements on a when-and-if-available basis, bug fixes, parts replacement services related to the hardware, as well as access to our cloud-based management and support platform. Support subscription revenue is also derived from the sale of our ES2 offering. Revenue related to support subscription is recognized ratably over the contractual term, which generally ranges from one to six years and represents our performance obligations period. The vast majority of our products are sold with support subscription agreements, which typically commence upon transfer of control of the corresponding products to our customers. Costs to service the support subscription are expensed as incurred. In addition, our
Evergreen Storage
program provides our customers who continually maintain active support subscription agreements for three years with an included controller refresh with each additional three year support subscription renewal. In accordance with revenue recognition guidance, the controller refresh represents an additional performance obligation and the allocated revenue is recognized in the period in which these controllers are shipped.
We recognize revenue upon the transfer of promised goods or services to customers in an amount that reflects the consideration we expect to be entitled to in exchange for those goods or services. This is achieved through applying the following five-step approach:
|
•
|
Identification of the contract, or contracts, with a customer
|
|
•
|
Identification of the performance obligations in the contract
|
|
•
|
Determination of the transaction price
|
|
•
|
Allocation of the transaction price to the performance obligations in the contract
|
|
•
|
Recognition of revenue when, or as, we satisfy a performance obligation
|
When applying this five-step approach, we apply judgment in determining the customer's ability and intention to pay, which is based on a variety of factors including the customer's historical payment experience and/or published credit and financial information pertaining to the customer. To the extent a customer contract includes multiple promised goods or services, we determine whether promised goods or services are capable of being distinct in the context of the contract to be accounted for as a separate performance obligation. The transaction price is determined based on the consideration which we will be entitled to in exchange for transferring goods or services to the customer. We allocate the transaction price to each performance obligation for contracts that contain multiple performance obligations based on a relative standalone selling price which is determined based on the price at which the performance obligation is sold separately, or if not observable through past transactions, is estimated taking into account available information such as market conditions and internally approved pricing guidelines related to the performance obligations.
Warranty Costs
We generally provide a
three
-year warranty on hardware and a
90
-day warranty on our software embedded in the hardware. Our hardware warranty provides for parts replacement for defective components and our software warranty provides for bug fixes. Our maintenance and support agreement provides for the same parts replacement that customers are entitled to under our warranty program, except that replacement parts are delivered according to targeted response times to minimize disruption to our customers’ critical business applications. Substantially all customers purchase maintenance and support agreements.
62
Therefore, given that substantially all our products sales are sold together with maintenance and support agreements, we generally do not have exposure related to warranty costs and
no
warranty reserve has been recorded.
Research and Development
Research and development costs are expensed as incurred. Research and development costs consist primarily of personnel costs including stock-based compensation expense, expensed prototype, to the extent there is no alternative use for that equipment, consulting services, depreciation of equipment used in research and development and allocated overhead costs.
Software Development Costs
We expense software development costs before technological feasibility is reached. We have determined that technological feasibility is reached shortly before the release of our products and as a result, the development costs incurred after the establishment of technological feasibility and before the release of those products have not been significant and accordingly, all software development costs have been expensed as incurred.
Software development costs also include costs incurred related to our hosted applications used to deliver our support services. Capitalization begins when the preliminary project stage is complete, management with the relevant authority authorizes and commits to the funding of the software project, and it is probable the project will be completed and the software will be used to perform the intended function. Total costs related to our hosted applications incurred to date have been insignificant and as a result
no
software development costs were capitalized during the years ended
January 31, 2017
,
2018
and
2019
.
Advertising Expenses
Advertising costs are expensed as incurred. Advertising expenses were
$10.7 million
,
$10.3 million
and
$10.7 million
for the years ended
January 31, 2017
,
2018
and
2019
, respectively.
Stock-Based Compensation
Stock-based compensation includes expenses related to restricted stock units (RSUs), restricted stock, stock options and purchase rights issued to employees under our employee stock purchase plan (ESPP). We determine the fair value of our stock options under our equity plans and purchase rights issued to employees under our ESPP on the date of grant utilizing the Black-Scholes option pricing model, which is impacted by the fair value of our common stock, as well as changes in assumptions regarding a number of subjective variables. These variables include the expected common stock price volatility over the term of the awards, the expected term of the awards, risk-free interest rates and expected dividend yield. RSUs and restricted stock are measured at the fair market value of the underlying stock at the grant date.
We recognize stock-based compensation expense for stock-based awards on a straight-line basis over the period during which an employee is required to provide services in exchange for the award (generally the vesting period of the award). We account for forfeitures as they occur. For stock-based awards granted to employees with a performance condition, we recognize stock-based compensation expense for these awards under the accelerated attribution method over the requisite service period when management determines it is probable that the performance condition will be satisfied.
Income Taxes
We account for income taxes using the asset and liability method. Deferred income taxes are recognized by applying enacted statutory tax rates applicable to future years to differences between the financial statement carrying amounts of existing assets and liabilities and their respective tax bases and operating loss and tax credit carryforwards. The effect on deferred tax assets and liabilities of a change in tax rates is recognized in income in the period that includes the enactment date. The measurement of deferred tax assets is reduced, if necessary, by a valuation allowance to amounts that are more likely than not to be realized.
We recognize tax benefits from uncertain tax positions only if we believe that it is more likely than not that the tax position will be sustained on examination by the taxing authorities based on the technical merits of the position. The tax benefits recognized in the financial statements from such positions are then measured based on the largest benefit that has a greater than 50% likelihood of being realized upon settlement.
63
New Accounting Pronouncements Adopted in Fiscal 2019
In May 2014, the Financial Accounting Standards Board (FASB), issued Accounting Standards Update (ASU) No. 2014-09,
Revenue from Contracts with Customers
(ASC 606), requiring an entity to recognize revenue when it transfers promised goods or services to customers in an amount that reflects the consideration to which the entity expects to be entitled to in exchange for those goods or services. ASC 606 supersedes nearly all existing revenue recognition guidance under U.S. GAAP upon its effective date. The standard permits two methods of adoption: retrospectively to each prior reporting period presented (full retrospective method), or retrospectively with the cumulative effect of applying the standard recognized at the date of application (cumulative catch-up transition method).
We adopted the standard using the full retrospective method beginning February 1, 2018, for the year ending
January 31, 2019
, and our historical financial information for the years ended
January 31, 2017
and
2018
has been adjusted to conform to the new standard.
The most significant impact of the standard related to the removal of limitation on contingent revenue, resulting in an increase in product revenue and a decrease in support subscription revenue. In addition, the adoption of ASC 606 also resulted in differences in the timing of recognition of sales commissions. While the adoption of the standard changes certain line items within the net cash flow from operating activities, it had no impact on the net cash provided by or used in operating, investing, or financing activities on our consolidated statements of cash flows.
The following line items on our consolidated balance sheet as of
January 31, 2018
have been adjusted to reflect the adoption of ASC 606 (in thousands):
|
As of January 31, 2018
|
|||||||||||
|
|
As Previously Reported
|
Adjustment
|
As Adjusted
|
||||||||
|
Assets:
|
|||||||||||
|
Deferred commissions, current
|
$
|
22,437
|
|
$
|
(1,349
|
)
|
$
|
21,088
|
|
||
|
Deferred commissions, non-current
|
20,288
|
|
45,937
|
|
66,225
|
|
|||||
|
Total deferred commissions
|
$
|
42,725
|
|
$
|
44,588
|
|
$
|
87,313
|
|
||
|
Liabilities:
|
|||||||||||
|
Deferred revenue, current
|
$
|
209,377
|
|
$
|
(18,148
|
)
|
$
|
191,229
|
|
||
|
Deferred revenue, non-current
|
196,632
|
|
(13,759
|
)
|
182,873
|
|
|||||
|
Total deferred revenue
|
$
|
406,009
|
|
$
|
(31,907
|
)
|
$
|
374,102
|
|
||
|
Stockholders' equity:
|
|||||||||||
|
Accumulated deficit
|
$
|
(980,082
|
)
|
$
|
76,495
|
|
$
|
(903,587
|
)
|
||
64
The following line items on our consolidated statements of operations for the years ended
January 31, 2017
and
2018
have been adjusted to reflect the adoption of ASC 606 (in thousands, except per share data):
|
January 31, 2017
|
January 31, 2018
|
||||||||||||||||||||||
|
|
As Previously Reported
|
Adjustment
|
As Adjusted
|
As Previously Reported
|
Adjustment
|
As Adjusted
|
|||||||||||||||||
|
Revenue:
|
|||||||||||||||||||||||
|
Product
|
$
|
590,001
|
|
$
|
24,457
|
|
$
|
614,458
|
|
$
|
813,985
|
|
$
|
20,469
|
|
$
|
834,454
|
|
|||||
|
Support subscription
|
137,976
|
|
(13,263
|
)
|
124,713
|
|
209,034
|
|
(18,726
|
)
|
190,308
|
|
|||||||||||
|
Total revenue
|
$
|
727,977
|
|
$
|
11,194
|
|
$
|
739,171
|
|
$
|
1,023,019
|
|
$
|
1,743
|
|
$
|
1,024,762
|
|
|||||
|
Gross profit
|
$
|
475,698
|
|
$
|
11,194
|
|
$
|
486,892
|
|
$
|
669,238
|
|
$
|
1,743
|
|
$
|
670,981
|
|
|||||
|
Sales and marketing
|
$
|
360,035
|
|
$
|
(12,340
|
)
|
$
|
347,695
|
|
$
|
480,030
|
|
$
|
(15,981
|
)
|
$
|
464,049
|
|
|||||
|
Total operating expenses
|
$
|
720,504
|
|
$
|
(12,340
|
)
|
$
|
708,164
|
|
$
|
854,396
|
|
$
|
(15,981
|
)
|
$
|
838,415
|
|
|||||
|
Loss from operations
|
$
|
(244,806
|
)
|
$
|
23,534
|
|
$
|
(221,272
|
)
|
$
|
(185,158
|
)
|
$
|
17,724
|
|
$
|
(167,434
|
)
|
|||||
|
Loss before provision for income taxes
|
$
|
(243,179
|
)
|
$
|
23,534
|
|
$
|
(219,645
|
)
|
$
|
(173,713
|
)
|
$
|
17,724
|
|
$
|
(155,989
|
)
|
|||||
|
Net loss
|
$
|
(245,066
|
)
|
$
|
23,534
|
|
$
|
(221,532
|
)
|
$
|
(177,602
|
)
|
$
|
17,724
|
|
$
|
(159,878
|
)
|
|||||
|
Net loss per share attributable to common stockholders, basic and diluted
|
$
|
(1.26
|
)
|
$
|
0.12
|
|
$
|
(1.14
|
)
|
$
|
(0.84
|
)
|
$
|
0.08
|
|
$
|
(0.76
|
)
|
|||||
Revenue by geographic location based on bill-to location, which reflects the adoption impact of ASC 606, are as follows (in thousands):
|
Year Ended January 31, 2017
|
Year Ended January 31, 2018
|
||||||||||||||||||||||
|
|
As Previously Reported
|
Adjustment
|
As Adjusted
|
As Previously Reported
|
Adjustment
|
As Adjusted
|
|||||||||||||||||
|
Revenue:
|
|||||||||||||||||||||||
|
United States
|
$
|
561,352
|
|
$
|
8,632
|
|
$
|
569,984
|
|
$
|
762,391
|
|
$
|
1,328
|
|
$
|
763,719
|
|
|||||
|
Rest of the world
|
166,625
|
|
2,562
|
|
169,187
|
|
260,628
|
|
415
|
|
261,043
|
|
|||||||||||
|
Total revenue
|
$
|
727,977
|
|
$
|
11,194
|
|
$
|
739,171
|
|
$
|
1,023,019
|
|
$
|
1,743
|
|
$
|
1,024,762
|
|
|||||
In November 2016, the FASB issued ASU No. 2016-18,
Statement of Cash Flows (Topic 230): Restricted Cash
(ASU 2016-18), which requires that a statement of cash flows explain the change during the period in the total of cash, cash equivalents and restricted cash. We adopted ASU 2016-18 effective February 1, 2018 on a retrospective basis. Upon adoption, restricted cash is included with cash and cash equivalents when reconciling the beginning-of-period and end-of-period total amounts shown on the statement of cash flows. The adoption of this standard increased our previously reported net cash flow from investing activities for the periods in which there were changes in restricted cash but did not impact our net cash flow from operating activities or financing activities presented on our consolidated statements of cash flows.
65
The following line items in our consolidated statements of cash flows for the years ended
January 31, 2017
and
2018
have been adjusted to reflect the adoption of ASU 2016-18 and ASC 606 (in thousands):
|
Year Ended January 31, 2017
|
Year Ended January 31, 2018
|
||||||||||||||||||||||
|
|
As Previously Reported
|
Adjustment
|
As Adjusted
|
As Previously Reported
|
Adjustment
|
As Adjusted
|
|||||||||||||||||
|
Net loss
(1)
|
$
|
(245,066
|
)
|
$
|
23,534
|
|
$
|
(221,532
|
)
|
$
|
(177,602
|
)
|
$
|
17,724
|
|
$
|
(159,878
|
)
|
|||||
|
Adjustments to reconcile net loss to net cash provided by (used in) operating activities:
|
|||||||||||||||||||||||
|
Deferred commissions
(1)
|
$
|
(740
|
)
|
$
|
(12,340
|
)
|
$
|
(13,080
|
)
|
$
|
(11,997
|
)
|
$
|
(15,981
|
)
|
$
|
(27,978
|
)
|
|||||
|
Deferred revenue
(1)
|
$
|
86,922
|
|
$
|
(11,194
|
)
|
$
|
75,728
|
|
$
|
102,883
|
|
$
|
(1,743
|
)
|
$
|
101,140
|
|
|||||
|
Cash provided by (used in) operating activities
|
$
|
(14,362
|
)
|
$
|
—
|
|
$
|
(14,362
|
)
|
$
|
72,756
|
|
$
|
—
|
|
$
|
72,756
|
|
|||||
|
Net increase in restricted cash
(2)
|
$
|
(5,600
|
)
|
$
|
5,600
|
|
$
|
—
|
|
$
|
(2,029
|
)
|
$
|
2,029
|
|
$
|
—
|
|
|||||
|
Net cash used in investing activities
(2)
|
$
|
(447,223
|
)
|
$
|
5,600
|
|
$
|
(441,623
|
)
|
$
|
(59,188
|
)
|
$
|
2,029
|
|
$
|
(57,159
|
)
|
|||||
|
Net increase (decrease) in cash, cash equivalents and restricted cash
(2)
|
$
|
(421,067
|
)
|
$
|
5,600
|
|
$
|
(415,467
|
)
|
$
|
60,382
|
|
$
|
2,029
|
|
$
|
62,411
|
|
|||||
|
Cash, cash equivalents and restricted cash, beginning of period
(2)
|
$
|
604,742
|
|
$
|
7,134
|
|
$
|
611,876
|
|
$
|
183,675
|
|
$
|
12,734
|
|
$
|
196,409
|
|
|||||
|
Cash, cash equivalents and restricted cash, end of period
(2)
|
$
|
183,675
|
|
$
|
12,734
|
|
$
|
196,409
|
|
$
|
244,057
|
|
$
|
14,763
|
|
$
|
258,820
|
|
|||||
_____________________________________________________
(1) Adjustment pertaining to the adoption of ASC 606.
(2) Adjustment pertaining to the adoption of ASU 2016-18.
In June 2018, the FASB issued ASU No. 2018-07,
Compensation - Stock Compensation (Topic 718)
(ASU 2018-07). ASU 2018-07 aligns the accounting for share-based awards to employees and non-employees to follow the same model. The new standard is effective for fiscal years beginning after December 15, 2018 using a modified retrospective transition approach and early adoption is permitted. We early adopted this new standard effective February 1, 2018 and the adoption of this standard did not materially impact our consolidated financial statements.
In May 2017, the FASB issued ASU No. 2017-09,
Compensation-Stock Compensation (Topic 718)-Scope of Modification Accounting
, to clarify when to account for a change to the terms or conditions of a share-based payment award as a modification. Under the new standard, modification is required only if the fair value, the vesting conditions, or the classification of an award as equity or liability changes as a result of the change in terms or conditions. We adopted this new standard effective February 1, 2018 and the adoption of this standard did not materially impact our consolidated financial statements.
In October 2016, the FASB issued ASU No. 2016-16,
Income Taxes (Topic 740): Intra-Entity Transfers of Assets Other Than Inventory
, which requires the recognition of the income tax consequences of an intra-entity transfer of an asset, other than inventory, when the transfer occurs. We adopted this new standard as of February 1, 2018 and the adoption of this standard did not materially impact our consolidated financial statements.
In March 2018, the FASB issued ASU No. 2018-05,
Income Taxes (Topic 740) - Amendments to SEC Paragraphs Pursuant to SEC Staff Accounting Bulletin No. 118
. This standard amends Accounting Standards Codification 740,
Income Taxes
(ASC 740) to provide guidance on accounting for the tax effects of the Tax Cuts and Jobs Act (the Tax Act) pursuant to Staff Accounting Bulletin No. 118, which allows companies to complete the accounting under ASC 740 within a one-year measurement period from the Tax Act enactment date. This standard is effective upon issuance. We have elected to record taxes associated with our global intangible low-taxed income (GILTI) as period costs if and when incurred.
Recent Accounting Pronouncements Not Yet Effective
In February 2016, the FASB issued ASU No. 2016-02,
Leases (Topic 842)
(ASC 842). ASC 842 requires lessees to generally recognize on its balance sheet operating and financing lease liabilities and corresponding right-of-use assets at the commencement date, and to recognize the associated lease expenses on the income statement in a manner similar to that required under current accounting rules. We will adopt ASC 842 on February
66
1, 2019 in accordance with the transition option permitted by ASU No. 2018-11,
Targeted Improvements to ASC 842
, that allows us not to restate the comparative periods in our financial statements in the year of adoption and record a cumulative effect adjustment as of February 1, 2019. We will elect the package of transition expedients, which allows us to keep our historical lease classifications and not have to reassess whether any existing leases as of the date of adoption are or contain leases. In addition, we will also elect to combine lease and non-lease components for our office facility leases and to take the practical expedient to keep leases with an initial term of 12 months or less off the balance sheet and recognize the associated lease payments in the consolidated statements of operations on a straight-line basis over the lease term. As a result of adopting ASC 842, we expect to recognize on our consolidated balance sheet right-of-use assets of approximately
$125 million
and lease liabilities of approximately
$131 million
. These are preliminary estimates that are subject to change as we finalize our adoption. We do not anticipate that the new standard will have a material impact on our other consolidated financial statements.
In June 2016, the FASB issued ASU No. 2016-13,
Financial Instruments - Credit Losses (Topic 326): Measurement of Credit Losses on Financial Instruments
(ASU 2016-13). ASU 2016-13 amends guidance on reporting credit losses for assets held at amortized cost basis and available-for-sale debt securities to require that credit losses on available-for-sale debt securities be presented as an allowance rather than as a write-down. The measurement of credit losses for newly recognized financial assets and subsequent changes in the allowance for credit losses are recorded in the statements of operations. The amendments in this update will be effective for us beginning February 1, 2020 with early adoption permitted on or after February 1, 2019. We are currently evaluating the impact of this standard on our consolidated financial statements.
In August 2018, the FASB issued ASU No. 2018-13,
Fair Value Measurement (Topic 820), Disclosure Framework - Changes to the Disclosure Requirements for Fair Value Measurement
(ASU 2018-13) which amended its conceptual framework to improve the effectiveness of disclosures in notes to financial statements. ASU 2018-13 eliminates such disclosures around the amount of and reasons for transfers between Level 1 and Level 2 of the fair value hierarchy. The guidance also adds new disclosure requirements for Level 3 measurements. ASU 2018-13 is effective for us beginning February 1, 2020. Early adoption is permitted. We are currently evaluating the impact of this standard on our consolidated financial statements.
In August 2018, the FASB issued ASU No. 2018-15,
Intangibles - Goodwill and Other - Internal-Use Software (Subtopic 350-40) - Customer's Accounting for Implementation Costs Incurred in a Cloud Computing Arrangement That Is a Service Contract
(ASU 2018-15). ASC 2018-15 aligns the requirements for capitalizing implementation costs in a cloud computing arrangement that is a service contract with the requirements for capitalizing implementation costs incurred to develop or obtain internal-use software. This standard will be effective for us beginning February 1, 2020 and should be applied either retrospectively or prospectively. Early adoption is permitted. We are currently evaluating the impact of this standard on our consolidated financial statements.
In August 2018, the SEC adopted the final rule under SEC Release No. 33-10532,
Disclosure Update and Simplification
, amending certain disclosure requirements that were redundant, duplicative, overlapping, outdated or superseded. In addition, the amendments expanded the disclosure requirements on the analysis of stockholders' equity for interim financial statements. Under the amendments, an analysis of changes in each caption of stockholders' equity presented in the balance sheet must be provided in a note or separate statement. The analysis should present a reconciliation of the beginning balance to the ending balance of each period for which a statement of comprehensive income is required to be filed. This final rule was effective on November 5, 2018. We will adopt this guidance in the first quarter of fiscal 2020.
Reclassifications
Certain amounts in prior periods have been reclassified to conform with current period presentation.
67
Note 3. Financial Instruments
Fair Value Measurements
We measure our cash equivalents, marketable securities and restricted cash at fair value on a recurring basis. We define fair value as the exchange price that would be received from sale of an asset or paid to transfer a liability in the principal or most advantageous market for the asset or liability in an orderly transaction between market participants on the measurement date. We measure our financial assets and liabilities at fair value at each reporting period using a fair value hierarchy which requires us to maximize the use of observable inputs and minimize the use of unobservable inputs when measuring fair value. A financial instrument’s classification within the fair value hierarchy is based upon the lowest level of input that is significant to the fair value measurement.
Three
levels of inputs may be used to measure fair value:
•
Level 1
- Observable inputs are unadjusted quoted prices in active markets for identical assets or liabilities;
|
•
|
Level 2
- Observable inputs are quoted prices for similar assets and liabilities in active markets or inputs other than quoted prices that are observable for the assets or liabilities, either directly or indirectly through market corroboration, for substantially the full term of the financial instruments; and
|
|
•
|
Level 3
- Unobservable inputs that are supported by little or no market activity and that are significant to the fair value of the assets or liabilities. These inputs are based on our own assumptions used to measure assets and liabilities at fair value and require significant management judgment or estimation.
|
We classify our cash equivalents, marketable securities and restricted cash within Level 1 or Level 2 because they are valued using either quoted market prices or inputs other than quoted prices which are directly or indirectly observable in the market, including readily-available pricing sources for the identical underlying security which may not be actively traded. Our fixed income available-for-sale securities consist of high quality, investment grade securities from diverse issuers. The valuation techniques used to measure the fair value of our marketable securities were derived from non-binding market consensus prices that are corroborated by observable market data or quoted market prices for similar instruments.
In addition to our cash equivalents, marketable securities and restricted cash, we measure the fair value of our Notes on a quarterly basis for disclosure purposes. We consider the fair value of the Notes at
January 31, 2019
to be a Level 2 measurement due to its limited trading activity. Refer to Note 6 for the carrying amount and estimated fair value of our Notes as of
January 31, 2019
.
Cash Equivalents, Marketable Securities and Restricted Cash
The following tables summarize our cash equivalents, marketable securities and restricted cash by significant investment categories as of
January 31, 2018
and
2019
(in thousands):
|
|
January 31, 2018
|
||||||||||||||||||||||||||
|
|
Amortized Cost
|
Gross Unrealized Gains
|
Gross Unrealized Losses
|
Fair Value
|
Cash Equivalents
|
Marketable Securities
|
Restricted Cash
|
||||||||||||||||||||
|
Level 1
|
|
|
|
|
|
|
|
|
|||||||||||||||||||
|
Money market accounts
|
$
|
—
|
|
$
|
—
|
|
$
|
—
|
|
$
|
32,057
|
|
$
|
17,294
|
|
$
|
—
|
|
$
|
14,763
|
|
||||||
|
Level 2
|
|
|
|
|
|
|
|
|
|||||||||||||||||||
|
U.S. government treasury notes
|
131,643
|
|
—
|
|
(651
|
)
|
130,992
|
|
10,172
|
|
120,820
|
|
—
|
|
|||||||||||||
|
U.S. government agencies
|
47,229
|
|
—
|
|
(333
|
)
|
46,896
|
|
—
|
|
46,896
|
|
—
|
|
|||||||||||||
|
Corporate debt securities
|
186,506
|
|
116
|
|
(1,049
|
)
|
185,573
|
|
—
|
|
185,573
|
|
—
|
|
|||||||||||||
|
Total
|
$
|
365,378
|
|
$
|
116
|
|
$
|
(2,033
|
)
|
$
|
395,518
|
|
$
|
27,466
|
|
$
|
353,289
|
|
$
|
14,763
|
|
||||||
68
|
|
January 31, 2019
|
||||||||||||||||||||||||||
|
|
Amortized Cost
|
Gross Unrealized Gains
|
Gross Unrealized Losses
|
Fair Value
|
Cash Equivalents
|
Marketable Securities
|
Restricted Cash
|
||||||||||||||||||||
|
Level 1
|
|
|
|
|
|
|
|
|
|||||||||||||||||||
|
Money market accounts
|
$
|
—
|
|
$
|
—
|
|
$
|
—
|
|
$
|
43,038
|
|
$
|
27,215
|
|
$
|
—
|
|
$
|
15,823
|
|
||||||
|
Level 2
|
|||||||||||||||||||||||||||
|
U.S. government treasury notes
|
315,329
|
|
208
|
|
(315
|
)
|
315,222
|
|
34,129
|
|
281,093
|
|
—
|
|
|||||||||||||
|
U.S. government agencies
|
69,114
|
|
17
|
|
(154
|
)
|
68,977
|
|
9,983
|
|
58,994
|
|
—
|
|
|||||||||||||
|
Corporate debt securities
|
363,860
|
|
534
|
|
(757
|
)
|
363,637
|
|
—
|
|
363,637
|
|
—
|
|
|||||||||||||
|
Foreign government bonds
|
7,965
|
|
36
|
|
—
|
|
8,001
|
|
—
|
|
8,001
|
|
—
|
|
|||||||||||||
|
Asset-backed securities
|
37,664
|
|
105
|
|
(12
|
)
|
37,757
|
|
—
|
|
37,757
|
|
—
|
|
|||||||||||||
|
Total
|
$
|
793,932
|
|
$
|
900
|
|
$
|
(1,238
|
)
|
$
|
836,632
|
|
$
|
71,327
|
|
$
|
749,482
|
|
$
|
15,823
|
|
||||||
The amortized cost and estimated fair value of our marketable securities are shown below by contractual maturity (in thousands):
|
January 31, 2019
|
|||||||
|
|
Amortized Cost
|
Fair Value
|
|||||
|
Due within one year
|
$
|
342,739
|
|
$
|
342,256
|
|
|
|
Due in one to five years
|
407,081
|
|
407,226
|
|
|||
|
Total
|
$
|
749,820
|
|
$
|
749,482
|
|
|
Based on our evaluation of available evidence, we concluded that the gross unrealized losses on our investments as of
January 31, 2019
were temporary in nature. The following table presents gross unrealized losses and fair values for those investments that were in a continuous unrealized loss position as of
January 31, 2019
, aggregated by investment category (in thousands):
|
Less than 12 months
|
Greater than 12 months
|
Total
|
|||||||||||||||||||||
|
|
Fair Value
|
Unrealized Loss
|
Fair Value
|
Unrealized Loss
|
Fair Value
|
Unrealized Loss
|
|||||||||||||||||
|
U.S. government treasury notes
|
$
|
156,529
|
|
$
|
(98
|
)
|
$
|
40,413
|
|
$
|
(217
|
)
|
$
|
196,942
|
|
$
|
(315
|
)
|
|||||
|
U.S. government agencies
|
24,892
|
|
(20
|
)
|
23,600
|
|
(134
|
)
|
48,492
|
|
(154
|
)
|
|||||||||||
|
Corporate debt securities
|
83,577
|
|
(152
|
)
|
96,914
|
|
(605
|
)
|
180,491
|
|
(757
|
)
|
|||||||||||
|
Asset-backed securities
|
11,194
|
|
(12
|
)
|
—
|
|
—
|
|
11,194
|
|
(12
|
)
|
|||||||||||
|
Total
|
$
|
276,192
|
|
$
|
(282
|
)
|
$
|
160,927
|
|
$
|
(956
|
)
|
$
|
437,119
|
|
$
|
(1,238
|
)
|
|||||
Realized gains and losses on sale of marketable securities were not significant for all periods presented.
Note 4. Business Combination
In August 2018, we completed the acquisition of StorReduce, Inc. (StorReduce), a privately-held, cloud-first software-defined storage solution for managing large-scale unstructured data. Acquisition-related costs were immaterial and were expensed as incurred.
The purchase consideration was
$20.5 million
in cash (net of cash acquired) after repayment of
$6.1 million
of debt assumed and payment of
$1.1 million
in transaction fees on behalf of StorReduce.
69
The purchase price was allocated as follows:
$17.7 million
in developed technology which will be amortized over
seven
years,
$11.0 million
of goodwill,
$4.5 million
in net liabilities assumed, and
$3.7 million
in deferred tax liabilities. The deferred tax liability was primarily a result of the difference in the book basis and tax basis related to the developed technology. Goodwill is primarily attributable to the assembled workforce and synergies from integrating StorReduce's technology with our storage portfolio and is not deductible for income tax purposes. We held back approximately
$3.7 million
in cash to satisfy potential indemnification claims through August 2019.
In addition, we granted
622,482
RSUs to former StorReduce employees with a total grant date fair value of
$13.6 million
, subject to continuous employment. These awards are recognized as stock-based compensation over the related vesting period.
The results of StorReduce are included in our consolidated statements of operations since the acquisition date, including revenue and net loss, and are not material. Pro forma results of operations have not been presented because the acquisition is not material to our results of operations.
Note 5. Balance Sheet Components
Inventory
Inventory consists of the following (in thousands):
|
January 31,
|
|||||||
|
2018
|
2019
|
||||||
|
Raw materials
|
$
|
1,181
|
|
$
|
3,349
|
|
|
|
Finished goods
|
33,316
|
|
41,338
|
|
|||
|
Inventory
|
$
|
34,497
|
|
$
|
44,687
|
|
|
Property and Equipment, Net
Property and equipment, net consists of the following (in thousands):
|
|
January 31,
|
||||||
|
|
2018
|
2019
|
|||||
|
Test equipment
|
$
|
142,311
|
|
$
|
170,930
|
|
|
|
Computer equipment and software
|
72,329
|
|
117,330
|
|
|||
|
Furniture and fixtures
|
5,363
|
|
6,980
|
|
|||
|
Leasehold improvements
|
15,032
|
|
34,286
|
|
|||
|
Total property and equipment
|
235,035
|
|
329,526
|
|
|||
|
Less: accumulated depreciation and amortization
|
(145,893
|
)
|
(204,173
|
)
|
|||
|
Property and equipment, net
|
$
|
89,142
|
|
$
|
125,353
|
|
|
Depreciation and amortization expense related to property and equipment was
$48.8 million
,
$60.2 million
and
$68.3 million
for the years ended
January 31, 2017
,
2018
and
2019
, respectively.
Intangible Assets, Net
Intangible assets, net consist of the following (in thousands):
|
|
As of January 31, 2018
|
As of January 31, 2019
|
|||||||||||||||||||||
|
|
Gross Carrying Value
|
Accumulated Amortization
|
Net Carrying Amount
|
Gross Carrying Value
|
Accumulated Amortization
|
Net Carrying Amount
|
|||||||||||||||||
|
Technology patents
|
$
|
10,125
|
|
$
|
(5,068
|
)
|
$
|
5,057
|
|
$
|
10,125
|
|
$
|
(6,572
|
)
|
$
|
3,553
|
|
|||||
|
Developed technology
|
—
|
|
—
|
|
—
|
|
17,700
|
|
(1,135
|
)
|
16,565
|
|
|||||||||||
|
Intangible assets, net
|
$
|
10,125
|
|
$
|
(5,068
|
)
|
$
|
5,057
|
|
$
|
27,825
|
|
$
|
(7,707
|
)
|
$
|
20,118
|
|
|||||
Intangible assets amortization expense was
$1.4 million
,
$1.5 million
and
$2.6 million
for the years ended
January 31, 2017
,
2018
and
2019
, respectively. As of January 31, 2019, the weighted-average remaining amortization
70
period was
2.4
years for technology patents and
6.6
years for developed technology. Amortization of the technology patents is included in general and administrative expenses due to their defensive nature and amortization of developed technology is included in cost of product revenue in the consolidated statements of operations.
As of
January 31, 2019
, future expected amortization expense for intangible assets is as follows (in thousands):
|
Fiscal Years Ending January 31,
|
Estimated Future
Amortization Expense |
||
|
2020
|
$
|
4,032
|
|
|
2021
|
4,032
|
|
|
|
2022
|
3,074
|
|
|
|
2023
|
2,529
|
|
|
|
2024
|
2,529
|
|
|
|
Thereafter
|
3,922
|
|
|
|
Total
|
$
|
20,118
|
|
Goodwill
The change in the carrying amount of goodwill is as follows (in thousands):
|
Amount
|
|||
|
Balance as of January 31, 2018
|
$
|
—
|
|
|
Goodwill acquired
|
10,997
|
|
|
|
Balance as of January 31, 2019
|
$
|
10,997
|
|
Accrued Expenses and Other Liabilities
Accrued expenses and other liabilities consist of the following (in thousands):
|
|
January 31,
|
||||||
|
|
2018
|
2019
|
|||||
|
Taxes payable
|
$
|
4,052
|
|
$
|
7,146
|
|
|
|
Accrued marketing
|
5,928
|
|
6,173
|
|
|||
|
Accrued travel and entertainment expenses
|
4,386
|
|
3,570
|
|
|||
|
Acquisition consideration held back
|
—
|
|
3,725
|
|
|||
|
Other accrued liabilities
|
12,783
|
|
19,246
|
|
|||
|
Total accrued expenses and other liabilities
|
$
|
27,149
|
|
$
|
39,860
|
|
|
Note 6. Convertible Senior Notes
In April 2018, we issued
$575.0 million
in principal amount of
0.125%
convertible senior notes due 2023, in a private placement to qualified institutional buyers pursuant to Rule 144A under the Securities Act and received proceeds of
$562.1 million
, after deducting the underwriters’ discounts and commissions. The Notes are governed by an indenture (the Indenture) between us, as the issuer, and U.S. Bank National Association, as trustee. The Notes are our senior unsecured obligations. The Indenture does not contain any financial covenants or restrictions on the payments of dividends, the incurrence of indebtedness, or the issuance or repurchase of securities by us or any of our subsidiaries. The Notes mature on April 15, 2023 unless repurchased or redeemed by us or converted in accordance with their terms prior to the maturity date. Interest is payable semi-annually in arrears on April 15 and October 15 of each year, beginning on October 15, 2018.
The Notes are convertible for up to
21,884,155
shares of our common stock at an initial conversion rate of approximately
38.0594
shares of Class A common stock per
$1,000
principal amount, which is equal to an initial conversion price of approximately
$26.27
per share of Class A common stock, subject to adjustment. Holders of the
71
Notes may surrender their Notes for conversion at their option at any time prior to the close of business on the business day immediately preceding October 15, 2022, only under the following circumstances:
|
•
|
during any fiscal quarter commencing after the fiscal quarter ended on July 31, 2018 (and only during such fiscal quarter), if the last reported sale price of our Class A common stock for at least
20
trading days (whether or not consecutive) during a period of
30
consecutive trading days ending on, and including, the last trading day of the immediately preceding fiscal quarter is greater than or equal to
130%
of the conversion price for the Notes on each applicable trading day;
|
|
•
|
during the
five
business day period after any
five
consecutive trading day period (the measurement period), in which the trading price per
$1,000
principal amount of the Notes for each trading day of the measurement period was less than
98%
of the product of the last reported sale price of our Class A common stock and the conversion rate for the Notes on each such trading day;
|
|
•
|
if we call any or all of the Notes for redemption, at any time prior to the close of business on the second scheduled trading day immediately preceding the redemption date; or
|
|
•
|
upon the occurrence of specified corporate events.
|
On or after October 15, 2022 until the close of business on the second scheduled trading day immediately preceding the maturity date, holders may convert all or any portion of their Notes at any time regardless of the foregoing circumstances. Upon conversion, holders will receive cash, shares of our Class A common stock, or a combination of cash and shares of our Class A common stock, at our election. We intend to settle the principal of the Notes in cash.
The conversion price will be subject to adjustment in some events. Following certain corporate events that occur prior to the maturity date or following our issuance of a notice of redemption, we will increase the conversion rate for a holder who elects to convert its Notes in connection with such corporate event or during the related redemption period in certain circumstances. Additionally, upon the occurrence of a corporate event that constitutes a “fundamental change” per the Indenture, holders of the Notes may require us to repurchase for cash all or a portion of the Notes at a purchase price equal to
100%
of the principal amount of the Notes plus accrued and unpaid contingent interest.
We may not redeem the Notes prior to April 20, 2021. We may redeem for cash all or any portion of the Notes, at our option, on or after April 20, 2021 if the last reported sale price of our Class A common stock has been at least
130%
of the conversion price then in effect for at least
20
trading days (whether or not consecutive) during any
30
consecutive trading day period (including the last trading day of such period) ending not more than
two
trading days immediately preceding the date on which we provide notice of redemption at a redemption price equal to
100%
of the principal amount of the Notes to be redeemed, plus accrued and unpaid interest to, but excluding, the redemption date. No sinking fund is provided for the Notes.
Upon the issuance of the Notes, we recorded total debt issuance costs of
$12.9 million
, of which approximately
$9.8 million
was allocated to the Notes and approximately
$3.1 million
was allocated to additional paid-in capital.
The Notes consisted of the following (in thousands):
|
As of January 31, 2019
|
|||
|
Liability:
|
|||
|
Principal
|
$
|
575,000
|
|
|
Less: debt discount, net of amortization
|
(116,722
|
)
|
|
|
Less: debt issuance costs, net of amortization
|
(8,450
|
)
|
|
|
Net carrying amount of the Notes
|
$
|
449,828
|
|
|
Stockholders' equity:
|
|||
|
Allocated value of the conversion feature
|
$
|
136,333
|
|
|
Less: debt issuance costs
|
(3,068
|
)
|
|
|
Additional paid-in capital
|
$
|
133,265
|
|
72
The total estimated fair value of the Notes as of
January 31, 2019
was approximately
$558.2 million
. The fair value was determined based on the closing trading price per
$100
of the Notes as of the last day of trading for the period. The fair value of the Notes is primarily affected by the trading price of our common stock and market interest rates. Based on the closing price of our Class A common stock of
$17.91
on
January 31, 2019
, the if-converted value of the Notes of
$391.9 million
was less than its principal amount.
The following table sets forth total interest expense recognized related to the Notes (in thousands):
|
Year Ended January 31, 2019
|
||||
|
Amortization of debt discount
|
$
|
19,611
|
|
|
|
Amortization of debt issuance costs
|
1,420
|
|
||
|
Total amortization of debt discount and debt issuance costs
|
21,031
|
|
||
|
Contractual interest expense
|
584
|
|
||
|
Total interest expense related to the Notes
|
$
|
21,615
|
|
|
|
Effective interest rate of the liability component
|
5.6
|
%
|
||
In connection with the offering of the Notes, we paid
$64.6 million
to enter into capped call transactions with certain of the underwriters and their affiliates (the Capped Calls), whereby we have the option to purchase a total of
21,884,155
shares of our Class A common stock upon any conversion of Notes and/or offset any cash payments we are required to make in excess of the principal amount of the Notes, as the case may be, with such reduction or offset subject to a cap initially equal to
$39.66
per share (which represents a premium of
100%
over the last reported sales price of our Class A common stock on April 4, 2018), subject to certain adjustments (the Cap Price). The cost of the Capped Calls was accounted for as a reduction to additional paid-in capital on the consolidated balance sheet. The Capped Calls are intended to reduce or offset potential dilution of our common stock upon any conversion of the Notes, subject to a cap based on the Cap Price.
Impact on Earnings Per Share
The Notes will not impact our diluted earnings per share until the average market price of our Class A common stock exceeds the conversion price of
$26.27
per share, as we intend to settle the principal amount of the Notes in cash upon conversion. We are required under the treasury stock method to compute the potentially dilutive shares of common stock related to the Notes for periods we report net income. However, upon conversion, there will be no economic dilution from the Notes until the average market price of our Class A common stock exceeds the Cap Price of
$39.66
per share, as exercise of the Capped Calls offsets any dilution from the Notes from the conversion price up to the Cap Price. Capped Calls are excluded from the calculation of diluted net loss per share, as they would be anti-dilutive under the treasury stock method.
Note 7. Commitments and Contingencies
Operating Leases and Other Contractual Commitments
We lease our office facilities under operating lease agreements expiring through October 2028. Certain of these lease agreements have escalating rent payments. We recognize rent expense under such agreements on a straight-line basis over the lease term, and the difference between the rent paid and the straight-line rent is recorded in accrued expenses and other liabilities and other long-term liabilities in the accompanying consolidated balance sheets.
73
As of
January 31, 2019
, the aggregate future minimum payments under non-cancelable operating leases consist of the following (in thousands):
|
Year Ending January 31,
|
Operating Leases
|
||
|
2020
|
$
|
31,297
|
|
|
2021
|
28,573
|
|
|
|
2022
|
24,381
|
|
|
|
2023
|
20,440
|
|
|
|
2024
|
14,780
|
|
|
|
Thereafter
|
30,096
|
|
|
|
Total
|
$
|
149,567
|
|
Rent expense recognized under our operating leases were
$16.6 million
,
$19.4 million
and
$25.6 million
for the years ended
January 31, 2017
,
2018
and
2019
, respectively.
As of
January 31, 2018
and
2019
, we had
$26.8 million
and
$21.4 million
of non-cancelable contractual purchase obligations related to certain software service and other contracts.
The repayment of our Notes with an aggregate principal amount of
$575.0 million
is due on April 15, 2023. Refer to Note 6 for further information regarding our convertible senior notes.
Letters of Credit
In connection with the amendment of our Mountain View, California lease in March 2018, we issued a letter of credit of
$1.5 million
. As of
January 31, 2018
and
2019
, we had outstanding letters of credit in the aggregate amount of
$9.6 million
and
$10.8 million
, in connection with our facility leases. The letters of credit are collateralized by restricted cash and mature on various dates through
August 2029
.
Legal Matters
On October 18, 2016, we entered into an agreement with Dell Inc. (Dell), as successor-in-interest to EMC to settle all litigation between EMC and us. The terms of the settlement include a payment to Dell, the dismissal of all litigation between the parties, mutual releases, and a license to the disputed patent. Accordingly, we paid Dell a one-time settlement amount of
$30.0 million
, and all litigation between EMC and us was dismissed prior to October 31, 2016. We evaluated the settlement as a multiple-element arrangement, which requires us to allocate the one-time payment to the identifiable elements based on their relative fair values. Based on our estimates of fair value, we determined that the sole benefit of the settlement is to avoid further litigation costs with no value attributable to future use or benefit. Accordingly, we recorded the
$30.0 million
as a legal settlement charge in general and administrative expenses during the three months ended October 31, 2016.
From time to time, we have become involved in claims and other legal matters arising in the normal course of business. We investigate these claims as they arise. Although claims are inherently unpredictable, we currently are not aware of any matters that we expect to have a material adverse effect on our business, financial position, results of operations or cash flows. Accordingly, we have
not
recorded any loss contingency on our consolidated balance sheet as of
January 31, 2019
.
74
Indemnification
Our arrangements generally include certain provisions for indemnifying customers against liabilities if our products or services infringe a third party’s intellectual property rights. Other guarantees or indemnification arrangements include guarantees of product and service performance and standby letters of credit for lease facilities. It is not possible to determine the maximum potential amount under these indemnification obligations due to the limited history of prior indemnification claims and the unique facts and circumstances involved in each particular agreement. To date, we have not incurred any material costs as a result of such obligations and have not accrued any liabilities related to such obligations in the consolidated financial statements. In addition, we indemnify our officers, directors and certain key employees while they are serving in good faith in their respective capacities. To date, there have been no claims under any indemnification provisions.
Note 8. Stockholders’ Equity
Preferred Stock
We have
20,000,000
authorized shares of undesignated preferred stock, the rights, preferences and privileges of which may be designated from time to time by our board of directors. As of
January 31, 2019
, there were
no
shares of preferred stock issued or outstanding.
Class A and Class B Common Stock
We have
two
classes of authorized common stock, Class A common stock and Class B common stock. As of
January 31, 2019
, we had
2,000,000,000
authorized shares of Class A common stock and
250,000,000
authorized shares of Class B common stock, with each class having a par value of
$0.0001
per share.
In December 2018, all outstanding shares of our Class B common stock automatically converted into the same number of shares of our Class A common stock pursuant to the terms of our amended and restated certificate of incorporation, which provided that each share of our Class B common stock would convert automatically into Class A common stock when the outstanding shares of Class B common stock represent less than
10%
of the aggregate number of shares of the then outstanding Class A common stock and Class B common stock. No additional Class B shares will be issued following such conversion. As of
January 31, 2019
,
243,523,831
shares of Class A common stock were issued and outstanding.
Prior to the conversion, the rights of the holders of Class A and Class B common stock were identical, except with respect to voting. Each share of Class A common stock was entitled to
one
vote per share while each share of Class B common stock was entitled to
10
votes per share.
Class A and Class B common stock are referred to as common stock throughout the notes to the consolidated financial statements, unless otherwise noted.
Common Stock Reserved for Issuance
As of
January 31, 2019
, we had reserved shares of Class A common stock for future issuance as follows:
|
|
January 31, 2019
|
|
|
Shares underlying outstanding stock options
|
35,465,543
|
|
|
Shares underlying outstanding restricted stock units
|
21,917,550
|
|
|
Shares reserved for future equity awards
|
15,792,845
|
|
|
Shares reserved for future employee stock purchase plan awards
|
1,318,558
|
|
|
Total
|
74,494,496
|
|
Repurchase of Common Stock
Concurrent with the issuance of the Notes (see Note 6), we repurchased and retired
1,008,573
shares, or
$20.0 million
, of our Class A common stock at
$19.83
per share, which was equal to the closing price per share of our Class A common stock on April 4, 2018, the date of the pricing of our offering of the Notes. The repurchased shares were recorded as a reduction of additional paid-in capital on the consolidated balance sheet.
75
Note 9. Equity Incentive Plans
Equity Incentive Plans
We maintain
two
equity incentive plans: the 2009 Equity Incentive Plan (our 2009 Plan) and the 2015 Equity Incentive Plan (our 2015 Plan). The 2015 Plan became effective in connection with our initial public offering (IPO) in October 2015 and serves as the successor to our 2009 Plan. Our 2015 Plan provides for grants of incentive stock options to our employees and non-statutory stock options, stock appreciation rights, restricted stock, RSUs, performance stock awards, performance cash awards, and other forms of stock awards to our employees, directors and consultants. No new awards have been issued under our 2009 Plan after the effective date of our 2015 Plan. Outstanding awards granted under our 2009 Plan will remain subject to the terms of our 2009 Plan and applicable award agreements, until such outstanding awards that are stock options are exercised, terminated or expired by their terms.
Starting in December 2018, we net-share settle equity awards held by certain employees by withholding shares upon vesting to satisfy tax withholding obligations. The shares withheld to satisfy employee tax withholding obligations are returned to our 2015 Plan and will be available for future issuance. Payments for employees’ tax obligations to the tax authorities are recognized as a reduction to additional paid-in capital and reflected as a financing activity in our consolidated statements of cash flows.
We initially reserved
27,000,000
shares of our Class A common stock for issuance under our 2015 Plan. The number of shares reserved for issuance under our 2015 Plan increases automatically on the first day of February of each of 2016 through 2025, in an amount equal to
5%
of the total number of shares of our capital stock outstanding as of the immediately preceding January 31.
The exercise price of stock options will generally not be less than
100%
of the fair market value of our common stock on the date of grant, as determined by our board of directors. Our equity awards generally vest over a
two
to
four
year period and expire no later than
ten years
from the date of grant.
2015 Employee Stock Purchase Plan
Our 2015 Employee Stock Purchase Plan (2015 ESPP) became effective in connection with our IPO. A total of
3,500,000
shares of Class A common stock was initially reserved for issuance under the 2015 ESPP. The number of shares reserved for issuance under our 2015 ESPP increases automatically on the first day of February of each of 2016 through 2025, in an amount equal to the lesser of (i)
1%
of the total number of shares of our capital stock outstanding as of the immediately preceding January 31, and (ii)
3,500,000
shares of Class A common stock.
The 2015 ESPP allows eligible employees to purchase shares of our Class A common stock at a discount through payroll deductions of up to
30%
of their eligible compensation, subject to a cap of
3,000
shares on any purchase date or
$25,000
in any calendar year (as determined under applicable tax rules). In February 2019, we amended the ESPP to include, on a prospective basis, a dollar cap of $7,500 per purchase period. The 2015 ESPP provides for
24
month offering periods beginning March 16th and September 16th of each year, and each offering period consists of
four
six
-month purchase periods, subject to a reset provision. If the closing stock price on the offering date of a new offering falls below the closing stock price on the offering date of an ongoing offering, the ongoing offering would terminate immediately following the purchase of ESPP shares on the purchase date immediately preceding the new offering and participants in the terminated ongoing offering would automatically be enrolled in the new offering (ESPP reset). On each purchase date, eligible employees will purchase our Class A common stock at a price per share equal to
85%
of the lesser of the fair market value of our Class A common stock (1) on the first trading day of the applicable offering period or (2) the purchase date.
Since inception, we have had
two
ESPP resets that have resulted in modification charges. The first ESPP reset occurred in March 2016 and resulted in a modification charge of
$10.6 million
. The second ESPP reset occurred in March 2017 and resulted in a modification charge of
$9.0 million
that is being recognized over the new offering period ending March 15, 2019.
During the years ended
January 31, 2017
,
2018
and
2019
, we recognized
$18.3 million
,
$18.3 million
and
$35.4 million
, of stock-based compensation expense related to our 2015 ESPP. As of
January 31, 2019
, there was
$18.4 million
of unrecognized stock-based compensation expense related to our 2015 ESPP which is expected to be recognized over a weighted-average period of approximately
0.9
years.
76
Early Exercise of Stock Options
Certain employees and directors exercised options granted under the 2009 Plan prior to vesting. The unvested shares were subject to a repurchase right held by us at the original purchase price. The proceeds initially were recorded as a liability related to early exercised stock options and reclassified to additional paid-in capital as the repurchase right lapsed.
No
unvested stock options were exercised during the years ended
January 31, 2017
,
2018
and
2019
.
No
shares were repurchased during the years ended
January 31, 2017
,
2018
and
2019
. As of January 31, 2018,
85,262
shares held by employees were subject to repurchase, all of which vested during the year ended
January 31, 2019
. As of
January 31, 2018
, the liability balance related to early exercised stock options was
$0.3 million
and included in accrued expenses and other liabilities on our consolidated balance sheet.
Stock Options
A summary of the stock option activity under our equity incentive plans and related information is as follows:
|
|
Options Outstanding
|
|||||||||||
|
|
Number of
Shares |
Weighted-
Average Exercise Price |
Weighted-
Average Remaining Contractual Life (Years) |
Aggregate
Intrinsic Value (in thousands) |
||||||||
|
Balance as of January 31, 2018
|
46,359,949
|
|
$
|
7.75
|
|
6.3
|
$
|
574,224
|
|
|||
|
Options exercised
|
(9,397,220
|
)
|
5.08
|
|
|
|
|
|||||
|
Options forfeited/canceled
|
(1,497,186
|
)
|
10.55
|
|
|
|
|
|||||
|
Balance as of January 31, 2019
|
35,465,543
|
|
$
|
8.34
|
|
5.4
|
$
|
339,591
|
|
|||
|
Vested and exercisable as of January 31, 2019
|
26,592,658
|
|
$
|
6.76
|
|
5.1
|
$
|
296,710
|
|
|||
The aggregate intrinsic value of options vested and exercisable as of
January 31, 2019
is calculated based on the difference between the exercise price and the closing price of
$17.91
of our Class A common stock on
January 31, 2019
. The aggregate intrinsic value of options exercised for the years ended
January 31, 2017
,
2018
and
2019
was
$114.2 million
,
$104.9 million
and
$165.0 million
.
The weighted-average grant date fair value of options granted was
$5.57
per share for each of the years ended
January 31, 2017
and
2018
. The total grant date fair value of options vested for the years ended
January 31, 2017
,
2018
and
2019
was
$61.8 million
,
$42.5 million
and
$45.6 million
.
As of
January 31, 2019
, total unamortized stock-based compensation expense related to our employee stock options was
$32.3 million
, which is expected to be recognized over a weighted-average period of approximately
1.8
years.
During the year ended
January 31, 2016
,
we granted options to purchase
238,000
shares of common stock, net of cancellations, that vest upon satisfaction of performance and service conditions. For those options that management determined that the performance condition was satisfied, stock-based compensation expense of
$3.3 million
,
$0.6 million
and
$0.3 million
was recognized during the years ended
January 31, 2017
,
2018
and
2019
. As of January 31, 2018 and 2019, there were
no
outstanding stock options subject to performance vesting conditions.
In November 2016, we modified employee stock option awards to purchase
800,000
shares of our common stock. The modification included an immediate acceleration of performance-based options to purchase
360,000
shares of common stock and an acceleration of time-based options to purchase
440,000
shares of common stock contingent on continued employment through
January 31, 2017
. This modification resulted in stock-based compensation expense of
$5.9 million
that was recognized during the year ended
January 31, 2017
.
77
Determination of Fair Value
The fair value of stock options granted to employees and to be purchased under ESPP is estimated on the grant date using the Black-Scholes option pricing model. This valuation model for stock-based compensation expense requires us to make assumptions and judgments about the variables used in the calculation including the fair value of the underlying common stock, expected term, the expected volatility of the common stock, a risk-free interest rate and expected dividend yield.
We estimate the fair value of employee stock options and ESPP purchase rights using a Black-Scholes option pricing model with the following assumptions:
|
|
Year Ended January 31,
|
|||||||
|
|
2017
|
2018
|
2019
|
|||||
|
Employee Stock Options
|
|
|
|
|||||
|
Expected term (in years)
|
6.1
|
|
6.1
|
|
n/a
|
|||
|
Expected volatility
|
44
|
%
|
47
|
%
|
n/a
|
|||
|
Risk-free interest rate
|
1.3% - 1.5%
|
|
1.9
|
%
|
n/a
|
|||
|
Dividend rate
|
—
|
|
—
|
|
n/a
|
|||
|
Fair value of common stock
|
$10.37 - $14.52
|
|
$12.84
|
n/a
|
||||
|
Employee Stock Purchase Plan
|
|
|
|
|
|
|
||
|
Expected term (in years)
|
0.5 - 2.0
|
|
0.5 - 2.0
|
|
0.5 - 2.0
|
|
||
|
Expected volatility
|
41
|
%
|
35% - 39%
|
|
44% - 47%
|
|
||
|
Risk-free interest rate
|
0.5% - 0.9%
|
|
0.9% - 1.4%
|
|
2.0% - 2.8%
|
|
||
|
Dividend rate
|
—
|
|
—
|
|
—
|
|
||
|
Fair value of common stock
|
$12.36 - $13.72
|
|
$10.39 - $14.65
|
|
$20.62 - $27.66
|
|
||
The assumptions used in the Black-Scholes option pricing model were determined as follows.
Fair Value of Common Stock
—We use the market closing price of our Class A common stock as reported on the New York Stock Exchange to determine the fair value of our common stock at each grant date.
Expected Term
—The expected term represents the period that our stock-based awards are expected to be outstanding. The expected term assumptions were determined based on the vesting terms, exercise terms and contractual lives of the options and ESPP purchase rights.
Expected Volatility
—Starting in fiscal 2019, the expected volatility for ESPP purchase rights is based on the historical volatility of our Class A common stock for a period equivalent to the expected term of the ESPP purchase rights. Prior to fiscal 2019, since we have limited trading history of our common stock, the expected volatility was derived from the average historical stock volatilities of several public companies within the same industry that we consider to be comparable to our business over a period equivalent to the expected term of the stock option grants and ESPP purchase rights.
Risk-Free Interest Rate
—The risk-free interest rate is based on the U.S. Treasury yield curve in effect at the time of grant for zero-coupon U.S. Treasury notes with maturities approximately equal to the expected term of the stock option grants and ESPP purchase rights.
Dividend Rate
—We have never declared or paid any cash dividends and do not plan to pay cash dividends in the foreseeable future, and, therefore, use an expected dividend yield of
zero
.
78
RSUs
A summary of the RSU activity under our 2015 Plan and related information is as follows:
|
Number of RSUs Outstanding
|
Weighted-Average Grant Date Fair Value
|
Aggregate Intrinsic Value
(in thousands)
|
||||||||
|
Unvested balance as of January 31, 2018
|
17,682,646
|
|
$
|
12.60
|
|
$
|
356,117
|
|
||
|
Granted
|
15,891,112
|
|
20.73
|
|
||||||
|
Vested
|
(8,403,422
|
)
|
13.24
|
|
||||||
|
Forfeited
|
(2,109,948
|
)
|
16.09
|
|
||||||
|
Converted
|
(1,142,838
|
)
|
11.86
|
|
||||||
|
Unvested balance of January 31, 2019
|
21,917,550
|
|
$
|
17.94
|
|
$
|
392,515
|
|
||
In March 2017, we granted
750,000
performance RSUs (net of approximately
77,000
canceled units), at a target percentage of
100%
, with both performance and service vesting conditions payable in common shares, from
0%
to
150%
of the target number granted, contingent upon the degree to which the performance condition is met. In March 2018, a total of
780,000
shares was earned based on the performance condition achieved and a portion of these shares were contemporaneously converted to restricted stock— see below for further discussion. The remaining shares are subject to service conditions through the vesting periods. Stock-based compensation expense related to these units was $
4.2 million
and
$2.2 million
for the years ended
January 31, 2018
and
2019
.
In August 2017, we granted
464,744
performance RSUs, at a target percentage of
100%
, with both performance and service vesting conditions payable in common shares, from
0%
to
150%
of the target number granted, contingent upon the degree to which the performance condition is met. Because the performance condition for these units was not established as of
January 31, 2018
, there was no grant date from an accounting perspective and no stock-based compensation expense was recognized for the year ended
January 31, 2018
. The grant date for these awards was subsequently established when the performance condition was determined in March 2018, and these awards were contemporaneously converted to restricted stock— see below for further discussion.
The aggregate fair value, as of the respective vesting dates, of restricted stock units that vested during the years ended
January 31, 2017
,
2018
and
2019
was
$14.8 million
,
$75.5 million
and
$184.8 million
.
There were no outstanding performance RSUs as of January 31, 2019. As of
January 31, 2019
, total unrecognized employee compensation cost related to unvested RSUs was
$355.8 million
, which is expected to be recognized over a weighted-average period of approximately
3.0
years.
Restricted Stock
In March 2018, we converted certain RSUs and performance RSUs that were previously granted into
1,375,210
shares of restricted stock for corporate tax benefit purposes. Of the
1,375,210
shares of restricted stock,
697,116
shares are performance restricted stock and
678,094
shares are subject to service vesting conditions only. The conversion did not change the fair value or vesting conditions and therefore no modification accounting was required. For the performance restricted stock,
486,501
shares were earned as of
January 31, 2019
based on the performance condition achieved and these shares are subject to a service condition through the vesting period. The remaining shares were canceled.
During the
year ended January 31, 2019
, we granted an aggregate of
2,138,810
shares of performance restricted stock as follows:
•
1,954,908
were issued at the maximum target percentage of
180%
, with both performance and service vesting conditions payable in common shares, from
0%
to
180%
of the target number granted, contingent upon the degree to which the performance condition is met. The shares may be earned from
0%
to
180%
. A total of
1,172,945
shares were earned as of
January 31, 2019
based on the performance condition achieved and these shares are subject to service conditions through the vesting periods. The remaining shares were canceled.
•
183,902
shares were issued at the target percentage of 100%, with both performance and service vesting conditions payable in common shares, from
0%
to
160%
of the target number granted, contingent upon the degree to which the performance condition is met. Because the performance condition for these shares was not established as of
January 31, 2019
, there was no grant date from an accounting
79
perspective and no stock-based compensation expense was recognized. Also, no grant date fair value was considered in the calculation of weighted-average grant date fair value in the table below.
A summary of the restricted stock activity under our 2015 Plan and related information is as follows:
|
|
Number of Restricted Stock Outstanding
|
Weighted-
Average
Grant Date
Fair Value
|
Aggregate
Intrinsic Value
(in thousands)
|
|||||||
|
Unvested Balance as of January 31, 2018
|
—
|
|
$
|
—
|
|
$
|
—
|
|
||
|
Granted and converted
|
3,514,020
|
|
19.25
|
|
||||||
|
Vested
|
(145,232
|
)
|
12.84
|
|
||||||
|
Forfeited/canceled
|
(1,101,219
|
)
|
21.15
|
|
||||||
|
Unvested Balance as of January 31, 2019
|
2,267,569
|
|
$
|
18.70
|
|
$
|
40,612
|
|
||
All unvested shares of restricted stock are subject to cancellation to the extent vesting conditions are not met. The aggregate fair value of restricted stock that vested during the year ended
January 31, 2019
was
$3.6 million
.
During the year ended
January 31, 2019
, we recognized $
23.3 million
in stock-based compensation expense related to restricted stock. As of
January 31, 2019
, total unrecognized employee compensation cost related to unvested restricted stock was
$18.5 million
, which is expected to be recognized over a weighted-average period of approximately
2.2
years.
Stock-Based Compensation Expense
The following table summarizes the components of stock-based compensation expense recognized in the consolidated statements of operations (in thousands):
|
|
Year Ended January 31,
|
||||||||||
|
|
2017
|
2018
|
2019
|
||||||||
|
Cost of revenue—product
|
$
|
601
|
|
$
|
1,630
|
|
$
|
2,951
|
|
||
|
Cost of revenue—support subscription
|
5,639
|
|
9,050
|
|
12,378
|
|
|||||
|
Research and development
|
63,495
|
|
71,229
|
|
92,484
|
|
|||||
|
Sales and marketing
|
34,317
|
|
47,687
|
|
66,350
|
|
|||||
|
General and administrative
|
12,616
|
|
21,077
|
|
36,482
|
|
|||||
|
Total stock-based compensation expense
|
$
|
116,668
|
|
$
|
150,673
|
|
$
|
210,645
|
|
||
Note 10. Net Loss per Share Attributable to Common Stockholders
Basic and diluted net loss per share attributable to common stockholders is presented in conformity with the two-class method required for participating securities. Basic net loss per share attributable to common stockholders is computed by dividing the net loss attributable to common stockholders by the weighted-average number of shares of common stock outstanding during the period, less shares subject to repurchase. Diluted net loss per share attributable to common stockholders is computed by giving effect to all potentially dilutive common stock equivalents, including our outstanding stock options, common stock related to unvested restricted stock units, repurchasable shares from early exercised stock options and restricted stock awards, convertible senior notes to the extent dilutive, and common stock issuable pursuant to the ESPP. These potentially dilutive common stock equivalents have been excluded from the calculation of diluted net loss per share attributable to common stockholders as their effect is anti-dilutive.
In December 2018, all outstanding shares of Class B common stock converted to shares of Class A common stock as discussed in Note 8. The conversion did not impact our basic or diluted net loss per share attributable to common stockholders for the year ended
January 31, 2019
. Prior to the conversion, the rights, including the liquidation and dividend rights, of the holders of our Class A and Class B common stock were identical, except with respect to voting. As the liquidation and dividend rights were identical, the undistributed earnings were allocated on a proportionate basis and the resulting net loss per share attributed to common stockholders was, therefore, the same for both Class A and Class B common stock on an individual or combined basis for the years ended
January 31, 2017
and
2018
.
80
The following table sets forth the computation of basic and diluted net loss per share attributable to common stockholders (in thousands, except per share data):
|
|
Year Ended January 31,
|
||||||||||
|
|
2017
|
2018
|
2019
|
||||||||
|
|
(As Adjusted*)
|
(As Adjusted*)
|
|||||||||
|
Net loss
|
$
|
(221,532
|
)
|
$
|
(159,878
|
)
|
$
|
(178,362
|
)
|
||
|
Weighted-average shares used in computing net loss
per share attributable to common stockholders, basic and diluted |
194,714
|
|
211,609
|
|
232,042
|
|
|||||
|
Net loss per share attributable to common stockholders,
basic and diluted
|
$
|
(1.14
|
)
|
$
|
(0.76
|
)
|
$
|
(0.77
|
)
|
||
* As adjusted to reflect the impact of the full retrospective adoption of ASC 606. For further information, see Note 2.
The following weighted-average outstanding shares of common stock equivalents were excluded from the computation of diluted net loss per share attributable to common stockholders for the periods presented because including them would have been anti-dilutive (in thousands):
|
|
Year Ended January 31,
|
|||||||
|
|
2017
|
2018
|
2019
|
|||||
|
Stock options to purchase common stock
|
63,984
|
|
52,424
|
|
39,928
|
|
||
|
Unvested restricted stock units
|
5,216
|
|
15,496
|
|
19,488
|
|
||
|
Restricted stock awards subject to repurchase
|
—
|
|
—
|
|
2,881
|
|
||
|
Shares related to convertible senior notes
|
—
|
|
—
|
|
17,867
|
|
||
|
Shares issuable pursuant to the ESPP
|
1,310
|
|
1,544
|
|
2,411
|
|
||
|
Early exercised stock options subject to repurchase
|
2,106
|
|
246
|
|
7
|
|
||
|
Total
|
72,616
|
|
69,710
|
|
82,582
|
|
||
Note 11. Other Income (Expense), Net
Other income (expense), net consists of the following (in thousands):
|
Year Ended January 31,
|
|||||||||||
|
2017
|
2018
|
2019
|
|||||||||
|
Interest income
(1)
|
$
|
4,052
|
|
$
|
5,424
|
|
$
|
18,013
|
|
||
|
Interest expense
(2)
|
(44
|
)
|
(19
|
)
|
(21,615
|
)
|
|||||
|
Foreign currency transaction gains (losses)
|
(2,632
|
)
|
5,976
|
|
(5,230
|
)
|
|||||
|
Other income
|
251
|
|
64
|
|
816
|
|
|||||
|
Total other income (expense), net
|
$
|
1,627
|
|
$
|
11,445
|
|
$
|
(8,016
|
)
|
||
_________________________________
(1) Interest income includes the interest income related to our cash, cash equivalents and marketable securities and non-cash interest income related to accretion (amortization) of the discount (premium) on marketable securities.
(2) Interest expense includes non-cash interest expense related to amortization of the debt discount and debt issuance costs and the contractual interest expense related to the Notes for the year ended
January 31, 2019
.
Note 12. Income Taxes
The geographical breakdown of loss before provision for income taxes is as follows (in thousands):
81
|
|
Year Ended January 31,
|
||||||||||
|
|
2017
|
2018
|
2019
|
||||||||
|
(As Adjusted*)
|
|
(As Adjusted*)
|
|
||||||||
|
Domestic
|
$
|
(176,821
|
)
|
$
|
(117,391
|
)
|
$
|
(145,428
|
)
|
||
|
International
|
(42,824
|
)
|
(38,598
|
)
|
(31,845
|
)
|
|||||
|
Total
|
$
|
(219,645
|
)
|
$
|
(155,989
|
)
|
$
|
(177,273
|
)
|
||
_________________________________
*As adjusted to reflect the impact of the full retrospective adoption of ASC 606. For further information, see Note 2.
The components of the provision for income taxes are as follows (in thousands):
|
|
Year Ended January 31,
|
||||||||||
|
|
2017
|
2018
|
2019
|
||||||||
|
Current:
|
|
|
|
|
|
|
|||||
|
State
|
$
|
389
|
|
$
|
525
|
|
$
|
571
|
|
||
|
Foreign
|
1,806
|
|
3,580
|
|
4,214
|
|
|||||
|
Total
|
$
|
2,195
|
|
$
|
4,105
|
|
$
|
4,785
|
|
||
|
Deferred:
|
|
|
|
|
|
|
|||||
|
Federal
|
$
|
—
|
|
$
|
—
|
|
$
|
(2,776
|
)
|
||
|
State
|
—
|
|
—
|
|
(920
|
)
|
|||||
|
Foreign
|
(308
|
)
|
(216
|
)
|
—
|
|
|||||
|
Total
|
$
|
(308
|
)
|
$
|
(216
|
)
|
$
|
(3,696
|
)
|
||
|
Provision for income taxes
|
$
|
1,887
|
|
$
|
3,889
|
|
$
|
1,089
|
|
||
The reconciliation of the federal statutory income tax rate and effective income tax rate is as follows (in thousands):
|
|
Year Ended January 31,
|
||||||||||
|
|
2017
|
2018
|
2019
|
||||||||
|
(* As Adjusted)
|
|
(* As Adjusted)
|
|
||||||||
|
Tax at federal statutory rate
|
$
|
(74,680
|
)
|
$
|
(51,314
|
)
|
$
|
(37,227
|
)
|
||
|
State tax, net of federal benefit
|
276
|
|
351
|
|
(469
|
)
|
|||||
|
Stock-based compensation expense
|
(5,242
|
)
|
(9,953
|
)
|
(28,437
|
)
|
|||||
|
Research and development tax credits
|
(1,570
|
)
|
(7,629
|
)
|
(10,371
|
)
|
|||||
|
Foreign rate differential
|
15,878
|
|
18,667
|
|
12,299
|
|
|||||
|
Change in valuation allowance
|
65,861
|
|
(44,784
|
)
|
85,533
|
|
|||||
|
Foreign on-shoring intellectual property
|
—
|
|
—
|
|
(20,371
|
)
|
|||||
|
Remeasurement of deferred tax assets and liabilities due to tax reform
|
—
|
|
97,280
|
|
—
|
|
|||||
|
Other
|
1,364
|
|
1,271
|
|
132
|
|
|||||
|
Provision for income taxes
|
$
|
1,887
|
|
$
|
3,889
|
|
$
|
1,089
|
|
||
_________________________________
*As adjusted to reflect the impact of the full retrospective adoption of ASC 606. For further information, see Note 2.
82
Deferred income taxes reflect the net effects of temporary differences between the carrying amounts of assets and liabilities for financial reporting purposes and the amounts used for income tax purposes. The significant components of our deferred tax assets and liabilities were as follows (in thousands):
|
|
January 31,
|
||||||
|
|
2018
|
2019
|
|||||
|
(As Adjusted*)
|
|||||||
|
Deferred tax assets:
|
|
|
|
|
|||
|
Net operating loss carryforwards
|
$
|
127,621
|
|
$
|
189,117
|
|
|
|
Tax credit carryover
|
33,105
|
|
50,848
|
|
|||
|
Accruals and reserves
|
1,809
|
|
12,506
|
|
|||
|
Deferred revenue
|
38,816
|
|
43,579
|
|
|||
|
Stock-based compensation expense
|
24,133
|
|
31,743
|
|
|||
|
Depreciation and amortization
|
15,367
|
|
19,578
|
|
|||
|
Charitable contribution carryforwards
|
2,892
|
|
2,850
|
|
|||
|
Other
|
465
|
|
81
|
|
|||
|
Total deferred tax assets
|
$
|
244,208
|
|
$
|
350,302
|
|
|
|
Valuation allowance
|
(221,930
|
)
|
(307,475
|
)
|
|||
|
Total deferred tax assets, net of valuation allowance
|
$
|
22,278
|
|
$
|
42,827
|
|
|
|
Deferred tax liabilities:
|
|
|
|
|
|||
|
Deferred commissions
|
$
|
(21,218
|
)
|
$
|
(27,537
|
)
|
|
|
Convertible debt
|
—
|
|
(14,230
|
)
|
|||
|
Total deferred tax liabilities
|
$
|
(21,218
|
)
|
$
|
(41,767
|
)
|
|
|
Net deferred tax assets
|
$
|
1,060
|
|
$
|
1,060
|
|
|
_________________________________
*As adjusted to reflect the impact of the full retrospective adoption of ASC 606.
We adopted ASC 606 effective February 1, 2018 and recorded a decrease of
$7.8 million
in U.S. deferred tax assets related to deferred revenue and an increase of
$10.8 million
in U.S. deferred tax liabilities related to deferred commissions as of January 31, 2018, which was fully offset by a decrease in the valuation allowance of
$18.6 million
.
In connection with the StorReduce acquisition during the third quarter of fiscal year
2019
, we recorded a net deferred tax liability which provides an additional source of taxable income to support the realizability of the pre-existing deferred tax assets and, accordingly, we released
$3.7 million
of our U.S. valuation allowance. We continue to maintain a valuation allowance for our U.S. federal and state deferred tax assets.
The Tax Act was signed into law on December 22, 2017. The new legislation decreases the U.S. corporate federal income tax rate from 35% to 21% effective January 1, 2018.
The Tax Act also includes a number of other provisions including the elimination of loss carrybacks and limitations on the use of future losses, limitations on the deductibility of executive compensation, limitation or modification on the deductibility of certain business expenses, the transition of U.S. international taxation from a worldwide tax system to a territorial system, and the introduction of a base erosion and anti-abuse tax. Under the Tax Act, the Global Intangible Low-Taxed Income (GILTI) provision taxes foreign income in excess of a deemed return on tangible assets of foreign corporations. Under U.S. GAAP, companies are allowed to make an accounting policy election to either (i) account for GILTI as a component of tax expense in the period in which a company is subject to the rules — the period cost method, or (ii) account for GILTI in a company’s measurement of deferred taxes — the deferred method. Though we did not generate any GILTI during the year ended
January 31, 2019
, we have elected to recognize the GILTI tax as a period cost in the future, as applicable.
As of
January 31, 2019
, the undistributed earnings of
$31.2
million from non-U.S. operations held by our foreign subsidiaries are designated as permanently reinvested outside the U.S. Accordingly, no additional U.S. income taxes
83
or additional foreign withholding taxes have been provided thereon. Determination of the amount of unrecognized deferred tax liability related to these earnings is not practicable.
As of
January 31, 2019
, we had net operating loss carryforwards for federal income tax purposes of approximately
$772.1 million
and state income tax purposes of approximately
$451.5 million
. These net operating loss carryforwards will expire, if not utilized, beginning in
2028
for federal and state income tax purposes.
We had federal and state research and development tax credit carryforwards of approximately
$40.5 million
and
$34.4 million
as of
January 31, 2019
. The federal research and development tax credit carryforwards will expire commencing in
2028
, while the state research and development tax credit carryforwards have no expiration date.
Realization of deferred tax assets is dependent on future taxable income, the existence and timing of which is uncertain. Based on our history of losses, management has determined that it is more likely than not that the U.S. deferred tax assets will not be realized, and accordingly has placed a full valuation allowance on the net U.S. deferred tax assets. The valuation allowance decreased by
$28.4 million
and increased by
$85.5 million
, during the years ended January 31,
2018
and
2019
.
Utilization of the net operating loss carryforwards and credits may be subject to substantial annual limitation due to the ownership change limitations provided by Section 382 of the Internal Revenue Code of 1986, as amended, and similar state provisions. The annual limitation may result in the expiration of net operating losses and credits before utilization. In February 2019, we completed an analysis through January 2019 to evaluate whether there are any limitations of our net operating loss carryforwards and concluded no limitations currently exist.
Uncertain Tax Positions
The activity related to the unrecognized tax benefits is as follows (in thousands):
|
|
Year Ended January 31,
|
||||||||||
|
|
2017
|
2018
|
2019
|
||||||||
|
Gross unrecognized tax benefits—beginning balance
|
$
|
15,470
|
|
$
|
6,375
|
|
$
|
12,401
|
|
||
|
Decreases related to tax positions taken during prior years
|
(11,286
|
)
|
(24
|
)
|
(845
|
)
|
|||||
|
Increases related to tax positions taken during prior years
|
—
|
|
619
|
|
—
|
|
|||||
|
Increases related to tax positions taken during current year
|
2,191
|
|
5,431
|
|
7,335
|
|
|||||
|
Gross unrecognized tax benefits—ending balance
|
$
|
6,375
|
|
$
|
12,401
|
|
$
|
18,891
|
|
||
As of
January 31, 2019
, our gross unrecognized tax benefit was approximately
$18.9 million
, none of which if recognized, would have an impact on the effective tax rate because it would be offset by the reversal of deferred tax assets which are subject to a full valuation allowance.
As of
January 31, 2019
, we had
no
current or cumulative interest and penalties related to uncertain tax positions.
It is difficult to predict the final timing and resolution of any particular uncertain tax position. Based on our assessment, including experience and complex judgments about future events, we do not expect that changes in the liability for unrecognized tax benefits during the next twelve months will have a significant impact on our consolidated financial position or results of operations.
We file income tax returns in the U.S. federal jurisdiction as well as many U.S. states and foreign jurisdictions. The tax returns for fiscal years 2009 and forward remain open to examination by the major jurisdictions in which we are subject to tax. The tax returns for fiscal years outside the normal statutes of limitation remain open to audit by tax authorities due to tax attributes generated in those early years, which have been carried forward and may be audited in subsequent years when utilized.
84
Note 13. Segment Information
Our chief operating decision maker is a group comprised of our Chief Executive Officer, our Chief Financial Officer, and our President. This group reviews financial information presented on a consolidated basis for purposes of allocating resources and evaluating financial performance. We have
one
business activity and there are no segment managers who are held accountable for operations or operating results. Accordingly, we have a single reportable segment.
Disaggregation of Revenue
The following table depicts the disaggregation of revenue by geographic area based on the billing address of our customers and is consistent with how we evaluate our financial performance (in thousands):
|
|
Year Ended January 31,
|
||||||||||
|
|
2017
|
2018
|
2019
|
||||||||
|
(As Adjusted*)
|
|
(As Adjusted*)
|
|
||||||||
|
United States
|
$
|
569,984
|
|
$
|
763,719
|
|
$
|
979,454
|
|
||
|
Rest of the world
|
169,187
|
|
261,043
|
|
380,370
|
|
|||||
|
Total revenue
|
$
|
739,171
|
|
$
|
1,024,762
|
|
$
|
1,359,824
|
|
||
* As adjusted to reflect the impact of the full retrospective adoption of ASC 606. For further information, see Note 2.
Long-Lived Assets by Geographic Area
Long-lived assets by geographic area are summarized as follows (in thousands):
|
|
January 31,
|
||||||
|
|
2018
|
2019
|
|||||
|
United States
|
$
|
85,430
|
|
$
|
120,876
|
|
|
|
Rest of the world
|
3,712
|
|
4,477
|
|
|||
|
Total long-lived assets
|
$
|
89,142
|
|
$
|
125,353
|
|
|
Note 14. 401(k) Plan
We have a 401(k) savings plan (the 401(k) plan) which qualifies as a deferred salary arrangement under section 401(k) of the Internal Revenue Code. Under the 401(k) plan, participating employees may elect to contribute up to
85%
of their eligible compensation, subject to certain limitations. Effective January 1, 2019, we have elected to match
50%
of employees' contributions up to a maximum of
$4,000
annually. Matching contributions will be immediately vested. Our contributions to the plan were
$1.4 million
during the year ended
January 31, 2019
.
85
Item 9. Changes in and Disagreements with Accountants on Accounting and Financial Disclosure
None.
Item 9A. Controls and Procedures
Evaluation of Disclosure Controls and Procedures
Our management, with the participation of our Chief Executive Officer and Chief Financial Officer, evaluated the effectiveness of our disclosure controls and procedures (as defined in Rules 13a-15(e) and 15d-15(e) under the Exchange Act) as of the end of the period covered by this Annual Report on Form 10-K. Based on such evaluation, our Chief Executive Officer and Chief Financial Officer concluded that, as of
January 31, 2019
, our disclosure controls and procedures were designed at a reasonable assurance level and were effective to provide reasonable assurance that information we are required to disclose in reports that we file or submit under the Exchange Act is recorded, processed, summarized, and reported within the time periods specified in the SEC's rules and forms, and that such information is accumulated and communicated to our management, including our Chief Executive Officer and Chief Financial Officer, as appropriate, to allow timely decisions regarding required disclosure.
Management’s Report on Internal Control over Financial Reporting
Our management is responsible for establishing and maintaining adequate internal control over financial reporting, as defined in Rule 13a-15(f) and Rule 15d-15(f) of the Exchange Act. Internal control over financial reporting consists of policies and procedures that: (1) pertain to the maintenance of records that, in reasonable detail, accurately and fairly reflect the transactions and dispositions of the assets of the Company; (2) are designed and operated to provide reasonable assurance regarding the reliability of our financial reporting and our process for the preparation of financial statements for external purposes in accordance with generally accepted accounting principles and that receipts and expenditures of the Company are being made only in accordance with authorizations of management and directors of the Company; and (3) provide reasonable assurance regarding prevention or timely detection of unauthorized acquisition, use or disposition of the Company's assets that could have a material effect on the financial statements. Our management evaluated the effectiveness of our internal control over financial reporting using the criteria set forth by the Committee of Sponsoring Organizations of the Treadway Commission in
Internal Control - Integrated Framework (2013)
. Based on the results of our evaluation, our management has concluded that our internal control over financial reporting was effective as of
January 31, 2019
.
The effectiveness of our internal control over financial reporting as of
January 31, 2019
has been audited by Deloitte & Touche LLP, an independent registered public accounting firm, as stated in their report, which appears in Part II, Item 8 of this Annual Report on Form 10-K.
Changes in Internal Control over Financial Reporting
There was no change in our internal control over financial reporting identified in connection with the evaluation required by Rule 13a-15(d) and 15d-15(d) of the Exchange Act that occurred during the quarter ended
January 31, 2019
that has materially affected, or is reasonably likely to materially affect, our internal control over financial reporting.
Limitations on the Effectiveness of Controls
In designing and evaluating the disclosure controls and procedures and internal control over financial reporting, management recognizes that any controls and procedures, no matter how well designed and operated, can provide only reasonable assurance of achieving the desired control objectives. In addition, the design of disclosure controls and procedures and internal control over financial reporting must reflect the fact that there are resource constraints and that management is required to apply its judgment in evaluating the benefits of possible controls and procedures relative to their costs.
Item 9B. Other Information
None.
86
PART III
Item 10. Directors, Executive Officers and Corporate Governance.
The information required by this item is incorporated herein by reference to our definitive proxy statement for our
2019
annual meeting of stockholders (2019 Proxy Statement), which will be filed not later than 120 days after the end of our fiscal year ended
January 31, 2019
.
Item 11. Executive Compensation.
The information required by this item is incorporated herein by reference to our
2019
Proxy Statement.
Item 12. Security Ownership of Certain Beneficial Owners and Management and Related Stockholder Matters.
The information required by this item is incorporated herein by reference to our
2019
Proxy Statement.
Item 13. Certain Relationships and Related Transactions, and Director Independence.
The information required by this item is incorporated herein by reference to our
2019
Proxy Statement.
Item 14. Principal Accounting Fees and Services.
The information required by this item is incorporated herein by reference to our
2019
Proxy Statement.
87
PART IV
Item 15. Exhibits, Financial Statement Schedules
(a)(1) Consolidated Financial Statements
We have filed the consolidated financial statements listed in the Index to Consolidated Financial Statements, Schedules, and Exhibits included in Part II, Item 8, “Financial Statements and Supplementary Data” of this Annual Report on Form 10-K.
(a)(2) Financial Statement Schedules
All financial statement schedules have been omitted because they are not applicable, not material, or the required information is shown in the consolidated financial statements or the notes thereto.
(a)(3) Exhibits
The documents set forth below are filed herewith or incorporated herein by reference to the location indicated.
88
Exhibit Index
|
|
|
Incorporation By Reference
|
|
|||||||
|
Exhibit
Number
|
Description
|
Form
|
SEC File No.
|
Exhibit
|
Filing Date
|
|||||
|
3.1
|
10-Q
|
001-37570
|
3.1
|
12/11/2015
|
||||||
|
3.2
|
S-1
|
333-206312
|
3.4
|
9/9/2015
|
||||||
|
4.1
|
S-1
|
333-206312
|
4.1
|
9/9/2015
|
||||||
|
4.2
|
Reference is made to
Exhibits 3.1
and
3.2
.
|
—
|
—
|
—
|
—
|
|||||
|
4.3
|
8-K
|
001-37570
|
4.1
|
4/10/2018
|
||||||
|
4.4
|
8-K
|
001-37570
|
4.1
|
4/10/2018
|
||||||
|
10.1
|
S-1
|
333-206312
|
10.1
|
8/12/2015
|
||||||
|
10.2+
|
S-1
|
333-206312
|
10.2
|
8/12/2015
|
||||||
|
10.3+
|
S-1
|
333-206312
|
10.3
|
8/12/2015
|
||||||
|
10.4+
|
S-1
|
333-206312
|
10.4
|
9/9/2015
|
||||||
|
10.5+
|
S-1
|
333-206312
|
10.5
|
9/24/2015
|
||||||
|
10.6+
|
10-K
|
001-37570
|
10.6
|
3/25/2016
|
||||||
|
10.7+
|
8-K
|
001-37570
|
10.1
|
3/16/2018
|
||||||
|
10.8+
|
S-1
|
333-206312
|
10.6
|
9/9/2015
|
||||||
|
10.9+
|
S-1
|
333-206312
|
10.7
|
9/9/2015
|
||||||
|
10.10+
|
10-Q
|
001-37570
|
10.1
|
12/8/2017
|
||||||
|
10.11+
|
S-1
|
333-206312
|
10.9
|
8/12/2015
|
||||||
|
10.12+
|
S-1
|
333-206312
|
10.10
|
8/12/2015
|
||||||
|
10.13+
|
S-1
|
333-206312
|
10.12
|
9/24/2015
|
||||||
|
21.1*
|
—
|
—
|
—
|
—
|
||||||
89
|
|
|
Incorporation By Reference
|
|
|||||||
|
Exhibit
Number
|
Description
|
Form
|
SEC File No.
|
Exhibit
|
Filing Date
|
|||||
|
23.1*
|
—
|
—
|
—
|
—
|
||||||
|
24.1*
|
—
|
—
|
—
|
—
|
||||||
|
31.1*
|
|
—
|
—
|
—
|
—
|
|||||
|
|
|
|
|
|
|
|
|
|
||
|
31.2*
|
|
—
|
—
|
—
|
—
|
|||||
|
|
|
|
|
|
|
|
|
|
||
|
32.1**
|
|
—
|
—
|
—
|
—
|
|||||
|
|
|
|
|
|
|
|
|
|
||
|
99.1
|
8-K
|
001-37570
|
99.1
|
4/10/2018
|
||||||
|
101.INS
|
|
XBRL Instance Document
|
—
|
—
|
—
|
—
|
||||
|
|
|
|
|
|
|
|
|
|
||
|
101.SCH
|
|
XBRL Taxonomy Extension Schema Document
|
—
|
—
|
—
|
—
|
||||
|
|
|
|
|
|
|
|
|
|
||
|
101.CAL
|
|
XBRL Taxonomy Extension Calculation Linkbase Document
|
—
|
—
|
—
|
—
|
||||
|
|
|
|
|
|
|
|
|
|
||
|
101.DEF
|
|
XBRL Taxonomy Extension Definition Linkbase Document
|
—
|
—
|
—
|
—
|
||||
|
|
|
|
|
|
|
|
|
|
||
|
101.LAB
|
|
XBRL Taxonomy Extension Label Linkbase Document
|
—
|
—
|
—
|
—
|
||||
|
|
|
|
|
|
|
|
|
|
||
|
101.PRE
|
|
XBRL Taxonomy Extension Presentation Linkbase Document
|
—
|
—
|
—
|
—
|
||||
|
*
|
Filed herewith.
|
|
|
**
|
Furnished herewith.
|
|
|
+
|
Indicates management contract or compensatory plan.
|
|
SIGNATURES
Pursuant to the requirements of Section 13 or 15(d) of the Securities Exchange Act of 1934, the registrant has duly caused this Annual Report on Form 10-K to be signed on its behalf by the undersigned, thereunto duly authorized.
Date:
March 26, 2019
|
PURE STORAGE, INC.
|
|||
|
|
|
|
|
|
By:
|
|
/s/ Charles H. Giancarlo
|
|
|
|
|
Charles H. Giancarlo
|
|
|
|
|
Chief Executive Officer
|
|
90
POWER OF ATTORNEY
KNOW ALL PERSONS BY THESE PRESENTS, that each person whose signature appears below constitute and appoint Charles H. Giancarlo, Timothy Riitters, Scott Dietzen and each one of them, as his or her true and lawful attorneys-in-fact and agents, with full power of substitution and resubstitution, for him or her and in their name, place, and stead, in any and all capacities, to sign any and all amendments to this Annual Report on Form 10-K, and to file the same, with all exhibits thereto and other documents in connection therewith, with the Securities and Exchange Commission, granting unto said attorneys-in-fact and agents, and each of them, full power and authority to do and perform each and every act and thing requisite and necessary to be done in connection therewith, as fully to all intents and purposes as he or she might or could do in person, hereby ratifying and confirming all that said attorneys-in-fact and agents or any of them, or his, her or their substitute or substitutes, may lawfully do or cause to be done by virtue hereof.
Pursuant to the requirements of the Securities Act of 1934, this Annual Report on Form 10-K has been signed by the following persons in the capacities and on the dates indicated.
|
Signature
|
|
Title
|
|
Date
|
||
|
/s/ Charles H. Giancarlo
|
|
Chief Executive Officer, Chairman and Director
(Principal Executive Officer)
|
|
March 26, 2019
|
||
|
Charles H. Giancarlo
|
|
|
||||
|
/s/ Timothy Riitters
|
|
Chief Financial Officer
(Principal Financial and Accounting Officer)
|
|
March 26, 2019
|
||
|
Timothy Riitters
|
|
|
||||
|
/s/ Scott Dietzen
|
Vice Chairman and Director
|
March 26, 2019
|
||||
|
Scott Dietzen
|
||||||
|
/s/ John Colgrove
|
|
Chief Technology Officer and Director
|
|
March 26, 2019
|
||
|
John Colgrove
|
|
|
||||
|
/s/ Susan Taylor
|
|
Director
|
|
March 26, 2019
|
||
|
Susan Taylor
|
|
|
||||
|
/s/ Mark Garrett
|
|
Director
|
|
March 26, 2019
|
||
|
Mark Garrett
|
|
|
||||
|
/s/ Anita M. Sands
|
|
Director
|
|
March 26, 2019
|
||
|
Anita M. Sands
|
|
|
||||
|
/s/ Frank Slootman
|
|
Director
|
|
March 26, 2019
|
||
|
Frank Slootman
|
|
|
||||
|
/s/ Mike Speiser
|
Director
|
March 26, 2019
|
||||
|
Mike Speiser
|
||||||
|
/s/ Roxanne Taylor
|
|
Director
|
|
March 26, 2019
|
||
|
Roxanne Taylor
|
||||||
91
TABLE OF CONTENTS
Part IItem 1. BusinessItem 1A. Risk FactorsItem 1B. Unresolved Staff CommentsItem 2. PropertiesItem 3. Legal ProceedingsItem 4. Mine Safety DisclosuresPart IIItem 5. Market For Registrant S Common Equity, Related Stockholder Matters and Issuer Purchases Of Equity SecuritiesItem 6. Selected Financial DataItem 7. Management S Discussion and Analysis Of Financial Condition and Results Of OperationsItem 7A. Quantitative and Qualitative Disclosures About Market RiskItem 8. Financial Statements and Supplementary DataNote 1. Business OverviewNote 2. Basis Of Presentation and Summary Of Significant Accounting PoliciesNote 3. Financial InstrumentsNote 4. Business CombinationNote 5. Balance Sheet ComponentsNote 6. Convertible Senior NotesNote 7. Commitments and ContingenciesNote 8. Stockholders EquityNote 9. Equity Incentive PlansNote 10. Net Loss Per Share Attributable To Common StockholdersNote 11. Other Income (expense), NetNote 12. Income TaxesNote 13. Segment InformationNote 14. 401(k) PlanItem 9. Changes in and Disagreements with Accountants on Accounting and Financial DisclosureItem 9A. Controls and ProceduresItem 9B. Other InformationPart IIIItem 10. Directors, Executive Officers and Corporate GovernanceItem 11. Executive CompensationItem 12. Security Ownership Of Certain Beneficial Owners and Management and Related Stockholder MattersItem 13. Certain Relationships and Related Transactions, and Director IndependenceItem 14. Principal Accounting Fees and ServicesPart IVItem 15. Exhibits, Financial Statement Schedules