PHILLIPS 66
10-Ks and 10-Qs
|
|
|
|
|
|
|
|
|
|
|
|
|
|
|
|
|
|
|
|
|
|
|
|
|
|
|
|
|
|
|
|
|
|
|
|
|
|
|
|
|
|
2018
|
||||
|
UNITED STATES
|
||
|
SECURITIES AND EXCHANGE COMMISSION
|
||
|
Washington, D.C. 20549
|
||
|
FORM 10-K
|
||
|
(Mark One)
|
||
|
[X]
|
ANNUAL REPORT PURSUANT TO SECTION 13 OR 15(d) OF THE SECURITIES EXCHANGE ACT OF 1934
|
|
|
For the fiscal year ended
|
December 31, 2018
|
|
|
OR
|
||
|
[ ]
|
TRANSITION REPORT PURSUANT TO SECTION 13 OR 15(d) OF THE SECURITIES EXCHANGE ACT OF 1934
|
|
|
For the transition period from
|
to
|
|||
|
Commission file number:
001-35349
|
||||
|
Phillips 66
|
||
|
(Exact name of registrant as specified in its charter)
|
||
|
Delaware
|
|
45-3779385
|
||
|
(State or other jurisdiction of
incorporation or organization)
|
|
(I.R.S. Employer
Identification No.)
|
||
|
2331 CityWest Blvd., Houston, Texas 77042
|
||
|
(Address of principal executive offices) (Zip Code)
|
||
|
Registrant’s telephone number, including area code:
281-293-6600
|
||
|
Securities registered pursuant to Section 12(b) of the Act:
|
||||
|
Title of each class
|
Name of each exchange on which registered
|
|||
|
Common Stock, $0.01 Par Value
|
New York Stock Exchange
|
|||
|
Securities registered pursuant to Section 12(g) of the Act: None
|
||||
|
Indicate by check mark if the registrant is a well-known seasoned issuer, as defined in Rule 405 of the Securities Act.
|
[X] Yes [ ] No
|
|||
|
Indicate by check mark if the registrant is not required to file reports pursuant to Section 13 or Section 15(d) of the Act.
|
[ ] Yes [X] No
|
|||
|
Indicate by check mark whether the registrant (1) has filed all reports required to be filed by Section 13 or 15(d) of the Securities Exchange Act of 1934 during the preceding 12 months (or for such shorter period that the registrant was required to file such reports), and (2) has been subject to such filing requirements for the past 90 days.
|
[X] Yes [ ] No
|
|||
|
Indicate by check mark whether the registrant has submitted electronically every Interactive Data File required to be submitted pursuant to Rule 405 of Regulation S-T during the preceding 12 months (or for such shorter period that the registrant was required to submit such files).
|
[X] Yes [ ] No
|
|||
|
Indicate by check mark if disclosure of delinquent filers pursuant to Item 405 of Regulation S-K is not contained herein, and will not be contained, to the best of the registrant’s knowledge, in definitive proxy or information statements incorporated by reference in Part III of this Form 10-K or any amendment to this Form 10-K.
|
[ ]
|
|||
|
Indicate by check mark whether the registrant is a large accelerated filer, an accelerated filer, a non-accelerated filer, a smaller reporting company, or an emerging growth company. See the definitions of “large accelerated filer,” “accelerated filer,” “smaller reporting company” and “emerging growth company” in Rule 12b-2 of the Exchange Act.
|
||||
|
Large accelerated filer [X]
|
Accelerated filer [ ]
|
Non-accelerated filer [ ]
|
Smaller reporting company [ ]
|
|
|
Emerging growth company [ ]
|
||||
|
If an emerging growth company, indicate by check mark if the registrant has elected not to use the extended transition period for complying with any new or revised financial accounting standards provided pursuant to Section 13(a) of the Exchange Act.
|
[ ]
|
|||
|
Indicate by check mark whether the registrant is a shell company (as defined in Rule 12b-2 of the Act).
|
[ ] Yes [X] No
|
|||
The aggregate market value of common stock held by non-affiliates of the registrant on
June 29, 2018
, the last business day of the registrant’s most recently completed second fiscal quarter, based on the closing price on that date of
$112.31
, was
$52.1 billion
. The registrant, solely for the purpose of this required presentation, had deemed its Board of Directors and executive officers to be affiliates, and deducted their stockholdings in determining the aggregate market value.
The registrant had
454,913,087
shares of common stock outstanding at
January 31, 2019
.
Documents incorporated by reference:
Portions of the Proxy Statement for the Annual Meeting of Stockholders to be held on
May 8, 2019
(Part III).
|
TABLE OF CONTENTS
|
|
|
Item
|
Page
|
Unless otherwise indicated, “the company,” “we,” “our,” “us” and “Phillips 66” are used in this report to refer to the businesses of Phillips 66 and its consolidated subsidiaries.
This Annual Report on Form 10-K contains forward-looking statements including, without limitation, statements relating to our plans, strategies, objectives, expectations and intentions that are made pursuant to the “safe harbor” provisions of the Private Securities Litigation Reform Act of 1995. The words “anticipate,” “estimate,” “believe,” “budget,” “continue,” “could,” “intend,” “may,” “plan,” “potential,” “predict,” “seek,” “should,” “will,” “would,” “expect,” “objective,” “projection,” “forecast,” “goal,” “guidance,” “outlook,” “effort,” “target” and similar expressions identify forward-looking statements. The company does not undertake to update, revise or correct any forward-looking information unless required to do so under the federal securities laws. Readers are cautioned that such forward-looking statements should be read in conjunction with the company’s disclosures under the heading “CAUTIONARY STATEMENT FOR THE PURPOSES OF THE ‘SAFE HARBOR’ PROVISIONS OF THE PRIVATE SECURITIES LITIGATION REFORM ACT OF 1995.”
PART I
Items 1 and 2. BUSINESS AND PROPERTIES
CORPORATE STRUCTURE
Phillips 66, headquartered in Houston, Texas, was incorporated in Delaware in 2011 in connection with, and in anticipation of, a restructuring of ConocoPhillips that separated its downstream businesses into an independent, publicly traded company named Phillips 66. The two companies were separated by ConocoPhillips distributing to its stockholders all the shares of common stock of Phillips 66 after the market closed on April 30, 2012 (the Separation). Phillips 66 stock trades on the New York Stock Exchange under the “PSX” stock symbol.
Our business is organized into four operating segments:
|
1)
|
Midstream—
Provides crude oil and refined petroleum product transportation, terminaling and processing services, as well as natural gas and natural gas liquids (NGL) transportation, storage, processing and marketing services, mainly in the United States.
This segment includes our master limited partnership (MLP), Phillips 66 Partners LP (Phillips 66 Partners), as well as our
50 percent
equity investment in DCP Midstream, LLC (DCP Midstream).
|
|
2)
|
Chemicals—
Consists of our
50 percent
equity investment in Chevron Phillips Chemical Company LLC (CPChem), which manufactures and markets petrochemicals and plastics on a worldwide basis.
|
|
3)
|
Refining—
Refines crude oil and other feedstocks into petroleum products (such as gasoline, distillates and aviation fuels) at
13
refineries in the United States and Europe.
|
|
4)
|
Marketing and Specialties (M&S)—
Purchases for resale and markets refined petroleum products, mainly in the United States and Europe. In addition, this segment includes the manufacturing and marketing of specialty products (such as base oils and lubricants), as well as power generation operations.
|
Corporate and Other includes general corporate overhead, interest expense, our investment in new technologies and various other corporate activities. Corporate assets include all cash, cash equivalents and income tax-related assets.
At
December 31, 2018
, Phillips 66 had approximately
14,200
employees.
1
SEGMENT AND GEOGRAPHIC INFORMATION
MIDSTREAM
The Midstream segment consists of three business lines:
|
•
|
Transportation
—Transports crude oil and other feedstocks to our refineries and other locations, delivers refined petroleum products to market, and provides terminaling and storage services for crude oil and refined petroleum products.
|
|
•
|
NGL and Other
—Transports, stores, fractionates, exports and markets NGL and provides other fee-based processing services.
|
|
•
|
DCP Midstream
—Gathers, processes, transports and markets natural gas and transports, fractionates and markets NGL.
|
Phillips 66 Partners
Phillips 66 Partners, headquartered in Houston, Texas, is an MLP we formed in 2013 to own, operate, develop and acquire primarily fee-based midstream assets. At
December 31, 2018
, we owned a
54 percent
limited partner interest and a
2 percent
general partner interest in Phillips 66 Partners, while the public owned a
44 percent
limited partner interest and
13.8 million
perpetual convertible preferred units.
Phillips 66 Partners’ operations currently consist of crude oil, refined petroleum product and NGL transportation, processing, terminaling and storage assets that are geographically dispersed throughout the United States. The majority of Phillips 66 Partners’ assets are integral to Phillips 66-operated refineries.
The results of operations of Phillips 66 Partners are included in Midstream’s Transportation and NGL and Other business lines, based on the nature of the activity within the partnership.
Transportation
We own or lease various assets to provide transportation, terminaling and storage services. These assets include crude oil, refined petroleum product, NGL, and natural gas pipeline systems; crude oil, refined petroleum product and NGL terminals; a petroleum coke handling facility; marine vessels; railcars and trucks.
Pipelines and Terminals
At
December 31, 2018
, our Transportation business was comprised of over 21,000 miles of crude oil, refined petroleum product, NGL and natural gas pipeline systems in the United States, including those partially owned or operated by our affiliates. We owned or operated 39 refined petroleum product terminals, 20 crude oil terminals, 4 NGL terminals, a petroleum coke exporting facility and various other storage and loading locations.
The Beaumont Terminal in Nederland, Texas, is the largest terminal in the Phillips 66 portfolio. During 2018, we continued to invest in the terminal by adding 3.5 million barrels of crude oil storage capacity. At
December 31, 2018
, the terminal storage capacity was 14.6 million barrels, which included 10.9 million barrels of storage capacity for crude oil and 3.7 million barrels of storage capacity for refined petroleum products. A further expansion of 2.2 million barrels of crude oil capacity is planned for completion in the first quarter of 2020.
The Bayou Bridge Pipeline joint venture delivers crude oil from Nederland, Texas, to Lake Charles, Louisiana. Phillips 66 Partners has a 40 percent interest in the joint venture, and our co-venturer serves as the operator. An extension of the pipeline from Lake Charles to St. James, Louisiana, is expected to be in service in March 2019. The pipeline has a capacity of approximately 480,000 barrels per day (BPD).
2
The Gray Oak Pipeline system will provide crude oil transportation from the Permian Basin and Eagle Ford to destinations in the Corpus Christi and Freeport markets on the Texas Gulf Coast, including the Sweeny Refinery. The planned capacity of the pipeline is 900,000 BPD. At December 31, 2018, Phillips 66 Partners had an effective ownership interest in the pipeline system of 48.75 percent. In February 2019, another party exercised its option to acquire an interest in the pipeline system that reduced Phillips 66 Partners’ effective ownership interest to 42.25 percent. The pipeline system is expected to be in service by the end of 2019.
Phillips 66 Partners owns a 25 percent interest in the South Texas Gateway Terminal, which will connect to the Gray Oak Pipeline in Corpus Christi, Texas. The marine terminal, under development by a co-venturer, will have two deepwater docks and an initial storage capacity of 6.5 to 7 million barrels. The terminal is expected to start-up by mid-2020.
An open season commenced for the Red Oak Pipeline system on November 12, 2018. As proposed, this pipeline system would provide shippers the opportunity to transport crude oil from Cushing, Oklahoma, to Corpus Christi, Houston, and Beaumont, Texas. The initial throughput capacity on the pipeline is expected to be 400,000 BPD, with potential for further expansion. The pipeline system is anticipated to be placed in service in the fourth quarter of 2020.
An open season also commenced on the Liberty Pipeline system on November 12, 2018. As proposed, this pipeline system would provide shippers the opportunity to transport crude oil from the Rockies and Bakken production areas to Corpus Christi, Texas. The initial throughput capacity on the pipeline is expected to be 350,000 BPD, with potential for further expansion. The pipeline system is anticipated to be placed in service in the fourth quarter of 2020.
3
The following table depicts our ownership interest in major pipeline systems at
December 31, 2018
:
|
Name
|
State of
Origination/Terminus
|
Interest
|
Length
(Miles)
|
Gross Capacity
(MBD)
|
|||||||
|
Crude Oil
|
|||||||||||
|
Bakken Pipeline †
|
North Dakota/Texas
|
25
|
%
|
1,915
|
|
525
|
|
||||
|
Bayou Bridge †
|
Texas/Louisiana
|
40
|
|
49
|
|
480
|
|
||||
|
Clifton Ridge †
|
Louisiana
|
100
|
|
10
|
|
260
|
|
||||
|
CushPo †
|
Oklahoma
|
100
|
|
62
|
|
130
|
|
||||
|
Eagle Ford Gathering †
|
Texas
|
100
|
|
28
|
|
54
|
|
||||
|
Glacier †
|
Montana
|
79
|
|
865
|
|
126
|
|
||||
|
Line 100
|
California
|
100
|
|
79
|
|
54
|
|
||||
|
Line 200
|
California
|
100
|
|
228
|
|
93
|
|
||||
|
Line 300
|
California
|
100
|
|
61
|
|
48
|
|
||||
|
Line 400
|
California
|
100
|
|
153
|
|
40
|
|
||||
|
Line O †
|
Oklahoma/Texas
|
100
|
|
276
|
|
37
|
|
||||
|
Louisiana Crude Gathering
|
Louisiana
|
100
|
|
80
|
|
25
|
|
||||
|
New Mexico Crude †
|
New Mexico/Texas
|
100
|
|
227
|
|
106
|
|
||||
|
North Texas Crude †
|
Texas
|
100
|
|
224
|
|
28
|
|
||||
|
Oklahoma Crude †
|
Texas/Oklahoma
|
100
|
|
217
|
|
100
|
|
||||
|
Sacagawea †
|
North Dakota
|
50
|
|
95
|
|
175
|
|
||||
|
STACK PL †
|
Oklahoma
|
50
|
|
149
|
|
250
|
|
||||
|
Sweeny Crude
|
Texas
|
100
|
|
56
|
|
265
|
|
||||
|
West Texas Crude †
|
Texas
|
100
|
|
1,064
|
|
156
|
|
||||
|
Refined Petroleum Products
|
|||||||||||
|
ATA Line †
|
Texas/New Mexico
|
50
|
|
293
|
|
34
|
|
||||
|
Borger to Amarillo †
|
Texas
|
100
|
|
93
|
|
76
|
|
||||
|
Borger-Denver
|
Texas/Colorado
|
70
|
|
397
|
|
38
|
|
||||
|
Cherokee East †
|
Oklahoma/Missouri
|
100
|
|
287
|
|
55
|
|
||||
|
Cherokee North †
|
Oklahoma/Kansas
|
100
|
|
29
|
|
57
|
|
||||
|
Cherokee South †
|
Oklahoma
|
100
|
|
98
|
|
46
|
|
||||
|
Cross Channel Connector †
|
Texas
|
100
|
|
5
|
|
180
|
|
||||
|
Explorer †
|
Texas/Indiana
|
22
|
|
1,830
|
|
660
|
|
||||
|
Gold Line †
|
Texas/Illinois
|
100
|
|
686
|
|
120
|
|
||||
|
Harbor
|
New Jersey
|
33
|
|
80
|
|
171
|
|
||||
|
Heartland*
|
Kansas/Iowa
|
50
|
|
49
|
|
30
|
|
||||
|
LAX Jet Line
|
California
|
50
|
|
19
|
|
50
|
|
||||
|
Los Angeles Products
|
California
|
100
|
|
22
|
|
112
|
|
||||
|
Paola Products †
|
Kansas
|
100
|
|
106
|
|
96
|
|
||||
|
Pioneer
|
Wyoming/Utah
|
50
|
|
562
|
|
63
|
|
||||
|
Richmond
|
California
|
100
|
|
14
|
|
26
|
|
||||
|
SAAL †
|
Texas
|
33
|
|
102
|
|
33
|
|
||||
|
SAAL †
|
Texas
|
54
|
|
19
|
|
30
|
|
||||
|
Seminoe †
|
Montana/Wyoming
|
100
|
|
342
|
|
33
|
|
||||
|
Standish †
|
Oklahoma/Kansas
|
100
|
|
92
|
|
72
|
|
||||
|
Sweeny to Pasadena †
|
Texas
|
100
|
|
120
|
|
294
|
|
||||
|
Torrance Products
|
California
|
100
|
|
8
|
|
161
|
|
||||
|
Watson Products
|
California
|
100
|
|
9
|
|
238
|
|
||||
|
Yellowstone
|
Montana/Washington
|
46
|
|
710
|
|
66
|
|
||||
4
|
Name
|
State of
Origination/Terminus
|
Interest
|
Length
(Miles)
|
Gross Capacity
(MBD)
|
|||||||
|
NGL
|
|||||||||||
|
Blue Line
|
Texas/Illinois
|
100
|
%
|
688
|
|
29
|
|
||||
|
Brown Line †
|
Oklahoma/Kansas
|
100
|
|
76
|
|
26
|
|
||||
|
Chisholm
|
Oklahoma/Kansas
|
50
|
|
202
|
|
42
|
|
||||
|
Conway to Wichita
|
Kansas
|
100
|
|
55
|
|
38
|
|
||||
|
Medford †
|
Oklahoma
|
100
|
|
42
|
|
10
|
|
||||
|
Powder River
|
Wyoming/Texas
|
100
|
|
705
|
|
14
|
|
||||
|
River Parish NGL†
|
Louisiana
|
100
|
|
510
|
|
133
|
|
||||
|
Sand Hills †
|
Texas
|
33
|
|
1,466
|
|
485
|
|
||||
|
Skelly-Belvieu
|
Texas
|
50
|
|
571
|
|
45
|
|
||||
|
Southern Hills †
|
Kansas/Texas
|
33
|
|
941
|
|
192
|
|
||||
|
Sweeny LPG
|
Texas
|
100
|
|
232
|
|
942
|
|
||||
|
Sweeny NGL
|
Texas
|
100
|
|
18
|
|
204
|
|
||||
|
TX Panhandle Y1/Y2
|
Texas
|
100
|
|
289
|
|
61
|
|
||||
|
Natural Gas
|
|||||||||||
|
Rockies Express**
|
|||||||||||
|
East to West
|
Ohio/Illinois
|
25
|
|
670
|
|
2.6 Bcf/d
|
|
||||
|
West to East
|
Colorado/Ohio
|
25
|
|
1,712
|
|
1.8 Bcf/d
|
|
||||
† Owned by Phillips 66 Partners; Phillips 66 held a
56 percent
ownership interest in Phillips 66 Partners at
December 31, 2018
.
* Total pipeline system is 419 miles. Phillips 66 has an ownership interest in multiple segments totaling 49 miles.
** Total pipeline system consists of three zones for a total of 1,712 miles. The third zone of the pipeline is bi-directional and can transport 2.6 Bcf/d of natural gas from east to west.
5
The following table depicts our ownership interest in terminal and storage facilities at
December 31, 2018
:
|
Facility Name
|
Location
|
Commodity Handled
|
Interest
|
Gross Storage Capacity (MBbl)
|
Gross Rack Capacity (MBD)
|
||||||||
|
Albuquerque †
|
New Mexico
|
Refined Petroleum Products
|
100
|
%
|
274
|
|
18
|
|
|||||
|
Amarillo †
|
Texas
|
Refined Petroleum Products
|
100
|
|
296
|
|
29
|
|
|||||
|
Beaumont
|
Texas
|
Crude Oil, Refined Petroleum Products
|
100
|
|
14,600
|
|
8
|
|
|||||
|
Billings
|
Montana
|
Refined Petroleum Products
|
100
|
|
88
|
|
16
|
|
|||||
|
Billings Crude †
|
Montana
|
Crude Oil
|
100
|
|
236
|
|
N/A
|
|
|||||
|
Borger
|
Texas
|
Crude Oil
|
50
|
|
772
|
|
N/A
|
|
|||||
|
Bozeman
|
Montana
|
Refined Petroleum Products
|
100
|
|
130
|
|
13
|
|
|||||
|
Buffalo Crude †
|
Montana
|
Crude Oil
|
100
|
|
303
|
|
N/A
|
|
|||||
|
Casper †
|
Wyoming
|
Refined Petroleum Products
|
100
|
|
365
|
|
7
|
|
|||||
|
Clemens †
|
Texas
|
NGL
|
100
|
|
9,000
|
|
N/A
|
|
|||||
|
Clifton Ridge †
|
Louisiana
|
Crude Oil
|
100
|
|
3,800
|
|
N/A
|
|
|||||
|
Coalinga
|
California
|
Crude Oil
|
100
|
|
817
|
|
N/A
|
|
|||||
|
Colton
|
California
|
Refined Petroleum Products
|
100
|
|
207
|
|
21
|
|
|||||
|
Cushing †
|
Oklahoma
|
Crude Oil
|
100
|
|
675
|
|
N/A
|
|
|||||
|
Cut Bank †
|
Montana
|
Crude Oil
|
100
|
|
315
|
|
N/A
|
|
|||||
|
Denver
|
Colorado
|
Refined Petroleum Products
|
100
|
|
310
|
|
43
|
|
|||||
|
Des Moines
|
Iowa
|
Refined Petroleum Products
|
50
|
|
217
|
|
15
|
|
|||||
|
East St. Louis †
|
Illinois
|
Refined Petroleum Products
|
100
|
|
2,031
|
|
78
|
|
|||||
|
Freeport
|
Texas
|
Crude Oil, Refined Petroleum Products, NGL
|
100
|
|
3,624
|
|
N/A
|
|
|||||
|
Glenpool †
|
Oklahoma
|
Refined Petroleum Products
|
100
|
|
571
|
|
19
|
|
|||||
|
Great Falls
|
Montana
|
Refined Petroleum Products
|
100
|
|
198
|
|
12
|
|
|||||
|
Hartford †
|
Illinois
|
Refined Petroleum Products
|
100
|
|
1,468
|
|
25
|
|
|||||
|
Helena
|
Montana
|
Refined Petroleum Products
|
100
|
|
195
|
|
10
|
|
|||||
|
Jefferson City †
|
Missouri
|
Refined Petroleum Products
|
100
|
|
103
|
|
16
|
|
|||||
|
Jones Creek
|
Texas
|
Crude Oil
|
100
|
|
2,580
|
|
N/A
|
|
|||||
|
Junction
|
California
|
Crude Oil
|
100
|
|
524
|
|
N/A
|
|
|||||
|
Kansas City †
|
Kansas
|
Refined Petroleum Products
|
100
|
|
1,410
|
|
66
|
|
|||||
|
Keene †
|
North Dakota
|
Crude Oil
|
50
|
|
503
|
|
N/A
|
|
|||||
|
La Junta
|
Colorado
|
Refined Petroleum Products
|
100
|
|
109
|
|
10
|
|
|||||
|
LCPL Storage
|
Louisiana
|
Refined Petroleum Products
|
50
|
|
3,143
|
|
N/A
|
|
|||||
|
Lincoln
|
Nebraska
|
Refined Petroleum Products
|
100
|
|
217
|
|
21
|
|
|||||
|
Linden †
|
New Jersey
|
Refined Petroleum Products
|
100
|
|
360
|
|
121
|
|
|||||
|
Los Angeles
|
California
|
Refined Petroleum Products
|
100
|
|
156
|
|
75
|
|
|||||
|
Lubbock †
|
Texas
|
Refined Petroleum Products
|
100
|
|
182
|
|
17
|
|
|||||
|
Medford Spheres †
|
Oklahoma
|
NGL
|
100
|
|
70
|
|
N/A
|
|
|||||
|
Missoula
|
Montana
|
Refined Petroleum Products
|
50
|
|
365
|
|
29
|
|
|||||
|
Moses Lake
|
Washington
|
Refined Petroleum Products
|
50
|
|
216
|
|
13
|
|
|||||
|
Mount Vernon †
|
Missouri
|
Refined Petroleum Products
|
100
|
|
365
|
|
46
|
|
|||||
|
North Salt Lake
|
Utah
|
Refined Petroleum Products
|
50
|
|
755
|
|
41
|
|
|||||
|
North Spokane
|
Washington
|
Refined Petroleum Products
|
100
|
|
492
|
|
N/A
|
|
|||||
|
Odessa †
|
Texas
|
Crude Oil
|
100
|
|
521
|
|
N/A
|
|
|||||
|
Oklahoma City †
|
Oklahoma
|
Crude Oil, Refined Petroleum Products
|
100
|
|
355
|
|
48
|
|
|||||
6
|
Facility Name
|
Location
|
Commodity Handled
|
Interest
|
Gross Storage Capacity (MBbl)
|
Gross Rack Capacity (MBD)
|
||||||||
|
Palermo †
|
North Dakota
|
Crude Oil
|
70
|
%
|
235
|
|
N/A
|
|
|||||
|
Paola †
|
Kansas
|
Refined Petroleum Products
|
100
|
|
978
|
|
N/A
|
|
|||||
|
Pasadena †
|
Texas
|
Refined Petroleum Products
|
100
|
|
3,234
|
|
65
|
|
|||||
|
Pecan Grove †
|
Louisiana
|
Crude Oil
|
100
|
|
177
|
|
N/A
|
|
|||||
|
Ponca City †
|
Oklahoma
|
Refined Petroleum Products
|
100
|
|
51
|
|
23
|
|
|||||
|
Ponca City Crude †
|
Oklahoma
|
Crude Oil
|
100
|
|
1,229
|
|
N/A
|
|
|||||
|
Portland
|
Oregon
|
Refined Petroleum Products
|
100
|
|
650
|
|
33
|
|
|||||
|
Renton
|
Washington
|
Refined Petroleum Products
|
100
|
|
243
|
|
20
|
|
|||||
|
Richmond
|
California
|
Refined Petroleum Products
|
100
|
|
343
|
|
28
|
|
|||||
|
River Parish †
|
Louisiana
|
NGL
|
100
|
|
1,500
|
|
N/A
|
|
|||||
|
Rock Springs
|
Wyoming
|
Refined Petroleum Products
|
100
|
|
132
|
|
19
|
|
|||||
|
Sacramento
|
California
|
Refined Petroleum Products
|
100
|
|
146
|
|
13
|
|
|||||
|
San Bernard
|
Texas
|
Refined Petroleum Products
|
100
|
|
231
|
|
N/A
|
|
|||||
|
Santa Margarita
|
California
|
Crude Oil
|
100
|
|
398
|
|
N/A
|
|
|||||
|
Sheridan †
|
Wyoming
|
Refined Petroleum Products
|
100
|
|
94
|
|
15
|
|
|||||
|
Spokane
|
Washington
|
Refined Petroleum Products
|
100
|
|
351
|
|
24
|
|
|||||
|
Tacoma
|
Washington
|
Refined Petroleum Products
|
100
|
|
316
|
|
17
|
|
|||||
|
Torrance
|
California
|
Crude Oil, Refined Petroleum Products
|
100
|
|
2,128
|
|
N/A
|
|
|||||
|
Tremley Point †
|
New Jersey
|
Refined Petroleum Products
|
100
|
|
1,701
|
|
25
|
|
|||||
|
Westlake
|
Louisiana
|
Refined Petroleum Products
|
100
|
|
128
|
|
16
|
|
|||||
|
Wichita Falls †
|
Texas
|
Crude Oil
|
100
|
|
225
|
|
N/A
|
|
|||||
|
Wichita North †
|
Kansas
|
Refined Petroleum Products
|
100
|
|
769
|
|
19
|
|
|||||
|
Wichita South †
|
Kansas
|
Refined Petroleum Products
|
100
|
|
272
|
|
N/A
|
|
|||||
†
Owned by Phillips 66 Partners; Phillips 66 held a
56 percent
ownership interest in Phillips 66 Partners at
December 31, 2018
.
The following table depicts our ownership interest in marine, rail and petroleum coke loading and offloading facilities at
December 31, 2018
:
|
Facility Name
|
Location
|
Commodity Handled
|
Interest
|
Gross Loading Capacity*
|
||||||
|
Marine
|
||||||||||
|
Beaumont
|
Texas
|
Crude Oil, Refined Petroleum Products
|
100
|
%
|
60
|
|
||||
|
Clifton Ridge †
|
Louisiana
|
Crude Oil
|
100
|
|
48
|
|
||||
|
Freeport
|
Texas
|
Crude Oil, Refined Petroleum Products, NGL
|
100
|
|
46
|
|
||||
|
Hartford †
|
Illinois
|
Refined Petroleum Products
|
100
|
|
3
|
|
||||
|
Pecan Grove †
|
Louisiana
|
Crude Oil
|
100
|
|
6
|
|
||||
|
Portland
|
Oregon
|
Crude Oil
|
100
|
|
10
|
|
||||
|
Richmond
|
California
|
Crude Oil
|
100
|
|
3
|
|
||||
|
San Bernard
|
Texas
|
Refined Petroleum Products
|
100
|
|
2
|
|
||||
|
Tacoma
|
Washington
|
Crude Oil
|
100
|
|
12
|
|
||||
|
Tremley Point †
|
New Jersey
|
Refined Petroleum Products
|
100
|
|
7
|
|
||||
|
Rail
|
||||||||||
|
Bayway †
|
New Jersey
|
Crude Oil
|
100
|
|
75
|
|
||||
|
Beaumont
|
Texas
|
Crude Oil
|
100
|
|
20
|
|
||||
|
Ferndale †
|
Washington
|
Crude Oil
|
100
|
|
30
|
|
||||
|
Missoula
|
Montana
|
Refined Petroleum Products
|
50
|
|
41
|
|
||||
|
Palermo †
|
North Dakota
|
Crude Oil
|
70
|
|
100
|
|
||||
|
Thompson Falls
|
Montana
|
Refined Petroleum Products
|
50
|
|
41
|
|
||||
|
Petroleum Coke
|
||||||||||
|
Lake Charles
|
Louisiana
|
Petroleum Coke
|
50
|
|
N/A
|
|
||||
†
Owned by Phillips 66 Partners; Phillips 66 held a
56 percent
ownership interest in Phillips 66 Partners at
December 31, 2018
.
* Marine facilities in thousands of barrels per hour; Rail in thousands of barrels daily (MBD).
7
Marine Vessels
At
December 31, 2018
, we had 13 international-flagged crude oil, refined petroleum product and NGL tankers and two Jones Act-compliant tankers under time charter contracts, with capacities ranging in size from 300,000 to 1,100,000 barrels. Additionally, we had a variety of inland and offshore tug/barge units. These vessels are used primarily to transport crude oil and other feedstocks and refined petroleum products for certain of our refineries. In addition, the NGL tankers are used to export propane and butane from our fractionation, transportation and storage infrastructure.
Truck and Rail
Our truck and rail fleets support our feedstock and distribution operations. Rail movements are provided via a fleet of more than 10,000 owned and leased railcars. Truck movements are provided through numerous third-party trucking companies, as well as through our wholly owned subsidiary, Sentinel Transportation LLC.
NGL and Other
Our NGL and Other business includes the following:
|
•
|
A U.S. Gulf Coast NGL market hub comprised of the Freeport LPG Export Terminal and Phillips 66 Partners’ 100,000-BPD Sweeny Fractionator. These assets are supported by 9 million barrels of gross capacity at Phillips 66 Partners’ Clemens Caverns storage facility. We refer to these facilities as the “Sweeny Hub.”
|
|
•
|
A 22.5 percent interest in Gulf Coast Fractionators, which owns an NGL fractionation plant in Mont Belvieu, Texas. We operate the facility, and our net share of its capacity is 32,625 BPD.
|
|
•
|
A 12.5 percent undivided interest in a fractionation plant in Mont Belvieu, Texas. Our net share of its capacity is 30,250 BPD.
|
|
•
|
A 40 percent undivided interest in a fractionation plant in Conway, Kansas. Our net share of its capacity is 43,200 BPD.
|
|
•
|
Phillips 66 Partners owns the River Parish NGL logistics system in southeast Louisiana, comprising approximately 500 miles of pipeline and a storage cavern connecting multiple fractionation facilities, refineries and a petrochemical facility.
|
|
•
|
Phillips 66 Partners owns a direct one-third interest in both the DCP Sand Hills Pipeline, LLC (Sand Hills) and DCP Southern Hills Pipeline, LLC, which own NGL pipeline systems that connect the Eagle Ford, Permian Basin and Midcontinent production areas to the Mont Belvieu, Texas, market hub.
|
|
•
|
Phillips 66 Partners, through its ownership of Merey Sweeny LLC, successor to Merey Sweeny, L.P. (both referred to herein as Merey Sweeny), owns a vacuum distillation unit with a capacity of 125,000 BPD and a delayed coker unit with a capacity of 70,000 BPD located at our Sweeny Refinery in Old Ocean, Texas.
|
Phillips 66 Partners’ Sweeny Fractionator is located adjacent to our Sweeny Refinery in Old Ocean, Texas, and supplies purity ethane to the petrochemical industry and purity NGL to domestic and global markets. Raw NGL supply to the fractionator is delivered from nearby major pipelines, including the Sand Hills Pipeline. The fractionator is supported by significant infrastructure including connectivity to two NGL supply pipelines, a pipeline connecting to the Mont Belvieu market center and the Clemens Caverns storage facility with access to our liquefied petroleum gas (LPG) export terminal in Freeport, Texas.
The Freeport LPG Export Terminal leverages our fractionation, transportation and storage infrastructure to supply petrochemical, heating and transportation markets globally. The terminal can simultaneously load two ships with refrigerated propane and butane at a combined rate of approximately 36,000 barrels per hour. In support of the terminal, we have a 100,000-BPD unit near the Sweeny Fractionator to upgrade domestic propane for export. In addition, the terminal exports 10,000 to 15,000 BPD of natural gasoline (C5+) produced at the Sweeny Fractionator.
8
At the Sweeny Hub, we are constructing two 150,000-BPD NGL fractionators and associated pipeline infrastructure, and Phillips 66 Partners is adding 6 million barrels of storage capacity at Clemens Caverns. DCP Midstream has committed to supply the fractionators with raw NGL and has an option to acquire up to a 30 percent ownership interest in the fractionators. Upon completion of the expansion, expected in late 2020, the Sweeny Hub will have 400,000 BPD of NGL fractionation capability and 15 million barrels of storage capacity at Clemens Caverns.
During 2018, Phillips 66 Partners continued development of a new 25,000-BPD isomerization unit at our Lake Charles Refinery to increase production of higher octane gasoline blend components. The project is expected to be completed in the third quarter of 2019.
DCP Midstream
Our Midstream segment includes our 50 percent equity investment in DCP Midstream, which is headquartered in Denver, Colorado. At
December 31, 2018
, DCP Midstream owned or operated 49 active natural gas processing facilities, with a net processing capacity of approximately 6.7 billion cubic feet per day (Bcf/d). DCP Midstream’s owned or operated natural gas pipeline systems included gathering services for these facilities, as well as natural gas transmission, and totaled approximately 62,000 miles of pipeline. DCP Midstream also owned or operated 12 NGL fractionation plants, along with natural gas and NGL storage facilities, and NGL pipelines.
The residual natural gas, primarily methane, which results from processing raw natural gas, is sold by DCP Midstream at market-based prices to marketers and end users, including large industrial companies, natural gas distribution companies and electric utilities. DCP Midstream purchases or takes custody of substantially all of its raw natural gas from producers, principally under contractual arrangements that expose DCP Midstream to the prices of NGL, natural gas and condensate. DCP Midstream also has fee-based arrangements with producers to provide midstream services such as gathering and processing. In addition, DCP Midstream markets a portion of its NGL to us and our equity affiliates under existing contracts.
During 2018, DCP Midstream completed or advanced the following growth projects:
|
•
|
Construction of the 200-million-cubic-feet-per-day (MMcf/d) Mewbourn 3 natural gas processing plant located in the Denver-Julesburg (DJ) Basin was completed in the third quarter of 2018.
|
|
•
|
Continued construction of the 300-MMcf/d O'Connor 2 natural gas processing facility and associated gathering infrastructure in the DJ Basin. The O’Connor 2 facility will have 200 MMcf/d of processing capacity and up to 100 MMcf/d of bypass capacity, which are expected to be placed into service in the second and third quarters of 2019, respectively.
|
|
•
|
Development of the Gulf Coast Express pipeline project (GCX project), in which DCP Midstream owns a 25 percent interest. The GCX project is designed to transport up to approximately 2 Bcf/d of natural gas to the Gulf Coast markets. The mostly 42-inch pipeline would traverse approximately 500 miles and be placed in service in the fourth quarter of 2019.
|
|
•
|
The Cheyenne Connector pipeline will provide takeaway solutions with capacity of at least 600 MMcf/d for DCP Midstream's DJ Basin assets, connecting natural gas to Rockies Express Pipeline LLC’s Cheyenne Hub, where it can then be delivered to numerous markets across the country. DCP Midstream holds an option to invest in this pipeline at a later date.
|
|
•
|
Expansion of the Sand Hills Pipeline to 485,000 BPD was completed in the fourth quarter of 2018. This expansion included a partial looping of the pipeline and the addition of new pump stations.
|
9
CHEMICALS
The Chemicals segment consists of our 50 percent equity investment in CPChem, which is headquartered in The Woodlands, Texas. At December 31,
2018
, CPChem owned or had joint venture interests in 28 manufacturing facilities located in Belgium, Colombia, Qatar, Saudi Arabia, Singapore and the United States. Additionally, CPChem has two research and development centers in the United States.
We structure our reporting of CPChem’s operations around two primary business lines: Olefins and Polyolefins (O&P) and Specialties, Aromatics and Styrenics (SA&S). The O&P business line produces and markets ethylene and other olefin products. The ethylene produced is primarily used by CPChem to produce polyethylene, normal alpha olefins (NAO) and polyethylene pipe. The SA&S business line manufactures and markets aromatics and styrenics products, such as benzene, cyclohexane, styrene and polystyrene. SA&S also manufactures and/or markets a variety of specialty chemical products including organosulfur chemicals, solvents, catalysts, and chemicals used in drilling and mining.
The manufacturing of petrochemicals and plastics involves the conversion of hydrocarbon-based raw material feedstocks into higher-value products, often through a thermal process referred to in the industry as “cracking.” For example, ethylene can be produced by cracking ethane, propane, butane, natural gasoline or certain refinery liquids, such as naphtha and gas oil. Ethylene primarily is used as a raw material in the production of plastics, such as polyethylene and polyvinyl chloride (PVC). Plastic resins, such as polyethylene, are manufactured in a thermal/catalyst process, and the produced output is used as a further raw material for various applications, such as packaging and plastic pipe.
The following table reflects CPChem’s petrochemicals and plastics product capacities at
December 31, 2018
:
|
|
Millions of Pounds per Year*
|
||||
|
|
U.S.
|
|
Worldwide
|
|
|
|
O&P
|
|||||
|
Ethylene**
|
11,635
|
|
14,110
|
|
|
|
Propylene
|
2,675
|
|
3,180
|
|
|
|
High-density polyethylene
|
5,305
|
|
7,470
|
|
|
|
Low-density polyethylene
|
620
|
|
620
|
|
|
|
Linear low-density polyethylene
|
1,590
|
|
1,590
|
|
|
|
Polypropylene
|
—
|
|
310
|
|
|
|
Normal alpha olefins
|
2,335
|
|
2,850
|
|
|
|
Polyalphaolefins
|
125
|
|
255
|
|
|
|
Polyethylene pipe
|
500
|
|
500
|
|
|
|
Total O&P
|
24,785
|
|
30,885
|
|
|
|
SA&S
|
|||||
|
Benzene
|
1,600
|
|
2,530
|
|
|
|
Cyclohexane
|
1,060
|
|
1,455
|
|
|
|
Styrene
|
1,050
|
|
1,875
|
|
|
|
Polystyrene
|
835
|
|
1,070
|
|
|
|
Specialty chemicals
|
440
|
|
575
|
|
|
|
Total SA&S
|
4,985
|
|
7,505
|
|
|
|
Total O&P and SA&S
|
29,770
|
|
38,390
|
|
|
* Capacities include CPChem’s share in equity affiliates and excludes CPChem’s NGL fractionation capacity.
** Effective January 1, 2019, the U.S. and Worldwide ethylene capacities increased to 11,935 million pounds per year and 14,410 million pounds per year, respectively.
10
During 2018, CPChem completed its U.S. Gulf Coast (USGC) Petrochemicals Project. The ethane cracker at CPChem’s Cedar Bayou facility in Baytown, Texas, commenced operations in the second quarter of 2018. Along with the two polyethylene units that started up in the third quarter of 2017, the USGC project increased CPChem’s global ethylene and polyethylene capacity by 31 percent from January 1, 2017. Effective January 1, 2019, the capacity of the ethane cracker increased to 3.8 billion pounds per year.
In the fourth quarter of 2018, CPChem permanently shutdown its paraxylene operations in Pascagoula, Mississippi.
11
REFINING
Our Refining segment refines crude oil and other feedstocks into petroleum products (such as gasoline, distillates and aviation fuels) at
13
refineries in the United States and Europe.
The table below depicts information for each of our owned and joint venture refineries at December 31,
2018
:
|
|
|
|
Thousands of Barrels Daily
|
|
|||||||||||||||
|
Region/Refinery
|
Location
|
Interest
|
|
Net Crude Throughput
Capacity
|
Net Clean Product
Capacity**
|
Clean
Product
Yield
Capability
|
|
||||||||||||
|
At
December 31
2018
|
|
Effective January 1
2019
|
|
Gasolines
|
|
Distillates
|
|
||||||||||||
|
Atlantic Basin/Europe
|
|||||||||||||||||||
|
Bayway
|
Linden, NJ
|
100
|
%
|
258
|
|
258
|
|
155
|
|
130
|
|
92
|
%
|
||||||
|
Humber
|
N. Lincolnshire, United Kingdom
|
100
|
|
221
|
|
221
|
|
95
|
|
115
|
|
81
|
|
||||||
|
MiRO*
|
Karlsruhe, Germany
|
19
|
|
58
|
|
58
|
|
25
|
|
25
|
|
87
|
|
||||||
|
537
|
|
537
|
|
||||||||||||||||
|
Gulf Coast
|
|||||||||||||||||||
|
Alliance
|
Belle Chasse, LA
|
100
|
|
247
|
|
250
|
|
130
|
|
120
|
|
87
|
|
||||||
|
Lake Charles
|
Westlake, LA
|
100
|
|
249
|
|
249
|
|
100
|
|
115
|
|
70
|
|
||||||
|
Sweeny
|
Old Ocean, TX
|
100
|
|
256
|
|
265
|
|
135
|
|
120
|
|
86
|
|
||||||
|
752
|
|
764
|
|
||||||||||||||||
|
Central Corridor
|
|||||||||||||||||||
|
Wood River
|
Roxana, IL
|
50
|
|
157
|
|
167
|
|
85
|
|
60
|
|
81
|
|
||||||
|
Borger
|
Borger, TX
|
50
|
|
73
|
|
75
|
|
50
|
|
30
|
|
91
|
|
||||||
|
Ponca City
|
Ponca City, OK
|
100
|
|
203
|
|
213
|
|
120
|
|
100
|
|
93
|
|
||||||
|
Billings
|
Billings, MT
|
100
|
|
60
|
|
60
|
|
35
|
|
30
|
|
90
|
|
||||||
|
493
|
|
515
|
|
||||||||||||||||
|
West Coast
|
|||||||||||||||||||
|
Ferndale
|
Ferndale, WA
|
100
|
|
105
|
|
105
|
|
65
|
|
35
|
|
81
|
|
||||||
|
Los Angeles
|
Carson/Wilmington, CA
|
100
|
|
139
|
|
139
|
|
85
|
|
65
|
|
90
|
|
||||||
|
San Francisco
|
Arroyo Grande/San Francisco, CA
|
100
|
|
120
|
|
120
|
|
60
|
|
65
|
|
85
|
|
||||||
|
364
|
|
364
|
|
||||||||||||||||
|
2,146
|
|
2,180
|
|
||||||||||||||||
* Mineraloelraffinerie Oberrhein GmbH.
**
Clean product capacities are maximum rates for each clean product category, independent of each other. They are not additive when calculating the clean product yield capability for each refinery.
12
Primary crude oil characteristics and sources of crude oil for our owned and joint venture refineries are as follows:
|
|
Characteristics
|
Sources
|
||||||||
|
|
Sweet
|
Medium
Sour
|
Heavy
Sour
|
High
TAN
*
|
United
States
|
Canada
|
South
America
|
Europe
|
Middle East
& Africa
|
|
|
Bayway
|
l
|
l
|
|
l
|
l
|
|
l
|
|||
|
Humber
|
l
|
l
|
l
|
l
|
l
|
l
|
||||
|
MiRO
|
l
|
l
|
l
|
l
|
l
|
|||||
|
Alliance
|
l
|
l
|
|
|
l
|
|
|
|
||
|
Lake Charles
|
l
|
l
|
l
|
l
|
l
|
l
|
l
|
|
l
|
|
|
Sweeny
|
l
|
l
|
l
|
l
|
l
|
l
|
l
|
|
||
|
Wood River
|
l
|
l
|
l
|
l
|
l
|
l
|
|
|
||
|
Borger
|
l
|
l
|
l
|
|
l
|
l
|
|
|
|
|
|
Ponca City
|
l
|
l
|
|
l
|
l
|
|
|
|||
|
Billings
|
|
l
|
l
|
l
|
l
|
|
|
|
||
|
Ferndale
|
l
|
l
|
|
|
l
|
l
|
|
|
||
|
Los Angeles
|
|
l
|
l
|
l
|
l
|
l
|
l
|
|
l
|
|
|
San Francisco
|
l
|
l
|
l
|
l
|
l
|
l
|
l
|
l
|
||
* High TAN (Total Acid Number): acid content greater than or equal to 1.0 milligram of potassium hydroxide (KOH) per gram.
Atlantic Basin/Europe Region
Bayway Refinery
The Bayway Refinery is located on the New York Harbor in Linden, New Jersey. Bayway’s facilities include crude distilling, naphtha reforming, fluid catalytic cracking, solvent deasphalting, hydrodesulfurization and alkylation units. The complex also includes a polypropylene plant with the capacity to produce up to 775 million pounds per year. The refinery produces a high percentage of transportation fuels, as well as petrochemical feedstocks, residual fuel oil and home heating oil. Refined petroleum products are distributed to East Coast customers by pipeline, barge, railcar and truck.
Humber Refinery
The Humber Refinery is located on the east coast of England in North Lincolnshire, United Kingdom, approximately 180 miles north of London. Humber’s facilities include crude distilling, naphtha reforming, fluid catalytic cracking, hydrodesulfurization, thermal cracking and delayed coking units. The refinery has two coking units with associated calcining plants. Humber is the only coking refinery in the United Kingdom, and a producer of high-quality specialty graphite and anode-grade petroleum cokes. The refinery also produces a high percentage of transportation fuels. The majority of the light oils produced by the refinery are distributed to customers in the United Kingdom by pipeline, railcar and truck, while the other refined petroleum products are exported to the rest of Europe, West Africa and the United States by waterborne cargo.
MiRO Refinery
The MiRO Refinery is located on the Rhine River in Karlsruhe, Germany, approximately 95 miles south of Frankfurt, Germany. MiRO is a joint venture in which we own an
18.75 percent
interest. Facilities include crude distilling, naphtha reforming, fluid catalytic cracking, petroleum coking and calcining, hydrodesulfurization, isomerization, ethyl tert-butyl ether and alkylation units. MiRO produces a high percentage of transportation fuels. Other products produced include petrochemical feedstocks, home heating oil, bitumen, and anode- and fuel-grade petroleum cokes. Refined petroleum products are distributed to customers in Germany, Switzerland and Austria by truck, railcar and barge.
13
Gulf Coast Region
Alliance Refinery
The Alliance Refinery is located on the Mississippi River in Belle Chasse, Louisiana, approximately 25 miles southeast of New Orleans, Louisiana. The single-train facility includes crude distilling, naphtha reforming, fluid catalytic cracking, alkylation, hydrodesulfurization, aromatics and delayed coking units. Alliance produces a high percentage of transportation fuels. Other products produced include petrochemical feedstocks, home heating oil and anode-grade petroleum coke. A majority of the refined petroleum products are distributed to customers in the southeastern and eastern United States through major common-carrier pipeline systems and by barge. Additionally, refined petroleum products are exported to customers primarily in Latin America by waterborne cargo.
Lake Charles Refinery
The Lake Charles Refinery is located in Westlake, Louisiana, approximately 150 miles east of Houston, Texas. Refinery facilities include crude distilling, naphtha reforming, fluid catalytic cracking, alkylation, hydrocracking, hydrodesulfurization and delayed coking units. Refinery facilities also include a specialty coker and calciner. The refinery produces a high percentage of transportation fuels. Other products produced include off-road diesel, home heating oil, feedstock for our Excel Paralubes joint venture in our M&S segment, and specialty graphite and fuel-grade petroleum cokes. A majority of the refined petroleum products are distributed to customers in the southeastern and eastern United States by truck, railcar, barge or major common carrier pipelines. Additionally, refined petroleum products are exported to customers primarily in Latin America and West Africa by waterborne cargo.
Sweeny Refinery
The Sweeny Refinery is located in Old Ocean, Texas, approximately 65 miles southwest of Houston, Texas. Refinery facilities include crude distilling, naphtha reforming, fluid catalytic cracking, alkylation, hydrodesulfurization, aromatics units, and a Phillips 66 Partners owned delayed coking unit. The refinery produces a high percentage of transportation fuels. Other products include petrochemical feedstocks, home heating oil and fuel-grade petroleum coke. A majority of the refined petroleum products are distributed to customers throughout the Midcontinent region, southeastern and eastern United States by pipeline, barge and railcar. Additionally, refined petroleum products are exported to customers primarily in Latin America by waterborne cargo.
Central Corridor Region
WRB Refining LP (WRB)
We are the operator and managing partner of WRB, a 50-percent-owned joint venture that owns the Wood River and Borger refineries.
|
•
|
Wood River Refinery
|
The Wood River Refinery is located in Roxana, Illinois, about 15 miles northeast of St. Louis, Missouri, at the confluence of the Mississippi and Missouri rivers. Refinery facilities include crude distilling, naphtha reforming, fluid catalytic cracking, alkylation, hydrocracking, hydrodesulfurization and delayed coking units. The refinery produces a high percentage of transportation fuels. Other products produced include petrochemical feedstocks, asphalt and fuel-grade petroleum coke. Refined petroleum products are distributed to customers throughout the Midcontinent region by pipeline, railcar, barge and truck.
|
•
|
Borger Refinery
|
The Borger Refinery is located in Borger, Texas, in the Texas Panhandle, approximately 50 miles north of Amarillo, Texas. Refinery facilities include crude distilling, naphtha reforming, fluid catalytic cracking, alkylation, hydrodesulfurization, and delayed coking units, as well as an NGL fractionation facility. The refinery produces a high percentage of transportation fuels, as well as fuel-grade petroleum coke, NGL and solvents. Refined petroleum products are distributed to customers in West Texas, New Mexico, Colorado and the Midcontinent region by pipeline.
14
Ponca City Refinery
The Ponca City Refinery is located in Ponca City, Oklahoma, approximately 95 miles northwest of Tulsa, Oklahoma. Refinery facilities include crude distilling, naphtha reforming, fluid catalytic cracking, alkylation, hydrodesulfurization, and delayed coking units. The refinery produces a high percentage of transportation fuels and anode-grade petroleum coke. Refined petroleum products are primarily distributed to customers throughout the Midcontinent region by company-owned and common-carrier pipelines.
Billings Refinery
The Billings Refinery is located in Billings, Montana. Refinery facilities include crude distilling, naphtha reforming, fluid catalytic cracking, alkylation, hydrodesulfurization and delayed coking units. The refinery produces a high percentage of transportation fuels and fuel-grade petroleum coke. Refined petroleum products are distributed to customers in Montana, Wyoming, Idaho, Utah, Colorado and Washington by pipeline, railcar and truck.
West Coast Region
Ferndale Refinery
The Ferndale Refinery is located on Puget Sound in Ferndale, Washington, approximately 20 miles south of the U.S.-Canada border. Facilities include crude distillation, naphtha reforming, fluid catalytic cracking, alkylation and hydrodesulfurization units. The refinery produces a high percentage of transportation fuels. Other products produced include residual fuel oil, which is supplied to the northwest marine bunker fuel market. Most of the refined petroleum products are distributed to customers in the northwest United States by pipeline and barge.
Los Angeles Refinery
The Los Angeles Refinery consists of two facilities linked by pipeline located five miles apart in Carson and Wilmington, California, approximately 15 miles southeast of Los Angeles. The Carson facility serves as the front end of the refinery by processing crude oil, and the Wilmington facility serves as the back end of the refinery by upgrading the intermediate products to finished products. Refinery facilities include crude distillation, naphtha reforming, fluid catalytic cracking, alkylation, hydrocracking, and delayed coking units. The refinery produces a high percentage of transportation fuels. The refinery produces California Air Resources Board (CARB)-grade gasoline. Other products produced include fuel-grade petroleum coke. Refined petroleum products are distributed to customers in California, Nevada and Arizona by pipeline and truck.
San Francisco Refinery
The San Francisco Refinery consists of two facilities linked by a 200-mile pipeline. The Santa Maria facility is located in Arroyo Grande, California, 200 miles south of San Francisco, California, while the Rodeo facility is located in the San Francisco Bay Area. Intermediate refined products from the Santa Maria facility are shipped by pipeline to the Rodeo facility for upgrading into finished petroleum products. Refinery facilities include crude distillation, naphtha reforming, hydrocracking, hydrodesulfurization and delayed coking units, as well as a calciner. The refinery produces a high percentage of transportation fuels, including CARB-grade gasoline. Other products produced include fuel-grade petroleum coke. The majority of the refined petroleum products are distributed to customers in California by pipeline and barge. Additionally, refined petroleum products are exported to customers primarily in Latin America by waterborne cargo.
15
MARKETING AND SPECIALTIES
Our M&S segment purchases for resale and markets refined petroleum products (such as gasolines, distillates and aviation fuels), mainly in the United States and Europe. In addition, this segment includes the manufacturing and marketing of specialty products (such as base oils and lubricants), as well as power generation operations.
Marketing
Marketing—United States
We market gasoline, diesel and aviation fuel through independently owned outlets that utilize the
Phillips 66
,
Conoco
or
76
brands. At
December 31, 2018
, we had approximately
7,520
independently owned marketing outlets in 48 states.
Our wholesale operations utilized a network of marketers operating approximately
5,600
outlets. We place a strong emphasis on the wholesale channel of trade because of its lower capital requirements. In addition, we held brand-licensing agreements covering approximately
1,120
sites. Our refined petroleum products are marketed on both a branded and unbranded basis. A high percentage of our branded marketing sales are made in the Midcontinent, Rockies and West Coast regions, where our wholesale marketing operations provide efficient off-take from our refineries. We continue to utilize consignment fuel arrangements with several marketers whereby we own the fuel inventory and pay the marketers a fixed monthly fee.
In the Gulf Coast and East Coast regions, most sales are conducted via the unbranded channel of trade, which does not require a highly integrated marketing and distribution infrastructure to secure product placement for refinery pull through. We are expanding our export capability at our U.S. coastal refineries to meet growing international demand and increase flexibility to provide product to the highest-value markets.
In addition to automotive gasoline and diesel, we produce and market aviation gasoline and jet fuel. Aviation gasoline and jet fuel were sold through dealers and independent marketers at approximately
800
Phillips 66
-branded locations.
Marketing—International
We have marketing operations in four European countries. Our European marketing strategy is to sell primarily through owned, leased or joint venture retail sites using a low-cost, high-volume approach. We use the
JET
brand name to market retail and wholesale products in Austria, Germany and the United Kingdom. In addition, we have an equity interest in a joint venture that markets refined petroleum products in Switzerland under the
COOP
brand name.
We also market aviation fuels, LPG, heating oils, transportation fuels, marine bunker fuels, bitumen and fuel-grade petroleum coke specialty products to commercial customers and into the bulk or spot markets in the above countries.
At
December 31, 2018
, we had
1,310
marketing outlets in Europe, of which
985
were company owned and
325
were dealer owned. In addition, we had interests in
320
additional sites through our
COOP
joint venture operations in Switzerland.
Specialties
We manufacture lubricants and sell a variety of specialty products, including petroleum coke products, waxes, solvents and polypropylene.
Lubricants
We manufacture and sell automotive, commercial, industrial and specialty lubricants which are marketed worldwide under the
Phillips 66, Kendall,
Red Line
and other private label brands. We also market Group III
Ultra-S
base oils through an agreement with South Korea’s S-Oil Corporation.
In addition, we own a
50 percent
interest in Excel Paralubes LLC (Excel), an operated joint venture that owns a hydrocracked lubricant base oil manufacturing plant located adjacent to the Lake Charles Refinery. The facility has a nameplate capacity to produce 22,200 BPD of high-quality Group II clear hydrocracked base oils. Excel markets the produced base oil under the
Pure Performance
brand. The facility’s feedstock is sourced primarily from our Lake Charles Refinery.
16
Other Specialty Products
We market high-quality specialty graphite and anode-grade petroleum cokes in the United States, Europe and Asia for use in a variety of industries that include steel, aluminum, titanium dioxide and battery manufacturing. We also market polypropylene in North America under the
COPYLENE
brand name for use in consumer products, and market specialty solvents that include pentane, iso-pentane, hexane, heptane and odorless mineral spirits for use in the petrochemical, agriculture and consumer markets. In addition, we market sulfur for use in agricultural and chemical applications, and fuel-grade petroleum coke for use in the making of cement, glass and power.
Other
Power Generation
We own a cogeneration power plant located adjacent to the Sweeny Refinery. The plant generates electricity and provides process steam to the refinery, as well as merchant power into the Texas market. The plant has a net electrical output of 440 megawatts and is capable of generating up to 3.6 million pounds per hour of process steam.
TECHNOLOGY DEVELOPMENT
Our Technology organization conducts applied and fundamental research to support our current business, provide new environmental solutions to address governmental regulations, and position us for future growth. Technology programs include evaluating advantaged crudes; and modeling to reduce energy consumption, increase product yield and increase reliability. Our sustainability group is focusing efforts on organic photovoltaic polymers, solid oxide fuel cells, atmospheric modeling and air chemistry, water use and reuse and renewable fuels. Additionally, we monitor for emerging technologies that could impact our business.
COMPETITION
The Midstream segment, through our equity investment in DCP Midstream and our other operations, competes with numerous integrated petroleum companies, as well as natural gas transmission and distribution companies, to deliver components of natural gas to end users in commodity natural gas markets. DCP Midstream is one of the leading natural gas gatherers and processors in the United States based on wellhead volumes, and one of the largest U.S. producers and marketers of NGL, based on published industry sources. Principal methods of competing include economically securing the right to purchase raw natural gas for gathering systems, managing the pressure of those systems, operating efficient NGL processing plants and securing markets for the products produced.
In the Chemicals segment, CPChem is ranked among the top 10 producers in many of its major product lines according to published industry sources, based on average
2018
production capacity. Petroleum products, petrochemicals and plastics are typically delivered into the worldwide commodity markets. Our Refining and M&S segments compete primarily in the United States and Europe. We are one of the largest refiners of petroleum products in the United States based on published industry sources. Elements of competition for both our Chemicals and Refining segments include product improvement, new product development, low-cost structures, ability to run advantaged feedstocks, and efficient manufacturing and distribution systems. In the marketing portion of the business, competitive factors include product properties and processibility, reliability of supply, customer service, price and credit terms, advertising and sales promotion, and development of customer loyalty to branded products.
17
GENERAL
At
December 31, 2018
, we held a total of
382
active patents in
20
countries worldwide, including
298
active U.S. patents. The overall profitability of any business segment is not dependent on any single patent, trademark, license or franchise.
In support of our goal to attain zero incidents, we have implemented a comprehensive Health, Safety and Environmental (HSE) management system to support consistent management of HSE risks across our enterprise. The management system is designed to ensure that personal safety, process safety, and environmental impact risks are identified, and mitigation steps are taken to reduce the risk. The management system requires periodic audits to ensure compliance with government regulations, as well as our internal requirements. Our commitment to continuous improvement is reflected in annual goal setting and performance measurement.
See the environmental information contained in “Management’s Discussion and Analysis of Financial Condition and Results of Operations—Capital Resources and Liquidity—Contingencies” under the captions “Environmental” and “Climate Change.” It includes information on expensed and capitalized environmental costs for
2018
and those expected for
2019
and
2020
.
Website Access to SEC Reports
Our Internet website address is
http://www.phillips66.com
. Information contained on our Internet website is not part of this Annual Report on Form 10-K.
Our Annual Reports on Form 10-K, Quarterly Reports on Form 10-Q, Current Reports on Form 8-K and any amendments to these reports filed or furnished pursuant to Section 13(a) or 15(d) of the Securities Exchange Act of 1934 are available on our website, free of charge, as soon as reasonably practicable after such reports are filed with, or furnished to, the U.S. Securities and Exchange Commission (SEC). Alternatively, you may access these reports at the SEC’s website at
http://www.sec.gov
.
18
Item 1A. RISK FACTORS
You should carefully consider the following risk factors in addition to the other information included in this Annual Report on Form 10-K. Each of these risk factors could adversely affect our business, operating results and financial condition, as well as the value of an investment in our common stock.
Our operating results and future rate of growth are exposed to the effects of changing commodity prices and refining, marketing and petrochemical margins.
Our revenues, operating results and future rate of growth are highly dependent on a number of factors, including fixed and variable expenses (including the cost of crude oil, NGL, and other refining and petrochemical feedstocks) and the margin we can derive from selling refined petroleum, petrochemical and plastics products. The prices of feedstocks and our products fluctuate substantially. These prices depend on numerous factors beyond our control, including the global supply and demand for feedstocks and our products, which are subject to, among other things:
|
•
|
Changes in the global economy and the level of foreign and domestic production of crude oil, natural gas and NGL and refined petroleum, petrochemical and plastics products.
|
|
•
|
Availability of feedstocks and refined petroleum products and the infrastructure to transport them.
|
|
•
|
Local factors, including market conditions, the level of operations of other facilities in our markets, and the volume of products imported and exported.
|
|
•
|
Threatened or actual terrorist incidents, acts of war and other global political conditions.
|
|
•
|
Government regulations.
|
|
•
|
Weather conditions, hurricanes or other natural disasters.
|
The price of crude oil influences prices for refined petroleum products. We do not produce crude oil and must purchase all of the crude oil we process. Many crude oils available on the world market will not meet the quality restrictions for use in our refineries. Others are not economical to use due to high transportation costs or for other reasons. The prices for crude oil and refined petroleum products can fluctuate differently based on global, regional and local market conditions, as well as by type and class of products, which can reduce refining margins and could have a significant impact on our refining, wholesale marketing and retail operations, revenues, operating income and cash flows. Also, crude oil supply contracts generally have market-responsive pricing provisions. We normally purchase our refinery feedstocks weeks before manufacturing and selling the refined petroleum products. Changes in prices that occur between when we purchase feedstocks and when we sell the refined petroleum products produced from these feedstocks could have a significant effect on our financial results. We also purchase refined petroleum products produced by others for sale to our customers. Price changes that occur between when we purchase and sell these refined petroleum products also could have a material adverse effect on our business, financial condition and results of operations.
The price of feedstocks also influences prices for petrochemical and plastics products. Although our Chemicals segment transports and fractionates feedstocks to meet a portion of their demand and has certain long-term feedstock supply contracts with others, it is still subject to volatile feedstock prices. In addition, the petrochemicals industry is both cyclical and volatile. Cyclicality occurs when periods of tight supply, resulting in increased prices and profit margins, are followed by periods of capacity expansion, resulting in oversupply and declining prices and profit margins. Volatility occurs as a result of changes in supply and demand for products, changes in energy prices, and changes in various other economic conditions around the world.
Uncertainty and illiquidity in credit and capital markets can impair our ability to obtain credit and financing on acceptable terms and can adversely affect the financial strength of our business partners.
Our ability to obtain credit and capital depends in large measure on the state of the credit and capital markets, which is beyond our control. Our ability to access credit and capital markets may be restricted at a time when we would like, or need, access to those markets, which could constrain our flexibility to react to changing economic and business conditions. In addition, the cost and availability of debt and equity financing may be adversely impacted by unstable or illiquid market conditions. Protracted uncertainty and illiquidity in these markets also could have an adverse impact on our lenders, commodity hedging counterparties, or our customers, preventing them from meeting their obligations to us.
19
From time to time, our cash needs may exceed our internally generated cash flow, and our business could be materially and adversely affected if we are unable to obtain necessary funds from financing activities. From time to time, we may need to supplement cash generated from operations with proceeds from financing activities. Uncertainty and illiquidity in financial markets may materially impact the ability of the participating financial institutions to fund their commitments to us under our liquidity facilities. Accordingly, we may not be able to obtain the full amount of the funds available under our liquidity facilities to satisfy our cash requirements, and our failure to do so could have a material adverse effect on our operations and financial position.
Deterioration in our credit profile could increase our costs of borrowing money and limit our access to the capital markets and commercial credit, and could trigger co-venturer rights under joint venture arrangements.
Our or Phillips 66 Partners’ credit ratings could be lowered or withdrawn entirely by a rating agency if, in its judgment, the circumstances warrant. If a rating agency were to downgrade our rating below investment grade, our or Phillips 66 Partners’ borrowing costs would increase, and our funding sources could decrease. In addition, a failure by us to maintain an investment grade rating could affect our business relationships with suppliers and operating partners. For example, our agreement with Chevron regarding CPChem permits Chevron to buy our 50 percent interest in CPChem for fair market value if we experience a change in control or if both Standard & Poor’s Financial Services LLC and Moody’s Investors Service, Inc. lower our credit ratings below investment grade and the credit rating from either rating agency remains below investment grade for 365 days thereafter, with fair market value determined by agreement or by nationally recognized investment banks. As a result of these factors, a downgrade of credit ratings could have a materially adverse impact on our future operations and financial position.
We expect to continue to incur substantial capital expenditures and operating costs as a result of our compliance with existing and future environmental laws and regulations. Likewise, future environmental laws and regulations may impact or limit our current business plans and reduce demand for our products.
Our business is subject to numerous laws and regulations relating to the protection of the environment. These laws and regulations continue to increase in both number and complexity and affect our operations with respect to, among other things:
|
•
|
The discharge of pollutants into the environment.
|
|
•
|
Emissions into the atmosphere (such as nitrogen oxides, sulfur dioxide and mercury emissions, and greenhouse gas emissions as they are, or may become, regulated).
|
|
•
|
The quantity of renewable fuels that must be blended into motor fuels.
|
|
•
|
The handling, use, storage, transportation, disposal and cleanup of hazardous materials and hazardous and nonhazardous wastes.
|
|
•
|
The dismantlement and abandonment of our facilities and restoration of our properties at the end of their useful lives.
|
We have incurred and will continue to incur substantial capital, operating and maintenance, and remediation expenditures as a result of these laws and regulations. To the extent these expenditures, as with all costs, are not ultimately reflected in the prices of our products and services, our business, financial condition, results of operations and cash flows in future periods could be materially adversely affected.
The U.S. Environmental Protection Agency (EPA) has implemented a Renewable Fuel Standard (RFS) pursuant to the Energy Policy Act of 2005 and the Energy Independence and Security Act of 2007. The RFS program sets annual quotas for the quantity of renewable fuels (such as ethanol) that must be blended into motor fuels consumed in the United States. To provide certain flexibility in compliance options available to the industry, a Renewable Identification Number (RIN) is assigned to each gallon of renewable fuel produced in, or imported into, the United States. As a producer of petroleum-based motor fuels, we are obligated to blend renewable fuels into the products we produce at a rate that is at least commensurate to the EPA’s quota and, to the extent we do not, we must purchase RINs in the open market to satisfy our obligation under the RFS program. To the extent the EPA mandates a blending quantity of renewable fuel that exceeds the amount that is commercially feasible to blend into motor fuel (a situation commonly referred to as “the blend wall”), our operations could be materially adversely impacted, up to and including a reduction in produced motor fuel.
20
The adoption of climate change legislation or regulation could result in increased operating costs and reduced demand for the refined petroleum products we produce.
The U.S. government, including the EPA, as well as several state and international governments, have either considered or adopted legislation or regulations in an effort to reduce greenhouse gas (GHG) emissions. These proposed or promulgated laws apply or could apply in states and/or countries where we have interests or may have interests in the future. In addition, various groups suggest that additional laws may be needed in an effort to address climate change, as illustrated by the Paris Agreement negotiated at the 2015 United Nations Conference on Climate Change, referred to as COP 21, which entered into force on November 4, 2016. We cannot predict the extent to which any such legislation or regulation will be enacted and, if so, what its provisions would be. To the extent we incur additional costs required to comply with the adoption of new laws and regulations that are not ultimately recovered in the prices of our products and services, our business, financial condition, results of operations and cash flows in future periods could be materially adversely affected. In addition, demand for the refined petroleum products we produce could be adversely affected.
Climate change may adversely affect our facilities and our ongoing operations.
The potential physical effects of climate change on our operations are highly uncertain and depend upon the unique geographic and environmental factors present. Examples of such effects include rising sea levels at our coastal facilities, changing storm patterns and intensities, and changing temperature levels. As many of our facilities are located near coastal areas, rising sea levels may disrupt our ability to operate those facilities or transport crude oil and refined petroleum products. Extended periods of such disruption could have an adverse effect on our results of operation. We could also incur substantial costs to prevent or repair damage to these facilities.
Political and economic developments could affect our operations and materially reduce our profitability and cash flows.
Actions of federal, state, local and international governments through legislation or regulation, executive order, permit or other review of infrastructure or facility development, and commercial restrictions could delay projects, increase costs, limit development, or otherwise reduce our operating profitability both in the United States and abroad. Any such actions may affect many aspects of our operations, including:
|
•
|
Requiring permits or other approvals that may impose unforeseen or unduly burdensome conditions or potentially cause delays in our operations.
|
|
•
|
Further limiting or prohibiting construction or other activities in environmentally sensitive or other areas.
|
|
•
|
Requiring increased capital costs to construct, maintain or upgrade equipment or facilities.
|
|
•
|
Restricting the locations where we may construct facilities or requiring the relocation of facilities.
|
In addition, the U.S. government can prevent or restrict us from doing business in foreign countries and from doing business with entities affiliated with foreign governments, which can include state oil companies and U.S. subsidiaries of those companies. The Office of Foreign Assets Control (OFAC) of the U.S. Department of the Treasury administers and enforces economic and trade sanctions based on U.S. foreign policy and national security matters. For example, sanctions are currently in effect against Venezuela and certain entities affiliated with it. The effect of any such OFAC sanctions could disrupt transactions with or operations involving entities affiliated with sanctioned countries, and could limit our ability to obtain optimum crude slates and other refinery feedstocks and effectively distribute refined petroleum products.
Other risks inherent in doing business internationally include global financial market turmoil; economic volatility and global economic slowdown; currency exchange rate fluctuations and inflationary pressures; import or export restrictions and changes in trade regulations; acts of terrorism, war, civil unrest and other political risks; difficulties in developing, staffing and managing foreign operations; and potentially adverse tax developments. If any of these events occur, our businesses and those of our joint ventures may be adversely affected.
Additionally, renewable fuels, alternative energy mandates and energy conservation efforts could reduce demand for refined petroleum products. Tax incentives and other subsidies can make renewable fuels and alternative energy more competitive with refined petroleum products than they otherwise might be, which may reduce refined petroleum product margins and hinder the ability of refined petroleum products to compete with renewable fuels.
21
Large capital projects can take many years to complete, and market conditions could deteriorate significantly between the project approval date and the project startup date, negatively impacting expected project returns.
Our basis for approving a large-scale capital project is the expectation that it will deliver an acceptable level of return on the capital invested. We base these forecasted project economics on our best estimate of future market conditions. Most large-scale projects take several years to complete. During this multi-year period, market conditions can change from those we forecast, and these changes could be significant. Accordingly, we may not be able to realize our expected returns from a large investment in a capital project, and this could negatively impact our results of operations, cash flows and our return on capital employed.
Plans we may have to expand existing assets or construct new assets, particularly in our Midstream segment, are subject to risks associated with societal and political pressures and other forms of opposition to the future development, transportation and use of carbon-based fuels. Such risks could adversely impact our ability to realize certain growth strategies.
Certain of our planned expenditures are based upon the assumption that societal sentiment will continue to enable, and existing regulations will remain intact to allow for, the future development, transportation and use of carbon-based fuels. A portion of our growth strategy is dependent on our ability to expand existing assets and to construct additional assets. Policy decisions relating to the production, refining, transportation and marketing of carbon-based fuels are subject to political pressures and the influence and protests of environmental and other special interest groups. For example, our Midstream segment’s growth plans include the construction or expansion of pipelines, which can involve numerous regulatory, environmental, political, and legal uncertainties, many of which are beyond our control. Our growth projects may not be completed on schedule or at the budgeted cost. In addition, our revenues may not increase immediately upon the expenditure of funds on a particular project. Delays or cost increases related to capital spending programs could negatively impact our results of operations, cash flows and our return on capital employed.
Our operations are subject to business interruptions and casualty losses. Failure to manage risks associated with business interruptions could adversely impact our operations, financial condition, results of operations and cash flows.
Our operations are subject to business interruptions due to scheduled refinery turnarounds, unplanned maintenance or unplanned events such as explosions, fires, refinery or pipeline releases or other incidents, power outages, severe weather, labor disputes, or other natural or man-made disasters, such as acts of terrorism, including cyber-intrusion. The inability to operate one or more of our facilities due to any of these events could significantly impair our ability to manufacture our products. Additionally, our manufacturing equipment is becoming increasingly dependent on our information technology systems. A disruption in our information technology systems due to a catastrophic event or security breach could interrupt or damage our operations.
Explosions, fires, refinery or pipeline releases or other incidents involving our assets or operations could result in serious personal injury or loss of human life, significant damage to property and equipment, environmental pollution, impairment of operations and substantial losses to us. For assets located near populated areas, including residential areas, commercial business centers, industrial sites and other public gathering areas, the level of damage resulting from these risks could be greater. Damages resulting from an incident involving any of our assets or operations may result in our being named as a defendant in one or more lawsuits asserting potentially substantial claims or in our being assessed potentially substantial fines by governmental authorities. Should any of these risks materialize at any of our equity affiliates, it could have a material adverse effect on the business and financial condition of the equity affiliate and negatively impact their ability to make future distributions to us.
22
There are certain hazards and risks inherent in our operations that could adversely affect those operations and our financial results.
The operation of refineries, power plants, fractionators, pipelines, terminals and vessels is inherently subject to the risks of spills, discharges or other inadvertent releases of petroleum or hazardous substances. If any of these events had previously occurred or occurs in the future in connection with any of our refineries, pipelines or refined petroleum products terminals, or in connection with any facilities that receive our wastes or by-products for treatment or disposal, other than events for which we are indemnified, we could be liable for all costs and penalties associated with their remediation under federal, state, local and international environmental laws or common law, and could be liable for property damage to third parties caused by contamination from releases and spills.
We do not insure against all potential losses, and, therefore, our business, financial condition, results of operations and cash flows could be adversely affected by unexpected liabilities and increased costs.
We maintain insurance coverage in amounts we believe to be prudent against many, but not all, potential liabilities arising from operating hazards. Uninsured liabilities arising from operating hazards, including but not limited to, explosions, fires, refinery or pipeline releases or other incidents involving our assets or operations, could reduce the funds available to us for capital and investment spending and could have a material adverse effect on our business, financial condition, results of operations and cash flows.
Our investments in joint ventures decrease our ability to manage risk.
We conduct some of our operations, including parts of our Midstream, Refining and M&S segments, and our entire Chemicals segment, through joint ventures in which we share control with our joint venture participants. Our joint venture participants may have economic, business or legal interests or goals that are inconsistent with ours or those of the joint venture, or our joint venture participants may be unable to meet their economic or other obligations, and we may be required to fulfill those obligations alone. Failure by us, or an entity in which we have a joint venture interest, to adequately manage the risks associated with any acquisitions or joint ventures could have a material adverse effect on the financial condition or results of operations of our joint ventures and, in turn, our business and operations.
We are subject to interruptions of supply and increased costs as a result of our reliance on third-party transportation of crude oil, NGL and refined petroleum products.
We often utilize the services of third parties to transport crude oil, NGL and refined petroleum products to and from our facilities. In addition to our own operational risks discussed above, we could experience interruptions of supply or increases in costs to deliver refined petroleum products to market if the ability of the pipelines or vessels to transport crude oil or refined petroleum products is disrupted because of weather events, accidents, governmental regulations or third-party actions. A prolonged disruption of the ability of a pipeline or vessel to transport crude oil, NGL or refined petroleum products to or from one or more of our refineries or other facilities could have a material adverse effect on our business, financial condition, results of operations and cash flows.
Increased regulation of hydraulic fracturing could result in reductions or delays in U.S. production of crude oil and natural gas, which could adversely impact our results of operations.
An increasing percentage of crude oil supplied to our refineries and the crude oil and gas production of our Midstream segment’s customers is being produced from unconventional oil shale reservoirs. These reservoirs require hydraulic fracturing completion processes to release the hydrocarbons from the rock so they can flow through casing to the surface. Hydraulic fracturing involves the injection of water, sand and chemicals under pressure into a formation to stimulate hydrocarbon production. The EPA, as well as several state agencies, have commenced studies and/or convened hearings regarding the potential environmental impacts of hydraulic fracturing activities. At the same time, certain environmental groups have suggested that additional laws may be needed to more closely and uniformly regulate the hydraulic fracturing process, and legislation has been proposed to provide for such regulation. In addition, some communities have adopted measures to ban hydraulic fracturing in their communities. We cannot predict whether any such legislation will ever be enacted and, if so, what its provisions would be. Any additional levels of regulation and permits required with the adoption of new laws and regulations at the federal or state level could result in our having to rely on higher priced crude oil for our refineries. This could lead to delays, increased operating costs and process prohibitions that could reduce
23
the volumes of natural gas that move through DCP Midstream’s gathering systems and could reduce supplies and increase costs of NGL feedstocks to CPChem’s facilities. This could materially adversely affect our results of operations and the ability of DCP Midstream and CPChem to make cash distributions to us.
DCP Midstream’s success depends on its ability to obtain new sources of natural gas and NGL. Any decrease in the volumes of natural gas DCP Midstream gathers could adversely affect its business and operating results.
DCP Midstream’s gathering and transportation pipeline systems are connected to or dependent on the level of production from natural gas wells, which naturally declines over time. As a result, its cash flows associated with these wells will also decline over time. In order to maintain or increase throughput levels on its gathering and transportation pipeline systems and NGL pipelines and the asset utilization rates at its natural gas processing plants, DCP Midstream must continually obtain new supplies. The primary factors affecting DCP Midstream’s ability to obtain new supplies of natural gas and NGL, and to attract new customers to its assets, include the level of successful drilling activity near these assets, prices of, and the demand for, natural gas and crude oil, producers’ desire and ability to obtain necessary permits in an efficient manner, natural gas field characteristics and production performance, surface access and infrastructure issues, and its ability to compete for volumes from successful new wells. If DCP Midstream is not able to obtain new supplies of natural gas to replace the natural decline in volumes from existing wells or because of competition, throughput on its pipelines and the utilization rates of its treating and processing facilities would decline. This could have a material adverse effect on its business, results of operations, financial position and cash flows, and its ability to make cash distributions to us.
Competitors that produce their own supply of feedstocks, have more extensive retail outlets, or have greater financial resources may have a competitive advantage.
The refining and marketing industry is highly competitive with respect to both feedstock supply and refined petroleum product markets. We compete with many companies for available supplies of crude oil and other feedstocks and for outlets for our refined petroleum products. We do not produce any of our crude oil feedstocks. Some of our competitors, however, obtain a portion of their feedstocks from their own production and some have more extensive retail outlets than we have. Competitors that have their own production or extensive retail outlets (and greater brand-name recognition) are at times able to offset losses from refining operations with profits from producing or retailing operations, and may be better positioned to withstand periods of depressed refining margins or feedstock shortages.
Some of our competitors also have materially greater financial and other resources than we have. Such competitors have a greater ability to bear the economic risks inherent in all phases of our business. In addition, we compete with other industries that provide alternative means to satisfy the energy and fuel requirements of our industrial, commercial and individual customers.
We may incur losses as a result of our forward contracts and derivative transactions.
We currently use commodity derivative instruments, and we expect to use them in the future. If the instruments we utilize to hedge our exposure to various types of risk are not effective, we may incur losses. Derivative transactions involve the risk that counterparties may be unable to satisfy their obligations to us. The risk of counterparty default is heightened in a poor economic environment.
One of our subsidiaries acts as the general partner of a publicly traded master limited partnership, Phillips 66 Partners, which may involve a greater exposure to legal liability than our historic business operations.
One of our subsidiaries acts as the general partner of Phillips 66 Partners, a publicly traded master limited partnership. Our control of the general partner of Phillips 66 Partners may increase the possibility that we could be subject to claims of breach of fiduciary duties, including claims of conflicts of interest, related to Phillips 66 Partners. Any liability resulting from such claims could have a material adverse effect on our future business, financial condition, results of operations and cash flows.
24
Security breaches and other disruptions could compromise our information and expose us to liability, which would cause our business and reputation to suffer.
In the ordinary course of our business, we collect sensitive data, including personally identifiable information of our customers and employees. Despite our security measures, our information technology and infrastructure
,
or information technology and infrastructure of our third-party service providers (e.g., cloud-based service providers), may be vulnerable to attacks by malicious actors or breached due to human error, malfeasance or other disruptions. Although we have experienced occasional, actual or attempted breaches of our cybersecurity, none of these breaches has had a material effect on our business, operations or reputation (or compromised any customer data). Any such breaches could compromise our networks and the information stored there could be accessed, publicly disclosed, lost or stolen. Any such access, disclosure or other loss of information could result in legal claims or proceedings, liability under laws that protect the privacy of customer information, including the European Union’s General Data Protection Regulation, disrupt the services we provide to customers, and damage our reputation, any of which could adversely affect our business.
The level of returns on pension and postretirement plan assets and the actuarial assumptions used for valuation purposes could affect our earnings and cash flows in future periods.
Assumptions used in determining projected benefit obligations and the expected return on plan assets for our pension plans and other postretirement benefit plans are evaluated by us based on a variety of independent sources of market information and in consultation with outside actuaries. If we determine that changes are warranted in the assumptions used, such as the discount rate, expected long-term rate of return, or health care cost trend rate, our future pension and postretirement benefit expenses and funding requirements could increase. In addition, several factors could cause actual results to differ significantly from the actuarial assumptions that we use. Funding obligations are determined based on the value of assets and liabilities on a specific date as required under relevant regulations. Future pension funding requirements, and the timing of funding payments, could be affected by legislation enacted by governmental authorities.
In connection with the Separation, ConocoPhillips has indemnified us for certain liabilities and we have agreed to indemnify ConocoPhillips for certain liabilities. If we are required to act on these indemnities to ConocoPhillips, we may need to use cash to meet those obligations and our financial results could be negatively impacted. The ConocoPhillips indemnity may not be sufficient to insure us against the full amount of liabilities for which it has been allocated responsibility, and ConocoPhillips may not be able to satisfy its indemnification obligations in the future.
Pursuant to the Indemnification and Release Agreement and certain other agreements with ConocoPhillips entered into in connection with the Separation, ConocoPhillips agreed to indemnify us for certain liabilities, and we agreed to indemnify ConocoPhillips for certain liabilities. Indemnities that we may be required to provide ConocoPhillips are not subject to any cap, may be significant and could negatively impact our business, particularly indemnities relating to our actions that could impact the tax-free nature of the distribution of Phillips 66 stock. Third parties could also seek to hold us responsible for any of the liabilities that ConocoPhillips has agreed to retain. Further, the indemnity from ConocoPhillips may not be sufficient to protect us against the full amount of such liabilities, and ConocoPhillips may not be able to fully satisfy its indemnification obligations. Moreover, even if we ultimately succeed in recovering from ConocoPhillips any amounts for which we are held liable, we may be temporarily required to bear these losses ourselves. Each of these risks could negatively affect our business, results of operations and financial condition.
We are subject to continuing contingent liabilities of ConocoPhillips following the Separation.
Notwithstanding the Separation, there are several significant areas where the liabilities of ConocoPhillips may become our obligations. For example, under the Internal Revenue Code and the related rules and regulations, each corporation that was a member of the ConocoPhillips consolidated U.S. federal income tax reporting group during any taxable period or portion of any taxable period ending on or before the effective time of the Separation is jointly and severally liable for the U.S. federal income tax liability of the entire ConocoPhillips consolidated tax reporting group for that taxable period. In connection with the Separation, we entered into the Tax Sharing Agreement with ConocoPhillips that allocates the responsibility for prior period taxes of the ConocoPhillips consolidated tax reporting group between us and ConocoPhillips. ConocoPhillips may be unable to pay any prior period taxes for which it is responsible, and we could be required to pay the entire amount of such taxes. Other provisions of federal law establish similar liability for other matters, including laws governing tax-qualified pension plans as well as other contingent liabilities.
25
If the distribution in connection with the Separation, together with certain related transactions, does not qualify as a transaction that is generally tax-free for U.S. federal income tax purposes, our stockholders and ConocoPhillips could be subject to significant tax liability and, in certain circumstances, we could be required to indemnify ConocoPhillips for material taxes pursuant to indemnification obligations under the Tax Sharing Agreement.
ConocoPhillips received a private letter ruling from the Internal Revenue Service (IRS) substantially to the effect that, among other things, the distribution, together with certain related transactions, qualified as a transaction that is generally tax-free for U.S. federal income tax purposes under Sections 355 and 368(a)(1)(D) of the Internal Revenue Code. The private letter ruling and the tax opinion that ConocoPhillips received relied on certain representations, assumptions and undertakings, including those relating to the past and future conduct of our business, and neither the private letter ruling nor the opinion would be valid if such representations, assumptions and undertakings were incorrect. Moreover, the private letter ruling does not address all the issues that are relevant to determining whether the distribution qualified for tax-free treatment. Notwithstanding the private letter ruling and the tax opinion, the IRS could determine the distribution should be treated as a taxable transaction for U.S. federal income tax purposes if it determines any of the representations, assumptions or undertakings that were included in the request for the private letter ruling are false or have been violated or if it disagrees with the conclusions in the opinion that are not covered by the IRS ruling.
If the IRS were to determine that the distribution failed to qualify for tax-free treatment, in general, ConocoPhillips would be subject to tax as if it had sold the Phillips 66 common stock in a taxable sale for its fair market value, and ConocoPhillips stockholders who received shares of Phillips 66 common stock in the distribution would be subject to tax as if they had received a taxable distribution equal to the fair market value of such shares.
Under the Tax Sharing Agreement, we would generally be required to indemnify ConocoPhillips against any tax resulting from the distribution to the extent that such tax resulted from (i) any of our representations or undertakings being incorrect or violated, or (ii) other actions or failures to act by us. Our indemnification obligations to ConocoPhillips and its subsidiaries, officers and directors are not limited by any maximum amount. If we are required to indemnify ConocoPhillips or such other persons under the circumstances set forth in the Tax Sharing Agreement, we may be subject to substantial liabilities.
Item 1B. UNRESOLVED STAFF COMMENTS
None.
26
Item 3. LEGAL PROCEEDINGS
The following is a description of reportable legal proceedings, including those involving governmental authorities under federal, state and local laws regulating the discharge of materials into the environment. While it is not possible to accurately predict the final outcome of these pending proceedings, if any one or more of such proceedings were decided adversely to Phillips 66, we expect there would be no material effect on our consolidated financial position. Nevertheless, such proceedings are reported pursuant to Securities and Exchange Commission (SEC) regulations.
Our U.S. refineries are implementing two separate consent decrees, regarding alleged violations of the Federal Clean Air Act, with the U.S. Environmental Protection Agency (EPA), five states and one local air pollution agency. Some of the requirements and limitations contained in the decrees provide for stipulated penalties for violations. Stipulated penalties under the decrees are not automatic, but must be requested by one of the agency signatories. As part of periodic reports under the decrees or other reports required by permits or regulations, we occasionally report matters that could be subject to a request for stipulated penalties. If a specific request for stipulated penalties meeting the reporting threshold set forth in SEC rules is made pursuant to these decrees based on a given reported exceedance, we will separately report that matter and the amount of the proposed penalty.
New Matters
In November 2018, the California Air Resources Board (CARB) demanded penalties to resolve a Notice of Violation (NOV) alleging that initial fuel certifications submitted by the company in November and December 2016 with respect to eight batches of gasoline were non-compliant with CARB regulations. We agreed to resolve the NOV with a penalty payment of $150,000.
In late 2018, Phillips 66 and the EPA agreed to resolve certain flaring violations alleged to have occurred at our Billings Refinery between May 2010 and September 2018. EPA's proposed resolution includes payments of a $150,000 penalty and approximately $220,000 for supplemental environmental projects. We are working with the EPA to finalize settlement terms to resolve this matter.
Matters Previously Reported (unresolved or resolved since the quarterly report on Form 10-Q for the quarterly period ended September 30,
2018
)
In September 2018, the South Coast Air Quality Management District (District) demanded penalties to resolve nine NOVs issued in 2016 and 2017. The NOVs pertain to alleged violations of air permit requirements or other air pollution regulatory requirements at our Los Angeles Refinery and Colton Terminal. This matter was resolved with a settlement payment of $93,500 to the District on December 6, 2018.
In May 2012, the Illinois Attorney General’s office filed and notified us of a complaint with respect to operations at the Wood River Refinery alleging violations of the Illinois groundwater standards and a third-party’s hazardous waste permit. The complaint seeks as relief remediation of area groundwater; compliance with the hazardous waste permit; enhanced pipeline and tank integrity measures; additional spill reporting; and fines and penalties exceeding $100,000. We are working with the Illinois Environmental Protection Agency and Attorney General’s office to resolve these allegations.
Item 4. MINE SAFETY DISCLOSURES
Not applicable.
27
EXECUTIVE OFFICERS OF THE REGISTRANT
|
Name
|
Position Held
|
Age*
|
|
|
Greg C. Garland
|
Chairman and Chief Executive Officer
|
61
|
|
|
Robert A. Herman
|
Executive Vice President, Refining
|
59
|
|
|
Paula A. Johnson
|
Executive Vice President, Legal and Government Affairs, General Counsel and Corporate Secretary
|
55
|
|
|
Brian M. Mandell
|
Senior Vice President, Marketing and Commercial
|
55
|
|
|
Kevin J. Mitchell
|
Executive Vice President, Finance and Chief Financial Officer
|
52
|
|
|
Chukwuemeka A. Oyolu
|
Vice President and Controller
|
49
|
|
|
Timothy D. Roberts
|
Executive Vice President, Midstream
|
57
|
|
* On
February 22, 2019
.
There are no family relationships among any of the officers named above. The Board of Directors annually elects the officers to serve until a successor is elected and qualified or as otherwise provided in our By-Laws. Set forth below is information about the executive officers identified above.
Greg C. Garland
is the Chairman and Chief Executive Officer of Phillips 66, a position he has held since June 2014. Previously, Mr. Garland served as Phillips 66’s Chairman, President and Chief Executive Officer from April 2012 to June 2014. Mr. Garland previously served as ConocoPhillips’ Senior Vice President, Exploration and Production—Americas from October 2010 to April 2012, and as President and Chief Executive Officer of CPChem from 2008 to 2010.
Robert A. Herman
is Executive Vice President, Refining of Phillips 66, a position he has held since September 2017. Previously, Mr. Herman served Phillips 66 as Executive Vice President, Midstream from June 2014 to September 2017, Senior Vice President, HSE, Projects and Procurement from February 2014 to June 2014, and Senior Vice President, Health, Safety, and Environment from April 2012 to February 2014.
Paula A. Johnson
is Executive Vice President, Legal and Government Affairs, General Counsel and Corporate Secretary of Phillips 66, a position she has held since October 2016. Previously, Ms. Johnson served as Executive Vice President, Legal, General Counsel and Corporate Secretary of Phillips 66 from May 2013 to October 2016.
Brian M. Mandell
is Senior Vice President, Marketing and Commercial of Phillips 66, a position he has held since August 2018. Previously, Mr. Mandell served as Senior Vice President, Commercial from November 2016 to August 2018, President, Global Marketing from March 2015 to November 2016, and Global Trading Lead, Clean Products, Commercial from May 2012 to March 2015.
Kevin J. Mitchell
is Executive Vice President, Finance and Chief Financial Officer of Phillips 66, a position he has held since January 2016. Previously, Mr. Mitchell served as Phillips 66’s Vice President, Investor Relations from September 2014, when he joined the company, to January 2016. Prior to joining the company, he served as the General Auditor of ConocoPhillips from May 2010 until September 2014.
Chukwuemeka A. Oyolu
is Vice President and Controller of Phillips 66, a position he has held since December 2014. Mr. Oyolu was Phillips 66’s General Manager, Finance for Refining, Marketing and Transportation from May 2012 to February 2014 when he became General Manager, Planning and Optimization.
Timothy D. Roberts
is Executive Vice President, Midstream of Phillips 66, a position he has held since August 2018. Previously, Mr. Roberts served as Executive Vice President, Marketing and Commercial, from January 2017 to August 2018 and as Executive Vice President Strategy and Business Development from April 2016 to January 2017. Before joining Phillips 66, Mr. Roberts served in a number of executive roles at LyondellBasell Industries N.V. since 2011, most recently as Executive Vice President, Global Olefins and Polyolefins from October 2013 to March 2016.
28
PART II
|
Item 5.
|
MARKET FOR REGISTRANT’S COMMON EQUITY, RELATED STOCKHOLDER MATTERS AND ISSUER PURCHASES OF EQUITY SECURITIES
|
Phillips 66’s common stock is traded on the New York Stock Exchange under the symbol “PSX.” At January 31,
2019
, our number of stockholders of record was
36,550
.
Performance Graph
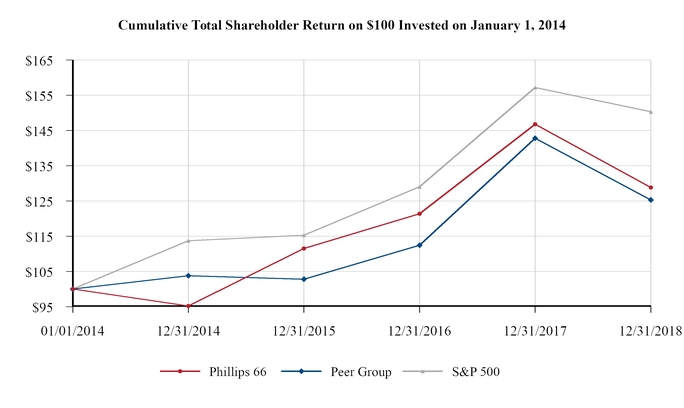
The performance graph above includes a peer index (the “Peer Group”) composed of Celanese Corporation; Delek US Holdings, Inc.; Eastman Chemical Co.; Enterprise Products Partners, LP; HollyFrontier Corporation; Huntsman Corporation; LyondellBasell Industries N.V.; Marathon Petroleum Corporation; Oneok, Inc.; PBF Energy Inc.; Targa Resources Corp.; Valero Energy Corporation; and Westlake Chemical Corp. Additionally, Andeavor is included as a peer for periods prior to its acquisition by Marathon Petroleum Corporation.
29
Issuer Purchases of Equity Securities
|
Millions of Dollars
|
|
||||||||||||
|
Period
|
Total Number of Shares Purchased*
|
|
Average Price Paid per Share
|
|
Total Number of Shares Purchased
as Part of Publicly Announced Plans
or Programs**
|
|
Approximate Dollar Value of Shares
that May Yet Be Purchased Under the Plans or Programs
|
|
|||||
|
October 1-31, 2018
|
1,972,339
|
|
$
|
108.57
|
|
1,972,339
|
|
$
|
1,890
|
|
|||
|
November 1-30, 2018
|
1,339,525
|
|
96.47
|
|
1,339,525
|
|
1,761
|
|
|||||
|
December 1-31, 2018
|
1,761,225
|
|
87.35
|
|
1,761,225
|
|
1,607
|
|
|||||
|
Total
|
5,073,089
|
|
$
|
98.01
|
|
5,073,089
|
|
||||||
* Includes repurchase of shares of common stock from company employees in connection with the company’s broad-based employee incentive plans, when applicable.
** As of
December 31, 2018
, our Board of Directors has authorized repurchases totaling up to
$12 billion
of our outstanding common stock. The authorizations from the Board of Directors do not have expiration dates. The share repurchases are expected to be funded primarily through available cash. The authorized shares will be repurchased from time to time in the open market at the company’s discretion, subject to market conditions and other factors, and in accordance with applicable regulatory requirements. We are not obligated to acquire any particular amount of common stock and may commence, suspend or discontinue purchases at any time or from time to time without prior notice. Shares of stock repurchased are held as treasury shares.
30
Item 6. SELECTED FINANCIAL DATA
|
Millions of Dollars Except Per Share Amounts
|
|||||||||||||||
|
|
2018
|
|
2017
|
|
2016
|
|
2015
|
|
2014
|
|
|||||
|
Sales and other operating revenues*
|
$
|
111,461
|
|
102,354
|
|
84,279
|
|
98,975
|
|
161,212
|
|
||||
|
Income from continuing operations
|
5,873
|
|
5,248
|
|
1,644
|
|
4,280
|
|
4,091
|
|
|||||
|
Income from continuing operations attributable to Phillips 66
|
5,595
|
|
5,106
|
|
1,555
|
|
4,227
|
|
4,056
|
|
|||||
|
Per common share
|
|||||||||||||||
|
Basic
|
11.87
|
|
9.90
|
|
2.94
|
|
7.78
|
|
7.15
|
|
|||||
|
Diluted
|
11.80
|
|
9.85
|
|
2.92
|
|
7.73
|
|
7.10
|
|
|||||
|
Net income
|
5,873
|
|
5,248
|
|
1,644
|
|
4,280
|
|
4,797
|
|
|||||
|
Net income attributable to Phillips 66
|
5,595
|
|
5,106
|
|
1,555
|
|
4,227
|
|
4,762
|
|
|||||
|
Per common share
|
|||||||||||||||
|
Basic
|
11.87
|
|
9.90
|
|
2.94
|
|
7.78
|
|
8.40
|
|
|||||
|
Diluted
|
11.80
|
|
9.85
|
|
2.92
|
|
7.73
|
|
8.33
|
|
|||||
|
Total assets
|
54,302
|
|
54,371
|
|
51,653
|
|
48,580
|
|
48,692
|
|
|||||
|
Long-term debt
|
11,093
|
|
10,069
|
|
9,588
|
|
8,843
|
|
7,793
|
|
|||||
|
Cash dividends declared per common share
|
3.10
|
|
2.73
|
|
2.45
|
|
2.18
|
|
1.89
|
|
|||||
* Sales and other operating revenues for the years ended December 31, 2014 through 2017, are presented in accordance with accounting standards in effect prior to our adoption of ASU No. 2014-09 on January 1, 2018. See Note 2—Changes in Accounting Principles, in the Notes to Consolidated Financial Statements, for further discussion regarding our adoption of ASU No. 2014-09.
In December 2013, we entered into an agreement to exchange the stock of Phillips Specialty Products Inc. (PSPI), a flow improver business, which was included in our Marketing and Specialties segment, for shares of Phillips 66 common stock owned by the other party. The PSPI share exchange was completed in February 2014. Accordingly, the selected income from continuing operations data above for the year ended December 31, 2014, excludes income from PSPI’s discontinued operations of $706 million.
To ensure full understanding, you should read the selected financial data presented above in conjunction with “Management’s Discussion and Analysis of Financial Condition and Results of Operations” and the consolidated financial statements and accompanying notes included elsewhere in this Annual Report on Form 10-K.
31
Item 7. MANAGEMENT’S DISCUSSION AND ANALYSIS OF FINANCIAL CONDITION AND RESULTS OF OPERATIONS
Unless otherwise indicated, “the company,” “we,” “our,” “us” and “Phillips 66” are used in this report to refer to the businesses of Phillips 66 and its consolidated subsidiaries.
Management’s Discussion and Analysis is the company’s analysis of its financial performance, financial condition, and significant trends that may affect future performance. It should be read in conjunction with the consolidated financial statements and notes thereto included elsewhere in this Annual Report on Form 10-K. It contains forward-looking statements including, without limitation, statements relating to the company’s plans, strategies, objectives, expectations and intentions that are made pursuant to the “safe harbor” provisions of the Private Securities Litigation Reform Act of 1995. The words “anticipate,” “estimate,” “believe,” “budget,” “continue,” “could,” “intend,” “may,” “plan,” “potential,” “predict,” “seek,” “should,” “will,” “would,” “expect,” “objective,” “projection,” “forecast,” “goal,” “guidance,” “outlook,” “effort,” “target” and similar expressions identify forward-looking statements. The company does not undertake to update, revise or correct any of the forward-looking information unless required to do so under the federal securities laws. Readers are cautioned that such forward-looking statements should be read in conjunction with the company’s disclosures under the heading: “CAUTIONARY STATEMENT FOR THE PURPOSES OF THE ‘SAFE HARBOR’ PROVISIONS OF THE PRIVATE SECURITIES LITIGATION REFORM ACT OF 1995.”
The terms “earnings” and “loss” as used in Management’s Discussion and Analysis refer to net income (loss) attributable to Phillips 66. The terms “pre-tax income” or “pre-tax loss” as used in Management’s Discussion and Analysis refer to income (loss) before income taxes.
EXECUTIVE OVERVIEW AND BUSINESS ENVIRONMENT
Phillips 66 is an energy manufacturing and logistics company with midstream, chemicals, refining, and marketing and specialties businesses. At
December 31, 2018
, we had total assets of
$54.3 billion
.
Executive Overview
In
2018
, we reported earnings of
$5.6 billion
, generated
$7.6 billion
in cash from operating activities and raised net proceeds of
$1.5 billion
from the issuance of senior notes. We used available cash primarily for repurchases of our common stock of
$4.6 billion
, capital expenditures and investments of
$2.6 billion
, dividend payments on our common stock of
$1.4 billion
and the early repayment of
$550 million
of debt. We ended
2018
with
$3.0 billion
of cash and cash equivalents and approximately
$5.6 billion
of total committed capacity available under our credit facilities.
We continue to focus on the following strategic priorities:
|
•
|
Operating Excellence.
Our commitment to operating excellence guides everything we do. We are committed to protecting the health and safety of everyone who has a role in our operations and the communities in which we operate. Continuous improvement in safety, environmental stewardship, reliability and cost efficiency is a fundamental requirement for our company and employees. We employ rigorous training and audit programs to drive ongoing improvement in both personal and process safety as we strive for zero incidents. Since we cannot control commodity prices, controlling operating expenses and overhead costs, within the context of our commitment to safety and environmental stewardship, is a high priority. Senior management actively monitors these costs. We are committed to protecting the environment and strive to reduce our environmental footprint throughout our operations.
Optimizing utilization rates at our refineries through reliable and safe operations enables us to capture the value available in the market in terms of prices and margins. During
2018
, our worldwide refining crude oil capacity utilization rate was
95 percent
.
|
32
|
•
|
Growth.
We have budgeted
$3.2 billion
in capital expenditures and investments in 2019, including
$0.9 billion
for Phillips 66 Partners LP (Phillips 66 Partners). The Phillips 66 Partners’ capital budget includes
$0.3 billion
of capital expected to be cash funded by noncontrolling interests. Additionally, our share of expected self-funded capital spending by joint ventures DCP Midstream, LLC (DCP Midstream), Chevron Phillips Chemical Company LLC (CPChem) and WRB Refining LP (WRB) in 2019 is
$1.2 billion
. In Midstream, we will continue building out our integrated logistics infrastructure network, including pipelines, storage, export and fractionation facilities. In Chemicals, CPChem’s growth capital will fund continuing development of a second U.S. Gulf Coast petrochemicals project and debottlenecking opportunities on existing assets. Growth capital in Refining will be directed toward high-return projects to enhance the yield of higher-value products, as well as other low-capital, quick-payout projects, while in Marketing and Specialties (M&S) it will be to further grow and enhance retail sites in Europe.
|
|
•
|
Returns.
We plan to improve refining returns by increasing throughput of advantaged feedstocks, disciplined capital allocation and portfolio optimization. A disciplined capital allocation process ensures we focus investments in projects that generate competitive returns throughout the business cycle. In
2018
, our Midstream segment benefited from higher equity earnings and cash distributions from our investments in joint venture pipelines. Our Refining segment maintained a strong clean product yield and a high advantaged crude oil throughput rate at our U.S. refineries. Additionally, our M&S segment continued to enhance our network and brand by re-imaging sites in the United States.
|
|
•
|
Distributions.
We believe shareholder value is enhanced through, among other things, consistent growth of regular dividends, complemented by share repurchases. We increased our quarterly dividend rate by
14 percent
during
2018
, and have increased it every year since the company’s inception in 2012. Regular dividends demonstrate the confidence our Board of Directors and management have in our capital structure and operations’ capability to generate free cash flow throughout the business cycle. In
2018
, we repurchased
$4.6 billion
, or approximately
48 million
shares, of our common stock. At the discretion of our Board of Directors, we plan to increase dividends annually and fund our share repurchase program while continuing to invest in the growth of our business.
|
|
•
|
High-Performing Organization.
We strive to attract, develop and retain individuals with the knowledge and skills to implement our business strategy and who support our values and culture. Throughout the company, we focus on getting results in the right way and believe success is both what we do and how we do it. We encourage collaboration throughout our company, while valuing differences, respecting diversity, and creating a great place to work. We foster an environment of learning and development through structured programs focused on enhancing functional and technical skills where employees are engaged in our business and committed to their own, as well as the company’s, success.
|
33
Business Environment
The price of U.S. benchmark crude oil, West Texas Intermediate (WTI) at Cushing, Oklahoma, increased to an average of $64.92 per barrel during 2018, compared with an average of $50.90 per barrel in 2017. The WTI discount versus the international benchmark Dated Brent widened in
2018
, compared with 2017, due to growing U.S. crude production. A widening differential generally benefits our results. Over the course of 2018, commodity prices had both favorable and unfavorable impacts on our businesses that vary by segment.
The Midstream segment, which includes our 50 percent equity investment in DCP Midstream, contains fee-based operations that are not directly exposed to commodity price risk, as well as operations that are directly linked to natural gas liquids (NGL) prices, natural gas prices and crude oil prices. Natural gas prices were relatively flat in 2018, compared with 2017, while NGL prices were higher in 2018 due to higher global crude oil prices and increased domestic demand for ethane.
The Chemicals segment consists of our 50 percent equity investment in CPChem. The chemicals and plastics industry is mainly a commodity-based industry where the margins for key products are based on supply and demand, as well as cost factors. During 2018, the high-density polyethylene chain margin contracted mainly due to rapidly expanding North American supply. In addition, lower naptha-based feedstock costs internationally narrowed the difference between naptha-based and ethane-based margins. However, North American ethane-based crackers integrated through ethylene derivatives continue to benefit from a feedstock price advantage associated with abundant domestic supply and continue to capture a higher polyethylene chain margin than crackers in most other regions of the world.
Our Refining segment results are driven by several factors, including refining margins, cost control, refinery throughput, feedstock costs, product yields and turnaround activity. Industry crack spread indicators, the difference between market prices for refined petroleum products and crude oil, are used to estimate refining margins. During
2018
, the U.S. 3:2:1 crack spread (three barrels of crude oil producing two barrels of gasoline and one barrel of diesel) decreased compared with 2017, primarily due to lower gasoline crack spreads caused by higher refinery utilization. The average Northwest Europe crack spread increased slightly in 2018, compared with 2017, due to higher distillate prices.
Results for our M&S segment depend largely on marketing fuel margins, lubricant margins, and other specialty product margins. While M&S margins are primarily driven by market factors, largely determined by the relationship between supply and demand, marketing fuel margins, in particular, are influenced by the trend in spot prices for refined petroleum products. Generally speaking, a downward trend of spot prices has a favorable impact on marketing fuel margins, while an upward trend of spot prices has an unfavorable impact on marketing fuel margins.
34
RESULTS OF OPERATIONS
Basis of Presentation
During the fourth quarter of 2018, the segment performance measure used by our chief executive officer to assess performance and allocate resources was changed from “net income” to “income before income taxes.” Prior-period segment information has been recast to conform to the current presentation.
Consolidated Results
A summary of income (loss) before income taxes by business segment with a reconciliation to net income attributable to Phillips 66 follows:
|
|
Millions of Dollars
|
||||||||
|
Year Ended December 31
|
|||||||||
|
|
2018
|
|
2017
|
|
2016
|
|
|||
|
Midstream
|
$
|
1,181
|
|
638
|
|
403
|
|
||
|
Chemicals
|
1,025
|
|
716
|
|
839
|
|
|||
|
Refining
|
4,535
|
|
2,076
|
|
435
|
|
|||
|
Marketing and Specialties
|
1,557
|
|
1,020
|
|
1,261
|
|
|||
|
Corporate and Other
|
(853
|
)
|
(895
|
)
|
(747
|
)
|
|||
|
Income before income taxes
|
7,445
|
|
3,555
|
|
2,191
|
|
|||
|
Income tax expense (benefit)
|
1,572
|
|
(1,693
|
)
|
547
|
|
|||
|
Net income
|
5,873
|
|
5,248
|
|
1,644
|
|
|||
|
Less: net income attributable to noncontrolling interests
|
278
|
|
142
|
|
89
|
|
|||
|
Net income attributable to Phillips 66
|
$
|
5,595
|
|
5,106
|
|
1,555
|
|
||
2018
vs.
2017
Our earnings
increased
$489 million
, or
10 percent
, in
2018
, mainly reflecting:
|
•
|
Higher realized refining and marketing margins.
|
|
•
|
Higher earnings from equity affiliates in our Midstream and Chemicals segments.
|
|
•
|
A lower U.S. federal corporate income tax rate beginning January 1, 2018, as a result of the U.S. Tax Cuts and Jobs Act (the Tax Act) enacted in December 2017.
|
These increases were partially offset by:
|
•
|
A $2,735 million provisional income tax benefit from the enactment of the Tax Act recognized in December 2017, primarily due to the revaluation of deferred income taxes.
|
|
•
|
A $261 million noncash, after-tax gain from the consolidation of Merey Sweeny, L.P., predecessor to Merey Sweeny LLC (both referred to herein as Merey Sweeny), in 2017.
|
|
•
|
Higher net income attributable to noncontrolling interests primarily due to the contribution of assets to Phillips 66 Partners in the fourth quarter of 2017.
|
|
•
|
Higher interest and debt expense.
|
35
2017
vs.
2016
Our earnings
increased
$3,551 million
, or
228 percent
, in
2017
, primarily resulting from:
|
•
|
Recognition of the $2,735 million provisional income tax benefit from the enactment of the Tax Act in December 2017.
|
|
•
|
Higher realized refining margins.
|
|
•
|
Recognition of the $261 million after-tax gain from the consolidation of Merey Sweeny.
|
|
•
|
Improved equity earnings from affiliates in our Midstream segment.
|
These increases were partially offset by:
|
•
|
Increased costs due to Hurricane Harvey, primarily impacting CPChem in our Chemicals segment.
|
|
•
|
Lower realized marketing margins.
|
|
•
|
Higher interest and debt expense.
|
See the “Segment Results” section for additional information on our segment results.
36
Income Statement Analysis
2018
vs.
2017
Sales and other operating revenues
and
purchased crude oil and products
increased
9 percent
and
23 percent
, respectively, in
2018
. The increases were mainly due to higher prices for refined petroleum products, crude oil and NGL. The increase in sales and other operating revenues was partially offset by a change in the presentation of excise taxes on sales of refined petroleum products resulting from our adoption of Financial Accounting Standard Board (FASB) Accounting Standards Update (ASU) No. 2014-09, “Revenue from Contracts with Customers (Topic 606),” on January 1, 2018. As part of our adoption of this ASU, prospectively from January 1, 2018, our presentation of excise taxes on sales of refined petroleum products changed to a net basis from a gross basis. As a result, the “Sales and other operating revenues” and “Taxes other than income taxes” lines on our consolidated statement of income for the year ended
December 31, 2018
, are not presented on a comparable basis to the years ended
December 31, 2017
and
2016
. See
Note 1—Summary of Significant Accounting Policies
and
Note 2—Changes in Accounting Principles
, in the Notes to Consolidated Financial Statements, for further information on our presentation of excise taxes on sales of refined petroleum products and our adoption of this ASU, respectively.
Equity in earnings of affiliates
increased
55 percent
in
2018
, primarily resulting from higher equity in earnings from WRB, CPChem and affiliates in our Midstream segment.
|
•
|
Equity in earnings of WRB increased $483 million, primarily due to higher realized margins driven by improved feedstock advantage.
|
|
•
|
Equity in earnings of CPChem increased $312 million, primarily due to commencement of full operations at CPChem’s new U.S. Gulf Coast petrochemicals assets and lower hurricane-related costs and downtime in 2018.
|
|
•
|
Equity in earnings for our Midstream segment increased $222 million, primarily due to higher volumes on affiliate pipelines, including the Bakken Pipeline, which operated for a full year in 2018.
|
Other income
decreased
$460 million
in
2018
. We recognized a noncash, pre-tax gain of
$423 million
in February 2017 related to the consolidation of Merey Sweeny. See
Note 5—Business Combinations
, in the Notes to Consolidated Financial Statements, for additional information.
Taxes other than income taxes
decreased
97 percent
in
2018
. The decrease was primarily attributable to the change in our presentation of excise taxes on sales of refined petroleum products resulting from our adoption of ASU No. 2014-09 on January 1, 2018. See the “Sales and other operating revenues” section above for further discussion.
Interest and debt expense
increased
15 percent
in
2018
. The increase was due to higher average debt principal balances resulting from our issuance of senior notes totaling $1,500 million in March 2018 and Phillips 66 Partners’ issuance of senior notes totaling $650 million in October 2017.
Income tax expense (benefit)
was an expense in 2018, compared with a benefit in 2017. The benefit in 2017 was due to the recognition of a provisional income tax benefit of $2,735 million from the enactment of the Tax Act in December 2017. The benefit from the Tax Act was primarily due to the revaluation of deferred income taxes. Excluding this benefit, income tax expense increased in 2018 due to higher income before income taxes, partially offset by the reduction of the U.S. federal corporate income tax rate from 35 percent to 21 percent beginning January 1, 2018, as a result of the Tax Act. See
Note 21—Income Taxes
, in the Notes to Consolidated Financial Statements, for more information regarding our income taxes.
Net income attributable to noncontrolling interests
increased
$136 million
in
2018
, primarily due to the contribution of assets to Phillips 66 Partners in the fourth quarter of 2017. See
Note 27—Phillips 66 Partners LP
, in the Notes to Consolidated Financial Statements, for more information.
37
2017
vs.
2016
Sales and other operating revenues
and
purchased crude oil and products
increased
21 percent
and
27 percent
, respectively, in
2017
. The increases were primarily due to higher prices for refined petroleum products, crude oil and NGL.
Equity in earnings of affiliates
increased
22 percent
in
2017
, primarily resulting from higher equity in earnings from DCP Midstream and other affiliates in our Midstream segment, as well as WRB, partially offset by lower results from CPChem.
|
•
|
Equity in earnings from our Midstream segment increased $270 million due to improved results from DCP Midstream, primarily driven by improved margins, as well as higher equity in earnings from our pipeline affiliates, including our joint ventures that own the Bakken Pipeline, which started commercial operations in June 2017.
|
|
•
|
Equity in earnings of WRB increased $207 million, primarily due to higher market crack spreads, partially offset by lower feedstock advantage.
|
|
•
|
Equity in earnings of CPChem decreased $120 million, primarily due to hurricane-related costs and downtime.
|
Other income
increased
$447 million
in
2017
. We recognized a noncash, pre-tax gain of
$423 million
in February 2017 related to the consolidation of Merey Sweeny. See
Note 5—Business Combinations
, in the Notes to Consolidated Financial Statements, for additional information.
Operating expenses
increased
10 percent
in
2017
. This increase was mainly due to the consolidation of a transportation joint venture in December 2016, as well as higher refining turnaround expenses and utility costs, pension settlement expense, and costs associated with a full year of operations at the Freeport LPG Export Terminal. These increases were partially offset by lower costs due to the sale of the Whitegate Refinery in 2016.
Depreciation and amortization
increased
13 percent
in
2017
due to the Freeport LPG Export Terminal beginning operations in late 2016, as well as other assets placed in service in 2017.
Interest and debt expense
increased
30 percent
in
2017
. This increase was primarily driven by lower capitalized interest due to the completion of major projects, including completion of the Freeport LPG Export Terminal project in late 2016, as well as higher average debt principal balances.
Income tax expense (benefit)
was a benefit in
2017
, compared with expense in 2016, primarily due to the $2,735 million provisional income tax benefit from the enactment of the Tax Act in December 2017. The benefit from the Tax Act was primarily due to the revaluation of deferred income taxes. This benefit was partially offset by higher income tax expense from increased income before income taxes. See
Note 21—Income Taxes
, in the Notes to Consolidated Financial Statements, for more information regarding our income taxes.
Net income attributable to noncontrolling interests
increased
$53 million
in
2017
, primarily due to the contributions of assets to Phillips 66 Partners during 2017 and late 2016. See
Note 27—Phillips 66 Partners LP
, in the Notes to Consolidated Financial Statements, for more information.
38
Segment Results
Midstream
|
|
Year Ended December 31
|
||||||||
|
|
2018
|
|
2017
|
|
2016
|
|
|||
|
|
Millions of Dollars
|
||||||||
|
Income (Loss) Before Income Taxes
|
|||||||||
|
Transportation
|
$
|
770
|
|
530
|
|
442
|
|
||
|
NGL and Other
|
305
|
|
32
|
|
(5
|
)
|
|||
|
DCP Midstream
|
106
|
|
76
|
|
(34
|
)
|
|||
|
Total Midstream
|
$
|
1,181
|
|
638
|
|
403
|
|
||
|
Thousands of Barrels Daily
|
||||||||
|
Transportation Volumes
|
||||||||
|
Pipelines*
|
3,441
|
|
3,320
|
|
3,321
|
|
||
|
Terminals
|
3,153
|
|
2,665
|
|
2,422
|
|
||
|
Operating Statistics
|
||||||||
|
NGL fractionated**
|
216
|
|
186
|
|
170
|
|
||
|
NGL extracted***
|
413
|
|
374
|
|
393
|
|
||
* Pipelines represent the sum of volumes transported through each separately tariffed consolidated pipeline segment. Prior year volumes have been recast to exclude our share of equity volumes from Yellowstone Pipe Line Company and Lake Charles Pipe Line Company.
*
* Excludes DCP Midstream.
*** Represents 100 percent of DCP Midstream’s volumes.
|
|
Dollars Per Gallon
|
||||||||
|
Weighted-Average NGL Price*
|
|||||||||
|
DCP Midstream
|
$
|
0.75
|
|
0.62
|
|
0.46
|
|
||
* Based on index prices from the Mont Belvieu market hub, which are weighted by NGL component.
The Midstream segment provides crude oil and refined petroleum product transportation, terminaling and processing services, as well as natural gas and NGL transportation, storage, processing and marketing services, mainly in the United States. This segment includes our master limited partnership (MLP), Phillips 66 Partners, as well as our
50 percent
equity investment in DCP Midstream, which includes the operations of its MLP, DCP Midstream, LP (DCP Partners).
2018
vs.
2017
Pre-tax income from the Midstream segment
increased
$543 million
in
2018
, compared with
2017
, due to improved results across all business lines.
Pre-tax income from our Transportation business
increased
$240 million
in
2018
, compared with
2017
. The increase was mainly driven by higher volumes, tariffs and storage rates from our portfolio of consolidated and joint venture assets. These increases were partially offset by a decrease in equity earnings from Rockies Express Pipeline LLC (REX) due to a favorable settlement recorded in 2017.
Pre-tax income from our NGL and Other business
increased
$273 million
in
2018
, compared with
2017
. The increase was primarily due to the contribution of Merey Sweeny to Phillips 66 Partners in October 2017, inventory impacts, improved cargo margins and volumes, and higher equity earnings from pipeline affiliates due to increased volumes.
39
Pre-tax income from our investment in DCP Midstream
increased
$30 million
in
2018
, compared with
2017
. The increase was primarily due to higher equity earnings from affiliates as a result of increased volumes, timing of incentive distribution income allocations from DCP Partners, and favorable hedging results. These increases were partially offset by higher asset impairments and operating costs in 2018.
See the “Executive Overview and Business Environment” section for information on market factors impacting
2018
results.
2017
vs.
2016
Pre-tax income from the Midstream segment
increased
$235 million
in
2017
, compared with
2016
, due to improved results across all business lines.
Pre-tax income from our Transportation business
increased
$88 million
in
2017
, compared with
2016
. The improvement was mainly driven by increased equity earnings from affiliates, including our joint ventures that own the Bakken Pipeline, which started commercial operations in June 2017, as well as REX due to our share of a favorable breach of contract settlement claim. These increases were partially offset by higher operating costs.
Pre-tax income from our NGL and Other business
increased
$37 million
in
2017
, compared with
2016
. The increase reflected a full year of operations at the Freeport LPG Export Terminal, the contribution of Merey Sweeny to Phillips 66 Partners in October 2017, and higher equity earnings from DCP Sand Hills Pipeline, LLC (Sand Hills), partially offset by lower realized margins.
Pre-tax income from our investment in DCP Midstream
increased
$110 million
in
2017
, compared with
2016
. The increase was primarily due to improved margins driven by higher average NGL and natural gas prices, and improved hedging results.
40
Chemicals
|
|
Year Ended December 31
|
||||||||
|
|
2018
|
|
2017
|
|
2016
|
|
|||
|
|
Millions of Dollars
|
||||||||
|
Income Before Income Taxes
|
$
|
1,025
|
|
716
|
|
839
|
|
||
|
|
Millions of Pounds
|
||||||||
|
CPChem Externally Marketed Sales Volumes
*
|
|||||||||
|
Olefins and Polyolefins
|
18,435
|
|
15,870
|
|
16,011
|
|
|||
|
Specialties, Aromatics and Styrenics
|
4,931
|
|
4,618
|
|
4,911
|
|
|||
|
23,366
|
|
20,488
|
|
20,922
|
|
||||
|
* Represents 100 percent of CPChem’s outside sales of produced petrochemical products, as well as commission sales from equity affiliates.
|
|||||||||
|
Olefins and Polyolefins Capacity Utilization (percent)
|
94
|
%
|
87
|
|
91
|
|
|||
The Chemicals segment consists of our
50 percent
interest in CPChem, which we account for under the equity method. CPChem uses NGL and other feedstocks to produce petrochemicals. These products are then marketed and sold or used as feedstocks to produce plastics and other chemicals. We structure our reporting of CPChem’s operations around two primary business lines: Olefins and Polyolefins (O&P) and Specialties, Aromatics and Styrenics (SA&S). The O&P business line produces and markets ethylene and other olefin products. Ethylene produced is primarily consumed within CPChem for the production of polyethylene, normal alpha olefins and polyethylene pipe. The SA&S business line manufactures and markets aromatics and styrenics products, such as benzene, cyclohexane, styrene and polystyrene. SA&S also manufactures and/or markets a variety of specialty chemical products. Unless otherwise noted, amounts referenced below reflect our net
50 percent
interest in CPChem.
2018
vs.
2017
Pre-tax income from the Chemicals segment
increased
$309 million
in
2018
, compared with
2017
. The increased results reflected the commencement of full operations at CPChem’s new U.S. Gulf Coast petrochemicals assets in the second quarter of 2018, which resulted in higher production and sales of polyethylene and ethylene, partially offset by lower capitalized interest. Additionally, lower hurricane-related costs and downtime, as well as lower impairment charges, contributed to the increased results in 2018.
See the “Executive Overview and Business Environment” section for information on market factors impacting CPChem’s
2018
results.
2017
vs.
2016
Pre-tax income from the Chemicals segment
decreased
$123 million
in
2017
, compared with
2016
. The decrease was primarily driven by higher costs and lower volumes due to Hurricane Harvey, as well as lower margins. These items were partially offset by lower impairment charges, higher equity in earnings from an O&P affiliate due to lower turnaround costs and a gain on the sale of CPChem’s K-Resin
®
styrene-butadiene copolymers business. CPChem recognized impairment charges of $127 million and $177 million in 2017 and 2016, respectively, due to lower demand and margin factors. As a result of these impairments, pre-tax income from the Chemicals segment was reduced by $64 million and $89 million in 2017 and 2016, respectively.
As a result of Hurricane Harvey, CPChem’s Cedar Bayou facility in Baytown, Texas, experienced severe flooding, which caused it to shut down operations in the third quarter of 2017. This facility restarted in phases during the fourth quarter of 2017. Startup of CPChem’s U.S. Gulf Coast Petrochemicals Project was delayed by the flooding.
41
Refining
|
|
Year Ended December 31
|
||||||||
|
|
2018
|
|
2017
|
|
2016
|
|
|||
|
Millions of Dollars
|
|||||||||
|
Income (Loss) Before Income Taxes
|
|||||||||
|
Atlantic Basin/Europe
|
$
|
567
|
|
448
|
|
187
|
|
||
|
Gulf Coast
|
1,040
|
|
809
|
|
69
|
|
|||
|
Central Corridor
|
2,817
|
|
755
|
|
367
|
|
|||
|
West Coast
|
111
|
|
64
|
|
(188
|
)
|
|||
|
Worldwide
|
$
|
4,535
|
|
2,076
|
|
435
|
|
||
|
Dollars Per Barrel
|
|||||||||
|
Income (Loss) Before Income Taxes
|
|||||||||
|
Atlantic Basin/Europe
|
$
|
3.05
|
|
2.25
|
|
0.85
|
|
||
|
Gulf Coast
|
3.55
|
|
2.83
|
|
0.24
|
|
|||
|
Central Corridor
|
26.50
|
|
8.19
|
|
3.74
|
|
|||
|
West Coast
|
0.81
|
|
0.48
|
|
(1.49
|
)
|
|||
|
Worldwide
|
6.29
|
|
2.92
|
|
0.60
|
|
|||
|
Realized Refining Margins*
|
|||||||||
|
Atlantic Basin/Europe
|
$
|
10.32
|
|
8.25
|
|
6.26
|
|
||
|
Gulf Coast
|
9.48
|
|
7.07
|
|
5.49
|
|
|||
|
Central Corridor
|
22.22
|
|
12.44
|
|
8.70
|
|
|||
|
West Coast
|
11.20
|
|
10.49
|
|
9.15
|
|
|||
|
Worldwide
|
12.99
|
|
9.13
|
|
6.99
|
|
|||
* See the “Non-GAAP Reconciliations” section for a reconciliation of this non-GAAP measure to the most directly comparable GAAP measure, income (loss) before income taxes per barrel.
42
|
Thousands of Barrels Daily
|
||||||||
|
|
Year Ended December 31
|
|||||||
|
|
2018
|
|
2017
|
|
2016
|
|
||
|
Operating Statistics
|
||||||||
|
Refining operations*
|
||||||||
|
Atlantic Basin/Europe
|
||||||||
|
Crude oil capacity
|
537
|
|
520
|
|
566
|
|
||
|
Crude oil processed
|
477
|
|
494
|
|
568
|
|
||
|
Capacity utilization (percent)
|
89
|
%
|
95
|
|
100
|
|
||
|
Refinery production
|
514
|
|
553
|
|
607
|
|
||
|
Gulf Coast
|
||||||||
|
Crude oil capacity
|
752
|
|
743
|
|
743
|
|
||
|
Crude oil processed
|
717
|
|
709
|
|
704
|
|
||
|
Capacity utilization (percent)
|
95
|
%
|
95
|
|
95
|
|
||
|
Refinery production
|
808
|
|
789
|
|
783
|
|
||
|
Central Corridor
|
||||||||
|
Crude oil capacity
|
493
|
|
493
|
|
493
|
|
||
|
Crude oil processed
|
507
|
|
467
|
|
485
|
|
||
|
Capacity utilization (percent)
|
103
|
%
|
95
|
|
98
|
|
||
|
Refinery production
|
530
|
|
489
|
|
506
|
|
||
|
West Coast
|
||||||||
|
Crude oil capacity
|
364
|
|
360
|
|
360
|
|
||
|
Crude oil processed
|
343
|
|
342
|
|
318
|
|
||
|
Capacity utilization (percent)
|
94
|
%
|
95
|
|
88
|
|
||
|
Refinery production
|
373
|
|
368
|
|
345
|
|
||
|
Worldwide
|
||||||||
|
Crude oil capacity
|
2,146
|
|
2,116
|
|
2,162
|
|
||
|
Crude oil processed
|
2,044
|
|
2,012
|
|
2,075
|
|
||
|
Capacity utilization (percent)
|
95
|
%
|
95
|
|
96
|
|
||
|
Refinery production
|
2,225
|
|
2,199
|
|
2,241
|
|
||
|
* Includes our share of equity affiliates.
|
||||||||
The Refining segment refines crude oil and other feedstocks into petroleum products (such as gasoline, distillates and aviation fuels) at
13
refineries in the United States and Europe.
2018
vs.
2017
Pre-tax income for the Refining segment
increased
$2,459 million
in
2018
, compared with
2017
. The increase was primarily due to higher realized refining margins, partially offset by a noncash gain of $423 million recognized on the consolidation of Merey Sweeny in February 2017.
The increased realized refining margins were primarily driven by higher feedstock advantage, improved premium coke margins, and increased optimization benefits from using our integrated logistics network to capture market opportunities related to widening Bakken, Canadian and other inland crude differentials. Improved clean product differentials and lower renewable identification number (RIN) costs also benefited margins. These items were partially offset by a decline in market crack spreads.
See the “Executive Overview and Business Environment” section for information on industry crack spreads and other market factors impacting this year’s results.
Our worldwide refining crude oil capacity utilization rate was
95 percent
in both
2018
and
2017
.
43
2017
vs.
2016
Pre-tax income for the Refining segment
increased
$1,641 million
in
2017
, compared with
2016
. The increase was primarily due to higher realized refining margins and West Coast volumes, as well as a noncash gain of $423 million recognized on the consolidation of Merey Sweeny, partially offset by higher turnaround expenses, utilities costs and pension settlement expense. The higher realized refining margins primarily resulted from improved market crack spreads and secondary product margins, partially offset by lower feedstock advantage.
See
Note 5—Business Combinations
, in the Notes to Consolidated Financial Statements, for additional information on the consolidation of Merey Sweeny in February 2017 and the subsequent contribution of our ownership interest in Merey Sweeny to Phillips 66 Partners in October 2017.
Our worldwide refining crude oil capacity utilization rate was
95 percent
in
2017
, compared with
96 percent
in
2016
. The
decrease
was primarily attributable to higher turnaround activities and unplanned downtime, partially offset by improved market conditions.
44
Marketing and Specialties
|
Year Ended December 31
|
|||||||||
|
2018
|
|
2017
|
|
2016
|
|
||||
|
Millions of Dollars
|
|||||||||
|
Income Before Income Taxes
|
|||||||||
|
Marketing and Other
|
$
|
1,306
|
|
808
|
|
1,044
|
|
||
|
Specialties
|
251
|
|
212
|
|
217
|
|
|||
|
Total Marketing and Specialties
|
$
|
1,557
|
|
1,020
|
|
1,261
|
|
||
|
Dollars Per Barrel
|
|||||||||
|
Income Before Income Taxes
|
|||||||||
|
U.S.
|
$
|
1.21
|
|
0.89
|
|
1.15
|
|
||
|
International
|
5.00
|
|
2.23
|
|
2.36
|
|
|||
|
Realized Marketing Fuel Margins*
|
|||||||||
|
U.S.
|
$
|
1.62
|
|
1.48
|
|
1.64
|
|
||
|
International
|
6.87
|
|
4.21
|
|
4.05
|
|
|||
|
*
See the “Non-GAAP Reconciliations” section for a reconciliation of this non-GAAP measure to the most directly comparable GAAP measure, income before income taxes per barrel.
|
|||||||||
|
Dollars Per Gallon
|
|||||||||
|
U.S. Average Wholesale Prices*
|
|||||||||
|
Gasoline
|
$
|
2.20
|
|
1.87
|
|
1.62
|
|
||
|
Distillates
|
2.29
|
|
1.85
|
|
1.48
|
|
|||
|
* On third-party branded refined petroleum product sales, excluding excise taxes.
|
|||||||||
|
Thousands of Barrels Daily
|
|||||||||
|
Marketing Refined Petroleum Product Sales
|
|||||||||
|
Gasoline
|
1,195
|
|
1,246
|
|
1,238
|
|
|||
|
Distillates
|
975
|
|
931
|
|
947
|
|
|||
|
Other
|
18
|
|
18
|
|
16
|
|
|||
|
2,188
|
|
2,195
|
|
2,201
|
|
||||
The M&S segment purchases for resale and markets refined petroleum products (such as gasoline, distillates and aviation fuels), mainly in the United States and Europe. In addition, this segment includes the manufacturing and marketing of specialty products (such as base oils and lubricants), as well as power generation operations.
2018
vs.
2017
Pre-tax income from the M&S segment
increased
$537 million
in
2018
, compared with
2017
. The increase was primarily due to higher realized marketing fuel margins, mainly driven by international marketing, benefits from the retroactive extension of the 2017 U.S. biodiesel blender’s tax incentive in early 2018, as well as improved specialty product service margins.
See the “Executive Overview and Business Environment” section for information on marketing fuel margins and other market factors impacting
2018
results.
2017
vs.
2016
Pre-tax income from the M&S segment
decreased
$241 million
in
2017
, compared with
2016
. The decrease was primarily due to lower realized marketing margins, as well as the absence of U.S. biofuel tax credits recognized in 2016.
45
Corporate and Other
|
|
Millions of Dollars
|
||||||||
|
Year Ended December 31
|
|||||||||
|
|
2018
|
|
2017
|
|
2016
|
|
|||
|
Income (Loss) Before Income Taxes
|
|||||||||
|
Net interest expense
|
$
|
(459
|
)
|
(408
|
)
|
(322
|
)
|
||
|
Corporate general and administrative expenses
|
(257
|
)
|
(268
|
)
|
(246
|
)
|
|||
|
Technology
|
(88
|
)
|
(94
|
)
|
(91
|
)
|
|||
|
Other
|
(49
|
)
|
(125
|
)
|
(88
|
)
|
|||
|
Total Corporate and Other
|
$
|
(853
|
)
|
(895
|
)
|
(747
|
)
|
||
2018
vs.
2017
Net interest expense consists of interest and financing expense, net of interest income and capitalized interest. Net interest expense
increased
$51 million
in
2018
, compared with
2017
, mainly due to higher average debt principal balances from our issuance of senior notes totaling $1,500 million in March 2018 and Phillips 66 Partners’ issuance of senior notes totaling $650 million in October 2017. This increase was partially offset by higher interest income.
The category “Other” includes environmental costs associated with sites no longer in operation, foreign currency transaction gains and losses and other costs not directly associated with an operating segment. The
$76 million
decrease in other costs in 2018, compared with 2017, was primarily attributable to lower environmental-related expenses and higher equity earnings from our share of income tax benefits recorded by equity affiliates due to the enactment of the Tax Act in December 2017.
2017
vs.
2016
Net interest expense
increased
$86 million
in
2017
, compared with
2016
, primarily driven by lower capitalized interest due to the completion of major projects, including completion of the Freeport LPG Export Terminal project in late 2016, and higher interest expense driven by higher average debt principal balances due to Phillips 66 Partners’ debt issuances in October 2017 and 2016.
Corporate general and administrative expenses
increased
$22 million
in
2017
, compared with
2016
, due to higher employee-related costs.
Other costs
increased
$37 million
in
2017
, compared with
2016
, mainly due to higher environmental-related expenses.
46
CAPITAL RESOURCES AND LIQUIDITY
Financial Indicators
|
Millions of Dollars, Except as Indicated
|
|||||||||
|
2018
|
|
2017
|
|
2016
|
|
||||
|
Cash and cash equivalents
|
$
|
3,019
|
|
3,119
|
|
2,711
|
|
||
|
Net cash provided by operating activities
|
7,573
|
|
3,648
|
|
2,963
|
|
|||
|
Short-term debt
|
67
|
|
41
|
|
550
|
|
|||
|
Total debt
|
11,160
|
|
10,110
|
|
10,138
|
|
|||
|
Total equity
|
27,153
|
|
27,428
|
|
23,725
|
|
|||
|
Percent of total debt to capital*
|
29
|
%
|
27
|
|
30
|
|
|||
|
Percent of floating-rate debt to total debt
|
11
|
%
|
11
|
|
3
|
|
|||
|
* Capital includes total debt and total equity.
|
|||||||||
To meet our short- and long-term liquidity requirements, we look to a variety of funding sources but rely primarily on cash generated from operating activities. Additionally, Phillips 66 Partners has raised funds for its growth activities through debt and equity financings. During
2018
, we generated
$7.6 billion
in cash from operations and raised net proceeds of
$1.5 billion
from the issuance of senior notes. We used this available cash primarily for repurchases of our common stock of
$4.6 billion
; capital expenditures and investments of
$2.6 billion
; dividend payments on our common stock of
$1.4 billion
; and the early repayment of
$550 million
of debt. During
2018
, cash and cash equivalents
decreased
by
$100 million
, to
$3.0 billion
.
In addition to cash flows from operating activities, we rely on our commercial paper and credit facility programs, asset sales and our ability to issue debt securities to support our short- and long-term liquidity requirements. We believe current cash and cash equivalents and cash generated by operations, together with access to external sources of funds as described below under “Significant Sources of Capital,” will be sufficient to meet our funding requirements in the near and long term, including our capital spending, dividend payments, defined benefit plan contributions, debt repayment and share repurchases.
Significant Sources of Capital
Operating Activities
During
2018
, cash of
$7,573 million
was provided by operating activities, a
108 percent
increase
compared with
2017
. The
increase
was primarily attributable to higher realized refining and marketing margins, increased distributions from our equity affiliates and lower employee benefit plan contributions. These increases were partially offset by unfavorable working capital impacts primarily driven by the effects of changes in commodity prices and the timing of payments and collections.
During
2017
, cash of
$3,648 million
was provided by operating activities, a
23 percent
increase
compared with
2016
. The
increase
was primarily attributable to improved operating results due to higher realized refining margins and increased distributions from our equity affiliates. These increases were partially offset by working capital changes, reflecting the negative impact of building inventory at higher commodity prices and timing of refining payables payments, as well as lower marketing margins.
Our short- and long-term operating cash flows are highly dependent upon refining and marketing margins, NGL prices and chemicals margins. Prices and margins in our industry are typically volatile, and are driven by market conditions over which we have little or no control. Absent other mitigating factors, as these prices and margins fluctuate, we would expect a corresponding change in our operating cash flows.
47
The level and quality of output from our refineries also impacts our cash flows. Factors such as operating efficiency, maintenance turnarounds, market conditions, feedstock availability and weather conditions can affect output. We actively manage the operations of our refineries, and any variability in their operations typically has not been as significant to cash flows as that caused by margins and prices. Our worldwide refining crude oil capacity utilization was
95 percent
in both
2018
and
2017
.
Equity Affiliates
Our operating cash flows are also impacted by distribution decisions made by our equity affiliates, including DCP Midstream, CPChem and WRB. Over the three years ended December 31,
2018
, we received aggregate distributions from our equity affiliates of
$4,712 million
, including
$201 million
from DCP Midstream,
$1,603 million
from CPChem and
$1,124 million
from WRB. CPChem resumed distributions to us in the first quarter of 2018 following the return to full operations of its Cedar Bayou facility post-Hurricane Harvey and the start-up of its new U.S. Gulf Coast petrochemicals assets. We cannot control the amount or timing of future distributions from equity affiliates; therefore, future distributions by these and other equity affiliates are not assured.
Phillips 66 Partners
In 2013, we formed Phillips 66 Partners, a publicly traded MLP, to own, operate, develop and acquire primarily fee-based midstream assets.
Ownership
At
December 31, 2018
, we owned a
54 percent
limited partner interest and a
2 percent
general partner interest in Phillips 66 Partners, while the public owned a
44 percent
limited partner interest and
13.8 million
perpetual convertible preferred units. We consolidate Phillips 66 Partners as a variable interest entity for financial reporting purposes. See
Note 27—Phillips 66 Partners LP
, in the Notes to Consolidated Financial Statements, for additional information on why we consolidate the partnership. As a result of this consolidation, the public common and preferred unitholders’ interests in Phillips 66 Partners are reflected as noncontrolling interests of
$2,469 million
in our consolidated balance sheet at December 31,
2018
.
Debt and Equity Financings
During the three years ended December 31,
2018
, Phillips 66 Partners raised net proceeds of approximately
$4.1 billion
from the following third-party debt and equity offerings:
|
•
|
In June 2018, Phillips 66 Partners completed its initial
$250 million
continuous offering of common units, or at-the-market (ATM) program, and commenced issuing common units under its second
$250 million
ATM program. Since inception in June 2016 through December 31, 2018, net proceeds of
$320 million
have been received under these programs.
|
|
•
|
In October 2017, Phillips 66 Partners received net proceeds of $643 million from the issuance of $500 million of 3.750% Senior Notes due March 2028 and $150 million of 4.680% Senior Notes due February 2045.
|
|
•
|
In October 2017, Phillips 66 Partners received net proceeds of $737 million from a private placement of 13,819,791 perpetual convertible preferred units, at a price of $54.27 per unit.
|
|
•
|
In October 2017, Phillips 66 Partners received net proceeds of $295 million from a private placement of 6,304,204 common units, at a price of $47.59 per unit.
|
|
•
|
In October 2016, Phillips 66 Partners received net proceeds of $1,111 million from the issuance of $500 million of 3.550% Senior Notes due October 2026 and $625 million of 4.900% Senior Notes due October 2046.
|
|
•
|
In August 2016, Phillips 66 Partners received net proceeds of $299 million from a public offering of 6,000,000 common units, at a price of $50.22 per unit.
|
|
•
|
In May 2016, Phillips 66 Partners received net proceeds of $656 million from a public offering of 12,650,000 common units, at a price of $52.40 per unit.
|
48
Phillips 66 Partners primarily used these net proceeds to fund the cash portion of acquisitions of assets from Phillips 66 and for capital spending and investments. See
Note 27—Phillips 66 Partners LP
, in the Notes to Consolidated Financial Statements, for additional information on Phillips 66 Partners.
Credit Facilities and Commercial Paper
Phillips 66 has a
$5 billion
revolving credit facility that extends until October 2021. This facility may be used for direct bank borrowings, as support for issuances of letters of credit, or as support for our commercial paper program. The facility is with a broad syndicate of financial institutions and contains covenants that are usual and customary for an agreement of this type for comparable commercial borrowers, including a maximum consolidated net debt-to-capitalization ratio of
60 percent
. The agreement has customary events of default, such as nonpayment of principal when due; nonpayment of interest, fees or other amounts; violation of covenants; cross-payment default and cross-acceleration (in each case, to indebtedness in excess of a threshold amount); and a change of control. Borrowings under the facility will incur interest at the London Interbank Offered Rate (LIBOR) plus a margin based on the credit rating of our senior unsecured long-term debt as determined from time to time by Standard & Poor’s Financial Services LLC (S&P) and Moody’s Investors Service, Inc. (Moody’s). The facility also provides for customary fees, including administrative agent fees and commitment fees. At December 31,
2018
,
no
amount had been drawn under this revolving credit agreement.
Phillips 66 has a
$5 billion
commercial paper program for short-term working capital needs that is supported by its revolving credit facility. Commercial paper maturities are generally limited to
90
days. At December 31,
2018
,
no
borrowings were outstanding under the commercial paper program.
Phillips 66 Partners has a
$750 million
revolving credit facility that extends until October 2021. The Phillips 66 Partners facility is with a broad syndicate of financial institutions and contains covenants that are usual and customary for an agreement of this type for comparable commercial borrowers. At Phillips 66 Partners’ option, outstanding borrowings under this facility bear interest at either i) the Eurodollar rate plus a margin based on its credit rating; or ii) the base rate (as described in the facility agreement) plus a margin based on its credit rating. Eurodollar rate borrowings are due on the facility’s termination date, while base rate borrowings are due the earlier of the facility’s termination date or the fourteenth business day after such borrowings were made. At December 31,
2018
, Phillips 66 Partners had borrowings of
$125 million
outstanding under this facility.
Other Debt Issuances and Financings
On March 1, 2018, Phillips 66 closed on a public offering of
$1,500 million
aggregate principal amount of unsecured notes consisting of:
|
•
|
$500 million
of floating-rate Senior Notes due February 2021. Interest on these notes is equal to the three-month LIBOR plus
0.60%
per annum and is payable quarterly in arrears on February 26, May 26, August 26 and November 26, beginning on May 29, 2018.
|
|
•
|
$800 million
of
3.900%
Senior Notes due March 2028. Interest on these notes is payable semiannually on March 15 and September 15 of each year, beginning on September 15, 2018.
|
|
•
|
An additional
$200 million
of our
4.875%
Senior Notes due November 2044. Interest on these notes is payable semiannually on May 15 and November 15 of each year, beginning on May 15, 2018.
|
Phillips 66 used the net proceeds from the issuance of these notes and cash on hand to repay commercial paper borrowings during the first quarter of 2018, and for general corporate purposes. The commercial paper borrowings during the first quarter of 2018, were primarily used to repurchase shares of our common stock. See
Note 17—Equity
, in the Notes to Consolidated Financial Statements, for additional information.
In addition, we have capital lease obligations related to equipment and transportation assets, and the use of an oil terminal in the United Kingdom. These leases mature within the next fifteen years. The present value of our minimum capital lease payments for these obligations as of December 31,
2018
, was
$184 million
.
49
Availability of Debt and Equity Financing
Our senior unsecured long-term debt has been rated investment grade by S&P (BBB+) and Moody’s (A3). We do not have any ratings triggers on any of our corporate debt that would cause an automatic default, and thereby impact our access to liquidity, in the event of a downgrade of our credit rating. If our credit rating deteriorated to a level prohibiting us from accessing the commercial paper market, we would expect to be able to access funds under our liquidity facilities mentioned above.
Off-Balance Sheet Arrangements
Under the operating lease agreement on our headquarters facility in Houston, Texas, we have a residual value guarantee with a maximum future exposure of
$554 million
at December 31, 2018. The operating lease term ends in
June 2021
and provides us the option, at the end of the lease term, to request to renew the lease, purchase the facility or assist the lessor in marketing it for resale. We also have residual value guarantees associated with railcar and airplane leases with maximum future exposures totaling
$300 million
at December 31, 2018, which have remaining terms of up to
five
years.
In addition, we have guarantees outstanding related to certain joint venture debt and purchase obligations, which have remaining terms of up to
seven
years. The maximum potential amount of future payments to third parties under these guarantees was approximately
$304 million
at December 31, 2018.
See
Note 13—Guarantees
, in the Notes to Consolidated Financial Statements, for additional information on our guarantees.
Capital Requirements
Capital Expenditures and Investments
For information about our capital expenditures and investments, see the “Capital Spending” section below.
Debt Financing
Our debt balance at December 31,
2018
, was
$11.2 billion
and our total debt-to-capital ratio was
29 percent
.
In 2018, Phillips 66 made early debt repayments totaling
$550 million
, comprised of
$300 million
floating-rate notes due April 2019 and
$250 million
of the
$450 million
outstanding under its
three
-year term loan facility due April 2020.
See
Note 12—Debt
, in the Notes to Consolidated Financial Statements, for our annual debt maturities over the next five years and more information on debt repayments.
Dividends
On February 6, 2019, our Board of Directors declared a quarterly cash dividend of
$0.80
per common share, payable March 1, 2019, to holders of record at the close of business on February 19, 2019. We are forecasting a double-digit percentage increase in our quarterly dividend rate in 2019.
Share Repurchases
Since July 2012, our Board of Directors has, at various times, authorized repurchases of our outstanding common stock under our share repurchase program, which aggregate to a total authorization of up to
$12 billion
. The share repurchases are expected to be funded primarily through available cash. The shares will be repurchased from time to time in the open market at our discretion, subject to market conditions and other factors, and in accordance with applicable regulatory requirements. Since the inception of our share repurchase program in 2012 through
December 31, 2018
, we have repurchased approximately
137 million
shares at an aggregate cost of
$10.4 billion
. Shares of stock repurchased are held as treasury shares.
50
In February 2018, we entered into a Stock Purchase and Sale Agreement (Purchase Agreement) with Berkshire Hathaway Inc. and National Indemnity Company, a wholly owned subsidiary of Berkshire Hathaway, to repurchase
35 million
shares of Phillips 66 common stock for an aggregate purchase price of
$3.3 billion
. Pursuant to the Purchase Agreement, the purchase price per share of
$93.725
was based on the volume-weighted-average price of our common stock on the New York Stock Exchange on February 13, 2018. The transaction closed in February 2018. We funded the repurchase with cash of
$1.9 billion
and borrowings of
$1.4 billion
under our commercial paper program. These borrowings were subsequently refinanced through a public offering of senior notes. This specific share repurchase transaction was separately authorized by our Board of Directors and therefore did not impact previously announced authorizations under our share repurchase program, which are discussed above.
Employee Benefit Plan Contributions
For the year ended December 31, 2018, we contributed
$150 million
to our U.S. employee benefit plans and
$34 million
to our international employee benefit plans. In 2019, we expect to contribute approximately
$90 million
to those plans.
51
Contractual Obligations
The following table summarizes our aggregate contractual fixed and variable obligations as of
December 31, 2018
:
|
Millions of Dollars
|
|||||||||||||||
|
Payments Due by Period
|
|||||||||||||||
|
|
Total
|
|
Up to
1 Year
|
|
Years
2-3
|
|
Years
4-5
|
|
After
5 Years
|
|
|||||
|
Debt obligations (a)
|
$
|
11,076
|
|
50
|
|
1,450
|
|
2,000
|
|
7,576
|
|
||||
|
Capital lease obligations
|
184
|
|
17
|
|
26
|
|
22
|
|
119
|
|
|||||
|
Total debt
|
11,260
|
|
67
|
|
1,476
|
|
2,022
|
|
7,695
|
|
|||||
|
Interest on debt
|
7,284
|
|
477
|
|
905
|
|
743
|
|
5,159
|
|
|||||
|
Operating lease obligations
|
1,581
|
|
509
|
|
573
|
|
207
|
|
292
|
|
|||||
|
Purchase obligations (b)
|
71,834
|
|
31,361
|
|
8,547
|
|
5,317
|
|
26,609
|
|
|||||
|
Other long-term liabilities (c)
|
|||||||||||||||
|
Asset retirement obligations
|
261
|
|
7
|
|
44
|
|
20
|
|
190
|
|
|||||
|
Accrued environmental costs
|
447
|
|
76
|
|
132
|
|
89
|
|
150
|
|
|||||
|
Repatriation income tax liability (d)
|
181
|
|
14
|
|
32
|
|
46
|
|
89
|
|
|||||
|
Total
|
$
|
92,848
|
|
32,511
|
|
11,709
|
|
8,444
|
|
40,184
|
|
||||
|
(a)
|
For additional information, see
Note 12—Debt
, in the Notes to Consolidated Financial Statements.
|
|
(b)
|
Represents any agreement to purchase goods or services that is enforceable, legally binding and specifies all significant terms. We expect these purchase obligations will be fulfilled with operating cash flows in the applicable maturity period. The majority of the purchase obligations are market-based contracts, including exchanges and futures, for the purchase of products such as crude oil and raw NGL. The products are used to supply our refineries and fractionators and optimize our supply chain. Product purchase commitments with third parties totaled
$31,242 million
. In addition,
$20,642 million
are product purchases from CPChem, mostly for fuel gas and natural gasoline over the remaining contractual term of
81
years, and product purchases of
$4,797 million
from DCP Midstream entities for NGL over the remaining contractual term of
ten
years.
|
Purchase obligations of
$4,832 million
are related to agreements to access and utilize the capacity of third-party equipment and facilities, including pipelines and product terminals, to transport, process, treat, and store products. The remainder is primarily our net share of purchase commitments for materials and services for jointly owned facilities where we are the operator.
|
(c)
|
Excludes pensions and unrecognized income tax benefits. From
2019
through
2023
, we expect to contribute an average of
$120 million
per year to our qualified and nonqualified pension and other postretirement benefit plans in the United States and an average of
$25 million
per year to our non-U.S. plans. The U.S. five-year average consists of approximately
$60 million
for
2019
and
$135 million
per year for the remaining four years. Our minimum funding in
2019
is expected to be
$60 million
in the United States and
$30 million
outside the United States. Unrecognized income tax benefits of
$23 million
were also excluded because the ultimate disposition and timing of any payments to be made with regard to such amounts are not reasonably estimable.
|
|
(d)
|
We elected to pay the one-time deemed repatriation income tax on foreign-sourced earnings, recognized as a result of the Tax Act enacted in December 2017, in installments over eight years beginning in 2018. The amount represents the remaining income tax liability.
|
52
Capital Spending
|
|
Millions of Dollars
|
|||||||||||
|
|
2019
Budget |
|
2018
|
|
2017
|
|
2016
|
|
||||
|
Capital Expenditures and Investments
|
||||||||||||
|
Midstream*
|
$
|
1,936
|
|
1,548
|
|
771
|
|
1,453
|
|
|||
|
Chemicals
|
—
|
|
—
|
|
—
|
|
—
|
|
||||
|
Refining
|
923
|
|
826
|
|
853
|
|
1,149
|
|
||||
|
Marketing and Specialties
|
161
|
|
125
|
|
108
|
|
98
|
|
||||
|
Corporate and Other
|
177
|
|
140
|
|
100
|
|
144
|
|
||||
|
$
|
3,197
|
|
2,639
|
|
1,832
|
|
2,844
|
|
||||
|
Selected Equity Affiliates**
|
||||||||||||
|
DCP Midstream
|
$
|
505
|
|
484
|
|
268
|
|
99
|
|
|||
|
CPChem
|
572
|
|
339
|
|
776
|
|
987
|
|
||||
|
WRB
|
165
|
|
156
|
|
126
|
|
164
|
|
||||
|
$
|
1,242
|
|
979
|
|
1,170
|
|
1,250
|
|
||||
* 2019 budget includes
$303 million
of capital expected to be cash funded by noncontrolling interests.
** Our share of joint venture’s self-funded capital spending.
Midstream
Capital spending in our Midstream segment during the three-year period ended December 31,
2018
, included:
|
•
|
Construction activities related to additional Gulf Coast fractionation capacity and Freeport LPG Export Terminal projects.
|
|
•
|
Construction activities related to increasing storage capacity at our crude oil and refined petroleum products terminal located near Beaumont, Texas.
|
|
•
|
Development of the Gray Oak Pipeline system, which will provide crude oil transportation from the Permian Basin and Eagle Ford to destinations in the Corpus Christi and Sweeny/Freeport markets on the Texas Gulf Coast. At December 31, 2018, Phillips 66 Partners had a 48.75 percent effective ownership interest in this pipeline system. In February 2019, another party exercised its option to acquire an interest in the pipeline system that reduced Phillips 66 Partners’ effective ownership interest to 42.25 percent.
|
|
•
|
Development of the Bayou Bridge Pipeline by Phillips 66 Partners’ 40-percent-owned joint venture.
|
|
•
|
Acquisition by Phillips 66 Partners of certain southeast Louisiana NGL logistics assets comprising approximately 500 miles of pipelines and a storage cavern connecting multiple fractionation facilities, refineries and a petrochemical facility.
|
|
•
|
Development of the Bakken Pipeline system project, in which Phillips 66 Partners owns a 25 percent interest.
|
|
•
|
Expansion activities on the Phillips 66 Partners’ 33-percent-owned Sand Hills Pipeline including investment in the transportation of NGL from the Permian Basin to the Texas Gulf Coast.
|
|
•
|
Construction activities related to Phillips 66 Partners’ new isomerization unit at the Lake Charles Refinery.
|
|
•
|
Expansion activities on the Phillips 66 Partners’ 50-percent owned STACK Pipeline joint venture.
|
|
•
|
Construction activities by joint ventures of Phillips 66 Partners in the Bakken production area of North Dakota, including the Palermo Rail Terminal, Sacagawea Crude Pipeline, the New Town injection point, Keene CDP Terminal and Sacagawea Gas Pipeline.
|
|
•
|
Spending associated with other return, reliability and maintenance projects in our Transportation and NGL business.
|
53
During the three-year period ended December 31,
2018
, DCP Midstream’s self-funded capital expenditures and investments were
$1.7 billion
on a 100 percent basis. Capital spending during this period was primarily for expansion of owned and joint venture natural gas processing and pipeline capacity.
In
2018
, REX repaid
$550 million
of its debt, reducing its total debt to approximately
$2 billion
. REX funded the repayment through member cash contributions, of which our
25 percent
share was approximately
$138 million
.
Chemicals
During the three-year period ended December 31,
2018
, CPChem had a self-funded capital program, and thus required no new capital infusions from us or our co-venturer. During this period, on a 100 percent basis, CPChem’s capital expenditures and investments were
$4.2 billion
. Capital spending during this period was primarily for the U.S. Gulf Coast Petrochemicals Project.
Refining
Capital spending for the Refining segment during the three-year period ended December 31,
2018
, was
$2.8 billion
, primarily for air emission reduction and clean fuels projects to meet new environmental standards, refinery upgrade projects to increase processing of advantaged crudes and improve product yields, improvements to the operating integrity of key processing units, and safety-related projects. Generally, our equity affiliates in the Refining segment are expected to have self-funding capital programs. During this three-year period, on a 100 percent basis, WRB’s capital expenditures and investments were
$892 million
.
Key projects completed during the three-year period included:
|
•
|
Installation of facilities to improve clean product yield at the Sweeny, Lake Charles, Ponca City, and Bayway refineries, as well as the jointly owned Wood River Refinery.
|
|
•
|
Installation of facilities to improve processing of advantaged crudes at the Billings and Lake Charles refineries, as well as the jointly owned Wood River Refinery.
|
|
•
|
Installation of facilities to comply with U.S. Environmental Protection Agency (EPA) Tier 3 gasoline regulations at the Alliance, Lake Charles, Bayway and Sweeny refineries, as well as the jointly owned Wood River Refinery.
|
|
•
|
Installation of a crude tank to increase accessibility of waterborne crude at the Los Angeles Refinery.
|
Major construction activities in progress include:
|
•
|
Installation of facilities to comply with EPA Tier 3 gasoline regulations at the Ferndale Refinery.
|
|
•
|
Installation of facilities to improve product value at the Sweeny and Lake Charles refineries, as well as the jointly owned Borger Refinery.
|
|
•
|
Installation of facilities for U.K. biofuels compliance at the Humber Refinery.
|
Marketing and Specialties
Capital spending for the M&S segment during the three-year period ended December 31,
2018
, was primarily for the acquisition and further development of new international retail sites. In addition, capital was used for reliability and maintenance projects at our lubricants and power generation facilities.
Corporate and Other
Capital spending for Corporate and Other during the three-year period ended December 31,
2018
, was primarily for information technology and facilities.
54
2019
Budget
Our
2019
capital budget is
$3.2 billion
including Phillips 66 Partners’ expected capital spending of
$0.9 billion
. This excludes our portion of planned capital spending by joint ventures DCP Midstream, CPChem and WRB totaling
$1.2 billion
, all of which is expected to be self-funded. Phillips 66 Partners’ expected capital spending includes
$0.3 billion
of capital expected to be cash funded by noncontrolling interests.
The Midstream capital budget of
$1.9 billion
includes 300,000 barrels per day of additional fractionation capacity at the Sweeny Hub, as well as ongoing expansion of the Beaumont Terminal and pipeline investments providing integration across our value chain. The Midstream capital budget also includes growth capital at Phillips 66 Partners to support organic projects, including the Gray Oak Pipeline, South Texas Gateway Terminal, Clemens Caverns expansion, an isomerization unit at the Phillips 66 Lake Charles Refinery, and the Sweeny to Pasadena Pipeline. Refining’s capital budget of
$0.9 billion
is primarily directed toward reliability, safety and environmental projects, as well as high-return projects to enhance the yield of higher-value products, including an upgrade of the fluid catalytic cracking unit at the Sweeny Refinery, and other low-capital, quick-payout projects. In M&S, we plan to invest approximately
$0.2 billion
of growth and sustaining capital; the investment will further grow and enhance retail sites in Europe. In Corporate and Other, we plan to fund approximately
$0.2 billion
in projects primarily related to information technology projects, including implementation of a new enterprise resource planning system.
Contingencies
A number of lawsuits involving a variety of claims that arose in the ordinary course of business have been filed against us or are subject to indemnifications provided by us. We also may be required to remove or mitigate the effects on the environment of the placement, storage, disposal or release of certain chemical, mineral and petroleum substances at various active and inactive sites. We regularly assess the need for financial recognition or disclosure of these contingencies. In the case of all known contingencies (other than those related to income taxes), we accrue a liability when the loss is probable and the amount is reasonably estimable. If a range of amounts can be reasonably estimated and no amount within the range is a better estimate than any other amount, then the minimum of the range is accrued. We do not reduce these liabilities for potential insurance or third-party recoveries. If applicable, we accrue receivables for probable insurance or other third-party recoveries. In the case of income-tax-related contingencies, we use a cumulative probability-weighted loss accrual in cases where sustaining a tax position is less than certain.
Based on currently available information, we believe it is remote that future costs related to known contingent liability exposures will exceed current accruals by an amount that would have a material adverse impact on our consolidated financial statements. As we learn new facts concerning contingencies, we reassess our position both with respect to accrued liabilities and other potential exposures. Estimates particularly sensitive to future changes include contingent liabilities recorded for environmental remediation, tax and legal matters. Estimated future environmental remediation costs are subject to change due to such factors as the uncertain magnitude of cleanup costs, the unknown time and extent of such remedial actions that may be required, and the determination of our liability in proportion to that of other potentially responsible parties. Estimated future costs related to tax and legal matters are subject to change as events evolve and as additional information becomes available during the administrative and litigation processes.
Legal and Tax Matters
Our legal and tax matters are handled by our legal and tax organizations. These organizations apply their knowledge, experience and professional judgment to the specific characteristics of our cases and uncertain tax positions. We employ a litigation management process to manage and monitor the legal proceedings against us. Our process facilitates the early evaluation and quantification of potential exposures in individual cases and enables the tracking of those cases that have been scheduled for trial and/or mediation. Based on professional judgment and experience in using these litigation management tools and available information about current developments in all our cases, our legal organization regularly assesses the adequacy of current accruals and determines if adjustment of existing accruals, or establishment of new accruals, is required. In the case of income-tax-related contingencies, we monitor tax legislation and court decisions, the status of tax audits and the statute of limitations within which a taxing authority can assert a liability. See
Note 21—Income Taxes
, in the Notes to Consolidated Financial Statements, for additional information about income-tax-related contingencies.
55
Environmental
Like other companies in our industry, we are subject to numerous international, federal, state and local environmental laws and regulations. Among the most significant of these international and federal environmental laws and regulations are the:
|
•
|
U.S. Federal Clean Air Act, which governs air emissions.
|
|
•
|
U.S. Federal Clean Water Act, which governs discharges into water bodies.
|
|
•
|
European Union Regulation for Registration, Evaluation, Authorization and Restriction of Chemicals (REACH), which governs the manufacture, placing on the market or use of chemicals.
|
|
•
|
U.S. Federal Comprehensive Environmental Response, Compensation and Liability Act (CERCLA), which imposes liability on generators, transporters and arrangers of hazardous substances at sites where hazardous substance releases have occurred or are threatening to occur.
|
|
•
|
U.S. Federal Resource Conservation and Recovery Act (RCRA), which governs the treatment, storage and disposal of solid waste.
|
|
•
|
U.S. Federal Emergency Planning and Community Right-to-Know Act (EPCRA), which requires facilities to report toxic chemical inventories to local emergency planning committees and response departments.
|
|
•
|
U.S. Federal Oil Pollution Act of 1990 (OPA90), under which owners and operators of onshore facilities and pipelines as well as owners and operators of vessels are liable for removal costs and damages that result from a discharge of oil into navigable waters of the United States.
|
|
•
|
European Union Trading Directive resulting in the European Union Emissions Trading Scheme (EU ETS), which uses a market-based mechanism to incentivize the reduction of greenhouse gas (GHG) emissions.
|
These laws and their implementing regulations set limits on emissions and, in the case of discharges to water, establish water quality limits. They also, in most cases, require permits in association with new or modified operations. These permits can require an applicant to collect substantial information in connection with the application process, which can be expensive and time consuming. In addition, there can be delays associated with notice and comment periods and the agency’s processing of the application. Many of the delays associated with the permitting process are beyond the control of the applicant.
Many states and foreign countries where we operate also have, or are developing, similar environmental laws and regulations governing these same types of activities. While similar, in some cases these regulations may impose additional, or more stringent, requirements that can add to the cost and difficulty of developing infrastructure and marketing and transporting products across state and international borders. For example, in California the South Coast Air Quality Management District (SCAQMD) approved amendments to the Regional Clean Air Incentives Market (RECLAIM) that became effective in 2016, which require a phased reduction of nitrogen oxide emissions through 2022 and affect refineries in the Los Angeles metropolitan area. In 2017, SCAQMD required additional nitrogen dioxide emissions reductions through 2025 and is now promulgating new regulations to replace the RECLAIM program with a traditional command and controls regulatory regime.
The ultimate financial impact arising from environmental laws and regulations is neither clearly known nor easily determinable as new standards, such as air emission standards, water quality standards and stricter fuel regulations, continue to evolve. However, environmental laws and regulations, including those that may arise to address concerns about global climate change, are expected to continue to have an increasing impact on our operations in the United States and in other countries in which we operate. Notable areas of potential impacts include air emission compliance and remediation obligations in the United States.
An example of this in the fuels area is the Energy Independence and Security Act of 2007 (EISA). It requires fuel producers and importers to provide additional renewable fuels for transportation motor fuels and stipulates a mix of various types to be included through 2022. We have met the increasingly stringent requirements to date while establishing implementation, operating and capital strategies, along with advanced technology development, to address projected future requirements. It is uncertain how various future requirements contained in EISA, and the regulations promulgated thereunder, may be implemented and what their full impact may be on our operations. For the 2019 compliance year, the EPA has set volumes of advanced and total renewable fuel at higher levels than in previous years (the 2019 compliance year volumes are approximately 3 percent higher than those required for the 2018 and 2017 compliance years); it is uncertain if these increased obligations will be achievable by fuel producers and shippers without
56
drawing on the RIN bank. EISA requires EPA to reset the statutory volumes if EPA waives the volumes by 20 percent or more for two consecutive years. The 2019 rulemaking triggered this requirement and EPA is currently working on rulemaking that will set volumes for 2020 through 2022. Additionally, we may experience a decrease in demand for refined petroleum products due to the regulatory program as currently promulgated. This program continues to be the subject of possible Congressional review and re-promulgation in revised form, and the EPA’s regulations pertaining to the 2014 through 2018 compliance years are subject to legal challenge, further creating uncertainty regarding renewable fuel volume requirements and obligations. Additionally, the market for RINs has been the subject of fraudulent third-party activity, and it is reasonably possible that some RINs that we have purchased may be determined to be invalid. Should that occur, we could incur costs to replace those fraudulent RINs. Although the cost for replacing any fraudulently marketed RINs is not reasonably estimable at this time, we would not expect to incur the full financial impact of fraudulent RINs replacement costs in any single interim or annual period, and would not expect such costs to have a material impact on our results of operations or financial condition.
We also are subject to certain laws and regulations relating to environmental remediation obligations associated with current and past operations. Such laws and regulations include CERCLA and RCRA and their state equivalents. Remediation obligations include cleanup responsibility arising from petroleum releases from underground storage tanks located at numerous previously and currently owned and/or operated petroleum-marketing outlets throughout the United States. Federal and state laws require contamination caused by such underground storage tank releases be assessed and remediated to meet applicable standards. In addition to other cleanup standards, many states have adopted cleanup criteria for methyl tertiary-butyl ether for both soil and groundwater.
At RCRA-permitted facilities, we are required to assess environmental conditions. If conditions warrant, we may be required to remediate contamination caused by prior operations. In contrast to CERCLA, which is often referred to as “Superfund,” the cost of corrective action activities under RCRA corrective action programs typically is borne solely by us. We anticipate increased expenditures for RCRA remediation activities may be required, but such annual expenditures for the near term are not expected to vary significantly from the range of such expenditures we have experienced over the past few years. Longer-term expenditures are subject to considerable uncertainty and may fluctuate significantly.
We occasionally receive requests for information or notices of potential liability from the EPA and state environmental agencies alleging that we are a potentially responsible party under CERCLA or an equivalent state statute. On occasion, we also have been made a party to cost recovery litigation by those agencies or by private parties. These requests, notices and lawsuits assert potential liability for remediation costs at various sites that typically are not owned by us, but allegedly contain wastes attributable to our past operations. As of
December 31, 2017
, we reported that we had been notified of potential liability under CERCLA and comparable state laws at
31
sites within the United States. During
2018
, we were notified of
one
new site,
one
previously resolved site that was returned to active status,
four
sites that were deemed resolved and closed, and
two
sites that were deemed resolved but not closed, leaving
27
unresolved sites with potential liability at
December 31, 2018
.
For most Superfund sites, our potential liability will be significantly less than the total site remediation costs because the percentage of waste attributable to us, versus that attributable to all other potentially responsible parties, is relatively low. Although liability of those potentially responsible is generally joint and several for federal sites and frequently so for state sites, other potentially responsible parties at sites where we are a party typically have had the financial strength to meet their obligations, and where they have not, or where potentially responsible parties could not be located, our share of liability has not increased materially. Many of the sites for which we are potentially responsible are still under investigation by the EPA or the state agencies concerned. Prior to actual cleanup, those potentially responsible normally assess site conditions, apportion responsibility and determine the appropriate remediation. In some instances, we may have no liability or attain a settlement of liability. Actual cleanup costs generally occur after the parties obtain EPA or equivalent state agency approval of a remediation plan. There are relatively few sites where we are a major participant, and given the timing and amounts of anticipated expenditures, neither the cost of remediation at those sites nor such costs at all CERCLA sites, in the aggregate, is expected to have a material adverse effect on our competitive or financial condition.
Expensed environmental costs were
$690 million
in
2018
and are expected to be approximately
$740 million
and
$700 million
in
2019
and
2020
, respectively. Capitalized environmental costs were
$149 million
in
2018
and are expected to be approximately
$115 million
and
$125 million
, in
2019
and
2020
, respectively. This amount does not include capital expenditures made for another purpose that have an indirect benefit on environmental compliance.
57
Accrued liabilities for remediation activities are not reduced for potential recoveries from insurers or other third parties and are not discounted (except those assumed in a business combination, which we record on a discounted basis).
Many of these liabilities result from CERCLA, RCRA and similar state laws that require us to undertake certain investigative and remedial activities at sites where we conduct, or once conducted, operations or at sites where our generated waste was disposed. We also have accrued for a number of sites we identified that may require environmental remediation, but which are not currently the subject of CERCLA, RCRA or state enforcement activities. If applicable, we accrue receivables for probable insurance or other third-party recoveries. In the future, we may incur significant costs under both CERCLA and RCRA. Remediation activities vary substantially in duration and cost from site to site, depending on the mix of unique site characteristics, evolving remediation technologies, diverse regulatory agencies and enforcement policies, and the presence or absence of potentially liable third parties. Therefore, it is difficult to develop reasonable estimates of future site remediation costs.
Notwithstanding any of the foregoing, and as with other companies engaged in similar businesses, environmental costs and liabilities are inherent concerns in certain of our operations and products, and there can be no assurance that material costs and liabilities will not be incurred. However, we currently do not expect any material adverse effect on our results of operations or financial position as a result of compliance with current environmental laws and regulations.
Climate Change
There has been a broad range of proposed or promulgated state, national and international laws focusing on GHG emissions reduction, including various regulations proposed or issued by the EPA. These proposed or promulgated laws apply or could apply in states and/or countries where we have interests or may have interests in the future. Laws regulating GHG emissions continue to evolve, and while it is not possible to accurately estimate either a timetable for implementation or our future compliance costs relating to implementation, such laws potentially could have a material impact on our results of operations and financial condition as a result of increasing costs of compliance, lengthening project implementation and agency reviews, or reducing demand for certain hydrocarbon products. Examples of legislation or precursors for possible regulation that do or could affect our operations include:
|
•
|
EU ETS, which is part of the European Union’s policy to combat climate change and is a key tool for reducing industrial GHG emissions. EU ETS impacts factories, power stations and other installations across all EU member states.
|
|
•
|
California’s Global Warming Solutions Act, which requires the California Air Resources Board to develop regulations and market mechanisms that will target reduction of California’s GHG emissions by 25 percent by 2020 (as well as SB32, which requires further reduction of California's GHG emissions to 40 percent below the 1990 emission level by 2030, and AB398, which extends the California GHG emission cap-and-trade program through 2030). Other GHG emissions programs in the western U.S. states have been enacted or are under consideration or development, including amendments to California's Low Carbon Fuel Standard, Oregon's Low Carbon Fuel Standard, and Washington's carbon reduction programs.
|
|
•
|
The U.S. Supreme Court decision in
Massachusetts v. EPA
, 549 U.S. 497, 127 S. Ct. 1438 (2007), confirming that the EPA has the authority to regulate carbon dioxide as an “air pollutant” under the Federal Clean Air Act.
|
|
•
|
The EPA’s announcement on March 29, 2010 (published as “Interpretation of Regulations that Determine Pollutants Covered by Clean Air Act Permitting Programs,” 75 Fed. Reg. 17004 (April 2, 2010)), and the EPA’s and U.S. Department of Transportation’s joint promulgation of a Final Rule on April 1, 2010, that triggers regulation of GHGs under the Clean Air Act. These collectively may lead to more climate-based claims for damages, and may result in longer agency review time for development projects to determine the extent of potential climate change.
|
|
•
|
EPA's 2015 Final Rule regulating GHG emissions from existing fossil fuel-fired electrical generating units under the Federal Clean Air Act, commonly referred to as the Clean Power Plan, which remains the subject of litigation and administrative review.
|
|
•
|
Carbon taxes in certain jurisdictions.
|
|
•
|
GHG emission cap and trade programs in certain jurisdictions.
|
In the EU, the first phase of the EU ETS completed at the end of 2007 and Phase II was undertaken from 2008 through 2012. The current phase (Phase III) runs from 2013 through to 2020, with the main changes being reduced allocation of free allowances and increased auctioning of new allowances. Phillips 66 has assets that are subject to the EU ETS, and the company is actively engaged in minimizing any financial impact from the EU ETS.
58
From November 30 to December 12, 2015, more than 190 countries, including the United States, participated in the United Nations Climate Change Conference in Paris, France. The conference culminated in what is known as the “Paris Agreement,” which, upon certain conditions being met, entered into force on November 4, 2016. The Paris Agreement establishes a commitment by signatory parties to pursue domestic GHG emission reductions. In 2017, the President of the United States announced his intention to withdraw the United States from the Paris Agreement.
In the United States, some additional form of regulation is likely to be forthcoming in the future at the state or federal levels with respect to GHG emissions. Such regulation could take any of several forms that may result in the creation of additional costs in the form of taxes, the restriction of output, investments of capital to maintain compliance with laws and regulations, or required acquisition or trading of emission allowances. We are working to continuously improve operational and energy efficiency through resource and energy conservation throughout our operations.
Compliance with changes in laws and regulations that create a GHG emission trading program, GHG reduction requirements or carbon taxes could significantly increase our costs, reduce demand for fossil energy derived products, impact the cost and availability of capital and increase our exposure to litigation. Such laws and regulations could also increase demand for less carbon intensive energy sources.
An example of one such program is California’s cap and trade program, which was promulgated pursuant to the State’s Global Warming Solutions Act. The program had been limited to certain stationary sources, which include our refineries in California, but beginning in January 2015 was expanded to include emissions from transportation fuels distributed in California. Inclusion of transportation fuels in California’s cap and trade program as currently promulgated has increased our cap and trade program compliance costs. The ultimate impact on our financial performance, either positive or negative, from this and similar programs, will depend on a number of factors, including, but not limited to:
|
•
|
Whether and to what extent legislation or regulation is enacted.
|
|
•
|
The nature of the legislation or regulation (such as a cap and trade system or a tax on emissions).
|
|
•
|
The GHG reductions required.
|
|
•
|
The price and availability of offsets.
|
|
•
|
The demand for, and amount and allocation of allowances.
|
|
•
|
Technological and scientific developments leading to new products or services.
|
|
•
|
Any potential significant physical effects of climate change (such as increased severe weather events, changes in sea levels and changes in temperature).
|
|
•
|
Whether, and the extent to which, increased compliance costs are ultimately reflected in the prices of our products and services.
|
We consider and take into account anticipated future GHG emissions in designing and developing major facilities and projects, and implement energy efficiency initiatives to reduce GHG emissions. Data on our GHG emissions, legal requirements regulating such emissions, and the possible physical effects of climate change on our coastal assets are incorporated into our planning, investment, and risk management decision-making.
59
CRITICAL ACCOUNTING ESTIMATES
The preparation of financial statements in conformity with generally accepted accounting principles in the United States (GAAP) requires management to select appropriate accounting policies and to make estimates and assumptions that affect the reported amounts of assets, liabilities, revenues and expenses. See
Note 1—Summary of Significant Accounting Policies
, in the Notes to Consolidated Financial Statements, for descriptions of our major accounting policies. Some of these accounting policies involve judgments and uncertainties to such an extent that there is a reasonable likelihood that materially different amounts would have been reported under different conditions, or if different assumptions had been used. The following discussion of critical accounting estimates, along with the discussion of contingencies in this report, address all important accounting areas where the nature of accounting estimates or assumptions could be material due to the levels of subjectivity and judgment necessary to account for highly uncertain matters or the susceptibility of such matters to change.
Impairments
Long-lived assets used in operations are assessed for impairment whenever changes in facts and circumstances indicate a possible significant deterioration in future expected cash flows. If the sum of the undiscounted expected future pre-tax cash flows of an asset group is less than the carrying value, including applicable liabilities, the carrying value is written down to estimated fair value. Individual assets are grouped for impairment purposes based on a judgmental assessment of the lowest level for which there are identifiable cash flows that are largely independent of the cash flows of other assets (for example, at a refinery complex level). Because there usually is a lack of quoted market prices for long-lived assets, the fair value of impaired assets is typically determined using one or more of the following methods: the present value of expected future cash flows using discount rates and other assumptions believed to be consistent with those used by principal market participants; a market multiple of earnings for similar assets; or historical market transactions of similar assets, adjusted using principal market participant assumptions when necessary. The expected future cash flows used for impairment reviews and related fair value calculations are based on judgmental assessments of future volumes, commodity prices, operating costs, margins, discount rates and capital project decisions, considering all available information at the date of review.
Investments in nonconsolidated entities accounted for under the equity method are assessed for impairment when there are indicators of a loss in value, such as a lack of sustained earnings capacity or a current fair value less than the investment’s carrying amount. When it is determined that an indicated impairment is other than temporary, a charge is recognized for the difference between the investment’s carrying value and its estimated fair value.
When determining whether a decline in value is other than temporary, management considers factors such as the length of time and extent of the decline, the investee’s financial condition and near-term prospects, and our ability and intention to retain our investment for a period that allows for recovery. When quoted market prices are not available, the fair value is usually based on the present value of expected future cash flows using discount rates and other assumptions believed to be consistent with those used by principal market participants and a market analysis of comparable assets, if appropriate. Different assumptions could affect the timing and the amount of an impairment of an investment in any period.
Asset Retirement Obligations
Under various contracts, permits and regulations, we have legal obligations to remove tangible equipment and restore the land at the end of operations at certain operational sites. Our largest asset removal obligations involve asbestos abatement at refineries. Estimating the timing and cost of future asset removals is difficult. Most of these removal obligations are many years, or decades, in the future, and the contracts and regulations often have vague descriptions of what removal practices and criteria must be met when the removal event actually occurs. Asset removal technologies and costs, regulatory and other compliance considerations, expenditure timing, and other inputs into valuation of the obligation, including discount and inflation rates, are also subject to change.
Environmental Costs
In addition to asset retirement obligations discussed above, we have certain obligations to complete environmental-related projects. These projects are primarily related to cleanup at domestic refineries, underground storage sites and non-operated sites. Future environmental remediation costs are difficult to estimate because they are subject to change due to such factors as the uncertain magnitude of cleanup costs, timing and extent of such remedial actions that may be required, and the determination of our liability in proportion to that of other responsible parties.
60
Intangible Assets and Goodwill
At December 31,
2018
, we had
$753 million
of intangible assets that we have determined to have indefinite useful lives, and therefore are not amortized. The judgmental determination that an intangible asset has an indefinite useful life is continuously evaluated. If, due to changes in facts and circumstances, management determines these intangible assets have finite useful lives, amortization will commence at that time on a prospective basis. As long as these intangible assets are determined to have indefinite lives, they will be subject to at least annual impairment tests that require management’s judgment of their estimated fair value.
At December 31,
2018
, we had
$3.3 billion
of goodwill recorded in conjunction with past business combinations. Goodwill is not amortized. Instead, goodwill is subject to at least annual tests for impairment at a reporting unit level. A reporting unit is an operating segment or a component that is one level below an operating segment and they are determined primarily based on the manner in which the business is managed.
We perform our annual goodwill impairment test using either a qualitative assessment or a quantitative assessment. As part of our qualitative assessment, we evaluate relevant events and circumstances that could affect the fair value of our reporting units, including macroeconomic conditions, overall industry and market considerations and regulatory changes, as well as company-specific market metrics, performance and events. The evaluation of company-specific events and circumstances includes evaluating changes in our stock price and cost of capital, actual and forecasted financial performance, as well as the effect of significant asset dispositions. If our qualitative assessment indicates it is likely the fair value of a reporting unit has declined below its carrying value (including goodwill), or if we elect not to perform a qualitative assessment, a quantitative assessment is performed.
When a quantitative assessment is performed, management applies judgment in determining the estimated fair values of the reporting units because quoted market prices for our reporting units are not available. Management uses available information to make this fair value determination, including estimated cash flows, cost of capital, observed market earnings multiples of comparable companies, our common stock price and associated total company market capitalization.
We completed our annual impairment test as of October 1, 2018, and concluded that the fair values of our reporting units continued to exceed their respective carrying values (including goodwill) by significant percentages. A decline in the estimated fair value of one or more of our reporting units in the future could result in an impairment. As such, we continue to monitor for indicators of impairment until our next annual impairment test is performed.
Tax Assets and Liabilities
Our operations are subject to various taxes, including federal, state and foreign income taxes, property taxes, and transactional taxes such as excise, sales/use and payroll taxes. We record tax liabilities based on our assessment of existing tax laws and regulations. The recording of tax liabilities requires significant judgment and estimates. We recognize the financial statement effects of an income tax position when it is more likely than not that the position will be sustained upon examination by a taxing authority. A contingent liability related to a transactional tax claim is recorded if the loss is both probable and estimable. Actual incurred tax liabilities can vary from our estimates for a variety of reasons, including different interpretations of tax laws and regulations and different assessments of the amount of tax due.
In determining our income tax expense (benefit), we assess the likelihood our deferred tax assets will be recovered through future taxable income. Valuation allowances reduce deferred tax assets to an amount that will, more likely than not, be realized. Judgment is required in estimating the amount of valuation allowance, if any, that should be recorded against our deferred tax assets. Based on our historical taxable income, our expectations for the future, and available tax-planning strategies, we expect the net deferred tax assets will more likely than not be realized as offsets to reversing deferred tax liabilities and as reductions to future taxable income. If our actual results of operations differ from such estimates or our estimates of future taxable income change, the valuation allowance may need to be revised.
New tax laws and regulations, as well as changes to existing tax laws and regulations, are continuously being proposed or promulgated. The implementation of future legislative and regulatory tax initiatives could result in increased income tax liabilities that cannot be predicted at this time.
61
Projected Benefit Obligations
Calculation of the projected benefit obligations for our defined benefit pension and postretirement plans impacts the obligations on the balance sheet and the amount of benefit expense in the income statement. The actuarial calculation of projected benefit obligations and company contribution requirements involves judgment about uncertain future events, including estimated retirement dates, salary levels at retirement, mortality rates, lump-sum election rates, rates of return on plan assets, future interest rates, future health care cost-trend rates, and rates of utilization of health care services by retirees. We engage outside actuarial firms to assist in the calculation of these projected benefit obligations and company contribution requirements due to the specialized nature of these calculations. Due to differing objectives and requirements between financial accounting rules and the pension plan funding regulations promulgated by governmental agencies, the actuarial methods and assumptions for the two purposes differ in certain important respects. Ultimately, we will be required to fund all promised benefits under pension and postretirement benefit plans not funded by plan assets or investment returns, but the judgmental assumptions used in the actuarial calculations significantly affect periodic financial statements and funding patterns over time. Benefit expense is particularly sensitive to the discount rate and return on plan assets assumptions. A one percentage-point decrease in the discount rate assumption used for the plan obligation would increase annual benefit expense by an estimated $50 million, while a one percentage-point decrease in the return on plan assets assumption would increase annual benefit expense by an estimated $30 million. In determining the discount rate, we use yields on high-quality fixed income investments with payments matched to the estimated distributions of benefits from our plans.
In 2018 and 2017, the expected weighted-average long-term rate of return for worldwide pension plan assets was approximately 6 percent, while the actual weighted-average rate of return was a negative
4 percent
in 2018 and a positive
15 percent
in 2017. For the past ten years, our actual weighted-average rate of return for worldwide pension plan assets was
9 percent
.
62
NEW ACCOUNTING STANDARDS
In February 2018, the FASB issued ASU No. 2018-02, “Income Statement—Reporting Comprehensive Income (Topic 220): Reclassification of Certain Tax Effects from Accumulated Other Comprehensive Income.” This ASU allows for the deferred income tax effects stranded in accumulated other comprehensive income (AOCI) resulting from the Tax Act enacted in December 2017 to be reclassed from AOCI to retained earnings. This ASU is effective for fiscal years, and interim periods within those fiscal years, beginning after December 15, 2018, with early adoption permitted. Upon adoption on January 1, 2019, we increased retained earnings by approximately
$90 million
with the offset to accumulated other comprehensive loss on our consolidated balance sheet.
In June 2016, the FASB issued ASU No. 2016-13, “Financial Instruments—Credit Losses (Topic 326): Measurement of Credit Losses on Financial Instruments.” The new standard amends the impairment model to utilize an expected loss methodology in place of the currently used incurred loss methodology, which may result in earlier recognition of losses. Public business entities should apply the guidance in ASU No. 2016-13 for annual periods beginning after December 15, 2019, including interim periods within those annual periods. Early adoption will be permitted for annual periods beginning after December 15, 2018. We are evaluating the provisions of ASU No. 2016-13, and currently do not expect our adoption to have a material impact on our consolidated financial statements.
In February 2016, the FASB issued ASU No. 2016-02, “Leases (Topic 842).” The new standard establishes a right-of-use (ROU) model that requires a lessee to record a ROU asset and a lease liability on the balance sheet for all leases with terms longer than 12 months. Leases will continue to be classified as either finance or operating, with classification affecting the pattern of expense recognition in the income statement. Similarly, lessors will be required to classify leases as sales-type, finance or operating, with classification affecting the pattern of income recognition. Classification for both lessees and lessors will be based on an assessment of whether risks and rewards, as well as substantive control have been transferred through a lease contract. The ASU also requires additional disclosures. Public business entities should apply the guidance in ASU No. 2016-02 for annual periods beginning after December 15, 2018, including interim periods within those annual periods. Early adoption is permitted. We will adopt ASU No. 2016-02 by recognizing a cumulative-effect adjustment to our opening consolidated balance sheet as of our January 1, 2019, adoption date. As of the adoption date, we expect to recognize ROU assets and operating lease liabilities on our consolidated balance sheet of approximately
$1.4 billion
. The adoption of this ASU is not expected to have a material impact on our consolidated statements of income and cash flows.
63
NON-GAAP RECONCILIATIONS
Refining
Our realized refining margins measure the difference between a) sales and other operating revenues derived from the sale of petroleum products manufactured at our refineries and b) purchase costs of feedstocks, primarily crude oil, used to produce the petroleum products. The realized refining margins are adjusted to include our proportional share of our joint venture refineries’ realized margins, as well as to exclude those items that are not representative of the underlying operating performance of a period, which we call “special items.” The realized refining margins are converted to a per-barrel basis by dividing them by total refinery processed inputs (primarily crude oil) measured on a barrel basis, including our share of inputs processed by our joint venture refineries. Our realized refining margin per barrel is intended to be comparable with industry refining margins, which are known as “crack spreads.” As discussed in “Business Environment,” industry crack spreads measure the difference between market prices for refined petroleum products and crude oil. We believe realized refining margin per barrel calculated on a similar basis as industry crack spreads provides a useful measure of how well we performed relative to benchmark industry margins.
The GAAP performance measure most directly comparable to realized refining margin per barrel is the Refining segment’s “income before income taxes per barrel.” Realized refining margin per barrel excludes items that are typically included in a manufacturer’s gross margin, such as depreciation and operating expenses, and other items used to determine income before income taxes, such as general and administrative expenses. It also includes our proportional share of joint venture refineries’ realized refining margins and excludes special items. Because realized refining margin per barrel is calculated in this manner, and because realized refining margin per barrel may be defined differently by other companies in our industry, it has limitations as an analytical tool. Following are reconciliations of income before income taxes to realized refining margins:
64
|
Millions of Dollars, Except as Indicated
|
|||||||||||
|
Realized Refining Margins
|
Atlantic Basin/Europe
|
|
Gulf
Coast
|
|
Central Corridor
|
|
West
Coast
|
|
Worldwide
|
|
|
|
Year Ended December 31, 2018
|
|||||||||||
|
Income before income taxes
|
$
|
567
|
|
1,040
|
|
2,817
|
|
111
|
|
4,535
|
|
|
Plus:
|
|||||||||||
|
Taxes other than income taxes
|
56
|
|
88
|
|
43
|
|
100
|
|
287
|
|
|
|
Depreciation, amortization and impairments
|
201
|
|
268
|
|
135
|
|
237
|
|
841
|
|
|
|
Selling, general and administrative expenses
|
63
|
|
57
|
|
34
|
|
50
|
|
204
|
|
|
|
Operating expenses
|
950
|
|
1,312
|
|
488
|
|
1,040
|
|
3,790
|
|
|
|
Equity in (earnings) losses of affiliates
|
10
|
|
6
|
|
(812
|
)
|
—
|
|
(796
|
)
|
|
|
Other segment (income) expense, net
|
(11
|
)
|
3
|
|
(13
|
)
|
(9
|
)
|
(30
|
)
|
|
|
Proportional share of refining gross margins contributed by equity affiliates
|
87
|
|
—
|
|
1,565
|
|
—
|
|
1,652
|
|
|
|
Special items:
|
|||||||||||
|
Certain tax impacts
|
(5
|
)
|
—
|
|
—
|
|
—
|
|
(5
|
)
|
|
|
Realized refining margins
|
$
|
1,918
|
|
2,774
|
|
4,257
|
|
1,529
|
|
10,478
|
|
|
Total processed inputs (
thousands of barrels
)
|
186,042
|
|
292,665
|
|
106,299
|
|
136,332
|
|
721,338
|
|
|
|
Adjusted total processed inputs (
thousands of barrels
)*
|
186,042
|
|
292,665
|
|
191,561
|
|
136,332
|
|
806,600
|
|
|
|
Income before income taxes per barrel (
dollars per barrel
)**
|
$
|
3.05
|
|
3.55
|
|
26.50
|
|
0.81
|
|
6.29
|
|
|
Realized refining margins (
dollars per barrel
)***
|
10.32
|
|
9.48
|
|
22.22
|
|
11.20
|
|
12.99
|
|
|
|
Year Ended December 31, 2017
|
|||||||||||
|
Income before income taxes
|
$
|
448
|
|
809
|
|
755
|
|
64
|
|
2,076
|
|
|
Plus:
|
|||||||||||
|
Taxes other than income taxes
|
56
|
|
97
|
|
46
|
|
64
|
|
263
|
|
|
|
Depreciation, amortization and impairments
|
192
|
|
273
|
|
129
|
|
244
|
|
838
|
|
|
|
Selling, general and administrative expenses
|
61
|
|
55
|
|
34
|
|
48
|
|
198
|
|
|
|
Operating expenses
|
847
|
|
1,212
|
|
593
|
|
982
|
|
3,634
|
|
|
|
Equity in (earnings) losses of affiliates
|
11
|
|
(4
|
)
|
(329
|
)
|
—
|
|
(322
|
)
|
|
|
Other segment (income) expense, net
|
(10
|
)
|
(421
|
)
|
13
|
|
5
|
|
(413
|
)
|
|
|
Proportional share of refining gross margins contributed by equity affiliates
|
59
|
|
1
|
|
959
|
|
—
|
|
1,019
|
|
|
|
Special items:
|
|
||||||||||
|
Certain tax impacts
|
(23
|
)
|
—
|
|
—
|
|
—
|
|
(23
|
)
|
|
|
Realized refining margins
|
$
|
1,641
|
|
2,022
|
|
2,200
|
|
1,407
|
|
7,270
|
|
|
Total processed inputs (
thousands of barrels
)
|
199,068
|
|
285,951
|
|
92,146
|
|
134,089
|
|
711,254
|
|
|
|
Adjusted total processed inputs (
thousands of barrels
)*
|
199,068
|
|
285,951
|
|
176,823
|
|
134,089
|
|
795,931
|
|
|
|
Income before income taxes per barrel (
dollars per barrel
)**
|
$
|
2.25
|
|
2.83
|
|
8.19
|
|
0.48
|
|
2.92
|
|
|
Realized refining margins (
dollars per barrel
)***
|
8.25
|
|
7.07
|
|
12.44
|
|
10.49
|
|
9.13
|
|
|
|
* Adjusted total processed inputs include our proportional share of processed inputs of an equity affiliate.
|
|||||||||||
|
** Income before income taxes divided by total processed inputs.
|
|||||||||||
|
*** Realized refining margins per barrel, as presented, are calculated using the underlying realized refining margin amounts, in dollars, divided by adjusted total processed inputs, in barrels. As such, recalculated per barrel amounts using the rounded margins and barrels presented may differ from the presented per barrel amounts due to rounding.
|
|||||||||||
65
|
Millions of Dollars, Except as Indicated
|
|||||||||||
|
Realized Refining Margins
|
Atlantic Basin/Europe
|
|
Gulf
Coast
|
|
Central Corridor
|
|
West
Coast
|
|
Worldwide
|
|
|
|
Year Ended December 31, 2016
|
|||||||||||
|
Income (loss) before income taxes
|
$
|
187
|
|
69
|
|
367
|
|
(188
|
)
|
435
|
|
|
Plus:
|
|||||||||||
|
Taxes other than income taxes
|
58
|
|
73
|
|
42
|
|
80
|
|
253
|
|
|
|
Depreciation, amortization and impairments
|
200
|
|
234
|
|
106
|
|
230
|
|
770
|
|
|
|
Selling, general and administrative expenses
|
64
|
|
51
|
|
31
|
|
49
|
|
195
|
|
|
|
Operating expenses
|
817
|
|
1,234
|
|
465
|
|
979
|
|
3,495
|
|
|
|
Equity in (earnings) losses of affiliates
|
8
|
|
(50
|
)
|
(122
|
)
|
—
|
|
(164
|
)
|
|
|
Other segment (income) expense, net
|
(11
|
)
|
3
|
|
(6
|
)
|
(2
|
)
|
(16
|
)
|
|
|
Proportional share of refining gross margins contributed by equity affiliates
|
55
|
|
(4
|
)
|
705
|
|
—
|
|
756
|
|
|
|
Special items:
|
|
||||||||||
|
Pending claims and settlements
|
—
|
|
(70
|
)
|
—
|
|
—
|
|
(70
|
)
|
|
|
Certain tax impacts
|
(32
|
)
|
—
|
|
—
|
|
—
|
|
(32
|
)
|
|
|
Railcar lease residual value deficiencies and related costs
|
5
|
|
16
|
|
11
|
|
8
|
|
40
|
|
|
|
Recognition of deferred logistics commitments
|
30
|
|
—
|
|
—
|
|
—
|
|
30
|
|
|
|
Realized refining margins
|
$
|
1,381
|
|
1,556
|
|
1,599
|
|
1,156
|
|
5,692
|
|
|
Total processed inputs (
thousands of barrels
)
|
220,519
|
|
283,574
|
|
98,217
|
|
126,329
|
|
728,639
|
|
|
|
Adjusted total processed inputs (
thousands of barrels
)*
|
220,519
|
|
283,574
|
|
183,691
|
|
126,329
|
|
814,113
|
|
|
|
Income (loss) before income taxes per barrel (
dollars per barrel
)**
|
$
|
0.85
|
|
0.24
|
|
3.74
|
|
(1.49
|
)
|
0.60
|
|
|
Realized refining margins (
dollars per barrel
)***
|
6.26
|
|
5.49
|
|
8.70
|
|
9.15
|
|
6.99
|
|
|
|
* Adjusted total processed inputs include our proportional share of processed inputs of an equity affiliate.
|
|||||||||||
|
** Income (loss) before income taxes divided by total processed inputs.
|
|||||||||||
|
*** Realized refining margins per barrel, as presented, are calculated using the underlying realized refining margin amounts, in dollars, divided by adjusted total processed inputs, in barrels. As such, recalculated per barrel amounts using the rounded margins and barrels presented may differ from the presented per barrel amounts due to rounding.
|
|||||||||||
66
Marketing
Our realized marketing fuel margins measure the difference between a) sales and other operating revenues derived from the sale of fuels in our M&S segment and b) purchase costs of those fuels. The realized marketing fuel margins are adjusted to exclude those items that are not representative of the underlying operating performance of a period, which we call “special items.” The realized marketing fuel margins are converted to a per-barrel basis by dividing them by sales volumes measured on a barrel basis. We believe realized marketing fuel margin per barrel demonstrates the value uplift our marketing operations provide by optimizing the placement and ultimate sale of our refineries’ fuel production.
Within the M&S segment, the GAAP performance measure most directly comparable to realized marketing fuel margin per barrel is the marketing business’ “income before income taxes per barrel.” Realized marketing fuel margin per barrel excludes items that are typically included in gross margin, such as depreciation and operating expenses, and other items used to determine income before income taxes, such as general and administrative expenses. Because realized marketing fuel margin per barrel excludes these items, and because realized marketing fuel margin per barrel may be defined differently by other companies in our industry, it has limitations as an analytical tool. Following are reconciliations of income before income taxes to realized marketing fuel margins:
|
Millions of Dollars, Except as Indicated
|
||||||||||||||
|
U.S.
|
International
|
|||||||||||||
|
2018
|
|
2017
|
|
2016
|
|
2018
|
|
2017
|
|
2016
|
|
|||
|
Realized Marketing Fuel Margins
|
||||||||||||||
|
Income before income taxes
|
$
|
843
|
|
628
|
|
804
|
|
505
|
|
217
|
|
252
|
|
|
|
Plus:
|
||||||||||||||
|
Taxes other than income taxes*
|
(2
|
)
|
5,481
|
|
5,187
|
|
2
|
|
7,579
|
|
8,132
|
|
||
|
Depreciation, amortization and impairment
|
13
|
|
14
|
|
12
|
|
71
|
|
67
|
|
63
|
|
||
|
Selling, general and administrative expenses
|
763
|
|
751
|
|
708
|
|
280
|
|
264
|
|
259
|
|
||
|
Equity in earnings of affiliates
|
(8
|
)
|
(5
|
)
|
(4
|
)
|
(91
|
)
|
(83
|
)
|
(75
|
)
|
||
|
Other operating revenues*
|
(379
|
)
|
(5,815
|
)
|
(5,558
|
)
|
(32
|
)
|
(7,594
|
)
|
(8,157
|
)
|
||
|
Other segment (income) expense, net
|
—
|
|
(15
|
)
|
—
|
|
2
|
|
2
|
|
3
|
|
||
|
Special items:
|
||||||||||||||
|
Certain tax impacts
|
(100
|
)
|
—
|
|
—
|
|
—
|
|
—
|
|
—
|
|
||
|
Marketing margins
|
1,130
|
|
1,039
|
|
1,149
|
|
|
737
|
|
452
|
|
477
|
|
|
|
Less: margin for non-fuel related sales
|
—
|
|
—
|
|
—
|
|
44
|
|
42
|
|
45
|
|
||
|
Realized marketing fuel margins
|
$
|
1,130
|
|
1,039
|
|
1,149
|
|
|
693
|
|
410
|
|
432
|
|
|
Total fuel sales volumes (
thousands of barrels
)
|
697,696
|
|
703,928
|
|
699,111
|
|
100,949
|
|
97,346
|
|
106,574
|
|
||
|
Income before income taxes per barrel (
dollars per barrel
)
|
$
|
1.21
|
|
0.89
|
|
1.15
|
|
5.00
|
|
2.23
|
|
2.36
|
|
|
|
Realized marketing fuel margins (
dollars per barrel
)**
|
1.62
|
|
1.48
|
|
1.64
|
|
6.87
|
|
4.21
|
|
4.05
|
|
||
|
* Includes excise taxes on sales of refined petroleum products for periods prior to our adoption of ASU No. 2014-09 on January 1, 2018. See Note 2—Changes in Accounting Principles, in the Notes to Consolidated Financial Statements, for further information on our adoption of this ASU. Other operating revenues also includes other non-fuel revenues.
|
||||||||||||||
|
** Realized marketing fuel margins per barrel, as presented, are calculated using the underlying realized marketing fuel margin amounts, in dollars, divided by sales volumes, in barrels. As such, recalculated per barrel amounts using the rounded margins and barrels presented may differ from the presented per barrel amounts due to rounding.
|
||||||||||||||
67
Item 7A. QUANTITATIVE AND QUALITATIVE DISCLOSURES ABOUT MARKET RISK
Financial Instrument Market Risk
We and certain of our subsidiaries hold and issue derivative contracts and financial instruments that expose our cash flows or earnings to changes in commodity prices, foreign currency exchange rates or interest rates. We may use financial- and commodity-based derivative contracts to manage the risks produced by changes in the prices of crude oil and related products, natural gas, NGL, and electric power; fluctuations in interest rates and foreign currency exchange rates; or to capture market opportunities.
Our use of derivative instruments is governed by an “Authority Limitations” document approved by our Board of Directors, that prohibits the use of highly leveraged derivatives or derivative instruments without sufficient market liquidity for comparable valuations. The Authority Limitations document also establishes Value at Risk (VaR) limits, and compliance with these limits is monitored daily. Our Chief Executive Officer and Chief Financial Officer monitor risks resulting from foreign currency exchange rates, interest rates and commodity prices.
Commodity Price Risk
We sell into and receive supply from the worldwide crude oil, refined petroleum product, natural gas, NGL, and electric power markets, exposing our revenues, purchases, cost of operating activities, and cash flows to fluctuations in the prices for these commodities. Generally, our policy is to remain exposed to the market prices of commodities. Consistent with this policy, our Commercial organization uses derivative contracts to convert our exposure from fixed-price sales contracts, often specified in contracts with refined petroleum product customers, back to fluctuating market prices. Conversely, our Commercial organization also uses futures, forwards, swaps and options in various markets to accomplish the following objectives to optimize the value of our supply chain, and this may reduce our exposure to fluctuations in market prices:
|
•
|
Balance physical systems or to meet our refinery requirements and marketing demand. In addition to cash settlement prior to contract expiration, exchange-traded futures contracts may be settled by physical delivery of the commodity.
|
|
•
|
Manage the risk to our cash flows from price exposures on specific crude oil, refined petroleum product, natural gas, NGL, and electric power transactions.
|
|
•
|
Enable us to use the market knowledge gained from these activities to capture market opportunities such as moving physical commodities to more profitable locations, storing commodities to capture seasonal or time premiums, and blending commodities to capture quality upgrades. Derivatives may be utilized to optimize these activities.
|
We use a VaR model to estimate the loss in fair value that could potentially result on a single day from the effect of adverse changes in market conditions on the derivative financial instruments and derivative commodity instruments held or issued, including commodity purchase and sales contracts recorded on the balance sheet at
December 31, 2018
, as derivative instruments. Using the Monte Carlo simulation, a 95 percent confidence level and a one-day holding period, the VaR for those instruments issued or held for trading purposes at
December 31, 2018
and
2017
, was immaterial to our cash flows and net income. The VaR for instruments held for purposes other than trading at
December 31, 2018
and
2017
, was also immaterial to our cash flows and net income.
68
Interest Rate Risk
Our use of fixed- or variable-rate debt directly exposes us to interest rate risk. Fixed-rate debt, such as our senior notes, exposes us to changes in the fair value of our debt due to changes in market interest rates. Fixed-rate debt also exposes us to the risk that we may need to refinance maturing debt with new debt at higher rates, or that we may be obligated to pay rates higher than the current market. Variable-rate debt, such as our floating-rate notes or borrowings under our revolving credit facility, exposes us to short-term changes in market rates that impact our interest expense. The following tables provide information about our debt instruments that are sensitive to changes in U.S. interest rates. These tables present principal cash flows and related weighted-average interest rates by expected maturity dates. Weighted-average variable rates are based on effective rates at the reporting date. The carrying amount of our floating-rate debt approximates its fair value. The fair value of the fixed-rate financial instruments is estimated based on observable market prices.
|
Millions of Dollars, Except as Indicated
|
||||||||||||||
|
Expected Maturity Date
|
Fixed Rate Maturity
|
Average Interest Rate
|
|
Floating Rate Maturity
|
Average Interest Rate
|
|
||||||||
|
Year-End 2018
|
||||||||||||||
|
2019
|
$
|
—
|
|
—
|
%
|
$
|
50
|
|
3.65
|
%
|
||||
|
2020
|
300
|
|
2.65
|
|
525
|
|
3.21
|
|
||||||
|
2021
|
—
|
|
—
|
|
625
|
|
3.23
|
|
||||||
|
2022
|
2,000
|
|
4.30
|
|
—
|
|
—
|
|
||||||
|
2023
|
—
|
|
—
|
|
—
|
|
—
|
|
||||||
|
Remaining years
|
7,576
|
|
4.69
|
|
—
|
|
—
|
|
||||||
|
Total
|
$
|
9,876
|
|
$
|
1,200
|
|
||||||||
|
Fair value
|
$
|
9,727
|
|
$
|
1,200
|
|
||||||||
|
Millions of Dollars, Except as Indicated
|
||||||||||||||
|
Expected Maturity Date
|
Fixed Rate Maturity
|
Average Interest Rate
|
|
Floating Rate Maturity
|
Average Interest Rate
|
|
||||||||
|
Year-End 2017
|
||||||||||||||
|
2018
|
$
|
—
|
|
—
|
%
|
$
|
25
|
|
1.94
|
%
|
||||
|
2019
|
—
|
|
—
|
|
300
|
|
2.01
|
|
||||||
|
2020
|
300
|
|
2.65
|
|
775
|
|
2.31
|
|
||||||
|
2021
|
—
|
|
—
|
|
50
|
|
1.94
|
|
||||||
|
2022
|
2,000
|
|
4.30
|
|
—
|
|
—
|
|
||||||
|
Remaining years
|
6,576
|
|
4.78
|
|
—
|
|
—
|
|
||||||
|
Total
|
$
|
8,876
|
|
$
|
1,150
|
|
||||||||
|
Fair value
|
$
|
9,746
|
|
$
|
1,150
|
|
||||||||
For additional information about our use of derivative instruments, see
Note 15—Derivatives and Financial Instruments
, in the Notes to Consolidated Financial Statements.
69
CAUTIONARY STATEMENT FOR THE PURPOSES OF THE “SAFE HARBOR” PROVISIONS OF THE PRIVATE SECURITIES LITIGATION REFORM ACT OF 1995
This report includes forward-looking statements within the meaning of Section 27A of the Securities Act of 1933 and Section 21E of the Securities Exchange Act of 1934. You can identify our forward-looking statements by the words “anticipate,” “estimate,” “believe,” “budget,” “continue,” “could,” “intend,” “may,” “plan,” “potential,” “predict,” “seek,” “should,” “will,” “would,” “expect,” “objective,” “projection,” “forecast,” “goal,” “guidance,” “outlook,” “effort,” “target” and similar expressions.
We based the forward-looking statements on our current expectations, estimates and projections about us and the industries in which we operate in general. We caution you these statements are not guarantees of future performance as they involve assumptions that, while made in good faith, may prove to be incorrect, and involve risks and uncertainties we cannot predict. In addition, we based many of these forward-looking statements on assumptions about future events that may prove to be inaccurate. Accordingly, our actual outcomes and results may differ materially from what we have expressed or forecast in the forward-looking statements. Any differences could result from a variety of factors, including the following:
|
•
|
Fluctuations in NGL, crude oil, refined petroleum product and natural gas prices and refining, marketing and petrochemical margins.
|
|
•
|
Failure of new products and services to achieve market acceptance.
|
|
•
|
Unexpected changes in costs or technical requirements for constructing, modifying or operating our facilities or transporting our products.
|
|
•
|
Unexpected technological or commercial difficulties in manufacturing, refining or transporting our products, including chemical products.
|
|
•
|
Lack of, or disruptions in, adequate and reliable transportation for our NGL, crude oil, natural gas and refined petroleum products.
|
|
•
|
The level and success of drilling and quality of production volumes around our Midstream assets.
|
|
•
|
Our inability to timely obtain or maintain permits, including those necessary for capital projects.
|
|
•
|
Our inability to comply with government regulations or make capital expenditures required to maintain compliance.
|
|
•
|
Failure to complete definitive agreements and feasibility studies for, and to timely complete construction of, announced and future capital projects.
|
|
•
|
Potential disruption or interruption of our operations due to accidents, weather events, civil unrest, political events, terrorism or cyber attacks.
|
|
•
|
International monetary conditions and exchange controls.
|
|
•
|
Substantial investment or reduced demand for products as a result of existing or future environmental rules and regulations.
|
|
•
|
Liability resulting from litigation or for remedial actions, including removal and reclamation obligations under environmental regulations.
|
|
•
|
General domestic and international economic and political developments including: armed hostilities; expropriation of assets; changes in governmental policies relating to NGL, crude oil, natural gas or refined petroleum products pricing, regulation or taxation; and other political, economic or diplomatic developments.
|
|
•
|
Changes in tax, environmental and other laws and regulations (including alternative energy mandates) applicable to our business.
|
|
•
|
Limited access to capital or significantly higher cost of capital related to changes to our credit profile or illiquidity or uncertainty in the domestic or international financial markets.
|
|
•
|
The operation, financing and distribution decisions of our joint ventures.
|
|
•
|
Domestic and foreign supplies of crude oil and other feedstocks.
|
|
•
|
Domestic and foreign supplies of petrochemicals and refined petroleum products, such as gasoline, diesel, aviation fuel and home heating oil.
|
|
•
|
Governmental policies relating to exports of crude oil and natural gas.
|
|
•
|
Overcapacity or undercapacity in the midstream, chemicals and refining industries.
|
|
•
|
Fluctuations in consumer demand for refined petroleum products.
|
|
•
|
The factors generally described in Item 1A.—Risk Factors in this report.
|
70
Item 8. FINANCIAL STATEMENTS AND SUPPLEMENTARY DATA
PHILLIPS 66
INDEX TO FINANCIAL STATEMENTS
|
|
Page
|
71
Report of Management
Management prepared, and is responsible for, the consolidated financial statements and the other information appearing in this Annual Report. The consolidated financial statements present fairly the company’s financial position, results of operations and cash flows in conformity with generally accepted accounting principles in the United States. In preparing its consolidated financial statements, the company includes amounts that are based on estimates and judgments management believes are reasonable under the circumstances. The company’s financial statements have been audited by Ernst & Young LLP, an independent registered public accounting firm appointed by the Audit and Finance Committee of the Board of Directors. Management has made available to Ernst & Young LLP all of the company’s financial records and related data, as well as the minutes of stockholders’ and directors’ meetings.
Assessment of Internal Control Over Financial Reporting
Management is responsible for establishing and maintaining adequate internal control over financial reporting. Phillips 66’s internal control system was designed to provide reasonable assurance to the company’s management and directors regarding the preparation and fair presentation of published financial statements.
All internal control systems, no matter how well designed, have inherent limitations. Therefore, even those systems determined to be effective can provide only reasonable assurance with respect to financial statement preparation and presentation.
Management assessed the effectiveness of the company’s internal control over financial reporting as of
December 31, 2018
. In making this assessment, it used the criteria set forth by the Committee of Sponsoring Organizations of the Treadway Commission in
Internal Control
—
Integrated Framework
(2013)
.
Based on this assessment, management concluded the company’s internal control over financial reporting was effective as of
December 31, 2018
.
Ernst & Young LLP has issued an audit report on the company’s internal control over financial reporting as of
December 31, 2018
, and their report is included herein.
|
/s/ Greg C. Garland
|
/s/ Kevin J. Mitchell
|
|
|
Greg C. Garland
|
Kevin J. Mitchell
|
|
|
Chairman and
|
Executive Vice President, Finance and
|
|
|
Chief Executive Officer
|
Chief Financial Officer
|
|
Date:
February 22, 2019
72
Report of Independent Registered Public Accounting Firm
To the Board of Directors and Stockholders of Phillips 66
Opinion on the Financial Statements
We have audited the accompanying consolidated balance sheet of Phillips 66 (the Company) as of
December 31, 2018
and
2017
, the related consolidated statements of income, comprehensive income, changes in equity, and cash flows, for each of the three years in the period ended
December 31, 2018
, and the related notes (collectively referred to as the financial statements). In our opinion, the financial statements present fairly, in all material respects, the consolidated financial position of the Company as of
December 31, 2018
and
2017
, and the consolidated results of its operations and its cash flows for each of the three years in the period ended
December 31, 2018
, in conformity with U.S. generally accepted accounting principles.
We also have audited, in accordance with the standards of the Public Company Accounting Oversight Board (United States) (PCAOB), the Company’s internal control over financial reporting as of
December 31, 2018
, based on criteria established in
Internal Control-Integrated Framework
issued by the Committee of Sponsoring Organizations of the Treadway Commission (2013 framework) and our report dated
February 22, 2019
expressed an unqualified opinion thereon.
Adoption of ASU No. 2014-09
As discussed in Note 2 to the consolidated financial statements, the Company adopted ASU No. 2014-09, “Revenue from Contracts with Customers (Topic 606)” effective January 1, 2018. As a result, for the year ended December 31, 2018, the Company changed its presentation of excise taxes collected from customers on sales of refined petroleum products.
Basis for Opinion
These financial statements are the responsibility of the Company’s management. Our responsibility is to express an opinion on the Company’s financial statements based on our audits. We are a public accounting firm registered with the PCAOB and are required to be independent with respect to the Company in accordance with the U.S. federal securities laws and the applicable rules and regulations of the Securities and Exchange Commission and the PCAOB.
We conducted our audits in accordance with the standards of the PCAOB. Those standards require that we plan and perform the audit to obtain reasonable assurance about whether the financial statements are free of material misstatement, whether due to error or fraud. Our audits included performing procedures to assess the risks of material misstatement of the financial statements, whether due to error or fraud, and performing procedures that respond to those risks. Such procedures include examining, on a test basis, evidence regarding the amounts and disclosures in the financial statements. Our audits also included evaluating the accounting principles used and significant estimates made by management, as well as evaluating the overall presentation of the financial statements. We believe that our audits provide a reasonable basis for our opinion.
/s/ Ernst & Young LLP
Houston, Texas
February 22, 2019
We have served as the Company’s auditor since 2011.
73
Report of Independent Registered Public Accounting Firm
To the Board of Directors and Stockholders of Phillips 66
Opinion on Internal Control over Financial Reporting
We have audited Phillips 66’s internal control over financial reporting as of
December 31, 2018
, based on criteria established in
Internal Control—Integrated Framework
issued by the Committee of Sponsoring Organizations of the Treadway Commission (2013 framework) (the COSO criteria). In our opinion, Phillips 66 (the Company) maintained, in all material respects, effective internal control over financial reporting as of
December 31, 2018
, based on the COSO criteria.
We also have audited, in accordance with the standards of the Public Company Accounting Oversight Board (United States) (PCAOB), the consolidated balance sheets of the Company as of
December 31, 2018
and
2017
, the related consolidated statements of income, comprehensive income, changes in equity, and cash flows, for each of the three years in the period ended
December 31, 2018
, and the related notes and our report dated
February 22, 2019
expressed an unqualified opinion thereon.
Basis for Opinion
The Company’s management is responsible for maintaining effective internal control over financial reporting and for its assessment of the effectiveness of internal control over financial reporting included under the heading “Assessment of Internal Control Over Financial Reporting” in the accompanying “Report of Management.” Our responsibility is to express an opinion on the Company’s internal control over financial reporting based on our audit. We are a public accounting firm registered with the PCAOB and are required to be independent with respect to the Company in accordance with the U.S. federal securities laws and the applicable rules and regulations of the Securities and Exchange Commission and the PCAOB.
We conducted our audit in accordance with the standards of the PCAOB. Those standards require that we plan and perform the audit to obtain reasonable assurance about whether effective internal control over financial reporting was maintained in all material respects.
Our audit included obtaining an understanding of internal control over financial reporting, assessing the risk that a material weakness exists, testing and evaluating the design and operating effectiveness of internal control based on the assessed risk, and performing such other procedures as we considered necessary in the circumstances. We believe that our audit provides a reasonable basis for our opinion.
Definition and Limitations of Internal Control Over Financial Reporting
A company’s internal control over financial reporting is a process designed to provide reasonable assurance regarding the reliability of financial reporting and the preparation of financial statements for external purposes in accordance with generally accepted accounting principles. A company’s internal control over financial reporting includes those policies and procedures that (1) pertain to the maintenance of records that, in reasonable detail, accurately and fairly reflect the transactions and dispositions of the assets of the company; (2) provide reasonable assurance that transactions are recorded as necessary to permit preparation of financial statements in accordance with generally accepted accounting principles, and that receipts and expenditures of the company are being made only in accordance with authorizations of management and directors of the company; and (3) provide reasonable assurance regarding prevention or timely detection of unauthorized acquisition, use, or disposition of the company’s assets that could have a material effect on the financial statements.
Because of its inherent limitations, internal control over financial reporting may not prevent or detect misstatements. Also, projections of any evaluation of effectiveness to future periods are subject to the risk that controls may become inadequate because of changes in conditions, or that the degree of compliance with the policies or procedures may deteriorate.
/s/ Ernst & Young LLP
Houston, Texas
February 22, 2019
74
|
Consolidated Statement of Income
|
Phillips 66
|
|
Millions of Dollars
|
||||||||||
|
Years Ended December 31
|
2018
|
|
2017
|
|
2016
|
|
||||
|
Revenues and Other Income
|
||||||||||
|
Sales and other operating revenues*
|
$
|
111,461
|
|
102,354
|
|
84,279
|
|
|||
|
Equity in earnings of affiliates
|
2,676
|
|
1,732
|
|
1,414
|
|
||||
|
Net gain on dispositions
|
19
|
|
15
|
|
10
|
|
||||
|
Other income
|
61
|
|
521
|
|
74
|
|
||||
|
Total Revenues and Other Income
|
114,217
|
|
104,622
|
|
85,777
|
|
||||
|
Costs and Expenses
|
||||||||||
|
Purchased crude oil and products
|
97,930
|
|
79,409
|
|
62,468
|
|
||||
|
Operating expenses
|
4,880
|
|
4,699
|
|
4,275
|
|
||||
|
Selling, general and administrative expenses
|
1,677
|
|
1,695
|
|
1,638
|
|
||||
|
Depreciation and amortization
|
1,356
|
|
1,318
|
|
1,168
|
|
||||
|
Impairments
|
8
|
|
24
|
|
5
|
|
||||
|
Taxes other than income taxes*
|
425
|
|
13,462
|
|
13,688
|
|
||||
|
Accretion on discounted liabilities
|
23
|
|
22
|
|
21
|
|
||||
|
Interest and debt expense
|
504
|
|
438
|
|
338
|
|
||||
|
Foreign currency transaction gains
|
(31
|
)
|
—
|
|
(15
|
)
|
||||
|
Total Costs and Expenses
|
106,772
|
|
101,067
|
|
83,586
|
|
||||
|
Income before income taxes
|
7,445
|
|
3,555
|
|
2,191
|
|
||||
|
Income tax expense (benefit)
|
1,572
|
|
(1,693
|
)
|
547
|
|
||||
|
Net Income
|
5,873
|
|
5,248
|
|
1,644
|
|
||||
|
Less: net income attributable to noncontrolling interests
|
278
|
|
142
|
|
89
|
|
||||
|
Net Income Attributable to Phillips 66
|
$
|
5,595
|
|
5,106
|
|
1,555
|
|
|||
|
Net Income Attributable to Phillips 66 Per Share of Common Stock
(dollars)
|
||||||||||
|
Basic
|
$
|
11.87
|
|
9.90
|
|
2.94
|
|
|||
|
Diluted
|
11.80
|
|
9.85
|
|
2.92
|
|
||||
|
Weighted-Average Common Shares Outstanding
(thousands)
|
||||||||||
|
Basic
|
470,708
|
|
515,090
|
|
527,531
|
|
||||
|
Diluted
|
474,047
|
|
518,508
|
|
530,066
|
|
||||
|
* Includes excise taxes on sales of refined petroleum products for periods prior to the adoption of Accounting Standards Update No. 2014-09 on January 1, 2018:
|
$
|
13,054
|
|
13,381
|
|
|||||
|
See Notes to Consolidated Financial Statements.
|
|
|
|
|
||||||
75
|
Consolidated Statement of Comprehensive Income
|
Phillips 66
|
||||||||
|
Millions of Dollars
|
|||||||||
|
Years Ended December 31
|
2018
|
|
2017
|
|
2016
|
|
|||
|
Net Income
|
$
|
5,873
|
|
5,248
|
|
1,644
|
|
||
|
Other comprehensive income (loss)
|
|||||||||
|
Defined benefit plans
|
|||||||||
|
Net actuarial loss arising during the period
|
(16
|
)
|
(1
|
)
|
(178
|
)
|
|||
|
Amortization to income of net actuarial loss, net prior service cost (credit) and settlements
|
148
|
|
176
|
|
94
|
|
|||
|
Curtailment gain
|
5
|
|
—
|
|
31
|
|
|||
|
Plans sponsored by equity affiliates
|
22
|
|
10
|
|
(11
|
)
|
|||
|
Income taxes on defined benefit plans
|
(33
|
)
|
(70
|
)
|
13
|
|
|||
|
Defined benefit plans, net of income taxes
|
126
|
|
115
|
|
|
(51
|
)
|
||
|
Foreign currency translation adjustments
|
(205
|
)
|
268
|
|
(301
|
)
|
|||
|
Income taxes on foreign currency translation adjustments
|
3
|
|
(9
|
)
|
5
|
|
|||
|
Foreign currency translation adjustments, net of income taxes
|
(202
|
)
|
259
|
|
(296
|
)
|
|||
|
Cash flow hedges
|
1
|
|
6
|
|
8
|
|
|||
|
Income taxes on hedging activities
|
—
|
|
(2
|
)
|
(3
|
)
|
|||
|
Hedging activities, net of income taxes
|
1
|
|
4
|
|
5
|
|
|||
|
Other Comprehensive Income (Loss), Net of Income Taxes
|
(75
|
)
|
378
|
|
(342
|
)
|
|||
|
Comprehensive Income
|
5,798
|
|
5,626
|
|
1,302
|
|
|||
|
Less: comprehensive income attributable to noncontrolling interests
|
278
|
|
142
|
|
89
|
|
|||
|
Comprehensive Income Attributable to Phillips 66
|
$
|
5,520
|
|
5,484
|
|
1,213
|
|
||
|
See Notes to Consolidated Financial Statements.
|
|||||||||
76
|
Consolidated Balance Sheet
|
Phillips 66
|
|||||
|
Millions of Dollars
|
||||||
|
At December 31
|
2018
|
|
2017
|
|
||
|
Assets
|
||||||
|
Cash and cash equivalents
|
$
|
3,019
|
|
3,119
|
|
|
|
Accounts and notes receivable (net of allowances of $22 million in 2018
and $29 million in 2017)
|
5,414
|
|
6,424
|
|
||
|
Accounts and notes receivable—related parties
|
759
|
|
1,082
|
|
||
|
Inventories
|
3,543
|
|
3,395
|
|
||
|
Prepaid expenses and other current assets
|
474
|
|
370
|
|
||
|
Total Current Assets
|
13,209
|
|
14,390
|
|
||
|
Investments and long-term receivables
|
14,421
|
|
13,941
|
|
||
|
Net properties, plants and equipment
|
22,018
|
|
21,460
|
|
||
|
Goodwill
|
3,270
|
|
3,270
|
|
||
|
Intangibles
|
869
|
|
876
|
|
||
|
Other assets
|
515
|
|
434
|
|
||
|
Total Assets
|
$
|
54,302
|
|
54,371
|
|
|
|
Liabilities
|
||||||
|
Accounts payable
|
$
|
6,113
|
|
7,242
|
|
|
|
Accounts payable—related parties
|
473
|
|
785
|
|
||
|
Short-term debt
|
67
|
|
41
|
|
||
|
Accrued income and other taxes
|
1,116
|
|
1,002
|
|
||
|
Employee benefit obligations
|
724
|
|
582
|
|
||
|
Other accruals
|
442
|
|
455
|
|
||
|
Total Current Liabilities
|
8,935
|
|
10,107
|
|
||
|
Long-term debt
|
11,093
|
|
10,069
|
|
||
|
Asset retirement obligations and accrued environmental costs
|
624
|
|
641
|
|
||
|
Deferred income taxes
|
5,275
|
|
5,008
|
|
||
|
Employee benefit obligations
|
867
|
|
884
|
|
||
|
Other liabilities and deferred credits
|
355
|
|
234
|
|
||
|
Total Liabilities
|
27,149
|
|
26,943
|
|
||
|
Equity
|
||||||
|
Common stock (2,500,000,000 shares authorized at $0.01 par value)
Issued (2018—645,691,761 shares; 2017—643,835,464 shares)
|
||||||
|
Par value
|
6
|
|
6
|
|
||
|
Capital in excess of par
|
19,873
|
|
19,768
|
|
||
|
Treasury stock (at cost: 2018—189,526,331 shares; 2017—141,565,145 shares)
|
(15,023
|
)
|
(10,378
|
)
|
||
|
Retained earnings
|
20,489
|
|
16,306
|
|
||
|
Accumulated other comprehensive loss
|
(692
|
)
|
(617
|
)
|
||
|
Total Stockholders’ Equity
|
24,653
|
|
25,085
|
|
||
|
Noncontrolling interests
|
2,500
|
|
2,343
|
|
||
|
Total Equity
|
27,153
|
|
27,428
|
|
||
|
Total Liabilities and Equity
|
$
|
54,302
|
|
54,371
|
|
|
|
See Notes to Consolidated Financial Statements.
|
||||||
77
|
Consolidated Statement of Cash Flows
|
Phillips 66
|
||||||||
|
Millions of Dollars
|
|||||||||
|
Years Ended December 31
|
2018
|
|
2017
|
|
2016
|
|
|||
|
Cash Flows From Operating Activities
|
|||||||||
|
Net income
|
$
|
5,873
|
|
5,248
|
|
1,644
|
|
||
|
Adjustments to reconcile net income to net cash provided by operating activities
|
|||||||||
|
Depreciation and amortization
|
1,356
|
|
1,318
|
|
1,168
|
|
|||
|
Impairments
|
8
|
|
24
|
|
5
|
|
|||
|
Accretion on discounted liabilities
|
23
|
|
22
|
|
21
|
|
|||
|
Deferred income taxes
|
252
|
|
(1,886
|
)
|
612
|
|
|||
|
Undistributed equity earnings
|
221
|
|
(516
|
)
|
(815
|
)
|
|||
|
Net gain on dispositions
|
(19
|
)
|
(15
|
)
|
(10
|
)
|
|||
|
Gain on consolidation of business
|
—
|
|
(423
|
)
|
—
|
|
|||
|
Other
|
132
|
|
(186
|
)
|
(163
|
)
|
|||
|
Working capital adjustments
|
|||||||||
|
Accounts and notes receivable
|
1,320
|
|
(1,182
|
)
|
(1,258
|
)
|
|||
|
Inventories
|
(202
|
)
|
(176
|
)
|
216
|
|
|||
|
Prepaid expenses and other current assets
|
(113
|
)
|
104
|
|
(147
|
)
|
|||
|
Accounts payable
|
(1,546
|
)
|
1,153
|
|
1,579
|
|
|||
|
Taxes and other accruals
|
268
|
|
163
|
|
111
|
|
|||
|
Net Cash Provided by Operating Activities
|
7,573
|
|
3,648
|
|
2,963
|
|
|||
|
Cash Flows From Investing Activities
|
|||||||||
|
Capital expenditures and investments
|
(2,639
|
)
|
(1,832
|
)
|
(2,844
|
)
|
|||
|
Proceeds from asset dispositions*
|
57
|
|
86
|
|
156
|
|
|||
|
Advances/loans—related parties
|
(1
|
)
|
(10
|
)
|
(432
|
)
|
|||
|
Collection of advances/loans—related parties
|
—
|
|
326
|
|
108
|
|
|||
|
Restricted cash received from consolidation of business
|
—
|
|
318
|
|
—
|
|
|||
|
Other
|
112
|
|
(34
|
)
|
(146
|
)
|
|||
|
Net Cash Used in Investing Activities
|
(2,471
|
)
|
(1,146
|
)
|
(3,158
|
)
|
|||
|
Cash Flows From Financing Activities
|
|||||||||
|
Issuance of debt
|
2,184
|
|
3,508
|
|
2,090
|
|
|||
|
Repayment of debt
|
(1,144
|
)
|
(3,678
|
)
|
(833
|
)
|
|||
|
Issuance of common stock
|
39
|
|
35
|
|
34
|
|
|||
|
Repurchase of common stock
|
(4,645
|
)
|
(1,590
|
)
|
(1,042
|
)
|
|||
|
Dividends paid on common stock
|
(1,436
|
)
|
(1,395
|
)
|
(1,282
|
)
|
|||
|
Distributions to noncontrolling interests
|
(207
|
)
|
(120
|
)
|
(75
|
)
|
|||
|
Net proceeds from issuance of Phillips 66 Partners LP common and preferred units
|
128
|
|
1,205
|
|
972
|
|
|||
|
Other
|
(86
|
)
|
(76
|
)
|
(42
|
)
|
|||
|
Net Cash Used in Financing Activities
|
(5,167
|
)
|
(2,111
|
)
|
(178
|
)
|
|||
|
Effect of Exchange Rate Changes on Cash, Cash Equivalents and Restricted Cash
|
(35
|
)
|
17
|
|
10
|
|
|||
|
Net Change in Cash, Cash Equivalents and Restricted Cash
|
(100
|
)
|
408
|
|
(363
|
)
|
|||
|
Cash, cash equivalents and restricted cash at beginning of year
|
3,119
|
|
2,711
|
|
3,074
|
|
|||
|
Cash, Cash Equivalents and Restricted Cash at End of Year
|
$
|
3,019
|
|
3,119
|
|
2,711
|
|
||
|
* Includes return of investments in equity affiliates.
|
|||||||||
|
See Notes to Consolidated Financial Statements.
|
|||||||||
78
|
Consolidated Statement of Changes in Equity
|
Phillips 66
|
||||||||||||||
|
|
Millions of Dollars
|
||||||||||||||
|
|
Attributable to Phillips 66
|
|
|
||||||||||||
|
Common Stock
|
|||||||||||||||
|
|
Par Value
|
|
Capital in Excess of Par
|
|
Treasury Stock
|
|
Retained Earnings
|
|
Accum. Other
Comprehensive Loss |
|
Noncontrolling
Interests |
|
Total
|
|
|
|
December 31, 2015
|
$
|
6
|
|
19,145
|
|
(7,746
|
)
|
12,348
|
|
(653
|
)
|
838
|
|
23,938
|
|
|
Net income
|
—
|
|
—
|
|
—
|
|
1,555
|
|
—
|
|
89
|
|
1,644
|
|
|
|
Other comprehensive loss
|
—
|
|
—
|
|
—
|
|
—
|
|
(342
|
)
|
—
|
|
(342
|
)
|
|
|
Dividends paid on common stock
|
—
|
|
—
|
|
—
|
|
(1,282
|
)
|
—
|
|
—
|
|
(1,282
|
)
|
|
|
Repurchase of common stock
|
—
|
|
—
|
|
(1,042
|
)
|
—
|
|
—
|
|
—
|
|
(1,042
|
)
|
|
|
Benefit plan activity
|
—
|
|
106
|
|
—
|
|
(13
|
)
|
—
|
|
—
|
|
93
|
|
|
|
Issuance of Phillips 66 Partners LP common units
|
—
|
|
308
|
|
—
|
|
—
|
|
—
|
|
483
|
|
791
|
|
|
|
Distributions to noncontrolling interests
|
—
|
|
—
|
|
—
|
|
—
|
|
—
|
|
(75
|
)
|
(75
|
)
|
|
|
December 31, 2016
|
6
|
|
19,559
|
|
(8,788
|
)
|
12,608
|
|
(995
|
)
|
1,335
|
|
23,725
|
|
|
|
Net income
|
—
|
|
—
|
|
—
|
|
5,106
|
|
—
|
|
142
|
|
5,248
|
|
|
|
Other comprehensive income
|
—
|
|
—
|
|
—
|
|
—
|
|
378
|
|
—
|
|
378
|
|
|
|
Dividends paid on common stock
|
—
|
|
—
|
|
—
|
|
(1,395
|
)
|
—
|
|
—
|
|
(1,395
|
)
|
|
|
Repurchase of common stock
|
—
|
|
—
|
|
(1,590
|
)
|
—
|
|
—
|
|
—
|
|
(1,590
|
)
|
|
|
Benefit plan activity
|
—
|
|
72
|
|
—
|
|
(13
|
)
|
—
|
|
—
|
|
59
|
|
|
|
Issuance of Phillips 66 Partners LP common and preferred units
|
—
|
|
137
|
|
—
|
|
—
|
|
—
|
|
986
|
|
1,123
|
|
|
|
Distributions to noncontrolling interests
|
—
|
|
—
|
|
—
|
|
—
|
|
—
|
|
(120
|
)
|
(120
|
)
|
|
|
December 31, 2017
|
6
|
|
19,768
|
|
(10,378
|
)
|
16,306
|
|
(617
|
)
|
2,343
|
|
27,428
|
|
|
|
Cumulative effect of accounting changes
|
—
|
|
—
|
|
—
|
|
36
|
|
—
|
|
13
|
|
49
|
|
|
|
Net income
|
—
|
|
—
|
|
—
|
|
5,595
|
|
—
|
|
278
|
|
5,873
|
|
|
|
Other comprehensive loss
|
—
|
|
—
|
|
—
|
|
—
|
|
(75
|
)
|
—
|
|
(75
|
)
|
|
|
Dividends paid on common stock
|
—
|
|
—
|
|
—
|
|
(1,436
|
)
|
—
|
|
—
|
|
(1,436
|
)
|
|
|
Repurchase of common stock
|
—
|
|
—
|
|
(4,645
|
)
|
—
|
|
—
|
|
—
|
|
(4,645
|
)
|
|
|
Benefit plan activity
|
—
|
|
63
|
|
—
|
|
(12
|
)
|
—
|
|
—
|
|
51
|
|
|
|
Issuance of Phillips 66 Partners LP common units
|
—
|
|
42
|
|
—
|
|
—
|
|
—
|
|
73
|
|
115
|
|
|
|
Distributions to noncontrolling interests
|
—
|
|
—
|
|
—
|
|
—
|
|
—
|
|
(207
|
)
|
(207
|
)
|
|
|
December 31, 2018
|
$
|
6
|
|
19,873
|
|
(15,023
|
)
|
20,489
|
|
(692
|
)
|
2,500
|
|
27,153
|
|
79
|
Shares in Thousands
|
||||||
|
Common Stock Issued
|
|
Treasury Stock
|
|
|||
|
December 31, 2015
|
639,336
|
|
109,926
|
|
||
|
Repurchase of common stock
|
—
|
|
12,901
|
|
||
|
Shares issued—share-based compensation
|
2,258
|
|
—
|
|
||
|
December 31, 2016
|
641,594
|
|
122,827
|
|
||
|
Repurchase of common stock
|
—
|
|
18,738
|
|
||
|
Shares issued—share-based compensation
|
2,241
|
|
—
|
|
||
|
December 31, 2017
|
643,835
|
|
141,565
|
|
||
|
Repurchase of common stock
|
—
|
|
47,961
|
|
||
|
Shares issued—share-based compensation
|
1,857
|
|
—
|
|
||
|
December 31, 2018
|
645,692
|
|
189,526
|
|
||
|
Dollars
|
||||||
|
Years Ended December 31
|
Dividends Paid Per Share of Common Stock
|
|||||
|
2016
|
$
|
2.45
|
||||
|
2017
|
2.73
|
|||||
|
2018
|
3.10
|
|||||
|
See Notes to Consolidated Financial Statements.
|
||||||
80
|
Notes to Consolidated Financial Statements
|
Phillips 66
|
Note 1—
Summary of Significant Accounting Policies
|
▪
|
Consolidation Principles and Investments
—Our consolidated financial statements include the accounts of majority-owned, controlled subsidiaries and variable interest entities (VIEs) where we are the primary beneficiary. Undivided interests in pipelines, natural gas plants and terminals are consolidated on a proportionate basis. See
Note 27—Phillips 66 Partners LP
, for further discussion on our significant consolidated VIE.
|
The equity method is used to account for investments in affiliates in which we have the ability to exert significant influence over the affiliates’ operating and financial policies, including VIEs of which we are not the primary beneficiary. Other securities and investments are generally carried at fair value, or cost less impairments, if any, adjusted up or down for price changes in similar financial instruments issued by the investee, when and if observed. See
Note 7—Investments, Loans and Long-Term Receivables
, for further discussion on our significant nonconsolidated VIEs.
|
▪
|
Recasted Financial Information
—Certain prior period financial information has been recasted to reflect the current year’s presentation.
|
|
▪
|
Use of Estimates
—The preparation of financial statements in conformity with generally accepted accounting principles in the United States (GAAP) requires management to make estimates and assumptions that affect the reported amounts of assets, liabilities, revenues and expenses, and the disclosure of contingent assets and liabilities. Actual results could differ from these estimates.
|
|
▪
|
Foreign Currency Translation
—Adjustments resulting from the process of translating foreign functional currency financial statements into U.S. dollars are included in accumulated other comprehensive income (loss) in stockholders’ equity. Foreign currency transaction gains and losses result from remeasuring monetary assets and liabilities denominated in a foreign currency into the functional currency of our subsidiary holding the asset or liability. We include these transaction gains and losses in current earnings. Most of our foreign operations use their local currency as the functional currency.
|
|
▪
|
Cash Equivalents
—Cash equivalents are highly liquid, short-term investments that are readily convertible to known amounts of cash and will mature within 90 days or less from the date of acquisition. We carry these investments at cost plus accrued interest.
|
|
▪
|
Inventories
—We have several valuation methods for our various types of inventories and consistently use the following methods for each type of inventory. Crude oil and petroleum products inventories are valued at the lower of cost or market in the aggregate, primarily on the last-in, first-out (LIFO) basis. Any necessary lower-of-cost-or-market write-downs at year end are recorded as permanent adjustments to the LIFO cost basis. LIFO is used to better match current inventory costs with current revenues and to meet tax-conformity requirements. Costs include both direct and indirect expenditures incurred in bringing an item or product to its existing condition and location. Materials and supplies inventories are valued using the weighted-average-cost method.
|
|
▪
|
Fair Value Measurements
—We categorize assets and liabilities measured at fair value into one of three different levels depending on the observability of the inputs employed in the measurement. Level 1 inputs are quoted prices in active markets for identical assets or liabilities. Level 2 inputs are inputs other than quoted prices included within Level 1 that are observable for the asset or liability, either directly or indirectly, through market-corroborated inputs. Level 3 inputs are unobservable inputs for the asset or liability that are used to measure fair value to the extent that relevant observable inputs are not available, and that reflect the assumptions we believe market participants would use when pricing an asset or liability for which there is little, if any, market activity at the measurement date.
|
81
|
▪
|
Derivative Instruments
—Derivative instruments are recorded on the balance sheet at fair value. We have master netting agreements with our exchange-cleared instrument counterparties and certain of our counterparties to other commodity instrument contracts (e.g., physical commodity forward contracts). We have elected to net derivative assets and liabilities with the same counterparty on the balance sheet if the legal right of offset exists and certain other criteria are met. We also net collateral payables and receivables against derivative assets and derivative liabilities, respectively.
|
Recognition and classification of the gain or loss that results from recording and adjusting a derivative to fair value depends on the purpose for issuing or holding the derivative. All realized and unrealized gains and losses from derivative instruments for which we do not apply hedge accounting are immediately recognized in our consolidated statement of income. Unrealized gains or losses from derivative instruments that qualify for and are designated as cash flow hedges are recognized in other comprehensive income (loss) and appear on the balance sheet in accumulated other comprehensive income (loss) until the hedged transactions are recognized in earnings. However, to the extent the change in the fair value of a derivative instrument exceeds the change in the anticipated cash flows of the hedged transaction, the excess gain or loss is recognized immediately in earnings.
|
▪
|
Loans and Long-Term Receivables
—We enter into agreements with other parties to pursue business opportunities, which may require us to provide loans or advances to certain affiliated and non-affiliated companies. Loans are recorded when cash is transferred or seller financing is provided to the affiliated or non-affiliated company pursuant to a loan agreement. The loan balance will increase as interest is earned on the outstanding loan balance and will decrease as interest and principal payments are received. Interest is earned at the loan agreement’s stated interest rate. Loans and long-term receivables are assessed for impairment when events indicate the loan balance may not be fully recovered.
|
|
▪
|
Impairment of Investments in Nonconsolidated Entities
—Investments in nonconsolidated entities accounted for under the equity method are assessed for impairment whenever changes in the facts and circumstances indicate a loss in value has occurred. When indicators exist, the fair value is estimated and compared to the investment carrying value. If any impairment is judgmentally determined to be other than temporary, the carrying value of the investment is written down to fair value. The fair value of the impaired investment is determined based on quoted market prices, if available, or upon the present value of expected future cash flows using discount rates and other assumptions believed to be consistent with those used by principal market participants and a market analysis of comparable assets, if appropriate.
|
|
▪
|
Depreciation and Amortization
—Depreciation and amortization of properties, plants and equipment (PP&E) are determined by either the individual-unit-straight-line method or the group-straight-line method (for those individual units that are highly integrated with other units).
|
|
▪
|
Capitalized Interest
—A portion of interest from external borrowings is capitalized on major projects with an expected construction period of
one
year or longer. Capitalized interest is added to the cost of the related asset, and is amortized over the useful life of the related asset.
|
|
▪
|
Impairment of Properties, Plants and Equipment
—PP&E used in operations are assessed for impairment whenever changes in facts and circumstances indicate a possible significant deterioration in the future cash flows expected to be generated by an asset group. If indicators of potential impairment exist, an undiscounted cash flow test is performed. If the sum of the undiscounted expected future pre-tax cash flows of an asset group is less than the carrying value of the asset group, including applicable liabilities, the carrying value of the PP&E included in the asset group is written down to estimated fair value and the write down is reported in the “Impairments” line on our consolidated statement of income in the period in which the impairment determination is made. Individual assets are grouped for impairment purposes at the lowest level for which identifiable cash flows are largely independent of the cash flows of assets (for example, at a refinery complex level). Because there is usually a lack of quoted market prices for long-lived assets, the fair value of impaired assets is typically determined using one or more of the following methods: the present values of expected future cash flows using discount rates and other assumptions believed to be consistent with those used by principal market participants; a market multiple of earnings for similar assets; or historical market transactions of similar assets, adjusted using principal market participant assumptions when necessary. Long-lived assets held for sale
|
82
are accounted for at the lower of amortized cost or fair value, less cost to sell, with fair value determined using a binding negotiated price, if available, or present value of expected future cash flows as previously described.
The expected future cash flows used for impairment reviews and related fair value calculations are based on estimated future volumes, prices, costs, margins and capital project decisions, considering all available evidence at the date of review.
|
▪
|
Property Dispositions
—When complete units of depreciable property are sold, the asset cost and related accumulated depreciation are eliminated, with any gain or loss reflected in the “Net gain on dispositions” line on our consolidated statement of income. When less than complete units of depreciable property are disposed of or retired, the difference between asset cost and salvage value is charged or credited to accumulated depreciation.
|
|
▪
|
Goodwill
—Goodwill represents the excess of the purchase price over the estimated fair value of the net assets acquired in a business combination. It is not amortized, but is tested for impairment annually and when events or changes in circumstance indicate that the fair value of a reporting unit with goodwill is below its carrying value. The impairment test requires allocating goodwill and other assets and liabilities to reporting units. The fair value of each reporting unit is determined and compared to the book value of the reporting unit. If the fair value of the reporting unit is less than the book value, an impairment is recognized for the amount by which the book value exceeds the reporting unit’s fair value. A goodwill loss cannot exceed the total amount of goodwill allocated to that reporting unit. For purposes of testing goodwill for impairment, we have
three
reporting units with goodwill balances: Transportation, Refining, and Marketing and Specialties.
|
|
▪
|
Intangible Assets Other Than Goodwill
—Intangible assets with finite useful lives are amortized using the straight-line method over their useful lives. Intangible assets with indefinite useful lives are not amortized, but are tested at least annually for impairment. Each reporting period, we evaluate the remaining useful lives of intangible assets not being amortized to determine whether events and circumstances continue to support the indefinite useful life classification. Indefinite-lived intangible assets are considered impaired if their fair value is lower than their net book value. The fair value of intangible assets is determined based on quoted market prices in active markets, if available. If quoted market prices are not available, the fair value of intangible assets is determined based upon the present values of expected future cash flows using discount rates and other assumptions believed to be consistent with those used by principal market participants, or upon estimated replacement cost, if expected future cash flows from the intangible asset are not determinable.
|
|
▪
|
Asset Retirement Obligations and Environmental Costs
—The fair value of legal obligations to retire and remove long-lived assets are recorded in the period in which the obligation arises. When the liability is initially recorded, we capitalize this cost by increasing the carrying amount of the related PP&E. Over time, the liability is increased for the change in its present value, and the capitalized cost in PP&E is depreciated over the useful life of the related asset. If our estimate of the liability changes after initial recognition, we record an adjustment to the liability and PP&E.
|
Environmental expenditures are expensed or capitalized, depending upon their future economic benefit. Expenditures relating to an existing condition caused by past operations, and those having no future economic benefit, are expensed. Liabilities for environmental expenditures are recorded on an undiscounted basis (unless acquired in a business combination) when environmental assessments or cleanups are probable and the costs can be reasonably estimated. Recoveries of environmental remediation costs from other parties, such as state reimbursement funds, are recorded as assets when their receipt is probable and estimable.
|
▪
|
Guarantees
—The fair value of a guarantee is determined and recorded as a liability at the time the guarantee is given. The initial liability is subsequently reduced as we are released from exposure under the guarantee. We amortize the guarantee liability over the relevant time period, if one exists, based on the facts and circumstances surrounding each type of guarantee. In cases where the guarantee term is indefinite, we reverse the liability when we have information indicating the liability has essentially been relieved or amortize it over an appropriate time period as the fair value of our guarantee exposure declines over time. We amortize the guarantee liability to the related income statement line item based on the nature of the guarantee. When it becomes probable we will have to perform on a guarantee, we accrue a separate liability for the excess amount above the guarantee’s book
|
83
value, if it is reasonably estimable, based on the facts and circumstances at that time. We reverse the fair value liability only when there is no further exposure under the guarantee.
|
▪
|
Treasury Stock
—We record treasury stock purchases at cost, which includes incremental direct transaction costs. Amounts are recorded as reductions of stockholders’ equity on the consolidated balance sheet.
|
|
▪
|
Revenue Recognition
—Our revenues are primarily associated with sales of refined petroleum products, crude oil and natural gas liquids (NGL). Each gallon, or other unit of measure of product, is separately identifiable and represents a distinct performance obligation to which a transaction price is allocated. The transaction prices of our contracts with customers are either fixed or variable, with variable pricing based upon various market indices. For our contracts that include variable consideration, we utilize the variable consideration allocation exception, whereby the variable consideration is only allocated to the performance obligations that are satisfied during the period. The related revenue is recognized at a point in time when control passes to the customer, which is when title and the risk of ownership passes to the customer and physical delivery of goods occurs, either immediately or within a fixed delivery schedule that is reasonable and customary in the industry. The payment terms with our customers vary based on the product or service provided, but usually are 30 days or less.
|
Revenues associated with pipeline transportation services are recognized at a point in time when the volumes are delivered based on contractual rates. Revenues associated with terminaling and storage services are recognized over time as the services are performed based on throughput volume or capacity utilization at contractual rates.
Revenues associated with transactions commonly called buy/sell contracts, in which the purchase and sale of inventory with the same counterparty are entered into in contemplation of one another, are combined and reported in the “Purchased crude oil and products” line on our consolidated statement of income (i.e., these transactions are recorded net).
|
▪
|
Taxes Collected from Customers and Remitted to Governmental Authorities
—Effective for reporting periods ending after our adoption of Financial Accounting Standards Board (FASB) Accounting Standards Update (ASU) No. 2014-09 on January 1, 2018, excise taxes on sales of refined petroleum products charged to our customers are presented net of taxes on sales of refined petroleum products owed to governmental authorities in the “Taxes other than income taxes” line on our consolidated statement of income. For reporting periods ending prior to January 1, 2018, excise taxes on sales of refined petroleum products charged to our customers are presented in the “Sales and other operating revenues” line on our consolidated statement of income, and excise taxes on sales of refined petroleum products owed to governmental authorities are presented in the “Taxes other than income taxes” line on our consolidated statement of income. See
Note 2—Changes in Accounting Principles
, for more information regarding our adoption of this ASU.
|
Other sales and value-added taxes are recorded net in the “Taxes other than income taxes” line on our consolidated statement of income.
|
▪
|
Shipping and Handling Costs
—We have elected to account for shipping and handling costs as fulfillment activities and include these activities in the “Purchased crude oil and products” line on our consolidated statement of income. Freight costs billed to customers are recorded in “Sales and other operating revenues.”
|
|
▪
|
Maintenance and Repairs
—Costs of maintenance and repairs, which are not significant improvements, are expensed when incurred. Major refinery maintenance turnarounds are expensed as incurred.
|
|
▪
|
Share-Based Compensation
—We recognize share-based compensation expense over the shorter of: (1) the service period (i.e., the stated period of time required to earn the award); or (2) the period beginning at the start of the service period and ending when an employee first becomes eligible for retirement, but not less than
six
months as this is the minimum period of time required for an award not to be subject to forfeiture. Our equity-classified programs generally provide accelerated vesting (i.e., a waiver of the remaining period of service required to earn an award) for awards held by employees at the time they become eligible for retirement (at age
55
with
5
years of service). We have elected to recognize expense on a straight-line basis over the service period for the entire award, irrespective of whether the award was granted with ratable or cliff vesting, and have elected to recognize forfeitures of awards when they occur.
|
84
|
▪
|
Income Taxes
—Income taxes are accounted for under the asset and liability method. Deferred tax assets and liabilities are recognized for the future tax consequences attributable to differences between the financial statement carrying amounts of existing assets and liabilities and their respective tax bases. Deferred tax assets and liabilities are measured using enacted tax rates expected to apply to taxable income in the years in which those temporary differences are expected to be recovered or settled. The effect on deferred tax assets and liabilities of a change in tax rates is recognized in income in the period that includes the enactment date. Interest related to unrecognized income tax benefits is reflected in interest expense, and penalties in operating expenses.
|
Note 2—
Changes in Accounting Principles
Effective January 1, 2018, we adopted ASU No. 2017-05, “Other Income—Gains and Losses from the Derecognition of Nonfinancial Assets (Subtopic 610-20),” which clarifies the scope and accounting for the sale or transfer of nonfinancial assets and in substance nonfinancial assets to noncustomers, including partial sales. This ASU eliminated the use of carryover basis for most nonmonetary exchanges, including contributions of assets to equity-method joint ventures, and could result in the entity recognizing a gain or loss on the sale or transfer of nonfinancial assets. At the time of adoption, there was no impact on our consolidated financial statements from this ASU.
Effective January 1, 2018, we adopted ASU No. 2017-01, “Business Combinations (Topic 805): Clarifying the Definition of a Business,” which clarifies the definition of a business with the objective of adding guidance to assist in evaluating whether transactions should be accounted for as acquisitions of assets or businesses. The amendment provides a screen for determining when a transaction involves an acquisition of a business. If substantially all of the fair value of the gross assets acquired is concentrated in a single identifiable asset, or a group of similar identifiable assets, then the screen is met and the transaction is not considered an acquisition of a business. If the screen is not met, the amendment requires that to be considered a business, the operation must include at a minimum an input and a substantive process that together significantly contribute to the ability to create an output. The guidance may reduce the number of future transactions accounted for as business acquisitions. At the time of adoption, there was no impact on our consolidated financial statements from this ASU.
Effective January 1, 2018, we adopted ASU No. 2016-16, “Income Taxes (Topic 740): Intra-Entity Asset Transfers of Assets Other Than Inventory.” This ASU requires the income tax consequences of an intra-entity transfer of an asset, other than inventory, to be recognized when the transfer occurs. At the time of adoption, this ASU did not have a material impact on our consolidated financial statements.
Effective January 1, 2018, we adopted ASU No. 2016-01, “Financial Instruments—Overall (Subtopic 825-10): Recognition and Measurement of Financial Assets and Financial Liabilities.” The majority of this ASU’s provisions amend only the presentation or disclosures of financial instruments; however, one provision could also affect net income. Equity investments carried under the cost method or the lower of cost or fair value method of accounting, in accordance with previous GAAP, will have to be carried at fair value with changes in fair value recorded in net income. For equity investments that do not have readily determinable fair values, a company may elect to carry such investments at cost less impairments, if any, adjusted up or down for price changes in similar financial instruments issued by the investee, when and if observed. At the time of adoption, this ASU did not have a material impact on our consolidated financial statements.
85
Effective January 1, 2018, we adopted ASU No. 2014-09, “Revenue from Contracts with Customers (Topic 606),” using the modified retrospective transition method applied to all contracts. Under the new guidance, recognition of revenue involves a multiple step approach including (i) identifying the contract, (ii) identifying the separate performance obligations, (iii) determining the transaction price, (iv) allocating the price to the performance obligations and (v) recognizing the revenue as the obligations are satisfied. Additional disclosures are required to enable users of financial statements to understand the nature, amount, timing and uncertainty of revenue and cash flows arising from contracts with customers.
We recorded noncash cumulative effect adjustments to our opening total equity balance as of January 1, 2018, to increase retained earnings by
$35 million
, net of
$11 million
of income taxes, and noncontrolling interests by
$13 million
. These adjustments primarily reflected amounts recorded by our equity-method investees related to contracts that contain tier-pricing and minimum volume commitments with recovery provisions.
In addition, prospectively from January 1, 2018, our presentation of excise taxes on sales of refined petroleum products changed to a net basis from a gross basis. As a result, the “Sales and other operating revenues” and “Taxes other than income taxes” lines on our consolidated statement of income for the year ended
December 31, 2018
, are not presented on a comparable basis to the years ended
December 31, 2017
and 2016. See
Note 1—Summary of Significant Accounting Policies
, for more information on our presentation of excise taxes on sales of refined petroleum products.
Note 3—
Sales and Other Operating Revenues
Disaggregated Revenues
The following tables present our disaggregated sales and other operating revenues:
|
|
Millions of Dollars
|
||||||||
|
|
2018
|
|
2017*
|
|
2016*
|
|
|||
|
Product Line and Services
|
|||||||||
|
Refined petroleum products
|
$
|
87,967
|
|
85,405
|
|
73,385
|
|
||
|
Crude oil resales
|
16,419
|
|
11,808
|
|
7,594
|
|
|||
|
NGL
|
6,161
|
|
4,670
|
|
3,107
|
|
|||
|
Services and other
|
914
|
|
471
|
|
193
|
|
|||
|
Consolidated sales and other operating revenues
|
$
|
111,461
|
|
102,354
|
|
84,279
|
|
||
|
Geographic Location**
|
|||||||||
|
United States
|
$
|
86,401
|
|
75,684
|
|
59,742
|
|
||
|
United Kingdom
|
11,054
|
|
10,626
|
|
9,895
|
|
|||
|
Germany
|
4,352
|
|
6,692
|
|
6,128
|
|
|||
|
Other foreign countries
|
9,654
|
|
9,352
|
|
8,514
|
|
|||
|
Consolidated sales and other operating revenues
|
$
|
111,461
|
|
102,354
|
|
84,279
|
|
||
* Sales and other operating revenues for the years ended December 31, 2017 and 2016, are presented in accordance with accounting standards in effect prior to our adoption of ASU No. 2014-09 on January 1, 2018. See
Note 2—Changes in Accounting Principles
, for further discussion regarding our adoption of ASU No. 2014-09.
** Sales and other operating revenues are attributable to countries based on the location of the operations generating the revenues.
86
Contract-Related Assets and Liabilities
At
December 31, 2018
, and January 1, 2018, receivables from contracts with customers were
$4,993 million
and
$6,186 million
, respectively. Significant non-customer balances, such as buy/sell receivables and excise tax receivables, were excluded from these amounts.
Our contract-related assets also include payments we make to our marketing customers related to incentive programs. An incentive payment is initially recognized as an asset and subsequently amortized as a reduction to revenue over the contract term, which generally ranges from
5
to
15
years. At
December 31, 2018
, and January 1, 2018, our asset balances related to such payments were
$248 million
and
$208 million
, respectively.
Our contract liabilities represent advances from our customers prior to product or service delivery. At
December 31, 2018
, and January 1, 2018, contract liabilities were not material.
Remaining Performance Obligations
Most of our contracts with customers are spot contracts or term contracts with only variable consideration. We do not disclose remaining performance obligations for these contracts as the expected duration is one year or less or because the variable consideration has been allocated entirely to an unsatisfied performance obligation. We also have certain contracts in our Midstream segment that include minimum volume commitments with fixed pricing, which mostly expire by 2021. At
December 31, 2018
, the remaining performance obligations related to these minimum volume commitment contracts were not material.
Note 4—
Inventories
Inventories at December 31 consisted of the following:
|
|
Millions of Dollars
|
|||||
|
|
2018
|
|
2017
|
|
||
|
Crude oil and petroleum products
|
$
|
3,238
|
|
3,106
|
|
|
|
Materials and supplies
|
305
|
|
289
|
|
||
|
$
|
3,543
|
|
3,395
|
|
||
Inventories valued on the LIFO basis totaled
$3,123 million
and
$2,980 million
at December 31,
2018
and
2017
, respectively. The estimated excess of current replacement cost over LIFO cost of inventories amounted to approximately
$2.9 billion
and
$4.3 billion
at December 31,
2018
and
2017
, respectively.
LIFO inventory liquidations did not have a material impact on net income for the years ended
December 31, 2018
and
2017
. For the year ended
December 31, 2016
, LIFO inventory liquidations, excluding the disposition of the Whitegate Refinery, decreased net income by approximately
$68 million
.
In conjunction with the Whitegate Refinery disposition, the refinery’s LIFO inventory values were liquidated causing a decrease in net income of
$62 million
during 2016. This LIFO liquidation impact was included in the net gain recognized on the disposition.
87
Note 5—
Business Combinations
Merey Sweeny LLC, successor to Merey Sweeny, L.P. (both referred to herein as Merey Sweeny), owns a delayed coker and related facilities at the Sweeny Refinery. In February 2017, we began accounting for Merey Sweeny as a consolidated subsidiary because the exercise of a call right triggered by certain defaults by the co-venturer, Petróleos de Venezuela S.A. (PDVSA), with respect to supply of crude oil to the Sweeny Refinery ceased to be subject to legal challenge. The purchase price for PDVSA’s
50 percent
ownership interest was determined by a contractual formula. As the distributions PDVSA received from Merey Sweeny exceeded the amounts it contributed to Merey Sweeny, the contractual formula required no cash consideration for the acquisition.
Based on a third-party appraisal of the fair value of Merey Sweeny’s net assets, utilizing discounted cash flows and replacement costs, the acquisition of PDVSA’s
50 percent
interest resulted in the recognition of a pre-tax gain of
$423 million
in the first quarter of 2017. This gain was included in the “Other income” line on our consolidated statement of income. The fair value of our original equity interest in Merey Sweeny immediately prior to the deemed acquisition was
$145 million
. As a result of the transaction, we recorded
$318 million
of restricted cash,
$250 million
of PP&E and
$238 million
of debt, as well as a net
$93 million
for the elimination of our equity investment in Merey Sweeny and net intercompany payables. Our acquisition accounting was finalized in the first quarter of 2017.
The results of Merey Sweeny were included in our Refining segment until October 2017, when we contributed our
100 percent
interest in Merey Sweeny to Phillips 66 Partners LP (Phillips 66 Partners), which is included in our Midstream segment.
In November 2016, Phillips 66 Partners acquired NGL logistics assets located in southeast Louisiana, consisting of approximately
500
miles of pipelines and storage caverns connecting multiple fractionation facilities, refineries and a petrochemical facility. The acquisition provided an opportunity for fee-based growth in the Louisiana market within our Midstream segment. The acquisition was included in the “Capital expenditures and investments” line on our consolidated statement of cash flows. At the acquisition date, we recorded
$183 million
of PP&E and
$3 million
of goodwill. Our acquisition accounting was finalized during the first quarter of 2017, with no change to the provisional amounts recorded in 2016.
Note 6—
Assets Held for Sale or Sold
In September 2016, we completed the sale of the Whitegate Refinery and related marketing assets, which were included primarily in our Refining segment. The net carrying value of the assets at the time of their disposition was
$135 million
, which consisted of
$127 million
of inventory, other working capital, and PP&E; and
$8 million
of allocated goodwill. An immaterial gain was recognized in 2016 on the disposition.
88
Note 7—
Investments, Loans and Long-Term Receivables
Components of investments and long-term receivables at December 31 were:
|
|
Millions of Dollars
|
|||||
|
|
2018
|
|
2017
|
|
||
|
Equity investments
|
$
|
14,218
|
|
13,733
|
|
|
|
Other investments
|
106
|
|
114
|
|
||
|
Loans and long-term receivables
|
97
|
|
94
|
|
||
|
$
|
14,421
|
|
13,941
|
|
||
Equity Investments
Significant affiliated companies accounted for under the equity method, including nonconsolidated VIEs, at
December 31, 2018
and 2017, included:
|
•
|
Chevron Phillips Chemical Company LLC (CPChem)
—
50
-percent-owned joint venture that manufactures and markets petrochemicals and plastics. We have multiple supply and purchase agreements in place with CPChem, ranging in initial terms from
one
to
99
years, with extension options. These agreements cover sales and purchases of refined petroleum products, solvents, and petrochemical and NGL feedstocks, as well as fuel oils and gases. All products are purchased and sold under specified pricing formulas based on various published pricing indices. At
December 31, 2018
and 2017, the book value of our investment in CPChem was
$6,233 million
and
$6,222 million
, respectively.
|
|
•
|
DCP Midstream, LLC (DCP Midstream)
—
50
-percent-owned joint venture that owns and operates gas plants, gathering systems, storage facilities and fractionation plants, through its subsidiary DCP Midstream, LP (DCP Partners). DCP Midstream markets a portion of its NGL to us and our equity affiliates under existing contracts. At
December 31, 2018
and 2017, the book value of our investment in DCP Midstream was
$2,240 million
and
$2,227 million
, respectively.
|
|
•
|
WRB Refining LP (WRB)
—
50
-percent-owned joint venture that owns the Wood River and Borger refineries located in Roxana, Illinois, and Borger, Texas, respectively, for which we are the operator and managing partner. At
December 31, 2018
and 2017, the book value of our investment in WRB was
$2,108 million
and
$2,269 million
, respectively.
|
We have a basis difference for our investment in WRB because the carrying value of our investment is lower than our share of WRB’s recorded net assets. This basis difference was primarily the result of our contribution of these refineries to WRB. On the contribution closing date, a basis difference was created because the fair value of the contributed assets recorded by WRB exceeded our historical book value. The contribution-related basis difference is primarily being amortized and recognized as a benefit to equity earnings evenly over a period of
26
years, which was the estimated remaining useful life of the refineries’ PP&E at the contribution closing date. At December 31, 2018, the aggregate remaining basis difference for this investment was
$2,610 million
. Equity earnings for the years ended December 31,
2018
,
2017
and
2016
, were increased by
$177 million
,
$186 million
and
$185 million
, respectively, due to the amortization of our aggregate basis difference.
|
•
|
Dakota Access, LLC (Dakota Access) and Energy Transfer Crude Oil Company, LLC (ETCO)
—Phillips 66 Partners’
two
25
-percent-owned joint ventures. Dakota Access owns a pipeline system that delivers crude oil from the Bakken/Three Forks production area in North Dakota to Patoka, Illinois, and ETCO owns a connecting crude oil pipeline system from Patoka, Illinois, to Nederland, Texas. These two pipeline systems collectively form the Bakken Pipeline system, which is operated by a co-venturer. The Bakken Pipeline system went into service in June 2017. At
December 31, 2018
and 2017, the aggregate book value of Phillips 66 Partners’ investments in Dakota Access and ETCO was
$608 million
and
$621 million
, respectively.
|
89
|
•
|
DCP Sand Hills Pipeline, LLC (Sand Hills)
—Phillips 66 Partners’
33
-percent-owned joint venture that owns an NGL pipeline system that extends from the Permian Basin and Eagle Ford to facilities on the Texas Gulf Coast and to the Mont Belvieu, Texas market hub. The Sand Hills Pipeline system is operated by DCP Partners. At
December 31, 2018
and 2017, the book value of Phillips 66 Partners’ investment in Sand Hills was
$601 million
and
$515 million
, respectively.
|
|
•
|
Rockies Express Pipeline LLC (REX)
—
25
-percent-owned joint venture that owns a natural gas pipeline system that extends from Wyoming and Colorado to Ohio with a bi-directional section that extends from Ohio to Illinois. The REX Pipeline system is operated by our co-venturer. In July 2018, we contributed
$138 million
to REX to cover our
25 percent
share of a
$550 million
debt repayment. Our capital contribution was included in the “Capital expenditures and investments” line on our consolidated statement of cash flows. At
December 31, 2018
and 2017, the book value of our investment in REX was
$600 million
and
$445 million
, respectively.
|
We have a basis difference for our investment in REX because the carrying value of our investment is lower than our share of REX’s recorded net assets. This basis difference was created by historical impairment charges we recorded for this investment. This basis difference is being amortized and recognized as a benefit to equity earnings evenly over a period of
25
years, which was the estimated remaining useful life of REX’s PP&E when the impairment charges were recorded. At December 31, 2018, the remaining basis difference for this investment was
$357 million
. Equity earnings for the years ended December 31, 2018, 2017 and 2016, were each increased by approximately
$20 million
due to the amortization of our basis difference.
|
•
|
Gray Oak Pipeline, LLC (Gray Oak)
—Phillips 66 Partners’ consolidated subsidiary, Gray Oak Holdings LLC (Holdings LLC), owned a
75
percent interest in a joint venture formed in 2018 to develop and construct the Gray Oak Pipeline system which, upon completion, will provide crude oil transportation from the Permian Basin and Eagle Ford to destinations in the Corpus Christi and Freeport markets on the Texas Gulf Coast. The pipeline system is expected to be placed in service by the end of 2019.
|
Phillips 66 Partners accounts for the investment in Gray Oak under the equity method because it does not have sufficient voting rights over key governance provisions to assert control over Gray Oak. Gray Oak is considered a VIE because it does not have sufficient equity at risk to fully fund the construction of all assets required for principal operations. Phillips 66 Partners has determined it is not the primary beneficiary because it and its co-venturer jointly direct the activities of Gray Oak that most significantly impact economic performance. At
December 31, 2018
, Phillips 66 Partners’ maximum exposure to loss was
$373 million
, which represented the book value of the investment in Gray Oak of
$288 million
and guaranteed purchase obligations of
$85 million
.
In February 2019, another party exercised its option to acquire a
10 percent
interest in Gray Oak, which reduced Holdings LLC’s ownership interest to
65 percent
.
See
Note 27—Phillips 66 Partners LP
, for additional information regarding Phillips 66 Partners’ ownership in Holdings LLC and Gray Oak.
|
•
|
Bayou Bridge Pipeline, LLC (Bayou Bridge
)—Phillips 66 Partners’
40
-percent-owned joint venture that owns a pipeline that delivers crude oil from Nederland, Texas, to Lake Charles, Louisiana. The Bayou Bridge Pipeline is operated by our co-venturer. An extension of the pipeline from Lake Charles to St. James, Louisiana, is expected to be in service in March 2019. At
December 31, 2018
and 2017, the book value of our investment in Bayou Bridge was
$277 million
and
$173 million
, respectively.
|
|
•
|
DCP Southern Hills Pipeline, LLC (Southern Hills)
—Phillips 66 Partners’
33
-percent-owned joint venture that owns an NGL pipeline system that extends from the Midcontinent region to the Mont Belvieu, Texas market hub. The Southern Hills Pipeline system is operated by DCP Partners. At
December 31, 2018
and 2017, the book value of Phillips 66 Partners’ investment in Southern Hills was
$206 million
and
$209 million
, respectively.
|
|
•
|
OnCue Holdings, LLC (OnCue)
—
50
-percent-owned joint venture that owns and operates retail convenience stores. We fully guaranteed various debt agreements of OnCue, and our co-venturer did not participate in the guarantees. This entity is considered a VIE because our debt guarantees resulted in OnCue not being exposed to all potential losses. We have determined we are not the primary beneficiary because we do not have the power to
|
90
direct the activities that most significantly impact economic performance. At
December 31, 2018
, our maximum exposure to loss was
$122 million
, which represented the book value of our investment in OnCue of
$69 million
and guaranteed debt obligations of
$53 million
.
Total distributions received from affiliates were
$2,942 million
,
$1,270 million
, and
$616 million
for the years ended December 31,
2018
,
2017
and
2016
, respectively. In addition, at
December 31, 2018
, retained earnings included approximately
$2,285 million
related to the undistributed earnings of affiliated companies.
Summarized 100 percent financial information for all affiliated companies accounted for under the equity method, on a combined basis, was:
|
|
Millions of Dollars
|
||||||||
|
|
2018
|
|
2017
|
|
2016
|
|
|||
|
Revenues
|
$
|
43,627
|
|
35,523
|
|
30,605
|
|
||
|
Income before income taxes
|
6,066
|
|
3,956
|
|
3,206
|
|
|||
|
Net income
|
5,926
|
|
3,764
|
|
2,960
|
|
|||
|
Current assets
|
6,791
|
|
7,325
|
|
7,097
|
|
|||
|
Noncurrent assets
|
52,649
|
|
49,950
|
|
50,163
|
|
|||
|
Current liabilities
|
8,047
|
|
5,248
|
|
5,173
|
|
|||
|
Noncurrent liabilities
|
10,695
|
|
13,743
|
|
13,709
|
|
|||
|
Noncontrolling interests
|
2,550
|
|
2,549
|
|
2,260
|
|
|||
Related Party Loans and Advances
In 2017, we received payment of the
$250 million
outstanding sponsor loans to the Dakota Access and ETCO joint ventures. We also received payment of the
$75 million
partner loan we made to WRB in 2016. These cash inflows, totaling
$325 million
, are included in the “Collection of advances/loans—related parties” line on our consolidated statement of cash flows.
Note 8—
Properties, Plants and Equipment
Our investment in PP&E is recorded at cost. Investments in refining and processing facilities are generally depreciated on a straight-line basis over a
25
-year life, pipeline assets over a
45
-year life and terminal assets over a
33
-year life. The company’s investment in PP&E, with the associated accumulated depreciation and amortization (Accum. D&A), at December 31 was:
|
|
Millions of Dollars
|
|||||||||||||||||
|
|
2018
|
2017
|
||||||||||||||||
|
|
Gross
PP&E
|
|
Accum.
D&A
|
|
Net
PP&E
|
|
Gross
PP&E
|
|
Accum.
D&A
|
|
Net
PP&E
|
|
||||||
|
Midstream
|
$
|
9,663
|
|
2,100
|
|
7,563
|
|
8,849
|
|
1,853
|
|
6,996
|
|
|||||
|
Chemicals
|
—
|
|
—
|
|
—
|
|
—
|
|
—
|
|
—
|
|
||||||
|
Refining
|
22,640
|
|
9,531
|
|
13,109
|
|
22,144
|
|
8,987
|
|
13,157
|
|
||||||
|
Marketing and Specialties
|
1,671
|
|
926
|
|
745
|
|
1,658
|
|
909
|
|
749
|
|
||||||
|
Corporate and Other
|
1,223
|
|
622
|
|
601
|
|
1,091
|
|
533
|
|
558
|
|
||||||
|
$
|
35,197
|
|
13,179
|
|
22,018
|
|
|
33,742
|
|
|
12,282
|
|
21,460
|
|
||||
91
Note 9—
Goodwill and Intangibles
Goodwill
The carrying amount of goodwill by segment at December 31 was:
|
|
Millions of Dollars
|
|||||||||||
|
|
Midstream
|
|
Refining
|
|
Marketing and Specialties
|
|
Total
|
|
||||
|
Balance at January 1, 2017
|
$
|
626
|
|
1,805
|
|
839
|
|
3,270
|
|
|||
|
Adjustments
|
—
|
|
—
|
|
—
|
|
—
|
|
||||
|
Balance at December 31, 2017
|
626
|
|
1,805
|
|
839
|
|
3,270
|
|
||||
|
Adjustments
|
—
|
|
—
|
|
—
|
|
—
|
|
||||
|
Balance at December 31, 2018
|
$
|
626
|
|
1,805
|
|
839
|
|
3,270
|
|
|||
Intangible Assets
The gross carrying value of indefinite-lived intangible assets at December 31 consisted of the following:
|
Millions of Dollars
|
||||||
|
|
2018
|
|
2017
|
|
||
|
Trade names and trademarks
|
$
|
503
|
|
503
|
|
|
|
Refinery air and operating permits
|
250
|
|
252
|
|
||
|
Other
|
—
|
|
1
|
|
||
|
$
|
753
|
|
756
|
|
||
The net book value of our amortized intangible assets was
$116 million
and
$120 million
at
December 31, 2018
and 2017, respectively. Acquisitions of amortized intangible assets were not material in 2018 and 2017. For the years ended December 31,
2018
,
2017
and
2016
, amortization expense was
$14 million
,
$21 million
and
$18 million
, respectively, and is expected to be less than
$20 million
per year in future years.
92
Note 10—
Asset Retirement Obligations and Accrued Environmental Costs
Asset retirement obligations and accrued environmental costs at December 31 were:
|
|
Millions of Dollars
|
|||||
|
|
2018
|
|
2017
|
|
||
|
Asset retirement obligations
|
$
|
261
|
|
268
|
|
|
|
Accrued environmental costs
|
447
|
|
458
|
|
||
|
Total asset retirement obligations and accrued environmental costs
|
708
|
|
726
|
|
||
|
Asset retirement obligations and accrued environmental costs due within one year*
|
(84
|
)
|
(85
|
)
|
||
|
Long-term asset retirement obligations and accrued environmental costs
|
$
|
624
|
|
641
|
|
|
* Classified as a current liability on the consolidated balance sheet, under the caption “Other accruals.”
Asset Retirement Obligations
We have asset retirement obligations that we are required to perform under law or contract once an asset is permanently taken out of service. Most of these obligations are not expected to be paid until many years in the future and are expected to be funded from general company resources at the time of removal. Our largest individual obligations involve asbestos abatement at refineries.
During the years ended December 31,
2018
and
2017
, our overall asset retirement obligation changed as follows:
|
|
Millions of Dollars
|
|||||
|
|
2018
|
|
2017
|
|
||
|
Balance at January 1
|
$
|
268
|
|
244
|
|
|
|
Accretion of discount
|
10
|
|
10
|
|
||
|
Changes in estimates of existing obligations
|
3
|
|
17
|
|
||
|
Spending on existing obligations
|
(15
|
)
|
(14
|
)
|
||
|
Foreign currency translation
|
(5
|
)
|
11
|
|
||
|
Balance at December 31
|
$
|
261
|
|
268
|
|
|
Accrued Environmental Costs
For the year ended December 31, 2018, the
$11 million
decrease in total accrued environmental costs was due to payments and settlements during the year, which exceeded new accruals, accrual adjustments and accretion.
Of our total accrued environmental costs at
December 31, 2018
,
$224 million
was primarily related to cleanup at domestic refineries and underground storage tanks at U.S. service stations;
$167 million
was associated with nonoperator sites; and
$56 million
was related to sites at which we have been named a potentially responsible party under federal or state laws. A large portion of our expected environmental expenditures have been discounted as these obligations were acquired in various business combinations. Expected expenditures for acquired environmental obligations were discounted using a weighted-average discount rate of approximately
5 percent
. At
December 31, 2018
, the accrued balance for acquired environmental liabilities was
$261 million
. The expected future undiscounted payments related to the portion of the accrued environmental costs that have been discounted are:
$24 million
in
2019
,
$41 million
in
2020
,
$23 million
in
2021
,
$22 million
in
2022
,
$15 million
in
2023
, and
$206 million
in the aggregate for all years after
2023
.
93
Note 11—
Earnings Per Share
The numerator of basic earnings per share (EPS) is net income attributable to Phillips 66, reduced by noncancelable dividends paid on unvested share-based employee awards during the vesting period (participating securities). The denominator of basic EPS is the sum of the daily weighted-average number of common shares outstanding during the periods presented and fully vested stock and unit awards that have not yet been issued as common stock. The numerator of diluted EPS is also based on net income attributable to Phillips 66, which is reduced only by dividend equivalents paid on participating securities for which the dividends are more dilutive than the participation of the awards in the earnings of the periods presented. To the extent unvested stock, unit or option awards and vested unexercised stock options are dilutive, they are included with the weighted-average common shares outstanding in the denominator. Treasury stock is excluded from the denominator in both basic and diluted EPS.
|
|
2018
|
2017
|
2016
|
||||||||||||
|
Basic
|
|
Diluted
|
|
Basic
|
|
Diluted
|
|
Basic
|
|
Diluted
|
|
||||
|
Amounts Attributed to Phillips 66 Common Stockholders
(millions)
:
|
|||||||||||||||
|
Net income attributable to Phillips 66
|
$
|
5,595
|
|
5,595
|
|
5,106
|
|
5,106
|
|
1,555
|
|
1,555
|
|
||
|
Income allocated to participating securities
|
(6
|
)
|
—
|
|
(6
|
)
|
—
|
|
(6
|
)
|
(5
|
)
|
|||
|
Net income available to common stockholders
|
$
|
5,589
|
|
5,595
|
|
|
5,100
|
|
5,106
|
|
|
1,549
|
|
1,550
|
|
|
Weighted-average common shares outstanding
(thousands)
:
|
467,483
|
|
470,708
|
|
511,268
|
|
515,090
|
|
523,250
|
|
527,531
|
|
|||
|
Effect of share-based compensation
|
3,225
|
|
3,339
|
|
3,822
|
|
3,418
|
|
4,281
|
|
2,535
|
|
|||
|
Weighted-average common shares outstanding—EPS
|
470,708
|
|
474,047
|
|
515,090
|
|
518,508
|
|
527,531
|
|
530,066
|
|
|||
|
Earnings Per Share of Common Stock
(dollars)
|
$
|
11.87
|
|
11.80
|
|
9.90
|
|
9.85
|
|
2.94
|
|
2.92
|
|
||
94
Note 12—
Debt
Short-term and long-term debt at December 31 was:
|
Millions of Dollars
|
||||||
|
2018
|
|
2017
|
|
|||
|
Phillips 66
|
||||||
|
4.300% Senior Notes due April 2022
|
$
|
2,000
|
|
2,000
|
|
|
|
3.900% Senior Notes due March 2028
|
800
|
|
—
|
|
||
|
4.650% Senior Notes due November 2034
|
1,000
|
|
1,000
|
|
||
|
5.875% Senior Notes due May 2042
|
1,500
|
|
1,500
|
|
||
|
4.875% Senior Notes due November 2044
|
1,700
|
|
1,500
|
|
||
|
Floating-rate notes due April 2019 at 2.009% at year-end 2017
|
—
|
|
300
|
|
||
|
Floating-rate notes due April 2020 at 3.186% and 2.109% at year-end 2018 and 2017, respectively
|
300
|
|
300
|
|
||
|
Term loan due April 2020 at 3.422% and 2.469% at year-end 2018 and 2017, respectively
|
200
|
|
450
|
|
||
|
Floating-rate Senior Notes due February 2021 at 3.289% at year-end 2018
|
500
|
|
—
|
|
||
|
Other
|
1
|
|
1
|
|
||
|
Phillips 66 Partners
|
||||||
|
2.646% Senior Notes due February 2020
|
300
|
|
300
|
|
||
|
3.605% Senior Notes due February 2025
|
500
|
|
500
|
|
||
|
3.550% Senior Notes due October 2026
|
500
|
|
500
|
|
||
|
3.750% Senior Notes due March 2028
|
500
|
|
500
|
|
||
|
4.680% Senior Notes due February 2045
|
450
|
|
450
|
|
||
|
4.900% Senior Notes due October 2046
|
625
|
|
625
|
|
||
|
Tax-exempt bonds due April 2020 and April 2021 at 1.885% and 1.935% at year-end 2018 and 2017, respectively
|
75
|
|
100
|
|
||
|
Revolving credit facility due January 2019 and October 2021 at weighted-average rate of 3.669% at year-end 2018
|
125
|
|
—
|
|
||
|
Debt at face value
|
11,076
|
|
10,026
|
|
||
|
Capitalized leases
|
184
|
|
192
|
|
||
|
Net unamortized discounts and debt issuance costs
|
(100
|
)
|
(108
|
)
|
||
|
Total debt
|
11,160
|
|
10,110
|
|
||
|
Short-term debt
|
(67
|
)
|
(41
|
)
|
||
|
Long-term debt
|
$
|
11,093
|
|
10,069
|
|
|
Maturities of borrowings outstanding at December 31,
2018
, inclusive of net unamortized discounts and debt issuance costs, for each of the years from
2019
through
2023
are
$67 million
,
$836 million
,
$636 million
,
$2,005 million
and
$11 million
, respectively.
95
Debt Issuances
2018 Issuances
On March 1, 2018, Phillips 66 closed on a public offering of
$1,500 million
aggregate principal amount of unsecured notes consisting of:
|
•
|
$500 million
of floating-rate Senior Notes due February 2021. Interest on these notes is equal to the three-month London Interbank Offered Rate (LIBOR) plus
0.60%
per annum and is payable quarterly in arrears on February 26, May 26, August 26 and November 26, beginning on May 29, 2018.
|
|
•
|
$800 million
of
3.900%
Senior Notes due March 2028. Interest on these notes is payable semiannually on March 15 and September 15 of each year, beginning on September 15, 2018.
|
|
•
|
An additional
$200 million
of our
4.875%
Senior Notes due November 2044. Interest on these notes is payable semiannually on May 15 and November 15 of each year, beginning on May 15, 2018.
|
These notes are guaranteed by Phillips 66 Company, a wholly owned subsidiary. Phillips 66 used the net proceeds from the issuance of these notes and cash on hand to repay commercial paper borrowings during the three months ended March 31, 2018, and for general corporate purposes. The commercial paper borrowings during the three months ended March 31, 2018, were primarily used to repurchase shares of our common stock. See
Note 17—Equity
, for additional information.
2017 Issuances
In October 2017, Phillips 66 Partners closed on a public offering of
$650 million
aggregate principal amount of senior notes, consisting of
$500 million
of
3.750%
Senior Notes due March 2028 and
$150 million
of
4.680%
Senior Notes due February 2045. Interest on the
3.750%
Senior Notes due March 2028 is payable semiannually in arrears on March 1 and September 1 of each year, commencing on March 1, 2018. Interest on the
4.680%
Senior Notes due February 2045 is payable semiannually in arrears on February 15 and August 15 of each year.
In April 2017, Phillips 66 completed a private offering of
$600 million
aggregate principal amount of unsecured notes, consisting of
$300 million
of floating-rate notes due April 2019 (2019 Notes) and
$300 million
of floating-rate notes due April 2020 (2020 Notes). Interest on these notes is a floating rate equal to three-month LIBOR plus
0.65%
per annum for the 2019 Notes and three-month LIBOR plus
0.75%
per annum for the 2020 Notes. Interest on both series of notes is payable quarterly in arrears on January 15, April 15, July 15 and October 15, commencing in July 2017. The 2019 Notes mature on April 15, 2019, and the 2020 Notes mature on April 15, 2020. The notes are guaranteed by Phillips 66 Company, a wholly owned subsidiary.
Also in April 2017, Phillips 66 entered into term loan facilities with an aggregate borrowing amount of
$900 million
, consisting of a
$450 million
364
-day facility due April 2018 and a
$450 million
three
-year facility due April 2020. Interest on the term loans is a floating rate based on either the Eurodollar rate or the reference rate, plus a margin determined by our long-term credit ratings.
In February 2017, as part of the consolidation of Merey Sweeny, Phillips 66 assumed
$135 million
of
8.850%
Senior Notes due in 2019 and
$100 million
of tax-exempt bonds due between 2018 and 2021. See
Note 5—Business Combinations
, for additional information regarding the consolidation of Merey Sweeny.
Debt Repayments
2018 Repayments
In December 2018, Phillips 66 repaid the
$300 million
floating-rate notes due April 2019.
In June 2018, Phillips 66 repaid
$250 million
of the
$450 million
outstanding under its
three
-year term loan facility due April 2020.
96
2017 Repayments
In October 2017, as part of a contribution of assets to Phillips 66 Partners, Phillips 66 Partners assumed the
$450 million
term loan outstanding under the
364
-day facility originally issued in April 2017, and subsequently repaid the loan. See
Note 27—Phillips 66 Partners LP
, for additional information.
In May 2017, Phillips 66 repaid
$1,500 million
of
2.950%
Senior Notes upon maturity with the funding from the April 2017 debt issuances discussed above. In addition, Phillips 66 repaid
$135 million
of Merey Sweeny
8.850%
Senior Notes due in 2019 originally recorded in February 2017 as part of the consolidation of Merey Sweeny. See
Note 5—Business Combinations
, for additional information regarding the consolidation of Merey Sweeny.
In 2017, Phillips 66 Partners repaid the
$210 million
of borrowings outstanding under its
$750 million
revolving credit facility at December 31, 2016.
Credit Facilities and Commercial Paper
Phillips 66 has a
$5 billion
revolving credit facility that extends until October 2021. This facility may be used for direct bank borrowings, as support for issuances of letters of credit, or as support for our commercial paper program. The facility is with a broad syndicate of financial institutions and contains covenants that are usual and customary for an agreement of this type for comparable commercial borrowers, including a maximum consolidated net debt-to-capitalization ratio of
60 percent
. The agreement has customary events of default, such as nonpayment of principal when due; nonpayment of interest, fees or other amounts; violation of covenants; cross-payment default and cross-acceleration (in each case, to indebtedness in excess of a threshold amount); and a change of control. Borrowings under the facility will incur interest at the LIBOR plus a margin based on the credit rating of our senior unsecured long-term debt as determined from time to time by Standard & Poor’s Financial Services LLC and Moody’s Investors Service, Inc. The facility also provides for customary fees, including administrative agent fees and commitment fees. At December 31,
2018
and
2017
,
no
amount had been drawn under this revolving credit agreement.
Phillips 66 has a
$5 billion
commercial paper program for short-term working capital needs that is supported by our revolving credit facility. Commercial paper maturities are generally limited to
90
days. At December 31,
2018
and
2017
,
no
borrowings were outstanding under the commercial paper program.
Phillips 66 Partners has a
$750 million
revolving credit facility that extends until October 2021. The Phillips 66 Partners facility is with a broad syndicate of financial institutions and contains covenants that are usual and customary for an agreement of this type for comparable commercial borrowers. At Phillips 66 Partners’ option, outstanding borrowings under this facility bear interest at either i) the Eurodollar rate plus a margin based on its credit rating; or ii) the base rate (as described in the facility agreement) plus a margin based on its credit rating. Eurodollar rate borrowings are due on the facility’s termination date, while base rate borrowings are due the earlier of the facility’s termination date or the fourteenth business day after such borrowings were made. At December 31,
2018
, Phillips 66 Partners had borrowings of
$125 million
outstanding under this facility. There were
no
borrowings outstanding under this facility at December 31,
2017
.
Note 13—
Guarantees
At
December 31, 2018
, we were liable for certain contingent obligations under various contractual arrangements as described below. We recognize a liability for the fair value of our obligation as a guarantor for newly issued or modified guarantees. Unless the carrying amount of the liability is noted below, we have not recognized a liability either because the guarantees were issued prior to December 31, 2002, or because the fair value of the obligation is immaterial. In addition, unless otherwise stated, we are not currently performing with any significance under the guarantees and expect future performance to be either immaterial or have only a remote chance of occurrence.
Guarantees of Joint Venture Obligations
At
December 31, 2018
, we had guarantees outstanding for our portion of certain joint venture debt and purchase obligations, which have remaining terms of up to
seven
years. The maximum potential amount of future payments to third parties under these guarantees was approximately
$304 million
. Payment would be required if a joint venture defaults on its obligations.
97
Residual Value Guarantees
Under the operating lease agreement on our headquarters facility in Houston, Texas, we have a residual value guarantee with a maximum future exposure of
$554 million
. The operating lease term ends in
June 2021
and provides us the option, at the end of the lease term, to request to renew the lease, purchase the facility or assist the lessor in marketing it for resale.
We also have residual value guarantees associated with railcar and airplane leases with maximum future exposures totaling
$300 million
, which have remaining terms of up to
five
years. For the years ended
December 31, 2018
,
2017
and
2016
, we recognized incremental operating lease rental expense of
$20 million
,
$45 million
and
$28 million
, respectively, for residual value deficiencies for certain railcar leases based on third-party appraisals of the railcars’ expected fair value at the end of the lease terms. These railcar leases were amended in November 2018 and October 2017 resulting in residual value deficiency settlement payments of
$40 million
and
$53 million
, respectively. At
December 31, 2018
, we do not have any liabilities recorded for residual value deficiencies under our railcar leases.
Indemnifications
Over the years, we have entered into various agreements to sell ownership interests in certain corporations, joint ventures and assets that gave rise to indemnification. Agreements associated with these sales include indemnifications for taxes, litigation, environmental liabilities, permits and licenses and employee claims, as well as real estate indemnity against tenant defaults. The provisions of these indemnifications vary greatly. The majority of these indemnifications are related to environmental issues, which generally have indefinite terms and potentially unlimited exposure. At
December 31, 2018
and 2017, the carrying amount of recorded indemnifications was
$171 million
and
$193 million
, respectively.
We amortize the indemnification liability over the relevant time period, if one exists, based on the facts and circumstances surrounding each type of indemnity. In cases where the indemnification term is indefinite, we will reverse the liability when we have information to support that the liability was essentially relieved or amortize the liability over an appropriate time period as the fair value of our indemnification exposure declines. Although it is reasonably possible future payments may exceed amounts recorded, due to the nature of the indemnifications, it is not possible to make a reasonable estimate of the maximum potential amount of future payments. At December 31, 2018 and 2017, environmental accruals for known contamination of
$101 million
and
$104 million
, respectively, were included in the carrying amount of recorded indemnifications. These environmental accruals were primarily included in the “Asset retirement obligations and accrued environmental costs” line on our consolidated balance sheet. For additional information about environmental liabilities, see
Note 14—Contingencies and Commitments
.
Indemnification and Release Agreement
In 2012, in connection with our separation from ConocoPhillips (the Separation), we entered into the Indemnification and Release Agreement. This agreement governs the treatment between ConocoPhillips and us of matters relating to indemnification, insurance, litigation responsibility and management, and litigation document sharing and cooperation arising in connection with the Separation. Generally, the agreement provides for cross-indemnities principally designed to place financial responsibility for the obligations and liabilities of our business with us and financial responsibility for the obligations and liabilities of ConocoPhillips’ business with ConocoPhillips. The agreement also establishes procedures for handling claims subject to indemnification and related matters.
98
Note 14—
Contingencies and Commitments
A number of lawsuits involving a variety of claims that arose in the ordinary course of business have been filed against us or are subject to indemnifications provided by us. We also may be required to remove or mitigate the effects on the environment of the placement, storage, disposal or release of certain chemical, mineral and petroleum substances at various active and inactive sites. We regularly assess the need for financial recognition or disclosure of these contingencies. In the case of all known contingencies (other than those related to income taxes), we accrue a liability when the loss is probable and the amount is reasonably estimable. If a range of amounts can be reasonably estimated and no amount within the range is a better estimate than any other amount, then the minimum of the range is accrued. We do not reduce these liabilities for potential insurance or third-party recoveries. If applicable, we accrue receivables for probable insurance or other third-party recoveries. In the case of income-tax-related contingencies, we use a cumulative probability-weighted loss accrual in cases where sustaining a tax position is less than certain. See
Note 21—Income Taxes
, for additional information about income-tax-related contingencies.
Based on currently available information, we believe it is remote that future costs related to known contingent liability exposures will exceed current accruals by an amount that would have a material adverse impact on our consolidated financial statements. As we learn new facts concerning contingencies, we reassess our position both with respect to accrued liabilities and other potential exposures. Estimates particularly sensitive to future changes include contingent liabilities recorded for environmental remediation, tax and legal matters. Estimated future environmental remediation costs are subject to change due to such factors as the uncertain magnitude of cleanup costs, the unknown time and extent of such remedial actions that may be required, and the determination of our liability in proportion to that of other potentially responsible parties. Estimated future costs related to tax and legal matters are subject to change as events evolve and as additional information becomes available during the administrative and litigation processes.
Environmental
We are subject to international, federal, state and local environmental laws and regulations. When we prepare our consolidated financial statements, we record accruals for environmental liabilities based on management’s best estimates, using information available at the time. We measure estimates and base contingent liabilities on currently available facts, existing technology and presently enacted laws and regulations, taking into account stakeholder and business considerations. When measuring contingent environmental liabilities, we also consider our prior experience in remediation of contaminated sites, other companies’ cleanup experience, and data released by the U.S. Environmental Protection Agency (EPA) or other organizations. We consider unasserted claims in our determination of environmental liabilities, and we accrue them in the period they are both probable and reasonably estimable.
Although liability for environmental remediation costs is generally joint and several for federal sites and frequently so for state sites, we are usually only one of many companies alleged to have liability at a particular site. Due to such joint and several liabilities, we could be responsible for all cleanup costs related to any site at which we have been designated as a potentially responsible party. We have been successful to date in sharing cleanup costs with other financially sound companies. Many of the sites at which we are potentially responsible are still under investigation by the EPA or the state agencies concerned. Prior to actual cleanup, those potentially responsible normally assess the site conditions, apportion responsibility and determine the appropriate remediation. In some instances, we may have no liability or may attain a settlement of liability. Where it appears that other potentially responsible parties may be financially unable to bear their proportional share, we consider this inability in estimating our potential liability, and we adjust our accruals accordingly. As a result of various acquisitions in the past, we assumed certain environmental obligations. Some of these environmental obligations are mitigated by indemnifications made by others for our benefit, although some of the indemnifications are subject to dollar and time limits.
We are currently participating in environmental assessments and cleanups at numerous federal Superfund and comparable state sites. After an assessment of environmental exposures for cleanup and other costs, we make accruals on an undiscounted basis (except those pertaining to sites acquired in a business combination, which we record on a discounted basis) for planned investigation and remediation activities for sites where it is probable future costs will be incurred and these costs can be reasonably estimated. We have not reduced these accruals for possible insurance recoveries. In the future, we may be involved in additional environmental assessments, cleanups and proceedings. See
Note 10—
Asset Retirement Obligations and Accrued Environmental Costs
, for a summary of our accrued environmental liabilities.
99
Legal Proceedings
Our legal organization applies its knowledge, experience and professional judgment to the specific characteristics of our cases, employing a litigation management process to manage and monitor the legal proceedings against us. Our process facilitates the early evaluation and quantification of potential exposures in individual cases and enables the tracking of those cases that have been scheduled for trial and/or mediation. Based on professional judgment and experience in using these litigation management tools and available information about current developments in all our cases, our legal organization regularly assesses the adequacy of current accruals and determines if adjustment of existing accruals, or establishment of new accruals, is required.
Other Contingencies
We have contingent liabilities resulting from throughput agreements with pipeline and processing companies not associated with financing arrangements. Under these agreements, we may be required to provide any such company with additional funds through advances and penalties for fees related to throughput capacity not utilized.
At
December 31, 2018
, we had performance obligations secured by letters of credit and bank guarantees of
$587 million
related to various purchase and other commitments incident to the ordinary conduct of business.
Long-Term Throughput Agreements and Take-or-Pay Agreements
We have certain throughput agreements and take-or-pay agreements in support of third-party financing arrangements. The agreements typically provide for crude oil transportation to be used in the ordinary course of our business. At December 31, 2018, the estimated aggregate future payments under these agreements were
$318 million
per year for each year from
2019
through
2023
and
$2,280 million
in the aggregate for all years after 2023. For the years ended December 31,
2018
,
2017
and
2016
, total payments under these agreements were
$323 million
,
$323 million
and
$325 million
, respectively.
Note 15—
Derivatives and Financial Instruments
Derivative Instruments
We use financial and commodity-based derivative contracts to manage exposures to fluctuations in commodity prices, interest rates and foreign currency exchange rates, or to capture market opportunities. Because we do not apply hedge accounting for commodity derivative contracts, all realized and unrealized gains and losses from commodity derivative contracts are recognized in our consolidated statement of income. Gains and losses from derivative contracts held for trading not directly related to our physical business are reported net in the “Other income” line on our consolidated statement of income. Cash flows from all our derivative activity for the periods presented appear in the operating section on our consolidated statement of cash flows.
Purchase and sales contracts with firm minimum notional volumes for commodities that are readily convertible to cash are recorded on our consolidated balance sheet as derivatives unless the contracts are eligible for, and we elect, the normal purchases and normal sales exception, whereby the contracts are recorded on an accrual basis. We generally apply the normal purchases and normal sales exception to eligible crude oil, refined petroleum product, NGL, natural gas and power commodity contracts to purchase or sell quantities we expect to use or sell in the normal course of business. All other derivative instruments are recorded at fair value on our consolidated balance sheet. For further information on the fair value of derivatives, see
Note 16—Fair Value Measurements
.
Commodity Derivative Contracts
—We sell into or receive supply from the worldwide crude oil, refined petroleum product, NGL, natural gas and electric power markets, exposing our revenues, purchases, cost of operating activities and cash flows to fluctuations in the prices for these commodities. Generally, our policy is to remain exposed to the market prices of commodities; however, we use futures, forwards, swaps and options in various markets to balance physical systems, meet customer needs, manage price exposures on specific transactions, and do a limited amount of trading not directly related to our physical business, all of which may reduce our exposure to fluctuations in market prices. We also use the market knowledge gained from these activities to capture market opportunities such as moving physical commodities to more profitable locations, storing commodities to capture seasonal or time premiums, and blending commodities to capture quality upgrades.
100
The following table indicates the consolidated balance sheet line items that include the fair values of commodity derivative assets and liabilities. The balances in the following table are presented on a gross basis, before the effects of counterparty and collateral netting. However, we have elected to present our commodity derivative assets and liabilities with the same counterparty on a net basis on our consolidated balance sheet when the legal right of offset exists.
|
|
Millions of Dollars
|
|||||||||||||||||
|
|
December 31, 2018
|
December 31, 2017
|
||||||||||||||||
|
Commodity Derivatives
|
Effect of Collateral Netting
|
|
Net Carrying Value Presented on the Balance Sheet
|
|
Commodity Derivatives
|
Effect of Collateral Netting
|
|
Net Carrying Value Presented on the Balance Sheet
|
|
|||||||||
|
|
Assets
|
|
Liabilities
|
|
Assets
|
|
Liabilities
|
|
||||||||||
|
Assets
|
||||||||||||||||||
|
Prepaid expenses and other current assets
|
$
|
1,257
|
|
(1,070
|
)
|
(89
|
)
|
98
|
|
43
|
|
(19
|
)
|
—
|
|
24
|
|
|
|
Other assets
|
2
|
|
—
|
|
—
|
|
2
|
|
7
|
|
(3
|
)
|
—
|
|
4
|
|
||
|
Liabilities
|
|
|
||||||||||||||||
|
Other accruals
|
—
|
|
(23
|
)
|
—
|
|
(23
|
)
|
699
|
|
(746
|
)
|
21
|
|
(26
|
)
|
||
|
Other liabilities and deferred credits
|
5
|
|
(7
|
)
|
—
|
|
(2
|
)
|
—
|
|
(1
|
)
|
—
|
|
(1
|
)
|
||
|
Total
|
$
|
1,264
|
|
(1,100
|
)
|
(89
|
)
|
75
|
|
|
749
|
|
(769
|
)
|
21
|
|
1
|
|
At December 31, 2018 and 2017, there was
no
material cash collateral received or paid that was not offset on our consolidated balance sheet.
The realized and unrealized gains (losses) incurred from commodity derivatives, and the line items where they appear on our consolidated statement of income, were:
|
Millions of Dollars
|
|||||||||
|
|
2018
|
|
2017
|
|
2016
|
|
|||
|
Sales and other operating revenues
|
$
|
192
|
|
(247
|
)
|
(451
|
)
|
||
|
Other income
|
(15
|
)
|
27
|
|
29
|
|
|||
|
Purchased crude oil and products
|
(64
|
)
|
(18
|
)
|
(62
|
)
|
|||
|
Net gain (loss) from commodity derivative activity
|
$
|
113
|
|
(238
|
)
|
(484
|
)
|
||
The following table summarizes our material net exposures resulting from outstanding commodity derivative contracts. These financial and physical derivative contracts are primarily used to manage price exposure on our underlying operations. The underlying exposures may be from non-derivative positions such as inventory volumes. Financial derivative contracts may also offset physical derivative contracts, such as forward sales contracts. The percentage of our derivative contract volumes expiring within the next twelve months was at least
98 percent
at December 31,
2018
and
2017
.
|
Open Position
Long / (Short)
|
|||||
|
|
2018
|
|
2017
|
|
|
|
Commodity
|
|||||
|
Crude oil, refined petroleum products and NGL
(millions of barrels)
|
(17
|
)
|
(11
|
)
|
|
101
Interest Rate Derivative Contracts
—In 2016, we entered into interest rate swaps to hedge the variability of lease payments on our headquarters facility. These monthly lease payments vary based on monthly changes in the one-month LIBOR and changes, if any, in our credit rating over the five-year term of the lease. The pay-fixed, receive-floating interest rate swaps have an aggregate notional value of $
650 million
and end in April 2021. We have designated these swaps as cash flow hedges.
The aggregate net fair value of these swaps, which is included in the “Prepaid expenses and other current assets” and “Other assets” lines on our consolidated balance sheet, totaled
$15 million
and
$14 million
at
December 31, 2018
and
2017
, respectively.
We report the mark-to-market gains or losses on our interest rate swaps designated as highly effective cash flow hedges as a component of other comprehensive income (loss), and reclassify such gains and losses into earnings in the same period during which the hedged transaction affects earnings. Net realized gains and losses from settlements of the swaps were immaterial for the years ended
December 31, 2018
and
2017
.
We currently estimate that pre-tax gains of
$7 million
will be reclassified from accumulated other comprehensive loss into general and administrative expenses during the next twelve months as the hedged transactions settle; however, the actual amounts that will be reclassified will vary based on changes in interest rates.
Credit Risk
Financial instruments potentially exposed to concentrations of credit risk consist primarily of trade receivables and derivative contracts.
Our trade receivables result primarily from the sale of products from, or related to, our refinery operations and reflect a broad national and international customer base, which limits our exposure to concentrations of credit risk. The majority of these receivables have payment terms of
30 days or less
. We continually monitor this exposure and the creditworthiness of the counterparties and recognize bad debt expense based on historical write-off experience or specific counterparty collectability. Generally, we do not require collateral to limit the exposure to loss; however, we will sometimes use letters of credit, prepayments or master netting arrangements to mitigate credit risk with counterparties that both buy from and sell to us, as these agreements permit the amounts owed by us or owed to others to be offset against amounts due to us.
The credit risk from our derivative contracts, such as forwards and swaps, derives from the counterparty to the transaction. Individual counterparty exposure is managed within predetermined credit limits and includes the use of cash-call margins when appropriate, thereby reducing the risk of significant nonperformance. We also use futures, swaps and option contracts that have a negligible credit risk because these trades are cleared with an exchange clearinghouse and subject to mandatory margin requirements, typically on a daily basis, until settled.
Certain of our derivative instruments contain provisions that require us to post collateral if the derivative exposure exceeds a threshold amount. We have contracts with fixed threshold amounts and other contracts with variable threshold amounts that are contingent on our credit rating. The variable threshold amounts typically decline for lower credit ratings, while both the variable and fixed threshold amounts typically revert to zero if our credit ratings fall below investment grade. Cash is the primary collateral in all contracts; however, many contracts also permit us to post letters of credit as collateral.
The aggregate fair values of all derivative instruments with such credit-risk-related contingent features that were in a liability position were immaterial at
December 31, 2018
and
2017
.
102
Note 16—
Fair Value Measurements
Recurring Fair Value Measurements
We carry certain assets and liabilities at fair value, which we measure at the reporting date using the price that would be received to sell an asset or paid to transfer a liability (i.e., an exit price), and disclose the quality of these fair values based on the valuation inputs used in these measurements under the following hierarchy:
|
•
|
Level 1: Fair value measured with unadjusted quoted prices from an active market for identical assets or liabilities.
|
|
•
|
Level 2: Fair value measured either with: (1) adjusted quoted prices from an active market for similar assets or liabilities; or (2) other valuation inputs that are directly or indirectly observable.
|
|
•
|
Level 3: Fair value measured with unobservable inputs that are significant to the measurement.
|
We classify the fair value of an asset or liability based on the significance of its observable or unobservable inputs to the measurement. However, the fair value of an asset or liability initially reported as Level 3 will be subsequently reported as Level 2 if the unobservable inputs become inconsequential to its measurement or corroborating market data becomes available. Conversely, an asset or liability initially reported as Level 2 will be subsequently reported as Level 3 if corroborating market data becomes unavailable. For the year ended December 31, 2018, derivative assets with an aggregate value of
$246 million
and derivative liabilities with an aggregate value of
$246 million
were transferred to Level 1 from Level 2, as measured from the beginning of the reporting period. The measurements were reclassified within the fair value hierarchy due to the availability of unadjusted quoted prices from an active market.
We used the following methods and assumptions to estimate the fair value of financial instruments:
|
•
|
Cash and cash equivalents
—The carrying amount reported on our consolidated balance sheet approximates fair value.
|
|
•
|
Accounts and notes receivable
—
The carrying amount reported on our consolidated balance sheet approximates fair value.
|
|
•
|
Derivative instruments
—We fair value our exchange-traded contracts based on quoted market prices obtained from the New York Mercantile Exchange, the Intercontinental Exchange or other exchanges, and classify them as Level 1 in the fair value hierarchy. When exchange-cleared contracts lack sufficient liquidity, or are valued using either adjusted exchange-provided prices or non-exchange quotes, we classify those contracts as Level 2.
|
Physical commodity forward purchase and sales contracts and over-the-counter (OTC) financial swaps are generally valued using forward quotes provided by brokers and price index developers, such as Platts and Oil Price Information Service. We corroborate these quotes with market data and classify the resulting fair values as Level 2. When forward market prices are not available, we estimate fair value using the forward price of a similar commodity, adjusted for the difference in quality or location. In certain less liquid markets or for longer-term contracts, forward prices are not as readily available. In these circumstances, physical commodity purchase and sales contracts and OTC swaps are valued using internally developed methodologies that consider historical relationships among various commodities that result in management’s best estimate of fair value. We classify these contracts as Level 3. Physical and OTC commodity options are valued using industry-standard models that consider various assumptions, including quoted forward prices for commodities, time value, volatility factors and contractual prices for the underlying instruments, as well as other relevant economic measures. The degree to which these inputs are observable in the forward markets determines whether the options are classified as Level 2 or 3. We use a mid-market pricing convention (the mid-point between bid and ask prices). When appropriate, valuations are adjusted to reflect credit considerations, generally based on available market evidence.
We determine the fair value of our interest rate swaps based on observed market valuations for interest rate swaps that have notional amounts, terms and pay and reset frequencies similar to ours.
|
•
|
Rabbi trust assets
—These deferred compensation investments are measured at fair value using unadjusted quoted prices available from national securities exchanges and are therefore categorized as Level 1 in the fair value hierarchy.
|
103
|
•
|
Debt
—The carrying amount of our floating-rate debt approximates fair value. The fair value of our fixed-rate debt is estimated based on observable market prices.
|
The following tables display the fair value hierarchy for our financial assets and liabilities either accounted for or disclosed at fair value on a recurring basis. These values are determined by treating each contract as the fundamental unit of account; therefore, derivative assets and liabilities with the same counterparty are shown on a gross basis in the hierarchy sections of these tables, before the effects of counterparty and collateral netting. The following tables also reflect the effect of netting derivative assets and liabilities with the same counterparty for which we have the legal right of offset and collateral netting.
The carrying values and fair values by hierarchy of our financial assets and liabilities, either carried or disclosed at fair value, including any effects of counterparty and collateral netting, were:
|
|
Millions of Dollars
|
|||||||||||||||||||
|
|
December 31, 2018
|
|||||||||||||||||||
|
Fair Value Hierarchy
|
Total Fair Value of Gross Assets & Liabilities
|
|
Effect of Counterparty Netting
|
|
Effect of Collateral Netting
|
|
Difference in Carrying Value and Fair Value
|
|
Net Carrying Value Presented on the Balance Sheet
|
|
||||||||||
|
|
Level 1
|
|
Level 2
|
|
Level 3
|
|
||||||||||||||
|
Commodity Derivative Assets
|
||||||||||||||||||||
|
Exchange-cleared instruments
|
$
|
674
|
|
547
|
|
—
|
|
1,221
|
|
(1,075
|
)
|
(89
|
)
|
—
|
|
57
|
|
|||
|
Physical forward contracts
|
—
|
|
39
|
|
4
|
|
43
|
|
—
|
|
—
|
|
—
|
|
43
|
|
||||
|
Interest rate derivatives
|
—
|
|
15
|
|
—
|
|
15
|
|
—
|
|
—
|
|
—
|
|
15
|
|
||||
|
Rabbi trust assets
|
104
|
|
—
|
|
—
|
|
104
|
|
N/A
|
|
N/A
|
|
—
|
|
104
|
|
||||
|
$
|
778
|
|
601
|
|
4
|
|
1,383
|
|
(1,075
|
)
|
(89
|
)
|
—
|
|
219
|
|
||||
|
Commodity Derivative Liabilities
|
||||||||||||||||||||
|
Exchange-cleared instruments
|
$
|
605
|
|
472
|
|
—
|
|
1,077
|
|
(1,075
|
)
|
—
|
|
—
|
|
2
|
|
|||
|
Physical forward contracts
|
—
|
|
20
|
|
—
|
|
20
|
|
—
|
|
—
|
|
—
|
|
20
|
|
||||
|
OTC instruments
|
—
|
|
3
|
|
—
|
|
3
|
|
—
|
|
—
|
|
—
|
|
3
|
|
||||
|
Floating-rate debt
|
—
|
|
1,200
|
|
—
|
|
1,200
|
|
N/A
|
|
N/A
|
|
—
|
|
1,200
|
|
||||
|
Fixed-rate debt, excluding capital leases
|
—
|
|
9,727
|
|
—
|
|
9,727
|
|
N/A
|
|
N/A
|
|
49
|
|
9,776
|
|
||||
|
$
|
605
|
|
11,422
|
|
—
|
|
12,027
|
|
(1,075
|
)
|
—
|
|
49
|
|
11,001
|
|
||||
104
|
|
Millions of Dollars
|
|||||||||||||||||||
|
|
December 31, 2017
|
|||||||||||||||||||
|
Fair Value Hierarchy
|
Total Fair Value of Gross Assets & Liabilities
|
|
Effect of Counterparty Netting
|
|
Effect of Collateral Netting
|
|
Difference in Carrying Value and Fair Value
|
|
Net Carrying Value Presented on the Balance Sheet
|
|
||||||||||
|
|
Level 1
|
|
Level 2
|
|
Level 3
|
|
||||||||||||||
|
Commodity Derivative Assets
|
||||||||||||||||||||
|
Exchange-cleared instruments
|
$
|
333
|
|
395
|
|
—
|
|
728
|
|
(721
|
)
|
—
|
|
—
|
|
7
|
|
|||
|
Physical forward contracts
|
—
|
|
20
|
|
1
|
|
21
|
|
—
|
|
—
|
|
—
|
|
21
|
|
||||
|
Interest rate derivatives
|
—
|
|
14
|
|
—
|
|
14
|
|
—
|
|
—
|
|
—
|
|
14
|
|
||||
|
Rabbi trust assets
|
112
|
|
—
|
|
—
|
|
112
|
|
N/A
|
|
N/A
|
|
—
|
|
112
|
|
||||
|
$
|
445
|
|
429
|
|
1
|
|
875
|
|
(721
|
)
|
—
|
|
—
|
|
154
|
|
||||
|
Commodity Derivative Liabilities
|
||||||||||||||||||||
|
Exchange-cleared instruments
|
$
|
369
|
|
373
|
|
—
|
|
742
|
|
(721
|
)
|
(21
|
)
|
—
|
|
—
|
|
|||
|
Physical forward contracts
|
—
|
|
23
|
|
4
|
|
27
|
|
—
|
|
—
|
|
—
|
|
27
|
|
||||
|
Floating-rate debt
|
—
|
|
1,150
|
|
—
|
|
1,150
|
|
N/A
|
|
N/A
|
|
—
|
|
1,150
|
|
||||
|
Fixed-rate debt, excluding capital leases
|
—
|
|
9,746
|
|
—
|
|
9,746
|
|
N/A
|
|
N/A
|
|
(978
|
)
|
8,768
|
|
||||
|
$
|
369
|
|
11,292
|
|
4
|
|
11,665
|
|
(721
|
)
|
(21
|
)
|
(978
|
)
|
9,945
|
|
||||
The rabbi trust assets are recorded in the “Investments and long-term receivables” line and floating-rate and fixed-rate debt are recorded in the “Short-term debt” and “Long-term debt” lines on our consolidated balance sheet. See
Note 15—Derivatives and Financial Instruments
, for information regarding where the assets and liabilities related to our commodity and interest rate derivatives are recorded on our consolidated balance sheet.
Nonrecurring Fair Value Measurements
See
Note 5—Business Combinations
, for information on the remeasurement of our investment in Merey Sweeny to fair value in
2017
. For the years ended
December 31, 2018
and
2017
, there were no other material nonrecurring fair value remeasurements of assets subsequent to their initial recognition.
105
Note 17—
Equity
Preferred Stock
We have
500 million
shares of preferred stock authorized, with a par value of
$0.01
per share,
none
of which have been issued.
Treasury Stock
Since July 2012, our Board of Directors has, at various times, authorized repurchases of our outstanding common stock under our share repurchase program, which aggregate to a total authorization of up to
$12 billion
. The shares will be repurchased from time to time in the open market at the company’s discretion, subject to market conditions and other factors, and in accordance with applicable regulatory requirements. We are not obligated to acquire any particular amount of common stock and may commence, suspend or discontinue purchases at any time or from time to time without prior notice. Since the inception of our share repurchase program in 2012 through
December 31, 2018
, we have repurchased a total of
137,103,716
shares at an aggregate cost of
$10,393 million
.
In February 2018, we entered into a Stock Purchase and Sale Agreement (Purchase Agreement) with Berkshire Hathaway Inc. and National Indemnity Company, a wholly owned subsidiary of Berkshire Hathaway, to repurchase
35,000,000
shares of Phillips 66 common stock for an aggregate purchase price of
$3,280 million
. Pursuant to the Purchase Agreement, the purchase price per share of
$93.725
was based on the volume-weighted-average price of our common stock on the New York Stock Exchange on February 13, 2018. The transaction closed in February 2018. We funded the repurchase with cash of
$1,880 million
and borrowings of
$1,400 million
under our commercial paper program. These borrowings were subsequently refinanced through a public offering of senior notes. This specific share repurchase transaction was separately authorized by our Board of Directors and therefore did not impact previously announced authorizations under our share repurchase program, which are discussed above.
In 2014, we completed the exchange of our flow improver business for shares of Phillips 66 common stock owned by the other party to the transaction. We received
17,422,615
shares of our common stock with a fair value at the time of the exchange of
$1,350 million
. This specific share repurchase transaction was also separately authorized by our Board of Directors and therefore did not impact previously announced authorizations under our share repurchase program, which are discussed above.
Common Stock Dividends
On February 6, 2019, our Board of Directors declared a quarterly cash dividend of
$0.80
per common share, payable March 1, 2019, to holders of record at the close of business on February 19, 2019.
Noncontrolling Interests
Our noncontrolling interests primarily represent issuances of common and preferred units to the public by Phillips 66 Partners. See
Note 27—Phillips 66 Partners LP
, for information on Phillips 66 Partners.
106
Note 18—
Leases
We lease ocean transport vessels, tugboats, barges, pipelines, storage tanks, railcars, service station sites, office buildings, corporate aircraft, land and other facilities and equipment. Certain leases include escalation clauses for adjusting rental payments to reflect changes in price indices, as well as renewal options and/or options to purchase the leased property. There are no significant restrictions imposed on us by the leasing agreements with regard to dividends, asset dispositions or borrowing ability. Our capital lease obligations relate primarily to the lease of an oil terminal in the United Kingdom. The lease obligation is subject to foreign currency translation adjustments each reporting period. The total net PP&E recorded for capital leases was
$196 million
and
$210 million
at December 31,
2018
and
2017
, respectively.
Future minimum lease payments at
December 31, 2018
, for capital and operating lease obligations were:
|
Millions of Dollars
|
||||||
|
Capital Lease Obligations
|
|
Operating Lease Obligations
|
|
|||
|
2019
|
$
|
23
|
|
509
|
|
|
|
2020
|
19
|
|
392
|
|
||
|
2021
|
18
|
|
181
|
|
||
|
2022
|
16
|
|
124
|
|
||
|
2023
|
16
|
|
83
|
|
||
|
Remaining years
|
138
|
|
292
|
|
||
|
Total
|
230
|
|
1,581
|
|
||
|
Less: income from subleases
|
—
|
|
38
|
|
||
|
Net minimum lease payments
|
$
|
230
|
|
1,543
|
|
|
|
Less: amount representing interest
|
46
|
|
||||
|
Capital lease obligations
|
$
|
184
|
|
|||
Operating lease rental expense for the years ended December 31 was:
|
|
Millions of Dollars
|
||||||||
|
|
2018
|
|
2017
|
|
2016
|
|
|||
|
Minimum rentals
|
$
|
669
|
|
680
|
|
669
|
|
||
|
Contingent rentals
|
5
|
|
6
|
|
6
|
|
|||
|
Less: sublease rental income
|
71
|
|
73
|
|
95
|
|
|||
|
$
|
603
|
|
613
|
|
580
|
|
|||
107
Note 19—
Pension and Postretirement Plans
The following table provides a reconciliation of the projected benefit obligations and plan assets for our pension plans and accumulated benefit obligations for our other postretirement benefit plans:
|
|
Millions of Dollars
|
|||||||||||||||||
|
Pension Benefits
|
Other Benefits
|
|||||||||||||||||
|
|
2018
|
2017
|
2018
|
|
2017
|
|
||||||||||||
|
U.S.
|
|
Int’l.
|
|
U.S.
|
|
Int’l.
|
|
|||||||||||
|
Change in Benefit Obligations
|
||||||||||||||||||
|
Benefit obligations at January 1
|
$
|
3,043
|
|
1,209
|
|
2,881
|
|
1,055
|
|
232
|
|
225
|
|
|||||
|
Service cost
|
136
|
|
29
|
|
132
|
|
32
|
|
6
|
|
6
|
|
||||||
|
Interest cost
|
104
|
|
28
|
|
108
|
|
27
|
|
7
|
|
8
|
|
||||||
|
Plan participant contributions
|
—
|
|
2
|
|
—
|
|
2
|
|
4
|
|
3
|
|
||||||
|
Net actuarial loss (gain)
|
(167
|
)
|
(165
|
)
|
267
|
|
(5
|
)
|
(9
|
)
|
6
|
|
||||||
|
Benefits paid
|
(386
|
)
|
(27
|
)
|
(345
|
)
|
(20
|
)
|
(20
|
)
|
(16
|
)
|
||||||
|
Curtailment gain
|
—
|
|
(5
|
)
|
—
|
|
—
|
|
—
|
|
—
|
|
||||||
|
Foreign currency exchange rate change
|
—
|
|
(64
|
)
|
—
|
|
118
|
|
—
|
|
—
|
|
||||||
|
Benefit obligations at December 31
|
$
|
2,730
|
|
1,007
|
|
3,043
|
|
1,209
|
|
220
|
|
232
|
|
|||||
|
Change in Fair Value of Plan Assets
|
||||||||||||||||||
|
Fair value of plan assets at January 1
|
$
|
2,751
|
|
972
|
|
2,274
|
|
796
|
|
—
|
|
—
|
|
|||||
|
Actual return on plan assets
|
(122
|
)
|
(29
|
)
|
399
|
|
71
|
|
—
|
|
—
|
|
||||||
|
Company contributions
|
134
|
|
34
|
|
423
|
|
35
|
|
16
|
|
13
|
|
||||||
|
Plan participant contributions
|
—
|
|
2
|
|
—
|
|
2
|
|
4
|
|
3
|
|
||||||
|
Benefits paid
|
(386
|
)
|
(27
|
)
|
(345
|
)
|
(20
|
)
|
(20
|
)
|
(16
|
)
|
||||||
|
Foreign currency exchange rate change
|
—
|
|
(50
|
)
|
—
|
|
88
|
|
—
|
|
—
|
|
||||||
|
Fair value of plan assets at December 31
|
$
|
2,377
|
|
902
|
|
2,751
|
|
972
|
|
—
|
|
—
|
|
|||||
|
Funded Status at December 31
|
$
|
(353
|
)
|
(105
|
)
|
(292
|
)
|
(237
|
)
|
(220
|
)
|
(232
|
)
|
|||||
Amounts recognized in the consolidated balance sheet for our pension and other postretirement benefit plans at December 31 include:
|
Millions of Dollars
|
||||||||||||||||||
|
Pension Benefits
|
Other Benefits
|
|||||||||||||||||
|
2018
|
2017
|
2018
|
|
2017
|
|
|||||||||||||
|
U.S.
|
|
Int’l.
|
|
U.S.
|
|
Int’l.
|
|
|||||||||||
|
Amounts Recognized in the Consolidated Balance Sheet
|
||||||||||||||||||
|
Noncurrent assets
|
$
|
—
|
|
78
|
|
—
|
|
—
|
|
—
|
|
—
|
|
|||||
|
Current liabilities
|
(25
|
)
|
—
|
|
(25
|
)
|
—
|
|
(16
|
)
|
(16
|
)
|
||||||
|
Noncurrent liabilities
|
(328
|
)
|
(183
|
)
|
(267
|
)
|
(237
|
)
|
(204
|
)
|
(216
|
)
|
||||||
|
Total recognized
|
$
|
(353
|
)
|
(105
|
)
|
(292
|
)
|
(237
|
)
|
(220
|
)
|
(232
|
)
|
|||||
108
Included in accumulated other comprehensive loss at December 31 were the following pre-tax amounts that had not been recognized in net periodic benefit cost:
|
Millions of Dollars
|
||||||||||||||||||
|
Pension Benefits
|
Other Benefits
|
|||||||||||||||||
|
2018
|
2017
|
2018
|
|
2017
|
|
|||||||||||||
|
U.S.
|
|
Int’l.
|
|
U.S.
|
|
Int’l.
|
|
|||||||||||
|
Unrecognized net actuarial loss (gain)
|
$
|
539
|
|
64
|
|
545
|
|
190
|
|
(8
|
)
|
1
|
|
|||||
|
Unrecognized prior service credit
|
—
|
|
(3
|
)
|
—
|
|
(4
|
)
|
(6
|
)
|
(7
|
)
|
||||||
|
Millions of Dollars
|
||||||||||||||||||
|
Pension Benefits
|
Other Benefits
|
|||||||||||||||||
|
2018
|
2017
|
2018
|
|
2017
|
|
|||||||||||||
|
U.S.
|
|
Int’l.
|
|
U.S.
|
|
Int’l.
|
|
|||||||||||
|
Sources of Change in Other Comprehensive Loss
|
||||||||||||||||||
|
Net actuarial gain (loss) arising during the period
|
$
|
(125
|
)
|
102
|
|
(14
|
)
|
14
|
|
9
|
|
(6
|
)
|
|||||
|
Curtailment gain
|
—
|
|
5
|
|
—
|
|
—
|
|
—
|
|
—
|
|
||||||
|
Amortization of net actuarial loss and settlements included in income
|
131
|
|
19
|
|
153
|
|
23
|
|
—
|
|
—
|
|
||||||
|
Net change in unrecognized net actuarial loss (gain) during the period
|
$
|
6
|
|
126
|
|
139
|
|
37
|
|
9
|
|
(6
|
)
|
|||||
|
Prior service cost (credit) arising during the period
|
$
|
—
|
|
—
|
|
—
|
|
—
|
|
—
|
|
—
|
|
|||||
|
Amortization of prior service cost (credit) included in income
|
—
|
|
(1
|
)
|
3
|
|
(1
|
)
|
(1
|
)
|
(2
|
)
|
||||||
|
Net change in unrecognized prior service cost (credit) during the period
|
$
|
—
|
|
(1
|
)
|
3
|
|
(1
|
)
|
(1
|
)
|
(2
|
)
|
|||||
The accumulated benefit obligations for all U.S. and international pension plans were
$2,466 million
and
$878 million
, respectively, at December 31,
2018
, and
$2,743 million
and
$1,006 million
, respectively, at December 31,
2017
.
Information for U.S. and international pension plans with an accumulated benefit obligation in excess of plan assets at December 31 were:
|
Millions of Dollars
|
||||||||||||
|
Pension Benefits
|
||||||||||||
|
2018
|
2017
|
|||||||||||
|
U.S.
|
|
Int’l.
|
|
U.S.
|
|
Int’l.
|
|
|||||
|
Accumulated benefit obligations
|
$
|
123
|
|
345
|
|
143
|
|
368
|
|
|||
|
Fair value of plan assets
|
—
|
|
182
|
|
—
|
|
196
|
|
||||
109
Information for U.S. and international pension plans with a projected benefit obligation in excess of plan assets at December 31 were:
|
Millions of Dollars
|
||||||||||||
|
Pension Benefits
|
||||||||||||
|
2018
|
2017
|
|||||||||||
|
U.S.
|
|
Int’l.
|
|
U.S.
|
|
Int’l.
|
|
|||||
|
Projected benefit obligations
|
$
|
2,730
|
|
365
|
|
3,043
|
|
1,209
|
|
|||
|
Fair value of plan assets
|
2,377
|
|
182
|
|
2,751
|
|
972
|
|
||||
Components of net periodic benefit cost for all defined benefit plans are presented in the table below:
|
Millions of Dollars
|
|||||||||||||||||||||||||||
|
Pension Benefits
|
Other Benefits
|
||||||||||||||||||||||||||
|
2018
|
2017
|
2016
|
2018
|
|
2017
|
|
2016
|
|
|||||||||||||||||||
|
U.S.
|
|
Int’l.
|
|
U.S.
|
|
Int’l.
|
|
U.S.
|
|
Int’l.
|
|
||||||||||||||||
|
Components of Net Periodic Benefit Cost
|
|||||||||||||||||||||||||||
|
Service cost
|
$
|
136
|
|
29
|
|
132
|
|
32
|
|
127
|
|
32
|
|
6
|
|
6
|
|
7
|
|
||||||||
|
Interest cost
|
104
|
|
28
|
|
108
|
|
27
|
|
116
|
|
28
|
|
7
|
|
8
|
|
8
|
|
|||||||||
|
Expected return on plan assets
|
(169
|
)
|
(46
|
)
|
(146
|
)
|
(40
|
)
|
(128
|
)
|
(38
|
)
|
—
|
|
—
|
|
—
|
|
|||||||||
|
Amortization of prior service cost (credit)
|
—
|
|
(1
|
)
|
3
|
|
(1
|
)
|
3
|
|
(1
|
)
|
(1
|
)
|
(2
|
)
|
(1
|
)
|
|||||||||
|
Amortization of net actuarial loss
|
59
|
|
19
|
|
70
|
|
23
|
|
72
|
|
14
|
|
—
|
|
—
|
|
—
|
|
|||||||||
|
Settlements
|
72
|
|
—
|
|
83
|
|
—
|
|
8
|
|
—
|
|
—
|
|
—
|
|
—
|
|
|||||||||
|
Total net periodic benefit cost*
|
$
|
202
|
|
29
|
|
250
|
|
41
|
|
198
|
|
35
|
|
12
|
|
12
|
|
14
|
|
||||||||
* Included in the “Operating expenses” and “Selling, general and administrative expenses” lines on our consolidated statement of income.
In determining net periodic benefit cost, we amortize prior service costs on a straight-line basis over the average remaining service period of employees expected to receive benefits under the plan. For net actuarial gains and losses, we amortize
10 percent
of the unamortized balance each year. The amount subject to amortization is determined on a plan-by-plan basis.
110
The following weighted-average assumptions were used to determine benefit obligations and net periodic benefit costs for years ended December 31:
|
Pension Benefits
|
Other Benefits
|
|||||||||||
|
|
2018
|
2017
|
2018
|
2017
|
||||||||
|
|
U.S.
|
|
Int’l.
|
U.S.
|
Int’l.
|
|||||||
|
Assumptions Used to Determine Benefit Obligations:
|
||||||||||||
|
Discount rate
|
4.30
|
%
|
2.59
|
3.60
|
2.36
|
4.15
|
3.35
|
|||||
|
Rate of compensation increase
|
4.00
|
|
3.34
|
4.00
|
3.74
|
—
|
—
|
|||||
|
Interest crediting rate on cash balance plan
|
3.25
|
|
—
|
3.00
|
—
|
—
|
—
|
|||||
|
Assumptions Used to Determine Net Periodic Benefit Cost:
|
||||||||||||
|
Discount rate
|
3.60
|
%
|
2.36
|
3.95
|
2.46
|
3.35
|
3.65
|
|||||
|
Expected return on plan assets
|
6.50
|
|
4.78
|
6.75
|
4.74
|
—
|
—
|
|||||
|
Rate of compensation increase
|
4.00
|
|
3.74
|
4.00
|
3.78
|
—
|
—
|
|||||
|
Interest crediting rate on cash balance plan
|
3.00
|
|
—
|
3.55
|
—
|
—
|
—
|
|||||
For both U.S. and international pension plans, the overall expected long-term rate of return is developed from the expected future return of each asset class, weighted by the expected allocation of pension assets to that asset class. We rely on a variety of independent market forecasts in developing the expected rate of return for each class of assets.
For the year ended
December 31, 2018
, actuarial gains resulted in decreases in our U.S. and international pension benefit obligations of
$167 million
and
$165 million
, respectively. The primary drivers for the actuarial gains were increases in the discount rates and changes to the census data demographics. For the year ended
December 31, 2017
, actuarial losses resulted in an increase in our U.S. pension benefit obligations of
$267 million
. The primary drivers for the actuarial losses were decreases in the discount rates and changes to the census data demographics.
For the year ended December 31, 2018, the weighted-average actual return on plan assets for our U.S. pension plans was negative
4 percent
, which resulted in a
$122 million
reduction in plan assets. For the year ended December 31, 2017, the weighted-average actual return on plan assets for our U.S. pension plans was positive
18 percent
, which resulted in a
$399 million
increase in plan assets. The primary driver of the return on plan assets in 2018 and 2017 was fluctuations in the equity markets.
Our other postretirement benefit plans for health insurance are contributory. Effective December 31, 2012, we terminated the subsidy for retiree medical plans. Since January 1, 2013, eligible employees have been able to utilize notional amounts credited to an account during their period of service with the company to pay all, or a portion, of their cost to participate in postretirement health insurance through the company. In general, employees hired after December 31, 2012, will not receive credits to an account, but will have unsubsidized access to health insurance through the plan. The cost of health insurance will be adjusted annually by the company’s actuary to reflect actual experience and expected health care cost trends. The measurement of the accumulated benefit obligation assumes a health care cost trend rate of
7.00 percent
in
2019
that declines to
5.00 percent
by
2027
.
Plan Assets
The investment strategy for managing pension plan assets is to seek a reasonable rate of return relative to an appropriate level of risk and provide adequate liquidity for benefit payments and portfolio management. We follow a policy of diversifying pension plan assets across asset classes, investment managers, and individual holdings. As a result, our plan assets have no significant concentrations of credit risk. Asset classes that are considered appropriate include equities, fixed income, cash, real estate and insurance contracts. Plan fiduciaries may consider and add other asset classes to the
111
investment program from time to time. The target allocations for plan assets are approximately
50 percent
equity securities,
42 percent
debt securities and
8 percent
in all other types of investments. Generally, the investments in the plans are publicly traded, therefore minimizing the liquidity risk in the portfolio.
The following is a description of the valuation methodologies used for the pension plan assets.
|
•
|
Fair values of equity securities and government debt securities are based on quoted market prices.
|
|
•
|
Fair values of corporate debt securities are estimated using recently executed transactions and market price quotations. If there have been no market transactions in a particular fixed income security, its fair value is calculated by pricing models that benchmark the security against other securities with actual market prices.
|
|
•
|
Fair values of mutual funds are valued based on quoted market prices, which represent the net asset value (NAV) of shares held.
|
|
•
|
Cash and cash equivalents are valued at cost, which approximates fair value.
|
|
•
|
Fair values of insurance contracts are valued at the present value of the future benefit payments owed by the insurance company to the plans’ participants.
|
|
•
|
Fair values of investments in common/collective trusts and real estate funds are valued at NAV as a practical expedient. The NAV is based on the underlying net assets owned by the fund and the relative interest of each participating investor in the fair value of the underlying assets. These investments valued at NAV are not classified within the fair value hierarchy, but are presented in the fair value table to permit reconciliation of total plan assets to the amounts presented in the notes to consolidated financial statements.
|
The fair values of our pension plan assets at December 31, by asset class, were:
|
|
Millions of Dollars
|
|||||||||||||||||||||||
|
U.S.
|
International
|
|||||||||||||||||||||||
|
|
Level 1
|
|
Level 2
|
|
Level 3
|
|
Total
|
|
Level 1
|
|
Level 2
|
|
Level 3
|
|
Total
|
|
||||||||
|
2018
|
||||||||||||||||||||||||
|
Equity securities
|
$
|
421
|
|
—
|
|
—
|
|
421
|
|
—
|
|
—
|
|
—
|
|
—
|
|
|||||||
|
Government debt securities
|
610
|
|
—
|
|
—
|
|
610
|
|
—
|
|
—
|
|
—
|
|
—
|
|
||||||||
|
Corporate debt securities
|
—
|
|
129
|
|
—
|
|
129
|
|
—
|
|
—
|
|
—
|
|
—
|
|
||||||||
|
Cash and cash equivalents
|
50
|
|
—
|
|
—
|
|
50
|
|
7
|
|
—
|
|
—
|
|
7
|
|
||||||||
|
Insurance contracts
|
—
|
|
—
|
|
—
|
|
—
|
|
—
|
|
—
|
|
14
|
|
14
|
|
||||||||
|
Total assets in the fair value hierarchy
|
1,081
|
|
129
|
|
—
|
|
1,210
|
|
7
|
|
—
|
|
14
|
|
21
|
|
||||||||
|
Common/collective trusts measured at NAV
|
|
|
|
1,048
|
|
|
|
|
873
|
|
||||||||||||||
|
Real estate funds measured at NAV
|
|
|
|
119
|
|
8
|
|
|||||||||||||||||
|
Total
|
$
|
1,081
|
|
129
|
|
—
|
|
2,377
|
|
7
|
|
—
|
|
14
|
|
902
|
|
|||||||
112
|
|
Millions of Dollars
|
|||||||||||||||||||||||
|
U.S.
|
International
|
|||||||||||||||||||||||
|
|
Level 1
|
|
Level 2
|
|
Level 3
|
|
Total
|
|
Level 1
|
|
Level 2
|
|
Level 3
|
|
Total
|
|
||||||||
|
2017
|
||||||||||||||||||||||||
|
Equity securities
|
$
|
589
|
|
—
|
|
—
|
|
589
|
|
—
|
|
—
|
|
—
|
|
—
|
|
|||||||
|
Government debt securities
|
632
|
|
—
|
|
—
|
|
632
|
|
—
|
|
—
|
|
—
|
|
—
|
|
||||||||
|
Mutual funds
|
129
|
|
—
|
|
—
|
|
129
|
|
—
|
|
—
|
|
—
|
|
—
|
|
||||||||
|
Cash and cash equivalents
|
90
|
|
—
|
|
—
|
|
90
|
|
6
|
|
—
|
|
—
|
|
6
|
|
||||||||
|
Insurance contracts
|
—
|
|
—
|
|
—
|
|
—
|
|
—
|
|
—
|
|
14
|
|
14
|
|
||||||||
|
Total assets in the fair value hierarchy
|
1,440
|
|
—
|
|
—
|
|
1,440
|
|
6
|
|
—
|
|
14
|
|
20
|
|
||||||||
|
Common/collective trusts measured at NAV
|
1,311
|
|
944
|
|
||||||||||||||||||||
|
Real estate funds measured at NAV
|
—
|
|
8
|
|
||||||||||||||||||||
|
Total
|
$
|
1,440
|
|
—
|
|
—
|
|
2,751
|
|
6
|
|
—
|
|
14
|
|
972
|
|
|||||||
Our funding policy for U.S. plans is to contribute at least the minimum required by the Employee Retirement Income Security Act of 1974 and the Internal Revenue Code of 1986, as amended. Contributions to international plans are subject to local laws and tax regulations. Actual contribution amounts are dependent upon plan asset returns, changes in pension obligations, regulatory environments, and other economic factors. In
2019
, we expect to contribute approximately
$60 million
to our U.S. pension plans and other postretirement benefit plans and
$30 million
to our international pension plans.
The following benefit payments, which reflect expected future service, as appropriate, are expected to be paid to plan participants in the years indicated:
|
|
Millions of Dollars
|
||||||||
|
Pension Benefits
|
Other Benefits
|
|
|||||||
|
U.S.
|
|
Int’l.
|
|
||||||
|
2019
|
$
|
412
|
|
19
|
|
25
|
|
||
|
2020
|
292
|
|
20
|
|
27
|
|
|||
|
2021
|
285
|
|
22
|
|
27
|
|
|||
|
2022
|
299
|
|
23
|
|
26
|
|
|||
|
2023
|
274
|
|
26
|
|
25
|
|
|||
|
2024-2028
|
1,205
|
|
158
|
|
102
|
|
|||
113
Defined Contribution Plans
Most U.S. employees are eligible to participate in the Phillips 66 Savings Plan (Savings Plan). Employees can contribute up to
75 percent
of their eligible pay, subject to certain statutory limits, in the thrift feature of the Savings Plan to a choice of investment funds. For the years ended December 31, 2018, 2017 and 2016, Phillips 66 provided a company match of participant thrift contributions up to
5 percent
of eligible pay. In addition, participants who contributed at least
1 percent
to the Savings Plan were eligible for “Success Share,” a semi-annual discretionary company contribution to the Savings Plan that can range from
0
to
6 percent
of eligible pay, with a target of
2 percent
. For the years ended December 31,
2018
,
2017
and
2016
, we recorded expense of
$178 million
,
$101 million
and
$99 million
, respectively, related to our contributions to the Savings Plan.
Note 20—
Share-Based Compensation Plans
In accordance with the Employee Matters Agreement related to the Separation, compensation awards based on ConocoPhillips stock and granted before April 30, 2012 (the Separation Date) were converted to compensation awards based on both ConocoPhillips and Phillips 66 stock if, on the Separation Date, the awards were: (1) options outstanding and exercisable; or (2) restricted stock or restricted stock units (RSUs) awarded for completed performance periods under the ConocoPhillips Performance Share Program. Phillips 66 restricted stock, RSUs and options issued in this conversion became subject to the “Omnibus Stock and Performance Incentive Plan of Phillips 66” (the 2012 Plan) on the Separation Date, whether held by grantees working for Phillips 66 or grantees that remained employees of ConocoPhillips. Some of these awards based on Phillips 66 stock and held by employees of ConocoPhillips are outstanding and appear in the activity tables for the Stock Option and the Performance Share Programs presented later in this footnote.
In May 2013, shareholders approved the 2013 Omnibus Stock and Performance Incentive Plan of Phillips 66 (the P66 Omnibus Plan). Subsequent to this approval, all new share-based awards are granted under the P66 Omnibus Plan, which authorizes the Human Resources and Compensation Committee (HRCC) of our Board of Directors to grant stock options, stock appreciation rights, stock awards (including restricted stock and RSU awards), cash awards, and performance awards to our employees, non-employee directors and other plan participants. The number of new shares that may be issued under the P66 Omnibus Plan to settle share-based awards may not exceed
45 million
.
We recognize share-based compensation expense over the shorter of: (1) the service period (i.e., the stated period of time required to earn the award); or (2) the period beginning at the start of the service period and ending when an employee first becomes eligible for retirement, but not less than
six
months as this is the minimum period of time required for an award not to be subject to forfeiture. Our equity-classified programs generally provide accelerated vesting (i.e., a waiver of the remaining period of service required to earn an award) for awards held by employees at the time they become eligible for retirement (at age
55
with
5
years of service). We have elected to recognize expense on a straight-line basis over the service period for the entire award, irrespective of whether the award was granted with ratable or cliff vesting, and have elected to recognize forfeitures of awards when they occur.
Total share-based compensation expense recognized in income and the associated income tax benefit for the years ended December 31 were:
|
|
Millions of Dollars
|
||||||||
|
|
2018
|
|
2017
|
|
2016
|
|
|||
|
Share-based compensation expense
|
$
|
100
|
|
142
|
|
156
|
|
||
|
Income tax benefit
|
(45
|
)
|
(74
|
)
|
(59
|
)
|
|||
114
Stock Options
Stock options granted under the provisions of the P66 Omnibus Plan and earlier plans permit purchases of our common stock at exercise prices equivalent to the average of the high and low market price of our stock on the date the options were granted. The options have terms of
10 years
and vest ratably, with one-third of the options becoming exercisable on each anniversary date for the
three
years following the date of grant. Options awarded to employees eligible for retirement are not subject to forfeiture
six
months after the grant date.
The following table summarizes our stock option activity from January 1,
2018
, to
December 31, 2018
:
|
Millions of Dollars
|
|
|||||||||||||
|
Options
|
|
Weighted-
Average
Exercise Price
|
|
Weighted-Average
Grant-Date
Fair Value
|
|
Aggregate
Intrinsic Value |
|
|||||||
|
Outstanding at January 1, 2018
|
4,838,855
|
|
$
|
58.34
|
|
|||||||||
|
Granted
|
650,000
|
|
94.85
|
|
$
|
20.69
|
|
|||||||
|
Forfeited
|
(49,027
|
)
|
89.93
|
|
||||||||||
|
Exercised
|
(687,020
|
)
|
57.61
|
|
$
|
37
|
|
|||||||
|
Outstanding at December 31, 2018
|
4,752,808
|
|
$
|
63.11
|
|
|||||||||
|
Vested at December 31, 2018
|
3,941,271
|
|
$
|
57.79
|
|
|
$
|
109
|
|
|||||
|
Exercisable at December 31, 2018
|
3,331,259
|
|
$
|
53.51
|
|
|
$
|
106
|
|
|||||
The weighted-average remaining contractual terms of vested options and exercisable options at
December 31, 2018
, were
4.87 years
and
4.29
years, respectively. During
2018
, we received
$39 million
in cash and realized an income tax benefit of
$7 million
from the exercise of options. At
December 31, 2018
, the remaining unrecognized compensation expense from unvested options was
$6 million
, which will be recognized over a weighted-average period of
21
months, the longest period being
25
months. The calculations of realized income tax benefits and weighted-average periods include awards based on both Phillips 66 and ConocoPhillips stock held by Phillips 66 employees.
During
2017
and
2016
, we granted options with a weighted-average grant-date fair value of
$16.95
and
$16.94
, respectively. During
2017
and
2016
, employees exercised options with an aggregate intrinsic value of
$62 million
and
$58 million
, respectively.
The following table provides the significant assumptions used to calculate the grant-date fair values of options granted over the years shown below, as calculated using the Black-Scholes-Merton option-pricing model:
|
2018
|
|
2017
|
2016
|
|||
|
Risk-free interest rate
|
2.81
|
%
|
2.28
|
1.71
|
||
|
Dividend yield
|
2.80
|
%
|
2.90
|
3.00
|
||
|
Volatility factor
|
25.41
|
%
|
26.91
|
28.68
|
||
|
Expected life (years)
|
7.18
|
|
7.22
|
7.08
|
||
We calculate the volatility factor using historical Phillips 66 end-of-week closing stock prices since the Separation Date. We periodically calculate the average period of time elapsed between grant dates and exercise dates of past grants to estimate the expected life of new option grants.
115
Restricted Stock Units
Generally, RSUs are granted annually under the provisions of the P66 Omnibus Plan and cliff vest at the end of
three
years. The grant date fair value is equal to the average of the high and low market price of our stock on the grant date. The recipients receive a quarterly dividend equivalent cash payment until the RSU is settled by issuing
one
share of our common stock for each RSU at the end of the service period. RSUs granted to retirement-eligible employees are not subject to forfeiture
six
months after the grant date. Special RSUs are granted to attract or retain key personnel and the terms and conditions may vary by award.
The following table summarizes our RSU activity from January 1,
2018
, to
December 31, 2018
:
|
Millions of Dollars
|
|
|||||||||
|
Stock Units
|
|
Weighted-Average
Grant-Date
Fair Value
|
|
Total Fair Value
|
|
|||||
|
Outstanding at January 1, 2018
|
2,496,425
|
|
$
|
77.20
|
|
|||||
|
Granted
|
822,457
|
|
96.16
|
|
||||||
|
Forfeited
|
(63,977
|
)
|
84.61
|
|
||||||
|
Issued
|
(995,076
|
)
|
75.77
|
|
$
|
102
|
|
|||
|
Outstanding at December 31, 2018
|
2,259,829
|
|
$
|
84.52
|
|
|||||
|
Not Vested at December 31, 2018
|
1,565,641
|
|
$
|
84.99
|
|
|||||
At
December 31, 2018
, the remaining unrecognized compensation cost from unvested RSU awards was
$53 million
, which will be recognized over a weighted-average period of
22
months, the longest period being
36
months.
During
2017
and
2016
, we granted RSUs with a weighted-average grant-date fair value of
$78.49
and
$78.56
, respectively. During
2017
and
2016
, we issued shares with an aggregate fair value of
$85 million
and
$109 million
, respectively, to settle RSUs.
Performance Share Units
Under the P66 Omnibus Plan, we annually grant to senior management restricted performance share units (PSUs) with
three
-year performance periods that vest when the HRCC approves the three-year performance results on the grant date. PSUs granted under the P66 Omnibus Plan are classified as liability awards and compensation expense is recognized beginning on the authorization date and ending on the vesting date.
PSUs granted under the P66 Omnibus Plan are settled by cash payments equal to the fair value of the awards, which is based on the market prices of our stock near the end of the performance periods. The HRCC must approve the
three
-year performance results prior to payout. Dividend equivalents are not paid on these awards.
PSUs granted under prior incentive compensation plans were classified as equity awards. These equity awards are settled upon an employee’s retirement by issuing one share of our common stock for each PSU held. Dividend equivalents are paid on these awards.
116
The following table summarizes our PSU activity from January 1,
2018
, to
December 31, 2018
:
|
Millions of Dollars
|
|
|||||||||
|
Performance
Share Units
|
|
Weighted-Average
Grant-Date
Fair Value
|
|
Total Fair Value
|
|
|||||
|
Outstanding at January 1, 2018
|
2,558,278
|
|
$
|
52.06
|
|
|
||||
|
Granted
|
494,277
|
|
99.74
|
|
|
|||||
|
Forfeited
|
(16,716
|
)
|
69.90
|
|
|
|||||
|
Issued
|
(639,060
|
)
|
59.15
|
|
$
|
70
|
|
|||
|
Cash settled
|
(494,277
|
)
|
99.74
|
|
49
|
|
||||
|
Outstanding at December 31, 2018
|
1,902,502
|
|
$
|
49.52
|
|
|||||
|
Not Vested at December 31, 2018
|
153,236
|
|
$
|
65.59
|
|
|||||
At
December 31, 2018
, the remaining unrecognized compensation cost from unvested PSU awards was
$1 million
, which will be recognized over a weighted-average period of
14
months, with the longest period being
4
years. The calculations of unamortized expense and weighted-average periods include awards based on both Phillips 66 and ConocoPhillips stock held by Phillips 66 employees.
During
2017
and
2016
, we granted PSUs with a weighted-average grant-date fair value of
$86.88
and
$78.62
, respectively. During
2017
and
2016
, we issued shares with an aggregate fair value of
$54 million
and
$26 million
, respectively, to settle PSUs. During 2017 and 2016, we cash settled PSUs with an aggregate fair value of
$56 million
and
$60 million
, respectively.
Note 21—
Income Taxes
In December 2017, the U.S. government enacted comprehensive income tax legislation, referred to as the Tax Cuts and Jobs Act (the Tax Act). The material provisions of the Tax Act i) reduced the U.S. federal corporate income tax rate from
35 percent
to
21 percent
beginning January 1, 2018, ii) required companies to reflect on their 2017 corporate income tax return a liability for a one-time deemed repatriation tax on foreign-sourced earnings that were previously tax deferred, and iii) created a new tax regime for post-2017 foreign-sourced earnings.
To account for the reduction in the U.S. federal corporate income tax rate, we remeasured our deferred tax assets and liabilities based on the rates at which they are expected to reverse in the future, generally
21 percent
, which resulted in the recognition of a provisional deferred tax benefit of
$2,870 million
in the year ended December 31, 2017. To account for the one-time deemed repatriation income tax, we calculated our provisional liability in accordance with the Tax Act and considered previously accrued current and deferred tax liabilities on undistributed earnings of our foreign subsidiaries and foreign joint ventures. The effects of the one-time deemed repatriation tax resulted in the recognition of a provisional income tax expense of
$149 million
in the year ended December 31, 2017.
During the year ended December 31, 2018, we recorded adjustments to finalize our accounting for the income tax effects of the Tax Act, which increased our income tax expense by
$36 million
. The adjustments were primarily due to the revision of our estimated deferred income tax balances in conjunction with the filing of our 2017 income tax return and the issuance of additional guidance by the U.S. Internal Revenue Service related to the calculation of the one-time deemed repatriation tax.
117
Components of income tax expense (benefit) were:
|
|
Millions of Dollars
|
||||||||
|
|
2018
|
|
2017
|
|
2016
|
|
|||
|
Income Tax Expense (Benefit)
|
|||||||||
|
Federal
|
|||||||||
|
Current
|
$
|
739
|
|
9
|
|
(105
|
)
|
||
|
Deferred
|
257
|
|
(1,960
|
)
|
645
|
|
|||
|
Foreign
|
|||||||||
|
Current
|
326
|
|
126
|
|
66
|
|
|||
|
Deferred
|
53
|
|
3
|
|
(84
|
)
|
|||
|
State and local
|
|||||||||
|
Current
|
255
|
|
61
|
|
(24
|
)
|
|||
|
Deferred
|
(58
|
)
|
68
|
|
49
|
|
|||
|
$
|
1,572
|
|
(1,693
|
)
|
547
|
|
|||
Deferred income taxes reflect the net tax effect of temporary differences between the carrying amounts of assets and liabilities for financial reporting purposes and the amounts used for tax purposes. Major components of deferred tax liabilities and assets at December 31 were:
|
|
Millions of Dollars
|
|||||
|
|
2018
|
|
2017
|
|
||
|
Deferred Tax Liabilities
|
||||||
|
Properties, plants and equipment, and intangibles
|
$
|
3,074
|
|
2,942
|
|
|
|
Investment in joint ventures
|
2,041
|
|
1,923
|
|
||
|
Investment in subsidiaries
|
602
|
|
594
|
|
||
|
Inventory
|
66
|
|
—
|
|
||
|
Other
|
14
|
|
18
|
|
||
|
Total deferred tax liabilities
|
5,797
|
|
5,477
|
|
||
|
Deferred Tax Assets
|
||||||
|
Benefit plan accruals
|
395
|
|
314
|
|
||
|
Asset retirement obligations and accrued environmental costs
|
109
|
|
121
|
|
||
|
Loss and credit carryforwards
|
59
|
|
96
|
|
||
|
Other financial accruals and deferrals
|
16
|
|
44
|
|
||
|
Inventory
|
—
|
|
10
|
|
||
|
Other
|
—
|
|
3
|
|
||
|
Total deferred tax assets
|
579
|
|
588
|
|
||
|
Less: valuation allowance
|
8
|
|
28
|
|
||
|
Net deferred tax assets
|
571
|
|
560
|
|
||
|
Net deferred tax liabilities
|
$
|
5,226
|
|
4,917
|
|
|
At December 31, 2018, the loss and credit carryforward deferred tax assets were primarily related to a German interest deduction carryforward of
$51 million
, and capital loss and net operating loss carryforwards in the United Kingdom of
$5 million
. All losses may be carried forward indefinitely.
118
Valuation allowances have been established to reduce deferred tax assets to an amount that will, more likely than not, be realized. During the year ended December 31,
2018
, our total valuation allowance balance
decreased
by
$20 million
. Based on our historical taxable income, expectations for the future and available tax planning strategies, management expects the remaining net deferred tax assets will be realized as offsets to reversing deferred tax liabilities and the tax consequences of future taxable income.
At December 31,
2017
, all undistributed earnings of our foreign subsidiaries and foreign joint ventures were included in our computation of the one-time deemed repatriation tax associated with the enactment of the Tax Act. Earnings of our foreign subsidiaries and foreign joint ventures after December 31, 2017, are generally not subject to incremental income taxes in the United States or withholding taxes in foreign countries upon repatriation. As such, we only assert that the earnings of one of our foreign subsidiaries are permanently reinvested. At December 31, 2018 and 2017, the unrecorded deferred tax liability related to the undistributed earnings of this foreign subsidiary was not material.
As a result of the Separation and pursuant to the Tax Sharing Agreement with ConocoPhillips, the unrecognized income tax benefits related to our operations for which ConocoPhillips was the taxpayer remain the responsibility of ConocoPhillips, and we have indemnified ConocoPhillips for such amounts. Following is a reconciliation of the changes in our unrecognized income tax benefits balance:
|
|
Millions of Dollars
|
||||||||
|
|
2018
|
|
2017
|
|
2016
|
|
|||
|
Balance at January 1
|
$
|
34
|
|
70
|
|
82
|
|
||
|
Additions for tax positions of prior years
|
1
|
|
1
|
|
5
|
|
|||
|
Reductions for tax positions of prior years
|
(2
|
)
|
(5
|
)
|
(17
|
)
|
|||
|
Settlements
|
(10
|
)
|
(32
|
)
|
—
|
|
|||
|
Balance at December 31
|
$
|
23
|
|
34
|
|
70
|
|
||
Included in the balance of unrecognized income tax benefits at December 31,
2018
,
2017
and
2016
were
$1 million
,
$5 million
and
$13 million
, respectively, which, if recognized, would affect our effective income tax rate. With respect to various unrecognized income tax benefits and the related accrued liabilities, we do not expect any to be recognized or paid within the next twelve months.
At December 31,
2018
,
2017
and
2016
, accrued liabilities for interest and penalties, net of accrued income taxes, totaled
$5 million
,
$8 million
and
$12 million
, respectively. As a result of reversing certain of these accruals, net income increased by
$1 million
and
$7 million
for the years ended December 31,
2017
and
2016
, respectively.
We file tax returns in the U.S. federal jurisdiction and in many foreign and state jurisdictions. Audits in significant jurisdictions are generally complete as follows: United Kingdom (2015), Germany (2014) and United States Phillips 66 audits (2013) and United States ConocoPhillips audits (2010). Certain issues remain in dispute for audited years, and unrecognized income tax benefits for years still subject to or currently undergoing an audit are subject to change. As a consequence, the balance in unrecognized income tax benefits can be expected to fluctuate from period to period. Although it is reasonably possible such changes could be significant when compared with our total unrecognized income tax benefits, the amount of change is not estimable.
119
The amounts of U.S. and foreign income before income taxes, with a reconciliation of income tax at the federal statutory rate to the recorded income tax expense (benefit), were:
|
|
Millions of Dollars
|
Percentage of
Income Before Income Taxes
|
||||||||||||||||
|
|
2018
|
|
2017
|
|
2016
|
|
2018
|
|
2017
|
|
2016
|
|
||||||
|
Income before income taxes
|
||||||||||||||||||
|
United States
|
$
|
5,716
|
|
2,799
|
|
1,713
|
|
76.8
|
%
|
78.7
|
|
78.2
|
|
|||||
|
Foreign
|
1,729
|
|
756
|
|
478
|
|
23.2
|
|
21.3
|
|
21.8
|
|
||||||
|
$
|
7,445
|
|
3,555
|
|
2,191
|
|
100.0
|
%
|
100.0
|
|
100.0
|
|
||||||
|
Federal statutory income tax
|
$
|
1,563
|
|
1,244
|
|
767
|
|
21.0
|
%
|
35.0
|
|
35.0
|
|
|||||
|
State income tax, net of federal benefit
|
155
|
|
79
|
|
12
|
|
2.1
|
|
2.2
|
|
0.6
|
|
||||||
|
Tax Cuts and Jobs Act
|
36
|
|
(2,721
|
)
|
—
|
|
0.5
|
|
(76.5
|
)
|
—
|
|
||||||
|
Foreign rate differential
|
(91
|
)
|
(210
|
)
|
(152
|
)
|
(1.2
|
)
|
(5.9
|
)
|
(6.9
|
)
|
||||||
|
Noncontrolling interests
|
(58
|
)
|
(46
|
)
|
(26
|
)
|
(0.8
|
)
|
(1.3
|
)
|
(1.2
|
)
|
||||||
|
Change in valuation allowance
|
(20
|
)
|
(4
|
)
|
(81
|
)
|
(0.3
|
)
|
(0.1
|
)
|
(3.7
|
)
|
||||||
|
Federal manufacturing deduction
|
—
|
|
(18
|
)
|
—
|
|
—
|
|
(0.5
|
)
|
—
|
|
||||||
|
Other
|
(13
|
)
|
(17
|
)
|
27
|
|
(0.2
|
)
|
(0.5
|
)
|
1.2
|
|
||||||
|
$
|
1,572
|
|
(1,693
|
)
|
547
|
|
21.1
|
%
|
(47.6
|
)
|
25.0
|
|
||||||
Income tax expense of
$13 million
,
$81 million
and
$150 million
for the years ended December 31,
2018
,
2017
and
2016
, respectively, is reflected in the “Capital in Excess of Par” column on our consolidated statement of changes in equity.
120
Note 22—
Accumulated Other Comprehensive Loss
Changes in the balances of each component of accumulated other comprehensive loss were as follows:
|
|
Millions of Dollars
|
|||||||||||
|
|
Defined
Benefit
Plans
|
|
Foreign
Currency
Translation
|
|
Hedging
|
|
Accumulated
Other
Comprehensive Loss
|
|
||||
|
December 31, 2015
|
$
|
(662
|
)
|
11
|
|
(2
|
)
|
(653
|
)
|
|||
|
Other comprehensive income (loss) before reclassifications
|
(112
|
)
|
(296
|
)
|
5
|
|
(403
|
)
|
||||
|
Amounts reclassified from accumulated other comprehensive loss*
|
||||||||||||
|
Amortization of defined benefit plan items**
|
||||||||||||
|
Net actuarial loss, prior service cost (credit) and settlements
|
61
|
|
—
|
|
—
|
|
61
|
|
||||
|
Net current period other comprehensive income (loss)
|
(51
|
)
|
(296
|
)
|
5
|
|
(342
|
)
|
||||
|
December 31, 2016
|
(713
|
)
|
(285
|
)
|
3
|
|
(995
|
)
|
||||
|
Other comprehensive income before reclassifications
|
3
|
|
259
|
|
4
|
|
266
|
|
||||
|
Amounts reclassified from accumulated other comprehensive loss*
|
||||||||||||
|
Amortization of defined benefit plan items**
|
||||||||||||
|
Net actuarial loss, prior service cost (credit) and settlements
|
112
|
|
—
|
|
—
|
|
112
|
|
||||
|
Net current period other comprehensive income
|
115
|
|
259
|
|
4
|
|
378
|
|
||||
|
December 31, 2017
|
(598
|
)
|
(26
|
)
|
7
|
|
(617
|
)
|
||||
|
Other comprehensive income (loss) before reclassifications
|
14
|
|
(192
|
)
|
4
|
|
(174
|
)
|
||||
|
Amounts reclassified from accumulated other comprehensive loss
|
||||||||||||
|
Amortization of defined benefit plan items**
|
||||||||||||
|
Net actuarial loss, prior service cost (credit) and settlements
|
112
|
|
—
|
|
—
|
|
112
|
|
||||
|
Foreign currency translation
|
—
|
|
(10
|
)
|
—
|
|
(10
|
)
|
||||
|
Hedging
|
—
|
|
—
|
|
(3
|
)
|
(3
|
)
|
||||
|
Net current period other comprehensive income (loss)
|
126
|
|
(202
|
)
|
1
|
|
(75
|
)
|
||||
|
December 31, 2018
|
$
|
(472
|
)
|
(228
|
)
|
8
|
|
(692
|
)
|
|||
* There were no significant reclassifications related to foreign currency translation or hedging in the years ended December 31,
2017
and
2016
.
** Included in the computation of net periodic benefit cost. See
Note 19—Pension and Postretirement Plans
, for additional information.
121
Note 23—
Cash Flow Information
Supplemental Cash Flow Information
|
Millions of Dollars
|
|||||||||
|
2018
|
|
2017
|
|
2016
|
|
||||
|
Cash Payments (Receipts)
|
|||||||||
|
Interest
|
$
|
465
|
|
421
|
|
311
|
|
||
|
Income taxes*
|
984
|
|
(257
|
)
|
(375
|
)
|
|||
*
2017 and 2016 reflected a net cash refund position; cash payments for income taxes were
$102 million
and
$385 million
in 2017 and 2016, respectively.
Restricted Cash
At December 31, 2018, 2017 and 2016, the company did
not
have any restricted cash. The restrictions on the cash acquired in February 2017, as a result of the consolidation of Merey Sweeny, were fully removed in May 2017 when Merey Sweeny’s outstanding debt that contained lender restrictions on the use of cash was paid in full. See
Note 5—Business Combinations
, for additional information regarding our consolidation of Merey Sweeny.
Note 24—
Other Financial Information
|
|
Millions of Dollars
|
||||||||
|
|
2018
|
|
2017
|
|
2016
|
|
|||
|
Interest and Debt Expense
|
|||||||||
|
Incurred
|
|||||||||
|
Debt
|
$
|
493
|
|
432
|
|
402
|
|
||
|
Other
|
28
|
|
21
|
|
17
|
|
|||
|
521
|
|
453
|
|
419
|
|
||||
|
Capitalized
|
(17
|
)
|
(15
|
)
|
(81
|
)
|
|||
|
Expensed
|
$
|
504
|
|
438
|
|
338
|
|
||
|
Other Income
|
|||||||||
|
Interest income
|
$
|
45
|
|
31
|
|
18
|
|
||
|
Gain on consolidation of business*
|
—
|
|
423
|
|
—
|
|
|||
|
Other, net**
|
16
|
|
67
|
|
56
|
|
|||
|
$
|
61
|
|
521
|
|
74
|
|
|||
|
* See Note 5—Business Combinations, for more information regarding the gain recognized in 2017.
|
|||||||||
|
** Includes derivatives-related activities. See Note 15—Derivatives and Financial Instruments, for additional information.
|
|||||||||
|
Research and Development Expenses
|
$
|
55
|
|
60
|
|
60
|
|
||
|
Advertising Expenses
|
$
|
68
|
|
76
|
|
80
|
|
||
|
Foreign Currency Transaction (Gains) Losses
|
|||||||||
|
Midstream
|
$
|
—
|
|
—
|
|
—
|
|
||
|
Chemicals
|
—
|
|
—
|
|
—
|
|
|||
|
Refining
|
(24
|
)
|
(2
|
)
|
(13
|
)
|
|||
|
Marketing and Specialties
|
1
|
|
1
|
|
1
|
|
|||
|
Corporate and Other
|
(8
|
)
|
1
|
|
(3
|
)
|
|||
|
$
|
(31
|
)
|
—
|
|
(15
|
)
|
|||
122
Note 25—
Related Party Transactions
Significant transactions with related parties were:
|
|
Millions of Dollars
|
||||||||
|
|
2018
|
|
2017
|
|
2016
|
|
|||
|
Operating revenues and other income (a)
|
$
|
3,514
|
|
2,596
|
|
2,174
|
|
||
|
Purchases (b)
|
12,755
|
|
10,468
|
|
8,109
|
|
|||
|
Operating expenses and selling, general and
administrative expenses (c)
|
59
|
|
79
|
|
125
|
|
|||
|
(a)
|
We sold NGL and other petrochemical feedstocks, along with solvents, to CPChem, gas oil and hydrogen feedstocks to Excel Paralubes (Excel), and refined petroleum products to OnCue. We also sold certain feedstocks and intermediate products to WRB and acted as agent for WRB in supplying crude oil and other feedstocks for a fee. In addition, we charged several of our affiliates, including CPChem, for the use of common facilities, such as steam generators, waste and water treaters and warehouse facilities.
|
|
(b)
|
We purchased crude oil, refined petroleum products and NGL from WRB and also acted as agent for WRB in distributing solvents. We also purchased natural gas and NGL from DCP Midstream and CPChem, as well as other feedstocks from various affiliates, for use in our refinery and fractionation processes. In addition, we purchased base oils and fuel products from Excel for use in our specialty and refining businesses. We paid NGL fractionation fees to CPChem. We also paid fees to various pipeline affiliates for transporting crude oil, refined petroleum products and NGL.
|
|
(c)
|
We paid utility and processing fees to various affiliates.
|
As discussed more fully in
Note 5—
Business Combinations
, in February 2017, we began accounting for Merey Sweeny as a consolidated subsidiary. Accordingly, the table above only includes processing fees paid to Merey Sweeny through the consolidation date.
123
Note 26—
Segment Disclosures and Related Information
During the fourth quarter of 2018, the segment performance measure used by our chief executive officer to assess performance and allocate resources was changed from “net income” to “income before income taxes.” Prior-period segment information has been recast to conform to the current presentation.
Our operating segments are:
|
1)
|
Midstream—
Provides crude oil and refined petroleum product transportation, terminaling and processing services, as well as natural gas and NGL transportation, storage, processing and marketing services, mainly in the United States. The Midstream segment includes our master limited partnership (MLP), Phillips 66 Partners, as well as our
50 percent
equity investment in DCP Midstream.
|
|
2)
|
Chemicals—
Consists of our
50 percent
equity investment in CPChem, which manufactures and markets petrochemicals and plastics on a worldwide basis.
|
|
3)
|
Refining—
Refines crude oil and other feedstocks into petroleum products (such as gasoline, distillates and aviation fuels) at
13
refineries in the United States and Europe.
|
|
4)
|
Marketing and Specialties—
Purchases for resale and markets refined petroleum products, mainly in the United States and Europe. In addition, this segment includes the manufacturing and marketing of specialty products, as well as power generation operations.
|
Corporate and Other includes general corporate overhead, interest expense, our investment in new technologies and various other corporate activities. Corporate assets include all cash, cash equivalents and income tax-related assets.
Intersegment sales are at prices that we believe approximate market.
124
Analysis of Results by Operating Segment
|
|
Millions of Dollars
|
||||||||
|
|
2018
|
|
2017*
|
|
2016*
|
|
|||
|
Sales and Other Operating Revenues**
|
|||||||||
|
Midstream
|
|||||||||
|
Total sales
|
$
|
8,293
|
|
6,620
|
|
4,226
|
|
||
|
Intersegment eliminations
|
(2,176
|
)
|
(1,842
|
)
|
(1,299
|
)
|
|||
|
Total Midstream
|
6,117
|
|
4,778
|
|
2,927
|
|
|||
|
Chemicals
|
5
|
|
5
|
|
5
|
|
|||
|
Refining
|
|||||||||
|
Total sales
|
83,140
|
|
65,494
|
|
52,068
|
|
|||
|
Intersegment eliminations
|
(49,343
|
)
|
(40,284
|
)
|
(34,120
|
)
|
|||
|
Total Refining
|
33,797
|
|
25,210
|
|
17,948
|
|
|||
|
Marketing and Specialties
|
|||||||||
|
Total sales
|
73,414
|
|
73,565
|
|
64,476
|
|
|||
|
Intersegment eliminations
|
(1,899
|
)
|
(1,233
|
)
|
(1,109
|
)
|
|||
|
Total Marketing and Specialties
|
71,515
|
|
72,332
|
|
63,367
|
|
|||
|
Corporate and Other
|
27
|
|
29
|
|
32
|
|
|||
|
Consolidated sales and other operating revenues
|
$
|
111,461
|
|
102,354
|
|
84,279
|
|
||
|
* Sales and other operating revenues for the years ended December 31, 2017 and 2016, are presented in accordance with accounting standards in effect prior to our adoption of ASU No. 2014-09 on January 1, 2018. See Note 2—Changes in Accounting Principles, for further discussion regarding our adoption of ASU No. 2014-09.
|
|||||||||
|
** See Note 3—Sales and Other Operating Revenues, for further details on our disaggregated sales and other operating revenues.
|
|||||||||
|
Equity in Earnings of Affiliates
|
|||||||||
|
Midstream
|
$
|
676
|
|
454
|
|
184
|
|
||
|
Chemicals
|
1,025
|
|
713
|
|
834
|
|
|||
|
Refining
|
796
|
|
322
|
|
164
|
|
|||
|
Marketing and Specialties
|
164
|
|
243
|
|
232
|
|
|||
|
Corporate and Other
|
15
|
|
—
|
|
—
|
|
|||
|
Consolidated equity in earnings of affiliates
|
$
|
2,676
|
|
1,732
|
|
1,414
|
|
||
|
Depreciation, Amortization and Impairments
|
|||||||||
|
Midstream
|
$
|
326
|
|
299
|
|
218
|
|
||
|
Chemicals
|
—
|
|
—
|
|
—
|
|
|||
|
Refining
|
841
|
|
838
|
|
770
|
|
|||
|
Marketing and Specialties
|
114
|
|
116
|
|
107
|
|
|||
|
Corporate and Other
|
83
|
|
89
|
|
78
|
|
|||
|
Consolidated depreciation, amortization and impairments
|
$
|
1,364
|
|
1,342
|
|
1,173
|
|
||
125
|
|
Millions of Dollars
|
||||||||
|
|
2018
|
|
2017
|
|
2016
|
|
|||
|
Interest Income and Expense
|
|||||||||
|
Interest income
|
|||||||||
|
Midstream
|
$
|
—
|
|
1
|
|
2
|
|
||
|
Chemicals
|
—
|
|
—
|
|
—
|
|
|||
|
Refining
|
—
|
|
—
|
|
—
|
|
|||
|
Marketing and Specialties
|
—
|
|
—
|
|
—
|
|
|||
|
Corporate and Other
|
45
|
|
30
|
|
16
|
|
|||
|
Consolidated interest income
|
$
|
45
|
|
31
|
|
18
|
|
||
|
Interest and debt expense
|
|||||||||
|
Corporate and Other
|
$
|
504
|
|
438
|
|
338
|
|
||
|
Income (Loss) Before Income Taxes
|
|||||||||
|
Midstream
|
$
|
1,181
|
|
638
|
|
403
|
|
||
|
Chemicals
|
1,025
|
|
716
|
|
839
|
|
|||
|
Refining
|
4,535
|
|
2,076
|
|
435
|
|
|||
|
Marketing and Specialties
|
1,557
|
|
1,020
|
|
1,261
|
|
|||
|
Corporate and Other
|
(853
|
)
|
(895
|
)
|
(747
|
)
|
|||
|
Consolidated income before income taxes
|
$
|
7,445
|
|
3,555
|
|
2,191
|
|
||
|
Investments In and Advances To Affiliates
|
|||||||||
|
Midstream
|
$
|
5,423
|
|
4,734
|
|
4,769
|
|
||
|
Chemicals
|
6,233
|
|
6,222
|
|
5,773
|
|
|||
|
Refining
|
2,226
|
|
2,398
|
|
2,420
|
|
|||
|
Marketing and Specialties
|
349
|
|
390
|
|
391
|
|
|||
|
Corporate and Other
|
—
|
|
—
|
|
1
|
|
|||
|
Consolidated investments in and advances to affiliates
|
$
|
14,231
|
|
13,744
|
|
13,354
|
|
||
|
Total Assets*
|
|||||||||
|
Midstream
|
$
|
14,329
|
|
13,231
|
|
12,832
|
|
||
|
Chemicals
|
6,235
|
|
6,226
|
|
5,802
|
|
|||
|
Refining
|
23,230
|
|
23,780
|
|
22,781
|
|
|||
|
Marketing and Specialties
|
6,572
|
|
7,052
|
|
6,179
|
|
|||
|
Corporate and Other
|
3,936
|
|
4,082
|
|
4,059
|
|
|||
|
Consolidated total assets
|
$
|
54,302
|
|
54,371
|
|
51,653
|
|
||
|
* Prior-period segment information has been recast to include all income tax-related assets in Corporate and Other.
|
|||||||||
126
|
|
Millions of Dollars
|
||||||||
|
|
2018
|
|
2017
|
|
2016
|
|
|||
|
Capital Expenditures and Investments
|
|||||||||
|
Midstream
|
$
|
1,548
|
|
771
|
|
1,453
|
|
||
|
Chemicals
|
—
|
|
—
|
|
—
|
|
|||
|
Refining
|
826
|
|
853
|
|
1,149
|
|
|||
|
Marketing and Specialties
|
125
|
|
108
|
|
98
|
|
|||
|
Corporate and Other
|
140
|
|
100
|
|
144
|
|
|||
|
Consolidated capital expenditures and investments
|
$
|
2,639
|
|
1,832
|
|
2,844
|
|
||
Geographic Information
Long-lived assets, defined as net PP&E plus investments and long-term receivables, by geographic location at December 31 were:
|
|
Millions of Dollars
|
||||||||
|
|
2018
|
|
2017
|
|
2016
|
|
|||
|
United States
|
$
|
34,587
|
|
33,457
|
|
32,619
|
|
||
|
United Kingdom
|
1,191
|
|
1,254
|
|
1,177
|
|
|||
|
Germany
|
570
|
|
593
|
|
505
|
|
|||
|
Other foreign countries
|
91
|
|
97
|
|
88
|
|
|||
|
Worldwide consolidated
|
$
|
36,439
|
|
35,401
|
|
34,389
|
|
||
127
Note 27—
Phillips 66 Partners LP
Phillips 66 Partners, headquartered in Houston, Texas, is a publicly traded MLP formed in 2013 to own, operate, develop and acquire primarily fee-based midstream assets. Phillips 66 Partners’ operations currently consist of crude oil, refined petroleum product and NGL transportation, processing, terminaling and storage assets.
We consolidate Phillips 66 Partners because we determined it is a VIE of which we are the primary beneficiary. As general partner of Phillips 66 Partners, we have the ability to control its financial interests, as well as the ability to direct the activities that most significantly impact its economic performance. As a result of this consolidation, the public common and perpetual convertible preferred unitholders’ ownership interests in Phillips 66 Partners are reflected as noncontrolling interests of
$2,469 million
and
$2,314 million
on our consolidated balance sheet at
December 31, 2018
and
2017
, respectively. Generally, drop down transactions to Phillips 66 Partners will eliminate in consolidation, except for third-party debt and third-party equity offerings made by Phillips 66 Partners to finance such transactions.
At
December 31, 2018
, we owned a
54 percent
limited partner interest and a
2 percent
general partner interest in Phillips 66 Partners, while the public owned a
44 percent
limited partner interest and
13.8 million
perpetual convertible preferred units. Holders of the preferred units are entitled to receive cumulative quarterly distributions equal to
$0.678375
per unit. Beginning in October 2020, holders are entitled to receive quarterly distributions equal to the greater of
$0.678375
per unit or the per-unit distribution paid to common unitholders.
The most significant assets of Phillips 66 Partners that are available to settle only its obligations, along with its most significant liabilities for which its creditors do not have recourse to Phillips 66’s general credit, were:
|
|
Millions of Dollars
|
|||||
|
|
December 31
2018 |
|
December 31
2017 |
|
||
|
Cash and cash equivalents
|
$
|
1
|
|
185
|
|
|
|
Equity investments*
|
2,448
|
|
1,932
|
|
||
|
Net properties, plants and equipment
|
3,052
|
|
2,918
|
|
||
|
Long-term debt
|
2,998
|
|
2,920
|
|
||
* Included in “Investments and long-term receivables” line on the Phillips 66 consolidated balance sheet.
2018 Activities
Phillips 66 Partners’ initial
$250 million
continuous offering of common units, or at-the-market (ATM) program, was completed in June 2018. At that time, Phillips 66 Partners commenced issuing common units under its second
$250 million
ATM program. For the years ended
December 31, 2018
and
2017
, on a settlement-date basis, Phillips 66 Partners generated net proceeds of
$128 million
and
$173 million
, respectively, from common units issued under the ATM programs. Since inception in June 2016 through
December 31, 2018
, the ATM programs have generated net proceeds of
$320 million
.
Phillips 66 Partners’ investment in the Gray Oak Pipeline development is held through Holdings LLC. In December 2018, a third party exercised its option to acquire a
35 percent
interest in Holdings LLC. Because Holdings LLC’s sole asset was its
75 percent
ownership interest in Gray Oak, which is considered a financial asset, and because certain restrictions were placed on the third party’s ability to transfer or sell its interest in Holdings LLC during the construction of the Gray Oak Pipeline, the legal sale of the
35 percent
interest did not qualify as a sale under GAAP. As such, the contributions the third party will make to Holdings LLC in 2019 to cover its share of previously incurred and future construction costs plus a premium to Phillips 66 Partners will be reflected as a long-term obligation on our consolidated balance sheet and financing cash inflows on our consolidated statement of cash flows. After construction of the Gray Oak Pipeline is completed, these restrictions expire, and the sale will be recognized under GAAP. Phillips 66 Partners will continue to control and consolidate Holdings LLC after sale recognition, and therefore the third party’s
35 percent
interest will be recharacterized from a long-term obligation to a noncontrolling interest in our financial statements at that time. Also at that time, the premium paid will be recharacterized from a long-term obligation to a gain in our consolidated statement of income. During January and February of 2019, the third party contributed an aggregate of
128
$294 million
into Holdings LLC, which Holdings LLC used to fund its portion of Gray Oak’s cash calls. See
Note 7—Investments, Loans and Long-Term Receivables
, for further discussion regarding Phillip 66 Partners’ investment in Gray Oak.
2017 Activities
In October 2017, we contributed to Phillips 66 Partners our
25 percent
ownership interests in both Dakota Access and ETCO and our
100 percent
ownership interest in Merey Sweeny. Total consideration for the transaction was
$1.65 billion
, which consisted of
$372 million
in cash at closing, the assumption of
$588 million
of promissory notes payable to us, the assumption of a
$450 million
term loan payable to a third party, and the issuance to us of common and general partner units with a fair value of
$240 million
. Shortly after closing, Phillips 66 Partners repaid the
$588 million
of promissory notes payable to us, resulting in total cash received by us for the transaction of
$960 million
.
Phillips 66 Partners financed the consideration paid with the proceeds from the following third-party equity and debt offerings:
|
•
|
Net proceeds of
$737 million
from a private placement of
13,819,791
perpetual convertible preferred units, at a price of
$54.27
per unit.
|
|
•
|
Net proceeds of
$295 million
from a private placement of
6,304,204
common units, at a price of
$47.59
per unit.
|
|
•
|
A portion of the
$643 million
of net proceeds from a public offering of
$650 million
of Senior Notes. See
Note 12—Debt
, for additional information on the Senior Notes.
|
Note 28—
New Accounting Standards
In February 2018, the FASB issued ASU No. 2018-02, “Income Statement—Reporting Comprehensive Income (Topic 220): Reclassification of Certain Tax Effects from Accumulated Other Comprehensive Income.” This ASU allows for the deferred income tax effects stranded in accumulated other comprehensive income (AOCI) resulting from the Tax Act enacted in December 2017 to be reclassed from AOCI to retained earnings. This ASU is effective for fiscal years, and interim periods within those fiscal years, beginning after December 15, 2018, with early adoption permitted. Upon adoption on January 1, 2019, we increased retained earnings by approximately
$90 million
with the offset to accumulated other comprehensive loss on our consolidated balance sheet.
In June 2016, the FASB issued ASU No. 2016-13, “Financial Instruments—Credit Losses (Topic 326): Measurement of Credit Losses on Financial Instruments.” The new standard amends the impairment model to utilize an expected loss methodology in place of the currently used incurred loss methodology, which may result in earlier recognition of losses. Public business entities should apply the guidance in ASU No. 2016-13 for annual periods beginning after December 15, 2019, including interim periods within those annual periods. Early adoption will be permitted for annual periods beginning after December 15, 2018. We are evaluating the provisions of ASU No. 2016-13, and currently do not expect our adoption to have a material impact on our consolidated financial statements.
In February 2016, the FASB issued ASU No. 2016-02, “Leases (Topic 842).” The new standard establishes a right-of-use (ROU) model that requires a lessee to record a ROU asset and a lease liability on the balance sheet for all leases with terms longer than 12 months. Leases will continue to be classified as either finance or operating, with classification affecting the pattern of expense recognition in the income statement. Similarly, lessors will be required to classify leases as sales-type, finance or operating, with classification affecting the pattern of income recognition. Classification for both lessees and lessors will be based on an assessment of whether risks and rewards, as well as substantive control have been transferred through a lease contract. The ASU also requires additional disclosures. Public business entities should apply the guidance in ASU No. 2016-02 for annual periods beginning after December 15, 2018, including interim periods within those annual periods. Early adoption is permitted. We will adopt ASU No. 2016-02 by recognizing a cumulative-effect adjustment to our opening consolidated balance sheet as of our January 1, 2019, adoption date. As of the adoption date, we expect to recognize ROU assets and operating lease liabilities on our consolidated balance sheet of approximately
$1.4 billion
. The adoption of this ASU is not expected to have a material impact on our consolidated statements of income and cash flows.
129
Note 29—
Condensed Consolidating Financial Information
Phillips 66 has senior notes outstanding, the payment obligations of which are fully and unconditionally guaranteed by Phillips 66 Company, a
100
-percent-owned subsidiary. The following condensed consolidating financial information presents the results of operations, financial position and cash flows for:
|
•
|
Phillips 66 and Phillips 66 Company (in each case, reflecting investments in subsidiaries utilizing the equity method of accounting).
|
|
•
|
All other nonguarantor subsidiaries.
|
|
•
|
The consolidating adjustments necessary to present Phillips 66’s results on a consolidated basis.
|
This condensed consolidating financial information should be read in conjunction with the accompanying consolidated financial statements and notes.
|
Millions of Dollars
|
|||||||||||
|
Year Ended December 31, 2018
|
|||||||||||
|
Statement of Income
|
Phillips 66
|
|
Phillips 66 Company
|
|
All Other Subsidiaries
|
|
Consolidating Adjustments
|
|
Total Consolidated
|
|
|
|
Revenues and Other Income
|
|||||||||||
|
Sales and other operating revenues
|
$
|
—
|
|
85,486
|
|
25,975
|
|
—
|
|
111,461
|
|
|
Equity in earnings of affiliates
|
5,918
|
|
4,030
|
|
747
|
|
(8,019
|
)
|
2,676
|
|
|
|
Net gain on dispositions
|
—
|
|
8
|
|
11
|
|
—
|
|
19
|
|
|
|
Other income
|
—
|
|
33
|
|
28
|
|
—
|
|
61
|
|
|
|
Intercompany revenues
|
—
|
|
3,493
|
|
14,085
|
|
(17,578
|
)
|
—
|
|
|
|
Total Revenues and Other Income
|
5,918
|
|
93,050
|
|
40,846
|
|
(25,597
|
)
|
114,217
|
|
|
|
Costs and Expenses
|
|||||||||||
|
Purchased crude oil and products
|
—
|
|
79,559
|
|
35,563
|
|
(17,192
|
)
|
97,930
|
|
|
|
Operating expenses
|
—
|
|
3,769
|
|
1,193
|
|
(82
|
)
|
4,880
|
|
|
|
Selling, general and administrative expenses
|
7
|
|
1,297
|
|
383
|
|
(10
|
)
|
1,677
|
|
|
|
Depreciation and amortization
|
—
|
|
926
|
|
430
|
|
—
|
|
1,356
|
|
|
|
Impairments
|
—
|
|
3
|
|
5
|
|
—
|
|
8
|
|
|
|
Taxes other than income taxes
|
—
|
|
321
|
|
104
|
|
—
|
|
425
|
|
|
|
Accretion on discounted liabilities
|
—
|
|
18
|
|
5
|
|
—
|
|
23
|
|
|
|
Interest and debt expense
|
402
|
|
146
|
|
250
|
|
(294
|
)
|
504
|
|
|
|
Foreign currency transaction gains
|
—
|
|
—
|
|
(31
|
)
|
—
|
|
(31
|
)
|
|
|
Total Costs and Expenses
|
409
|
|
86,039
|
|
37,902
|
|
(17,578
|
)
|
106,772
|
|
|
|
Income before income taxes
|
5,509
|
|
7,011
|
|
2,944
|
|
(8,019
|
)
|
7,445
|
|
|
|
Income tax expense (benefit)
|
(86
|
)
|
1,093
|
|
565
|
|
—
|
|
1,572
|
|
|
|
Net Income
|
5,595
|
|
5,918
|
|
2,379
|
|
(8,019
|
)
|
5,873
|
|
|
|
Less: net income attributable to noncontrolling interests
|
—
|
|
—
|
|
278
|
|
—
|
|
278
|
|
|
|
Net Income Attributable to Phillips 66
|
$
|
5,595
|
|
5,918
|
|
2,101
|
|
(8,019
|
)
|
5,595
|
|
|
|
|||||||||||
|
Comprehensive Income
|
$
|
5,520
|
|
5,843
|
|
2,291
|
|
(7,856
|
)
|
5,798
|
|
130
|
Millions of Dollars
|
|||||||||||
|
Year Ended December 31, 2017
|
|||||||||||
|
Statement of Income
|
Phillips 66
|
|
Phillips 66 Company
|
|
All Other Subsidiaries
|
|
Consolidating Adjustments
|
|
Total Consolidated
|
|
|
|
Revenues and Other Income
|
|||||||||||
|
Sales and other operating revenues
|
$
|
—
|
|
74,640
|
|
27,714
|
|
—
|
|
102,354
|
|
|
Equity in earnings of affiliates
|
5,336
|
|
3,256
|
|
559
|
|
(7,419
|
)
|
1,732
|
|
|
|
Net gain on dispositions
|
—
|
|
1
|
|
14
|
|
—
|
|
15
|
|
|
|
Other income
|
3
|
|
471
|
|
47
|
|
—
|
|
521
|
|
|
|
Intercompany revenues
|
—
|
|
1,610
|
|
13,457
|
|
(15,067
|
)
|
—
|
|
|
|
Total Revenues and Other Income
|
5,339
|
|
79,978
|
|
41,791
|
|
(22,486
|
)
|
104,622
|
|
|
|
Costs and Expenses
|
|||||||||||
|
Purchased crude oil and products
|
—
|
|
63,812
|
|
30,379
|
|
(14,782
|
)
|
79,409
|
|
|
|
Operating expenses
|
—
|
|
3,672
|
|
1,085
|
|
(58
|
)
|
4,699
|
|
|
|
Selling, general and administrative expenses
|
7
|
|
1,300
|
|
399
|
|
(11
|
)
|
1,695
|
|
|
|
Depreciation and amortization
|
—
|
|
892
|
|
426
|
|
—
|
|
1,318
|
|
|
|
Impairments
|
—
|
|
20
|
|
4
|
|
—
|
|
24
|
|
|
|
Taxes other than income taxes
|
—
|
|
5,784
|
|
7,678
|
|
—
|
|
13,462
|
|
|
|
Accretion on discounted liabilities
|
—
|
|
17
|
|
5
|
|
—
|
|
22
|
|
|
|
Interest and debt expense
|
348
|
|
70
|
|
236
|
|
(216
|
)
|
438
|
|
|
|
Total Costs and Expenses
|
355
|
|
75,567
|
|
40,212
|
|
(15,067
|
)
|
101,067
|
|
|
|
Income before income taxes
|
4,984
|
|
4,411
|
|
1,579
|
|
(7,419
|
)
|
3,555
|
|
|
|
Income tax benefit
|
(122
|
)
|
(925
|
)
|
(646
|
)
|
—
|
|
(1,693
|
)
|
|
|
Net Income
|
5,106
|
|
5,336
|
|
2,225
|
|
(7,419
|
)
|
5,248
|
|
|
|
Less: net income attributable to noncontrolling interests
|
—
|
|
—
|
|
142
|
|
—
|
|
142
|
|
|
|
Net Income Attributable to Phillips 66
|
$
|
5,106
|
|
5,336
|
|
2,083
|
|
(7,419
|
)
|
5,106
|
|
|
Comprehensive Income
|
$
|
5,484
|
|
5,714
|
|
2,498
|
|
(8,070
|
)
|
5,626
|
|
131
|
Millions of Dollars
|
|||||||||||
|
Year Ended December 31, 2016
|
|||||||||||
|
Statement of Income
|
Phillips 66
|
|
Phillips 66 Company
|
|
All Other Subsidiaries
|
|
Consolidating Adjustments
|
|
Total Consolidated
|
|
|
|
Revenues and Other Income
|
|||||||||||
|
Sales and other operating revenues
|
$
|
—
|
|
58,822
|
|
25,457
|
|
—
|
|
84,279
|
|
|
Equity in earnings of affiliates
|
1,797
|
|
1,839
|
|
296
|
|
(2,518
|
)
|
1,414
|
|
|
|
Net gain (loss) on dispositions
|
—
|
|
(9
|
)
|
19
|
|
—
|
|
10
|
|
|
|
Other income
|
—
|
|
42
|
|
32
|
|
—
|
|
74
|
|
|
|
Intercompany revenues
|
—
|
|
864
|
|
9,160
|
|
(10,024
|
)
|
—
|
|
|
|
Total Revenues and Other Income
|
1,797
|
|
61,558
|
|
34,964
|
|
(12,542
|
)
|
85,777
|
|
|
|
Costs and Expenses
|
|||||||||||
|
Purchased crude oil and products
|
—
|
|
48,171
|
|
24,102
|
|
(9,805
|
)
|
62,468
|
|
|
|
Operating expenses
|
—
|
|
3,465
|
|
846
|
|
(36
|
)
|
4,275
|
|
|
|
Selling, general and administrative expenses
|
6
|
|
1,236
|
|
406
|
|
(10
|
)
|
1,638
|
|
|
|
Depreciation and amortization
|
—
|
|
821
|
|
347
|
|
—
|
|
1,168
|
|
|
|
Impairments
|
—
|
|
1
|
|
4
|
|
—
|
|
5
|
|
|
|
Taxes other than income taxes
|
—
|
|
5,477
|
|
8,211
|
|
—
|
|
13,688
|
|
|
|
Accretion on discounted liabilities
|
—
|
|
16
|
|
5
|
|
—
|
|
21
|
|
|
|
Interest and debt expense
|
366
|
|
21
|
|
124
|
|
(173
|
)
|
338
|
|
|
|
Foreign currency transaction gains
|
—
|
|
—
|
|
(15
|
)
|
—
|
|
(15
|
)
|
|
|
Total Costs and Expenses
|
372
|
|
59,208
|
|
34,030
|
|
(10,024
|
)
|
83,586
|
|
|
|
Income before income taxes
|
1,425
|
|
2,350
|
|
934
|
|
(2,518
|
)
|
2,191
|
|
|
|
Income tax expense (benefit)
|
(130
|
)
|
553
|
|
124
|
|
—
|
|
547
|
|
|
|
Net Income
|
1,555
|
|
1,797
|
|
810
|
|
(2,518
|
)
|
1,644
|
|
|
|
Less: net income attributable to noncontrolling interests
|
—
|
|
—
|
|
89
|
|
—
|
|
89
|
|
|
|
Net Income Attributable to Phillips 66
|
$
|
1,555
|
|
1,797
|
|
721
|
|
(2,518
|
)
|
1,555
|
|
|
Comprehensive Income
|
$
|
1,213
|
|
1,455
|
|
451
|
|
(1,817
|
)
|
1,302
|
|
132
|
Millions of Dollars
|
|||||||||||
|
Year Ended December 31, 2018
|
|||||||||||
|
Balance Sheet
|
Phillips 66
|
|
Phillips 66 Company
|
|
All Other Subsidiaries
|
|
Consolidating Adjustments
|
|
Total Consolidated
|
|
|
|
Assets
|
|||||||||||
|
Cash and cash equivalents
|
$
|
—
|
|
1,648
|
|
1,371
|
|
—
|
|
3,019
|
|
|
Accounts and notes receivable
|
9
|
|
4,255
|
|
3,202
|
|
(1,293
|
)
|
6,173
|
|
|
|
Inventories
|
—
|
|
2,489
|
|
1,054
|
|
—
|
|
3,543
|
|
|
|
Prepaid expenses and other current assets
|
2
|
|
373
|
|
99
|
|
—
|
|
474
|
|
|
|
Total Current Assets
|
11
|
|
8,765
|
|
5,726
|
|
(1,293
|
)
|
13,209
|
|
|
|
Investments and long-term receivables
|
32,712
|
|
22,799
|
|
9,829
|
|
(50,919
|
)
|
14,421
|
|
|
|
Net properties, plants and equipment
|
—
|
|
13,218
|
|
8,800
|
|
—
|
|
22,018
|
|
|
|
Goodwill
|
—
|
|
2,853
|
|
417
|
|
—
|
|
3,270
|
|
|
|
Intangibles
|
—
|
|
726
|
|
143
|
|
—
|
|
869
|
|
|
|
Other assets
|
9
|
|
335
|
|
173
|
|
(2
|
)
|
515
|
|
|
|
Total Assets
|
$
|
32,732
|
|
48,696
|
|
25,088
|
|
(52,214
|
)
|
54,302
|
|
|
Liabilities and Equity
|
|||||||||||
|
Accounts payable
|
$
|
—
|
|
5,415
|
|
2,464
|
|
(1,293
|
)
|
6,586
|
|
|
Short-term debt
|
—
|
|
11
|
|
56
|
|
—
|
|
67
|
|
|
|
Accrued income and other taxes
|
—
|
|
458
|
|
658
|
|
—
|
|
1,116
|
|
|
|
Employee benefit obligations
|
—
|
|
663
|
|
61
|
|
—
|
|
724
|
|
|
|
Other accruals
|
66
|
|
227
|
|
149
|
|
—
|
|
442
|
|
|
|
Total Current Liabilities
|
66
|
|
6,774
|
|
3,388
|
|
(1,293
|
)
|
8,935
|
|
|
|
Long-term debt
|
7,928
|
|
54
|
|
3,111
|
|
—
|
|
11,093
|
|
|
|
Assets retirement obligations and accrued environmental costs
|
—
|
|
458
|
|
166
|
|
—
|
|
624
|
|
|
|
Deferred income taxes
|
1
|
|
3,541
|
|
1,735
|
|
(2
|
)
|
5,275
|
|
|
|
Employee benefit obligations
|
—
|
|
676
|
|
191
|
|
—
|
|
867
|
|
|
|
Other liabilities and deferred credits
|
55
|
|
4,611
|
|
4,287
|
|
(8,598
|
)
|
355
|
|
|
|
Total Liabilities
|
8,050
|
|
16,114
|
|
12,878
|
|
(9,893
|
)
|
27,149
|
|
|
|
Common stock
|
4,856
|
|
24,960
|
|
8,754
|
|
(33,714
|
)
|
4,856
|
|
|
|
Retained earnings
|
20,518
|
|
8,314
|
|
1,249
|
|
(9,592
|
)
|
20,489
|
|
|
|
Accumulated other comprehensive loss
|
(692
|
)
|
(692
|
)
|
(293
|
)
|
985
|
|
(692
|
)
|
|
|
Noncontrolling interests
|
—
|
|
—
|
|
2,500
|
|
—
|
|
2,500
|
|
|
|
Total Liabilities and Equity
|
$
|
32,732
|
|
48,696
|
|
25,088
|
|
(52,214
|
)
|
54,302
|
|
133
|
Millions of Dollars
|
|||||||||||
|
Year Ended December 31, 2017
|
|||||||||||
|
Balance Sheet
|
Phillips 66
|
|
Phillips 66 Company
|
|
All Other Subsidiaries
|
|
Consolidating Adjustments
|
|
Total Consolidated
|
|
|
|
Assets
|
|||||||||||
|
Cash and cash equivalents
|
$
|
—
|
|
1,411
|
|
1,708
|
|
—
|
|
3,119
|
|
|
Accounts and notes receivable
|
10
|
|
5,317
|
|
4,476
|
|
(2,297
|
)
|
7,506
|
|
|
|
Inventories
|
—
|
|
2,386
|
|
1,009
|
|
—
|
|
3,395
|
|
|
|
Prepaid expenses and other current assets
|
2
|
|
276
|
|
92
|
|
—
|
|
370
|
|
|
|
Total Current Assets
|
12
|
|
9,390
|
|
7,285
|
|
(2,297
|
)
|
14,390
|
|
|
|
Investments and long-term receivables
|
32,125
|
|
23,483
|
|
9,959
|
|
(51,626
|
)
|
13,941
|
|
|
|
Net properties, plants and equipment
|
—
|
|
13,117
|
|
8,343
|
|
—
|
|
21,460
|
|
|
|
Goodwill
|
—
|
|
2,853
|
|
417
|
|
—
|
|
3,270
|
|
|
|
Intangibles
|
—
|
|
722
|
|
154
|
|
—
|
|
876
|
|
|
|
Other assets
|
12
|
|
266
|
|
158
|
|
(2
|
)
|
434
|
|
|
|
Total Assets
|
$
|
32,149
|
|
49,831
|
|
26,316
|
|
(53,925
|
)
|
54,371
|
|
|
Liabilities and Equity
|
|||||||||||
|
Accounts payable
|
$
|
—
|
|
7,272
|
|
3,052
|
|
(2,297
|
)
|
8,027
|
|
|
Short-term debt
|
—
|
|
9
|
|
32
|
|
—
|
|
41
|
|
|
|
Accrued income and other taxes
|
—
|
|
451
|
|
551
|
|
—
|
|
1,002
|
|
|
|
Employee benefit obligations
|
—
|
|
513
|
|
69
|
|
—
|
|
582
|
|
|
|
Other accruals
|
55
|
|
298
|
|
102
|
|
—
|
|
455
|
|
|
|
Total Current Liabilities
|
55
|
|
8,543
|
|
3,806
|
|
(2,297
|
)
|
10,107
|
|
|
|
Long-term debt
|
6,972
|
|
50
|
|
3,047
|
|
—
|
|
10,069
|
|
|
|
Assets retirement obligations and accrued environmental costs
|
—
|
|
467
|
|
174
|
|
—
|
|
641
|
|
|
|
Deferred income taxes
|
—
|
|
3,349
|
|
1,661
|
|
(2
|
)
|
5,008
|
|
|
|
Employee benefit obligations
|
—
|
|
639
|
|
245
|
|
—
|
|
884
|
|
|
|
Other liabilities and deferred credits
|
8
|
|
4,700
|
|
3,814
|
|
(8,288
|
)
|
234
|
|
|
|
Total Liabilities
|
7,035
|
|
17,748
|
|
12,747
|
|
(10,587
|
)
|
26,943
|
|
|
|
Common stock
|
9,396
|
|
24,952
|
|
10,125
|
|
(35,077
|
)
|
9,396
|
|
|
|
Retained earnings
|
16,335
|
|
7,748
|
|
1,306
|
|
(9,083
|
)
|
16,306
|
|
|
|
Accumulated other comprehensive loss
|
(617
|
)
|
(617
|
)
|
(205
|
)
|
822
|
|
(617
|
)
|
|
|
Noncontrolling interests
|
—
|
|
—
|
|
2,343
|
|
—
|
|
2,343
|
|
|
|
Total Liabilities and Equity
|
$
|
32,149
|
|
49,831
|
|
26,316
|
|
(53,925
|
)
|
54,371
|
|
134
|
Millions of Dollars
|
|||||||||||
|
Year Ended December 31, 2018
|
|||||||||||
|
Statement of Cash Flows
|
Phillips 66
|
|
Phillips 66 Company
|
|
All Other Subsidiaries
|
|
Consolidating Adjustments
|
|
Total Consolidated
|
|
|
|
Cash Flows From Operating Activities
|
|||||||||||
|
Net Cash Provided by Operating Activities
|
$
|
2,955
|
|
6,962
|
|
2,642
|
|
(4,986
|
)
|
7,573
|
|
|
Cash Flows From Investing Activities
|
|||||||||||
|
Capital expenditures and investments
|
—
|
|
(998
|
)
|
(1,641
|
)
|
—
|
|
(2,639
|
)
|
|
|
Proceeds from asset dispositions*
|
—
|
|
462
|
|
50
|
|
(455
|
)
|
57
|
|
|
|
Intercompany lending activities
|
2,214
|
|
(3,031
|
)
|
817
|
|
—
|
|
—
|
|
|
|
Advances/loans—related parties
|
—
|
|
—
|
|
(1
|
)
|
—
|
|
(1
|
)
|
|
|
Other
|
—
|
|
27
|
|
85
|
|
—
|
|
112
|
|
|
|
Net Cash Provided by (Used in) Investing Activities
|
2,214
|
|
(3,540
|
)
|
(690
|
)
|
(455
|
)
|
(2,471
|
)
|
|
|
Cash Flows From Financing Activities
|
|||||||||||
|
Issuance of debt
|
1,509
|
|
—
|
|
675
|
|
—
|
|
2,184
|
|
|
|
Repayment of debt
|
(550
|
)
|
(11
|
)
|
(583
|
)
|
—
|
|
(1,144
|
)
|
|
|
Issuance of common stock
|
39
|
|
—
|
|
—
|
|
—
|
|
39
|
|
|
|
Repurchase of common stock
|
(4,645
|
)
|
—
|
|
—
|
|
—
|
|
(4,645
|
)
|
|
|
Dividends paid on common stock
|
(1,436
|
)
|
(3,174
|
)
|
(1,812
|
)
|
4,986
|
|
(1,436
|
)
|
|
|
Distributions to noncontrolling interests
|
—
|
|
—
|
|
(207
|
)
|
—
|
|
(207
|
)
|
|
|
Net proceeds from issuance of Phillips 66 Partners LP common units
|
—
|
|
—
|
|
128
|
|
—
|
|
128
|
|
|
|
Other
|
(86
|
)
|
—
|
|
(455
|
)
|
455
|
|
(86
|
)
|
|
|
Net Cash Used in Financing Activities
|
(5,169
|
)
|
(3,185
|
)
|
(2,254
|
)
|
5,441
|
|
(5,167
|
)
|
|
|
Effect of Exchange Rate Changes on Cash, Cash Equivalents and Restricted Cash
|
—
|
|
—
|
|
(35
|
)
|
—
|
|
(35
|
)
|
|
|
Net Change in Cash, Cash Equivalents and Restricted Cash
|
—
|
|
237
|
|
(337
|
)
|
—
|
|
(100
|
)
|
|
|
Cash, cash equivalents and restricted cash at beginning of period
|
—
|
|
1,411
|
|
1,708
|
|
—
|
|
3,119
|
|
|
|
Cash, Cash Equivalents and Restricted Cash at End of Period
|
$
|
—
|
|
1,648
|
|
1,371
|
|
—
|
|
3,019
|
|
|
* Includes return of investments in equity affiliates.
|
|||||||||||
135
|
Millions of Dollars
|
|||||||||||
|
Year Ended December 31, 2017
|
|||||||||||
|
Statement of Cash Flows
|
Phillips 66
|
|
Phillips 66 Company
|
|
All Other Subsidiaries
|
|
Consolidating Adjustments
|
|
Total Consolidated
|
|
|
|
Cash Flows From Operating Activities
|
|||||||||||
|
Net Cash Provided by Operating Activities
|
$
|
2,619
|
|
2,702
|
|
1,747
|
|
(3,420
|
)
|
3,648
|
|
|
Cash Flows From Investing Activities
|
|||||||||||
|
Capital expenditures and investments*
|
—
|
|
(1,133
|
)
|
(839
|
)
|
140
|
|
(1,832
|
)
|
|
|
Proceeds from asset dispositions**
|
—
|
|
265
|
|
84
|
|
(263
|
)
|
86
|
|
|
|
Intercompany lending activities
|
401
|
|
1,453
|
|
(1,854
|
)
|
—
|
|
—
|
|
|
|
Advances/loans—related parties
|
—
|
|
(10
|
)
|
—
|
|
—
|
|
(10
|
)
|
|
|
Collection of advances/loans—related parties
|
—
|
|
75
|
|
251
|
|
—
|
|
326
|
|
|
|
Restricted cash received from consolidation of business
|
—
|
|
—
|
|
318
|
|
—
|
|
318
|
|
|
|
Other
|
—
|
|
(26
|
)
|
(8
|
)
|
—
|
|
(34
|
)
|
|
|
Net Cash Provided by (Used in) Investing Activities
|
401
|
|
624
|
|
(2,048
|
)
|
(123
|
)
|
(1,146
|
)
|
|
|
Cash Flows From Financing Activities
|
|||||||||||
|
Issuance of debt
|
1,500
|
|
—
|
|
2,008
|
|
—
|
|
3,508
|
|
|
|
Repayment of debt
|
(1,500
|
)
|
(17
|
)
|
(2,161
|
)
|
—
|
|
(3,678
|
)
|
|
|
Issuance of common stock
|
35
|
|
—
|
|
—
|
|
—
|
|
35
|
|
|
|
Repurchase of common stock
|
(1,590
|
)
|
—
|
|
—
|
|
—
|
|
(1,590
|
)
|
|
|
Dividends paid on common stock
|
(1,395
|
)
|
(2,752
|
)
|
(668
|
)
|
3,420
|
|
(1,395
|
)
|
|
|
Distributions to noncontrolling interests
|
—
|
|
—
|
|
(120
|
)
|
—
|
|
(120
|
)
|
|
|
Net proceeds from issuance of Phillips 66 Partners LP common and preferred units
|
—
|
|
—
|
|
1,205
|
|
—
|
|
1,205
|
|
|
|
Other*
|
(70
|
)
|
—
|
|
(129
|
)
|
123
|
|
(76
|
)
|
|
|
Net Cash Provided by (Used in) Financing Activities
|
(3,020
|
)
|
(2,769
|
)
|
135
|
|
3,543
|
|
(2,111
|
)
|
|
|
Effect of Exchange Rate Changes on Cash, Cash Equivalents and Restricted Cash
|
—
|
|
—
|
|
17
|
|
—
|
|
17
|
|
|
|
Net Change in Cash, Cash Equivalents and Restricted Cash
|
—
|
|
557
|
|
(149
|
)
|
—
|
|
408
|
|
|
|
Cash, cash equivalents and restricted cash at beginning of period
|
—
|
|
854
|
|
1,857
|
|
—
|
|
2,711
|
|
|
|
Cash, Cash Equivalents and Restricted Cash at End of Period
|
$
|
—
|
|
1,411
|
|
1,708
|
|
—
|
|
3,119
|
|
|
* Includes intercompany capital contributions.
|
|||||||||||
|
** Includes return of investments in equity affiliates.
|
|||||||||||
136
|
Millions of Dollars
|
|||||||||||
|
Year Ended December 31, 2016
|
|||||||||||
|
Statement of Cash Flows
|
Phillips 66
|
|
Phillips 66 Company
|
|
All Other Subsidiaries
|
|
Consolidating Adjustments
|
|
Total Consolidated
|
|
|
|
Cash Flows From Operating Activities
|
|||||||||||
|
Net Cash Provided by Operating Activities
|
$
|
3,491
|
|
2,307
|
|
1,552
|
|
(4,387
|
)
|
2,963
|
|
|
Cash Flows From Investing Activities
|
|||||||||||
|
Capital expenditures and investments*
|
—
|
|
(1,425
|
)
|
(1,457
|
)
|
38
|
|
(2,844
|
)
|
|
|
Proceeds from asset dispositions**
|
—
|
|
1,007
|
|
156
|
|
(1,007
|
)
|
156
|
|
|
|
Intercompany lending activities
|
(1,139
|
)
|
2,046
|
|
(907
|
)
|
—
|
|
—
|
|
|
|
Advances/loans—related parties
|
—
|
|
(75
|
)
|
(357
|
)
|
—
|
|
(432
|
)
|
|
|
Collection of advances/loans—related parties
|
—
|
|
—
|
|
108
|
|
—
|
|
108
|
|
|
|
Other
|
—
|
|
18
|
|
(164
|
)
|
—
|
|
(146
|
)
|
|
|
Net Cash Provided by (Used in) Investing Activities
|
(1,139
|
)
|
1,571
|
|
(2,621
|
)
|
(969
|
)
|
(3,158
|
)
|
|
|
Cash Flows From Financing Activities
|
|||||||||||
|
Issuance of debt
|
—
|
|
—
|
|
2,090
|
|
—
|
|
2,090
|
|
|
|
Repayment of debt
|
—
|
|
(26
|
)
|
(807
|
)
|
—
|
|
(833
|
)
|
|
|
Issuance of common stock
|
34
|
|
—
|
|
—
|
|
—
|
|
34
|
|
|
|
Repurchase of common stock
|
(1,042
|
)
|
—
|
|
—
|
|
—
|
|
(1,042
|
)
|
|
|
Dividends paid on common stock
|
(1,282
|
)
|
(3,604
|
)
|
(783
|
)
|
4,387
|
|
(1,282
|
)
|
|
|
Distributions to noncontrolling interests
|
—
|
|
—
|
|
(75
|
)
|
—
|
|
(75
|
)
|
|
|
Net proceeds from issuance of Phillips 66 Partners LP common units
|
—
|
|
—
|
|
972
|
|
—
|
|
972
|
|
|
|
Other*
|
(62
|
)
|
31
|
|
(980
|
)
|
969
|
|
(42
|
)
|
|
|
Net Cash Provided by (Used in) Financing Activities
|
(2,352
|
)
|
(3,599
|
)
|
417
|
|
5,356
|
|
(178
|
)
|
|
|
Effect of Exchange Rate Changes on Cash, Cash Equivalents and Restricted Cash
|
—
|
|
—
|
|
10
|
|
—
|
|
10
|
|
|
|
Net Change in Cash, Cash Equivalents and Restricted Cash
|
—
|
|
279
|
|
(642
|
)
|
—
|
|
(363
|
)
|
|
|
Cash, cash equivalents and restricted cash at beginning of period
|
—
|
|
575
|
|
2,499
|
|
—
|
|
3,074
|
|
|
|
Cash, Cash Equivalents and Restricted Cash at End of Period
|
$
|
—
|
|
854
|
|
1,857
|
|
—
|
|
2,711
|
|
|
* Includes intercompany capital contributions.
|
|||||||||||
|
** Includes return of investments in equity affiliates.
|
|||||||||||
137
|
Selected Quarterly Financial Data
(Unaudited)
|
||||
|
Millions of Dollars
|
Per Share of Common Stock
|
|||||||||||||
|
Sales and Other Operating Revenues*
|
|
Income Before Income Taxes
|
|
Net Income
|
|
Net Income Attributable to Phillips 66
|
|
Net Income Attributable to Phillips 66
|
||||||
|
Basic
|
|
Diluted
|
|
|||||||||||
|
2018
|
||||||||||||||
|
First
|
$
|
23,595
|
|
717
|
|
585
|
|
524
|
|
1.07
|
|
1.07
|
|
|
|
Second
|
28,980
|
|
1,835
|
|
1,404
|
|
1,339
|
|
2.86
|
|
2.84
|
|
||
|
Third
|
29,788
|
|
1,975
|
|
1,568
|
|
1,492
|
|
3.20
|
|
3.18
|
|
||
|
Fourth
|
29,098
|
|
2,918
|
|
2,316
|
|
2,240
|
|
4.85
|
|
4.82
|
|
||
|
2017
|
||||||||||||||
|
First
|
$
|
22,894
|
|
797
|
|
563
|
|
535
|
|
1.02
|
|
1.02
|
|
|
|
Second
|
24,087
|
|
848
|
|
581
|
|
550
|
|
1.06
|
|
1.06
|
|
||
|
Third
|
25,627
|
|
1,256
|
|
849
|
|
823
|
|
1.60
|
|
1.60
|
|
||
|
Fourth**
|
29,746
|
|
654
|
|
3,255
|
|
3,198
|
|
6.29
|
|
6.25
|
|
||
* 2017 amounts include excise taxes on sales of refined petroleum products.
** Includes a
$2,721 million
provisional income tax benefit from the enactment of the U.S. Tax Cuts and Jobs Act in December 2017.
138
Item 9. CHANGES IN AND DISAGREEMENTS WITH ACCOUNTANTS ON ACCOUNTING AND FINANCIAL DISCLOSURE
None.
Item 9A. CONTROLS AND PROCEDURES
We maintain disclosure controls and procedures designed to ensure that information required to be disclosed in reports we file or submit under the Securities Exchange Act of 1934, as amended (the Act), is recorded, processed, summarized and reported within the time periods specified in SEC rules and forms, and that such information is accumulated and communicated to management, including our principal executive and principal financial officers, as appropriate, to allow timely decisions regarding required disclosure. As of
December 31, 2018
, with the participation of management, our Chairman and Chief Executive Officer and our Executive Vice President, Finance and Chief Financial Officer carried out an evaluation, pursuant to Rule 13a-15(b) of the Act, of the effectiveness of our disclosure controls and procedures (as defined in Rule 13a-15(e) of the Act). Based upon that evaluation, our Chairman and Chief Executive Officer and our Executive Vice President, Finance and Chief Financial Officer concluded that our disclosure controls and procedures were operating effectively as of
December 31, 2018
.
There have been no changes in our internal control over financial reporting, as defined in Rule 13a-15(f) of the Act, in the quarterly period ended
December 31, 2018
, that have materially affected, or are reasonably likely to materially affect, our internal control over financial reporting.
Management’s Annual Report on Internal Control Over Financial Reporting
This report is included in Item 8 and is incorporated herein by reference.
Report of Independent Registered Public Accounting Firm on Internal Control Over Financial Reporting
This report is included in Item 8 and is incorporated herein by reference.
Item 9B. OTHER INFORMATION
None.
139
PART III
Item 10. DIRECTORS, EXECUTIVE OFFICERS AND CORPORATE GOVERNANCE
Information regarding our executive officers appears in Part I of this report.
The remaining information required by Item 10 of Part III is incorporated herein by reference from our Proxy Statement for the Annual Meeting of Stockholders to be held on
May 8, 2019
, which will be filed within 120 days after
December 31, 2018
(
2019
Definitive Proxy Statement).*
Item 11. EXECUTIVE COMPENSATION
The information required by Item 11 of Part III is incorporated herein by reference from our
2019
Definitive Proxy Statement.*
Item 12. SECURITY OWNERSHIP OF CERTAIN BENEFICIAL OWNERS AND MANAGEMENT AND RELATED STOCKHOLDER MATTERS
The information required by Item 12 of Part III is incorporated herein by reference from our
2019
Definitive Proxy Statement.*
Item 13. CERTAIN RELATIONSHIPS AND RELATED TRANSACTIONS, AND DIRECTOR INDEPENDENCE
The information required by Item 13 of Part III is incorporated herein by reference from our
2019
Definitive Proxy Statement.*
Item 14. PRINCIPAL ACCOUNTING FEES AND SERVICES
The information required by Item 14 of Part III is incorporated herein by reference from our
2019
Definitive Proxy Statement.*
_________________________
* Except for information or data specifically incorporated herein by reference under Items 10 through 14, other information and data appearing in our
2019
Definitive Proxy Statement are not deemed to be a part of this Annual Report on Form 10-K or deemed to be filed with the Commission as a part of this report.
140
PART IV
Item 15. EXHIBITS, FINANCIAL STATEMENT SCHEDULES
|
(a)
|
1.
|
Financial Statements and Supplementary Data
The financial statements and supplementary information listed in the Index to Financial Statements, which appears on page 71, are filed as part of this Annual Report on Form 10-K.
|
|
2.
|
Financial Statement Schedules
All financial statement schedules are omitted because they are not required, not significant, not applicable, or the information is shown in the financial statements or notes thereto.
|
|
|
3.
|
Exhibits
The exhibits listed in the Index to Exhibits, which appears on pages 142 to 145, are filed as part of this Annual Report on Form 10-K.
|
|
Item 16. FORM 10-K SUMMARY
None.
141
PHILLIPS 66
INDEX TO EXHIBITS
|
|
|
Incorporated by Reference
|
|||||
|
Exhibit
Number
|
Exhibit Description
|
Form
|
Exhibit
Number
|
|
Filing
Date
|
SEC
File No.
|
|
|
8-K
|
2.1
|
|
05/01/2012
|
001-35349
|
|||
|
8-K
|
3.1
|
|
05/01/2012
|
001-35349
|
|||
|
8-K
|
3.1
|
|
02/09/2017
|
001-35349
|
|||
|
10
|
4.3
|
|
04/05/2012
|
001-35349
|
|||
|
As permitted by Item 601(b)(4)(iii)(A) of Regulation S-K, the company has not filed with this Annual Report on Form 10-K certain instruments defining the rights of holders of long-term debt of the company and its subsidiaries because the total amount of securities authorized thereunder does not exceed 10 percent of the total assets of the company and its subsidiaries on a consolidated basis. The company agrees to furnish a copy of such agreements to the Commission upon request.
|
|||||||
|
10
|
4.1
|
|
03/01/2012
|
001-35349
|
|||
|
10-Q
|
10.1
|
|
05/01/2014
|
001-35349
|
|||
|
10-K
|
10.3
|
|
02/20/2015
|
001-35349
|
|||
|
10-K
|
10.4
|
|
02/17/2017
|
001-35349
|
|||
|
10-Q
|
10.14
|
|
08/03/2012
|
001-35349
|
|||
|
10-K
|
10.6
|
|
02/23/2018
|
001-35349
|
|||
|
10-Q
|
10.1
|
|
07/27/2018
|
001-35349
|
|||
142
|
|
|
Incorporated by Reference
|
|||||
|
Exhibit
Number |
Exhibit Description
|
Form
|
Exhibit
Number |
|
Filing
Date |
SEC
File No. |
|
|
10
|
10.12
|
|
03/01/2012
|
001-35349
|
|||
|
10
|
10.13
|
|
03/01/2012
|
001-35349
|
|||
|
10
|
10.14
|
|
03/01/2012
|
001-35349
|
|||
|
10
|
10.15
|
|
03/01/2012
|
001-35349
|
|||
|
10
|
10.16
|
|
03/01/2012
|
001-35349
|
|||
|
10-Q
|
10.1
|
|
10/30/2014
|
001-35349
|
|||
|
8-K
|
10.1
|
|
05/01/2012
|
001-35349
|
|||
|
8-K
|
10.2
|
|
05/01/2012
|
001-35349
|
|||
|
8-K
|
10.3
|
|
05/01/2012
|
001-35349
|
|||
|
8-K
|
10.4
|
|
05/01/2012
|
001-35349
|
|||
|
10-Q
|
10.1
|
|
05/02/2013
|
001-35349
|
|||
|
8-K
|
10.5
|
|
05/01/2012
|
001-35349
|
|||
143
|
|
|
Incorporated by Reference
|
|||||
|
Exhibit
Number |
Exhibit Description
|
Form
|
Exhibit
Number |
|
Filing
Date |
SEC
File No. |
|
|
DEF14A
|
App. A
|
|
03/27/2013
|
001-35349
|
|||
|
10-Q
|
10.15
|
|
08/03/2012
|
001-35349
|
|||
|
10-K
|
10.18
|
|
02/22/2013
|
001-35349
|
|||
|
10-Q
|
10.1
|
|
07/29/2016
|
001-35349
|
|||
|
10-Q
|
10.17
|
|
08/03/2012
|
001-35349
|
|||
|
10-Q
|
10.18
|
|
08/03/2012
|
001-35349
|
|||
|
10-Q
|
10.19
|
|
08/03/2012
|
001-35349
|
|||
|
10-K
|
10.24
|
|
02/22/2013
|
001-35349
|
|||
|
10-Q
|
10.20
|
|
08/03/2012
|
001-35349
|
|||
|
10-K
|
10.26
|
|
02/22/2013
|
001-35349
|
|||
|
10-K
|
10.27
|
|
02/22/2013
|
001-35349
|
|||
|
8-K
|
10.1
|
|
11/08/2013
|
001-35349
|
|||
|
10-Q
|
10.23
|
|
08/03/2012
|
001-35349
|
|||
|
10.33
*
|
|||||||
|
10.34
*
|
|||||||
|
10.35
*
|
|||||||
|
8-K
|
10.1
|
|
02/14/2018
|
001-35349
|
|||
|
21
*
|
|||||||
|
23.1
*
|
|||||||
|
31.1
*
|
|||||||
144
|
|
|
Incorporated by Reference
|
|||||
|
Exhibit
Number |
Exhibit Description
|
Form
|
Exhibit
Number |
|
Filing
Date |
SEC
File No. |
|
|
31.2
*
|
|||||||
|
32
*
|
|||||||
|
101.INS*
|
XBRL Instance Document.
|
||||||
|
101.SCH*
|
XBRL Schema Document.
|
||||||
|
101.CAL*
|
XBRL Calculation Linkbase Document.
|
||||||
|
101.LAB*
|
XBRL Labels Linkbase Document.
|
||||||
|
101.PRE*
|
XBRL Presentation Linkbase Document.
|
||||||
|
101.DEF*
|
XBRL Definition Linkbase Document.
|
||||||
* Filed herewith.
** Management contracts and compensatory plans or arrangements.
145
SIGNATURES
Pursuant to the requirements of Section 13 or 15(d) of the Securities Exchange Act of 1934, the registrant has duly caused this report to be signed on its behalf by the undersigned, thereunto duly authorized.
|
PHILLIPS 66
|
||
|
Date:
|
February 22, 2019
|
/s/ Greg C. Garland
|
|
Greg C. Garland
Chairman of the Board of Directors
and Chief Executive Officer
|
||
Pursuant to the requirements of the Securities Exchange Act of 1934, this report has been signed below, as of
February 22, 2019
, by the following persons on behalf of the registrant, and in the capacities indicated.
|
Signature
|
Title
|
|
|
/s/ Greg C. Garland
|
Chairman of the Board of Directors
|
|
|
Greg C. Garland
|
and Chief Executive Officer
|
|
|
(Principal executive officer)
|
||
|
/s/ Kevin J. Mitchell
|
Executive Vice President, Finance
|
|
|
Kevin J. Mitchell
|
and Chief Financial Officer
|
|
|
(Principal financial officer)
|
||
|
/s/ Chukwuemeka A. Oyolu
|
Vice President and Controller
|
|
|
Chukwuemeka A. Oyolu
|
(Principal accounting officer)
|
|
146
|
/s/ Gary K. Adams
|
Director
|
|
|
Gary K. Adams
|
||
|
/s/ J. Brian Ferguson
|
Director
|
|
|
J. Brian Ferguson
|
||
|
/s/ John E. Lowe
|
Director
|
|
|
John E. Lowe
|
||
|
/s/ Harold W. McGraw III
|
Director
|
|
|
Harold W. McGraw III
|
||
|
/s/ Denise L. Ramos
|
Director
|
|
|
Denise L. Ramos
|
||
|
/s/ Glenn F. Tilton
|
Director
|
|
|
Glenn F. Tilton
|
||
|
/s/ Victoria J. Tschinkel
|
Director
|
|
|
Victoria J. Tschinkel
|
||
|
/s/ Marna C. Whittington
|
Director
|
|
|
Marna C. Whittington
|
||
147
TABLE OF CONTENTS
Part IItem 1A. Risk FactorsItem 1B. Unresolved Staff CommentsItem 3. Legal ProceedingsItem 4. Mine Safety DisclosuresPart IIItem 5. Market For Registrant S Common Equity, Related Stockholder Matters and Issuer Purchases Of Equity SecuritiesItem 6. Selected Financial DataItem 7. Management S Discussion and Analysis Of Financial Condition and Results Of OperationsNote 1 Summary Of Significant Accounting PoliciesNote 2 Changes in Accounting PrinciplesNote 5 Business CombinationsNote 21 Income TaxesNote 27 Phillips 66 Partners LpNote 17 EquityNote 13 GuaranteesNote 12 DebtItem 7A. Quantitative and Qualitative Disclosures About Market RiskNote 15 Derivatives and Financial InstrumentsItem 8. Financial Statements and Supplementary DataNote 7 Investments, Loans and Long-term ReceivablesNote 3 Sales and Other Operating RevenuesNote 4 InventoriesNote 6 Assets Held For Sale Or SoldNote 8 Properties, Plants and EquipmentNote 9 Goodwill and IntangiblesNote 10 Asset Retirement Obligations and Accrued Environmental CostsNote 11 Earnings Per ShareNote 14 Contingencies and CommitmentsNote 16 Fair Value MeasurementsNote 18 LeasesNote 19 Pension and Postretirement PlansNote 20 Share-based Compensation PlansNote 22 Accumulated Other Comprehensive LossNote 23 Cash Flow InformationNote 24 Other Financial InformationNote 25 Related Party TransactionsNote 26 Segment Disclosures and Related InformationNote 28 New Accounting StandardsNote 29 Condensed Consolidating Financial InformationItem 9. Changes in and Disagreements with Accountants on Accounting and Financial DisclosureItem 9A. Controls and ProceduresItem 9B. Other InformationPart IIIItem 10. Directors, Executive Officers and Corporate GovernanceItem 11. Executive CompensationItem 12. Security Ownership Of Certain Beneficial Owners and Management and Related Stockholder MattersItem 13. Certain Relationships and Related Transactions, and Director IndependenceItem 14. Principal Accounting Fees and ServicesPart IVItem 15. Exhibits, Financial Statement SchedulesItem 16. Form 10-k Summary