PALATIN TECHNOLOGIES INC
10-Ks and 10-Qs
|
|
|
|
|
|
|
|
|
|
|
|
|
|
|
|
|
|
|
|
|
|
|
|
|
|
|
|
|
|
|
|
|
|
|
|
|
|
|
|
|
|
|
|
|
|
|
|
|
|
|
|
|
|
|
|
|
|
|
|
|
|
|
|
|
UNITED STATES
SECURITIES AND EXCHANGE COMMISSION
Washington, D.C. 20549
FORM 10 - K
☑
ANNUAL
REPORT PURSUANT TO SECTION 13 OR 15(d) OF THE SECURITIES EXCHANGE
ACT OF 1934
For the
fiscal year ended June 30, 2018
or
☐
TRANSITION
REPORT PURSUANT TO SECTION 13 OR 15(d) OF THE SECURITIES EXCHANGE
ACT OF 1934
For the
transition period from ___________ to __________
Commission
file number: 001-15543

PALATIN TECHNOLOGIES, INC.
(Exact
name of registrant as specified in its charter)
|
Delaware
|
|
95-4078884
|
|
(State
or other jurisdiction of
incorporation
or organization)
|
|
(I.R.S.
Employer Identification No.)
|
|
|
|
|
|
4B Cedar Brook Drive
Cranbury, New Jersey
|
|
08512
|
|
(Address
of principal executive offices)
|
|
(Zip
Code)
|
(609) 495-2200
(Registrant’s
telephone number, including area code)
Securities
registered pursuant to Section 12(b) of the Act:
|
Title of Each Class
|
|
Name of Each Exchange
on Which Registered
|
|
Common
Stock, par value $.01 per share
|
|
NYSE
American
|
Securities
registered pursuant to Section 12(g) of the Act: None
Indicate
by check mark if the registrant is a well-known seasoned issuer, as
defined in Rule 405 of the Securities Act. Yes ☐ No
☑
Indicate
by check mark if the registrant is not required to file reports
pursuant to Section 13 or Section 15(d) of the Act. Yes ☐ No
☑
Indicate
by check mark whether the registrant (1) has filed all reports
required to be filed by Section 13 or 15(d) of the Securities
Exchange Act of 1934 during the preceding 12 months (or for such
shorter period that the registrant was required to file such
reports), and (2) has been subject to such filing requirements for
the past 90 days.
Yes
☑ No ☐
Indicate
by check mark whether the registrant has submitted electronically
and posted on its corporate Web site, if any, every Interactive
Data File required to be submitted and posted pursuant to Rule 405
of Regulation S-T during the preceding 12 months (or for such
shorter period that the registrant was required to submit and post
such files).
Yes ☑ No ☐
Indicate
by check mark if disclosure of delinquent filers pursuant to Item
405 of Regulation S-K is not contained herein, and will not be
contained, to the best of the registrant’s knowledge, in
definitive proxy or information statements incorporated by
reference in Part III of this Form 10-K or any amendment to this
Form 10-K. ☐
Indicate
by check mark whether the registrant is a large accelerated filer,
an accelerated filer, a non-accelerated filer, a smaller reporting
company, or an emerging growth company. See the definitions of
“large accelerated filer,” “accelerated
filer,” “smaller reporting company,” and
“emerging growth company” in Rule 12b-2 of the Exchange
Act. (Check one):
|
Large accelerated filer
|
☐
|
Accelerated filer
|
☑
|
|
Non-accelerated
filer
|
☐
(Do not check if a smaller reporting
company)
|
Smaller reporting company
|
☑
|
|
|
|
Emerging
growth company
|
☐
|
If an
emerging growth company, indicate by check mark if the registrant
has elected not to use the extended transition period for complying
with any new or revised financial accounting standards provided
pursuant to Section 13(a) of the Exchange Act.
☐
Indicate
by check mark whether the registrant is a shell company (as defined
in Rule 12b-2 of the Exchange Act). Yes ☐ No
☑
State
the aggregate market value of the voting and non-voting common
equity held by non-affiliates, computed by reference to the price
at which the common equity was last sold, or the average bid and
asked price of such common equity, as of the last business day of
the registrant’s most recently completed second fiscal
quarter (December 31, 2017): $166,295,449.
Indicate
the number of shares outstanding of each of the registrant’s
classes of common stock, as of the latest practicable date
(September 11, 2018): 202,048,804.
PALATIN TECHNOLOGIES, INC
.
Table of Contents
|
|
Page
|
|
|
PART
I
|
||
|
Item
1.
|
Business
|
1
|
|
Item
1A.
|
Risk
Factors
|
17
|
|
Item
1B.
|
Unresolved Staff
Comments
|
38
|
|
Item
2.
|
Properties
|
38
|
|
Item
3.
|
Legal
Proceedings
|
38
|
|
Item
4.
|
Mine
Safety Disclosures
|
38
|
|
PART
II
|
||
|
Item
5.
|
Market
for Registrant’s Common Equity, Related Stockholder Matters
and Issuer Purchases of Equity Securities
|
39
|
|
Item
6.
|
Selected Financial
Data
|
39
|
|
Item
7.
|
Management’s
Discussion and Analysis of Financial Condition and Results of
Operations
|
40
|
|
Item
7A.
|
Quantitative and
Qualitative Disclosures About Market Risk
|
44
|
|
Item
8.
|
Financial
Statements and Supplementary Data
|
45
|
|
Item
9.
|
Changes
in and Disagreements with Accountants on Accounting and Financial
Disclosure
|
73
|
|
Item
9A.
|
Controls and
Procedures
|
73
|
|
Item
9B.
|
Other
Information
|
74
|
|
PART
III
|
||
|
Item
10.
|
Directors,
Executive Officers and Corporate Governance
|
75
|
|
Item
11.
|
Executive
Compensation
|
80
|
|
Item
12.
|
Security Ownership
of Certain Beneficial Owners and Management and Related Stockholder
Matters
|
86
|
|
Item
13.
|
Certain
Relationships and Related Transactions, and Director
Independence
|
90
|
|
Item
14.
|
Principal
Accountant Fees and Services
|
90
|
|
PART
IV
|
||
|
Item
15.
|
Exhibits, Financial
Statement Schedules
|
91
|
|
Item
16.
|
Form
10-K Summary
|
94
|
Special Note Regarding Forward-Looking Statements
In this
Annual Report on Form 10-K (this “Annual Report”)
references to “we,” “our,”
“us,” the “Company” or
“Palatin” means Palatin Technologies, Inc. and its
subsidiary.
Statements
in this Annual Report, as well as oral statements that may be made
by us or by our officers, directors, or employees acting on our
behalf, that are not historical facts constitute
“forward-looking statements,” which are made pursuant
to the safe harbor provisions of Section 21E of the Securities
Exchange Act of 1934 (the “Exchange Act”). The
forward-looking statements in this Annual Report do not constitute
guarantees of future performance. Investors are cautioned that
statements that are not strictly historical facts contained in this
Annual Report, including, without limitation, the following are
forward looking statements:
●
estimates of our
expenses, future revenue and capital requirements;
●
our ability to
achieve and maintain profitability;
●
our ability to
obtain additional financing on terms acceptable to us, or at
all;
●
our ability to
advance product candidates into, and successfully complete,
clinical trials;
●
the initiation,
timing, progress and results of future preclinical studies and
clinical trials, and our research and development
programs;
●
the timing or
likelihood of regulatory filings and approvals;
●
our expectations
regarding completion of required clinical trials and studies and
validation of methods and controls used to manufacture
Vyleesi™ (the trade name for bremelanotide) for the treatment
of premenopausal women with hypoactive sexual desire disorder
(“HSDD”), which is a type of female sexual dysfunction
(“FSD”);
●
our expectation
regarding the timing of our regulatory submissions for approval of
Vyleesi for HSDD in the United States and in certain other
jurisdictions outside the United States;
●
our expectation
regarding performance of our exclusive licensees of Vyleesi,
including;
o
AMAG
Pharmaceuticals, Inc. (“AMAG”) for North
America,
o
Shanghai Fosun
Pharmaceutical Industrial Development Co. Ltd.
(“Fosun”), a subsidiary of Shanghai Fosun
Pharmaceutical (Group) Co., Ltd., for the territories of the
People’s Republic of China, Taiwan, Hong Kong S.A.R. and
Macau S.A.R. (collectively, “China”), and
o
Kwangdong
Pharmaceutical Co., Ltd. (“Kwangdong”) for the Republic
of Korea (“Korea”);
●
the potential for
commercialization of Vyleesi for HSDD in North America by AMAG and
other product candidates, if approved, by us;
●
our expectations
regarding the potential market size and market acceptance for
Vyleesi for HSDD and our other product candidates, if approved for
commercial use;
●
our ability to
compete with other products and technologies similar to our product
candidates;
●
the ability of our
third-party collaborators to timely carry out their duties under
their agreements with us;
●
the ability of our
contract manufacturers to perform their manufacturing activities
for us in compliance with applicable regulations;
●
our ability to
recognize the potential value of our licensing arrangements with
third parties;
●
the potential to
achieve revenues from the sale of our product
candidates;
●
our ability to
obtain adequate reimbursement from Medicare, Medicaid, private
insurers and other healthcare payers;
●
our ability to
maintain product liability insurance at a reasonable cost or in
sufficient amounts, if at all;
●
the performance of
our management team, senior staff professionals, and third-party
contractors and consultants;
●
the retention of
key management, employees and third-party contractors;
●
the scope of
protection we are able to establish and maintain for intellectual
property rights covering our product candidates and technology in
the United States and throughout the world;
●
our compliance with
federal and state laws and regulations;
●
the timing and
costs associated with obtaining regulatory approval for our product
candidates;
●
the impact of
fluctuations in foreign exchange rates;
●
the impact of
legislative or regulatory healthcare reforms in the United
States;
●
our ability to
adapt to changes in global economic conditions as well as competing
products and technologies; and
●
our ability to
remain listed on the NYSE American stock exchange.
Such
forward-looking statements involve risks, uncertainties and other
factors that could cause our actual results to be materially
different from historical results or from any results expressed or
implied by such forward-looking statements. Our future operating
results are subject to risks and uncertainties and are dependent
upon many factors, including, without limitation, the risks
identified under the caption “Risk Factors” and
elsewhere in this Annual Report, and any of those made in our other
reports filed with the U.S. Securities and Exchange Commission (the
“SEC”). Except as required by law, we do not intend,
and undertake no obligation, to publicly update forward-looking
statements to reflect events or circumstances after the date of
this document or to reflect the occurrence of unanticipated
events.
Palatin
Technologies® is a registered trademark of Palatin
Technologies, Inc. Vyleesi™ is a trademark of AMAG
Pharmaceuticals, Inc. in North America and of Palatin Technologies,
Inc. elsewhere in the world.
Overview
We are
a specialized biopharmaceutical company developing first-in-class
medicines based on molecules that modulate the activity of the
melanocortin and natriuretic peptide receptor systems. Our product
candidates are targeted, receptor-specific therapeutics for the
treatment of diseases with significant unmet medical need and
commercial potential. Our most advanced product candidate is
Vyleesi™, the trade name for bremelanotide, a peptide
melanocortin receptor 4 (MC4r) agonist, for the treatment of
premenopausal women with acquired, generalized hypoactive sexual
desire disorder (“HSDD”), which is a type of female
sexual dysfunction (“FSD”), defined as low desire with
associated distress or interpersonal difficulty. A New Drug
Application (“NDA”) has been submitted to the U.S. Food
and Drug Administration (“FDA”) by our exclusive North
American licensee, AMAG Pharmaceuticals, Inc. (“AMAG”)
and accepted for filing by the FDA, with an FDA decision on
approval expected in the first quarter of calendar
2019.
Vyleesi.
Vyleesi is an on demand subcutaneous injectable
product for the treatment of HSDD in premenopausal women. Vyleesi
is a synthetic peptide analog of the naturally occurring hormone
alpha-MSH (melanocyte-stimulating hormone). In March 2018, our
exclusive North American licensee for Vyleesi, AMAG, submitted an
NDA to the FDA for Vyleesi for the treatment of HSDD in
premenopausal women, which was accepted for filing and review by
the FDA. The Prescription Drug User Fee Act (“PDUFA”)
date for completion of FDA review of the Vyleesi NDA is March 23,
2019. We have also licensed rights to Vyleesi to Shanghai Fosun
Pharmaceutical Industrial Development Co. Ltd.
(“Fosun”) for the territories of the People’s
Republic of China, Taiwan, Hong Kong S.A.R. and Macau S.A.R.
(collectively, “China”), and Kwangdong Pharmaceutical
Co., Ltd. (“Kwangdong”) for the Republic of Korea
(“Korea”).
Our
Phase 3 studies for HSDD in premenopausal women, called the
RECONNECT studies, consisted of two double-blind
placebo-controlled, randomized parallel group studies comparing the
on demand use of 1.75 mg of Vyleesi versus placebo, in each case,
delivered via a subcutaneous auto-injector. Each trial consisted of
more than 600 patients randomized in a 1:1 ratio to either the
treatment arm or placebo with a 24-week evaluation period. In both
clinical trials, Vyleesi met the pre-specified co-primary efficacy
endpoints of improvement in desire and decrease in distress
associated with low sexual desire as measured using validated
patient-reported outcome instruments.
After
completing the studies, patients had the option to continue in an
open-label safety extension study for an additional 52 weeks.
Nearly 80% of patients who completed the randomized portion of the
study elected to remain in the open-label portion of the study. In
the Phase 3 clinical trials, the most frequent adverse events were
nausea, flushing, and headache, which were generally
mild-to-moderate in intensity and were transient.
We
retain worldwide rights for Vyleesi for HSDD and all other
indications outside North America, Korea and China. We are actively
seeking potential partners for marketing and commercialization
rights for Vyleesi for HSDD outside the licensed territories.
However, we may not be able to enter into suitable agreements with
potential partners on acceptable terms, if at all.
Melanocortin Receptor Systems.
There are five melanocortin
receptors, MC1r through MC5r. Modulation of these receptors,
through use of receptor-specific agonists, which activate receptor
function, or receptor-specific antagonists, which block receptor
function, can have significant pharmacological effects. Our new
product development activities primarily focus on MC1r agonists,
with potential to treat a number of inflammatory and autoimmune
diseases such as dry eye disease, also known as
keratoconjunctivitis sicca, uveitis, diabetic retinopathy and
inflammatory bowel disease. We believe that MC1r agonists,
including the MC1r agonist peptides we are developing, have broad
anti-inflammatory effects and appear to utilize mechanisms engaged
by the endogenous melanocortin system in regulation of the immune
system and resolution of inflammatory responses. We are also
developing peptides that are active at more than one melanocortin
receptor, and MC4r agonists, with potential utility in a number of
obesity and metabolic-related disorders, including rare disease and
orphan indications.
●
PL-8177, a
selective MC1r agonist peptide, is our lead clinical development
candidate for inflammatory bowel diseases, with potential
applicability for a number of other diseases. We filed an
Investigational New Drug (“IND”) application on PL-8177
in late 2017 and have completed subcutaneous dosing of human
subjects in a Phase 1 single and multiple ascending dose clinical
safety study, with data expected in the fourth quarter of calendar
year 2018. We anticipate starting a clinical study with oral dosing
of PL-8177 in human subjects in the fourth quarter of calendar year
2018, with data expected in the first half of calendar
2019.
1
●
PL-8331, a dual
MC1r and MC5r peptide agonist, is a preclinical development
candidate for treating ocular inflammation. We have initiated
IND-enabling preclinical activities with PL-8331, and if results
are favorable, anticipate filing an IND and initiating clinical
trials for treatment of dry eye disease in the second half of
calendar year 2019.
●
We have initiated
preclinical programs with MC4r peptides and orally-active small
molecules for treatment of rare genetic metabolic and obesity
disorders, and if results are favorable, anticipate selecting a
lead clinical development candidate and completing IND-enabling
activities in calendar year 2019.
Natriuretic Peptide Receptor Systems.
The natriuretic
peptide receptor (“NPR”) system has numerous
cardiovascular functions, and therapeutic agents modulating this
system may be useful in treatment of cardiovascular diseases,
including reducing cardiac hypertrophy and fibrosis, heart failure,
acute asthma, other pulmonary diseases and hypertension. While the
therapeutic potential of modulating this system is well
appreciated, development of therapeutic agents has been difficult
due, in part, to the short biological half-life of native peptide
agonists. We have designed and are developing potential NPR
candidate drugs that are selective for one or more different
natriuretic peptide receptors, including natriuretic peptide
receptor-A (“NPR-A”), natriuretic peptide receptor B
(“NPR-B”), and natriuretic peptide receptor C
(“NPR-C”).
●
PL-3994 is an NPR-A
agonist we developed which has completed Phase 1 clinical safety
studies. It has potential utility in treatment of a number of
cardiovascular diseases, including genetic and orphan diseases
resulting from a deficiency of endogenous active NPR-A. We have
ongoing academic collaborations with several institutions with
PL-3994.
●
PL-5028, a dual
NPR-A and NPR-C agonist we developed, is in preclinical development
for cardiovascular diseases, including reducing cardiac hypertrophy
and fibrosis. We have ongoing academic collaborations with several
institutions with PL-5028, and seek to enter into a development
partnership by the end of calendar year 2019.
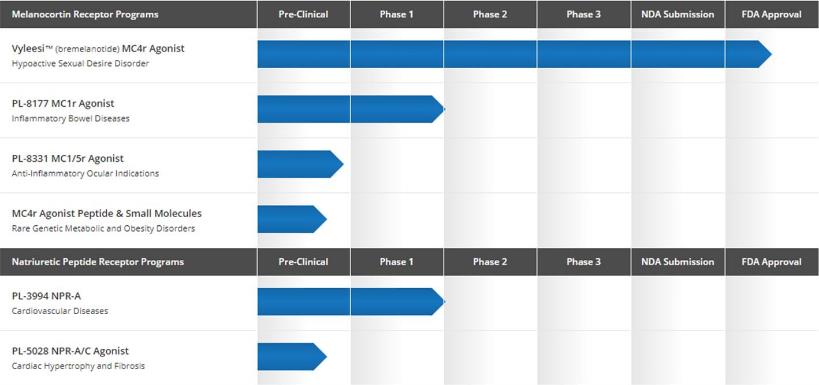
The
following chart illustrates the status of our drug development
programs.
Our Strategy
Key
elements of our business strategy include:
●
Using our
technology and expertise to develop and commercialize products in
our active drug development programs;
●
Entering into
strategic alliances and partnerships with pharmaceutical companies
to facilitate the development, manufacture, marketing, sale and
distribution of product candidates that we are
developing;
●
Partially funding
our product development programs with the cash flow generated from
existing license agreements, as well as any future research,
collaboration or license agreements; and
●
Completing
development and seeking regulatory approval of certain of our other
product candidates.
2
Our Melanocortin Receptor-Specific Programs
The
melanocortin system is involved in a large and diverse number of
physiologic functions. We are focusing on MC1r agonists and MC4r
agonists. MC1r agonists may have the potential to treat a variety
of conditions and diseases, including a number of inflammatory and
autoimmune diseases such as dry eye disease, uveitis, diabetic
retinopathy and inflammatory bowel disease. MC4r agonists may have
the potential to treat FSD, including HSDD, and a number of
metabolic-related diseases, including genetic metabolic and obesity
disorders.
Vyleesi for HSDD.
With our exclusive North American
licensee, AMAG, we are developing subcutaneously administered
Vyleesi for the treatment of HSDD in premenopausal women. FSD is
defined as persistent or recurring problems during one or more of
the stages of sexual response with associated distress. Acquired
generalized HSDD, the most common form of FSD, is characterized by
low sexual desire that causes marked distress or interpersonal
difficulties and is not due to coexisting medical or psychiatric
conditions, relationship problems or effects of medication or other
drug substances.
Vyleesi
is intended to be self-administered in the thigh or abdomen on
demand with a single-use subcutaneous auto-injector device before
anticipated sexual activity. The treatment effects may last up to
15 hours following self-administration. Vyleesi is a melanocortin
agonist with a mechanism of action which we believe involves
activation of endogenous neuronal pathways in the brain regulating
sexual arousal and desire responses.
Two
successful RECONNECT Phase 3 studies, Studies 301 and 302, have
been completed, which randomized 1,247 premenopausal women
diagnosed with acquired HSDD to either placebo or Vyleesi arms. The
Phase 3 studies included a 12-month open-label safety extension
study.
The
primary efficacy analysis population was the modified
intent-to-treat patient population, consisting of 1,202 women with
HSDD in the United States and Canada. Patients
self-administered either 1.75 mg of Vyleesi or placebo on demand in
anticipation of sexual activity. The efficacy portion of each study
consisted of a 24-week treatment evaluation period.
The
co-primary endpoints for the Phase 3 clinical trials were increase
in sexual desire measured using the Female Sexual Function Index:
Desire Domain (“FSFI-D”) and decrease in distress
associated with low sexual desire measured using Female Sexual
Distress Scale-Desires/Arousal/Orgasm (“FSDS-DAO”) Item
13. The FSFI-D is a validated patient reported outcome measurement
tool of sexual desire in the context of overall sexual function.
The FSDS-DAO Item 13 is a validated patient reported outcome
measurement tool of distress related to sexual dysfunction,
measuring personal distress associated with low sexual desire. Both
Phase 3 Studies 301 and 302 with Vyleesi for HSDD in premenopausal
women met the pre-specified co-primary efficacy
endpoints.
The
FSFI-D showed a statistically significant increase for Vyleesi
compared to placebo in both trials in the modified intent-to-treat
patient population:
Study
301: Mean change of 0.54 vs. 0.24, median change of 0.60 vs. 0.00,
p=0.0002; and,
Study
302: Mean change of 0.63 vs. 0.21, median change of 0.60 vs. 0.00,
p<0.0001.
The
FSDS-DAO Item 13 showed a statistically significant reduction in
distress related to low sexual desire for Vyleesi compared to
placebo in both trials in the modified intent-to-treat patient
population:
Study
301: Mean change of -0.7 vs. -0.4, median change of -1.0 vs. 0.0,
p<0.0001; and,
Study
302: Mean change of -0.7 vs. -0.4, median change of -1.0 vs. 0.0,
p=0.0053.
The
changes seen in both co-primary endpoints were clinically
significant. An independent committee evaluated the clinical
significance of co-primary endpoint study results using multiple
assessments of patient benefit, and was based on discussions with
the FDA and FDA guidance documents.
In the
safety population (1,247 patients), Vyleesi appeared to be well
tolerated. The most frequent adverse events were nausea, flushing,
and headache, which were generally mild-to-moderate in intensity
and were transient. Nearly 80% of patients who completed the
randomized portion of the study elected to remain in the open-label
safety extension portion of the study. All of the patients in the
extension study, which was completed in 2017, received
Vyleesi.
In the
Phase 3 clinical study program patients self-administered Vyleesi
with a single-use autoinjector device, which is intended to be the
commercial drug product. The autoinjector does not have a visible
needle, and is expected to be stored by patients at room
temperature. Women administer Vyleesi by pressing the autoinjector
pen collar against either their thigh or abdomen, and the
autoinjector pen automatically introduces the needle, administers
the dose of Vyleesi under the skin and audibly signals when the
drug had been delivered and the needle has been
retracted.
With
AMAG, we have conducted multiple pharmacokinetic and safety
pharmacology studies, including an abuse-liability study and
drug-to-drug interaction studies, as well as certain chemistry,
manufacturing and controls activities, including a drug product
process validation study. These studies were required in order to
file an NDA with FDA.
3
New Drug Application and Regulatory Pathway.
In March 2018,
our exclusive North American licensee AMAG, submitted an NDA to FDA
for Vyleesi for the treatment of HSDD in premenopausal women, which
was subsequently accepted for filing and review by the FDA. The
PDUFA date for completion of FDA review of the Vyleesi NDA is March
23, 2019, with an FDA Advisory Committee meeting on Vyleesi for
HSDD set for early 2019. We cannot assure you that a complete
review of the Phase 3 efficacy data and the pharmacokinetic and
safety pharmacology studies will support approval of Vyleesi for
HSDD, that the FDA Advisory Committee will make a favorable
recommendation or that the FDA will approve the NDA for
Vyleesi.
Medical Need — HSDD.
The 2006 PRESIDE (Prevalence of
Female Sexual Problems Associated with Distress and Determinants of
Treatment Seeking) study, a cross-sectional, population-based
survey of 31,581 female adult respondents in the United States
published in 2008 in the journal
Obstetrics & Gynecology
, found that
approximately 22% of women reported a sexual problem and 11% were
women with HSDD. Based on the number of premenopausal women in the
United States according to the U.S. Census, the presenting market
size of premenopausal women with primary HSDD is at least 5.8
million women. Despite one FDA-approved HSDD therapy on the market
today for pre-menopausal women, we believe that patient awareness
and understanding of the condition is extremely low, and as a
result few women currently seek treatment. HSDD may go undiagnosed
due to various factors such as embarrassment or stigma, lack of
awareness of low sexual desire as a medical condition or
attribution to other external factors, such as stress or
fatigue.
Subcutaneous Vyleesi.
Vyleesi, which is believed to act
through activation of melanocortin receptors in the central nervous
system, is a first-in-class pharmaceutical agent in development as
a treatment of HSDD. Vyleesi is intended for on demand use and is
self-administered by the patient, using a simple and
patient-friendly single-use autoinjector pen, prior to anticipated
sexual activity.
Partnering.
In January 2017, we entered into a license
agreement with AMAG, pursuant to which we granted AMAG an exclusive
license in all countries of North America, with the right to grant
sublicenses, to research, develop and commercialize products
containing Vyleesi. AMAG also has a non-exclusive license, with the
right to grant sublicenses, to manufacture products containing
Vyleesi in North America, and to research, develop and manufacture,
but not commercialize, products containing Vyleesi in countries
outside North America. Upon the license agreement becoming
effective on February 2, 2017, AMAG paid us $60 million as a
one-time initial payment, and has reimbursed us $25 million for
direct out-of-pocket expenses incurred in development and
regulatory activities necessary to file an NDA, less certain
expenses directly paid or to be paid by AMAG. Upon the FDA
acceptance of the Vyleesi NDA filing for HSDD, AMAG paid us $20
million less agreed deductions for expenses incurred by AMAG. In
addition, we may receive $60 million upon FDA approval of Vyleesi
for HSDD, and up to $300 million in sales milestone payments based
on achievement of certain annual net sales amounts of products
containing Vyleesi. AMAG will also pay tiered royalties on annual
net sales of products containing Vyleesi at rates ranging from the
high single-digits to the low double-digits.
In
early September 2017, we entered into a license agreement with
Fosun for exclusive rights to commercialize Vyleesi in China. We
received an upfront payment of $5.0 million, less required tax
withholding, and when regulatory approval for a Vyleesi product is
obtained in China will receive a $7.5 million milestone payment. We
may receive up to $92.5 million in sales related milestones, and
will receive high single-digit to low double-digit royalties on net
sales in China. In November 2017 we entered into a license
agreement with Kwangdong for exclusive rights to commercialize
Vyleesi in Korea, and received an upfront payment of $500,000, less
required tax withholding. Upon the first commercial sale of Vyleesi
in Korea we will receive a $3.0 million milestone payment and we
will receive mid-single-digit to low double-digit royalties on all
net sales, and may receive up to $37.5 million in sales related
milestones.
We
retain worldwide rights for Vyleesi for FSD, HSDD and all other
indications outside North America, China and Korea. We are in
active discussions with potential partners for marketing and
commercialization rights for Vyleesi in other jurisdictions,
including Europe. We may not be able to enter into suitable
agreements with potential partners on acceptable terms, if at
all.
MC1r Peptide Agonists.
Our goal is to design and develop
highly selective MC1r agonist peptides and dual MC1r and MC5r
agonist peptides for treatment of a variety of inflammatory and
autoimmune indications. In animal models our peptides, as well as
the endogenous agonist alpha-MSH, can reduce inflammation and
potentially resolve chronic inflammatory conditions. We believe
that our agonist peptides suppress certain inflammatory cytokines,
and modulate the activities of other cells, such as monocytes and T
cells, to mediate immune tolerance, and may utilize mechanisms
engaged by the endogenous melanocortin system in regulation of the
immune system and resolution of inflammatory
responses.
4
We have
conducted preclinical animal studies with MC1r and dual MC1r and
MC5r peptide drug candidates for a number of inflammatory disease
and autoimmune indications. MC1r is upregulated in a number of
diseases, including inflammatory bowel disease and ocular
indications such as uveitis, diabetic retinopathy and dry eye
disease. Work with rodent animal models have demonstrated
therapeutic responses that are statistically significant compared
to placebo, and that are equal to or superior to established
positive controls in animal models. However, success in animal
models does not necessarily mean that any of the drug candidates
will be able to successfully treat any disease or condition in
human patients.
Our
MC1r and dual MC1r and MC5r peptide drug candidates are highly
specific, with substantially greater binding and activity at MC1r,
or MC1r and MC5r for dual target drug candidates, than at other
melanocortin receptors. In vitro safety studies have shown that our
peptide drug candidates have no activity in a wide range of
receptors, ion channels and kinases.
PL-8177 Evaluation.
We have selected one of our MC1r peptide
drug candidates, designated PL-8177, as our lead clinical
development candidate for inflammatory bowel diseases, including
ulcerative colitis. PL-8177 is a cyclic peptide comprised of seven
amino acids. We may also explore use of PL-8177 for other
indications or diseases.
We
completed preclinical toxicology testing on PL-8177 as well as
chemistry, controls and manufacturing activities to support Phase 1
studies, and filed an IND with the FDA. Pursuant to that IND, we
have completed dosing in a Phase 1 randomized, double-blind,
placebo-controlled, single and multiple ascending dose study to
evaluate the safety and tolerability of PL-8177 administered via
subcutaneous injection. We anticipate top line data in the fourth
quarter of 2018.
We have
developed an oral formulation of PL-8177, and have evaluated the
oral formulation in animal models. In animal models PL-8177 was
protected from degradation in the stomach and small intestine and
delivered to the large intestine and colon over an extended period.
In addition, orally administered PL-8177 had a significant effect
on resolving inflammation in a rat bowel inflammation model. We
anticipate starting a clinical study with oral dosing of PL-8177 in
human subjects in the fourth quarter of calendar year 2018, with
data expected in the first half of calendar 2019.
PL-8331 Evaluation.
We have designated our peptide PL-8331,
which is a dual MC1r and MC5r agonists, as a preclinical
development candidate for treating ocular inflammatory diseases. We
are conducting ongoing preclinical IND-enabling activities with
PL-8331, and if results are favorable, anticipate filing an IND and
initiating clinical trials for treatment of dry eye disease in the
second half of calendar year 2019.
Next Generation MC4r Peptide and Small Molecule Agonists.
We
have developed a series of highly selective MC4r peptides and
orally active small molecules. In developing these compounds, we
examined effectiveness in animal models of sexual response and
obesity, and also determined cardiovascular effects, primarily
looking at changes in blood pressure. Results of these studies,
including studies of weight loss in diet-induced obese mice and
leptin-deficient mice with orally administered MC4r compounds,
suggest that certain of these compounds may have significant
medical and commercial potential for treatment of conditions
responsive to MC4r activation, including certain orphan and rare
disease indications. We are continuing preclinical development
work, and evaluating the potential for orphan designation under the
Orphan Drug Act.
We have
initiated a chemistry development program for both MC1r and MC4r
specific small molecule agonists, and will be evaluating compounds
we develop in functional assays.
Our Natriuretic Peptide Receptor-Specific Programs
The
natriuretic peptide receptor system has numerous cardiovascular
functions, and therapeutic agents modulating this system may be
useful in treatment of heart failure, acute asthma, other pulmonary
diseases and hypertension. While the therapeutic potential of
modulating this system is well appreciated, development of
therapeutic agents has been difficult due, in part, to the short
biological half-life of native peptide agonists.
We have
designed and are developing potential candidate drugs that are
selective for different natriuretic peptide receptors, including
NPR-A, NPR-B, NPR-C, and combinations of receptors.
PL-3994.
PL-3994 is our lead NPR-A product candidate, and is
a synthetic mimetic of the endogenous neuropeptide hormone atrial
natriuretic peptide (“ANP”) and an NPR-A agonist.
PL-3994 may be suitable for replacement therapy in patients with
prohormone processing deficiencies characterized by insufficient
endogenous ANP. PL-3994 activates NPR-A, a receptor known to play a
role in cardiovascular homeostasis. Consistent with being an NPR-A
agonist, PL-3994 increases plasma cyclic guanosine monophosphate
(“cGMP”) levels, a pharmacological response consistent
with the effects of endogenous natriuretic peptides on
cardiovascular function and smooth muscle relaxation. PL-3994 also
decreases activity of the renin-angiotensin-aldosterone system
(“RAAS”), a hormone system that regulates blood
pressure and fluid balance. The RAAS system is frequently
over-activated in heart failure patients, leading to worsening of
cardiovascular function.
5
PL-3994,
our lead product development candidate which has completed Phase 1
safety studies, is one of a number of natriuretic peptide receptor
agonist compounds we have developed. In conjunction with clinicians
at a major research institution, PL-3994 is tentatively scheduled
to enter Phase 2A clinical trials within the next twelve months.
PL-3994 is a synthetic molecule incorporating a novel and
proprietary amino acid mimetic structure, and has an extended
circulation half-life and metabolic stability compared to
endogenous ANP. Based on the half-life and pharmacokinetics, we
believe that PL-3994 is amenable to once daily chronic use
subcutaneous administration.
Prior Clinical Studies with PL-3994.
Human clinical studies
of PL-3994 commenced with a Phase 1 trial, which concluded in 2008.
This was a randomized, double-blind, placebo-controlled study in 26
healthy volunteers who received either PL-3994 or a placebo
subcutaneously. Dosing concluded with the successful achievement of
the primary endpoint of the study, a pre-specified reduction in
systemic blood pressure. No volunteer experienced a serious or
severe adverse event. Elevations in plasma cGMP levels, increased
diuresis and increased natriuresis were all observed for several
hours after single subcutaneous doses. Later in 2008, we conducted
a trial in volunteers with controlled hypertension who were
receiving one or more conventional antihypertensive medications. No
volunteer experienced a serious or severe adverse event. Elevations
in plasma cGMP levels were observed for several hours after single
subcutaneous doses. Based on the studies to date, PL-3994 is ready
for Phase 2 safety and efficacy studies.
PL-5028.
We are in preclinical development with PL-5028, a
dual natriuretic peptide receptor A and C agonist we developed, for
cardiovascular disease indications, including reducing cardiac
hypertrophy and fibrosis. Depending on results of preclinical
studies, we may file an IND application in the first half of
calendar year 2019, and thereafter initiate a Phase 1 clinical
safety study.
Administration of PL-3994 and PL-5028.
For heart failure and
other cardiovascular disease indications we believe that
subcutaneous administration may be employed. In studies to date,
PL-3994 is well absorbed through the subcutaneous route of
administration. In human studies with PL-3994, the pharmacokinetic
and pharmacodynamic half-lives were on the order of hours,
significantly longer than the comparable half-lives of endogenous
natriuretic peptides. We believe that subcutaneous PL-3994 or
PL-5028, if successful, will be appropriate for self-administration
by patients, similar to insulin and other self-administered
drugs.
Heart Failure and Cardiovascular Disease Indications.
Patient populations have been identified which have reduced levels
of endogenous active natriuretic peptides, including endogenous
active ANP. The reduced levels have a variety of causes, including
mutations in endogenous natriuretic peptides and in enzymes
necessary to convert natriuretic peptide sequences to their active
form. Patients with reduced levels of endogenous active natriuretic
peptides are reported to have a poor response to current drug
therapies and to have increased rates of cardiac remodeling and
cardiac events.
We
believe that our natriuretic peptide potential candidate drugs have
the potential to treat heart failure with preserved ejection
fraction (“HFpEF”), which is a high unmet medical need
with no approved treatment options, heart failure with reduced
ejection fraction (“HFrEF”), and patients with reduced
levels of endogenous active natriuretic peptides, such as corin
deficiencies, which is a high unmet medical need in patients with a
poor response to current therapies, with the objective to restore
normal natriuretic peptide function.
Technologies We Use
We used
a rational drug design approach to discover and develop proprietary
peptide, peptide mimetic and small molecule agonist compounds,
focusing on melanocortin and natriuretic peptide receptor systems.
Computer-aided drug design models of receptors are optimized based
on experimental results obtained with peptides and small molecules
that we develop. With our approach, we believe we are developing an
advanced understanding of the factors which drive
agonism.
We have
developed a series of proprietary technologies used in our drug
development programs. One technology employs novel amino acid
mimetics in place of selected amino acids. These mimetics provide
the receptor-binding functions of conventional amino acids while
providing structural, functional and physiochemical advantages. The
amino acid mimetic technology is employed in PL-3994, our compound
in development for treatment of heart failure.
Some
compound series have been derived using our proprietary and
patented platform technology, called MIDAS™, or
M
etal
I
on-induced
D
istinctive
A
rray of
S
tructures. This technology employs
metal ions to fix the three-dimensional configuration of peptides,
forming conformationally rigid molecules that remain folded
specifically in their active state. These MIDAS molecules are
generally simple to synthesize, are chemically and proteolytically
stable, and have the potential to be orally bioavailable. In
addition, MIDAS molecules are information-rich and provide data on
structure-activity relationships that may be used to design small
molecule, non-peptide drugs.
6
Amount Spent on Research and Development Activities
Research
and development expenses were approximately $32.6 million for the
fiscal year ended June 30, 2018 (“fiscal 2018”), $45.7
million for the fiscal year ended June 30, 2017 (“fiscal
2017”), and $43.1 million for the fiscal year ended June 30,
2016 (“fiscal 2016”).
Competition
General.
Our products under development will compete on the
basis of quality, performance, cost effectiveness and application
suitability with numerous established products and technologies. We
have many competitors, including pharmaceutical, biopharmaceutical
and biotechnology companies. Furthermore, there are several
well-established products in our target markets that we will have
to compete against. Products using new technologies which may be
competitive with our proposed products may also be introduced by
others. Most of the companies selling or developing competitive
products have financial, technological, manufacturing and
distribution resources significantly greater than ours and may
represent significant competition for us. In addition, if any of
our product candidates are approved by FDA, they will eventually
face competition from generic versions that will sell at
significantly reduced prices, be preferred by managed care and
health insurance payers, and be eligible for automatic pharmacy
substitution even when a prescriber writes a prescription for our
product. The timing and extent of future generic competition is
dependent upon both our intellectual property rights and the FDA
regulatory process, but cannot be accurately
predicted.
The
pharmaceutical and biotechnology industries are characterized by
extensive research efforts and rapid technological change. Many
biopharmaceutical companies have developed or are working to
develop products similar to ours or that address the same markets.
Such companies may succeed in developing technologies and products
that are more effective or less costly than any of those that we
may develop. Such companies may be more successful than us in
developing, manufacturing and marketing products.
We
cannot guarantee that we will be able to compete successfully in
the future or that developments by others will not render our
proposed products under development or any future product
candidates obsolete or noncompetitive or that our collaborators or
customers will not choose to use competing technologies or
products.
Vyleesi for Treatment of HSDD.
There is competition and
financial incentive to develop, market and sell drugs for the
treatment of HSDD and other forms of FSD. Flibanserin, sold under
the trade name Addyi®, is the only drug currently approved in
the United States for treatment of HSDD. Flibanserin, a
non-hormonal oral serotonin 5-HT1A agonist, 5-HT2A antagonist,
which requires chronic dosing, was approved by the FDA on August
18, 2015 for treatment of premenopausal women with HSDD. The FDA
approval included a risk evaluation and mitigation strategy
(“REMS”) because of the increased risk of severe
hypotension and syncope due to the interaction between flibanserin
and alcohol, and a Boxed Warning to highlight the risks of severe
hypotension and syncope in patients who drink alcohol during
treatment with flibanserin, in those who also use moderate or
strong CYP3A4 inhibitors, and in those who have liver impairment.
We are aware of several other drugs at various stages of
development, most of which are taken on a chronic, typically
once-daily, basis. There are other companies reported to be
developing new drugs for FSD indications, some of which may be in
clinical trials in the United States or elsewhere. We are not aware
of any other company actively developing a melanocortin receptor
agonist drug for HSDD.
PL-3994 and PL-5028 for Heart Failure Indications.
Nesiritide (sold under the trade name Natrecor®), a
recombinant human B-type natriuretic peptide drug, is marketed in
the United States by Scios Inc., a Johnson & Johnson company.
Nesiritide is approved for treatment of acutely decompensated
congestive heart failure patients who have dyspnea at rest or with
minimal activity. Other peptide drugs, including carperitide, a
recombinant human ANP drug, and ularitide, a synthetic form of
urodilatin, a naturally occurring human natriuretic peptide related
to ANP, have been investigated for treatment of congestive heart
failure, but we are not aware of any active development in the
United States. We are aware of other companies developing
intravenously administered natriuretic peptide drugs, with at least
one reported to have completed Phase 2 clinical trials for acute
heart failure. A combination drug comprised of sacubitril and
valsartan developed by Novartis AG, sold under the trade name
Entresto®, inhibits both the angiotensin II receptor and
neprilysin (an enzyme which inactivates endogenous active
natriuretic peptides). This combination drug, which was approved by
the FDA in July 2015, results in increases of endogenous active ANP
levels, and thus has a mechanism of action with similarities to
PL-3994 and PL-5028. In a Phase 3 trial, the combination drug was
compared to an angiotensin-converting-enzyme inhibitor, enalapril,
in heart failure patients with reduced ejection fraction. It
significantly improved the rate of death from cardiovascular
causes, significantly reduced hospitalization for heart failure and
significantly improved heart failure symptoms. This combination
drug demonstrated that upregulation of the natriuretic peptide
system in combination with angiotensin-converting-enzyme inhibition
is superior to angiotensin-converting-enzyme inhibition alone, and
thus provides validation of the natriuretic peptide system as a
target for improving outcomes in treating heart failure patients.
In addition, there are a number of approved drugs and drugs in
development for treatment of heart failure through mechanisms or
pathways other than agonism of NPR-A.
7
MC1r Peptides for Inflammatory Disease-Related Indications.
Many inflammatory disease-related indications are treated using
systemic steroids or immunosuppressant drugs, all of which have
side effects which can be dose limiting. There are a large number
of approved biological drugs and biological drugs under development
for treatment of inflammatory disease-related indications. For
inflammatory bowel diseases, FDA-approved drugs include mesalazine
and immunosuppressive drugs such as prednisone and other steroids,
tumor necrosis factor inhibitors such as infliximab and adalimumab,
and immune system suppressants such as azathioprine, mercaptopurine
and methotrexate.
Mild to
moderate dry eye disease and other ocular inflammatory diseases may
be treated with artificial tear eye drops, lubricating tear
ointments, hot compresses or punctual plugs, but more severe
disease may be treated with topical immunosuppressants such as
cyclosporine ophthalmic emulsions, including Restasis®
marketed in the United States by Allergan, Inc., or with drugs
inhibiting inflammatory cell binding, such as lifitegrast,
including Xiidra® marketed in the United States by Shire US
Inc. In addition, there are a number of drugs in clinical
development for treatment of dry eye disease, with 19 agents
reported to be in or have completed Phase 2 development. There are
no reported MC1r agonist drugs in clinical trials for dry eye
disease. If one or more of these competing product candidates is
approved and either treats the signs and symptoms of dry eye
disease or reduces the frequency of flares of dry eye in patients,
it could reduce the market for our MC1r drugs.
Obesity and Related Indications.
There are a number of
FDA-approved drugs and medical devices for the treatment of
obesity, and a large number of products in clinical development by
other companies, including products which target melanocortin
receptors. Rhythm Pharmaceuticals, Inc. is reported to be in Phase
3 clinical trials with an MC4r agonist peptide drug for rare
genetic disorders of obesity.
Patents and Proprietary Information
Patent Protection.
Our success will depend in substantial
part on our ability to obtain, defend and enforce patents, maintain
trade secrets and operate without infringing upon the proprietary
rights of others, both in the United States and abroad. We own a
number of issued United States patents and have pending United
States patent applications, many with issued or pending counterpart
patents in selected foreign countries. We seek patent protection
for our technologies and products in the United States and those
foreign countries where we believe patent protection is
commercially important.
We own
two issued United States patents claiming the Vyleesi substance and
an issued patent claiming the Vyleesi substance in each of
Australia, Austria, Belgium, Brazil, Canada, Cyprus, Denmark,
Finland, France, Germany, Greece, Hong Kong, Ireland, Italy, Japan,
Korea, Luxembourg, Mexico, Monaco, Netherlands, New Zealand,
Portugal, Spain, Sweden, Switzerland, and the United Kingdom. The
issued United States patents have a term until 2020, and the term
of one patent covering either the composition of matter or method
of use of Vyleesi may be subject to extension for a maximum period
of up to five years as compensation for patent term lost during
drug development and the FDA regulatory review process, pursuant to
the Drug Price Competition and Patent Term Restoration Act of 1984,
or the Hatch-Waxman Amendments. Whether we will be able to obtain a
patent term extension under the Hatch-Waxman Amendments and the
length of any such extension cannot be determined until the FDA
approves for marketing, if ever, a product in which Vyleesi is the
active ingredient. In addition, the claims of issued patents
covering Vyleesi may not provide meaningful protection. Further,
third parties may challenge the validity or scope of any issued
patent, and under the Hatch-Waxman Amendments, potentially receive
approval of a competing generic version of our product or products
even before a court rules on the validity or infringement of our
patents.
We own
two issued United States patents and a pending patent application
in the United States for methods of treating FSD with Vyleesi, with
related patents issued in Australia and South Africa, and related
patent applications pending in Brazil, Canada, China, Georgia, Hong
Kong, India, Indonesia, Israel, Japan, Korea, Malaysia, Mexico, New
Zealand, Philippines, Ukraine, Vietnam and before the European and
Eurasian patent offices. Under our license agreement with AMAG,
AMAG has assumed responsibility for prosecution in the United
States, Canada and Mexico. The issued United States patents have a
term until 2033. We do not know the full scope of patent coverage
we will obtain, or whether any patents will issue other than the
patents already issued. Whether we will be able to obtain a patent
term extension in the United States under the Hatch-Waxman
Amendments, and the length of any such extension, cannot be
determined until the FDA approves for marketing, if ever, a product
utilizing Vyleesi by methods claimed in the patent. Issued patents
and pending applications in the United States and elsewhere in the
world have a presumptive term, if a patent is issued, until
2033.
8
We have
patents and patent applications on an alternative class of
melanocortin receptor-specific peptides for treatment of sexual
dysfunction and other indications, including obesity, consisting of
two issued patents in the United States, an issued patent in each
of Australia, Canada, China, France, Germany, Ireland, Israel,
Japan, Korea, Mexico, New Zealand, Russia, Switzerland and the
United Kingdom, and pending patent applications on the same class
in Brazil, and South Africa. The presumptive term of the issued
patents and pending patent applications is until 2029. We also have
patents and pending patent applications for a second class of
alternative melanocortin receptor-specific peptides for treatment
of sexual dysfunction and other indications, including obesity,
consisting of issued patents in the United States, Australia,
China, France, Germany, Ireland, Japan, Israel, Korea, New Zealand,
Russia, South Africa, Switzerland and the United Kingdom and
pending patent applications on the same class in Brazil, Canada,
China, India, and Mexico. The presumptive term of the issued
patents and pending patent applications is until 2030. Until one or
more product candidates covered by a claim of one of these patents
and patent applications are developed for commercialization, which
may never occur, we cannot evaluate the duration of any potential
patent term extension under the Hatch-Waxman
Amendments.
We own
four issued patents in the United States, and issued patents in
Canada, China, Israel, Japan, Mexico, New Zealand, South Africa and
Russia claiming highly selective MC1r agonist peptides, including
for treatment of inflammation-related diseases and disorders and
related indications, and pending patent applications in Australia,
Brazil, India, and Korea. The presumptive term of the issued
patents and pending patent applications is until 2030. Until one or
more product candidates covered by a claim of one of these patent
applications are developed for commercialization, which may never
occur, we cannot evaluate the duration of any potential patent term
extension under the Hatch-Waxman Amendments.
We own
two issued United States patents claiming the PL-3994 substance and
other natriuretic peptide receptor agonist compounds that we have
developed and an issued United States patent claiming a precursor
molecule to the PL-3994 substance, both of which expire in 2027.
Corresponding patents on the PL-3994 substance and other
natriuretic peptide receptor agonist compounds were issued in
Australia, Austria, Belgium, China, Colombia, Denmark, Finland,
France, Germany, Hong Kong, Hungary, India, Ireland, Israel, Italy,
Japan, Korea, Mexico, Netherlands, Philippines, Russia, South
Africa, Spain, Sweden, Switzerland, and the United Kingdom, with
terms until 2027. Patent applications on the PL-3994 substance and
other natriuretic peptide receptor agonist compounds are pending in
Brazil and Canada, with presumptive terms until 2027. Applications
claiming precursor molecules for the PL-3994 substance and other
compounds have issued in the United States, Australia, Canada,
China, France, Germany, Hong Kong, India, Ireland, Israel, Japan,
Mexico, Netherlands, Philippines, Korea, South Africa, Sweden,
Switzerland and the United Kingdom, and expire in 2027. A Patent
application on the precursor molecule is pending in Brazil, with
presumptive terms until 2027. We also own an issued United States
patent claiming use of the PL-3994 substance for treatment of acute
asthma and chronic obstructive pulmonary disease, which expires in
2031. Until one or more product candidates covered by a claim of
the issued patents or one of these patent applications are
developed for commercialization, which may never occur, we cannot
evaluate the duration of any potential patent term extension under
the Hatch-Waxman Amendments.
We
additionally have 35 issued United States patents on melanocortin
receptor specific peptides and small molecules, and five issued
United States patents on natriuretic peptide receptor agonist
compounds, but we are not actively developing any product candidate
covered by a claim of any of these patents.
In the
event that a third party has also filed a patent application
relating to an invention we claimed in a patent application, we may
be required to participate in an interference proceeding
adjudicated by the United States Patent and Trademark Office
(“USPTO”) to determine priority of invention. The
possibility of an interference proceeding could result in
substantial uncertainties and cost, even if the eventual outcome is
favorable to us. An adverse outcome could result in the loss of
patent protection for the subject of the interference, subjecting
us to significant liabilities to third parties, the need to obtain
licenses from third parties at undetermined cost, or requiring us
to cease using the technology. Additionally, the claims of our
issued patents may be narrowed or invalidated by administrative
proceedings, such as interference or derivation,
inter partes
review, post grant review
or reexamination proceedings before the USPTO.
Future Patent Infringement.
We do not know for certain that
our commercial activities will not infringe upon patents or patent
applications of third parties, some of which may not even have been
issued. Although we are not aware of any valid United States
patents which are infringed by Vyleesi or PL-3994, we cannot
exclude the possibility that such patents might exist or arise in
the future. We may be unable to avoid infringement of any such
patents and may have to seek a license, defend an infringement
action, or challenge the validity of such patents in court. Patent
litigation is costly and time consuming. If such patents are valid
and we do not obtain a license under any such patents, or we are
found liable for infringement, we may be liable for significant
monetary damages, may encounter significant delays in bringing
products to market, or may be precluded from participating in the
manufacture, use or sale of products or methods of treatment
covered by such patents.
Proprietary Information.
We rely on proprietary information,
such as trade secrets and know-how, which is not patented. We have
taken steps to protect our unpatented trade secrets and know-how,
in part through the use of confidentiality and intellectual
property agreements with our employees, consultants and certain
contractors. If our employees, scientific consultants,
collaborators or licensees develop inventions or processes
independently that may be applicable to our product candidates,
disputes may arise about the ownership of proprietary rights to
those inventions and processes. Such inventions and processes will
not necessarily become our property, but may remain the property of
those persons or their employers. Protracted and costly litigation
could be necessary to enforce and determine the scope of our
proprietary rights.
9
If
trade secrets are breached, our recourse will be solely against the
person who caused the secrecy breach. This might not be an adequate
remedy to us because third parties other than the person who causes
the breach will be free to use the information without
accountability to us. This is an inherent limitation of the law of
trade secret protection.
U.S. Governmental Regulation of Pharmaceutical
Products
General
Regulation
by governmental authorities in the United States and other
countries will continue to significantly impact our research,
product development, manufacturing and marketing of any
pharmaceutical products. The nature and the extent to which
regulations apply to us will vary depending on the nature of any
such products. Our potential pharmaceutical products will require
regulatory approval by governmental agencies prior to
commercialization. The products we are developing are subject to
federal regulation in the United States, principally by the FDA
under the Federal Food, Drug, and Cosmetic Act
(“FFDCA”), and by state and local governments, as well
as regulatory and other authorities in foreign governments that
include rigorous preclinical and clinical testing and other
approval procedures. Such regulations govern or influence, among
other things, the research, development, testing, manufacture,
safety and efficacy requirements, labeling, storage, recordkeeping,
licensing, advertising, promotion, distribution and export of
products, manufacturing and the manufacturing process. In many
foreign countries, such regulations also govern the prices charged
for products under their respective national social security
systems and availability to consumers.
All
drugs intended for human use are subject to rigorous regulation by
the FDA in the United States and similar regulatory bodies in other
countries. The steps ordinarily required by the FDA before an
innovative new drug product may be marketed in the United States
are similar to steps required in most other countries and include,
but are not limited to:
●
completion of
preclinical laboratory tests, preclinical animal testing and
formulation studies;
●
submission to the
FDA of an IND, which must be in effect before clinical trials may
commence;
●
submission to the
FDA of an NDA that includes preclinical data, clinical trial data
and manufacturing information;
●
payment of
substantial user fees for filing the NDA and other recurring user
fees;
●
FDA review of the
NDA;
●
satisfactory
completion of an FDA pre-approval inspection of the manufacturing
facilities; and
●
FDA approval of the
NDA, including approval of all product labeling.
For
combination products deemed to have a “drug” primary
mode of action, primary review of the product will be conducted by
the appropriate division within the Center for Drug Evaluation and
Research (“CDER”), but CDER will consult with the
Center for Devices and Radiological Health to ensure that the
device components of the product meet all applicable device
requirements.
The
research, development and approval process requires substantial
time, effort and financial resources, and approvals may not be
granted on a timely or commercially viable basis, if at
all.
Preclinical
testing includes laboratory evaluations to characterize the
product’s composition, impurities, stability, and mechanism
of its pharmacologic effect, as well as animal studies to assess
the potential safety and efficacy of each product. Preclinical
safety tests must be conducted by laboratories that comply with FDA
regulations regarding Good Laboratory Practices and the U.S.
Department of Agriculture’s Animal Welfare Act. Violations of
these laws and regulations can, in some cases, lead to invalidation
of the tests, requiring such tests to be repeated and delaying
approval of the NDA. The results of the preclinical tests, together
with manufacturing information and analytical data, are submitted
to the FDA as part of an IND and are reviewed by the FDA before the
commencement of human clinical trials. Unless the FDA objects to an
IND by placing the study on clinical hold, the IND will go into
effect 30 days following its receipt by the FDA. The FDA may
authorize trials only on specified terms and may suspend ongoing
clinical trials at any time on various grounds, including a finding
that patients are being exposed to unacceptable health risks. If
the FDA places a study on clinical hold, the sponsor must resolve
all of the FDA’s concerns before the study may begin or
continue. The IND application process may become extremely costly
and substantially delay development of products. Similar
restrictive requirements also apply in other countries.
Additionally, positive results of preclinical tests will not
necessarily indicate positive results in clinical
trials.
10
Clinical
trials involve the administration of the investigational product to
humans under the supervision of qualified principal investigators.
Our clinical trials must be conducted in accordance with Good
Clinical Practice regulations under protocols submitted to the FDA
as part of an IND. In addition, each clinical trial is approved and
conducted under the auspices of an institutional review board
(“IRB”), and requires the patients’ informed
consent. An IRB considers, among other things, ethical factors, the
safety of human subjects, and the possibility of liability of the
institutions conducting the trial. The IRB at each institution at
which a clinical trial is being performed may suspend a clinical
trial at any time for a variety of reasons, including a belief that
the test subjects are being exposed to an unacceptable health risk.
As the sponsor, we can also suspend or terminate a clinical trial
at any time.
Clinical
trials are typically conducted in three sequential phases, Phases
1, 2, and 3, involving an increasing number of human subjects.
These phases may sometimes overlap or be combined. Phase 1 trials
are performed in a small number of healthy human subjects or
subjects with the targeted condition, and involve testing for
safety, dosage tolerance, absorption, distribution, metabolism and
excretion. Phase 2 studies, which may involve up to hundreds of
subjects, seek to identify possible adverse effects and safety
risks, preliminary information related to the efficacy of the
product for specific targeted diseases, dosage tolerance, and
optimal dosage. Finally, Phase 3 trials may involve up to thousands
of individuals often at geographically dispersed clinical trial
sites, and are intended to provide the documentation of
effectiveness and important additional safety data required for
approval. Prior to commencing Phase 3 clinical trials many sponsors
elect to meet with FDA officials to discuss the conduct and design
of the proposed trial or trials.
In
addition, federal law requires the listing, on a publicly-available
website, of detailed information on clinical trials for
investigational drugs. Some states have similar or supplemental
clinical trial reporting laws.
Success
in early-stage animal studies and clinical trials does not
necessarily assure success in later-stage clinical trials. Data
obtained from animal studies and clinical activities are not always
conclusive and may be subject to alternative interpretations that
could delay, limit or even prevent regulatory
approval.
All
data obtained from the preclinical studies and clinical trials, in
addition to detailed information on the manufacture and composition
of the product, would be submitted in an NDA to the FDA for review
and approval for the manufacture, marketing and commercial
shipments of any of our products. FDA approval of the NDA is
required before commercial marketing or non-investigational
interstate shipment may begin in the United States. The FDA may
also conduct an audit of the clinical trial data used to support
the NDA.
The FDA
may deny or delay approval of an NDA that does not meet applicable
regulatory criteria. For example the FDA may determine that the
preclinical or clinical data or the manufacturing information does
not adequately establish the safety and efficacy of the drug. The
FDA has substantial discretion in the approval process and may
disagree with an applicant’s interpretation of the data
submitted in its NDA. The FDA can request additional information,
seek clarification regarding information already provided in the
submission or ask that new additional clinical trials be conducted,
all of which can delay approval. Similar types of regulatory
processes will be encountered as efforts are made to market any
drug internationally. We will be required to assure product
performance and manufacturing processes from one country to
another.
Even if
the FDA approves a product, it may limit the approved uses for the
product as described in the product labeling, require that
contraindications, warning statements or precautions be included in
the product labeling, require that additional studies be conducted
following approval as a condition of the approval, impose
restrictions and conditions on product distribution, prescribing or
dispensing in the form of a REMS, or otherwise limit the scope of
any approval or limit labeling. Once it approves an NDA, the FDA
may revoke or suspend the product approval if compliance with
post-market regulatory standards is not maintained or if problems
occur after the product reaches the marketplace. In addition, the
FDA may require post-marketing studies to monitor the effect of
approved products, and may limit further marketing of the product
based on the results of these post-market studies. The FDA and
other government agencies have broad post-market regulatory and
enforcement powers, including the ability to levy civil and
criminal penalties, suspend or delay issuance of approvals, seize
or recall products and revoke approvals.
Pharmaceutical
manufacturers, distributors and their subcontractors are required
to register their facilities with the FDA and state agencies.
Manufacturers are required to list their marketed drugs with the
FDA, are subject to periodic inspection by the FDA and other
authorities, where applicable, and must comply with the FDA’s
current Good Manufacturing Practices (“GMP”)
regulations, and the product specifications set forth in the
approved NDA. The GMP requirements for pharmaceutical products are
extensive and compliance with them requires considerable time,
resources and ongoing investment. The regulations require
manufacturers and suppliers of raw materials and components to
establish validated systems and to employ and train qualified
employees to ensure that products meet high standards of safety,
efficacy, stability, sterility (where applicable), purity, and
potency. The requirements apply to all stages of the manufacturing
process, including the synthesis, processing, sterilization,
packaging, labeling, storage and shipment of the drug product. For
all drug products, the regulations require investigation and
correction of any deviations from GMP requirements and impose
documentation requirements upon us and any third-party
manufacturers that we may decide to use. Manufacturing
establishments are subject to mandatory user fees, and to periodic
unannounced inspections by the FDA and state agencies for
compliance with all GMP requirements. The FDA is authorized to
inspect manufacturing facilities without a warrant at reasonable
times and in a reasonable manner.
11
We or
our present or future suppliers may not be able to comply with GMP
and other FDA regulatory requirements. Failure to comply with the
statutory and regulatory requirements subjects the manufacturer
and/or the NDA sponsor or distributor to possible legal or
regulatory action, such as a delay or refusal to approve an NDA,
suspension of manufacturing, seizure or recall of a product, or
civil or criminal prosecution of the company or individual officers
or employees.
Post-Marketing Regulation
Any
drug products manufactured or distributed by us pursuant to FDA
approvals, as well as the materials and components used in our
products, are subject to pervasive and continuing regulation by the
FDA, including:
●
recordkeeping
requirements;
●
periodic reporting
requirements;
●
GMP requirements
related to all stages of manufacturing, testing, storage,
packaging, labeling and distribution of finished dosage forms of
the product;
●
monitoring and
reporting of adverse experiences with the product; and
●
advertising and
promotional reporting requirements and restrictions.
Adverse
experiences with the product must be reported to the FDA and could
result in the imposition of market restriction through labeling
changes or product removal. Product approvals may be revoked if
compliance with regulatory requirements is not maintained or if
problems concerning safety or effectiveness of the product occur
following approval. The FDA is developing a national electronic
drug safety tracking system known as SENTINEL that may impose
additional safety monitoring burdens, and enhanced FDA enforcement
authority, beyond the extensive requirements already in effect. As
a condition of NDA approval, the FDA may require post-approval
testing and surveillance to monitor a product’s safety or
efficacy. The FDA also may impose other conditions, including
labeling restrictions which can materially impact the potential
market and profitability of a product.
With
respect to post-market product advertising and promotion, the FDA
and other government agencies including the Department of Health
and Human Services and the Department of Justice, and individual
States, impose a number of complex regulations on entities that
advertise and promote pharmaceuticals, including, among others,
standards and restrictions on direct-to-consumer advertising,
off-label promotion, industry-sponsored scientific and educational
activities and promotional activities involving the Internet. The
FDA has very broad enforcement authority under the FFDCA, and
failure to abide by these regulations can result in administrative
and judicial enforcement actions, including the issuance of a
Warning Letter directing correction of deviations from FDA
standards, a requirement that future advertising and promotional
materials be pre-cleared by the FDA, False Claims Act prosecution
based on alleged off-label marketing seeking monetary and other
penalties, including potential exclusion of the drug and/or the
company from participation in government health care programs, and
state and federal civil and criminal investigations and
prosecutions. Foreign regulatory bodies also strictly enforce these
and other regulatory requirements and drug marketing may be
prohibited in whole or in part in other countries.
We, our
collaborators or our third-party contract manufacturers may not be
able to comply with the applicable regulations. After regulatory
approvals are obtained, the subsequent discovery of previously
unknown problems, or the failure to maintain compliance with
existing or new regulatory requirements, may result
in:
●
restrictions on the
marketing or manufacturing of a product;
●
Warning Letters or
Untitled Letters from the FDA asking us, our collaborators or
third-party contractors to take or refrain from taking certain
actions;
●
withdrawal of the
product from the market;
●
the FDA’s
refusal to approve pending applications or supplements to approved
applications;
●
voluntary or
mandatory product recall;
●
fines or
disgorgement of profits or revenue;
●
suspension or
withdrawal of regulatory approvals;
●
refusals to permit
the import or export of products;
●
product seizure;
and
●
injunctions or the
imposition of civil or criminal penalties.
12
We may
also be subject to healthcare laws, regulations and enforcement and
our failure to comply with any such laws, regulations or
enforcement could adversely affect our business, operations and
financial condition. Certain federal and state healthcare laws and
regulations pertaining to fraud and abuse and patients’
rights are and will be applicable to our business. We are subject
to regulation by both the federal government and the states in
which we or our partners conduct our business. The laws and
regulations that may affect our ability to operate
include:
●
the federal
Anti-Kickback Statute, which prohibits, among other things, any
person or entity from knowingly and willfully offering, soliciting,
receiving or providing any remuneration (including any kickback,
bribe or rebate), directly or indirectly, overtly or covertly, in
cash or in kind, to induce either the referral of an individual or
in return for the purchase, lease, or order of any good, facility
item or service, for which payment may be made, in whole or in
part, under federal healthcare programs such as the Medicare and
Medicaid programs;
●
federal civil and
criminal false claims laws and civil monetary penalty laws,
including, for example, the federal civil False Claims Act, which
impose criminal and civil penalties, including civil whistleblower
or qui tam actions, against individuals or entities for, among
other things, knowingly presenting, or causing to be presented, to
the federal government, including the Medicare and Medicaid
programs, claims for payment that are false or fraudulent or making
a false statement to avoid, decrease or conceal an obligation to
pay money to the federal government;
●
the federal Health
Insurance Portability and Accountability Act of 1996
(“HIPAA”), which created new federal criminal statutes
that prohibit knowingly and willfully executing, or attempting to
execute, a scheme to defraud any healthcare benefit program or
obtain, by means of false or fraudulent pretenses, representations
or promises, any of the money or property owned by, or under the
custody or control of, any healthcare benefit program, regardless
of the payer (e.g., public or private), knowingly and willfully
embezzling or stealing from a health care benefit program,
willfully obstructing a criminal investigation of a health care
offense and knowingly and willfully falsifying, concealing or
covering up by any trick or device a material fact or making any
materially false statements in connection with the delivery of, or
payment for, healthcare benefits, items or services relating to
healthcare matters;
●
HIPAA, as amended
by the Health Information Technology for Economic and Clinical
Health Act, and their implementing regulations, which impose
obligations on covered entities, including healthcare providers,
health plans, and healthcare clearinghouses, as well as their
respective business associates that create, receive, maintain or
transmit individually identifiable health information for or on
behalf of a covered entity, with respect to safeguarding the
privacy, security and transmission of individually identifiable
health information;
●
the federal
physician sunshine requirements under the Patient Protection and
Affordable Care Act (“Affordable Care Act”), which
require manufacturers of drugs, devices, biologics and medical
supplies to report annually to the Centers for Medicare &
Medicaid Services information related to payments and other
transfers of value provided to physicians and teaching hospitals,
and ownership and investment interests held by physicians and their
immediate family members; and
●
state law
equivalents of each of the above federal laws, such as
anti-kickback and false claims laws, which may apply to items or
services reimbursed by any third-party payer, including commercial
insurers; state laws that require pharmaceutical companies to
comply with the pharmaceutical industry’s voluntary
compliance guidelines and the applicable compliance guidance
promulgated by the federal government, or otherwise restrict
payments that may be provided to healthcare providers and other
potential referral sources; state laws that require drug
manufacturers to report information related to payments and other
transfers of value to healthcare providers or marketing
expenditures; and state laws governing the privacy and security of
health information in certain circumstances, many of which differ
from each other in significant ways and may not have the same
effect, thus complicating compliance efforts.
Because
of the breadth of these laws and the narrowness of the statutory
exceptions and safe harbors available, it is possible that some of
our business activities could be subject to challenge under one or
more of such laws. In addition, recent health care reform
legislation has strengthened these laws. For example, the
Affordable Care Act, among other things, amended the intent
requirement of the federal Anti-Kickback Statute and certain
criminal healthcare fraud statutes. A person or entity no longer
needs to have actual knowledge of the statute or specific intent to
violate it. In addition, the Affordable Care Act provided that the
government may assert that a claim including items or services
resulting from a violation of the federal Anti-Kickback Statute
constitutes a false or fraudulent claim for purposes of the federal
civil False Claims Act.
13
Achieving
and sustaining compliance with these laws may prove costly. In
addition, any action against us for violation of these laws, even
if we successfully defend against it, could cause us to incur
significant legal expenses and divert our management’s
attention from the operation of our business. If our operations are
found to be in violation of any of the laws described above or any
other governmental laws or regulations that apply to us, we may be
subject to penalties, including administrative, civil and criminal
penalties, damages, fines, disgorgement, the exclusion from
participation in federal and state healthcare programs, individual
imprisonment or the curtailment or restructuring of our operations,
any of which could adversely affect our ability to operate our
business and our financial results.
Generic Competition
Orange Book Listing.
In seeking approval for a drug through
an NDA, applicants are required to list with the FDA each patent
whose claims cover the applicant’s product. Upon approval of
a drug, the applicant identifies all patents that claim the
approved product’s active ingredient(s), the drug
product’s approved formulation, or an approved method of use
of the drug. Each of the identified patents are then published in
the FDA’s Approved Drug Products with Therapeutic Equivalence
Evaluations, commonly known as the Orange Book. Drugs listed in the
Orange Book can, in turn, be cited by potential generic competitors
in support of approval of an abbreviated new drug application
(“ANDA”). An ANDA provides for marketing of a drug
product that has the same active ingredients in the same strengths
and dosage form as the listed drug and has been shown through
bioequivalence testing, unless such testing is waived by the FDA,
as is the case with some injectable drug products, to be
therapeutically equivalent to the listed drug. Other than
bioequivalence testing, ANDA applicants are not required to
conduct, or submit results of, preclinical or clinical tests to
prove the safety or effectiveness of their drug product. Drugs
approved in this way are commonly referred to as “generic
equivalents” to the listed drug, and can usually be
substituted by pharmacists under prescriptions written for the
original listed drug.
The
ANDA applicant is required to certify to the FDA concerning any
patents listed for the approved product in the FDA’s Orange
Book. Specifically, the applicant must certify either that: (1) the
required patent information has not been filed (a Paragraph I
Certification); (2) the listed patent has expired (a Paragraph II
Certification); (3) the listed patent has not expired, but will
expire on a particular date and the generic approval is being
sought only after patent expiration (a Paragraph III
Certification); or (4) the listed patent is invalid, unenforceable,
or will not be infringed by the proposed generic product (a
Paragraph IV Certification). In certain circumstances, the ANDA
applicant may also elect to submit a “section (viii)”
statement instead of a Paragraph IV Certification, certifying that
its proposed ANDA label does not contain (or carves out) any
language regarding the patented method-of-use rather than certify
to a listed method-of-use patent. If the application contains only
Paragraph I or Paragraph II Certifications, the ANDA may be
approved as soon as FDA completes its review and concludes that all
approval requirements have been met. If the ANDA contains one or
more Paragraph III Certifications, the ANDA cannot not be approved
until each listed patent for which a Paragraph III Certification
was filed have expired.
If the
ANDA applicant has provided a Paragraph IV certification to the
FDA, the applicant must also send notice of the Paragraph IV
certification to the NDA holder and patent owner once the ANDA has
been accepted for filing by the FDA. The patent owner or NDA holder
may then commence a patent infringement lawsuit in response to the
notice of the Paragraph IV certification. The filing of a patent
infringement lawsuit within 45 days of the receipt of a Paragraph
IV certification automatically prevents the FDA from approving the
ANDA until the earlier of 30 months (the “30-month
stay”), expiration of the patent, settlement of the lawsuit
in which the patent owner admits that the patent is invalid or not
infringed by the ANDA product, or a decision in the infringement
case that holds the patent to be invalid or not infringed, or an
order by the court shortening the 30-month stay due to actions by
the patent holder to delay the litigation. In most circumstances,
NDA holder is only eligible for one 30-month stay against an
ANDA.
If a
patent infringement action is filed against an ANDA applicant, any
settlement of the litigation must be submitted to the Federal Trade
Commission (“FTC”). If the FTC believes the terms or
effects of the settlement are anticompetitive, FTC may bring an
antitrust enforcement action against the parties. Private parties
may also bring antitrust lawsuits against drug companies based on
such patent litigation settlements.
The
ANDA also will not be approved until any applicable non-patent
regulatory exclusivity listed in the Orange Book for the referenced
product has expired.
Regulatory Exclusivity.
Upon NDA approval of a new chemical
entity (“NCE”), which is a drug that contains no active
moiety that has been approved by the FDA in any other NDA, that
drug receives five years of marketing exclusivity during which the
FDA cannot receive for review any ANDA seeking approval of a
generic version of that drug. An ANDA containing a Paragraph IV
Certification may be received by FDA 4 years after the NCE
drug’s approval, but any 30-month stay that ensues would be
extended so that it expires seven and one half years after the NCE
approval date, subject to early termination by reason of a court
decision or settlement as described above.
14
Certain
changes to an NDA drug, such as the addition of a new indication to
the package insert, for which new clinical trials, conducted or
sponsored by the applicant are deemed by FDA to be essential to the
approval of the change, can be eligible for a three-year period of
exclusivity during which the FDA cannot approve an ANDA for a
generic drug that includes the change. An ANDA that contains a
section (viii) statement to a method of use patent may be approved
with labeling that omits the patented use before the use patent
expires. Generic drugs approved with such a labeling carve out may
be substituted by pharmacists for the original branded drug before
the method of use patent expires.
Section 505(b)(2) NDAs.
Most drug products obtain FDA
marketing approval pursuant to an NDA or an ANDA. A third
alternative is a special type of NDA, commonly referred to as a
505(b)(2) NDA, which enables the applicant to rely, in part, on the
FDA’s previous approval of a similar product, or published
literature, in support of its application.
505(b)(2)
NDAs often provide an alternate path to FDA approval for new or
improved formulations or new uses of previously approved products.
A 505(b)(2) NDA may be used where at least some of the information
required for approval comes from studies not conducted by, or for,
the applicant and for which the applicant has not obtained a right
of reference. If the 505(b)(2) applicant can establish that
reliance on the FDA’s previous approval is scientifically
appropriate, it may eliminate the need to conduct certain
preclinical or clinical studies of the new product. The FDA may
also require companies to perform additional studies or
measurements to support the change from the approved product. The
FDA may then approve the new product candidate for all, or some, of
the label indications for which the referenced product has been
approved, as well as for any new indication or conditions of use
sought by the Section 505(b)(2) applicant.
To the
extent that the Section 505(b)(2) applicant is relying on studies
conducted for an already approved product, the applicant is
required to certify to the FDA concerning any patents listed for
the approved product in the Orange Book to the same extent that an
ANDA applicant would. As a result, approval of a 505(b)(2) NDA can
be stalled until all the listed patents claiming the referenced
product have expired, until any non-patent exclusivity, such as
exclusivity for obtaining approval of a new chemical entity, listed
in the Orange Book for the referenced product has expired, and, in
the case of a Paragraph IV certification and subsequent patent
infringement suit, until the expiration of any 30-month stay,
subject to early termination of the stay as described
above.
Changing Legal and Regulatory Landscape
Periodically,
legislation is introduced in the U.S. Congress that could change
the statutory and regulatory provisions governing the approval,
manufacturing and marketing of our drugs. In addition, the FDCA,
FDA regulations and guidance are often revised or reinterpreted by
the FDA or the courts in ways that may significantly affect our
business and products. We cannot predict whether or when
legislation or court decisions impacting our business will be
enacted or issued, what FDA regulations, guidance or
interpretations may change, or what the impact of such changes, if
any, may be in the future.
Third-Party Reimbursements
Successful
sales of our proposed products in the United States and other
countries depend, in large part, on the availability of adequate
reimbursement from third-party payers such as governmental
entities, managed care organizations, health maintenance
organizations (“HMOs”), and private insurance plans.
Reimbursement by a third-party payer depends on a number of
factors, including the payer’s determination that the product
has been approved by the FDA for the indication for which the claim
is being made, that it is neither experimental nor investigational,
and that the use of the product is safe and efficacious, medically
necessary, appropriate for the specific patient and cost
effective.
Since
reimbursement by one payer does not guarantee reimbursement by
another, we or our licensees may be required to seek approval from
each payer individually. Seeking such approvals is a time-consuming
and costly process. Third-party payers routinely limit the products
that they will cover and the amount of money that they will pay
and, in many instances, are exerting significant pressure on
medical suppliers to lower their prices.
Payers
frequently employ a tiered system in reimbursing end users for
pharmaceutical products, with tier designation affecting copay or
deductible amounts. The only approved product for treating HSDD is
flibanserin, sold under the trade name Addyi®. There is
significant uncertainty concerning the extent and scope of
third-party reimbursement for products treating HSDD. Based on
third-party reimbursement for approved products treating ED, we
believe Vyleesi will be classified as a Tier 3 drug, so that
reimbursement will be limited for Vyleesi for treatment of
premenopausal women with HSDD, assuming the product is approved by
the FDA. Less than full reimbursement by governmental and other
third-party payers may adversely affect the market acceptance of
Vyleesi. Further, healthcare reimbursement systems vary from
country to country, and third-party reimbursement might not be made
available for Vyleesi for HSDD under any other reimbursement
system.
15
Manufacturing and Marketing
To be
successful, our proposed products will need to be manufactured in
commercial quantities under GMP prescribed by the FDA and at
acceptable costs. We do not have the facilities to manufacture any
of our proposed products under GMP. We intend to rely on
collaborators, licensees or contract manufacturers for the
commercial manufacture of our proposed products.
Our
Vyleesi product candidate is a synthetic peptide. While the
production process involves well-established technology, there are
few manufacturers capable of scaling up to commercial quantities
under GMP at acceptable costs. We identified one third-party
manufacturer for the production of Vyleesi, Lonza Ltd., and have
validated manufacturing of the Vyleesi drug substance under GMP
with that manufacturer. AMAG, as the exclusive licensee for North
America, has assumed responsibility for manufacturing Vyleesi drug
substance.
Our
Vyleesi product candidate will be a combination product,
incorporating both the Vyleesi drug substance and a delivery
device. AMAG, as the exclusive licensee for North America, has
assumed responsibility for manufacturing the Vyleesi combination
product. A third-party manufacturer, Ypsomed AG, makes the selected
autoinjector pen delivery device. A third-party contract
manufacturer, Catalent Belgium S.A., performs fill and finish of
the Vyleesi product candidate. We negotiated a long-term commercial
supply agreement with Catalent Belgium S.A., and have assigned this
agreement to AMAG.
Our
PL-3994 product candidate is a peptide mimetic molecule,
incorporating a proprietary amino acid mimetic structure and amino
acids. We identified a manufacturer that made the product in
quantities sufficient for Phase 1 and Phase 2, and are evaluating
commercial-scale manufacturers. Scaling up to commercial quantities
may involve production, purification, formulation and other
problems not present in the scale of manufacturing done to
date.
Our
MC1r and MC4r agonist product candidates are synthetic peptides,
which other than PL-8177, we have manufactured only at laboratory
scale. Other than PL-8177, we have not contracted with a
third-party manufacturer to produce these synthetic peptides for
either clinical trials or commercial purposes. While the production
process involves well-established technology, there are few
manufacturers capable of scaling up to commercial quantities under
GMP at acceptable costs. Additionally, scaling up to commercial
quantities may involve production, purification, formulation and
other problems not present in the scale of manufacturing done to
date.
The
failure of any manufacturer or supplier to comply with FDA
regulations, including GMP or medical device quality systems
regulations (“QSR”), or to supply the device component
or drug substance and services as agreed, would force us or our
licensees to seek alternative sources of supply and could interfere
with our and our licensees’ ability to deliver product on a
timely and cost-effective basis or at all. Establishing
relationships with new manufacturers or suppliers, any of whom must
be FDA-approved, is a time-consuming and costly
process.
Product Liability and Insurance
Our
business may be affected by potential product liability risks that
are inherent in the testing, manufacturing, marketing and use of
our proposed products. We have liability insurance providing $10
million coverage in the aggregate as to certain clinical trial
risks.
Employees
As of
September 11, 2018, we employed 19 people full time, of whom 13 are
engaged in research and development activities and 6 are engaged in
administration and management, and did not have any part-time
employees. While we have been successful in attracting skilled and
experienced scientific personnel, competition for personnel in our
industry is intense. None of our employees are covered by a
collective bargaining agreement. All of our employees have executed
confidentiality and intellectual property agreements. We consider
relations with our employees to be good.
We rely
on contractors and scientific consultants to work on specific
research and development programs. We also rely on independent
organizations, advisors and consultants to provide services,
including aspects of manufacturing, testing, preclinical
evaluation, clinical management, regulatory strategy and market
research. Our independent advisors, contractors and consultants
sign agreements that provide for confidentiality of our proprietary
information and that we have the rights to any intellectual
property developed while working for us.
Corporate Information
We were
incorporated under the laws of the State of Delaware on November
21, 1986 and commenced operations in the biopharmaceutical area in
1996. Our corporate offices are located at 4B Cedar Brook Drive,
Cranbury, New Jersey 08512 and our telephone number is (609)
495-2200. We maintain an Internet site at
www.palatin.com
, where among other
things, we make available free of charge on and through this
website our Forms 3, 4 and 5, annual reports on Form 10-K,
quarterly reports on Form 10-Q, current reports on Form 8-K, and
amendments to those reports filed or furnished pursuant to Section
13(a) or 15(d) and Section 16 of the Exchange Act as soon as
reasonably practicable after we electronically file such material
with, or furnish it to, the SEC. Our website and the information
contained in it or connected to it are not incorporated into this
Annual Report. The reference to our website is an inactive textual
reference only.
16
Risks Related to Our Financial Results and Need for
Financing
We have a history of substantial net losses, and expect to continue
to incur substantial net losses over the next few years, and we may
never achieve or maintain profitability.
As of
June 30, 2018, we had an accumulated deficit of $332.0 million. We
had $24.7 million of net income for the year ended June 30, 2018
and we may attain profitability in the fiscal year ending June 30,
2019 but only if the FDA approves the NDA on Vyleesi for HSDD. Even
if we are profitable in fiscal 2019, we may not sustain
profitability in future years, depending on numerous factors,
including whether and when development and sales milestones are
met, regulatory actions by the FDA and other regulatory bodies, the
performance of our licensees, and market acceptance of our
products.
We
expect to incur significant expenses as we continue our development
of natriuretic peptide and MC1r products. These expenses, among
other things, have had and will continue to have an adverse effect
on our stockholders’ equity, total assets and working
capital.
Since
2005 we have not had any products available for commercial sale and
have not received any revenues from the sale of our product
candidates. For the foreseeable future, we will have to fund all of
our operations and capital expenditures from license and contract
revenue under collaborative development agreements, existing cash
balances and outside sources of financing, which may not be
available on acceptable terms, if at all. Unless and until we
receive approval from the FDA or other equivalent regulatory
authorities outside the United States, we cannot sell our products
and will not have product revenues from them. We have devoted
substantially all of our efforts to research and development,
including preclinical and clinical trials. Because of the numerous
risks associated with developing drugs, we are unable to predict
the extent of future losses, whether or when any of our product
candidates will become commercially available, or when we will
become profitable, if at all.
We will need additional funding, including funding to complete
clinical trials for our product candidates other than Vyleesi,
which may not be available on acceptable terms, if at
all.
We
intend to focus future efforts on our product candidates other than
Vyleesi, including our MC1r and natriuretic peptide programs. As of
June 30, 2018, we had cash and cash equivalents of $38.0 million,
with current liabilities of $10.8 million. We believe we currently
have sufficient existing capital resources, together with proceeds
received from sales of common stock in our
“at-the-market” program (if any), to fund our planned
operations through at least September 30, 2019. We will need
additional funding to complete development activities and required
clinical trials for our other product candidates and development
programs and, if those clinical trials are successful (which we
cannot predict), to complete submission of required regulatory
applications to the FDA.
Until
the FDA approves Vyleesi for HSDD and marketing commences, if at
all, we will not have any recurring revenue. Even if Vyleesi is
approved and marketing commences, we cannot predict product sales
or our resulting royalties, so we may not have any source of
significant recurring revenue and may need to depend on financing
or partnering to sustain our operations. We may raise additional
funds through public or private equity or debt financings,
collaborative arrangements on our product candidates, or other
sources. However, such financing arrangements may not be available
on acceptable terms, or at all. To obtain additional funding, we
may need to enter into arrangements that require us to develop only
certain of our product candidates or relinquish rights to certain
technologies, product candidates and/or potential
markets.
If we
are unable to raise sufficient additional funds when needed, we may
be required to curtail operations significantly, cease clinical
trials and decrease staffing levels. We may seek to license, sell
or otherwise dispose of our product candidates, technologies and
contractual rights on the best possible terms available. Even if we
are able to license, sell or otherwise dispose of our product
candidates, technologies and contractual rights, it is likely to be
on unfavorable terms and for less value than if we had the
financial resources to develop or otherwise advance our product
candidates, technologies and contractual rights
ourselves.
17
Our
future capital requirements depend on many factors,
including:
●
our ability to
enter into one or more licensing or similar agreements for Vyleesi
outside of North America, Korea and China;
●
the timing of, and
the costs involved in, obtaining regulatory approvals for Vyleesi
for HSDD and our other product candidates;
●
the number and
characteristics of any additional product candidates we develop or
acquire;
●
the scope,
progress, results and costs of researching and developing our
future product candidates, and conducting preclinical and clinical
trials;
●
the cost of
commercialization activities if any future product candidates are
approved for sale, including marketing, sales and distribution
costs;
●
the cost of
manufacturing any future product candidates and any products we
successfully commercialize;
●
our ability to
establish and maintain strategic collaborations, licensing or other
arrangements and the terms and timing of such
arrangements;
●
the degree and rate
of market acceptance of any future approved products;
●
the emergence,
approval, availability, perceived advantages, relative cost,
relative safety and relative efficacy of alternative and competing
products or treatments;
●
any product
liability or other lawsuits related to our products;
●
the expenses needed
to attract and retain skilled personnel;
●
the costs involved
in preparing, filing, prosecuting, maintaining, defending and
enforcing patent claims, including litigation costs and the outcome
of such litigation; and
●
the timing, receipt
and amount of sales of, or royalties on, future approved products,
if any.
We have a limited operating history upon which to base an
investment decision.
Our
operations are primarily focused on acquiring, developing and
securing our proprietary technology, conducting preclinical and
clinical studies and formulating and manufacturing, through
contract manufacturers, our principal product candidates on a
small-scale basis. These operations provide a limited basis for
stockholders to assess our ability to commercialize our product
candidates.
While
we have completed Phase 3 clinical trials on Vyleesi for HSDD in
premenopausal women, and with AMAG have filed an NDA on Vyleesi for
HSDD with the FDA, we have not yet demonstrated our ability to
perform the functions necessary for the successful
commercialization of any of our current product candidates. The
successful commercialization of our product candidates will require
us to perform a variety of functions, including:
●
continuing to
conduct preclinical development and clinical trials;
●
participating in
regulatory approval processes;
●
formulating and
manufacturing products, or having third parties formulate and
manufacture products;
●
post-approval
monitoring and surveillance of our products;
●
conducting sales
and marketing activities, either alone or with a partner;
and
●
obtaining
additional capital.
If we
are unable to obtain regulatory approval of any of our product
candidates, to successfully commercialize any products for which we
receive regulatory approval or to obtain additional capital, we may
not be able to recover our investment in our development
efforts.
The
clinical and commercial success of our product candidates will
depend on a number of factors, including the
following:
●
the ability to
raise additional capital on acceptable terms, or at
all;
●
timely completion
of our clinical trials, which may be significantly slower or cost
more than we currently anticipate and will depend substantially
upon the performance of third-party contractors;
●
whether we are
required by the FDA or similar foreign regulatory agencies to
conduct additional clinical trials beyond those planned to support
the approval and commercialization of our product candidates or any
future product candidates;
●
acceptance of our
proposed indications and primary endpoint assessments relating to
the proposed indications of our product candidates by the FDA and
similar foreign regulatory authorities;
18
●
our ability to
demonstrate to the satisfaction of the FDA and similar foreign
regulatory authorities, the safety and efficacy of our product
candidates or any future product candidates;
●
the prevalence,
duration and severity of potential side effects experienced with
our product candidates or future approved products, if
any;
●
the timely receipt
of necessary marketing approvals from the FDA and similar foreign
regulatory authorities;
●
achieving and
maintaining, and, where applicable, ensuring that our third-party
contractors achieve and maintain, compliance with our contractual
obligations and with all regulatory requirements applicable to our
product candidates or any future product candidates or approved
products, if any;
●
the ability of
third parties with whom we contract to manufacture clinical trial
and commercial supplies of our product candidates or any future
product candidates, remain in good standing with regulatory
agencies and develop, validate and maintain commercially viable
manufacturing processes that are compliant the FDA’s current
Good Manufacturing Practices (“GMP”)
regulations;
●
a continued
acceptable safety profile and efficacy during clinical development
and following approval of our product candidates or any future
product candidates;
●
our ability to
successfully commercialize our product candidates or any future
product candidates in the United States and internationally, if
approved for marketing, sale and distribution in such countries and
territories, whether alone or in collaboration with
others;
●
acceptance by
physicians and patients of the benefits, safety and efficacy of our
product candidates or any future product candidates, if approved,
including relative to alternative and competing
treatments;
●
our and our
partners’ ability to establish and enforce intellectual
property rights in and to our product candidates or any future
product candidates;
●
our and our
partners’ ability to avoid third-party patent interference or
intellectual property infringement claims; and
●
our ability to
develop, in-license or acquire additional product candidates or
commercial-stage products that we believe can be successfully
developed and commercialized.
If we
do not achieve one or more of these factors, many of which are
beyond our control, in a timely manner or at all, we could
experience significant delays or an inability to obtain regulatory
approvals or commercialize our product candidates. Even if
regulatory approvals are obtained, we may never be able to
successfully commercialize any of our product candidates.
Accordingly, we cannot assure you that we will be able to generate
sufficient revenue through the sale of our product candidates or
any future product candidates to continue our
business.
Raising additional capital may cause dilution to existing
shareholders, restrict our operations or require us to relinquish
rights.
We may
seek the additional capital necessary to fund our operations
through public or private equity offerings, collaboration
agreements, debt financings or licensing arrangements. To the
extent that we raise additional capital through the sale of equity
or convertible debt securities, existing shareholders’
ownership interests will be diluted and the terms may include
liquidation or other preferences that adversely affect their rights
as a shareholder. Debt financing, if available, may involve
agreements that include covenants limiting or restricting our
ability to take specific actions such as incurring additional debt,
making capital expenditures or declaring dividends. If we raise
additional funds through collaborations and licensing arrangements
with third parties, we may have to relinquish valuable rights to
our technologies or product candidates, or grant licenses on terms
that are not favorable to us.
Risks Related to Our Business, Strategy and Industry
We are substantially dependent on the clinical and commercial
success of our product candidates, primarily our lead product
candidate, Vyleesi for HSDD, but we and our licensees may never
obtain regulatory approval for or successfully commercialize
Vyleesi for HSDD or any of our product candidates.
To
date, we have invested most of our efforts and financial resources
in the research and development of Vyleesi for HSDD, which is
currently our lead product candidate. We licensed all rights to
Vyleesi in North America to AMAG, and were contractually obligated
to complete development and regulatory activities necessary to file
an NDA for Vyleesi for HSDD in the United States, for which AMAG
reimbursed us for $25 million of expenses we incurred less certain
other expenses directly paid or to be paid by AMAG. We licensed
rights to Vyleesi for China to Fosun and licensed rights to Vyleesi
for Korea to Kwangdong, but depending on the regulatory approval
pathway utilized in China or Korea, approval in China or Korea may
be contingent on approval of an NDA for Vyleesi for HSDD in the
United States.
19
Our
near-term prospects, including our ability to finance our company
and generate revenue, will depend heavily on the successful
development, regulatory approval and commercialization of Vyleesi
for HSDD, as well as any future product candidates. The clinical
and commercial success of our product candidates will depend on a
number of factors, including the following:
●
timely completion
of, or need to conduct additional clinical trials and studies, for
our product candidates, which may be significantly slower or cost
more than we currently anticipate and will depend substantially
upon the accurate and satisfactory performance of third-party
contractors;
●
the ability to
demonstrate to the satisfaction of the FDA the safety and efficacy
of Vyleesi for HSDD or any future product candidates through
clinical trials;
●
whether we or our
licensees are required by the FDA or other similar foreign
regulatory agencies to conduct additional clinical trials to
support the approval of Vyleesi for HSDD or any future product
candidates;
●
the acceptance of
parameters for regulatory approval, including our proposed
indication, primary endpoint assessment and primary endpoint
measurement, relating to our lead indications of Vyleesi for
HSDD;
●
the success of our
licensees in educating physicians and patients about the benefits,
administration and use of Vyleesi for HSDD, if
approved;
●
the prevalence and
severity of adverse events experienced with Vyleesi for HSDD or any
future product candidates or approved products;
●
the adequacy and
regulatory compliance of the autoinjector device, supplied by an
unaffiliated third party, to be used as part of the Vyleesi
combination product;
●
the timely receipt
of necessary marketing approvals from the FDA and similar foreign
regulatory authorities;
●
our ability to
raise additional capital on acceptable terms to achieve our
goals;
●
achieving and
maintaining compliance with all regulatory requirements applicable
to Vyleesi for HSDD or any future product candidates or approved
products;
●
the availability,
perceived advantages, relative cost, relative safety and relative
efficacy of alternative and competing treatments;
●
the effectiveness
of our own or our future potential strategic collaborators’
marketing, sales and distribution strategy and
operations;
●
the ability to
manufacture clinical trial supplies of Vyleesi for HSDD or any
future product candidates and to develop, validate and maintain a
commercially viable manufacturing process that is compliant with
current GMP;
●
the ability of AMAG
to successfully commercialize Vyleesi for HSDD;
●
our ability to
successfully commercialize any future product candidates, if
approved for marketing and sale, whether alone or in collaboration
with others;
●
our ability to
enforce our intellectual property rights in and to Vyleesi for HSDD
or any future product candidates;
●
our ability to
avoid third-party patent interference or intellectual property
infringement claims;
●
acceptance of
Vyleesi for HSDD or any future product candidates, if approved, as
safe and effective by patients and the medical community;
and
●
a continued
acceptable safety profile and efficacy of Vyleesi for HSDD or any
future product candidates following approval.
If we
fail to satisfy any one of these prerequisites to our commercial
success, many of which are beyond our control, in a timely manner
or at all, we could experience significant delays or an inability
to successfully commercialize our product candidates. Accordingly,
we cannot assure you that we will be able to generate sufficient
revenue through the sale of Vyleesi for HSDD by AMAG, Fosun and
Kwangdong or through the sale of any future product candidate to
continue our business. In addition to preventing us from executing
our current business plan, any delays in our clinical trials, or
inability to successfully commercialize our products could impair
our reputation in the industry and the investment community and
could hinder our ability to fulfill our existing contractual
commitments. As a result, our share price would likely decline
significantly, and we would have difficulty raising necessary
capital for future projects.
20
We do not control the development or commercialization of Vyleesi
in North America, which is licensed to AMAG, and as a result we may
not realize a significant portion of the potential value of the
license arrangement with AMAG.
Although
we conducted development work to support an NDA for Vyleesi in
HSDD, the license agreement with AMAG for Vyleesi in North America
limits our control over development activities, including
regulatory approvals, and we do not have any direct control over
commercialization efforts. AMAG may abandon further development of
Vyleesi in its licensed territory, including terminating the
agreement, for any reason, including a change of priorities within
AMAG or lack of success in ancillary clinical trials necessary to
obtain regulatory approvals. Because the potential value of the
license arrangement with AMAG is contingent upon the successful
development and commercialization of Vyleesi in the United States
and other countries in the licensed territory, the ultimate value
of this license will depend on the efforts of AMAG. If AMAG does
not succeed in obtaining regulatory approval of Vyleesi in the
United States for any reason, does not succeed in securing market
acceptance of Vyleesi in the United States, or elects for any
reason to discontinue marketing of Vyleesi, we will be unable to
realize the potential value of this arrangement and would
experience significant delays or an inability to successfully
commercialize Vyleesi.
Production and supply of Vyleesi depend on contract manufacturers
over whom neither we nor AMAG have any control, and we may not have
adequate supplies of Vyleesi.
We do
not have the facilities to manufacture the Vyleesi active drug
ingredient or the autoinjector pen component of the Vyleesi
combination product, or to fill, assemble and package the Vyleesi
combination product. AMAG, our exclusive licensee for North America
for Vyleesi, has assumed responsibility for contract manufacturing.
The contract manufacturers must perform these manufacturing
activities in a manner that complies with FDA regulations.
AMAG’s ability to control third-party compliance with FDA
requirements is limited to contractual remedies and rights of
inspection. The manufacturers of approved products and their
manufacturing facilities will be subject to ongoing review and
periodic inspections by the FDA and other authorities where
applicable, and must comply with regulatory requirements, including
FDA regulations concerning GMP. Failure of third-party
manufacturers to comply with GMP, medical device quality system
regulations, or other FDA requirements may result in enforcement
action by the FDA. Failure to conduct their activities in
compliance with FDA regulations could delay Vyleesi development
programs or negatively impact AMAG’s ability to receive FDA
approval of the Vyleesi potential products or continue marketing
Vyleesi products if they are approved. Establishing relationships
with new suppliers, who must be FDA-approved, is a time-consuming
and costly process. If AMAG is not able to obtain adequate supplies
of Vyleesi, it will be difficult for AMAG to develop Vyleesi and
compete effectively.
Our product candidates other than Vyleesi are still in the early
stages of development and remain subject to clinical testing and
regulatory approval. If we are unable to successfully develop and
test our product candidates, we will not be
successful.
Our
product candidates are at various stages of research and
development, will require regulatory approval, and may never be
successfully developed or commercialized. Our product candidates
will require significant further research, development and testing
before we can seek regulatory approval to market and sell them. We
must demonstrate that our product candidates are safe and effective
for use in patients in order to receive regulatory approval for
commercial sale. Preclinical studies in animals, using various
doses and formulations, must be performed before we can begin human
clinical trials. Even if we obtain favorable results in the
preclinical studies, the results in humans may be different.
Numerous small-scale human clinical trials may be necessary to
obtain initial data on a product candidate’s safety and
efficacy in humans before advancing to large scale human clinical
trials. We face the risk that the results of our trials in later
phases of clinical trials may be inconsistent with those obtained
in earlier phases. Adverse or inconclusive results could delay the
progress of our development programs and may prevent us from filing
for regulatory approval of our product candidates. Additional
factors that could inhibit the successful development of our
product candidates include:
●
lack of
effectiveness of any product candidate during clinical trials or
the failure of our product candidates to meet specified
endpoints;
●
failure to design
appropriate clinical trial protocols;
●
uncertainty
regarding proper dosing;
●
inability to
develop or obtain a supplier for an autoinjector device that meets
the FDA’s medical device requirements;
●
insufficient data
to support regulatory approval;
●
inability or
unwillingness of medical investigators to follow our clinical
protocols;
●
inability to add a
sufficient number of clinical trial sites; or
●
the availability of
sufficient capital to sustain operations and clinical
trials.
21
You
should evaluate us in light of these uncertainties, difficulties
and expenses commonly experienced by early stage biopharmaceutical
companies, as well as unanticipated problems and additional costs
relating to:
●
product approval or
clearance;
●
regulatory
compliance;
●
good manufacturing
practices;
●
intellectual
property rights;
●
product
introduction; and
●
marketing and
competition.
If clinical trials for our product candidates are prolonged or
delayed, we may be unable to commercialize our product candidates
on a timely basis, which would require us to incur additional costs
and delay our receipt of any revenue from potential product
sales.
We may
be unable to commercialize our product candidates on a timely basis
due to unexpected delays in our human clinical trials. Potential
delaying events include:
●
discovery of
serious or unexpected toxicities or side effects experienced by
study participants or other safety issues;
●
slower than
expected rates of subject recruitment and enrollment rates in
clinical trials resulting from numerous factors, including the
prevalence of other companies’ clinical trials for their
product candidates for the same indication, or clinical trials for
indications for which patients do not as commonly seek
treatment;
●
difficulty in
retaining subjects who have initiated a clinical trial but may
withdraw at any time due to adverse side effects from the therapy,
insufficient efficacy, fatigue with the clinical trial process or
for any other reason;
●
difficulty in
obtaining institutional review board (“IRB”) approval
for studies to be conducted at each site;
●
delays in
manufacturing or obtaining, or inability to manufacture or obtain,
sufficient quantities of materials for use in clinical
trials;
●
inadequacy of or
changes in our manufacturing process or the product formulation or
method of delivery;
●
changes in
applicable laws, regulations and regulatory policies;
●
delays or failure
in reaching agreement on acceptable terms in clinical trial
contracts or protocols with prospective contract research
organizations (“CROs”), clinical trial sites and other
third-party contractors;
●
failure of our CROs
or other third-party contractors to comply with contractual and
regulatory requirements or to perform their services in a timely or
acceptable manner;
●
failure by us, our
employees, our CROs or their employees or any partner with which we
may collaborate or their employees to comply with applicable FDA or
other regulatory requirements relating to the conduct of clinical
trials or the handling, storage, security and recordkeeping for
drug, medical device and biologic products;
●
delays in the
scheduling and performance by the FDA of required inspections of
us, our CROs, our suppliers, or our clinical trial sites, and
violations of law or regulations discovered in the course of FDA
inspections;
●
scheduling
conflicts with participating clinicians and clinical institutions;
or
●
difficulty in
maintaining contact with subjects during or after treatment, which
may result in incomplete data.
Any of
these events or other delaying events, individually or in the
aggregate, could delay the commercialization of our product
candidates and have a material adverse effect on our business,
results of operations and financial condition.
We may not be able to secure and maintain relationships with
research institutions and other organizations to conduct our
clinical trials.
We rely
on research institutions and other organizations to conduct our
clinical trials, and we therefore have limited control over the
timing and cost of clinical trials and our ability to recruit
subjects. If we are unable to reach agreements with suitable
research institutions or organizations on acceptable terms, or if
any such agreement is terminated, we may be unable to quickly
replace the research institution or organization with another
qualified institution or organization on acceptable terms. We may
not be able to secure and maintain suitable research institutions
or organizations to conduct our clinical trials.
22
Even if our product candidates receive regulatory approval, they
may never achieve market acceptance, in which case our business,
financial condition and results of operation will be materially
adversely affected.
Regulatory
approval for the marketing and sale of any of our product
candidates does not assure the product’s commercial success.
Any approved product will compete with other products manufactured
and marketed by major pharmaceutical and other biotechnology
companies. If any of our product candidates are approved by the FDA
and do not achieve adequate market acceptance, our business,
financial condition and results of operations will be materially
adversely affected. The degree of market acceptance of any such
product will depend on a number of factors, including:
●
perceptions by
members of the healthcare community, including physicians, about
the safety and effectiveness of any such product;
●
cost-effectiveness
relative to competing products and technologies;
●
availability of
reimbursement for our products from third-party payers such as
health insurers, health maintenance organizations
(“HMOs”) and government programs such as Medicare and
Medicaid; and
●
advantages over
alternative treatment methods.
There
is one FDA approved product for treatment of HSDD, flibanserin,
which is sold under the trade name Addyi®, and started
marketing in October 2015. Because flibanserin was not consistently
marketed since October 2015, and ownership of the product has
changed, the actual market size and market dynamics for HSDD are
unknown, and there remains uncertainty concerning the extent and
scope of third-party reimbursement for products treating HSDD.
While we believe that an on-demand drug for HSDD has competitive
advantages compared to chronic or daily use hormones and other
drugs, we may not be able to realize this perceived advantage in
the market. Vyleesi is administered by subcutaneous injection.
While the single-use, disposable autoinjector pen format is
designed to maximize market acceptability, Vyleesi as a
subcutaneous injectable drug for HSDD may never achieve significant
market acceptance. In addition, we believe reimbursement of Vyleesi
from third-party payers such as health insurers, HMOs or other
third-party payers of healthcare costs will be similar to
reimbursement for erectile dysfunction (“ED”) drugs,
and that the ultimate user may pay a substantial part of the cost
of Vyleesi for HSDD. If the market opportunity for Vyleesi is
smaller than we anticipate, it may also be difficult for us to find
marketing partners and, as a result, we may be unable to generate
revenue and business from Vyleesi. If Vyleesi for HSDD does not
achieve adequate market acceptance at an acceptable price point,
our business, financial condition and results of operations will be
materially adversely affected.
Even if our product candidates receive regulatory approval in the
United States, we may never receive approval or commercialize our
products outside of the United States.
In
order to market any products outside of the United States, we must
establish and comply with numerous and varying regulatory
requirements of other countries regarding safety and efficacy.
Approval procedures vary among countries and can involve additional
product testing and additional administrative review periods. The
time required to obtain approval in other countries might differ
from that required to obtain FDA approval. The regulatory approval
process in other countries may include all of the risks detailed
above regarding FDA approval in the United States as well as other
risks. Regulatory approval in one country does not ensure
regulatory approval in another, but a failure or delay in obtaining
regulatory approval in one country may have a negative effect on
the regulatory process in others. Failure to obtain regulatory
approval in other countries or any delay or setbacks in obtaining
such approval would impair our ability to develop foreign markets
for our product candidates and may have a material adverse effect
on our results of operations and financial condition.
If side effects emerge that can be linked to our product candidates
(either while they are in development or after they are approved
and on the market), we may be required to perform lengthy
additional clinical trials, change the labeling of any such
products, or withdraw such products from the market, any of which
would hinder or preclude our ability to generate
revenues.
If we
identify side effects or other problems occur in future clinical
trials, we may be required to terminate or delay clinical
development of the product candidate. Furthermore, even if any of
our product candidates receive marketing approval, as greater
numbers of patients use a drug following its approval, if the
incidence of side effects increases or if other problems are
observed after approval that were not seen or anticipated during
pre-approval clinical trials, a number of potentially significant
negative consequences could result, including:
●
regulatory
authorities may withdraw their approval of the
product;
●
we may be required
to reformulate such products or change the way the product is
manufactured;
●
we may become the
target of lawsuits, including class action suits; and
●
our reputation in
the market place may suffer resulting in a significant drop in the
sales of such products.
23
Any of
these events could substantially increase the costs and expenses of
developing, commercializing and marketing any such product
candidates or could harm or prevent sales of any approved
products.
The number of subjects in our study pools in our clinical trials
may be deemed by regulators to be too small, which could cause
unanticipated delays or higher than anticipated costs.
Our
clinical trials have been conducted on a pool of subjects that is
structured for such research. Nevertheless, there is the
possibility that for statistical reasons, the pool of subjects may
be determined by the FDA or another regulatory body to be too small
to verify statistical significance. In such a case, the conclusions
from the previous trials will need to be established with at least
another set of clinical trials testing the relevant issue. Due to
the need to find new subjects for any additional clinical trials
and the limited pool from which such subjects can be selected, any
such determination by the FDA could result in a delay in obtaining
FDA approval or require additional financial
expenditures.
We may not be able to keep up with the rapid technological change
in the biotechnology and pharmaceutical industries, which could
make any future approved products obsolete and reduce our
revenue.
Biotechnology
and related pharmaceutical technologies have undergone and continue
to be subject to rapid and significant change. Our future will
depend in large part on our ability to maintain a competitive
position with respect to these technologies. Our competitors may
render our technologies obsolete by advances in existing
technological approaches or the development of new or different
approaches, potentially eliminating the advantages in our drug
discovery process that we believe we derive from our research
approach and proprietary technologies. In addition, any future
products that we develop, including our clinical product
candidates, may become obsolete before we recover expenses incurred
in developing those products, which may require that we raise
additional funds to continue our operations.
Competing products and technologies may make our proposed products
noncompetitive.
Flibanserin,
a daily-use oral drug sold under the trade name Addyi®, has
been approved by the FDA for HSDD in premenopausal women. There are
other products being developed for HSDD and other FSD indications,
including a number of oral combination drugs, some of which
incorporate testosterone, antidepressants or PDE-5 inhibitors.
There is competition to develop drugs for treatment of HSDD and FSD
in both premenopausal and postmenopausal patients. Our Vyleesi drug
product is intended to be administered by subcutaneous injection,
and an on demand drug product for the same indication which
utilizes another route of administration, such as a conventional
oral drug product, may make subcutaneous Vyleesi
noncompetitive.
There
are several products approved for use in treatment of obesity and
related indications, and a number of other products being developed
for treatment of obesity, including products in clinical trials.
There is intense competition to develop drugs for treatment of
obesity and related indications.
There
are a number of products approved for use in treating inflammatory
diseases and indications, and other products are being developed,
including products in clinical trials. The dry eye disease and
ocular inflammatory disease markets are highly competitive, with a
number of products reported in late stage clinical
trials.
We are
aware of one recombinant NPR product for acutely decompensated
congestive heart failure approved and marketed in the United
States, and another recombinant NPR product approved and marketed
in Japan. Clinical trials on other natriuretic peptide products are
being conducted in the United States. In addition, other products
for treatment of heart failure are either currently being marketed
or in development, including a combination drug which increases
active levels of ANP.
As
discussed above, the biopharmaceutical industry is highly
competitive. We are likely to encounter significant competition
with respect to Vyleesi, MC1r product candidates, MC4r product
candidates and NPR product candidates. Most of our competitors have
substantially greater financial and technological resources than we
do. Many of them also have significantly greater experience in
research and development, marketing, distribution and sales than we
do. Accordingly, our competitors may succeed in developing,
marketing, distributing and selling products and underlying
technologies more rapidly than we can. These competitive products
or technologies may be more effective and useful or less costly
than Vyleesi or our MC1r product candidates, MC4r product
candidates and NPR product candidates. In addition, academic
institutions, hospitals, governmental agencies and other public and
private research organizations are also conducting research and may
develop competing products or technologies on their own or through
strategic alliances or collaborative arrangements.
24
We rely on third parties over whom we have no control to conduct
preclinical studies, clinical trials and other research for our
product candidates and their failure to timely perform their
obligations could significantly harm our product
development.
We have
limited research and development staff and do not have dedicated
research or development facilities. We rely on third parties and
independent contractors, such as researchers at CROs and
universities, in certain areas that are particularly relevant to
our research and product development plans. We engage such
researchers to conduct our preclinical studies, clinical trials and
associated tests. These outside contractors are not our employees
and may terminate their engagements with us at any time. In
addition, we have limited control over the resources that these
contractors devote to our programs and they may not assign as great
a priority to our programs or pursue them as diligently as we would
if we were undertaking such programs ourselves. There is also
competition for these relationships, and we may not be able to
maintain our relationships with our contractors on acceptable
terms. If our third-party contractors do not carry out their duties
under their agreements with us, fail to meet expected deadlines or
fail to comply with appropriate standards for preclinical or
clinical research, our ability to develop our product candidates
and obtain regulatory approval on a timely basis, if at all, may be
materially adversely affected.
Production and supply of our product candidates depend on contract
manufacturers over whom we have no control, with the risk that we
may not have adequate supplies of our product candidates or
products.
We do
not have the facilities to manufacture our early stage potential
products such as PL-8177, PL-8331, PL-3994 and other natriuretic
peptide and melanocortin receptor agonist compounds for use in
preclinical studies and clinical trials. Contract manufacturers
must perform these manufacturing activities in a manner that
complies with FDA regulations. Our ability to control third-party
compliance with FDA requirements is limited to contractual remedies
and rights of inspection. The manufacturers of our potential
products and their manufacturing facilities will be subject to
continual review and periodic inspections by the FDA and other
authorities where applicable, and must comply with ongoing
regulatory requirements, including FDA regulations concerning GMP.
Failure of third-party manufacturers to comply with GMP, medical
device QSR, or other FDA requirements may result in enforcement
action by the FDA. Failure to conduct their activities in
compliance with FDA regulations could delay our development
programs or negatively impact our ability to receive FDA approval
of our potential products. Establishing relationships with new
suppliers, who must be FDA-approved, is a time-consuming and costly
process.
If we are unable to establish sales and marketing capabilities
within our organization or enter into and maintain agreements with
third parties to market and sell our product candidates, we may be
unable to generate product revenue.
We do
not currently have any experience in sales, marketing and
distribution of pharmaceutical products. We will need to establish
sales and marketing capabilities within our organization or
establish and maintain agreements with third parties to market and
sell our product candidates. We do not have marketing partners for
any of our products other than Vyleesi, for which we have marketing
partners in North America, China and Korea. If any of our other
products are approved by the FDA or other regulatory authorities,
we must either develop marketing, distribution and selling capacity
and expertise, which will be costly and time consuming, or enter
into agreements with other companies to provide these capabilities.
We may not be able to enter into suitable agreements on acceptable
terms, if at all. Engaging a third party to perform these services
could delay the commercialization of any of our product candidates,
if approved for commercial sale. If we are unable to establish
adequate sales, marketing and distribution capabilities, whether
independently or with third parties, we may not be able to generate
product revenue and our business would suffer. In addition, if we
enter into arrangements with third parties to perform sales,
marketing and distribution services, our product revenues are
likely to be lower than if we could market and sell any products
that we develop ourselves.
We will need to hire additional employees in order to commercialize
our product candidates in the future. Any inability to manage
future growth could harm our ability to commercialize our product
candidates, increase our costs and adversely impact our ability to
compete effectively.
In
order to commercialize our product candidates, we will need to hire
experienced sales and marketing personnel to sell and market those
product candidates we decide to commercialize, and we will need to
expand the number of our managerial, operational, financial and
other employees to support commercialization. Competition exists
for qualified personnel in the biopharmaceutical
field.
Future
growth will impose significant added responsibilities on members of
management, including the need to identify, recruit, maintain and
integrate additional employees. Our future financial performance
and our ability to commercialize our product candidates and to
compete effectively will depend, in part, on our ability to manage
any future growth effectively.
25
Our ability to achieve revenues from the sale of our products in
development will depend, in part, on our ability to obtain adequate
reimbursement from Medicare, Medicaid, private insurers and other
healthcare payers.
Our
ability to successfully commercialize our products in development
will depend, in significant part, on the extent to which we or our
marketing partners can obtain reimbursement for our products and
also reimbursement at appropriate levels for the cost of our
products. Obtaining reimbursement from governmental payers,
insurance companies, HMOs and other third-party payers of
healthcare costs is a time-consuming and expensive process. There
is no guarantee that our products will ultimately be reimbursed.
There is significant uncertainty concerning third-party
reimbursement for the use of any pharmaceutical product
incorporating new technology and third-party reimbursement might
not be available for our proposed products once approved, or if
obtained, might not be adequate.
There
is significant uncertainty concerning the extent and scope of
third-party reimbursement for products treating HSDD and other
forms of FSD. Based on third-party reimbursement for approved
products treating ED, we believe Vyleesi for HSDD will be
classified as a Tier 3 drug, so that reimbursement will be limited
for Vyleesi for treatment of premenopausal women with HSDD,
assuming the product is approved by the FDA. If we are able to
obtain reimbursement, continuing efforts by governmental and
third-party payers to contain or reduce costs of healthcare may
adversely affect our future revenues and ability to achieve
profitability. Third-party payers are increasingly challenging the
prices charged for diagnostic and therapeutic products and related
services. Reimbursement from governmental payers is subject to
statutory and regulatory changes, retroactive rate adjustments,
administrative rulings and other policy changes, all of which could
materially decrease the range of products for which we are
reimbursed or the rates of reimbursement by government payers. In
addition, recent legislation reforming the healthcare system may
result in lower prices or the actual inability of prospective
customers to purchase our products in development. The cost
containment measures that healthcare payers and providers are
instituting and the effect of any healthcare reform could
materially and adversely affect our ability to operate profitably.
Furthermore, even if reimbursement is available, it may not be
available at price levels sufficient for us to realize a positive
return on our investment, which would have a material adverse
effect on our business, financial condition and results of
operations.
Even if we receive regulatory approval for our products in Europe,
we may not be able to secure adequate pricing and reimbursement in
Europe for us or any strategic partner to achieve
profitability.
Even if
one or more of our products are approved in Europe, we may be
unable to obtain appropriate pricing and reimbursement for such
products. In most European markets, demand levels for healthcare in
general and for pharmaceuticals in particular are principally
regulated by national governments. Therefore, pricing and
reimbursement for our products will have to be negotiated on a
“Member State by Member State” basis according to
national rules, as there does not exist a centralized European
process. As each Member State has its own national rules governing
pricing control and reimbursement policy for pharmaceuticals, there
are likely to be uncertainties attaching to the review process, and
the level of reimbursement that national governments are prepared
to accept. In the current economic environment, governments and
private payers or insurers are increasingly looking to contain
healthcare costs, including costs on drug therapies. If we are
unable to obtain adequate pricing and reimbursement for our
products in Europe, we or a potential strategic partner or
collaborator may not be able to cover the costs necessary to
manufacture, market and sell the product, limiting or preventing
our ability to achieve profitability.
We may incur substantial liabilities and may be required to limit
commercialization of our products in response to product liability
lawsuits.
The
testing and marketing of medical products entails an inherent risk
of product liability. If we cannot successfully defend ourselves
against product liability claims, we may incur substantial
liabilities or be required to limit commercialization of our
products or cease clinical trials. Our inability to obtain
sufficient product liability insurance at an acceptable cost to
protect against potential product liability claims could prevent or
inhibit the commercialization of pharmaceutical products we
develop, alone or with corporate collaborators. We currently carry
$10 million liability insurance in the aggregate as to certain
clinical trial risks, but we do not have and have not obtained
quotations for commercial product liability insurance. We, or any
corporate collaborators, may not in the future be able to obtain
insurance at a reasonable cost or in sufficient amounts, if at all.
Even if our agreements with any future corporate collaborators
entitle us to indemnification against losses, such indemnification
may not be available or adequate should any claim
arise.
26
Our internal computer systems, or those of our third-party
contractors or consultants, may fail or suffer security breaches,
which could result in a material disruption of our product
development programs.
In the
ordinary course of our business, we collect, store and transmit
confidential information. Despite the implementation of security
measures, our internal computer systems and those of our
third-party contractors and consultants are vulnerable to damage
from computer viruses, unauthorized access, natural disasters,
terrorism, war and telecommunication and electrical failures. We
rely on industry accepted measures and technology to secure
confidential and proprietary information maintained on our computer
systems. However, these measures and technology may not adequately
prevent security breaches. While we do not believe that we have
experienced any such system failure, accident, or security breach
to date, if such an event were to occur and cause interruptions in
our operations, it could result in a loss of clinical trial data
for our product candidates that could result in delays in our
regulatory approval efforts and significantly increase our costs to
recover or reproduce the data. Cyberattacks are increasing in their
frequency, sophistication and intensity. Cyberattacks could include
the deployment of harmful malware, denial-of-service attacks,
social engineering and other means to affect service reliability
and threaten the confidentiality, integrity and availability of
information. Significant disruptions of our information technology
systems or security breaches could adversely affect our business
operations and/or result in the loss, misappropriation, and/or
unauthorized access, use or disclosure of, or the prevention of
access to, confidential information (including trade secrets or
other intellectual property, proprietary business information and
personal information), and could result in financial, legal,
business and reputational harm to us. To the extent that any
disruption or security breach results in a loss of or damage to our
data or applications or other data or applications relating to our
technology, intellectual property, research and development or
product candidates, or inappropriate disclosure of confidential or
proprietary information, we could incur liabilities and the further
development of our product candidates could be
delayed.
We may be subject to claims that our employees, consultants or
independent contractors have wrongfully used or disclosed
confidential information of third parties or that our employees
have wrongfully used or disclosed alleged trade secrets of their
former employers.
We may
in the future employ individuals who were previously employed at
universities or other biotechnology or pharmaceutical companies,
including our competitors or potential competitors. Although we try
to ensure that our employees, consultants and independent
contractors do not use the proprietary information or know-how of
others in their work for us, we may be subject to claims that we or
our employees, consultants or independent contractors have
inadvertently or otherwise used or disclosed intellectual property,
including trade secrets or other proprietary information, of any of
our employee’s former employer or other third parties.
Litigation may be necessary to defend against these claims. If we
fail in defending any such claims, in addition to paying monetary
damages, we may lose valuable intellectual property rights or
personnel, which could adversely impact our business. Even if we
are successful in defending against such claims, litigation could
result in substantial costs and be a distraction to management and
other employees.
We may be subject, directly or indirectly, to federal and state
healthcare fraud and abuse laws, false claims laws, and health
information privacy and security laws. If we are unable to comply,
or have not fully complied, with such laws, we could face
substantial penalties.
If we
begin commercializing any of our products in the United States, our
operations may be directly, or indirectly through our customers,
subject to various federal and state fraud and abuse laws,
including, without limitation, the federal Anti-Kickback Statute,
the federal False Claims Act, and physician sunshine laws and
regulations. These laws may impact, among other things, our
proposed sales, marketing, and education programs. In addition, we
may be subject to patient privacy regulation by both the federal
government and the states in which we conduct our business. The
laws that may affect our ability to operate include:
●
the federal
Anti-Kickback Statute, which prohibits, among other things, persons
or entities from soliciting, receiving, offering or providing
remuneration, directly or indirectly, in return for or to induce
either the referral of an individual for, or the purchase order or
recommendation of, any item or services for which payment may be
made under a federal health care program such as the Medicare and
Medicaid programs;
●
federal civil and
criminal false claims laws and civil monetary penalty laws, which
prohibit, among other things, individuals or entities from
knowingly presenting, or causing to be presented, claims for
payment from Medicare, Medicaid, or other third-party payors that
are false or fraudulent;
●
HIPAA, which
created new federal criminal statutes that prohibit executing a
scheme to defraud any healthcare benefit program and making false
statements relating to healthcare matters;
●
HIPPA, as amended
by the Health Information Technology and Clinical Health Act, and
its implementing regulations, which imposes certain requirements
relating to the privacy, security, and transmission of individually
identifiable health information;
●
The federal
physician sunshine requirements under the Affordable Care Act,
which require manufacturers of drugs, devices, biologics, and
medical supplies to report annually to the U.S. Department of
Health and Human Services information related to payments and other
transfers of value to physicians, other healthcare providers, and
teaching hospitals, and ownership and investment interests held by
physicians and other healthcare providers and their immediate
family members and applicable group purchasing organizations;
and
●
state law
equivalents of each of the above federal laws, such as
anti-kickback and false claims laws that may apply to items or
services reimbursed by any third-party payor, including commercial
insurers, state laws that require pharmaceutical companies to
comply with the pharmaceutical industry’s voluntary
compliance guidelines and the relevant compliance guidance
promulgated by the federal government, or otherwise restrict
payments that may be made to healthcare providers and other
potential referral sources; state laws that require drug
manufacturers to report information related to payments and other
transfers of value to physicians and other healthcare providers or
marketing expenditures; and state laws governing the privacy and
security of health information in certain circumstances, many of
which differ from each other in significant ways and may not have
the same effect, thus complicating compliance efforts.
27
Because
of the breadth of these laws and the narrowness of the statutory
exceptions and safe harbors available, it is possible that some of
our business activities could be subject to challenge under one or
more of such laws. In addition, recent health care reform
legislation has strengthened these laws. For example, the
Affordable Care Act, among other things, amends the intent
requirement of the federal anti-kickback and criminal healthcare
fraud statutes. A person or entity no longer needs to have actual
knowledge of this statute or specific intent to violate it.
Moreover, the Affordable Care Act provides that the government may
assert that a claim including items or services resulting from a
violation of the federal anti-kickback statute constitutes a false
or fraudulent claim for purposes of the False Claims
Act.
If our
operations are found to be in violation of any of the laws
described above or any other governmental regulations that apply to
us, we may be subject to penalties, including civil and criminal
penalties, damages, fines, exclusion from participation in
government health care programs, such as Medicare and Medicaid,
imprisonment, and the curtailment or restructuring of our
operations, any of which could adversely affect our ability to
operate our business and our results of operations
We are highly dependent on our management team, senior staff
professionals and third-party contractors and consultants, and the
loss of their services could materially adversely affect our
business.
We rely
on our relatively small management team and staff as well as
various contractors and consultants to provide critical services.
Our ability to execute our clinical programs for Vyleesi, PL-8177,
PL-8331, PL-3994 and our other preclinical programs for MC1r and
MC4r peptide or small molecule drug candidates and natriuretic
peptide drug candidates depends on our continued retention and
motivation of our management and senior staff professionals,
including executive officers and senior members of product
development and management, including commercialization, who
possess significant technical expertise and experience and oversee
our development and commercialization programs. If we lose the
services of existing key personnel, our development programs could
be adversely affected if suitable replacement personnel are not
recruited quickly. Our success also depends on our ability to
develop and maintain relationships with contractors, consultants
and scientific advisors.
There
is competition for qualified personnel, contractors and consultants
in the pharmaceutical industry, which makes it difficult to attract
and retain the qualified personnel, contractors and consultants
necessary for the development and growth of our business. Our
failure to attract and retain such personnel, contractors and
consultants could have a material adverse effect on our business,
results of operations and financial condition.
Because we expect Vyleesi for the treatment of HSDD to be
classified as a Tier 3 drug with reimbursement by third-party
payers similar to approved products for treating ED, demand for
this product will be tied to discretionary spending levels of our
targeted patient population and particularly affected by
unfavorable economic conditions.
The
market for HSDD may be particularly vulnerable to unfavorable
economic conditions. We expect Vyleesi for the treatment of HSDD to
have significant copay or deductible requirements and to be only
partially reimbursed by third-party payers and, as a result, demand
for this product may be tied to discretionary spending levels of
our targeted patient population. The recent global financial crisis
caused extreme volatility and disruptions in the capital and credit
markets. A severe or prolonged economic downturn could result in a
variety of risks to our business, including weakened demand for
Vyleesi for HSDD or any future product candidates, if approved, and
our ability to raise additional capital when needed on acceptable
terms, if at all. This is particularly true in Europe, which is
undergoing a continued severe economic crisis. A weak or declining
economy could also strain our suppliers, possibly resulting in
supply disruption, or cause our customers to delay making payments
for our services. Any of the foregoing could harm our business and
we cannot anticipate all of the ways in which future economic
climates and financial market conditions could adversely impact our
business.
28
Risks Related to Government Regulation
Both before and after marketing approval, our product candidates
are subject to ongoing regulatory requirements and, if we fail to
comply with these continuing requirements, we could be subject to a
variety of sanctions and the sale of any approved commercial
products could be suspended.
Both
before and after regulatory approval to market a particular product
candidate, the manufacturing, labeling, packaging, adverse event
reporting, storage, advertising and promotion and record keeping
related to the product candidates are subject to extensive
regulatory requirements. If we fail to comply with the regulatory
requirements of the FDA and other applicable U.S. and foreign
regulatory authorities, we could be subject to administrative or
judicially imposed sanctions, including:
●
restrictions on the
products or manufacturing process;
●
warning
letters;
●
civil or criminal
penalties;
●
fines;
●
injunctions;
●
imposition of a
Corporate Integrity Agreement requiring heightened monitoring of
our compliance functions, overseen by outside monitors, and
enhanced reporting requirements to, and oversight by, the FDA and
other government agencies;
●
product seizures or
detentions and related publicity requirements;
●
suspension or
withdrawal of regulatory approvals;
●
regulators or IRBs
may not authorize us or any potential future collaborators to
commence a clinical trial or conduct a clinical trial at a
prospective trial site;
●
total or partial
suspension of production; and
●
refusal to approve
pending applications for marketing approval of new product
candidates.
Changes
in the regulatory approval policy during the development period,
changes in or the enactment of additional regulations or statutes,
or changes in the regulatory review for each submitted product
application may cause delays in the approval or rejection of an
application. Even if the FDA approves a product candidate, the
approval may impose significant restrictions on the indicated uses,
conditions for use, labeling, advertising, promotion, marketing
and/or production of such product, and may impose ongoing
requirements for post-approval studies, including additional
research and development and clinical trials. The approval may also
impose REMS on a product if the FDA believes there is a reason to
monitor the safety of the drug in the marketplace. REMS may include
requirements for additional training for health care professionals,
safety communication efforts and limits on channels of
distribution, among other things. The sponsor would be required to
evaluate and monitor the various REMS activities and adjust them if
need be. The FDA also may impose various civil or criminal
sanctions for failure to comply with regulatory requirements,
including withdrawal of product approval.
Furthermore,
the approval procedure and the time required to obtain approval
varies among countries and can involve additional testing beyond
that required by the FDA. Approval by one regulatory authority does
not ensure approval by regulatory authorities in other
jurisdictions. The FDA has substantial discretion in the approval
process and may refuse to accept any application or may decide that
our data are insufficient for approval and require additional
preclinical, clinical or other studies.
In
addition, varying interpretations of the data obtained for
preclinical and clinical testing could delay, limit or prevent
regulatory approval of a product candidate. Even if we submit an
application to the FDA for marketing approval of a product
candidate, it may not result in marketing approval from the
FDA.
We do
not expect to receive regulatory approval for the commercial sale
of any of our product candidates that are in development in the
near future, if at all. The inability to obtain FDA approval or
approval from comparable authorities in other countries for our
product candidates would prevent us or any potential future
collaborators from commercializing these product candidates in the
United States or other countries.
We may not be able to obtain regulatory approval of Vyleesi for
HSDD even if the product is effective in treating
HSDD.
Clinical
drug development programs for our product candidates are very
expensive, time-consuming, difficult to design and implement and
their outcome is inherently uncertain. Approval of Vyleesi for
treatment of HSDD in premenopausal women requires a determination
by the FDA that the product is both safe and effective. Our Phase 3
clinical trials for HSDD demonstrated what we believe to be an
acceptable safety profile and statistically significant efficacy.
However, the FDA may ultimately disagree with our safety analysis,
definition of efficacy in HSDD, our clinical trial designs, or our
interpretation of our clinical trial results. It is not possible to
predict, with any assurance, whether the FDA will approve Vyleesi
for any indications. The FDA may deny or delay approval of any
application for Vyleesi if the FDA determines that the clinical
data do not adequately establish the safety of the drug even if
efficacy is established. If FDA approves Vyleesi, the approved
labeling of the product may be limited or restricted in such ways
as to inhibit or prevent the successful market acceptance and
profitability of the product. Vyleesi could take a significantly
longer time to obtain approval than we expect and it may never gain
approval. If regulatory approval of Vyleesi is delayed, limited or
never obtained, our business, financial condition and results of
operations would be materially adversely affected.
29
The regulatory approval process is lengthy, expensive and
uncertain, and may prevent us from obtaining the approvals that we
require.
Government
authorities in the United States and other countries extensively
regulate the advertising, labeling, storage, record-keeping,
safety, efficacy, research, development, testing, manufacture,
promotion, marketing and distribution of drug products. Drugs are
subject to rigorous regulation in the United States by the FDA and
similar regulatory bodies in other countries. The steps ordinarily
required by the FDA before a new drug may be marketed in the United
States include:
●
completion of
non-clinical tests including preclinical laboratory and formulation
studies and animal testing and toxicology;
●
submission to the
FDA of an IND application, which must become effective before
clinical trials may begin, and which may be placed on
“clinical hold” by the FDA, meaning the trial may not
commence, or must be suspended or terminated prior to
completion;
●
performance of
adequate and well-controlled Phase 1, 2 and 3 human clinical trials
to establish the safety and efficacy of the drug for each proposed
indication, and potentially post-approval or Phase 4 studies to
further define the drug’s efficacy and safety, generally or
in specific patient populations;
●
submission to the
FDA of an NDA that must be accompanied by a substantial “user
fee” payment;
●
FDA review and
approval of the NDA before any commercial marketing or sale;
and
●
compliance with
post-approval commitments and requirements.
Satisfaction
of FDA pre-market approval requirements for new drugs typically
takes a number of years and the actual time required for approval
may vary substantially based upon the type, complexity and novelty
of the product or disease to be treated by the drug. The results of
product development, preclinical studies and clinical trials are
submitted to the FDA as part of an NDA. The NDA also must contain
extensive manufacturing information, demonstrating compliance with
applicable GMP requirements. Once the submission has been accepted
for filing, the FDA generally has twelve months to review the
application and respond to the applicant. Such response may be an
approval, or may be a “complete response letter”
outlining additional data or steps that must be completed prior to
further FDA review of the NDA. The review process is often
significantly extended by FDA requests for additional information
or clarification. Success in early stage clinical trials does not
assure success in later stage clinical trials. Data obtained from
clinical trials is not always conclusive and may be susceptible to
varying interpretations that could delay, limit or prevent
regulatory approval. The FDA may refer the NDA to an advisory
committee for review, evaluation and recommendation as to whether
the application should be approved, but the FDA is not bound by the
recommendation of the advisory committee. The FDA may deny or delay
approval of applications that do not meet applicable regulatory
criteria or if the FDA determines that the clinical data do not
adequately establish the safety and efficacy of the drug.
Therefore, our proposed products could take a significantly longer
time than we expect or may never gain approval. If regulatory
approval is delayed or never obtained, our business, financial
condition and results of operations would be materially adversely
affected.
Some of
our products or product candidates, including Vyleesi, may be used
in combination with a drug delivery device, such as an injector or
other delivery system. Medical products containing a combination of
new drugs, biological products or medical devices are regulated as
“combination products” in the United States. A
combination product generally is defined as a product comprised of
components from two or more regulatory categories (e.g.,
drug/device, device/biologic, drug/biologic). Each component of a
combination product is subject to the requirements established by
the FDA for that type of component, whether a new drug, biologic or
device. In order to facilitate pre-market review of combination
products, the FDA designates one of its centers to have primary
jurisdiction for the pre-market review and regulation of the
overall product based upon a determination by the FDA of the
primary mode of action of the combination product. The
determination whether a product is a combination product or two
separate products is made by the FDA on a case-by-case basis. Our
product candidates intended for use with such devices, or expanded
indications that we may seek for our products used with such
devices, may not be approved or may be substantially delayed in
receiving approval if the devices do not gain and/or maintain their
own regulatory approvals or clearances. Where approval of the drug
product and device is sought under a single application, the
increased complexity of the review process may delay approval. In
addition, because these drug delivery devices are provided by
single source unaffiliated third-party companies, we are dependent
on the sustained cooperation and effort of those third-party
companies both to supply the devices, maintain their own regulatory
compliance, and, in some cases, to conduct the studies required for
approval or other regulatory clearance of the devices. We are also
dependent on those third-party companies continuing to maintain
such approvals or clearances once they have been received. Failure
of third-party companies to supply the devices, to successfully
complete studies on the devices in a timely manner, or to obtain or
maintain required approvals or clearances of the devices, and
maintain compliance with all regulatory requirements, could result
in increased development costs, delays in or failure to obtain
regulatory approval and delays in product candidates reaching the
market or in gaining approval or clearance for expanded labels for
new indications.
30
Upon
approval, a product candidate may be marketed only in those dosage
forms and for those indications approved by the FDA. Once approved,
the FDA may withdraw the product approval if compliance with
regulatory requirements is not maintained or if problems occur
after the product reaches the marketplace. In addition, the FDA may
require post-marketing studies, referred to as Phase 4 studies, to
monitor the approved products in a specific subset of patients or a
larger number of patients than were required for product approval
and may limit further marketing of the product based on the results
of these post-market studies. The FDA has broad post-market
regulatory and enforcement powers, including the ability to seek
injunctions, levy fines and civil penalties, criminal prosecution,
withdraw approvals and seize products or request
recalls.
If
regulatory approval of any of our product candidates is granted, it
will be limited to certain disease states or conditions, patient
populations, duration or frequency of use, and will be subject to
other conditions as set forth in the FDA-approved labeling. Adverse
experiences with the product must be reported to the FDA and could
result in the imposition of market restriction through labeling
changes or in product removal. Product approvals may be withdrawn
if compliance with regulatory requirements is not maintained or if
problems concerning safety or efficacy of the product occur
following approval.
Outside
the United States, our ability to market our product candidates
will also depend on receiving marketing authorizations from the
appropriate regulatory authorities. The foreign regulatory approval
process generally includes all of the risks associated with FDA
approval described above. The requirements governing the conduct of
clinical trials and marketing authorization vary widely from
country to country. At present, foreign marketing authorizations
are applied for at a national level, although within the European
Community (“EC”), registration procedures are available
to companies wishing to market a product to more than one EC member
state. If the regulatory authority is satisfied that adequate
evidence of safety, quality and efficiency has been presented, a
marketing authorization will be granted. If we do not obtain, or
experience difficulties in obtaining, such marketing
authorizations, our business, financial condition and results of
operations may be materially adversely affected.
Legislative or regulatory healthcare reforms in the United States
may make it more difficult and costly for us to obtain regulatory
clearance or approval of Vyleesi for HSDD or any future product
candidates and to produce, market and distribute our products after
clearance or approval is obtained.
From
time to time, legislation is drafted and introduced in Congress,
and court decisions are issued, that could significantly change the
statutory provisions governing the regulatory clearance or
approval, manufacture and marketing of regulated products or the
reimbursement thereof. In addition, FDA regulations and guidance
are often revised or reinterpreted by the FDA in ways that may
significantly affect our business and our products. Any new
regulations or revisions or reinterpretations of existing
regulations may impose additional costs or lengthen review times of
Vyleesi for HSDD or any future product candidates. We cannot
determine what effect changes in regulations, statutes, court
decisions, legal interpretation or policies, when and if
promulgated, enacted, issued or adopted may have on our business in
the future. Such changes could, among other things:
●
require changes to
manufacturing methods;
●
require recall,
replacement or discontinuance of one or more of our
products;
●
require additional
recordkeeping;
●
limit or restrict
our ability to engage in certain types of marketing or promotional
activities;
●
alter or eliminate
the scope or terms of any currently available regulatory
exclusivities; and
●
restrict or
eliminate our ability to settle any patent litigation we may bring
against potential generic competitors.
Each of
these would likely entail substantial time and cost and could
materially harm our business and our financial results. In
addition, delays in receipt of or failure to receive regulatory
clearances or approvals for any future products would harm our
business, financial condition and results of
operations.
Changes in healthcare policy could adversely affect our
business.
U.S.
and foreign governments continue to propose and pass legislation
designed to reduce the cost of healthcare. For example, the
Medicare Prescription Drug Improvement and Modernization Act of
2003 (“MMA”), expanded Medicare coverage for drugs
purchased by Medicare beneficiaries and introduced new
reimbursement methodologies. In addition, this law provided
authority for limiting the number of drugs that will be covered in
any therapeutic class. Until our products are approved and drug
plan formulary listing decisions are made, we do not know what
impact the MMA and similar laws will have on the availability of
coverage for and the price that we receive for any approved
products. Moreover, while the MMA applies only to drug benefits for
Medicare beneficiaries, private payers often follow Medicare
policies in setting their own reimbursement policies, and any
reduction in reimbursement that results from the MMA may result in
similar reductions by private payers.
31
The
Affordable Care Act, as amended by the Health Care and Education
Affordability Reconciliation Act (together the “ACA”),
was adopted in 2010. This law has resulted in an increase in the
number of people who are covered by both public and private
insurance and has changed the way health care is financed by both
government health program and private insurers, with significant
impacts on the pharmaceutical industry. The ACA contains a number
of provisions that may impact our business and operations in ways
that may negatively affect our potential revenues in the future.
For example, the ACA imposes a non-deductible excise tax on
pharmaceutical manufacturers or importers that sell branded
prescription drugs to U.S. government programs that we believe will
increase the cost of any products that we develop. In addition, as
part of the ACA’s provisions closing a funding gap that
currently exists in the Medicare Part D prescription drug program
(commonly known as the “donut hole”), we will be
required to provide a 50% discount on any branded prescription
drugs that we develop sold to beneficiaries who fall within the
donut hole. We cannot predict all of the specific effects the ACA
or any future healthcare reform legislation will have on our
business, but they could have a material adverse effect on our
business and financial condition.
Some of
the provisions of the ACA have yet to be fully implemented, while
certain provisions have been subject to judicial and Congressional
challenges, as well as efforts by the Trump administration to
repeal or replace certain aspects of the ACA. Since January 2017,
President Trump has signed two executive orders and other
directives designed to delay, circumvent, or loosen certain
requirements mandated by the ACA. Concurrently, Congress has
considered legislation that would repeal or repeal and replace all
or part of the ACA. While Congress has not passed repeal
legislation, the Tax Cuts and Jobs Act (the “2017 Tax
Act”) includes a provision repealing, effective January 1,
2019, the tax-based shared responsibility payment imposed by the
ACA on certain individuals who fail to maintain qualifying health
coverage for all or part of a year that is commonly referred to as
the “individual mandate”. Congress may consider other
legislation to repeal or replace elements of the ACA. Because of
the continued uncertainty about the implementation of the ACA,
including the potential for further legal challenges or repeal of
the ACA, we cannot quantify or predict with any certainty the
likely impact of the ACA or its repeal on our business, prospects,
financial condition or results of operations.
The
availability of government reimbursement for prescription drugs
will be impacted by the Budget Control Act of 2011, which was
signed into law on August 2, 2011. This law is expected to result
in federal spending cuts totaling between $1.2 trillion and $1.5
trillion over the next decade, over half of which will include cuts
in Medicare and other health-related spending.
Risks Related to Our Intellectual Property
If we fail to adequately protect or enforce our intellectual
property rights or secure rights to patents of others, the value of
our intellectual property rights would diminish.
Our
success, competitive position and future revenues will depend in
part on our ability and the abilities of our licensors to obtain
and maintain patent protection for our products, methods, processes
and other technologies, to preserve our trade secrets, to prevent
third parties from infringing on our proprietary rights and to
operate without infringing the proprietary rights of third parties.
We cannot predict:
●
the degree and
range of protection any patents will afford us against competitors,
including whether third parties will find ways to invalidate or
otherwise circumvent our patents;
●
if and when patents
will be issued;
●
whether or not
others will obtain patents claiming aspects similar to those
covered by our patents and patent applications; and
●
whether we will
need to initiate litigation or administrative proceedings, which
may be costly whether we win or lose.
If our
products, methods, processes and other technologies infringe the
proprietary rights of other parties we could incur substantial
costs and we may have to:
●
obtain licenses,
which may not be available on commercially reasonable terms, if at
all;
●
redesign our
products or processes to avoid infringement;
●
stop using the
subject matter claimed in the patents held by others;
●
pay damages;
or
●
defend litigation
or administrative proceedings, which may be costly whether we win
or lose, and which could result in a substantial diversion of our
management resources.
32
We may become involved in lawsuits to protect or enforce our
patents or other intellectual property or the patents of our
licensors, which could be expensive and time
consuming.
Competitors
may infringe our intellectual property, including our patents or
the patents of our licensors. As a result, we may be required to
file infringement claims to stop third-party infringement or
unauthorized use. This can be expensive, particularly for a company
of our size, and time-consuming. In addition, in an infringement
proceeding, a court may decide that a patent of ours is not valid
or is unenforceable, or may refuse to stop the other party from
using the technology at issue on the grounds that our patent claims
do not cover its technology or that the factors necessary to grant
an injunction against an infringer are not satisfied.
An
adverse determination of any litigation or other proceedings could
put one or more of our patents at risk of being invalidated or
interpreted narrowly and could put our patent applications at risk
of not issuing.
Interference,
derivation or other proceedings brought at the USPTO may be
necessary to determine the priority or patentability of inventions
with respect to our patent applications or those of our licensors
or collaborators. Litigation or USPTO proceedings brought by us may
fail or may be invoked against us by third parties. Even if we are
successful, domestic or foreign litigation or USPTO or foreign
patent office proceedings may result in substantial costs and
distraction to our management. We may not be able, alone or with
our licensors or collaborators, to prevent misappropriation of our
proprietary rights, particularly in countries where the laws may
not protect such rights as fully as in the United
States.
Furthermore,
because of the substantial amount of discovery required in
connection with intellectual property litigation or other
proceedings, there is a risk that some of our confidential
information could be compromised by disclosure during this type of
litigation or proceedings. In addition, during the course of this
kind of litigation or proceedings, there could be public
announcements of the results of hearings, motions or other interim
proceedings or developments or public access to related documents.
If investors perceive these results to be negative, the market
price for our common stock could be significantly
harmed.
If we infringe or are alleged to infringe intellectual property
rights of third parties, our business could be harmed.
Our
research, development and commercialization activities may infringe
or otherwise violate or be claimed to infringe or otherwise violate
patents owned or controlled by other parties. There may also be
patent applications that have been filed but not published that,
when issued as patents, could be asserted against us. These third
parties could bring claims against us that would cause us to incur
substantial expenses and, if successful against us, could cause us
to pay substantial damages. Further, if a patent infringement suit
were brought against us, we could be forced to stop or delay
research, development, manufacturing or sales of the product or
product candidate that is the subject of the suit.
As a
result of patent infringement claims, or to avoid potential claims,
we may choose or be required to seek licenses from third parties.
These licenses may not be available on acceptable terms, or at all.
Even if we are able to obtain a license, the license would likely
obligate us to pay license fees or royalties or both, and the
rights granted to us might be nonexclusive, which could result in
our competitors gaining access to the same intellectual property.
Ultimately, we could be prevented from commercializing a product,
or be forced to cease some aspect of our business operations, if,
as a result of actual or threatened patent infringement claims, we
are unable to enter into licenses on acceptable terms, if at
all.
There
has been substantial litigation and other proceedings regarding
patent and other intellectual property rights in the pharmaceutical
industry. In addition to infringement claims against us, we may
become a party to other patent litigation and other proceedings,
including interference, derivation or post-grant proceedings
declared or granted by the USPTO and similar proceedings in foreign
countries, regarding intellectual property rights with respect to
our current or future products. The cost to us of any patent
litigation or other proceeding, even if resolved in our favor,
could be substantial. Some of our competitors may be able to
sustain the costs of such litigation or proceedings more
effectively than we can because of their substantially greater
financial resources. Patent litigation and other proceedings may
also absorb significant management time. Uncertainties resulting
from the initiation and continuation of patent litigation or other
proceedings could impair our ability to compete in the marketplace.
The occurrence of any of the foregoing could have a material
adverse effect on our business, financial condition or results of
operations.
33
Our patent applications and the enforcement or defense of our
issued patents may be impacted by the application of or changes in
U.S. and foreign standards.
The
standards that the USPTO and foreign patent offices use to grant
patents are not always applied predictably or uniformly and can
change. Consequently, our pending patent applications may not be
allowed and, if allowed, may not contain the type and extent of
patent claims that will be adequate to conduct our business as
planned. Additionally, any issued patents we currently own or
obtain in the future may have a shorter patent term than expected
or may not contain claims that will permit us to stop competitors
from using our technology or similar technology or from copying our
product candidates. Similarly, the standards that courts use to
interpret patents are not always applied predictably or uniformly
and may evolve, particularly as new technologies develop. In
addition, changes to patent laws in the United States or other
countries may be applied retroactively to affect the validation
enforceability, or term of our patent. For example, the U.S.
Supreme Court has recently modified some legal standards applied by
the USPTO in examination of U.S. patent applications, which may
decrease the likelihood that we will be able to obtain patents and
may increase the likelihood of challenges to patents we obtain or
license. In addition, changes to the U.S. patent system have come
into force under the Leahy-Smith America Invents Act, or the
Leahy-Smith Act, which was signed into law in September 2011. The
Leahy-Smith Act included a number of significant changes to U.S.
patent law. These include provisions that affect the way patent
applications will be prosecuted and may also affect patent
litigation. In particular, under the Leahy-Smith Act, the United
States transitioned in March 2013 to a “first to file”
system in which the first inventor to file a patent application
will be entitled to the patent. Third parties are allowed to submit
prior art before the issuance of a patent by the USPTO, and may
become involved in opposition, derivation, reexamination,
inter partes
review or
interference proceedings challenging our patent rights or the
patent rights of others. An adverse determination in any such
submission, proceeding or litigation could reduce the scope of, or
invalidate, our patent rights, which could adversely affect our
competitive position.
While
we cannot predict with certainty the impact the Leahy-Smith Act or
any potential future changes to the U.S. or foreign patent systems
will have on the operation of our business, the Leahy-Smith Act and
such future changes could increase the uncertainties and costs
surrounding the prosecution of our patent applications and the
enforcement or defense of our issued patents, all of which could
have a material adverse effect on our business, results of
operations, financial condition and cash flows and future
prospects.
We may not be able to protect our intellectual property rights
throughout the world.
Filing,
prosecuting and defending patents on product candidates in all
countries throughout the world would be prohibitively expensive,
and our intellectual property rights in some countries outside the
United States can be less extensive than those in the United
States. In addition, the laws of some foreign countries do not
protect intellectual property rights to the same extent as federal
and state laws in the United States and in some cases may even
force us to grant a compulsory license to competitors or other
third parties. Consequently, we may not be able to prevent third
parties from practicing our inventions in all countries outside the
United States, or from selling or importing products made using our
inventions in and into the United States or other jurisdictions.
Competitors may use our technologies in jurisdictions where we have
not obtained patent protection to develop their own products and
further, may export otherwise infringing products to territories
where we have patent protection, but enforcement is not as strong
as that in the United States. These products may compete with our
products and our patents or other intellectual property rights may
not be effective or sufficient to prevent them from
competing.
Many
companies have encountered significant problems in protecting and
defending intellectual property rights in foreign jurisdictions.
The legal systems of certain countries, particularly certain
developing countries, do not favor the enforcement of patents and
other intellectual property protection, particularly those relating
to biopharmaceuticals, which could make it difficult for us to stop
the infringement of our patents or marketing of competing products
in violation of our proprietary rights generally. Proceedings to
enforce our patent rights in foreign jurisdictions could result in
substantial costs and divert our efforts and attention from other
aspects of our business, could put our patents at risk of being
invalidated or interpreted narrowly and our patent applications at
risk of not issuing and could provoke third parties to assert
claims against us. We may not prevail in any lawsuits that we
initiate and the damages or other remedies awarded, if any, may not
be commercially meaningful. Accordingly, our efforts to enforce our
intellectual property rights around the world may be inadequate to
obtain a significant commercial advantage from the intellectual
property that we develop or license.
In
addition, our ability to protect and enforce our intellectual
property rights may be adversely affected by unforeseen changes in
domestic and foreign intellectual property laws.
If we are unable to keep our trade secrets confidential, our
technologies and other proprietary information may be used by
others to compete against us.
In
addition to our reliance on patents, we attempt to protect our
proprietary technologies and processes by relying on trade secret
laws and agreements with our employees and other persons who have
access to our proprietary information. These agreements and
arrangements may not provide meaningful protection for our
proprietary technologies and processes in the event of unauthorized
use or disclosure of such information, and may not provide an
adequate remedy in the event of unauthorized disclosure of
confidential information. In addition, our competitors may
independently develop substantially equivalent technologies and
processes or gain access to our trade secrets or technology, either
of which could materially and adversely affect our competitive
position.
34
Risks Related to the Ownership of Our Common Stock
Our stock price is volatile and may fluctuate in a way that is
disproportionate to our operating performance and we expect it to
remain volatile, which could limit investors’ ability to sell
stock at a profit.
The
volatile price of our stock makes it difficult for investors to
predict the value of their investment, to sell shares at a profit
at any given time or to plan purchases and sales in advance. A
variety of factors may affect the market price of our common stock.
These include, but are not limited to:
●
publicity regarding
actual or potential clinical results relating to products under
development by our competitors or us;
●
delay or failure in
initiating, completing or analyzing preclinical or clinical trials
or unsatisfactory designs or results of these trials;
●
interim decisions
by regulatory agencies, including the FDA, as to clinical trial
designs, acceptable safety profiles and the benefit/risk ratio of
products under development;
●
achievement or
rejection of regulatory approvals by our competitors or by
us;
●
announcements of
technological innovations or new commercial products by our
competitors or by us;
●
developments
concerning proprietary rights, including patents;
●
developments
concerning our collaborations;
●
regulatory
developments in the United States and foreign
countries;
●
economic or other
crises and other external factors;
●
period-to-period
fluctuations in our revenue and other results of
operations;
●
changes in the
structure of healthcare payment systems or other actions that
affect the effective reimbursement rates for treatment regimens
containing our products;
●
changes in
financial estimates and recommendations by securities analysts
following our business or our industry;
●
sales of our common
stock (or the perception that such sales could occur);
and
●
the other factors
described in this “Risk Factors” section.
We will
not be able to control many of these factors, and we believe that
period-to-period comparisons of our financial results will not
necessarily be indicative of our future performance. If our
revenues, if any, in any particular period do not meet
expectations, we may not be able to adjust our expenditures in that
period, which could cause our operating results to suffer further.
If our operating results in any future period fall below the
expectations of securities analysts or investors, our stock price
may fall by a significant amount.
For the
12-month period ended June 30, 2018, the price of our stock has
been volatile, ranging from a high of $1.59 per share to a low of
$0.38 per share. In addition, the stock market in general, and the
market for biotechnology companies in particular, has experienced
extreme price and volume fluctuations that may have been unrelated
or disproportionate to the operating performance of individual
companies. These broad market and industry factors may seriously
harm the market price of our common stock, regardless of our
operating performance.
As a public company in the United States, we are subject to the
Sarbanes-Oxley Act of 2002 (“Sarbanes-Oxley”). We can
provide no assurance that we will, at all times, in the future be
able to report that our internal controls over financial reporting
are effective.
Companies
that file reports with the SEC, including us, are subject to the
requirements of Section 404 of Sarbanes-Oxley. Section 404 requires
management to establish and maintain a system of internal control
over financial reporting, and annual reports on Form 10-K filed
under the Exchange Act must contain a report from management
assessing the effectiveness of a company’s internal control
over financial reporting. Ensuring that we have adequate internal
financial and accounting controls and procedures in place to
produce accurate financial statements on a timely basis is a costly
and time-consuming effort that needs to be re-evaluated frequently.
Failure on our part to have effective internal financial and
accounting controls would cause our financial reporting to be
unreliable, could have a material adverse effect on our business,
operating results, and financial condition, and could cause the
trading price of our common stock to fall
dramatically.
If securities or industry analysts do not publish research or
publish unfavorable research about our business, our stock price
and trading volume could decline.
As a
smaller company, it may be difficult for us to attract or retain
the interest of equity research analysts. A lack of research
coverage may adversely affect the liquidity of and market price of
our common stock. We do not have any control of the equity research
analysts or the content and opinions included in their reports. The
price of our stock could decline if one or more equity research
analysts downgrade our stock or issue other unfavorable commentary
or research. If one or more equity research analysts ceases
coverage of our company, or fails to publish reports on us
regularly, demand for our stock could decrease, which in turn could
cause our stock price or trading volume to decline.
35
Holders of our preferred stock may have interests different from
our common stockholders.
We are
permitted under our certificate of incorporation to issue up to
10,000,000 shares of preferred stock. We can issue shares of our
preferred stock in one or more series and can set the terms of the
preferred stock without seeking any further approval from our
common stockholders. 4,030 shares of our Series A Preferred Stock
remain outstanding as of September 11, 2018. Each share of Series A
Preferred Stock is convertible at any time, at the option of the
holder, and such conversion could dilute the value of our common
stock to current stockholders and could adversely affect the market
price of our common stock. The conversion price decreases if we
sell common stock (or equivalents) for a price per share less than
the conversion price or less than the market price of the common
stock and is also subject to adjustment upon the occurrence of a
merger, reorganization, consolidation, reclassification, stock
dividend or stock split which results in an increase or decrease in
the number of shares of common stock outstanding. Upon (i)
liquidation, dissolution or winding up of the Company, whether
voluntary or involuntary, (ii) sale or other disposition of all or
substantially all of the assets of the Company, or (iii) any
consolidation, merger, combination, reorganization or other
transaction in which the Company is not the surviving entity or in
which the shares of common stock constituting in excess of 50% of
the voting power of the Company are exchanged for or changed into
other stock or securities, cash and/or any other property, after
payment or provision for payment of the debts and other liabilities
of the Company, the holders of Series A Preferred Stock will be
entitled to receive, pro rata and in preference to the holders of
any other capital stock, an amount per share equal to $100 plus
accrued but unpaid dividends, if any. Any preferred stock that we
issue may rank ahead of our common stock in terms of dividend
priority or liquidation premiums and may have greater voting rights
than our common stock.
Because we do not anticipate paying any cash dividends on our
common stock in the foreseeable future, capital appreciation, if
any, will be your sole source of gains.
We do
not anticipate paying any cash dividends in the foreseeable future
and intend to retain future earnings, if any, for the development
and expansion of our business. Our outstanding Series A Preferred
Stock, consisting of 4,030 shares on September 11, 2018, provides
that we may not pay a dividend or make any distribution to holders
of any class of stock unless we first pay a special dividend or
distribution of $100 per share to the holders of the Series A
Preferred Stock. In addition, the terms of existing or future
agreements may limit our ability to pay dividends. As a result,
capital appreciation, if any, of our common stock will be your sole
source of gain for the foreseeable future.
Anti-takeover provisions of Delaware law and our charter documents
may make potential acquisitions more difficult and could result in
the entrenchment of management.
We are
incorporated in Delaware. Anti-takeover provisions of Delaware law
and our charter documents may make a change in control or efforts
to remove management more difficult. Also, under Delaware law, our
board of directors may adopt additional anti-takeover measures.
Under Section 203 of the Delaware General Corporation Law, a
corporation may not engage in a business combination with an
“interested stockholder” for a period of three years
after the date of the transaction in which the person first becomes
an “interested stockholder,” unless the business
combination is approved in a prescribed manner.
We are
authorized to issue up to 300,000,000 shares of common stock. To
the extent that we sell or otherwise issue authorized but currently
unissued shares, this could have the effect of making it more
difficult for a third party to acquire a majority of our
outstanding voting stock.
Our
charter authorizes us to issue up to 10,000,000 shares of preferred
stock and to determine the terms of those shares of stock without
any further action by our stockholders. If we exercise this right,
it could be more difficult for a third party to acquire a majority
of our outstanding voting stock.
In
addition, our equity incentive plans generally permit us to
accelerate the vesting of options and other stock rights granted
under these plans in the event of a change of control. If we
accelerate the vesting of options or other stock rights, this
action could make an acquisition more costly.
The
application of these provisions could have the effect of delaying
or preventing a change of control, which could adversely affect the
market price of our common stock.
36
We are a smaller reporting company and the reduced disclosure
requirements applicable to smaller reporting companies may make our
Common Stock less attractive to investors.
We are
currently a “smaller reporting company” as defined in
the Exchange Act. Smaller reporting companies are able to provide
simplified executive compensation disclosures in their filings, but
as an “accelerated filer” we are not exempt from the
provisions of Section 404(b) of the Sarbanes-Oxley Act requiring
that an independent registered public accounting firm provide an
attestation report on the effectiveness of internal control over
financial reporting, and have certain other decreased disclosure
obligations in their SEC filings. We cannot predict whether
investors will find our common stock less attractive because of our
reliance on the smaller reporting company exemption. If some
investors find our common stock less attractive as a result, there
may be a less active trading market for our common stock and our
stock price may be more volatile.
As of September 11, 2018, there were 45,179,691 shares of common
stock underlying outstanding convertible preferred stock, options,
restricted stock units and warrants. Stockholders may experience
dilution from the conversion of preferred stock, exercise of
outstanding options and warrants and vesting of restricted stock
units.
As of
September 11, 2018, holders of our outstanding dilutive securities
had the right to acquire the following amounts of underlying common
stock:
●
61,145 shares
issuable on the conversion of our immediately convertible Series A
Convertible Preferred Stock, subject to adjustment, for no further
consideration;
●
12,646,312 shares
issuable upon the exercise of stock options at a weighted-average
exercise price of $0.75 per share;
●
9,068,188 shares
issuable under restricted stock units which vest on dates between
December 8, 2018 and June 26, 2022, subject to the fulfillment of
service or performance conditions, and some of which are subject to
delivery restrictions; and
●
23,404,046 shares
issuable upon the exercise of warrants at a weighted-average
exercise price of $0.77 per share.
If the
holders convert, exercise or receive these securities, or similar
dilutive securities we may issue in the future, stockholders may
experience dilution in the net book value of their common stock. In
addition, the sale or availability for sale of the underlying
shares in the marketplace could depress our stock price. We have
registered or agreed to register for resale substantially all of
the underlying shares listed above. Holders of registered
underlying shares could resell the shares immediately upon
issuance, which could result in significant downward pressure on
our stock price.
Our failure to meet the continued listing requirements of the NYSE
American could result in a de-listing of our common
stock.
Our
common shares are listed on the NYSE American, a national
securities exchange, under the symbol “PTN”. Although
we currently meet the NYSE American’s listing standards,
which generally mandate that we meet certain requirements relating
to stockholders’ equity, market capitalization, aggregate
market value of publicly held shares and distribution requirements,
we cannot assure you that we will be able to continue to meet the
NYSE American’s listing requirements. If we fail to satisfy
the continued listing requirements of the NYSE American, such as
the corporate governance requirements or the minimum closing bid
price requirement, the NYSE American may take steps to de-list our
common stock. If the NYSE American delists our securities for
trading on its exchange, we could face significant material adverse
consequences, including:
●
a limited
availability of market quotations for our securities;
●
reduced liquidity
with respect to our securities;
●
a determination
that our shares of common stock are “penny stock” which
will require brokers trading in our shares of common stock to
adhere to more stringent rules, possibly resulting in a reduced
level of trading activity in the secondary trading market for our
shares of common stock;
●
a limited amount of
news and analyst coverage for our company; and
●
a decreased ability
to issue additional securities or obtain additional financing in
the future.
37
Such a
de-listing would likely have a negative effect on the price of our
common stock and would impair your ability to sell or purchase our
common stock when you wish to do so. In the event of a de-listing,
we may take actions to restore our compliance with the NYSE
American’s listing requirements, but we can provide no
assurance that any such action taken by us would allow our common
stock to become listed again, stabilize the market price or improve
the liquidity of our common stock, prevent our common stock from
dropping below the NYSE American minimum bid price requirement or
prevent future non-compliance with the NYSE American’s
listing requirements.
The
National Securities Markets Improvement Act of 1996, which is a
federal statute, prevents or preempts the states from regulating
the sale of certain securities, which are referred to as
“covered securities.” Our common shares are considered
to be covered securities because they are listed on the NYSE
American. Although the states are preempted from regulating the
sale of our securities, the federal statute does allow the states
to investigate companies if there is a suspicion of fraud, and, if
there is a finding of fraudulent activity, then the states can
regulate or bar the sale of covered securities in a particular
case. Further, if we were no longer listed on the NYSE American,
our common stock would not be covered securities and we would be
subject to regulation in each state in which we offer our
securities.
None.
Item
2.
Properties
Our
corporate offices are located at 4B Cedar Brook Drive, Cedar Brook
Corporate Center, Cranbury, NJ 08512, where we lease approximately
10,000 square feet of office space under a lease that expires in
June 2020. We also lease approximately 1,700 square feet of
laboratory space in the Township of South Brunswick, NJ, under a
lease that expires in August 2019. We believe our present
facilities are adequate for our current needs. We do not own any
real property.
Item
3.
Legal
Proceedings
We are
involved, from time to time, in various claims and legal
proceedings arising in the ordinary course of our business. We are
not currently a party to any claim or legal
proceeding.
Item
4.
Mine
Safety Disclosures
Not
applicable.
38
The
table below provides, for the fiscal quarters indicated, the
reported high and low sales prices for our common stock on the NYSE
American (formerly known as the NYSE MKT and NYSE AMEX) since July
1, 2016.
|
FISCAL YEAR ENDED
JUNE 30, 2017
|
HIGH
|
LOW
|
|
Fourth
Quarter
|
$
0.50
|
$
0.29
|
|
Third
Quarter
|
0.62
|
0.32
|
|
Second
Quarter
|
0.90
|
0.45
|
|
First
Quarter
|
0.86
|
0.45
|
|
|
|
|
|
FISCAL YEAR ENDED
JUNE 30, 2018
|
HIGH
|
LOW
|
|
Fourth
Quarter
|
$
1.59
|
$
0.87
|
|
Third
Quarter
|
1.20
|
0.83
|
|
Second
Quarter
|
1.05
|
0.65
|
|
First
Quarter
|
0.69
|
0.38
|
Our
common stock has been listed on NYSE American under the symbol
“PTN” since December 21, 1999. It previously traded on
The Nasdaq SmallCap Market under the symbol
“PLTN.”
On
September 11, 2018, we had approximately 143 record holders of
common stock and the closing sales price of our common stock as
reported on the NYSE American was $1.05 per share. The aggregate
market value of the common and non-voting common equity held by
non-affiliates on such date, computed by reference to the closing
sales price of our common stock on that date, was
$209,647,584.
Issuer purchases of equity securities.
We have not and do
not currently intend to retire or repurchase any of our capital
securities other than providing our employees with the option to
withhold shares to satisfy tax withholding amounts due from
employees upon the vesting of restricted stock units in connection
with our 2011 Stock Incentive Plan. The following 3,295 shares were
withheld during the quarter ended June 30, 2018 at the direction of
the employees as permitted under the 2011 Stock Incentive Plan in
order to pay the minimum amount of tax liability owed by the
employee from the vesting of those units:
|
Period
|
Total Number of
Shares Purchased (1)
|
Weighted Average
Price Paid per Share
|
Total Number of
Shares Purchased as Part of Publicly Announced Plans or
Programs
|
Maximum Number
of Shares that May Yet be Purchased Under Announced Plans or
Programs
|
|
April 1-30,
2018
|
-
|
$
-
|
-
|
-
|
|
May 1-31,
2018
|
-
|
-
|
-
|
-
|
|
June 1-30,
2018
|
3,295
|
0.97
|
-
|
-
|
|
Total
|
3,295
|
$
0.97
|
-
|
-
|
(1)
Consists solely of 3,295 shares that were withheld to satisfy tax
withholding amounts due from employees upon the vesting of
previously issued restricted stock units.
Dividends and dividend policy
. We have never declared or
paid any dividends. We currently intend to retain earnings, if any,
for use in our business. We do not anticipate paying dividends in
the foreseeable future.
Dividend restrictions
. Our outstanding Series A Preferred
Stock, consisting of 4,030 shares on September 11, 2018, provides
that we may not pay a dividend or make any distribution to holders
of any class of stock unless we first pay a special dividend or
distribution of $100 per share to the holders of the Series A
Preferred Stock.
Equity Compensation Plan Information.
Reference is
made to the information contained in the Equity Compensation Plan
table contained in Item 11 of this Annual Report.
Not
Applicable.
39
Item
7.
Management’s
Discussion and Analysis of Financial Condition and Results of
Operations.
The
following discussion and analysis should be read in conjunction
with the consolidated financial statements and notes to the
consolidated financial statements filed as part of this Annual
Report.
Forward-Looking Statements
The
following discussion and analysis contains forward-looking
statements within the meaning of the federal securities laws. You
are urged to carefully review our description and examples of
forward-looking statements included earlier in this Annual Report
on Form 10-K immediately prior to Part I, under the heading
“Forward-Looking Statements.” Forward-looking
statements are subject to risks and uncertainties that could cause
actual results to differ materially from those expressed in the
forward-looking statements. You are urged to carefully review the
disclosures we make concerning risks and other factors that may
affect our business and operating results, including those made in
Part I, Item 1A of this Annual Report on Form 10-K, and any of
those made in our other reports filed with the SEC. You are
cautioned not to place undue reliance on the forward-looking
statements included herein, which speak only as of the date of this
document. We do not intend, and undertake no obligation, to publish
revised forward-looking statements to reflect events or
circumstances after the date of this document or to reflect the
occurrence of unanticipated events.
Critical Accounting Policies and Estimates
Our
significant accounting policies are described in Note 2 to the
consolidated financial statements included in this Annual Report.
We believe that our accounting policies and estimates relating to
revenue recognition, accrued expenses and stock-based compensation
charges are the most critical.
Revenue Recognition.
Revenue
is recognized in accordance with Financial Accounting Standards
Board (“FASB”) Accounting Standards Codification
(“ASC”) Topic 605-25,
Revenue Recognition for Arrangements with
Multiple Elements
, which addresses the determination of
whether an arrangement involving multiple deliverables contains
more than one unit of accounting. A delivered item within an
arrangement is considered a separate unit of accounting only if
both of the following criteria are met:
●
the delivered item
has value to the customer on a stand-alone basis; and
●
if the arrangement
includes a general right of return relative to the delivered item,
delivery or performance of the undelivered item is considered
probable and substantially in control of the vendor.
Under
FASB ASC Topic 605-25, if both of the criteria above are not met,
then separate accounting for the individual deliverables is not
appropriate.
Revenue
resulting from the achievement of development milestones is
recorded in accordance with the accounting guidance for the
milestone method of revenue recognition.
Amounts
received prior to satisfying the revenue recognition criteria are
recorded as deferred revenue on the Company’s consolidated
balance sheet. Amounts expected to be recognized as revenue in the
next 12 months following the balance sheet date are classified as
current liabilities.
Accrued Expenses.
Third
parties perform a significant portion of our development
activities. We review the activities performed under significant
contracts each quarter and accrue expenses and the amount of any
reimbursement to be received from our collaborators based upon the
estimated amount of work completed. Estimating the value or stage
of completion of certain services requires judgment based on
available information. If we do not identify services performed for
us but not billed by the service-provider, or if we underestimate
or overestimate the value of services performed as of a given date,
reported expenses will be understated or overstated.
Stock-based Compensation.
The
fair value of stock options granted has been calculated using the
Black-Scholes option pricing model, which requires us to make
estimates of expected volatility, interest rates and expected
option lives. We estimate these factors at the time of grant based
on our own prior experience and public sources of information. The
amount of recorded compensation related to an option grant is not
adjusted for subsequent changes in these estimates or for actual
experience. In addition, awards containing a market condition are
valued using a multifactor Monte Carlo simulation and awards
containing a performance condition require us to estimate the
probability of achievement of the performance
condition.
40
The
amount and timing of compensation expense to be recorded in future
periods related to grants of options and restricted stock units may
be affected by the achievement of performance conditions and
employment terminations. As a result, stock-based compensation
charges may vary significantly from period to period.
See
Note 3 to the consolidated financial statements included in this
Annual Report for a description of recent accounting pronouncements
that affect us.
Results of Operations
Year Ended June 30, 2018 Compared to the Year Ended June 30,
2017:
Revenue –
For the fiscal year ended June 30, 2018
(“fiscal 2018”), we recognized $67,134,758 in revenue
pursuant to our license agreements with AMAG and Fosun compared to
$44,723,827 in revenue for the year ended June 30,2017
(“fiscal 2017”).
On
January 8, 2017, we entered into a License Agreement (the
“AMAG License Agreement”) with AMAG which provided for
$60,000,000 as a one-time initial payment. Pursuant to the terms of
and subject to the conditions in the AMAG License Agreement, AMAG
reimbursed us $25,000,000, less certain expenses directly paid or
to be paid by AMAG for reasonable, documented, direct out-of-pocket
expenses we incurred following the effective date of the License
Agreement in connection with development and regulatory activities
necessary to file an NDA for Vyleesi for HSDD in the United States,
less certain other expenses directly paid or to be paid by AMAG.
The Company recognized $42,134,758 and $44,723,827 for fiscal 2018
and fiscal 2017 respectively as license and contract revenue which
included additional billings for AMAG related Vyleesi costs of
$1,151,243 and $707,342 in fiscal 2018 and fiscal 2017,
respectively.
In
addition, pursuant to the terms of and subject to the conditions in
the AMAG License Agreement, the Company will be eligible to receive
from AMAG (i) up to $80,000,000 in specified regulatory
milestone payments upon achievement of certain regulatory
milestones, and (ii) up to $300,000,000 in sales milestone payments
based on achievement of certain annual net sales for all Products
in the Territory. On June 4, 2018 the FDA accepted the Vyleesi NDA
for filing. The NDA was filed on March 23,
2018. The
FDA’s acceptance triggered a $20,000,000 milestone payment to
Palatin from AMAG. As a result, the Company recognized $20,000,000
in revenue related to regulatory milestones in fiscal
2018.
On
September 6, 2017, we entered into a License Agreement (the
“Fosun License Agreement”) with Fosun for exclusive
rights to commercialize Vyleesi in the territories of mainland
China, Taiwan, Hong Kong S.A.R. and Macau S.A.R., which provided
for $5,000,000 as a one-time non-refundable upfront payment.
Pursuant to the Fosun License Agreement with Fosun, $500,000 was
withheld in accordance with tax withholding requirements in China
and was recorded as an expense during fiscal 2018.
On
November 21, 2017, we entered into a License Agreement (the
“Kwangdong License Agreement”) with Kwangdong for
exclusive rights to commercialize Vyleesi in the Republic of Korea,
which provided for a $500,000 one-time refundable upfront payment,
which has been recorded as non-current deferred revenue as of June
30, 2018. Pursuant to the License Agreement with Kwangdong, $82,500
was withheld in accordance with tax withholding requirements in
South Korea and was recorded as an expense during fiscal
2018.
Research and Development
– Research and development
expenses were $32,566,217 for fiscal 2018 compared to $45,683,174
for fiscal 2017. These costs primarily relate to our Vyleesi Phase
3 clinical trial program and ancillary studies necessary to file an
NDA for Vyleesi for HSDD.
Research
and development expenses related to our Vyleesi, PL-3994, PL-8177,
MC1r, MC4r and other preclinical programs were $27,449,494 and
$41,146,970 in fiscal 2018 and fiscal 2017, respectively. Spending
to date has been primarily related to our Vyleesi for the treatment
of HSDD program. The decrease in research and development expenses
is mainly attributable to the conclusion of Phase 3 clinical trial
and development of Vyleesi for HSDD. The amount of such spending
and the nature of future development activities are dependent on a
number of factors, including primarily the availability of funds to
support future development activities, success of our clinical
trials and preclinical and discovery programs, and our ability to
progress compounds in addition to Vyleesi, PL-8177 and PL-3994 into
human clinical trials.
The
amounts of project spending above exclude general research and
development spending, which was $5,116,723 and $4,536,204 in fiscal
2018 and fiscal 2017, respectively. The increase in general
research and development spending is primarily attributable to
additional staffing and secondarily to the recognition of
stock-based compensation.
Cumulative
spending from inception to June 30, 2018 was approximately
$306,900,000 on our Vyleesi program and approximately $130,400,000
on all our other programs (which include PL-3994, PL-8177, other
melanocortin receptor agonists, other discovery programs and
terminated programs). Due to various risk factors described herein
under “Risk Factors,” including the difficulty in
currently estimating the costs and timing of future Phase 1
clinical trials and larger-scale Phase 2 and Phase 3 clinical
trials for any product under development, we cannot predict with
reasonable certainty when, if ever, a program will advance to the
next stage of development or be successfully completed, or when, if
ever, related net cash inflows will be generated.
41
General and Administrative
– General and
administrative expenses, which consist mainly of compensation and
related costs, were $8,641,976 for fiscal 2018 compared to
$9,610,147 for fiscal 2017. The decrease in general and
administrative expenses is primarily attributable to payment for
professional services of Greenhill & Co. LLC in fiscal 2017
relating to entering into our license agreement with AMAG and
offset by employee related expenses recognized in the
year.
Other Income (Expense)
– Total other expense, net was
$(1,141,351) and $(2,262,039) for fiscal 2018 and fiscal 2017,
respectively. For fiscal 2018, we recognized $(1,452,014) of
interest expense primarily related to our venture debt offset by
$310,663 of investment income. For fiscal 2017, we recognized
$(2,288,309) of interest expense primarily related to our venture
debt offset by $26,270 of investment income. The decrease in
interest expense relates to our paying down of the venture
debt.
Income Taxes
– Income tax expense was $82,500 in
fiscal 2018 compared to $500,000 in fiscal 2017. The fiscal 2018
income tax expense relates to foreign withholding taxes of $582,500
offset by an income tax benefit of $500,000 resulting from the 2017
Tax Act under which Alternative Minimum Tax (“AMT”)
credits became refundable and the valuation allowance against the
Company’s previously estimated AMT credits was
released.
Year Ended June 30, 2017 Compared to the Year Ended June 30,
2016:
Revenue –
For fiscal 2017, we recognized $44,723,827
in revenue pursuant to our license agreement with AMAG. For the
fiscal year ended June 30, 2016 (“fiscal 2016”), we did
not recognize any revenue. As of June 30, 2017, $4,657,577 was
received under the agreement and $15,116,822 was included in
accounts receivable relating to reimbursable expenses.
Research and Development
– Research and development
expenses were $45,683,174 for fiscal 2017 compared to $43,071,051
for fiscal 2016. These costs primarily relate to our Vyleesi Phase
3 clinical trial program.
Research
and development expenses related to our Vyleesi, PL-3994, MC1r,
MC4r and other preclinical programs were $41,146,970 and
$39,371,908 in fiscal 2017 and fiscal 2016, respectively. Spending
to date was primarily related to our Vyleesi for the treatment of
HSDD program. The increase in research and development expenses is
mainly attributable to the continued progress of Phase 3 clinical
trial and development of Vyleesi for HSDD. The amount of such
spending and the nature of future development activities are
dependent on a number of factors, including primarily the
availability of funds to support future development activities,
success of our clinical trials and preclinical and discovery
programs, and our ability to progress compounds in addition to
Vyleesi and PL-3994 into human clinical trials.
The
amounts of project spending above exclude general research and
development spending, which was $4,536,204 and $3,699,143 in fiscal
2017 and fiscal 2016, respectively. The increase in general
research and development spending is primarily attributable to
additional staffing and secondarily to the recognition of
stock-based compensation.
Cumulative
spending from inception to June 30, 2017 was approximately
$279,000,000 on our Vyleesi program and approximately $125,400,000
on all our other programs (which include PL-3994, PL-8177, other
melanocortin receptor agonists, other discovery programs and
terminated programs). Due to various risk factors described herein
under “Risk Factors,” including the difficulty in
currently estimating the costs and timing of future Phase 1
clinical trials and larger-scale Phase 2 and Phase 3 clinical
trials for any product under development, we cannot predict with
reasonable certainty when, if ever, a program will advance to the
next stage of development or be successfully completed, or when, if
ever, related net cash inflows will be generated.
General and Administrative
– General and
administrative expenses, which consist mainly of compensation and
related costs, were $9,610,147 for fiscal 2017 compared to
$6,179,084 for fiscal 2016. The increase in general and
administrative expenses is primarily attributable to payment for
professional services of Greenhill & Co. LLC relating to
entering into our license agreement with AMAG and secondarily
attributable to employee related expenses recognized in the
year.
Other Income (Expense)
– Total other expense, net was
$(2,262,039) and $(2,462,801) for fiscal 2017 and fiscal 2016,
respectively. For fiscal 2017, we recognized $(2,288,309) of
interest expense primarily related to our venture debt offset by
$26,270 of investment income. For fiscal 2016, we recognized
$(2,513,027) of interest expense primarily related to our venture
debt offset by $50,226 of investment income.
Income Taxes
– Income tax expense was $500,000 in
fiscal 2017 compared to no income tax expense or benefit in fiscal
2016. The fiscal 2017 income tax expense related to estimated
alternative minimum tax (“AMT”) expense based on
estimated federal alternative minimum taxable income attributable
to the $60,000,000 initial payment from AMAG.
Effects of Inflation
We do
not believe that inflation has had a material impact on our
business, revenues or operating results during the periods
presented.
42
Liquidity and Capital Resources
Since
inception, we have incurred net operating losses, primarily related
to spending on our research and development programs. We have
financed our net operating losses primarily through debt and equity
financings and amounts received under collaborative
agreements.
Our
product candidates are at various stages of development and will
require significant further research, development and testing and
some may never be successfully developed or commercialized. We may
experience uncertainties, delays, difficulties and expenses
commonly experienced by early stage biopharmaceutical companies,
which may include unanticipated problems and additional costs
relating to:
●
the development and
testing of products in animals and humans;
●
product approval or
clearance;
●
regulatory
compliance;
●
GMP
compliance;
●
intellectual
property rights;
●
product
introduction;
●
marketing, sales
and competition; and
●
obtaining
sufficient capital.
Failure
to enter into or successfully perform under collaboration
agreements and obtain timely regulatory approval for our product
candidates and indications would impact our ability to increase
revenues and could make it more difficult to attract investment
capital for funding our operations. Any of these possibilities
could materially and adversely affect our operations and require us
to curtail or cease certain programs.
During
fiscal 2018, net cash provided by operating activities was
$1,703,103 compared to net cash provided by operating activities of
$12,881,527 in fiscal 2017, compared to cash used in operating
activities of $47,363,814 in fiscal 2016. The difference in cash
provided by operations in fiscal 2018 compared with fiscal 2017 was
the result of the initial payment in fiscal 2017 and lower cash
receipts relating to the license agreement with AMAG. The
difference of cash provided by and cash used in operations in
fiscal 2017 compared to fiscal 2016 was primarily the result of the
receipt of the initial payment of $60,000,000 relating to the
License Agreement with AMAG.
During
fiscal 2018, net cash provided by investing activities was
$227,549, which consisted of $250,000 of proceeds from maturity of
investments offset by $22,451 used for the acquisition of
equipment. During fiscal 2017, net cash provided by investing
activities was $991,596, which consisted of $1,124,999 of proceeds
from the maturity of investments offset by $133,403 used for the
acquisition of equipment. During fiscal 2016, net cash used in
investing activities was $1,404,717, consisting primarily of the
purchase of investments.
During
fiscal 2018, net cash used in financing activities was $4,130,805,
which consisted of payments of capital lease obligations of
$14,324, payment of withholding taxes related to restricted stock
units of $45,165, and payment of debt obligations of $8,000,000,
offset by proceeds from the exercise of stock options, and common
stock warrants of $2,670,910 and sale of common stock of
$1,257,774. During fiscal 2017, net cash provided by financing
activities was $18,324,533, which consisted of net proceeds from
our underwritten offerings of units consisting of our common stock
and warrants in August and December 2016 of $23,856,973 and
proceeds from the exercise of warrants of $164,358, offset by
$5,696,798 for the payments on notes payable, capital lease
payments and the payment of withholding taxes related to restricted
stock units. During fiscal 2016, net cash provided by financing
activities was $29,471,931, which consisted of a private placement
with net proceeds of $19,834,278, a loan of $9,853,885, net of
related debt issuance costs, offset by $216,232 for the payment of
withholding taxes related to restricted stock units and capital
lease payments.
We have
incurred cumulative negative cash flows from operations since our
inception, and have expended, and expect to continue to expend in
the future, substantial funds to complete our planned product
development efforts. Continued operations are dependent upon our
ability to complete equity or debt financing activities and enter
into licensing or collaboration arrangements. As of June 30, 2018,
our cash and cash equivalents were $38,000,171 and our current
liabilities were $10,762,965.
We
intend to utilize existing capital resources for general corporate
purposes and working capital, including Vyleesi, preclinical and
clinical development of our MC1r and MC4r peptide programs and
natriuretic peptide program, and development of other portfolio
products.
43
We
believe that our existing capital resources, together with proceeds
received from sales of common stock in our
“at-the-market” program (if any), will be adequate to
fund our planned operations through at least September 30, 2019. We
will need additional funding to complete required clinical trials
for our product candidates and development programs other than
Vyleesi and, if those clinical trials are successful (which we
cannot predict), to complete submission of required regulatory
applications to the FDA.
We had
net income for fiscal 2018 of $24,702,714, and may attain
profitability in the fiscal year ending June 30, 2019 but only if
the FDA approves the NDA on Vyleesi for HSDD. We may not sustain
profitability in future years, which is dependent on numerous
factors, including whether and when development and sales
milestones are met, regulatory actions by the FDA and other
regulatory bodies, the performance of our licensees, and market
acceptance of our products.
We
expect to incur significant expenses as we continue our development
of natriuretic peptide and MC1r products. These expenses, among
other things, have had and will continue to have an adverse effect
on our stockholders’ equity, total assets and working
capital.
Off-Balance Sheet Arrangements
None.
Contractual Obligations
We have
entered into various contractual obligations and commercial
commitments. The following table summarizes our most significant
contractual obligations as of June 30, 2018:
|
|
Payments due by
Period
|
||||
|
|
Total
|
Less than 1
Year
|
1 - 3
Years
|
3 - 5
Years
|
More than 5
Years
|
|
|
|
|
|
|
|
|
Facility operating
leases
|
$
488,096
|
$
260,960
|
$
227,136
|
$
-
|
$
-
|
|
Notes payable,
including interest
|
7,619,134
|
6,783,212
|
835,922
|
-
|
-
|
|
|
|
|
|
|
|
|
Total contractual
obligations
|
$
8,107,230
|
$
7,044,172
|
$
1,063,058
|
$
-
|
$
-
|
Not
applicable.
44
Table of Contents
Consolidated Financial Statements
The
following consolidated financial statements are filed as part of
this Annual Report:
|
|
Page
|
|
|
|
|
Report
of Independent Registered Public Accounting Firm
|
46
|
|
|
|
|
Consolidated
Balance Sheets
|
47
|
|
|
|
|
Consolidated
Statements of Operations
|
48
|
|
|
|
|
Consolidated
Statements of Comprehensive Income (Loss)
|
49
|
|
|
|
|
Consolidated
Statements of Stockholders’ Equity (Deficiency)
|
50
|
|
|
|
|
Consolidated
Statements of Cash Flows
|
51
|
|
|
|
|
Notes
to Consolidated Financial Statements
|
52
|
45
Report of Independent Registered Public Accounting
Firm
To the
Stockholders and Board of Directors
Palatin
Technologies, Inc.:
Opinion on the Consolidated Financial Statements
We have
audited the accompanying consolidated balance sheets of Palatin
Technologies, Inc. and subsidiary (the Company) as of
June 30, 2018 and 2017, the related consolidated statements of
operations, comprehensive income (loss), stockholders’ equity
(deficiency), and cash flows for each of the years in the
three-year period ended June 30, 2018, and the related notes
(collectively, the consolidated financial statements). In our
opinion, the consolidated financial statements present fairly, in
all material respects, the financial position of the Company as of
June 30, 2018 and 2017, and the results of its operations and
its cash flows for each of the years in the three-year period ended
June 30, 2018, in conformity with U.S. generally accepted
accounting principles.
We also
have audited, in accordance with the standards of the Public
Company Accounting Oversight Board (United States) (PCAOB), the
Company’s internal control over financial reporting as of
June 30, 2018, based on criteria established in
Internal Control – Integrated Framework
(2013)
issued by the Committee of Sponsoring Organizations
of the Treadway Commission, and our report dated September 13, 2018
expressed an unqualified opinion on the effectiveness of the
Company’s internal control over financial
reporting.
Basis for Opinion
These
consolidated financial statements are the responsibility of the
Company’s management. Our responsibility is to express an
opinion on these consolidated financial statements based on our
audits. We are a public accounting firm registered with the PCAOB
and are required to be independent with respect to the Company in
accordance with the U.S. federal securities laws and the
applicable rules and regulations of the Securities and Exchange
Commission and the PCAOB.
We
conducted our audits in accordance with the standards of the PCAOB.
Those standards require that we plan and perform the audit to
obtain reasonable assurance about whether the consolidated
financial statements are free of material misstatement, whether due
to error or fraud. Our audits included performing procedures to
assess the risks of material misstatement of the consolidated
financial statements, whether due to error or fraud, and performing
procedures that respond to those risks. Such procedures included
examining, on a test basis, evidence regarding the amounts and
disclosures in the consolidated financial statements. Our audits
also included evaluating the accounting principles used and
significant estimates made by management, as well as evaluating the
overall presentation of the consolidated financial statements. We
believe that our audits provide a reasonable basis for our
opinion.
/s/
KPMG LLP
We have
served as the Company’s auditor since 2002.
Philadelphia,
Pennsylvania
September
13, 2018
46
|
PALATIN TECHNOLOGIES, INC
.
|
||
|
and
Subsidiary
|
||
|
|
|
|
June
30,
2018
|
June
30,
2017
|
|
ASSETS
|
|
|
|
Current
assets:
|
|
|
|
Cash and cash
equivalents
|
$
38,000,171
|
$
40,200,324
|
|
Available-for-sale
investments
|
-
|
249,837
|
|
Accounts
receivable
|
-
|
15,116,822
|
|
Prepaid expenses
and other current assets
|
513,688
|
1,011,221
|
|
Total current
assets
|
38,513,859
|
56,578,204
|
|
|
|
|
|
Property and
equipment, net
|
164,035
|
198,153
|
|
Other
assets
|
338,916
|
56,916
|
|
Total
assets
|
$
39,016,810
|
$
56,833,273
|
|
|
|
|
|
LIABILITIES
AND STOCKHOLDERS’ EQUITY (DEFICIENCY)
|
|
|
|
Current
liabilities:
|
|
|
|
Accounts
payable
|
$
2,223,693
|
$
1,551,367
|
|
Accrued
expenses
|
2,103,021
|
10,521,098
|
|
Notes payable, net
of discount
|
5,948,763
|
7,824,935
|
|
Capital lease
obligations
|
-
|
14,324
|
|
Deferred
revenue
|
-
|
35,050,572
|
|
Other current
liabilities
|
487,488
|
-
|
|
Total current
liabilities
|
10,762,965
|
54,962,296
|
|
|
|
|
|
Notes payable, net
of discount
|
332,898
|
6,281,660
|
|
Deferred
revenue
|
500,000
|
-
|
|
Other non-current
liabilities
|
456,038
|
753,961
|
|
Total
liabilities
|
12,051,901
|
61,997,917
|
|
|
|
|
|
Commitments and
contingencies (Note 13)
|
|
|
|
|
|
|
|
Stockholders’
equity (deficiency):
|
|
|
|
Preferred stock of
$0.01 par value – authorized 10,000,000 shares:
|
|
|
|
Series A
Convertible: issued and outstanding 4,030 shares as of June 30,
2018 and June 30, 2017
|
40
|
40
|
|
Common stock of
$0.01 par value – authorized 300,000,000 shares;
|
|
|
|
issued and
outstanding 200,554,205 shares as of June 30, 2018 and 160,515,361
as of June 30, 2017
|
2,005,542
|
1,605,153
|
|
Additional paid-in
capital
|
357,005,233
|
349,974,538
|
|
Accumulated other
comprehensive loss
|
-
|
(590
)
|
|
Accumulated
deficit
|
(332,045,906
)
|
(356,743,785
)
|
|
Total
stockholders’ equity (deficiency)
|
26,964,909
|
(5,164,644
)
|
|
Total liabilities
and stockholders’ equity (deficiency)
|
$
39,016,810
|
$
56,833,273
|
The
accompanying notes are an integral part of these consolidated
financial statements
47
|
PALATIN
TECHNOLOGIES, INC.
|
|||
|
and
Subsidiary
|
|||
|
|
|
|
Year Ended June
30,
|
||
|
|
2018
|
2017
|
2016
|
|
|
|
|
|
|
REVENUES
|
|
|
|
|
License and
contract
|
$
67,134,758
|
$
44,723,827
|
$
-
|
|
|
|
|
|
|
OPERATING
EXPENSES
|
|
|
|
|
Research and
development
|
32,566,217
|
45,683,174
|
43,071,051
|
|
General and
administrative
|
8,641,976
|
9,610,147
|
6,179,084
|
|
Total operating
expenses
|
41,208,193
|
55,293,321
|
49,250,135
|
|
|
|
|
|
|
Income (loss) from
operations
|
25,926,565
|
(10,569,494
)
|
(49,250,135
)
|
|
|
|
|
|
|
OTHER INCOME
(EXPENSE)
|
|
|
|
|
Investment
income
|
310,663
|
26,270
|
50,226
|
|
Interest
expense
|
(1,452,014
)
|
(2,288,309
)
|
(2,513,027
)
|
|
Total other
expense, net
|
(1,141,351
)
|
(2,262,039
)
|
(2,462,801
)
|
|
|
|
|
|
|
Income (loss)
before income taxes
|
24,785,214
|
(12,831,533
)
|
(51,712,936
)
|
|
Income tax
expense
|
(82,500
)
|
(500,000
)
|
-
|
|
|
|
|
|
|
NET INCOME
(LOSS)
|
$
24,702,714
|
$
(13,331,533
)
|
$
(51,712,936
)
|
|
|
|
|
|
|
Basic net income
(loss) per common share
|
$
0.12
|
$
(0.07
)
|
$
(0.33
)
|
|
|
|
|
|
|
Diluted net income
(loss) income per common share
|
$
0.12
|
$
(0.07
)
|
$
(0.33
)
|
|
|
|
|
|
|
Weighted average
number of common shares outstanding used in computing basic net
income (loss) per common share
|
198,101,060
|
184,087,719
|
156,553,534
|
|
|
|
|
|
|
Weighted average
number of common shares outstanding used in computing diluted
income (loss) per common share
|
207,007,558
|
184,087,719
|
156,553,534
|
The
accompanying notes are an integral part of these consolidated
financial statements
48
|
PALATIN
TECHNOLOGIES, INC.
|
|||
|
and
Subsidiary
|
|||
|
Consolidated
Statements of Comprehensive Income (Loss)
|
|||
|
|
|||
|
|
Year Ended June
30,
|
||
|
|
2018
|
2017
|
2016
|
|
|
|
|
|
|
Net income
(loss)
|
$
24,702,714
|
$
(13,331,533
)
|
$
(51,712,936
)
|
|
|
|
|
|
|
Other comprehensive
income (loss):
|
|
|
|
|
Unrealized gain
(loss) on available-for-sale investments
|
590
|
1,354
|
(1,944
)
|
|
|
|
|
|
|
Total comprehensive
income (loss)
|
$
24,703,304
|
$
(13,330,179
)
|
$
(51,714,880
)
|
The accompanying notes are an integral part of these consolidated
financial statements
49
|
PALATIN TECHNOLOGIES, INC.
|
|||||||||
|
and Subsidiary
|
|||||||||
|
Consolidated Statements of Stockholders’ Equity
(Deficiency)
|
|
|
|
|
|
|
Additional
|
Accumulated
Other
|
|
|
|
|
Preferred
Stock
|
Common
Stock
|
Paid-in
|
Comprehensive
|
Accumulated
|
|
||
|
|
Shares
|
Amount
|
Shares
|
Amount
|
Capital
|
Income
(Loss)
|
Deficit
|
Total
|
|
Balance, June 30,
2015
|
4,697
|
$
47
|
57,128,433
|
$
571,284
|
$
303,332,460
|
$
-
|
$
(291,699,316
)
|
$
12,204,475
|
|
Stock-based
compensation
|
-
|
-
|
662,186
|
6,622
|
1,836,743
|
-
|
-
|
1,843,365
|
|
Sale of common stock units, net of
costs
|
-
|
-
|
-
|
-
|
19,834,278
|
-
|
-
|
19,834,278
|
|
Issuance of warrants on
debt
|
-
|
-
|
-
|
-
|
305,196
|
-
|
-
|
305,196
|
|
Withholding taxes related to
restricted stock units
|
-
|
-
|
(123,483
)
|
(1,235
)
|
(57,166
)
|
-
|
-
|
(58,401
)
|
|
Warrant
exercises
|
-
|
-
|
10,890,889
|
108,909
|
(108,909
)
|
-
|
-
|
-
|
|
Series A
Conversion
|
(667
)
|
(7
)
|
10,030
|
100
|
(93
)
|
-
|
-
|
-
|
|
Unrealized loss on
investments
|
-
|
-
|
-
|
-
|
-
|
(1,944
)
|
-
|
(1,944
)
|
|
Net loss
|
-
|
-
|
-
|
-
|
-
|
-
|
(51,712,936
)
|
(51,712,936
)
|
|
Balance, June 30,
2016
|
4,030
|
40
|
68,568,055
|
685,680
|
325,142,509
|
(1,944
)
|
(343,412,252
)
|
(17,585,967
)
|
|
Stock-based
compensation
|
-
|
-
|
579,400
|
5,794
|
1,751,465
|
-
|
-
|
1,757,259
|
|
Sale of common stock units, net of
costs
|
-
|
-
|
36,866,097
|
368,661
|
23,488,312
|
-
|
-
|
23,856,973
|
|
Withholding taxes related to
restricted stock units
|
-
|
-
|
(75,993
)
|
(760
)
|
(26,328
)
|
-
|
-
|
(27,088
)
|
|
Warrant
exercises
|
-
|
-
|
54,577,802
|
545,778
|
(381,420
)
|
-
|
-
|
164,358
|
|
Unrealized gains on
investments
|
-
|
-
|
-
|
-
|
-
|
1,354
|
-
|
1,354
|
|
Net loss
|
-
|
-
|
-
|
-
|
-
|
-
|
(13,331,533
)
|
(13,331,533
)
|
|
Balance, June 30,
2017
|
4,030
|
40
|
160,515,361
|
1,605,153
|
349,974,538
|
(590
)
|
(356,743,785
)
|
(5,164,644
)
|
|
Cumulative effect of accounting
change
|
-
|
-
|
-
|
-
|
4,835
|
-
|
(4,835
)
|
-
|
|
Stock-based
compensation
|
-
|
-
|
795,041
|
7,951
|
3,510,400
|
-
|
-
|
3,518,351
|
|
Sale of common stock , net of
costs
|
-
|
-
|
1,283,754
|
12,838
|
1,244,936
|
-
|
-
|
1,257,774
|
|
Withholding taxes related to
restricted stock units
|
-
|
-
|
(27,465
)
|
(275
)
|
(20,511
)
|
-
|
-
|
(20,786
)
|
|
Warrant
exercises
|
-
|
-
|
37,778,614
|
377,786
|
2,133,243
|
-
|
-
|
2,511,029
|
|
Option
exercises
|
-
|
-
|
208,900
|
2,089
|
157,792
|
-
|
-
|
159,881
|
|
Unrealized gains on
investments
|
-
|
-
|
-
|
-
|
-
|
590
|
-
|
590
|
|
Net Income
|
-
|
-
|
-
|
-
|
-
|
-
|
24,702,714
|
24,702,714
|
|
Balance, June 30,
2018
|
4,030
|
$
40
|
200,554,205
|
$
2,005,542
|
$
357,005,233
|
$
-
|
$
(332,045,906
)
|
$
26,964,909
|
The
accompanying notes are an integral part of these consolidated
financial statements
50
|
PALATIN TECHNOLOGIES, INC.
|
|||||
|
and Subsidiary
|
|||||
|
|
|
|
Year Ended June
30,
|
||
|
|
2018
|
2017
|
2016
|
|
CASH FLOWS FROM
OPERATING ACTIVITIES:
|
|
|
|
|
Net
income (loss)
|
$
24,702,714
|
$
(13,331,533
)
|
$
(51,712,936
)
|
|
Adjustments
to reconcile net income (loss) to net cash provided by
|
|
|
|
|
(used)
in operating activities:
|
|
|
|
|
Depreciation and
amortization
|
56,569
|
33,051
|
43,052
|
|
Non-cash interest
expense
|
175,493
|
298,790
|
327,479
|
|
Stock-based
compensation
|
3,518,351
|
1,757,259
|
1,843,365
|
|
Deferred income tax
benefit
|
(500,000
)
|
|
|
|
Changes in
operating assets and liabilities:
|
|
|
|
|
Accounts
receivable
|
15,116,822
|
(15,116,822
)
|
-
|
|
Prepaid expenses
and other assets
|
715,533
|
308,917
|
503,785
|
|
Accounts
payable
|
672,326
|
837,477
|
(392,594
)
|
|
Accrued
expenses
|
(8,393,698
)
|
2,728,985
|
1,676,209
|
|
Deferred
revenue
|
(34,550,572
)
|
35,050,572
|
-
|
|
Other non-current
liabilities
|
189,565
|
314,831
|
347,826
|
|
Net cash provided
by (used in) operating activities
|
1,703,103
|
12,881,527
|
(47,363,814
)
|
|
|
|
|
|
|
CASH FLOWS FROM
INVESTING ACTIVITIES:
|
|
|
|
|
Proceeds from
sale/maturity of investments
|
250,000
|
1,124,999
|
-
|
|
Purchases of
investments
|
-
|
-
|
(1,387,022
)
|
|
Purchases of
property and equipment
|
(22,451
)
|
(133,403
)
|
(17,695
)
|
|
Net cash provided
by (used in) investing activities
|
227,549
|
991,596
|
(1,404,717
)
|
|
|
|
|
|
|
CASH FLOWS FROM
FINANCING ACTIVITIES:
|
|
|
|
|
Payments on capital
lease obligations
|
(14,324
)
|
(27,424
)
|
(25,872
)
|
|
Payment of
withholding taxes related to restricted
|
|
|
|
|
stock
units
|
(45,165
)
|
(2,708
)
|
(190,360
)
|
|
Payment on debt
obligations
|
(8,000,000
)
|
(5,666,666
)
|
-
|
|
Proceeds from the
exercise of stock options
|
159,881
|
-
|
-
|
|
Proceeds from
exercise of common stock warrants
|
2,511,029
|
164,358
|
-
|
|
Proceeds from the
sale of common stock and warrants, net
|
|
|
|
|
of
costs
|
1,257,774
|
23,856,973
|
19,834,278
|
|
Proceeds from the
issuance of notes payable and warrants
|
-
|
-
|
10,000,000
|
|
Payment of debt
issuance costs
|
-
|
-
|
(146,115
)
|
|
Net cash (used in)
provided by financing activities
|
(4,130,805
)
|
18,324,533
|
29,471,931
|
|
|
|
|
|
|
NET (DECREASE)
INCREASE IN CASH
|
|
|
|
|
AND
CASH EQUIVALENTS
|
(2,200,153
)
|
32,197,656
|
(19,296,600
)
|
|
|
|
|
|
|
CASH AND CASH
EQUIVALENTS, beginning of year
|
40,200,324
|
8,002,668
|
27,299,268
|
|
|
|
|
|
|
CASH AND CASH
EQUIVALENTS, end of year
|
$
38,000,171
|
$
40,200,324
|
$
8,002,668
|
|
|
|
|
|
|
SUPPLEMENTAL CASH
FLOW INFORMATION:
|
|
|
|
|
Cash paid for
interest
|
$
1,084,158
|
$
1,676,954
|
$
1,836,743
|
|
Issuance of
warrants in connection with debt financing
|
-
|
-
|
305,196
|
The
accompanying notes are an integral part of these consolidated
financial statements
51
PALATIN TECHNOLOGIES, INC.
and Subsidiary
Notes to Consolidated Financial Statements
(1)
ORGANIZATION
Palatin
Technologies, Inc. (“Palatin” or the
“Company”) is a specialized biopharmaceutical company
developing first-in-class medicines based on molecules that
modulate the activity of the melanocortin and natriuretic peptide
receptor systems. Our product candidates are targeted,
receptor-specific therapeutics for the treatment of diseases with
significant unmet medical need and commercial potential. Our most
advanced product candidate is Vyleesi™, the trade name for
bremelanotide, a peptide melanocortin receptor 4 (MC4r) agonist,
for the treatment of premenopausal women with acquired, generalized
hypoactive sexual desire disorder (“HSDD”), which is a
type of female sexual dysfunction (“FSD”), defined as
low desire with associated distress or interpersonal difficulty. A
New Drug Application (“NDA”) has been submitted to the
U.S. Food and Drug Administration (“FDA”) by our
exclusive North American licensee, AMAG Pharmaceuticals, Inc.
(“AMAG”) and accepted for filing by the FDA, with an
FDA decision on approval expected in the first quarter of calendar
2019.
Vyleesi.
Vyleesi is an on demand subcutaneous injectable
product for the treatment of HSDD in premenopausal women. Vyleesi
is a synthetic peptide analog of the naturally occurring hormone
alpha-MSH (melanocyte-stimulating hormone). In March 2018, our
exclusive North American licensee for Vyleesi, AMAG, submitted an
NDA to the FDA for Vyleesi for the treatment of HSDD in
premenopausal women, which was accepted for filing and review by
the FDA. The Prescription Drug User Fee Act (“PDUFA”)
date for completion of FDA review of the Vyleesi NDA is March 23,
2019. We have also licensed rights to Vyleesi to Shanghai Fosun
Pharmaceutical Industrial Development Co. Ltd.
(“Fosun”) for the territories of the People’s
Republic of China, Taiwan, Hong Kong S.A.R. and Macau S.A.R.
(collectively, “China”), and Kwangdong Pharmaceutical
Co., Ltd. (“Kwangdong”) for the Republic of Korea
(“Korea”).
Our
Phase 3 studies for HSDD in premenopausal women, called the
RECONNECT studies, consisted of two double-blind
placebo-controlled, randomized parallel group studies comparing the
on demand use of 1.75 mg of Vyleesi versus placebo, in each case,
delivered via a subcutaneous auto-injector. Each trial consisted of
more than 600 patients randomized in a 1:1 ratio to either the
treatment arm or placebo with a 24-week evaluation period. In both
clinical trials, Vyleesi met the pre-specified co-primary efficacy
endpoints of improvement in desire and decrease in distress
associated with low sexual desire as measured using validated
patient-reported outcome instruments.
After
completing the studies, patients had the option to continue in an
open-label safety extension study for an additional 52 weeks.
Nearly 80% of patients who completed the randomized portion of the
study elected to remain in the open-label portion of the study. In
the Phase 3 clinical trials, the most frequent adverse events were
nausea, flushing, and headache, which were generally
mild-to-moderate in intensity and were transient.
We
retain worldwide rights for Vyleesi for HSDD and all other
indications outside North America, Korea and China. We are actively
seeking potential partners for marketing and commercialization
rights for Vyleesi for HSDD outside the licensed territories.
However, we may not be able to enter into suitable agreements with
potential partners on acceptable terms, if at all.
Melanocortin Receptor Systems.
There are five melanocortin
receptors, MC1r through MC5r. Modulation of these receptors,
through use of receptor-specific agonists, which activate receptor
function, or receptor-specific antagonists, which block receptor
function, can have significant pharmacological effects. Our new
product development activities primarily focus on MC1r agonists,
with potential to treat a number of inflammatory and autoimmune
diseases such as dry eye disease, also known as
keratoconjunctivitis sicca, uveitis, diabetic retinopathy and
inflammatory bowel disease. We believe that MC1r agonists,
including the MC1r agonist peptides we are developing, have broad
anti-inflammatory effects and appear to utilize mechanisms engaged
by the endogenous melanocortin system in regulation of the immune
system and resolution of inflammatory responses. We are also
developing peptides that are active at more than one melanocortin
receptor, and MC4r agonists, with potential utility in a number of
obesity and metabolic-related disorders, including rare disease and
orphan indications.
52
PALATIN TECHNOLOGIES, INC.
and Subsidiary
Notes to Consolidated Financial Statements
●
PL-8177, a
selective MC1r agonist peptide, is our lead clinical development
candidate for inflammatory bowel diseases, with potential
applicability for a number of other diseases. We filed an
Investigational New Drug (“IND”) application on PL-8177
in late 2017 and have completed subcutaneous dosing of human
subjects in a Phase 1 single and multiple ascending dose clinical
safety study, with data expected in the fourth quarter of calendar
year 2018. We anticipate starting a clinical study with oral dosing
of PL-8177 in human subjects in the second half of calendar year
2018, with data expected in the first half of calendar
2019.
●
PL-8331, a dual
MC1r and MC5r peptide agonist, is a preclinical development
candidate for treating ocular inflammation. We have initiated IND
preclinical enabling activities with PL-8331, and if results are
favorable, anticipate filing an IND and initiating clinical trials
for treatment of dry eye disease in the second half of calendar
year 2019.
●
We have initiated
preclinical programs with MC4r peptides and orally-active small
molecules for treatment of rare genetic metabolic and obesity
disorders, and if results are favorable, anticipate selecting a
lead clinical development candidate and completing IND enabling
activities in calendar year 2019.
Natriuretic Peptide Receptor Systems.
The natriuretic
peptide receptor (“NPR”) system has numerous
cardiovascular functions, and therapeutic agents modulating this
system may be useful in treatment of cardiovascular diseases,
including reducing cardiac hypertrophy and fibrosis, heart failure,
acute asthma, other pulmonary diseases and hypertension. While the
therapeutic potential of modulating this system is well
appreciated, development of therapeutic agents has been difficult
due, in part, to the short biological half-life of native peptide
agonists. We have designed and are developing potential NPR
candidate drugs that are selective for one or more different
natriuretic peptide receptors, including natriuretic peptide
receptor-A (“NPR-A”), natriuretic peptide receptor B
(“NPR-B”), and natriuretic peptide receptor C
(“NPR-C”).
●
PL-3994 is an NPR-A
agonist we developed which has completed Phase 1 clinical safety
studies. It has potential utility in treatment of a number of
cardiovascular diseases, including genetic and orphan diseases
resulting from a deficiency of endogenous active NPR-A. We have
ongoing academic collaborations with several institutions with
PL-3994.
●
PL-5028, a dual
NPR-A and NPR-C agonist we developed, is in preclinical development
for cardiovascular diseases, including reducing cardiac hypertrophy
and fibrosis. We have ongoing academic collaborations with several
institutions with PL-5028, and seek to enter into a development
partnership by the end of calendar year 2019.
Business Risk and Liquidity –
Since inception, the
Company has incurred negative cash flows from operations, and has
expended, and expects to continue to expend, substantial funds to
complete its planned product development efforts. As shown in the
accompanying consolidated financial statements, the Company had an
accumulated deficit as of June 30, 2018 of $332,045,906 and while
the Company earned net income for fiscal 2018 of $24,702,714, the
Company anticipates incurring significant expenses in the future as
a result of spending on its development programs and will require
substantial additional financing or revenues to continue to fund
its planned developmental activities. To achieve sustained
profitability, if ever, the Company, alone or with others, must
successfully develop and commercialize its technologies and
proposed products, conduct successful preclinical studies and
clinical trials, obtain required regulatory approvals and
successfully manufacture and market such technologies and proposed
products. The time required to reach sustained profitability is
highly uncertain, and the Company may never be able to achieve
profitability on a sustained basis, if at all.
As of
June 30, 2018, the Company’s cash and cash equivalents, were
$38,000,171 and current liabilities were $10,762,965. We intend to
utilize existing capital resources for general corporate purposes
and working capital, including, preclinical and clinical
development of our MC1r and MC4r peptide programs and natriuretic
peptide program, and development of other portfolio
products.
Management
believes that the Company’s existing capital resources,
together with proceeds received from sales of common stock in the
Company’s “at-the-market” program (if any), will
be adequate to fund the Company’s planned operations through
at least September 30, 2019. The Company will need additional
funding to complete required clinical trials for its other product
candidates and, assuming those clinical trials are successful, as
to which there can be no assurance, to complete submission of
required applications to the FDA. If the Company is unable to
obtain approval or otherwise advance in the FDA approval process,
the Company’s ability to sustain its operations would be
materially adversely affected.
53
PALATIN TECHNOLOGIES, INC.
and Subsidiary
Notes to Consolidated Financial Statements
The
Company may seek the additional capital necessary to fund its
operations through public or private equity offerings,
collaboration agreements, debt financings or licensing
arrangements. Additional capital that is required by the Company
may not be available on reasonable terms, or at all.
Concentrations –
Concentrations in the Company’s
assets and operations subject it to certain related risks.
Financial instruments that subject the Company to concentrations of
credit risk primarily consist of cash and cash equivalents,
accounts receivable and investments. The Company’s cash and
cash equivalents are primarily invested in one money market account
sponsored by a large financial institution. For year ended June 30,
2018, the Company reported $62,134,758 in license and contract
revenue related to a license agreement with AMAG for Vyleesi for
North America (“AMAG License Agreement”) (Note 4). In
addition, for the year ended June 30, 2018, the Company reported
$5,000,000 in license revenue related to a license agreement with
Fosun for Vyleesi for China and certain other Asian territories
(“Fosun License Agreement”) (Note 5). For the year
ended June 30, 2017, the Company reported $44,723,827 in contract
revenue related to the AMAG License Agreement.
(2)
SUMMARY
OF SIGNIFICANT ACCOUNTING POLICIES
Principles of Consolidation
– The consolidated
financial statements include the accounts of Palatin and its
wholly-owned inactive subsidiary. All intercompany accounts and
transactions have been eliminated in consolidation.
Use of Estimates
– The preparation of consolidated
financial statements in conformity with accounting principles
generally accepted in the United States of America (“U.S.
GAAP”) requires management to make estimates and assumptions
that affect the reported amounts of assets and liabilities and
disclosure of contingent assets and liabilities at the date of the
consolidated financial statements and the reported amounts of
revenues and expenses during the reporting period. Actual results
could differ from those estimates.
Cash and Cash Equivalents
– Cash and cash equivalents
include cash on hand, cash in banks and all highly liquid
investments with a purchased maturity of less than three months.
Cash equivalents consist of $37,808,099 and $40,019,336 in a money
market account at June 30, 2018 and 2017,
respectively.
Investments
–The Company
determines the appropriate classification of its investments in
debt and equity securities at the time of purchase and reevaluates
such determinations at each balance sheet date. Debt securities are
classified as held-to-maturity when the Company has the intent and
ability to hold the securities to maturity. Debt securities for
which the Company does not have the intent or ability to hold to
maturity are classified as available-for-sale. Held-to-maturity
securities are recorded as either short-term or long-term on the
balance sheet, based on the contractual maturity date and are
stated at amortized cost. Marketable securities that are bought and
held principally for the purpose of selling them in the near term
are classified as trading securities and are reported at fair
value, with unrealized gains and losses recognized in earnings.
Debt and marketable equity securities not classified as
held-to-maturity or as trading are classified as available-for-sale
and are carried at fair market value, with the unrealized gains and
losses, net of tax, included in the determination of other
comprehensive income (loss).
The fair value of substantially all securities is determined by
quoted market prices. The estimated fair value of securities for
which there are no quoted market prices is based on similar types
of securities that are traded in the market.
Fair Value of Financial Instruments
– The
Company’s financial instruments consist primarily of cash
equivalents, accounts receivable, accounts payable and notes
payable. Management believes that the carrying values of cash
equivalents, available-for-sale investments, accounts receivable
and accounts payable are representative of their respective fair
values based on the short-term nature of these instruments.
Management believes that the carrying amount of its notes payable
approximates fair value based on terms of the notes.
Credit Risk
– Financial instruments which potentially
subject the Company to concentrations of credit risk consist
principally of cash and cash equivalents. Total cash and cash
equivalent balances have exceeded insured balances by the Federal
Depository Insurance Company (“FDIC”).
Property and Equipment
– Property and equipment
consists of office and laboratory equipment, office furniture and
leasehold improvements and includes assets acquired under capital
leases. Property and equipment are recorded at cost. Depreciation
is recognized using the straight-line method over the estimated
useful lives of the related assets, generally five years for
laboratory and computer equipment, seven years for office furniture
and equipment and the lesser of the term of the lease or the useful
life for leasehold improvements. Amortization of assets acquired
under capital leases is included in depreciation expense.
Maintenance and repairs are expensed as incurred while expenditures
that extend the useful life of an asset are
capitalized.
54
PALATIN TECHNOLOGIES, INC.
and Subsidiary
Notes to Consolidated Financial Statements
Impairment of Long-Lived Assets
– The Company reviews
its long-lived assets for impairment whenever events or changes in
circumstances indicate that the carrying amount of the assets may
not be fully recoverable. To determine recoverability of a
long-lived asset, management evaluates whether the estimated future
undiscounted net cash flows from the asset are less than its
carrying amount. If impairment is indicated, the long-lived asset
would be written down to fair value. Fair value is determined by an
evaluation of available price information at which assets could be
bought or sold, including quoted market prices, if available, or
the present value of the estimated future cash flows based on
reasonable and supportable assumptions.
Revenue Recognition
– The Company has generated
revenue solely through license and collaboration agreements. The
Company recognizes revenue in accordance with Financial Accounting
Standards Board (“FASB”) Accounting Standards
Codification (“ASC”) Topic 605-25,
Revenue Recognition for Arrangements with
Multiple Elements
, which addresses the determination of
whether an arrangement involving multiple deliverables contains
more than one unit of accounting. A delivered item within an
arrangement is considered a separate unit of accounting only if
both of the following criteria are met:
●
the delivered item
has value to the customer on a stand-alone basis; and
●
if the arrangement
includes a general right of return relative to the delivered item,
delivery or performance of the undelivered item is considered
probable and substantially in control of the vendor.
Under
FASB ASC Topic 605-25, if both of the criteria above are not met,
then separate accounting for the individual deliverables is not
appropriate.
The
Company has determined that it is appropriate to recognize such
revenue using the input-based proportional method during the period
of Palatin’s development obligations as defined in the
license agreement with AMAG (the “AMAG License
Agreement”). Refer to Note 4 for additional
information.
Under
its license agreement with Fosun (the “Fosun License
Agreement”) (Note 5), the Company received consideration in
the form of an upfront license fee payment and determined that it
was appropriate to recognize such consideration as revenue in the
first quarter of fiscal 2018, which was the quarter in which the
license was granted, since the license has stand-alone value and
the upfront payment received by the Company is
non-refundable.
Under
its license agreement with Kwangdong (the “Kwangdong License
Agreement”) (Note 6), the Company received consideration in
the form of an upfront license fee payment and has currently
determined that it is appropriate to record such consideration as
non-current deferred revenue because the upfront payment received
by the Company is subject to certain refund
provisions.
Revenue
resulting from the achievement of development milestones is
recorded in accordance with the accounting guidance for the
milestone method of revenue recognition.
Amounts
received prior to satisfying the revenue recognition criteria are
recorded as deferred revenue on the Company’s consolidated
balance sheet. Amounts expected to be recognized as revenue in the
next 12 months following the balance sheet date are classified as
current liabilities.
Research and Development Costs
– The costs of research
and development activities are charged to expense as incurred,
including the cost of equipment for which there is no alternative
future use.
Accrued Expenses –
Third parties perform a significant
portion of our development activities. We review the activities
performed under all contracts each quarter and accrue expenses and
the amount of any reimbursement to be received from our
collaborators based upon the estimated amount of work completed.
Estimating the value or stage of completion of certain services
requires judgment based on available information. If we do not
identify services performed for us but not billed by the
service-provider, or if we underestimate or overestimate the value
of services performed as of a given date, reported expenses will be
understated or overstated.
55
PALATIN TECHNOLOGIES, INC.
and Subsidiary
Notes to Consolidated Financial Statements
Stock-Based Compensation –
The Company charges to
expense the fair value of stock options and other equity awards
granted. The Company determines the value of stock options
utilizing the Black-Scholes option pricing model. Compensation
costs for share-based awards with pro-rata vesting are determined
using the quoted market price of the Company’s common stock
on the date of grant and allocated to periods on a straight-line
basis, while awards containing a market condition are valued using
multifactor Monte Carlo simulations. Compensation costs for awards
containing a performance condition are determined using the quoted
price of the Company’s common stock on the date of grant and
allocated to the periods based on the probability of achievement of
the performance condition over the service period.
Income Taxes
– The Company and its subsidiary file
consolidated federal and separate-company state income tax returns.
Income taxes are accounted for under the asset and liability
method. Deferred tax assets and liabilities are recognized for the
future tax consequences attributable to differences between the
financial statement carrying amounts of assets and liabilities and
their respective tax basis and operating loss and tax credit
carryforwards. Deferred tax assets and liabilities are measured
using enacted tax rates expected to apply to taxable income in the
years in which those temporary differences or operating loss and
tax credit carryforwards are expected to be recovered or settled.
The effect on deferred tax assets and liabilities of a change in
tax rates is recognized in the period that includes the enactment
date. The Company has recorded a valuation allowance against its
deferred tax assets based on the history of losses
incurred.
Pursuant
to the Fosun License Agreement (Note 5) and Kwangdong License
Agreement (Note 6), $500,000 and $82,500, respectively, was
withheld in accordance with tax withholding requirements in China
and Korea, respectively, and was recorded as an expense during the
year ended June 30, 2018. Any potential credit to be received by
the Company on its United States tax returns is currently offset by
the Company’s valuation allowance.
On
December 22, 2017, the U.S. government enacted wide-ranging tax
legislation, the Tax Cuts and Jobs Act (the “2017 Tax
Act”). The 2017 Tax Act significantly revises U.S. tax law
by, among other provisions, (a) lowering the applicable U.S.
federal statutory corporate income tax rate from 35% to 21%, (b)
eliminating or reducing certain income tax deductions, such as
deductions for interest expense, executive compensation expenses
and certain employee expenses, and (c) repealing the federal
alternative minimum tax (“AMT”) and providing for the
refund of existing AMT credits.
As a
result of the enactment of the new corporate income tax rate, the
Company remeasured certain deferred tax assets and liabilities
based on the rates at which they are expected to reverse but
continues to maintain a full valuation allowance against its net
deferred tax assets.
Other provisions enacted include a
new provision designed to tax low-taxed income of foreign
subsidiaries (i.e., “GILTI”) and a one-time transition
tax on the deemed repatriation of post-1986 undistributed foreign
subsidiary earnings and profits (“E&P”) from
controlled foreign corporations (“CFC”). The Company
does not have any foreign subsidiaries, and thus these provisions
do not apply.
As a
result of the 2017 Tax Act, during the quarter ended December 31,
2017, the Company recorded a tax benefit of $500,000 related to the
release of a valuation allowance against an AMT credit (Note
15).
In
addition, as a result of the enactment of the new corporate income
tax rate, the Company remeasured certain deferred tax assets and
liabilities based on the rates at which they are expected to
reverse but continues to maintain a full valuation allowance
against its net deferred tax assets.
Other provisions enacted include a
new provision designed to tax low-taxed income of foreign
subsidiaries (i.e., “GILTI”) and a one-time transition
tax on the deemed repatriation of post-1986 undistributed foreign
subsidiary earnings and profits (“E&P”) from
controlled foreign corporations (“CFC”). The Company
does not have any foreign subsidiaries, and thus these provisions
do not apply.
Net Income (Loss) per Common Share -
Basic and diluted
earnings per common share (“EPS”) are calculated in
accordance with the provisions of FASB ASC Topic 260,
Earnings per Share
, which includes
guidance pertaining to the warrants issued in connection with the
July 3, 2012, December 23, 2014, and July 2, 2015 private placement
offerings and the August 4, 2016 underwritten offering, that were
exercisable for nominal consideration and, therefore, to the extent
not yet exercised are considered in the computation of basic and
diluted net income (loss) per common share. As of June 30, 2018,
all warrants exercisable for nominal value have been converted into
common stock.
The
following table is a reconciliation of net income (loss) and the
shares used in calculating basic and diluted net income (loss) per
common share for the three years ended June 30, 2018, 2017 and
2016:
56
PALATIN TECHNOLOGIES, INC.
and Subsidiary
Notes to Consolidated Financial Statements
|
|
Year Ended June
30,
|
||
|
|
2018
|
2017
|
2016
|
|
|
|
|
|
|
Net income
(loss)
|
$
24,702,714
|
$
(13,331,533
)
|
$
(51,712,936
)
|
|
|
|
|
|
|
Denominator:
|
|
|
|
|
Weighted average
common shares outstanding - Basic
|
198,101,060
|
184,087,719
|
156,553,534
|
|
|
|
|
|
|
Effect of dilutive
shares:
|
|
|
|
|
Common stock
equivalents arising from stock options,
|
|
|
|
|
warrants and
conversion of preferred stock
|
6,752,604
|
-
|
-
|
|
Restriced stock
units
|
2,153,894
|
-
|
-
|
|
Weighted average
common shares outstanding - Diluted
|
207,007,558
|
184,087,719
|
156,553,534
|
|
|
|
|
|
|
Net income (loss)
per common share:
|
|
|
|
|
Basic
|
$
0.12
|
$
(0.07
)
|
$
(0.33
)
|
|
Diluted
|
$
0.12
|
$
(0.07
)
|
$
(0.33
)
|
As of
June 30, 2018, 2017 and 2016 common shares issuable upon conversion
of Series A Convertible Preferred Stock, the exercise of
outstanding options and warrants, excluding outstanding warrants
exercisable for nominal consideration, and the vesting of
restricted stock units amounted in an aggregate of 5,197,592,
40,597,194 and 32,167,737 shares, respectively, being excluded from
the weighted average number of common shares outstanding used in
computing diluted net income (loss) per common share because they
were anti-dilutive during the period or the minimum performance
requirements or market conditions had not been met.
(3)
NEW
AND RECENTLY ADOPTED ACCOUNTING PRONOUNCEMENTS
In May
2017, the FASB issued ASU No. 2017-09,
Compensation-Stock Compensation (Topic 718):
Scope of Modification Accounting
, which clarifies when to
account for a change to the terms or conditions of a share-based
payment award as a modification. Under the new guidance,
modification accounting is required only if the fair value, the
vesting conditions, or the classification of the award (as equity
or liability) changes as a result of the change in terms or
conditions. It is effective prospectively for the annual period
ending June 30, 2019 and interim periods within that annual period.
Early adoption is permitted.
The
Company has not completed review of the impact of this guidance but
does not expect this new guidance to have a material impact on its
consolidated financial statements.
In June
2016, the FASB issued ASU No. 2016-13,
Financial Instruments - Credit Losses:
Measurement of Credit Losses on Financial Instruments
which
requires measurement and recognition of expected credit losses for
financial assets held at the reporting date based on historical
experience, current conditions, and reasonable and supportable
forecasts. This is different from the current guidance as this will
require immediate recognition of estimated credit losses expected
to occur over the remaining life of many financial assets. The new
guidance will be effective for the Company on July 1, 2020. Early
adoption will be available on July 1, 2019. The Company is
currently evaluating the effect that ASU No. 2016-13 will have on
its consolidated financial statements and related
disclosures.
In
March 2016, the FASB issued ASU No. 2016-09,
Compensation – Improvements to Employee
Share-Based Payment Accounting
, which amended the guidance
related to stock compensation. The updated guidance changes how
companies account for certain aspects of share-based payment awards
to employees, including the accounting for income taxes,
forfeitures, and statutory tax withholding requirements, as well as
classification in the statement of cash flows.
Under this guidance, on a prospective basis,
companies will no longer record excess tax benefits and certain tax
deficiencies as additional paid-in capital. Instead, companies will
record all excess tax benefits and tax deficiencies as income tax
expense or benefit in the income statement. In addition, the
guidance eliminates the requirement that excess tax benefits be
realized before companies can recognize them. The ASU requires a
cumulative-effect adjustment for previously unrecognized excess tax
benefits in opening retained earnings in the period of adoption.
Effective July 1, 2017, the Company adopted this updated guidance
and elected to recognize forfeitures when they occur using a
modified retrospective approach. The adoption of ASU No. 2016-09
did not have a material impact on the Company’s consolidated
financial statements.
57
PALATIN TECHNOLOGIES, INC.
and Subsidiary
Notes to Consolidated Financial Statements
In
February 2016, the FASB issued ASU No. 2016-02,
Leases,
related to the recognition of
lease assets and lease liabilities. The new guidance requires
lessees to recognize almost all leases on their balance sheet as a
right-of-use asset and a lease liability, other than leases that
meet the definition of a short- term lease, and requires expanded
disclosures about leasing arrangements. The recognition,
measurement, and presentation of expenses and cash flows arising
from a lease by a lessee have not significantly changed from the
current guidance. Lessor accounting is similar to the current
guidance, but updated to align with certain changes to the lessee
model and the new revenue recognition standard. The new guidance is
effective for the Company on July 1, 2019, with early adoption
permitted. The Company is currently evaluating the impact that ASU
No. 2016-02 will have on its consolidated financial statements and
related disclosures.
In
January 2016, the FASB issued ASU No. 2016-01,
Financial Instruments: Recognition and
Measurement of Financial Assets and Financial Liabilities
.
The new guidance relates to the recognition and measurement of
financial assets and liabilities. The new guidance makes targeted
improvements to GAAP impacting equity investments (other than those
accounted for under the equity method or consolidated), financial
liabilities accounted for under the fair value election, and
presentation and disclosure requirements for financial instruments,
among other changes. The new guidance is effective for the Company
on July 1, 2018, with early adoption prohibited other than for
certain provisions.
The Company has
not completed review of the impact of this guidance but does not
expect this new guidance to have a material impact on its
consolidated financial statements.
In November 2015, the FASB issued ASU No. 2015-17,
Income Taxes:
Balance Sheet Classification of Deferred Taxes,
which simplifies the balance sheet classification
of deferred taxes. The new guidance requires that deferred tax
liabilities and assets be classified as noncurrent in a classified
statement of financial position. The current requirement that
deferred tax liabilities and assets of a tax-paying component of an
entity be offset and presented as a single amount is not affected
by the new guidance. Effective July 1, 2017, the Company adopted
this updated guidance, which did not have a material impact on the
Company’s financial position or results of operations because
its net deferred tax assets were fully offset by a valuation
allowance based on the history of losses
incurred.
In May 2014, the FASB issued ASU No. 2014-09,
Revenue from Contracts with
Customers
, which requires an
entity to recognize the amount of revenue to which it expects to be
entitled for the transfer of promised goods or services to
customers. The ASU will replace most existing revenue recognition
guidance in U.S. GAAP when it becomes effective. In July 2015, the
FASB voted to defer the effective date of the new standard until
fiscal years beginning after December 15, 2017 with early
application permitted for fiscal years beginning after December 15,
2016. With the deferral, the new standard is effective for the
Company on July 1, 2018.
In addition, in April 2016, the
FASB issued ASU No. 2016-10,
Identifying Performance Obligations and
Licensing
, which addresses various issues associated with
identifying performance obligations, licensing of intellectual
property, royalty considerations, and other matters. ASU No.
2016-10 is effective in connection with ASU No. 2014-09.
The two permitted transition methods
under ASU 2014-09 are the full retrospective method, in which case
the new standard would be applied to each prior period presented
and the cumulative effect of applying the standard would be
recognized as of the earliest period reported, or the modified
retrospective method, in which case the cumulative effect of
applying the new standard would be recognized as of the date of
initial application.
The Company has elected to adopt the new standard using the
modified retrospective approach. The Company has completed its
review to assess the impact to its consolidated financial
statements, including an assessment of the Company’s three
key contracts. Based on the review of these contracts, the Company
expects the effect of initially applying the new standard to result
in a decrease to the opening balance of accumulated deficit of
$500,000 as a result of recognition of revenue deferred as of June
30, 2018. The Company is continuing its assessment of the impact
over its financial reporting disclosures.
(4)
AGREEMENT
WITH AMAG
On
January 8, 2017, the Company entered into the AMAG License
Agreement. Under the terms of the AMAG License Agreement, the
Company granted to AMAG (i) an exclusive license in all countries
of North America (the “Territory”), with the right to
grant sub-licenses, to research, develop and commercialize products
containing Vyleesi (each a Product, and collectively, Products),
(ii) a non-exclusive license in the Territory, with the right to
grant sub-licenses, to manufacture Products, and (iii) a
non-exclusive license in all countries outside the Territory, with
the right to grant sub-licenses, to research, develop and
manufacture (but not commercialize) the Products.
58
PALATIN TECHNOLOGIES, INC.
and Subsidiary
Notes to Consolidated Financial Statements
Following
the satisfaction of certain conditions to closing, the license
agreement became effective on February 2, 2017. On that date, AMAG
paid the Company $60,000,000 as a one-time initial payment.
Pursuant to the terms of and subject to the conditions in the AMAG
License Agreement, AMAG was required to reimburse the Company up to
an aggregate amount of $25,000,000 for reasonable, documented,
direct out-of-pocket expenses incurred by the Company following
February 2, 2017, in connection with the development and regulatory
activities necessary to file an NDA for Vyleesi for HSDD in the
United States related to Palatin’s development
obligations.
The
Company has determined there is no stand-alone value for the
license, and that the license and the reimbursable direct
out-of-pocket expenses, pursuant to the terms of the License
Agreement, represent a combined unit of accounting which totals
$85,000,000. The Company recognized revenue of the combined unit of
accounting over the arrangement using the input-based proportional
method as the Company completed its development obligations. For
the years ended June 30, 2018 and 2017, the Company recognized
$42,134,758 and $44,723,827, respectively, as license and contract
revenue which included additional billings for AMAG related Vyleesi
costs of $1,151,243 and $707,342 in fiscal 2018 and fiscal 2017,
respectively.
In
addition, pursuant to the terms of and subject to the conditions in
the AMAG License Agreement, the Company will be eligible to receive
from AMAG (i) up to $80,000,000 in specified regulatory
milestone payments upon achievement of certain regulatory
milestones, and (ii) up to $300,000,000 in sales milestone payments
based on achievement of certain annual net sales for all Products
in the Territory. On June 4, 2018 the FDA accepted the Vyleesi NDA
for filing. The NDA was filed on March 23,
2018. The
FDA’s acceptance triggered a $20,000,000 million milestone
payment to Palatin from AMAG. As a result, the Company recognized
$20,000,000 in revenue related to regulatory milestones for the
year ended June 30, 2018.
AMAG is
also obligated to pay the Company tiered royalties on annual net
sales of Products, on a product-by-product basis, in the Territory
ranging from the high single-digits to the low double-digits. The
royalties will expire on a product-by-product and
country-by-country basis until the latest to occur of (i) the
earliest date on which there are no valid claims of the
Company’s patent rights covering such Product in such
country, (ii) the expiration of the regulatory exclusivity period
for such Product in such country and (iii) ten years following the
first commercial sale of such Product in such country. Such
royalties are subject to reductions in the event that:
(a) AMAG must license additional third-party intellectual
property in order to develop, manufacture or commercialize a
Product, or (b) generic competition occurs with respect to a
Product in a given country, subject to an aggregate cap on such
deductions of royalties otherwise payable to the Company. After the
expiration of the applicable royalties for any Product in a given
country, the license for such Product in such country will become a
fully paid-up, royalty-free, perpetual and irrevocable
license.
The
Company engaged Greenhill & Co. LLC (“Greenhill”)
as the Company’s sole financial advisor in connection with a
potential transaction with respect to Vyleesi. Under the
engagement agreement with Greenhill, the Company was obligated to
pay Greenhill a fee equal to 2% of all proceeds and consideration
paid to the Company by AMAG in connection with the AMAG License
Agreement, subject to a minimum fee of $2,500,000. The minimum fee
of $2,500,000, less a credit of $50,000 for an advisory fee
previously paid by the Company, was paid to Greenhill upon the
closing of the licensing transaction. This amount will be credited
toward amounts that become due to Greenhill in the future, provided
that the aggregate fee payable to Greenhill will not be less than
2% of all proceeds and consideration paid to the Company by AMAG in
connection with the AMAG License Agreement. The Company will pay
Greenhill an aggregate total of 2% of all proceeds and
consideration paid to the Company by AMAG in connection with the
License Agreement, including future milestone and royalty payments,
after crediting the $2,500,000 that was paid to Greenhill upon
entering into the AMAG License Agreement. The Company also
reimbursed Greenhill $7,263 for certain expenses incurred in
connection with its advisory services.
Pursuant
to the License Agreement, the Company has assigned to AMAG the
Company’s manufacturing and supply agreements with Catalent
Belgium S.A. to perform fill, finish and packaging of
Vyleesi.
59
PALATIN TECHNOLOGIES, INC.
and Subsidiary
Notes to Consolidated Financial Statements
(5)
AGREEMENT
WITH FOSUN:
On
September 6, 2017, the Company entered into the Fosun License
Agreement for exclusive rights to commercialize Vyleesi in China.
Under the terms of the agreement, the Company received $4,500,000
in October 2017, which consisted of an upfront payment of
$5,000,000 less $500,000 that was withheld in accordance with tax
withholding requirements in China and recorded as an expense during
the year ended June 30, 2018. The Company will receive a $7,500,000
milestone payment when regulatory approval in China is obtained,
provided that a commercial supply agreement for Vyleesi has been
entered into. Palatin has the potential to receive up to
$92,500,000 in additional sales related milestone payments and high
single-digit to low double-digit royalties on net sales in the
licensed territory. All development, regulatory, sales, marketing,
and commercial activities and associated costs in the licensed
territory will be the sole responsibility of Fosun.
(6)
AGREEMENT
WITH KWANGDONG:
On
November 21, 2017, the Company entered into the Kwangdong License
Agreement for exclusive rights to commercialize Vyleesi in
Korea.
Under the terms of
the agreement, the Company received $417,500 in December 2017,
consisting of an upfront payment of $500,000, less $82,500, which
was withheld in accordance with tax withholding requirements in
Korea and recorded as an expense during the year ended June 30,
2018. Based upon certain refund provisions, the upfront payment has
been recorded as non-current deferred revenue at June 30, 2018. The
Company will receive a $3,000,000 milestone payment based on the
first commercial sale in Korea. Palatin has the potential to
receive up to $37,500,000 in additional sales related milestone
payments and mid-single-digit to low double-digit royalties on net
sales in the licensed territory. All development, regulatory,
sales, marketing, and commercial activities and associated costs in
the licensed territory will be the sole responsibility of
Kwangdong.
(7)
PREPAID
EXPENSES AND OTHER CURRENT ASSETS
Prepaid
expenses
and other
current assets consist of the following:
|
|
June
30,
|
June
30,
|
|
|
2018
|
2017
|
|
Clinical study
costs
|
$
145,994
|
$
657,069
|
|
Insurance
premiums
|
42,605
|
182,966
|
|
Other
|
325,089
|
171,186
|
|
|
$
513,688
|
$
1,011,221
|
(8)
INVESTMENTS
The
following summarizes the carrying value of our available-for-sale
investments, which consist of corporate debt
securities:
|
|
June
30,
|
June
30,
|
|
|
2018
|
2017
|
|
Cost
|
$
-
|
$
1,387,022
|
|
Matured
investments
|
-
|
(1,124,999
)
|
|
Amortization of
premium
|
-
|
(11,596
)
|
|
Gross unrealized
loss
|
-
|
(590
)
|
|
Fair
value
|
$
-
|
$
249,837
|
(9)
FAIR
VALUE MEASUREMENTS
The
fair value of cash equivalents is classified using a hierarchy
prioritized based on inputs. Level 1 inputs are quoted prices
(unadjusted) in active markets for identical assets or liabilities.
Level 2 inputs are quoted prices for similar assets and liabilities
in active markets or inputs that are observable for the asset or
liability, either directly or indirectly through market
corroboration, for substantially the full term of the financial
instrument. Level 3 inputs are unobservable inputs based on
management’s own assumptions used to measure assets and
liabilities at fair value. A financial asset or liability’s
classification within the hierarchy is determined based on the
lowest level input that is significant to the fair value
measurement.
60
PALATIN TECHNOLOGIES, INC.
and Subsidiary
Notes to Consolidated Financial Statements
The
following table provides the assets carried at fair
value:
|
|
Carrying
Value
|
Quoted prices in
active markets
(Level
1)
|
Other
quoted/observable inputs
(Level
2)
|
Significant
unobservable inputs
(Level
3)
|
|
June 30,
2018:
|
|
|
|
|
|
Money Market
Account
|
$
37,808,099
|
$
37,808,099
|
$
-
|
$
-
|
|
June 30,
2017:
|
|
|
|
|
|
Money Market
Account
|
$
40,019,336
|
$
40,019,336
|
$
-
|
$
-
|
(10)
PROPERTY
AND EQUIPMENT, NET
Property
and equipment, net, consists of the following:
|
|
June
30,
|
June
30,
|
|
|
2018
|
2017
|
|
Office
equipment
|
$
1,193,162
|
$
1,180,210
|
|
Laboratory
equipment
|
558,205
|
548,706
|
|
Leasehold
improvements
|
751,226
|
751,226
|
|
|
2,502,593
|
2,480,142
|
|
Less: Accumulated
depreciation and amortization
|
(2,338,558
)
|
(2,281,989
)
|
|
|
$
164,035
|
$
198,153
|
The
aggregate cost of assets acquired under capital leases was $146,115
as of both June 30, 2018 and 2017. Accumulated amortization
associated with assets acquired under capital leases was $122,115
and $106,115 as of June 30, 2018 and 2017,
respectively.
(11)
ACCRUED
EXPENSES
Accrued
expenses
consist of the
following:
|
|
June
30,
|
June
30,
|
|
|
2018
|
2017
|
|
Clinical study
costs
|
$
983,410
|
$
9,138,827
|
|
Other research
related expenses
|
590,236
|
217,307
|
|
Professional
services
|
297,731
|
434,768
|
|
Other
|
231,644
|
730,196
|
|
|
$
2,103,021
|
$
10,521,098
|
(12)
NOTES PAYABLE:
Notes
payable consist of the following:
|
|
June
30,
|
June
30,
|
|
|
2018
|
2017
|
|
Notes payable under
venture loan
|
$
6,333,334
|
$
14,333,334
|
|
Unamortized related
debt discount
|
(33,535
)
|
(143,524
)
|
|
Unamortized debt
issuance costs
|
(18,138
)
|
(83,215
)
|
|
Notes
payable
|
6,281,661
|
14,106,595
|
|
|
|
|
|
Less: current
portion
|
5,948,763
|
7,824,935
|
|
|
|
|
|
Long-term
portion
|
$
332,898
|
$
6,281,660
|
61
PALATIN TECHNOLOGIES, INC.
and Subsidiary
Notes to Consolidated Financial Statements
On
December 23, 2014, the Company closed on a $10,000,000 venture loan
which was led by Horizon Technology Finance Corporation
(“Horizon”). The debt facility is a four-year senior
secured term loan that bears interest at a floating coupon rate of
one-month LIBOR (floor of 0.50%) plus 8.50%, and provides for
interest-only payments for the first eighteen months followed by
monthly payments of principal of $333,333 plus accrued interest
through January 1, 2019. The lenders also received five-year
immediately exercisable Series D 2014 warrants to purchase 666,666
shares of common stock exercisable at an exercise price of $0.75
per share. The Company recorded a debt discount of $267,820 equal
to the fair value of these warrants at issuance, which is being
amortized to interest expense over the term of the related debt.
This debt discount is offset against the note payable balance and
included in additional paid-in capital on the Company’s
balance sheet at June 30, 2018 and June 30, 2017. In addition, a
final incremental payment of $500,000 is due on January 1, 2019, or
upon early repayment of the loan. This final incremental payment is
being accreted to interest expense over the term of the related
debt and is included in other current liabilities on the
consolidated balance sheet as of June 30, 2018. The Company
incurred $209,367 of costs in connection with the loan. These costs
were capitalized as deferred financing costs and are offset against
the note payable balance. These debt issuance costs are being
amortized to interest expense over the term of the related
debt.
On July
2, 2015, the Company closed on a $10,000,000 venture loan led by
Horizon. The debt facility is a four-year senior secured term loan
that bears interest at a floating coupon rate of one-month LIBOR
(floor of 0.50%) plus 8.50% and provides for interest-only payments
for the first eighteen months followed by monthly payments of
principal of $333,333 plus accrued interest through August 1, 2019.
The lenders also received five-year immediately exercisable Series
G warrants to purchase 549,450 shares of the Company’s common
stock exercisable at an exercise price of $0.91 per share. The
Company has recorded a debt discount of $305,196 equal to the fair
value of these warrants at issuance, which is being amortized to
interest expense over the term of the related debt. This debt
discount is offset against the note payable balance and is included
in additional paid-in capital on the Company’s balance sheet
at June 30, 2018 and June 30, 2017. In addition, a final
incremental payment of $500,000 is due on August 1, 2019, or upon
early repayment of the loan. This final incremental payment is
being accreted to interest expense over the term of the related
debt and is included in other non-current liabilities on the
consolidated balance sheet as of June 30, 2018. The Company
incurred $146,115 of costs in connection with the loan agreement.
These costs were capitalized as deferred financing costs and are
offset against the note payable balance. These debt issuance costs
are being amortized to interest expense over the term of the
related debt.
The
Company’s obligations under the 2015 amended and restated
loan agreement, which includes both the 2014 venture loan and the
2015 venture loan, are secured by a first priority security
interest in substantially all of its assets other than its
intellectual property. The Company also has agreed to specified
limitations on pledging or otherwise encumbering its intellectual
property assets. The 2015 amended and restated loan agreement
includes customary affirmative and restrictive covenants, but does
not include any covenants to attain or maintain specified financial
metrics. The loan agreement includes customary events of default,
including payment defaults, breaches of covenants, change of
control and a material adverse change default. Upon the occurrence
of an event of default and following any applicable cure periods, a
default interest rate of an additional 5% may be applied to the
outstanding loan balances, and the lenders may declare all
outstanding obligations immediately due and payable and take such
other actions as set forth in the loan agreement. As of June 30,
2018, the Company was in compliance with all of its loan covenants.
Scheduled future principal payments related to notes payable as of
June 30, 2018 are as follows:
|
Year
Ending June 30,
|
|
|
2019
|
$
6,000,000
|
|
2020
|
333,334
|
|
|
6,333,334
|
|
Less: Unamortized
debt discount and issuance costs
|
(51,673
)
|
|
Net
|
$
6,281,661
|
(13)
COMMITMENTS
AND CONTINGENCIES
Operating Leases
– The Company currently leases
facilities under two non-cancelable operating leases. The lease on
our corporate offices was renewed effective July 1, 2015 and
expires on June 30, 2020 and in June 2016 we entered into a lease
for approximately 1,700 square feet of laboratory space which
expires in August 2019. Future minimum lease payments under these
leases are as follows:
62
PALATIN TECHNOLOGIES, INC.
and Subsidiary
Notes to Consolidated Financial Statements
|
Year
Ending June 30,
|
|
|
2019
|
$
260,960
|
|
2020
|
227,136
|
|
|
$
488,096
|
For the
years ended June 30, 2018, 2017 and 2016, rent expense was
$292,411, $261,580 and $256,642 respectively.
Employment Agreements
– The Company has employment
agreements with two executive officers which provide a stated
annual compensation amount, subject to annual increases, and annual
bonus compensation in an amount to be approved by the
Company’s Board of Directors. Each agreement allows the
Company or the employee to terminate the agreement in certain
circumstances. In some circumstances, early termination by the
Company may result in severance pay to the employee for a period of
18 to 24 months at the salary then in effect, continuation of
health insurance premiums over the severance period and immediate
vesting of all stock options and restricted stock units.
Termination following a change in control will result in a lump sum
payment of one and one-half to two times the salary then in effect
and immediate vesting of all stock options and restricted stock
units.
Employee Retirement Savings Plan
– The Company
maintains a defined contribution 401(k) plan for the benefit of its
employees. The Company currently matches a portion of employee
contributions to the plan. For the years ended June 30, 2018, 2017
and 2016, Company contributions were $166,962, $199,264 and
$138,184, respectively.
Contingencies
– The Company accounts for litigation
losses in accordance with ASC 450-20,
Loss Contingencies
. Under ASC 450-20,
loss contingency provisions are recorded for probable losses when
management is able to reasonably estimate the loss. Any outcome
upon settlement that deviates from the Company’s best
estimate may result in additional expense or in a reduction in
expense in a future accounting period. The Company records legal
expenses associated with such contingencies as
incurred.
The
Company is involved, from time to time, in various claims and legal
proceedings arising in the ordinary course of its business. The
Company is not currently a party to any such claims or proceedings
that, if decided adversely to it, would either individually or in
the aggregate have a material adverse effect on its business,
financial condition or results of operations.
(14)
STOCKHOLDERS’
EQUITY (DEFICIENCY)
Series A Convertible Preferred Stock
– As of June
30, 2018, 4,030 shares of Series A Convertible Preferred Stock were
outstanding. Each share of Series A Convertible Preferred Stock is
convertible at any time, at the option of the holder, into the
number of shares of common stock equal to $100 divided by the
Series A Conversion Price. As of June 30, 2018, the Series A
Conversion Price was $6.65, so each share of Series A Convertible
Preferred Stock is currently convertible into approximately 15.0
shares of common stock. The Series A Conversion Price is subject to
adjustment, under certain circumstances, upon the sale or issuance
of common stock for consideration per share less than either (i)
the Series A Conversion Price in effect on the date of such sale or
issuance, or (ii) the market price of the common stock as of the
date of such sale or issuance. The Series A Conversion Price is
also subject to adjustment upon the occurrence of a merger,
reorganization, consolidation, reclassification, stock dividend or
stock split which will result in an increase or decrease in the
number of shares of common stock outstanding. Shares of Series A
Convertible Preferred Stock have a preference in liquidation,
including certain merger transactions, of $100 per share, or
$403,000 in the aggregate as of June 30, 2018. Additionally, the
Company may not pay a dividend or make any distribution to holders
of any class of stock unless the Company first pays a special
dividend or distribution of $100 per share to holders of the Series
A Convertible Preferred Stock.
Financing Transactions –
On April 20, 2018, the Company entered into an
equity distribution agreement (the “Equity Distribution
Agreement”) with Canaccord Genuity LLC
(“Canaccord”), pursuant to which the Company may, from
time to time, sell shares of the Company’s common
stock
at market prices by
methods deemed to be an “at-the-market offering” as
defined in Rule 415 promulgated under the Securities Act of 1933,
as amended. The Company will pay Canaccord 3.0% of the gross
proceeds as a commission. Between April 20, 2018 and June 30, 2018,
a total of 1,283,754 shares of common stock were sold through
Canaccord under the Equity Distribution Agreement for net proceeds
of $1,257,773 after payment of commission fees of $43,385 and other
related expenses of $145,000. The Company has no obligation to sell
any shares under the Equity Distribution Agreement and may at any
time suspend solicitation and offers under the Equity Distribution
Agreement.
63
PALATIN TECHNOLOGIES, INC.
and Subsidiary
Notes to Consolidated Financial Statements
On
December 6, 2016, the Company closed on an underwritten public
offering of units, with each unit consisting of a share of common
stock and a Series J warrant to purchase 0.50 of a share of common
stock. Gross proceeds of the offering were $16,500,000, with net
proceeds to the Company, after deducting underwriting discounts and
commissions and offering expenses, of $15,386,076. The Company
issued 25,384,616 shares of common stock and Series J warrants to
purchase 12,692,310 shares of common stock at an initial exercise
price of $0.80 per share, which warrants are exercisable
immediately upon issuance and expire on the fifth anniversary of
the date of issuance. The Series J warrants are subject to a
limitation on their exercise if the holder and its affiliates would
beneficially own more than 9.99%, or 4.99% for certain holders, of
the total number of the Company’s shares of common stock
following such exercise.
On
August 4, 2016, the Company closed on an underwritten offering of
units, with each unit consisting of a share of common stock and a
Series H warrant to purchase 0.75 of a share of common stock.
Investors whose purchase of units in the offering would result in
them beneficially owning more than 9.99% of the Company’s
outstanding common stock following the completion of the offering
had the opportunity to acquire units with Series I prefunded
warrants substituted for any common stock they would have otherwise
acquired. Gross proceeds of the offering were $9,225,000, with net
proceeds to the Company, after deducting offering expenses, of
$8,470,897. The Company issued 11,481,481 shares of common stock
and ten-year prefunded Series I warrants to purchase 2,218,045
shares of common stock at an exercise price of $0.01, together with
Series H warrants to purchase 10,274,646 shares of common stock at
an exercise price of $0.70 per share.
The
Series I warrants were exercisable immediately upon issuance and
were exercised during the year ended June 30, 2017. The Series H
warrants are exercisable at an initial exercise price of $0.70 per
share, are exercisable commencing six months following the date of
issuance and expire on the fifth anniversary of the date of
issuance. The Series H warrants are subject to a limitation on
their exercise if the holder and its affiliates would beneficially
own more than 9.99% of the total number of the Company’s
shares of common stock following such exercise.
On July
2, 2015, the Company closed on a private placement of Series E
warrants to purchase 21,917,808 shares of common stock and Series F
warrants to purchase 2,191,781 shares of common stock. Certain
funds managed by QVT Financial LP (“QVT”) invested
$5,000,000 and another accredited investment fund invested
$15,000,000. The funds paid $0.90 for each Series E warrant and
$0.125 for each Series F warrant, resulting in gross proceeds to
the Company of $20,000,000, with net proceeds, after deducting
estimated offering expenses, of approximately
$19,834,278.
The
Series E warrants, which would be exercised on a cashless basis,
were exercisable immediately upon issuance at an initial exercise
price of $0.01 per share, and the exercise of all Series E warrants
was completed during the year ended June 30, 2018. The Series F
warrants are exercisable at an initial exercise price of $0.91 per
share, exercisable immediately upon issuance and expire on the
fifth anniversary of the date of issuance. The Series F warrants
are subject to a limitation on their exercise if the holder and its
affiliates would beneficially own more than 9.99% of the total
number of the Company’s shares of common stock following such
exercise.
Outstanding Stock Purchase Warrants
– As of June 30,
2018, the Company had outstanding warrants exercisable for shares
of common stock as follows:
|
Shares of
Common
|
Exercise Price
per
|
Latest
Termination
|
|
Stock
|
Share
|
Date
|
|
666,666
|
0.75
|
December 23,
2019
|
|
2,191,781
|
0.91
|
July 2,
2020
|
|
549,450
|
0.91
|
July 2,
2020
|
|
10,274,646
|
0.70
|
August 4,
2021
|
|
25,000
|
0.70
|
August 4,
2021
|
|
9,696,503
|
0.80
|
December 6,
2021
|
|
23,404,046
|
|
|
64
PALATIN TECHNOLOGIES, INC.
and Subsidiary
Notes to Consolidated Financial Statements
During
the year ended June 30, 2018, the Company received $2,396,646 and
$114,383, respectively, and issued 2,995,807 shares of common stock
pursuant to the exercise of warrants at an exercise price of $0.80
per share and issued 11,438,356 shares of common stock pursuant to
the exercise of warrants at an exercise price of $0.01 per share.
The Company also issued 23,344,451 shares of common stock pursuant
to the cashless exercise provisions of warrants at an exercise
price of $0.01 per share. As of June 30, 2018, there were no
warrants outstanding at an exercise price of $0.01 per
share.
During
the year ended June 30, 2017, the Company issued 38,141,991 shares
of common stock pursuant to the cashless exercise provisions of
warrants at an exercise price of $0.01 per share, and during the
year ended June 30, 2017, the Company received $164,358 and issued
16,435,811 shares of common stock pursuant to the exercise of
warrants at an exercise price of $0.01 per share. During the year
ended June 30, 2016, the Company issued 10,890,889 shares of common
stock pursuant to the cashless exercise provisions of warrants at
an exercise price of $0.01.
On
October 31, 2016, in connection with a contract for financial
advisory services, the Company issued to each of PSL Business
Development Consulting and SARL Avisius, or their permitted
designees, as partial consideration for services, a warrant to
purchase up to 12,500 shares of the Company’s common stock at
an exercise price of $0.70 per share. The warrants are exercisable
at any time, and expire on August 4, 2021. The Company recorded
stock-based compensation related to these stock warrants of $6,885
for the year ended June 30, 2017.
Stock Plan –
The Company’s 2011 Stock Incentive
Plan was approved by the Company’s stockholders at the annual
meeting of stockholders held in May 2011 and amended at the annual
meeting of stockholders held on June 8, 2017 and again at the
annual meeting of stockholders held on June 26, 2018. The 2011
Stock Incentive Plan provides for incentive and nonqualified stock
option grants, restricted stock unit awards and other stock-based
awards to employees, non-employee directors and consultants for up
to 32,500,000 shares of common stock. The 2011 Stock Incentive Plan
is administered under the direction of the Board of Directors,
which may specify grant terms and recipients. Options granted by
the Company generally expire ten years from the date of grant and
generally vest over three to four years. The Company’s former
2005 Stock Plan was terminated and replaced by the 2011 Stock
Incentive Plan, and shares of common stock that were available for
grant under the 2005 Stock Plan became available for grant under
the 2011 Stock Incentive Plan. No new awards can be granted under
the 2005 Stock Plan, but awards granted under the 2005 Stock Plan
remain outstanding in accordance with their terms. As of June 30,
2018, 7,559,248 shares were available for grant under the 2011
Stock Incentive Plan.
The
Company has outstanding options that were granted under the 2005
Stock Plan. The Company expects to settle option exercises under
any of its plans with authorized but currently unissued
shares.
The
following table summarizes option activity and related information
for the years ended June 30, 2018, 2017 and 2016:
65
PALATIN TECHNOLOGIES, INC.
and Subsidiary
Notes to Consolidated Financial Statements
|
|
Number of
Shares
|
Weighted Average
Exercise Price
|
Weighted Average
Remaining Term in Years
|
Aggregate
Intrinsic Value
|
|
|
|
|
|
|
|
Outstanding - July
1, 2015
|
5,130,230
|
1.46
|
7.3
|
|
|
|
|
|
|
|
|
Granted
|
355,000
|
0.54
|
|
|
|
Forfeited
|
(170,550
)
|
0.80
|
|
|
|
Expired
|
(52,940
)
|
22.53
|
|
|
|
|
|
|
|
|
|
Outstanding - June
30, 2016
|
5,261,740
|
1.21
|
6.2
|
|
|
|
|
|
|
|
|
Granted
|
4,119,000
|
0.46
|
|
|
|
Forfeited
|
(410,388
)
|
1.12
|
|
|
|
Expired
|
(43,220
)
|
22.59
|
|
|
|
|
|
|
|
|
|
Outstanding - June
30, 2017
|
8,927,132
|
0.76
|
7.5
|
|
|
|
|
|
|
|
|
Granted
|
4,182,550
|
0.90
|
|
|
|
Forfeited
|
(39,500
)
|
1.70
|
|
|
|
Exercised
|
(208,900
)
|
0.77
|
|
|
|
Expired
|
(85,820
)
|
6.95
|
|
|
|
|
|
|
|
|
|
Outstanding - June
30, 2018
|
12,775,462
|
$
0.76
|
7.7
|
$
3,115,515
|
|
|
|
|
|
|
|
Exercisable at June
30, 2018
|
6,163,850
|
$
0.79
|
6.0
|
$
1,460,394
|
|
|
|
|
|
|
|
Expected to vest at
June 30, 2018
|
6,611,612
|
$
0.54
|
9.2
|
$
1,651,121
|
For the
years ended June 30, 2018, 2017 and 2016, the fair value of option
grants was estimated at the grant date using the Black-Scholes
model or a multi-factor Monte Carlo simulation. The Company’s
weighted average assumptions for the years ended June 30, 2018,
2017 and 2016 were as follows:
|
|
2018
|
2017
|
2016
|
|
|
|
|
|
|
Risk-free interest
rate
|
1.8
%
|
1.7
%
|
1.4
%
|
|
Volatility
factor
|
52.6
%
|
75.0
%
|
73.5
%
|
|
Dividend
yield
|
0
%
|
0
%
|
0
%
|
|
Expected option
life (years)
|
4.4
|
6.2
|
5.7
|
|
Weighted average
grant date fair value
|
$
0.58
|
$
0.27
|
$
0.35
|
Expected
volatilities are based on the Company’s historical
volatility. The expected term of options is based upon the
simplified method, which represents the average of the vesting term
and the contractual term. The risk-free interest rate is based on
U.S. Treasury yields for securities with terms approximating the
expected term of the option.
For the
years ended June 30, 2018, 2017 and 2016 the Company recorded
stock-based compensation related to stock options of $1,131,895,
$547,953, and $545,641, respectively. As of June 30, 2018, there
was $2,706,207 of unrecognized compensation cost related to
unvested options, which is expected to be recognized over a
weighted-average period of 2.9 years.
66
PALATIN TECHNOLOGIES, INC.
and Subsidiary
Notes to Consolidated Financial Statements
In June
2018, the Company granted 987,000 options to its executive
officers, 262,550 options to its employees and 224,000 options to
its non-employee directors under the Company’s 2011 Stock
Incentive Plan. The Company is amortizing the fair value of these
options of $659,159, $175,342 and $139,666, respectively, over the
vesting period.
In
December 2017, the Company granted 1,200,000 options to its
executive officers and 225,000 options to its non-employee
directors under the Company’s 2011 Stock Incentive Plan. The
fair value of these options was $691,171 and $126,130,
respectively. The Company is amortizing the fair value of these
options over a 48-month vesting period for its executive officers
and over a 36-month vesting period for its non-employee
directors.
Also,
in December 2017, the Company granted 1,075,000 and 125,000
performance-based options to its executive officers and employees,
respectively, which vest during a performance period ending on
December 31, 2020, if and upon either i) as to 100% of the target
number of shares upon achievement of a closing price for the
Company’s common stock equal to or greater than $1.50 per
share for 20 consecutive trading days, which is considered a market
condition; or ii) as to thirty percent (30%) of the target number
of shares, upon the acceptance for filing by the FDA of an NDA for
Vyleesi for HSDD in premenopausal women during the performance
period, which is considered a performance condition; iii) as to
fifty percent (50%) of the target number of shares, upon the
approval by the FDA of an NDA for Vyleesi for HSDD in premenopausal
women during the performance period, which is also considered a
performance condition; iv) as to twenty percent (20%) of the target
number of shares, upon entry into a licensing agreement during the
performance period for the commercialization of Vyleesi for FSD in
selected countries, which is also considered a performance
condition. The fair value of these options was $602,760. The
Company is amortizing the fair value over the derived service
period of 1.1 years or upon the attainment of the performance
condition. Pursuant to the FDA acceptance of the NDA filing of
Vyleesi, 30% of the target number of options vested in June
2018.
In
September 2017, the Company granted 54,000 options to a newly
appointed non-employee director under the Company’s 2011
Stock Incentive Plan. The Company is amortizing the fair value of
these options of $18,176 over a 48-month vesting
period.
During
the year ended June 30, 2018, the Company also granted 30,000
options to three new hires under the Company’s 2011 Stock
Incentive Plan. The fair value of these options was $14,505. The
Company is amortizing the fair value of these options over a
48-month vesting period.
In June
2017, the Company granted 1,797,000 options to its executive
officers, 780,000 options to its employees and 378,000 options to
its non-employee directors under the Company’s 2011 Stock
Incentive Plan. The Company is amortizing the fair value of these
options of $445,533, $194,689 and $89,220, respectively, over the
vesting period.
In
September 2016, the Company granted 828,000 options to its
executive officers and 336,000 options to its employees under the
Company’s 2011 Stock Incentive Plan. The Company is
amortizing the fair value of the options vesting over a 48-month
period, consisting of 595,000 options granted to its executive
officers and all options granted to its employees, of $188,245 and
$106,303, respectively, over the vesting period. The remaining
233,000 options granted to its executive officers vested 12 months
from the date of grant, and the Company amortized the fair value of
these options of $67,160 over this vesting period.
In June
2016, the Company granted 262,500 options to its non-employee
directors under the Company’s 2011 Stock Incentive Plan. The
Company amortized the fair value of these options of $81,435 over
the vesting period and they were fully vested as of June 30,
2017.
During
the year-ended June 30, 2016, the Company granted an aggregate
92,500 options to certain employees under the Company’s 2011
Stock Incentive Plan. The Company is amortizing the fair value of
these options of $41,470 over the vesting period.
67
PALATIN TECHNOLOGIES, INC.
and Subsidiary
Notes to Consolidated Financial Statements
Unless
otherwise stated, stock options granted to the Company’s
executive officers and employees vest over a 48-month period, while
stock options granted to its non-employee directors vest over a
12-month period.
Restricted Stock Units –
The following table
summarizes restricted stock award activity for the years ended June
30, 2018, 2017 and 2016:
|
|
2018
|
2017
|
2016
|
|
Outstanding at
beginning of year
|
5,209,617
|
2,665,768
|
1,028,017
|
|
Granted
|
4,914,550
|
3,192,000
|
2,302,500
|
|
Forfeited
|
(5,250
)
|
(68,751
)
|
(2,563
)
|
|
Vested
|
(795,041
)
|
(579,400
)
|
(662,186
)
|
|
Outstanding at end
of year
|
9,323,876
|
5,209,617
|
2,665,768
|
For the
years ended June 30, 2018, 2017 and 2016 the Company recorded
stock-based compensation related to restricted stock units of
$2,386,456, $1,202,421, and $1,297,724, respectively.
In June
2018, the Company granted 659,000 restricted stock units to its
executive officers, 262,550 restricted stock units to its employees
and 224,000 restricted stock units to its non-employee directors
under the Company’s 2011 Stock Incentive Plan. The Company is
amortizing the fair value of these restricted stock units of
$659,000, $262,550, and $224,000, respectively, over the vesting
period.
In
December 2017, the Company granted 1,200,000 restricted stock units
to its executive officers, 225,000 restricted stock units to its
non-employee directors and 545,000 restricted stock units to its
employees under the Company’s 2011 Stock Incentive Plan. The
fair value of these restricted stock units was $1,020,000, $191,250
and $463,250, respectively. For executive officers and employees,
the restricted stock units vest 25% on the first, second, third and
fourth anniversary dates from the date of grant. For non-employee
directors, the restricted stock units vest 33 1/3% on the first,
second and third anniversary dates from the date of
grant.
Also,
in December 2017, the Company granted 1,075,000 performance-based
restricted stock units to its executive officers and 670,000
performance-based restricted stock units to other employees which
vest during a performance period, ending on December 31, 2020, if
and upon either i) as to 100% of the target number of shares upon
achievement of a closing price for the Company’s common stock
equal to or greater than $1.50 per share for 20 consecutive trading
days, which is considered a market condition; or ii) as to thirty
percent (30%) of the target number of shares, upon the acceptance
for filing by the FDA of an NDA for Vyleesi for HSDD in
premenopausal women during the performance period, which is
considered a performance condition; iii) as to fifty percent (50%)
of the target number of shares, upon the approval by the FDA of an
NDA for Vyleesi for HSDD in premenopausal women during the
performance period, which is also considered a performance
condition; iv) as to twenty percent (20%) of the target number of
shares, upon entry into a licensing agreement during the
performance period for the commercialization of Vyleesi for FSD in
at least two of the following geographic areas (a) four or more
countries in Europe, (b) Japan, (c) two or more countries in
Central and/or South America, (d) two or more countries in Asia,
excluding Japan and China, and (e) Australia, which is also
considered a performance condition. The fair value of these awards
was $913,750 and $569,500, respectively. The Company is amortizing
the fair value over the derived service period of 1.1 years or upon
the attainment of the performance condition. Pursuant to the FDA
acceptance of the NDA filing for Vyleesi, 30% of the target number
of shares vested in June 2018.
In
September 2017, the Company granted 54,000 restricted stock units
to a newly appointed non-employee director under the
Company’s 2011 Stock Incentive Plan. The Company is
amortizing the fair value of these restricted stock units of
$27,000 over a 48-month vesting period.
In June
2017, the Company granted 1,140,000 restricted stock units to its
executive officers, 780,000 restricted stock units to its employees
and 378,000 restricted stock units to its non-employee directors
under the Company’s 2011 Stock Incentive Plan. The Company is
amortizing the fair value of these restricted stock units of
$421,800, $288,600, and $139,860, respectively, over the vesting
period.
68
PALATIN TECHNOLOGIES, INC.
and Subsidiary
Notes to Consolidated Financial Statements
In
September 2016, the Company granted 558,000 restricted stock units
to its executive officers, 415,000 of which vest over 24 months and
143,000 of which vested at 12 months, and 336,000 restricted stock
units to its employees under the Company’s 2011 Stock
Incentive Plan. The Company is amortizing the fair value of the
restricted stock units of $284,580, and $171,360, respectively,
over the vesting periods.
In June
2016, the Company granted 262,500 restricted stock units to its
non-employee directors under the Company’s 2011 Stock
Incentive Plan. The Company amortized the fair value of these
options of $131,250, over the vesting period.
In
December 2015, the Company granted 625,000 performance-based
restricted stock units to its executive officers and 200,000
performance-based restricted stock units to its employees under the
Company’s 2011 Stock Incentive Plan, which vested during the
performance period, ended December 31, 2017, upon the earlier of:
i) achievement of a closing price for the Company’s common
stock equal to or greater than $1.20 per share for 20 consecutive
trading days, which was considered a market condition, or ii)
entering into a collaboration agreement (U.S. or global) of Vyleesi
for FSD, which was considered a performance condition. This
performance condition was deemed met as of February 2, 2017, the
effective date of the License Agreement on Vyleesi with AMAG. Prior
to meeting the performance condition, the Company determined that
it was not probable of achievement on the date of grant since
meeting the condition was outside the control of the Company. The
fair value of these awards, as calculated under a multifactor Monte
Carlo simulation, was $338,250 and was recognized over the derived
service period which was through December 2016. Upon the
achievement of the performance condition, which occurred in the
three-month period ended March 31, 2017 the grant date fair value
was utilized and an incremental $222,075 was recognized as
stock-based compensation expense during the three months ended
March 31, 2017. Also, in December 2015, the Company granted 625,000
restricted stock units to its executive officers, 340,000
restricted stock units to its non-employee directors and 200,000
restricted stock units to its employees under the Company’s
2011 Stock Incentive Plan. For executive officers and employees,
the restricted stock units vest 25% on the date of grant and 25% on
the first, second and third anniversary dates from the date of
grant. For non-employee directors, the restricted stock units
vested 50% on the first and second anniversary dates from the date
of grant. The Company is amortizing the fair value of these
restricted stock units of $425,000, $231,200 and $136,000,
respectively, over the vesting period.
Unless
otherwise stated, time-based restricted stock units granted to the
Company’s executive officers, employees and non-employee
directors vest over 24 months, 48 months and 12 months,
respectively.
In
connection with the vesting of restricted share units during the
years ended June 30, 2018, 2017 and 2016, the Company withheld
27,465, 75,993 and 123,483 shares with aggregate values of $20,786,
$27,088 and $58,401 respectively, in satisfaction of minimum tax
withholding obligations.
(15)
INCOME
TAXES
For
fiscal 2018, the Company recorded income tax expense of $82,500,
which consisted of $500,000 that was withheld in accordance with
tax withholding requirements in China related to our Fosun License
Agreement (Note 5) and $82,500, which was withheld in accordance
with tax withholding requirements in Korea related to our Kwangdong
License Agreement (Note 6). The total income tax expense of
$582,500 was offset by an income tax benefit of $500,000, which
resulted from the 2017 Tax Act, under which AMT credits became
refundable, and therefore a $500,000 benefit related to the release
of a valuation allowance against an AMT credit was recorded during
the quarter ended December 2017. The Company’s June 30, 2017
tax return was filed during the quarter ended March 31, 2018 and
the Company did not incur an AMT liability. As a result, as of June
30, 2018, the Company has a current income tax receivable of
$218,000 and a long-term income tax receivable of $282,000 from
estimated fiscal 2018 AMT that can be refunded in the
future.
For
fiscal 2017, the Company incurred $500,000 of estimated federal AMT
expense based on estimated federal alternative minimum taxable
income attributable to the $60,000,000 initial payment from AMAG.
For fiscal 2016 the Company had no income tax expense because of
operating losses or a tax benefit from the sale of New Jersey state
net operating loss carryforwards on account that it reached the
state limits on the sale of New Jersey state net operating loss
carryforwards and tax credits.
69
PALATIN TECHNOLOGIES, INC.
and Subsidiary
Notes to Consolidated Financial Statements
Deferred
tax assets and liabilities are determined based on the estimated
future tax effect of differences between the financial statement
and tax reporting basis of assets and liabilities, as well as for,
net operating loss carryforwards and research and development
credit carryforwards, given the provisions of existing tax
laws.
As a
result of the enactment of the new corporate income tax rate, the
Company remeasured certain deferred tax assets and liabilities
based on the rates at which they are expected to reverse, but
continues to maintain a full valuation allowance against its
deferred tax assets.
As of
June 30, 2018, the Company had state net operating loss
carryforwards of approximately $118,309,000, which will expire, if
not utilized, between 2030 and 2037, federal net operating loss
carryforwards of approximately $100,439,000, federal research and
development credits of approximately $5,649,000, which expire, if
not utilized, between 2020 and 2038, and foreign tax credits of
$582,500, which expire, if not utilized, in 2028.
The Tax
Reform Act of 1986 (the “Act”) provides for limitation
on the use of these net operating loss and research and development
tax credit carryforwards following certain ownership changes (as
defined by the Act) that could limit the Company’s ability to
utilize these carryforwards. Since its inception, the Company has
completed several financings and sales of common stock which has
resulted in multiple ownership changes defined by Section 382 of
the Act. Accordingly, the Company’s ability to utilize the
aforementioned carryforwards are subject to limitation under
Section 382.
The
Company does have adequate levels of available net operating loss
carryforwards that are not subject to limitation under Section 382
to offset taxable income during the tax year ended June 30, 2018.
If the Company undergoes a future ownership change or as it
completes its Section 382 limitation assessment, any unutilized
carryforwards that were not previously subject to a Section 382
limitation may become subject to limitation which may result in a
significant limitation and loss of net operating loss
carryforwards.
Additionally,
U.S. tax laws limit the time during which these carryforwards may
be applied against future taxes; therefore, the Company may not be
able to take full advantage of these carryforwards for federal
income tax purposes. Accordingly, a portion of the carryforwards
may expire unutilized.
The
Company’s net deferred tax assets are as
follows:
|
|
June
30,
|
June
30,
|
|
|
2018
|
2017
|
|
Net operating loss
carryforwards
|
$
29,504,000
|
$
103,845,000
|
|
Research and
development and AMT tax credits
|
5,649,000
|
12,360,000
|
|
Foreign tax
credits
|
583,000
|
-
|
|
Basis differences
in fixed assets and other
|
1,734,000
|
1,510,000
|
|
Basis difference in
deferred revenue
|
-
|
14,318,000
|
|
|
37,470,000
|
132,033,000
|
|
Valuation
allowance
|
(37,470,000
)
|
(132,033,000
)
|
|
Net deferred tax
assets
|
$
-
|
$
-
|
In
assessing the realizability of deferred tax assets, the Company
considers whether it is more likely than not that some portion or
all of the deferred tax assets will not be realized. The ultimate
realization of deferred tax assets is dependent upon the generation
of future taxable income and the application of loss limitation
provisions related to ownership changes. The Company assesses the
available positive and negative evidence to estimate if sufficient
future taxable income will be generated to use the existing
deferred tax assets. The Company also considers the scheduled
reversal of deferred tax liabilities (including the impact of
available carryback and carryforward periods), projected future
taxable income, and tax-planning strategies in making this
assessment. A significant piece of objective negative evidence
evaluated was the cumulative loss incurred over the three-year
period from July 1, 2015 through June 30, 2018. On the basis of
these considerations, the Company continued to recognize a full
valuation allowance against its net deferred tax assets as of June
30, 2018 and 2017.
70
PALATIN TECHNOLOGIES, INC.
and Subsidiary
Notes to Consolidated Financial Statements
The
Company recognizes interest expense and penalties on uncertain
income tax positions as a component of interest expense. No
interest expense or penalties were recorded for uncertain income
tax matters in fiscal 2018, 2017 or 2016. As of June 30, 2018 and
2017, the Company had no liabilities for uncertain income tax
matters.
(16)
CONSOLIDATED
QUARTERLY FINANCIAL DATA - UNAUDITED
The
following tables provide quarterly data for the years ended June
30, 2018 and 2017.
|
|
Three Months Ended
|
|||
|
|
June
30,
|
March
31,
|
December
31,
|
September
30,
|
|
|
2018
|
2018
|
2017
|
2017
|
|
|
(amounts in thousands, except per share
data)
|
|||
|
Revenues
|
$
20,618
|
$
8,963
|
$
10,612
|
$
26,942
|
|
Operating
expenses
|
8,349
|
9,480
|
7,671
|
15,708
|
|
Other expense,
net
|
(185
)
|
(241
)
|
(310
)
|
(405
)
|
|
Income (loss)
before income taxes
|
12,083
|
(758
)
|
2,631
|
10,829
|
|
Income
taxes
|
(276
)
|
19
|
399
|
(225
)
|
|
Net income
(loss)
|
$
11,807
|
$
(739
)
|
$
3,030
|
$
10,604
|
|
Basic net income
(loss) per common share
|
$
0.06
|
$
-
|
$
0.02
|
$
0.05
|
|
Diluted net income
(loss) per common share
|
$
0.06
|
$
-
|
$
0.01
|
$
0.05
|
|
Weighted average
number of
|
|
|
|
|
|
common shares
outstanding
|
|
|
|
|
|
used in computing
basic net
|
|
|
|
|
|
income (loss) per
common share
|
200,581,435
|
197,485,758
|
197,238,056
|
197,112,400
|
|
Weighted average
number of
|
|
|
|
|
|
common shares
outstanding
|
|
|
|
|
|
used in computing
diluted net
|
|
|
|
|
|
income (loss) per
common share
|
211,047,927
|
197,485,758
|
202,711,616
|
201,360,736
|
71
PALATIN TECHNOLOGIES, INC.
and Subsidiary
Notes to Consolidated Financial Statements
|
|
Three Months Ended
|
|||
|
|
June
30,
|
March
31,
|
December
31,
|
September
30,
|
|
|
2017
|
2017
|
2016
|
2016
|
|
|
(amounts in
thousands, except per share data)
|
|||
|
Revenues
|
$
33,900
|
$
10,824
|
$
-
|
$
-
|
|
Operating
expenses
|
19,581
|
13,836
|
9,441
|
12,435
|
|
Other expense,
net
|
(504
)
|
(552
)
|
(588
)
|
(618
)
|
|
Income (loss)
before income taxes
|
13,815
|
(3,564
)
|
(10,029
)
|
(13,053
)
|
|
Income
taxes
|
(500
)
|
-
|
-
|
-
|
|
Net income
(loss)
|
$
13,315
|
$
(3,564
)
|
$
(10,029
)
|
$
(13,053
)
|
|
Basic net income
(loss) per common share
|
$
0.07
|
$
(0.02
)
|
$
(0.06
)
|
$
(0.08
)
|
|
Diluted net income
(loss) per common share
|
$
0.07
|
$
(0.02
)
|
$
(0.06
)
|
$
(0.08
)
|
|
Weighted average
number of
|
|
|
|
|
|
common shares
outstanding
|
|
|
|
|
|
used in computing
basic net
|
|
|
|
|
|
income (loss) per
common share
|
196,874,145
|
196,580,519
|
177,798,511
|
165,848,269
|
|
Weighted average
number of
|
|
|
|
|
|
common shares
outstanding
|
|
|
|
|
|
used in computing
diluted net
|
|
|
|
|
|
income (loss) per
common share
|
197,948,721
|
196,580,519
|
177,798,511
|
165,848,269
|
(17)
SUBSEQUENT
EVENTS
Between July 1, 2018 and September 11, 2018, a total of 1,305,949
shares of the Company’s common stock were sold through
Canaccord under the Equity Distribution Agreement for net proceeds
of $1,299,263 after payment of commission fees of
$40,183.
72
None.
Our
management carried out an evaluation, with the participation of our
Chief Executive Officer and our Chief Financial Officer, of the
effectiveness of our disclosure controls and procedures (as defined
in Rules 13a-15(e) or 15d-15(e) of the Exchange Act) as of the end
of the period covered by this report. Based upon this evaluation,
our Chief Executive Officer and our Chief Financial Officer
concluded that, as of June 30, 2018, our disclosure controls and
procedures were effective.
A
control system, no matter how well designed and operated, cannot
provide absolute assurance that the objectives of the control
system are met, and no evaluation of controls can provide absolute
assurance that all control issues and instances of fraud, if any,
within a company have been detected.
Management’s Report on Internal Control Over Financial
Reporting
Management
is responsible for establishing and maintaining adequate internal
control over financial reporting as defined in Rule 13a-15(f) or
15d-15(f) of the Exchange Act. Our internal control system was
designed to provide reasonable assurance to management and the
board of directors regarding the preparation and fair presentation
of published financial statements.
All
internal control systems, no matter how well designed, have
inherent limitations. Therefore, even those systems determined to
be effective can provide only reasonable assurance with respect to
financial statement preparation and presentation.
There
was no change in our internal control over financial reporting
during the fourth quarter of the period covered by this Annual
Report that has materially affected, or is reasonably likely to
materially affect, our internal control over financial
reporting.
Management
assessed the effectiveness of our internal control over financial
reporting as of June 30, 2018. In making this assessment, it used
the criteria set forth by the Committee of Sponsoring Organizations
of the Treadway Commission (COSO) in
Internal Control-Integrated Framework as
adopted in 2013
. Based on its assessment, management
believes that, as of June 30, 2018, our internal control over
financial reporting is effective based on those
criteria.
Our
independent registered accounting firm, KPMG LLP, has audited our
internal control over financial reporting as of June 30, 2018.
Their report on the effectiveness of our internal control over
financial reporting appears below.
73
Report of Independent Registered Public Accounting
Firm
To the
Stockholders and Board of Directors
Palatin
Technologies, Inc.:
Opinion on Internal Control Over Financial Reporting
We have
audited Palatin Technologies, Inc. and subsidiary’s (the
Company) internal control over financial reporting as of
June 30, 2018, based on criteria established in
Internal Control – Integrated Framework
(2013)
issued by the Committee of Sponsoring Organizations
of the Treadway Commission. In our opinion, the Company maintained,
in all material respects, effective internal control over financial
reporting as of June 30, 2018, based on criteria established in
Internal Control –
Integrated Framework (2013)
issued by the Committee of
Sponsoring Organizations of the Treadway Commission.
We also
have audited, in accordance with the standards of the Public
Company Accounting Oversight Board (United States) (PCAOB), the
consolidated balance sheets of the Company as of June 30, 2018
and 2017, the related consolidated statements of operations,
comprehensive income (loss), stockholders’ equity
(deficiency), and cash flows for each of the years in the
three-year period ended June 30, 2018, and the related notes
(collectively, the consolidated financial statements), and our
report dated September 13, 2018 expressed an unqualified opinion on
those consolidated financial statements.
Basis for Opinion
The
Company’s management is responsible for maintaining effective
internal control over financial reporting and for its assessment of
the effectiveness of internal control over financial reporting,
included in the accompanying
Management’s Report on
Internal Control Over Financial Reporting
. Our
responsibility is to express an opinion on the Company’s
internal control over financial reporting based on our audit. We
are a public accounting firm registered with the PCAOB and are
required to be independent with respect to the Company in
accordance with the U.S. federal securities laws and the applicable
rules and regulations of the Securities and Exchange Commission and
the PCAOB.
We
conducted our audit in accordance with the standards of the PCAOB.
Those standards require that we plan and perform the audit to
obtain reasonable assurance about whether effective internal
control over financial reporting was maintained in all material
respects. Our audit of internal control over financial reporting
included obtaining an understanding of internal control over
financial reporting, assessing the risk that a material weakness
exists, and testing and evaluating the design and operating
effectiveness of internal control based on the assessed risk. Our
audit also included performing such other procedures as we
considered necessary in the circumstances. We believe that our
audit provides a reasonable basis for our opinion.
Definition and Limitations of Internal Control Over Financial
Reporting
A
company’s internal control over financial reporting is a
process designed to provide reasonable assurance regarding the
reliability of financial reporting and the preparation of financial
statements for external purposes in accordance with generally
accepted accounting principles. A company’s internal control
over financial reporting includes those policies and procedures
that (1) pertain to the maintenance of records that, in
reasonable detail, accurately and fairly reflect the transactions
and dispositions of the assets of the company; (2) provide
reasonable assurance that transactions are recorded as necessary to
permit preparation of financial statements in accordance with
generally accepted accounting principles, and that receipts and
expenditures of the company are being made only in accordance with
authorizations of management and directors of the company; and
(3) provide reasonable assurance regarding prevention or
timely detection of unauthorized acquisition, use, or disposition
of the company’s assets that could have a material effect on
the financial statements.
Because
of its inherent limitations, internal control over financial
reporting may not prevent or detect misstatements. Also,
projections of any evaluation of effectiveness to future periods
are subject to the risk that controls may become inadequate because
of changes in conditions, or that the degree of compliance with the
policies or procedures may deteriorate.
/s/
KPMG LLP
Philadelphia,
Pennsylvania
September
13, 2018
None.
74
Identification of Directors
The
following table sets forth the names, ages, positions and committee
memberships of our current directors. All directors hold office
until the next annual meeting of stockholders or until their
successors have been elected and qualified. All current directors
were elected at our annual stockholders’ meeting on June 26,
2018.
|
Name
|
Age
|
Position with Palatin
|
|
Carl
Spana, Ph.D.
|
55
|
Chief
Executive Officer, President and a Director
|
|
John
K.A. Prendergast, Ph.D. (3)
|
64
|
Director, Chairman
of the Board of Directors
|
|
Robert
K. deVeer, Jr. (1) (2)
|
72
|
Director
|
|
J.
Stanley Hull (1) (2)
|
66
|
Director
|
|
Alan W.
Dunton, M.D. (1) (2)
|
64
|
Director
|
|
Angela
Rossetti (1) (3)
|
65
|
Director
|
|
Arlene
M. Morris (2) (3)
|
66
|
Director
|
|
Anthony
M. Manning (3)
|
56
|
Director
|
|
(1)
Member of the audit committee.
(2)
Member of the compensation committee.
(3)
Member of the nominating and corporate governance
committee.
|
||
CARL
SPANA, Ph.D., co-founder of Palatin, has been our Chief Executive
Officer and President since June 14, 2000. He has been a director
of Palatin since June 1996 and has been a director of our
wholly-owned subsidiary, RhoMed Incorporated, since July 1995. From
June 1996 through June 14, 2000, Dr. Spana served as an executive
vice president and our chief technical officer. From June 1993 to
June 1996, Dr. Spana was vice president of Paramount Capital
Investments, LLC, a biotechnology and biopharmaceutical merchant
banking firm, and of The Castle Group Ltd., a medical venture
capital firm. Through his work at Paramount Capital Investments and
The Castle Group, Dr. Spana co-founded and acquired several private
biotechnology firms. From July 1991 to June 1993, Dr. Spana was a
Research Associate at Bristol-Myers Squibb, a publicly-held
pharmaceutical company, where he was involved in scientific
research in the field of immunology. He was previously a member of
the board of the life science company AVAX Technologies, Inc. Dr.
Spana received his Ph.D. in molecular biology from The Johns
Hopkins University and his B.S. in biochemistry from Rutgers
University.
Dr.
Spana’s qualifications for our board include his leadership
experience, business judgment and industry experience. As a senior
executive of Palatin for over nineteen years, he provides in-depth
knowledge of our company, our drug products under development and
the competitive and corporate partnering landscape.
JOHN
K.A. PRENDERGAST, Ph.D., co-founder of Palatin, has served as the
non-executive Chairman of the board since June 14, 2000, and as a
director since August 1996. While Mr. Prendergast has served as a
member of the board, he does not, and has not, served in a
management or operational role with the company. Dr. Prendergast
has been president and sole stockholder of Summercloud Bay, Inc.,
an independent consulting firm providing services to the
biotechnology industry, since 1993. Dr. Prendergast is a director
and executive chairman of the board of directors of Antyra, Inc., a
privately held biopharmaceutical firm, lead director of Heat
Biologics, Inc., a publicly traded clinical stage immunotherapy
company, and a director of Recce Pharmaceuticals Ltd., a publicly
traded Australian pharmaceutical company developing antibiotic
drugs. He was previously a member of the board of the life science
companies AVAX Technologies, Inc., Avigen, Inc. and MediciNova,
Inc. From October 1991 through December 1997, Dr. Prendergast was a
managing director of The Castle Group Ltd., a medical venture
capital firm. Dr. Prendergast received his M.Sc. and Ph.D. from the
University of New South Wales, Sydney, Australia and a C.S.S. in
administration and management from Harvard University.
75
Dr.
Prendergast brings a historical perspective to our board coupled
with extensive industry experience in corporate development and
finance in the life sciences field. His prior service on other
publicly traded company boards provides experience relevant to good
corporate governance practices.
ROBERT
K. deVEER, Jr. has been a director of Palatin since November 1998.
Since January 1997, Mr. deVeer has been the president of deVeer
Capital LLC, a private investment company. He was a director of
Solutia Inc., a publicly-held chemical-based materials company,
until its merger with Eastman Chemical Company in July 2012. From
1995 until his retirement in 1996, Mr. deVeer served as Managing
Director, Head of Industrial Group, at New York-based Lehman
Brothers. From 1973 to 1995, he held increasingly responsible
positions at New York-based CS First Boston, including Head of
Project Finance, Head of Industrials and Head of Natural Resources.
He was a managing director, member of the investment banking
committee and a trustee of the First Boston Foundation. He received
a B.A. in economics from Yale University and an M.B.A. in finance
from Stanford Graduate School of Business.
Mr.
deVeer has extensive experience in investment banking and corporate
finance, including the financing of life sciences companies, and
serves as the audit committee’s financial
expert.
J.
STANLEY HULL has been a director of Palatin since September 2005.
Mr. Hull has over three decades of experience in the field of
sales, marketing and drug development. Mr. Hull joined
GlaxoSmithKline, a research-based pharmaceutical company, in
October 1987 and retired as Senior Vice President, Pharmaceuticals
– North America in May 2010. Mr. Hull was responsible for all
commercial activities including sales, marketing, sales training
and office operations. Previously Mr. Hull served in the R&D
organization of Glaxo Wellcome as Vice President and Worldwide
Director of Therapeutic Development and Product Strategy –
Neurology and Psychiatry. Prior to his service in the R&D
organization he was Vice President of Marketing – Infectious
Diseases and Gastroenterology for Glaxo Wellcome-U.S. Mr. Hull
started his career in the pharmaceutical industry with SmithKline
and French Laboratories in 1978. Mr. Hull received his B.S. in
business administration from the University of North Carolina at
Greensboro.
Mr.
Hull has extensive experience in commercial operations, development
and marketing of pharmaceutical drugs and corporate alliances
between pharmaceutical companies and biotechnology
companies.
ALAN W.
DUNTON, M.D., has been a director of Palatin since June 2011. He
founded Danerius, LLC, a biotechnology consulting company, in 2006.
From November 2015 through March 2018 he was senior vice president
of research, development and regulatory affairs for Purdue Pharma
L.P., with responsibilities for overall research strategy and
development programs. From January 2007 to March 2009, Dr. Dunton
served as president and chief executive officer of Panacos
Pharmaceuticals Inc. and he served as a managing director of
Panacos from March 2009 to January 2011. Dr. Dunton is currently a
member of the board of directors of the publicly traded company
Oragenics, Inc. He previously served on the board of directors of
the publicly traded companies Targacept, Inc., EpiCept Corporation
(as Non-Executive Chairman), Adams Respiratory Therapeutics, Inc.
(acquired by Reckitt Benckiser Group plc), MediciNova, Inc. and
Panacos Pharmaceuticals, Inc. Dr. Dunton has served as a director
or executive officer of various pharmaceutical companies, and from
1994 to 2001, Dr. Dunton was a senior executive in various
capacities in the Pharmaceuticals Group of Johnson & Johnson,
including president and managing director of the Janssen Research
Foundation, the primary global R&D organization for Johnson
& Johnson. Dr. Dunton received his M.D. degree from New York
University School of Medicine, where he completed his residency in
internal medicine. He also was a Fellow in Clinical Pharmacology at
the New York Hospital/Cornell University Medical
Center.
Dr.
Dunton has extensive drug development and clinical research
experience, having played a key role in the development of more
than 20 products to regulatory approval, and also has extensive
experience as an executive and officer for both large
pharmaceutical companies and smaller biotechnology and
biopharmaceutical companies.
ANGELA
ROSSETTI has been a director of Palatin since June 2013. From June
2015 through July 2017, she served as Executive Vice President of
Cell Machines, Inc., an early stage biopharmaceutical company
developing novel protein therapies. Previously, Ms. Rossetti served
in pharmaceutical marketing, communications and financial roles,
including as Vice President at Pfizer Inc., where she led a global
commercial medicine team for smoking cessation, and as an Assistant
Vice President at Wyeth, managing a global hemophilia business.
Previously, she was President of Ogilvy Healthworld, an advertising
business in the pharmaceutical and biotechnology sectors, and
served on the Biotech and Pharmaceutical Advisory Board of Danske
Capital for six years. Ms. Rossetti graduated from a joint program
of the Albert Einstein College of Medicine and Benjamin N. Cardozo
School of Law with an M.S.in Bioethics in 2014, has an M.B.A. in
Finance from Columbia University Graduate School of Business and a
B.A. in Biology from the University of Pennsylvania, and is an
adjunct Assistant Professor at New York Medical
College.
Ms.
Rossetti has extensive experience in worldwide development and
marketing of specialty pharmaceuticals, including prefilled syringe
products, in communications and development of commercialization
plans and in pharmaceutical and biotechnology finance.
76
ARLENE
M. MORRIS has been a director of Palatin since June 2015. Since May
2015 she has served as the chief executive officer of Willow
Advisors, LLC. From April 2012 until May 2015 she was President and
Chief Executive Officer of Syndax Pharmaceuticals, Inc., a
privately held biopharmaceutical company focused on the development
and commercialization of an epigenetic therapy for
treatment-resistant cancers, and was a member of the board of
directors from May 2011 until May 2015. From 2003 to January 2011,
Ms. Morris served as the President, Chief Executive Officer and a
member of the board of directors of Affymax, Inc., a publicly
traded biotechnology company. Ms. Morris has also held various
management and executive positions at Clearview Projects, Inc., a
corporate advisory firm, Coulter Pharmaceutical, Inc., a publicly
traded pharmaceutical company, Scios Inc., a publicly traded
biopharmaceutical company, and Johnson & Johnson, a publicly
traded healthcare company. She is currently a member of the board
of directors of Viveve Medical, Inc., a publicly traded female
healthcare medical device company, miRagen Therapeutics, Inc., a
publicly traded microRNA therapeutics company, and Neovacs, SA, a
French publicly traded biotechnology company, and was a director of
Biodel Inc., a publicly traded specialty pharmaceutical company,
from 2015 until its merger with Albireo Limited in 2016, and
Dimension Therapeutics, Inc., a publicly traded gene therapy
company, until its acquisition by Ultragenyx Pharmaceutical Inc. in
2017. Ms. Morris received a B.A. in Biology and Chemistry from
Carlow College.
Ms.
Morris has extensive experience in the biotechnology industry,
including prior leadership positions, current senior management and
board service, and experience as chief executive officer of
companies with product candidates in phase 3 clinical
trials.
ANTHONY
M. MANNING, Ph.D., has been a director of Palatin since September
2017. Since 2013, Dr. Manning has been senior vice president of
research at Momenta Pharmaceuticals, Inc., a publicly traded
biopharmaceutical company developing therapeutics for autoimmune
indications as well as biosimilars and generic versions of complex
drugs. From 2011 to 2013, he was senior vice president of research
and development at Aileron Therapeutics, Inc., a publicly traded
biopharmaceutical company developing stapled peptide therapeutics
for cancers and other diseases. From 2007 to 2011, he was vice
president and head of inflammation and autoimmune diseases research
at Biogen, Inc., a publicly traded biopharmaceutical company
developing medicines for neurological and neurodegenerative
conditions. From 2002 to 2007, he was vice president and global
therapy area head for Roche Pharmaceuticals, the pharmaceutical
division of Roche Holding AG, and from 2000 to 2002 he was vice
president of Pharmacia, a global pharmaceutical company acquired by
Pfizer in 2002. Dr. Manning received his Ph.D., M.Sc. and B.Sc.
from the University of Otago, Dunedin, New Zealand.
Dr.
Manning has extensive experience in translational research and
development of new pharmaceutical products, and in pharmaceutical
and biotechnology research, development and business
strategy.
The Board and Its Committees
Committees and meetings
. The board has an audit committee, a
compensation committee and a nominating and corporate governance
committee. During fiscal 2018, the board met five times, the audit
committee met four times, the compensation committee met three
times and the nominating and corporate governance committee met two
times. Each director attended at least 75% of the total number of
meetings of the board and committees of the board on which he
served. The independent directors meet in executive sessions at
least annually, following the annual board meeting. We do not have
a policy requiring our directors to attend stockholder meetings.
With the exception of Drs. Prendergast and Spana, the directors did
not attend the annual meeting of stockholders held on June 26,
2018.
Audit committee
. The audit committee reviews the engagement
of the independent registered public accounting firm and reviews
the independence of the independent registered public accounting
firm. The audit committee also reviews the audit and non-audit fees
of the independent registered public accounting firm and the
adequacy of our internal control procedures. The audit committee is
currently composed of four independent directors, Mr. deVeer
(chair), and Dr. Dunton, Ms. Rossetti and Mr. Hull. The board has
determined that the members of the audit committee are independent,
as defined in the listing standards of the NYSE American, and
satisfy the requirements of the NYSE American as to financial
literacy and expertise. The board has determined that at least one
member of the committee, Mr. deVeer, is the audit committee
financial expert as defined by Item 407 of Regulation S-K. The
responsibilities of the audit committee are set forth in a written
charter adopted by the board and updated as of October 1, 2013, a
copy of which is available on our web site at
www.palatin.com.
77
Compensation committee.
The compensation committee reviews
and recommends to the board on an annual basis employment
agreements and compensation for our officers, directors and some
employees, and administers our 2011 Plan and the options still
outstanding which were granted under previous stock option plans.
The compensation committee is composed of Dr. Dunton (chair), Ms.
Morris and Messrs. deVeer and Hull. The board has determined that
the members of the compensation committee are independent, as
defined in the listing standards of the NYSE American. Our Chief
Executive Officer aids the compensation committee by providing
annual recommendations regarding the compensation of all executive
officers, other than himself. Our Chief Financial Officer supports
the committee in its work by gathering, analyzing and presenting
data on our compensation arrangements and compensation in the
marketplace.
The
responsibilities of the compensation committee are set forth in a
written charter adopted by the board effective October 1, 2013, a
copy of which is available on our web site at www.palatin.com. The
committee administers our 2011 Plan, under which it has delegated
to an officer its authority to grant stock options to employees and
to a single-member committee of the board its authority to grant
restricted stock units to officers and to grant options and
restricted stock units to our consultants, but in either instance
not to grant options or restricted stock units to themselves, any
member of the board or officer, or any person subject to Section 16
of the Exchange Act.
Nominating and corporate governance committee.
The
nominating and corporate governance committee assists the board in
recommending nominees for directors, and in determining the
composition of committees. It also reviews, assesses and makes
recommendations to the board concerning policies and guidelines for
corporate governance, including relationships of the board, the
stockholders and management in determining our direction and
performance. The responsibilities of the nominating and corporate
governance committee are set forth in a written charter adopted by
the board and updated as of October 1, 2013, a copy of which is
available on our web site at www.palatin.com. The nominating and
corporate governance committee is composed of Dr. Prendergast
(chair), Mss. Rossetti and Morris and Dr. Manning, each of whom
meets the independence requirements established by the NYSE
American.
Duration of Office.
Unless a director resigns, all directors
hold office until the next annual meeting of stockholders or until
their successors have been elected and qualified. Directors serve
as members of committees as the board determines from time to
time.
Communicating With Directors
Generally,
stockholders or other interested parties who have questions or
concerns should contact Stephen T. Wills, Secretary, Palatin
Technologies, Inc., 4B Cedar Brook Drive, Cranbury, NJ 08512.
However, any stockholder or other interest party who wishes to
address questions regarding our business directly to the board of
directors, or any individual director, can direct questions to the
board members or a director by regular mail to the Secretary at the
address above or by e-mail at boardofdirectors@palatin.com.
Stockholders or other interested parties may also submit their
concerns anonymously or confidentially by postal mail.
Communications
are distributed to the board, or to any individual directors as
appropriate, depending on the facts and circumstances outlined in
the communication, unless the Secretary determines that the
communication is unrelated to the duties and responsibilities of
the board, such as product inquiries, resumes, advertisements or
other promotional material. Communications that are unduly hostile,
threatening, illegal or similarly unsuitable will also not be
distributed to the board or any director. All communications
excluded from distribution will be retained and made available to
any non-management director upon request.
Board Role in Risk Oversight
Our
board, as part of its overall responsibility to oversee the
management of our business, considers risks generally when
reviewing our strategic plan, financial results, business
development activities, legal and regulatory matters. The board
satisfies this responsibility through regular reports directly from
our officers responsible for oversight of particular risks. The
board’s risk management oversight also includes full and open
communications with management to review the adequacy and
functionality of the risk management processes used by management.
The board’s role in risk oversight has no effect on the
board’s leadership structure. In addition, committees of the
board assist in its risk oversight responsibility,
including:
●
The audit committee
assists the board in its oversight of the integrity of the
financial reporting and our compliance with applicable legal and
regulatory requirements. It also oversees our internal controls and
compliance activities, and meets privately with representatives
from our independent registered public accounting
firm.
78
●
The compensation
committee assists the board in its oversight of risk relating to
compensation policies and practices. The compensation committee
annually reviews our compensation policies, programs and
procedures, including the incentives they create and mitigating
factors that may reduce the likelihood of excessive risk taking, to
determine whether they present a significant risk to our
company.
Board Leadership Structure
Since
2000, the roles of chairman of the board and chief executive
officer have been held by separate persons. John K.A. Prendergast,
Ph.D., a non-employee director, has served as Chairman of the board
since June 2000. Carl Spana, Ph.D., has been our Chief Executive
Officer and President since June 2000. Generally, the chairman is
responsible for advising the chief executive officer, assisting in
long-term strategic planning, and presiding over meetings of the
board, and the chief executive officer is responsible for leading
our day-to-day performance. While we do not have a written policy
with respect to separation of the roles of chairman of the board
and chief executive officer, the board believes that the existing
leadership structure, with the separation of these roles, provides
several important advantages, including: enhancing the
accountability of the chief executive officer to the board;
strengthening the board’s independence from management;
assisting the board in reaching consensus on particular strategies
and policies; and facilitating robust director, board, and
executive officer evaluation processes.
Code of Corporate Conduct and Ethics
We have
adopted a code of corporate conduct and ethics, updated as of March
11, 2016, that applies to all of our directors, officers and
employees, including our Chief Executive Officer and Chief
Financial Officer. You can view the code of corporate conduct and
ethics at our website, www.palatin.com. We will disclose any
amendments to, or waivers from, provisions of the code of corporate
conduct and ethics that apply to our directors, principal executive
and financial officers in a current report on Form 8-K, unless the
rules of the NYSE American permit website posting of any such
amendments or waivers.
Executive Officers
Executive
officers are appointed by the board and serve at the discretion of
the board. Each officer holds his position until his successor is
appointed and qualified. The current executive officers hold office
under employment agreements.
|
Name
|
Age
|
Position with
Palatin
|
|
Carl
Spana, Ph.D.
|
55
|
Chief
Executive Officer, President and Director
|
|
Stephen
T. Wills, MST, CPA
|
61
|
Chief
Financial Officer, Chief Operating Officer, Executive Vice
President, Secretary and Treasurer
|
Additional
information about Dr. Spana is included above under the heading
“Identification of Directors.”
STEPHEN
T. WILLS, CPA, MST, has been Executive Vice President, Secretary,
Treasurer and Chief Financial Officer since 1997 and was Executive
Vice President of Operations from 2005 until June 2011, when he was
appointed Chief Operating Officer and Executive Vice President.
Since March 2017, Mr. Wills has served as a director, and since
October 2017 as non-executive chairman, of MediWound Ltd., a
publicly-traded biopharmaceutical company providing products for
severe burns, chronic and other hard-to-heal wounds. Mr. Wills
served as executive chairman and interim principal executive
officer of Derma Sciences, Inc. (“Derma”), a
publicly-held company providing advanced wound care products, from
December 2015 until February 2017 when Derma was acquired by
Integra LifeSciences Holding Corporation. Mr. Wills also served as
the lead director of Derma until December 2015 and as Derma’s
chief financial officer from 1997 to 2000. Mr. Wills is chairman of
the board of trustees of The Hun School of Princeton, New Jersey.
From 1991 to 2000 he was the president and chief operating officer
of Golomb, Wills & Company, P.C., a public accounting firm. Mr.
Wills, a certified public accountant, received his B.S. in
accounting from West Chester University, and an M.S. in taxation
from Temple University.
Section 16(A) Beneficial Ownership Reporting
Compliance
The
rules of the SEC require us to disclose failures to file or late
filings of reports of stock ownership and changes in stock
ownership required to be filed by our directors, officers and
holders of more than 10% of our common stock. To the best of our
knowledge, all of the filings for our directors, officers and
holders of more than 10% of our common stock were made on a timely
basis in fiscal 2018.
79
Fiscal 2018 Summary Compensation Table
The
following table summarizes the compensation earned by or paid to
our principal executive officer and our principal financial
officer, who constitute all of our executive officers, for fiscal
2018 and fiscal 2017. We have no defined benefit or actuarial
pension plan, and no deferred compensation plan.
|
Name and
Principal Position
|
Fiscal
Year
|
Salary
($)
|
Stock
awards (1)
($)
|
Option
awards (1)
($)
|
Nonequity
incentive plan compensation (2)($)
|
All
other
compensation
(3)($)
|
Total
($)
|
|
|
|
Carl
Spana, Ph.D., Chief Executive Officer and President
|
2018
|
490,700
|
1,418,500
|
1,029,882
|
263,000
|
13,857
|
3,215,939
|
|
|
2017
|
476,400
|
368,050
|
367,368
|
458,000
|
13,250
|
1,683,068
|
|
|
|
Stephen
T. Wills, MST, CPA, Chief Financial Officer, Chief Operating
Officer and Executive Vice President
|
2018
|
448,300
|
1,189,125
|
869,371
|
240,000
|
13,827
|
2,760,623
|
|
|
2017
|
435,200
|
338,330
|
336,570
|
438,000
|
13,250
|
1,561,350
|
|
|
|
|
|
|
|
|
|
|
|
(1)
Amounts in these
columns represent the aggregate grant date fair value for stock
awards and option awards computed using either the Black-Scholes
model or a multifactor Monte Carlo simulation. For a description of
the assumptions we used to calculate these amounts, see Note 14 to
the consolidated financial statements included in this Annual
Report.
(2)
Bonus
amounts.
(3)
Consists of
matching contributions to 401(k) plan.
Employment Agreements
Effective
July 1, 2016, we entered into employment agreements with Dr. Spana
and Mr. Wills which continue through June 30, 2019 unless
terminated earlier. Under these agreements, which replaced
substantially similar agreements that expired on June 30, 2016, Dr.
Spana is serving as Chief Executive Officer and President at a base
salary of $476,400 per year and Mr. Wills is serving as Chief
Financial Officer and Chief Operating Officer at a base salary of
$435,200 per year. Each agreement also provides for:
●
annual
discretionary bonus compensation, in an amount to be decided by the
compensation committee and approved by the board, based on
achievement of yearly performance objectives; and
●
participation in
all benefit programs that we establish, to the extent the
executive’s position, tenure, salary, age, health and other
qualifications make him eligible to participate.
Each
agreement allows us or the executive to terminate the agreement
upon written notice, and contains other provisions for termination
by us for “cause,” or by the employee for “good
reason” or due to a “change in control” (as these
terms are defined in the employment agreements and set forth
below). Early termination may, in some circumstances, result in
severance pay at the salary then in effect, plus continuation of
medical and dental benefits then in effect for a period of two
years (Dr. Spana) or 18 months (Mr. Wills). In addition, the
agreements provide that options and restricted stock units granted
to these officers accelerate upon termination of employment except
for voluntary resignation by the officer or termination for cause.
In the event of retirement, termination by the officer for good
reason, or termination by us other than for “cause”,
options may be exercised until the earlier of twenty-four months
following termination or expiration of the option term.
Arrangements with our named executive officers in connection with a
termination following a change in control are described below. Each
agreement includes non-competition, non-solicitation and
confidentiality covenants.
80
The
annual incentive bonus for the named executive officers is
determined based on corporate performance and also individual
achievements and performance, as warranted. The target bonus payout
for both fiscal 2018 and fiscal 2017 was 50% of base salary. In
determining the annual incentive bonus opportunity for executives,
the executive’s annual base salary is multiplied by the
target bonus percentage. The resulting amount is then multiplied by
the corporate performance percentage approved by the compensation
committee, which is dependent on the achievement of corporate
performance goals, and also potentially adjusted upwards or
downwards for individual executives based on their individual
contribution toward the corporate results during the relevant year.
For fiscal 2018, the compensation committee determined that our
named executive officers achieved 107% of their target objectives,
consisting primarily of progress relating to the Vyleesi program,
including filing an NDA and acceptance of the NDA by FDA, and
entering into license agreements on Vyleesi with Fosun and
Kwangdong and secondarily to advances in MC1r anti-inflammatory
programs and other corporate items, and our financial condition. In
February 2017 the compensation committee awarded a special,
one-time cash bonus of $220,000 to each of the named executive
officers based on positive data for Vyleesi in the Phase 3 clinical
trials and entering into a North American licensing agreement with
AMAG. In June 2017, the compensation committee determined that our
named executive officers achieved 100% of their target objectives,
after giving consideration to the February 2017 award, based on
results of the Vyleesi program, and secondarily to advances in MC14
anti-inflammatory programs and NPR programs.
Stock Option and Restricted Stock Unit Grants
On June
26, 2018, we granted 356,000 restricted stock units to Dr. Spana
and 303,000 restricted stock units to Mr. Wills, which vest as to
50% of the number of shares granted on each anniversary of the
grant date. We also granted 533,000 stock options to Dr. Spana and
454,000 stock options to Mr. Wills, which vest as to 25% of the
number of shares granted on each anniversary of the grant date.
These options have an exercise price of $1.00, the fair market
value of the common stock on the date of grant, and they expire on
June 26, 2028.
In the
fall of 2017, the compensation committee retained Korn Ferry Hay
Group (“Hay Group”), a nationally-recognized global
human resources consulting firm, as its independent compensation
advisor. Hay Group principally provided analysis, advice and
recommendations regarding named executive officer and non-employee
director compensation. Hay Group developed a peer group of
twenty-one similarly-situated public companies which was used as
the basis for competitive market analysis both for beneficial
ownership and target total cash compensation. It was determined
that long term incentive equity grant value for the named executive
officers was below the peer group twenty-fifth percentile, and
significantly below the peer group median. It was determined by the
compensation committee to make a special grant to the named
executive officers to position each executive around peer group
median levels, and to promote performance and
retention.
On
December 12, 2017, the board ratified the compensation committee
determination that additional equity grants were necessary in order
to reward, motivate and retain the non-employee directors, based in
part on the report of the Hay Group, which reviewed non-employee
director compensation in peer companies, and determined that equity
compensation below median for the peer group, and we granted the
Chairman of the board 60,000 restricted stock units and an option
to purchase 60,000 shares of common stock, and the other serving
non-employee directors, other than Dr. Manning, received 30,000
restricted stock units and an option to purchase 30,000 shares of
common stock, with Dr. Manning receiving 15,000 restricted stock
units and an option to purchase 15, 000 shares of common stock. The
restricted stock units vest as to one-third of the total award on
the first, second and third anniversary of the grant date,
conditioned on continued service as a director through the
applicable vesting dates. All of the options have an exercise price
of $0.85 per share, the closing price of our common stock on the
date of grant, vest as to one-third of the total award on the
first, second and third anniversary of the grant date, expire ten
years from the date of grant and provide for accelerated vesting in
the event of involuntarily termination as a director following a
change in control, with exercise permitted following accelerated
vesting for up to the earlier of one year after termination or the
expiration date of the option.
On June
20, 2017 we granted 595,000 restricted stock units to Dr. Spana and
545,000 restricted stock units to Mr. Wills, which vest as to
50% on each anniversary of the grant date. We also granted 938,000
stock options to Dr. Spana and 859,000 stock options to Mr.
Wills, which vest as to 25% on each anniversary of the grant date.
These options have an exercise price of $0.37, the fair market
value of the common stock on the date of grant, and they expire on
June 20, 2027.
81
Outstanding Equity Awards at 2018 Fiscal Year-End
The
following table summarizes all of the outstanding equity-based
awards granted to our named executive officers as of June 30, 2018,
the end of our fiscal year.
|
|
|
|
Option awards
(1)
|
Stock awards
(2)
|
|||||||
|
Name
|
|
Option
or
stock
award
grant
date
|
Number
of
securities
underlying
unexercised
options
(#)
exercisable
|
Number
of
securities
underlying
unexercised
options
(#)
unexercisable
|
Equity incentive
plan award: number of securities underlying unexercised unearned
options (#)
|
Option
exercise
price
($)
|
Option
expiration
date
|
Number of shares
or units of stock that have not vested
(#)
|
Market value of
shares or units of stock that have not vested
($)
(3)
|
Equity incentive
plan awards: number of unearned shares, unit or other rights that
have not vested (#)
|
Equity incentive
plan awards: market or payout value of unearned shares, units or
other rights that have not vested ($)
|
|
Carl
Spana
|
|
07/01/08
|
25,000
|
-
|
|
1.80
|
07/01/18
|
|
|
|
|
|
|
07/01/09
|
25,000
|
-
|
|
2.80
|
07/01/19
|
|
|
|
|
|
|
|
06/22/11
|
300,000
|
-
|
|
1.00
|
06/22/21
|
|
|
|
|
|
|
|
07/17/12
|
150,000
|
-
|
|
0.72
|
07/17/22
|
|
|
|
|
|
|
|
06/27/13
|
275,000
|
-
|
|
0.62
|
06/27/23
|
|
|
|
|
|
|
|
06/25/14
|
175,000
|
-
|
|
1.02
|
06/25/24
|
|
|
|
|
|
|
|
06/11/15
|
225,000
|
75,000
|
|
1.08
|
06/11/25
|
|
|
|
|
|
|
|
09/07/16
|
199,500
|
232,500
|
|
0.68
|
09/07/26
|
|
|
|
|
|
|
|
06/20/17
|
234,500
|
703,500
|
|
0.37
|
06/20/27
|
|
|
|
|
|
|
|
12/12/17
|
-
|
625,000
|
|
0.85
|
12/12/27
|
|
|
|
|
|
|
|
12/12/17
|
187,500
|
|
437,500
|
0.85
|
12/12/27
|
|
|
|
|
|
|
|
6/26/18
|
-
|
533,000
|
|
1.00
|
6/26/28
|
|
|
|
|
|
|
|
12/08/15
|
|
|
|
|
|
81,250
|
78,813
|
|
|
|
|
|
09/07/16
|
|
|
|
|
|
107,500
|
104,275
|
|
|
|
|
|
06/20/17
|
|
|
|
|
|
297,500
|
288,575
|
|
|
|
|
|
12/12/17
|
|
|
|
|
|
625,000
|
606,250
|
437,500
|
424,375
|
|
|
|
6/26/18
|
|
|
|
|
|
356,000
|
345,320
|
|
|
|
|
Total
Stock Awards
|
|
|
|
1,467,250
|
$
1,423,233
|
437,500
|
$
424,375
|
||||
|
|
|
|
|
|
|
|
|
|
|
|
|
|
Stephen T.
Wills
|
|
07/01/08
|
20,000
|
-
|
|
1.80
|
07/01/18
|
|
|
|
|
|
|
07/01/09
|
20,000
|
-
|
|
2.80
|
07/01/19
|
|
|
|
|
|
|
|
06/22/11
|
250,000
|
-
|
|
1.00
|
06/22/21
|
|
|
|
|
|
|
|
07/17/12
|
135,000
|
-
|
|
0.72
|
07/17/22
|
|
|
|
|
|
|
|
06/27/13
|
250,000
|
-
|
|
0.62
|
06/27/23
|
|
|
|
|
|
|
|
06/25/14
|
150,000
|
-
|
|
1.02
|
06/25/24
|
|
|
|
|
|
|
|
06/11/15
|
202,500
|
67,500
|
|
1.08
|
06/11/25
|
|
|
|
|
|
|
|
09/07/16
|
182,250
|
213,750
|
|
0.68
|
09/07/26
|
|
|
|
|
|
|
|
06/20/17
|
214,750
|
644,250
|
|
0.37
|
06/20/27
|
|
|
|
|
|
|
|
12/12/17
|
-
|
575,000
|
|
0.85
|
12/12/27
|
|
|
|
|
|
|
|
12/12/17
|
135,000
|
|
332,500
|
0.85
|
12/12/27
|
|
|
|
|
|
|
|
6/26/18
|
-
|
454,000
|
|
1.00
|
6/26/28
|
|
|
|
|
|
|
|
12/08/15
|
|
|
|
|
|
75,000
|
72,750
|
|
|
|
|
|
09/07/16
|
|
|
|
|
|
100,000
|
97,000
|
|
|
|
|
|
06/20/17
|
|
|
|
|
|
272,500
|
264,325
|
|
|
|
|
|
12/12/17
|
|
|
|
|
|
575,000
|
557,750
|
332,500
|
322,525
|
|
|
|
6/26/18
|
|
|
|
|
|
303,000
|
293,910
|
|
|
|
|
Total Stock Awards
|
|
|
|
1,325,500
|
$
1,285,735
|
332,500
|
$
322,525
|
||||
82
(1)
Stock option
vesting schedules: all options granted on or before June 10, 2015
have fully vested. Options granted after June 10, 2015 vest over
four years with 1/4 of the shares vesting per year starting on the
first anniversary of the grant date, provided that the named
executive officer remains an employee. See “Termination and
Change-In-Control Arrangements” below, except for
performance-based options granted on December 12, 2017, which vest
according to the terms of the grant described above.
(2)
Time-based stock
award vesting schedule: stock awards consist of restricted stock
units granted December 8, 2015, as to 162,500 shares for Dr. Spana
and 150,000 shares for Mr. Wills, which vest in equal amounts over
a four year period, provided that the named executive officer
remains an employee; restricted stock units granted on September 7,
2016, as to 182,500 shares for Dr. Spana and 168,000 shares for
Mr. Wills, which have fully vested as of September 7, 2018;
restricted stock units granted on June 20, 2017, as to 595,000
shares for Dr. Spana and 545,000 shares for Mr. Wills, which vest
in equal amounts over a two year period, provided that the named
executive officer remains an employee; restricted stock units
granted on December 12, 2017, as to 575,000 shares for Dr. Spana
and 625,000 shares for Mr. Wills, which vest in equal amounts over
a four year period, provided that the named executive officer
remains an employee; and restricted stock units granted on June 26,
2018, as to 356,000 shares for Dr. Spana and 303,000 shares for Mr.
Wills, which vest in equal amounts over a two year period, provided
that the named executive officer remains an employee. Both
time-based and performance-based restricted stock unit awards
contain deferred delivery provisions provision for delivery of the
common stock after the grantee’s separation from service or a
defined changed in control. See “Stock Options and Restricted
Stock Unit Awards” above and “Termination and
Change-In-Control Arrangements” below.
(3)
Calculated by
multiplying the number of restricted stock units by $0.97, the
closing market price of our common stock on June 29, 2018, the last
trading day of our most recently completed fiscal
year.
Termination
and Change-In-Control Arrangements
The
employment agreements, stock option agreements and restricted stock
unit agreements with Dr. Spana and Mr. Wills contain the following
provisions concerning severance compensation and the vesting of
stock options and restricted stock units upon termination of
employment or upon a change in control. The executive’s
entitlement to severance, payment of health benefits and
accelerated vesting of options is contingent on the executive
executing a general release of claims against us.
Termination Without Severance Compensation
. Regardless of
whether there has been a change in control, if we terminate
employment for cause or the executive terminates employment without
good reason (as those terms are defined in the employment agreement
and set forth below), then the executive will receive only his
accrued salary and vacation benefits through the date of
termination. He may also elect to receive medical and dental
benefits pursuant to COBRA for up to two years (Dr. Spana) or 18
months (Mr. Wills), but must remit the cost of coverage to us.
Under the terms of our outstanding options and restricted stock
units, all unvested options and restricted stock units would
terminate immediately, and vested options would be exercisable for
three months after termination.
Severance Compensation After Death or Disability.
In the
event of the executive’s death or disability, we will provide
lump sum severance pay equal to 24 months (for Dr. Spana) or 18
months (for Mr. Wills) of base pay, as well as the opportunity for
COBRA benefits as described above under “Termination Without
Severance Compensation.”
Severance Compensation Without a Change in Control
. If we
terminate or fail to extend the employment agreement without cause,
or the executive terminates employment with good reason, then the
executive will receive as severance pay his salary then in effect,
paid in a lump sum, plus medical and dental benefits at our
expense, for a period of two years (Dr. Spana) or 18 months (Mr.
Wills) after the termination date. In addition, upon such event all
unvested options would immediately vest and be exercisable for two
years after the termination date or, if earlier, the expiration of
the option term, and all unvested restricted stock units would
accelerate and become fully vested.
Severance Compensation After a Change in Control
. If, within
one year after a change in control, we terminate employment or the
executive terminates employment with good reason, then the
executive will receive as severance pay 200% (Dr. Spana) or 150%
(Mr. Wills) of his salary then in effect, paid in a lump sum, plus
medical and dental benefits at our expense, for a period of two
years (Dr. Spana) or 18 months (Mr. Wills) after the termination
date. We would also reimburse the executive for up to $25,000 in
fees and expenses during the six months following termination, for
locating employment. We would also reimburse the executive for any
excise tax he might incur on “excess parachute
payments” (as defined in Section 280G(b) of the Internal
Revenue Code). All unvested options would immediately vest and be
exercisable for two years after the termination date or, if
earlier, the expiration of the option term. All unvested restricted
stock units would vest upon a change in control, without regard to
whether the executive’s employment is
terminated.
83
Option and Restricted Stock Unit Vesting Upon a Change in
Control
. Options and restricted stock units granted under
the 2011 Stock Incentive Plan vest upon a change in control. If any
options granted under the 2005 Stock Plan are to be terminated in
connection with a change in control, those options will vest in
full immediately before the change in control.
Definitions
. Under the employment agreements, a
“change in control,” “cause” and
“good reason” are defined as follows:
A
“change in control” occurs when:
(a)
any person or
entity acquires more than 50% of the voting power of our
outstanding securities;
(b)
the individuals
who, during any twelve-month period, constitute our board of
directors cease to constitute at least a majority of the board of
directors;
(c)
the consummation of
a merger or consolidation; or
(d)
we sell
substantially all our assets.
The
term “cause” means:
(a)
the occurrence of
(i) the executive’s material breach of, or habitual neglect
or failure to perform the material duties which he is required to
perform under, the terms of his employment agreement; (ii) the
executive’s material failure to follow the reasonable
directives or policies established by or at the direction of our
board of directors; or (iii) the executive’s engaging in
conduct that is materially detrimental to our interests such that
we sustain a material loss or injury as a result thereof, provided
that the breach or failure of performance is not cured, to the
extent cure is possible, within ten days of the delivery to the
executive of written notice thereof;
(b)
the willful breach
by the executive of his obligations to us with respect to
confidentiality, invention and non-disclosure, non-competition or
non-solicitation; or
(c)
the conviction of
the executive of, or the entry of a pleading of guilty or nolo
contendere by the executive to, any crime involving moral turpitude
or any felony.
The
term “good reason” means the occurrence of any of the
following, with our failure to cure such circumstances within 30
days of the delivery to us of written notice by the executive of
such circumstances:
(a)
any material
adverse change in the executive’s duties, authority or
responsibilities, which causes the executive’s position with
us to become of significantly less responsibility, or assignment of
duties and responsibilities inconsistent with the executive’s
position;
(b)
a material
reduction in the executive’s salary;
(c)
our failure to
continue in effect any material compensation or benefit plan in
which the executive participates, unless an equitable arrangement
has been made with respect to such plan, or our failure to continue
the executive’s participation therein (or in a substitute or
alternative plan) on a basis not materially less favorable, both in
terms of the amount of benefits provided and the level of the
executive’s participation relative to other
participants;
(d)
our failure to
continue to provide the executive with benefits substantially
similar to those enjoyed by the executive under any of our health
and welfare insurance, retirement and other fringe-benefit plans,
the taking of any action by us which would directly or indirectly
materially reduce any of such benefits, or our failure to provide
the executive with the number of paid vacation days to which he is
entitled; or
(e)
the relocation of
the executive to a location which is a material distance from
Cranbury, New Jersey.
Director Compensation
The
following table sets forth the compensation we paid to all
directors during fiscal 2018, except for Dr. Spana, whose
compensation is set forth above in the Summary Compensation Table
and related disclosure. Dr. Spana did not receive any separate
compensation for his services as a director.
84
|
Name
|
Fees earned or
paid in cash ($)
|
Stock awards ($)
(1) (2)
|
Option
awards
($) (1)
(2)
|
Total
($)
|
|
John K.A.
Prendergast, Ph.D.
|
97,500
|
107,000
|
68,552
|
273,052
|
|
Robert K. deVeer,
Jr.
|
62,500
|
53,500
|
34,275
|
150,275
|
|
J. Stanley
Hull
|
55,000
|
53,500
|
34,275
|
142,775
|
|
Alan W. Dunton,
M.D.
|
62,500
|
53,500
|
34,275
|
150,275
|
|
Angela
Rossetti
|
52,500
|
53,500
|
34,275
|
140,275
|
|
Arlene
Morris
|
52,500
|
53,500
|
34,275
|
140,275
|
|
Anthony Manning,
Ph.D.
|
30,885
|
67,750
|
44,043
|
142,678
|
(1)
The aggregate
number of shares underlying option awards and stock awards
outstanding at June 30, 2018 for each director was:
|
|
Option
awards
|
Stock
awards
|
|
Dr.
Prendergast
|
604,750
|
226,000
|
|
Mr.
deVeer
|
332,500
|
108,000
|
|
Mr.
Hull
|
329,000
|
108,000
|
|
Dr.
Dunton
|
262,000
|
98,000
|
|
Ms.
Rossetti
|
214,500
|
88,000
|
|
Ms.
Morris
|
169,500
|
78,000
|
|
Dr.
Manning
|
97,000
|
97,000
|
(2)
Amounts in these
columns represent the aggregate grant date fair value for stock
awards and option awards. For a description of the assumptions we
used to calculate these amounts, see Note 14 to the consolidated
financial statements included in this Annual Report. Amounts in
this column include options granted on June 26, 2018 for our
current fiscal year ending June 30, 2019.
Non-Employee Directors’ Equity Grants.
Our
non-employee directors receive an annual equity grant at the board
meeting closest to the beginning of each fiscal year, or such other
date as may be determined by the board.
On June
20, 2018, the Chairman of the board received 56,000 restricted
stock units which vest on June 26, 2019, and an option to purchase
56,000 shares of common stock, and each other serving non-employee
director received 28,000 restricted stock units which vest on June
26, 2019, and an option to purchase 28,000 shares of common stock.
All of the options have an exercise price of $1.00 per share, the
closing price of our common stock on the date of grant, vest in
twelve monthly installments beginning on July 31, 2018, expire ten
years from the date of grant and provide for accelerated vesting in
the event of involuntarily termination as a director following a
change in control, with exercise permitted following accelerated
vesting for up to the earlier of one year after termination or the
expiration date of the option.
On
December 12, 2017, the board ratified the compensation committee
determination that additional equity grants were necessary in order
to reward, motivate and retain the non-employee directors, based in
part on the report of the Hay Group, which reviewed non-employee
director compensation in peer companies, and determined that equity
compensation below median for the peer group, and we granted the
Chairman of the board 60,000 restricted stock units and an option
to purchase 60,000 shares of common stock, and the other serving
non-employee directors, other than Dr. Manning, received 30,000
restricted stock units and an option to purchase 30,000 shares of
common stock, with Dr. Manning receiving 15,000 restricted stock
units and an option to purchase 15, 000 shares of common stock. The
restricted stock units vest as to one-third the total award on the
first, second and third anniversary of the grant date, conditioned
on continued service as a director through the applicable vesting
dates. All of the options have an exercise price of $0.85 per
share, the closing price of our common stock on the date of grant,
vest as to one-third of the total award on the first, second and
third anniversary of the grant date, expire ten years from the date
of grant and provide for accelerated vesting in the event of
involuntarily termination as a director following a change in
control, with exercise permitted following accelerated vesting for
up to the earlier of one year after termination or the expiration
date of the option.
85
On June
20, 2017, the Chairman of the board received 108,000 restricted
stock units which vested on June 20, 2018, and an option to
purchase 108,000 shares of common stock, and each other serving
non-employee director received 54,000 restricted stock units which
vested on June 20, 2018, and an option to purchase 54,000 shares of
common stock. All of the options have an exercise price of $0.37
per share, the closing price of our common stock on the date of
grant, vest in twelve monthly installments beginning on July 31,
2017, expire ten years from the date of grant and provide for
accelerated vesting in the event of involuntarily termination as a
director following a change in control, with exercise permitted
following accelerated vesting for up to the earlier of one year
after termination or the expiration date of the
option.
Non-Employee Directors’ Cash Compensation
. Dr.
Prendergast serves as Chairman of the board and for fiscal 2018
received an annual retainer of $87,500, payable quarterly. Other
non-employee directors received an annual base retainer of $40,000,
payable on a quarterly basis. The chairperson of the audit
committee received an additional annual retainer of $12,500, the
chairperson of the compensation committee received an additional
annual retainer of $12,500 and the chairperson of the corporate
governance committee received an additional annual retainer of
$7,500. Members of the foregoing committees, other than the
non-employee Chairman, received an additional retainer of one-half
the retainer payable to the committee chairperson. For the fiscal
year ending June 30, 2019, Dr. Prendergast serves as Chairman of
the board and will received an annual retainer of $90,000, payable
quarterly. Other non-employee directors will receive an annual base
retainer of $45,000, payable on a quarterly basis. The chairperson
of the audit committee will receive an additional annual retainer
of $15,000, the chairperson of the compensation committee will
receive an additional annual retainer of $15,000 and the
chairperson of the corporate governance committee will receive an
additional annual retainer of $10,000. Members of the foregoing
committees, other than the non-employee Chairman, receive an
additional retainer of one-half the retainer payable to the
committee chairperson.
Non-Employee Directors’ Expenses.
Non-employee
directors are reimbursed for expenses incurred in performing their
duties as directors, including attending all meetings of the board
and any committees on which they serve.
Employee Directors.
Employee directors are not separately
compensated for services as directors, but are reimbursed for
expenses incurred in performing their duties as directors,
including attending all meetings of the board and any committees on
which they serve.
Securities Authorized for Issuance Under Equity Compensation
Plans.
The table below provides information on our equity
compensation plans as of June 30, 2018:
|
Equity
Compensation Plan Information
as
of June 30, 2018
|
|||
|
Plan
category
|
Number of
securities to be issued upon exercise of outstanding options,
warrants and rights
|
Weighted-average
exercise price of outstanding options, warrants and
rights
|
Number of
securities remaining available for future issuance under equity
compensation plans (excluding securities reflected in column
(a))
|
|
|
(a)
|
(b)
|
(c)
|
|
Equity compensation
plans approved by security holders
|
22,099,338
(1)
|
$
0.76
(2)
|
7,559,248
|
|
Equity compensation
plans not approved by security holders
|
25,000
(3)
|
$
0.70
|
-
|
|
Total
|
22,124,338
|
|
7,559,248
|
(1)
Includes 12,526,312
options and 9,323,876 restricted stock units granted under our 2011
Stock Incentive Plan and 249,150 options granted under our 2005
Stock Plan. Our 2005 Stock Plan has terminated, but termination
does not affect awards that are currently outstanding under this
plan. The shares subject to outstanding awards under the 2005 Stock
Plan, if forfeited prior to exercise, will become available for
issuance under the 2011 Stock Incentive Plan.
86
(2)
The amount in
column (a) for equity compensation plans approved by security
holders includes 9,323,876 shares reserved for issuance on vesting
of outstanding restricted stock units, granted under our 2011 Stock
Incentive Plan, which vest on various dates through June 26, 2022,
subject to the fulfillment of service, market conditions, or
performance conditions. Because no exercise price is required for
issuance of shares on vesting of the restricted stock units, the
weighted-average exercise price in column (b) does not take the
restricted stock units into account.
(3)
Consists of two
warrants to purchase 12,500 shares at $0.70 per share issued in
connection with a contract for financial advisory
services.
Beneficial Ownership Tables.
The tables below show the
beneficial stock ownership and voting power, as of September 11,
2018, of:
●
each director, each
of the named executive officers, and all current directors and
officers as a group; and
●
all persons who, to
our knowledge, beneficially own more than five percent of the
common stock or Series A preferred stock.
“Beneficial
ownership” here means direct or indirect voting or investment
power over outstanding stock and stock which a person has the right
to acquire now or within 60 days after September 13, 2018. See the
footnotes for more detailed explanations of the holdings. Except as
noted, to our knowledge, the persons named in the tables
beneficially own and have sole voting and investment power over all
shares listed.
The
common stock has one vote per share and the Series A preferred
stock has approximately 15 votes per share of Series A preferred
stock. Voting power is calculated on the basis of the aggregate of
common stock and Series A preferred stock outstanding as of
September 12, 2018, on which date
202,048,804 shares of
common stock and 4,030 shares of Series A preferred stock,
convertible into 61,145 shares of common stock, were
outstanding.
The
address for all members of our management and directors is c/o
Palatin Technologies, Inc., 4B Cedar Brook Drive, Cranbury, NJ
08512. Addresses of other beneficial owners are in the
table.
MANAGEMENT:
|
Class
|
Name of
beneficial owner
|
Amount and
nature of beneficial ownership
|
Percent
of
class
|
Percent of total
voting
power
|
|
Common
|
Carl Spana,
Ph.D.
|
3,934,352
(1)
|
1.9
%
|
*
|
|
Common
|
Stephen T.
Wills
|
3,535,739
(2)
|
1.7
%
|
*
|
|
Common
|
John K.A.
Prendergast, Ph.D.
|
829,683
(3)
|
*
|
*
|
|
Common
|
Robert K. deVeer,
Jr.
|
473,392
(4)
|
*
|
*
|
|
Common
|
J. Stanley
Hull
|
444,332
(5)
|
*
|
*
|
|
Common
|
Alan W. Dunton,
M.D.
|
387,352
(6)
|
*
|
*
|
|
Common
|
Angela
Rossetti
|
322,332
(7)
|
*
|
*
|
|
Common
|
Arlene M.
Morris
|
252,332
(8)
|
*
|
*
|
|
Common
|
Anthony M. Manning,
Ph.D.
|
36,332
(9)
|
*
|
*
|
|
|
|
|
|
|
|
All current
directors and executive officers as a group (nine
persons)
|
10,215,846
(10)
|
4.9
%
|
1.2
%
|
|
*Less
than one percent.
87
(1)
Includes 1,849,000
shares of common stock underlying outstanding options and 1,343,750
shares of common stock underlying restricted stock units, all of
which shares of common stock underlying restricted stock units have
vested but not been delivered under deferred delivery provisions
provision for delivery after the grantee’s separation from
service or a defined changed in control, but does not include
shares of common stock underlying outstanding options or restricted
stock unit awards that have not vested and will not vest within 60
days.
(2)
Includes 1,610,750
shares of common stock underlying outstanding options and 1,200,500
shares of common stock underlying restricted stock units, all of
which shares of common stock underlying restricted stock units have
vested but not been delivered under deferred delivery provisions
provision for delivery after the grantee’s separation from
service or a defined changed in control, but does not include
shares of common stock underlying outstanding options or restricted
stock unit awards that have not vested and will not vest within 60
days.
(3)
Includes 474,750
shares of common stock underlying outstanding options and 100,000
shares of common stock underlying restricted stock units, all of
which shares of common stock underlying restricted stock units have
vested but not been delivered under deferred delivery provisions
provision for delivery after the grantee’s separation from
service or a defined changed in control, but does not include
shares of common stock underlying outstanding options or restricted
stock unit awards that have not vested and will not vest within 60
days.
(4)
Includes 264,916
shares of common stock underlying outstanding options and 50,000
shares of common stock underlying restricted stock units, all of
which shares of common stock underlying restricted stock units have
vested but not been delivered under deferred delivery provisions
provision for delivery after the grantee’s separation from
service or a defined changed in control, but does not include
shares of common stock underlying outstanding options or restricted
stock unit awards that have not vested and will not vest within 60
days.
(5)
Includes 261,332
shares of common stock underlying outstanding options and 50,000
shares of common stock underlying restricted stock units, all of
which shares of common stock underlying restricted stock units have
vested but not been delivered under deferred delivery provisions
provision for delivery after the grantee’s separation from
service or a defined changed in control, but does not include
shares of common stock underlying outstanding options or restricted
stock unit awards that have not vested and will not vest within 60
days.
(6)
Includes 213,332
shares of common stock underlying outstanding options and 40,000
shares of common stock underlying restricted stock units, all of
which shares of common stock underlying restricted stock units have
vested but not been delivered under deferred delivery provisions
provision for delivery after the grantee’s separation from
service or a defined changed in control, but does not include
shares of common stock underlying outstanding options or restricted
stock unit awards that have not vested and will not vest within 60
days.
(7)
Includes 165,832
shares of common stock underlying outstanding options and 30,000
shares of common stock underlying restricted stock units, all of
which shares of common stock underlying restricted stock units have
vested but not been delivered under deferred delivery provisions
provision for delivery after the grantee’s separation from
service or a defined changed in control, but does not include
shares of common stock underlying outstanding options or restricted
stock unit awards that have not vested and will not vest within 60
days.
(8)
Consists of 120,832
shares of common stock underlying outstanding options and 20,000
shares of common stock underlying restricted stock units, all of
which shares of common stock underlying restricted stock units have
vested but not been delivered under deferred delivery provisions
provision for delivery after the grantee’s separation from
service or a defined changed in control, but does not include
shares of common stock underlying outstanding options or restricted
stock unit awards that have not vested and will not vest within 60
days.
88
(9)
Consists of 22,832
shares of common stock underlying outstanding options and 13,500
shares of common stock underlying restricted stock units, all of
which shares of common stock underlying restricted stock units have
vested but not been delivered under deferred delivery provisions
provision for delivery after the grantee’s separation from
service or a defined changed in control, but does not include
shares of common stock underlying outstanding options or restricted
stock unit awards that have not vested and will not vest within 60
days.
(10)
Includes 7,831,326
shares of common stock underlying outstanding options and
restricted stock units.
MORE THAN 5% BENEFICIAL OWNERS:
|
Class
|
Name and address
of beneficial owner
|
Amount and
nature of beneficial ownership (1)
|
Percent of class
Percent of total voting power
|
|
|
|
|
|
|
Series
A
Preferred
|
Steven N.
Ostrovsky
43 Nikki
Ct.
Morganville, NJ
07751
|
500
|
12.4
%*
|
|
Series
A
Preferred
|
Thomas L. Cassidy
IRA Rollover
38 Canaan
Close
New Canaan, CT
06840
|
500
|
12.4
%*
|
|
Series
A
Preferred
|
Jonathan E.
Rothschild
300 Mercer St.,
#28F
New York, NY
10003
|
500
|
12.4
%*
|
|
Series
A
Preferred
|
Arthur J.
Nagle
19 Garden
Avenue
Bronxville, NY
10708
|
250
|
6.2
%*
|
|
Series
A
Preferred
|
Thomas P. and Mary
E. Heiser, JTWROS
10 Ridge
Road
Hopkinton, MA
01748
|
250
|
6.2
%*
|
|
Series
A
Preferred
|
Carl F.
Schwartz
31 West 87th
St.
New York, NY
10016
|
250
|
6.2
%*
|
|
Series
A
Preferred
|
Michael J.
Wrubel
3650 N. 36 Avenue,
#39
Hollywood, FL
33021
|
250
|
6.2
%*
|
|
Series
A
Preferred
|
Myron M.
Teitelbaum, M.D.
175 Burton
Lane
Lawrence, NY
11559
|
250
|
6.2
%*
|
|
Series
A
Preferred
|
Laura Gold
Galleries Ltd. Profit Sharing Trust Park South Gallery at Carnegie
Hall
154 West 57th
Street, Suite 114
New York, NY
10019
|
250
|
6.2
%*
|
|
Series
A
Preferred
|
Laura
Gold
180 W. 58th
Street
New York, NY
10019
|
250
|
6.2
%*
|
|
Series
A
Preferred
|
Nadji T.
Richmond
20 E. Wedgewood
Glen
The Woodlands, TX
77381
|
230
|
5.7
%*
|
|
|
|
|
|
*Less
than one percent.
(1)
Unless otherwise indicated by footnote, all share amounts represent
outstanding shares of the class indicated, and all beneficial
owners listed have, to our knowledge, sole voting and dispositive
power over the shares listed.
89
The
board of directors has determined that all of the directors except
for Dr. Spana (our Chief Executive Officer and President) are
independent directors, as defined in the listing standards of the
NYSE American.
As a
condition of employment, we require all employees to disclose in
writing actual or potential conflicts of interest, including
related party transactions. Our code of corporate conduct and
ethics, which applies to employees, officers and directors,
requires that the audit committee review and approve related party
transactions. Since July 1, 2015, there have been no
transactions or proposed transactions in which we were or are to be
a participant, in which any related person had or will have a
direct or indirect material interest.
KPMG
LLP (“KPMG”), served as our independent registered
public accounting firm for fiscal 2017 and fiscal
2016.
Audit Fees
. For fiscal 2018, fees for professional services
rendered for the audit of our annual consolidated financial
statements, the audit of internal control over financial reporting
as of June 30, 2018, review of our consolidated financial
statements in our Forms 10-Q, services provided in connection with
regulatory filings and comfort letters were $522,000. For fiscal
2017, fees for professional services rendered for the audit of our
annual consolidated financial statements, review of our
consolidated financial statements in our Forms 10-Q and services
provided in connection with regulatory fillings was
$382,600.
Audit-Related Fees
. For fiscal 2018 and fiscal 2017, KPMG
did not perform or bill us for any audit-related
services.
Tax Fees
. For fiscal 2018, KPMG billed us a total of
$380,354 for professional services rendered for tax compliance and
consulting services. For fiscal 2017, KPMG billed us a total of
$208,651 for professional services rendered for tax compliance and
IRC Section 382 services.
All Other Fees
. KPMG did not perform or bill us for any
services other than those described above for fiscal 2018 and
fiscal 2017.
Policy on Audit Committee Pre-Approval of Audit and Permissible
Non-Audit Services of Independent Auditors
. Consistent with
SEC policies regarding auditor independence, the audit committee
has responsibility for appointing, setting compensation for and
overseeing the work of the independent registered public accounting
firm. In recognition of this responsibility, the audit committee
has established a policy to pre-approve all audit and permissible
non-audit services provided by the independent registered public
accounting firm.
The
audit committee pre-approves fees for each category of service. The
fees are budgeted and the audit committee requires the independent
registered public accounting firm and management to report actual
fees versus the budget periodically throughout the year by category
of service. During the year, circumstances may arise when it may
become necessary to engage the independent registered public
accounting firm for additional services not contemplated in the
original pre-approval. In those instances, the audit committee
requires specific pre-approval before engaging the independent
registered public accounting firm.
The
audit committee may delegate pre-approval authority to one or more
of its members. The member to whom such authority is delegated must
report, for informational purposes only, any pre-approval decisions
to the audit committee at its next scheduled meeting.
90
(a) Documents filed as part of the
report:
1.
Financial
statements: The following consolidated financial statements are
filed as a part of this report under Item 8 – Financial
Statements and Supplementary Data:
—
Report of Independent Registered Public Accounting
Firm
—
Consolidated Balance Sheets
—
Consolidated Statements of Operations
—
Consolidated Statements of Comprehensive Income (Loss)
—
Consolidated Statements of Stockholders’ Equity
(Deficiency)
—
Consolidated Statements of Cash Flows
—
Notes to Consolidated Financial Statements
2.
Financial statement
schedules: None.
3.
List of
Exhibits
The
following exhibits are incorporated by reference or filed as part
of this report:
|
Exhibit Number
|
Description
|
Filed Herewith
|
Form
|
Filing Date
|
SEC File No.
|
|
Restated Certificate of Incorporation of Palatin Technologies,
Inc., as amended.
|
|
10-K
|
September 27, 2013
|
001-15543
|
|
|
Bylaws of Palatin Technologies, Inc.
|
|
10-Q
|
February 8, 2008
|
001-15543
|
|
|
Form of Series A 2012 Warrant.
|
|
8-K
|
July 6, 2012
|
001-15543
|
|
|
Form of Series B 2012 Warrant.
|
|
8-K
|
July 6, 2012
|
001-15543
|
|
|
Form of
Series C 2014 Common Stock Purchase Warrant.
|
|
8-K
|
December
30,
2014
|
001-15543
|
|
|
Form of
Series D 2014 Common Stock Purchase Warrant.
|
|
8-K
|
December
30,
2014
|
001-15543
|
|
|
Form of
Series E 2015 Common Stock Purchase Warrant.
|
|
8-K
|
July 7,
2015
|
001-15543
|
|
|
Form of
Series F 2015 Common Stock Purchase Warrant.
|
|
8-K
|
July 7,
2015
|
001-15543
|
|
|
Form of
Series G 2015 Common Stock Purchase Warrant.
|
|
8-K
|
July 7,
2015
|
001-15543
|
|
|
Form of
Series H 2016 Common Stock Purchase Warrant.
|
|
8-K
|
August
2, 2016
|
001-15543
|
|
|
Form of
Series I 2016 Common Stock Purchase Warrant.
|
|
8-K
|
August
2, 2016
|
001-15543
|
|
|
Form of
Series J 2016 Common Stock Purchase Warrant.
|
|
8-K
|
December
1, 2016
|
001-15543
|
|
|
Form of
warrant issued to PSL Business Development Consulting and SARL
Avisius in connection with a contract for financial advisory
services.
|
|
10-Q
|
February
10, 2017
|
001-15543
|
|
|
10.1
†
|
1996 Stock Option Plan, as amended.
|
|
10-K
|
September 28, 2009
|
001-15543
|
91
|
10.2
†
|
Form of Option Certificate (Incentive Option) Under the 2005 Stock
Plan.
|
|
8-K
|
September 21, 2011
|
001-15543
|
|
10.3
†
|
Form of Incentive Stock Option Under the 2005 Stock
Plan.
|
|
8-K
|
September 21, 2011
|
001-15543
|
|
10.4
†
|
Form of Opinion Certificate (Non-Qualified Opinion) Under the 2005
Stock Plan.
|
|
8-K
|
September 21, 2011
|
001-15543
|
|
10.5
†
|
Form of Non-Qualified Stock Option Agreement Under the 2005 Stock
Plan.
|
|
8-K
|
September 21, 2011
|
001-15543
|
|
10.6
†
|
2007 Change in Control Severance Plan.
|
|
10-Q
|
February 8, 2008
|
001-15543
|
|
10.7
†
|
2005 Stock Plan, as amended.
|
|
10-Q
|
May 15, 2009
|
001-15543
|
|
10.8
†
|
Form of Executive Officer Option Certificate.
|
|
10-Q
|
May 14, 2008
|
001-15543
|
|
10.9
†
|
Form of Amended Restricted Stock Unit Agreement.
|
|
10-Q
|
May 14, 2008
|
001-15543
|
|
10.10
†
|
Form of Amended Option Certificate (Incentive Option) Under the
2005 Stock Plan.
|
|
10-Q
|
May 14, 2008
|
001-15543
|
|
10.11
†
|
Employment Agreement, effective as of July 1, 2016, between Carl
Spana and Palatin Technologies, Inc.
|
|
8-K
|
June 13, 2016
|
001-15543
|
|
10.12
†
|
Employment Agreement, effective as of July 1, 2016, between Stephen
T. Wills and Palatin Technologies, Inc.
|
|
8-K
|
June 13, 2016
|
001-15543
|
|
Underwriting Agreement, datedFebruary 24, 2011, by and between Roth
Capital Partners, LLC and Palatin Technologies, Inc.
|
|
8-K
|
February 24, 2011
|
001-15543
|
|
|
10.14
†
|
2011 Stock Incentive Plan, as amended.
|
|
8-K
|
June 27, 2018
|
001-15543
|
|
10.15
†
|
Form of Restricted Share Unit Agreement Under the 2011 Stock
Incentive Plan.
|
|
10-Q
|
May 13, 2011
|
001-15543
|
|
10.16
†
|
Form of Nonqualified Stock Option Agreement under the 2011 Stock
Incentive Plan.
|
|
10-Q
|
May 13, 2011
|
001-15543
|
|
10.17
†
|
Form of Incentive Stock Option Agreement under the 2011 Stock
Incentive Plan.
|
|
10-Q
|
May 13, 2011
|
001-15543
|
|
10.18
†
|
Form of Restricted Share Unit Agreement under the 2011 Stock
Incentive Plan.
|
|
8-K
|
December 11, 2015
|
001-15543
|
|
10.19
†
|
Form of Performance-Based Restricted Share Unit Agreement under the
2011 Stock Incentive Plan.
|
|
8-K
|
December 11, 2015
|
001-15543
|
|
10.20
†
|
Form of Restricted Share Unit Agreement for Non-Employee Directors
under the 2011 Stock Incentive Plan.
|
|
8-K
|
December 11, 2015
|
001-15543
|
|
10.21
†
|
Amended form of Restricted Share Unit Agreement under the 2011
Stock Incentive Plan.
|
|
10-Q
|
February 12, 2016
|
001-15543
|
92
|
10.22
†
|
Amended form of Performance-Based Restricted Share Unit Agreement
under the 2011 Stock Incentive Plan.
|
|
10-Q
|
February 12, 2016
|
001-15543
|
|
10.23
†
|
Amended form of Restricted Share Unit Agreement for Non-Employee
Directors under the 2011 Stock Incentive Plan.
|
|
10-Q
|
February 12, 2016
|
001-15543
|
|
Form of Indenture.
|
|
S-3
|
August 3, 2015
|
333-206047
|
|
|
Letter Agreement, dated October 7, 2011, between Biotechnology
Value Fund, L.P. and Palatin Technologies, Inc.
|
|
8-K
|
October 7, 2011
|
001-15543
|
|
|
Securities
Purchase Agreement, dated December 23, 2014, by and between Palatin
Technologies, Inc. and the investors named therein.
|
|
8-K
|
December
30,
2014
|
001-15543
|
|
|
Registration
Rights Agreement, dated December 23, 2014, by and between Palatin
Technologies, Inc. and the investors named therein.
|
|
8-K
|
December
30,
2014
|
001-15543
|
|
|
Placement
Engagement Letter, dated December 22, 2014, by and between Palatin
Technologies, Inc. and Piper Jaffray & Co.
|
|
8-K
|
December
30,
2014
|
001-15543
|
|
|
Amended and Restated Venture Loan and Security Agreement, dated
July 2, 2015, by and between Palatin Technologies, Inc. and Horizon
Technology Finance Corporation, Fortress Credit Co LLC, Horizon
Credit II LLC and Fortress Credit Opportunities V CLO
Limited.
|
|
8-K
|
July 7,
2015
|
001-15543
|
|
|
Securities
Purchase Agreement, dated July 2, 2015, by and between Palatin
Technologies, Inc. and the investors named therein.
|
|
8-K
|
July 7,
2015
|
001-15543
|
|
|
Registration
Rights Agreement, dated July 2, 2015, by and between Palatin
Technologies, Inc. and the investors named therein.
|
|
8-K
|
July 7,
2015
|
001-15543
|
|
|
Underwriting
Agreement, dated August 1, 2016, by and between Palatin
Technologies, Inc. and Canaccord Genuity Inc., on behalf of itself
and as representative of the underwriters named
therein.
|
|
8-K
|
August
2, 2016
|
001-15543
|
|
|
10.33
††
|
License, Co-Development and Commercialization Agreement, dated
August 29, 2014, by and between Chemical Works of Gedeon Richter
Plc. and Palatin Technologies, Inc.
|
|
10-K/A
|
October 9, 2014
|
001-15543
|
|
Termination Agreement, dated September 16, 2015, by and
between
Chemical Works of
Gedeon Richter Plc. and Palatin Technologies,
Inc.
|
|
10-K
|
September 18, 2015
|
001-15543
|
93
|
10.35
††
|
Commercial Supply Agreement dated June 20, 2016, by and between
Catalent Belgium S.A. and Palatin Technologies, Inc.
|
|
10-K
|
September 19, 2016
|
001-15543
|
|
10.36
††
|
Manufacturing Preparation and Services Agreement dated June 20,
2016, by and between Catalent Belgium S.A. and Palatin
Technologies, Inc.
|
|
10-K
|
September 19, 2016
|
001-15543
|
|
Underwriting Agreement, dated December 1, 2016, by and between
Palatin Technologies, Inc. and Canaccord Genuity Inc., on behalf of
itself and as representative of the underwriters named
therein.
|
|
8-K
|
December 1, 2016
|
001-15543
|
|
|
10.38
††
|
License Agreement, dated January 8, 2017, by and between AMAG
Pharmaceuticals, Inc. and Palatin Technologies, Inc.
|
|
10-Q
|
February 10, 2017
|
001-15543
|
|
Equity Distribution Agreement, dated April 20, 2018, by and between
Palatin Technologies, Inc. and Canaccord Genuity LLC
|
|
8-K
|
April 20, 2018
|
001-15543
|
|
|
10.40
††
|
License Agreement, dated September 6, 2017, by and between Shanghai
Fosun Pharmaceutical Industrial Development Co., Ltd. and Palatin
Technologies, Inc.
|
|
10-Q
|
November 13, 2017
|
001-15543
|
|
Subsidiaries of Palatin Technologies, Inc.
|
X
|
|
|
|
|
|
Consent of KPMG LLP.
|
X
|
|
|
|
|
|
Certification of Chief Executive Officer.
|
X
|
|
|
|
|
|
Certification of Chief Financial Officer.
|
X
|
|
|
|
|
|
Certification of principal executive officer pursuant to U.S.C.
Section 1350, as adopted pursuant to Section 906 of the
Sarbanes-Oxley Act of 2002.
|
X
|
|
|
|
|
|
Certification of principal financial officer pursuant to U.S.C.
Section 1350, as adopted pursuant to Section 906 of the
Sarbanes-Oxley Act of 2002.
|
X
|
|
|
|
|
|
101.INS
|
XBRL Instance Document.
|
X
|
|
|
|
|
101.SCH
|
XBRL Taxonomy Extension Schema Document.
|
X
|
|
|
|
|
101.CAL
|
XBRL Taxonomy Extension Calculation Linkbase Document.
|
X
|
|
|
|
|
101.LAB
|
XBRL Taxonomy Extension Label Linkbase Document.
|
X
|
|
|
|
|
101.PRE
|
XBRL Taxonomy Extension Presentation Linkbase
Document.
|
X
|
|
|
|
|
101.DEF
|
XBRL Taxonomy Extension Definition Linkbase Document.
|
X
|
|
|
|
† Management contract or compensatory plan or
arrangement.
††
Confidential treatment granted as to certain portions, which
portions are omitted and filed separately with the
SEC.
None.
94
SIGNATURES
Pursuant
to the requirements of Section 13 or 15(d) of the Securities
Exchange Act of 1934, the registrant has duly caused this report to
be signed on its behalf by the undersigned, thereunto duly
authorized.
|
|
PALATIN
TECHNOLOGIES, INC.
|
|
|
|
|
|
|
|
|
|
By:
|
/s/
Carl
Spana
|
|
|
|
|
Carl Spana,
Ph.D.
|
|
|
|
|
President and Chief
Executive Officer
(principal
executive officer)
|
|
Date:
September 13, 2018
Pursuant
to the requirements of the Securities Exchange Act of 1934, this
report has been signed below by the following persons on behalf of
the registrant and in the capacities and on the dates
indicated.
|
Signature
|
|
Title
|
|
Date
|
|
|
|
|
|
|
|
/s/
Carl Spana
|
|
President,
Chief Executive Officer and Director
|
|
September
13, 2018
|
|
Carl
Spana
|
|
(principal
executive officer)
|
|
|
|
|
|
|
|
|
|
/s/
Stephen T. Wills
|
|
Executive
Vice President, Chief Financial Officer
|
|
September
13, 2018
|
|
Stephen
T. Wills
|
|
and
Chief Operating Officer (principal financial and accounting
officer)
|
|
|
|
|
|
|
|
|
|
/s/
John K. A. Prendergast
|
|
Chairman
and Director
|
|
September
13, 2018
|
|
John K.
A. Prendergast
|
|
|
|
|
|
|
|
|
|
|
|
/s/
Robert K. deVeer, Jr,
|
|
Director
|
|
September
13, 2018
|
|
Robert
K. deVeer, Jr.
|
|
|
|
|
|
|
|
|
|
|
|
/s/ J.
Stanley Hull
|
|
Director
|
|
September
13, 2018
|
|
J.
Stanley Hull
|
|
|
|
|
|
|
|
|
|
|
|
/s/
Alan W. Dunton
|
|
Director
|
|
September
13, 2018
|
|
Alan W.
Dunton
|
|
|
|
|
|
|
|
|
|
|
|
/s/
Angela Rossetti
|
|
Director
|
|
September
13, 2018
|
|
Angela
Rossetti
|
|
|
|
|
|
|
|
|
|
|
|
/s/
Arlene M. Morris
|
|
Director
|
|
September
13, 2018
|
|
Arlene
M. Morris
|
|
|
|
|
|
|
|
|
|
|
|
/s/
Anthony M. Manning
|
|
Director
|
|
September
13, 2018
|
|
Anthony
M. Manning
|
|
|
|
|
95
TABLE OF CONTENTS
Part IItem 1. BusinessItem 1A. Risk FactorsItem 1B. Unresolved Staff CommentsItem 2. PropertiesItem 3. Legal ProceedingsItem 4. Mine Safety DisclosuresPart IIItem 5. Market For Registrant S Common Equity, Related Stockholder Matters and Issuer Purchases Of Equity SecuritiesItem 6. Selected Financial DataItem 7. Management S Discussion and Analysis Of Financial Condition and Results Of OperationsItem 7A. Quantitative and Qualitative Disclosures About Market RiskItem 8. Financial Statements and Supplementary DataItem 9. Changes in and Disagreements with Accountants on Accounting and Financial DisclosureItem 9A. Controls and ProceduresItem 9B. Other InformationPart IIIItem 10. Directors, Executive Officers and Corporate GovernanceItem 11. Executive CompensationItem 12. Security Ownership Of Certain Beneficial Owners and Management and Related Stockholder MattersItem 13. Certain Relationships and Related Transactions, and Director IndependenceItem 14. Principal Accountant Fees and ServicesPart IVItem 15. Exhibits, Financial Statement SchedulesItem 16. Form 10-k Summary