PALATIN TECHNOLOGIES INC
10-Ks and 10-Qs
|
|
|
|
|
|
|
|
|
|
|
|
|
|
|
|
|
|
|
|
|
|
|
|
|
|
|
|
|
|
|
|
|
|
|
|
|
|
|
|
|
|
|
|
|
|
|
|
|
|
|
|
|
|
|
|
|
|
|
|
|
|
|
|
|
UNITED STATES
SECURITIES AND EXCHANGE COMMISSION
Washington, DC 20549
FORM 10-Q
(Mark
One)
|
[X]
|
QUARTERLY
REPORT PURSUANT TO SECTION 13 OR 15(d) OF THE SECURITIES EXCHANGE
ACT OF 1934
|
For the
quarterly period ended December 31, 2017
or
|
[ ]
|
TRANSITION
REPORT PURSUANT TO SECTION 13 OR 15(d) OF THE SECURITIES EXCHANGE
ACT OF 1934
|
For the
transition period from ___________ to __________
Commission
file number: 001-15543
________________________
PALATIN TECHNOLOGIES, INC.
(Exact
name of registrant as specified in its charter)
|
Delaware
|
|
95-4078884
|
|
(State
or other jurisdiction of
incorporation
or organization)
|
|
(I.R.S.
Employer Identification No.)
|
|
|
|
|
|
4B Cedar Brook Drive
Cranbury, New Jersey
|
|
08512
|
|
(Address
of principal executive offices)
|
|
(Zip
Code)
|
(609) 495-2200
(Registrant's
telephone number, including area code)
Indicate
by check mark whether the registrant (1) has filed all reports
required to be filed by Section 13 or 15(d) of the Securities
Exchange Act of 1934 during the preceding 12 months (or for such
shorter period that the registrant was required to file such
reports), and (2) has been subject to such filing requirements for
the past 90 days.
Yes
☒ No ☐
Indicate
by check mark whether the registrant has submitted electronically
and posted on its corporate Web site, if any, every Interactive
Data File required to be submitted and posted pursuant to Rule 405
of Regulation S-T (§232.405 of this chapter) during the
preceding 12 months (or for such shorter period that the registrant
was required to submit and post such
files). Yes ☒ No
☐
Indicate
by check mark whether the registrant is a large accelerated filer,
an accelerated filer, a non-accelerated filer, a smaller reporting
company, or an emerging growth company. See the definitions of
“large accelerated filer,” “accelerated
filer,” “smaller reporting company,” and
“emerging growth company” in Rule 12b-2 of the Exchange
Act.
|
Large
accelerated
filer
☐
|
Accelerated
filer
☐
|
|
Non-accelerated
filer
☐
(Do not check if a
smaller reporting company)
|
Smaller
reporting company ☒
|
|
|
Emerging
growth company ☐
|
If an
emerging growth company, indicate by check mark if the registrant
has elected not to use the extended transition period for complying
with any new or revised financial accounting standards provided
pursuant to Section 13(a) for the Exchange Act.
☐
Indicate
by check mark whether the registrant is a shell company (as defined
in Rule 12b-2 of the Exchange Act). Yes ☐ No
☒
As of
February 9, 2018, 195,373,239 shares of the registrant’s
common stock, par value $0.01 per share, were
outstanding.
Table of Contents
|
|
Page
|
|
PART I – FINANCIAL INFORMATION
|
|
|
Item 1. Financial Statements (Unaudited)
|
|
|
Consolidated
Balance Sheets as of December 31, 2017 and June 30,
2017
|
3
|
|
Consolidated
Statements of Operations for the Three and Six Months Ended
December 31, 2017 and 2016
|
4
|
|
Consolidated
Statements of Comprehensive Income (Loss) for the Three and Six
Months Ended December 31, 2017 and 2016
|
5
|
|
Consolidated
Statements of Cash Flows for the Three and Six Months Ended
December 31, 2017 and 2016
|
6
|
|
Notes
to Consolidated Financial Statements
|
7
|
|
Item 2. Management’s Discussion and Analysis of Financial
Condition and Results of Operations
|
19
|
|
Item 3. Quantitative and Qualitative Disclosures About Market
Risk
|
22
|
|
Item 4. Controls and Procedures
|
22
|
|
PART
II – OTHER INFORMATION
|
|
|
|
|
|
Item 1. Legal Proceedings
|
23
|
|
Item 1A. Risk Factors
|
23
|
|
Item 2. Unregistered Sales of Equity Securities and Use of
Proceeds
|
23
|
|
Item 3. Defaults Upon Senior Securities
|
23
|
|
Item 4. Mine Safety Disclosures
|
23
|
|
Item 5. Other Information
|
23
|
|
Item 6. Exhibits
|
23
|
|
Signatures
|
24
|
SPECIAL NOTE REGARDING FORWARD-LOOKING STATEMENTS
In this
Quarterly Report on Form 10-Q, references to “we”,
“our”, “us” or “Palatin” means
Palatin Technologies, Inc. and its subsidiary.
Statements
in this Quarterly Report on Form 10-Q, as well as oral statements
that may be made by us or by our officers, directors, or employees
acting on our behalf, that are not historical facts constitute
“forward-looking statements”, which are made pursuant
to the safe harbor provisions of Section 21E of the Securities
Exchange Act of 1934, as amended (the “Exchange Act”).
The forward-looking statements in this Quarterly Report on Form
10-Q do not constitute guarantees of future performance. Investors
are cautioned that statements that are not strictly historical
statements contained in this Quarterly Report on Form 10-Q,
including, without limitation, the following are forward looking
statements:
●
estimates of our
expenses, future revenue and capital requirements;
●
our ability to
obtain additional financing on terms acceptable to us, or at
all;
●
our ability to
advance product candidates into, and successfully complete,
clinical trials;
●
the initiation,
timing, progress and results of future preclinical studies and
clinical trials, and our research and development
programs;
●
the timing or
likelihood of regulatory filings and approvals;
●
our expectations
regarding completion of required clinical trials and studies and
validation of methods and controls used to manufacture
bremelanotide for the treatment of premenopausal women with
hypoactive sexual desire disorder (“HSDD”), which is a
type of female sexual dysfunction (“FSD”);
●
our expectation
regarding the timing of our regulatory submissions for approval of
bremelanotide for HSDD in the United States and in certain other
jurisdictions outside the United States;
●
our expectation
regarding performance of our exclusive licensees of bremelanotide,
including;
o
AMAG
Pharmaceuticals, Inc. (“AMAG”) for North
America,
o
Shanghai Fosun
Pharmaceutical Industrial Development Co. Ltd.
(“Fosun”), a subsidiary of Shanghai Fosun
Pharmaceutical (Group) Co., Ltd. for the territories of mainland
China, Taiwan, Hong Kong S.A.R. and Macau S.A.R., and
o
Kwangdong
Pharmaceutical Co., Ltd. (“Kwangdong”) for the Republic
of Korea;
●
the potential for
commercialization of bremelanotide for HSDD in North America by
AMAG and other product candidates, if approved, by us;
●
our expectations
regarding the potential market size and market acceptance for
bremelanotide for HSDD and our other product candidates, if
approved for commercial use;
●
our ability to
compete with other products and technologies similar to our product
candidates;
●
the ability of our
third-party collaborators to timely carry out their duties under
their agreements with us;
●
the ability of our
contract manufacturers to perform their manufacturing activities
for us in compliance with applicable regulations;
●
our ability to
recognize the potential value of our licensing arrangements with
third parties;
●
the potential to
achieve revenues from the sale of our product
candidates;
●
our ability to
obtain adequate reimbursement from Medicare, Medicaid, private
insurers and other healthcare payers;
●
our ability to
maintain product liability insurance at a reasonable cost or in
sufficient amounts, if at all;
●
the retention of
key management, employees and third-party contractors;
●
the scope of
protection we are able to establish and maintain for intellectual
property rights covering our product candidates and
technology;
●
our compliance with
federal and state laws and regulations;
●
the timing and
costs associated with obtaining regulatory approval for our product
candidates;
●
the impact of
fluctuations in foreign exchange rates;
●
the impact of
legislative or regulatory healthcare reforms in the United
States;
●
our ability to
adapt to changes in global economic conditions; and
●
our ability to
remain listed on the NYSE American stock exchange.
1
Such
forward-looking statements involve risks, uncertainties and other
factors that could cause our actual results to be materially
different from historical results or from any results expressed or
implied by such forward-looking statements. Our future operating
results are subject to risks and uncertainties and are dependent
upon many factors, including, without limitation, the risks
identified in this report, in our Annual Report on Form 10-K for
the year ended June 30, 2017, and in our other Securities and
Exchange Commission (“SEC”) filings.
We
expect to incur losses in the future as a result of spending on our
planned development programs and results may fluctuate
significantly from quarter to quarter.
Palatin
Technologies® is a registered trademark of Palatin
Technologies, Inc.
2
|
PALATIN TECHNOLOGIES, INC
.
|
|||
|
and Subsidiary
|
|||
|
|
|||
|
(unaudited)
|
|
|
December
31,
2017
|
June
30,
2017
|
|
ASSETS
|
|
|
|
Current
assets:
|
|
|
|
Cash and cash
equivalents
|
$
34,958,048
|
$
40,200,324
|
|
Available-for-sale
investments
|
-
|
249,837
|
|
Accounts
receivable
|
-
|
15,116,822
|
|
Prepaid expenses
and other current assets
|
1,288,504
|
1,011,221
|
|
Total current
assets
|
36,246,552
|
56,578,204
|
|
|
|
|
|
Property and
equipment, net
|
178,767
|
198,153
|
|
Other
assets
|
556,916
|
56,916
|
|
Total
assets
|
$
36,982,235
|
$
56,833,273
|
|
|
|
|
|
LIABILITIES
AND STOCKHOLDERS’ EQUITY (DEFICIENCY)
|
|
|
|
Current
liabilities:
|
|
|
|
Accounts
payable
|
$
703,767
|
$
1,551,367
|
|
Accrued
expenses
|
5,527,776
|
10,521,098
|
|
Notes payable, net
of discount and debt issuance costs
|
7,889,152
|
7,824,935
|
|
Capital lease
obligations
|
-
|
14,324
|
|
Deferred
revenue
|
9,548,228
|
35,050,572
|
|
Total current
liabilities
|
23,668,923
|
54,962,296
|
|
|
|
|
|
Notes payable, net
of discount and debt issuance costs
|
2,321,124
|
6,281,660
|
|
Deferred
revenue
|
500,000
|
-
|
|
Other non-current
liabilities
|
866,135
|
753,961
|
|
Total
liabilities
|
27,356,182
|
61,997,917
|
|
|
|
|
|
Stockholders’
equity (deficiency):
|
|
|
|
Preferred stock of
$0.01 par value – authorized 10,000,000 shares:
|
|
|
|
Series A
Convertible: issued and outstanding 4,030 shares as of December 31,
2017 and June 30, 2017
|
40
|
40
|
|
Common stock of
$0.01 par value – authorized 300,000,000 shares:
|
|
|
|
issued and
outstanding 195,373,239 shares as of December 31, 2017 and
160,515,361 shares as of June 30, 2017, respectively
|
1,953,732
|
1,605,153
|
|
Additional paid-in
capital
|
350,787,078
|
349,974,538
|
|
Accumulated other
comprehensive loss
|
-
|
(590
)
|
|
Accumulated
deficit
|
(343,114,797
)
|
(356,743,785
)
|
|
Total
stockholders’ equity (deficiency)
|
9,626,053
|
(5,164,644
)
|
|
Total liabilities
and stockholders’ equity (deficiency)
|
$
36,982,235
|
$
56,833,273
|
The
accompanying notes are an integral part of these consolidated
financial statements.
3
|
PALATIN TECHNOLOGIES, INC.
|
||||
|
and Subsidiary
|
||||
|
Consolidated Statements of Operations
|
||||
|
(unaudited)
|
||||
|
|
|
|
|
|
|
|
Three Months Ended
December 31,
|
Six Months Ended
December 31,
|
||
|
|
2017
|
2016
|
2017
|
2016
|
|
|
|
|
|
|
|
REVENUES:
|
|
|
|
|
|
License
and contract revenue
|
$
10,612,153
|
$
-
|
$
37,553,661
|
$
-
|
|
|
|
|
|
|
|
OPERATING
EXPENSES:
|
|
|
|
|
|
Research
and development
|
6,045,884
|
8,134,575
|
20,208,981
|
19,360,659
|
|
General
and administrative
|
1,625,189
|
1,306,300
|
3,169,764
|
2,515,646
|
|
Total
operating expenses
|
7,671,073
|
9,440,875
|
23,378,745
|
21,876,305
|
|
|
|
|
|
|
|
Income
(Loss) from operations
|
2,941,080
|
(9,440,875
)
|
14,174,916
|
(21,876,305
)
|
|
|
|
|
|
|
|
OTHER
INCOME (EXPENSE):
|
|
|
|
|
|
Interest
income
|
81,356
|
5,991
|
133,082
|
12,636
|
|
Interest
expense
|
(391,363
)
|
(594,535
)
|
(848,040
)
|
(1,218,520
)
|
|
Total
other expense, net
|
(310,007
)
|
(588,544
)
|
(714,958
)
|
(1,205,884
)
|
|
|
|
|
|
|
|
Income
(Loss) before income taxes
|
2,631,073
|
(10,029,419
)
|
13,459,958
|
(23,082,189
)
|
|
Income
tax benefit, net
|
399,120
|
-
|
173,865
|
-
|
|
|
|
|
|
|
|
NET
INCOME (LOSS)
|
$
3,030,193
|
$
(10,029,419
)
|
$
13,633,823
|
$
(23,082,189
)
|
|
|
|
|
|
|
|
Basic
net income (loss) per common share
|
$
0.02
|
$
(0.06
)
|
$
0.07
|
$
(0.13
)
|
|
|
|
|
|
|
|
Diluted
net income (loss) per common share
|
$
0.01
|
$
(0.06
)
|
$
0.07
|
$
(0.13
)
|
|
|
|
|
|
|
|
Weighted
average number of common shares outstanding used in computing basic
net income (loss) per common share
|
197,238,056
|
177,798,511
|
197,175,316
|
171,823,390
|
|
|
|
|
|
|
|
Weighted
average number of common shares outstanding used in computing
diluted net income (loss) per common share
|
202,711,616
|
177,798,511
|
200,430,824
|
171,823,390
|
The
accompanying notes are an integral part of these consolidated
financial statements.
4
|
PALATIN
TECHNOLOGIES, INC.
|
||||
|
and
Subsidiary
|
||||
|
Consolidated
Statements of Comprehensive Income (Loss)
|
||||
|
(unaudited)
|
||||
|
|
|
|
|
|
|
|
|
|
|
|
|
|
Three Months
Ended
December
31,
|
Six Months
Ended
December
31,
|
||
|
|
2017
|
2016
|
2017
|
2016
|
|
|
|
|
|
|
|
Net income
(loss)
|
$
3,030,193
|
$
(10,029,419
)
|
$
13,633,823
|
$
(23,082,189
)
|
|
|
|
|
|
|
|
Other comprehensive
income (loss):
|
|
|
|
|
|
Unrealized gain
(loss) on available-for-sale investments
|
153
|
515
|
590
|
(62
)
|
|
|
|
|
|
|
|
Total comprehensive
income (loss)
|
$
3,030,346
|
$
(10,028,904
)
|
$
13,634,413
|
$
(23,082,251
)
|
The
accompanying notes are an integral part of these consolidated
financial statements.
5
|
PALATIN
TECHNOLOGIES, INC.
|
||
|
and
Subsidiary
|
||
|
Consolidated
Statements of Cash Flows
|
||
|
(unaudited)
|
||
|
|
|
|
|
|
Six Months
Ended
December
31,
|
|
|
|
2017
|
2016
|
|
CASH FLOWS FROM
OPERATING ACTIVITIES:
|
|
|
|
Net
income (loss)
|
$
13,633,823
|
$
(23,082,189
)
|
|
Adjustments
to reconcile net income (loss) to net cash
|
|
|
|
used
in operating activities:
|
|
|
|
Depreciation and
amortization
|
28,886
|
15,261
|
|
Non-cash interest
expense
|
104,108
|
160,711
|
|
Stock-based
compensation
|
1,041,900
|
853,241
|
|
Deferred income tax
benefit
|
(500,000
)
|
-
|
|
Changes in
operating assets and liabilities:
|
|
|
|
Accounts
receivable
|
15,116,822
|
-
|
|
Prepaid expenses
and other assets
|
(277,283
)
|
481,877
|
|
Accounts
payable
|
(847,600
)
|
3,992,124
|
|
Accrued
expenses
|
(4,968,942
)
|
(320,908
)
|
|
Deferred
revenue
|
(25,002,344
)
|
-
|
|
Other non-current
liabilities
|
112,174
|
168,358
|
|
Net cash used in
operating activities
|
(1,558,456
)
|
(17,731,525
)
|
|
|
|
|
|
CASH FLOWS FROM
INVESTING ACTIVITIES:
|
|
|
|
Proceeds from
matured investments
|
250,000
|
-
|
|
Purchases of
property and equipment
|
(9,500
)
|
-
|
|
Net cash provided
by investing activities
|
240,500
|
-
|
|
|
|
|
|
CASH FLOWS FROM
FINANCING ACTIVITIES:
|
|
|
|
Payments on capital
lease obligations
|
(14,324
)
|
(13,534
)
|
|
Payment of
withholding taxes related to restricted
|
|
|
|
stock
units
|
(24,380
)
|
-
|
|
Payment on notes
payable obligations
|
(4,000,000
)
|
(2,000,000
)
|
|
Proceeds from the
exercise of warrants
|
114,384
|
-
|
|
Proceeds from the
sale of common stock and
|
|
|
|
warrants, net of
costs
|
-
|
23,856,972
|
|
Net cash (used in)
provided by financing activities
|
(3,924,320
)
|
21,843,438
|
|
|
|
|
|
NET (DECREASE)
INCREASE IN CASH AND CASH EQUIVALENTS
|
(5,242,276
)
|
4,111,913
|
|
|
|
|
|
CASH AND CASH
EQUIVALENTS, beginning of period
|
40,200,324
|
8,002,668
|
|
|
|
|
|
CASH AND CASH
EQUIVALENTS, end of period
|
$
34,958,048
|
$
12,114,581
|
|
|
|
|
|
SUPPLEMENTAL CASH
FLOW INFORMATION:
|
|
|
|
Cash paid for
interest
|
$
632,185
|
$
891,717
|
|
Unrealized gain
(loss) on available-for-sale investments
|
590
|
(62
)
|
|
Non-cash equity
financing costs in accrued expenses
|
-
|
50,861
|
The
accompanying notes are an integral part of these consolidated
financial statements.
6
PALATIN TECHNOLOGIES, INC.
and Subsidiary
Notes to Consolidated Financial Statements
(unaudited)
(1)
ORGANIZATION:
Nature of Business
– Palatin Technologies, Inc.
(“Palatin” or the “Company”) is a
biopharmaceutical company developing targeted, receptor-specific
peptide therapeutics for the treatment of diseases with significant
unmet medical need and commercial potential. Palatin’s
programs are based on molecules that modulate the activity of the
melanocortin and natriuretic peptide receptor systems. The
melanocortin system is involved in a large and diverse number of
physiologic functions, and therapeutic agents modulating this
system may have the potential to treat a variety of conditions and
diseases, including sexual dysfunction and inflammation-related
diseases. The natriuretic peptide receptor system has numerous
cardiovascular functions, and therapeutic agents modulating this
system may be useful in treatment of heart failure and other
cardiovascular diseases.
The
Company’s primary product in development is bremelanotide for
the treatment of hypoactive sexual desire disorder
(“HSDD”), which is a type of female sexual dysfunction
(“FSD”). The Company also has drug candidates or
development programs for cardiovascular diseases, including heart
failure and fibrosis, and inflammatory diseases, including
inflammatory bowel disease and ocular indications.
Key
elements of the Company’s business strategy include using its
technology and expertise to develop and commercialize therapeutic
products; entering into alliances and partnerships with
pharmaceutical companies to facilitate the development,
manufacture, marketing, sale and distribution of product candidates
that the Company is developing; and partially funding its product
candidate development programs with the cash flow generated from
its relationships with third parties.
Business Risk and Liquidity –
Since inception, the
Company has incurred negative cash flows from operations, and has
expended, and expects to continue to expend, substantial funds to
complete its planned product development efforts. As shown in the
accompanying consolidated financial statements, the Company had an
accumulated deficit as of December 31, 2017 of $343,614,797 and had
net income for the three and six months ended December 31, 2017 of
$2,530,193 and $13,133,823, respectively. The Company anticipates
incurring losses in the future as a result of spending on its
development programs and will require substantial additional
financing to continue to fund its planned developmental activities.
To achieve sustained profitability, if ever, the Company, alone or
with others, must successfully develop and commercialize its
technologies and proposed products, conduct successful preclinical
studies and clinical trials, obtain required regulatory approvals
and successfully manufacture and market such technologies and
proposed products. The time required to reach sustained
profitability is highly uncertain, and the Company may never be
able to achieve profitability on a sustained basis, if at
all.
On
November 21, 2017, the Company entered into a license agreement
with Kwangdong for exclusive rights to develop and commercialize
bremelanotide in the Republic of Korea. (“License Agreement
with Kwangdong”) (Note 7).
As of
December 31, 2017, the Company’s cash and cash equivalents
were $34,958,048 and current liabilities were $14,120,695, net of
deferred revenue of $9,548,228. The Company intends to utilize
existing capital resources for general corporate purposes and
working capital, including the preparation of and filing a New Drug
Application (“NDA”) on bremelanotide for HSDD with the
U.S. Food and Drug Administration (“FDA”), and
preclinical and clinical development of the Company’s other
product candidates and programs, including natriuretic peptide
receptor and melanocortin receptor programs.
Management
believes that its existing capital resources will be sufficient to
fund its planned operations through at least one year after the
date that these financial statements are issued. The Company will
need additional funding to complete required clinical trials for
its other product candidates and, assuming those clinical trials
are successful, as to which there can be no assurance, to complete
submission of required applications to the FDA. If the Company is
unable to obtain approval or otherwise advance in the FDA approval
process, the Company’s ability to sustain its operations
would be materially adversely affected.
The
Company may seek the additional capital necessary to fund its
operations through public or private equity offerings,
collaboration agreements, debt financings or licensing
arrangements. Additional capital that is required by the Company
may not be available on reasonable terms, or at all.
Concentrations –
Concentrations in the Company’s
assets and operations subject it to certain related risks.
Financial instruments that subject the Company to concentrations of
credit risk primarily consist of cash and cash equivalents,
accounts receivable and investments. The Company’s cash and
cash equivalents are primarily invested in one money market account
sponsored by a large financial institution. For the three and six
months ended December 31, 2017, the Company reported $10,612,153
and $32,553,661, respectively, in license and contract revenue
related to a license agreement with AMAG for bremelanotide for
North America (“License Agreement with AMAG”) (Note 5).
In addition, for the six months ended December 31, 2017, the
Company reported $5,000,000 in license revenue related to a license
agreement with Fosun for bremelanotide for China and certain other
Asian territories (“License Agreement with Fosun”)
(Note 6). The Company did not generate any revenue for the three
and six months ended December 31, 2016.
7
PALATIN TECHNOLOGIES, INC.
and Subsidiary
Notes to Consolidated Financial Statements
(unaudited)
(2)
BASIS
OF PRESENTATION:
The
accompanying unaudited consolidated financial statements have been
prepared in accordance with accounting principles generally
accepted in the United States of America (“U.S. GAAP”)
for interim financial information and with the instructions to Form
10-Q. Accordingly, they do not include all of the information and
footnote disclosures required to be presented for complete
financial statements. In the opinion of management, these
consolidated financial statements contain all adjustments
(consisting of normal recurring adjustments) considered necessary
for fair presentation. The results of operations for the three and
six months ended December 31, 2017 may not necessarily be
indicative of the results of operations expected for the full
year.
The
accompanying consolidated financial statements should be read in
conjunction with the audited consolidated financial statements and
notes thereto included in the Company’s Annual Report on Form
10-K for the year ended June 30, 2017, filed with the SEC, which
includes consolidated financial statements as of June 30, 2017 and
2016 and for each of the fiscal years in the three-year period
ended June 30, 2017.
(3)
SUMMARY
OF SIGNIFICANT ACCOUNTING POLICIES:
Principles of Consolidation
– The consolidated
financial statements include the accounts of Palatin and its
wholly-owned inactive subsidiary. All intercompany accounts and
transactions have been eliminated in consolidation.
Use of Estimates
– The preparation of consolidated
financial statements in conformity with U.S. GAAP requires
management to make estimates and assumptions that affect the
reported amount of assets and liabilities and disclosure of
contingent assets and liabilities at the date of the consolidated
financial statements and the reported amounts of revenues and
expenses during the reporting period. Actual results could differ
from those estimates.
Cash and Cash Equivalents
– Cash and cash equivalents
include cash on hand, cash in banks and all highly liquid
investments with a purchased maturity of less than three months.
Cash equivalents consist of $34,769,696 and $40,019,336 in a money
market account as of December 31, 2017 and June 30, 2017,
respectively.
Investments
– The Company determines the appropriate
classification of its investments in debt and equity securities at
the time of purchase and reevaluates such determinations at each
balance sheet date. Debt securities are classified as
held-to-maturity when the Company has the intent and ability to
hold the securities to maturity. Debt securities for which the
Company does not have the intent or ability to hold to maturity are
classified as available-for-sale. Held-to-maturity securities are
recorded as either short-term or long-term on the balance sheet,
based on the contractual maturity date and are stated at amortized
cost. Marketable securities that are bought and held principally
for the purpose of selling them in the near term are classified as
trading securities and are reported at fair value, with unrealized
gains and losses recognized in earnings. Debt and marketable equity
securities not classified as held-to-maturity or as trading are
classified as available-for-sale and are carried at fair market
value, with the unrealized gains and losses, net of tax, included
in the determination of other comprehensive income
(loss).
The
fair value of substantially all securities is determined by quoted
market prices. The estimated fair value of securities for which
there are no quoted market prices is based on similar types of
securities that are traded in the market.
Fair Value of Financial Instruments
– The
Company’s financial instruments consist primarily of cash
equivalents, accounts receivable, accounts payable and notes
payable. Management believes that the carrying values of cash
equivalents, accounts receivable, available-for-sale investments
and accounts payable are representative of their respective fair
values based on the short-term nature of these instruments.
Management believes that the carrying amount of its notes payable
approximates fair value based on the terms of the
notes.
Credit Risk
– Financial instruments which potentially
subject the Company to concentrations of credit risk consist
principally of cash and cash equivalents. Total cash and cash
equivalent balances have exceeded balances insured by the Federal
Depository Insurance Company.
Property and Equipment
– Property and equipment
consists of office and laboratory equipment, office furniture and
leasehold improvements and includes assets acquired under capital
leases. Property and equipment are recorded at cost. Depreciation
is recognized using the straight-line method over the estimated
useful lives of the related assets, generally five years for
laboratory and computer equipment, seven years for office furniture
and equipment and the lesser of the term of the lease or the useful
life for leasehold improvements. Amortization of assets acquired
under capital leases is included in depreciation expense.
Maintenance and repairs are expensed as incurred while expenditures
that extend the useful life of an asset are capitalized.
Accumulated depreciation and amortization was $2,310,875 and
$2,281,989 as of December 31, 2017 and June 30, 2017,
respectively.
8
PALATIN TECHNOLOGIES, INC.
and Subsidiary
Notes to Consolidated Financial Statements
(unaudited)
Impairment of Long-Lived Assets
– The Company reviews
its long-lived assets for impairment whenever events or changes in
circumstances indicate that the carrying amount of the assets may
not be fully recoverable. To determine recoverability of a
long-lived asset, management evaluates whether the estimated future
undiscounted net cash flows from the asset are less than its
carrying amount. If impairment is indicated, the long-lived asset
would be written down to fair value. Fair value is determined by an
evaluation of available price information at which assets could be
bought or sold, including quoted market prices, if available, or
the present value of the estimated future cash flows based on
reasonable and supportable assumptions.
Revenue Recognition
– The Company has generated
revenue solely through license and collaboration agreements. The
Company recognizes revenue in accordance with Financial Accounting
Standards Board (“FASB”) Accounting Standards
Codification (“ASC”) Topic 605-25,
Revenue Recognition for Arrangements with
Multiple Elements
, which addresses the determination of
whether an arrangement involving multiple deliverables contains
more than one unit of accounting. A delivered item within an
arrangement is considered a separate unit of accounting only if
both of the following criteria are met:
●
the delivered item
has value to the customer on a stand-alone basis; and
●
if the arrangement
includes a general right of return relative to the delivered item,
delivery or performance of the undelivered item is considered
probable and substantially in control of the vendor.
Under
FASB ASC Topic 605-25, if both of the criteria above are not met,
then separate accounting for the individual deliverables is not
appropriate.
The
Company has determined that it is appropriate to recognize the
consideration received under its License Agreement with AMAG as
revenue using the input-based proportional method during the period
of the Palatin Development Obligation as defined in the License
Agreement with AMAG. Refer to Note 5 for additional information on
this topic.
Under
its License Agreement with Fosun (Note 6), the Company received
consideration in the form of an upfront license fee payment and
determined that it was appropriate to recognize such consideration
as revenue in the first quarter of 2018, which was the quarter in
which the license was granted, since the license has stand-alone
value and the upfront payment received by the Company is
non-refundable.
Under
its License Agreement with Kwangdong (Note 7), the Company received
consideration in the form of an upfront license fee payment and has
currently determined that it is appropriate to record such
consideration as non-current deferred revenue because the upfront
payment received by the Company is subject to certain refund
provisions.
Revenue
resulting from the achievement of development milestones is
recorded in accordance with the accounting guidance for the
milestone method of revenue recognition.
Amounts
received prior to satisfying the revenue recognition criteria are
recorded as deferred revenue on the Company’s consolidated
balance sheet. Amounts expected to be recognized as revenue in the
next 12 months following the balance sheet date are classified as
current liabilities.
Research and Development Costs
– The costs of research
and development activities are charged to expense as incurred,
including the cost of equipment for which there is no alternative
future use.
Accrued Expenses –
Third parties perform a significant
portion of the Company’s development activities. The Company
reviews the activities performed under all contracts each quarter
and accrue expenses and the amount of any reimbursement to be
received from collaborators based upon the estimated amount of work
completed. Estimating the value or stage of completion of certain
services requires judgment based on available information. If the
Company does not identify services performed but not billed by the
service-provider, or if the Company underestimates or overestimates
the value of services performed as of a given date, reported
expenses will be understated or overstated.
Stock-Based Compensation –
The Company charges to
expense the fair value of stock options and other equity awards
granted. The Company determines the value of stock options
utilizing the Black-Scholes option pricing model. Compensation
costs for share-based awards with pro-rata vesting are determined
using the quoted market price of the Company’s common stock
on the date of grant and allocated to periods on a straight-line
basis, while awards containing a market condition and performance
conditions are valued using multifactor Monte Carlo
simulations.
9
PALATIN TECHNOLOGIES, INC.
and Subsidiary
Notes to Consolidated Financial Statements
(unaudited)
Income Taxes
– The Company and its subsidiary file
consolidated federal and separate-company state income tax returns.
Income taxes are accounted for under the asset and liability
method. Deferred tax assets and liabilities are recognized for the
future tax consequences attributable to differences between the
financial statement carrying amounts of assets and liabilities and
their respective tax basis and operating loss and tax credit
carryforwards. Deferred tax assets and liabilities are measured
using enacted tax rates expected to apply to taxable income in the
years in which those temporary differences or operating loss and
tax credit carryforwards are expected to be recovered or settled.
The effect on deferred tax assets and liabilities of a change in
tax rates is recognized in the period that includes the enactment
date. The Company has recorded a valuation allowance against its
deferred tax assets based on the history of losses
incurred.
Pursuant
to the License Agreement with Fosun (Note 6) and the License
Agreement with Kwangdong (Note 7), $500,000 and $82,500,
respectively, was withheld in accordance with tax withholding
requirements in China and the Republic of Korea, respectively, and
will be recorded as an expense during the fiscal year ending June
30, 2018. For the three and six months ended December 31, 2017, the
Company incurred $100,880 and $326,135, respectively, in income tax
expense and the remaining balance of $256,365 was included in
prepaid expenses and other current assets at December 31, 2017. Any
potential credit to be received by the Company on its United States
tax returns is currently offset by the Company’s valuation
allowance.
On
December 22, 2017, the U.S. government enacted wide-ranging tax
legislation, the Tax Cuts and Jobs Act (the "2017 Tax Act"). The
2017 Tax Act significantly revises U.S. tax law by, among other
provisions, (a) lowering the applicable U.S. federal statutory
corporate income tax rate from 35% to 21%, (b) eliminating or
reducing certain income tax deductions, such as deductions for
interest expense, executive compensation expenses and certain
employee expenses, and (c) repealing the federal alternative
minimum tax ("AMT") and providing for the refund of existing AMT
credits.
As a
result of the 2017 tax Act, during the quarter ended December 31,
2017, the Company recorded a tax benefit of $500,000 related to the
release of a valuation allowance against an AMT credit; accordingly
$500,000 is included in Other long-term assets at December 31,
2017.
In addition, as a
result of the enactment of the new corporate income tax rate, the
Company remeasured certain deferred tax assets and liabilities
based on the rates at which they are expected to reverse and with
the exception of the AMT credit, the Company continues to maintain
a full valuation allowance against its net deferred tax
assets.
Net Income (Loss) per Common Share
– Basic and diluted
earnings per common share (“EPS”) are calculated in
accordance with the provisions of FASB ASC Topic 260,
“
Earnings per
Share
,” which includes guidance pertaining to the
warrants issued in connection with the July 3, 2012, December 23,
2014, and July 2, 2015 private placement offerings and the August
4, 2016 underwritten offering, that were exercisable for nominal
consideration and, therefore, to the extent not yet exercised are
considered in the computation of basic and diluted net loss per
common share. As of December 31, 2017, all warrants exercisable for
nominal value have been converted into common stock.
The
following table is a reconciliation of net income (loss) and the
shares used in calculating basic and diluted net income (loss) per
common share for the three and six months ended December 30, 2017
and 2016:
10
PALATIN TECHNOLOGIES, INC.
and Subsidiary
Notes to Consolidated Financial Statements
(unaudited)
|
|
Three Months Ended December 31,
|
Six Months Ended December 31,
|
||
|
|
2017
|
2016
|
2017
|
2016
|
|
|
|
|
|
|
|
Net
income (loss)
|
$
3,030,193
|
$
(10,029,419
)
|
$
13,633,823
|
$
(23,082,189
)
|
|
|
|
|
|
|
|
Denominator:
|
|
|
|
|
|
Weighted
average common shares outstanding - Basic
|
197,238,056
|
177,798,511
|
197,175,316
|
171,823,390
|
|
|
|
|
|
|
|
Effect
of dilutive shares:
|
|
|
|
|
|
Common
stock equivalents arising from stock options,
|
|
|
|
|
|
warrants
and conversion of preferred stock
|
3,525,013
|
-
|
1,792,803
|
-
|
|
Restricted
stock units
|
1,948,547
|
-
|
1,462,705
|
-
|
|
Weighted
average common shares outstanding - Diluted
|
202,711,616
|
177,798,511
|
200,430,824
|
171,823,390
|
|
|
|
|
|
|
|
Net
income (loss) per common share:
|
|
|
|
|
|
Basic
|
$
0.02
|
$
(0.06
)
|
$
0.07
|
$
(0.13
)
|
|
Diluted
|
$
0.01
|
$
(0.06
)
|
$
0.07
|
$
(0.13
)
|
For the
three and six months ended December 31, 2017 and 2016, common
shares issuable upon conversion of Series A Convertible Preferred
Stock, the exercise of outstanding options and warrants (excluding
the Series A 2012, Series B 2012, Series C 2014, Series E 2015 and
Series I 2016 warrants issued in connection with the July 3, 2012,
December 23, 2014, and July 2, 2015 private placement offerings and
the August 4, 2016 underwritten offering as such warrants, to the
extent not yet exercised, are already included in the weighted
average number of common shares outstanding used in computing basic
net income (loss) per common share since they are exercisable for
nominal consideration), and the vesting of restricted stock units
amounted to an aggregate of 46,966,803 and 57,174,473 shares,
respectively, and are excluded from the weighted average number of
common shares outstanding used in computing basic net income (loss)
per common share. For the three and six months ended December 31,
2017, an additional 5,473,560 and 3,255,508 of common shares,
respectively, have been included in the computation of diluted EPS
using the treasury stock and if-converted methods. However, for the
three and six months ended December 31, 2016, no additional common
shares were added in the computation of diluted EPS because to do
so would have been anti-dilutive.
(4)
NEW
AND RECENTLY ADOPTED ACCOUNTING PRONOUNCEMENTS:
In May
2017, the FASB issued ASU No. 2017-09,
Compensation-Stock Compensation (Topic 718):
Scope of Modification Accounting
, which clarifies when to
account for a change to the terms or conditions of a share-based
payment award as a modification. Under the new guidance,
modification accounting is required only if the fair value, the
vesting conditions, or the classification of the award (as equity
or liability) changes as a result of the change in terms or
conditions. It is effective prospectively for the annual period
ending June 30, 2019 and interim periods within that annual period.
Early adoption is permitted. The Company is currently evaluating
the effect that ASU No. 2017-09 will have on its consolidated
financial statements and related disclosures.
In June
2016, the FASB issued ASU No. 2016-13,
Financial Instruments Credit Losses:
Measurement of Credit Losses on Financial Instruments,
which
requires measurement and recognition of expected credit losses for
financial assets held at the reporting date based on historical
experience, current conditions, and reasonable and supportable
forecasts. This is different from the current guidance as this will
require immediate recognition of estimated credit losses expected
to occur over the remaining life of many financial assets. The new
guidance will be effective for the Company on July 1, 2020. Early
adoption will be available on July 1, 2019. The Company is
currently evaluating the effect that ASU No. 2016-13 will have on
its consolidated financial statements and related
disclosures.
In
March 2016, the FASB issued ASU No. 2016-09,
Compensation – Improvements to Employee
Share-Based Payment Accounting
, which amends the current
guidance related to stock compensation. The updated guidance
changes how companies account for certain aspects of share-based
payment awards to employees, including the accounting for income
taxes, forfeitures, and statutory tax withholding requirements, as
well as classification in the statement of cash flows.
Under this guidance, on a prospective basis,
companies will no longer be able to record excess tax benefits and
certain tax deficiencies as additional paid-in capital. Instead,
companies will record all excess tax benefits and tax deficiencies
as income tax expense or benefit in the income statement. In
addition, the guidance eliminates the requirement that excess tax
benefits be realized before companies can recognize them. The ASU
requires a cumulative-effect adjustment for previously unrecognized
excess tax benefits in opening retained earnings in the period of
adoption. Effective July 1, 2017, the Company adopted this updated
guidance and elected to recognize forfeitures when they occur using
a modified retrospective approach. The adoption of ASU No. 2016-09
did not have a material impact on the Company’s consolidated
financial statements.
11
PALATIN TECHNOLOGIES, INC.
and Subsidiary
Notes to Consolidated Financial Statements
(unaudited)
In
February 2016, the FASB issued ASU No. 2016-02,
Leases
, related to the recognition of
lease assets and lease liabilities. The new guidance requires
lessees to recognize almost all leases on their balance sheet as a
right-of-use asset and a lease liability, other than leases that
meet the definition of a short term lease, and requires
expanded disclosures about leasing arrangements. The recognition,
measurement, and presentation of expenses and cash flows arising
from a lease have not significantly changed from the current
guidance. Lessor accounting is similar to the current guidance, but
updated to align with certain changes to the lessee model and the
new revenue recognition standard. The new guidance is effective for
the Company on July 1, 2019, with early adoption permitted. The
Company is evaluating the impact that ASU No. 2016-02 will have on
its consolidated financial statements and related
disclosures.
In
January 2016, the FASB issued ASU No. 2016-01,
Financial Instruments: Recognition and
Measurement of Financial Assets and Financial Liabilities
.
The new guidance relates to the recognition and measurement of
financial assets and liabilities. The new guidance makes targeted
improvements to U.S. GAAP impacting equity investments (other than
those accounted for under the equity method or consolidated),
financial liabilities accounted for under the fair value election,
and presentation and disclosure requirements for financial
instruments, among other changes. The new guidance is effective for
the Company on July 1, 2018, with early adoption prohibited other
than for certain provisions. The Company is evaluating the impact
that ASU No. 2016-01 will have on its consolidated financial
statements and related disclosures.
In November 2015, the FASB issued ASU No. 2015-17,
Income Taxes:
Balance Sheet Classification of Deferred Taxes,
which simplifies the balance sheet classification
of deferred taxes. The new guidance requires that deferred tax
liabilities and assets be classified as noncurrent in a classified
statement of financial position. The current requirement that
deferred tax liabilities and assets of a tax-paying component of an
entity be offset and presented as a single amount is not affected
by the new guidance. Effective July 1, 2017, the Company adopted
this updated guidance, which did not have a material impact on the
Company’s financial position or results of operations because
its net deferred tax assets were fully offset by a valuation
allowance based on the history of losses
incurred.
In May 2014, the FASB issued ASU No. 2014-09,
Revenue from Contracts with
Customers
, which requires an
entity to recognize the amount of revenue to which it expects to be
entitled for the transfer of promised goods or services to
customers. The ASU will replace most existing revenue recognition
guidance in U.S. GAAP when it becomes effective. In July 2015, the
FASB voted to defer the effective date of the new standard until
fiscal years beginning after December 15, 2017 with early
application permitted for fiscal years beginning after December 15,
2016. With the deferral, the new standard is effective for the
Company on July 1, 2018.
In addition, in April 2016 the FASB
issued ASU No. 2016-10,
Identifying Performance Obligations and
Licensing
, which addresses various issues associated with
identifying performance obligations, licensing of intellectual
property, royalty considerations, and other matters. ASU No.
2016-10 is effective in connection with ASU No. 2014-09.
The two permitted transition methods
under ASU 2014-09 are the full retrospective method, in which case
the new standard would be applied to each prior period presented
and the cumulative effect of applying the standard would be
recognized as of the earliest period reported, or the modified
retrospective method, in which case the cumulative effect of
applying the new standard would be recognized as of the date of
initial application. The Company is currently evaluating the impact
that the implementation of this standard will have on the
Company’s consolidated financial statements, including
performing an assessment of the impact of the new standard on its
collaboration arrangements with third parties.
(5)
AGREEMENT
WITH AMAG:
On
January 8, 2017, the Company entered into the License Agreement
with AMAG. Under the terms of the License Agreement with AMAG, the
Company granted to AMAG (i) an exclusive license in all countries
of North America (the “Territory”), with the right to
grant sub-licenses, to research, develop and commercialize products
containing bremelanotide (each a “Product,” and
collectively, “Products”), (ii) a non-exclusive license
in the Territory, with the right to grant sub-licenses, to
manufacture Products, and (iii) a non-exclusive license in all
countries outside the Territory, with the right to grant
sub-licenses, to research, develop and manufacture (but not
commercialize) the Products.
Following
the satisfaction of certain conditions to closing, the License
Agreement with AMAG became effective on February 2, 2017. On that
date, AMAG paid the Company $60,000,000 as a one-time initial
payment. Pursuant to the terms of and subject to the conditions in
the License Agreement with AMAG, AMAG is required to reimburse the
Company up to an aggregate amount of $25,000,000 for reasonable,
documented, direct out-of-pocket expenses incurred by the Company
following February 2, 2017, in connection with the development and
regulatory activities necessary to file an NDA for bremelanotide
for HSDD in the United States related to Palatin’s
development obligations.
12
PALATIN TECHNOLOGIES, INC.
and Subsidiary
Notes to Consolidated Financial Statements
(unaudited)
The
Company has determined there is no stand-alone value for the
license, and that the license and the reimbursable direct
out-of-pocket expenses, pursuant to the terms of the License
Agreement with AMAG, represent a combined unit of accounting which
totals $85,000,000. The Company is recognizing revenue of the
combined unit of accounting over the arrangement using the
input-based proportional method as the Company completes its
development obligations. For the three and six months ended
December 31, 2017, the Company recognized $10,612,153 and
$32,553,661, respectively, as license and contract revenue related
to this transaction. As of December 31, 2017 and June 30, 2017,
there was $9,548,228 and $35,050,572, respectively, of current
deferred revenue on the consolidated balance sheet related to this
transaction.
In
addition, pursuant to the terms of and subject to the conditions in
the License Agreement with AMAG, the Company is eligible to receive
from AMAG: (i) up to $80,000,000 in specified regulatory
payments upon achievement of certain regulatory milestones, and
(ii) up to $300,000,000 in sales milestone payments based on
achievement of annual net sales amounts for all Products in the
Territory.
AMAG is
also obligated to pay the Company tiered royalties on annual net
sales of Products, on a product-by-product basis, in the Territory
ranging from the high single-digits to the low double-digits. The
royalties will expire on a product-by-product and
country-by-country basis until the latest to occur of (i) the
earliest date on which there are no valid claims of the
Company’s patent rights covering such Product in such
country, (ii) the expiration of the regulatory exclusivity period
for such Product in such country and (iii) ten years following the
first commercial sale of such Product in such country. Such
royalties are subject to reductions in the event that:
(a) AMAG must license additional third party intellectual
property in order to develop, manufacture or commercialize a
Product, or (b) generic competition occurs with respect to a
Product in a given country, subject to an aggregate cap on such
deductions of royalties otherwise payable to the Company. After the
expiration of the applicable royalties for any Product in a given
country, the license for such Product in such country will become a
fully paid-up, royalty-free, perpetual and irrevocable
license.
The
Company engaged Greenhill & Co. LLC (“Greenhill”)
as the Company’s sole financial advisor in connection with a
potential transaction with respect to bremelanotide. Under the
engagement agreement with Greenhill, the Company was obligated to
pay Greenhill a fee equal to 2% of all proceeds and consideration
paid to the Company by AMAG in connection with the License
Agreement with AMAG, subject to a minimum fee of $2,500,000. The
minimum fee of $2,500,000, less credit of $50,000 for an advisory
fee previously paid by the Company, was paid to Greenhill upon the
closing of the licensing transaction. This amount will be credited
toward amounts that become due to Greenhill in the future, provided
that the aggregate fee payable to Greenhill will not be less than
2% of all proceeds and consideration paid to the Company by AMAG in
connection with the License Agreement with AMAG. The Company will
pay Greenhill an aggregate total of 2% of all proceeds and
consideration paid to the Company by AMAG in connection with the
License Agreement with AMAG, including future milestone and royalty
payments, after crediting the $2,500,000 that was paid to Greenhill
upon entering into the License Agreement with AMAG. The Company
also reimbursed Greenhill $7,263 for certain expenses incurred in
connection with its advisory services.
Pursuant
to the License Agreement with AMAG, the Company has assigned to
AMAG the Company’s manufacturing and supply agreements with
Catalent Belgium S.A. to perform fill, finish and packaging of
bremelanotide.
(6)
AGREEMENT
WITH FOSUN:
On
September 6, 2017, the Company entered into the License Agreement
with Fosun for exclusive rights to commercialize bremelanotide in
the territories of mainland China, Taiwan, Hong Kong S.A.R. and
Macau S.A.R.
Under the terms of the agreement, the Company received
$4,500,000 in October 2017, which consisted of an upfront payment
of $5,000,000 less $500,000 which was withheld in accordance with
tax withholding requirements in China and will be recorded as an
expense during the fiscal year ending June 30, 2018. For the three
and six months ended December 31, 2017, the Company incurred
$54,712 and $279,967, respectively, in income tax expense utilizing
an estimated effective annual income tax rate applied to income for
the three and six months ended December 31, 2017 and the remaining
balance of $220,033 was included in prepaid expenses and other
current assets at December 31, 2017. The Company will receive a
$7,500,000 milestone payment when regulatory approval in China is
obtained, provided that a commercial supply agreement for
bremelanotide has been entered into. Palatin has the potential to
receive up to $92,500,000 in additional sales related milestone
payments and high single-digit to low double-digit royalties on net
sales in the licensed territory. All development, regulatory,
sales, marketing, and commercial activities and associated costs in
the licensed territory will be the sole responsibility of
Fosun.
(7)
AGREEMENT
WITH KWANGDONG:
On
November 21, 2017, the Company entered into the License Agreement
with Kwangdong for exclusive rights to commercialize bremelanotide
in the Republic of Korea.
13
PALATIN TECHNOLOGIES, INC.
and Subsidiary
Notes to Consolidated Financial Statements
(unaudited)
Under
the terms of the agreement, the Company received $417,500 in
December 2017, consisting of an upfront payment of $500,000, less
$82,500, which was withheld in accordance with tax withholding
requirements in Korea and will be recorded as an expense during the
fiscal year ending June 30, 2018. Based upon certain refund
provisions, the upfront payment has been recorded as non-current
deferred revenue at December 31, 2017. For the three and six months
ended December 31, 2017, the Company incurred $46,168 in income tax
expense utilizing an estimated effective annual income tax rate
applied to income for the three and six months ended December 31,
2017 and the remaining balance of $36,332 was included in prepaid
expenses and other current assets at December 31, 2017. The Company
will receive a $3,000,000 milestone payment based on the first
commercial sale in Korea. Palatin has the potential to receive up
to $37,500,000 in additional sales related milestone payments and
mid-single-digit to low double-digit royalties on net sales in the
licensed territory. All development, regulatory, sales, marketing,
and commercial activities and associated costs in the licensed
territory will be the sole responsibility of
Kwangdong.
(8)
PREPAID EXPENSES AND OTHER CURRENT
ASSETS:
Prepaid
expenses and other current assets consist of the
following:
|
|
December
31,
2017
|
June
30,
2017
|
|
Clinical
costs
|
$
753,614
|
$
657,069
|
|
Insurance
premiums
|
53,886
|
182,966
|
|
Foreign withholding
tax (Notes 6 & 7)
|
256,365
|
-
|
|
Other
|
224,639
|
171,186
|
|
|
$
1,288,504
|
$
1,011,221
|
(9)
INVESTMENTS:
The
following summarizes the carrying value of the Company’s
available-for-sale investments, which consist of corporate debt
securities:
|
|
December
31,
2017
|
June
30,
2017
|
|
Cost
|
$
-
|
$
262,023
|
|
Amortization of
premium
|
-
|
(11,596
)
|
|
Gross unrealized
loss
|
-
|
(590
)
|
|
Fair
value
|
$
-
|
$
249,837
|
(10)
FAIR
VALUE MEASUREMENTS:
The
fair value of cash equivalents and investments is classified using
a hierarchy prioritized based on inputs. Level 1 inputs are quoted
prices (unadjusted) in active markets for identical assets or
liabilities. Level 2 inputs are quoted prices for similar assets
and liabilities in active markets or inputs that are observable for
the asset or liability, either directly or indirectly through
market corroboration, for substantially the full term of the
financial instrument. Level 3 inputs are unobservable inputs based
on management’s own assumptions used to measure assets and
liabilities at fair value. A financial asset or liability’s
classification within the hierarchy is determined based on the
lowest level input that is significant to the fair value
measurement.
14
PALATIN TECHNOLOGIES, INC.
and Subsidiary
Notes to Consolidated Financial Statements
(unaudited)
The
following table provides the assets carried at fair value measured
on a recurring basis:
|
|
Carrying
Value
|
Quoted prices
in active markets
(Level
1)
|
Other
quoted/observable inputs
(Level
2)
|
Significant
unobservable inputs
(Level
3)
|
|
December 31,
2017:
|
|
|
|
|
|
Money market
account
|
$
34,769,696
|
$
34,769,696
|
$
-
|
$
-
|
|
TOTAL
|
$
34,769,696
|
$
34,769,696
|
$
-
|
$
-
|
|
June 30,
2017:
|
|
|
|
|
|
Money market
account
|
$
40,019,336
|
$
40,019,336
|
$
-
|
$
-
|
|
Corporate debt
securities
|
249,837
|
249,837
|
-
|
-
|
|
TOTAL
|
$
40,269,173
|
$
40,269,173
|
$
-
|
$
-
|
(11)
ACCRUED EXPENSES:
Accrued
expenses consist of the following:
|
|
December
31,
2017
|
June
30,
2017
|
|
Clinical
costs
|
$
5,055,378
|
$
9,138,827
|
|
Other research
related expenses
|
180,820
|
217,307
|
|
Professional
services
|
51,732
|
434,768
|
|
Other
|
239,846
|
730,196
|
|
|
$
5,527,776
|
$
10,521,098
|
(12)
NOTES PAYABLE:
Notes
payable consist of the following:
|
|
December
31,
2017
|
June
30,
2017
|
|
Notes payable under
venture loan
|
$
10,333,334
|
$
14,333,334
|
|
Unamortized related
debt discount
|
(78,564
)
|
(143,524
)
|
|
Unamortized debt
issuance costs
|
(44,494
)
|
(83,215
)
|
|
Notes
payable
|
10,210,276
|
14,106,595
|
|
|
|
|
|
Less: current
portion
|
7,889,152
|
7,824,935
|
|
|
|
|
|
Long-term
portion
|
$
2,321,124
|
$
6,281,660
|
On
December 23, 2014, the Company closed on a $10,000,000 venture loan
which was led by Horizon Technology Finance Corporation
(“Horizon”). The debt facility is a four year senior
secured term loan that bears interest at a floating coupon rate of
one-month LIBOR (floor of 0.50%) plus 8.50%, and provides for
interest-only payments for the first eighteen months followed by
monthly payments of principal of $333,333 plus accrued interest
through January 1, 2019. The lenders also received five-year
immediately exercisable Series D 2014 warrants to purchase 666,666
shares of common stock exercisable at an exercise price of $0.75
per share. The Company recorded a debt discount of $267,820 equal
to the fair value of these warrants at issuance, which is being
amortized to interest expense over the term of the related debt.
This debt discount is offset against the note payable balance and
included in additional paid-in capital on the Company’s
balance sheet at December 31, 2017 and June 30, 2017. In addition,
a final incremental payment of $500,000 is due on January 1, 2019,
or upon early repayment of the loan. This final incremental payment
is being accreted to interest expense over the term of the related
debt. The Company incurred $209,367 of costs in connection with the
loan. These costs were capitalized as deferred financing costs and
are offset against the note payable balance. These debt issuance
costs are being amortized to interest expense over the term of the
related debt.
15
PALATIN TECHNOLOGIES, INC.
and Subsidiary
Notes to Consolidated Financial Statements
(unaudited)
On July
2, 2015, the Company closed on a $10,000,000 venture loan led
by
Horizon. The debt
facility is a four-year senior secured term loan that bears
interest at a floating coupon rate of one-month LIBOR (floor of
0.50%) plus 8.50% and provides for interest-only payments for the
first eighteen months followed by monthly payments of principal of
$333,333 plus accrued interest through August 1, 2019. The lenders
also received five-year immediately exercisable Series G warrants
to purchase 549,450 shares of the Company’s common stock
exercisable at an exercise price of $0.91 per share. The Company
has recorded a debt discount of $305,196 equal to the fair value of
these warrants at issuance, which is being amortized to interest
expense over the term of the related debt. This debt discount is
offset against the note payable balance and is included in
additional paid-in capital on the Company’s balance sheet at
December 31, 2017 and June 30, 2017. In addition, a final
incremental payment of $500,000 is due on August 1, 2019, or upon
early repayment of the loan. This final incremental payment is
being accreted to interest expense over the term of the related
debt. The Company incurred $146,115 of costs in connection with the
loan agreement. These costs were capitalized as deferred financing
costs and are offset against the note payable balance. These debt
issuance costs are being amortized to interest expense over the
term of the related debt.
The
Company’s obligations under the 2015 amended and restated
loan agreement, which includes both the 2014 venture loan and the
2015 venture loan, are secured by a first priority security
interest in substantially all of its assets other than its
intellectual property. The Company also has agreed to specified
limitations on pledging or otherwise encumbering its intellectual
property assets. The 2015 amended and restated loan agreement
include customary affirmative and restrictive covenants, but does
not include any covenants to attain or maintain specified financial
metrics. The loan agreement includes customary events of default,
including payment defaults, breaches of covenants, change of
control and a material adverse change default. Upon the occurrence
of an event of default and following any applicable cure periods, a
default interest rate of an additional 5% may be applied to the
outstanding loan balances, and the lenders may declare all
outstanding obligations immediately due and payable and take such
other actions as set forth in the loan agreement. As of December
31, 2017, the Company was in compliance with all of its loan
covenants.
(13)
STOCKHOLDERS’
EQUITY (DEFICIENCY):
Financing Transactions –
On December 6, 2016, the
Company closed on an underwritten public offering of units, with
each unit consisting of a share of common stock and a Series J
warrant to purchase 0.50 of a share of common stock. Gross proceeds
were $16,500,000, with net proceeds to the Company, after deducting
underwriting discounts and commissions and offering expenses, of
$15,386,075. The Company issued 25,384,616 shares of common stock
and Series J warrants to purchase 12,692,310 shares of common stock
at an initial exercise price of $0.80 per share, which warrants are
exercisable immediately upon issuance and expire on the fifth
anniversary of the date of issuance.
The Series J warrants are subject to
limitation on exercise if the holder and its affiliates would
beneficially own more than 9.99%, or 4.99% for certain holders, of
the total number of the Company’s shares of common stock
outstanding following such exercise.
On
August 4, 2016, the Company closed on an underwritten offering of
units, with each unit consisting of a share of common stock and a
Series H warrant to purchase 0.75 of a share of common stock.
Investors whose purchase of units in the offering would result in
them beneficially owning more than 9.99% of the Company’s
outstanding common stock following the completion of the offering
had the option to acquire units with Series I prefunded warrants
substituted for any common stock they would have otherwise
acquired. Gross proceeds were $9,225,000, with net proceeds to the
Company, after deducting offering expenses, of $8,470,897. The
Company issued 11,481,481 shares of common stock and ten-year
prefunded Series I warrants to purchase 2,218,045 shares of common
stock at an exercise price of $0.01, together with Series H
warrants to purchase 10,274,646 shares of common stock at an
exercise price of $0.70 per share.
The
Series I warrants were exercised during the fiscal year ended June
30, 2017. The Series H warrants are exercisable at an initial
exercise price of $0.70 per share, are exercisable commencing six
months following the date of issuance and expire on the fifth
anniversary of the date of issuance. The Series H warrants are
subject to a limitation on their exercise if the holder and its
affiliates would beneficially own more than 9.99% of the total
number of the Company’s shares of common stock outstanding
following such exercise.
On July
2, 2015, the Company closed on a private placement of Series E
warrants to purchase 21,917,808 shares of Palatin common stock and
Series F warrants to purchase 2,191,781 shares of the
Company’s common stock. Certain funds managed by QVT
Financial LP (“QVT”) invested $5,000,000 and another
accredited investment fund invested $15,000,000. The funds paid
$0.90 for each Series E warrant and $0.125 for each Series F
warrant, resulting in gross proceeds to the Company of $20,000,000,
with net proceeds, after deducting offering expenses, of
$19,834,278.
16
PALATIN TECHNOLOGIES, INC.
and Subsidiary
Notes to Consolidated Financial Statements
(unaudited)
The
Series E warrants were exercisable immediately upon issuance at an
initial exercise price of $0.01 per share. As of December 31,
2017, all of the Series E warrants have been exercised. The Series
F warrants are exercisable at an initial exercise price of $0.91
per share, are exercisable immediately upon issuance and expire on
the fifth anniversary of the date of issuance. The Series F
warrants are subject to limitation on exercise if QVT and its
affiliates would beneficially own more than 9.99% (4.99% for the
other accredited investment fund holder) of the total number of the
Company’s shares of common stock outstanding following such
exercise.
The
purchase agreement for the private placement provides that the
purchasers have certain rights until the earlier of approval of
bremelanotide for FSD by the FDA and July 3, 2018, including rights
of first refusal and participation in any subsequent equity or debt
financing. The purchase agreement also contains certain restrictive
covenants so long as the funds continue to hold specified amounts
of warrants or beneficially own specified amounts of the
outstanding shares of common stock.
During
the six months ended December 31, 2017, and 2016, the Company
issued 23,344,451 and 27,989,685 shares, respectively of common
stock pursuant to the cashless exercise provisions of warrants at
an exercise price of $0.01 per share, and during the six months
ended December 31, 2017, the Company received $114,384 and issued
11,438,356 shares of common stock pursuant to the exercise of
warrants at an exercise price of $0.01 per share. As of December
31, 2017, all warrants with an exercise price of $0.01 per share
have been exercised.
Stock Options
– In December 2017, the Company granted
1,200,000 options to its executive officers and 225,000 options to
its non-employee directors under the Company’s 2011 Stock
Incentive Plan. The fair value of these options is $691,171 and
$126,130, respectively. The Company is amortizing the fair value of
these options over a 48-month vesting period for its executive
officers and over a 36-month vesting period for its non-employee
directors. The Company recognized $17,904 of stock-based
compensation expense related to these options during the three and
six months ended December 31, 2017.
Also,
in December 2017, the Company granted 1,075,000 and 125,000
performance-based options to its executive officers and employees,
respectively, which vest during a performance period ending on
December 31, 2020, if and upon i) as to 100% of the target number
of shares upon achievement of a closing price for the
Company’s common stock equal to or greater than $1.50 per
share for 20 consecutive trading days, which is considered a market
condition; ii) as to thirty percent (30%) of the target number of
shares, upon the acceptance for filing by the FDA of an NDA for
bremelanotide for HSDD in premenopausal women during the
performance period, which is considered a performance condition;
iii) as to fifty percent (50%) of the target number of shares, upon
the approval by the FDA of an NDA for bremelanotide for HSDD in
premenopausal women during the performance period, which is also
considered a performance condition; iv) as to twenty percent (20%)
of the target number of shares, upon entry into a licensing
agreement during the performance period for the commercialization
of bremelanotide for female sexual dysfunction in at least two of
the following geographic areas (a) four or more countries in
Europe, (b) Japan, (c) two or more countries in Central and/or
South America, (d) two or more countries in Asia, excluding Japan
and China, and (e) Australia, which is also considered a
performance condition. The fair value of these options, as
calculated under a multifactor Monte Carlo simulation, is $602,760.
The Company is amortizing the fair value over the derived service
period of 1.1 years. The Company recognized $42,034 of stock-based
compensation expense related to these options during the three and
six months ended December 31, 2017.
In
September 2017, the Company granted 54,000 options to a newly
appointed non-employee director under the Company’s 2011
Stock Incentive Plan. The Company is amortizing the fair value of
these options of $18,176 over a 48 month vesting period. The
Company recognized $1,136 and $1,515, respectively, of stock-based
compensation expense related to these options during the three and
six months ended December 31, 2017.
In June
2017, the Company granted 1,797,000 options to its executive
officers, 780,000 options to its employees and 378,000 options to
its non-employee directors under the Company’s 2011 Stock
Incentive Plan. The Company is amortizing the fair value of these
options of $445,533, $194,689 and $89,220, respectively, over the
vesting period of the options. The Company recognized $62,506 and
$125,013, respectively, of stock-based compensation expense related
to these options during the three and six months ended December 31,
2017.
In
September 2016, the Company granted 828,000 options to its
executive officers and 336,000 options to its employees under the
Company’s 2011 Stock Incentive Plan. The Company is
amortizing the fair value of the options vesting over a 48 month
period, consisting of 595,000 options granted to its executive
officers and all options granted to its employees, of $188,245 and
$106,303, respectively, over the vesting period. The Company
recognized $17,703 and $35,406, respectively, of stock-based
compensation expense related to these options during the three and
six months ended December 31, 2017 and $16,568 and $21,784,
respectively, during the three and six months ended December 31,
2016. The remaining 233,000 options granted to the Company’s
executive officers vested 12 months from the date of grant, and the
Company amortized the fair value of these options of $67,160 over
this vesting period. The Company recognized $11,193 of stock-based
compensation expense related to these options during the six months
ended December 31, 2017 and $15,111 and $19,868, respectively,
during the three and six months ended December 31,
2016.
17
PALATIN TECHNOLOGIES, INC.
and Subsidiary
Notes to Consolidated Financial Statements
(unaudited)
In June
2015, the Company granted 570,000 options to its executive
officers, 185,800 options to its employees and 160,000 options to
its non-employee directors under the Company’s 2011 Stock
Incentive Plan. The Company is amortizing the fair value of these
options of $446,748, $145,439 and $111,876, respectively, over the
vesting period. The Company recognized $36,478, and $72,957,
respectively, of stock-based compensation expense related to these
options during the three and six months ended December 31, 2017 and
$35,192 and $67,485, respectively, during the three and six months
ended December 31, 2016.
Unless
otherwise stated, stock options granted to the Company’s
executive officers and employees vest over a 48-month period, while
stock options granted to its non-employee directors vest over a
12-month period.
Restricted Stock Units
– In December 2017, the Company
granted 1,200,000 restricted stock units to its executive officers,
225,000 restricted stock units to its non-employee directors and
545,000 restricted stock units to its employees under the
Company’s 2011 Stock Incentive Plan. The fair value of these
restricted stock units is $1,020,000, $191,250 and $463,250,
respectively. For executive officers and employees, the restricted
stock units vest 25% on the first, second, third and fourth
anniversary dates from the date of grant. For non-employee
directors, the restricted stock units vest 33 1/3% on the first,
second and third anniversary dates from the date of grant. The
Company recognized $46,940 of stock-based compensation expense
related to these restricted stock units during the three and six
months ended December 31, 2017.
Also,
in December 2017, the Company granted 1,075,000 performance-based
restricted stock units to its executive officers and 670,000
performance-based restricted stock units to other employees which
vest during a performance period, ending on December 31, 2020, if
and upon i) as to 100% of the target number of shares upon
achievement of a closing price for the Company’s common stock
equal to or greater than $1.50 per share for 20 consecutive trading
days, which is considered a market condition; ii) as to thirty
percent (30%) of the target number of shares, upon the acceptance
for filing by the FDA of an NDA for bremelanotide for HSDD in
premenopausal women during the performance period, which is
considered a performance condition; iii) as to fifty percent (50%)
of the target number of shares, upon the approval by the FDA of an
NDA for bremelanotide for HSDD in premenopausal women during the
performance period, which is also considered a performance
condition; iv) as to twenty percent (20%) of the target number of
shares, upon entry into a licensing agreement during the
performance period for the commercialization of bremelanotide for
female sexual dysfunction in at least two of the following
geographic areas (a) four or more countries in Europe, (b) Japan,
(c) two or more countries in Central and/or South America, (d) two
or more countries in Asia, excluding Japan and China, and (e)
Australia, which is also considered a performance condition. The
fair value of these awards, as calculated under a multifactor Monte
Carlo simulation, is $913,750 and $569,500, respectively. The
Company is amortizing the fair value over the derived service
period of 1.1 years. The Company recognized $106,850 of stock-based
compensation expense related to these restricted stock units during
the three and six months ended December 31, 2017.
In
September 2017, the Company granted 54,000 restricted stock units
to a newly appointed non-employee director under the
Company’s 2011 Stock Incentive Plan. The Company is
amortizing the fair value of these restricted stock units of
$27,000 over a 48 month vesting period. The Company recognized
$3,516 and $4,414, respectively, of stock-based compensation
expense related to these restricted stock units during the three
and six months ended December 31, 2017.
In June
2017, the Company granted 1,140,000 restricted stock units to its
executive officers, 780,000 restricted stock units to its employees
and 378,000 restricted stock units to its non-employee directors
under the Company’s 2011 Stock Incentive Plan. The Company is
amortizing the fair value of these restricted stock units of
$421,800, $288,600, and $139,860, respectively, over the vesting
period. The Company recognized $171,574 and $323,204, respectively,
of stock-based compensation expense related to these restricted
stock units during the three and six months ended December 31,
2017.
In
September 2016, the Company granted 558,000 restricted stock units
to its executive officers, 350,500 of which vest over 24 months and
207,500 of which vested over 12 months, and 336,000 restricted
stock units to its employees under the Company’s 2011 Stock
Incentive Plan. The Company is amortizing the fair value of the
restricted stock units of $284,580, and $171,360, respectively,
over the vesting periods. The Company recognized $27,491 and
$91,483, respectively, of stock-based compensation expense related
to these restricted stock units during the three and six months
ended December 31, 2017 and $80,228 and $100,732, respectively,
during the three and six months ended December 31,
2016.
In
December 2015, the Company granted 625,000 performance-based
restricted stock units to its executive officers and 200,000
performance-based restricted stock units to its employees under the
Company’s 2011 Stock Incentive Plan, which vest during the
performance period, ending December 31, 2017, if and upon the
earlier of: i) achievement of a closing price for the
Company’s common stock equal to or greater than $1.20 per
share for 20 consecutive trading days, which is considered a market
condition, or ii) entering into a collaboration agreement (U.S. or
global) of bremelanotide for FSD, which is considered a performance
condition. This performance condition was deemed met as of February
2, 2017, the effective date of the License Agreement with AMAG.
Prior to meeting the performance condition, the Company determined
that it was not probable of achievement on the date of grant since
meeting the condition was outside the control of the Company. The
fair value of these awards, as calculated under a multifactor Monte
Carlo simulation, was $338,250 and was recognized over the derived
service period which was through December 2016. The Company
recognized $55,410 and $142,289, respectively, of stock-based
compensation expense related to these restricted stock units during
the three and six months ended December 31, 2016. Upon the
achievement of the performance condition, which occurred in the
three month period ended March 31, 2017, the grant date fair value
was utilized and an incremental $222,075 was recognized as
stock-based compensation expense during the three months ended
March 31, 2017.
Also,
in December 2015, the Company granted 625,000 restricted stock
units to its executive officers, 340,000 restricted stock units to
its non-employee directors and 200,000 restricted stock units to
its employees under the Company’s 2011 Stock Incentive Plan.
For executive officers and employees, the restricted stock units
vest 25% on the date of grant and 25% on the first, second and
third anniversary dates from the date of grant. For non-employee
directors, the restricted stock units vest 50% on the first and
second anniversary dates from the date of grant. The Company is
amortizing the fair value of these restricted stock units of
$425,000, $231,200 and $136,000, respectively, over the vesting
period of the restricted stock units. The Company recognized
$35,553 and $77,010, respectively, of stock-based compensation
expense related to these restricted stock units during the three
and six months ended December 31, 2017 and $85,996 and $187,252,
respectively, during the three and six months ended December 31,
2016.
In June
2015, the Company granted 400,000 restricted stock units to its
executive officers, 185,800 restricted stock units to its employees
and 160,000 restricted stock units to its non-employee directors
under the Company’s 2011 Stock Incentive Plan. The Company is
amortizing the fair value of these restricted stock units of
$432,000, $200,664, and $172,800, respectively, over the vesting
period. The Company recognized $7,067 and $13,954, respectively, of
stock-based compensation expense related to these restricted stock
units during the three and six months ended December 31, 2017 and
$40,430 and $80,859, respectively, during the three and six months
ended December 31, 2016.
Unless
otherwise stated, restricted stock units granted to the
Company’s executive officers, employees and non-employee
directors vest over 24 months, 48 months and 12 months,
respectively.
Stock-based
compensation expense for the three and six months ended December
31, 2017 for equity-based instruments issued other than the stock
options and restricted stock units described above was $43,277 and
$72,023, respectively, and $121,098 and $232,972, respectively, for
the three and six months ended December 31, 2016.
18
The
following discussion and analysis should be read in conjunction
with the consolidated financial statements and notes to the
consolidated financial statements filed as part of this report and
the audited consolidated financial statements and notes thereto
included in our Annual Report on Form 10-K for the year ended June
30, 2017.
Critical Accounting Policies and Estimates
Our
significant accounting policies, which are described in the notes
to our consolidated financial statements included in this report
and in our Annual Report on Form 10-K for the year ended June 30,
2017, have not changed as of December 31, 2017. We believe that our
accounting policies and estimates relating to revenue recognition,
accrued expenses and stock-based compensation are the most
critical.
Overview
We are
a biopharmaceutical company developing targeted, receptor-specific
peptide therapeutics for the treatment of diseases with significant
unmet medical need and commercial potential. Our programs are based
on molecules that modulate the activity of the melanocortin and
natriuretic peptide receptor systems. Our lead product in clinical
development is bremelanotide for the treatment of premenopausal
women with hypoactive sexual desire disorder (“HSDD”),
which is a type of female sexual dysfunction (“FSD”),
defined as low desire with associated distress. In addition, we
have drug candidates and development programs for cardiovascular
diseases and inflammatory diseases.
The
following drug development programs are actively under
development:
●
Bremelanotide, an
as-needed subcutaneous injectable product for the treatment of HSDD
in premenopausal women. Bremelanotide is a synthetic peptide analog
of the naturally occurring hormone alpha-MSH
(melanocyte-stimulating hormone). In two pivotal Phase 3 clinical
studies of bremelanotide for HSDD in premenopausal women,
bremelanotide met the pre-specified co-primary efficacy endpoints
of improvement in desire and decrease in distress associated with
low sexual desire as measured using validated patient-reported
outcome instruments. We have licensed North American rights to
bremelanotide to AMAG Pharmaceuticals, Inc. (“AMAG”),
rights in China, Taiwan, Hong Kong and Macau to Shanghai Fosun
Pharmaceutical Industrial Development Co. Ltd.
(“Fosun”), and rights in the Republic of Korea to
Kwangdong Pharmaceutical Co., Ltd.
(“Kwangdong”).
●
Melanocortin
peptide system program, focused on development of treatments for a
variety of inflammatory disease indications. PL-8177 is a selective
melanocortin receptor 1 (“MC1r”) agonist peptide we
have designated as our lead clinical development candidate for
inflammatory bowel diseases. We have filed an Investigational New
Drug (“IND”) application and announced dosing of human
subjects in a Phase 1 clinical safety study in February, 2018. A
dual melanocortin receptor 1 and 5 peptide we developed, PL-8331,
is a preclinical development candidate for treating ocular
inflammation. We anticipate completing IND preclinical enabling
activities on PL-8331 later this calendar year; and
●
Natriuretic peptide
system program, including PL3994, a natriuretic peptide
receptor-A (“NPR-A”) agonist, for treatment of
cardiovascular indications. PL3994, a synthetic mimetic of
the neuropeptide hormone atrial natriuretic peptide
(“ANP”), is in development for treatment of heart
failure, and is scheduled to start Phase 2A clinical trials later
this calendar year. A dual natriuretic peptide receptor A and C
agonist we developed, PL-5028, is in preclinical development for
cardiovascular diseases, including reducing cardiac hypertrophy and
fibrosis. We may file an IND application in the first half of
calendar year 2019, and thereafter initiate a Phase 1 clinical
safety study.
The
following chart illustrates the status of our drug development
programs.
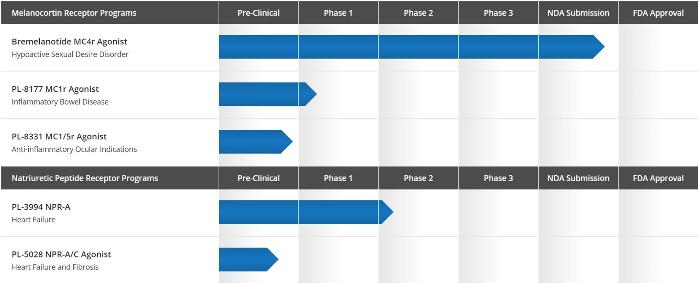
19
Our Strategy
Key
elements of our business strategy include:
●
Using our
technology and expertise to develop and commercialize products in
our active drug development programs;
●
Entering into
strategic alliances and partnerships with pharmaceutical companies
to facilitate the development, manufacturing, marketing, sale and
distribution of our product candidates;
●
Partially funding
our product development programs with the cash flow generated from
existing license agreements, as well as any future research,
collaboration or license agreements with third parties;
and
●
Completing
development and seeking regulatory approval of certain of our
product candidates.
We
incorporated in Delaware in 1986 and commenced operations in the
biopharmaceutical area in 1996. Our corporate offices are located
at 4B Cedar Brook Drive, Cranbury, New Jersey 08512 and our
telephone number is (609) 495-2200. We maintain an Internet site at
http://www.palatin.com, where among other things, we make available
free of charge on and through this website our Forms 3, 4 and 5,
proxy statements, Annual Reports on Form 10-K, Quarterly Reports on
Form 10-Q, Current Reports on Form 8-K, and amendments to those
reports filed or furnished pursuant to Section 13(a) or 15(d),
Section 14A and Section 16 of the Exchange Act as soon as
reasonably practicable after we electronically file such material
with, or furnish it to, the SEC. Our website and the information
contained in it or connected to it are not incorporated into this
Quarterly Report on Form 10-Q.
Results of Operations
Three and Six Months Ended December 31, 2017 Compared to the Three
and Six Months Ended December 31, 2016
Revenue –
For the three and six months ended December
31, 2017, we recognized $10,612,153 and $37,553,661, respectively,
in revenue, of which $10,612,153 and $32,553,661, respectively, was
attributable to our License Agreement with AMAG. For the six months
ended December 31, 2017, $5,000,000 in revenue was attributable to
our License Agreement with Fosun.
We recognized no revenue for the
three and six months ended December 31, 2016.
On
January 8, 2017, we entered into the License Agreement with AMAG
which provided for $60,000,000 as a one-time initial payment.
Pursuant to the terms of and subject to the conditions in the
License Agreement with AMAG, AMAG reimbursed us $25,000,000 for
reasonable, documented, direct out-of-pocket expenses we incurred
following the Effective Date of the License Agreement with AMAG in
connection with the development and regulatory activities necessary
to file an NDA for bremelanotide for HSDD in the United
States.
On
September 6, 2017, we entered into the License Agreement with
Fosun, for exclusive rights to commercialize bremelanotide in the
territories of mainland China, Taiwan, Hong Kong S.A.R. and Macau
S.A.R., which provided for $5,000,000 as a one-time non-refundable
upfront payment. Pursuant to the License Agreement with Fosun,
$500,000 was withheld in accordance with tax withholding
requirements in China and will be recorded as an expense during the
fiscal year ending June 30, 2018. For the three and six months
ended December 31, 2017, the Company incurred $54,712 and $279,967
in income tax expense related to this transaction.
On
November 21, 2017, we entered into the License Agreement with
Kwangdong, for exclusive rights to commercialize bremelanotide in
the Republic of Korea, which provided for a $500,000 as a one-time
refundable upfront payment, which has been recorded as non-current
deferred revenue as of December 31, 2017. Pursuant to the License
Agreement with Kwangdong, $82,500 was withheld in accordance with
tax withholding requirements in South Korea and will be recorded as
an expense during the fiscal year ending June 30, 2018. For the
three and six months ended December 31, 2017, the Company incurred
$46,168 in income tax expense related to this
transaction.
Research and Development
– Research and development
expenses were $6,045,884 and $20,208,981, respectively for the
three and six months ended December 31, 2017, compared to
$8,134,575 and $19,360,659, respectively, for the three and six
months ended December 31, 2016.
Research
and development expenses related to our bremelanotide, PL-3994,
MC1r, MC4r and other preclinical programs were $4,850,502 and
$18,035,608, respectively, for the three and six months ended
December 31, 2017, compared to $7,203,093 and $17,302,067,
respectively, for the three and six months ended December 31, 2016.
Spending to date has been primarily related to our bremelanotide
for the treatment of HSDD program. The fluctuations in research and
development expenses for the periods presented are mainly
attributable to the progression of the Phase 3 clinical trial and
development of bremelanotide for HSDD program. The amount of such
spending and the nature of future development activities are
dependent on a number of factors, including primarily the
availability of funds to support future development activities,
success of our clinical trials and preclinical and discovery
programs, and our ability to progress compounds in addition to
bremelanotide and PL-3994 into human clinical trials.
The
amounts of project spending noted above exclude general research
and development spending, which was $1,195,382 and $2,173,373,
respectively, for the three and six months ended December 31, 2017
compared to $931,481 and $2,058,592, respectively, for the three
and six months ended December 31, 2016. The increase in general
research and development spending is primarily attributable to
employee related expenses.
20
Cumulative
spending from inception to December 31, 2017 is approximately
$297,700,000 on our bremelanotide program and approximately
$126,900,000 on all our other programs (which include PL3994,
PL8177, other melanocortin receptor agonists, other discovery
programs and terminated programs). Due to various risk factors
described herein and in our Annual Report on Form 10-K for the year
ended June 30, 2017, under “Risk Factors,” including
the difficulty in estimating the costs and timing of future Phase 1
clinical trials and larger-scale Phase 2 and Phase 3 clinical
trials for any product under development, we cannot predict with
reasonable certainty when, if ever, a program will advance to the
next stage of development, be successfully completed, or generate
net cash inflows.
General and Administrative
– General and
administrative expenses, which consist mainly of compensation and
related costs, were $1,625,189 and $3,169,764, respectively, for
the three and six months ended December 31, 2017 compared to
$1,306,300 and $2,515,646, respectively, for the three and six
months ended December 31, 2016. The increase in general and
administrative expenses is primarily attributable to professional
services rendered for tax compliance and Internal Revenue Code
Section 382 services and secondarily attributable to employee
related expenses recognized in the corresponding
periods.
Other Income (Expense)
– Other income (expense) was
$(310,007) and $(714,958), respectively, for the three and six
months ended December 31, 2017 compared to $(588,544) and
$(1,205,884), respectively, for the three and six months ended
December 31, 2016. For the three and six months ended December 31,
2017, we recognized $81,356 and $133,082, respectively, of
investment income offset by $(391,363) and $(848,040),
respectively, of interest expense primarily related to our venture
debt. For the three and six months ended December 31, 2016, we
recognized $5,991 and $12,636, respectively, of investment income
offset by $(594,535) and $(1,218,520), respectively, of interest
expense primarily related to our venture debt.
Income Tax Benefit
– Net income tax benefit was
$399,120 and $173,865, respectively, for the three and six months
ended December 31, 2017. Pursuant to the 2017 Tax Act, during the
quarter ended December 31, 2017, we recorded a tax benefit of
$500,000 related to the release of a valuation allowance against an
AMT credit; accordingly this benefit is offset by $100,880 and
$326,135, respectively, in income tax expense for the three and six
months ended December 31, 2017.
No income tax expense or benefit
was recognized for the three and six months ended December 31,
2016.
Liquidity and Capital Resources
Since
inception, we have incurred net operating losses, primarily related
to spending on our research and development programs. We have
financed our net operating losses primarily through debt and equity
financings and amounts received under collaboration and license
agreements.
Our
product candidates are at various stages of development and will
require significant further research, development and testing and
some may never be successfully developed or commercialized. We may
experience uncertainties, delays, difficulties and expenses
commonly experienced by early stage biopharmaceutical companies,
which may include unanticipated problems and additional costs
relating to:
●
the development and
testing of products in animals and humans;
●
product approval or
clearance;
●
regulatory
compliance;
●
good manufacturing
practices (“GMP”) compliance;
●
intellectual
property or technology rights;
●
product
introduction;
●
marketing, sales
and competition; and
●
obtaining
sufficient capital.
Failure
to enter into or successfully perform under collaboration
agreements and obtain timely regulatory approval for our product
candidates and indications would impact our ability to increase
revenues and could make it more difficult to attract investment
capital for funding our operations. Any of these possibilities
could materially and adversely affect our operations and require us
to curtail or cease certain programs.
During
the six months ended December 31, 2017, cash used in operating
activities was $1,558,456, compared to $17,731,525 for the six
months ended December 31, 2016. Lower net cash outflows from
operations in the six months ended December 31, 2017 was primarily
the result of the cash payments received in the period relating to
our license agreements with AMAG, Fosun and Kwangdong. Our periodic
prepaid expenses, accounts payable and accrued expenses balances
will continue to be highly dependent on the timing of our operating
costs.
During
the six months ended December 31, 2017, cash provided by investing
activities was $240,500, consisting of $250,000 in proceeds from
the maturity of investments offset by $9,500, which was used for
the purchase of equipment. There were no investing activities
during the six months ended December 31, 2016.
21
During
the six months ended December 31, 2017, net cash used in financing
activities was $3,924,320, which consisted of $4,000,000 for the
payment on notes payable, and $38,704 for capital lease payments
and the payment of withholding taxes related to restricted stock
units, offset by proceeds from the exercise of warrants of
$114,384. During the six months ended December 31, 2016, net cash
provided by financing activities of $21,843,438 consisted of net
proceeds of $23,856,972 from the sale of common stock and warrants
in August and December 2016, offset by $2,013,534 for the payment
of principal on notes payable and capital lease
payments.
We have
incurred cumulative negative cash flows from operations since our
inception, and have expended, and expect to continue to expend in
the future, substantial funds to complete our planned product
development efforts. Continued operations are dependent upon our
ability to complete equity or debt financing activities, entering
into licensing agreements or collaboration arrangements. As of
December 31, 2017, our cash and cash equivalents were $34,958,048
and our current liabilities were $14,120,695, net of deferred
revenue of $9,548,228.
We
intend to utilize existing capital resources for general corporate
purposes and working capital, including preparation and filing of
an NDA on bremelanotide for HSDD with the FDA, and preclinical and
clinical development of our MC1r and MC4r peptide programs and
PL-3994 natriuretic peptide, and development of other portfolio
products.
We
believe that our existing capital resources will be adequate to
fund our planned operations through at least one year after the
date that these financial statements are issued. We will need
additional funding to complete required clinical trials for our
other product candidates and development programs and, if those
clinical trials are successful (which we cannot predict), to
complete submission of required regulatory applications to the
FDA.
We
anticipate incurring additional losses over at least the next
several years. To achieve or maintain profitability, if ever, we,
alone or with others, must successfully develop and commercialize
our technologies and proposed products, conduct preclinical studies
and clinical trials, obtain required regulatory approvals and
successfully manufacture and market our technologies and proposed
products. The time required to reach sustained profitability is
highly uncertain, and we do not know whether we will be able to
achieve profitability on a sustained basis, if at all.
Off-Balance Sheet Arrangements
None.
Not
required to be provided by smaller reporting
companies.
Our
management, with the participation of our Chief Executive Officer
and Chief Financial Officer, has evaluated the effectiveness of our
disclosure controls and procedures, as defined in Exchange Act
Rules 13a-15(e) and 15d-15(e), as of the end of the period covered
by this report. Based on that evaluation, our Chief Executive
Officer and Chief Financial Officer concluded that our disclosure
controls and procedures were effective as of December 31, 2017.
There were no changes in our internal control over financial
reporting that occurred during our most recent fiscal quarter that
materially affected, or that are reasonably likely to materially
affect, our internal control over financial
reporting.
22
We may
be involved, from time to time, in various claims and legal
proceedings arising in the ordinary course of our business. We are
not currently a party to any claim or legal
proceeding.
This
report and other documents we file with the SEC contain
forward-looking statements that are based on current expectations,
estimates, forecasts and projections about us, our future
performance, our business, our beliefs and our management’s
assumptions. These statements are not guarantees of future
performance, and they involve certain risks, uncertainties and
assumptions that are difficult to predict. You should carefully
consider the risks and uncertainties facing our
business.
There
have been no material changes to our risk factors disclosed in Part
I, Item 1A, of our Annual Report, on Form 10-K for the year ended
June 30, 2017.
None.
None.
Not
applicable.
None.
Exhibits
filed or furnished with this report:
|
Exhibit
Number
|
Description
|
Filed
Herewith
|
Form
|
Filing
Date
|
SEC File
No.
|
|
Certification
of Chief Executive Officer.
|
X
|
|
|
|
|
|
Certification
of Chief Financial Officer.
|
X
|
|
|
|
|
|
|
Certification
of principal executive officer pursuant to 18 U.S.C. Section 1350,
as adopted pursuant to Section 906 of the Sarbanes-Oxley Act of
2002.
|
X
|
|
|
|
|
Certification
of principal financial officer pursuant to 18 U.S.C. Section 1350,
as adopted pursuant to Section 906 of the Sarbanes-Oxley Act of
2002.
|
X
|
|
|
|
|
|
101.INS
|
XBRL
Instance Document.
|
X
|
|
|
|
|
101.SCH
|
XBRL
Taxonomy Extension Schema Document.
|
X
|
|
|
|
|
101.CAL
|
XBRL
Taxonomy Extension Calculation Linkbase Document.
|
X
|
|
|
|
|
101.LAB
|
XBRL
Taxonomy Extension Label Linkbase Document.
|
X
|
|
|
|
|
101.PRE
|
XBRL
Taxonomy Extension Presentation Linkbase Document.
|
X
|
|
|
|
|
101.DEF
|
XBRL
Taxonomy Extension Definition Linkbase Document.
|
X
|
|
|
|
23
SIGNATURES
Pursuant
to the requirements of the Securities Exchange Act of 1934, the
registrant has duly caused this report to be signed on its behalf
by the undersigned thereunto duly authorized.
|
|
|
Palatin Technologies, Inc.
|
|
|
|
|
(Registrant)
|
|
|
|
|
|
|
|
|
|||
|
|
|||
|
|
|
/s/
Carl Spana
|
|
|
Date:
February 12, 2018
|
|
Carl
Spana, Ph.D.
President
and
Chief
Executive Officer (Principal
Executive
Officer)
|
|
|
|
|
|
|
|
|
|
|
|
|
|
|
|
|
|
|
|
/s/ Stephen T. Wills
|
|
|
Date:
February 12, 2018
|
|
Stephen
T. Wills, CPA, MST
Executive
Vice President, Chief Financial Officer and Chief Operating
Officer
(Principal
Financial and Accounting Officer)
|
|
24
EXHIBIT INDEX
|
Exhibit
Number
|
Description
|
Filed
Herewith
|
Form
|
Filing
Date
|
SEC File
No.
|
|
Certification of
Chief Executive Officer.
|
X
|
|
|
|
|
|
Certification of
Chief Financial Officer.
|
X
|
|
|
|
|
|
|
Certification of
principal executive officer pursuant to 18 U.S.C. Section 1350, as
adopted pursuant to Section 906 of the Sarbanes-Oxley Act of
2002.
|
X
|
|
|
|
|
Certification of
principal financial officer pursuant to 18 U.S.C. Section 1350, as
adopted pursuant to Section 906 of the Sarbanes-Oxley Act of
2002.
|
X
|
|
|
|
|
|
101.INS
|
XBRL Instance
Document.
|
X
|
|
|
|
|
101.SCH
|
XBRL Taxonomy
Extension Schema Document.
|
X
|
|
|
|
|
101.CAL
|
XBRL Taxonomy
Extension Calculation Linkbase Document.
|
X
|
|
|
|
|
101.LAB
|
XBRL Taxonomy
Extension Label Linkbase Document.
|
X
|
|
|
|
|
101.PRE
|
XBRL Taxonomy
Extension Presentation Linkbase Document.
|
X
|
|
|
|
|
101.DEF
|
XBRL Taxonomy
Extension Definition Linkbase Document.
|
X
|
|
|
|
25
TABLE OF CONTENTS
Part I - Financial InformationItem 1. Financial StatementsItem 2. Management S Discussion and Analysis Of Financial Condition and Results Of OperationsItem 3. Quantitative and Qualitative Disclosures About Market RiskItem 4. Controls and ProceduresPart II - Other InformationItem 1. Legal ProceedingsItem 1A. Risk FactorsItem 2. Unregistered Sales Of Equity Securities and Use Of ProceedsItem 3. Defaults Upon Senior SecuritiesItem 4. Mine Safety DisclosuresItem 5. Other InformationItem 6. Exhibits