PALATIN TECHNOLOGIES INC
10-Ks and 10-Qs
|
|
|
|
|
|
|
|
|
|
|
|
|
|
|
|
|
|
|
|
|
|
|
|
|
|
|
|
|
|
|
|
|
|
|
|
|
|
|
|
|
|
|
|
|
|
|
|
|
|
|
|
|
|
|
|
|
|
|
|
|
|
|
|
|
UNITED STATES
SECURITIES AND EXCHANGE COMMISSION
Washington, DC 20549
FORM 10-Q
(Mark
One)
|
[X]
|
QUARTERLY
REPORT PURSUANT TO SECTION 13 OR 15(d) OF THE SECURITIES EXCHANGE
ACT OF 1934
|
For the
quarterly period ended March 31, 2018
or
|
[ ]
|
TRANSITION
REPORT PURSUANT TO SECTION 13 OR 15(d) OF THE SECURITIES EXCHANGE
ACT OF 1934
|
For the
transition period from ___________ to __________
Commission
file number: 001-15543
________________________
PALATIN TECHNOLOGIES, INC.
(Exact
name of registrant as specified in its charter)
|
Delaware
|
|
95-4078884
|
|
(State
or other jurisdiction of
incorporation
or organization)
|
|
(I.R.S.
Employer Identification No.)
|
|
|
|
|
|
4B Cedar Brook Drive
Cranbury, New Jersey
|
|
08512
|
|
(Address
of principal executive offices)
|
|
(Zip
Code)
|
(609) 495-2200
(Registrant's
telephone number, including area code)
Indicate
by check mark whether the registrant (1) has filed all reports
required to be filed by Section 13 or 15(d) of the Securities
Exchange Act of 1934 during the preceding 12 months (or for such
shorter period that the registrant was required to file such
reports), and (2) has been subject to such filing requirements for
the past 90 days.
Yes
☒ No ☐
Indicate
by check mark whether the registrant has submitted electronically
and posted on its corporate Web site, if any, every Interactive
Data File required to be submitted and posted pursuant to Rule 405
of Regulation S-T (§232.405 of this chapter) during the
preceding 12 months (or for such shorter period that the registrant
was required to submit and post such
files). Yes ☒ No
☐
Indicate
by check mark whether the registrant is a large accelerated filer,
an accelerated filer, a non-accelerated filer, a smaller reporting
company, or an emerging growth company. See the definitions of
“large accelerated filer,” “accelerated
filer,” “smaller reporting company,” and
“emerging growth company” in Rule 12b-2 of the Exchange
Act.
|
Large accelerated
filer
|
☐
|
Accelerated
filer
|
☐
|
|
Non-accelerated
filer
|
☐ (Do
not check if a smaller reporting company)
|
Smaller reporting
company
|
☒
|
|
|
|
Emerging growth
company
|
☐
|
If an
emerging growth company, indicate by check mark if the registrant
has elected not to use the extended transition period for complying
with any new or revised financial accounting standards provided
pursuant to Section 13(a) for the Exchange Act.
☐
Indicate
by check mark whether the registrant is a shell company (as defined
in Rule 12b-2 of the Exchange Act). Yes ☐ No
☒
As of
May 11, 2018, 198,677,039 shares of the
registrant’s common stock, par value $0.01 per share, were
outstanding.
PALATIN TECHNOLOGIES, INC
.
Table of Contents
|
|
Page
|
|
PART I – FINANCIAL INFORMATION
|
|
|
Item 1. Financial Statements (Unaudited)
|
|
|
Consolidated
Balance Sheets as of March 31, 2018 and June 30, 2017
|
3
|
|
Consolidated
Statements of Operations for the Three and Nine Months Ended March
31, 2018 and 2017
|
4
|
|
Consolidated
Statements of Comprehensive (Loss) Income for the Three and Nine
Months Ended
March 31, 2018 and
2017
|
5
|
|
Consolidated
Statements of Cash Flows for the Three and Nine Months Ended
March
31, 2018 and 2017
|
6
|
|
Notes
to Consolidated Financial Statements
|
7
|
|
Item 2. Management’s Discussion and Analysis of Financial
Condition and Results of Operations
|
19
|
|
Item 3. Quantitative and Qualitative Disclosures About Market
Risk
|
22
|
|
Item 4. Controls and Procedures
|
22
|
|
PART
II – OTHER INFORMATION
|
|
|
|
|
|
Item 1. Legal Proceedings
|
23
|
|
Item 1A. Risk Factors
|
23
|
|
Item 2. Unregistered Sales of Equity Securities and Use of
Proceeds
|
42
|
|
Item 3. Defaults Upon Senior Securities
|
42
|
|
Item 4. Mine Safety Disclosures
|
42
|
|
Item 5. Other Information
|
42
|
|
Item 6. Exhibits
|
43
|
|
Signatures
|
44
|
1
SPECIAL NOTE REGARDING FORWARD-LOOKING STATEMENTS
In this
Quarterly Report on Form 10-Q, references to “we”,
“our”, “us” or “Palatin” means
Palatin Technologies, Inc. and its subsidiary.
Statements
in this Quarterly Report on Form 10-Q, as well as oral statements
that may be made by us or by our officers, directors, or employees
acting on our behalf, that are not historical facts constitute
“forward-looking statements”, which are made pursuant
to the safe harbor provisions of Section 21E of the Securities
Exchange Act of 1934, as amended (the “Exchange Act”).
The forward-looking statements in this Quarterly Report on Form
10-Q do not constitute guarantees of future performance. Investors
are cautioned that statements that are not strictly historical
statements contained in this Quarterly Report on Form 10-Q,
including, without limitation, the following are forward looking
statements:
●
estimates of our
expenses, future revenue and capital requirements;
●
our ability to
obtain additional financing on terms acceptable to us, or at
all;
●
our ability to
advance product candidates into, and successfully complete,
clinical trials;
●
the initiation,
timing, progress and results of future preclinical studies and
clinical trials, and our research and development
programs;
●
the timing or
likelihood of regulatory filings and approvals;
●
our expectations
regarding completion of required clinical trials and studies and
validation of methods and controls used to manufacture
bremelanotide for the treatment of premenopausal women with
hypoactive sexual desire disorder (“HSDD”), which is a
type of female sexual dysfunction (“FSD”);
●
our expectation
regarding the timing of our regulatory submissions for approval of
bremelanotide for HSDD in the United States and in certain other
jurisdictions outside the United States;
●
our expectation
regarding performance of our exclusive licensees of bremelanotide,
including;
o
AMAG
Pharmaceuticals, Inc. (“AMAG”) for North
America,
o
Shanghai Fosun
Pharmaceutical Industrial Development Co. Ltd.
(“Fosun”), a subsidiary of Shanghai Fosun
Pharmaceutical (Group) Co., Ltd., for the territories of the
People’s Republic of China, Taiwan, Hong Kong S.A.R. and
Macau S.A.R. (collectively, “China”), and
o
Kwangdong
Pharmaceutical Co., Ltd. (“Kwangdong”) for the Republic
of Korea (“Korea”);
●
the potential for
commercialization of bremelanotide for HSDD in North America by
AMAG and other product candidates, if approved, by us;
●
our expectations
regarding the potential market size and market acceptance for
bremelanotide for HSDD and our other product candidates, if
approved for commercial use;
●
our ability to
compete with other products and technologies similar to our product
candidates;
●
the ability of our
third-party collaborators to timely carry out their duties under
their agreements with us;
●
the ability of our
contract manufacturers to perform their manufacturing activities
for us in compliance with applicable regulations;
●
our ability to
recognize the potential value of our licensing arrangements with
third parties;
●
the potential to
achieve revenues from the sale of our product
candidates;
●
our ability to
obtain adequate reimbursement from Medicare, Medicaid, private
insurers and other healthcare payers;
●
our ability to
maintain product liability insurance at a reasonable cost or in
sufficient amounts, if at all;
●
the retention of
key management, employees and third-party contractors;
●
the scope of
protection we are able to establish and maintain for intellectual
property rights covering our product candidates and
technology;
●
our compliance with
federal and state laws and regulations;
●
the timing and
costs associated with obtaining regulatory approval for our product
candidates;
●
the impact of
fluctuations in foreign exchange rates;
●
the impact of
legislative or regulatory healthcare reforms in the United
States;
●
our ability to
adapt to changes in global economic conditions; and
●
our ability to
remain listed on the NYSE American stock exchange.
Such
forward-looking statements involve risks, uncertainties and other
factors that could cause our actual results to be materially
different from historical results or from any results expressed or
implied by such forward-looking statements. Our future operating
results are subject to risks and uncertainties and are dependent
upon many factors, including, without limitation, the risks
identified in this report, in our Annual Report on Form 10-K for
the year ended June 30, 2017, and in our other Securities and
Exchange Commission (“SEC”) filings.
We
expect to incur losses in the future as a result of spending on our
planned development programs and results may fluctuate
significantly from quarter to quarter.
Palatin
Technologies® is a registered trademark of Palatin
Technologies, Inc.
2
|
PALATIN TECHNOLOGIES, INC
.
|
||
|
and
Subsidiary
|
||
|
|
||
|
(unaudited)
|
||
|
|
|
|
|
|
March
31,
2018
|
June
30,
2017
|
|
ASSETS
|
|
|
|
Current
assets:
|
|
|
|
Cash and cash
equivalents
|
$
25,736,158
|
$
40,200,324
|
|
Available-for-sale
investments
|
-
|
249,837
|
|
Accounts
receivable
|
-
|
15,116,822
|
|
Prepaid expenses
and other current assets
|
701,456
|
1,011,221
|
|
Total current
assets
|
26,437,614
|
56,578,204
|
|
|
|
|
|
Property and
equipment, net
|
165,080
|
198,153
|
|
Other
assets
|
556,915
|
56,916
|
|
Total
assets
|
$
27,159,609
|
$
56,833,273
|
|
|
|
|
|
LIABILITIES
AND STOCKHOLDERS’ EQUITY (DEFICIENCY)
|
|
|
|
Current
liabilities:
|
|
|
|
Accounts
payable
|
$
793,642
|
$
1,551,367
|
|
Accrued
expenses
|
5,894,877
|
10,521,098
|
|
Notes payable, net
of discount and debt issuance costs
|
6,921,032
|
7,824,935
|
|
Capital lease
obligations
|
-
|
14,324
|
|
Deferred
revenue
|
585,519
|
35,050,572
|
|
Total current
liabilities
|
14,195,070
|
54,962,296
|
|
|
|
|
|
Notes payable, net
of discount and debt issuance costs
|
1,328,973
|
6,281,660
|
|
Deferred
revenue
|
500,000
|
-
|
|
Other non-current
liabilities
|
909,179
|
753,961
|
|
Total
liabilities
|
16,933,222
|
61,997,917
|
|
|
|
|
|
Stockholders’
equity (deficiency):
|
|
|
|
Preferred stock of
$0.01 par value – authorized 10,000,000 shares:
|
|
|
|
Series A
Convertible: issued and outstanding 4,030 shares as of March 31,
2018 and June 30, 2017
|
40
|
40
|
|
Common stock of
$0.01 par value – authorized 300,000,000 shares:
|
|
|
|
issued and
outstanding 195,477,332 shares as of March 31, 2018 and 160,515,361
shares as of June 30, 2017, respectively
|
1,954,773
|
1,605,153
|
|
Additional paid-in
capital
|
352,125,554
|
349,979,373
|
|
Accumulated other
comprehensive loss
|
-
|
(590
)
|
|
Accumulated
deficit
|
(343,853,980
)
|
(356,748,620
)
|
|
Total
stockholders’ equity (deficiency)
|
10,226,387
|
(5,164,644
)
|
|
Total liabilities
and stockholders’ equity (deficiency)
|
$
27,159,609
|
$
56,833,273
|
|
|
|
|
The
accompanying notes are an integral part of these consolidated
financial statements.
3
|
PALATIN
TECHNOLOGIES, INC.
|
||||
|
and
Subsidiary
|
||||
|
|
||||
|
(unaudited)
|
||||
|
|
|
|
|
|
|
|
Three Months
Ended March 31,
|
Nine Months
Ended March 31,
|
||
|
|
2018
|
2017
|
2018
|
2017
|
|
|
|
|
|
|
|
REVENUES:
|
|
|
|
|
|
License and
contract revenue
|
$
8,962,709
|
$
10,823,748
|
$
46,516,370
|
$
10,823,748
|
|
|
|
|
|
|
|
OPERATING
EXPENSES:
|
|
|
|
|
|
Research and
development
|
7,068,849
|
9,062,316
|
27,277,830
|
28,422,975
|
|
General and
administrative
|
2,411,302
|
4,773,696
|
5,581,066
|
7,289,342
|
|
Total operating
expenses
|
9,480,151
|
13,836,012
|
32,858,896
|
35,712,317
|
|
|
|
|
|
|
|
(Loss) Income from
operations
|
(517,442
)
|
(3,012,264
)
|
13,657,474
|
(24,888,569
)
|
|
|
|
|
|
|
|
OTHER INCOME
(EXPENSE):
|
|
|
|
|
|
Interest
income
|
86,496
|
6,304
|
219,578
|
18,940
|
|
Interest
expense
|
(326,983
)
|
(558,702
)
|
(1,175,023
)
|
(1,777,222
)
|
|
Total other
expense, net
|
(240,487
)
|
(552,398
)
|
(955,445
)
|
(1,758,282
)
|
|
|
|
|
|
|
|
(Loss) Income
before income taxes
|
(757,929
)
|
(3,564,662
)
|
12,702,029
|
(26,646,851
)
|
|
Income tax benefit,
net
|
18,746
|
-
|
192,611
|
-
|
|
|
|
|
|
|
|
NET (LOSS)
INCOME
|
$
(739,183
)
|
$
(3,564,662
)
|
$
12,894,640
|
$
(26,646,851
)
|
|
|
|
|
|
|
|
Basic net (loss)
income per common share
|
$
(0.00
)
|
$
(0.02
)
|
$
0.07
|
$
(0.15
)
|
|
|
|
|
|
|
|
Diluted net (loss)
income per common share
|
$
(0.00
)
|
$
(0.02
)
|
$
0.06
|
$
(0.15
)
|
|
|
|
|
|
|
|
Weighted average
number of common shares outstanding used in computing basic net
(loss) income per common share
|
197,485,758
|
196,580,519
|
197,277,286
|
179,841,133
|
|
|
|
|
|
|
|
Weighted average
number of common shares outstanding used in computing diluted net
(loss) income per common share
|
197,485,758
|
196,580,519
|
202,712,963
|
179,841,133
|
The
accompanying notes are an integral part of these consolidated
financial statements.
4
|
PALATIN
TECHNOLOGIES, INC.
|
||||
|
and
Subsidiary
|
||||
|
Consolidated
Statements of Comprehensive (Loss) Income
|
||||
|
(unaudited)
|
||||
|
|
|
|
|
|
|
|
|
|
|
|
|
|
Three Months
Ended March 31,
|
Nine Months
Ended March 31,
|
||
|
|
2018
|
2017
|
2018
|
2017
|
|
|
|
|
|
|
|
Net (loss)
income
|
$
(739,183
)
|
$
(3,564,662
)
|
$
12,894,640
|
$
(26,646,851
)
|
|
|
|
|
|
|
|
Other comprehensive
(loss) income :
|
|
|
|
|
|
Unrealized gain on
available-for-sale investments
|
-
|
587
|
590
|
525
|
|
|
|
|
|
|
|
Total comprehensive
(loss) income
|
$
(739,183
)
|
$
(3,564,075
)
|
$
12,895,230
|
$
(26,646,326
)
|
The
accompanying notes are an integral part of these consolidated
financial statements.
5
|
PALATIN
TECHNOLOGIES, INC.
|
||
|
and
Subsidiary
|
||
|
|
||
|
(unaudited)
|
||
|
|
|
|
|
|
Nine Months
Ended March 31,
|
|
|
|
2018
|
2017
|
|
CASH FLOWS FROM
OPERATING ACTIVITIES:
|
|
|
|
Net
income (loss)
|
$
12,894,640
|
$
(26,646,851
)
|
|
Adjustments
to reconcile net income (loss) to net cash
|
|
|
|
(used
in) provided by operating activities:
|
|
|
|
Depreciation and
amortization
|
42,573
|
22,891
|
|
Non-cash interest
expense
|
143,837
|
234,056
|
|
Stock-based
compensation
|
2,370,972
|
1,404,721
|
|
Deferred income tax
benefit
|
(500,000
)
|
-
|
|
Changes in
operating assets and liabilities:
|
|
|
|
Accounts
receivable
|
15,116,822
|
(4,657,577
)
|
|
Prepaid expenses
and other assets
|
309,766
|
256,026
|
|
Accounts
payable
|
(757,725
)
|
529,254
|
|
Accrued
expenses
|
(4,601,842
)
|
546,474
|
|
Deferred
revenue
|
(33,965,053
)
|
53,833,828
|
|
Other non-current
liabilities
|
155,218
|
245,701
|
|
Net cash (used in)
provided by operating activities
|
(8,790,792
)
|
25,768,523
|
|
|
|
|
|
CASH FLOWS FROM
INVESTING ACTIVITIES:
|
|
|
|
Proceeds from
matured investments
|
250,000
|
450,000
|
|
Purchases of
property and equipment
|
(9,500
)
|
-
|
|
Net cash provided
by investing activities
|
240,500
|
450,000
|
|
|
|
|
|
CASH FLOWS FROM
FINANCING ACTIVITIES:
|
|
|
|
Payments on capital
lease obligations
|
(14,324
)
|
(20,418
)
|
|
Payment of
withholding taxes related to restricted
|
|
|
|
stock
units
|
(45,165
)
|
(222
)
|
|
Payment on notes
payable obligations
|
(6,000,000
)
|
(3,666,666
)
|
|
Proceeds from the
exercise of options and warrants
|
145,615
|
114,358
|
|
Proceeds from the
sale of common stock and
|
|
|
|
warrants, net of
costs
|
-
|
23,856,972
|
|
Net cash (used in)
provided by financing activities
|
(5,913,874
)
|
20,284,024
|
|
|
|
|
|
NET (DECREASE)
INCREASE IN CASH AND CASH EQUIVALENTS
|
(14,464,166
)
|
46,502,547
|
|
|
|
|
|
CASH AND CASH
EQUIVALENTS, beginning of period
|
40,200,324
|
8,002,668
|
|
|
|
|
|
CASH AND CASH
EQUIVALENTS, end of period
|
$
25,736,158
|
$
54,505,215
|
|
|
|
|
|
SUPPLEMENTAL CASH
FLOW INFORMATION:
|
|
|
|
Cash paid for
interest
|
$
876,394
|
$
1,299,731
|
|
Unrealized gain on
available-for-sale investments
|
590
|
525
|
The
accompanying notes are an integral part of these consolidated
financial statements.
6
PALATIN TECHNOLOGIES, INC.
and Subsidiary
Notes to Consolidated Financial Statements
(unaudited)
Nature of Business
– Palatin Technologies, Inc.
(“Palatin” or the “Company”) is a
biopharmaceutical company developing targeted, receptor-specific
peptide therapeutics for the treatment of diseases with significant
unmet medical need and commercial potential. Palatin’s
programs are based on molecules that modulate the activity of the
melanocortin and natriuretic peptide receptor systems. The
melanocortin system is involved in a large and diverse number of
physiologic functions, and therapeutic agents modulating this
system may have the potential to treat a variety of conditions and
diseases, including sexual dysfunction and inflammation-related
diseases. The natriuretic peptide receptor system has numerous
cardiovascular functions, and therapeutic agents modulating this
system may be useful in treatment of heart failure and other
cardiovascular diseases.
The
Company’s primary product in development is bremelanotide for
the treatment of hypoactive sexual desire disorder
(“HSDD”), which is a type of female sexual dysfunction
(“FSD”). The Company also has drug candidates or
development programs for cardiovascular diseases, including heart
failure and fibrosis, and inflammatory diseases, including
inflammatory bowel disease and ocular indications.
Key
elements of the Company’s business strategy include using its
technology and expertise to develop and commercialize therapeutic
products; entering into alliances and partnerships with
pharmaceutical companies to facilitate the development,
manufacture, marketing, sale and distribution of product candidates
that the Company is developing; and partially funding its product
candidate development programs with the cash flow generated from
its relationships with third parties.
Business Risk and Liquidity –
Since inception, the
Company has incurred negative cash flows from operations, and has
expended, and expects to continue to expend, substantial funds to
complete its planned product development efforts. As shown in the
accompanying consolidated financial statements, the Company had an
accumulated deficit as of March 31, 2018 of $343,853,980 and had
net losses and income for the three and nine months ended March 31,
2018 of $739,183 and $12,894,640, respectively. The Company
anticipates incurring losses in the future as a result of spending
on its development programs and will require substantial additional
financing to continue to fund its planned developmental activities.
To achieve sustained profitability, if ever, the Company, alone or
with others, must successfully develop and commercialize its
technologies and proposed products, conduct successful preclinical
studies and clinical trials, obtain required regulatory approvals
and successfully manufacture and market such technologies and
proposed products. The time required to reach sustained
profitability is highly uncertain, and the Company may never be
able to achieve profitability on a sustained basis, if at
all.
As of
March 31, 2018, the Company’s cash and cash equivalents were
$25,736,158 and current liabilities were $13,609,551, net of
deferred revenue of $585,519. The Company intends to utilize
existing capital resources for general corporate purposes and
working capital, and preclinical and clinical development of the
Company’s other product candidates and programs, including
natriuretic peptide receptor and melanocortin receptor
programs.
Management
believes that the Company’s existing capital resources,
together with proceeds received from sales of common stock in the
Company’s “at-the-market” program (if any) (Note
14), will be adequate to fund the Company’s planned
operations through at least June 30, 2019. The Company will need
additional funding to complete required clinical trials for its
other product candidates and, assuming those clinical trials are
successful, as to which there can be no assurance, to complete
submission of required applications to the U.S. Food and Drug
Administration (“FDA”). If the Company is unable to
obtain approval or otherwise advance in the FDA approval process,
the Company’s ability to sustain its operations would be
materially adversely affected.
The
Company may seek the additional capital necessary to fund its
operations through public or private equity offerings,
collaboration agreements, debt financings or licensing
arrangements. Additional capital that is required by the Company
may not be available on reasonable terms, or at all.
Concentrations –
Concentrations in the Company’s
assets and operations subject it to certain related risks.
Financial instruments that subject the Company to concentrations of
credit risk primarily consist of cash and cash equivalents,
accounts receivable and investments. The Company’s cash and
cash equivalents are primarily invested in one money market account
sponsored by a large financial institution. For the three and nine
months ended March 31, 2018, the Company reported $8,962,709 and
$41,516,370, respectively, in license and contract revenue related
to a license agreement with AMAG for bremelanotide for North
America (“License Agreement with AMAG”) (Note 5). In
addition, for the nine months ended March 31, 2018, the Company
reported $5,000,000 in license revenue related to a license
agreement with Fosun for bremelanotide for China and certain other
Asian territories (“License Agreement with Fosun”)
(Note 6). For the three and nine months ended March 31, 2017, the
Company reported $10,823,748 in contract revenue related to the
License Agreement with AMAG.
7
PALATIN TECHNOLOGIES, INC.
and Subsidiary
Notes to Consolidated Financial Statements
(unaudited)
(2)
BASIS
OF PRESENTATION:
The
accompanying unaudited consolidated financial statements have been
prepared in accordance with accounting principles generally
accepted in the United States of America (“U.S. GAAP”)
for interim financial information and with the instructions to Form
10-Q. Accordingly, they do not include all of the information and
footnote disclosures required to be presented for complete
financial statements. In the opinion of management, these
consolidated financial statements contain all adjustments
(consisting of normal recurring adjustments) considered necessary
for fair presentation. The results of operations for the three and
nine months ended March 31, 2018 may not necessarily be indicative
of the results of operations expected for the full
year.
The
accompanying unaudited consolidated financial statements should be
read in conjunction with the audited consolidated financial
statements and notes thereto included in the Company’s Annual
Report on Form 10-K for the year ended June 30, 2017, filed with
the SEC, which includes consolidated financial statements as of
June 30, 2017 and 2016 and for each of the fiscal years in the
three-year period ended June 30, 2017.
(3)
SUMMARY
OF SIGNIFICANT ACCOUNTING POLICIES:
Principles of Consolidation
– The consolidated
financial statements include the accounts of Palatin and its
wholly-owned inactive subsidiary. All intercompany accounts and
transactions have been eliminated in consolidation.
Use of Estimates
– The preparation of consolidated
financial statements in conformity with U.S. GAAP requires
management to make estimates and assumptions that affect the
reported amount of assets and liabilities and disclosure of
contingent assets and liabilities at the date of the consolidated
financial statements and the reported amounts of revenues and
expenses during the reporting period. Actual results could differ
from those estimates.
Cash and Cash Equivalents
– Cash and cash equivalents
include cash on hand, cash in banks and all highly liquid
investments with a purchased maturity of less than three months.
Cash equivalents consist of $25,461,335 and $40,019,336 in a money
market account as of March 31,2018 and June 30, 2017,
respectively.
Investments
– The Company determines the appropriate
classification of its investments in debt and equity securities at
the time of purchase and reevaluates such determinations at each
balance sheet date. Debt securities are classified as
held-to-maturity when the Company has the intent and ability to
hold the securities to maturity. Debt securities for which the
Company does not have the intent or ability to hold to maturity are
classified as available-for-sale. Held-to-maturity securities are
recorded as either short-term or long-term on the balance sheet,
based on the contractual maturity date and are stated at amortized
cost. Marketable securities that are bought and held principally
for the purpose of selling them in the near term are classified as
trading securities and are reported at fair value, with unrealized
gains and losses recognized in earnings. Debt and marketable equity
securities not classified as held-to-maturity or as trading are
classified as available-for-sale and are carried at fair market
value, with the unrealized gains and losses, net of tax, included
in the determination of other comprehensive (loss)
income.
The
fair value of substantially all securities is determined by quoted
market prices. The estimated fair value of securities for which
there are no quoted market prices is based on similar types of
securities that are traded in the market.
Fair Value of Financial Instruments
– The
Company’s financial instruments consist primarily of cash
equivalents, accounts receivable, accounts payable and notes
payable. Management believes that the carrying values of cash
equivalents, accounts receivable, available-for-sale investments
and accounts payable are representative of their respective fair
values based on the short-term nature of these instruments.
Management believes that the carrying amount of its notes payable
approximates fair value based on the terms of the
notes.
Credit Risk
– Financial instruments which potentially
subject the Company to concentrations of credit risk consist
principally of cash and cash equivalents. Total cash and cash
equivalent balances have exceeded balances insured by the Federal
Depository Insurance Company.
Property and Equipment
– Property and equipment
consists of office and laboratory equipment, office furniture and
leasehold improvements and includes assets acquired under capital
leases. Property and equipment are recorded at cost. Depreciation
is recognized using the straight-line method over the estimated
useful lives of the related assets, generally five years for
laboratory and computer equipment, seven years for office furniture
and equipment and the lesser of the term of the lease or the useful
life for leasehold improvements. Amortization of assets acquired
under capital leases is included in depreciation expense.
Maintenance and repairs are expensed as incurred while expenditures
that extend the useful life of an asset are capitalized.
Accumulated depreciation and amortization was $2,324,562 and
$2,281,989 as of March 31, 2018 and June 30, 2017,
respectively.
8
PALATIN TECHNOLOGIES, INC.
and Subsidiary
Notes to Consolidated Financial Statements
(unaudited)
Impairment of Long-Lived Assets
– The Company reviews
its long-lived assets for impairment whenever events or changes in
circumstances indicate that the carrying amount of the assets may
not be fully recoverable. To determine recoverability of a
long-lived asset, management evaluates whether the estimated future
undiscounted net cash flows from the asset are less than its
carrying amount. If impairment is indicated, the long-lived asset
would be written down to fair value. Fair value is determined by an
evaluation of available price information at which assets could be
bought or sold, including quoted market prices, if available, or
the present value of the estimated future cash flows based on
reasonable and supportable assumptions.
Revenue Recognition
– The Company has generated
revenue solely through license and collaboration agreements. The
Company recognizes revenue in accordance with Financial Accounting
Standards Board (“FASB”) Accounting Standards
Codification (“ASC”) Topic 605-25,
Revenue Recognition for Arrangements with
Multiple Elements
, which addresses the determination of
whether an arrangement involving multiple deliverables contains
more than one unit of accounting. A delivered item within an
arrangement is considered a separate unit of accounting only if
both of the following criteria are met:
●
the delivered item
has value to the customer on a stand-alone basis; and
●
if the arrangement
includes a general right of return relative to the delivered item,
delivery or performance of the undelivered item is considered
probable and substantially in control of the vendor.
Under
FASB ASC Topic 605-25, if both of the criteria above are not met,
then separate accounting for the individual deliverables is not
appropriate.
The
Company has determined that it is appropriate to recognize the
consideration received under its License Agreement with AMAG as
revenue using the input-based proportional method during the period
of the Palatin Development Obligation as defined in the License
Agreement with AMAG. Refer to Note 5 for additional information on
this topic.
Under
its License Agreement with Fosun (Note 6), the Company received
consideration in the form of an upfront license fee payment and
determined that it was appropriate to recognize such consideration
as revenue in the first quarter of 2018, which was the quarter in
which the license was granted, since the license has stand-alone
value and the upfront payment received by the Company is
non-refundable.
Under
its License Agreement with Kwangdong (Note 7), the Company received
consideration in the form of an upfront license fee payment and has
currently determined that it is appropriate to record such
consideration as non-current deferred revenue because the upfront
payment received by the Company is subject to certain refund
provisions.
Revenue
resulting from the achievement of development milestones is
recorded in accordance with the accounting guidance for the
milestone method of revenue recognition.
Amounts
received prior to satisfying the revenue recognition criteria are
recorded as deferred revenue on the Company’s consolidated
balance sheet. Amounts expected to be recognized as revenue in the
next 12 months following the balance sheet date are classified as
current liabilities.
Research and Development Costs
– The costs of research
and development activities are charged to expense as incurred,
including the cost of equipment for which there is no alternative
future use.
Accrued Expenses –
Third parties perform a significant
portion of the Company’s development activities. The Company
reviews the activities performed under all contracts each quarter
and accrues expenses and the amount of any reimbursement to be
received from collaborators based upon the estimated amount of work
completed. Estimating the value or stage of completion of certain
services requires judgment based on available information. If the
Company does not identify services performed but not billed by the
service-provider, or if the Company underestimates or overestimates
the value of services performed as of a given date, reported
expenses will be understated or overstated.
Stock-Based Compensation –
The Company charges to
expense the fair value of stock options and other equity awards
granted. The Company determines the value of stock options
utilizing the Black-Scholes option pricing model. Compensation
costs for share-based awards with pro-rata vesting are determined
using the quoted market price of the Company’s common stock
on the date of grant and allocated to periods on a straight-line
basis, while awards containing a market condition and performance
conditions are valued using multifactor Monte Carlo
simulations.
9
PALATIN TECHNOLOGIES, INC.
and Subsidiary
Notes to Consolidated Financial Statements
(unaudited)
Income Taxes
– The Company and its subsidiary file
consolidated federal and separate-company state income tax returns.
Income taxes are accounted for under the asset and liability
method. Deferred tax assets and liabilities are recognized for the
future tax consequences attributable to differences between the
financial statement carrying amounts of assets and liabilities and
their respective tax basis and operating loss and tax credit
carryforwards. Deferred tax assets and liabilities are measured
using enacted tax rates expected to apply to taxable income in the
years in which those temporary differences or operating loss and
tax credit carryforwards are expected to be recovered or settled.
The effect on deferred tax assets and liabilities of a change in
tax rates is recognized in the period that includes the enactment
date. The Company has recorded a valuation allowance against its
deferred tax assets based on the history of losses
incurred.
Pursuant
to the License Agreement with Fosun (Note 6) and the License
Agreement with Kwangdong (Note 7), $500,000 and $82,500,
respectively, was withheld in accordance with tax withholding
requirements in China and the Republic of Korea, respectively, and
will be recorded as an expense during the fiscal year ending June
30, 2018. For the three and nine months ended March 31, 2018, the
Company recorded an income tax benefit of $18,746 and an income tax
expense of $307,389, respectively, related to these transactions
and the remaining balance of $275,111 was included in prepaid
expenses and other current assets at March 31, 2018. Any potential
credit to be received by the Company on its United States tax
returns is currently offset by the Company’s valuation
allowance.
On
December 22, 2017, the U.S. government enacted wide-ranging tax
legislation, the Tax Cuts and Jobs Act (the "2017 Tax Act"). The
2017 Tax Act significantly revises U.S. tax law by, among other
provisions, (a) lowering the applicable U.S. federal statutory
corporate income tax rate from 35% to 21%, (b) eliminating or
reducing certain income tax deductions, such as deductions for
interest expense, executive compensation expenses and certain
employee expenses, and (c) repealing the federal alternative
minimum tax (“AMT”) and providing for the refund of
existing AMT credits.
As a
result of the 2017 Tax Act, during the quarter ended December 31,
2017, the Company recorded a tax benefit of $500,000 related to the
release of a valuation allowance against an AMT credit;
accordingly, $500,000 is included in Other long-term assets at
March 31, 2018. In addition, as a result of the enactment of the
new corporate income tax rate, the Company remeasured certain
deferred tax assets and liabilities based on the rates at which
they are expected to reverse and with the exception of the AMT
credit, the Company continues to maintain a full valuation
allowance against its net deferred tax assets.
The June 30,
2017 tax return was filed during the quarter ended March 31, 2018.
As a result, the Company did not incur AMT liability. The Company
has an income tax receivable of $500,000 from previously paying tax
that can be refunded in the future.
Net (Loss) Income per Common Share
– Basic and diluted
earnings per common share (“EPS”) are calculated in
accordance with the provisions of FASB ASC Topic 260,
“
Earnings per
Share
,” which includes guidance pertaining to the
warrants issued in connection with the July 3, 2012, December 23,
2014, and July 2, 2015 private placement offerings and the August
4, 2016 underwritten offering, that were exercisable for nominal
consideration and, therefore, to the extent not yet exercised are
considered in the computation of basic and diluted net loss per
common share. As of March 31, 2018, all warrants exercisable for
nominal value have been converted into common stock.
The
following table is a reconciliation of net (loss) income and the
shares used in calculating basic and diluted net (loss) income per
common share for the three and nine months ended March 31, 2018 and
2017:
|
|
Three Months
Ended March 31,
|
Nine Months
Ended March 31,
|
||
|
|
2018
|
2017
|
2018
|
2017
|
|
|
|
|
|
|
|
Net (loss)
income
|
$
(739,183
)
|
$
(3,564,662
)
|
$
12,894,640
|
$
(26,646,851
)
|
|
|
|
|
|
|
|
Denominator:
|
|
|
|
|
|
Weighted average
common shares outstanding - Basic
|
197,485,758
|
196,580,519
|
197,277,286
|
179,841,133
|
|
|
|
|
|
|
|
Effect of dilutive
shares:
|
|
|
|
|
|
Common stock
equivalents arising from stock options,
|
|
|
|
|
|
warrants and
conversion of preferred stock
|
-
|
-
|
3,610,611
|
-
|
|
Restricted stock
units
|
-
|
-
|
1,825,066
|
-
|
|
Weighted average
common shares outstanding - Diluted
|
197,485,758
|
196,580,519
|
202,712,963
|
179,841,133
|
|
|
|
|
|
|
|
Net (loss) income
per common share:
|
|
|
|
|
|
Basic
|
$
(0.00
)
|
$
(0.02
)
|
$
0.07
|
$
(0.15
)
|
|
Diluted
|
$
(0.00
)
|
$
(0.02
)
|
$
0.06
|
$
(0.15
)
|
10
PALATIN TECHNOLOGIES, INC.
and Subsidiary
Notes to Consolidated Financial Statements
(unaudited)
As of
March 31, 2018 and 2017, common shares issuable upon conversion of
Series A Convertible Preferred Stock, the exercise of outstanding
options and warrants (excluding the Series A 2012, Series B 2012,
Series C 2014, Series E 2015 and Series I 2016 warrants issued in
connection with the July 3, 2012, December 23, 2014, and July 2,
2015 private placement offerings and the August 4, 2016
underwritten offering as such warrants, to the extent not yet
exercised, are already included in the weighted average number of
common shares outstanding used in computing basic net (loss) income
per common share since they are exercisable for nominal
consideration), and the vesting of restricted stock units amounted
to an aggregate of 46,773,540 and 36,222,569 shares, respectively,
and are excluded from the weighted average number of common shares
outstanding used in computing basic net (loss) income per common
share. For the nine months ended March 31, 2018, an additional
5,435,677 common shares are included in the computation of diluted
EPS using the treasury stock and if-converted methods. However, for
the three months ended March 31, 2018 and the three and nine months
ended March 31, 2017, no additional common shares were added in the
computation of diluted EPS because to do so would have been
anti-dilutive.
(4)
NEW
AND RECENTLY ADOPTED ACCOUNTING PRONOUNCEMENTS:
In May
2017, the FASB issued ASU No. 2017-09,
Compensation-Stock Compensation (Topic 718):
Scope of Modification Accounting
, which clarifies when to
account for a change to the terms or conditions of a share-based
payment award as a modification. Under the new guidance,
modification accounting is required only if the fair value, the
vesting conditions, or the classification of the award (as equity
or liability) changes as a result of the change in terms or
conditions. It is effective prospectively for the annual period
ending June 30, 2019 and interim periods within that annual period.
Early adoption is permitted. The Company is currently evaluating
the effect that ASU No. 2017-09 will have on its consolidated
financial statements and related disclosures.
In June
2016, the FASB issued ASU No. 2016-13,
Financial Instruments Credit Losses:
Measurement of Credit Losses on Financial Instruments,
which
requires measurement and recognition of expected credit losses for
financial assets held at the reporting date based on historical
experience, current conditions, and reasonable and supportable
forecasts. This is different from the current guidance as this will
require immediate recognition of estimated credit losses expected
to occur over the remaining life of many financial assets. The new
guidance will be effective for the Company on July 1, 2020. Early
adoption will be available on July 1, 2019. The Company is
currently evaluating the effect that ASU No. 2016-13 will have on
its consolidated financial statements and related
disclosures.
In
March 2016, the FASB issued ASU No. 2016-09,
Compensation – Improvements to Employee
Share-Based Payment Accounting
, which amends the current
guidance related to stock compensation. The updated guidance
changes how companies account for certain aspects of share-based
payment awards to employees, including the accounting for income
taxes, forfeitures, and statutory tax withholding requirements, as
well as classification in the statement of cash flows.
Under this guidance, on a prospective basis,
companies will no longer be able to record excess tax benefits and
certain tax deficiencies as additional paid-in capital. Instead,
companies will record all excess tax benefits and tax deficiencies
as income tax expense or benefit in the income statement. In
addition, the guidance eliminates the requirement that excess tax
benefits be realized before companies can recognize them. The ASU
requires a cumulative-effect adjustment for previously unrecognized
excess tax benefits in opening retained earnings in the period of
adoption. Effective July 1, 2017, the Company adopted this updated
guidance and elected to recognize forfeitures when they occur using
a modified retrospective approach. The adoption of ASU No. 2016-09
did not have a material impact on the Company’s consolidated
financial statements.
In
February 2016, the FASB issued ASU No. 2016-02,
Leases
, related to the recognition of
lease assets and lease liabilities. The new guidance requires
lessees to recognize almost all leases on their balance sheet as a
right-of-use asset and a lease liability, other than leases that
meet the definition of a short-term lease and requires expanded
disclosures about leasing arrangements. The recognition,
measurement, and presentation of expenses and cash flows arising
from a lease have not significantly changed from the current
guidance. Lessor accounting is similar to the current guidance but
updated to align with certain changes to the lessee model and the
new revenue recognition standard. The new guidance is effective for
the Company on July 1, 2019, with early adoption permitted. The
Company is evaluating the impact that ASU No. 2016-02 will have on
its consolidated financial statements and related
disclosures.
In
January 2016, the FASB issued ASU No. 2016-01,
Financial Instruments: Recognition and
Measurement of Financial Assets and Financial Liabilities
.
The new guidance relates to the recognition and measurement of
financial assets and liabilities. The new guidance makes targeted
improvements to U.S. GAAP impacting equity investments (other than
those accounted for under the equity method or consolidated),
financial liabilities accounted for under the fair value election,
and presentation and disclosure requirements for financial
instruments, among other changes. The new guidance is effective for
the Company on July 1, 2018, with early adoption prohibited other
than for certain provisions. The Company is evaluating the impact
that ASU No. 2016-01 will have on its consolidated financial
statements and related disclosures.
11
PALATIN TECHNOLOGIES, INC.
and Subsidiary
Notes to Consolidated Financial Statements
(unaudited)
In November 2015, the FASB issued ASU No. 2015-17,
Income Taxes:
Balance Sheet Classification of Deferred Taxes,
which simplifies the balance sheet classification
of deferred taxes. The new guidance requires that deferred tax
liabilities and assets be classified as noncurrent in a classified
statement of financial position. The current requirement that
deferred tax liabilities and assets of a tax-paying component of an
entity be offset and presented as a single amount is not affected
by the new guidance. Effective July 1, 2017, the Company adopted
this updated guidance, which did not have a material impact on the
Company’s financial position or results of operations because
its net deferred tax assets were fully offset by a valuation
allowance based on the history of losses
incurred.
In May 2014, the FASB issued ASU No. 2014-09,
Revenue from Contracts with
Customers
, which requires an
entity to recognize the amount of revenue to which it expects to be
entitled for the transfer of promised goods or services to
customers. The ASU will replace most existing revenue recognition
guidance in U.S. GAAP when it becomes effective. In July 2015, the
FASB voted to defer the effective date of the new standard until
fiscal years beginning after December 15, 2017 with early
application permitted for fiscal years beginning after December 15,
2016. With the deferral, the new standard is effective for the
Company on July 1, 2018.
In addition, in April 2016 the FASB
issued ASU No. 2016-10,
Identifying Performance Obligations and
Licensing
, which addresses various issues associated with
identifying performance obligations, licensing of intellectual
property, royalty considerations, and other matters. ASU No.
2016-10 is effective in connection with ASU No. 2014-09.
The two permitted transition methods
under ASU 2014-09 are the full retrospective method, in which case
the new standard would be applied to each prior period presented
and the cumulative effect of applying the standard would be
recognized as of the earliest period reported, or the modified
retrospective method, in which case the cumulative effect of
applying the new standard would be recognized as of the date of
initial application. The Company is engaged in an ongoing review to
assess the impact to its financial statements, including an
assessment of the Company’s three key contracts, and is
evaluating the effect that these standards will have on its
consolidated financial statements and related
disclosures.
(5)
AGREEMENT
WITH AMAG:
On
January 8, 2017, the Company entered into the License Agreement
with AMAG. Under the terms of the License Agreement with AMAG, the
Company granted to AMAG (i) an exclusive license in all countries
of North America (the “Territory”), with the right to
grant sub-licenses, to research, develop and commercialize products
containing bremelanotide (each a “Product,” and
collectively, “Products”), (ii) a non-exclusive license
in the Territory, with the right to grant sub-licenses, to
manufacture Products, and (iii) a non-exclusive license in all
countries outside the Territory, with the right to grant
sub-licenses, to research, develop and manufacture (but not
commercialize) the Products.
Following
the satisfaction of certain conditions to closing, the License
Agreement with AMAG became effective on February 2, 2017. On that
date, AMAG paid the Company $60,000,000 as a one-time initial
payment. Pursuant to the terms of and subject to the conditions in
the License Agreement with AMAG, AMAG is required to reimburse the
Company up to an aggregate amount of $25,000,000 for reasonable,
documented, direct out-of-pocket expenses incurred by the Company
following February 2, 2017, in connection with the development and
regulatory activities necessary to file an NDA for bremelanotide
for HSDD in the United States related to Palatin’s
development obligations.
The
Company has determined there is no stand-alone value for the
license, and that the license and the reimbursable direct
out-of-pocket expenses, pursuant to the terms of the License
Agreement with AMAG, represent a combined unit of accounting which
totals $85,000,000. The Company is recognizing revenue of the
combined unit of accounting over the arrangement using the
input-based proportional method as the Company completes its
development obligations. For the three and nine months ended March
31, 2018, the Company recognized $8,962,709 and $41,516,370,
respectively, as license and contract revenue related to this
transaction. As of March 31, 2018, and June 30, 2017, there was
$585,519 and $35,050,572, respectively, of current deferred revenue
on the consolidated balance sheet related to this
transaction.
In
addition, pursuant to the terms of and subject to the conditions in
the License Agreement with AMAG, the Company is eligible to receive
from AMAG: (i) up to $80,000,000 in specified regulatory
payments upon achievement of certain regulatory milestones, and
(ii) up to $300,000,000 in sales milestone payments based on
achievement of annual net sales amounts for all Products in the
Territory.
12
PALATIN TECHNOLOGIES, INC.
and Subsidiary
Notes to Consolidated Financial Statements
(unaudited)
AMAG is
also obligated to pay the Company tiered royalties on annual net
sales of Products, on a product-by-product basis, in the Territory
ranging from the high single-digits to the low double-digits. The
royalties will expire on a product-by-product and
country-by-country basis until the latest to occur of (i) the
earliest date on which there are no valid claims of the
Company’s patent rights covering such Product in such
country, (ii) the expiration of the regulatory exclusivity period
for such Product in such country and (iii) ten years following the
first commercial sale of such Product in such country. Such
royalties are subject to reductions in the event that:
(a) AMAG must license additional third party intellectual
property in order to develop, manufacture or commercialize a
Product, or (b) generic competition occurs with respect to a
Product in a given country, subject to an aggregate cap on such
deductions of royalties otherwise payable to the Company. After the
expiration of the applicable royalties for any Product in a given
country, the license for such Product in such country will become a
fully paid-up, royalty-free, perpetual and irrevocable
license.
The
Company engaged Greenhill & Co. LLC (“Greenhill”)
as the Company’s sole financial advisor in connection with a
potential transaction with respect to bremelanotide. Under the
engagement agreement with Greenhill, the Company was obligated to
pay Greenhill a fee equal to 2% of all proceeds and consideration
paid to the Company by AMAG in connection with the License
Agreement with AMAG, subject to a minimum fee of $2,500,000. The
minimum fee of $2,500,000, less credit of $50,000 for an advisory
fee previously paid by the Company, was paid to Greenhill upon the
closing of the licensing transaction. This amount will be credited
toward amounts that become due to Greenhill in the future, provided
that the aggregate fee payable to Greenhill will not be less than
2% of all proceeds and consideration paid to the Company by AMAG in
connection with the License Agreement with AMAG. The Company will
pay Greenhill an aggregate total of 2% of all proceeds and
consideration paid to the Company by AMAG in connection with the
License Agreement with AMAG, including future milestone and royalty
payments, after crediting the $2,500,000 that was paid to Greenhill
upon entering into the License Agreement with AMAG. The Company
also reimbursed Greenhill $7,263 for certain expenses incurred in
connection with its advisory services.
Pursuant
to the License Agreement with AMAG, the Company has assigned to
AMAG the Company’s manufacturing and supply agreements with
Catalent Belgium S.A. to perform fill, finish and packaging of
bremelanotide.
(6)
AGREEMENT
WITH FOSUN:
On
September 6, 2017, the Company entered into the License Agreement
with Fosun for exclusive rights to commercialize bremelanotide in
the territories of the People's Republic of China, Taiwan, Hong
Kong S.A.R. and Macau S.A.R.
Under
the terms of the agreement, the Company received $4,500,000 in
October 2017, which consisted of an upfront payment of $5,000,000
less $500,000 that was withheld in accordance with tax withholding
requirements in China and will be recorded as an expense during the
fiscal year ending June 30, 2018. For the three and nine months
ended March 31, 2018, the Company recorded an income tax benefit of
$15,765 and an income tax expense of $264,202, respectively,
utilizing an estimated effective annual income tax rate applied to
(loss) income for the three and nine months ended March 31, 2018
and the remaining balance of $235,798 was included in prepaid
expenses and other current assets at March 31, 2018. The Company
will receive a $7,500,000 milestone payment when regulatory
approval in China is obtained, provided that a commercial supply
agreement for bremelanotide has been entered into. Palatin has the
potential to receive up to $92,500,000 in additional sales related
milestone payments and high single-digit to low double-digit
royalties on net sales in the licensed territory. All development,
regulatory, sales, marketing, and commercial activities and
associated costs in the licensed territory will be the sole
responsibility of Fosun.
(7)
AGREEMENT
WITH KWANGDONG:
On
November 21, 2017, the Company entered into the License Agreement
with Kwangdong for exclusive rights to commercialize bremelanotide
in the Republic of Korea.
Under
the terms of the agreement, the Company received $417,500 in
December 2017, consisting of an upfront payment of $500,000, less
$82,500, which was withheld in accordance with tax withholding
requirements in Korea and will be recorded as an expense during the
fiscal year ending June 30, 2018. Based upon certain refund
provisions, the upfront payment has been recorded as non-current
deferred revenue at March 31, 2018. For the three and nine months
ended March 31, 2018, the Company recorded an income tax benefit of
$2,981 and an income tax expense of $43,187, respectively,
utilizing an estimated effective annual income tax rate applied to
(loss) income for the three and nine months ended March 31, 2018
and the remaining balance of $39,313 was included in prepaid
expenses and other current assets at March 31, 2018. The Company
will receive a $3,000,000 milestone payment based on the first
commercial sale in Korea. Palatin has the potential to receive up
to $37,500,000 in additional sales related milestone payments and
mid-single-digit to low double-digit royalties on net sales in the
licensed territory. All development, regulatory, sales, marketing,
and commercial activities and associated costs in the licensed
territory will be the sole responsibility of
Kwangdong.
13
PALATIN TECHNOLOGIES, INC.
and Subsidiary
Notes to Consolidated Financial Statements
(unaudited)
(8)
PREPAID EXPENSES AND OTHER CURRENT
ASSETS:
Prepaid
expenses and other current assets consist of the
following:
|
|
March 31,
2018
|
June 30,
2017
|
|
Clinical study
costs
|
$
232,508
|
$
657,069
|
|
Insurance
premiums
|
5,426
|
182,966
|
|
Foreign withholding
tax (Notes 6 & 7)
|
275,111
|
-
|
|
Other
|
188,411
|
171,186
|
|
|
$
701,456
|
$
1,011,221
|
(9)
INVESTMENTS:
The
following summarizes the carrying value of the Company’s
available-for-sale investments, which consist of corporate debt
securities:
|
|
March 31,
2018
|
June 30,
2017
|
|
Cost
|
$
-
|
$
262,023
|
|
Amortization of
premium
|
-
|
(11,596
)
|
|
Gross unrealized
loss
|
-
|
(590
)
|
|
Fair
value
|
$
-
|
$
249,837
|
(10)
FAIR
VALUE MEASUREMENTS:
The
fair value of cash equivalents and investments is classified using
a hierarchy prioritized based on inputs. Level 1 inputs are quoted
prices (unadjusted) in active markets for identical assets or
liabilities. Level 2 inputs are quoted prices for similar assets
and liabilities in active markets or inputs that are observable for
the asset or liability, either directly or indirectly through
market corroboration, for substantially the full term of the
financial instrument. Level 3 inputs are unobservable inputs based
on management’s own assumptions used to measure assets and
liabilities at fair value. A financial asset or liability’s
classification within the hierarchy is determined based on the
lowest level input that is significant to the fair value
measurement.
The
following table provides the assets carried at fair value measured
on a recurring basis:
|
|
Carrying
Value
|
Quoted prices
in active markets (Level 1)
|
Other
quoted/observable inputs (Level 2)
|
Significant
unobservable inputs (Level 3)
|
|
March 31,
2018:
|
|
|
|
|
|
Money market
account
|
$
25,461,335
|
$
25,461,335
|
$
-
|
$
-
|
|
June 30,
2017:
|
|
|
|
|
|
Money market
account
|
$
40,019,336
|
$
40,019,336
|
$
-
|
$
-
|
|
Corporate debt
securities
|
249,837
|
249,837
|
-
|
-
|
|
TOTAL
|
$
40,269,173
|
$
40,269,173
|
$
-
|
$
-
|
|
|
|
|
|
|
14
PALATIN TECHNOLOGIES, INC.
and Subsidiary
Notes to Consolidated Financial Statements
(unaudited)
(11)
ACCRUED EXPENSES:
Accrued
expenses consist of the following:
|
|
March 31,
2018
|
June 30,
2017
|
|
Clinical study
costs
|
$
4,428,593
|
$
9,138,827
|
|
Other research
related expenses
|
393,411
|
217,307
|
|
Professional
services
|
45,269
|
434,768
|
|
Other
|
1,027,604
|
730,196
|
|
|
$
5,894,877
|
$
10,521,098
|
(12)
NOTES PAYABLE:
Notes
payable consist of the following:
|
|
March 31,
2018
|
June 30,
2017
|
|
Notes payable under
venture loan
|
$
8,333,333
|
$
14,333,334
|
|
Unamortized related
debt discount
|
(53,558
)
|
(143,524
)
|
|
Unamortized debt
issuance costs
|
(29,770
)
|
(83,215
)
|
|
Notes
payable
|
8,250,005
|
14,106,595
|
|
|
|
|
|
Less: current
portion
|
6,921,032
|
7,824,935
|
|
|
|
|
|
Long-term
portion
|
$
1,328,973
|
$
6,281,660
|
On
December 23, 2014, the Company closed on a $10,000,000 venture loan
which was led by Horizon Technology Finance Corporation
(“Horizon”). The debt facility is a four year senior
secured term loan that bears interest at a floating coupon rate of
one-month LIBOR (floor of 0.50%) plus 8.50%, and provides for
interest-only payments for the first eighteen months followed by
monthly payments of principal of $333,333 plus accrued interest
through January 1, 2019. The lenders also received five-year
immediately exercisable Series D 2014 warrants to purchase 666,666
shares of common stock exercisable at an exercise price of $0.75
per share. The Company recorded a debt discount of $267,820 equal
to the fair value of these warrants at issuance, which is being
amortized to interest expense over the term of the related debt.
This debt discount is offset against the note payable balance and
included in additional paid-in capital on the Company’s
balance sheet at March 31,2018 and June 30, 2017. In addition, a
final incremental payment of $500,000 is due on January 1, 2019, or
upon early repayment of the loan. This final incremental payment is
being accreted to interest expense over the term of the related
debt. The Company incurred $209,367 of costs in connection with the
loan. These costs were capitalized as deferred financing costs and
are offset against the note payable balance. These debt issuance
costs are being amortized to interest expense over the term of the
related debt.
On July
2, 2015, the Company closed on a $10,000,000 venture loan led
by
Horizon. The debt
facility is a four-year senior secured term loan that bears
interest at a floating coupon rate of one-month LIBOR (floor of
0.50%) plus 8.50% and provides for interest-only payments for the
first eighteen months followed by monthly payments of principal of
$333,333 plus accrued interest through August 1, 2019. The lenders
also received five-year immediately exercisable Series G warrants
to purchase 549,450 shares of the Company’s common stock
exercisable at an exercise price of $0.91 per share. The Company
has recorded a debt discount of $305,196 equal to the fair value of
these warrants at issuance, which is being amortized to interest
expense over the term of the related debt. This debt discount is
offset against the note payable balance and is included in
additional paid-in capital on the Company’s balance sheet at
March 31, 2018 and June 30, 2017. In addition, a final incremental
payment of $500,000 is due on August 1, 2019, or upon early
repayment of the loan. This final incremental payment is being
accreted to interest expense over the term of the related debt. The
Company incurred $146,115 of costs in connection with the loan
agreement. These costs were capitalized as deferred financing costs
and are offset against the note payable balance. These debt
issuance costs are being amortized to interest expense over the
term of the related debt.
15
PALATIN TECHNOLOGIES, INC.
and Subsidiary
Notes to Consolidated Financial Statements
(unaudited)
The
Company’s obligations under the 2015 amended and restated
loan agreement, which includes both the 2014 venture loan and the
2015 venture loan, are secured by a first priority security
interest in substantially all of its assets other than its
intellectual property. The Company also has agreed to specified
limitations on pledging or otherwise encumbering its intellectual
property assets. The 2015 amended and restated loan agreement
include customary affirmative and restrictive covenants, but does
not include any covenants to attain or maintain specified financial
metrics. The loan agreement includes customary events of default,
including payment defaults, breaches of covenants, change of
control and a material adverse change default. Upon the occurrence
of an event of default and following any applicable cure periods, a
default interest rate of an additional 5% may be applied to the
outstanding loan balances, and the lenders may declare all
outstanding obligations immediately due and payable and take such
other actions as set forth in the loan agreement. As of March 31,
2018, the Company was in compliance with all of its loan
covenants.
(13)
STOCKHOLDERS’
EQUITY (DEFICIENCY):
Financing Transactions –
On December 6, 2016, the
Company closed on an underwritten public offering of units, with
each unit consisting of a share of common stock and a Series J
warrant to purchase 0.50 of a share of common stock. Gross proceeds
were $16,500,000, with net proceeds to the Company, after deducting
underwriting discounts and commissions and offering expenses, of
$15,386,075. The Company issued 25,384,616 shares of common stock
and Series J warrants to purchase 12,692,310 shares of common stock
at an initial exercise price of $0.80 per share, which warrants are
exercisable immediately upon issuance and expire on the fifth
anniversary of the date of issuance.
The Series J warrants are subject to
limitation on exercise if the holder and its affiliates would
beneficially own more than 9.99%, or 4.99% for certain holders, of
the total number of the Company’s shares of common stock
outstanding following such exercise.
On
August 4, 2016, the Company closed on an underwritten offering of
units, with each unit consisting of a share of common stock and a
Series H warrant to purchase 0.75 of a share of common stock.
Investors whose purchase of units in the offering would result in
them beneficially owning more than 9.99% of the Company’s
outstanding common stock following the completion of the offering
had the option to acquire units with Series I prefunded warrants
substituted for any common stock they would have otherwise
acquired. Gross proceeds were $9,225,000, with net proceeds to the
Company, after deducting offering expenses, of $8,470,897. The
Company issued 11,481,481 shares of common stock and ten-year
prefunded Series I warrants to purchase 2,218,045 shares of common
stock at an exercise price of $0.01, together with Series H
warrants to purchase 10,274,646 shares of common stock at an
exercise price of $0.70 per share.
The
Series I warrants were exercised during the fiscal year ended June
30, 2017. The Series H warrants are exercisable at an initial
exercise price of $0.70 per share, are exercisable commencing six
months following the date of issuance and expire on the fifth
anniversary of the date of issuance. The Series H warrants are
subject to a limitation on their exercise if the holder and its
affiliates would beneficially own more than 9.99% of the total
number of the Company’s shares of common stock outstanding
following such exercise.
On July
2, 2015, the Company closed on a private placement of Series E
warrants to purchase 21,917,808 shares of Palatin common stock and
Series F warrants to purchase 2,191,781 shares of the
Company’s common stock. Certain funds managed by QVT
Financial LP (“QVT”) invested $5,000,000 and another
accredited investment fund invested $15,000,000. The funds paid
$0.90 for each Series E warrant and $0.125 for each Series F
warrant, resulting in gross proceeds to the Company of $20,000,000,
with net proceeds, after deducting offering expenses, of
$19,834,278.
The
Series E warrants were exercisable immediately upon issuance at an
initial exercise price of $0.01 per share. As of December 31,
2017, all of the Series E warrants were exercised. The Series F
warrants are exercisable at an initial exercise price of $0.91 per
share, are exercisable immediately upon issuance and expire on the
fifth anniversary of the date of issuance. The Series F warrants
are subject to limitation on exercise if QVT and its affiliates
would beneficially own more than 9.99% (4.99% for the other
accredited investment fund holder) of the total number of the
Company’s shares of common stock outstanding following such
exercise.
During
the nine months ended March 31, 2018 and 2017, the Company issued
23,344,451 and 27,989,685 shares, respectively of common stock
pursuant to the cashless exercise provisions of warrants at an
exercise price of $0.01 per share, and during the nine months ended
March 31, 2018, the Company received $114,384 and issued 11,438,356
shares of common stock pursuant to the exercise of warrants at an
exercise price of $0.01 per share. As of March 31, 2018, all
warrants with an exercise price of $0.01 per share had been
exercised.
Stock Options
– In December 2017, the Company granted
1,200,000 options to its executive officers and 225,000 options to
its non-employee directors under the Company’s 2011 Stock
Incentive Plan. The fair value of these options is $691,171 and
$126,130, respectively. The Company is amortizing the fair value of
these options over a 48-month vesting period for its executive
officers and over a 36-month vesting period for its non-employee
directors. The Company recognized $53,709 and $71,613 of
stock-based compensation expense related to these options during
the three and nine months ended March 31, 2018.
16
PALATIN TECHNOLOGIES, INC.
and Subsidiary
Notes to Consolidated Financial Statements
(unaudited)
Also,
in December 2017, the Company granted 1,075,000 and 125,000
performance-based options to its executive officers and employees,
respectively, which vest during a performance period ending on
December 31, 2020, if and upon i) as to 100% of the target number
of shares upon achievement of a closing price for the
Company’s common stock equal to or greater than $1.50 per
share for 20 consecutive trading days, which is considered a market
condition; ii) as to thirty percent (30%) of the target number of
shares, upon the acceptance for filing by the FDA of an NDA for
bremelanotide for HSDD in premenopausal women during the
performance period, which is considered a performance condition;
iii) as to fifty percent (50%) of the target number of shares, upon
the approval by the FDA of an NDA for bremelanotide for HSDD in
premenopausal women during the performance period, which is also
considered a performance condition; iv) as to twenty percent (20%)
of the target number of shares, upon entry into a licensing
agreement during the performance period for the commercialization
of bremelanotide for FSD in at least two of the following
geographic areas (a) four or more countries in Europe, (b) Japan,
(c) two or more countries in Central and/or South America, (d) two
or more countries in Asia, excluding Japan and China, and (e)
Australia, which is also considered a performance condition. The
fair value of these options, as calculated under a multifactor
Monte Carlo simulation, is $602,760. The Company is amortizing the
fair value over the derived service period of 1.1 years. The
Company recognized $205,743 and $247,777 of stock-based
compensation expense related to these options during the three and
nine months ended March 31, 2018.
In
September 2017, the Company granted 54,000 options to a newly
appointed non-employee director under the Company’s 2011
Stock Incentive Plan. The Company is amortizing the fair value of
these options of $18,176 over a 48-month vesting period. The
Company recognized $1,136 and $2,651, respectively, of stock-based
compensation expense related to these options during the three and
nine months ended March 31, 2018.
In June
2017, the Company granted 1,797,000 options to its executive
officers, 780,000 options to its employees and 378,000 options to
its non-employee directors under the Company’s 2011 Stock
Incentive Plan. The Company is amortizing the fair value of these
options of $445,533, $194,689 and $89,220, respectively, over the
vesting period of the options. The Company recognized $62,096 and
$187,109, respectively, of stock-based compensation expense related
to these options during the three and nine months ended March 31,
2018.
In
September 2016, the Company granted 828,000 options to its
executive officers and 336,000 options to its employees under the
Company’s 2011 Stock Incentive Plan. The Company is
amortizing the fair value of the options vesting over a 48-month
period, consisting of 595,000 options granted to its executive
officers and all options granted to its employees, of $188,245 and
$106,303, respectively, over the vesting period. The Company
recognized $17,537 and $52,943, respectively, of stock-based
compensation expense related to these options during the three and
nine months ended March 31, 2018 and $16,426 and $38,210,
respectively, during the three and nine months ended March 31,
2017. The remaining 233,000 options granted to the Company’s
executive officers vested 12 months from the date of grant, and the
Company amortized the fair value of these options of $67,160 over
this vesting period. The Company recognized $11,193 of stock-based
compensation expense related to these options during the nine
months ended March 31, 2018 and $16,370 and $36,238, respectively,
during the three and nine months ended March 31, 2017.
Unless
otherwise stated, stock options granted to the Company’s
executive officers and employees vest over a 48-month period, while
stock options granted to its non-employee directors vest over a
12-month period.
During
the three and nine months ended March 31, 2018, the Company
received $31,231 and issued 56,400 shares of common stock pursuant
to the exercise of options.
Restricted Stock Units
– In December 2017, the Company
granted 1,200,000 restricted stock units to its executive officers,
225,000 restricted stock units to its non-employee directors and
545,000 restricted stock units to its employees under the
Company’s 2011 Stock Incentive Plan. The fair value of these
restricted stock units is $1,020,000, $191,250 and $463,250,
respectively. For executive officers and employees, the restricted
stock units vest 25% on the first, second, third and fourth
anniversary dates from the date of grant. For non-employee
directors, the restricted stock units vest 33 1/3% on the first,
second and third anniversary dates from the date of grant. The
Company recognized $222,350 and $269,290 of stock-based
compensation expense related to these restricted stock units during
the three and nine months ended March 31, 2018.
Also,
in December 2017, the Company granted 1,075,000 performance-based
restricted stock units to its executive officers and 670,000
performance-based restricted stock units to other employees which
vest during a performance period, ending on December 31, 2020, if
and upon i) as to 100% of the target number of shares upon
achievement of a closing price for the Company’s common stock
equal to or greater than $1.50 per share for 20 consecutive trading
days, which is considered a market condition; ii) as to thirty
percent (30%) of the target number of shares, upon the acceptance
for filing by the FDA of an NDA for bremelanotide for HSDD in
premenopausal women during the performance period, which is
considered a performance condition; iii) as to fifty percent (50%)
of the target number of shares, upon the approval by the FDA of an
NDA for bremelanotide for HSDD in premenopausal women during the
performance period, which is also considered a performance
condition; iv) as to twenty percent (20%) of the target number of
shares, upon entry into a licensing agreement during the
performance period for the commercialization of bremelanotide for
FSD in at least two of the following geographic areas (a) four or
more countries in Europe, (b) Japan, (c) two or more countries in
Central and/or South America, (d) two or more countries in Asia,
excluding Japan and China, and (e) Australia, which is also
considered a performance condition. The fair value of these awards,
as calculated under a multifactor Monte Carlo simulation, is
$913,750 and $569,500, respectively. The Company is amortizing the
fair value over the derived service period of 1.1 years. The
Company recognized $506,132 and $612,982 of stock-based
compensation expense related to these restricted stock units during
the three and nine months ended March 31, 2018.
17
PALATIN TECHNOLOGIES, INC.
and Subsidiary
Notes to Consolidated Financial Statements
(unaudited)
In
September 2017, the Company granted 54,000 restricted stock units
to a newly appointed non-employee director under the
Company’s 2011 Stock Incentive Plan. The Company is
amortizing the fair value of these restricted stock units of
$27,000 over a 48- month vesting period. The Company recognized
$3,516 and $7,930, respectively, of stock-based compensation
expense related to these restricted stock units during the three
and nine months ended March 31, 2018.
In June
2017, the Company granted 1,140,000 restricted stock units to its
executive officers, 780,000 restricted stock units to its employees
and 378,000 restricted stock units to its non-employee directors
under the Company’s 2011 Stock Incentive Plan. The Company is
amortizing the fair value of these restricted stock units of
$421,800, $288,600, and $139,860, respectively, over the vesting
period. The Company recognized $150,364 and $473,568, respectively,
of stock-based compensation expense related to these restricted
stock units during the three and nine months ended March 31,
2018.
In
September 2016, the Company granted 558,000 restricted stock units
to its executive officers, 350,500 of which vest over 24 months and
207,500 of which vested over 12 months, and 336,000 restricted
stock units to its employees under the Company’s 2011 Stock
Incentive Plan. The Company is amortizing the fair value of the
restricted stock units of $284,580 and $171,360, respectively, over
the vesting periods. The Company recognized $13,228 and $104,711,
respectively, of stock-based compensation expense related to these
restricted stock units during the three and nine months ended March
31, 2018 and $76,822 and $177,554, respectively, during the three
and nine months ended March 31, 2017.
In
December 2015, the Company granted 625,000 performance-based
restricted stock units to its executive officers and 200,000
performance-based restricted stock units to its employees under the
Company’s 2011 Stock Incentive Plan, which vest during the
performance period, ending December 31, 2017, if and upon the
earlier of: i) achievement of a closing price for the
Company’s common stock equal to or greater than $1.20 per
share for 20 consecutive trading days, which is considered a market
condition, or ii) entering into a collaboration agreement (U.S. or
global) of bremelanotide for FSD, which is considered a performance
condition. This performance condition was deemed met as of February
2, 2017, the effective date of the License Agreement with AMAG.
Prior to meeting the performance condition, the Company determined
that it was not probable of achievement on the date of grant since
meeting the condition was outside the control of the Company. The
fair value of these awards, as calculated under a multifactor Monte
Carlo simulation, was $338,250 and was recognized over the derived
service period which was through December 2016. The Company
recognized $55,410 and $142,289, respectively, of stock-based
compensation expense related to these restricted stock units during
the three and six months ended December 31, 2016. Upon the
achievement of the performance condition, which occurred in the
three-month period ended March 31, 2017, the grant date fair value
was utilized and an incremental $222,075 was recognized as
stock-based compensation expense during the three months ended
March 31, 2017. The Company recognized $364,364 of stock-based
compensation expense related to these restricted stock units during
the nine months ended March 31, 2017.
Also,
in December 2015, the Company granted 625,000 restricted stock
units to its executive officers, 340,000 restricted stock units to
its non-employee directors and 200,000 restricted stock units to
its employees under the Company’s 2011 Stock Incentive Plan.
For executive officers and employees, the restricted stock units
vest 25% on the date of grant and 25% on the first, second and
third anniversary dates from the date of grant. For non-employee
directors, the restricted stock units vest 50% on the first and
second anniversary dates from the date of grant. The Company is
amortizing the fair value of these restricted stock units of
$425,000, $231,200 and $136,000, respectively, over the vesting
period of the restricted stock units. The Company recognized
$11,404 and $66,914, respectively, of stock-based compensation
expense related to these restricted stock units during the three
and nine months ended March 31, 2018 and $41,079 and $228,331,
respectively, during the three and nine months ended March 31,
2017.
Unless
otherwise stated, restricted stock units granted to the
Company’s executive officers, employees and non-employee
directors vest over 24 months, 48 months and 12 months,
respectively.
Stock-based
compensation expense for the three and nine months ended March 31,
2018 for equity-based instruments issued other than the stock
options and restricted stock units described above was $81,857 and
$262,291, respectively, and $178,708 and $560,024, respectively,
for the three and nine months ended March 31, 2017.
(14)
SUBSEQUENT
EVENTS:
At-the-Market Offering
–
On April 20, 2018, the Company entered into an
equity distribution agreement (the “Equity Distribution
Agreement”) with Canaccord Genuity LLC
(“Canaccord”), pursuant to which the Company may, from
time to time, sell shares of the Company’s common
stock
at market prices by methods deemed to be an
“at-the-market offering” as defined in Rule 415
promulgated under the Securities Act of 1933, as amended. The
Company will pay Canaccord 3.0% of the gross proceeds as a
commission. Between April 20, 2018 and May 11, 2018, a total of
203,900 shares of common stock were sold through Canaccord under
the Equity Distribution Agreement for net proceeds of $243,696,
after payment of commission fees of $7,537. The Company has no
obligation to sell any shares under the Equity Distribution
Agreement and may at any time suspend solicitation and offers under
the Equity Distribution Agreement.
Outstanding Common Stock
– Between April 1, 2018 and
May 11, 2018, the Company issued 2,995,807 shares of common stock
pursuant to the exercise of warrants at an exercise price of $0.80
and received proceeds of $2,396,646 upon exercise.
18
The
following discussion and analysis should be read in conjunction
with the consolidated financial statements and notes to the
consolidated financial statements filed as part of this report and
the audited consolidated financial statements and notes thereto
included in our Annual Report on Form 10-K for the year ended June
30, 2017.
Critical Accounting Policies and Estimates
Our
significant accounting policies, which are described in the notes
to our consolidated financial statements included in this report
and in our Annual Report on Form 10-K for the year ended June 30,
2017, have not changed as of March 31, 2018. We believe that our
accounting policies and estimates relating to revenue recognition,
accrued expenses and stock-based compensation are the most
critical.
Overview
We are
a biopharmaceutical company developing targeted, receptor-specific
peptide therapeutics for the treatment of diseases with significant
unmet medical need and commercial potential. Our programs are based
on molecules that modulate the activity of the melanocortin and
natriuretic peptide receptor systems. Our lead product in clinical
development is bremelanotide for the treatment of premenopausal
women with hypoactive sexual desire disorder (“HSDD”),
which is a type of female sexual dysfunction (“FSD”),
defined as low desire with associated distress. In addition, we
have drug candidates and development programs for cardiovascular
diseases and inflammatory diseases.
The
following drug development programs are actively under
development:
●
Bremelanotide, an
as-needed subcutaneous injectable product for the treatment of HSDD
in premenopausal women. Bremelanotide is a synthetic peptide analog
of the naturally occurring hormone alpha-MSH
(melanocyte-stimulating hormone). In two pivotal Phase 3 clinical
studies of bremelanotide for HSDD in premenopausal women,
bremelanotide met the pre-specified co-primary efficacy endpoints
of improvement in desire and decrease in distress associated with
low sexual desire as measured using validated patient-reported
outcome instruments. In March 2018, our exclusive North American
licensee for bremelanotide, AMAG, submitted a New Drug Application
(“NDA”) to the FDA for bremelanotide for the treatment
of HSDD in premenopausal women. We have also licensed rights to
bremelanotide in China to Fosun and in Korea to
Kwangdong.
●
Melanocortin
peptide system program, focused on development of treatments for a
variety of inflammatory disease indications. PL-8177 is a selective
melanocortin receptor 1 (“MC1r”) agonist peptide we
have designated as our lead clinical development candidate for
inflammatory bowel diseases. We have filed an Investigational New
Drug (“IND”) application and announced dosing of human
subjects in a Phase 1 clinical safety study in February 2018. A
dual melanocortin receptor 1 and 5 peptide we developed, PL-8331,
is a preclinical development candidate for treating ocular
inflammation. We anticipate completing IND preclinical enabling
activities on PL-8331 later this calendar year; and
●
Natriuretic peptide
system program, including PL3994, a natriuretic peptide
receptor-A (“NPR-A”) agonist, for treatment of
cardiovascular indications. PL3994, a synthetic mimetic of
the neuropeptide hormone atrial natriuretic peptide
(“ANP”), is in development for treatment of heart
failure, and is scheduled to start Phase 2A clinical trials later
this calendar year. A dual natriuretic peptide receptor A and C
agonist we developed, PL-5028, is in preclinical development for
cardiovascular diseases, including reducing cardiac hypertrophy and
fibrosis. We may file an IND application in the first half of
calendar year 2019, and thereafter initiate a Phase 1 clinical
safety study.
The
following chart illustrates the status of our drug development
programs.
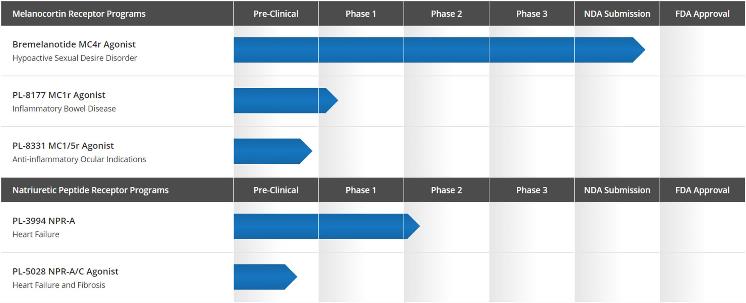
19
Our
Phase 3 studies for HSDD in premenopausal women, called the
RECONNECT studies, consisted of two double-blind
placebo-controlled, randomized parallel group studies comparing the
as desired use of 1.75 mg of bremelanotide versus placebo, in each
case, delivered via a subcutaneous auto-injector. Each trial
consisted of more than 600 patients randomized in a 1:1 ratio to
either the treatment arm or placebo with a 24-week evaluation
period. In both clinical trials, bremelanotide met the
pre-specified co-primary efficacy endpoints of median improvement
in desire and decrease in distress associated with low sexual
desire as measured using validated patient-reported outcome
instruments.
After
completion of the trial, women in the trials had the option to
continue in an open-label safety extension study for an additional
52 weeks. Nearly 80% of patients who completed the randomized
portion of the study elected to remain in the open-label portion of
the study.
In the
Phase 3 clinical trials, the most frequent adverse events were
nausea, flushing, and headache, which were generally
mild-to-moderate in intensity and were transient.
We
retain worldwide rights for bremelanotide for HSDD and all other
indications outside North America, Korea and China. We are actively
seeking potential partners for marketing and commercialization
rights for bremelanotide for HSDD outside the licensed territories.
However, we may not be able to enter into suitable agreements with
potential partners on acceptable terms, if at all.
Our Strategy
Key
elements of our business strategy include:
●
Using our
technology and expertise to develop and commercialize products in
our active drug development programs;
●
Entering into
strategic alliances and partnerships with pharmaceutical companies
to facilitate the development, manufacturing, marketing, sale and
distribution of our product candidates;
●
Partially funding
our product development programs with the cash flow generated from
existing license agreements, as well as any future research,
collaboration or license agreements with third parties;
and
●
Completing
development and seeking regulatory approval of certain of our
product candidates.
We
incorporated in Delaware in 1986 and commenced operations in the
biopharmaceutical area in 1996. Our corporate offices are located
at 4B Cedar Brook Drive, Cranbury, New Jersey 08512 and our
telephone number is (609) 495-2200. We maintain an Internet site at
http://www.palatin.com, where among other things, we make available
free of charge on and through this website our Forms 3, 4 and 5,
proxy statements, Annual Reports on Form 10-K, Quarterly Reports on
Form 10-Q, Current Reports on Form 8-K, and amendments to those
reports filed or furnished pursuant to Section 13(a) or 15(d),
Section 14A and Section 16 of the Exchange Act as soon as
reasonably practicable after we electronically file such material
with, or furnish it to, the SEC. Our website and the information
contained in it or connected to it are not incorporated into this
Quarterly Report on Form 10-Q.
Results of Operations
Three and Nine Months Ended March 31, 2018 Compared to the Three
and Nine Months Ended March 31, 2017
Revenue –
For the three and nine months ended March
31, 2018, we recognized $8,962,709 and $46,516,370, respectively,
in revenue, of which $8,962,709 and $41,516,370, respectively, was
attributable to our License Agreement with AMAG. For the nine
months ended March 31, 2018, $5,000,000 in revenue was attributable
to our License Agreement with Fosun.
For the three and nine months
ended March 31, 2017 we recognized $10,823,748 in revenue, all of
which was attributable to our License Agreement with
AMAG.
On
January 8, 2017, we entered into the License Agreement with AMAG
which provided for $60,000,000 as a one-time initial payment.
Pursuant to the terms of and subject to the conditions in the
License Agreement with AMAG, AMAG reimbursed us $25,000,000 for
reasonable, documented, direct out-of-pocket expenses we incurred
following the Effective Date of the License Agreement with AMAG in
connection with the development and regulatory activities necessary
to file an NDA for bremelanotide for HSDD in the United States less
certain other expenses directly paid or to be paid by
AMAG.
On
September 6, 2017, we entered into the License Agreement with
Fosun, for exclusive rights to commercialize bremelanotide in the
territories of the People's Republic of China, Taiwan, Hong Kong
S.A.R. and Macau S.A.R., which provided for $5,000,000 as a
one-time non-refundable upfront payment. Pursuant to the License
Agreement with Fosun, $500,000 was withheld in accordance with tax
withholding requirements in China and will be recorded as an
expense during the fiscal year ending June 30, 2018. For the three
and nine months ended March 31, 2018, the Company recorded an
income tax benefit of $15,765 and an income tax expense of
$264,202, respectively, related to this transaction.
On
November 21, 2017, we entered into the License Agreement with
Kwangdong, for exclusive rights to commercialize bremelanotide in
the Republic of Korea, which provided for a $500,000 as a one-time
refundable upfront payment, which has been recorded as non-current
deferred revenue as of March 31, 2018. Pursuant to the License
Agreement with Kwangdong, $82,500 was withheld in accordance with
tax withholding requirements in South Korea and will be recorded as
an expense during the fiscal year ending June 30, 2018. For the
three and nine months ended March 31, 2018, the Company recorded an
income tax benefit of $2,981 and an income tax expense of $43,187,
respectively, related to this transaction.
20
Research and Development
– Research and development
expenses were $7,068,849 and $27,277,830, respectively for the
three and nine months ended March 31, 2018, compared to $9,062,316
and $28,422,975, respectively, for the three and nine months ended
March 31, 2017.
Research
and development expenses related to our bremelanotide, PL-3994,
MC1r, MC4r and other preclinical programs were $5,342,113 and
$23,377,721, respectively, for the three and nine months ended
March 31, 2018, compared to $7,904,690 and $25,206,757,
respectively, for the three and nine months ended March 31, 2017.
Spending to date has been primarily related to our bremelanotide
for the treatment of HSDD program. The fluctuations in research and
development expenses for the periods presented are mainly
attributable to the progression of the Phase 3 clinical trial and
development of bremelanotide for HSDD program. The amount of such
spending and the nature of future development activities are
dependent on a number of factors, including primarily the
availability of funds to support future development activities,
success of our clinical trials and preclinical and discovery
programs, and our ability to progress compounds in addition to
bremelanotide and PL-3994 into human clinical trials.
The
amounts of project spending noted above exclude general research
and development spending, which was $1,726,736 and $3,900,109,
respectively, for the three and nine months ended March 31, 2018
compared to $1,157,626 and $3,216,218, respectively, for the three
and nine months ended March 31, 2017. The increase in general
research and development spending is primarily attributable to
employee-related expenses.
Cumulative
spending from inception to March 31, 2018 is approximately
$303,100,000 on our bremelanotide program and approximately
$128,600,000 on all our other programs (which include PL3994,
PL8177, other melanocortin receptor agonists, other discovery
programs and terminated programs). Due to various risk factors
described herein and in our Annual Report on Form 10-K for the year
ended June 30, 2017, under “Risk Factors,” including
the difficulty in estimating the costs and timing of future Phase 1
clinical trials and larger-scale Phase 2 and Phase 3 clinical
trials for any product under development, we cannot predict with
reasonable certainty when, if ever, a program will advance to the
next stage of development, be successfully completed, or generate
net cash inflows.
General and Administrative
– General and
administrative expenses, which consist mainly of compensation and
related costs, were $2,411,302 and $5,581,066, respectively, for
the three and nine months ended March 31, 2018 compared to
$4,773,696 and $7,289,342, respectively, for the three and nine
months ended March 31, 2017. The decrease in general and
administrative expenses is primarily attributable to professional
services rendered in connection with our License Agreement with
AMAG in 2017.
Other Income (Expense)
– Other income (expense) was
$(240,487) and $(955,445), respectively, for the three and nine
months ended March 31, 2018 compared to $(552,398) and
$(1,758,282), respectively, for the three and nine months ended
March 31, 2017. For the three and nine months ended March 31, 2018,
we recognized $86,496 and $219,578, respectively, of investment
income offset by $(326,983) and $(1,175,023), respectively, of
interest expense primarily related to our venture debt. For the
three and nine months ended March 31, 2017, we recognized $6,304
and $18,940, respectively, of investment income offset by
$(558,702) and $(1,777,222), respectively, of interest expense
primarily related to our venture debt.
Income Tax Benefit
– Net income tax benefit was
$18,746 and $192,611, respectively, for the three and nine months
ended March 31, 2018. Pursuant to the 2017 Tax Act, during the
quarter ended December 31, 2017, we recorded a tax benefit of
$500,000 related to the release of a valuation allowance against an
AMT credit. We filed the June 30, 2017 tax return during the
quarter ended March 31, 2018 and as a result was not subject to AMT
liability. This benefit is offset by $307,389 in income tax expense
for the nine months ended March 31, 2018.
We recorded a benefit of $18,746
during the three months ended March 31, 2018 based on its estimated
effective tax rate. No income tax expense or benefit was recognized
for the three and nine months ended March 31, 2017.
Liquidity and Capital Resources
Since
inception, we have incurred net operating losses, primarily related
to spending on our research and development programs. We have
financed our net operating losses primarily through debt and equity
financings and amounts received under collaboration and license
agreements.
Our
product candidates are at various stages of development and will
require significant further research, development and testing and
some may never be successfully developed or commercialized. We may
experience uncertainties, delays, difficulties and expenses
commonly experienced by early stage biopharmaceutical companies,
which may include unanticipated problems and additional costs
relating to:
●
the development and
testing of products in animals and humans;
●
product approval or
clearance;
●
regulatory
compliance;
●
good manufacturing
practices (“GMP”) compliance;
●
intellectual
property or technology rights;
●
product
introduction;
●
marketing, sales
and competition; and
●
obtaining
sufficient capital.
21
Failure
to enter into or successfully perform under collaboration
agreements and obtain timely regulatory approval for our product
candidates and indications would impact our ability to increase
revenues and could make it more difficult to attract investment
capital for funding our operations. Any of these possibilities
could materially and adversely affect our operations and require us
to curtail or cease certain programs.
During
the nine months ended March 31, 2018, cash used in operating
activities was $8,790,792, compared to cash provided by operating
activities of $25,768,523 for the nine months ended March 31, 2017.
Higher net cash outflows from operations in the nine months ended
March 31, 2018 was primarily the result of the cash payments
received in the prior period relating to our license agreement with
AMAG. Our periodic prepaid expenses, accounts payable and accrued
expenses balances will continue to be highly dependent on the
timing of our operating costs.
During
the nine months ended March 31, 2018, cash provided by investing
activities was $240,500, consisting of $250,000 in proceeds from
the maturity of investments offset by $9,500, which was used for
the purchase of equipment. During the nine months ended March 31,
2017, cash provided by investing activities was $450,000 relating
to proceeds from the maturity of investments.
During
the nine months ended March 31, 2018, net cash used in financing
activities was $5,913,874, which consisted of $6,000,000 for the
payment on notes payable, and $59,489 for capital lease payments
and the payment of withholding taxes related to restricted stock
units, offset by proceeds from the exercise of options and warrants
of $145,615. During the nine months ended March 31, 2017 net cash
provided by financing activities was $20,284,024, which consisted
of net proceeds from our underwritten offerings in August and
December 2016 of $23,856,972 and proceeds from the exercise of
warrants of $114,358 offset by $3,687,306 for the payment on notes
payable, capital lease payments and payment of withholding
taxes.
We have
incurred cumulative negative cash flows from operations since our
inception, and have expended, and expect to continue to expend in
the future, substantial funds to complete our planned product
development efforts. Continued operations are dependent upon our
ability to complete equity or debt financing activities, entering
into licensing agreements or collaboration arrangements. As of
March 31, 2018, our cash and cash equivalents were $25,736,158 and
our current liabilities were $13,609,551, net of deferred revenue
of $585,519.
We
intend to utilize existing capital resources and sales of stock
under the equity distribution agreement for general corporate
purposes and working capital, and preclinical and clinical
development of our MC1r and MC4r peptide programs and PL-3994
natriuretic peptide, and development of other portfolio
products.
We
believe that our existing capital resources, together with proceeds
received from sales of common stock in our
“at-the-market” program (if any), will be adequate to
fund our planned operations through at least June 30, 2019. We will
need additional funding to complete required clinical trials for
our product candidates and development programs other than
bremelanotide and, if those clinical trials are successful (which
we cannot predict), to complete submission of required regulatory
applications to the FDA.
We
anticipate incurring additional losses over at least the next
several years. To achieve or maintain profitability, if ever, we,
alone or with others, must successfully develop and commercialize
our technologies and proposed products, conduct preclinical studies
and clinical trials, obtain required regulatory approvals and
successfully manufacture and market our technologies and proposed
products. The time required to reach sustained profitability is
highly uncertain, and we do not know whether we will be able to
achieve profitability on a sustained basis, if at all.
Off-Balance Sheet Arrangements
None.
Not
required to be provided by smaller reporting
companies.
Our
management, with the participation of our Chief Executive Officer
and Chief Financial Officer, has evaluated the effectiveness of our
disclosure controls and procedures, as defined in Exchange Act
Rules 13a-15(e) and 15d-15(e), as of the end of the period covered
by this report. Based on that evaluation, our Chief Executive
Officer and Chief Financial Officer concluded that our disclosure
controls and procedures were effective as of March 31, 2018. There
were no changes in our internal control over financial reporting
that occurred during our most recent fiscal quarter that materially
affected, or that are reasonably likely to materially affect, our
internal control over financial reporting.
22
We may
be involved, from time to time, in various claims and legal
proceedings arising in the ordinary course of our business. We are
not currently a party to any claim or legal
proceeding.
This report and other documents we file with the SEC contain
forward-looking statements that are based on current expectations,
estimates, forecasts and projections about us, our future
performance, our business, our beliefs and our management’s
assumptions. These statements are not guarantees of future
performance, and they involve certain risks, uncertainties and
assumptions that are difficult to predict. You should carefully
consider the risks and uncertainties described below and the other
information in this Quarterly Report on Form 10-Q, including our
unaudited condensed financial statements and the related notes
thereto and “Management’s Discussion and Analysis of
Financial Condition and Results of Operation.”
Risks Related to Our Financial Results and Need for
Financing
We have a history of substantial net losses, may continue to incur
substantial net losses over the next few years, and we may never
achieve or maintain profitability.
As of
March 31, 2018, we had an accumulated deficit of $343.9 million,
with net income for the nine months ended March 31, 2018 of $12.9
million. We may not achieve or sustain profitability in future
years, which is dependent on numerous factors, including whether
and when development and sales milestones are met, regulatory
actions by the FDA and other regulatory bodies, the performance of
our licensees, and market acceptance of our products. If we attain
sustained profitability, it will not be until the fiscal year
ending June 30, 2019 at the earliest, and then only if the FDA
approves the NDA on bremelanotide for HSDD.
We
expect to incur additional losses as we continue our development of
natriuretic peptide and MC1r products. These losses, among other
things, have had and will continue to have an adverse effect on our
stockholders’ equity, total assets and working
capital.
Since
2005 we have not had any products available for commercial sale and
have not received any revenues from the sale of our product
candidates. For the foreseeable future, we will have to fund all of
our operations and capital expenditures from license and contract
revenue under collaborative development agreements, existing cash
balances and outside sources of financing, which may not be
available on acceptable terms, if at all. Unless and until we
receive approval from the FDA or other equivalent regulatory
authorities outside the United States, we cannot sell our products
and will not have product revenues from them. We have devoted
substantially all of our efforts to research and development,
including preclinical and clinical trials. Because of the numerous
risks associated with developing drugs, we are unable to predict
the extent of future losses, whether or when any of our product
candidates will become commercially available, or when we will
become profitable, if at all.
We will need additional funding, including funding to complete
clinical trials for our product candidates other than
bremelanotide, which may not be available on acceptable terms, if
at all.
We
intend to focus future efforts on our product candidates other than
bremelanotide, including our MC1r and natriuretic peptide programs.
As of March 31, 2018, we had cash and cash equivalents of $25.7
million, with current liabilities of $13.6 million, net of deferred
revenue of $0.6 million. We believe we currently have sufficient
existing capital resources, together with proceeds received from
sales of common stock in our “at-the-market” program
(if any), to fund our planned operations through at least June 30,
2019. We will need additional funding to complete development
activities and required clinical trials for our other product
candidates and development programs and, if those clinical trials
are successful (which we cannot predict), to complete submission of
required regulatory applications to the FDA.
Until
the FDA approves bremelanotide for HSDD and marketing commences, if
at all, we will not have any recurring revenue. Even if
bremelanotide is approved and marketing commences, we cannot
predict product sales or our resulting royalties, so we may not
have any source of significant recurring revenue and may need to
depend on financing or partnering to sustain our operations. We may
raise additional funds through public or private equity or debt
financings, collaborative arrangements on our product candidates,
or other sources. However, such financing arrangements may not be
available on acceptable terms, or at all. To obtain additional
funding, we may need to enter into arrangements that require us to
develop only certain of our product candidates or relinquish rights
to certain technologies, product candidates and/or potential
markets.
If we
are unable to raise sufficient additional funds when needed, we may
be required to curtail operations significantly, cease clinical
trials and decrease staffing levels. We may seek to license, sell
or otherwise dispose of our product candidates, technologies and
contractual rights on the best possible terms available. Even if we
are able to license, sell or otherwise dispose of our product
candidates, technologies and contractual rights, it is likely to be
on unfavorable terms and for less value than if we had the
financial resources to develop or otherwise advance our product
candidates, technologies and contractual rights
ourselves.
23
Our
future capital requirements depend on many factors,
including:
●
our ability to
enter into one or more licensing or similar agreements for
bremelanotide outside of North America, Korea and
China;
●
the timing of, and
the costs involved in, obtaining regulatory approvals for
bremelanotide for HSDD and our other product
candidates;
●
the number and
characteristics of any additional product candidates we develop or
acquire;
●
the scope,
progress, results and costs of researching and developing our
future product candidates, and conducting preclinical and clinical
trials;
●
the cost of
commercialization activities if any future product candidates are
approved for sale, including marketing, sales and distribution
costs;
●
the cost of
manufacturing any future product candidates and any products we
successfully commercialize;
●
our ability to
establish and maintain strategic collaborations, licensing or other
arrangements and the terms and timing of such
arrangements;
●
the degree and rate
of market acceptance of any future approved products;
●
the emergence,
approval, availability, perceived advantages, relative cost,
relative safety and relative efficacy of alternative and competing
products or treatments;
●
any product
liability or other lawsuits related to our products;
●
the expenses needed
to attract and retain skilled personnel;
●
the costs involved
in preparing, filing, prosecuting, maintaining, defending and
enforcing patent claims, including litigation costs and the outcome
of such litigation; and
●
the timing, receipt
and amount of sales of, or royalties on, future approved products,
if any.
We have a limited operating history upon which to base an
investment decision.
Our
operations are primarily focused on acquiring, developing and
securing our proprietary technology, conducting preclinical and
clinical studies and formulating and manufacturing, through
contract manufacturers, our principal product candidates on a
small-scale basis. These operations provide a limited basis for
stockholders to assess our ability to commercialize our product
candidates.
While
we have completed Phase 3 clinical trials on bremelanotide for HSDD
in premenopausal women, and with AMAG have filed an NDA on
bremelanotide for HSDD with the FDA, we have not yet demonstrated
our ability to perform the functions necessary for the successful
commercialization of any of our current product candidates. The
successful commercialization of our product candidates will require
us to perform a variety of functions, including:
●
continuing to
conduct preclinical development and clinical trials;
●
participating in
regulatory approval processes;
●
formulating and
manufacturing products, or having third parties formulate and
manufacture products;
●
post-approval
monitoring and surveillance of our products;
●
conducting sales
and marketing activities, either alone or with a partner;
and
●
obtaining
additional capital.
If we
are unable to obtain regulatory approval of any of our product
candidates, to successfully commercialize any products for which we
receive regulatory approval or to obtain additional capital, we may
not be able to recover our investment in our development
efforts.
The
clinical and commercial success of our product candidates will
depend on a number of factors, including the
following:
●
the ability to
raise additional capital on acceptable terms, or at
all;
●
timely completion
of our clinical trials, which may be significantly slower or cost
more than we currently anticipate and will depend substantially
upon the performance of third-party contractors;
●
whether we are
required by the FDA or similar foreign regulatory agencies to
conduct additional clinical trials beyond those planned to support
the approval and commercialization of our product candidates or any
future product candidates;
●
acceptance of our
proposed indications and primary endpoint assessments relating to
the proposed indications of our product candidates by the FDA and
similar foreign regulatory authorities;
●
our ability to
demonstrate to the satisfaction of the FDA and similar foreign
regulatory authorities, the safety and efficacy of our product
candidates or any future product candidates;
●
the prevalence,
duration and severity of potential side effects experienced with
our product candidates or future approved products, if
any;
24
●
the timely receipt
of necessary marketing approvals from the FDA and similar foreign
regulatory authorities;
●
achieving and
maintaining, and, where applicable, ensuring that our third-party
contractors achieve and maintain, compliance with our contractual
obligations and with all regulatory requirements applicable to our
product candidates or any future product candidates or approved
products, if any;
●
the ability of
third parties with whom we contract to manufacture clinical trial
and commercial supplies of our product candidates or any future
product candidates, remain in good standing with regulatory
agencies and develop, validate and maintain commercially viable
manufacturing processes that are compliant the FDA’s current
Good Manufacturing Practices (“GMP”)
regulations;
●
a continued
acceptable safety profile and efficacy during clinical development
and following approval of our product candidates or any future
product candidates;
●
our ability to
successfully commercialize our product candidates or any future
product candidates in the United States and internationally, if
approved for marketing, sale and distribution in such countries and
territories, whether alone or in collaboration with
others;
●
acceptance by
physicians and patients of the benefits, safety and efficacy of our
product candidates or any future product candidates, if approved,
including relative to alternative and competing
treatments;
●
our and our
partners’ ability to establish and enforce intellectual
property rights in and to our product candidates or any future
product candidates;
●
our and our
partners’ ability to avoid third-party patent interference or
intellectual property infringement claims; and
●
our ability to
in-license or acquire additional product candidates or
commercial-stage products that we believe can be successfully
developed and commercialized.
If we
do not achieve one or more of these factors, many of which are
beyond our control, in a timely manner or at all, we could
experience significant delays or an inability to obtain regulatory
approvals or commercialize our product candidates. Even if
regulatory approvals are obtained, we may never be able to
successfully commercialize any of our product candidates.
Accordingly, we cannot assure you that we will be able to generate
sufficient revenue through the sale of our product candidates or
any future product candidates to continue our
business.
Raising additional capital may cause dilution to existing
shareholders, restrict our operations or require us to relinquish
rights.
We may
seek the additional capital necessary to fund our operations
through public or private equity offerings, collaboration
agreements, debt financings or licensing arrangements. To the
extent that we raise additional capital through the sale of equity
or convertible debt securities, existing shareholders’
ownership interests will be diluted and the terms may include
liquidation or other preferences that adversely affect their rights
as a shareholder. Debt financing, if available, may involve
agreements that include covenants limiting or restricting our
ability to take specific actions such as incurring additional debt,
making capital expenditures or declaring dividends. If we raise
additional funds through collaborations and licensing arrangements
with third parties, we may have to relinquish valuable rights to
our technologies or product candidates, or grant licenses on terms
that are not favorable to us.
Risks Related to Our Business, Strategy and Industry
We are substantially dependent on the clinical and commercial
success of our product candidates, primarily our lead product
candidate, bremelanotide for HSDD, but we and our licensees may
never obtain regulatory approval for or successfully commercialize
bremelanotide for HSDD or any of our product
candidates.
To
date, we have invested most of our efforts and financial resources
in the research and development of bremelanotide for HSDD, which is
currently our lead product candidate. We licensed all rights to
bremelanotide in North America to AMAG, and were contractually
obligated to complete development and regulatory activities
necessary to file an NDA for bremelanotide for HSDD in the United
States, for which AMAG reimbursed us for $25 million of expenses we
incurred less certain other expenses directly paid or to be paid by
AMAG. We licensed rights to bremelanotide for China to Fosun and
licensed rights to bremelanotide for Korea
to Kwangdong, but depending on the
regulatory approval pathway utilized in China or Korea, approval in
China or Korea may be contingent on approval of an NDA for
bremelanotide for HSDD in the United States.
Our
near-term prospects, including our ability to finance our company
and generate revenue, will depend heavily on the successful
development, regulatory approval and commercialization of
bremelanotide for HSDD, as well as any future product candidates.
The clinical and commercial success of our product candidates will
depend on a number of factors, including the
following:
25
●
timely completion
of, or need to conduct additional clinical trials and studies, for
our product candidates, which may be significantly slower or cost
more than we currently anticipate and will depend substantially
upon the accurate and satisfactory performance of third-party
contractors;
●
the ability to
demonstrate to the satisfaction of the FDA the safety and efficacy
of bremelanotide for HSDD or any future product candidates through
clinical trials;
●
whether we or our
licensees are required by the FDA or other similar foreign
regulatory agencies to conduct additional clinical trials to
support the approval of bremelanotide for HSDD or any future
product candidates;
●
the acceptance of
parameters for regulatory approval, including our proposed
indication, primary endpoint assessment and primary endpoint
measurement, relating to our lead indications of bremelanotide for
HSDD;
●
the success of our
licensees in educating physicians and patients about the benefits,
administration and use of bremelanotide for HSDD, if
approved;
●
the prevalence and
severity of adverse events experienced with bremelanotide for HSDD
or any future product candidates or approved products;
●
the adequacy and
regulatory compliance of the autoinjector device, supplied by an
unaffiliated third party, to be used as part of the bremelanotide
combination product;
●
the timely receipt
of necessary marketing approvals from the FDA and similar foreign
regulatory authorities;
●
our ability to
raise additional capital on acceptable terms to achieve our
goals;
●
achieving and
maintaining compliance with all regulatory requirements applicable
to bremelanotide for HSDD or any future product candidates or
approved products;
●
the availability,
perceived advantages, relative cost, relative safety and relative
efficacy of alternative and competing treatments;
●
the effectiveness
of our own or our future potential strategic collaborators’
marketing, sales and distribution strategy and
operations;
●
the ability to
manufacture clinical trial supplies of bremelanotide for HSDD or
any future product candidates and to develop, validate and maintain
a commercially viable manufacturing process that is compliant with
current GMP;
●
the ability of AMAG
to successfully commercialize bremelanotide for HSDD;
●
our ability to
successfully commercialize any future product candidates, if
approved for marketing and sale, whether alone or in collaboration
with others;
●
our ability to
enforce our intellectual property rights in and to bremelanotide
for HSDD or any future product candidates;
●
our ability to
avoid third-party patent interference or intellectual property
infringement claims;
●
acceptance of
bremelanotide for HSDD or any future product candidates, if
approved, as safe and effective by patients and the medical
community; and
●
a continued
acceptable safety profile and efficacy of bremelanotide for HSDD or
any future product candidates following approval.
If we
fail to satisfy any one of these prerequisites to our commercial
success, many of which are beyond our control, in a timely manner
or at all, we could experience significant delays or an inability
to successfully commercialize our product candidates. Accordingly,
we cannot assure you that we will be able to generate sufficient
revenue through the sale of bremelanotide for HSDD by AMAG, Fosun
and Kwangdong or through the sale of any future product candidate
to continue our business. In addition to preventing us from
executing our current business plan, any delays in our clinical
trials, or inability to successfully commercialize our products
could impair our reputation in the industry and the investment
community and could hinder our ability to fulfill our existing
contractual commitments. As a result, our share price would likely
decline significantly, and we would have difficulty raising
necessary capital for future projects.
We do not control the development or commercialization of
bremelanotide in North America, which is licensed to AMAG, and as a
result we may not realize a significant portion of the potential
value of the license arrangement with AMAG.
Although
we conducted development work to support an NDA for bremelanotide
in HSDD, the license agreement with AMAG for bremelanotide in North
America limits our control over development activities, including
regulatory approvals, and we do not have any direct control over
commercialization efforts. AMAG may abandon further development of
bremelanotide in its licensed territory, including terminating the
agreement, for any reason, including a change of priorities within
AMAG or lack of success in ancillary clinical trials necessary to
obtain regulatory approvals. Because the potential value of the
license arrangement with AMAG is contingent upon the successful
development and commercialization of bremelanotide in the United
States and other countries in the licensed territory, the ultimate
value of this license will depend on the efforts of AMAG. If AMAG
does not succeed in obtaining regulatory approval of bremelanotide
in the United States for any reason, does not succeed in securing
market acceptance of bremelanotide in the United States, or elects
for any reason to discontinue marketing of bremelanotide, we will
be unable to realize the potential value of this arrangement and
would experience significant delays or an inability to successfully
commercialize bremelanotide.
26
Production and supply of bremelanotide depend on contract
manufacturers over whom neither we nor AMAG have any control, and
we may not have adequate supplies of bremelanotide.
We do
not have the facilities to manufacture the bremelanotide active
drug ingredient or the autoinjector pen component of the
bremelanotide combination product, or to fill, assemble and package
the bremelanotide combination product. AMAG, our exclusive licensee
for North America for bremelanotide, has assumed responsibility for
contract manufacturing. The contract manufacturers must perform
these manufacturing activities in a manner that complies with FDA
regulations. AMAG’s ability to control third-party compliance
with FDA requirements is limited to contractual remedies and rights
of inspection. The manufacturers of approved products and their
manufacturing facilities will be subject to ongoing review and
periodic inspections by the FDA and other authorities where
applicable, and must comply with regulatory requirements, including
FDA regulations concerning GMP. Failure of third-party
manufacturers to comply with GMP, medical device quality system
regulations, or other FDA requirements may result in enforcement
action by the FDA. Failure to conduct their activities in
compliance with FDA regulations could delay bremelanotide
development programs or negatively impact AMAG’s ability to
receive FDA approval of the bremelanotide potential products or
continue marketing bremelanotide products if they are approved.
Establishing relationships with new suppliers, who must be
FDA-approved, is a time-consuming and costly process. If AMAG is
not able to obtain adequate supplies of bremelanotide, it will be
difficult for AMAG to develop bremelanotide and compete
effectively.
Our product candidates other than bremelanotide are still in the
early stages of development and remain subject to clinical testing
and regulatory approval. If we are unable to successfully develop
and test our product candidates, we will not be
successful.
Our
product candidates are at various stages of research and
development, will require regulatory approval, and may never be
successfully developed or commercialized. Our product candidates
will require significant further research, development and testing
before we can seek regulatory approval to market and sell them. We
must demonstrate that our product candidates are safe and effective
for use in patients in order to receive regulatory approval for
commercial sale. Preclinical studies in animals, using various
doses and formulations, must be performed before we can begin human
clinical trials. Even if we obtain favorable results in the
preclinical studies, the results in humans may be different.
Numerous small-scale human clinical trials may be necessary to
obtain initial data on a product candidate’s safety and
efficacy in humans before advancing to large scale human clinical
trials. We face the risk that the results of our trials in later
phases of clinical trials may be inconsistent with those obtained
in earlier phases. Adverse or inconclusive results could delay the
progress of our development programs and may prevent us from filing
for regulatory approval of our product candidates. Additional
factors that could inhibit the successful development of our
product candidates include:
●
lack of
effectiveness of any product candidate during clinical trials or
the failure of our product candidates to meet specified
endpoints;
●
failure to design
appropriate clinical trial protocols;
●
uncertainty
regarding proper dosing;
●
inability to
develop or obtain a supplier for an autoinjector device that meets
the FDA’s medical device requirements;
●
insufficient data
to support regulatory approval;
●
inability or
unwillingness of medical investigators to follow our clinical
protocols;
●
inability to add a
sufficient number of clinical trial sites; or
●
the availability of
sufficient capital to sustain operations and clinical
trials.
You
should evaluate us in light of these uncertainties, difficulties
and expenses commonly experienced by early stage biopharmaceutical
companies, as well as unanticipated problems and additional costs
relating to:
●
product approval or
clearance;
●
regulatory
compliance;
●
good manufacturing
practices;
●
intellectual
property rights;
●
product
introduction; and
●
marketing and
competition.
27
If clinical trials for our product candidates are prolonged or
delayed, we may be unable to commercialize our product candidates
on a timely basis, which would require us to incur additional costs
and delay our receipt of any revenue from potential product
sales.
We may
be unable to commercialize our product candidates on a timely basis
due to unexpected delays in our human clinical trials. Potential
delaying events include:
●
discovery of
serious or unexpected toxicities or side effects experienced by
study participants or other safety issues;
●
slower than
expected rates of subject recruitment and enrollment rates in
clinical trials resulting from numerous factors, including the
prevalence of other companies’ clinical trials for their
product candidates for the same indication, or clinical trials for
indications for which patients do not as commonly seek
treatment;
●
difficulty in
retaining subjects who have initiated a clinical trial but may
withdraw at any time due to adverse side effects from the therapy,
insufficient efficacy, fatigue with the clinical trial process or
for any other reason;
●
difficulty in
obtaining institutional review board (“IRB”) approval
for studies to be conducted at each site;
●
delays in
manufacturing or obtaining, or inability to manufacture or obtain,
sufficient quantities of materials for use in clinical
trials;
●
inadequacy of or
changes in our manufacturing process or the product formulation or
method of delivery;
●
changes in
applicable laws, regulations and regulatory policies;
●
delays or failure
in reaching agreement on acceptable terms in clinical trial
contracts or protocols with prospective contract research
organizations (“CROs”), clinical trial sites and other
third-party contractors;
●
failure of our CROs
or other third-party contractors to comply with contractual and
regulatory requirements or to perform their services in a timely or
acceptable manner;
●
failure by us, our
employees, our CROs or their employees or any partner with which we
may collaborate or their employees to comply with applicable FDA or
other regulatory requirements relating to the conduct of clinical
trials or the handling, storage, security and recordkeeping for
drug, medical device and biologic products;
●
delays in the
scheduling and performance by the FDA of required inspections of
us, our CROs, our suppliers, or our clinical trial sites, and
violations of law or regulations by discovered in the course of FDA
inspections;
●
scheduling
conflicts with participating clinicians and clinical institutions;
or
●
difficulty in
maintaining contact with subjects during or after treatment, which
may result in incomplete data.
Any of
these events or other delaying events, individually or in the
aggregate, could delay the commercialization of our product
candidates and have a material adverse effect on our business,
results of operations and financial condition.
We may not be able to secure and maintain relationships with
research institutions and organizations to conduct our clinical
trials.
We rely
on research institutions and organizations to conduct our clinical
trials, and we therefore have limited control over the timing and
cost of clinical trials and our ability to recruit subjects. If we
are unable to reach agreements with suitable research institutions
or organizations on acceptable terms, or if any such agreement is
terminated, we may be unable to quickly replace the research
institution or organization with another qualified institution or
organization on acceptable terms. We may not be able to secure and
maintain suitable research institutions or organizations to conduct
our clinical trials.
Even if our product candidates receive regulatory approval, they
may never achieve market acceptance, in which case our business,
financial condition and results of operation will be materially
adversely affected.
Regulatory
approval for the marketing and sale of any of our product
candidates does not assure the product’s commercial success.
Any approved product will compete with other products manufactured
and marketed by major pharmaceutical and other biotechnology
companies. If any of our product candidates are approved by the FDA
and do not achieve adequate market acceptance, our business,
financial condition and results of operations will be materially
adversely affected. The degree of market acceptance of any such
product will depend on a number of factors, including:
●
perceptions by
members of the healthcare community, including physicians, about
the safety and effectiveness of any such product;
●
cost-effectiveness
relative to competing products and technologies;
●
availability of
reimbursement for our products from third-party payers such as
health insurers, health maintenance organizations
(“HMOs”) and government programs such as Medicare and
Medicaid; and
●
advantages over
alternative treatment methods.
There
is one FDA approved product for treatment of HSDD, flibanserin,
which is sold under the trade name Addyi®, and started
marketing in October 2015. The actual market size and market
dynamics for HSDD are unknown, and there is significant uncertainty
concerning the extent and scope of third-party reimbursement for
products treating HSDD. While we believe that an on-demand drug for
HSDD has competitive advantages compared to chronic or daily use
hormones and other drugs, we may not be able to realize this
perceived advantage in the market. Bremelanotide is administered by
subcutaneous injection. While the single-use, disposable
autoinjector pen format is designed to maximize market
acceptability, bremelanotide as a subcutaneous injectable drug for
HSDD may never achieve significant market acceptance. In addition,
we believe reimbursement of bremelanotide from third-party payers
such as health insurers, HMOs or other third-party payers of
healthcare costs will be similar to reimbursement for erectile
dysfunction (“ED”) drugs, and that the ultimate user
may pay a substantial part of the cost of bremelanotide for HSDD.
If the market opportunity for bremelanotide is smaller than we
anticipate, it may also be difficult for us to find marketing
partners and, as a result, we may be unable to generate revenue and
business from bremelanotide. If bremelanotide for HSDD does not
achieve adequate market acceptance at an acceptable price point,
our business, financial condition and results of operations will be
materially adversely affected.
28
Even if our product candidates receive regulatory approval in the
United States, we may never receive approval or commercialize our
products outside of the United States.
In
order to market any products outside of the United States, we must
establish and comply with numerous and varying regulatory
requirements of other countries regarding safety and efficacy.
Approval procedures vary among countries and can involve additional
product testing and additional administrative review periods. The
time required to obtain approval in other countries might differ
from that required to obtain FDA approval. The regulatory approval
process in other countries may include all of the risks detailed
above regarding FDA approval in the United States as well as other
risks. Regulatory approval in one country does not ensure
regulatory approval in another, but a failure or delay in obtaining
regulatory approval in one country may have a negative effect on
the regulatory process in others. Failure to obtain regulatory
approval in other countries or any delay or setbacks in obtaining
such approval would impair our ability to develop foreign markets
for our product candidates and may have a material adverse effect
on our results of operations and financial condition.
If side effects emerge that can be linked to our product candidates
(either while they are in development or after they are approved
and on the market), we may be required to perform lengthy
additional clinical trials, change the labeling of any such
products, or withdraw such products from the market, any of which
would hinder or preclude our ability to generate
revenues.
If we
identify side effects or other problems occur in future clinical
trials, we may be required to terminate or delay clinical
development of the product candidate. Furthermore, even if any of
our product candidates receive marketing approval, as greater
numbers of patients use a drug following its approval, if the
incidence of side effects increases or if other problems are
observed after approval that were not seen or anticipated during
pre-approval clinical trials, a number of potentially significant
negative consequences could result, including:
●
regulatory
authorities may withdraw their approval of the
product;
●
we may be required
to reformulate such products or change the way the product is
manufactured;
●
we may become the
target of lawsuits, including class action suits; and
●
our reputation in
the market place may suffer resulting in a significant drop in the
sales of such products.
Any of
these events could substantially increase the costs and expenses of
developing, commercializing and marketing any such product
candidates or could harm or prevent sales of any approved
products.
The number of subjects in our study pools in our clinical trials
may be deemed by regulators to be too small, which could cause
unanticipated delays or higher than anticipated costs.
Our
clinical trials have been conducted on a pool of subjects that is
structured for such research. Nevertheless, there is the
possibility that for statistical reasons, the pool of subjects may
be determined by the FDA or another regulatory body to be too small
to verify statistical significance. In such a case, the conclusions
from the previous trials will need to be established with at least
another set of clinical trials testing the relevant issue. Due to
the need to find new subjects for any additional clinical trials
and the limited pool from which such subjects can be selected, any
such determination by the FDA could result in a delay in obtaining
FDA approval or require additional financial
expenditures.
We may not be able to keep up with the rapid technological change
in the biotechnology and pharmaceutical industries, which could
make any future approved products obsolete and reduce our
revenue.
Biotechnology
and related pharmaceutical technologies have undergone and continue
to be subject to rapid and significant change. Our future will
depend in large part on our ability to maintain a competitive
position with respect to these technologies. Our competitors may
render our technologies obsolete by advances in existing
technological approaches or the development of new or different
approaches, potentially eliminating the advantages in our drug
discovery process that we believe we derive from our research
approach and proprietary technologies. In addition, any future
products that we develop, including our clinical product
candidates, may become obsolete before we recover expenses incurred
in developing those products, which may require that we raise
additional funds to continue our operations.
Competing products and technologies may make our proposed products
noncompetitive.
Flibanserin,
a daily-use oral drug sold under the trade name Addyi®, has
been approved by the FDA for HSDD in premenopausal women. There are
other products being developed for HSDD and other FSD indications,
including a number of oral combination drugs, some of which
incorporate testosterone, antidepressants or PDE-5 inhibitors.
There is competition to develop drugs for treatment of HSDD and FSD
in both premenopausal and postmenopausal patients. Our
bremelanotide drug product is intended to be administered by
subcutaneous injection, and an as desired drug product for the same
indication which utilizes another route of administration, such as
a conventional oral drug product, may make subcutaneous
bremelanotide noncompetitive.
29
There
are several products approved for use in treatment of obesity and
related indications, and a number of other products being developed
for treatment of obesity, including products in clinical trials.
There is intense competition to develop drugs for treatment of
obesity and related indications.
There
are a number of products approved for use in treating inflammatory
diseases and indications, and other products are being developed,
including products in clinical trials.
We are
aware of one recombinant natriuretic peptide product for acutely
decompensated congestive heart failure approved and marketed in the
United States, and another recombinant natriuretic peptide product
approved and marketed in Japan. Clinical trials on other
natriuretic peptide products are being conducted in the United
States. In addition, other products for treatment of heart failure
are either currently being marketed or in development, including a
combination drug which increases active levels of ANP.
As
discussed above, the biopharmaceutical industry is highly
competitive. We are likely to encounter significant competition
with respect to bremelanotide, other melanocortin receptor agonist
compounds and PL-3994. Most of our competitors have substantially
greater financial and technological resources than we do. Many of
them also have significantly greater experience in research and
development, marketing, distribution and sales than we do.
Accordingly, our competitors may succeed in developing, marketing,
distributing and selling products and underlying technologies more
rapidly than we can. These competitive products or technologies may
be more effective and useful or less costly than bremelanotide,
other melanocortin receptor agonist compounds or PL-3994. In
addition, academic institutions, hospitals, governmental agencies
and other public and private research organizations are also
conducting research and may develop competing products or
technologies on their own or through strategic alliances or
collaborative arrangements.
We rely on third parties over whom we have no control to conduct
preclinical studies, clinical trials and other research for our
product candidates and their failure to timely perform their
obligations could significantly harm our product
development.
We have
limited research and development staff and do not have dedicated
research or development facilities. We rely on third parties and
independent contractors, such as researchers at CROs and
universities, in certain areas that are particularly relevant to
our research and product development plans. We engage such
researchers to conduct our preclinical studies, clinical trials and
associated tests. These outside contractors are not our employees
and may terminate their engagements with us at any time. In
addition, we have limited control over the resources that these
contractors devote to our programs and they may not assign as great
a priority to our programs or pursue them as diligently as we would
if we were undertaking such programs ourselves. There is also
competition for these relationships, and we may not be able to
maintain our relationships with our contractors on acceptable
terms. If our third-party contractors do not carry out their duties
under their agreements with us, fail to meet expected deadlines or
fail to comply with appropriate standards for preclinical or
clinical research, our ability to develop our product candidates
and obtain regulatory approval on a timely basis, if at all, may be
materially adversely affected.
Production and supply of our product candidates depend on contract
manufacturers over whom we have no control, with the risk that we
may not have adequate supplies of our product candidates or
products.
We do
not have the facilities to manufacture our early stage potential
products such as PL-3994, PL-8177 and other melanocortin receptor
agonist compounds for use in preclinical studies and clinical
trials. Contract manufacturers must perform these manufacturing
activities in a manner that complies with FDA regulations. Our
ability to control third-party compliance with FDA requirements is
limited to contractual remedies and rights of inspection. The
manufacturers of our potential products and their manufacturing
facilities will be subject to continual review and periodic
inspections by the FDA and other authorities where applicable, and
must comply with ongoing regulatory requirements, including FDA
regulations concerning GMP. Failure of third-party manufacturers to
comply with GMP, medical device quality system regulations, or
other FDA requirements may result in enforcement action by the FDA.
Failure to conduct their activities in compliance with FDA
regulations could delay our development programs or negatively
impact our ability to receive FDA approval of our potential
products. Establishing relationships with new suppliers, who must
be FDA-approved, is a time-consuming and costly
process.
If we are unable to establish sales and marketing capabilities
within our organization or enter into and maintain agreements with
third parties to market and sell our product candidates, we may be
unable to generate product revenue.
We do
not currently have any experience in sales, marketing and
distribution of pharmaceutical products. We will need to establish
sales and marketing capabilities within our organization or
establish and maintain agreements with third parties to market and
sell our product candidates. We do not have marketing partners for
any of our products, including bremelanotide and PL-3994. If any of
these products are approved by the FDA or other regulatory
authorities, we must either develop marketing, distribution and
selling capacity and expertise, which will be costly and time
consuming, or enter into agreements with other companies to provide
these capabilities. We may not be able to enter into suitable
agreements on acceptable terms, if at all. Engaging a third party
to perform these services could delay the commercialization of any
of our product candidates, if approved for commercial sale. If we
are unable to establish adequate sales, marketing and distribution
capabilities, whether independently or with third parties, we may
not be able to generate product revenue and our business would
suffer. In addition, if we enter into arrangements with third
parties to perform sales, marketing and distribution services, our
product revenues are likely to be lower than if we could market and
sell any products that we develop ourselves.
30
We will need to hire additional employees in order to commercialize
our product candidates in the future. Any inability to manage
future growth could harm our ability to commercialize our product
candidates, increase our costs and adversely impact our ability to
compete effectively.
In
order to commercialize our product candidates, we will need to hire
experienced sales and marketing personnel to sell and market those
product candidates we decide to commercialize, and we will need to
expand the number of our managerial, operational, financial and
other employees to support commercialization. Competition exists
for qualified personnel in the biopharmaceutical
field.
Future
growth will impose significant added responsibilities on members of
management, including the need to identify, recruit, maintain and
integrate additional employees. Our future financial performance
and our ability to commercialize our product candidates and to
compete effectively will depend, in part, on our ability to manage
any future growth effectively.
Our ability to achieve revenues from the sale of our products in
development will depend, in part, on our ability to obtain adequate
reimbursement from Medicare, Medicaid, private insurers and other
healthcare payers.
Our
ability to successfully commercialize our products in development
will depend, in significant part, on the extent to which we or our
marketing partners can obtain reimbursement for our products and
also reimbursement at appropriate levels for the cost of our
products. Obtaining reimbursement from governmental payers,
insurance companies, HMOs and other third-party payers of
healthcare costs is a time-consuming and expensive process. There
is no guarantee that our products will ultimately be reimbursed.
There is significant uncertainty concerning third-party
reimbursement for the use of any pharmaceutical product
incorporating new technology and third-party reimbursement might
not be available for our proposed products once approved, or if
obtained, might not be adequate.
There
is significant uncertainty concerning the extent and scope of
third-party reimbursement for products treating HSDD and other
forms of FSD. Based on third-party reimbursement for approved
products treating ED, we believe bremelanotide for HSDD will be
classified as a Tier 3 drug, so that reimbursement will be limited
for bremelanotide for treatment of premenopausal women with HSDD,
assuming the product is approved by the FDA. If we are able to
obtain reimbursement, continuing efforts by governmental and
third-party payers to contain or reduce costs of healthcare may
adversely affect our future revenues and ability to achieve
profitability. Third-party payers are increasingly challenging the
prices charged for diagnostic and therapeutic products and related
services. Reimbursement from governmental payers is subject to
statutory and regulatory changes, retroactive rate adjustments,
administrative rulings and other policy changes, all of which could
materially decrease the range of products for which we are
reimbursed or the rates of reimbursement by government payers. In
addition, recent legislation reforming the healthcare system may
result in lower prices or the actual inability of prospective
customers to purchase our products in development. The cost
containment measures that healthcare payers and providers are
instituting and the effect of any healthcare reform could
materially and adversely affect our ability to operate profitably.
Furthermore, even if reimbursement is available, it may not be
available at price levels sufficient for us to realize a positive
return on our investment, which would have a material adverse
effect on our business, financial condition and results of
operations.
Even if we receive regulatory approval for our products in Europe,
we may not be able to secure adequate pricing and reimbursement in
Europe for us or any strategic partner to achieve
profitability.
Even if
one or more of our products are approved in Europe, we may be
unable to obtain appropriate pricing and reimbursement for such
products. In most European markets, demand levels for healthcare in
general and for pharmaceuticals in particular are principally
regulated by national governments. Therefore, pricing and
reimbursement for our products will have to be negotiated on a
“Member State by Member State” basis according to
national rules, as there does not exist a centralized European
process. As each Member State has its own national rules governing
pricing control and reimbursement policy for pharmaceuticals, there
are likely to be uncertainties attaching to the review process, and
the level of reimbursement that national governments are prepared
to accept. In the current economic environment, governments and
private payers or insurers are increasingly looking to contain
healthcare costs, including costs on drug therapies. If we are
unable to obtain adequate pricing and reimbursement for our
products in Europe, we or a potential strategic partner or
collaborator may not be able to cover the costs necessary to
manufacture, market and sell the product, limiting or preventing
our ability to achieve profitability.
We may incur substantial liabilities and may be required to limit
commercialization of our products in response to product liability
lawsuits.
The
testing and marketing of medical products entails an inherent risk
of product liability. If we cannot successfully defend ourselves
against product liability claims, we may incur substantial
liabilities or be required to limit commercialization of our
products or cease clinical trials. Our inability to obtain
sufficient product liability insurance at an acceptable cost to
protect against potential product liability claims could prevent or
inhibit the commercialization of pharmaceutical products we
develop, alone or with corporate collaborators. We currently carry
$10 million liability insurance in the aggregate as to certain
clinical trial risks, but we do not have and have not obtained
quotations for commercial product liability insurance. We, or any
corporate collaborators, may not in the future be able to obtain
insurance at a reasonable cost or in sufficient amounts, if at all.
Even if our agreements with any future corporate collaborators
entitle us to indemnification against losses, such indemnification
may not be available or adequate should any claim
arise.
31
Our internal computer systems, or those of our third-party
contractors or consultants, may fail or suffer security breaches,
which could result in a material disruption of our product
development programs.
In the
ordinary course of our business, we collect, store and transmit
confidential information. Despite the implementation of security
measures, our internal computer systems and those of our
third-party contractors and consultants are vulnerable to damage
from computer viruses, unauthorized access, natural disasters,
terrorism, war and telecommunication and electrical failures. We
rely on industry accepted measures and technology to secure
confidential and proprietary information maintained on our computer
systems. However, these measures and technology may not adequately
prevent security breaches. While we do not believe that we have
experienced any such system failure, accident, or security breach
to date, if such an event were to occur and cause interruptions in
our operations, it could result in a loss of clinical trial data
for our product candidates that could result in delays in our
regulatory approval efforts and significantly increase our costs to
recover or reproduce the data. Cyberattacks are increasing in their
frequency, sophistication and intensity. Cyberattacks could include
the deployment of harmful malware, denial-of-service attacks,
social engineering and other means to affect service reliability
and threaten the confidentiality, integrity and availability of
information. Significant disruptions of our information technology
systems or security breaches could adversely affect our business
operations and/or result in the loss, misappropriation, and/or
unauthorized access, use or disclosure of, or the prevention of
access to, confidential information (including trade secrets or
other intellectual property, proprietary business information and
personal information), and could result in financial, legal,
business and reputational harm to us. To the extent that any
disruption or security breach results in a loss of or damage to our
data or applications or other data or applications relating to our
technology, intellectual property, research and development or
product candidates, or inappropriate disclosure of confidential or
proprietary information, we could incur liabilities and the further
development of our product candidates could be
delayed.
We may be subject to claims that our employees, consultants or
independent contractors have wrongfully used or disclosed
confidential information of third parties or that our employees
have wrongfully used or disclosed alleged trade secrets of their
former employers.
We may in the future employ individuals who were previously
employed at universities or other biotechnology or pharmaceutical
companies, including our competitors or potential competitors.
Although we try to ensure that our employees, consultants and
independent contractors do not use the proprietary information or
know-how of others in their work for us, we may be subject to
claims that we or our employees, consultants or independent
contractors have inadvertently or otherwise used or disclosed
intellectual property, including trade secrets or other proprietary
information, of any of our employee’s former employer or
other third parties. Litigation may be necessary to defend against
these claims. If we fail in defending any such claims, in addition
to paying monetary damages, we may lose valuable intellectual
property rights or personnel, which could adversely impact our
business. Even if we are successful in defending against such
claims, litigation could result in substantial costs and be a
distraction to management and other employees.
We may be subject, directly or indirectly, to federal and state
healthcare fraud and abuse laws, false claims laws, and health
information privacy and security laws. If we are unable to comply,
or have not fully complied, with such laws, we could face
substantial penalties.
If we
begin commercializing any of our products in the United States, our
operations may be directly, or indirectly through our customers,
subject to various federal and state fraud and abuse laws,
including, without limitation, the federal Anti-Kickback Statute,
the federal False Claims Act, and physician sunshine laws and
regulations. These laws may impact, among other things, our
proposed sales, marketing, and education programs. In addition, we
may be subject to patient privacy regulation by both the federal
government and the states in which we conduct our business. The
laws that may affect our ability to operate include:
●
the federal
Anti-Kickback Statute, which prohibits, among other things, persons
or entities from soliciting, receiving, offering or providing
remuneration, directly or indirectly, in return for or to induce
either the referral of an individual for, or the purchase order or
recommendation of, any item or services for which payment may be
made under a federal health care program such as the Medicare and
Medicaid programs;
●
federal civil and
criminal false claims laws and civil monetary penalty laws, which
prohibit, among other things, individuals or entities from
knowingly presenting, or causing to be presented, claims for
payment from Medicare, Medicaid, or other third-party payors that
are false or fraudulent;
●
the federal Health
Insurance Portability and Accountability Act of 1996
(“HIPAA”), which created new federal criminal statutes
that prohibit executing a scheme to defraud any healthcare benefit
program and making false statements relating to healthcare
matters;
●
HIPPA, as amended
by the Health Information Technology and Clinical Health Act, and
its implementing regulations, which imposes certain requirements
relating to the privacy, security, and transmission of individually
identifiable health information;
32
●
The federal
physician sunshine requirements under the Affordable Care Act,
which require manufacturers of drugs, devices, biologics, and
medical supplies to report annually to the U.S. Department of
Health and Human Services information related to payments and other
transfers of value to physicians, other healthcare providers, and
teaching hospitals, and ownership and investment interests held by
physicians and other healthcare providers and their immediate
family members and applicable group purchasing organizations;
and
●
state law
equivalents of each of the above federal laws, such as
anti-kickback and false claims laws that may apply to items or
services reimbursed by any third-party payor, including commercial
insurers, state laws that require pharmaceutical companies to
comply with the pharmaceutical industry's voluntary compliance
guidelines and the relevant compliance guidance promulgated by the
federal government, or otherwise restrict payments that may be made
to healthcare providers and other potential referral sources; state
laws that require drug manufacturers to report information related
to payments and other transfers of value to physicians and other
healthcare providers or marketing expenditures; and state laws
governing the privacy and security of health information in certain
circumstances, many of which differ from each other in significant
ways and may not have the same effect, thus complicating compliance
efforts.
Because
of the breadth of these laws and the narrowness of the statutory
exceptions and safe harbors available, it is possible that some of
our business activities could be subject to challenge under one or
more of such laws. In addition, recent health care reform
legislation has strengthened these laws. For example, the
Affordable Care Act, among other things, amends the intent
requirement of the federal anti-kickback and criminal healthcare
fraud statutes. A person or entity no longer needs to have actual
knowledge of this statute or specific intent to violate it.
Moreover, the Affordable Care Act provides that the government may
assert that a claim including items or services resulting from a
violation of the federal anti-kickback statute constitutes a false
or fraudulent claim for purposes of the False Claims
Act.
If our
operations are found to be in violation of any of the laws
described above or any other governmental regulations that apply to
us, we may be subject to penalties, including civil and criminal
penalties, damages, fines, exclusion from participation in
government health care programs, such as Medicare and Medicaid,
imprisonment, and the curtailment or restructuring of our
operations, any of which could adversely affect our ability to
operate our business and our results of operations
We are highly dependent on our management team, senior staff
professionals and third-party contractors and consultants, and the
loss of their services could materially adversely affect our
business.
We rely
on our relatively small management team and staff as well as
various contractors and consultants to provide critical services.
Our ability to execute our clinical programs for bremelanotide,
PL-3994 and PL-8177, and our preclinical programs for melanocortin
and natriuretic peptide drug candidates, depends on our continued
retention and motivation of our management and senior staff
professionals, including executive officers and senior members of
product development and management, including commercialization,
who possess significant technical expertise and experience and
oversee our development and commercialization programs. If we lose
the services of existing key personnel, our development programs
could be adversely affected if suitable replacement personnel are
not recruited quickly. Our success also depends on our ability to
develop and maintain relationships with contractors, consultants
and scientific advisors.
There
is competition for qualified personnel, contractors and consultants
in the pharmaceutical industry, which makes it difficult to attract
and retain the qualified personnel, contractors and consultants
necessary for the development and growth of our business. Our
failure to attract and retain such personnel, contractors and
consultants could have a material adverse effect on our business,
results of operations and financial condition.
Because we expect bremelanotide for the treatment of HSDD to be
classified as a Tier 3 drug with reimbursement by third-party
payers similar to approved products for treating ED, demand for
this product will be tied to discretionary spending levels of our
targeted patient population and particularly affected by
unfavorable economic conditions.
The
market for HSDD may be particularly vulnerable to unfavorable
economic conditions. We expect bremelanotide for the treatment of
HSDD to have significant copay or deductible requirements and to be
only partially reimbursed by third-party payers and, as a result,
demand for this product may be tied to discretionary spending
levels of our targeted patient population. The recent global
financial crisis caused extreme volatility and disruptions in the
capital and credit markets. A severe or prolonged economic downturn
could result in a variety of risks to our business, including
weakened demand for bremelanotide for HSDD or any future product
candidates, if approved, and our ability to raise additional
capital when needed on acceptable terms, if at all. This is
particularly true in Europe, which is undergoing a continued severe
economic crisis. A weak or declining economy could also strain our
suppliers, possibly resulting in supply disruption, or cause our
customers to delay making payments for our services. Any of the
foregoing could harm our business and we cannot anticipate all of
the ways in which future economic climates and financial market
conditions could adversely impact our business.
33
Risks Related to Government Regulation
Both before and after marketing approval, our product candidates
are subject to ongoing regulatory requirements and, if we fail to
comply with these continuing requirements, we could be subject to a
variety of sanctions and the sale of any approved commercial
products could be suspended.
Both
before and after regulatory approval to market a particular product
candidate, the manufacturing, labeling, packaging, adverse event
reporting, storage, advertising and promotion and record keeping
related to the product candidates are subject to extensive
regulatory requirements. If we fail to comply with the regulatory
requirements of the FDA and other applicable U.S. and foreign
regulatory authorities, we could be subject to administrative or
judicially imposed sanctions, including:
●
restrictions on the
products or manufacturing process;
●
warning
letters;
●
civil or criminal
penalties;
●
fines;
●
injunctions;
●
imposition of a
Corporate Integrity Agreement requiring heightened monitoring of
our compliance functions, overseen by outside monitors, and
enhanced reporting requirements to, and oversight by, the FDA and
other government agencies;
●
product seizures or
detentions and related publicity requirements;
●
suspension or
withdrawal of regulatory approvals;
●
regulators or IRBs
may not authorize us or any potential future collaborators to
commence a clinical trial or conduct a clinical trial at a
prospective trial site;
●
total or partial
suspension of production; and
●
refusal to approve
pending applications for marketing approval of new product
candidates.
Changes
in the regulatory approval policy during the development period,
changes in or the enactment of additional regulations or statutes,
or changes in the regulatory review for each submitted product
application may cause delays in the approval or rejection of an
application. Even if the FDA approves a product candidate, the
approval may impose significant restrictions on the indicated uses,
conditions for use, labeling, advertising, promotion, marketing
and/or production of such product, and may impose ongoing
requirements for post-approval studies, including additional
research and development and clinical trials. The approval may also
impose a risk evaluation and mitigation strategy
(“REMS”) on a product if the FDA believes there is a
reason to monitor the safety of the drug in the marketplace. REMS
may include requirements for additional training for health care
professionals, safety communication efforts and limits on channels
of distribution, among other things. The sponsor would be required
to evaluate and monitor the various REMS activities and adjust them
if need be. The FDA also may impose various civil or criminal
sanctions for failure to comply with regulatory requirements,
including withdrawal of product approval.
Furthermore,
the approval procedure and the time required to obtain approval
varies among countries and can involve additional testing beyond
that required by the FDA. Approval by one regulatory authority does
not ensure approval by regulatory authorities in other
jurisdictions. The FDA has substantial discretion in the approval
process and may refuse to accept any application or may decide that
our data are insufficient for approval and require additional
preclinical, clinical or other studies.
In
addition, varying interpretations of the data obtained for
preclinical and clinical testing could delay, limit or prevent
regulatory approval of a product candidate. Even if we submit an
application to the FDA for marketing approval of a product
candidate, it may not result in marketing approval from the
FDA.
We do
not expect to receive regulatory approval for the commercial sale
of any of our product candidates that are in development in the
near future, if at all. The inability to obtain FDA approval or
approval from comparable authorities in other countries for our
product candidates would prevent us or any potential future
collaborators from commercializing these product candidates in the
United States or other countries.
We may not be able to obtain regulatory approval of bremelanotide
for HSDD even if the product is effective in treating
HSDD.
Clinical
drug development programs for our product candidates are very
expensive, time-consuming, difficult to design and implement and
their outcome is inherently uncertain. Approval of bremelanotide
for treatment of HSDD in premenopausal women requires a
determination by the FDA that the product is both safe and
effective. Our Phase 3 clinical trials for HSDD demonstrated what
we believe to be an acceptable safety profile and statistically
significant efficacy. However, the FDA may ultimately disagree with
our safety analysis, definition of efficacy in HSDD, our clinical
trial designs, or our interpretation of our clinical trial results.
It is not possible to predict, with any assurance, whether the FDA
will approve bremelanotide for any indications. The FDA may deny or
delay approval of any application for bremelanotide if the FDA
determines that the clinical data do not adequately establish the
safety of the drug even if efficacy is established. If FDA approves
bremelanotide, the approved labeling of the product may be limited
or restricted in such ways as to inhibit or prevent the successful
market acceptance and profitability of the product. Bremelanotide
could take a significantly longer time to obtain approval than we
expect and it may never gain approval. If regulatory approval of
bremelanotide is delayed, limited or never obtained, our business,
financial condition and results of operations would be materially
adversely affected.
34
The regulatory approval process is lengthy, expensive and
uncertain, and may prevent us from obtaining the approvals that we
require.
Government
authorities in the United States and other countries extensively
regulate the advertising, labeling, storage, record-keeping,
safety, efficacy, research, development, testing, manufacture,
promotion, marketing and distribution of drug products. Drugs are
subject to rigorous regulation in the United States by the FDA and
similar regulatory bodies in other countries. The steps ordinarily
required by the FDA before a new drug may be marketed in the United
States include:
●
completion of
non-clinical tests including preclinical laboratory and formulation
studies and animal testing and toxicology;
●
submission to the
FDA of an IND application, which must become effective before
clinical trials may begin, and which may be placed on
“clinical hold” by the FDA, meaning the trial may not
commence, or must be suspended or terminated prior to
completion;
●
performance of
adequate and well-controlled Phase 1, 2 and 3 human clinical trials
to establish the safety and efficacy of the drug for each proposed
indication, and potentially post-approval or Phase 4 studies to
further define the drug’s efficacy and safety, generally or
in specific patient populations;
●
submission to the
FDA of an NDA that must be accompanied by a substantial “user
fee” payment;
●
FDA review and
approval of the NDA before any commercial marketing or sale;
and
●
compliance with
post-approval commitments and requirements.
Satisfaction
of FDA pre-market approval requirements for new drugs typically
takes a number of years and the actual time required for approval
may vary substantially based upon the type, complexity and novelty
of the product or disease to be treated by the drug. The results of
product development, preclinical studies and clinical trials are
submitted to the FDA as part of an NDA. The NDA also must contain
extensive manufacturing information, demonstrating compliance with
applicable GMP requirements. Once the submission has been accepted
for filing, the FDA generally has twelve months to review the
application and respond to the applicant. Such response may be an
approval or may be a “complete response letter”
outlining additional data or steps that must be completed prior to
further FDA review of the NDA. The review process is often
significantly extended by FDA requests for additional information
or clarification. Success in early stage clinical trials does not
assure success in later stage clinical trials. Data obtained from
clinical trials is not always conclusive and may be susceptible to
varying interpretations that could delay, limit or prevent
regulatory approval. The FDA may refer the NDA to an advisory
committee for review, evaluation and recommendation as to whether
the application should be approved, but the FDA is not bound by the
recommendation of the advisory committee. The FDA may deny or delay
approval of applications that do not meet applicable regulatory
criteria or if the FDA determines that the clinical data do not
adequately establish the safety and efficacy of the drug.
Therefore, our proposed products could take a significantly longer
time than we expect or may never gain approval. If regulatory
approval is delayed or never obtained, our business, financial
condition and results of operations would be materially adversely
affected.
Some of
our products or product candidates, including bremelanotide, may be
used in combination with a drug delivery device, such as an
injector or other delivery system. Medical products containing a
combination of new drugs, biological products or medical devices
are regulated as “combination products” in the United
States. A combination product generally is defined as a product
comprised of components from two or more regulatory categories
(e.g., drug/device, device/biologic, drug/biologic). Each component
of a combination product is subject to the requirements established
by the FDA for that type of component, whether a new drug, biologic
or device. In order to facilitate pre-market review of combination
products, the FDA designates one of its centers to have primary
jurisdiction for the pre-market review and regulation of the
overall product based upon a determination by the FDA of the
primary mode of action of the combination product. The
determination whether a product is a combination product or two
separate products is made by the FDA on a case-by-case basis. Our
product candidates intended for use with such devices, or expanded
indications that we may seek for our products used with such
devices, may not be approved or may be substantially delayed in
receiving approval if the devices do not gain and/or maintain their
own regulatory approvals or clearances. Where approval of the drug
product and device is sought under a single application, the
increased complexity of the review process may delay approval. In
addition, because these drug delivery devices are provided by
single source unaffiliated third-party companies, we are dependent
on the sustained cooperation and effort of those third-party
companies both to supply the devices, maintain their own regulatory
compliance, and, in some cases, to conduct the studies required for
approval or other regulatory clearance of the devices. We are also
dependent on those third-party companies continuing to maintain
such approvals or clearances once they have been received. Failure
of third-party companies to supply the devices, to successfully
complete studies on the devices in a timely manner, or to obtain or
maintain required approvals or clearances of the devices, and
maintain compliance with all regulatory requirements, could result
in increased development costs, delays in or failure to obtain
regulatory approval and delays in product candidates reaching the
market or in gaining approval or clearance for expanded labels for
new indications.
35
Upon
approval, a product candidate may be marketed only in those dosage
forms and for those indications approved by the FDA. Once approved,
the FDA may withdraw the product approval if compliance with
regulatory requirements is not maintained or if problems occur
after the product reaches the marketplace. In addition, the FDA may
require post-marketing studies, referred to as Phase 4 studies, to
monitor the approved products in a specific subset of patients or a
larger number of patients than were required for product approval
and may limit further marketing of the product based on the results
of these post-market studies. The FDA has broad post-market
regulatory and enforcement powers, including the ability to seek
injunctions, levy fines and civil penalties, criminal prosecution,
withdraw approvals and seize products or request
recalls.
If
regulatory approval of any of our product candidates is granted, it
will be limited to certain disease states or conditions, patient
populations, duration or frequency of use, and will be subject to
other conditions as set forth in the FDA-approved labeling. Adverse
experiences with the product must be reported to the FDA and could
result in the imposition of market restriction through labeling
changes or in product removal. Product approvals may be withdrawn
if compliance with regulatory requirements is not maintained or if
problems concerning safety or efficacy of the product occur
following approval.
Outside
the United States, our ability to market our product candidates
will also depend on receiving marketing authorizations from the
appropriate regulatory authorities. The foreign regulatory approval
process generally includes all of the risks associated with FDA
approval described above. The requirements governing the conduct of
clinical trials and marketing authorization vary widely from
country to country. At present, foreign marketing authorizations
are applied for at a national level, although within the European
Community (“EC”), registration procedures are available
to companies wishing to market a product to more than one EC member
state. If the regulatory authority is satisfied that adequate
evidence of safety, quality and efficiency has been presented, a
marketing authorization will be granted. If we do not obtain, or
experience difficulties in obtaining, such marketing
authorizations, our business, financial condition and results of
operations may be materially adversely affected.
Legislative or regulatory healthcare reforms in the United States
may make it more difficult and costly for us to obtain regulatory
clearance or approval of bremelanotide for HSDD or any future
product candidates and to produce, market and distribute our
products after clearance or approval is obtained.
From
time to time, legislation is drafted and introduced in Congress,
and court decisions are issued, that could significantly change the
statutory provisions governing the regulatory clearance or
approval, manufacture and marketing of regulated products or the
reimbursement thereof. In addition, FDA regulations and guidance
are often revised or reinterpreted by the FDA in ways that may
significantly affect our business and our products. Any new
regulations or revisions or reinterpretations of existing
regulations may impose additional costs or lengthen review times of
bremelanotide for HSDD or any future product candidates. We cannot
determine what effect changes in regulations, statutes, court
decisions, legal interpretation or policies, when and if
promulgated, enacted, issued or adopted may have on our business in
the future. Such changes could, among other things:
●
require changes to
manufacturing methods;
●
require recall,
replacement or discontinuance of one or more of our
products;
●
require additional
recordkeeping;
●
limit or restrict
our ability to engage in certain types of marketing or promotional
activities;
●
alter or eliminate
the scope or terms of any currently available regulatory
exclusivities; and
●
restrict or
eliminate our ability to settle any patent litigation we may bring
against potential generic competitors.
Each of
these would likely entail substantial time and cost and could
materially harm our business and our financial results. In
addition, delays in receipt of or failure to receive regulatory
clearances or approvals for any future products would harm our
business, financial condition and results of
operations.
Changes in healthcare policy could adversely affect our
business.
U.S.
and foreign governments continue to propose and pass legislation
designed to reduce the cost of healthcare. For example, the
Medicare Prescription Drug Improvement and Modernization Act of
2003 (“MMA”), expanded Medicare coverage for drugs
purchased by Medicare beneficiaries and introduced new
reimbursement methodologies. In addition, this law provided
authority for limiting the number of drugs that will be covered in
any therapeutic class. Until our products are approved and drug
plan formulary listing decisions are made, we do not know what
impact the MMA and similar laws will have on the availability of
coverage for and the price that we receive for any approved
products. Moreover, while the MMA applies only to drug benefits for
Medicare beneficiaries, private payers often follow Medicare
policies in setting their own reimbursement policies, and any
reduction in reimbursement that results from the MMA may result in
similar reductions by private payers.
The
Affordable Care Act, as amended by the Health Care and Education
Affordability Reconciliation Act (together the “ACA”),
was adopted in 2010. This law has resulted in an increase in the
number of people who are covered by both public and private
insurance and has changed the way health care is financed by both
government health program and private insurers, with significant
impacts on the pharmaceutical industry. The ACA contains a number
of provisions that may impact our business and operations in ways
that may negatively affect our potential revenues in the future.
For example, the ACA imposes a non-deductible excise tax on
pharmaceutical manufacturers or importers that sell branded
prescription drugs to U.S. government programs that we believe will
increase the cost of any products that we develop. In addition, as
part of the ACA’s provisions closing a funding gap that
currently exists in the Medicare Part D prescription drug program
(commonly known as the “donut hole”), we will be
required to provide a 50% discount on any branded prescription
drugs that we develop sold to beneficiaries who fall within the
donut hole. We cannot predict all of the specific effects the ACA
or any future healthcare reform legislation will have on our
business, but they could have a material adverse effect on our
business and financial condition.
36
Some of the provisions of the
ACA have yet to be fully implemented, while
certain provisions have been subject to judicial and Congressional
challenges, as well as efforts by the Trump administration to
repeal or replace certain aspects of the
ACA . Since January 2017, President Trump has
signed two executive orders and other directives designed to delay,
circumvent, or loosen certain requirements mandated by
the
ACA. Concurrently,
Congress has considered legislation that would repeal or repeal and
replace all or part of the
ACA. While Congress has not passed repeal
legislation, the 2017 Tax Act includes a provision repealing,
effective January 1, 2019, the tax-based shared
responsibility payment imposed by the
ACA on certain individuals who fail to
maintain qualifying health coverage for all or part of a year that
is commonly referred to as the “individual mandate”.
Congress may consider other legislation to repeal or replace
elements of the ACA. Because of the continued uncertainty about the
implementation of the
ACA,
including the potential for further legal challenges or repeal
of
the ACA, we cannot
quantify or predict with any certainty the likely impact of
the
ACA or its repeal on
our business, prospects, financial condition or results of
operations.
The
availability of government reimbursement for prescription drugs
will be impacted by the Budget Control Act of 2011, which was
signed into law on August 2, 2011. This law is expected to result
in federal spending cuts totaling between $1.2 trillion and $1.5
trillion over the next decade, over half of which will include cuts
in Medicare and other health-related spending.
Risks Related to Our Intellectual Property
If we fail to adequately protect or enforce our intellectual
property rights or secure rights to patents of others, the value of
our intellectual property rights would diminish.
Our
success, competitive position and future revenues will depend in
part on our ability and the abilities of our licensors to obtain
and maintain patent protection for our products, methods, processes
and other technologies, to preserve our trade secrets, to prevent
third parties from infringing on our proprietary rights and to
operate without infringing the proprietary rights of third parties.
We cannot predict:
●
the degree and
range of protection any patents will afford us against competitors,
including whether third parties will find ways to invalidate or
otherwise circumvent our patents;
●
if and when patents
will be issued;
●
whether or not
others will obtain patents claiming aspects similar to those
covered by our patents and patent applications; and
●
whether we will
need to initiate litigation or administrative proceedings, which
may be costly whether we win or lose.
If our
products, methods, processes and other technologies infringe the
proprietary rights of other parties we could incur substantial
costs and we may have to:
●
obtain licenses,
which may not be available on commercially reasonable terms, if at
all;
●
redesign our
products or processes to avoid infringement;
●
stop using the
subject matter claimed in the patents held by others;
●
pay damages;
or
●
defend litigation
or administrative proceedings, which may be costly whether we win
or lose, and which could result in a substantial diversion of our
management resources.
We may become involved in lawsuits to protect or enforce our
patents or other intellectual property or the patents of our
licensors, which could be expensive and time
consuming.
Competitors
may infringe our intellectual property, including our patents or
the patents of our licensors. As a result, we may be required to
file infringement claims to stop third-party infringement or
unauthorized use. This can be expensive, particularly for a company
of our size, and time-consuming. In addition, in an infringement
proceeding, a court may decide that a patent of ours is not valid
or is unenforceable, or may refuse to stop the other party from
using the technology at issue on the grounds that our patent claims
do not cover its technology or that the factors necessary to grant
an injunction against an infringer are not satisfied.
An
adverse determination of any litigation or other proceedings could
put one or more of our patents at risk of being invalidated or
interpreted narrowly and could put our patent applications at risk
of not issuing.
Interference,
derivation or other proceedings brought at the United States Patent
and Trademark Office (“USPTO”) may be necessary to
determine the priority or patentability of inventions with respect
to our patent applications or those of our licensors or
collaborators. Litigation or USPTO proceedings brought by us may
fail or may be invoked against us by third parties. Even if we are
successful, domestic or foreign litigation or USPTO or foreign
patent office proceedings may result in substantial costs and
distraction to our management. We may not be able, alone or with
our licensors or collaborators, to prevent misappropriation of our
proprietary rights, particularly in countries where the laws may
not protect such rights as fully as in the United
States.
37
Furthermore,
because of the substantial amount of discovery required in
connection with intellectual property litigation or other
proceedings, there is a risk that some of our confidential
information could be compromised by disclosure during this type of
litigation or proceedings. In addition, during the course of this
kind of litigation or proceedings, there could be public
announcements of the results of hearings, motions or other interim
proceedings or developments or public access to related documents.
If investors perceive these results to be negative, the market
price for our common stock could be significantly
harmed.
If we infringe or are alleged to infringe intellectual property
rights of third parties, our business could be harmed.
Our
research, development and commercialization activities may infringe
or otherwise violate or be claimed to infringe or otherwise violate
patents owned or controlled by other parties. There may also be
patent applications that have been filed but not published that,
when issued as patents, could be asserted against us. These third
parties could bring claims against us that would cause us to incur
substantial expenses and, if successful against us, could cause us
to pay substantial damages. Further, if a patent infringement suit
were brought against us, we could be forced to stop or delay
research, development, manufacturing or sales of the product or
product candidate that is the subject of the suit.
As a
result of patent infringement claims, or to avoid potential claims,
we may choose or be required to seek licenses from third parties.
These licenses may not be available on acceptable terms, or at all.
Even if we are able to obtain a license, the license would likely
obligate us to pay license fees or royalties or both, and the
rights granted to us might be nonexclusive, which could result in
our competitors gaining access to the same intellectual property.
Ultimately, we could be prevented from commercializing a product,
or be forced to cease some aspect of our business operations, if,
as a result of actual or threatened patent infringement claims, we
are unable to enter into licenses on acceptable terms, if at
all.
There
has been substantial litigation and other proceedings regarding
patent and other intellectual property rights in the pharmaceutical
industry. In addition to infringement claims against us, we may
become a party to other patent litigation and other proceedings,
including interference, derivation or post-grant proceedings
declared or granted by the USPTO and similar proceedings in foreign
countries, regarding intellectual property rights with respect to
our current or future products. The cost to us of any patent
litigation or other proceeding, even if resolved in our favor,
could be substantial. Some of our competitors may be able to
sustain the costs of such litigation or proceedings more
effectively than we can because of their substantially greater
financial resources. Patent litigation and other proceedings may
also absorb significant management time. Uncertainties resulting
from the initiation and continuation of patent litigation or other
proceedings could impair our ability to compete in the marketplace.
The occurrence of any of the foregoing could have a material
adverse effect on our business, financial condition or results of
operations.
Our patent applications and the enforcement or defense of our
issued patents may be impacted by the application of or changes in
U.S. and foreign standards.
The
standards that the USPTO and foreign patent offices use to grant
patents are not always applied predictably or uniformly and can
change. Consequently, our pending patent applications may not be
allowed and, if allowed, may not contain the type and extent of
patent claims that will be adequate to conduct our business as
planned. Additionally, any issued patents we currently own or
obtain in the future may have a shorter patent term than expected
or may not contain claims that will permit us to stop competitors
from using our technology or similar technology or from copying our
product candidates. Similarly, the standards that courts use to
interpret patents are not always applied predictably or uniformly
and may evolve, particularly as new technologies develop. In
addition, changes to patent laws in the United States or other
countries may be applied retroactively to affect the validation
enforceability, or term of our patent. For example, the U.S.
Supreme Court has recently modified some legal standards applied by
the USPTO in examination of U.S. patent applications, which may
decrease the likelihood that we will be able to obtain patents and
may increase the likelihood of challenges to patents we obtain or
license. In addition, changes to the U.S. patent system have come
into force under the Leahy-Smith America Invents Act, or the
Leahy-Smith Act, which was signed into law in September 2011. The
Leahy-Smith Act included a number of significant changes to U.S.
patent law. These include provisions that affect the way patent
applications will be prosecuted and may also affect patent
litigation. In particular, under the Leahy-Smith Act, the United
States transitioned in March 2013 to a “first to file”
system in which the first inventor to file a patent
application will be entitled to the patent. Third parties are
allowed to submit prior art before the issuance of a patent by the
USPTO, and may become involved in opposition, derivation,
reexamination, inter-parties review or interference proceedings
challenging our patent rights or the patent rights of others. An
adverse determination in any such submission, proceeding or
litigation could reduce the scope of, or invalidate, our patent
rights, which could adversely affect our competitive
position.
While
we cannot predict with certainty the impact the Leahy-Smith Act or
any potential future changes to the U.S. or foreign patent systems
will have on the operation of our business, the Leahy-Smith Act and
such future changes could increase the uncertainties and costs
surrounding the prosecution of our patent applications and the
enforcement or defense of our issued patents, all of which could
have a material adverse effect on our business, results of
operations, financial condition and cash flows and future
prospects.
38
We may not be able to protect our intellectual property rights
throughout the world.
Filing,
prosecuting and defending patents on product candidates in all
countries throughout the world would be prohibitively expensive,
and our intellectual property rights in some countries outside the
United States can be less extensive than those in the United
States. In addition, the laws of some foreign countries do not
protect intellectual property rights to the same extent as federal
and state laws in the United States and in some cases may even
force us to grant a compulsory license to competitors or other
third parties. Consequently, we may not be able to prevent third
parties from practicing our inventions in all countries outside the
United States, or from selling or importing products made using our
inventions in and into the United States or other jurisdictions.
Competitors may use our technologies in jurisdictions where we have
not obtained patent protection to develop their own products and
further, may export otherwise infringing products to territories
where we have patent protection, but enforcement is not as strong
as that in the United States. These products may compete with our
products and our patents or other intellectual property rights may
not be effective or sufficient to prevent them from
competing.
Many
companies have encountered significant problems in protecting and
defending intellectual property rights in foreign jurisdictions.
The legal systems of certain countries, particularly certain
developing countries, do not favor the enforcement of patents and
other intellectual property protection, particularly those relating
to biopharmaceuticals, which could make it difficult for us to stop
the infringement of our patents or marketing of competing products
in violation of our proprietary rights generally. Proceedings to
enforce our patent rights in foreign jurisdictions could result in
substantial costs and divert our efforts and attention from other
aspects of our business, could put our patents at risk of being
invalidated or interpreted narrowly and our patent applications at
risk of not issuing and could provoke third parties to assert
claims against us. We may not prevail in any lawsuits that we
initiate and the damages or other remedies awarded, if any, may not
be commercially meaningful. Accordingly, our efforts to enforce our
intellectual property rights around the world may be inadequate to
obtain a significant commercial advantage from the intellectual
property that we develop or license.
In
addition, our ability to protect and enforce our intellectual
property rights may be adversely affected by unforeseen changes in
domestic and foreign intellectual property laws.
If we are unable to keep our trade secrets confidential, our
technologies and other proprietary information may be used by
others to compete against us.
In
addition to our reliance on patents, we attempt to protect our
proprietary technologies and processes by relying on trade secret
laws and agreements with our employees and other persons who have
access to our proprietary information. These agreements and
arrangements may not provide meaningful protection for our
proprietary technologies and processes in the event of unauthorized
use or disclosure of such information and may not provide an
adequate remedy in the event of unauthorized disclosure of
confidential information. In addition, our competitors may
independently develop substantially equivalent technologies and
processes or gain access to our trade secrets or technology, either
of which could materially and adversely affect our competitive
position.
Risks Related to the Ownership of Our Common Stock
Our stock price is volatile and may fluctuate in a way that is
disproportionate to our operating performance and we expect it to
remain volatile, which could limit investors’ ability to sell
stock at a profit.
The
volatile price of our stock makes it difficult for investors to
predict the value of their investment, to sell shares at a profit
at any given time or to plan purchases and sales in advance. A
variety of factors may affect the market price of our common stock.
These include, but are not limited to:
●
publicity regarding
actual or potential clinical results relating to products under
development by our competitors or us;
●
delay or failure in
initiating, completing or analyzing preclinical or clinical trials
or unsatisfactory designs or results of these trials;
●
interim decisions
by regulatory agencies, including the FDA, as to clinical trial
designs, acceptable safety profiles and the benefit/risk ratio of
products under development;
●
achievement or
rejection of regulatory approvals by our competitors or by
us;
●
announcements of
technological innovations or new commercial products by our
competitors or by us;
●
developments
concerning proprietary rights, including patents;
●
developments
concerning our collaborations;
●
regulatory
developments in the United States and foreign
countries;
●
economic or other
crises and other external factors;
●
period-to-period
fluctuations in our revenue and other results of
operations;
●
changes in the
structure of healthcare payment systems or other actions that
affect the effective reimbursement rates for treatment regimens
containing our products;
●
changes in
financial estimates and recommendations by securities analysts
following our business or our industry;
●
sales of our common
stock (or the perception that such sales could occur);
and
●
the other factors
described in this “Risk Factors” section.
39
We will
not be able to control many of these factors, and we believe that
period-to-period comparisons of our financial results will not
necessarily be indicative of our future performance. If our
revenues, if any, in any particular period do not meet
expectations, we may not be able to adjust our expenditures in that
period, which could cause our operating results to suffer further.
If our operating results in any future period fall below the
expectations of securities analysts or investors, our stock price
may fall by a significant amount.
For the
12-month period ended March 31, 2018, the price of our stock has
been volatile, ranging from a high of $1.20 per share to a low of
$0.29 per share. In addition, the stock market in general, and the
market for biotechnology companies in particular, has experienced
extreme price and volume fluctuations that may have been unrelated
or disproportionate to the operating performance of individual
companies. These broad market and industry factors may seriously
harm the market price of our common stock, regardless of our
operating performance.
As a public company in the United States, we are subject to the
Sarbanes-Oxley Act of 2002 (“Sarbanes-Oxley”). We can
provide no assurance that we will, at all times, in the future be
able to report that our internal controls over financial reporting
are effective.
Companies
that file reports with the SEC, including us, are subject to the
requirements of Section 404 of Sarbanes-Oxley. Section 404 requires
management to establish and maintain a system of internal control
over financial reporting, and annual reports on Form 10-K filed
under the Exchange Act, must contain a report from management
assessing the effectiveness of a company’s internal control
over financial reporting. Ensuring that we have adequate internal
financial and accounting controls and procedures in place to
produce accurate financial statements on a timely basis will be a
costly and time-consuming effort that needs to be re-evaluated
frequently. Failure on our part to have effective internal
financial and accounting controls would cause our financial
reporting to be unreliable, could have a material adverse effect on
our business, operating results, and financial condition, and could
cause the trading price of our common stock to fall
dramatically.
If securities or industry analysts do not publish research or
publish unfavorable research about our business, our stock price
and trading volume could decline.
As a
smaller company, it may be difficult for us to attract or retain
the interest of equity research analysts. A lack of research
coverage may adversely affect the liquidity of and market price of
our common stock. We do not have any control of the equity research
analysts or the content and opinions included in their reports. The
price of our stock could decline if one or more equity research
analysts downgrade our stock or issue other unfavorable commentary
or research. If one or more equity research analysts ceases
coverage of our company, or fails to publish reports on us
regularly, demand for our stock could decrease, which in turn could
cause our stock price or trading volume to decline.
Holders of our preferred stock may have interests different from
our common stockholders.
We are
permitted under our certificate of incorporation to issue up to
10,000,000 shares of preferred stock. We can issue shares of our
preferred stock in one or more series and can set the terms of the
preferred stock without seeking any further approval from our
common stockholders. 4,030 shares of our Series A Preferred Stock
remain outstanding as of March 31, 2018. Each share of Series A
Preferred Stock is convertible at any time, at the option of the
holder, and such conversion could dilute the value of our common
stock to current stockholders and could adversely affect the market
price of our common stock. The conversion price decreases if we
sell common stock (or equivalents) for a price per share less than
the conversion price or less than the market price of the common
stock and is also subject to adjustment upon the occurrence of a
merger, reorganization, consolidation, reclassification, stock
dividend or stock split which results in an increase or decrease in
the number of shares of common stock outstanding. Upon (i)
liquidation, dissolution or winding up of the Company, whether
voluntary or involuntary, (ii) sale or other disposition of all or
substantially all of the assets of the Company, or (iii) any
consolidation, merger, combination, reorganization or other
transaction in which the Company is not the surviving entity or in
which the shares of common stock constituting in excess of 50% of
the voting power of the Company are exchanged for or changed into
other stock or securities, cash and/or any other property, after
payment or provision for payment of the debts and other liabilities
of the Company, the holders of Series A Preferred Stock will be
entitled to receive, pro rata and in preference to the holders of
any other capital stock, an amount per share equal to $100 plus
accrued but unpaid dividends, if any. Any preferred stock that we
issue may rank ahead of our common stock in terms of dividend
priority or liquidation premiums and may have greater voting rights
than our common stock.
Because we do not anticipate paying any cash dividends on our
common stock in the foreseeable future, capital appreciation, if
any, will be your sole source of gains.
We do
not anticipate paying any cash dividends in the foreseeable future
and intend to retain future earnings, if any, for the development
and expansion of our business. Our outstanding Series A Preferred
Stock, consisting of 4,030 shares on March 31, 2018, provides that
we may not pay a dividend or make any distribution to holders of
any class of stock unless we first pay a special dividend or
distribution of $100 per share to the holders of the Series A
Preferred Stock. In addition, the terms of existing or future
agreements may limit our ability to pay dividends. As a result,
capital appreciation, if any, of our common stock will be your sole
source of gain for the foreseeable future.
40
Anti-takeover provisions of Delaware law and our charter documents
may make potential acquisitions more difficult and could result in
the entrenchment of management.
We are
incorporated in Delaware. Anti-takeover provisions of Delaware law
and our charter documents may make a change in control or efforts
to remove management more difficult. Also, under Delaware law, our
board of directors may adopt additional anti-takeover measures.
Under Section 203 of the Delaware General Corporation Law, a
corporation may not engage in a business combination with an
“interested stockholder” for a period of three years
after the date of the transaction in which the person first becomes
an “interested stockholder,” unless the business
combination is approved in a prescribed manner.
We are
authorized to issue up to 300,000,000 shares of common stock. To
the extent that we sell or otherwise issue authorized but currently
unissued shares, this could have the effect of making it more
difficult for a third party to acquire a majority of our
outstanding voting stock.
Our
charter authorizes us to issue up to 10,000,000 shares of preferred
stock and to determine the terms of those shares of stock without
any further action by our stockholders. If we exercise this right,
it could be more difficult for a third party to acquire a majority
of our outstanding voting stock.
In
addition, our equity incentive plans generally permit us to
accelerate the vesting of options and other stock rights granted
under these plans in the event of a change of control. If we
accelerate the vesting of options or other stock rights, this
action could make an acquisition more costly.
The
application of these provisions could have the effect of delaying
or preventing a change of control, which could adversely affect the
market price of our common stock.
We are a smaller reporting company and the reduced disclosure
requirements applicable to smaller reporting companies may make our
Common Stock less attractive to investors.
We are
currently a “smaller reporting company” as defined in
the Exchange Act. Smaller reporting companies are able to provide
simplified executive compensation disclosures in their filings, are
exempt from the provisions of Section 404(b) of the Sarbanes-Oxley
Act requiring that an independent registered public accounting firm
provide an attestation report on the effectiveness of internal
control over financial reporting and have certain other decreased
disclosure obligations in their SEC filings. We cannot predict
whether investors will find our common stock less attractive
because of our reliance on any of these exemptions. If some
investors find our common stock less attractive as a result, there
may be a less active trading market for our common stock and our
stock price may be more volatile.
As of March 31, 2018, there were 46,773,540 shares of common stock
underlying outstanding convertible preferred stock, options,
restricted stock units and warrants. Stockholders may experience
dilution from the conversion of preferred stock, exercise of
outstanding options and warrants and vesting of restricted stock
units.
As of
March 31, 2018, holders of our outstanding dilutive securities had
the right to acquire the following amounts of underlying common
stock:
●
60,592 shares
issuable on the conversion of our immediately convertible Series A
Convertible Preferred Stock, subject to adjustment, for no further
consideration;
●
11,481,412 shares
issuable upon the exercise of stock options at a weighted-average
exercise price of $0.73 per share;
●
8,831,683 shares
issuable under restricted stock units which vest on dates between
June 11, 2018 and December 12, 2021, subject to the fulfillment of
service or performance conditions, and some of which are subject to
delivery restrictions; and
●
26,399,853 shares
issuable upon the exercise of warrants at a weighted-average
exercise price of $0.77 per share.
If the
holders convert, exercise or receive these securities, or similar
dilutive securities we may issue in the future, stockholders may
experience dilution in the net book value of their common stock. In
addition, the sale or availability for sale of the underlying
shares in the marketplace could depress our stock price. We have
registered or agreed to register for resale substantially all of
the underlying shares listed above. Holders of registered
underlying shares could resell the shares immediately upon
issuance, which could result in significant downward pressure on
our stock price.
41
Our failure to meet the continued listing requirements of the NYSE
American could result in a de-listing of our common
stock.
Our
common shares are listed on the NYSE American, a national
securities exchange, under the symbol “PTN”. Although
we currently meet the NYSE American’s listing standards,
which generally mandate that we meet certain requirements relating
to stockholders’ equity, market capitalization, aggregate
market value of publicly held shares and distribution requirements,
we cannot assure you that we will be able to continue to meet the
NYSE American’s listing requirements. If we fail to satisfy
the continued listing requirements of the NYSE American, such as
the corporate governance requirements or the minimum closing bid
price requirement, the NYSE American may take steps to de-list our
common stock. If the NYSE American delists our securities for
trading on its exchange, we could face significant material adverse
consequences, including:
●
a limited
availability of market quotations for our securities;
●
reduced liquidity
with respect to our securities;
●
a determination
that our shares of common stock are “penny stock” which
will require brokers trading in our shares of common stock to
adhere to more stringent rules, possibly resulting in a reduced
level of trading activity in the secondary trading market for our
shares of common stock;
●
a limited amount of
news and analyst coverage for our company; and
●
a decreased ability
to issue additional securities or obtain additional financing in
the future.
Such a
de-listing would likely have a negative effect on the price of our
common stock and would impair your ability to sell or purchase our
common stock when you wish to do so. In the event of a de-listing,
we may take actions to restore our compliance with the NYSE
American’s listing requirements, but we can provide no
assurance that any such action taken by us would allow our common
stock to become listed again, stabilize the market price or improve
the liquidity of our common stock, prevent our common stock from
dropping below the NYSE American minimum bid price requirement or
prevent future non-compliance with the NYSE American’s
listing requirements.
The
National Securities Markets Improvement Act of 1996, which is a
federal statute, prevents or preempts the states from regulating
the sale of certain securities, which are referred to as
“covered securities.” Our common shares are considered
to be covered securities because they are listed on the NYSE
American. Although the states are preempted from regulating the
sale of our securities, the federal statute does allow the states
to investigate companies if there is a suspicion of fraud, and, if
there is a finding of fraudulent activity, then the states can
regulate or bar the sale of covered securities in a particular
case. Further, if we were no longer listed on the NYSE American,
our common stock would not be covered securities and we would be
subject to regulation in each state in which we offer our
securities.
Issuer purchases of equity securities.
We have not and do
not currently intend to retire or repurchase any of our capital
securities other than providing our employees in certain grants
with the option to withhold shares to satisfy tax withholding
amounts due upon the vesting of restricted stock units granted
under our 2011 Stock Incentive Plan. The following 24,170 shares
were withheld during the three-month period ended March 31, 2018 at
the direction of the employees as permitted in specific grants
under the 2011 Stock Incentive Plan in order to pay the minimum
amount of tax liability owed by the employee from the vesting of
those units:
|
Period
|
Total Number of Shares Purchased (1)
|
Weighted Average Price Paid per Share
|
Total Number of Shares Purchased as Part of Publicly Announced
Plans or Programs
|
Maximum
Number of Shares that May Yet be Purchased Under Announced Plans or
Programs
|
|
January
1-31, 2018
|
-
|
$
-
|
-
|
-
|
|
February
1-28, 2018
|
-
|
-
|
-
|
-
|
|
March
1-31, 2018
|
24,170
|
0.86
|
-
|
-
|
|
Total
|
24,170
|
$
0.86
|
-
|
-
|
None.
Not
applicable.
None.
42
Exhibits
filed or furnished with this report:
|
Exhibit
Number
|
Description
|
Filed
Herewith
|
Form
|
Filing
Date
|
SEC File
No.
|
|
31.1
|
Certification
of Chief Executive Officer.
|
X
|
|
|
|
|
31.2
|
Certification
of Chief Financial Officer.
|
X
|
|
|
|
|
32.1
|
Certification
of principal executive officer pursuant to 18 U.S.C. Section 1350,
as adopted pursuant to Section 906 of the Sarbanes-Oxley Act of
2002.
|
X
|
|
|
|
|
32.2
|
Certification
of principal financial officer pursuant to 18 U.S.C. Section 1350,
as adopted pursuant to Section 906 of the Sarbanes-Oxley Act of
2002.
|
X
|
|
|
|
|
101.INS
|
XBRL
Instance Document.
|
X
|
|
|
|
|
101.SCH
|
XBRL
Taxonomy Extension Schema Document.
|
X
|
|
|
|
|
101.CAL
|
XBRL
Taxonomy Extension Calculation Linkbase Document.
|
X
|
|
|
|
|
101.LAB
|
XBRL
Taxonomy Extension Label Linkbase Document.
|
X
|
|
|
|
|
101.PRE
|
XBRL
Taxonomy Extension Presentation Linkbase Document.
|
X
|
|
|
|
|
101.DEF
|
XBRL
Taxonomy Extension Definition Linkbase Document.
|
X
|
|
|
|
43
SIGNATURES
Pursuant
to the requirements of the Securities Exchange Act of 1934, the
registrant has duly caused this report to be signed on its behalf
by the undersigned thereunto duly authorized.
|
|
|
Palatin Technologies, Inc.
|
|
|
|
|
(Registrant)
|
|
|
|
|
|
|
|
|
|||
|
|
|||
|
|
|
/s/
Carl Spana
|
|
|
Date:
May 14, 2018
|
|
Carl
Spana, Ph.D.
President
and
Chief
Executive Officer (Principal
Executive
Officer)
|
|
|
|
|
|
|
|
|
|
|
|
|
|
|
|
|
|
|
|
/s/
Stephen T. Wills
|
|
|
Date:
May 14, 2018
|
|
Stephen
T. Wills, CPA, MST
Executive
Vice President, Chief Financial Officer and Chief Operating
Officer
(Principal
Financial and Accounting Officer)
|
|
44
EXHIBIT INDEX
|
Exhibit
Number
|
Description
|
Filed
Herewith
|
Form
|
Filing
Date
|
SEC File
No.
|
|
Certification
of Chief Executive Officer.
|
X
|
|
|
|
|
|
Certification
of Chief Financial Officer.
|
X
|
|
|
|
|
|
Certification
of principal executive officer pursuant to 18 U.S.C. Section 1350,
as adopted pursuant to Section 906 of the Sarbanes-Oxley Act of
2002.
|
X
|
|
|
|
|
|
|
Certification
of principal financial officer pursuant to 18 U.S.C. Section 1350,
as adopted pursuant to Section 906 of the Sarbanes-Oxley Act of
2002.
|
X
|
|
|
|
|
101.INS
|
XBRL
Instance Document.
|
X
|
|
|
|
|
101.SCH
|
XBRL
Taxonomy Extension Schema Document.
|
X
|
|
|
|
|
101.CAL
|
XBRL
Taxonomy Extension Calculation Linkbase Document.
|
X
|
|
|
|
|
101.LAB
|
XBRL
Taxonomy Extension Label Linkbase Document.
|
X
|
|
|
|
|
101.PRE
|
XBRL
Taxonomy Extension Presentation Linkbase Document.
|
X
|
|
|
|
|
101.DEF
|
XBRL
Taxonomy Extension Definition Linkbase Document.
|
X
|
|
|
|
45
TABLE OF CONTENTS
Part I - Financial InformationItem 1. Financial StatementsItem 2. Management S Discussion and Analysis Of Financial Condition and Results Of OperationsItem 3. Quantitative and Qualitative Disclosures About Market RiskItem 4. Controls and ProceduresPart II - Other InformationItem 1. Legal ProceedingsItem 1A. Risk FactorsItem 2. Unregistered Sales Of Equity Securities and Use Of ProceedsItem 3. Defaults Upon Senior SecuritiesItem 4. Mine Safety DisclosuresItem 5. Other InformationItem 6. Exhibits