PVH CORP. /DE/
10-Ks and 10-Qs
|
|
|
|
|
|
|
|
|
|
|
|
|
|
|
|
|
|
|
|
|
|
|
|
|
|
|
|
|
|
|
|
|
|
|
|
|
|
|
|
|
|
|
|
|
|
|
|
|
|
|
|
|
|
|
|
|
|
|
UNITED STATES
SECURITIES AND EXCHANGE COMMISSION
Washington, D. C. 20549
FORM 10-K
|
(Mark One)
|
|
|
|
x
|
ANNUAL REPORT PURSUANT TO SECTION 13 OR 15(d) OF THE SECURITIES EXCHANGE ACT OF 1934
|
|
|
|
For the fiscal year ended January 29, 2017
|
|
|
|
OR
|
|
|
o
|
TRANSITION REPORT PURSUANT TO SECTION 13 OR 15(d) OF THE SECURITIES EXCHANGE ACT OF 1934
|
|
|
|
For the transition period from _________ to ___________
|
|
|
|
Commission File Number
001-07572
|
|
|
PVH CORP.
|
(Exact name of registrant as specified in its charter)
|
Delaware
|
13-1166910
|
|
|
(State of incorporation)
|
(I.R.S. Employer Identification No.)
|
|
|
200 Madison Avenue, New York, New York
|
10016
|
|
|
(Address of principal executive offices)
|
Zip Code
|
|
|
212-381-3500
|
|
(Registrant’s telephone number)
|
Securities registered pursuant to Section 12(b) of the Act:
|
Title of Each Class
|
Name of Each Exchange
on Which Registered
|
|
|
Common Stock, $1.00 par value
|
New York Stock Exchange
|
|
Securities registered pursuant to Section 12(g) of the Act:
None
Indicate by check mark if the registrant is a well-known seasoned issuer, as defined in Rule 405 of the Securities Act. Yes
x
No
o
Indicate by check mark if the registrant is not required to file reports pursuant to Section 13 or Section 15(d) of the Act. Yes
o
No
x
Indicate by check mark whether registrant (1) has filed all reports required to be filed by Section 13 or 15(d) of the Securities Exchange Act of 1934 during the preceding 12 months (or for such shorter period that the registrant was required to file such reports), and (2) has been subject to such filing requirements for the past 90 days. Yes
x
No
o
Indicate by check mark whether the registrant has submitted electronically and posted on its corporate Web site, if any, every Interactive Data File required to be submitted and posted pursuant to Rule 405 of Regulation S-T (§ 232.405 of this chapter) during the preceding 12 months (or for such shorter period that the registrant was required to submit and post such files). Yes
x
No
o
Indicate by check mark if disclosure of delinquent filers pursuant to Item 405 of Regulation S-K (§ 229.405 of this chapter) is not contained herein, and will not be contained, to the best of registrant’s knowledge, in definitive proxy or information statements incorporated by reference in Part III of this Form 10-K or any amendment to this Form 10-K.
x
Indicate by check mark whether the registrant is a large accelerated filer, an accelerated filer, a non-accelerated filer, or a smaller reporting company. See the definitions of “large accelerated filer,” “accelerated filer” and “smaller reporting company” in Rule 12b-2 of the Exchange Act. (Check one):
|
Large accelerated filer
x
|
Accelerated filer
o
|
Non-accelerated filer
o
|
Smaller reporting company
o
|
|
|
(do not check if a smaller
|
||||
|
reporting company)
|
||||
Indicate by check mark whether the registrant is a shell company (as defined in Rule 12b-2 of the Act). Yes
o
No
x
The aggregate market value of the registrant’s voting and non-voting common equity held by non-affiliates of the registrant (assuming, for purposes of this calculation only, that the registrant’s directors and corporate officers are affiliates of the registrant) based upon the closing sale price of the registrant’s common stock on July 31, 2016 (the last business day of the registrant’s most recently completed second quarter) was
$8,092,731,997
.
Number of shares of Common Stock outstanding as of March 14, 2017:
78,203,197
DOCUMENTS INCORPORATED BY REFERENCE
|
Document
|
Location in Form 10-K
in which incorporated
|
|
|
Registrant’s Proxy Statement
for the Annual Meeting of Stockholders to be held on June 15, 2017 |
Part III
|
|
SAFE HARBOR STATEMENT UNDER THE PRIVATE SECURITIES LITIGATION REFORM ACT OF 1995: Forward-looking statements in this Annual Report on Form 10-K including, without limitation, statements relating to our future revenue, earnings and cash flows, plans, strategies, objectives, expectations and intentions are made pursuant to the safe harbor provisions of the Private Securities Litigation Reform Act of 1995. Investors are cautioned that such forward-looking statements are inherently subject to risks and uncertainties, many of which cannot be predicted with accuracy, and some of which might not be anticipated, including, without limitation, (i) our plans, strategies, objectives, expectations and intentions are subject to change at any time at our discretion; (ii) we may be considered to be highly leveraged and we use a significant portion of our cash flows to service our indebtedness, as a result of which we might not have sufficient funds to operate our businesses in the manner we intend or have operated in the past; (iii) the levels of sales of our apparel, footwear and related products, both to our wholesale customers and in our retail stores, the levels of sales of our licensees at wholesale and retail, and the extent of discounts and promotional pricing in which we and our licensees and other business partners are required to engage, all of which can be affected by weather conditions, changes in the economy, fuel prices, reductions in travel, fashion trends, consolidations, repositionings and bankruptcies in the retail industries, repositionings of brands by our licensors and other factors; (iv) our plans and results of operations will be affected by our ability to manage our growth and inventory, including our ability to realize benefits from acquisitions; (v) our operations and results could be affected by quota restrictions and the imposition of safeguard controls (which, among other things, could limit our ability to produce products in cost-effective countries that have the labor and technical expertise needed), the availability and cost of raw materials, our ability to adjust timely to changes in trade regulations and the migration and development of manufacturers (which can affect where our products can best be produced), changes in available factory and shipping capacity, wage and shipping cost escalation, civil conflict, war or terrorist acts, the threat of any of the foregoing, or political and labor instability in any of the countries where our or our licensees’ or other business partners’ products are sold, produced or are planned to be sold or produced; (vi) disease epidemics and health related concerns, which could result in closed factories, reduced workforces, scarcity of raw materials and scrutiny or embargoing of goods produced in infected areas, as well as reduced consumer traffic and purchasing, as consumers become ill or limit or cease shopping in order to avoid exposure; (vii) acquisitions and divestitures and issues arising with acquisitions, divestitures and proposed transactions, including, without limitation, the ability to integrate an acquired entity or business into us with no substantial adverse effect on the acquired entity’s, the acquired business’s or our existing operations, employee relationships, vendor relationships, customer relationships or financial performance, and the disposal of the net assets of a divested entity; (viii) the failure of our licensees to market successfully licensed products or to preserve the value of our brands, or their misuse of our brands; (ix) our results could be adversely affected by the strengthening of the United States dollar against foreign currencies in which we transact significant levels of business; (x) our retirement plan expenses recorded throughout the year are calculated using actuarial valuations that incorporate assumptions and estimates about financial market, economic and demographic conditions, and differences between estimated and actual results give rise to gains and losses that are recorded immediately in earnings, generally in the fourth quarter of the year; and (xi) other risks and uncertainties indicated from time to time in our filings with the Securities and Exchange Commission.
We do not undertake any obligation to update publicly any forward-looking statement, including, without limitation, any estimate regarding revenue, earnings or cash flows, whether as a result of the receipt of new information, future events or otherwise.
PVH Corp.
Form 10-K
For the Year Ended January 29, 2017
Table of Contents
|
PART I
|
||
|
Item 1.
|
Business
|
|
|
Item 1A.
|
Risk Factors
|
|
|
Item 1B.
|
Unresolved Staff Comments
|
|
|
Item 2.
|
Properties
|
|
|
Item 3.
|
Legal Proceedings
|
|
|
Item 4.
|
Mine Safety Disclosures
|
|
|
PART II
|
||
|
Item 5.
|
Market for Registrant’s Common Equity, Related Stockholder Matters and Issuer Purchases of Equity Securities
|
|
|
Item 6.
|
Selected Financial Data
|
|
|
Item 7.
|
Management’s Discussion and Analysis of Financial Condition and Results of Operations
|
|
|
Item 7A.
|
Quantitative and Qualitative Disclosures About Market Risk
|
|
|
Item 8.
|
Financial Statements and Supplementary Data
|
|
|
Item 9.
|
Changes in and Disagreements with Accountants on Accounting and Financial Disclosure
|
|
|
Item 9A.
|
Controls and Procedures
|
|
|
Item 9B.
|
Other Information
|
|
|
PART III
|
||
|
Item 10.
|
Directors, Executive Officers and Corporate Governance
|
|
|
Item 11.
|
Executive Compensation
|
|
|
Item 12.
|
Security Ownership of Certain Beneficial Owners and Management and Related Stockholder Matters
|
|
|
Item 13.
|
Certain Relationships and Related Transactions, and Director Independence
|
|
|
Item 14.
|
Principal Accounting Fees and Services
|
|
|
PART IV
|
||
|
Item 15.
|
Exhibits, Financial Statement Schedules
|
|
|
Item 16.
|
Form 10-K Summary
|
|
|
Signatures
|
||
|
Exhibit Index
|
||
|
Index to Financial Statements and Financial Statement Schedule
|
||
Introduction
Unless the context otherwise requires, the terms “we,” “our” or “us” refer to PVH Corp. and its subsidiaries.
Our fiscal years are based on the 52-53 week period ending on the Sunday closest to February 1 and are designated by the calendar year in which the fiscal year commences. References to a year are to our fiscal year, unless the context requires otherwise. Our 2016 year commenced on February 1, 2016 and ended on January 29, 2017; 2015 commenced on February 2, 2015 and ended on January 31, 2016; and 2014 commenced on February 3, 2014 and ended on February 1, 2015.
We obtained the market and competitive position data used throughout this report from research, surveys or studies conducted by third parties (including, with respect to the brand rankings, the NPD Group/POS Tracking Service), information provided by customers and industry or general publications. The United States department and chain store rankings to which we refer in this report are on a unit basis. Industry publications and surveys generally state that they have obtained information from sources believed to be reliable but do not guarantee the accuracy and completeness of such information. While we believe that each of these studies and publications and all other information are reliable, we have not independently verified such data and we do not make any representation as to the accuracy of such information.
References to the brand names
CALVIN KLEIN
,
CALVIN KLEIN 205 W39 NYC
,
CK Calvin Klein
,
Calvin Klein Jeans
,
Calvin Klein Underwear
,
Tommy Hilfiger
,
Hilfiger Collection
,
Tommy Hilfiger Tailored
,
Hilfiger Denim
,
Van Heusen
,
IZOD
,
ARROW
,
Warner’s
,
Olga
,
Eagle
,
Speedo
,
Geoffrey Beene
,
Kenneth Cole New York
,
Kenneth Cole Reaction
,
Sean John
,
MICHAEL Michael Kors
,
Michael Kors Collection
and
Chaps
, and to other brand names in this report are to registered trademarks owned by us or licensed to us by third parties and are identified by italicizing the brand name.
References to the acquisition of Warnaco refer to our February 13, 2013 acquisition of The Warnaco Group, Inc. and its subsidiaries, which companies we refer to collectively as “Warnaco.”
References to the acquisition of Tommy Hilfiger refer to our May 6, 2010 acquisition of Tommy Hilfiger B.V. and certain affiliated companies, which companies we refer to collectively as “Tommy Hilfiger.”
References to our acquisition of Calvin Klein refer to our February 2003 acquisition of Calvin Klein, Inc. and certain affiliated companies, which companies we refer to collectively as “Calvin Klein.”
Company Overview
We are one of the largest apparel companies in the world, with a history going back over 135 years. We have over 30,000 associates operating in over 40 countries. Our brand portfolio consists of nationally and internationally recognized brand names, including the global designer lifestyle brands
CALVIN KLEIN
and
Tommy Hilfiger
, as well as
Van Heusen
,
IZOD
,
ARROW
,
Warner’s
,
Olga
and
Eagle
,
which are owned brands, and
Speedo
,
Geoffrey Beene
,
Kenneth Cole New York
,
Kenneth Cole Reaction
,
Sean John
,
MICHAEL Michael Kors
,
Michael Kors Collection
and
Chaps
, which are licensed, as well as various other owned, licensed and private label brands. We design and market branded dress shirts, neckwear, sportswear, jeanswear, performance apparel, intimate apparel, underwear, swim products, handbags, accessories, footwear and other related products. Additionally, we license our owned brands over a broad range of products. We sell our brands at multiple price points and in multiple channels of distribution and geographies. This enables us to offer products to a broad range of consumers, while minimizing competition among our brands and reducing our reliance on any one demographic group, merchandise preference, price point, distribution channel or region. During 2016, our directly operated businesses in North America consisted principally of wholesale men’s dress shirts, neckwear and underwear sales under our owned and licensed brands; wholesale men’s sportswear sales under our
CALVIN KLEIN
,
Tommy Hilfiger
,
Van Heusen
,
IZOD
and
ARROW
brands; wholesale womenswear sales under our
Tommy Hilfiger
brand (through the fourth quarter of 2016, at which time the business was licensed to a third party); wholesale men’s and women’s jeanswear sales under our
CALVIN KLEIN
and
Tommy Hilfiger
brands; wholesale women’s intimate apparel sales under our
Calvin Klein Underwear
,
Warner’s
and
Olga
brands; wholesale swimwear, footwear, swim accessories and related product sales under the
Speedo
brand; the operation of digital commerce sites under the
CALVIN KLEIN
,
Tommy Hilfiger
and
Speedo
brands; and the operation of retail stores, principally in premium outlet centers, primarily under our
CALVIN KLEIN
,
Tommy Hilfiger
and certain of our heritage brands. As of the end of 2015, our Heritage
1
Brands retail business primarily consisted of our
Van Heusen
stores but, beginning in 2015, we started offering a limited selection of
IZOD Golf
,
Warner’s
and
Speedo
products in some of our Heritage Brands stores. A majority of our Heritage Brands stores now offer a broad selection of
Van Heusen
men’s and women’s apparel with limited selections of these other brands, some of which feature multiple brand names on the door signage. During 2016, our directly operated businesses outside of North America consisted principally of our wholesale and retail sales in Europe, Japan and, beginning in April 2016, China under our
Tommy Hilfiger
brands; our wholesale and retail sales in Europe, Asia and Latin America under our
CALVIN KLEIN
brands; and the operation of digital commerce sites under the
CALVIN KLEIN
and
Tommy Hilfiger
brands. Our licensing activities principally related to the licensing worldwide of our
CALVIN KLEIN
and
Tommy Hilfiger
trademarks for a broad range of lifestyle products and for specific geographic regions.
On November 30, 2016, we formed a joint venture in Mexico in which we own a 49% economic interest (“PVH Mexico”). The joint venture was formed by merging our wholly owned subsidiary that principally operated and managed our Calvin Klein business in Mexico with a wholly owned subsidiary of Grupo Axo, S.A.P.I. de C.V. that distributes certain
Tommy Hilfiger
brand products in Mexico. In connection with the formation of PVH Mexico, we deconsolidated our wholly owned subsidiary (the “Mexico deconsolidation”).
On April 13, 2016, we completed the acquisition of the 55% of the ownership interests in TH Asia, Ltd. (“TH China”), our former joint venture for
Tommy Hilfiger
in China, that we did not already own (the “TH China acquisition”). As a result of the TH China acquisition, we now operate directly our Tommy Hilfiger business in this high-growth market.
On February 1, 2016, we entered into a licensing agreement with G-III Apparel Group, Ltd. (“G-III”) for the design, production and wholesale distribution of
Tommy Hilfiger
womenswear in the United States and Canada (the “G-III license”), which resulted in the discontinuation of our directly operated Tommy Hilfiger North America womenswear wholesale business in the fourth quarter of 2016.
We exited our Izod retail business in the third quarter of 2015.
Our history of acquisitions has made us a more diversified global organization, with an extensive brand portfolio, retail footprint and distribution network, and a large consumer base. Our acquisition of Warnaco in 2013 provided us with direct control of Calvin Klein’s two largest apparel categories, jeanswear and underwear, and followed our transformative acquisitions of Tommy Hilfiger in 2010 and Calvin Klein in 2003. We will continue to explore strategic acquisitions of licensed businesses, trademarks and companies that we believe are additive to our overall business.
We aggregate our segments into three main businesses: (i) Calvin Klein, which consists of the Calvin Klein North America and Calvin Klein International segments; (ii) Tommy Hilfiger, which consists of the Tommy Hilfiger North America and Tommy Hilfiger International segments; and (iii) Heritage Brands, which consists of the Heritage Brands Wholesale and Heritage Brands Retail segments.
Note 19
, “Segment Data,” in the Notes to Consolidated Financial Statements included in Item 8 of this report contains information with respect to revenue, income before interest and taxes and assets related to each segment, as well as information regarding our revenue generated from foreign and domestic sources, and the geographic locations where our net property, plant and equipment is held.
Our 2016 revenue was $8.2 billion, of which approximately 50% was generated outside of the United States. Our global designer lifestyle brands,
CALVIN KLEIN
and
Tommy Hilfiger
, together generated over 80% of our revenue during 2016.
Company Information
We were incorporated in the State of Delaware in 1976 as the successor to a business begun in 1881. Our principal executive offices are located at 200 Madison Avenue, New York, New York 10016; our telephone number is (212) 381-3500.
We make available at no cost, on our corporate website, our annual reports on Form 10-K, quarterly reports on Form 10-Q, current reports on Form 8-K and amendments to those reports filed or furnished pursuant to Section 13(a) or 15(d) of the Exchange Act as soon as reasonably practicable after we have electronically filed such material with the Securities and Exchange Commission. We also make available at no cost, on our corporate website, our Code of Business Conduct and Ethics. Our corporate website address is
pvh
.com.
2
Calvin Klein Business Overview
We believe Calvin Klein is one of the best known designer names in the world, exemplifying bold, progressive ideals and a seductive, and often minimal, aesthetic. Global retail sales of products sold under the
CALVIN KLEIN
brands were approximately $8.4 billion in 2016. The
CALVIN KLEIN
brands provide us with the opportunity to market products both domestically and internationally at various price points, through multiple distribution channels and to different consumer groups. Our tiered-brand strategy provides a focused, consistent approach to global brand growth and development that preserves the brand’s prestige and image. The
CALVIN KLEIN
brands are:
|
•
|
Calvin Klein By Appointment
—
a bespoke collection with distinct looks handcrafted and made to measure in New York, New York. The launch is a new high luxury tier of product for us, available exclusively by appointment beginning April 1, 2017.
|
|
•
|
CALVIN KLEIN 205 W39 NYC
(formerly
Calvin Klein Collection
) — our “halo” brand, under which men’s and women’s high-end designer ready-to-wear and accessories, as well as items for the home, are sold. Representing pure, refined luxury, distribution is through our wholesale partners across the globe (in stores and online) and our own flagship store on Madison Avenue in New York, New York, as well as through our Company-operated digital commerce sites.
|
|
•
|
CK Calvin Klein
(formerly
Calvin Klein Platinum
)—
our “contemporary” brand, offering modern, sophisticated, fashionable items including apparel and accessories. Offerings are sold in the wholesale channel through specialty and department store partners (in stores and online) in various regions, as well as in free-standing stores and online in Asia. Distribution for the line is in the United States (through our Company-operated digital commerce site) and growing internationally across select markets.
|
|
•
|
CALVIN KLEIN
— our “master” brand includes offerings such as men’s and women’s sportswear, outerwear, fragrance, accessories, footwear, performance apparel, men’s dress furnishings, women’s dresses, suits and handbags, and items for the home. Distribution is primarily in North America through our wholesale partners (in stores and online), our own stores, our Company-operated digital commerce sites and pure play digital commerce retailers, and is expanding internationally in select markets.
|
|
•
|
Calvin Klein Jeans
— offerings under this label include men’s and women’s jeans and related apparel, which are distributed worldwide, and accessories, which are distributed in Europe, Asia and Brazil. With roots in denim, it is the casual expression of the
CALVIN KLEIN
brand and is known for its unique details and innovative washes. Distribution is through our own stores, our wholesale partners (in stores and online), our Company-operated digital commerce sites and pure play digital commerce retailers
.
|
|
•
|
Calvin Klein Underwear
— as one of the world’s leading designer underwear brands for men and women,
Calvin Klein Underwear
is known across the globe for provocative, cutting-edge products and marketing campaigns, consistently delivering innovative designs with superior fit and quality. Offerings under this label include men’s and women’s underwear, women’s intimates, sleepwear and loungewear. Distribution is through our own stores, our wholesale partners (in stores and online), our Company-operated digital commerce sites and pure play digital commerce retailers.
|
Raf Simons was appointed as Chief Creative Officer of Calvin Klein in August 2016, marking the implementation of Calvin Klein’s new global creative strategy to unify all of the
CALVIN KLEIN
brands under one creative vision. Mr. Simons oversees all aspects of design, global marketing and communications, and visual creative services.
3
In 2016, over $330 million was spent globally in connection with the advertising, marketing and promotion of the
CALVIN KLEIN
brands and approximately 45% of these expenses were funded by Calvin Klein’s licensees and other authorized users of the brands. The global 360° marketing campaigns, which are designed to engage consumers through provocative, modern, sensual and iconic lifestyle imagery, are integral to
CALVIN KLEIN
. Our efforts in this area were recognized in 2016, with
CALVIN KLEIN
receiving the Fashion Media Awards Ad Campaign of the Year award. In addition,
CALVIN KLEIN
was ranked #9 on the
L2 Digital IQ Index
:
Luxury China in 2016
and #12 on the
L2 Digital IQ Index
:
Fashion in 2016,
which ranks the digital competence of global fashion brands across site, digital marketing, social media, mobile and tablet.
Through our Calvin Klein North America and Calvin Klein International segments, we sell
CALVIN KLEIN
products in a variety of distribution channels, including:
|
•
|
Wholesale — We operate wholesale businesses through which we distribute and sell
CALVIN KLEIN
products to third party retailers and distributors (in stores and online) and to pure play digital commerce retailers. Given the various price points at which products under the various
CALVIN KLEIN
brands are sold, we have a range of wholesale customers. For example, within North America, our
men’s dress shirts, neckwear and sportswear under the
CALVIN KLEIN
brand are marketed at better price points and are distributed principally in better department and specialty store retailers (in stores and online). Our
CALVIN KLEIN 205 W39 NYC
and
CK Calvin Klein
dress shirts are sold into the more limited channels of luxury or premier department and specialty store retailers (in stores and online), as well as through free-standing stores.
Our
Calvin Klein Jeans
and
Calvin Klein Underwear
products are primarily distributed through department stores, chain stores, shop-in-shop/concession locations, stores operated under retail licenses and/or distributor agreements, digital commerce sites operated by key department store customers and pure play digital commerce retailers.
|
|
•
|
Retail — We operate retail businesses in North America, Europe, Asia and Latin America.
CALVIN KLEIN 205 W39 NYC
brand men’s and women’s high-end designer ready-to-wear and accessories collections are marketed through our flagship store located in New York, New York and online through our Company-operated digital commerce sites. Additionally, we market the
Calvin Klein By Appointment
brand bespoke product exclusively by appointment at the flagship store in New York, New York. We operate full-price and outlet stores and concession locations in Europe, Asia and Brazil, where we principally offer
Calvin Klein Jeans
,
Calvin Klein Underwear
and
CALVIN KLEIN
accessory offerings. Our
CALVIN KLEIN
stores in the United States and Canada are located primarily in premium outlet centers and offer men’s and women’s apparel and other products under the
CALVIN KLEIN
brand to communicate the
CALVIN KLEIN
lifestyle.
CALVIN KLEIN
products are also sold through the digital commerce sites we operate in approximately 35 countries.
|
|
•
|
Licensing — We license the
CALVIN KLEIN
brands throughout the world for use in connection with a broad array of product categories. In these arrangements, Calvin Klein combines its design, marketing and branding skills with the specific manufacturing, distribution and geographic capabilities of its partners to develop, market and distribute these goods, most of which are subject to our prior approval and continuing oversight. Calvin Klein has approximately 60 licensing and other arrangements across the
CALVIN KLEIN
brands. The arrangements generally are exclusive to a territory or product category. Territorial licensees include our joint ventures in Australia, India and Mexico.
|
Calvin Klein’s key licensing partners, and the products and territories licensed, include:
4
|
Licensing Partner
|
|
Product Category and Territory
|
|
|
|
|
|
CK Watch & Jewelry Co., Ltd.
(Swatch SA)
|
|
Men’s and women’s watches (worldwide) and men’s and women’s jewelry (worldwide, including Japan beginning January 2016)
|
|
|
|
|
|
CK21 Holdings Pte. Ltd.
|
|
Men’s and women’s
CK Calvin Klein
apparel (Asia, excluding Japan)
|
|
|
|
|
|
Coty Inc.
|
|
Men’s and women’s fragrance, bath products and color cosmetics (worldwide)
|
|
|
|
|
|
DWI Holdings, Inc. / Himatsingka Seide, Ltd.
|
|
Soft home bed and bath furnishings (United States, Canada, Mexico, Central America, South America and India)
|
|
|
|
|
|
G-III
|
|
Men’s and women’s coats, swimwear and luggage, and women’s suits, dresses, sportswear, active performancewear, handbags and small leather goods (United States, Canada and Mexico with distribution for certain lines in Europe and elsewhere)
|
|
|
|
|
|
Jimlar Corporation / LF USA, Inc.
|
|
Men’s, women’s and children’s footwear (United States, Canada, Mexico and certain other jurisdictions for the
CALVIN KLEIN
and
CK Calvin Klein
lines and worldwide for the
CALVIN KLEIN 205 W39 NYC
and
Calvin Klein Jeans
lines)
|
|
|
|
|
|
Marchon Eyewear, Inc.
|
|
Men’s and women’s optical frames and sunglasses (worldwide)
|
|
|
|
|
|
McGregor Industries, Inc. / American Essentials, Inc.
|
|
Men’s and women’s socks and women’s tights (United States, Canada, Mexico, Central and South America, Europe, Middle East and Asia, excluding Japan)
|
|
|
|
|
|
Onward Kashiyama Co. Ltd.
|
|
Men’s and women’s
CK Calvin Klein
apparel (Japan)
|
|
|
|
|
|
Peerless Delaware, Inc.
|
|
Men’s tailored clothing (United States, Canada and Mexico)
|
The results of our Calvin Klein wholesale, retail and licensing activities in the United States, Canada and Mexico, and our proportionate share of the net income or loss of our investment in
the joint venture in Mexico are reported in our Calvin Klein North America segment. The results of our Calvin Klein wholesale, retail and licensing activities outside of North America, and our proportionate share of the net income or loss of our investments in joint ventures in Australia and India are reported in our Calvin Klein International segment.
Tommy Hilfiger Business Overview
We believe
Tommy Hilfiger
is one of the world’s leading designer lifestyle brands and is internationally recognized for celebrating the essence of classic American cool style, featuring preppy with a twist designs. Global retail sales of products sold under the
Tommy Hilfiger
brands were approximately $6.6 billion in 2016. Our Tommy Hilfiger business markets its products under several brands in order to fully capitalize on its global appeal, as each brand varies in terms of price point, demographic target and distribution. The
Tommy Hilfiger
brands offer a breadth of collections, including tailored clothing, sportswear, denim, accessories, underwear and footwear, and consist of:
|
•
|
Hilfiger Collection —
this line represents the pinnacle of the
Tommy Hilfiger
product offerings and features its most directional styles for women, blending the brand’s Americana styling with contemporary influences. The collection targets 25 to 40 year-old consumers and includes designs that premiere on the runway during New York Fashion Week.
Hilfiger Collection
is available globally at select
Tommy Hilfiger
stores, through our wholesale partners (in stores and online), and through our Company-operated digital commerce sites.
|
|
•
|
Tommy Hilfiger Tailored —
this line reflects the brand’s American menswear heritage in elevated, sophisticated styles that are suitable for more formal occasions. From structured suiting to more relaxed tailoring, classics are modernized with precision fit, premium fabrics, updated cuts, rich colors and luxurious details executed with the brand’s signature
|
5
twist.
Tommy Hilfiger Tailored
targets 25 to 40 year-old consumers and is available globally at select
Tommy Hilfiger
stores, through our wholesale partners (in stores and online) and through our Company-operated digital commerce sites.
|
•
|
Tommy Hilfiger —
our core line embodies the brand’s classic American cool spirit with a broad selection of designs across more than 25 categories, including men’s, women’s and kids’ sportswear, footwear and accessories. With a focus on the 25 to 40 year-old consumer,
Tommy Hilfiger
is internationally recognized for celebrating the essence of classic American style with a fresh, modern twist inspired by pop culture
—
from fashion, art and music to sports and entertainment. Products are sold domestically and internationally in our
Tommy Hilfiger
specialty and outlet stores and through our wholesale partners (in stores and online), our Company-operated digital commerce sites and pure play digital commerce retailers.
|
|
•
|
Hilfiger Denim —
this line brings authentic American denim with a modern edge to the global consumer, with offerings that are more casual and trend-oriented than the
Tommy Hilfiger
label. Targeting the 18 to 30 year-old denim-oriented consumer, the line focuses on premium denim separates, footwear, bags, accessories, eyewear and fragrance. Products are primarily sold outside North America and can be purchased in our
Tommy Hilfiger
stores and through our wholesale partners (in stores and online), our Company-operated digital commerce sites and pure play digital commerce retailers.
|
Global marketing campaigns are integral to
Tommy Hilfiger
, with a focus on driving awareness, consistency and relevancy across product lines and regions.
Tommy Hilfiger
engages consumers through comprehensive 360° marketing campaigns and spent over $160 million on global marketing and communications efforts in 2016, with a particular focus on innovative experiences and digital marketing initiatives. The global brand power and digital expertise of
Tommy Hilfiger
are being recognized; in 2016, L2 ranked
Tommy Hilfiger
#9 on its 2016
Digital IQ Index: Fashion.
Through our Tommy Hilfiger North America and Tommy Hilfiger International segments, we sell
Tommy Hilfiger
products in a variety of distribution channels, including:
|
•
|
Wholesale — The Tommy Hilfiger wholesale business consists of the distribution and sale of products in North America, Europe and China under the
Tommy Hilfiger
brands to third party retailers and distributors (in stores and online), franchisees and pure play digital commerce retailers. Tommy Hilfiger has, since 2008, made the majority of its North American wholesale sales to Macy’s, Inc. (“Macy’s”), which is currently the exclusive department store retailer for
Tommy Hilfiger
men’s sportswear in the United States. During 2016, we entered into the G-III license, which resulted in the discontinuation of our directly operated Tommy Hilfiger North America womenswear wholesale business in the fourth quarter of 2016. Tommy Hilfiger also has a wholesale business in Canada selling men’s sportswear and dress furnishings, as well as accessories, to Hudson’s Bay Company, Canada’s leading department store.
|
|
•
|
Retail — The Tommy Hilfiger retail business principally consists of the distribution and sale of
Tommy Hilfiger
products in North America, Europe, Japan, and China through Company-operated full-price specialty and outlet stores, as well as through Company-operated digital commerce sites.
Tommy Hilfiger
specialty stores consist of flagship stores, which are generally larger stores situated in high-profile locations in major cities and are intended to enhance local exposure of the brand, and anchor stores, which are located on high-traffic retail streets and in malls in secondary cities and are intended to provide incremental revenue and profitability. Outlet stores in North America are primarily located in premium outlet centers and carry specially designed merchandise that is sold at a lower price point than merchandise sold in our specialty stores. Outlet stores operated by Tommy Hilfiger outside of North America are used primarily to clear excess inventory from previous seasons at discounted prices and, to a lesser extent, carry specially designed merchandise.
|
|
•
|
Licensing — We license the
Tommy Hilfiger
brands to third parties both for specific product categories and in certain geographic regions, and generally on an exclusive basis. Tommy Hilfiger has over 25 license agreements. We provide support to our licensing partners and seek to preserve the integrity of our brands by taking an active role in the design, quality control, advertising, marketing and distribution of each licensed product, most of which are subject to our prior approval and continuing oversight. Territorial licensees include our joint ventures in Australia, Brazil, India and Mexico.
|
6
Tommy Hilfiger’s key licensing partners, and the products and territories licensed, include:
|
Licensing Partner
|
|
Product Category and Territory
|
|
|
|
|
|
American Sportswear S.A.
|
|
Men’s, women’s and children’s sportswear, accessories and
Hilfiger Denim
distribution (Central America and South America (excluding Brazil))
|
|
|
|
|
|
Aramis, Inc.
|
|
Fragrance, cosmetics, skincare products and toiletries (worldwide)
|
|
|
|
|
|
Dickson Concepts (International) Limited
|
|
Men’s, women’s and children’s sportswear and
Hilfiger Denim
distribution (Hong Kong, Macau, Malaysia, Singapore and Taiwan)
|
|
|
|
|
|
G-III
|
Men’s, women’s and juniors’ outerwear, luggage, women’s dresses and women’s apparel (excluding intimates, sleepwear, loungewear, hats, scarves, gloves and footwear) (United States and Canada)
|
|
|
GBG Youth Apparel LLC
|
|
Boys’ and girls’ apparel (United States, Canada, Puerto Rico and Guam (Macy’s stores only)) and school uniforms (United States)
|
|
Hyundai G&F Co., Ltd.
|
|
Men’s, women’s and children’s sportswear and
Hilfiger Denim
distribution (South Korea)
|
|
Marcraft Clothes, Inc.
|
Men’s tailored clothing (United States and Canada) (We have announced that this category will be licensed to Peerless Clothing International, Inc. beginning January 1, 2018)
|
|
|
|
|
|
|
MBF Holdings LLC
|
|
Men’s and women’s footwear (United States and Canada)
|
|
|
|
|
|
Movado Group, Inc. & Swissam Products, Ltd.
|
|
Men’s and women’s watches and jewelry (worldwide, excluding Japan (except certain customers))
|
|
|
|
|
|
Safilo Group S.P.A.
|
|
Men’s, women’s and children’s eyeglasses and non-ophthalmic sunglasses (worldwide, excluding India)
|
The results of our Tommy Hilfiger wholesale, retail and licensing activities in the United States, Canada and Mexico, and our proportionate share of the net income or loss of our investment in the joint venture in Mexico are reported in our Tommy Hilfiger North America segment. The results of our Tommy Hilfiger wholesale, retail and licensing activities outside of North America, and our proportionate share of the net income or loss of our investments in joint ventures in Australia, Brazil and India are reported in our Tommy Hilfiger International segment.
Heritage Brands Business Overview
Our Heritage Brands business encompasses the design, sourcing and marketing of a varied selection of prominent brand label dress shirts, neckwear, sportswear, swim products, intimate apparel, underwear and related apparel and accessories, as well as the licensing of our
Van Heusen
,
IZOD
,
ARROW
,
Warner’s
and
Olga
brands for an assortment of products. The Heritage Brands business also includes private label dress furnishings programs, particularly neckwear programs. We design, source and market substantially all of these products on a brand-by-brand basis, targeting distinct consumer demographics and lifestyles in an effort to minimize competition among our brands. We distribute our Heritage Brands products at wholesale through national and regional department, chain, specialty, mass market, club, off-price and independent stores (in stores and online) in the United States and Canada, as well as through select pure play digital commerce retailers. As a complement to our wholesale business, which is our core business, we also market products directly to consumers through our Heritage Brands
stores, principally located in outlet centers throughout the United States and Canada. We currently sell our products online through our directly operated digital commerce site for
Speedo
, through the digital commerce sites of our third party retail partners and through select pure play digital commerce retailers.
Heritage Brands Wholesale.
Our Heritage Brands Wholesale segment principally consists of:
|
•
|
The design and marketing of men’s dress shirts and neckwear primarily to department, chain, specialty, mass market, club and off-price retailers (in stores and online through select wholesale partners), as well as pure play digital commerce retailers. We market both dress shirts and neckwear under brands including
Van Heusen
,
ARROW
,
IZOD
,
Eagle
,
Sean John
,
Geoffrey Beene
,
Kenneth Cole New York
,
Kenneth Cole Reaction
,
MICHAEL Michael Kors
and
Michael Kors Collection
. We also market dress shirts under the
Chaps
brand, among others. We also offer private label
|
7
dress shirt and neckwear programs to retailers, primarily national department and mass market stores. Collectively, our product offerings represent a sizeable portion of the domestic dress furnishings market.
We license certain of the brands under which we sell men’s dress shirts and neckwear. The following table provides information with respect to the expiration of the licenses for the more significant brands (as determined based on 2016 sales volume):
|
Brand Name
|
Licensor
|
Expiration
|
|
Geoffrey Beene
|
Geoffrey Beene, LLC
|
December 31, 2021, with a right of renewal (subject to certain conditions) through December 31, 2028
|
|
Kenneth Cole New York
and
Kenneth Cole Reaction
|
Kenneth Cole Productions (Lic), Inc.
|
December 31, 2019
|
|
Chaps
|
The Polo/Lauren Company, LP and PRL USA, Inc.
|
March 31, 2020
|
|
MICHAEL Michael Kors
|
Michael Kors, LLC
|
January 31, 2019, with a right of renewal (subject to certain conditions) through January 31, 2022
|
|
•
|
The design and marketing of sportswear, including men’s sport shirts, sweaters, bottoms and outerwear, at wholesale, principally under the
IZOD
,
Van Heusen
and
ARROW
brands primarily to department, chain, specialty, mass market, club and off-price retailers, as well as pure play digital commerce retailers. We believe that we had some of the best-selling brands in the men’s sport shirts category in United States department and chain stores in 2016.
|
|
•
|
The design and marketing of certain men’s, women’s and children’s swimwear, pool and deck footwear and swim related products and accessories, such as swim goggles, learn-to-swim aids, water-based fitness products and training accessories under the
Speedo
trademark. The
Speedo
brand is exclusively licensed to us for North America and the Caribbean in perpetuity from Speedo International Limited. We primarily distribute
Speedo
products through mass market stores, sporting goods stores, team dealers, swim clubs, off-price stores, catalog retailers and digital commerce sites, including Speedo’s
speedousa
.com digital commerce site and pure play digital commerce retailers.
|
|
•
|
The design and marketing of women’s intimate apparel, shapewear and loungewear under the
Warner’s
and
Olga
brands.
Warner’s
and
Olga
women’s intimate apparel is primarily distributed in the United States and Canada through various retail channels, including department, chain, club, off-price and mass market retailers (in stores and online), as well as pure play digital commerce retailers.
Warner’s
and
Olga
were the third and eighth best selling brands for bras and panties in United States chain stores in 2016, respectively.
|
Heritage Brands Retail.
Our Heritage Brands Retail segment consists of the operation of stores, primarily in outlet centers throughout the United States and Canada. Our stores primarily offer
Van Heusen
men’s dress shirts, neckwear and underwear, men’s and women’s suit separates, men’s and women’s sportswear, including woven and knit shirts, sweaters, bottoms and outerwear, and men’s and women’s accessories. A limited selection of
IZOD Golf
,
Warner’s
and
Speedo
products are also sold in some of our Heritage Brands stores.
Licensing.
We license our heritage brands globally for a broad range of products through approximately 35 domestic and 40 international license agreements covering approximately 160 territories. The arrangements generally are exclusive to a territory or product category. Territorial licenses include our joint ventures in Australia and Mexico. We believe that licensing provides us with a relatively stable flow of revenues with high margins and extends and strengthens our brands.
We grant licensing partners the right to manufacture and sell at wholesale specified products under one or more of our brands. In addition, certain foreign licensees are granted the right to open retail stores under the licensed brand name. A substantial portion of the sales by our domestic licensing partners is made to our largest wholesale customers. We provide support to our licensing partners and seek to preserve the integrity of our brands by taking an active role in the design, quality control, advertising, marketing and distribution of each licensed product, most of which are subject to our prior approval and continuing oversight.
8
Our heritage brands licensing partners, and the products and territories licensed by them, include:
|
Licensing Partner
|
|
Product Category and Territory
|
|
|
|
|
|
Arvind Lifestyle Brands LTD.
|
|
ARROW
men’s and women’s dresswear, sportswear and accessories (India, Middle East, Egypt, Ethiopia, Maldives, Nepal, Sri Lanka and South Africa);
IZOD
men’s and women’s sportswear and accessories (India and Middle East)
|
|
|
|
|
|
ECCE
|
|
ARROW
men’s and women’s dresswear, sportswear and accessories (France, Switzerland and Andorra)
|
|
|
|
|
|
F&T Apparel LLC
|
|
Van Heusen
and
ARROW
boys’ dress furnishings and sportswear;
IZOD
boys’ sportswear;
IZOD
and
ARROW
boys’ and
girls’ school uniforms;
ARROW
men’s tailored clothing;
IZOD
boys’ tailored clothing (United States and Canada)
|
|
|
|
|
|
I.C.C. International Public Company, Ltd.
|
ARROW
men’s dress furnishings, tailored clothing, sportswear and accessories;
ARROW
women’s dresswear and sportswear (Thailand, Myanmar, Laos, Cambodia and Vietnam)
|
|
|
Peerless Delaware, Inc.
|
|
Van Heusen
and
IZOD
men’s tailored clothing (United States, Canada and Mexico)
|
|
|
|
|
|
Van Dale Industries, Inc.
|
|
IZOD
women’s intimates and sleepwear;
Warner’s
and
Olga
women’s shapewear, sleepwear, loungewear and athletic wear (United States and Canada)
|
|
Basic Resources, Inc.
|
Van Heusen
and
IZOD
men’s and boy’s knit and woven underwear (United States and Canada)
|
|
The results of our Heritage Brands wholesale and licensing activities and our proportionate share of the net income or loss of our investment in joint ventures in Australia and Mexico are reported in our Heritage Brands Wholesale segment. The results of our Heritage Brands retail activities are reported in our Heritage Brands Retail segment.
Our Business Strategy
We are one of the largest apparel companies in the world, with over $8.2 billion in revenues in 2016. We see opportunity for growth as we employ our strategic initiatives across our organization. Our global growth strategies include:
|
•
|
Driving consumer engagement by investing in our product, marketing and in-store and online experiences;
|
|
•
|
Expanding
CALVIN KLEIN
’s
and
Tommy Hilfiger
’s worldwide reach and assuming more direct control over various licensed businesses;
|
|
•
|
Investing in our global operating and digital platforms to support our growth initiatives;
|
|
•
|
Developing and retaining talent through career development opportunities, while providing an inclusive workplace where every individual is valued;
|
|
•
|
Generating solid free cash flow to drive sustainable long-term growth and stockholder returns; and
|
|
•
|
Having a positive impact on the communities in which we live and work.
|
Calvin Klein Business
We believe significant growth opportunities exist to drive
CALVIN KLEIN
global retail sales further over time, including:
|
•
|
Enhancing
CALVIN KLEIN’s
global brand relevance and premium designer status worldwide through marketing campaigns and consumer engagement initiatives designed to drive growth and further resonate with more youth-minded consumers.
|
|
•
|
Driving product improvement and expansion, particularly within apparel, accessories and women’s intimates.
|
|
▪
|
Apparel — In Europe, our
CALVIN KLEIN
apparel assortments are underpenetrated compared to our
Tommy Hilfiger
offerings. We believe that we can grow our European apparel sales, given
CALVIN KLEIN’
s strong brand positioning and our proven success with
Tommy Hilfiger
in Europe.
|
9
|
▪
|
Accessories — We see opportunity to grow our handbag, small leather goods and accessories offerings across our geographies with the largest opportunities existing in Asia and Europe, as
Calvin Klein Accessories
has a very limited penetration in those markets.
|
|
▪
|
Women’s Intimates — We believe that we can further expand and improve the performance of our women’s intimates assortments, particularly as we leverage our strong positioning and brand awareness in men’s underwear. To that end, we have been focused on improving our designs, detailing and quality. Fit has been another key focus area, as we are adding extended women’s sizing and tailoring products and fit to accommodate different regional markets. Additionally, our growth in logo product (including the
Modern Cotton
collection) is helping us engage with youth-minded shoppers, which has been additive to the existing
Calvin Klein Underwear
women’s customer base.
|
|
•
|
Pursuing growth channels, including digital commerce, specialty stores and travel retail, while opportunistically opening specialized brick and mortar locations.
|
|
•
|
Gaining greater control of the brand, as we continue to evolve from licensor to owner.
|
|
•
|
Evolving our supply chain, including through our speed to market initiatives, to drive efficiencies and other benefits.
|
Tommy Hilfiger Business
We believe significant growth opportunities exist to drive further global retail sales of
Tommy Hilfiger
, including through:
|
•
|
Enhancing global brand relevance, with marketing campaigns and consumer engagement initiatives designed to drive growth and reflect
Tommy Hilfiger
’s accessible luxury positioning and classic American cool aesthetic.
|
|
•
|
Category expansion, particularly within womenswear and accessories, men’s tailored clothing, and underwear.
|
|
▪
|
Womenswear and accessories —We believe that we can grow our womenswear assortments, including accessories, globally as the
Tommy Hilfiger
brand remains underpenerated in this category. We see the biggest opportunity in Asia, where the brand is significantly underpenetrated compared to our European or North American businesses. Throughout 2016, we undertook several efforts to raise awareness of and to support this business, including launching the global ambassadorship with Gigi Hadid and entering into the G-III license to drive the North American womenswear wholesale business.
|
|
▪
|
Men’s tailored clothing — We believe that we can grow this business as we leverage our core competencies in dress furnishings and tailored apparel and expand internationally. In January 2017, we announced that the license for the Tommy Hilfiger men’s tailored clothing business in North America with Marcraft Clothes, Inc. will be terminated effective December 31, 2017. Beginning January 1, 2018, the license will move to Peerless Clothing International, Inc. in order to consolidate our men’s tailored clothing businesses for all of our brands in North America under one partner and drive the business forward.
|
|
▪
|
Underwear — We see significant room to grow the Tommy Hilfiger
underwear business, as we leverage our
Calvin Klein Underwear
expertise with regards to fit, styling, sourcing and fabrics.
|
|
•
|
Continuing regional expansion, particularly in Asia, as reflected by the TH China acquisition.
|
|
•
|
Pursuing growth through digital commerce.
|
|
•
|
Evolving our supply chain, including through our speed to market initiatives, to drive efficiencies and other benefits.
|
Heritage Brands Business
Our Heritage Brands business is our original business, is where we developed our core competencies and is an important complement to our global designer brand businesses. We believe that this business can continue to capture market share and generate healthy cash flows as we execute against our key strategic initiatives, including:
|
•
|
Brand management, as we are committed to designing and marketing quality, trend-right products that offer great value to our customers.
|
|
•
|
Leveraging and enhancing each division’s positioning in the market. This includes:
|
10
|
▪
|
Dress Furnishings — We operate the world’s largest dress shirt and neckwear business. We are focused on maintaining and expanding our positioning as we introduce innovation, such as the
Van Heusen Flex Collar
, and expand across channels.
|
|
▪
|
Sportswear — We are focused on elevating our sportswear offerings through quality, detailing, fashion and innovation, while also expanding our distribution across our wholesale partners, with an emphasis on driving our digital sales penetration. We are focused on strengthening our position in the mid-tier department stores, reinforcing the value equation for each brand and growing through cross-channel expansion.
|
|
▪
|
Core Intimates — We see a healthy path of growth for
Warner’s
and believe that we can expand our distribution, particularly within the mass market channel. We have enhanced our existing assortments, particularly bras, with new technologies, solutions-based innovation and more comfortable products, along with investing in new marketing campaigns and enhanced fixtures across our wholesale presentations.
|
|
▪
|
Swimwear — We plan to continue to extend our product offerings of swimwear and swim products to a wider audience.
Speedo
is on the cutting edge of technology and innovation in the competitive swimwear arena and we are continually enhancing the product assortment to reflect the latest advancements. We see potential to broaden the brand’s customer base and relevance beyond the competitive swimmer population to reach more general fitness and recreational consumers.
|
|
•
|
Maximizing distribution, particularly through wholesale partners (in store and online) and pure play digital commerce retailers.
|
|
•
|
Enhancing profitability by capitalizing on supply chain opportunities and maintaining a critical focus on inventory management.
|
Other Strategic Opportunities
While we believe we have an attractive and diverse portfolio of brands with growth potential, we will continue to explore acquisitions of companies or trademarks and licensing opportunities that we believe are additive to our overall business. New license opportunities allow us to fill new product and brand portfolio needs. We take a disciplined approach to acquisitions, seeking brands with broad consumer recognition that we can grow profitably and expand by leveraging our infrastructure and core competencies and, where appropriate, by extending the brand through licensing.
Seasonality
Our business generally follows a seasonal pattern. Our wholesale businesses tend to generate higher levels of sales in the first and third quarters, while our retail businesses tend to generate higher levels of sales in the fourth quarter. Royalty, advertising and other revenue tends to be earned somewhat evenly throughout the year, although the third quarter has the highest level of royalty revenue due to higher sales by licensees in advance of the holiday selling season. We expect this seasonal pattern will generally continue.
Design
Our businesses depend on our ability to stimulate and respond to consumer tastes and demands, as well as on our ability to remain competitive in the areas of quality and delivering a compelling price value proposition.
A significant factor in the continued strength of our brands is our in-house design teams. We form separate teams of designers and merchandisers for each of our brands, creating a structure that focuses on the special qualities and identity of each brand. These designers and merchandisers consider consumer taste and lifestyle and trends when creating a brand or product plan for a particular season. Additionally, Calvin Klein and Tommy Hilfiger tailor products and fit for different regional markets in order to appeal to local tastes, sizing differences or other preferences, while maintaining the cohesive creative vision for each brand. The process from initial design to finished product varies greatly but generally spans six to ten months prior to each retail selling season. Our product lines are developed primarily for two major selling seasons, Spring and Fall. However, certain of our product lines offer more frequent introductions of new merchandise.
Calvin Klein implemented a new global creative strategy to unify all of the
CALVIN KLEIN
brands under one creative vision during 2016. As part of this strategy, Raf Simons was appointed as Chief Creative Officer of Calvin Klein and is
11
responsible for leading the creative strategy of the brand globally, as well as overseeing all aspects of design, global marketing and communications, and visual creative services. Mr. Simons’ first collections for
CALVIN KLEIN 205 W39 NYC
were presented in February 2017 at New York Fashion week and will be available for sale in Fall 2017. He also introduced
Calvin Klein By Appointment
, a bespoke collection of distinct looks handcrafted and made to measure in New York, New York, available exclusively by appointment. Mr. Simons’ team also controls design operations and product development for most licensees and other strategic partners.
Tommy Hilfiger seeks to reinforce the premium positioning of the
Tommy Hilfiger
brands by taking a coordinated and consistent worldwide approach to brand management. We believe that regional execution and adaptation helps us anticipate, identify and respond more readily to changing consumer demand, fashion trends and local tastes or preferences. It also reduces the importance of any one collection and enables the brand to appeal to a wider range of customers.
Product Sourcing
Our capabilities for worldwide procurement and sourcing enable us to deliver to our customers competitive, high quality and low cost goods on a timely basis. We have an extensive established network of worldwide sourcing partners that enables us to meet our customers’ needs in an efficient manner and not rely on any one vendor or factory or on vendors or factories in any one country. Our products were produced in over 1,600 factories in over 50 countries during 2016. All but one of these factories was operated by independent manufacturers, with most being located in Asia. The manufacturers of our products are required to meet our quality, human rights, safety, environmental and cost requirements. We source finished products and, to a lesser extent, raw materials and trim. Raw materials and trim include fabric, buttons, thread, labels and similar components. Raw materials, trim, and production commitments are generally made two to six months prior to production, and quantities are finalized at that time. We believe we are one of the largest users of shirting fabric in the world. Finished products consist of manufactured and fully assembled products ready for shipment to our customers and our stores. We believe that an ample number of alternative suppliers exist should we need to secure additional or replacement production capacity and raw materials.
Our global supply chain teams, offices and buying agents enable us to monitor the quality of the goods manufactured by, and the delivery performance of, our suppliers, and work with our global compliance teams to ensure the enforcement of our human rights and labor standards and other code of conduct requirements through our ongoing extensive training, approval and monitoring system. Our purchases from our suppliers are effected through individual purchase orders specifying the price, quantity, delivery date and destination of the items to be produced. Sales are monitored regularly at both the retail and wholesale levels and modifications in production can be made either to increase or reduce inventories. We look to establish long-term supplier relationships in the appropriate locations throughout the world to meet our needs and we place our orders in a manner designed to limit the risk that a production disruption at any one facility could cause a serious inventory problem, while maximizing the business opportunity.
During the second quarter of 2016, we formed a joint venture, PVH Arvind Manufacturing Private Limited Company (“PVH Ethiopia”), in Ethiopia with Arvind Limited (“Arvind”). PVH Ethiopia was formed to operate a manufacturing facility that will produce finished products for us to distribute primarily in the United States. We expect the manufacturing facility to begin operations in the first half of 2017.
In March 2017, we entered into agreements for a transaction to restructure our supply chain relationship with Li & Fung Trading Limited (“Li & Fung”). The transaction establishes a new strategic partnership with Li & Fung to provide services to us and also provides for the termination of our non-exclusive buying agency agreement with Li & Fung, pursuant to which we are obligated to source certain
Calvin Klein Jeans
products and at least 54% of certain
Tommy Hilfiger
products through Li & Fung. The transaction is expected to close July 1, 2017. Our Tommy Hilfiger business uses other third party buying offices for a portion of its sourced products and has a small in-house sourcing team that places orders directly with suppliers.
We are continuing to develop strategies and make investments in people and locations that enhance our ability to provide our customers with timely product availability and delivery. We are evolving our supply chain and building upon our operating platforms to enhance our efficiencies across the organization. Speed is a focus area across our company, as we have taken measures to reduce our lead times, leverage data to enhance our operations and simplify our processes to create a more dynamic and responsive business model, while increasing service levels, reducing inventory exposure and improving quality and consumer value. We believe the enhancement of our supply chain efficiencies and working capital management through the effective use of our distribution network and overall infrastructure will allow us to better control costs and provide improved service to our customers.
12
The global supply chain teams monitor and track the primary cost inputs to the finished product to ensure that we pay the most appropriate cost for our finished goods. We continue to assess our manufacturing footprint to ensure we have the best infrastructure to meet the needs of our global wholesale and retail businesses.
Corporate Responsibility
Corporate responsibility is central to how we conduct business, as we recognize both the opportunity and the responsibility for businesses to take a lead role in addressing pressing global issues. We believe corporate responsibility helps strengthen our organization by managing risk, maximizing efficiencies and driving value in a rapidly changing world. Through our collective efforts, we seek to create value for both society and our business. Our corporate responsibility strategy is focused on ten commitments across three key focus areas. The strategies support 14 of the United Nation’s 17 Sustainable Development Goals, covering issues such as building safety, chemical management, greenhouse gases, inclusion and diversity, and supporting the needs of women and children. The three key focus areas are:
|
•
|
Empowering people — We believe that our people are the key to our future success. We are committed to investing in talent, developing our people and expanding their career development opportunities, while providing an inclusive environment where every individual is valued. We view people in our supply chain as an extension of our organization and we are committed to partnering with our business partners to help protect their employees’ rights.
|
|
•
|
Preserving the environment — We recognize our responsibility to address environmental impacts across our value chain, as well as the opportunity to maximize efficiencies and drive business value. This means reducing and phasing out hazardous chemicals, safeguarding water resources, innovating towards more sustainable packaging, and sourcing raw materials in a way that respects people, animals and the environment. In order to reduce our global greenhouse gas emissions, we measure and analyze our impact and are establishing targets around reducing energy consumption, increasing energy efficiency and utilizing clean energy.
|
|
•
|
Supporting communities — We are passionate about making a positive impact on the communities where we work and live. We aim to support the needs of women and children by creating safe spaces, improving access to education and enhancing their quality of life. We invest in local communities through partnerships with non-profit organizations, associate volunteerism and contributions.
|
We issue an annual report on our corporate responsibility efforts, which can be found on our corporate website.
Warehousing, Distribution and Logistics
Our products are shipped from manufacturers to our wholesale and retail warehousing and distribution centers for inspection, sorting, packing and shipment. Centers range in size and our main facilities are located in the United States in Arkansas, California, Georgia, North Carolina, Pennsylvania and Tennessee; and internationally in the Netherlands, Canada, China, Japan, Hong Kong, South Korea, Taiwan and Brazil. In North America, the two largest centers, located in Georgia and North Carolina, use fully integrated and automated distribution systems, where the bar code scanning of merchandise and cartons provide timely, accurate and instantaneous updates to the distribution system. Our warehousing and distribution centers are designed to provide responsive service to our customers and our retail stores on a cost-effective basis. This includes the use of various forms of electronic communications to meet customer needs, including advance shipping notices for certain customers.
We believe that our investments in logistics and supply chain management allow us to respond rapidly to changes in sales trends and consumer demands while enhancing inventory management. We believe our customers can better manage their inventories as a result of our continuous analysis of sales trends, broad array of product availability and quick response capabilities. Certain of our products can be ordered at any time through our EDI replenishment systems. For customers who reorder these products, we generally ship these products within one to two days of order receipt. Our backlog of customer orders totaled $1.377 billion and $1.364 billion as of January 29, 2017 and January 31, 2016, respectively.
The size of our order backlog depends upon a number of factors, including the timing of the market weeks for our particular lines during which a significant percentage of our orders are received and the timing of the shipments, which varies from year-to-year with consideration for holidays, consumer trends, concept plans, and the basic stock replenishment program’s usage. As a consequence, a comparison of the size of our order backlog from period to period may not be meaningful, nor may it be indicative of eventual shipments.
13
Material Customers
Our largest customers account for significant portions of our revenue. Sales to our five largest customers were 21.3% of our revenue in 2016, 22.2% of our revenue in 2015 and 21.8% of our revenue in 2014. No single customer accounted for more than 10% of our revenue in 2016, 2015 or 2014.
Advertising and Promotion
Our marketing programs are an integral feature of our brands and their associated product offerings. Advertisements generally portray a lifestyle rather than a specific item. We intend for each of our brands to be a leader in its respective market segment, with strong consumer awareness and consumer loyalty. We believe that our brands are successful in their respective segments because we have strategically positioned each brand to target a distinct consumer demographic. We design and market our products to complement each other, satisfy lifestyle needs, emphasize product features important to our target consumers and encourage consumer loyalty.
The largest component of our marketing programs is digital media, including our digital commerce platforms and social media outlets, which allows us to to expand our reach to customers and enables us to provide timely information in an entertaining fashion to consumers about our products, special events, promotions and store locations. In addition, we advertise through print media (including fashion, entertainment/human interest, business, men’s, women’s and sports magazines and newspapers), on television, through outdoor signage and through in-store point of sale materials, as well as participate in cooperative advertising programs with our retail partners.
We also advertise our brands through sport sponsorships and product tie-ins. Three-time PGA Tour winner Scott Piercy and 2015 PGA Tour champion David Lingmerth serve as brand ambassadors for
IZOD
Golf
, which includes wearing
IZOD Golf
apparel on-course.
Speedo
is endorsed by world-class swimmers, including Missy Franklin and Nathan Adrian. These athletes exclusively wear
Speedo
products in competition, including throughout the 2016 Summer Olympics, and participate in various promotional activities on behalf of the brand. We have an all-brand, regional sponsorship agreement with the New York Giants, and
CALVIN KLEIN
has an ongoing sponsorship agreement with the Brooklyn Nets and the Barclays Center.
With respect to our retail outlet operations, we generally rely upon local outlet mall developers to promote traffic for their centers. Outlet center developers employ multiple formats, including signage (highway billboards, off-highway directional signs, on-site signage and on-site information centers), print advertising (brochures, newspapers and travel magazines), direct marketing (to tour bus companies and travel agents), radio and television advertising and special promotions.
We believe
CALVIN KLEIN
is one of the best known designer names in the world, exemplifying bold, progressive ideals and a seductive, and often minimal, aesthetic. Its high-profile, often cutting-edge global advertising campaigns have periodically garnered significant publicity, notoriety and conversation among customers and consumers, as well as within the fashion industry, and have helped to establish and maintain the
CALVIN KLEIN
name and image. Calvin Klein has a dedicated in-house advertising agency, with experienced creative and media teams that develop and execute a substantial portion of the institutional consumer advertising for products under the
CALVIN KLEIN
brands and work closely with other Calvin Klein departments and business partners to deliver a cohesive and aspirational brand message to the consumer. Calvin Klein maintains multiple showroom facilities and sales offices in Europe, North and South America and Asia.
Creatively,
CALVIN KLEIN
had a tremendous year in 2016. With a focus on digital consumer engagement, the successful
#mycalvins
concept was evolved into a 360° lifestyle campaign for Spring. Its call-to-action,
“I _____ in #mycalvins”
, continued through the Fall season and asked the consumer “What do you do in yours?.” The Spring and Fall campaigns each featured a diverse group of pop culture influencers, including actors, musicians, athletes, fashion icons and artists. Through the campaigns, we took a significant step toward showcasing the “World of
CALVIN KLEIN
” with each of the
CALVIN KLEIN
brands being featured together in a true lifestyle presentation, as opposed to a single classification-based approach. Additionally, in January 2017, Calvin Klein debuted
Calvin Klein By Appointment
, a bespoke collection of distinct looks handcrafted and made to measure in New York, New York. The collection is a new high luxury tier of product for us, available exclusively by appointment beginning April 1, 2017. The launch was accompanied by a new advertising campaign, which was featured on
calvinklein.
com, the brand’s official social media channels, and in print, digital and outdoor advertising in New York, New York, Los Angeles, California, Paris, France, Milan, Italy, London, England, Tokyo, Japan, Hong Kong, China and Seoul, South Korea.
Calvin Klein also has a dedicated in-house global communications team, which incorporates corporate communications, public relations, celebrity dressing and special events. This group coordinates many global events to support
14
the brand and business, including the Spring and Fall
CALVIN KLEIN 205 W39 NYC
runway shows, and oversees the dressing of celebrities for events, award ceremonies and film premieres.
We believe that
Tommy Hilfiger
is one of the world’s leading designer lifestyle brands and is internationally recognized for celebrating the essence of classic American cool style featuring preppy with a twist designs. Tommy Hilfiger employs advertising, marketing and communications staff, including an in-house creative team, as well as outside agencies, to implement its global marketing and communications strategy across all channels of distribution. The Tommy Hilfiger marketing and communications team develops and coordinates Tommy Hilfiger advertising for all regions and product lines, licensees and regional distributors. Advertisements for
Tommy Hilfiger
brand products appear primarily in fashion and lifestyle magazines, newspapers, outdoor media and cinema and on television. The digital and online focus of marketing for the
Tommy Hilfiger
brands is integral to its campaigns and continues to increase. Additionally, the marketing and communications team coordinates personal appearances by Mr. Tommy Hilfiger, including at runway shows, brand events and flagship store openings as part of its efforts. Tommy Hilfiger maintains multiple showroom facilities and sales offices in Europe, North and South America and Asia,
as well as
innovative digital sales showrooms located in Tommy Hilfiger offices around the world that enhance the sales experience for wholesale accounts.
Significant
Tommy Hilfiger
marketing campaigns are launched two times per year in Spring/Summer and Fall/Winter to provide maximum consumer visibility of the new seasonal collections and to support sell-throughs. Marketing and consumer engagement continued to drive the brand forward in 2016, particularly in support of the brand’s global growth categories, including underwear, men’s tailored clothing and women’s apparel and accessories. One of the brand’s highest profile campaigns was its Fall 2016 marketing campaign featuring Gigi Hadid as the global brand ambassador for womenswear. The partnership was meaningful for Tommy Hilfiger, as it enabled the brand to capitalize on her impressive social media following, which was in excess of 28 million followers as of January 2017. The marketing campaign was accompanied by the TommyXGigi Capsule collection, which launched at New York Fashion Week in September 2016, along with the #TOMMYNOW “Buy Now. Wear Now.” concept that made the runway collection immediately available for purchase across all sales channels, including throughout our retail partner network globally. On the men’s side, Tommy Hilfiger continued its successful partnership with Rafael Nadal, who serves as the global brand ambassador for
Tommy Hilfiger
underwear,
Tommy Hilfiger Tailored
and the
Tommy Hilfiger Bold
fragrance.
In addition to offering a broad array of apparel and licensed products, our flagship digital commerce sites, Tommy Hilfiger’s digital commerce site,
tommy
.com, and Calvin Klein’s digital commerce site,
calvinklein
.com, also serve as marketing vehicles to complement the ongoing development of the
Tommy Hilfiger
and
CALVIN KLEIN
lifestyle brands, respectively.
Our Heritage Brands business also utilizes marketing campaigns to support its new product launches. The
Van Heusen Flex Collection
was supported by point of sale signage and print advertising to communicate the breadth of the collection and key product features. We also continued to advertise the
Warner’s No Side Effects
bra on television during 2016, as this collection continues to perform well. Additionally,
Speedo Fit
, a line of swimsuits and accessories targeted to recreational athletes, was advertised on television and through online videos featuring Olympic swimmers during 2016.
Trademarks
We own the
CALVIN KLEIN
,
Tommy Hilfiger
,
Van Heusen
,
IZOD
,
ARROW
,
Warner’s
,
Olga
and
Eagle
brands, as well as related trademarks (
e.g.
, the interlocking
“IZ”
logo for
IZOD
and the
Tommy Hilfiger
flag logo and crest design) and lesser-known names. These trademarks are registered for use in each of the primary countries where our products are sold and additional applications for registration of these and other trademarks are made in jurisdictions to accommodate new marks, uses in additional trademark classes or additional categories of goods or expansion into new countries.
We own the
CALVIN KLEIN
marks and derivative marks in all trademark classes and for all product categories through our ownership of Calvin Klein and Warnaco. Calvin Klein and Warnaco together own the Calvin Klein Trademark Trust (“the Trust”), which is the sole and exclusive title owner of substantially all registrations of the
CALVIN KLEIN
trademarks. The sole purpose of the Trust is to hold these marks. Calvin Klein maintains and protects the marks on behalf of the Trust pursuant to a servicing agreement. The Trust licenses to Calvin Klein and Warnaco on an exclusive, irrevocable, perpetual and royalty-free basis the use of the marks.
Mr. Calvin Klein retains the right to use his name, on a non-competitive basis, with respect to his right of publicity, unless those rights are already being used in the Calvin Klein business. Mr. Klein has also been granted a royalty-free worldwide right to use the
CALVIN KLEIN
mark with respect to certain personal businesses and activities, such as motion picture, television and video businesses, a book business, writing, speaking and teaching engagements, non-commercial
15
photography, charitable activities and architectural and industrial design projects, subject to certain limitations designed to protect the image and prestige of the
CALVIN KLEIN
brands and to avoid competitive conflicts.
Mr. Tommy Hilfiger is prohibited in perpetuity from using, or authorizing others to use, the
Tommy Hilfiger
marks (except for the use by Mr. Hilfiger of his name personally and in connection with certain specified activities). In addition, we are prohibited in perpetuity from selling products not ordinarily sold under the names of prestige designer businesses or prestige global lifestyle brands without Mr. Hilfiger’s consent, from engaging in new lines of business materially different from such types of lines of business without Mr. Hilfiger’s consent, or from disparaging or intentionally tarnishing the
Tommy Hilfiger
-related marks or Mr. Hilfiger’s personal name.
Our trademarks are the subject of registrations and pending applications throughout the world for use on a variety of apparel, footwear and related products, and we continue to expand our worldwide usage and registration of new and related trademarks. In general, trademarks remain valid and enforceable as long as the marks continue to be used in connection with the products and services with which they are identified and, as to registered tradenames, the required registration renewals are filed. In markets outside of the United States, particularly those where products bearing any of our brands are not sold by us or any of our licensees or other authorized users, our rights to the use of trademarks may not be clearly established.
Our trademarks and other intellectual property rights are valuable assets and we vigorously seek to protect them on a worldwide basis against infringement. We are susceptible to others imitating our products and infringing on our intellectual property rights. This is especially the case with respect to the
CALVIN KLEIN
and
Tommy Hilfiger
brands, as these brands enjoy significant worldwide consumer recognition and their generally higher pricing provides significant opportunity and incentive for counterfeiters and infringers. We have broad, proactive enforcement programs that we believe have been generally effective in controlling the sale of counterfeit products in the United States and in major markets abroad.
Competition
The apparel industry is competitive as a result of its fashion orientation, mix of large and small producers, the flow of domestic and imported merchandise and the wide diversity of retailing methods. We compete with numerous domestic and foreign designers, brands, manufacturers and retailers of apparel, accessories and footwear, including, in certain circumstances, the private label brands of our wholesale customers.
We compete primarily on the basis of style, quality, price and service. Our business depends on our ability to stimulate consumer tastes and demands, as well as on our ability to remain competitive in these areas. We believe we are well-positioned to compete in the apparel industry. Our diversified portfolio of brands and products and our use of multiple channels of distribution have allowed us to develop a business that produces results that are not dependent on any one demographic group, merchandise preference, distribution channel or geographic region. We have developed a portfolio of brands that appeal to a broad spectrum of consumers. Our owned brands have long histories and enjoy high recognition and awareness within their respective consumer segments. We develop our owned and licensed brands to complement each other and to generate strong consumer loyalty. The
CALVIN KLEIN
and
Tommy Hilfiger
brands generally provide us with the opportunity to develop businesses that target different consumer groups at higher price points and in higher-end distribution channels than our heritage brands, as well as with significant global opportunities due to the worldwide recognition of the brands.
Imports and Import Restrictions
A substantial portion of our products is imported into the United States, Canada, Europe and Asia. These products are subject to various customs laws, which may impose tariffs, as well as quota restrictions. Under the provisions of the World Trade Organization (“WTO”) agreement governing international trade in textiles, known as the “WTO Agreement on Textiles and Clothing,” the United States and other WTO member countries have eliminated quotas on textiles and apparel-related products from WTO member countries. As a result, quota restrictions generally do not affect our business in most countries. We are subject to numerous international trade agreements and regulations, such as the North American Free Trade Agreement, Africa Growth & Opportunity Act, Central American Free Trade Agreement, Jordan Free Trade Agreement, Israel Free Trade Agreement, Egypt Qualifying Industrial Zones, Colombia Free Trade Agreement, Peru Free Trade Agreement and other special trade programs. Presently, a portion of our imported products is eligible for certain of these duty-advantaged programs. In addition, each of the countries in which our products are sold has laws and regulations covering imports. Because the United States and the other countries in which our products are manufactured and sold may impose, from time to time, new duties, tariffs, surcharges, or other import controls or restrictions, including the imposition of a “safeguard quota,” or adjust presently prevailing duty or tariff rates or levels, we maintain a program of intensive monitoring of import restrictions and opportunities. We seek to minimize our potential exposure to import related risks through, among other measures, adjustments in product
16
design and fabrication, shifts of production among countries and manufacturers and geographical diversification of our sources of supply.
Environmental Matters
Our facilities and operations are subject to various environmental, health and safety laws and regulations. In addition, we may incur liability under environmental statutes and regulations with respect to the contamination of sites that we own or operate or previously owned or operated (including contamination caused by prior owners and operators of such sites, abutters or other persons) and the off-site disposal of hazardous materials. We believe our operations are in compliance with the terms of all applicable laws and regulations.
Employees
As of January 29, 2017, we employed approximately 18,800 persons on a full-time basis and approximately 15,700 persons on a part-time basis. Approximately 3% of our employees were represented for the purpose of collective bargaining by five different unions in the United States. Additional persons, some represented by these five unions, are employed from time to time based upon our manufacturing schedules and retailing seasonal needs. Our collective bargaining agreements generally are for one to three-year terms. In some international markets, a significant percentage of employees are covered by governmental labor arrangements. We believe that our relations with our employees are satisfactory.
Executive Officers of the Registrant
The following table sets forth the name, age and position of each of our executive officers:
|
Name
|
Age
|
Position
|
|||
|
Emanuel Chirico
|
59
|
|
Chairman and Chief Executive Officer
|
||
|
Michael A. Shaffer
|
54
|
|
Executive Vice President and Chief Operating & Financial Officer
|
||
|
Francis K. Duane
|
60
|
|
Chief Executive Officer, Heritage Brands and North America Wholesale
|
||
|
Daniel Grieder
|
55
|
|
Chief Executive Officer, Tommy Hilfiger Global and PVH Europe
|
||
|
Steven B. Shiffman
|
59
|
|
Chief Executive Officer, Calvin Klein
|
||
|
Mark D. Fischer
|
55
|
|
Executive Vice President, General Counsel & Secretary
|
||
|
Dave Kozel
|
61
|
|
Executive Vice President, Chief Human Resources Officer
|
||
Mr. Chirico joined us as Vice President and Controller in 1993. Mr. Chirico was named Executive Vice President and Chief Financial Officer in 1999, President and Chief Operating Officer in 2005, Chief Executive Officer in February 2006, and Chairman of the Board in June 2007.
Mr. Shaffer has been employed by us since 1990. He served as Senior Vice President, Retail Operations immediately prior to being named Executive Vice President, Finance in 2005, Executive Vice President and Chief Financial Officer in March 2006, and Executive Vice President and Chief Operating & Financial Officer in February 2012.
Mr. Duane served as President of our Izod division from 1998 until 2001, was named Vice Chairman, Sportswear in 2001, Vice Chairman, Wholesale Apparel in March 2006, Chief Executive Officer, Wholesale Apparel in February 2012, and Chief Executive Officer, Heritage Brands and North America Wholesale in February 2013.
Mr. Grieder has been employed by Tommy Hilfiger since 1997 (including time served with a predecessor organization). He served as Chief Executive Officer, Tommy Hilfiger Europe from 2008 until 2014, prior to being named Chief Executive Officer, Tommy Hilfiger Global and PVH Europe in July 2014.
Mr. Shiffman has been employed by us since 1992. Mr. Shiffman was named President & Chief Commercial Officer, Calvin Klein Retail in 2009, Group President, Calvin Klein Global Licensing and Retail in 2013, and Chief Executive Officer, Calvin Klein in July 2014.
Mr. Fischer joined us as Vice President, General Counsel & Secretary in 1999. He became Senior Vice President in 2007 and Executive Vice President in 2013.
17
Mr. Kozel has been employed by us since 2003. He was promoted from Vice President to Senior Vice President in 2007 and to Executive Vice President in 2013.
Our business is exposed to foreign currency exchange rate fluctuations and control regulations.
Our Calvin Klein and Tommy Hilfiger businesses each have substantial international components that expose us to significant foreign exchange risk. Our Heritage Brands business also has international components but those components are not significant to the business. Changes in exchange rates between the United States dollar and other currencies can impact our financial results in two ways: a translation impact and a transaction impact. The translation impact refers to the impact that changes in exchange rates can have on our financial results, as our operating results in local foreign currencies are translated into United States dollars using an average exchange rate over the representative period. Accordingly, during times of a strengthening United States dollar, particularly against the euro, the Brazilian real, the Japanese yen, the Korean won, the British pound sterling, the Canadian dollar, the Mexican peso, the Indian rupee, the Russian ruble and the Chinese yuan renminbi, our results of operations will be negatively impacted, as was the case during 2016 and which we expect, to a lesser extent, in 2017, and during times of a weakening United States dollar, our results of operations will be favorably impacted.
The transaction impact on financial results is common for apparel companies operating outside the United States that purchase goods in United States dollars, as is the case with most of our foreign operations. During times of a strengthening United States dollar, our results of operations will be negatively impacted from these transactions as the increased local currency value of inventory results in higher cost of goods sold in local currency when the goods are sold, as was the case during 2016 and which we expect, to a lesser extent, in 2017, and during times of a weakening United States dollar, our results of operations will be favorably impacted. We also have exposure to changes in foreign currency exchange rates related to certain intercompany transactions and, to a lesser extent, SG&A expenses
that are denominated in currencies other than the functional currency of a particular entity. We currently use and plan to continue to use foreign currency forward exchange contracts or other derivative instruments to mitigate the cash flow or market value risks associated with these inventory and intercompany transactions, but we are unable to entirely eliminate these risks.
We are also exposed to market risk for changes in exchange rates for the United States dollar in connection with our licensing businesses. Most of our license agreements require the licensee to report sales to us in the licensee’s local currency but to pay us in United States dollars based on the exchange rate as of the last day of the contractual selling period. Thus, while we are not generally exposed to exchange rate gains and losses between the end of the selling period and the date we collect payment, we are exposed to exchange rate changes during and up to the last day of the selling period. In addition, certain of our other foreign license agreements expose us to exchange rate changes up to the date we collect payment or convert local currency payments into United States dollars. As a result, during times of a strengthening United States dollar, our foreign royalty revenue will be negatively impacted, as was the case during 2016 and which we expect, to a lesser extent, in 2017, and during times of a weakening United States dollar, our foreign royalty revenue will be favorably impacted.
We conduct business, directly or through licensees and other partners, in countries that are or have been subject to exchange rate control regulations and have, as a result, experienced difficulties in receiving payments owed to us when due, with amounts left unpaid for extended periods of time. Although the amounts to date have been immaterial to our results, as our international businesses grow and if controls are enacted or enforced in additional countries, there can be no assurance that such controls would not have a material and adverse effect on our business, financial condition or results of operations.
A substantial portion of our revenue and gross profit is derived from a small number of large wholesale customers and the loss of any of these customers or significant financial difficulties in their businesses could substantially reduce our revenue.
A few of our customers account for significant portions of our revenue. Sales to our five largest customers were 21.3% of our revenue in 2016, 22.2% of our revenue in 2015 and 21.8% of our revenue in 2014. No single customer accounted for more than 10% of our revenue in 2016, 2015 or 2014. In February 2017, Macy’s announced that it had closed 66 stores and plans to close approximately 30 additional stores over the next several years and J. C. Penney Company, Inc. (“J. C. Penney”) announced that it will close between 130 and 140 locations in 2017. These store closings may result in a decrease in the total amount of purchases made by Macy’s and J. C. Penney, two of our five largest customers in 2016, and could have an adverse effect on our United States wholesale business.
Tommy Hilfiger is party to an agreement with Macy’s providing for the exclusive department store distribution in the United States of men’s sportswear under the
Tommy Hilfiger
brand. The term of this agreement ends on January 31, 2020. As a
18
result of this strategic alliance, the success of Tommy Hilfiger’s North American men’s wholesale business is substantially dependent on this relationship and on Macy’s ability to maintain and increase sales of
Tommy Hilfiger
products. In addition, our United States men’s wholesale businesses may be affected by any operational or financial difficulties that Macy’s experiences, including any deterioration in Macy’s overall ability to attract customer traffic or in its overall liquidity position.
We do not have long-term agreements with any of our customers, other than Tommy Hilfiger’s strategic alliance with Macy’s, and purchases generally occur on an order-by-order basis. A decision by any of our major customers, whether motivated by marketing strategy, competitive conditions, financial difficulties or otherwise, to decrease significantly the amount of merchandise purchased from us or our licensing or other partners, or to change their manner of doing business with us or our licensing or other partners, could substantially reduce our revenue and materially adversely affect our profitability. During the past several years, the retail industry has experienced a great deal of consolidation and other ownership changes, as well as management changes and store closing programs, and we expect such changes to be ongoing. In addition, store closings by our customers, such as those described above, decrease the number of stores carrying our products, while the remaining stores may purchase a smaller amount of our products and may reduce the retail floor space designated for our brands. In the future, retailers may further consolidate, undergo restructurings or reorganizations, realign their affiliations or reposition their stores’ target markets or marketing strategies. Any of these types of actions could decrease the number of stores that carry our products or increase the ownership concentration within the retail industry. These changes could decrease our opportunities in the market, increase our reliance on a smaller number of large customers and decrease our negotiating strength with our customers. These factors could have a material adverse effect on our financial condition and results of operations.
We may not be able to continue to develop and grow our Calvin Klein and Tommy Hilfiger businesses in terms of revenue and profitability.
A significant portion of our business strategy involves growing our Calvin Klein and Tommy Hilfiger businesses. Our achievement of revenue and profitability growth from Calvin Klein and Tommy Hilfiger will depend largely upon our ability to:
|
•
|
continue to maintain and enhance the distinctive brand identities of the
CALVIN KLEIN
and
Tommy Hilfiger
brands;
|
|
•
|
retain key employees at our Calvin Klein and Tommy Hilfiger businesses;
|
|
•
|
continue to maintain good working relationships with Calvin Klein’s and Tommy Hilfiger’s licensees;
|
|
•
|
continue to enter into new (or renew or extend existing) licensing agreements for the
CALVIN KLEIN
and
Tommy Hilfiger
brands; and
|
|
•
|
continue to strengthen and expand the Calvin Klein and Tommy Hilfiger businesses.
|
We cannot assure you that we can successfully execute any of these actions or our growth strategy for these businesses, nor can we assure you that the launch of any additional product lines or businesses by us or our licensees or that the continued offering of these lines will achieve the degree of consistent success necessary to generate profits or positive cash flow. Our ability to successfully carry out our growth strategy may be affected by, among other things, our ability to enhance our relationships with existing customers to obtain additional selling space or add additional product lines, our ability to develop new relationships with retailers, economic and competitive conditions, changes in consumer spending patterns and changes in consumer tastes and style trends. If we fail to continue to develop and grow either the Calvin Klein or Tommy Hilfiger business in terms of revenue and profitability, our financial condition and results of operations may be materially and adversely affected.
Acquisitions may not be successful in achieving intended benefits, cost savings and synergies.
One component of our growth strategy has been to make acquisitions, such as the Calvin Klein, Tommy Hilfiger and Warnaco acquisitions. Prior to completing any acquisition, our management team identifies expected synergies, cost savings and growth opportunities but, due to legal and business limitations, we may not have access to all necessary information. The integration process may be complex, costly and time-consuming. The potential difficulties of integrating the operations of an acquired business and realizing our expectations for an acquisition, including the benefits that may be realized, include, among other things:
|
•
|
failure to implement our business plan for the combined business;
|
|
•
|
delays or difficulties in completing the integration of acquired companies or assets;
|
19
|
•
|
higher than expected costs, lower than expected cost savings or a need to allocate resources to manage unexpected operating difficulties;
|
|
•
|
unanticipated issues in integrating manufacturing, logistics, information, communications and other systems;
|
|
•
|
unanticipated changes in applicable laws and regulations affecting the acquired business;
|
|
•
|
unanticipated changes in the combined business due to potential divestitures or other requirements imposed by antitrust regulators;
|
|
•
|
retaining key customers, suppliers and employees;
|
|
•
|
retaining and obtaining required regulatory approvals, licenses and permits;
|
|
•
|
operating risks inherent in the acquired business;
|
|
•
|
diversion of the attention and resources of management;
|
|
•
|
consumers’ failure to accept product offerings by us or our licensees;
|
|
•
|
assumption of liabilities not identified in due diligence;
|
|
•
|
the impact on our or an acquired business’ internal controls and compliance with the requirements under the Sarbanes-Oxley Act of 2002; and
|
|
•
|
other unanticipated issues, expenses and liabilities.
|
We have completed acquisitions that have not performed as well as initially expected and cannot assure you that any acquisition will not have a material adverse impact on our financial condition and results of operations.
Future economic conditions, including volatility in the financial and credit markets may adversely affect our business.
Economic conditions in the past have adversely affected, and in the future may adversely affect, our business, our customers and their businesses, and our financing and other contractual arrangements. Such conditions, among other things, have resulted, and in the future may result, in financial difficulties leading to restructurings, bankruptcies, liquidations and other unfavorable events for our customers, and may continue to cause such customers to reduce or discontinue orders of our products or be unable to pay us for products they have purchased from us. Financial difficulties of customers may also affect the ability of our customers to access credit markets or lead to higher credit risk relating to receivables from customers.
Future volatility in the financial and credit markets could make it more difficult for us to obtain financing or refinance existing debt when the need arises or on terms that would be acceptable to us.
Our retail stores are heavily dependent on the ability and desire of consumers to travel and shop.
The vast majority of our retail stores are located away from major residential centers and, in many cases, are near vacation destinations. As a result, reduced travel resulting from economic conditions, fuel shortages, increased fuel prices, travel restrictions, travel concerns and other circumstances, including adverse weather conditions, disease epidemics and other health-related concerns, war, terrorist attacks or the perceived threat of war or terrorist attacks could have a material adverse effect on us, particularly if such events impact certain of our higher-volume retail locations. Additionally, during times of a strengthening United States dollar, particularly against the euro, the Brazilian real, the Canadian dollar, the Mexican peso and the Chinese yuan renminbi, as was the case during 2016 and which we expect for 2017, international tourism to the United States could be (and, in 2016 was) reduced, as could the extent to which international tourists shop at our retail stores, which could have a material adverse effect on our sales in our United States retail stores, which are material contributors of revenue and profits. Other factors that could affect the success of our stores include:
|
•
|
the location of the mall or the location of a particular store within the mall;
|
|
•
|
the other tenants occupying space at the mall;
|
|
•
|
increased competition in areas where the malls are located; and
|
|
•
|
the amount of advertising and promotional dollars spent on attracting consumers to the malls.
|
20
The success of our Calvin Klein and Tommy Hilfiger businesses depends on the value of our “CALVIN KLEIN” and “Tommy Hilfiger” brands, and if the value of either of those brands were to diminish, our business could be adversely affected.
Our success depends on our brands and their value. The
CALVIN KLEIN
name is integral to the existing Calvin Klein business, as well as to our strategies for continuing to grow and expand the business. The
CALVIN KLEIN
brands could be adversely affected if Mr. Klein’s public image or reputation were to be tarnished. We have similar exposure with respect to the
Tommy Hilfiger
brands. Mr. Hilfiger is closely identified with the
Tommy Hilfiger
brand and any negative perception with respect to Mr. Hilfiger could adversely affect the
Tommy Hilfiger
brands. In addition, under Mr. Hilfiger’s employment agreement, if his employment is terminated for any reason, his agreement not to compete with the Tommy Hilfiger business will expire two years after such termination. Although Mr. Hilfiger could not use any
Tommy Hilfiger
trademark in connection with a competitive business, his association with a competitive business could adversely affect the Tommy Hilfiger business.
Our level of debt could impair our financial condition and ability to operate.
We had outstanding as of January 29, 2017 an aggregate of $3.223 billion of indebtedness under our senior secured credit facilities, our senior notes and our secured debentures. Our level of debt could have important consequences to investors, including:
|
•
|
requiring a substantial portion of our cash flows from operations be used for the payment of interest on our debt, thereby reducing the funds available to us for our operations or other capital needs;
|
|
•
|
limiting our flexibility in planning for, or reacting to, changes in our business and the industry in which we operate because our available cash flow after paying principal and interest on our debt may not be sufficient to make the capital and other expenditures necessary to address these changes;
|
|
•
|
increasing our vulnerability to general adverse economic and industry conditions because, during periods in which we experience lower earnings and cash flow, we will be required to devote a proportionally greater amount of our cash flow to paying principal and interest on our debt;
|
|
•
|
limiting our ability to obtain additional financing in the future to fund working capital, capital expenditures, acquisitions, contributions to our pension plans and general corporate requirements;
|
|
•
|
placing us at a competitive disadvantage to other relatively less leveraged competitors that have more cash flow available to fund working capital, capital expenditures, acquisitions, share repurchases, dividend payments, contributions to pension plans and general corporate requirements; and
|
|
•
|
with respect to any borrowings we make at variable interest rates, including under our senior secured credit facility, leaving us vulnerable to increases in interest rates to the extent the borrowings are not subject to an interest rate swap or interest rate cap agreement.
|
We primarily use foreign suppliers for our products and raw materials, which poses risks to our business operations.
The majority of our apparel and footwear products are produced by and purchased or procured from independent manufacturers located in countries in Europe, Asia (including China and the Indian subcontinent), the Middle East, South America, the Caribbean, Central America and Africa. We believe that we are one of the largest users of shirting fabric in the world. Although no single supplier or country is expected to be critical to our production needs, any of the following could materially and adversely affect our ability to produce or deliver our products and, as a result, have a material adverse effect on our business, financial condition and results of operations:
|
•
|
political, labor instability or military conflict involving any of the countries in which we, our contractors, or our suppliers operate, which could cause a delay in the transportation of our products and raw materials to us and an increase in transportation costs;
|
|
•
|
heightened terrorism security concerns, which could subject imported or exported goods to additional, more frequent or more thorough inspections, leading to delays in deliveries or impoundments of goods for extended periods or could result in decreased scrutiny by customs officials for counterfeit goods, leading to lost sales, increased costs for our anti-counterfeiting measures and damage to the reputation of our brands;
|
|
•
|
a significant decrease in availability or increase in cost of raw materials or the inability to use raw materials produced in a country that is a major provider due to political, human rights, labor, environmental, animal cruelty or other concerns;
|
21
|
•
|
a significant decrease in factory and shipping capacity or increase in demand for such capacity;
|
|
•
|
a significant increase in wage and shipping costs;
|
|
•
|
disease epidemics and health-related concerns, which could result in closed factories, reduced workforces, scarcity of raw materials and scrutiny or embargoing of goods produced in infected areas;
|
|
•
|
migration and development of manufacturers, which could affect where our products are or are planned to be produced;
|
|
•
|
imposition of regulations, quotas and safeguards relating to imports and our ability to adjust timely to changes in trade regulations, which, among other things, could limit our ability to produce products in cost-effective countries that have the labor and expertise needed;
|
|
•
|
imposition of duties, taxes and other charges on imports; and
|
|
•
|
restrictions on transfers of funds out of countries where our foreign licensees are located.
|
Recently, members of the United States government have indicated their intentions to reform trade and tax regulations related to the import of goods into the United States and significant changes seem likely. Proposed reforms include increased tariffs on imported goods into the United States from certain countries where our goods are produced and a border adjustment tax that would increase income taxes on the sales of imported goods in the United States. Substantially all of the products we sell in the United States are imported. Therefore, while enactment of any such proposal is not certain, such changes, if enacted, could have a material adverse effect on our business and results of operations.
If our manufacturers, or the manufacturers used by our licensees, fail to use legal and ethical business practices, our business could suffer.
We require our manufacturers, and the manufacturers used by our licensees (and the licensees themselves), to operate in compliance with applicable laws, rules and regulations regarding working conditions, employment practices and environmental compliance. Additionally, we impose upon our business partners operating guidelines that require additional obligations in those areas in order to promote ethical business practices, and our staff and third parties we retain for such purposes periodically visit and monitor the operations of these independent parties to determine compliance. We are a signatory of the Accord on Fire and Building Safety in Bangladesh to improve fire and building safety in Bangladesh’s apparel factories and we continue to collaborate with factories, suppliers, industry participants and other engaged stakeholders to improve the lives of our factory workers and others in our sourcing communities. However, we do not control our manufacturers or licensees, or the manufacturers used by our licensees, or their labor, manufacturing and other business practices. If any of these manufacturers (or licensees) violates labor, environmental, building and fire safety, or other laws or implements labor, manufacturing or other business practices that are generally regarded as unethical in the United States, the shipment of finished products to us could be interrupted, orders could be cancelled and relationships could be terminated. In addition, we could be the focus of adverse publicity and our reputation could be damaged. Any of these events could have a material adverse effect on our revenue and, consequently, our results of operations.
We are dependent on third parties to source and manufacture our products and any disruption in our relationships with these parties or in their businesses may materially adversely affect our businesses.
We rely upon independent third parties for the vast majority of our apparel and footwear products. A manufacturer’s failure to ship products to us in a timely manner or to meet required quality standards could cause us to miss the delivery date requirements of our customers for those products. As a result, customers could cancel their orders, refuse to accept deliveries or demand reduced prices. Any of these actions taken by our customers could have a material adverse effect on our revenue and, consequently, our results of operations.
In addition, we are a party to a non-exclusive buying agency agreement with Li & Fung under which we are obligated to source certain
Calvin Klein Jeans
products and at least 54% of certain
Tommy Hilfiger
products through Li & Fung (or pay a penalty). Li & Fung is one of the world’s largest buying agencies for apparel and related goods and is our largest buying office for
Tommy Hilfiger
products. The buying agency agreement with Li & Fung is terminable by us upon 12 months’ prior notice for any reason and is terminable by either party (i) upon six months’ prior notice in the event of a material breach by the other party and (ii) immediately upon the occurrence of certain bankruptcy or insolvency events relating to the other party. In March 2017, we entered into agreements for a transaction to restructure our supply chain relationship with Li & Fung. The transaction establishes a new strategic partnership with Li & Fung to provide services to us and also provides for the termination of our non-exclusive buying agency agreement with Li & Fung. The transaction is expected to close July 1, 2017. If the transaction
22
does not close, we will continue to be obligated under the non-exclusive buying agreement with Li & Fung described above. We also use other third party buying offices for a portion of our sourcing for
Tommy Hilfiger
products and have retained a small in-house sourcing team. Any interruption in the operations of Li & Fung or other buying offices, the failure of Li & Fung or other buying offices to perform effectively their services for us, or the failure of us to realize the expected benefits of the transaction described above, could result in material delays, reductions of shipments and increased costs. Furthermore, such events could harm our wholesale and retail relationships. We may be unable to source products through other third parties in sufficient quantities, if at all, on terms commercially acceptable to us and on a timely basis. Any disruption in our relationships with our buying offices or in their businesses could have a material adverse effect on our cash flows, business, financial condition and results of operations.
We are dependent on a limited number of distribution facilities. If one becomes inoperable, our business, financial condition and operating results could be negatively impacted.
We operate a limited number of distribution facilities and also rely on certain independently operated distribution facilities around the world to warehouse and ship products to our customers and perform related logistics services. Our ability to meet the needs of our retail customers and of our own retail stores depends on the proper operation of our primary facilities. If any of our primary facilities were to shut down or otherwise become inoperable or inaccessible for any reason, we could have a substantial loss of inventory or disruptions of deliveries to our customers and our stores, incur significantly higher costs or experience longer lead times associated with the distribution of our products during the time it takes to reopen or replace the facility. This could adversely affect our business, financial condition and operating results.
A portion of our revenue is dependent on royalties and licensing.
The operating profit associated with our royalty, advertising and other revenue is significant because the operating expenses directly associated with administering and monitoring an individual licensing or similar agreement are minimal. Therefore, the loss of a significant licensing partner, whether due to the termination or expiration of the relationship, the cessation of the licensing partner’s operations or otherwise (including as a result of financial difficulties of the partner), without an equivalent replacement, could materially impact our profitability.
While we generally have significant control over our licensing partners’ products and advertising, we rely on our licensing partners for, among other things, operational and financial controls over their businesses. Our licensing partners’ failure to successfully market licensed products or our inability to replace our existing licensing partners could materially and adversely affect our revenue both directly from reduced royalty and advertising and other revenue received and indirectly from reduced sales of our other products. Risks are also associated with our licensing partners’ ability to obtain capital, execute their business plans, timely deliver quality products, manage their labor relations, maintain relationships with their suppliers, manage their credit risk effectively and maintain relationships with their customers.
Our licensing business makes us susceptible to the actions of third parties over whom we have limited control.
We rely on our licensing partners to preserve the value of our brands. Although we attempt to protect our brands through, among other things, approval rights over design, production quality, packaging, merchandising, distribution, advertising and promotion of our products, we cannot assure you that we can control our licensing partners’ use of our licensed brands. The misuse of our brands by a licensing partner could have a material adverse effect on our business, financial condition and results of operations.
We may be unable to protect our trademarks and other intellectual property rights.
Our trademarks and other intellectual property rights are important to our success and our competitive position. We are susceptible to others imitating our products and infringing on our intellectual property rights, especially with respect to the
CALVIN KLEIN
and
Tommy Hilfiger
brands, as they enjoy significant worldwide consumer recognition and the generally premium pricing of
CALVIN KLEIN
and
Tommy Hilfiger
brand products creates additional incentive for counterfeiters and infringers. Imitation or counterfeiting of our products or infringement of our intellectual property rights could diminish the value of our brands or otherwise adversely affect our revenue. We cannot assure you that the actions we take to establish and protect our trademarks and other intellectual property rights will be adequate to prevent imitation of our products by others or to prevent others from seeking to invalidate our trademarks or block sales of our products as a violation of their own trademarks and intellectual property rights. In addition, we cannot assure you that others will not assert rights in, or ownership of, trademarks and other intellectual property rights of ours or in marks that are similar to ours or marks that we license or market or that we will be able to successfully resolve these types of conflicts to our satisfaction. In some cases, there may be
23
trademark owners who have prior rights to our marks because the laws of certain foreign countries may not protect intellectual property rights to the same extent as do the laws of the United States. In other cases, there may be holders who have prior rights to similar marks. For example, in the past we were involved in proceedings relating to a company’s claim of prior rights to the
IZOD
mark in Mexico and to another company’s claim of prior rights to the
CALVIN KLEIN
mark in Chile. We are currently involved in opposition and cancellation proceedings with respect to marks similar to some of our brands, both domestically and internationally.
The success of our dress furnishings business is dependent on the strategies and reputation of our licensors.
Our business strategy is to offer our products on a multiple brand, multiple channel and multiple price point basis. This strategy is designed to provide stability should market trends shift. As part of this strategy we license the names and brands of recognized designers and celebrities, including Kenneth Cole, Michael Kors and Sean “Puff Daddy” Combs (
Sean John
). In entering into these license agreements, we target our products towards certain market segments based on consumer demographics, design, suggested pricing and channel of distribution in order to minimize competition between our own products and maximize profitability. If any of our licensors determines to “reposition” a brand we license from them, introduce similar products under similar brand names or otherwise change the parameters of design, pricing, distribution, target market or competitive set, we could experience a significant downturn in that brand’s business, adversely affecting our sales and profitability. In addition, as products may be personally associated with these designers and celebrities, our sales of those products could be materially and adversely affected if any of those individual’s images, reputations or popularity were to be negatively impacted.
We face intense competition in the apparel industry.
Competition is intense in the apparel industry. We compete with numerous domestic and foreign designers, brands, manufacturers and retailers of apparel, accessories and footwear, some of which have greater resources than we do. In addition, in certain instances, we compete directly with our wholesale customers as they also sell their own private label products in their stores. We compete within the apparel industry primarily on the basis of:
|
•
|
anticipating and responding to changing consumer tastes and demands in a timely manner and developing attractive, quality products;
|
|
•
|
maintaining favorable brand recognition;
|
|
•
|
appropriately pricing products and creating an acceptable value proposition for customers;
|
|
•
|
providing strong and effective marketing support;
|
|
•
|
ensuring product availability and optimizing supply chain efficiencies with third party manufacturers and retailers; and
|
|
•
|
obtaining sufficient retail floor space and effective presentation of our products at retail.
|
The failure to compete effectively or to keep pace with rapidly changing markets could have a material adverse effect on our business, financial condition and results of operations. In addition, if we misjudge the market for our products, we could be faced with significant excess inventories for some products and missed opportunities for others.
Our profitability may decline as a result of increasing pressure on margins.
The apparel industry, particularly in the United States (our largest market), is subject to significant pricing pressure caused by many factors, including intense competition, consolidation in the retail industry, pressure from retailers to reduce the costs of products and changes in consumer demand. These factors may cause us to reduce our sales prices to retailers and consumers, which could cause our profitability to decline if we are unable to appropriately manage inventory levels or offset price reductions with sufficient reductions in product costs or operating expenses. This could have a material adverse effect on our results of operations, liquidity and financial condition.
The loss of members of our executive management and other key employees could have a material adverse effect on our business.
We depend on the services and management experience of our executive officers, who have substantial experience and expertise in our business. We also depend on other key executives in various areas of our businesses and operations. Competition for qualified personnel in the apparel industry is intense and competitors may use aggressive tactics to recruit our key employees. The unexpected loss of services of one or more of these individuals could have a material adverse effect on us.
24
A significant shift in the relative sources of our earnings, adverse decisions of tax authorities or changes in tax treaties, laws, rules or interpretations could have a material adverse effect on our results of operations and cash flow.
We have direct operations in many countries and the applicable tax rates vary by jurisdiction. As a result, our overall effective tax rate could be materially affected by the relative level of earnings in the various taxing jurisdictions to which our earnings are subject. In addition, the tax laws and regulations in the countries where we operate may be subject to change and there may be changes in interpretation and enforcement of tax law. As a result, we may pay additional taxes if tax rates increase or if tax laws, regulations or treaties in the jurisdictions where we operate are modified by the competent authorities in an adverse manner.
In addition, various national and local taxing authorities periodically examine us and our subsidiaries. The resolution of an examination or audit may result in us paying more than the amount that we may have reserved for a particular tax matter, which could have a material adverse effect on our cash flows, business, financial condition and results of operations for any affected reporting period.
We and our subsidiaries are engaged in a number of intercompany transactions. Although we believe that these transactions reflect arm’s length terms and that proper transfer pricing documentation is in place, which should be respected for tax purposes, the transfer prices and conditions may be scrutinized by local tax authorities, which could result in additional tax liabilities.
If we are unable to fully utilize our deferred tax assets, our profitability could be reduced.
Our deferred income tax assets are valuable to us. These assets include tax loss and foreign tax credit carryforwards in various jurisdictions. Realization of deferred tax assets is based on a number of factors, including whether there will be adequate levels of taxable income in future periods to offset the tax loss and foreign tax credit carryforwards in jurisdictions where such assets have arisen. Valuation allowances are recorded in order to reduce the deferred tax assets to the amount expected to be realized in the future. In assessing the adequacy of our valuation allowances, we consider various factors including reversal of deferred tax liabilities, forecasted future taxable income and potential tax planning strategies. These factors could reduce the value of the deferred tax assets, which could have a material effect on our profitability.
We rely significantly on information technology. Our businesses could be adversely impacted if our computer systems are disrupted or cease to operate effectively or if we are subject to a data security or privacy breach.
Our ability to effectively manage and operate our business depends significantly on information technology systems. The failure of our systems to operate effectively or disruption in our systems could adversely impact our operations. Additionally, any electronic or physical security breach involving the misappropriation, loss or other unauthorized disclosure of confidential or personally identifiable information, including penetration of our network security, whether by us or by a third party, could disrupt our business, severely damage our reputation and our relationships with our customers, expose us to risks of litigation and liability and adversely affect our business and results of operations.
Volatility in securities markets, interest rates and other economic factors could substantially increase our defined benefit pension costs and liabilities.
We have significant obligations under our defined benefit pension plans. The funded status of our pension plans is dependent on many factors, including returns on invested plan assets and the discount rate used to measure pension obligations. Unfavorable returns on plan assets, a lower discount rate or unfavorable changes in the applicable laws or regulations could materially change the timing and amount of pension funding requirements, which could reduce cash available for our business.
Our operating performance also may be significantly impacted by the amount of expense recorded for our pension plans. Pension expense recorded throughout the year is calculated using actuarial valuations that incorporate assumptions and estimates about financial market, economic and demographic conditions. Differences between estimated and actual results give rise to gains and losses that are recorded immediately in pension expense, generally in the fourth quarter of the year, which can create volatility in our operating results.
Our balance sheet includes a significant amount of intangible assets and goodwill. A decline in the estimated fair value of an intangible asset or of a reporting unit could result in an impairment charge recorded in our operating results, which could be material.
25
Goodwill and other indefinite-lived intangible assets are tested for impairment annually and between annual tests if an event occurs or circumstances change that would indicate the carrying amount may be impaired. Also, we review our amortizable intangible assets for impairment if an event occurs or circumstances change that would indicate the carrying amount may not be recoverable. If the carrying value of an intangible asset or goodwill were to exceed its fair value, the asset would be written down to its fair value, with the impairment charge recognized as a noncash expense in our operating results. Adverse changes in future market conditions or weaker operating results compared to our expectations may impact our projected cash flows and estimates of weighted average cost of capital, which could result in a potentially material impairment charge if we are unable to recover the carrying value of our goodwill and other intangible assets.
As of January 29, 2017, we had approximately $3.470 billion of goodwill and $3.610 billion of trademarks and other identifiable intangible assets on our balance sheet, which together represented 64% of our total assets. No impairment was recorded in 2016 based on our annual goodwill impairment test.
Provisions in our certificate of incorporation and our by-laws and Delaware General Corporation Law could make it more difficult to acquire us and may reduce the market price of our common stock.
Our certificate of incorporation and by-laws contain certain provisions, including provisions requiring supermajority voting (80% of the outstanding voting power) to approve certain business combinations, permitting the Board of Directors to fill vacancies on the Board and authorizing the Board of Directors to issue shares of preferred stock without approval of our stockholders. These provisions could also have the effect of deterring changes of control.
In addition, Section 203 of the Delaware General Corporation Law imposes restrictions on mergers and other business combinations between us and any holder of 15% or more of our common stock. The existence of this provision may have an anti-takeover effect with respect to transactions not approved in advance by the Board of Directors.
None.
26
The general location, use, ownership status and approximate size of the principal properties that we occupied as of
January 29, 2017
are set forth below:
|
Location
|
Use
|
Ownership
Status
|
Approximate
Area in
Square Feet
|
|||
|
New York, New York
|
Corporate and Heritage Brands administrative offices and showrooms
|
Leased
|
209,000
|
|
||
|
New York, New York
|
Calvin Klein administrative offices and showrooms
|
Leased
|
411,000
|
|
||
|
New York, New York
|
Tommy Hilfiger administrative offices and showrooms
|
Leased
|
348,000
|
|
||
|
Bridgewater, New Jersey
|
Corporate, finance and retail administrative offices
|
Leased
|
249,000
|
|
||
|
Amsterdam, The Netherlands
|
Tommy Hilfiger and Calvin Klein administrative offices, warehouse and showrooms
|
Leased
|
321,000
|
|
||
|
Venlo/Oud Gastal, The Netherlands
|
Warehouse and distribution centers
|
Leased
|
1,405,000
|
|
||
|
McDonough, Georgia
|
Warehouse and distribution center
|
Leased
|
851,000
|
|
||
|
Jonesville, North Carolina
|
Warehouse and distribution center
|
Owned
|
778,000
|
|
||
|
Irwindale, California
|
Warehouse and distribution center
|
Leased
|
486,000
|
|
||
|
Chattanooga, Tennessee
|
Warehouse and distribution center
|
Owned
|
451,000
|
|
||
|
Reading, Pennsylvania
|
Warehouse and distribution center
|
Owned
|
410,000
|
|
||
|
Los Angeles, California
|
Neckwear administrative office, warehouse and manufacturing facility
|
Leased
|
200,000
|
|
||
|
Montreal, Canada
|
Administrative office, warehouses and distribution centers
|
Leased
|
183,000
|
|
||
|
Hong Kong, China
|
Corporate, Calvin Klein and Tommy Hilfiger administrative offices
|
Leased
|
146,000
|
|
||
|
Hawassa, Ethiopia
|
Manufacturing facility
|
Leased
|
144,000
|
|
||
|
Brinkley, Arkansas
|
Warehouse and distribution center
|
Owned
|
112,000
|
|
||
|
Dusseldorf, Germany
|
Tommy Hilfiger showrooms
|
Leased
|
85,000
|
|
||
|
Cypress, California
|
Speedo administrative offices
|
Leased
|
69,000
|
|
||
In addition, as of
January 29, 2017
, we leased certain other administrative/support offices and showrooms in various domestic and international locations. We also leased and operated approximately 1,600 retail locations as of
January 29, 2017
in the United States, Canada, Europe, Asia and Brazil.
Our Jonesville, North Carolina property is subject to a lien under our secured revolving credit facility.
Information with respect to minimum annual rental commitments under leases in which we are a lessee is included in
Note 16
, “Leases,” in the Notes to Consolidated Financial Statements included in Item 8 of this report.
We are a party to certain litigations which, in management’s judgment based, in part, on the opinions of legal counsel, will not have a material adverse effect on our financial position.
Not applicable.
27
Certain information with respect to the market for our common stock, which is listed on the New York Stock Exchange, and the dividends declared on our common stock appear in the Notes to Consolidated Financial Statements included in Item 8 of this report under
Note 13
, “Stockholders’ Equity,” and under the heading “Selected Quarterly Financial Data- Unaudited” on pages F-57 and F-58. See
Note 8
, “Debt,” in the Notes to Consolidated Financial Statements included in Item 8 of this report for a description of the restrictions to our paying dividends on our common stock. As of March 14, 2017, there were 670 stockholders of record of our common stock. The closing price of our common stock on March 14, 2017 was $91.52.
ISSUER PURCHASES OF EQUITY SECURITIES
|
Period
|
(a) Total Number of Shares (or Units) Purchased
(1)(2)
|
(b) Average Price Paid
per Share
(or Unit)
(1)(2)
|
(c) Total Number of Shares (or Units) Purchased as Part of Publicly Announced Plans or Programs
(1)
|
(d) Maximum Number (or Approximate Dollar Value) of Shares (or Units) that May Yet Be Purchased Under the Plans or Programs
(1)
|
||||||||||
|
October 31, 2016 -
|
|
|
||||||||||||
|
November 27, 2016
|
186,598
|
|
$
|
107.94
|
|
186,400
|
|
$
|
127,833,521
|
|
||||
|
November 28, 2016 -
|
|
|
|
|
|
|
||||||||
|
January 1, 2017
|
434,518
|
|
92.78
|
|
433,879
|
|
87,578,659
|
|
||||||
|
January 2, 2017 -
|
|
|
|
|
|
|
|
|
||||||
|
January 29, 2017
|
313,561
|
|
92.14
|
|
312,811
|
|
58,748,475
|
|
||||||
|
Total
|
934,677
|
|
$
|
95.59
|
|
933,090
|
|
$
|
58,748,475
|
|
||||
___________________
|
(1)
|
On June 1, 2015, we announced that our Board of Directors had authorized us to repurchase up to $500 million of our outstanding common stock. The Board of Directors’ authorization was effective through June 3, 2018. On March 21, 2017, the Board of Directors authorized a $750 million increase to the program and extended it to June 3, 2020. Repurchases under the program may be made from time to time over the period through open market purchases, accelerated share repurchase programs, privately negotiated transactions or other methods, as we deem appropriate. Purchases are made based on a variety of factors, such as price, corporate requirements and overall market conditions, applicable legal requirements and limitations, restrictions under our debt arrangements, trading restrictions under our insider trading policy and other relevant factors. The program may be modified by the Board of Directors, including to increase or decrease the repurchase limitation or extend, suspend, or terminate the program, at any time, without prior notice.
|
|
(2)
|
Our 2006 Stock Incentive Plan provides us with the right to deduct or withhold, or require employees to remit to us, an amount sufficient to satisfy any applicable tax withholding requirements applicable to stock-based compensation awards. To the extent permitted, employees may elect to satisfy all or part of such withholding requirements by tendering previously owned shares or by having us withhold shares having a fair market value equal to the minimum statutory tax withholding rate that could be imposed on the transaction. Included in this table are shares withheld during the
fourth quarter of 2016
principally in connection with the settlement of vested restricted stock units to satisfy tax withholding requirements, in addition to the shares repurchased as part of the stock repurchase program discussed above.
|
The following performance graph and return to stockholders information shown below are provided pursuant to Item 201(e) of Regulation S-K promulgated under the Exchange Act. The graph and information are not deemed to be “filed” under the Exchange Act or otherwise subject to liabilities thereunder, nor are they to be deemed to be incorporated by reference in any filing under the Securities Act or Exchange Act unless we specifically incorporate them by reference.
The performance graph compares the yearly change in the cumulative total stockholder return on our common stock against the cumulative return of the S&P 500 Index and the S&P 500 Apparel, Accessories & Luxury Goods Index for the five fiscal years ended
January 29, 2017
.
28
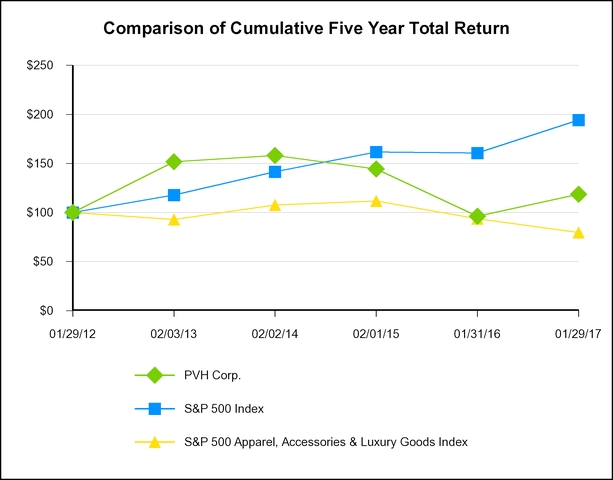
|
Value of $100.00 invested after 5 years:
|
|
||
|
Our Common Stock
|
$
|
118.58
|
|
|
S&P 500 Index
|
$
|
194.26
|
|
|
S&P 500 Apparel, Accessories & Luxury Goods Index
|
$
|
79.75
|
|
Selected Financial Data appears under the heading “Five Year Financial Summary” on pages F-62 and F-63.
29
OVERVIEW
The following discussion and analysis is intended to help you understand us, our operations and our financial performance. It should be read in conjunction with our consolidated financial statements and the accompanying notes, which are included elsewhere in this report.
We are one of the largest branded apparel companies in the world, with a history going back over 135 years. Our brand portfolio consists of nationally and internationally recognized brand names, including
CALVIN KLEIN, Tommy Hilfiger, Van Heusen, IZOD, ARROW, Speedo
(licensed in perpetuity for North America and the Caribbean from Speedo International Ltd.),
Warner’s, Olga
and
Eagle
. We also license brands from third parties primarily for use on dress shirts and neckwear offered in the United States and Canada.
Our business strategy is to sell our brands at multiple price points and in multiple channels of distribution and regions. This enables us to offer products to a broad range of consumers, while minimizing competition among our brands and reducing our reliance on any one demographic group, merchandise preference, price point, distribution channel or region. We also license our brands to third parties and joint ventures for product categories and in jurisdictions where we believe our partners’ expertise can better serve our businesses.
Our revenue was $8.203 billion in 2016, of which approximately 50% was generated outside of the United States. Our global designer lifestyle brands,
Tommy Hilfiger
and
CALVIN KLEIN
, together generated over 80% of our revenue.
RESULTS OF OPERATIONS
Operations Overview
We generate net sales from (i) the wholesale distribution to retailers, franchisees, licensees and distributors of dress shirts, neckwear, sportswear, jeanswear, performance apparel, intimate apparel, underwear, swim products, handbags, accessories, footwear and other related products under owned and licensed trademarks, including through digital commerce sites operated by our wholesale partners and pure play digital commerce retailers, and (ii) the sale of certain of these products through (a) approximately 1,600 Company-operated free-standing retail store locations worldwide under our
CALVIN KLEIN
,
Tommy Hilfiger
and certain of our heritage brands, (b) over 1,150 Company-operated concessions/shop-in-shops worldwide under our
CALVIN KLEIN
and
Tommy Hilfiger
trademarks, and (c) digital commerce sites in certain countries under our
CALVIN KLEIN
and
Tommy Hilfiger
trademarks and in North America through our
SpeedoUSA
.com digital commerce site. Additionally, we generate royalty, advertising and other revenue from fees for licensing the use of our trademarks.
On January 24, 2017, we announced that the license for the Tommy Hilfiger men’s tailored clothing business in North America with Marcraft Clothes, Inc. will be terminated effective December 31, 2017 (the “TH men’s tailored license termination”). Beginning January 1, 2018, the license will move to Peerless Clothing International, Inc. in order to consolidate our men’s tailored businesses for all of our brands in North America under one partner. We recorded a pre-tax charge of $11 million in the fourth quarter of 2016 in connection with the TH men’s tailored license termination.
On November 30, 2016, we formed a joint venture in Mexico, PVH Mexico, in which we own a 49% economic interest. The joint venture was formed by merging our wholly owned subsidiary that principally operated and managed our Calvin Klein business in Mexico with a wholly owned subsidiary of Grupo Axo, S.A.P.I. de C.V. (“Grupo Axo”) that distributes certain
Tommy Hilfiger
brand products in Mexico. In connection with the formation of PVH Mexico, we deconsolidated our wholly owned subsidiary. We recorded a pre-tax noncash loss of $82 million in 2016 in connection with the Mexico deconsolidation.
On June 29, 2016, we, along with Arvind formed a joint venture in Ethiopia, PVH Ethiopia, in which we own a 75% interest. We have consolidated the joint venture in our consolidated financial statements. PVH Ethiopia was formed to operate a manufacturing facility that will produce finished products for us for distribution primarily in the United States. We expect the manufacturing facility will begin operations in the first half of 2017.
On June 20, 2016, we issued €350 million euro-denominated principal amount of 3 5/8% senior notes due July 15, 2024. Please see “Liquidity and Capital Resources” below for a further discussion.
30
On April 13, 2016, we completed the acquisition of the 55% of the ownership interests in TH China, our former joint venture for
Tommy Hilfiger
in China, that we did not already own. As a result of the TH China acquisition, we now operate directly our Tommy Hilfiger business in this high-growth market. The total consideration for the acquisition was $161 million (including the elimination of a $3 million pre-acquisition receivable owed to us by TH China), net of cash acquired of $105 million. We recorded a net pre-tax gain of $70 million in 2016, including a noncash gain of $153 million to write-up our existing equity investment to fair value and costs of $83 million, which were primarily noncash and related to valuation adjustments and amortization of short-lived assets.
On February 1, 2016, we entered into a licensing agreement with G-III for the design, production and wholesale distribution of
Tommy Hilfiger
womenswear in the United States and Canada, which resulted in the discontinuation of our directly operated Tommy Hilfiger North America womenswear wholesale business in the fourth quarter of 2016. We recorded pre-tax charges of $4 million and $3 million in 2016 and 2015, respectively, in connection with the G-III license.
We recorded pre-tax debt modification and extinguishment charges in 2016 and 2014 that totaled $16 million and $93 million, respectively.
We recorded pre-tax charges principally in connection with the acquisition of Warnaco and the related integration and restructuring that totaled $10 million, $73 million and $146 million during 2016, 2015 and 2014, respectively.
We implemented initiatives to rationalize the Heritage Brands business, including the exit from our Izod retail business (completed in the third quarter of 2015) and the discontinuation of several licensed product lines in the dress furnishings business. We recorded pre-tax charges of $10 million in 2015 and $21 million in 2014, including $18 million of noncash impairment charges, in connection with the operation of and exit from our Izod retail business. We recorded pre-tax charges of $3 million and $17 million in 2016 and 2015, respectively, principally in connection with the discontinuation of several licensed product lines in the dress furnishings business.
We expect to incur additional pre-tax charges of approximately $110 million during 2017, consisting of (i) approximately $55 million in connection with the agreements entered into in March 2017 for a transaction, which is expected to close July 1, 2017, to restructure our supply chain relationship with Li & Fung, which establishes a new strategic partnership with Li & Fung to provide services to us and also provides for the termination of our non-exclusive buying agency agreement with Li & Fung, pursuant to which we are obligated to source certain
Calvin Klein Jeans
products and at least 54% of certain
Tommy Hilfiger
products through Li & Fung (the “Li & Fung termination”); (ii) approximately $25 million in connection with the TH China acquisition, primarily consisting of noncash amortization of short-lived assets; (iii) approximately $20 million in connection with the relocation of our Tommy Hilfiger office in New York, New York, including noncash depreciation expense; and (iv) approximately $10 million in connection with the noncash settlement of certain benefit obligations related to our retirement plans as a result of an annuity purchase for certain participants, under which such obligations were transferred to an insurer.
Our Calvin Klein and Tommy Hilfiger businesses each have substantial international components that expose us to significant foreign exchange risk. Amounts recorded in local foreign currencies are translated back to United States dollars using an average exchange rate over the representative period. Our international revenue and earnings are unfavorably impacted during times of a strengthening United States dollar against the foreign currencies in which we generate significant revenue and earnings and favorably impacted during times of a weakening United States dollar against those currencies. In 2016, approximately 50% of our revenue was subject to foreign currency translation. Beginning in the latter part of 2014, the United States dollar strengthened against most major currencies, resulting in a negative impact on our results of operations for 2015 and 2016. To hedge against a portion of this exposure, we entered into several foreign currency option contracts during 2016. These contracts represent our purchase of euro put/United States dollar call options. We currently expect the strength of the United States dollar and resulting unfavorable impact on our revenue and earnings to continue in 2017, although to a lesser degree than in 2015 and 2016. Additionally, there is a transaction impact on our financial results because inventory typically is purchased in United States dollars by our foreign subsidiaries. As with translation, during times of a strengthening United States dollar, our results of operations will be negatively impacted by these transactions as the increased local currency value of inventory results in a higher local currency cost of goods when the goods are sold. We use foreign currency forward exchange contracts to hedge against a portion of the exposure related to this transaction impact. The contracts cover at least 70% of the projected inventory purchases in United States dollars by our foreign subsidiaries. These contracts are generally entered into 12 months in advance of the related inventory purchases. Therefore, the unfavorable impact of a strengthening United States dollar on the cost of inventory purchases covered by these contracts may be realized in our earnings in the year following their inception, as the underlying inventory hedged by the contracts is sold. As such, the unfavorable impact of a strengthening United States dollar against most major currencies in the latter part of 2014 and through 2015, particularly the euro, negatively
31
impacted our gross margin during 2016, and is expected to have a negative impact, to a much lesser extent, on our earnings in 2017.
Retail comparable store sales discussed below refer to sales for retail stores that have been open for at least 12 months. Sales for retail stores that are closed during the year are excluded from the calculation of retail comparable store sales. Sales for retail stores that are either relocated, materially altered in size or closed for a certain number of consecutive days for renovation are also excluded from the calculation of retail comparable store sales until such stores have been in their new location or in their newly renovated state for at least 12 months. Sales from our Company-operated digital commerce sites are included within retail comparable store sales for those businesses and regions that have operated the related digital commerce site for at least 12 months. Retail comparable store sales are based on comparable weeks and local currencies.
The following table summarizes our income statements in 2016, 2015 and 2014:
|
|
2016
|
2015
|
2014
|
||||||||
|
(Dollars in millions)
|
|
|
|
||||||||
|
Net sales
|
$
|
7,791
|
|
$
|
7,605
|
|
$
|
7,849
|
|
||
|
Royalty revenue
|
321
|
|
325
|
|
300
|
|
|||||
|
Advertising and other revenue
|
91
|
|
90
|
|
92
|
|
|||||
|
Total revenue
|
8,203
|
|
8,020
|
|
8,241
|
|
|||||
|
Gross profit
|
4,370
|
|
4,162
|
|
4,327
|
|
|||||
|
% of total revenue
|
53.3
|
%
|
51.9
|
%
|
52.5
|
%
|
|||||
|
Selling, general and administrative expenses
|
3,637
|
|
3,418
|
|
3,714
|
|
|||||
|
% of total revenue
|
44.3
|
%
|
42.6
|
%
|
45.1
|
%
|
|||||
|
Debt modification and extinguishment costs
|
16
|
|
—
|
|
93
|
|
|||||
|
Other noncash gain, net
|
71
|
|
—
|
|
—
|
|
|||||
|
Equity in net income of unconsolidated affiliates
|
0
|
|
17
|
|
10
|
|
|||||
|
Income before interest and taxes
|
789
|
|
761
|
|
530
|
|
|||||
|
Interest expense
|
121
|
|
117
|
|
144
|
|
|||||
|
Interest income
|
6
|
|
4
|
|
5
|
|
|||||
|
Income before taxes
|
674
|
|
647
|
|
391
|
|
|||||
|
Income tax expense (benefit)
|
125
|
|
75
|
|
(48
|
)
|
|||||
|
Net income
|
549
|
|
572
|
|
439
|
|
|||||
|
Less: Net loss attributable to redeemable non-controlling interest
|
0
|
|
—
|
|
0
|
|
|||||
|
Net income attributable to PVH Corp.
|
$
|
549
|
|
$
|
572
|
|
$
|
439
|
|
||
Total Revenue
Total revenue was $8.203 billion in 2016, $8.020 billion in 2015 and $8.241 billion in 2014. The increase in revenue of $183 million in 2016 as compared to 2015 was due principally to the net effect of the following items:
|
•
|
The addition of an aggregate of $213 million of revenue attributable to our Calvin Klein North America and Calvin Klein International segments, which included a reduction of approximately $53 million related to the impact of foreign currency translation. Revenue in the Calvin Klein North America segment increased 3% (including a 1% negative foreign currency impact) primarily driven by strong growth in the wholesale business, partially offset by a revenue decrease due to the Mexico deconsolidation and a 4% decrease in comparable store sales, primarily driven by declines in traffic and consumer spending in Calvin Klein’s United States stores located in international tourist locations. Calvin Klein International segment revenue increased 12% (including a 3% negative foreign currency impact) due principally to significant growth in Europe and China. Calvin Klein International segment comparable store sales increased 6%.
|
|
•
|
The net addition of $141 million of revenue attributable to our Tommy Hilfiger North America and Tommy Hilfiger International segments, which included a reduction of approximately $43 million related to the impact of foreign currency translation. Revenue in the Tommy Hilfiger North America segment decreased 4% principally due to a 9% decline in comparable store sales, driven by weak traffic and consumer spending in Tommy Hilfiger’s United States stores located in international tourist locations, and the discontinuation of our directly operated womenswear
|
32
wholesale business in the United States and Canada in connection with the G-III license. Tommy Hilfiger International segment revenue increased 11% (including a 2% negative foreign currency impact) driven principally by strong growth across Europe, including a 9% increase in comparable store sales, and the inclusion of the revenue of the China business after completion of the TH China acquisition in April 2016.
|
•
|
The reduction of an aggregate of $171 million of revenue attributable to our Heritage Brands Retail and Heritage Brands Wholesale segments. The decrease was primarily due to the business rationalization initiatives discussed in the section entitled “Operations Overview” above, partially offset by a 7% increase in comparable store sales.
|
The decrease in revenue of $221 million in 2015 as compared to 2014 was due principally to the net effect of the following items:
|
•
|
The net addition of $64 million of revenue attributable to our Calvin Klein North America and Calvin Klein International segments, which included a reduction of approximately $199 million related to the impact of foreign currency translation. Revenue in the Calvin Klein North America segment increased 5% (including a 3% negative foreign currency impact). The Calvin Klein North America retail business experienced solid growth due to square footage expansion in Company-operated stores, including the conversion of
IZOD
stores to
Calvin Klein Accessory
and
Calvin Klein Underwear
stores, and a 2% increase in comparable store sales despite the decreased traffic and consumer spending trends in Calvin Klein’s United States stores located in international tourist locations, while the wholesale business experienced modest growth. Revenue in the Calvin Klein International segment decreased 2% (including a 13% negative foreign currency impact). Revenue of the segment would have increased if not for the negative foreign currency impact. This was attributable to the strong performance in Europe, where we experienced growth in most markets, and an increase in Asia, partially due to the benefit of the Chinese New Year, as the first and fourth quarters of fiscal 2015 included the peak wholesale selling seasons before the Chinese New Year, while fiscal 2014 did not include a peak selling season before the holiday. International comparable store sales increased 5%.
|
|
•
|
The reduction of an aggregate of $212 million of revenue attributable to our Tommy Hilfiger North America and Tommy Hilfiger International segments, which included a reduction of approximately $341 million related to the impact of foreign currency translation resulting principally from a weaker euro. Revenue in the Tommy Hilfiger North America segment decreased 1% (including a 2% negative foreign currency impact) due principally to a 5% decrease in comparable store sales primarily as a result of the decline in traffic and consumer spending trends in Tommy Hilfiger’s United States stores located in international tourist locations. Revenue in the Tommy Hilfiger International segment decreased 10% (including a 15% negative foreign currency impact). Revenue of the segment would have increased if not for the negative foreign currency impact, principally as a result of 8% comparable store sales growth in Europe and a mid-single digit percentage increase in wholesale revenue.
|
|
•
|
The reduction of an aggregate of $72 million of revenue attributable to our Heritage Brands Wholesale and Heritage Brands Retail segments, as a 10% increase in comparable store sales in the Van Heusen retail business was more than offset by the revenue decrease attributable to the business rationalization initiatives discussed in the section entitled “Operations Overview” above.
|
We currently expect that revenue will increase 2% in 2017 compared to 2016, inclusive of a negative impact of approximately 2% related to foreign currency translation. Negatively impacting revenue in 2017 as compared to 2016 are decreases from (i) the Mexico deconsolidation, which resulted in us no longer recognizing revenues from a directly operated business in Mexico, and (ii) the G-III license, which resulted in the discontinuation of our directly operated womenswear wholesale business in the United States and Canada in the fourth quarter of 2016. Revenue for our Calvin Klein business is projected to increase approximately 5% compared to 2016, inclusive of a negative impact of approximately 2% related to foreign currency translation, as well as the negative impact of the Mexico deconsolidation. Revenue for our Tommy Hilfiger business is expected to increase approximately 1% compared to 2016, inclusive of a negative impact of approximately 3% related to foreign currency translation, as well as the negative impact of the G-III license. Revenue for our Heritage Brands business is expected to decrease approximately 1% compared to 2016.
33
Gross Profit
Gross profit is calculated as total revenue less cost of goods sold and gross margin is calculated as gross profit divided by total revenue. Included as cost of goods sold are costs associated with the production and procurement of product, such as inbound freight costs, purchasing and receiving costs and inspection costs. Also included as costs of goods sold are the amounts recognized on foreign currency forward exchange contracts as the underlying inventory hedged by such forward exchange contracts is sold. Warehousing and distribution expenses are included in selling, general and administrative expenses. All of our royalty, advertising and other revenue is included in gross profit because there is no cost of goods sold associated with such revenue. As a result, our gross profit may not be comparable to that of other entities.
The following table shows our revenue mix between net sales and royalty, advertising and other revenue, as well as our gross margin for
2016
,
2015
and
2014
:
|
2016
|
2015
|
2014
|
||||||
|
Components of revenue:
|
|
|
|
|||||
|
Net sales
|
95.0
|
%
|
94.8
|
%
|
95.2
|
%
|
||
|
Royalty, advertising and other revenue
|
5.0
|
|
5.2
|
|
4.8
|
|
||
|
Total
|
100.0
|
%
|
100.0
|
%
|
100.0
|
%
|
||
|
Gross margin
|
53.3
|
%
|
51.9
|
%
|
52.5
|
%
|
||
Gross profit in 2016 was $4.370 billion, or 53.3% of total revenue, compared to $4.162 billion, or 51.9% of total revenue, in 2015. The 140 basis point increase in gross margin was principally driven by (i) a favorable mix of business due to revenue growth in our higher-margin Calvin Klein and Tommy Hilfiger businesses and revenue contraction in our lower-margin Heritage Brands business, (ii) the addition of TH China, which achieved a significantly higher gross margin than the average gross margin for our overall business, and (iii) gross margin improvements in our North American businesses, principally in the second half of the year, due to decreased promotional selling resulting from lower inventory levels as compared to the prior year. These increases were partially offset by the unfavorable impact of the stronger United States dollar on our international businesses that purchase inventory in United States dollars, particularly our European businesses, as the increased local currency value of inventory resulted in higher cost of goods in local currency when the goods were sold.
Gross profit in 2015 was $4.162 billion, or 51.9% of total revenue, compared to $4.327 billion, or 52.5% of total revenue, in 2014. The 60 basis point decrease in gross margin was principally driven by (i) a decline in gross margin in the Tommy Hilfiger North America segment due to the decline in traffic and consumer spending trends in our United States stores located in international tourist locations, which drove more promotional selling compared to 2014, (ii) the stronger United States dollar, which caused our Calvin Klein International and Tommy Hilfiger International segments, which generally carry higher gross margins than our North American segments, to be translated to United States dollars at lower average exchange rates, (iii) the stronger United States dollar, which further negatively impacted our international businesses that purchase inventory in United States dollars, particularly the Tommy Hilfiger European business, as the increased local currency value of inventory resulted in higher cost of goods in local currency when the goods were sold, and (iv) costs incurred principally in connection with the discontinuation of several licensed product lines in the Heritage Brands dress furnishings business. These declines were partially offset by overall gross margin improvements in our Calvin Klein European and Asian businesses as a result of higher average unit retail selling prices, as well as an increase in our royalty, advertising and other revenue as a percentage of total revenue, as there is no cost of goods sold associated with such revenue.
We currently expect that gross margin in 2017 will increase as compared to 2016 due to (i) the impact of expected faster growth in our Calvin Klein International and Tommy Hilfiger International segments than in our North American segments, as our International segments generally carry higher gross margins and (ii) gross margin improvements in our North American businesses principally resulting from decreased promotional selling compared to 2016. We currently expect that these gross margin increases will be partially offset by the unfavorable impact of the stronger United States dollar on our international businesses that purchase inventory in United States dollars.
34
Selling, General and Administrative (“SG&A”) Expenses
Our SG&A expenses were as follows:
|
|
2016
|
2015
|
2014
|
||||||||
|
(Dollars in millions)
|
|
|
|
||||||||
|
SG&A expenses
|
$
|
3,637
|
|
$
|
3,418
|
|
$
|
3,714
|
|
||
|
% of total revenue
|
44.3
|
%
|
42.6
|
%
|
45.1
|
%
|
|||||
SG&A expenses in 2016 were $3.637 billion, or 44.3% of total revenue, as compared to $3.418 billion, or 42.6% of total revenue in 2015. The 170 basis point increase in SG&A expenses as a percentage of total revenue was principally attributable to (i) the costs incurred in connection with the TH China acquisition, primarily consisting of noncash valuation adjustments and amortization of short-lived assets, (ii) an unfavorable mix of business due to the revenue growth in our higher-expense Calvin Klein and Tommy Hilfiger businesses and revenue contraction in our lower-expense Heritage Brands business, and (iii) an increase in marketing expenditures and investments associated with the recent
CALVIN KLEIN
creative team leadership changes. These increases were partially offset by (i) a reduction of costs incurred in connection with the Warnaco integration and related restructuring compared to 2015 and (ii) a decrease in retirement plan expense resulting from an increase in the actuarial gain recorded in 2016 compared to 2015 (please see
Note 12
, “Retirement and Benefit Plans” in the Notes to Consolidated Financial Statements included in Item 8 of this report for a further discussion).
SG&A expenses in 2015 were $3.418 billion, or 42.6% of total revenue, as compared to $3.714 billion, or 45.1% of total revenue in 2014. The 250 basis point decrease in SG&A expenses as a percentage of total revenue was principally attributable to (i) a decrease due to lower retirement plan expense resulting from an actuarial gain in 2015, as compared to an actuarial loss in 2014, (ii) a reduction of costs incurred in connection with the Warnaco integration and related restructuring compared to 2014 and (iii) a decrease attributable to the results of our Calvin Klein International and Tommy Hilfiger International segments, which generally carry higher SG&A percentages of total revenue than our North American segments, being translated to United States dollars at lower average exchange rates. These decreases were partially offset by (i) the impact of contraction in our lower-expense Heritage Brands business and (ii) an increase in corporate expenses mainly attributable to associate-related benefits.
We currently expect that SG&A expenses as a percentage of total revenue in 2017 will increase compared to 2016 due to (i) the impact of expected faster growth in our Calvin Klein International and Tommy Hilfiger International segments than in our North American segments, as our International segments generally carry higher SG&A percentages of total revenue, (ii) costs related to the Li & Fung termination and (iii) costs related to the relocation of our Tommy Hilfiger office in New York, New York, including noncash depreciation expense. Additionally, our expectation of 2017 SG&A expenses includes a $10 million actuarial loss expected to be incurred in the first quarter associated with the noncash settlement of certain benefit obligations related to our retirement plans as a result of an annuity purchase for certain participants, under which such obligations were transferred to an insurer, while our 2016 SG&A expenses included a $39 million actuarial gain recorded in the fourth quarter. These increases will be partially offset by lower costs expected to be incurred in 2017 as compared to 2016 in connection with the TH China acquisition. Our actual 2017 SG&A expenses may be significantly different than our projections because of expenses associated with our retirement plans. Retirement plan expenses recorded throughout the year are calculated using actuarial valuations that incorporate assumptions and estimates about financial market, economic and demographic conditions. Differences between estimated and actual results give rise to gains and losses that are recorded immediately in earnings, generally in the fourth quarter of the year, which can create volatility in our operating results.
We incurred costs totaling $16 million in 2016 in connection with the amendment of our senior secured credit facilities. Please see the section entitled “Liquidity and Capital Resources” below for a further discussion.
We incurred costs totaling $93 million in 2014 in connection with the amendment and restatement of our senior secured credit facilities and the related redemption of our 7 3/8% senior notes due 2020. Please see the section entitled “Liquidity and Capital Resources” below for a further discussion.
35
Other Noncash Gain, Net
We recorded a pre-tax noncash gain of $153 million in 2016 to write-up our equity investment in TH China to fair value in connection with the TH China acquisition. Please see Note 2, “Acquisitions,” in the Notes to Consolidated Financial Statements included in Item 8 of this report for a further discussion.
We recorded a pre-tax noncash loss of $82 million in 2016 in connection with the Mexico deconsolidation. Please see
Note 5
, “Investments in Unconsolidated Affiliates,” in the Notes to Consolidated Financial Statements included in Item 8 of this report for a further discussion.
Equity in Net Income of Unconsolidated Affiliates
The equity in net income of unconsolidated affiliates decreased to $100,000 in 2016 compared to $17 million during 2015 and $10 million during 2014. These amounts relate to our share of income (loss) from our joint ventures for the
Tommy Hilfiger
brand in China (the 55% that we did not own was acquired on April 13, 2016), India and Brazil, for the
CALVIN KLEIN
brand in India, for the
Tommy Hilfiger
,
CALVIN KLEIN
and
Van Heusen
brands in Australia, and for the
CALVIN KLEIN
,
Tommy Hilfiger
,
Warner’s
,
Olga
and
Speedo
brands in Mexico (since its formation on November 30, 2016). Also included is our share of income (loss) from our investments in the parent company of the
Karl Lagerfeld
brand (“Karl Lagerfeld”) and, beginning in the third quarter of 2016, in Gazal Corporation Limited (“Gazal”). Our investments in the continuing joint ventures, Karl Lagerfeld and Gazal are being accounted for under the equity method of accounting. Please see the section entitled “Investments in Unconsolidated Affiliates” within “Liquidity and Capital Resources” below for a further discussion. The equity in net income of unconsolidated affiliates in 2016 included a one-time expense of $6 million recorded on our equity investment in TH China prior to the acquisition closing. The equity in net income of unconsolidated affiliates in 2015 included a one-time gain of $2 million on our equity investment in Karl Lagerfeld.
Interest Expense, Net
Net interest expense increased to $115 million in 2016 from $113 million in 2015 as the positive impacts from debt repayments made during 2016 and 2015 and the amendment of our senior secured credit facilities in the second quarter of 2016 were more than offset by the negative impact of the interest rate swap that commenced in February 2016 to convert a portion of our variable rate debt under our term loans to fixed rate debt and the issuance of €350 million of 3 5/8% senior notes in June 2016. Please see the section entitled “Financing Arrangements” within “Liquidity and Capital Resources” below for a further discussion.
Net interest expense decreased to $113 million in 2015 from $139 million in 2014 due to lower average debt balances and the effect of the amendment and restatement of our senior secured credit facilities and the related redemption of our 7 3/8% senior notes due 2020 in the first quarter of 2014. Please see the section entitled “Financing Arrangements” within “Liquidity and Capital Resources” below for a further discussion.
Net interest expense in 2017 is currently expected to be approximately $120 million compared to $115 million in 2016, primarily due to the net impact of the issuance of €350 million of 3 5/8% senior notes in June 2016, partially offset by debt repayments made during 2016 and expected to be made in 2017 and the amendment of our senior secured credit facilities in the second quarter of 2016.
Income Taxes
Income tax expense was as follows:
|
|
2016
|
2015
|
2014
|
||||||||
|
(Dollars in millions)
|
|
|
|
||||||||
|
Income tax expense (benefit)
|
$
|
125
|
|
$
|
75
|
|
$
|
(48
|
)
|
||
|
Income tax expense (benefit) as a % of pre-tax income
|
18.6
|
%
|
11.6
|
%
|
(12.1
|
)%
|
|||||
The effective income tax rate for 2016 was 18.6% compared with 11.6% in 2015 and (12.1)% in 2014. The volatility in our effective income tax rate in the last three years is due in large part to adjustments to our liabilities for uncertain tax positions.
36
The effective income tax rate for 2016 was lower than the United States statutory rate due to the benefit of overall lower tax rates in certain international jurisdictions where we file tax returns. Also contributing to the lower effective income tax rate for 2016 was the benefit of discrete items, including the lower tax rate applicable to the pre-tax gain recorded to write-up our existing equity investment in TH China to fair value.
The effective income tax rate for 2015 was lower than the United States statutory rate principally due to the benefit of lower tax rates in certain international jurisdictions where we file tax returns and the benefits primarily related to the favorable resolution of uncertain tax positions and the impact of tax law and tax rate changes on deferred taxes, as well as the expiration of the statute of limitations related to other uncertain tax positions.
The effective income tax rate in 2014 was a benefit to income principally due to a reduction of $94 million in our estimate for uncertain tax positions, which provided a 24% benefit to our tax rate. This benefit resulted from the favorable resolutions of uncertain tax positions in certain international jurisdictions, as well as the expiration of the statute of limitations related to other uncertain tax positions.
We currently expect that our effective income tax rate in 2017 will be approximately 17%, which is lower than the United States statutory rate principally due to the benefit of overall lower tax rates in certain international jurisdictions where we file tax returns.
Our tax rate is affected by many factors, including the mix of international and domestic pre-tax earnings, discrete events arising from specific transactions, and audits by tax authorities or the receipt of new information, any of which can cause us to change our estimate for uncertain tax positions.
Redeemable Non-Controlling Interest
We have consolidated the results of PVH Ethiopia, in which we own a 75% interest, in our consolidated financial statements. The net loss attributable to the redeemable non-controlling interest was immaterial for 2016. We currently expect that the net loss attributable to the redeemable non-controlling interest for 2017 will be immaterial. Please refer to
Note 6
, “Redeemable Non-Controlling Interests,” in the Notes to Consolidated Financial Statements included in Item 8 of this report for a further discussion.
LIQUIDITY AND CAPITAL RESOURCES
Cash Flow Summary
Cash and cash equivalents at
January 29, 2017
was $730 million, an increase of $174 million from the amount at
January 31, 2016
of $556 million. The change in cash and cash equivalents included the impact of $390 million of net proceeds from our issuance of €350 million principal amount of 3 5/8% senior notes in June 2016, offset by (i) $350 million of debt repayments, (ii) $315 million of common stock repurchases under the stock repurchase program, (iii) a $158 million payment (net of cash acquired of $105 million) in connection with the TH China acquisition and (iv) a $100 million contribution to our defined benefit pension plans. Cash flow in 2017 will be impacted by various factors in addition to those noted below in this “Liquidity and Capital Resources” section, including expected debt repayments of at least $250 million and common stock repurchases under the stock repurchase program of $200 million to $250 million in 2017.
As of
January 29, 2017
, approximately $395 million of cash and cash equivalents was held by international subsidiaries whose undistributed earnings are considered permanently reinvested. Our intent is to continue to reinvest these funds in international operations. If management decides at a later date, or is required under changes to United States tax law, to repatriate these funds to the United States, we may be required to pay taxes on these amounts based on the then applicable United States tax rates, net of foreign taxes already paid.
Operations
Cash provided by operating activities was $955 million in 2016 compared to $900 million in 2015. The increase in cash provided by operating activities as compared to the prior year was primarily driven by changes in working capital, principally favorable changes related to inventory and accrued expenses, partially offset by an increase in contributions to our defined benefit pension plans.
37
Capital Expenditures
Our capital expenditures in 2016 were $247 million compared to $264 million in 2015. Capital expenditures in 2016 primarily included investments in new stores and store expansions, as well as continued investments in operations and infrastructure, including system improvements. We currently expect that capital expenditures for 2017 will be approximately $400 million, which includes a shift into 2017 of expenditures originally expected to occur in 2016. Capital expenditures in 2017 will primarily include expenditures related to the relocation of our Tommy Hilfiger office in New York, New York, as well as significant investments in operations and infrastructure, including upgrading and enhancing our digital commerce platforms and systems related to our supply chain and logistics operations.
Investments in Unconsolidated Affiliates
During the fourth quarter of 2016, we and Grupo Axo formed a joint venture, PVH Mexico, in which we own a
49%
economic interest. PVH Mexico licenses from certain of our wholly owned subsidiaries the rights to distribute and sell certain
CALVIN KLEIN
,
Tommy Hilfiger
,
Warner’s
,
Olga
and
Speedo
brand products in Mexico. PVH Mexico was formed by merging our wholly owned subsidiary that principally operated and managed the Calvin Klein business in Mexico (the “Mexico business”) with a wholly owned subsidiary of Grupo Axo that distributes certain
Tommy Hilfiger
brand products in Mexico. In connection with the formation of PVH Mexico, we deconsolidated the Mexico business and began accounting for our
49%
interest under the equity method of accounting in the fourth quarter of 2016. We made payments of $
7
million to PVH Mexico during 2016 to contribute our
49%
share of the joint venture funding. Please see
Note 5
, “Investments in Unconsolidated Affiliates,” in the Notes to Consolidated Financial Statements included in Item 8 of this report for further discussion.
In 2014, we acquired an economic interest of approximately 10% in Karl Lagerfeld for $19 million. During 2016, a third party acquired a minority stake in Karl Lagerfeld, diluting our economic interest to approximately 8%.
In 2013, we formed with Gazal a joint venture, PVH Brands Australia Pty. Limited (“PVH Australia”), in which we own a 50% economic interest. PVH Australia has licensed from one of our subsidiaries since the first quarter of 2014 the rights to distribute and sell certain
CALVIN KLEIN
brand products in Australia, New Zealand and other island nations in the South Pacific. As part of the transaction, we contributed to PVH Australia our subsidiaries that were operating the Calvin Klein Jeans businesses in Australia and New Zealand. In 2015, we completed a transaction in which the
Tommy Hilfiger
and
Van Heusen
trademarks were licensed for certain product categories to subsidiaries of PVH Australia for use in Australia, New Zealand and, in the case of
Tommy Hilfiger
, other island nations in the South Pacific. The
Tommy Hilfiger
trademarks had previously been licensed to a third party and the
Van Heusen
trademarks had previously been licensed to Gazal. Additionally, subsidiaries of PVH Australia license other trademarks for certain product categories. We made net payments of $21 million (of which $20 million was placed into an escrow account prior to the end of 2014) and $7 million to PVH Australia during 2015 and 2014, respectively, to contribute our 50% share of the joint venture funding for the periods. We received a $1 million dividend from PVH Australia during 2016.
During 2016, we acquired approximately 10% of Gazal’s outstanding capital stock, which is listed on the Australian Securities Exchange, for $9 million.
In 2013, we acquired a 51% economic interest in a Calvin Klein joint venture in India, which is now known as Calvin Klein Arvind Fashion Private Limited (“CK India”). CK India licenses from one of our subsidiaries the rights to the
CALVIN KLEIN
trademarks in India for certain product categories. During the first quarter of 2014, Arvind purchased our prior joint venture partners’ shares in CK India and, as a result of the entry into a shareholder agreement with different governing arrangements between us and Arvind than those with our prior partners, we were no longer deemed to hold a controlling interest in the joint venture. CK India was deconsolidated as a result and we began reporting our 51% interest as an equity method investment in the first quarter of 2014. We made payments of $2 million and $4 million to CK India during 2016 and 2015, respectively, to contribute our 51% share of the joint venture funding for the periods.
In 2012, we formed a joint venture, Tommy Hilfiger do Brasil S.A. (“TH Brazil”), in Brazil, in which we own a 40% economic interest. TH Brazil licenses from one of our subsidiaries the rights to the
Tommy Hilfiger
trademarks in Brazil for certain product categories. We made payments of $2 million to TH Brazil in both 2016 and 2015 to contribute our 40% share of the joint venture funding for the periods. During the third quarter of 2016, we issued a note receivable due April 2, 2017 to TH Brazil for $12 million, of which $6 million was repaid during the fourth quarter of 2016. As of January 29, 2017, the interest rate on the note was 13.00% and the outstanding balance, including accrued interest, was $7 million.
38
Loan to a Supplier
Wuxi Jinmao Foreign Trade Co., Ltd. (“Wuxi”), one of our finished goods inventory suppliers, has a wholly owned subsidiary with which we entered into a loan agreement in 2016. Under the agreement, Wuxi’s subsidiary borrowed a principal amount of $14 million for the development and operation of a fabric mill. Principal payments are due in semi-annual installments through November 29, 2026. The outstanding principal balance of the loan bears interest at a rate of (i) 4.50% per annum until the sixth anniversary of the closing date of the loan and (ii) a rate of LIBOR plus 4.00% thereafter. As of January 29, 2017, the outstanding balance, including accrued interest, was $14 million.
Acquisition of TH China
We acquired on April 13, 2016 the 55% of the ownership interests in TH China that we did not already own. Prior to April 13, 2016, we accounted for our 45% interest in TH China under the equity method of accounting. We paid $158 million, net of cash acquired of $105 million, as cash consideration for this transaction. Please see Note 2, “Acquisitions,” in the Notes to Consolidated Financial Statements included in Item 8 of this report for further discussion.
Acquisition of Russia Franchisee
In 2014, we acquired for $4 million two
Tommy Hilfiger
stores in Russia from a former
Tommy Hilfiger
franchisee.
Acquisition of Ireland Franchisee
In 2014, we acquired for $3 million six
Tommy Hilfiger
stores in Ireland from a former
Tommy Hilfiger
franchisee.
Acquisition of Calvin Klein Performance Retail Businesses in Hong Kong and China
In 2014, we acquired for $7 million the Calvin Klein Performance retail businesses in Hong Kong and China from a former
CALVIN KLEIN
sublicensee. The adjustment to the purchase price was finalized during 2015.
Tommy Hilfiger India Contingent Purchase Price Payments
We reacquired in 2011 the rights in India to the
Tommy Hilfiger
trademarks that had been subject to a perpetual license previously granted to GVM International Limited. We are required to make annual contingent purchase price payments based on a percentage of sales of
Tommy Hilfiger
products in India in excess of an agreed upon threshold during each of six consecutive 12-month periods. Such payments are subject to a $25 million aggregate maximum and are due within 60 days following each one-year period. We made contingent purchase price payments of approximately $1 million in each of 2016, 2015 and 2014. The estimated fair value of future contingent purchase price payments was $2 million as of January 29, 2017.
Calvin Klein Contingent Purchase Price Payments
In connection with our acquisition of Calvin Klein in 2003, we are obligated to pay Mr. Calvin Klein contingent purchase price payments based on 1.15% of total worldwide net sales (as defined in the acquisition agreement, as amended) of products bearing any of the
CALVIN KLEIN
brands with respect to sales made through February 12, 2018. A significant portion of the sales on which the payments to Mr. Klein are made are wholesale sales by us and our licensees and other partners to retailers. Such contingent purchase price payments totaled $53 million, $51 million and $51 million in 2016, 2015 and 2014, respectively. Based upon current exchange rates, we currently expect that such payments will be approximately $54 million in 2017.
Dividends
Our common stock currently pays annual dividends totaling $0.15 per share. Dividends on common stock totaled $12 million in each of 2016, 2015 and 2014.
We currently project that cash dividends on our common stock in 2017 will be approximately $12 million based on our current dividend rate, the number of shares of our common stock outstanding as of
January 29, 2017
, our estimate of stock to be issued during 2017 under our stock incentive plans and our estimate of stock repurchases during 2017.
39
Acquisition of Treasury Shares
Our Board of Directors authorized a $500 million three-year stock repurchase program effective June 3, 2015. On March 21, 2017, the Board of Directors authorized a $750 million increase to the program and extended it to June 3, 2020. Repurchases under the program may be made from time to time over the period through open market purchases, accelerated share repurchase programs, privately negotiated transactions or other methods, as we deem appropriate. Purchases are made based on a variety of factors, such as price, corporate requirements and overall market conditions, applicable legal requirements and limitations, restrictions under our debt arrangements, trading restrictions under our insider trading policy and other relevant factors. The program may be modified by the Board of Directors, including to increase or decrease the repurchase limitation or extend, suspend, or terminate the program, at any time, without prior notice.
During 2016 and 2015, we purchased 3.2 million shares and 1.3 million shares, respectively, of our common stock under the program in open market transactions for $315 million and $126 million, respectively. The repurchased shares were held as treasury stock and $59 million of the authorization remained available for future share repurchases as of January 29, 2017.
Treasury stock activity also includes shares that were withheld principally in conjunction with the settlement of vested restricted stock, restricted stock units and performance share units to satisfy tax withholding requirements.
Sale of Assets
One of our European subsidiaries sold a building in Amsterdam, the Netherlands in 2016 for proceeds of €15 million (approximately $17 million based on the exchange rate in effect on the date of the sale).
Financing Arrangements
Our capital structure was as follows:
|
(In millions)
|
January 29, 2017
|
January 31, 2016
|
|||||
|
Short-term borrowings
|
$
|
19
|
|
$
|
26
|
|
|
|
Current portion of long-term debt
|
—
|
|
137
|
|
|||
|
Capital lease obligations
|
16
|
|
15
|
|
|||
|
Long-term debt
|
3,197
|
|
3,032
|
|
|||
|
Stockholders’ equity
|
4,804
|
|
4,552
|
|
|||
In addition, we had $730 million and $556 million of cash and cash equivalents as of
January 29, 2017
and
January 31, 2016
, respectively.
Short-Term Borrowings
One of our Asian subsidiaries has a yen-denominated short-term line of credit and a yen-denominated overdraft facility with a Japanese bank that together provide for borrowings of up to
¥2.200
billion (approximately
$19
million based on exchange rates in effect on
January 29, 2017
) and are utilized primarily to fund working capital needs. Borrowings under the short-term line of credit bear interest at the one-month Tokyo interbank offered rate plus
0.15%
. As of
January 29, 2017
, we had
$17
million of borrowings outstanding under these facilities. The weighted average interest rate on the funds borrowed at
January 29, 2017
was
0.19%
. The maximum amount of borrowings outstanding under these facilities during 2016 was ¥2.000 billion (approximately $
17
million based on exchange rates in effect on
January 29, 2017
).
One of our Asian subsidiaries has a won-denominated overdraft facility with a South Korean bank that provides for borrowings of up to ₩
3.500
billion (approximately $
3
million based on exchange rates in effect on January 29, 2017) and is utilized primarily to fund working capital needs. Borrowings under this facility are unsecured and bear interest at the South Korean bank three-month certificate of deposit rate plus
1.50%
. There were no borrowings outstanding under this facility as of or during the year ended January 29, 2017.
40
One of our Asian subsidiaries has a United States dollar-denominated short-term revolving credit facility with a bank that provides for borrowings of up to $
10
million and is utilized primarily to fund working capital needs. Borrowings under this facility bear interest at the one-month London interbank borrowing rate (“LIBOR”) plus
1.50%
. At the end of each month, amounts outstanding under this facility may be carried forward for additional one-month periods for up to one year. This facility is subject to certain terms and conditions and may be terminated at any time at the discretion of the bank. There were no borrowings outstanding under this facility as of or during the year ended January 29, 2017.
One of our European subsidiaries has a euro-denominated short-term revolving note and a euro-denominated overdraft facility with a bank that together provide for borrowings of up to
€40
million (approximately
$43
million based on exchange rates in effect on
January 29, 2017
) and are utilized primarily to fund working capital needs. Borrowings under the revolving note bear interest at the one-month Euro Interbank Offered Rate (“EURIBOR”) plus 1.50%. There were no borrowings outstanding under these facilities as of or during the year ended
January 29, 2017
.
One of our European subsidiaries has a United States dollar-denominated short-term line of credit facility with a bank that provides for borrowings of up to $
3
million and is utilized primarily to fund working capital needs. Borrowings under this facility bear interest at
13.50%
. As of
January 29, 2017
, we had $400,000 of borrowings outstanding under this facility, which represented the maximum amount of borrowings outstanding under this facility during 2016.
One of our European subsidiaries has a United States dollar-denominated short-term line of credit facility with a Turkish bank that provides for borrowings of up to
$4
million and is utilized primarily to fund working capital needs. Borrowings under this facility bear interest at the Turkish overnight lending rate plus
3.00%
. As of January 29, 2017, we had $1 million of borrowings outstanding under this facility. The weighted average interest rate on the funds borrowed at January 29, 2017 was
13.50%
. The maximum amount of borrowings outstanding under this facility during 2016 was $
3
million.
One of our European subsidiaries has a Turkish lira-denominated short-term line of credit facility with a Turkish bank that provides for borrowings of up to lira
3
million (approximately $
1
million based on exchange rates in effect on January 29, 2017) and is utilized primarily to fund working capital needs. Borrowings under this facility bear interest at the Turkish overnight lending rate plus
4.00%
. As of January 29, 2017, we had no borrowings outstanding under this facility. The maximum amount of borrowings outstanding under this facility during 2016 was equal to the maximum amount of borrowings available under this facility.
One of our Latin American subsidiaries has a Brazilian real-denominated short-term revolving credit facility with a Brazilian bank that provides for borrowings of up to R
$25
million (approximately
$8
million based on exchange rates in effect on
January 29, 2017
) and is utilized primarily to fund working capital needs. Borrowings under this facility are unsecured. There were no borrowings outstanding under this facility as of or during the year ended
January 29, 2017
.
We also have the ability to draw revolving borrowings under our senior secured credit facilities as discussed in the section entitled “2016 Senior Secured Credit Facilities” below. As of January 29, 2017, we had no borrowings outstanding under these facilities. The maximum amount of revolving borrowings outstanding under these facilities during 2016 was
$15
million.
Capital Lease Obligations
Our cash payments for capital lease obligations totaled $7 million, $8 million and $9 million in 2016, 2015 and 2014, respectively.
2014 Senior Secured Credit Facilities
On March 21, 2014, we entered into an amendment to our senior secured credit facilities (as amended, the “2014 facilities”). Among other things, the amendment provided for an additional $350 million principal amount of loans under the Term Loan A facility and an additional $250 million principal amount of loans under the Term Loan B facility. On March 21, 2014, we borrowed the additional principal amounts described above and used the proceeds to redeem all of our outstanding 7 3/8% senior notes, as discussed below in the section entitled “7 3/8% Senior Notes Due 2020.” In connection with entering into an amendment, we paid debt issuance costs of $13 million (of which $8 million was expensed as debt modification and extinguishment costs and $5 million is being amortized over the term of the related debt agreement) and recorded additional debt modification and extinguishment costs of $3 million to write-off previously capitalized debt issuance costs.
41
The 2014 facilities consisted of a $1.986 billion United States dollar-denominated Term Loan A facility, a $1.189 billion United States dollar-denominated Term Loan B facility and senior secured revolving credit facilities consisting of (a) a $475 million United States dollar-denominated revolving credit facility, (b) a $25 million United States dollar-denominated revolving credit facility available in United States dollars or Canadian dollars and (c) a €186 million euro-denominated revolving credit facility available in euro, British pound sterling, Japanese yen or Swiss francs.
On May 19, 2016, we amended the 2014 facilities, as discussed in the following section.
2016 Senior Secured Credit Facilities
On May 19, 2016 (the “Amendment Date”), we entered into an amendment (the “Amendment”) to the 2014 facilities (as amended by the Amendment, the “2016 facilities”). Among other things, the Amendment provided for (i) us to borrow an additional $582 million principal amount of loans under the Term Loan A facility, (ii) the repayment of all outstanding loans under the Term Loan B facility with the proceeds of the additional loans under the Term Loan A facility, and (iii) the termination of the Term Loan B facility. In addition, the Amendment extended the maturity of the Term Loan A and the revolving credit facilities from February 13, 2019 to May 19, 2021.
The 2016 facilities consist of a $2.347 billion United States dollar-denominated Term Loan A facility and the senior secured revolving credit facilities consisting of (a) a $475 million United States dollar-denominated revolving credit facility, (b) a $25 million United States dollar-denominated revolving credit facility available in United States dollars or Canadian dollars and (c) a €186 million euro-denominated revolving credit facility available in euro, British pound sterling, Japanese yen or Swiss francs. In connection with entering into the Amendment, we paid debt issuance costs of $11 million (of which $5 million was expensed as debt modification costs and $6 million is being amortized over the term of the related debt agreement) and recorded debt extinguishment costs of $11 million to write-off previously capitalized debt issuance costs.
The revolving credit facilities also include amounts available for letters of credit. As of
January 29, 2017
, we had $25 million of outstanding letters of credit. There were no borrowings outstanding under the revolving credit facilities. A portion of each of the United States dollar-denominated revolving credit facilities is also available for the making of swingline loans. The issuance of such letters of credit and the making of any swingline loan reduces the amount available under the applicable revolving credit facility. So long as certain conditions are satisfied, we may add one or more term loan facilities or increase the commitments under the revolving credit facilities by an aggregate amount not to exceed the sum of (1) the sum of (x) $1.350 billion plus (y) the aggregate amount of all voluntary prepayments of loans under the Term Loan A and the revolving credit facilities (to the extent, in the case of voluntary prepayments of loans under the revolving credit facilities, there is an equivalent permanent reduction of the revolving commitments) plus (z) an amount equal to the aggregate revolving commitments of any defaulting lender (to the extent the commitments with respect thereto have been terminated) and (2) an additional unlimited amount as long as the ratio of our senior secured net debt to consolidated adjusted earnings before interest, taxes, depreciation and amortization (in each case calculated as set forth in the documentation relating to the 2016 facilities) would not exceed 3 to 1 after giving pro forma effect to the incurrence of such increase. The lenders under the 2016 facilities are not required to provide commitments with respect to such additional facilities or increased commitments.
The terms of the Term Loan A facility require us to make quarterly repayments of amounts outstanding under the 2016 facilities, which commenced with the calendar quarter ended June 30, 2016. Such amounts equal 5.00% per annum of the principal amount outstanding on the Amendment Date for the first eight calendar quarters following the Amendment Date, 7.50% per annum of the principal amount for the four calendar quarters thereafter and 10.00% per annum of the principal amount for the remaining calendar quarters, in each case paid in equal installments and in each case subject to certain customary adjustments, with the balance due on the maturity date of the Term Loan A facility.
We made payments of $350 million, $350 million and $425 million during 2016, 2015 and 2014, respectively, on our term loans under the 2016 and 2014 facilities. As a result of the voluntary repayments we made, as of January 29, 2017 we are not required to make a long-term debt repayment until September 2018. We had term loans outstanding of $2.040 billion, net of original issue discounts and debt issuance costs, as of January 29, 2017.
Our obligations under the 2016 facilities are guaranteed by substantially all of our existing and future direct and indirect United States subsidiaries, with certain exceptions. Obligations of the European borrower under the 2016 facilities are guaranteed by us, substantially all of our existing and future direct and indirect United States subsidiaries (with certain exceptions) and Tommy Hilfiger Europe B.V., a wholly owned subsidiary of ours. We and our United States subsidiary guarantors have pledged certain of our assets as security for the obligations under the 2016 facilities.
42
The outstanding borrowings under the 2016 facilities are prepayable at any time without penalty (other than customary breakage costs). The terms of the 2016 facilities require us to repay certain amounts outstanding thereunder with (a) net cash proceeds of the incurrence of certain indebtedness, (b) net cash proceeds of certain asset sales or other dispositions (including as a result of casualty or condemnation) that exceed certain thresholds, to the extent such proceeds are not reinvested or committed to be reinvested in the business in accordance with customary reinvestment provisions, and (c) a percentage of excess cash flow that exceeds the voluntary debt payments we have made during the applicable year, which percentage is based upon our net leverage ratio during the relevant fiscal period.
The United States dollar-denominated borrowings under the 2016 facilities bear interest at a rate equal to an applicable margin plus, as determined at our option, either (a) a base rate determined by reference to the greater of (i) the prime rate, (ii) the United States federal funds rate plus 1/2 of
1.00%
and (iii) a one-month adjusted Eurocurrency rate plus
1.00%
or (b) an adjusted Eurocurrency rate, calculated in a manner set forth in the 2016 facilities.
The Canadian dollar-denominated borrowings under the 2016 facilities bear interest at a rate equal to an applicable margin plus, as determined at our option, either (a) a Canadian prime rate determined by reference to the greater of (i) the rate of interest per annum that Royal Bank of Canada establishes at its main office in Toronto, Ontario as the reference rate of interest in order to determine interest rates for loans in Canadian dollars to its Canadian borrowers and (ii) the sum of (x) the average of the rates per annum for Canadian dollar bankers’ acceptances having a term of one month that appears on the display referred to as “CDOR Page” of Reuters Monitor Money Rate Services as of 10:00 a.m. (Toronto time) on the date of determination, as reported by the administrative agent (and if such screen is not available, any successor or similar service as may be selected by the administrative agent), and (y)
0.75%
, or (b) an adjusted Eurocurrency rate, calculated in a manner set forth in the 2016 facilities.
The borrowings under the 2016 facilities in currencies other than United States dollars or Canadian dollars bear interest at a rate equal to an applicable margin plus an adjusted Eurocurrency rate, calculated in a manner set forth in the 2016 facilities.
The current applicable margin with respect to the Term Loan A facility and each revolving credit facility is
1.50%
for adjusted Eurocurrency rate loans and
0.50%
for base rate loans, respectively. After the date of delivery of the compliance certificate and financial statements with respect to each of our fiscal quarters, the applicable margin for borrowings under the Term Loan A facility and the revolving credit facilities is subject to adjustment based upon our net leverage ratio.
The 2016 facilities contain customary events of default, including but not limited to nonpayment; material inaccuracy of representations and warranties; violations of covenants; certain bankruptcies and liquidations; cross-default to material indebtedness; certain material judgments; certain events related to the Employee Retirement Income Security Act of 1974, as amended; certain events related to certain of the guarantees by us and certain of our subsidiaries, and certain pledges of our assets and those of certain of our subsidiaries, as security for the obligations under the 2016 facilities; and a change in control (as defined in the 2016 facilities).
During the second quarter of 2014, we entered into an interest rate cap agreement for an 18-month term commencing on August 18, 2014. The agreement was designed with the intended effect of capping the interest rate on an initial notional amount of $514 million of our variable rate debt obligation under the 2014 facilities or any replacement facility with similar terms. Under the terms of this agreement, the one-month LIBOR that we paid was capped at a rate of
1.50%
. Therefore, the maximum amount of interest that we would have paid on the then-outstanding notional amount was at the
1.50%
capped rate, plus the current applicable margin. The agreement expired on February 17, 2016.
During the second quarter of 2014, we entered into an interest rate swap agreement for a two-year term commencing on February 17, 2016. The agreement was designed with the intended effect of converting an initial notional amount of $683 million of our variable rate debt obligation under the 2014 facilities or any replacement facility with similar terms, including the 2016 facilities, to fixed rate debt. Such agreement remains outstanding with a notional amount of $925 million as of January 29, 2017, and is now converting a portion of our variable rate debt obligation under the 2016 facilities to fixed rate debt. Under the terms of the agreement for the then-outstanding notional amount, our exposure to fluctuations in the one-month LIBOR is eliminated and we will pay a weighted average fixed rate of
1.924%
, plus the current applicable margin.
During the second quarter of 2013, we entered into an interest rate swap agreement for a three-year term commencing on August 19, 2013. The agreement was designed with the intended effect of converting an initial notional amount of $1.229 billion of our variable rate debt obligation under our previously outstanding facilities or any replacement facility with similar terms, including the 2016 facilities, to fixed rate debt. Under the terms of the agreement for the then-outstanding notional
43
amount, our exposure to fluctuations in the one-month LIBOR was eliminated and we paid a fixed rate of
0.604%
, plus the current applicable margin. The agreement expired on August 17, 2016.
The notional amount of any outstanding interest rate swap will be adjusted according to a pre-set schedule during the term of the applicable swap agreement such that, based on our projections for future debt repayments, our outstanding debt under the Term Loan A facility is expected to always equal or exceed the combined notional amount of the then-outstanding interest rate swaps.
The 2016 facilities also contain covenants that restrict our ability to finance future operations or capital needs, to take advantage of other business opportunities that may be in our interest or to satisfy our obligations under our other outstanding debt. These covenants restrict our ability to, among other things:
|
•
|
incur or guarantee additional debt or extend credit;
|
|
•
|
make restricted payments, including paying dividends or making distributions on, or redeeming or repurchasing, our capital stock or certain debt;
|
|
•
|
make acquisitions and investments;
|
|
•
|
dispose of assets;
|
|
•
|
engage in transactions with affiliates;
|
|
•
|
enter into agreements restricting our subsidiaries’ ability to pay dividends;
|
|
•
|
create liens on our assets or engage in sale/leaseback transactions; and
|
|
•
|
effect a consolidation or merger, or sell, transfer, or lease all or substantially all of our assets.
|
The 2016 facilities require us to comply with certain financial covenants, including minimum interest coverage and maximum net leverage. A breach of any of these operating or financial covenants would result in a default under the applicable facility. If an event of default occurs and is continuing, the lenders could elect to declare all amounts then outstanding, together with accrued interest, to be immediately due and payable, which would result in acceleration of our other debt. If we were unable to repay any such borrowings when due, the lenders could proceed against their collateral, which also secures some of our other indebtedness.
7 3/8% Senior Notes Due 2020
On May 6, 2010, we issued $600 million principal amount of 7 3/8% senior notes due May 15, 2020. On March 24, 2014, in connection with an amendment to our senior secured credit facilities discussed above in the section entitled “2014 Senior Secured Credit Facilities,” we redeemed all of our outstanding 7 3/8% senior notes and, pursuant to the indenture under which the notes were issued, paid a “make whole” premium of $68 million to the holders of the notes. We also recorded costs of $14 million to write-off previously capitalized debt issuance costs associated with these notes.
4 1/2% Senior Notes Due 2022
On December 20, 2012, we issued $700 million principal amount of 4 1/2% senior notes due December 15, 2022. We paid $16 million of fees during 2013 in connection with the issuance of these notes, which are amortized over the term of the notes. We may redeem some or all of these notes at any time prior to December 15, 2017 by paying a “make whole” premium plus any accrued and unpaid interest. In addition, we may redeem some or all of these notes on or after December 15, 2017 at specified redemption prices plus any accrued and unpaid interest. Our ability to pay cash dividends and make other restricted payments is limited, in each case, over specified amounts as defined in the indenture governing the notes.
7 3/4% Debentures Due 2023
We have outstanding $100 million of debentures due November 15, 2023 that accrue interest at the rate of 7 3/4%. Pursuant to the indenture governing the debentures, we must maintain a certain level of stockholders’ equity in order to pay cash dividends and make other restricted payments, as defined in the indenture governing the debentures.
3 5/8% Euro Senior Notes Due 2024
On June 20, 2016, we issued €350 million euro-denominated principal amount of 3 5/8% senior notes due July 15, 2024. Interest on the notes is payable in euros. We paid €6 million (approximately $7 million based on exchange rates in effect on the payment date) of fees during the second quarter of 2016 in connection with the issuance of these notes, which are amortized over the term of the notes. We may redeem some or all of these notes at any time prior to April 15, 2024 by paying a
44
“make whole” premium plus any accrued and unpaid interest. In addition, we may redeem some or all of these notes on or after April 15, 2024 at their principal amount plus any accrued and unpaid interest.
As of January 29, 2017, we were in compliance with all applicable financial and non-financial covenants under our financing arrangements.
As of January 29, 2017, our corporate credit was rated Ba1 by Moody’s with a stable outlook and our issuer credit was rated BB+ by Standard & Poor’s with a stable outlook. In assessing our credit strength, we believe that both Moody’s and Standard & Poor’s considered, among other things, our capital structure and financial policies as well as our consolidated balance sheet, our historical acquisition activity and other financial information, as well as industry and other qualitative factors.
Contractual Obligations
The following table summarizes, as of
January 29, 2017
, our contractual cash obligations by future period:
|
|
Payments Due by Period
|
|||||||||||||||||||
|
Description
|
Total
Obligations
|
2017
|
2018-2019
|
2020-2021
|
Thereafter
|
|||||||||||||||
|
(In millions)
|
||||||||||||||||||||
|
Long-term debt
(1)
|
$
|
3,223
|
|
$
|
—
|
|
$
|
289
|
|
$
|
1,760
|
|
$
|
1,174
|
|
|||||
|
Interest payments on long-term debt
|
543
|
|
109
|
|
196
|
|
157
|
|
81
|
|
||||||||||
|
Short-term borrowings
|
19
|
|
19
|
|
—
|
|
—
|
|
—
|
|
||||||||||
|
Operating and capital leases
(2)
|
2,384
|
|
462
|
|
729
|
|
491
|
|
702
|
|
||||||||||
|
Inventory purchase commitments
(3)
|
1,016
|
|
1,016
|
|
—
|
|
—
|
|
—
|
|
||||||||||
|
Minimum contractual royalty payments
(4)
|
48
|
|
15
|
|
24
|
|
8
|
|
1
|
|
||||||||||
|
Non-qualified supplemental defined benefit plans
(5)
|
12
|
|
1
|
|
3
|
|
2
|
|
6
|
|
||||||||||
|
Sponsorship and model payments
(6)
|
17
|
|
8
|
|
8
|
|
1
|
|
—
|
|
||||||||||
|
Total contractual cash obligations
|
$
|
7,262
|
|
$
|
1,630
|
|
$
|
1,249
|
|
$
|
2,419
|
|
$
|
1,964
|
|
|||||
______________________
|
(1)
|
At
January 29, 2017
, we had outstanding $2.049 billion under a senior secured Term Loan A facility, which requires mandatory payments through May 19, 2021 (according to the mandatory repayment schedules), $700 million of 4 1/2% senior unsecured notes due December 15, 2022, $100 million of 7 3/4% debentures due November 15, 2023 and $374 million of 3 5/8% senior unsecured euro notes due July 15, 2024.
|
|
(2)
|
Includes retail store, warehouse, showroom, office and equipment operating leases, as well as capital leases. Retail store operating leases generally provide for payment of direct operating costs in addition to rent. The obligation amounts listed include future minimum lease payments and exclude such direct operating costs. Please see
Note 16
, “Leases,” in the Notes to Consolidated Financial Statements included in Item 8 of this report for further information.
|
|
(3)
|
Represents contractual commitments that are enforceable and legally binding for goods on order and not received or paid for as of
January 29, 2017
. Inventory purchase commitments also include fabric commitments with our suppliers, which secure a portion of our material needs for future seasons. Substantially all of these goods are expected to be received and the related payments are expected to be made within six months of our year end. This amount does not include foreign currency exchange forward contracts that we have entered into to manage our exposure to exchange rate changes with respect to certain of these purchases. Please see
Note 10
, “Derivative Financial Instruments,” in the Notes to Consolidated Financial Statements included in Item 8 of this report for further information.
|
|
(4)
|
Our minimum contractual royalty payments arise under numerous license agreements we have with third parties, each of which has different terms. Agreements typically require us to make minimum payments to the licensors of the licensed trademarks based on expected or required minimum levels of sales of licensed products, as well as additional royalty payments based on a percentage of sales when our sales exceed such minimum sales. Certain of our license agreements require that we pay a specified percentage of net sales to the licensor for advertising and promotion of the licensed products, in some cases requiring a minimum amount to be paid. Any advertising payments, with the exception of minimum payments to licensors, are excluded from the minimum contractual royalty payments shown in the table. There is no guarantee that we will exceed the minimum payments under any of these license agreements. However, given our projected sales levels for products covered under these agreements, we currently anticipate that
|
45
future payments required under our license agreements on an aggregate basis will exceed the contractual minimums shown in the table.
|
(5)
|
We have an unfunded, non-qualified supplemental defined benefit plan covering certain retired executives under which the participants will receive a predetermined amount during the 10 years following the attainment of age 65, provided that prior to the termination of employment with us, the participant has been in such plan for at least 10 years and has attained age 55.
|
|
(6)
|
Represents payment obligations for sponsorships. We have agreements relating to our sponsorship of the Barclays Center, the Brooklyn Nets and certain other professional sports teams and athletes and other similar sponsorships, as well as agreements with models and stylists.
|
Not included in the above table are contingent purchase price payments we are obligated to pay Mr. Calvin Klein based on 1.15% of total worldwide net sales, as defined in the agreement (as amended) governing the Calvin Klein acquisition, of products bearing any of the
CALVIN KLEIN
brands. Such payments are required to be made with respect to sales made through February 12, 2018. A significant portion of the sales on which the payments to Mr. Klein are made are wholesale sales by us and our licensees and other partners to retailers. Such contingent purchase price payments totaled $53 million, $51 million and $51 million in 2016, 2015 and 2014, respectively.
Not included in the above table are contingent purchase price payments we are obligated to pay GVM International Limited into 2017 based on a percentage of sales of
Tommy Hilfiger
products in India in excess of an agreed upon threshold. Such payments are subject to a $25 million aggregate maximum and are due within 60 days following each one-year period. We made contingent purchase price payments of approximately $600,000 during each of 2016, 2015, and 2014. The estimated fair value of future contingent purchase price payments was $2 million as of January 29, 2017.
Not included in the above table are contributions to our qualified defined benefit pension plans, or payments to employees and retirees in connection with our unfunded supplemental executive retirement, supplemental pension and postretirement health plans. Contractual cash obligations for these plans cannot be determined due to the number of assumptions required to estimate our future benefit obligations, including return on assets, discount rate and future compensation increases. The liabilities associated with these plans, together with the liability for the non-qualified supplemental defined benefit plans included in the above table, are presented in
Note 12
, “Retirement and Benefit Plans,” in the Notes to Consolidated Financial Statements included in Item 8 of this report. Currently, we do not expect to make any material contributions to our pension plans in 2017. Our actual contributions may differ from our planned contributions due to many factors, including changes in tax and other benefit laws, or significant differences between expected and actual pension asset performance or interest rates.
Not included in the above table are $263 million of net potential cash obligations associated with uncertain tax positions due to the uncertainty regarding the future cash outflows associated with such obligations. Please see
Note 9
, “Income Taxes,” in the Notes to Consolidated Financial Statements included in Item 8 of this report for further information related to uncertain tax positions.
Not included in the above table are $22 million of asset retirement obligations related to leased office and retail store locations due to the uncertainty of timing of future cash outflows associated with such obligations. Please see
Note 21
, “Other Comments,” in the Notes to Consolidated Financial Statements included in Item 8 of this report for further information related to asset retirement obligations.
Not included in the above table are obligations related to our non-exclusive buying agency agreement with Li & Fung due to uncertainty of the timing and amounts of future cash outflows associated with such obligations. In March 2017, we entered into agreements for a transaction to restructure our supply chain relationship with Li & Fung. The transaction establishes a new strategic partnership with Li & Fung to provide services to us and also provides for the termination of our non-exclusive buying agency agreement with Li & Fung, pursuant to which we are obligated to source certain
Calvin Klein Jeans
products and at least 54% of certain
Tommy Hilfiger
products through Li & Fung. The transaction is expected to close July 1, 2017.
Not included in the above table are contractual royalty obligations related to our perpetual license agreement with Speedo International Limited. Under the terms of the agreement, our contractual minimum payments each year are $1 million, which is subject to annual increases based on the Consumer Price Index.
46
Off-Balance Sheet Arrangements
We do not have any off-balance sheet arrangements that have a material current effect, or that are reasonably likely to have a material future effect, on our financial position, changes in financial position, revenue, expenses, results of operations, liquidity, capital expenditures or capital resources.
MARKET RISK
Financial instruments held by us as of
January 29, 2017
include cash and cash equivalents, short-term borrowings, long-term debt, foreign currency forward exchange and foreign currency option contracts and interest rate swap agreements.
Note 11
, “Fair Value Measurements,” in the Notes to Consolidated Financial Statements included in Item 8 of this report outlines the fair value of our financial instruments as of
January 29, 2017
. Cash and cash equivalents held by us are affected by short-term interest rates, which are currently low. Due to the currently low rates of return we are receiving on our cash equivalents, the potential for a significant decrease in short-term interest rates is low and, therefore, a further decrease would not have a material impact on our interest income. However, there is potential for a more significant increase in short-term interest rates, which could have a more material impact on our interest income. Given our balance of cash and cash equivalents at
January 29, 2017
, the effect of a 10 basis point change in short-term interest rates on our interest income would be approximately $700,000 annually. Borrowings under our 2016 facilities bear interest at a rate equal to an applicable margin plus a variable rate. As such, our credit facilities expose us to market risk for changes in interest rates. We have entered into interest rate swap agreements for the intended purpose of reducing our exposure to interest rate volatility. As of
January 29, 2017
, after taking into account the effect of our interest rate swap agreement that was in effect at such date, approximately 65% of our long-term debt was at a fixed interest rate, with the remainder at variable interest rates. Given our debt position at
January 29, 2017
, the effect of a 10 basis point change in interest rates on our interest expense would be approximately $1 million annually. Please see the section entitled “Liquidity and Capital Resources” above for a further discussion of our credit facilities and interest rate swap agreements.
Our Calvin Klein and Tommy Hilfiger businesses each have substantial international components that expose us to significant foreign exchange risk. Our Heritage Brands business also has international components, but those components are not significant to the business. Changes in exchange rates between the United States dollar and other currencies can impact our financial results in two ways: a translation impact and a transaction impact. The translation impact refers to the impact that changes in exchange rates can have on our financial results, as our operating results in local foreign currencies are translated into United States dollars using an average exchange rate over the representative period. Accordingly, the impact of a strengthening United States dollar, particularly against the euro, the Brazilian real, the Japanese yen, the Korean won, the British pound sterling, the Canadian dollar, the Mexican peso, the Indian rupee, the Russian ruble and the Chinese yuan renminbi, will have a negative impact on our reported results of operations. To hedge against a portion of this exposure, we entered into several foreign currency option contracts during 2016. These contracts represent our purchase of euro put/United States dollar call options. The changes in the fair value of these foreign currency option contracts are recognized immediately in earnings. This mitigates, to an extent, the effect of a strengthening United States dollar against the euro on the reporting of our euro-denominated operating results. We expect reductions in revenue and, absent material changes in the fair value of these foreign currency option contracts, in net income in 2017 due to the foreign exchange translation impact of approximately $150 million and $20 million, respectively, based on current exchange rates.
The transaction impact on financial results is common for apparel companies operating outside the United States that purchase goods in United States dollars, as is the case with most of our foreign operations. As with translation, during times of a strengthening United States dollar, our results of operations will be negatively impacted from these transactions as the increased local currency value of inventory results in higher cost of goods sold in local currency when the goods are sold. We also have exposure to changes in foreign currency exchange rates related to certain intercompany transactions and, to a lesser extent, SG&A expenses
that are denominated in currencies other than the functional currency of a particular entity. We currently use and plan to continue to use foreign currency forward exchange contracts or other derivative instruments to mitigate the cash flow or market value risks associated with these inventory and intercompany transactions, but we are unable to entirely eliminate these risks. We expect a reduction in net income in 2017 due to the foreign exchange transaction impact of approximately $10 million, based on current exchange rates.
Included in the calculations of expense and liabilities for our pension plans are various assumptions, including return on assets, discount rates, mortality rates and future compensation increases. Actual results could differ from these assumptions, which would require adjustments to our balance sheet and could result in volatility in our future pension expense. Holding all other assumptions constant, a 0.25% increase or decrease in the assumed discount rate would decrease or increase, respectively, 2017 net pension expense by approximately $25 million.
47
SEASONALITY
Our business generally follows a seasonal pattern. Our wholesale businesses tend to generate higher levels of sales in the first and third quarters, while our retail businesses tend to generate higher levels of sales in the fourth quarter. Royalty, advertising and other revenue tends to be earned somewhat evenly throughout the year, although the third quarter has the highest level of royalty revenue due to higher sales by licensees in advance of the holiday selling season. We expect this seasonal pattern will generally continue.
RECENT ACCOUNTING PRONOUNCEMENTS
Recently Adopted Accounting Guidance
The Financial Accounting Standards Board (“FASB”) issued in April 2015 an update to accounting guidance related to debt issuance costs. The update requires debt issuance costs related to a recognized debt liability to be presented in the balance sheet as a direct deduction from the carrying amount of that debt liability, consistent with the presentation of debt discounts. We adopted this update during the first quarter of 2016 on a retrospective basis, which resulted in decreases to prepaid expenses and other assets of $
8
million and $
15
million, respectively, as of
January 31, 2016
with corresponding decreases in long-term debt.
The FASB issued in April 2015 an update to accounting guidance related to retirement benefits. This update provides a practical expedient which allows a company with fiscal years that do not fall on a calendar month-end to measure defined benefit plan assets and obligations using the month end that is closest to the company’s fiscal year end. If elected, this update should be applied consistently from year to year for all plans. The update became effective for us in the first quarter of 2016. Prospective application is required. We have not elected to change our measurement date under this update.
Accounting Guidance Issued But Not Adopted as of January 29, 2017
The FASB issued in May 2014 guidance that supersedes most of the current revenue recognition requirements. The core principle of the guidance is that an entity should recognize revenue to depict the transfer of promised goods or services to customers in an amount that reflects the consideration to which the entity expects to be entitled in exchange for those goods or services. New disclosures about the nature, amount, timing and uncertainty of revenue and cash flows arising from contracts with customers are also required. In August 2015, the FASB approved a one year delay to the required adoption date of the standard, which makes it effective for us no later than the first quarter of 2018, with adoption in 2017 permitted. In 2016, the FASB issued several amendments to clarify various aspects of the implementation guidance. The new standard is required to be applied retrospectively to each prior reporting period (full retrospective method) or retrospectively with the cumulative effect of initially applying the standard recognized as an adjustment to opening retained earnings at the date of initial adoption (modified retrospective method).
We formed a global, cross-functional project team to analyze the impacts of the guidance across all of our revenue streams. This included review of current accounting policies and practices to identify potential differences that would result from applying the guidance. The majority of our revenue is generated from sales of finished products, which will continue to be recognized when control is transferred to the customer. Our assessment included an evaluation of the impact that the guidance will have on our accounting for royalty and advertising revenue, loyalty programs and gift cards. Under the guidance, our royalty and advertising revenue will continue to be recognized over time. However, we are still assessing the impact of decisions reached by the FASB Transition Resource Group in November 2016 on the treatment of minimum guarantees in licensing arrangements, which may affect the timing of our recognition of royalty and advertising revenue. For loyalty programs, we record costs associated with such programs ratably as a cost of goods sold based on enrolled customers’ spending. Under the guidance, the revenue associated with the loyalty award will be initially deferred when the loyalty awards are earned and recognized, along with the related cost of goods sold, as the loyalty awards are redeemed or expire. Revenue for the unredeemed portion of gift cards, which is currently recognized when the likelihood of redemption becomes remote, will be recognized under the guidance proportionately over the estimated customer redemption period, subject to the constraint that it must be highly probable that a significant reversal of revenue will not occur. While our assessment of the impacts of the guidance is still in process, the adoption of the guidance is not expected to have a material impact on our consolidated financial statements. We plan to adopt the standard in the first quarter of 2018 using the modified retrospective method.
The FASB issued in July 2015 an update to accounting guidance to simplify the measurement of inventory. Currently, all inventory is measured at the lower of cost or market. The update requires an entity to measure inventory within the scope of
48
the guidance at the lower of cost or net realizable value. Net realizable value is the estimated selling price in the ordinary course of business less reasonably predictable costs of completion, disposal and transportation. The update does not apply to inventory measured using last-in, first-out or the retail inventory methods. This update will be effective for us in the first quarter of 2017. Prospective adoption is required. The adoption is not expected to have a material impact on our consolidated financial statements.
The FASB issued in January 2016 an update to accounting guidance for the recognition and measurement of financial instruments. The update requires equity investments that are not accounted for under the equity method of accounting to be measured at fair value with changes recognized in net income and updates certain presentation and disclosure requirements. The update will be effective for us in the first quarter of 2018 with limited early adoption permitted. The adoption is not expected to have any impact on our consolidated financial statements as we do not currently have such investments.
The FASB issued in February 2016 a new accounting standard on leases. The new standard, among other changes, will require lessees to recognize a right-of-use asset and a lease liability in the balance sheet for most leases. The lease liability will be measured at the present value of the lease payments over the lease term. The right-of-use asset will be measured at the lease liability amount, adjusted for lease prepayments, lease incentives received and the lessee’s initial direct costs (
e.g
., commissions). The guidance will be effective for us in the first quarter of 2019 with early adoption permitted. The adoption will require a modified retrospective approach for leases that exist or are entered into after the beginning of the earliest period presented. We are currently evaluating the standard to determine the impact of the adoption on our consolidated financial statements but expect that it will result in a significant increase to our other assets and other liabilities.
The FASB issued in March 2016 an update to accounting guidance to simplify several aspects of accounting for share-based payment award transactions, including the accounting for forfeitures, income taxes and statutory tax withholding requirements, as well as classification of these transactions in the statement of cash flows. The update will be effective for us in the first quarter of 2017. We have elected not to continue estimating expected forfeitures in determining compensation expense. With respect to the accounting for income taxes, this update requires, on a prospective basis, recognition of excess tax benefits and tax deficiencies (resulting from an increase or decrease in the fair value of an award from grant date to the vesting or exercise date) in the provision for income taxes as a discrete item in the quarterly period in which they occur. Currently, excess tax benefits or tax deficiencies are recognized in equity as a component of additional paid in capital. As such, the adoption of this update is expected to impact our Consolidated Income Statements and Balance Sheets on a prospective basis. We recognized, in equity, a tax deficiency of $7 million and a tax benefit of $5 million in 2016 and 2015, respectively. These amounts may not be indicative of future amounts that may be recognized subsequent to the adoption of this update, as any excess tax benefits or tax deficiencies recognized will be dependent upon unpredictable future events, including the timing of exercises, the value realized upon the vesting or exercise of shares versus the fair value of the shares when they were granted and applicable tax rates. In addition, these excess tax benefits and deficiencies will be classified as an operating activity in the Consolidated Statement of Cash Flows instead of as a financing activity, and such classification will be applied on a retrospective basis to all periods presented. The update also requires that the value of shares withheld from employees upon vesting of stock awards in order to satisfy any applicable tax withholding requirements are to be presented within financing activities in the Consolidated Statement of Cash Flows, which is consistent with our current presentation, and will therefore have no impact to us.
The FASB issued in August 2016 an update to accounting guidance to clarify and provide specific guidance on how certain cash receipts and cash payments are classified in the statement of cash flows with the objective of reducing existing diversity in practice with respect to these items. Among the types of cash flows addressed are payments for costs related to debt prepayments or extinguishments, payments of contingent consideration after a business combination and distributions from equity method investees. The update will be effective for us in the first quarter of 2018, with early adoption permitted. Retrospective adoption is required. Upon adoption, contingent purchase price payments that are currently classified as cash flows from investing activities will be classified as cash flows from operating activities in our Consolidated Statements of Cash Flows. Otherwise, the adoption of the update is not expected to have a material impact on our consolidated financial statements.
The FASB issued in October 2016 an update to accounting guidance to simplify income tax accounting on intercompany sales or transfers of assets other than inventory. The existing guidance requires entities to defer the income tax effect of intercompany transfers of assets until the asset has been sold to an outside party or otherwise recognized. The update requires companies to immediately recognize in their income statement the income tax effects of an intercompany sale or transfer of an asset other than inventory. The update will be effective for us in the first quarter of 2018, with early adoption permitted as of the beginning of an annual period. Entities are required to apply the update using a modified retrospective approach with a cumulative catch-up adjustment to opening retained earnings in the period of adoption. As of January 29, 2017, we had deferred charges of $8 million related to intercompany sales and transfers of assets recorded in other assets. Upon
49
adoption of this update, other assets will be reduced by the then current amount of deferred charges with a corresponding adjustment to opening retained earnings.
The FASB issued in November 2016 an update to accounting guidance to clarify and provide specific guidance on the cash flow classifications and presentation of changes in restricted cash. The update requires that restricted cash be included with cash and cash equivalents when reconciling the beginning-of-period and end-of-period total amounts shown in the statement of cash flows. The update will be effective for us in the first quarter of 2018, with early adoption permitted. Retrospective adoption is required. The adoption is not expected to have a material impact on our Consolidated Statement of Cash Flows.
The FASB issued in January 2017 an update to accounting guidance to revise the definition of a business. The update requires that when substantially all of the fair value of the gross assets acquired (or disposed of) is concentrated in a single identifiable asset or a group of identifiable assets, the set of assets would not represent a business. Also, in order to be considered a business, an acquisition would have to include an input and a substantive process that together significantly contribute to the ability to produce outputs. Under the update, fewer sets of assets are expected to be considered businesses. The update will be effective for us in the first quarter of 2018, with early adoption permitted. We will apply this update to applicable transactions after the adoption date. The impact on our consolidated financial statements will depend on the facts and circumstances of any specific future transactions.
The FASB issued in January 2017 an update to the accounting guidance to simplify the testing for goodwill impairment. The update eliminates the requirement to calculate the implied fair value of goodwill to measure the amount of impairment loss, if any, under the second step of the current goodwill impairment test. Under the update, the goodwill impairment loss would be measured as the amount by which a reporting unit’s carrying value exceeds its fair value, not to exceed the carrying amount of goodwill. The update will be effective for us in the first quarter of 2020, with early adoption permitted for interim or annual goodwill impairment tests performed after January 1, 2017. Prospective adoption is required. The adoption is not expected to have a material impact on our consolidated financial statements.
CRITICAL ACCOUNTING POLICIES AND ESTIMATES
Our consolidated financial statements are based on the selection and application of significant accounting policies, which require management to make significant estimates and assumptions. Our significant accounting policies are outlined in
Note 1
, “Summary of Significant Accounting Policies,” in the Notes to Consolidated Financial Statements included in Item 8 of this report. We believe that the following are the more critical judgmental areas in the application of our accounting policies that currently affect our financial position and results of operations:
Sales allowances and returns
—We have arrangements with many of our department and specialty store customers to support their sales of our products. We establish accruals which, based on a review of the individual customer arrangements and the expected performance of our products in their stores, we believe will be required to satisfy our sales allowance obligations. We also establish accruals, which are based on historical data and authorized amounts, that we believe are necessary to provide for sales allowances and inventory returns. It is possible that the accrual estimates could vary from actual results, which would require adjustment to the allowance and returns accruals.
Inventories—
Inventories are comprised principally of finished goods and are stated at the lower of cost or market. Cost for principally all wholesale inventories in North America and certain wholesale and retail inventories in Asia and Latin America is determined using the first-in, first-out method. Cost for all other inventories is determined using the weighted average cost method. We review current business trends, inventory agings and discontinued merchandise categories to determine adjustments which we estimate will be needed to liquidate existing clearance inventories and reduce inventories to the lower of cost or market. We believe that all inventory writedowns required at
January 29, 2017
have been recorded. If market conditions were to change, it is possible that the required level of inventory reserves would need to be adjusted.
Asset impairments
—During 2016, 2015 and 2014, we determined that the long-lived assets in certain of our retail stores were not recoverable, which resulted in us recording impairment charges. In order to calculate the impairment charges, we estimated the undiscounted future cash flows and the related fair value of each asset. The undiscounted future cash flows for each asset were estimated using current sales trends and other factors. If different assumptions had been used for future sales trends, the recorded impairment charges could have been significantly higher or lower.
Note 11
, “Fair Value Measurements,” in the Notes to Consolidated Financial Statements included in Item 8 of this report includes a further discussion of the circumstances surrounding the impairments and the assumptions related to the impairment charges.
50
Allowance for doubtful accounts
—Trade receivables, as presented in our Consolidated Balance Sheets, are net of an allowance for doubtful accounts. An allowance for doubtful accounts is determined through an analysis of the aging of accounts receivable and assessments of collectibility based on historic trends, the financial condition of our customers and an evaluation of economic conditions. Because we cannot predict future changes in economic conditions and in the financial stability of our customers, actual future losses from uncollectible accounts may differ from our estimates and could impact our allowance for doubtful accounts.
Income taxes
—Deferred income tax balances reflect the effects of temporary differences between the carrying amounts of assets and liabilities and their tax bases and are stated at enacted tax rates expected to be in effect when taxes are actually paid or recovered. FASB guidance on accounting for income taxes requires that deferred tax assets be evaluated for future realization and reduced by a valuation allowance to the extent we believe a portion will not be realized. We consider many factors when assessing the likelihood of future realization of our deferred tax assets, including our recent earnings experience and expectations of future taxable income by taxing jurisdiction, the carryforward periods available to us for tax reporting purposes and other relevant factors. The actual realization of deferred tax assets may differ significantly from the amounts we have recorded.
During the ordinary course of business, there are many transactions and calculations for which the ultimate tax determination is uncertain.
Accounting for income taxes requires a two-step approach to recognizing and measuring uncertain tax positions. The first step is to evaluate the tax position for recognition by determining if available evidence indicates it is more likely than not that the tax position will be fully sustained upon review by taxing authorities, including resolution of related appeals or litigation processes, if any. The second step is to measure the tax benefit as the largest amount with a greater than 50 percent likelihood of being realized upon ultimate settlement. For tax positions that are 50 percent or less likely of being sustained upon audit, we do not recognize any portion of that benefit in the financial statements. We consider many factors when evaluating and estimating our tax positions and tax benefits, which may require periodic adjustments and which may not accurately anticipate actual outcomes. Our actual results could differ materially from our current estimates.
Goodwill and other intangible assets
— Goodwill and other indefinite-lived intangible assets are tested for impairment annually, at the beginning of the third quarter of each fiscal year, and between annual tests if an event occurs or circumstances change that would indicate that it is more likely than not that the carrying amount may be impaired. Impairment testing for goodwill is done at the reporting unit level. A reporting unit is defined as an operating segment or one level below the operating segment, called a component. However, two or more components of an operating segment will be aggregated and deemed a single reporting unit if the components have similar economic characteristics.
FASB guidance allows us to first assess qualitative factors to determine whether it is necessary to perform a more detailed quantitative impairment test for goodwill and other indefinite-lived intangible assets. We may elect to bypass the qualitative assessment and proceed directly to the quantitative test for any reporting unit or indefinite-lived intangible assets. Qualitative factors that we consider as part of our assessment include a change in our market capitalization and its implied impact on reporting unit fair value, industry and market conditions, macroeconomic conditions, trends in product costs and financial performance of our businesses. If we perform the quantitative test for any reporting units or indefinite-lived intangible assets, we generally use a discounted cash flow method to estimate fair value. The discounted cash flow method is based on the present value of projected cash flows. Assumptions used in these cash flow projections are generally consistent with our internal forecasts. The estimated cash flows are discounted using a rate that represents the weighted average cost of capital. The weighted average cost of capital is based on a number of variables, including the equity-risk premium and risk-free interest rate. Management believes the assumptions used for the impairment tests are consistent with those that would be utilized by a market participant performing similar analysis and valuations. Adverse changes in future market conditions or weaker operating results compared to our expectations may impact our projected cash flows and estimates of weighted average cost of capital, which could result in a potential impairment charge if we are unable to recover the carrying value of our goodwill and other intangible assets.
For the 2016 annual goodwill impairment test, we elected to first assess qualitative factors to determine whether it was more likely than not that the fair value of any reporting unit was less than its carrying amount as a basis for determining whether it was necessary to perform the two-step goodwill impairment test. In evaluating whether it was more likely than not that the fair value of any reporting unit was less than its carrying amount, we assessed relevant events and circumstances including, the change in our market capitalization and our implied impact on reporting unit fair value, industry and market conditions, macroeconomic conditions, trends in product costs and financial performance of our businesses. After assessing these events and circumstances, we determined that it was not more likely than not that the fair value of any reporting unit was less than its carrying amount and concluded that the quantitative goodwill impairment test was not required.
51
During 2016, and subsequent to the 2016 annual goodwill impairment test, we formed a joint venture in Mexico by merging our wholly owned subsidiary that principally operated and managed the Calvin Klein business in Mexico with a wholly owned subsidiary of the joint venture partner, which resulted in the deconsolidation of our wholly owned subsidiary, including goodwill assigned to the business. This transaction was a triggering event that indicated that the amount of remaining goodwill allocated to the Calvin Klein North America Wholesale, Calvin Klein North America Retail and Heritage Brands Wholesale reporting units could be impaired, prompting the need for us to perform a goodwill impairment test for these reporting units in 2016. No goodwill impairment resulted from this interim test in 2016.
For the 2015 annual goodwill impairment test, we elected to bypass the qualitative assessment and proceeded directly to the quantitative impairment test using a discounted cash flow method to estimate fair value. Our annual goodwill impairment test during 2015 yielded estimated fair values in excess of the carrying amounts for all of our reporting units and therefore the second step of the quantitative goodwill impairment test was not required.
During the fourth quarter of 2014, we announced our plan to exit the Izod retail business in 2015 (which was completed in the third quarter of 2015). The decision to exit this business was a triggering event that indicated that the amount of goodwill allocated to the Heritage Brands Retail reporting unit could be impaired, prompting the need for us to perform a goodwill impairment test for this reporting unit in 2014. As a result of this interim test in 2014, the goodwill allocated to the Heritage Brands Retail reporting unit was determined to be impaired and an impairment charge of $
12
million was recorded in selling, general and administrative expenses.
Indefinite-lived intangible assets not subject to amortization are tested for impairment annually, at the beginning of the third quarter of each fiscal year, and between annual tests if an event occurs or circumstances change that would indicate that the carrying amount may be impaired. FASB guidance allows us to first assess qualitative factors to determine whether it is necessary to perform a more detailed quantitative impairment test for its indefinite-lived intangible assets. We may elect to bypass the qualitative assessment and proceed directly to the quantitative impairment test. When performing the quantitative test, an impairment loss is recognized if the carrying amount of the asset exceeds the fair value of the asset, which is generally determined using the estimated discounted cash flows associated with the asset’s use. Intangible assets with finite lives are amortized over their estimated useful lives and are tested for impairment along with other long-lived assets.
For the 2016 and 2015 annual impairment tests of certain indefinite-lived intangible assets, we elected to first assess qualitative factors to determine whether it was more likely than not that the fair value of any asset was less than its carrying amount. In performing this evaluation, we assessed relevant events and circumstances including industry and market conditions, macroeconomic conditions, trends in product costs and financial performance of our businesses. After assessing these events and circumstances, the Company determined that it was not more likely than not that the fair value of these certain indefinite-lived intangible assets were less than their carrying amount and concluded that the quantitative impairment test was not required. For certain other indefinite-lived intangible assets impairment tests, we elected to bypass the qualitative assessment and proceeded directly to the quantitative impairment test using a discounted cash flow method to estimate fair value. No impairment of indefinite-lived intangible assets resulted from any of our annual impairment tests in 2016 and 2015.
If different assumptions for our goodwill and other indefinite-lived intangible assets impairment tests had been applied, significantly different outcomes could have resulted. There can be no assurance that the estimates and assumptions used in our goodwill and indefinite-lived intangible assets impairment testing performed in 2016 will prove to be accurate predictions of the future. For example, if general macroeconomic conditions deteriorate or otherwise vary from current assumptions (including changes in the weighted average cost of capital), industry or market conditions deteriorate, business conditions or strategies for a specific reporting unit change from current assumptions, including cost increases or loss of major customers, our businesses do not perform as projected, or there is an extended period of a significant decline in our stock price, this could be an indicator that the excess fair value of our reporting units could be lessened and the chance of an impairment of goodwill and other indefinite-lived intangible assets could be raised.
Pension benefits
—Included in the calculations of expense and liabilities for our pension plans are various assumptions, including return on assets, discount rates, mortality rates and future compensation increases. During 2016 and 2014, we revised the mortality assumptions used to determine the benefit obligations of our pension plans based on recently published mortality tables. These changes in life expectancy resulted in changes to the period for which we expect benefits to be paid. In 2016, the decrease in life expectancy decreased our benefit obligations and future expense and in 2014, the increase in life expectancy increased our benefit obligations and future expense.
Note 12
, “Retirement and Benefit Plans,” in the Notes to Consolidated Financial Statements included in Item 8 of this report sets forth certain significant rate assumptions used in performing calculations related to our pension plans. Actual results could differ from these assumptions, which would require adjustments to our balance sheet and could result in volatility in our future pension expense. Holding all other assumptions constant, a 1% increase or decrease in the assumed rate of return on assets would decrease or increase, respectively, 2017 net
52
benefit cost by approximately $6 million. Likewise, a 0.25% increase or decrease in the assumed discount rate would decrease or increase, respectively, 2017 net periodic pension expense by approximately $25 million. Actuarial gains and losses are recognized in our operating results in the year in which they occur. These gains and losses are measured at least annually at the end of our fiscal year and, as such, are generally recorded during the fourth quarter of each year.
Stock-based compensation
—Accounting for stock-based compensation requires measurement of compensation cost for all stock-based awards at fair value on the date of grant and recognition of compensation over the service period for awards expected to vest. We use the Black-Scholes-Merton option pricing model to determine the fair value of our stock options. This model uses assumptions that include the risk-free interest rate, expected volatility, expected dividend yield and expected life of the options. The fair value of restricted stock units is determined based on the quoted price of our common stock on the date of grant. The fair value of our stock options and restricted stock units is recognized as expense over the service period, net of estimated forfeitures. The fair value of contingently issuable performance shares that are not based on market conditions is based on the quoted price of our common stock on the date of grant, reduced for the present value of any dividends expected to be paid on our common stock during the performance cycle, as the contingently issuable performance shares do not accrue dividends prior to the completion of the performance cycle. We record expense for contingently issuable performance shares that are not based on market conditions based on our current expectations of the probable number of shares that will ultimately be issued. The fair value of contingently issuable performance shares that are subject to market conditions is established using a Monte Carlo simulation model. We record expense for the awards that are subject to market conditions ratably over the vesting period, net of estimated forfeitures, regardless of whether the market condition is satisfied. We consider many factors when estimating expected forfeitures, including types of awards, employee class and historical experience. The estimation of stock awards that will ultimately vest requires judgment, and to the extent actual results or updated estimates differ from our current estimates, such amounts will be recorded as a cumulative adjustment in the period estimates are revised. Actual results and future estimates may differ substantially from our current estimates.
Information with respect to Quantitative and Qualitative Disclosures About Market Risk appears under the heading “Market Risk” in Item 7.
See page F-1 of this report for a listing of the consolidated financial statements and supplementary data included in this report.
None.
Evaluation of Disclosure Controls and Procedures
As of the end of the period covered by this report, we carried out an evaluation, under the supervision and with the participation of our management, including our Chief Executive Officer and Chief Operating & Financial Officer, of the effectiveness of the design and operation of our disclosure controls and procedures. Based upon that evaluation, our Chief Executive Officer and Chief Operating & Financial Officer concluded that our disclosure controls and procedures were effective as of the end of the period covered by this report. Disclosure controls and procedures are controls and procedures that are designed to ensure that information required to be disclosed in our reports filed or submitted under the Securities Exchange Act of 1934, as amended, is recorded, processed, summarized and reported within the time periods specified in the Securities and Exchange Commission’s rules and forms and that such information is accumulated and communicated to our management, including our Chief Executive Officer and Chief Operating & Financial Officer, as appropriate to allow timely decisions regarding required disclosure.
53
Management’s Report on Internal Control over Financial Reporting
Management’s report on internal control over financial reporting and our independent registered public accounting firm’s audit report on our assessment of our internal control over financial reporting can be found on pages F-59 and F-60.
Changes in Internal Control over Financial Reporting
We did not identify any changes in our internal control over financial reporting during the fourth quarter of the fiscal year to which this report relates that have materially affected, or are reasonably likely to materially affect, our internal control over financial reporting.
Not applicable.
54
Information with respect to Directors of the Registrant is incorporated herein by reference to the section entitled “Election of Directors” in our proxy statement for the Annual Meeting of Stockholders to be held on June 15, 2017. Information with respect to compliance by our officers and directors with Section 16(a) of the Securities Exchange Act is incorporated herein by reference to the section entitled “Section 16(a) Beneficial Ownership Reporting Compliance” in our proxy statement for the Annual Meeting of Stockholders to be held on June 15, 2017. Information with respect to our executive officers is contained in the section entitled “Executive Officers of the Registrant” in Part I, Item 1 of this report. Information with respect to the procedure by which security holders may recommend nominees to our Board of Directors and with respect to our Audit & Risk Management Committee, our Audit Committee Financial Expert and our Code of Ethics for the Chief Executive and Senior Financial Officers is incorporated herein by reference to the section entitled “Election of Directors” in our proxy statement for the Annual Meeting of Stockholders to be held on June 15, 2017.
Information with respect to Executive Compensation is incorporated herein by reference to the sections entitled “Executive Compensation,” “Compensation Committee Report,” “Compensation Discussion and Analysis” and “Compensation Committee Interlocks and Insider Participation” in our proxy statement for the Annual Meeting of Stockholders to be held on June 15, 2017.
Information with respect to the Security Ownership of Certain Beneficial Owners and Management and Equity Compensation Plan Information is incorporated herein by reference to the sections entitled “Security Ownership of Certain Beneficial Owners and Management” and “Equity Compensation Plan Information” in our proxy statement for the Annual Meeting of Stockholders to be held on June 15, 2017.
Information with respect to Certain Relationships and Related Transactions and Director Independence is incorporated herein by reference to the sections entitled “Transactions with Related Persons,” “Election of Directors” and “Director Compensation” in our proxy statement for the Annual Meeting of Stockholders to be held on June 15, 2017.
Information with respect to Principal Accounting Fees and Services is incorporated herein by reference to the section entitled “Ratification of the Appointment of Auditor” in our proxy statement for the Annual Meeting of Stockholders to be held on June 15, 2017.
55
|
(a)(1)
|
See page F-1 for a listing of the consolidated financial statements included in Item 8 of this report.
|
|
(a)(2)
|
See page F-1 for a listing of consolidated financial statement schedules submitted as part of this report.
|
|
(a)(3)
|
The following exhibits are included in this report:
|
|
Exhibit
Number
|
|||
|
2.1
|
Stock Purchase Agreement, dated December 17, 2002, among Phillips-Van Heusen Corporation, Calvin Klein, Inc., Calvin Klein (Europe), Inc., Calvin Klein (Europe II) Corp., Calvin Klein Europe S.r.l., CK Service Corp., Calvin Klein, Barry Schwartz, Trust for the Benefit of the Issue of Calvin Klein, Trust for the Benefit of the Issue of Barry Schwartz, Stephanie Schwartz-Ferdman and Jonathan Schwartz (incorporated by reference to Exhibit 10.1 to our Current Report on Form 8-K, filed on December 20, 2002). The registrant agrees to furnish supplementally a copy of any omitted schedules to the Commission upon request.
|
||
|
|
|
||
|
2.2
|
Agreement and Plan of Merger, dated as of October 29, 2012, by and among The Warnaco Group, Inc., PVH Corp. and Wand Acquisition Corp. (incorporated by reference to Exhibit 2.1 to our Current Report on Form 8-K, filed on November 2, 2012).
|
||
|
|
|
||
|
3.1
|
Certificate of Incorporation (incorporated by reference to Exhibit 5 to our Annual Report on Form 10-K for the fiscal year ended January 29, 1977); Amendment to Certificate of Incorporation, filed June 27, 1984 (incorporated by reference to Exhibit 3B to our Annual Report on Form 10-K for the fiscal year ended February 3, 1985); Amendment to Certificate of Incorporation, filed June 2, 1987 (incorporated by reference to Exhibit 3(c) to our Annual Report on Form 10-K for the fiscal year ended January 31, 1988); Amendment to Certificate of Incorporation, filed June 1, 1993 (incorporated by reference to Exhibit 3.5 to our Annual Report on Form 10-K for the fiscal year ended January 30, 1994); Amendment to Certificate of Incorporation, filed June 20, 1996 (incorporated by reference to Exhibit 3.1 to our Quarterly Report on Form 10-Q for the period ended July 28, 1996); Certificate of Amendment of Certificate of Incorporation, filed June 29, 2006 (incorporated by reference to Exhibit 3.9 to our Quarterly Report on Form 10-Q for the period ended May 6, 2007); Certificate of Amendment of Certificate of Incorporation, filed June 23 2011 (incorporated by reference to Exhibit 3.1 to our Current Report on Form 8-K, filed on June 29, 2011).
|
||
|
|
|
||
|
3.2
|
Certificate of Designation of Series A Cumulative Participating Preferred Stock, filed June 10, 1986 (incorporated by reference to Exhibit A of the document filed as Exhibit 3 to our Quarterly Report on Form 10-Q for the period ended May 4, 1986).
|
||
|
|
|
||
|
3.3
|
Certificate of Designations, Preferences and Rights of Series B Convertible Preferred Stock of Phillips-Van Heusen Corporation (incorporated by reference to Exhibit 3.1 to our Current Report on Form 8-K, filed on February 26, 2003); Corrected Certificate of Designations, Preferences and Rights of Series B Convertible Preferred Stock of Phillips-Van Heusen Corporation, dated April 17, 2003 (incorporated by reference to Exhibit 3.9 to our Annual Report on Form 10-K for the fiscal year ended February 2, 2003).
|
||
|
|
|
||
|
3.4
|
Certificate Eliminating Reference to Series B Convertible Preferred Stock from Certificate of Incorporation of Phillips-Van Heusen Corporation, filed June 12, 2007 (incorporated by reference to Exhibit 3.10 to our Quarterly Report on Form 10-Q for the period ended May 6, 2007).
|
||
|
|
|
||
|
3.5
|
Certificate Eliminating Reference To Series A Cumulative Participating Preferred Stock From Certificate of Incorporation of Phillips-Van Heusen Corporation (incorporated by reference to Exhibit 3.2 to our Current Report on Form 8-K, filed on September 28, 2007).
|
||
|
|
|
||
|
3.6
|
Certificate of Designations of Series A Convertible Preferred Stock of Phillips-Van Heusen Corporation (incorporated by reference to Exhibit 3.1 to our Current Report on Form 8-K, filed May 12, 2010).
|
||
|
3.7
|
Certificate Eliminating Reference to Series A Convertible Preferred Stock From Certificate of Incorporation of PVH Corp. (incorporated by reference to Exhibit 3.1 to our Current Report on Form 8-K, filed on May 3, 2013).
|
||
|
3.8
|
By-Laws of PVH Corp., as amended through April 28, 2016 (incorporated by reference to Exhibit 3.1 to our Current Report on Form 8-K, filed on May 3, 2016).
|
||
56
|
4.1
|
|
Specimen of Common Stock certificate (incorporated by reference to Exhibit 4.1 to our Quarterly Report on Form 10-Q for the period ended July 31, 2011).
|
|
|
|
|
|
4.2
|
|
Indenture, dated as of November 1, 1993, between Phillips-Van Heusen Corporation and The Bank of New York, as Trustee (incorporated by reference to Exhibit 4.01 to our Registration Statement on Form S-3 (Reg. No. 33-50751) filed on October 26, 1993); First Supplemental Indenture, dated as of October 17, 2002 to Indenture dated as of November 1, 1993 between Phillips-Van Heusen Corporation and The Bank of New York, as Trustee (incorporated by reference to Exhibit 4.15 to our Quarterly Report on Form 10-Q for the period ended November 3, 2002); Second Supplemental Indenture, dated as of February 12, 2002 to Indenture, dated as of November 1, 1993, between Phillips-Van Heusen Corporation and The Bank of New York, as Trustee (incorporated by reference to Exhibit 4.2 to our Current Report on Form 8-K, filed on February 26, 2003); Third Supplemental Indenture, dated as of May 6, 2010, between Phillips-Van Heusen Corporation and The Bank of New York Mellon (formerly known as The Bank of New York), as Trustee (incorporated by reference to Exhibit 4.16 to our Quarterly Report on Form 10-Q for the period ended August 1, 2010); Fourth Supplemental Indenture, dated as of February 13, 2013 to Indenture, dated as of November 1, 1993, between PVH Corp. and The Bank of New York Mellon, as Trustee (incorporated by reference to Exhibit 4.11 to our Quarterly Report on Form 10-Q for the period ended May 5, 2013).
|
|
|
|
|
|
4.3
|
|
Indenture, dated as of May 6, 2010, between Phillips-Van Heusen Corporation and U.S. Bank National Association, as Trustee (incorporated by reference to Exhibit 4.15 to our Quarterly Report on Form 10-Q for the period ended August 1, 2010).
|
|
4.4
|
|
First Supplemental Indenture, dated as of November 8, 2012, to Indenture dated as of May 6, 2010, between PVH Corp. (formally known as Phillips-Van Heusen Corporation”) and U.S. Bank National Association, as Trustee (incorporated by reference to Exhibit 4.9 to the Company’s Annual Report on Form 10-K for the fiscal year ended February 3, 2013).
|
|
4.5
|
|
Indenture, dated as of December 20, 2012, between PVH Corp. and U.S. Bank National Association, as Trustee (incorporated by reference to Exhibit 4.1 to our Current Report on Form 8-K, filed on December 20, 2012).
|
|
4.6
|
|
Indenture, dated as of June 20, 2016, between PVH Corp., U.S. Bank National Association, as Trustee, Elavon Financial Services Limited, UK Branch, as Paying Agent and Authenticating Agent, and Elavon Financial Services Limited, as Transfer Agent and Registrar (incorporated by reference to Exhibit 4.1 to our Current Report on Form 8-K, filed on June 20, 2016).
|
|
*10.1
|
|
Phillips-Van Heusen Corporation Capital Accumulation Plan (incorporated by reference to our Current Report on Form 8-K, filed on January 16, 1987); Phillips-Van Heusen Corporation Amendment to Capital Accumulation Plan (incorporated by reference to Exhibit 10(n) to our Annual Report on Form 10-K for the fiscal year ended February 2, 1987); Form of Agreement amending Phillips-Van Heusen Corporation Capital Accumulation Plan with respect to individual participants (incorporated by reference to Exhibit 10(1) to our Annual Report on Form 10-K for the fiscal year ended January 31, 1988); Form of Agreement amending Phillips-Van Heusen Corporation Capital Accumulation Plan with respect to individual participants (incorporated by reference to Exhibit 10.8 to our Quarterly Report on Form 10-Q for the period ended October 29, 1995).
|
|
*10.2
|
|
Phillips-Van Heusen Corporation Supplemental Defined Benefit Plan, dated January 1, 1991, as amended and restated effective as of January 1, 2005 (incorporated by reference to Exhibit 10.3 to our Quarterly Report on Form 10-Q for the period ended November 4, 2007).
|
|
*10.3
|
|
Phillips-Van Heusen Corporation Supplemental Savings Plan, effective as of January 1, 1991 and amended and restated effective as of January 1, 2005 (incorporated by reference to Exhibit 10.4 to our Quarterly Report on Form 10-Q for the period ended November 4, 2007).
|
|
*10.4
|
|
Phillips-Van Heusen Corporation 2003 Stock Option Plan, effective as of May 1, 2003, as amended through September 21, 2006 (incorporated by reference to Exhibit 10.4 to our Quarterly Report on Form 10-Q for the period ended October 29, 2006).
|
|
*10.5
|
|
Phillips-Van Heusen Corporation 2003 Stock Option Plan option certificate (incorporated by reference to Exhibit 10.19 to our Annual Report on Form 10-K for the fiscal year ended January 30, 2005).
|
57
|
*10.6
|
|
Second Amended and Restated Employment Agreement, dated as of December 23, 2008, between Phillips-Van Heusen Corporation and Emanuel Chirico (incorporated by reference to Exhibit 10.15 to our Annual Report on Form 10-K for the fiscal year ended February 1, 2009); First Amendment to Second Amended and Restated Employment Agreement, dated as of January 29, 2010, between Phillips-Van Heusen Corporation and Emanuel Chirico (incorporated by reference to Exhibit 10.1 to our Quarterly Report on Form 10-Q for the period ended May 2, 2010); Second Amendment to Second Amended and Restated Employment Agreement, dated as of May 27, 2010, between Phillips-Van Heusen Corporation and Emanuel Chirico (incorporated by reference to Exhibit 10.6 to our Quarterly Report on Form 10-Q for the period ended August 1, 2010); Third Amendment to Second Amended and Restated Employment Agreement, dated January 28, 2011, between Phillips-Van Heusen Corporation and Emanuel Chirico (incorporated by reference to Exhibit 10.1 to our Current Report on Form 8-K, filed January 28, 2011).
|
|
*10.7
|
|
Second Amended and Restated Employment Agreement, dated as of December 23, 2008, between Phillips-Van Heusen Corporation and Francis K. Duane (incorporated by reference to Exhibit 10.19 to our Annual Report on Form 10-K for the fiscal year ended February 1, 2009); First Amendment to Second Amended and Restated Employment Agreement, dated as of January 29, 2010, between Phillips-Van Heusen Corporation and Francis K. Duane (incorporated by reference to Exhibit 10.3 to our Quarterly Report on Form 10-Q for the period ended May 2, 2010); Second Amendment to Second Amended and Restated Employment Agreement, dated January 28, 2011, between Phillips-Van Heusen Corporation and Francis K. Duane (incorporated by reference to Exhibit 10.3 to our Current Report on Form 8-K, filed January 28, 2011).
|
|
*10.8
|
|
Second Amended and Restated Employment Agreement, dated as of December 23, 2008, between Phillips-Van Heusen Corporation and P. Thomas Murry (incorporated by reference to Exhibit 10.28 to our Annual Report on Form 10-K for the fiscal year ended February 1, 2009); First Amendment to Second Amended and Restated Employment Agreement, dated as of January 29, 2010, between Calvin Klein, Inc. and Paul Thomas Murry (incorporated by reference to Exhibit 10.4 to our Quarterly Report on Form 10-Q for the period ended May 2, 2010); Second Amendment to Second Amended and Restated Employment Agreement, dated January 28, 2011, between Calvin Klein, Inc. and Paul Thomas Murry (incorporated by reference to Exhibit 10.4 to our Current Report on Form 8-K, filed January 28, 2011); Third Amended and Restated Employment Agreement, dated as of July 1, 2013, between Calvin Klein, Inc. and Paul Thomas Murry
(incorporated by reference to Exhibit 10.3 to our Quarterly Report on Form 10-Q for the period ended August 4, 2013); Amendment to Third Amended and Restated Employment Agreement, dated as of March 24, 2014, between Calvin Klein, Inc. and Paul Thomas Murry (incorporated by reference to Exhibit 10.1 to our Current Report on Form 8-K, filed March 25, 2014 (“Date of Report” of March 24, 2014)).
|
|
*10.9
|
|
Second Amended and Restated Employment Agreement, dated as of December 23, 2008, between Phillips-Van Heusen Corporation and Michael Shaffer (incorporated by reference to Exhibit 10.30 to our Annual Report on Form 10-K for the fiscal year ended February 1, 2009); First Amendment to Second Amended and Restated Employment Agreement, dated January 28, 2011, between Phillips-Van Heusen Corporation and Michael Shaffer (incorporated by reference to Exhibit 10.2 to our Current Report on Form 8-K, filed January 28, 2011).
|
|
10.10
|
|
Stock Purchase Agreement, dated as of December 20, 2005, by and among Warnaco, Inc., Fingen Apparel N.V., Fingen S.p.A., Euro Cormar S.p.A. and Calvin Klein, Inc. (incorporated by reference to Exhibit 10.1 to our Current Report on Form 8-K, filed on December 22, 2005).
|
|
*10.11
|
|
PVH Corp. Performance Incentive Bonus Plan, as amended and restated effective May 2, 2013 (incorporated by reference to Exhibit 10.1 to our Current Report on Form 8-K, filed June 26, 2013).
|
|
*10.12
|
|
PVH Corp. Long-Term Incentive Plan, as amended and restated effective May 2, 2013 (incorporated by reference to Exhibit 10.2 to our Current Report on Form 8-K, filed June 26, 2013).
|
|
*10.13
|
|
PVH Corp. 2006 Stock Incentive Plan, as amended and restated effective April 26, 2012 (incorporated by reference to Exhibit 10.1 to our Current Report on Form 8-K, filed on June 25, 2012); PVH Corp. 2006 Stock Incentive Plan, as amended and restated effective May 7, 2014 (incorporated by reference to Exhibit 10.2 to our Quarterly Report on Form 10-Q for the period ended August 3, 2014); PVH Corp. 2006 Stock Incentive Plan, as amended and restated effective April 30, 2015 (incorporated by reference to Exhibit 10.1 to our Current Report on Form 8-K, filed on June 22, 2015).
|
|
*10.14
|
|
Form of Stock Option Agreement for Directors under the Phillips-Van Heusen Corporation 2006 Stock Incentive Plan (incorporated by reference to Exhibit 10.2 to our Current Report on Form 8-K, filed on June 16, 2006); Revised Form of Stock Option Agreement for Directors under the Phillips-Van Heusen Corporation 2006 Stock Incentive Plan (incorporated by reference to Exhibit 10.5 to our Quarterly Report on Form 10-Q for the period ended May 6, 2007).
|
|
*10.15
|
|
Form of Stock Option Agreement for Associates under the Phillips-Van Heusen Corporation 2006 Stock Incentive Plan (incorporated by reference to Exhibit 10.1 to our Current Report on Form 8-K, filed on April 11, 2007); Revised Form of Stock Option Agreement for Associates under the Phillips-Van Heusen Corporation 2006 Stock Incentive Plan (incorporated by reference to Exhibit 10.2 to our Quarterly Report on Form 10-Q for the period ended May 6, 2007).
|
58
|
*10.16
|
|
Form of Restricted Stock Unit Agreement for Associates under the Phillips-Van Heusen Corporation 2006 Stock Incentive Plan (incorporated by reference to Exhibit 10.2 to our Current Report on Form 8-K, filed on April 11, 2007); Revised Form of Restricted Stock Unit Agreement for Associates under the Phillips-Van Heusen Corporation 2006 Corporation Stock Incentive Plan (incorporated by reference to Exhibit 10.3 to our Quarterly Report on Form 10-Q for the period ended May 6, 2007); Revised Form of Restricted Stock Unit Award Agreement for Employees under the Phillips-Van Heusen Corporation 2006 Stock Incentive Plan, effective as of July 1, 2008 (incorporated by reference to Exhibit 10.4 to our Quarterly Report on Form 10-Q for the period ended August 3, 2008); Revised Form of Restricted Stock Unit Award Agreement for Associates under the Phillips-Van Heusen Corporation 2006 Stock Incentive Plan, effective as of September 24, 2008 (incorporated by reference to Exhibit 10.39 to our Annual Report on Form 10-K for the fiscal year ended February 1, 2009).
|
|
*10.17
|
|
Form of Amendment to Outstanding Restricted Stock Unit Award Agreements with Associates under the Phillips-Van Heusen Corporation 2006 Stock Incentive Plan, dated November 19, 2008 (incorporated by reference to Exhibit 10.40 to our Annual Report on Form 10-K for the fiscal year ended February 1, 2009).
|
|
*10.18
|
|
Form of Performance Share Award Agreement under the Phillips-Van Heusen Corporation 2006 Stock Incentive Plan (incorporated by reference to Exhibit 10.1 to our Current Report on Form 8-K, filed on May 8, 2007); Revised Form of Performance Share Award Agreement under the Phillips-Van Heusen Corporation 2006 Stock Incentive Plan, effective as of April 30, 2008 (incorporated by reference to Exhibit 10.2 to our Quarterly Report on Form 10-Q for the period ended May 4, 2008); Revised Form of Performance Share Award Agreement under the Phillips-Van Heusen Corporation 2006 Stock Incentive Plan, effective as of December 16, 2008 (incorporated by reference to Exhibit 10.42 to our Annual Report on Form 10-K for the fiscal year ended February 1, 2009); Revised Form of Performance Share Award Agreement under the PVH Corp. 2006 Stock Incentive Plan, effective as of April 25, 2012 (incorporated by reference to Exhibit 10.3 to our Quarterly Report on Form 10-Q for the period ended April 29, 2012); Alternative Form of Performance Share Unit Award Agreement under the PVH Corp. 2006 Stock Incentive Plan, effective as of May 1, 2013 (incorporated by reference to Exhibit 10.2 to our Quarterly Report on Form 10-Q for the period ended May 5, 2013).
|
|
*10.19
|
|
Revised Form of Restricted Stock Unit Award Agreement for Directors under the Phillips-Van Heusen Corporation 2006 Stock Incentive Plan, effective as of July 1, 2008 (incorporated by reference to Exhibit 10.5 to our Quarterly Report on Form 10-Q for the period ended August 3, 2008); Revised Form of Restricted Stock Unit Award Agreement for Directors under the Phillips-Van Heusen Corporation 2006 Stock Incentive Plan, effective as of September 24, 2008 (incorporated by reference to Exhibit 10.45 to our Annual Report on Form 10-K for the fiscal year ended February 1, 2009); Revised Form of Restricted Stock Unit Award Agreement for Directors under the Phillips-Van Heusen Corporation 2006 Stock Incentive Plan, effective as of June 24, 2010 (incorporated by reference to Exhibit 10.3 to our Quarterly Report on Form 10-Q for the period ended August 1, 2010).
|
|
*10.20
|
|
Form of Amendment to Outstanding Restricted Stock Unit Award Agreements with Directors under the Phillips-Van Heusen Corporation 2006 Stock Incentive Plan, dated November 19, 2008 (incorporated by reference to Exhibit 10.46 to our Annual Report on Form 10-K for the fiscal year ended February 1, 2009).
|
|
*10.21
|
|
Form of Restricted Stock Unit Agreement between Phillips-Van Heusen and Emanuel Chirico (incorporated by reference to Exhibit 10.4 to our Current Report on Form 8-K, filed on July 1, 2009).
|
|
10.22
|
|
Credit and Guaranty Agreement, dated as of February 13, 2013, among PVH Corp., Tommy Hilfiger B.V., certain subsidiaries of PVH Corp., Barclays Bank PLC as Administrative Agent and Collateral Agent, Joint Lead Arranger and Joint Lead Bookrunner, Merrill Lynch, Pierce, Fenner & Smith Incorporated as Co-Syndication Agent, Joint Lead Arranger and Joint Lead Bookrunner, Citigroup Global Markets Inc. as Co-Syndication Agent, Joint Lead Arranger and Joint Lead Bookrunner, Credit Suisse Securities (USA) LLC as Co-Documentation Agent and Joint Lead Bookrunner, Royal Bank of Canada as Co-Documentation Agent, and RBC Capital Markets as Joint Lead Bookrunner (incorporated by reference to Exhibit 10.1 to our Quarterly Report on Form 10-Q for the period ended May 5, 2013); First Amendment to Credit Agreement, dated as of March 21, 2014, entered into by and among PVH Corp., PVH B.V. (formerly known as Tommy Hilfiger B.V.), the Guarantors listed on the signature pages thereto, each Lender party thereto, each Lender Counterparty party thereto, each Issuing Bank party thereto and Barclays Bank PLC, as administrative agent and collateral agent (incorporated by reference to Exhibit 10.1 to our Quarterly Report on Form 10-Q for the period ended May 4, 2014); Second Amendment to Credit Agreement, dated as of May 19, 2016, entered into by and among PVH Corp., PVH B.V., the Guarantors listed on the signature pages thereto, each Lender party thereto, each Issuing Bank party thereto, the Swing Line Lender party thereto and Barclays Bank PLC, as administrative agent and collateral agent (incorporated by reference to Exhibit 10.1 to our Quarterly Report on Form 10-Q for the period ended July 31, 2016).
|
|
*10.23
|
|
Schedule of Non-Management Directors’ Fees, effective June 21, 2012 (incorporated by reference to Exhibit 10.1 to our Quarterly Report on Form 10-Q for the period ended July 29, 2012); Schedule of Non-Management Directors’ Fees, effective June 16, 2016 (incorporated by reference to Exhibit 10.2 to our Quarterly Report on Form 10-Q for the period ended July 31, 2016).
|
59
|
*10.24
|
|
Employment Agreement, dated as of May 6, 2010, between Tommy Hilfiger Group, B.V. and Fred Gehring (incorporated by reference to Exhibit 10.47 to our Annual Report on Form 10-K for the fiscal year ended January 30, 2011); Addendum to Employment Agreement, dated as of December 31, 2010, between Tommy Hilfiger Group, B.V. and Fred Gehring (incorporated by reference to Exhibit 10.48 to our Annual Report on Form 10-K for the fiscal year ended January 30, 2011); Amended and Restated Employment Agreement, dated as of July 23, 2013, between PVH B.V. and Fred Gehring (incorporated by reference to Exhibit 10.4 to our Quarterly Report on Form 10-Q for the period ended August 4, 2013); Amendment to Amended and Restated Employment Agreement, dated as of December 23, 2013, between PVH B.V. and Fred Gehring (incorporated by reference to Exhibit 10.33 to our Annual Report on Form 10-K for the fiscal year ended February 2, 2014); Second Amendment to Amended and Restated Employment Agreement, dated as of May 23, 2014, between PVH B.V. and Fred Gehring (incorporated by reference to Exhibit 10.1 to our Current Report on Form 8-K, filed on June 5, 2014); Third Amendment to Amended and Restated Employment Agreement, dated as of July 31, 2015, between PVH B.V. and Fred Gehring (incorporated by reference to Exhibit 10.2 to our Quarterly Report on Form 10-Q for the period ended August 2, 2015).
|
|
*10.25
|
|
Second Amended and Restated Employment Agreement, dated as of December 16, 2008, between Phillips-Van Heusen Corporation and Steven B. Shiffman (incorporated by reference to Exhibit 10.25 to our Annual Report on Form 10-K for the fiscal year ended February 1, 2015); First Amendment to Second Amended and Restated Employment Agreement, dated as of March 31, 2011, between Phillips-Van Heusen Corporation and Steven B. Shiffman (incorporated by reference to Exhibit 10.26 to our Annual Report on Form 10-K for the fiscal year ended February 1, 2015); Second Amendment to Second Amended and Restated Employment Agreement, dated as of June 1, 2013, between PVH Corp. and Steven B. Shiffman (incorporated by reference to Exhibit 10.27 to our Annual Report on Form 10-K for the fiscal year ended February 1, 2015).
|
|
*10.26
|
|
Employment Contract, dated as of April 22, 2004, between Tommy Hilfiger Europe B.V. and Daniel Grieder (incorporated by reference to Exhibit 10.28 to our Annual Report on Form 10-K for the fiscal year ended February 1, 2015); Addendum to Contract of Employment, dated as of July 8, 2004, between Tommy Hilfiger Europe B.V. and Daniel Grieder (incorporated by reference to Exhibit 10.29 to our Annual Report on Form 10-K for the fiscal year ended February 1, 2015).
|
|
*10.27
|
|
Non-Competition and Non-Solicitation Agreement, dated as of March 10, 2010, between Phillips-Van Heusen Corporation, Tommy Hilfiger Europe and Daniel Grieder (incorporated by reference to Exhibit 10.27 to our Annual Report on Form 10-K for fiscal year ended January 31, 2016).
|
|
*10.28
|
|
European Management Term Sheet, dated as of March 10, 2010, between Phillips-Van Heusen Corporation, Tommy Hilfiger Europe and Daniel Grieder (incorporated by reference to Exhibit 10.28 to our Annual Report on From 10-K for fiscal year ended January 31, 2016).
|
|
+21
|
|
PVH Corp. Subsidiaries.
|
|
+23
|
|
Consent of Independent Registered Public Accounting Firm.
|
|
+31.1
|
|
Certification of Emanuel Chirico, Chairman and Chief Executive Officer, pursuant to Section 302 of the Sarbanes – Oxley Act of 2002.
|
|
+31.2
|
|
Certification of Michael Shaffer, Executive Vice President and Chief Operating & Financial Officer, pursuant to Section 302 of the Sarbanes – Oxley Act of 2002.
|
|
+32.1
|
|
Certification of Emanuel Chirico, Chairman and Chief Executive Officer, pursuant to Section 906 of the Sarbanes – Oxley Act of 2002, 18 U.S.C. Section 1350.
|
|
+32.2
|
|
Certification of Michael Shaffer, Executive Vice President and Chief Operating & Financial Officer, pursuant to Section 906 of the Sarbanes – Oxley Act of 2002, 18 U.S.C. Section 1350.
|
|
+101.INS
|
|
XBRL Instance Document
|
|
+101.SCH
|
|
XBRL Taxonomy Extension Schema Document
|
|
+101.CAL
|
|
XBRL Taxonomy Extension Calculation Linkbase Document
|
|
+101.DEF
|
|
XBRL Taxonomy Extension Definition Linkbase Document
|
|
+101.LAB
|
|
XBRL Taxonomy Extension Label Linkbase Document
|
|
+101.PRE
|
|
XBRL Taxonomy Extension Presentation Linkbase Document
|
________________
|
+
|
Filed or furnished herewith.
|
60
|
*
|
Management contract or compensatory plan or arrangement required to be identified pursuant to Item 15(a)(3) of this report.
|
Exhibits 32.1 and 32.2 shall not be deemed “filed” for purposes of Section 18 of the Securities Exchange Act of 1934, or otherwise subject to the liability of that Section. Such exhibits shall not be deemed incorporated by reference into any filing under the Securities Act of 1933 or the Securities Exchange Act of 1934.
|
(b)
|
Exhibits: See (a)(3) above for a listing of the exhibits included as part of this report.
|
|
(c)
|
Financial Statement Schedules: See page F-1 for a listing of the consolidated financial statement schedules submitted as part of this report.
|
61
None.
62
SIGNATURES
Pursuant to the requirements of Section 13 or 15(d) of the Securities Exchange Act of 1934, the Registrant has duly caused this report to be signed on its behalf by the undersigned, thereunto duly authorized.
Dated:
March 24, 2017
|
|
PVH CORP.
|
|
|
|
|
|
|
|
By:
|
/s/ EMANUEL CHIRICO
|
|
|
|
Emanuel Chirico
|
|
|
|
Chairman and Chief Executive Officer
|
Pursuant to the requirements of the Securities Exchange Act of 1934, this report has been signed below by the following persons on behalf of the Registrant and in the capacities and on the dates indicated.
|
Signature
|
Title
|
Date
|
|
|
|
|
|
/s/ EMANUEL CHIRICO
|
Chairman and Chief Executive Officer
|
March 24, 2017
|
|
Emanuel Chirico
|
(Principal Executive Officer)
|
|
|
|
|
|
|
/s/ MICHAEL SHAFFER
|
Executive Vice President and Chief Operating &
|
March 24, 2017
|
|
Michael Shaffer
|
Financial Officer (Principal Financial Officer)
|
|
|
|
|
|
|
/s/ JAMES W. HOLMES
|
Senior Vice President and Controller
|
March 24, 2017
|
|
James W. Holmes
|
(Principal Accounting Officer)
|
|
|
|
|
|
|
/s/ MARY BAGLIVO
|
Director
|
March 24, 2017
|
|
Mary Baglivo
|
||
|
|
|
|
|
/s/ BRENT CALLINICOS
|
Director
|
March 24, 2017
|
|
Brent Callinicos
|
||
|
/s/ JUAN FIGUEREO
|
Director
|
March 24, 2017
|
|
Juan Figuereo
|
||
|
|
|
|
|
/s/ JOSEPH B. FULLER
|
Director
|
March 24, 2017
|
|
Joseph B. Fuller
|
||
|
|
|
|
|
/s/ V. JAMES MARINO
|
Director
|
March 24, 2017
|
|
V. James Marino
|
||
|
|
|
|
|
/s/ GERALDINE (PENNY) MCINTYRE
|
Director
|
March 24, 2017
|
|
Geraldine (Penny) McIntyre
|
||
|
/s/ HENRY NASELLA
|
Director
|
March 24, 2017
|
|
Henry Nasella
|
||
|
|
|
|
|
/s/ EDWARD ROSENFELD
|
Director
|
March 24, 2017
|
|
Edward Rosenfeld
|
||
|
/s/ CRAIG RYDIN
|
Director
|
March 24, 2017
|
|
Craig Rydin
|
||
|
/s/ JUDITH AMANDA SOURRY KNOX
|
Director
|
March 24, 2017
|
|
Judith Amanda Sourry Knox
|
||
63
Exhibit Index
|
21
|
PVH Corp. Subsidiaries.
|
|
|
|
|
23
|
Consent of Independent Registered Public Accounting Firm.
|
|
|
|
|
31.1
|
Certification of Emanuel Chirico, Chairman and Chief Executive Officer, pursuant to Section 302 of the Sarbanes – Oxley Act of 2002.
|
|
|
|
|
31.2
|
Certification of Michael Shaffer, Executive Vice President and Chief Operating & Financial Officer, pursuant to Section 302 of the Sarbanes – Oxley Act of 2002.
|
|
|
|
|
32.1
|
Certification of Emanuel Chirico, Chairman and Chief Executive Officer, pursuant to Section 906 of the Sarbanes – Oxley Act of 2002, 18 U.S.C. Section 1350.
|
|
|
|
|
32.2
|
Certification of Michael Shaffer, Executive Vice President and Chief Operating & Financial Officer, pursuant to Section 906 of the Sarbanes – Oxley Act of 2002, 18 U.S.C. Section 1350.
|
|
|
|
|
101.INS
|
XBRL Instance Document
|
|
|
|
|
101.SCH
|
XBRL Taxonomy Extension Schema Document
|
|
|
|
|
101.CAL
|
XBRL Taxonomy Extension Calculation Linkbase Document
|
|
|
|
|
101.DEF
|
XBRL Taxonomy Extension Definition Linkbase Document
|
|
|
|
|
101.LAB
|
XBRL Taxonomy Extension Label Linkbase Document
|
|
|
|
|
101.PRE
|
XBRL Taxonomy Extension Presentation Linkbase Document
|
64
FORM 10-K-ITEM 15(a)(1) and 15(a)(2)
PVH CORP.
INDEX TO FINANCIAL STATEMENTS AND FINANCIAL STATEMENT SCHEDULE
|
15(a)(1) The following consolidated financial statements and supplementary data are included in Item 8 of this report:
|
|
|
||
|
|
||
|
|
||
|
|
|
|
|
|
||
|
|
||
|
|
|
|
|
|
||
|
|
|
|
|
|
||
|
|
|
|
|
|
||
|
|
|
|
|
|
||
|
|
|
|
|
15(a)(2) The following consolidated financial statement schedule is included herein:
|
All other schedules for which provision is made in the applicable accounting regulation of the Securities and Exchange Commission are not required under the related instructions or are inapplicable and therefore have been omitted.
F-1
PVH CORP.
CONSOLIDATED INCOME STATEMENTS
(In millions, except per share data)
|
|
2016
|
2015
|
2014
|
||||||||
|
Net sales
|
$
|
7,791.4
|
|
$
|
7,605.5
|
|
$
|
7,849.1
|
|
||
|
Royalty revenue
|
320.6
|
|
324.8
|
|
300.5
|
|
|||||
|
Advertising and other revenue
|
91.1
|
|
90.0
|
|
91.6
|
|
|||||
|
Total revenue
|
8,203.1
|
|
8,020.3
|
|
8,241.2
|
|
|||||
|
Cost of goods sold (exclusive of depreciation and amortization)
|
3,832.8
|
|
3,858.7
|
|
3,914.5
|
|
|||||
|
Gross profit
|
4,370.3
|
|
4,161.6
|
|
4,326.7
|
|
|||||
|
Selling, general and administrative expenses
|
3,636.7
|
|
3,417.7
|
|
3,713.6
|
|
|||||
|
Debt modification and extinguishment costs
|
15.8
|
|
—
|
|
93.1
|
|
|||||
|
Other noncash gain, net
|
71.3
|
|
—
|
|
—
|
|
|||||
|
Equity in net income of unconsolidated affiliates
|
0.1
|
|
16.6
|
|
9.9
|
|
|||||
|
Income before interest and taxes
|
789.2
|
|
760.5
|
|
529.9
|
|
|||||
|
Interest expense
|
120.9
|
|
117.0
|
|
143.5
|
|
|||||
|
Interest income
|
5.9
|
|
4.0
|
|
5.0
|
|
|||||
|
Income before taxes
|
674.2
|
|
647.5
|
|
391.4
|
|
|||||
|
Income tax expense (benefit)
|
125.5
|
|
75.1
|
|
(47.5
|
)
|
|||||
|
Net income
|
548.7
|
|
572.4
|
|
438.9
|
|
|||||
|
Less: Net loss attributable to redeemable non-controlling interest
|
(0.3
|
)
|
—
|
|
(0.1
|
)
|
|||||
|
Net income attributable to PVH Corp.
|
$
|
549.0
|
|
$
|
572.4
|
|
$
|
439.0
|
|
||
|
Basic net income per common share attributable to PVH Corp.
|
$
|
6.84
|
|
$
|
6.95
|
|
$
|
5.33
|
|
||
|
Diluted net income per common share attributable to PVH Corp.
|
$
|
6.79
|
|
$
|
6.89
|
|
$
|
5.27
|
|
||
See notes to consolidated financial statements.
F-2
PVH CORP.
(In millions)
|
2016
|
2015
|
2014
|
|||||||||
|
Net income
|
$
|
548.7
|
|
$
|
572.4
|
|
$
|
438.9
|
|
||
|
Other comprehensive (loss) income:
|
|||||||||||
|
Foreign currency translation adjustments, net of tax benefit of $(0.1), $(0.4) and $(1.7)
|
(21.2
|
)
|
(234.3
|
)
|
(545.7
|
)
|
|||||
|
Amortization of prior service credit related to pension and postretirement plans, net of tax benefit of $(0.2), $(0.2) and $(0.3)
|
(0.2
|
)
|
(0.3
|
)
|
(0.6
|
)
|
|||||
|
Net unrealized and realized gain (loss) related to effective cash flow hedges, net of tax expense (benefit) of $1.2, $(8.4) and $5.6
|
0.7
|
|
(53.1
|
)
|
88.1
|
|
|||||
|
Net gain on net investment hedge, net of tax expense of $8.6 in 2016
|
14.1
|
|
—
|
|
—
|
|
|||||
|
Total other comprehensive loss
|
(6.6
|
)
|
(287.7
|
)
|
(458.2
|
)
|
|||||
|
Comprehensive income (loss)
|
542.1
|
|
284.7
|
|
(19.3
|
)
|
|||||
|
Less: Comprehensive (loss) income attributable to redeemable non-controlling interest
|
(0.3
|
)
|
—
|
|
0.5
|
|
|||||
|
Total comprehensive income (loss) attributable to PVH Corp.
|
$
|
542.4
|
|
$
|
284.7
|
|
$
|
(19.8
|
)
|
||
See notes to consolidated financial statements.
F-3
PVH CORP.
(In millions, except share and per share data)
|
January 29,
2017 |
January 31,
2016 |
||||||
|
ASSETS
|
|
|
|||||
|
Current Assets:
|
|
|
|||||
|
Cash and cash equivalents
|
$
|
730.1
|
|
$
|
556.4
|
|
|
|
Trade receivables, net of allowances for doubtful accounts of $15.0 and $18.1
|
616.0
|
|
657.2
|
|
|||
|
Other receivables
|
25.4
|
|
28.7
|
|
|||
|
Inventories, net
|
1,317.9
|
|
1,322.3
|
|
|||
|
Prepaid expenses
|
133.2
|
|
150.4
|
|
|||
|
Other
|
57.0
|
|
74.8
|
|
|||
|
Assets held for sale
|
—
|
|
14.7
|
|
|||
|
Total Current Assets
|
2,879.6
|
|
2,804.5
|
|
|||
|
Property, Plant and Equipment, net
|
759.9
|
|
744.6
|
|
|||
|
Goodwill
|
3,469.9
|
|
3,219.3
|
|
|||
|
Tradenames
|
2,783.4
|
|
2,802.6
|
|
|||
|
Other Intangibles, net
|
826.6
|
|
843.8
|
|
|||
|
Other Assets, including deferred taxes of $17.4 and $12.2
|
348.5
|
|
259.0
|
|
|||
|
Total Assets
|
$
|
11,067.9
|
|
$
|
10,673.8
|
|
|
|
LIABILITIES, REDEEMABLE NON-CONTROLLING INTEREST AND STOCKHOLDERS’ EQUITY
|
|||||||
|
Current Liabilities:
|
|
|
|
|
|||
|
Accounts payable
|
$
|
682.6
|
|
$
|
636.1
|
|
|
|
Accrued expenses
|
832.4
|
|
696.3
|
|
|||
|
Deferred revenue
|
30.7
|
|
32.3
|
|
|||
|
Short-term borrowings
|
19.1
|
|
25.9
|
|
|||
|
Current portion of long-term debt
|
—
|
|
136.6
|
|
|||
|
Total Current Liabilities
|
1,564.8
|
|
1,527.2
|
|
|||
|
Long-Term Debt
|
3,197.3
|
|
3,031.7
|
|
|||
|
Other Liabilities, including deferred taxes of $877.7 and $836.4
|
1,499.3
|
|
1,562.6
|
|
|||
|
Redeemable Non-Controlling Interest
|
2.0
|
|
—
|
|
|||
|
Stockholders’ Equity:
|
|||||||
|
Preferred stock, par value $100 per share; 150,000 total shares authorized
|
—
|
|
—
|
|
|||
|
Common stock, par value $1 per share; 240,000,000 shares authorized; 83,923,184 and 83,545,818 shares issued
|
83.9
|
|
83.5
|
|
|||
|
Additional paid in capital – common stock
|
2,866.2
|
|
2,822.5
|
|
|||
|
Retained earnings
|
3,098.0
|
|
2,561.2
|
|
|||
|
Accumulated other comprehensive loss
|
(710.8
|
)
|
(704.2
|
)
|
|||
|
Less: 5,371,660 and 2,057,850 shares of common stock held in treasury, at cost
|
(532.8
|
)
|
(210.7
|
)
|
|||
|
Total Stockholders’ Equity
|
4,804.5
|
|
4,552.3
|
|
|||
|
Total Liabilities, Redeemable Non-Controlling Interest and Stockholders’ Equity
|
$
|
11,067.9
|
|
$
|
10,673.8
|
|
|
See notes to consolidated financial statements.
F-4
PVH CORP.
(In millions)
|
|
2016
|
2015
|
2014
|
|||||||||
|
OPERATING ACTIVITIES
|
|
|
|
|||||||||
|
Net income
|
$
|
548.7
|
|
$
|
572.4
|
|
$
|
438.9
|
|
|||
|
Adjustments to reconcile to net cash provided by operating activities:
|
|
|
|
|
|
|
||||||
|
Depreciation and amortization
|
321.8
|
|
257.4
|
|
244.7
|
|
||||||
|
Equity in net income of unconsolidated affiliates
|
(0.1
|
)
|
(16.6
|
)
|
(9.9
|
)
|
||||||
|
Deferred taxes
|
1.3
|
|
(8.7
|
)
|
(31.0
|
)
|
||||||
|
Stock-based compensation expense
|
38.2
|
|
42.0
|
|
48.7
|
|
||||||
|
Impairment of long-lived assets
|
10.1
|
|
11.4
|
|
17.8
|
|
||||||
|
Actuarial (gain) loss on retirement and benefit plans
|
(39.1
|
)
|
(20.2
|
)
|
138.9
|
|
||||||
|
Debt modification and extinguishment costs
|
15.8
|
|
—
|
|
93.1
|
|
||||||
|
Net loss (gain) on deconsolidation of subsidiaries and joint venture
|
81.8
|
|
—
|
|
(8.0
|
)
|
||||||
|
Impairment of goodwill
|
—
|
|
—
|
|
11.9
|
|
||||||
|
Gain to write-up equity investment in joint venture to fair value
|
(153.1
|
)
|
—
|
|
—
|
|
||||||
|
Changes in operating assets and liabilities:
|
|
|
|
|
|
|
||||||
|
Trade receivables, net
|
22.3
|
|
33.2
|
|
(17.4
|
)
|
||||||
|
Inventories, net
|
2.2
|
|
(96.2
|
)
|
(71.7
|
)
|
||||||
|
Accounts payable, accrued expenses and deferred revenue
|
166.9
|
|
58.6
|
|
(41.7
|
)
|
||||||
|
Prepaid expenses
|
19.2
|
|
(21.3
|
)
|
(12.6
|
)
|
||||||
|
Employer pension contributions
|
(100.0
|
)
|
(1.5
|
)
|
(2.7
|
)
|
||||||
|
Other, net
|
18.8
|
|
89.1
|
|
(9.9
|
)
|
||||||
|
Net cash provided by operating activities
|
954.8
|
|
899.6
|
|
789.1
|
|
||||||
|
INVESTING ACTIVITIES
(1)
|
|
|
|
|
|
|
||||||
|
Business acquisitions, net of cash acquired
|
(157.7
|
)
|
—
|
|
(13.5
|
)
|
||||||
|
Purchase of property, plant and equipment
|
(246.6
|
)
|
(263.8
|
)
|
(255.8
|
)
|
||||||
|
Proceeds from sale of building
|
16.7
|
|
—
|
|
—
|
|
||||||
|
Contingent purchase price payments
|
(53.7
|
)
|
(51.3
|
)
|
(51.7
|
)
|
||||||
|
Change in restricted cash
|
—
|
|
20.2
|
|
(10.5
|
)
|
||||||
|
Investments in and advance to unconsolidated affiliates
|
(32.0
|
)
|
(26.6
|
)
|
(26.2
|
)
|
||||||
|
Payment received on advance to unconsolidated affiliate
|
6.2
|
|
—
|
|
—
|
|
—
|
|
||||
|
Loan to a supplier
|
(13.8
|
)
|
—
|
|
—
|
|
||||||
|
Net cash used by investing activities
|
(480.9
|
)
|
(321.5
|
)
|
(357.7
|
)
|
||||||
|
FINANCING ACTIVITIES
(1)
|
|
|
|
|
|
|
||||||
|
Net (payments on) proceeds from short-term borrowings
|
(6.8
|
)
|
17.4
|
|
0.2
|
|
||||||
|
Redemption of 7 3/8% senior notes, including make whole premium
|
—
|
|
—
|
|
(667.6
|
)
|
||||||
|
Proceeds from 2016/2014 facilities, net of related fees
|
571.1
|
|
—
|
|
586.7
|
|
||||||
|
Repayment of Term Loan B in connection with amendment to 2014 facilities
|
(582.0
|
)
|
—
|
|
—
|
|
||||||
|
Repayment of 2016/2014 facilities
|
(350.0
|
)
|
(350.0
|
)
|
(425.5
|
)
|
||||||
|
Proceeds from 3 5/8% senior notes, net of related fees
|
389.6
|
|
—
|
|
—
|
|
||||||
|
Net proceeds from settlement of awards under stock plans
|
13.1
|
|
7.4
|
|
13.0
|
|
||||||
|
Excess tax benefits from awards under stock plans
|
0.9
|
|
5.5
|
|
11.0
|
|
||||||
|
Cash dividends
|
(12.2
|
)
|
(12.5
|
)
|
(12.5
|
)
|
||||||
|
Acquisition of treasury shares
|
(322.1
|
)
|
(138.4
|
)
|
(11.1
|
)
|
||||||
|
Payments of capital lease obligations
|
(7.0
|
)
|
(7.8
|
)
|
(8.7
|
)
|
||||||
|
Contributions from non-controlling interest
|
2.2
|
|
—
|
|
—
|
|
||||||
|
Net cash used by financing activities
|
(303.2
|
)
|
(478.4
|
)
|
(514.5
|
)
|
||||||
|
Effect of exchange rate changes on cash and cash equivalents
|
3.0
|
|
(22.6
|
)
|
(30.8
|
)
|
||||||
|
Increase (decrease) in cash and cash equivalents
|
173.7
|
|
77.1
|
|
(113.9
|
)
|
||||||
|
Cash and cash equivalents at beginning of year
|
556.4
|
|
479.3
|
|
593.2
|
|
||||||
|
Cash and cash equivalents at end of year
|
$
|
730.1
|
|
$
|
556.4
|
|
$
|
479.3
|
|
|||
(1)
See
Note 18
for information on noncash investing and financing transactions.
See notes to consolidated financial statements.
F-5
PVH CORP.
CONSOLIDATED STATEMENTS OF CHANGES IN STOCKHOLDERS’ EQUITY AND REDEEMABLE NON-CONTROLLING INTEREST
(In millions, except share and per share data)
|
Stockholders’ Equity
|
||||||||||||||||||||||||||||||||||
|
Common Stock
|
Additional
Paid In Capital-
Common
Stock
|
Accumulated
Other
Comprehensive Income (Loss)
|
Total Stockholders’ Equity
|
|||||||||||||||||||||||||||||||
|
Redeemable
Non-Controlling
Interest
|
Preferred
Stock
|
Shares
|
$1 par
Value
|
Retained
Earnings
|
Treasury
Stock
|
|||||||||||||||||||||||||||||
|
February 2, 2014
|
$
|
5.6
|
|
$
|
—
|
|
82,679,574
|
|
$
|
82.7
|
|
$
|
2,696.6
|
|
$
|
1,574.8
|
|
$
|
42.3
|
|
$
|
(61.2
|
)
|
$
|
4,335.2
|
|
||||||||
|
Net income attributable to PVH Corp.
|
|
|
|
|
|
|
|
439.0
|
|
|
|
|
|
439.0
|
|
|||||||||||||||||||
|
Amortization of prior service credit related to pension and postretirement plans, net of tax benefit of $(0.3)
|
|
|
|
|
|
|
|
|
|
(0.6
|
)
|
|
|
(0.6
|
)
|
|||||||||||||||||||
|
Foreign currency translation adjustments, net of tax benefit of $(1.7)
|
|
|
|
|
|
|
|
|
|
(546.3
|
)
|
|
|
(546.3
|
)
|
|||||||||||||||||||
|
Net unrealized and realized gain related to effective cash flow hedges, net of tax expense of $5.6
|
|
|
|
|
|
|
|
|
|
88.1
|
|
|
|
88.1
|
|
|||||||||||||||||||
|
Total comprehensive loss attributable to PVH Corp.
|
|
|
|
|
|
|
|
|
|
|
|
|
|
(19.8
|
)
|
|||||||||||||||||||
|
Settlement of awards under stock plans
|
|
436,488
|
|
0.4
|
|
12.6
|
|
|
|
|
|
|
|
13.0
|
|
|||||||||||||||||||
|
Tax benefits from awards under stock plans
|
|
|
|
|
|
10.8
|
|
|
|
|
|
|
|
10.8
|
|
|||||||||||||||||||
|
Stock-based compensation expense
|
|
|
|
|
|
48.7
|
|
|
|
|
|
|
|
48.7
|
|
|||||||||||||||||||
|
Cash dividends
|
|
|
|
|
|
|
|
(12.5
|
)
|
|
|
|
|
(12.5
|
)
|
|||||||||||||||||||
|
Acquisition of 90,780 treasury shares
|
|
|
|
|
|
|
|
|
|
(11.1
|
)
|
(11.1
|
)
|
|||||||||||||||||||||
|
Net loss attributable to redeemable non-controlling interest
|
(0.1
|
)
|
||||||||||||||||||||||||||||||||
|
Foreign currency translation adjustments attributable to redeemable non-controlling interest
|
0.6
|
|
||||||||||||||||||||||||||||||||
|
Deconsolidation of CK India and elimination of related non-controlling interest
|
(6.1
|
)
|
||||||||||||||||||||||||||||||||
|
February 1, 2015
|
—
|
|
—
|
|
83,116,062
|
|
83.1
|
|
2,768.7
|
|
2,001.3
|
|
(416.5
|
)
|
(72.3
|
)
|
4,364.3
|
|
||||||||||||||||
|
Net income attributable to PVH Corp.
|
572.4
|
|
572.4
|
|
||||||||||||||||||||||||||||||
|
Amortization of prior service credit related to pension and postretirement plans, net of tax benefit of $(0.2)
|
(0.3
|
)
|
(0.3
|
)
|
||||||||||||||||||||||||||||||
|
Foreign currency translation adjustments, net of tax benefit of $(0.4)
|
(234.3
|
)
|
(234.3
|
)
|
||||||||||||||||||||||||||||||
|
Net unrealized and realized loss related to effective cash flow hedges, net of tax benefit of $(8.4)
|
(53.1
|
)
|
(53.1
|
)
|
||||||||||||||||||||||||||||||
|
Total comprehensive income attributable to PVH Corp.
|
284.7
|
|
||||||||||||||||||||||||||||||||
|
Settlement of awards under stock plans
|
429,756
|
|
0.4
|
|
7.0
|
|
7.4
|
|
||||||||||||||||||||||||||
|
Tax benefits from awards under stock plans
|
4.8
|
|
4.8
|
|
||||||||||||||||||||||||||||||
|
Stock-based compensation expense
|
42.0
|
|
42.0
|
|
||||||||||||||||||||||||||||||
|
Cash dividends
|
(12.5
|
)
|
(12.5
|
)
|
||||||||||||||||||||||||||||||
|
Acquisition of 1,454,368 treasury shares
|
(138.4
|
)
|
(138.4
|
)
|
||||||||||||||||||||||||||||||
|
January 31, 2016
|
—
|
|
—
|
|
83,545,818
|
|
83.5
|
|
2,822.5
|
|
2,561.2
|
|
(704.2
|
)
|
(210.7
|
)
|
4,552.3
|
|
||||||||||||||||
|
Net income attributable to PVH Corp.
|
549.0
|
|
549.0
|
|
||||||||||||||||||||||||||||||
|
Amortization of prior service credit related to pension and postretirement plans, net of tax benefit of $(0.2)
|
(0.2
|
)
|
(0.2
|
)
|
||||||||||||||||||||||||||||||
|
Foreign currency translation adjustments, net of tax benefit of $(0.1)
|
(21.2
|
)
|
(21.2
|
)
|
||||||||||||||||||||||||||||||
|
Net unrealized and realized gain related to effective cash flow hedges, net of tax expense of $1.2
|
0.7
|
|
0.7
|
|
||||||||||||||||||||||||||||||
|
Net gain on net investment hedge, net of tax expense of $8.6
|
14.1
|
|
14.1
|
|
||||||||||||||||||||||||||||||
|
Total comprehensive income attributable to PVH Corp.
|
542.4
|
|
||||||||||||||||||||||||||||||||
|
Settlement of awards under stock plans
|
377,366
|
|
0.4
|
|
12.7
|
|
13.1
|
|
||||||||||||||||||||||||||
|
Tax deficiency from awards under stock plans
|
(7.2
|
)
|
(7.2
|
)
|
||||||||||||||||||||||||||||||
|
Stock-based compensation expense
|
38.2
|
|
38.2
|
|
||||||||||||||||||||||||||||||
|
Cash dividends
|
(12.2
|
)
|
(12.2
|
)
|
||||||||||||||||||||||||||||||
|
Acquisition of 3,313,810 treasury shares
|
(322.1
|
)
|
(322.1
|
)
|
||||||||||||||||||||||||||||||
|
Acquisition date fair value of redeemable non-controlling interest
|
0.1
|
|
||||||||||||||||||||||||||||||||
|
Contributions from the minority shareholder
|
2.2
|
|
||||||||||||||||||||||||||||||||
|
Net loss attributable to redeemable non-controlling interest
|
(0.3
|
)
|
||||||||||||||||||||||||||||||||
|
January 29, 2017
|
$
|
2.0
|
|
$
|
—
|
|
83,923,184
|
|
$
|
83.9
|
|
$
|
2,866.2
|
|
$
|
3,098.0
|
|
$
|
(710.8
|
)
|
$
|
(532.8
|
)
|
$
|
4,804.5
|
|
||||||||
See notes to consolidated financial statements.
F-6
PVH CORP.
NOTES TO CONSOLIDATED FINANCIAL STATEMENTS
1. SUMMARY OF SIGNIFICANT ACCOUNTING POLICIES
Description of Business
— PVH Corp. and its consolidated subsidiaries (collectively, the “Company”) constitute a global apparel company whose brand portfolio consists of nationally and internationally recognized brand names, including
CALVIN KLEIN
,
Tommy Hilfiger
,
Van Heusen
,
IZOD
,
ARROW
,
Warner’s
,
Olga
and
Eagle
, which are owned, and
Speedo
,
Geoffrey Beene
,
Kenneth Cole New York
,
Kenneth Cole Reaction
,
Sean John
,
MICHAEL Michael Kors
,
Michael Kors Collection
and
Chaps
, which are licensed,
as well as various other owned, licensed and private label brands. The Company designs and markets branded dress shirts, neckwear, sportswear, jeanswear, performance apparel, intimate apparel, underwear, swim products, handbags, accessories, footwear and other related products and licenses its owned brands over a broad range of products.
Principles of Consolidation
— The consolidated financial statements include the accounts of the Company. Intercompany accounts and transactions have been eliminated in consolidation. Investments in entities that the Company does not control but has the ability to exercise significant influence over are accounted for using the equity method of accounting. The Company’s Consolidated Income Statements include its proportionate share of the net income or loss of these entities. Please see
Note 5
, “Investments in Unconsolidated Affiliates,” for a further discussion. During the second quarter of 2016, the Company and Arvind Limited (“Arvind”) formed a joint venture in Ethiopia, PVH Arvind Manufacturing Private Limited Company (“PVH Ethiopia”), in which the Company owns a
75%
interest. PVH Ethiopia is consolidated and the minority shareholder’s proportionate share (
25%
) of the equity in this joint venture is accounted for as a redeemable non-controlling interest. The Company acquired in 2013 a
51%
economic interest in a Calvin Klein joint venture in India, which is now known as Calvin Klein Arvind Fashion Private Limited (“CK India”). CK India was consolidated and the minority shareholder’s proportionate share (
49%
) of the equity in this joint venture was accounted for as a redeemable non-controlling interest. During 2014, Arvind purchased the Company’s prior joint venture partners’ shares in CK India and, as a result of the entry into a shareholder agreement with different governing arrangements between the Company and Arvind than those with the Company’s prior partners, the Company no longer was deemed to hold a controlling interest in the joint venture. CK India was deconsolidated as a result and the Company began reporting its 51% interest as an equity method investment in the first quarter of 2014. Please see
Note 6
, “Redeemable Non-Controlling Interests,” for a further discussion.
Use of Estimates
— The preparation of the consolidated financial statements in conformity with accounting principles generally accepted in the United States requires management to make estimates and assumptions that affect the amounts reported in the consolidated financial statements and accompanying notes. Actual results could differ materially from the estimates.
Fiscal Year
— The Company uses a
52
-
53
week fiscal year ending on the Sunday closest to February 1. References to a year are to the Company’s fiscal year, unless the context requires otherwise. Results for
2016
,
2015
and
2014
represent the 52 weeks ended
January 29, 2017
,
January 31, 2016
and
February 1, 2015
, respectively.
Cash and Cash Equivalents
— The Company considers all highly liquid investments with original maturities of three months or less when purchased to be cash equivalents. Cash equivalents also includes amounts due from third party credit card processors for the settlement of customer debit and credit card transactions that are collectible in one week or less. The Company’s balances of cash and cash equivalents at
January 29, 2017
consisted principally of bank deposits and investments in money market funds.
Accounts Receivable
— Trade receivables, as presented in the Company’s Consolidated Balance Sheets, are net of returns and allowances. An allowance for doubtful accounts is determined through an analysis of the aging of accounts receivable and assessments of collectibility based on historic trends, the financial condition of the Company’s customers and an evaluation of economic conditions. The Company writes off uncollectible trade receivables once collection efforts have been exhausted and third parties confirm the balance is not recoverable. Costs associated with allowable customer markdowns and operational chargebacks, net of the expected recoveries, are part of the provision for allowances included in accounts receivable. These provisions result from seasonal negotiations, as well as historic deduction trends net of expected recoveries, and the evaluation of current market conditions.
F-7
PVH CORP.
NOTES TO CONSOLIDATED FINANCIAL STATEMENTS - (Continued)
Goodwill and Other Intangible Assets
— The Company assesses the recoverability of goodwill annually, at the beginning of the third quarter of each fiscal year, and between annual tests if an event occurs or circumstances change that would indicate that it is more likely than not that the fair value of the reporting unit may have been reduced below its carrying amount. Impairment testing for goodwill is done at a reporting unit level. Under Financial Accounting Standards Board (“FASB”) guidance for goodwill and intangible assets, a reporting unit is defined as an operating segment or one level below the operating segment, called a component. However,
two
or more components of an operating segment will be aggregated and deemed a single reporting unit if the components have similar economic characteristics.
FASB guidance allows the Company to first assess qualitative factors to determine whether it is necessary to perform the more detailed two-step quantitative goodwill impairment test. The Company may elect to bypass the qualitative assessment and proceed directly to the quantitative test for any reporting unit. The quantitative goodwill impairment test, if necessary, is a two-step process. The first step is to identify the existence of a potential impairment by comparing the fair value of a reporting unit (the fair value of a reporting unit is estimated using a discounted cash flow model) with its carrying amount, including goodwill. If the fair value of a reporting unit exceeds its carrying amount, the reporting unit’s goodwill is considered not to be impaired and performance of the second step of the quantitative goodwill impairment test is unnecessary. However, if the carrying amount of a reporting unit exceeds its fair value, the second step of the quantitative goodwill impairment test is performed to measure the amount of impairment loss to be recorded, if any. The second step of the quantitative goodwill impairment test compares the implied fair value of a reporting unit’s goodwill with the carrying amount of that goodwill. If the carrying amount of a reporting unit’s goodwill exceeds its implied fair value, an impairment loss is recognized in an amount equal to that excess. The implied fair value of goodwill is determined using the same approach as employed when determining the amount of goodwill that would be recognized in a business combination. That is, the fair value of the reporting unit is allocated to all of its assets and liabilities as if the reporting unit had been acquired in a business combination and the fair value was the purchase price paid to acquire the reporting unit.
For the 2016 annual goodwill impairment test, the Company elected to first assess qualitative factors to determine whether it was more likely than not that the fair value of any reporting unit was less than its carrying amount as a basis for determining whether it was necessary to perform the two-step goodwill impairment test. In evaluating whether it was more likely than not that the fair value of any reporting unit was less than its carrying amount, the Company assessed relevant events and circumstances including the change in the Company’s market capitalization and its implied impact on reporting unit fair value, industry and market conditions, macroeconomic conditions, trends in product costs and financial performance of the Company’s businesses. After assessing these events and circumstances, the Company determined that it was not more likely than not that the fair value of any reporting unit was less than its carrying amount and concluded that the quantitative goodwill impairment test was not required.
During 2016, and subsequent to the 2016 annual goodwill impairment test, the Company formed a joint venture in Mexico by merging its wholly owned subsidiary that principally operated and managed the Calvin Klein business in Mexico with a wholly owned subsidiary of the joint venture partner, which resulted in the deconsolidation of the Company’s wholly owned subsidiary, including goodwill assigned to the business. This transaction was a triggering event that indicated that the amount of remaining goodwill allocated to the Calvin Klein North America Wholesale, Calvin Klein North America Retail and Heritage Brands Wholesale reporting units could be impaired, prompting the need for the Company to perform a goodwill impairment test for these reporting units in 2016. No goodwill impairment resulted from this interim test in 2016.
For the 2015 annual goodwill impairment test, the Company elected to bypass the qualitative assessment and proceeded directly to the quantitative impairment test using a discounted cash flow method to estimate fair value. The Company’s annual goodwill impairment test during 2015 yielded estimated fair values in excess of the carrying amounts for all of the Company’s reporting units and therefore the second step of the quantitative goodwill impairment test was not required.
During the fourth quarter of 2014, the Company announced its plan to exit the Izod retail business in 2015 (which was completed in the third quarter of 2015). The decision to exit this business was a triggering event that indicated that the amount of goodwill allocated to the Heritage Brands Retail reporting unit could be impaired, prompting the need for the Company to perform a goodwill impairment test for this reporting unit in 2014. As a result of this interim test in 2014, the goodwill allocated to the Heritage Brands Retail reporting unit was determined to be impaired and an impairment charge of $
11.9
million was recorded in selling, general and administrative expenses.
F-8
PVH CORP.
NOTES TO CONSOLIDATED FINANCIAL STATEMENTS - (Continued)
Indefinite-lived intangible assets not subject to amortization are tested for impairment annually, at the beginning of the third quarter of each fiscal year, and between annual tests if an event occurs or circumstances change that would indicate that the carrying amount may be impaired. FASB guidance allows the Company to first assess qualitative factors to determine whether it is necessary to perform a more detailed quantitative impairment test for its indefinite-lived intangible assets. The Company may elect to bypass the qualitative assessment and proceed directly to the quantitative impairment test. When performing the quantitative test, an impairment loss is recognized if the carrying amount of the asset exceeds the fair value of the asset, which is generally determined using the estimated discounted cash flows associated with the asset’s use. Intangible assets with finite lives are amortized over their estimated useful lives and are tested for impairment along with other long-lived assets.
For the 2016 and 2015 annual impairment tests of certain indefinite-lived intangible assets, the Company elected to first assess qualitative factors to determine whether it was more likely than not that the fair value of any asset was less than its carrying amount. In performing this evaluation, the Company assessed relevant events and circumstances including industry and market conditions, macroeconomic conditions, trends in product costs and financial performance of the Company’s businesses. After assessing these events and circumstances, the Company determined that it was not more likely than not that the fair value of these certain indefinite-lived intangible assets were less than their carrying amount and concluded that the quantitative impairment test was not required. For certain other indefinite-lived intangible assets impairment tests, the Company elected to bypass the qualitative assessment and proceeded directly to the quantitative impairment test using a discounted cash flow method to estimate fair value. No impairment of indefinite-lived intangible assets resulted from any of the Company’s annual impairment tests in 2016 and 2015.
Asset Impairments
— The Company reviews for and records impairment losses on long-lived assets (excluding goodwill and other indefinite-lived intangible assets) in accordance with FASB guidance for the impairment or disposal of long-lived assets. The Company records impairment losses when events and circumstances indicate that the assets might be impaired and the carrying amount of the asset is not recoverable and exceeds its fair value. Please see
Note 11
, “Fair Value Measurements” for a further discussion.
Inventories
—
Inventories are comprised principally of finished goods and are stated at the lower of cost or market. Cost for principally all wholesale inventories in North America and certain wholesale and retail inventories in Asia and Latin America is determined using the first-in, first-out method. Cost for all other inventories is determined using the weighted average cost method. The Company reviews current business trends, inventory agings and discontinued merchandise categories to determine adjustments that it estimates will be needed to liquidate existing clearance inventories and record inventories at the lower of cost or market.
Inventory held on consignment by third parties totaled $
19.6
million at
January 29, 2017
and
$19.1
million at
January 31, 2016
. The Company retains the title to its inventory stored at third party facilities.
Property, Plant and Equipment
— Property, plant and equipment is stated at cost less accumulated depreciation. Depreciation is generally provided over the estimated useful lives of the related assets on a straight-line basis. The range of useful lives is principally as follows: Buildings and building improvements —
15
-
40
years; machinery, software and equipment —
2
-
10
years; furniture and fixtures —
2
-
10
years; and fixtures located in third party customer locations (“shop-in-shops”) and their related costs —
3
-4 years. Leasehold improvements are depreciated using the straight-line method over the lesser of the term of the related lease or the estimated useful life of the asset. In certain circumstances, contractual renewal options are considered when determining the term of the related lease. Major additions and betterments are capitalized, and repairs and maintenance are charged to operations in the period incurred. Depreciation expense totaled
$228.4
million,
$210.8
million and
$193.8
million in
2016
,
2015
and
2014
, respectively.
Leases
— The Company leases retail locations, warehouses, showrooms, office space and equipment. Assets held under capital leases are included in property, plant and equipment and are amortized over the lesser of the term of the related lease or the estimated useful life of the asset. The Company accounts for rent expense under non-cancelable operating leases with scheduled rent increases and rent holidays on a straight-line basis over the lease term. The Company determines the lease term at the inception of a lease by assuming the exercise of those renewal options that are reasonably assured because of the significant economic penalty that exists for not exercising those options. The excess of straight-line rent expense over scheduled payments is recorded as a deferred liability. In addition, the Company receives build out contributions from landlords
F-9
PVH CORP.
NOTES TO CONSOLIDATED FINANCIAL STATEMENTS - (Continued)
primarily as an incentive for the Company to lease retail store space from the landlords. Such amounts are amortized as a reduction of rent expense over the life of the related lease.
Revenue Recognition
— Revenue from the Company’s wholesale operations is recognized at the time title to the goods is passed and the risk of loss is transferred to customers. For sales by the Company’s retail stores, revenue is recognized when goods are sold to consumers. Revenue from the Company’s digital commerce transactions is recognized at the estimated time of delivery to the customer. Allowances for estimated returns and discounts are provided when sales are recorded. Royalty revenue for licensees whose sales exceed contractual sales minimums, including licensee contributions toward advertising, is recognized when licensed products are sold as reported by the Company’s licensees. For licensees whose sales do not exceed contractual sales minimums, royalty revenue is recognized ratably based on contractual minimum requirements.
The Company sells gift cards to customers in its retail stores. The Company does not charge administrative fees on gift cards nor do they expire. Upon the purchase of a gift card by a customer, a liability is established for the cash value of the gift card. The liability is relieved and revenue is recognized when the gift card is redeemed by the customer or if the Company determines that the likelihood of the gift card being redeemed is remote (also known as “gift card breakage”) and that it does not have a legal obligation to remit the value of such unredeemed gift card to any jurisdiction. Gift card breakage was immaterial in each of the last three years.
Sales Incentives
— The Company uses certain sales incentive programs related to certain of the Company’s retail operations, such as customer loyalty programs and the issuance of coupons. The Company’s loyalty programs are structured such that customers receive specified amounts off of future purchases for a specified period of time after certain levels of spending are achieved. Costs associated with the Company’s loyalty programs are recorded ratably as a cost of goods sold based on enrolled customers’ spending. Costs associated with coupons are recorded as a reduction of revenue at the time of coupon redemption.
Cost of Goods Sold and Selling, General and Administrative Expenses
— Costs associated with the production and procurement of product are included in cost of goods sold, including inbound freight costs, purchasing and receiving costs, inspection costs and other product procurement related charges. Shipping and handling costs incurred by the Company associated with digital commerce transactions are also included in cost of goods sold. Generally, all other expenses, excluding interest and income taxes, are included in selling, general and administrative expenses, including warehousing and distribution expenses, as the predominant expenses associated therewith are general and administrative in nature, including rent, utilities, payroll and depreciation and amortization. Warehousing and distribution expenses, which are subject to exchange rate fluctuations, totaled $
246.5
million, $
232.4
million and $
250.4
million in 2016, 2015 and 2014, respectively.
Shipping and Handling Fees
— Shipping and handling fees billed to customers are included in net sales.
Advertising
— Advertising costs are expensed as incurred and are included in selling, general and administrative expenses. Costs associated with cooperative advertising programs, under which the Company shares the cost of a customer’s advertising expenditures, are treated as a reduction of revenue. Advertising expenses, which are subject to exchange rate fluctuations, totaled $
416.3
million,
$376.6
million and
$384.6
million in
2016
,
2015
and
2014
, respectively. Prepaid advertising expenses recorded in prepaid expenses and other assets totaled $
7.5
million and
$2.9
million at
January 29, 2017
and
January 31, 2016
, respectively.
Sales Taxes
— The Company accounts for sales taxes and other related taxes on a net basis, excluding such taxes from revenue.
Income Taxes
— Deferred tax assets and liabilities are recognized for temporary differences between the tax bases of assets and liabilities and their reported amounts in the consolidated financial statements. Deferred tax assets and liabilities are measured using enacted tax rates expected to apply in the periods in which those temporary differences are expected to be recovered or settled. The effect on deferred tax assets and liabilities of a change in tax rates is recognized in the period that includes the enactment date. Valuation allowances are established when necessary to reduce deferred tax assets to the amounts more likely than not to be realized.
Significant judgment is required in assessing the timing and amount of deductible and taxable items, evaluating tax positions and in determining the income tax provision. The Company recognizes income tax benefits only when it is more
F-10
PVH CORP.
NOTES TO CONSOLIDATED FINANCIAL STATEMENTS - (Continued)
likely than not that the tax position will be fully sustained upon review by taxing authorities, including resolution of related appeals or litigation processes, if any. If the recognition threshold is met, the Company measures the tax benefit at the largest amount with a greater than
50
percent likelihood of being realized upon ultimate settlement. For tax positions that are
50
percent or less likely of being sustained upon audit, the Company does not recognize any portion of that benefit in the financial statements. When the outcome of these tax matters changes, the change in estimate impacts the provision for income taxes in the period that such a determination is made. The Company recognizes interest and penalties related to unrecognized tax benefits in the Company’s income tax provision.
Financial
Instruments
— The Company has exposure to changes in foreign currency exchange rates related to anticipated cash flows primarily associated with certain international inventory purchases. The Company periodically uses foreign currency forward exchange contracts to hedge against a portion of this exposure. The Company also has exposure to interest rate volatility related to its secured term loan facilities. The Company enters into interest rate swap and cap agreements to hedge against a portion of this exposure. The Company records the foreign currency forward exchange contracts and interest rate contracts at fair value in its Consolidated Balance Sheets, and does not net the related assets and liabilities. The fair value of the foreign currency forward exchange contracts is measured as the total amount of currency to be purchased, multiplied by the difference between (i) the forward rate as of the period end and (ii) the settlement rate specified in each contract. The fair value of the interest rate contracts is based on observable interest rate yield curves and represents the expected discounted cash flows underlying the financial instruments. Changes in fair value of the foreign currency forward exchange contracts primarily associated with certain international inventory purchases and the interest rate contracts that are designated as effective hedging instruments (collectively referred to as “cash flow hedges”) are recorded in equity as a component of accumulated other comprehensive loss (“AOCL”). Any ineffectiveness in such cash flow hedges is immediately recognized in earnings. Cash flows from such hedges are presented in the Consolidated Statements of Cash Flows in the same category as the items being hedged.
The Company also has exposure to changes in foreign currency exchange rates related to the value of its investments in foreign subsidiaries denominated in a currency other than the United States dollar. To hedge against a portion of this exposure, the Company designates certain foreign currency borrowings issued in the United States as a net investment hedge of its investments in certain of its foreign subsidiaries that use a functional currency other than the United States dollar. Changes in fair value of the foreign currency borrowings designated as a net investment hedge are recorded in equity as a component of AOCL. The Company evaluates the effectiveness of its net investment hedge as of the beginning of each quarter. Any ineffectiveness in such net investment hedge is immediately recognized in earnings.
The Company records immediately in earnings changes in the fair value of hedges that are not designated as effective hedging instruments (“undesignated contracts”). Undesignated contracts include all of the foreign currency forward exchange contracts related to intercompany transactions and intercompany loans that are not of a long-term investment nature. Any gains and losses that are immediately recognized in earnings on such contracts are largely offset by the remeasurement of the underlying intercompany balances. Undesignated contracts also include foreign currency option contracts used to hedge against changes in foreign currency exchange rates related to the translation of the earnings of the Company’s subsidiaries that use a functional currency other than the United States dollar. The fair value of the foreign currency option contracts is estimated based on external valuation models, which use the original strike price, current foreign currency exchange rates, the implied volatility in foreign currency exchange rates and length of time to expiration as inputs. The Company does not use derivative or non-derivative financial instruments for trading or speculative purposes. Please see Note 10, “Derivative Financial Instruments” for a further discussion.
Foreign Currency Translation and Transactions
— The consolidated financial statements of the Company are prepared in United States dollars. If the functional currency of a foreign subsidiary is not the United States dollar, assets and liabilities are translated to United States dollars at the exchange rates in effect at the applicable balance sheet date and revenue and expenses are translated to United States dollars at the average exchange rate for the applicable period. Gains and losses on the revaluation of intercompany loans made between foreign subsidiaries that are of a long-term investment nature are included in AOCL. Gains and losses arising from transactions denominated in a currency other than the functional currency of a particular entity, not including inventory purchases, are principally included in selling, general and administrative expenses and totaled a loss of $
4.7
million, $
17.3
million and $
49.8
million in
2016
,
2015
and
2014
, respectively. The transaction loss recorded in 2014 included a loss of $
38.0
million on the revaluation of certain intercompany loans, which was mostly offset by a gain on undesignated foreign currency forward exchange contracts. Please see
Note 10
, “Derivative Financial Instruments” for a further discussion.
F-11
PVH CORP.
NOTES TO CONSOLIDATED FINANCIAL STATEMENTS - (Continued)
Balance Sheet Classification of Early Settlements of Long-Term Obligations
— The Company classifies obligations settled after the balance sheet date but prior to the issuance of the consolidated financial statements based on the contractual payment terms of the underlying agreements.
Pension and Other Postretirement Plans
— Employee pension benefits earned during the year, as well as interest on the projected benefit obligations or accumulated benefit obligations, are accrued quarterly. Prior service costs and credits resulting from changes in plan benefits are generally amortized over the average remaining service period of the employees expected to receive benefits. The expected return on plan assets is recognized quarterly and determined by applying the assumed return on assets to the actual fair value of plan assets adjusted for expected benefit payments, contributions and plan expenses. Actuarial gains and losses are recognized in the Company’s operating results in the year in which they occur. These gains and losses are measured at least annually at the end of the Company’s fiscal year and, as such, are generally recorded during the fourth quarter of each year. Please see
Note 12
, “Retirement and Benefit Plans” for a further discussion of the Company’s pension and other postretirement plans.
Stock
-Based Compensation
—
The Company recognizes all share-based payments to employees and non-employee directors, net of estimated forfeitures, as compensation expense in the consolidated financial statements based on their grant date fair values. Please see
Note 14
, “Stock-Based Compensation” for a further discussion.
Recently Adopted Accounting Guidance
— The FASB issued in April 2015 an update to accounting guidance related to debt issuance costs. The update requires debt issuance costs related to a recognized debt liability to be presented in the balance sheet as a direct deduction from the carrying amount of that debt liability, consistent with the presentation of debt discounts. The Company adopted this update during the first quarter of 2016 on a retrospective basis, which resulted in decreases to prepaid expenses and other assets of $
8.1
million and $
14.5
million, respectively, as of
January 31, 2016
with corresponding decreases in long-term debt.
The FASB issued in April 2015 an update to accounting guidance related to retirement benefits. This update provides a practical expedient which allows a company with fiscal years that do not fall on a calendar month-end to measure defined benefit plan assets and obligations using the month end that is closest to the company’s fiscal year end. If elected, this update should be applied consistently from year to year for all plans. The update became effective for the Company in the first quarter of 2016. Prospective application is required. The Company has not elected to change its measurement date under this update.
Accounting Guidance Issued But Not Adopted as of
January 29, 2017
— The FASB issued in May 2014 guidance that supersedes most of the current revenue recognition requirements. The core principle of the guidance is that an entity should recognize revenue to depict the transfer of promised goods or services to customers in an amount that reflects the consideration to which the entity expects to be entitled in exchange for those goods or services. New disclosures about the nature, amount, timing and uncertainty of revenue and cash flows arising from contracts with customers are also required. In August 2015, the FASB approved a one year delay to the required adoption date of the standard, which makes it effective for the Company no later than the first quarter of 2018, with adoption in 2017 permitted. In 2016, the FASB issued several amendments to clarify various aspects of the implementation guidance. The new standard is required to be applied retrospectively to each prior reporting period (full retrospective method) or retrospectively with the cumulative effect of initially applying the standard recognized as an adjustment to opening retained earnings at the date of initial adoption (modified retrospective method).
The Company formed a global, cross-functional project team to analyze the impacts of the guidance across all of its revenue streams. This included review of current accounting policies and practices to identify potential differences that would result from applying the guidance. The majority of the Company’s revenue is generated from sales of finished products, which will continue to be recognized when control is transferred to the customer. The Company’s assessment included an evaluation of the impact that the guidance will have on the Company’s accounting for royalty and advertising revenue, loyalty programs and gift cards. Under the guidance, the Company’s royalty and advertising revenue will continue to be recognized over time. However, the Company is still assessing the impact of decisions reached by the FASB Transition Resource Group in November 2016 on the treatment of minimum guarantees in licensing arrangements, which may affect the timing of the Company’s recognition of royalty and advertising revenue. For loyalty programs, the Company records costs associated with such programs ratably as a cost of goods sold based on enrolled customers’ spending. Under the guidance, the revenue associated with the loyalty award will be initially deferred when the loyalty awards are earned and recognized, along with the related cost of goods
F-12
PVH CORP.
NOTES TO CONSOLIDATED FINANCIAL STATEMENTS - (Continued)
sold, as the loyalty awards are redeemed or expire. Revenue for the unredeemed portion of gift cards, which is currently recognized when the likelihood of redemption becomes remote, will be recognized under the guidance proportionately over the estimated customer redemption period, subject to the constraint that it must be highly probable that a significant reversal of revenue will not occur. While the Company’s assessment of the impacts of the guidance is still in process, the adoption of the guidance is not expected to have a material impact on the Company’s consolidated financial statements. The Company plans to adopt the standard in the first quarter of 2018 using the modified retrospective method.
The FASB issued in July 2015 an update to accounting guidance to simplify the measurement of inventory. Currently, all inventory is measured at the lower of cost or market. The update requires an entity to measure inventory within the scope of the guidance at the lower of cost or net realizable value. Net realizable value is the estimated selling price in the ordinary course of business less reasonably predictable costs of completion, disposal and transportation. The update does not apply to inventory measured using last-in, first-out or the retail inventory methods. This update will be effective for the Company in the first quarter of 2017. Prospective adoption is required. The adoption is not expected to have a material impact on the Company’s consolidated financial statements.
The FASB issued in January 2016 an update to accounting guidance for the recognition and measurement of financial instruments. The update requires equity investments that are not accounted for under the equity method of accounting to be measured at fair value with changes recognized in net income and updates certain presentation and disclosure requirements. The update will be effective for the Company in the first quarter of 2018 with limited early adoption permitted. The adoption is not expected to have any impact on the Company’s consolidated financial statements as the Company does not currently have such investments.
The FASB issued in February 2016 a new accounting standard on leases. The new standard, among other changes, will require lessees to recognize a right-of-use asset and a lease liability in the balance sheet for most leases. The lease liability will be measured at the present value of the lease payments over the lease term. The right-of-use asset will be measured at the lease liability amount, adjusted for lease prepayments, lease incentives received and the lessee’s initial direct costs (
e.g
., commissions). The guidance will be effective for the Company in the first quarter of 2019 with early adoption permitted. The adoption will require a modified retrospective approach for leases that exist or are entered into after the beginning of the earliest period presented. The Company is currently evaluating the standard to determine the impact of the adoption on the Company’s consolidated financial statements but expects that it will result in a significant increase to its other assets and other liabilities.
The FASB issued in March 2016 an update to accounting guidance to simplify several aspects of accounting for share-based payment award transactions, including the accounting for forfeitures, income taxes and statutory tax withholding requirements, as well as classification of these transactions in the statement of cash flows. The update will be effective for the Company in the first quarter of 2017. The Company has elected not to continue estimating expected forfeitures in determining compensation expense. With respect to the accounting for income taxes, this update requires, on a prospective basis, recognition of excess tax benefits and tax deficiencies (resulting from an increase or decrease in the fair value of an award from grant date to the vesting or exercise date) in the provision for income taxes as a discrete item in the quarterly period in which they occur. Currently, excess tax benefits or tax deficiencies are recognized in equity as a component of Additional Paid in Capital. As such, the adoption of this update is expected to impact the Company’s Consolidated Income Statements and Balance Sheets on a prospective basis. The Company recognized, in equity, a tax deficiency of $
7.2
million and a tax benefit of $
4.8
million in 2016 and 2015, respectively. These amounts may not be indicative of future amounts that may be recognized subsequent to the adoption of this update, as any excess tax benefits or tax deficiencies recognized will be dependent upon unpredictable future events, including the timing of exercises, the value realized upon the vesting or exercise of shares versus the fair value of the shares when they were granted and applicable tax rates. In addition, these excess tax benefits and deficiencies will be classified as an operating activity in the Consolidated Statement of Cash Flows instead of as a financing activity, and such classification will be applied on a retrospective basis to all periods presented. The update also requires that the value of shares withheld from employees upon vesting of stock awards in order to satisfy any applicable tax withholding requirements are to be presented within financing activities in the Consolidated Statement of Cash Flows, which is consistent with the Company’s current presentation, and will therefore have no impact to the Company.
The FASB issued in August 2016 an update to accounting guidance to clarify and provide specific guidance on how certain cash receipts and cash payments are classified in the statement of cash flows with the objective of reducing existing diversity in practice with respect to these items. Among the types of cash flows addressed are payments for costs related to debt prepayments or extinguishments, payments of contingent consideration after a business combination and distributions from
F-13
PVH CORP.
NOTES TO CONSOLIDATED FINANCIAL STATEMENTS - (Continued)
equity method investees. The update will be effective for the Company in the first quarter of 2018, with early adoption permitted. Retrospective adoption is required. Upon adoption, contingent purchase price payments that are currently classified as cash flows from investing activities will be classified as cash flows from operating activities in the Company’s Consolidated Statements of Cash Flows. Otherwise, the adoption of the update is not expected to have a material impact on the Company’s consolidated financial statements.
The FASB issued in October 2016 an update to accounting guidance to simplify income tax accounting on intercompany sales or transfers of assets other than inventory. The existing guidance requires entities to defer the income tax effect of intercompany transfers of assets until the asset has been sold to an outside party or otherwise recognized. The update requires companies to immediately recognize in their income statement the income tax effects of an intercompany sale or transfer of an asset other than inventory. The update will be effective for the Company in the first quarter of 2018, with early adoption permitted as of the beginning of an annual period. Entities are required to apply the update using a modified retrospective approach with a cumulative catch-up adjustment to opening retained earnings in the period of adoption. As of January 29, 2017, the Company had deferred charges of $
7.5
million related to intercompany sales and transfers of assets recorded in other assets. Upon adoption of this update, other assets will be reduced by the then current amount of deferred charges with a corresponding adjustment to opening retained earnings.
The FASB issued in November 2016 an update to accounting guidance to clarify and provide specific guidance on the cash flow classifications and presentation of changes in restricted cash. The update requires that restricted cash be included with cash and cash equivalents when reconciling the beginning of period and end of period total amounts shown in the statement of cash flows. The update will be effective for the Company in the first quarter of 2018, with early adoption permitted. Retrospective adoption is required. The adoption is not expected to have a material impact on the Company’s Consolidated Statement of Cash Flows.
The FASB issued in January 2017 an update to accounting guidance to revise the definition of a business. The update requires that when substantially all of the fair value of the gross assets acquired (or disposed of) is concentrated in a single identifiable asset or a group of identifiable assets, the set of assets would not represent a business. Also, in order to be considered a business, an acquisition would have to include an input and a substantive process that together significantly contribute to the ability to produce outputs. Under the update, fewer sets of assets are expected to be considered businesses. The update will be effective for the Company in the first quarter of 2018, with early adoption permitted. The Company will apply the update to applicable transactions after the adoption date. The impact on the Company’s consolidated financial statements will depend on the facts and circumstances of any specific future transactions.
The FASB issued in January 2017 an update to the accounting guidance to simplify the testing for goodwill impairment. The update eliminates the requirement to calculate the implied fair value of goodwill to measure the amount of impairment loss, if any, under the second step of the current goodwill impairment test. Under the update, the goodwill impairment loss would be measured as the amount by which a reporting unit’s carrying value exceeds its fair value, not to exceed the carrying amount of goodwill. The update will be effective for the Company in the first quarter of 2020, with early adoption permitted for interim or annual goodwill impairment tests performed after January 1, 2017. Prospective adoption is required. The adoption is not expected to have a material impact on the Company’s consolidated financial statements.
2. ACQUISITIONS
Acquisition of TH China
The Company acquired on April 13, 2016 the
55%
of the ownership interests in TH Asia, Ltd. (“TH China”), its former joint venture for
Tommy Hilfiger
in China, that it did not already own (the “TH China acquisition”). Prior to April 13, 2016, the Company accounted for its
45%
interest in TH China under the equity method of accounting. Since the completion of the TH China acquisition, the results of TH China’s operations have been consolidated in the Company’s consolidated financial statements.
TH China began operating the Tommy Hilfiger wholesale and retail distribution businesses in China in 2011 and held a license from a subsidiary of the Company for the
Tommy Hilfiger
trademarks for use in connection with these businesses.
F-14
PVH CORP.
NOTES TO CONSOLIDATED FINANCIAL STATEMENTS - (Continued)
The carrying value of the Company’s
45%
interest in TH China prior to the acquisition was $
52.5
million. In connection with the acquisition, this investment was remeasured to a fair value of $
205.6
million, resulting in the recognition of a pre-tax noncash gain of $
153.1
million during the first quarter of 2016, which was included in other noncash gain, net in the Company’s Consolidated Income Statement for the year ended January 29, 2017. Such fair value was estimated using future operating cash flow projections that were discounted at a rate of
14.4%
, which accounted for the relative risks of the estimated future cash flows. Such fair value also included an estimated discount for a lack of marketability of
10.0%
. The Company classified this as a Level 3 fair value measurement due to the use of these significant unobservable inputs.
The acquisition date fair value of the consideration for the
55%
interest that the Company did not already own was $
265.8
million, consisting of $
263.0
million paid in cash and the elimination of a $
2.8
million pre-acquisition receivable owed to the Company by TH China. Together with the fair value of the Company’s
45%
interest, the total fair value of TH China was $
471.4
million. The estimated fair value of assets acquired and liabilities assumed included net assets of $
102.2
million (including $
105.3
million of cash acquired), $
110.6
million of other intangible assets and $
258.6
million of goodwill. The goodwill of $
258.6
million was assigned to the Company’s Tommy Hilfiger International segment. Goodwill is not expected to be deductible for tax purposes. Please see
Note 7
, “Goodwill and Other Intangible Assets,” for a further discussion. The Company finalized the purchase price allocation during the fourth quarter of 2016.
Acquisition of Russia Franchisee
In 2014, the Company acquired for $
4.3
million
two
Tommy Hilfiger
stores in Russia from a former
Tommy Hilfiger
franchisee. This transaction was accounted for as a business combination.
Acquisition of Ireland Franchisee
In 2014, the Company acquired for
$3.1
million
six
Tommy Hilfiger
stores in Ireland from a former
Tommy Hilfiger
franchisee. This transaction was accounted for as a business combination.
Acquisition of Calvin Klein Performance Retail Businesses in Hong Kong and China
In 2014, the Company acquired for
$6.7
million the Calvin Klein performance retail businesses in Hong Kong and China from a former
CALVIN KLEIN
sublicensee. This transaction was accounted for as a business combination. The adjustment to the purchase price was finalized during 2015.
3. ASSETS HELD FOR SALE
During 2015, one of the Company’s European subsidiaries entered into an agreement to sell a building in Amsterdam, the Netherlands. The Company classified the building as held for sale in the fourth quarter of 2015 and ceased recording depreciation on the building at that time. The building had a carrying value of $
14.7
million as of January 31, 2016, which was determined to be lower than the fair value, less costs to sell, and was included in the Calvin Klein International segment.
The Company completed the sale of the building on July 4, 2016 for proceeds of
€15.0
million (approximately
$16.7
million based on the exchange rate in effect on that date) and recorded a gain of
$1.5
million, which represented the excess of the proceeds, less costs to sell, over the carrying value on that date. The gain was recorded in selling, general and administrative expenses in the Company’s Consolidated Income Statement during the second quarter of 2016 and was included in the Calvin Klein International segment.
F-15
PVH CORP.
NOTES TO CONSOLIDATED FINANCIAL STATEMENTS - (Continued)
4. PROPERTY, PLANT AND EQUIPMENT
Property, plant and equipment, at cost, was as follows:
|
(In millions)
|
2016
|
2015
|
|||||
|
Land
|
$
|
1.1
|
|
$
|
1.1
|
|
|
|
Buildings and building improvements
|
57.4
|
|
53.3
|
|
|||
|
Machinery, software and equipment
|
533.2
|
|
456.0
|
|
|||
|
Furniture and fixtures
|
406.0
|
|
370.3
|
|
|||
|
Shop-in-shops
|
164.1
|
|
146.8
|
|
|||
|
Leasehold improvements
|
622.5
|
|
576.1
|
|
|||
|
Construction in progress
|
30.0
|
|
33.3
|
|
|||
|
Property, plant and equipment, gross
|
1,814.3
|
|
1,636.9
|
|
|||
|
Less: Accumulated depreciation
|
(1,054.4
|
)
|
(892.3
|
)
|
|||
|
Property, plant and equipment, net
|
$
|
759.9
|
|
$
|
744.6
|
|
|
Construction in progress at
January 29, 2017
and
January 31, 2016
represents costs incurred for machinery, software and equipment, furniture and fixtures and leasehold improvements not yet placed in use, principally related to the construction of retail stores. Interest costs capitalized in construction in progress were immaterial during
2016
,
2015
and
2014
.
5. INVESTMENTS IN UNCONSOLIDATED AFFILIATES
Karl Lagerfeld
The Company acquired an economic interest of approximately
10%
in the parent company of the
Karl Lagerfeld
brand (“Karl Lagerfeld”) during 2014 for $
18.9
million. During 2016, a third party acquired a minority stake in Karl Lagerfeld, diluting the Company’s economic interest to approximately
8%
. The Company has significant influence as defined under FASB guidance with respect to this investment, which is being accounted for under the equity method of accounting.
PVH Australia
The Company formed a joint venture, PVH Brands Australia Pty. Limited (“PVH Australia”), in 2013 with Gazal Corporation Limited (“Gazal”), in which the Company owns a
50%
economic interest. PVH Australia has licensed from a subsidiary of the Company since the first quarter of 2014 the rights to distribute and sell certain
CALVIN KLEIN
brand products in Australia, New Zealand and other island nations in the South Pacific. As part of the transaction, the Company contributed to PVH Australia its subsidiaries that were operating the Calvin Klein Jeans businesses in Australia and New Zealand (the “Australia business”). In connection with this contribution, which took place on the first day of 2014, the Company deconsolidated the contributed subsidiaries and recognized a net gain of $
2.1
million during the first quarter of 2014, which was recorded in selling, general and administrative expenses. The gain was measured as the difference between the fair value of the Company’s
50%
interest in PVH Australia and the carrying value of the net assets and cash contributed. The fair value of PVH Australia was determined using the discounted cash flow method, based on net sales projections for the Calvin Klein business in Australia, New Zealand and other island nations in the South Pacific, discounted using a rate of return that accounted for the relative risks of the estimated future cash flows.
The Company completed a transaction in 2015 in which the
Tommy Hilfiger
and
Van Heusen
trademarks were licensed for certain product categories to subsidiaries of PVH Australia for use in Australia, New Zealand and, in the case of
Tommy Hilfiger
, other island nations in the South Pacific. The
Tommy Hilfiger
trademarks had previously been licensed to a third party and the
Van Heusen
trademarks had previously been licensed to Gazal. Additionally, subsidiaries of PVH Australia license other trademarks for certain product categories.
The Company made net payments of $
21.0
million (of which $
20.2
million was placed into an escrow account prior to the end of 2014) and $
7.3
million to PVH Australia during
2015
and
2014
, respectively, to contribute its
50%
share of the joint venture funding for the periods. This investment is being accounted for under the equity method of accounting.
F-16
PVH CORP.
NOTES TO CONSOLIDATED FINANCIAL STATEMENTS - (Continued)
The Company received a $
1.5
million dividend from PVH Australia during 2016.
Gazal
The Company acquired approximately
10%
of the outstanding capital stock of Gazal, which is listed on the Australian Securities Exchange, during the third quarter of 2016 for approximately $
9.2
million. The Company has significant influence as defined under FASB guidance with respect to this investment, which is being accounted for under the equity method of accounting. Gazal is also the Company’s joint venture partner in PVH Australia.
CK India
The Company acquired a
51%
economic interest in CK India in 2013. CK India licenses from a subsidiary of the Company the rights to the
CALVIN KLEIN
trademarks in India for certain product categories. CK India was consolidated in the Company’s financial statements during 2013. During the first quarter of 2014, Arvind purchased the Company’s prior joint venture partners’ shares in CK India and, as a result of the entry into a shareholder agreement with different governing arrangements between the Company and Arvind than those with the Company’s prior partners, the Company no longer was deemed to hold a controlling interest in the joint venture. CK India was deconsolidated as a result and the Company began reporting its
51%
interest as an equity method investment in the first quarter of 2014. Please see
Note 6
, “Redeemable Non-Controlling Interests,” for a further discussion.
The Company made payments of $
1.5
million and $
4.0
million to CK India during 2016 and 2015, respectively, to contribute its
51%
share of the joint venture funding for the periods.
TH Brazil
The Company formed a joint venture, Tommy Hilfiger do Brasil S.A. (“TH Brazil”), in Brazil in 2012, in which the Company owns a
40%
economic interest. TH Brazil licenses from a subsidiary of the Company the rights to the
Tommy Hilfiger
trademarks in Brazil for certain product categories. This investment is being accounted for under the equity method of accounting.
The Company made payments of $
1.5
million and $
1.6
million to TH Brazil during 2016 and 2015, respectively, to contribute its
40%
share of the joint venture funding for the periods.
The Company issued a note receivable due April 2, 2017 to TH Brazil during the third quarter of 2016 for $
12.5
million, of which $
6.2
million was repaid during the fourth quarter of 2016. As of
January 29, 2017
, the interest rate on the note was
13.00%
and the outstanding balance, including accrued interest, was $
7.0
million.
TH India
The Company acquired in 2011 a
50%
economic interest in a company that has since been renamed Tommy Hilfiger Arvind Fashion Private Limited (“TH India”). TH India licenses from a subsidiary of the Company the rights to the
Tommy Hilfiger
trademarks in India for certain product categories. This investment is being accounted for under the equity method of accounting. Arvind, the Company’s joint venture partner in PVH Ethiopia and in CK India, is also the Company’s joint venture partner in TH India.
TH China
The Company formed TH China as a joint venture in 2010. This investment was accounted for under the equity method of accounting until April 13, 2016, on which date the Company acquired the
55%
of the ownership interests in TH China that it did not already own. Please see
Note 2
, “Acquisitions,” for a further discussion.
F-17
PVH CORP.
NOTES TO CONSOLIDATED FINANCIAL STATEMENTS - (Continued)
PVH Mexico
The Company and Grupo Axo, S.A.P.I. de C.V. (“Grupo Axo”) formed a joint venture (“PVH Mexico”) in the fourth quarter of 2016, in which the Company owns a
49%
economic interest. PVH Mexico licenses from certain wholly owned subsidiaries of the Company the rights to distribute and sell certain
CALVIN KLEIN
,
Tommy Hilfiger
,
Warner’s
,
Olga
and
Speedo
brand products in Mexico. PVH Mexico was formed by merging the Company’s wholly owned subsidiary that principally operated and managed the Calvin Klein business in Mexico (the “Mexico business”) with a wholly owned subsidiary of Grupo Axo that distributes certain
Tommy Hilfiger
brand products in Mexico. In connection with the formation of PVH Mexico, the Company deconsolidated the Mexico business (the “Mexico deconsolidation”) and began accounting for its
49%
interest under the equity method of accounting in the fourth quarter of 2016.
In connection with the Mexico deconsolidation, the Company recorded a pre-tax noncash loss of $
81.8
million in 2016 (including $
56.7
million related to foreign currency translation adjustment losses previously recorded in AOCL) to write down the net assets of the Mexico business to fair value. The loss was included in other noncash gain, net in the Company’s Consolidated Income Statement for the year ended January 29, 2017. The fair value of the net assets of $
64.3
million was estimated as the fair value of the
49%
interest in PVH Mexico that the Company acquired upon its formation, based on future operating cash flow projections that were discounted at a rate of
15.0%
, which accounted for the relative risks of the estimated future cash flows. Such fair value also included an estimated discount for a lack of marketability of
10.0%
. The Company classified this as a Level 3 fair value measurement due to the use of these significant unobservable inputs.
The Company made payments of $
7.3
million to PVH Mexico during 2016, to contribute its
49%
share of the joint venture funding for the period.
Total Investments in Unconsolidated Affiliates
Included in other assets in the Company’s Consolidated Balance Sheets as of
January 29, 2017
and
January 31, 2016
is $
180.0
million (of which $
7.0
million is related to the note receivable due from TH Brazil) and
$140.7
million (of which $
52.9
million related to TH China), respectively, related to these investments in unconsolidated affiliates.
6. REDEEMABLE NON-CONTROLLING INTERESTS
PVH Ethiopia
During the second quarter of 2016, the Company and Arvind formed PVH Ethiopia in which the Company owns a
75%
interest. The Company has consolidated the joint venture in its consolidated financial statements. PVH Ethiopia was formed to operate a manufacturing facility that will produce finished products for the Company for distribution primarily in the United States. The Company expects the manufacturing facility will begin operations in the first half of 2017.
The shareholders agreement entered into by the parties to the joint venture (the “Shareholders Agreement”) contains a put option under which Arvind can require the Company to purchase all of its shares in the joint venture during various future periods as specified in the Shareholders Agreement. The first such period immediately precedes the ninth anniversary of the date of incorporation of PVH Ethiopia. The Shareholders Agreement also contains call options under which the Company can require Arvind to sell to the Company (i) all or a portion of its shares during various future periods as specified in the Shareholders Agreement; (ii) all of its shares in the event of a change of control of Arvind; or (iii) all of its shares in the event that Arvind ceases to hold at least
ten percent
of the outstanding shares. The Company’s first call option referred to in clause (i) immediately follows the fifth anniversary of the date of incorporation of PVH Ethiopia. The put and call prices are the fair market value of the shares on the redemption date based upon a multiple of the joint venture’s earnings before interest, taxes, depreciation and amortization for the prior 12 months, less the joint venture’s net debt.
The fair value of the redeemable non-controlling interest (“RNCI”) as of the date of formation of the joint venture was $
0.1
million. The carrying amount of the RNCI is adjusted to equal the redemption amount at the end of each reporting period, provided that this amount at the end of each reporting period cannot be lower than the initial fair value adjusted for the minority shareholder’s share of net income or loss. Any adjustment to the redemption amount of the RNCI is determined after attribution of net income of the RNCI and will be recognized immediately in retained earnings of the Company, since it is probable that the RNCI will become redeemable in the future based on the passage of time. The carrying amount of the RNCI, which is also its
F-18
PVH CORP.
NOTES TO CONSOLIDATED FINANCIAL STATEMENTS - (Continued)
fair value, increased to $
2.0
million as of January 29, 2017, principally attributable to additional contributions of $
2.2
million made by Arvind during 2016 for its proportionate share of the joint venture funding.
CK India
During the first quarter of 2014, CK India was deconsolidated, as discussed in
Note 5
, “Investments in Unconsolidated Affiliates.” The Company recognized a net gain of
$5.9
million in connection with the deconsolidation of CK India during the first quarter of 2014 that was recorded in selling, general and administrative expenses in the Company’s Consolidated Income Statement. The gain was measured as the difference between the fair value of the Company’s
51%
interest in CK India and the carrying value. The fair value of CK India was determined using the discounted cash flow method, based on net sales projections for the Calvin Klein business in India and was discounted using a rate of return that accounted for the relative risks of the estimated future cash flows.
7. GOODWILL AND OTHER INTANGIBLE ASSETS
The changes in the carrying amount of goodwill, by segment (please see Note 19, “Segment Data,” for a further discussion of the Company’s reportable segments), were as follows:
|
(In millions)
|
Calvin Klein North America
|
Calvin Klein International
|
Tommy Hilfiger North America
|
Tommy Hilfiger International
|
Heritage Brands Wholesale
|
Heritage Brands Retail
|
Total
|
||||||||||||||||||||
|
Balance as of February 1, 2015
|
|||||||||||||||||||||||||||
|
Goodwill, gross
|
$
|
705.4
|
|
$
|
859.6
|
|
$
|
204.4
|
|
$
|
1,251.4
|
|
$
|
238.3
|
|
$
|
11.9
|
|
$
|
3,271.0
|
|
||||||
|
Accumulated impairment losses
|
—
|
|
—
|
|
—
|
|
—
|
|
—
|
|
(11.9
|
)
|
(11.9
|
)
|
|||||||||||||
|
Goodwill, net
|
705.4
|
|
859.6
|
|
204.4
|
|
1,251.4
|
|
238.3
|
|
—
|
|
3,259.1
|
|
|||||||||||||
|
Contingent purchase price payments to Mr. Calvin Klein
|
31.2
|
|
20.5
|
|
—
|
|
—
|
|
—
|
|
—
|
|
51.7
|
|
|||||||||||||
|
Currency translation and other
|
(8.6
|
)
|
(38.6
|
)
|
—
|
|
(43.0
|
)
|
(1.3
|
)
|
—
|
|
(91.5
|
)
|
|||||||||||||
|
Balance as of January 31, 2016
|
|||||||||||||||||||||||||||
|
Goodwill, gross
|
728.0
|
|
841.5
|
|
204.4
|
|
1,208.4
|
|
237.0
|
|
11.9
|
|
3,231.2
|
|
|||||||||||||
|
Accumulated impairment losses
|
—
|
|
—
|
|
—
|
|
—
|
|
—
|
|
(11.9
|
)
|
(11.9
|
)
|
|||||||||||||
|
Goodwill, net
|
728.0
|
|
841.5
|
|
204.4
|
|
1,208.4
|
|
237.0
|
|
—
|
|
3,219.3
|
|
|||||||||||||
|
Contingent purchase price payments to Mr. Calvin Klein
|
31.3
|
|
21.3
|
|
—
|
|
—
|
|
—
|
|
—
|
|
52.6
|
|
|||||||||||||
|
TH China acquisition
|
—
|
|
—
|
|
—
|
|
258.6
|
|
—
|
|
—
|
|
258.6
|
|
|||||||||||||
|
Mexico deconsolidation
|
(20.5
|
)
|
—
|
|
—
|
|
—
|
|
(1.0
|
)
|
—
|
|
(21.5
|
)
|
|||||||||||||
|
Currency translation and other
|
0.6
|
|
1.7
|
|
—
|
|
(41.2
|
)
|
(0.2
|
)
|
—
|
|
(39.1
|
)
|
|||||||||||||
|
Balance as of January 29, 2017
|
|||||||||||||||||||||||||||
|
Goodwill, gross
|
739.4
|
|
864.5
|
|
204.4
|
|
1,425.8
|
|
235.8
|
|
11.9
|
|
3,481.8
|
|
|||||||||||||
|
Accumulated impairment losses
|
—
|
|
—
|
|
—
|
|
—
|
|
—
|
|
(11.9
|
)
|
(11.9
|
)
|
|||||||||||||
|
Goodwill, net
|
$
|
739.4
|
|
$
|
864.5
|
|
$
|
204.4
|
|
$
|
1,425.8
|
|
$
|
235.8
|
|
$
|
—
|
|
$
|
3,469.9
|
|
||||||
The Company is required to make contingent purchase price payments to Mr. Calvin Klein in connection with the Company’s acquisition in 2003 of all of the issued and outstanding stock of Calvin Klein, Inc. and certain affiliated companies (collectively, “Calvin Klein”). Such payments are based on
1.15%
of total worldwide net sales, as defined in the acquisition agreement (as amended), of products bearing any of the
CALVIN KLEIN
brands and are required to be made with respect to sales made through February 12, 2018. A significant portion of the sales on which the payments to Mr. Klein are made are wholesale sales by the Company and its licensees and other partners to retailers.
F-19
PVH CORP.
NOTES TO CONSOLIDATED FINANCIAL STATEMENTS - (Continued)
The Company’s intangible assets consisted of the following:
|
|
January 29, 2017
|
January 31, 2016
|
|||||||||||||||||||||
|
(In millions)
|
Gross
Carrying
Amount
|
Accumulated
Amortization
|
Net
|
Gross
Carrying
Amount
|
Accumulated
Amortization
|
Net
|
|||||||||||||||||
|
Intangible assets subject to amortization:
|
|||||||||||||||||||||||
|
Customer relationships
(1) (2)
|
$
|
296.7
|
|
$
|
(130.8
|
)
|
$
|
165.9
|
|
$
|
291.9
|
|
$
|
(108.7
|
)
|
$
|
183.2
|
|
|||||
|
Order backlog
(1)
|
24.6
|
|
(24.6
|
)
|
—
|
|
—
|
|
—
|
|
—
|
|
|||||||||||
|
Reacquired license rights
(1) (2)
|
524.7
|
|
(78.1
|
)
|
446.6
|
|
494.8
|
|
(47.7
|
)
|
447.1
|
|
|||||||||||
|
Total intangible assets subject to amortization
|
846.0
|
|
(233.5
|
)
|
612.5
|
|
786.7
|
|
(156.4
|
)
|
630.3
|
|
|||||||||||
|
Indefinite-lived intangible assets:
|
|||||||||||||||||||||||
|
Tradenames
|
2,783.4
|
|
—
|
|
2,783.4
|
|
2,802.6
|
|
—
|
|
2,802.6
|
|
|||||||||||
|
Perpetual license rights
|
203.9
|
|
—
|
|
203.9
|
|
203.1
|
|
—
|
|
203.1
|
|
|||||||||||
|
Reacquired perpetual license rights
|
10.2
|
|
—
|
|
10.2
|
|
10.4
|
|
—
|
|
10.4
|
|
|||||||||||
|
Total indefinite-lived intangible assets
|
2,997.5
|
|
—
|
|
2,997.5
|
|
3,016.1
|
|
—
|
|
3,016.1
|
|
|||||||||||
|
Total intangible assets
|
$
|
3,843.5
|
|
$
|
(233.5
|
)
|
$
|
3,610.0
|
|
$
|
3,802.8
|
|
$
|
(156.4
|
)
|
$
|
3,646.4
|
|
|||||
The gross carrying amount and accumulated amortization of certain intangible assets include the impact of changes in foreign currency exchange rates.
|
(1)
|
The change from January 31, 2016 to January 29, 2017 primarily related to intangible assets recorded in connection with the TH China acquisition. The intangible assets as of the acquisition date amounted to $
110.6
million and included reacquired license rights of $
72.0
million, order backlog of $
26.2
million and customer relationships of $
12.4
million, which are subject to amortization on a straight-line basis over 2.7 years, 0.8 years and 10.0 years, respectively, and exchange rate fluctuations after the acquisition date.
|
|
(2)
|
The change from January 31, 2016 to January 29, 2017 included decreases to customer relationships and reacquired license rights for the net amounts of $
3.3
million and $
44.1
million, respectively, in connection with the Mexico deconsolidation.
|
Amortization expense related to the Company’s amortizable intangible assets was
$86.2
million and
$40.3
million for
2016
and
2015
, respectively.
Assuming constant foreign currency exchange rates and no change in the gross carrying amount of the intangible assets, amortization expense for the next five years related to the Company’s amortizable intangible assets as of
January 29, 2017
is expected to be as follows:
|
(In millions)
|
||||
|
Fiscal Year
|
Amount
|
|||
|
2017
|
$
|
63.3
|
|
|
|
2018
|
60.8
|
|
||
|
2019
|
38.4
|
|
||
|
2020
|
38.3
|
|
||
|
2021
|
38.1
|
|
||
F-20
PVH CORP.
NOTES TO CONSOLIDATED FINANCIAL STATEMENTS - (Continued)
8. DEBT
Short-Term Borrowings
One of the Company’s Asian subsidiaries has a yen-denominated short-term line of credit and a yen-denominated overdraft facility with a Japanese bank that together provide for borrowings of up to
¥2,200.0
million (approximately
$19.1
million based on exchange rates in effect on
January 29, 2017
) and are utilized primarily to fund working capital needs. Borrowings under the short-term line of credit bear interest at the one-month Tokyo interbank offered rate plus
0.15%
. As of
January 29, 2017
, the Company had
$17.4
million of borrowings outstanding under these facilities. The weighted average interest rate on the funds borrowed at
January 29, 2017
was
0.19%
. The maximum amount of borrowings outstanding under these facilities during 2016 was ¥
2,000
million (approximately $
17.4
million based on exchange rates in effect on
January 29, 2017
).
One of the Company’s Asian subsidiaries has a won-denominated overdraft facility with a South Korean bank that provides for borrowings of up to ₩
3,500.0
million (approximately $
3.0
million based on exchange rates in effect on January 29, 2017) and is utilized primarily to fund working capital needs. Borrowings under this facility are unsecured and bear interest at the South Korean bank three-month certificate of deposit rate plus
1.50%
. There were no borrowings outstanding under this facility as of or during the year ended January 29, 2017.
One of the Company’s Asian subsidiaries has a United States dollar-denominated short-term revolving credit facility with a bank that provides for borrowings of up to $
10.0
million and is utilized primarily to fund working capital needs. Borrowings under this facility bear interest at the one-month London interbank borrowing rate (“LIBOR”) plus
1.50%
. At the end of each month, amounts outstanding under this facility may be carried forward for additional one-month periods for up to one year. This facility is subject to certain terms and conditions and may be terminated at any time at the discretion of the bank. There were no borrowings outstanding under this facility as of or during the year ended January 29, 2017.
One of the Company’s European subsidiaries has a euro-denominated short-term revolving note and a euro-denominated overdraft facility with a bank that together provide for borrowings of up to
€40.0
million (approximately
$42.7
million based on exchange rates in effect on
January 29, 2017
) and are utilized primarily to fund working capital needs. Borrowings under the revolving note bear interest at the one-month Euro Interbank Offered Rate (“EURIBOR”) plus
1.50%
. There were no borrowings outstanding under these facilities as of or during the year ended
January 29, 2017
.
One of the Company’s European subsidiaries has a United States dollar-denominated short-term line of credit facility with a bank that provides for borrowings of up to $
3.4
million and is utilized primarily to fund working capital needs. Borrowings under this facility bear interest at
13.50%
. As of
January 29, 2017
, the Company had $
0.4
million of borrowings outstanding under this facility, which represented the maximum amount of borrowings outstanding under this facility during 2016.
One of the Company’s European subsidiaries has a United States dollar-denominated short-term line of credit facility with a Turkish bank that provides for borrowings of up to
$3.7
million and is utilized primarily to fund working capital needs. Borrowings under this facility bear interest at the Turkish overnight lending rate plus
3.00%
. As of January 29, 2017, the Company had $
1.3
million of borrowings outstanding under this facility. The weighted average interest rate on the funds borrowed at January 29, 2017 was
13.50%
. The maximum amount of borrowings outstanding under this facility during 2016 was $
3.3
million.
One of the Company’s European subsidiaries has a Turkish lira-denominated short-term line of credit facility with a Turkish bank that provides for borrowings of up to lira
2.6
million (approximately $
0.7
million based on exchange rates in effect on January 29, 2017) and is utilized primarily to fund working capital needs. Borrowings under this facility bear interest at the Turkish overnight lending rate plus
4.00%
. As of January 29, 2017, the Company had no borrowings outstanding under this facility. The maximum amount of borrowings outstanding under this facility during 2016 was equal to the maximum amount of borrowings available under this facility.
One of the Company’s Latin American subsidiaries has a Brazilian real-denominated short-term revolving credit facility with a Brazilian bank that provides for borrowings of up to R
$25.0
million (approximately
$7.9
million based on exchange rates in effect on
January 29, 2017
) and is utilized primarily to fund working capital needs. Borrowings under this facility are unsecured. There were no borrowings outstanding under this facility as of or during the year ended
January 29, 2017
.
F-21
PVH CORP.
NOTES TO CONSOLIDATED FINANCIAL STATEMENTS - (Continued)
The Company also has the ability to draw revolving borrowings under its senior secured credit facilities as discussed in the section entitled “2016 Senior Secured Credit Facilities” below. As of January 29, 2017, the Company had no borrowings outstanding under these facilities. The maximum amount of revolving borrowings outstanding under these facilities during 2016 was
$15.3
million.
Long-Term Debt
The carrying amounts of the Company’s long-term debt were as follows:
|
(In millions)
|
2016
|
2015
|
|||||
|
Senior secured Term Loan A facility due 2021
|
$
|
2,039.9
|
|
$
|
1,804.6
|
|
|
|
Senior secured Term Loan B facility
|
—
|
|
575.5
|
|
|||
|
4 1/2% senior unsecured notes due 2022
|
690.4
|
|
688.8
|
|
|||
|
7 3/4% debentures due 2023
|
99.5
|
|
99.4
|
|
|||
|
3 5/8% senior unsecured euro notes due 2024
|
367.5
|
|
—
|
|
|||
|
Total
|
3,197.3
|
|
3,168.3
|
|
|||
|
Less: Current portion of long-term debt
|
—
|
|
136.6
|
|
|||
|
Long-term debt
|
$
|
3,197.3
|
|
$
|
3,031.7
|
|
|
Please see
Note 11
, “Fair Value Measurements,” for the fair value of the Company’s long-term debt as of
January 29, 2017
and
January 31, 2016
.
As of
January 29, 2017
, the Company’s mandatory long-term debt repayments for the next five years were as follows:
|
(In millions)
|
|||
|
Fiscal Year
|
Amount
|
||
|
2017
|
$
|
—
|
|
|
2018
|
68.7
|
|
|
|
2019
|
220.1
|
|
|
|
2020
|
234.7
|
|
|
|
2021
|
1,525.8
|
|
|
Total debt repayments for the next five years exceed the carrying amount of the Company’s Term Loan A facility as of January 29, 2017 because the carrying amount reflects the unamortized portions of debt issuance costs and the original issue discounts.
As of January 29, 2017, after taking into account the effect of the Company’s interest rate swap agreements discussed in the section below entitled “2016 Senior Secured Credit Facilities,” which were in effect as of such date, approximately
65%
of the Company’s long-term debt had a fixed interest rate, with the remainder at variable interest rates.
2014 Senior Secured Credit Facilities
On March 21, 2014, the Company entered into an amendment to its senior secured credit facilities (as amended, the “2014 facilities”). Among other things, the amendment provided for an additional
$350.0
million principal amount of loans under the Term Loan A facility and an additional
$250.0
million principal amount of loans under the Term Loan B facility. On March 21, 2014, the Company borrowed the additional principal amounts described above and used the proceeds to redeem all of its outstanding 7 3/8% senior notes, as discussed below in the section entitled “7 3/8% Senior Notes Due 2020.” In connection with entering into an amendment, the Company paid debt issuance costs of
$13.3
million (of which
$8.0
million was expensed as debt modification and extinguishment costs and
$5.3
million is being amortized over the term of the related debt agreement)
F-22
PVH CORP.
NOTES TO CONSOLIDATED FINANCIAL STATEMENTS - (Continued)
and recorded additional debt modification and extinguishment costs of
$3.2
million to write-off previously capitalized debt issuance costs.
The 2014 facilities consisted of a $
1,986.3
million United States dollar-denominated Term Loan A facility, a $
1,188.6
million United States dollar-denominated Term Loan B facility and senior secured revolving credit facilities consisting of (a) a $
475.0
million United States dollar-denominated revolving credit facility, (b) a $
25.0
million United States dollar-denominated revolving credit facility available in United States dollars or Canadian dollars and (c) a €
185.9
million euro-denominated revolving credit facility available in euro, British pound sterling, Japanese yen or Swiss francs.
On May 19, 2016, the Company amended the 2014 facilities, as discussed in the following section.
2016 Senior Secured Credit Facilities
On May 19, 2016 (the “Amendment Date”), the Company entered into an amendment (the “Amendment”) to the 2014 facilities (as amended by the Amendment, the “2016 facilities”). Among other things, the Amendment provided for (i) the Company to borrow an additional $
582.0
million principal amount of loans under the Term Loan A facility, (ii) the repayment of all outstanding loans under the Term Loan B facility with the proceeds of the additional loans under the Term Loan A facility, and (iii) the termination of the Term Loan B facility. In addition, the Amendment extended the maturity of the Term Loan A and the revolving credit facilities from February 13, 2019 to May 19, 2021.
The 2016 facilities consist of a $
2,347.4
million United States dollar-denominated Term Loan A facility and the senior secured revolving credit facilities consisting of (a) a $
475.0
million United States dollar-denominated revolving credit facility, (b) a $
25.0
million United States dollar-denominated revolving credit facility available in United States dollars or Canadian dollars and (c) a €
185.9
million euro-denominated revolving credit facility available in euro, British pound sterling, Japanese yen or Swiss francs. In connection with entering into the Amendment, the Company paid debt issuance costs of $
10.9
million (of which $
4.6
million was expensed as debt modification costs and $
6.3
million is being amortized over the term of the related debt agreement) and recorded debt extinguishment costs of $
11.2
million to write-off previously capitalized debt issuance costs.
The revolving credit facilities also include amounts available for letters of credit. As of
January 29, 2017
, the Company had
$24.6
million of outstanding letters of credit. There were no borrowings outstanding under the revolving credit facilities. A portion of each of the United States dollar-denominated revolving credit facilities is also available for the making of swingline loans. The issuance of such letters of credit and the making of any swingline loan reduces the amount available under the applicable revolving credit facility. So long as certain conditions are satisfied, the Company may add one or more term loan facilities or increase the commitments under the revolving credit facilities by an aggregate amount not to exceed the sum of (1) the sum of (x)
$1,350.0
million plus (y) the aggregate amount of all voluntary prepayments of loans under the Term Loan A and the revolving credit facilities (to the extent, in the case of voluntary prepayments of loans under the revolving credit facilities, there is an equivalent permanent reduction of the revolving commitments) plus (z) an amount equal to the aggregate revolving commitments of any defaulting lender (to the extent the commitments with respect thereto have been terminated) and (2) an additional unlimited amount as long as the ratio of the Company’s senior secured net debt to consolidated adjusted earnings before interest, taxes, depreciation and amortization (in each case calculated as set forth in the documentation relating to the 2016 facilities) would not exceed 3 to 1 after giving pro forma effect to the incurrence of such increase. The lenders under the 2016 facilities are not required to provide commitments with respect to such additional facilities or increased commitments.
The terms of the Term Loan A facility require the Company to make quarterly repayments of amounts outstanding under the 2016 facilities, which commenced with the calendar quarter ended June 30, 2016. Such amounts equal
5.00%
per annum of the principal amount outstanding on the Amendment Date for the first eight calendar quarters following the Amendment Date,
7.50%
per annum of the principal amount for the four calendar quarters thereafter and
10.00%
per annum of the principal amount for the remaining calendar quarters, in each case paid in equal installments and in each case subject to certain customary adjustments, with the balance due on the maturity date of the Term Loan A facility.
The Company made payments of
$350.0
million,
$350.0
million and
$425.5
million during 2016, 2015 and 2014, respectively, on its term loans under the 2016 and 2014 facilities. As a result of the voluntary repayments made by the Company, as of January 29, 2017 the Company is not required to make a long-term debt repayment until September 2018. The Company had term loans outstanding of $
2,039.9
million, net of original issue discounts and debt issuance costs, as of January 29, 2017.
F-23
PVH CORP.
NOTES TO CONSOLIDATED FINANCIAL STATEMENTS - (Continued)
The Company’s obligations under the 2016 facilities are guaranteed by substantially all of its existing and future direct and indirect United States subsidiaries, with certain exceptions. Obligations of the European borrower under the 2016 facilities are guaranteed by the Company, substantially all of the Company’s existing and future direct and indirect United States subsidiaries (with certain exceptions) and Tommy Hilfiger Europe B.V., one of the Company’s wholly owned subsidiaries. The Company and its United States subsidiary guarantors have pledged certain of their assets as security for the obligations under the 2016 facilities.
The outstanding borrowings under the 2016 facilities are prepayable at any time without penalty (other than customary breakage costs). The terms of the 2016 facilities require the Company to repay certain amounts outstanding thereunder with (a) net cash proceeds of the incurrence of certain indebtedness, (b) net cash proceeds of certain asset sales or other dispositions (including as a result of casualty or condemnation) that exceed certain thresholds, to the extent such proceeds are not reinvested or committed to be reinvested in the business in accordance with customary reinvestment provisions, and (c) a percentage of excess cash flow that exceeds the voluntary debt payments the Company has made during the applicable year, which percentage is based upon its net leverage ratio during the relevant fiscal period.
The United States dollar-denominated borrowings under the 2016 facilities bear interest at a rate equal to an applicable margin plus, as determined at the Company’s option, either (a) a base rate determined by reference to the greater of (i) the prime rate, (ii) the United States federal funds rate plus 1/2 of
1.00%
and (iii) a one-month adjusted Eurocurrency rate plus
1.00%
or (b) an adjusted Eurocurrency rate, calculated in a manner set forth in the 2016 facilities.
The Canadian dollar-denominated borrowings under the 2016 facilities bear interest at a rate equal to an applicable margin plus, as determined at the Company’s option, either (a) a Canadian prime rate determined by reference to the greater of (i) the rate of interest per annum that Royal Bank of Canada establishes at its main office in Toronto, Ontario as the reference rate of interest in order to determine interest rates for loans in Canadian dollars to its Canadian borrowers and (ii) the sum of (x) the average of the rates per annum for Canadian dollar bankers’ acceptances having a term of one month that appears on the display referred to as “CDOR Page” of Reuters Monitor Money Rate Services as of 10:00 a.m. (Toronto time) on the date of determination, as reported by the administrative agent (and if such screen is not available, any successor or similar service as may be selected by the administrative agent), and (y)
0.75%
, or (b) an adjusted Eurocurrency rate, calculated in a manner set forth in the 2016 facilities.
The borrowings under the 2016 facilities in currencies other than United States dollars or Canadian dollars bear interest at a rate equal to an applicable margin plus an adjusted Eurocurrency rate, calculated in a manner set forth in the 2016 facilities.
The current applicable margin with respect to the Term Loan A facility and each revolving credit facility is
1.50%
for adjusted Eurocurrency rate loans and
0.50%
for base rate loans, respectively. After the date of delivery of the compliance certificate and financial statements with respect to each of the Company’s fiscal quarters, the applicable margin for borrowings under the Term Loan A facility and the revolving credit facilities is subject to adjustment based upon the Company’s net leverage ratio.
The 2016 facilities contain customary events of default, including but not limited to nonpayment; material inaccuracy of representations and warranties; violations of covenants; certain bankruptcies and liquidations; cross-default to material indebtedness; certain material judgments; certain events related to the Employee Retirement Income Security Act of 1974, as amended; certain events related to certain of the guarantees by the Company and certain of its subsidiaries, and certain pledges of the Company’s assets and those of certain of the Company’s subsidiaries, as security for the obligations under the 2016 facilities; and a change in control (as defined in the 2016 facilities).
During the second quarter of 2014, the Company entered into an interest rate cap agreement for an 18-month term commencing on August 18, 2014. The agreement was designed with the intended effect of capping the interest rate on an initial notional amount of
$514.2
million of the Company’s variable rate debt obligation under the 2014 facilities or any replacement facility with similar terms. Under the terms of this agreement, the one-month LIBOR that the Company paid was capped at a rate of
1.50%
. Therefore, the maximum amount of interest that the Company would have paid on the then-outstanding notional amount was at the
1.50%
capped rate, plus the current applicable margin. The agreement expired on February 17, 2016.
F-24
PVH CORP.
NOTES TO CONSOLIDATED FINANCIAL STATEMENTS - (Continued)
During the second quarter of 2014, the Company entered into an interest rate swap agreement for a two-year term commencing on February 17, 2016. The agreement was designed with the intended effect of converting an initial notional amount of
$682.6
million of the Company’s variable rate debt obligation under the 2014 facilities or any replacement facility with similar terms, including the 2016 facilities, to fixed rate debt. Such agreement remains outstanding with a notional amount of $
925.1
million as of January 29, 2017, and is now converting a portion of the Company’s variable rate debt obligation under the 2016 facilities to fixed rate debt. Under the terms of the agreement for the then-outstanding notional amount, the Company’s exposure to fluctuations in the one-month LIBOR is eliminated and the Company will pay a weighted average fixed rate of
1.924%
, plus the current applicable margin.
During the second quarter of 2013, the Company entered into an interest rate swap agreement for a three-year term commencing on August 19, 2013. The agreement was designed with the intended effect of converting an initial notional amount of
$1,228.8
million of the Company’s variable rate debt obligation under the Company’s previously outstanding facilities or any replacement facility with similar terms, including the 2016 facilities, to fixed rate debt. Under the terms of the agreement for the then-outstanding notional amount, the Company’s exposure to fluctuations in the one-month LIBOR was eliminated and the Company paid a fixed rate of
0.604%
, plus the current applicable margin. The agreement expired on August 17, 2016.
The notional amount of any outstanding interest rate swap will be adjusted according to a pre-set schedule during the term of the applicable swap agreement such that, based on the Company’s projections for future debt repayments, the Company’s outstanding debt under the Term Loan A facility is expected to always equal or exceed the combined notional amount of the then-outstanding interest rate swaps.
The 2016 facilities also contain covenants that restrict the Company’s ability to finance future operations or capital needs, to take advantage of other business opportunities that may be in its interest or to satisfy its obligations under its other outstanding debt. These covenants restrict its ability to, among other things:
|
•
|
incur or guarantee additional debt or extend credit;
|
|
•
|
make restricted payments, including paying dividends or making distributions on, or redeeming or repurchasing, the Company’s capital stock or certain debt;
|
|
•
|
make acquisitions and investments;
|
|
•
|
dispose of assets;
|
|
•
|
engage in transactions with affiliates;
|
|
•
|
enter into agreements restricting the Company’s subsidiaries’ ability to pay dividends;
|
|
•
|
create liens on the Company’s assets or engage in sale/leaseback transactions; and
|
|
•
|
effect a consolidation or merger, or sell, transfer, or lease all or substantially all of the Company’s assets.
|
The 2016 facilities require the Company to comply with certain financial covenants, including minimum interest coverage and maximum net leverage. A breach of any of these operating or financial covenants would result in a default under the applicable facility. If an event of default occurs and is continuing, the lenders could elect to declare all amounts then outstanding, together with accrued interest, to be immediately due and payable, which would result in acceleration of its other debt. If the Company were unable to repay any such borrowings when due, the lenders could proceed against their collateral, which also secures some of the Company’s other indebtedness.
7 3/8% Senior Notes Due 2020
On May 6, 2010, the Company issued
$600.0
million principal amount of 7 3/8% senior notes due May 15, 2020. On March 24, 2014, in connection with an amendment to its senior secured credit facilities discussed above in the section entitled “2014 Senior Secured Credit Facilities,” the Company redeemed all of its outstanding 7 3/8% senior notes and, pursuant to the indenture under which the notes were issued, paid a “make whole” premium of
$67.6
million to the holders of the notes. The Company also recorded costs of
$14.3
million to write-off previously capitalized debt issuance costs associated with these notes.
4 1/2% Senior Notes Due 2022
On December 20, 2012, the Company issued
$700.0
million principal amount of 4 1/2% senior notes due December 15, 2022. The Company paid
$16.3
million of fees during 2013 in connection with the issuance of these notes, which are amortized
F-25
PVH CORP.
NOTES TO CONSOLIDATED FINANCIAL STATEMENTS - (Continued)
over the term of the notes. The Company may redeem some or all of these notes at any time prior to December 15, 2017 by paying a “make whole” premium plus any accrued and unpaid interest. In addition, the Company may redeem some or all of these notes on or after December 15, 2017 at specified redemption prices plus any accrued and unpaid interest. The Company’s ability to pay cash dividends and make other restricted payments is limited, in each case, over specified amounts as defined in the indenture governing the notes.
7 3/4% Debentures Due 2023
The Company has outstanding
$100.0
million of debentures due November 15, 2023 that accrue interest at the rate of 7 3/4%. Pursuant to the indenture governing the debentures, the Company must maintain a certain level of stockholders’ equity in order to pay cash dividends and make other restricted payments, as defined in the indenture governing the debentures.
3 5/8% Euro Senior Notes Due 2024
On June 20, 2016, the Company issued €
350.0
million euro-denominated principal amount of 3 5/8% senior notes due July 15, 2024. Interest on the notes is payable in euros. The Company paid €
6.4
million (approximately $
7.3
million based on exchange rates in effect on the payment date) of fees during the second quarter of 2016 in connection with the issuance of these notes, which are amortized over the term of the notes. The Company may redeem some or all of these notes at any time prior to April 15, 2024 by paying a “make whole” premium plus any accrued and unpaid interest. In addition, the Company may redeem some or all of these notes on or after April 15, 2024 at their principal amount plus any accrued and unpaid interest.
Substantially all of the Company’s assets have been pledged as collateral to secure the Company’s obligations under its senior secured credit facilities, the 7 3/4% debentures due 2023 and contingent purchase price payments to Mr. Calvin Klein as discussed in
Note 7
, “Goodwill and Other Intangible Assets.”
Interest paid was
$109.8
million,
$104.9
million and
$141.7
million during 2016, 2015 and 2014, respectively.
9. INCOME TAXES
The domestic and foreign components of income (loss) before provision for income taxes were as follows:
|
(In millions)
|
2016
|
2015
|
2014
|
||||||||
|
Domestic
|
$
|
60.9
|
|
$
|
117.5
|
|
$
|
(103.4
|
)
|
||
|
Foreign
|
613.3
|
|
530.0
|
|
494.8
|
|
|||||
|
Total
|
$
|
674.2
|
|
$
|
647.5
|
|
$
|
391.4
|
|
||
Domestic income (loss) before provision for income taxes included an actuarial gain (loss) related to the Company’s United States retirement plans of $
39.1
million, $
20.2
million and $
(138.9)
million in
2016
,
2015
and
2014
, respectively.
Taxes paid were $
85.3
million,
$91.5
million and
$102.9
million in
2016
,
2015
and
2014
, respectively.
F-26
PVH CORP.
NOTES TO CONSOLIDATED FINANCIAL STATEMENTS - (Continued)
The provision (benefit) for income taxes attributable to income consisted of the following:
|
(In millions)
|
2016
|
2015
|
2014
|
||||||||
|
Federal:
|
|
|
|
||||||||
|
Current
|
$
|
(2.7
|
)
|
$
|
6.8
|
|
$
|
(35.4
|
)
|
||
|
Deferred
|
(9.3
|
)
|
(4.1
|
)
|
(54.8
|
)
|
|||||
|
State and local:
|
|
|
|
|
|
|
|||||
|
Current
|
(2.4
|
)
|
6.4
|
|
3.4
|
|
|||||
|
Deferred
|
(0.9
|
)
|
(22.2
|
)
|
(4.3
|
)
|
|||||
|
Foreign:
|
|
|
|
|
|
|
|||||
|
Current
|
129.3
|
|
70.6
|
|
15.5
|
|
|||||
|
Deferred
|
11.5
|
|
17.6
|
|
28.1
|
|
|||||
|
Total
|
$
|
125.5
|
|
$
|
75.1
|
|
$
|
(47.5
|
)
|
||
The provision (benefit) for income taxes for the years
2016
,
2015
and
2014
was different from the amount computed by applying the statutory United States federal income tax rate to the underlying income as follows:
|
|
2016
|
2015
|
2014
|
|||||
|
Statutory federal tax rate
|
35.0
|
%
|
35.0
|
%
|
35.0
|
%
|
||
|
State and local income taxes, net of federal income tax benefit
|
0.4
|
%
|
(1.3
|
)%
|
(1.1
|
)%
|
||
|
Effects of international jurisdictions, including foreign tax credits
|
(12.9
|
)%
|
(15.0
|
)%
|
(23.3
|
)%
|
||
|
Change in estimates for uncertain tax positions
|
(3.7
|
)%
|
(7.6
|
)%
|
(24.0
|
)%
|
||
|
Change in valuation allowance
|
(0.1
|
)%
|
(0.2
|
)%
|
1.1
|
%
|
||
|
Other, net
|
(0.1
|
)%
|
0.7
|
%
|
0.2
|
%
|
||
|
Effective tax rate
|
18.6
|
%
|
11.6
|
%
|
(12.1
|
)%
|
||
Effects of international jurisdictions, including foreign tax credits, reflected in the above table for
2016
,
2015
and
2014
include not only those taxes at statutory income tax rates but also taxes at special rates levied on income from certain jurisdictional activities. The Company expects to benefit from these special rates until 2023.
F-27
PVH CORP.
NOTES TO CONSOLIDATED FINANCIAL STATEMENTS - (Continued)
The components of deferred income tax assets and liabilities were as follows:
|
(In millions)
|
2016
|
2015
|
|||||
|
Gross deferred tax assets
|
|||||||
|
Tax loss and credit carryforwards
|
$
|
248.1
|
|
$
|
240.1
|
|
|
|
Employee compensation and benefits
|
88.7
|
|
135.3
|
|
|||
|
Inventories
|
27.2
|
|
24.0
|
|
|||
|
Accounts receivable
|
26.6
|
|
28.5
|
|
|||
|
Accrued expenses
|
31.7
|
|
31.6
|
|
|||
|
Other, net
|
0.0
|
|
37.1
|
|
|||
|
Subtotal
|
422.3
|
|
496.6
|
|
|||
|
Valuation allowances
|
(43.9
|
)
|
(43.8
|
)
|
|||
|
Total gross deferred tax assets, net of valuation allowances
|
$
|
378.4
|
|
$
|
452.8
|
|
|
|
Gross deferred tax liabilities
|
|
|
|
|
|||
|
Intangibles
|
$
|
(1,157.0
|
)
|
$
|
(1,199.2
|
)
|
|
|
Property, plant and equipment
|
(67.6
|
)
|
(77.8
|
)
|
|||
|
Other, net
|
(14.1
|
)
|
—
|
|
|||
|
Total gross deferred tax liabilities
|
$
|
(1,238.7
|
)
|
$
|
(1,277.0
|
)
|
|
|
Net deferred tax liability
|
$
|
(860.3
|
)
|
$
|
(824.2
|
)
|
|
At the end of 2016, the Company had on a tax effected basis approximately $
286.3
million of net operating loss and tax credit carryforwards available to offset future taxable income in various jurisdictions. This included net operating loss carryforwards of approximately $
19.5
million and $
37.2
million for federal and various state and local jurisdictions, respectively, and $
28.9
million for various foreign jurisdictions. The Company also had federal and state tax credit and other carryforwards of $
200.7
million. The carryforwards expire principally between 2017 and 2037.
The Company does not provide for deferred taxes on the excess of financial reporting over tax basis on its investments in all of its foreign subsidiaries that are essentially permanent in duration. The earnings that are permanently reinvested were $
2.6
billion as of
January 29, 2017
. It is not practicable to estimate the amount of tax that might be payable if these earnings were repatriated due to the complexities associated with the hypothetical calculation.
Uncertain tax positions activity for each of the last three years was as follows:
|
(In millions)
|
2016
|
2015
|
2014
|
||||||||
|
Balance at beginning of year
|
$
|
226.8
|
|
$
|
244.5
|
|
$
|
485.7
|
|
||
|
Increases related to prior year tax positions
|
2.8
|
|
4.3
|
|
16.8
|
|
|||||
|
Decreases related to prior year tax positions
|
(9.9
|
)
|
(12.5
|
)
|
(239.3
|
)
|
|||||
|
Increases related to current year tax positions
|
52.0
|
|
40.0
|
|
38.2
|
|
|||||
|
Lapses in statute of limitations
|
(24.4
|
)
|
(44.6
|
)
|
(36.3
|
)
|
|||||
|
Effects of foreign currency translation
|
(1.7
|
)
|
(4.9
|
)
|
(20.6
|
)
|
|||||
|
Balance at end of year
|
$
|
245.6
|
|
$
|
226.8
|
|
$
|
244.5
|
|
||
In 2014, the Company resolved for
$179.0
million an uncertain tax position related to European and United States transfer pricing arrangements, for which it had previously recorded a liability of approximately
$185.0
million.
The entire amount of uncertain tax positions as of
January 29, 2017
, if recognized, would reduce the future effective tax rate under current accounting provisions.
Interest and penalties related to uncertain tax positions are recorded in the Company’s income tax provision. Interest and penalties recognized in the Company’s Consolidated Income Statements for the years
2016
,
2015
and
2014
totaled an expense
F-28
PVH CORP.
NOTES TO CONSOLIDATED FINANCIAL STATEMENTS - (Continued)
of $
1.0
million, a benefit of
$(0.9)
million and a benefit of
$(25.9)
million, respectively. Interest and penalties accrued in the Company’s Consolidated Balance Sheets as of
January 29, 2017
,
January 31, 2016
and
February 1, 2015
totaled $
27.8
million,
$27.6
million and
$28.6
million, respectively. The Company recorded its liabilities for uncertain tax positions principally in accrued expenses and other liabilities in its Consolidated Balance Sheets.
The Company files income tax returns in the United States and in various foreign, state and local jurisdictions. With few exceptions, examinations have been completed by tax authorities or the statute of limitations has expired for United States federal, foreign, state and local income tax returns filed by the Company for years through 2005. It is reasonably possible that a reduction of uncertain tax positions in a range of $
45.0
million to $
55.0
million may occur within
12
months of
January 29, 2017
.
10. DERIVATIVE FINANCIAL INSTRUMENTS
Cash Flow Hedges
The Company has exposure to changes in foreign currency exchange rates related to anticipated cash flows associated with certain international inventory purchases. The Company periodically uses foreign currency forward exchange contracts to hedge against a portion of this exposure.
The Company also has exposure to interest rate volatility related to its term loans under the 2016 facilities. The Company has entered into interest rate swap agreements to hedge against a portion of this exposure. The Company had also entered into an interest rate cap agreement, which expired on February 17, 2016. Please see Note 8, “Debt,” for a further discussion of the Company’s facilities and these agreements.
The Company records the foreign currency forward exchange contracts and interest rate contracts at fair value in its Consolidated Balance Sheets, and does not net the related assets and liabilities. Changes in fair value of the foreign currency forward exchange contracts associated with certain international inventory purchases and the interest rate contracts that are designated as effective hedging instruments (collectively referred to as “cash flow hedges”) are recorded in equity as a component of AOCL. The cash flows from such hedges are presented in the same category in the Company’s Consolidated Statements of Cash Flows as the items being hedged. No amounts were excluded from effectiveness testing. There was no ineffective portion of cash flow hedges during 2016 and 2015.
Net Investment Hedge
The Company has exposure to changes in foreign currency exchange rates related to the value of its investments in foreign subsidiaries denominated in a currency other than the United States dollar. To hedge against a portion of this exposure, during the second quarter of 2016, the Company designated the carrying amount of its €
350.0
million euro-denominated principal amount of 3 5/8% senior notes due 2024 (the “foreign currency borrowings”) that it had issued in the United States as a net investment hedge of its investments in certain of its foreign subsidiaries that use the euro as their functional currency. Please see Note 8, “Debt,” for a further discussion of the Company’s foreign currency borrowings.
The Company records the foreign currency borrowings at carrying value in its Consolidated Balance Sheets. The carrying value of the foreign currency borrowings is remeasured at the end of each reporting period to reflect changes in the foreign currency exchange spot rate. Since the foreign currency borrowings are designated as a net investment hedge, such remeasurement is recorded in equity as a component of AOCL. As of January 29, 2017, the fair value and the carrying value of the foreign currency borrowings designated as a net investment hedge were $
384.1
million and $
367.5
million, respectively. The Company evaluates the effectiveness of its net investment hedge as of the beginning of each quarter. No amounts were excluded from effectiveness testing. There was no ineffective portion of the net investment hedge during 2016.
Undesignated Contracts
The Company records immediately in earnings changes in the fair value of hedges that are not designated as effective hedging instruments (“undesignated contracts”), including all of the foreign currency forward exchange contracts related to intercompany transactions and intercompany loans that are not of a long-term investment nature. Any gains and losses that are
F-29
PVH CORP.
NOTES TO CONSOLIDATED FINANCIAL STATEMENTS - (Continued)
immediately recognized in earnings on such contracts are largely offset by the remeasurement of the underlying intercompany balances.
In addition, the Company has exposure to changes in foreign currency exchange rates related to the translation of the earnings of its subsidiaries denominated in a currency other than the United States dollar. To hedge against a portion of this exposure, the Company entered into several foreign currency option contracts during 2016. These contracts represent the Company’s purchase of euro put/United States dollar call options. In connection with the foreign currency option contracts, the Company paid total cash premiums of $
2.3
million during 2016.
The Company’s foreign currency option contracts are also undesignated contracts. As such, the changes in the fair value of these foreign currency option contracts are recognized immediately in earnings. This mitigates the effect of a strengthening United States dollar against the euro on the reporting of the Company’s euro-denominated earnings.
The Company does not use derivative or non-derivative financial instruments for trading or speculative purposes.
The following table summarizes the fair value and presentation of the Company’s derivative financial instruments in its Consolidated Balance Sheets:
|
(In millions)
|
Assets (Classified in Other Current Assets and Other Assets)
|
Liabilities (Classified in Accrued
Expenses and Other Liabilities)
|
|||||||||||||
|
|
2016
|
2015
|
2016
|
2015
|
|||||||||||
|
Contracts designated as cash flow hedges:
|
|||||||||||||||
|
Foreign currency forward exchange contracts (inventory purchases)
|
$
|
25.1
|
|
$
|
24.9
|
|
$
|
2.6
|
|
$
|
1.7
|
|
|||
|
Interest rate contracts
|
—
|
|
—
|
|
7.1
|
|
20.6
|
|
|||||||
|
Total contracts designated as cash flow hedges
|
25.1
|
|
24.9
|
|
9.7
|
|
22.3
|
|
|||||||
|
Undesignated contracts:
|
|||||||||||||||
|
Foreign currency forward exchange contracts
|
0.8
|
|
19.3
|
|
0.0
|
|
0.1
|
|
|||||||
|
Foreign currency option contracts
|
3.2
|
|
—
|
|
—
|
|
—
|
|
|||||||
|
Total undesignated contracts
|
4.0
|
|
19.3
|
|
0.0
|
|
0.1
|
|
|||||||
|
Total
|
$
|
29.1
|
|
$
|
44.2
|
|
$
|
9.7
|
|
$
|
22.4
|
|
|||
At
January 29, 2017
, the notional amount outstanding of foreign currency forward exchange contracts and foreign currency option contracts was $
954.0
million and $
100.0
million, respectively. Such contracts expire principally between February 2017 and April 2018.
The following table summarizes the effect of the Company’s hedges designated as cash flow and net investment hedging instruments:
|
Gain (Loss)
Recognized in Other
Comprehensive Loss
|
Gain (Loss) Reclassified from
AOCL into Income (Expense)
|
||||||||||||||||
|
(In millions)
|
Location
|
Amount
|
|||||||||||||||
|
2016
|
2015
|
|
2016
|
2015
|
|||||||||||||
|
Foreign currency forward exchange contracts (inventory purchases)
|
$
|
2.4
|
|
$
|
36.3
|
|
Cost of goods sold
|
$
|
14.0
|
|
$
|
92.1
|
|
||||
|
Interest rate contracts
|
1.4
|
|
(9.4
|
)
|
Interest expense
|
(12.1
|
)
|
(3.7
|
)
|
||||||||
|
Foreign currency borrowings (net investment hedge)
|
22.7
|
|
—
|
|
N/A
|
—
|
|
—
|
|
||||||||
|
Total
|
$
|
26.5
|
|
$
|
26.9
|
|
$
|
1.9
|
|
$
|
88.4
|
|
|||||
F-30
PVH CORP.
NOTES TO CONSOLIDATED FINANCIAL STATEMENTS - (Continued)
A net gain in AOCL on foreign currency forward exchange contracts at
January 29, 2017
of $
32.3
million is estimated to be reclassified in the next
12
months in the Company’s Consolidated Income Statement to costs of goods sold as the underlying inventory hedged by such forward exchange contracts is sold. In addition, a net loss in AOCL for interest rate contracts at
January 29, 2017
of $
7.0
million is estimated to be reclassified to interest expense within the next
12
months. Amounts recognized in AOCL for foreign currency borrowings would be recognized in earnings only upon the sale or liquidation of the hedged net investment.
The following table summarizes the effect of the Company’s undesignated contracts recognized in selling, general and administrative expenses in its Consolidated Income Statements:
|
(Loss) Gain Recognized in (Expense) Income
|
||||||||
|
(In millions)
|
2016
|
2015
|
||||||
|
Foreign currency forward exchange contracts
|
$
|
(1.2
|
)
|
$
|
4.7
|
|
||
|
Foreign currency option contracts
|
0.9
|
|
—
|
|
||||
The Company had no derivative financial instruments with credit risk-related contingent features underlying the related contracts as of
January 29, 2017
.
11. FAIR VALUE MEASUREMENTS
FASB guidance for fair value measurements defines fair value as the price that would be received to sell an asset or paid to transfer a liability in an orderly transaction between market participants at the measurement date. It also establishes a three level hierarchy that prioritizes the inputs used to measure fair value. The three levels of the hierarchy are defined as follows:
Level 1 – Inputs are unadjusted quoted prices in active markets for identical assets or liabilities that the Company has the ability to access at the measurement date.
Level 2 – Observable inputs other than quoted prices included in Level 1, including quoted prices for similar assets or liabilities in active markets, quoted prices for identical assets or liabilities in inactive markets, inputs other than quoted prices that are observable for the asset or liability and inputs derived principally from or corroborated by observable market data.
Level 3 – Unobservable inputs reflecting the Company’s own assumptions about the inputs that market participants would use in pricing the asset or liability based on the best information available.
F-31
PVH CORP.
NOTES TO CONSOLIDATED FINANCIAL STATEMENTS - (Continued)
In accordance with the fair value hierarchy described above, the following table shows the fair value of the Company’s financial assets and liabilities that are required to be remeasured at fair value on a recurring basis:
|
(In millions)
|
2016
|
2015
|
|||||||||||||||||||||||||
|
Level 1
|
Level 2
|
Level 3
|
Total
|
Level 1
|
Level 2
|
Level 3
|
Total
|
||||||||||||||||||||
|
Assets:
|
|||||||||||||||||||||||||||
|
Foreign currency forward exchange contracts
|
N/A
|
$
|
25.9
|
|
N/A
|
$
|
25.9
|
|
N/A
|
$
|
44.2
|
|
N/A
|
$
|
44.2
|
|
|||||||||||
|
Foreign currency option contracts
|
N/A
|
3.2
|
|
N/A
|
3.2
|
|
N/A
|
N/A
|
|
N/A
|
N/A
|
||||||||||||||||
|
Total Assets
|
N/A
|
$
|
29.1
|
|
N/A
|
$
|
29.1
|
|
N/A
|
$
|
44.2
|
|
N/A
|
$
|
44.2
|
|
|||||||||||
|
Liabilities:
|
|||||||||||||||||||||||||||
|
Foreign currency forward exchange contracts
|
N/A
|
$
|
2.6
|
|
N/A
|
$
|
2.6
|
|
N/A
|
$
|
1.8
|
|
N/A
|
$
|
1.8
|
|
|||||||||||
|
Interest rate contracts
|
N/A
|
7.1
|
|
N/A
|
7.1
|
|
N/A
|
20.6
|
|
N/A
|
20.6
|
|
|||||||||||||||
|
Contingent purchase price payments related to reacquisition of the perpetual rights to the
Tommy Hilfiger
trademarks in India
|
N/A
|
N/A
|
$
|
1.6
|
|
1.6
|
|
N/A
|
N/A
|
$
|
2.2
|
|
2.2
|
|
|||||||||||||
|
Total Liabilities
|
N/A
|
$
|
9.7
|
|
$
|
1.6
|
|
$
|
11.3
|
|
N/A
|
$
|
22.4
|
|
$
|
2.2
|
|
$
|
24.6
|
|
|||||||
The fair value of the foreign currency forward exchange contracts is measured as the total amount of currency to be purchased, multiplied by the difference between (i) the forward rate as of the period end and (ii) the settlement rate specified in each contract. The fair value of the interest rate contracts is based on observable interest rate yield curves and represents the expected discounted cash flows underlying the financial instruments. The fair value of the foreign currency option contracts is estimated based on external valuation models, which use the original strike price, current foreign currency exchange rates, the implied volatility in foreign currency exchange rates and length of time to expiration as inputs.
Pursuant to the agreement governing the reacquisition of the rights in India to the
Tommy Hilfiger
trademarks (which the Company entered into in September 2011 in connection with its acquisition of its
50%
ownership of TH India), the Company is required to make annual contingent purchase price payments based on a percentage of sales of
Tommy Hilfiger
products in India in excess of an agreed upon threshold during each of six consecutive 12-month periods. Such payments are subject to a
$25.0
million aggregate maximum and are due within 60 days following each one-year period. The Company made annual contingent purchase price payments of
$0.6
million,
$0.6
million,
$0.6
million,
$0.4
million and
$0.2
million during 2016, 2015, 2014, 2013 and 2012, respectively. The Company is required to remeasure this liability at fair value on a recurring basis and classifies this as a Level 3 measurement. The fair value of such liability was determined using the discounted cash flow method, based on net sales projections for the Tommy Hilfiger apparel and accessories businesses in India, and was discounted using rates of return that account for the relative risks of the estimated future cash flows. Excluding the initial recognition of the liability for the contingent purchase price payments and payments made to reduce the liability, changes in the fair value are included within selling, general and administrative expenses in the Company’s Consolidated Income Statements.
The following table presents the change in the Level 3 contingent purchase price payment liability during
2016
and
2015
:
|
(In millions)
|
2016
|
2015
|
|||||
|
Balance at beginning of year
|
$
|
2.2
|
|
$
|
4.0
|
|
|
|
Payments
|
(0.6
|
)
|
(0.6
|
)
|
|||
|
Adjustments included in earnings
|
—
|
|
(1.2
|
)
|
|||
|
Balance at end of year
|
$
|
1.6
|
|
$
|
2.2
|
|
|
F-32
PVH CORP.
NOTES TO CONSOLIDATED FINANCIAL STATEMENTS - (Continued)
Additional information with respect to assumptions used to value the contingent purchase price payment liability as of
January 29, 2017
is as follows:
|
Unobservable Inputs
|
Amount
|
||
|
Approximate compounded annual net sales growth rate
|
35.0
|
%
|
|
|
Approximate
discount rate
|
15.0
|
%
|
|
A five percentage point increase or decrease in the discount rate or the compounded annual net sales growth rate would result in an immaterial change to the liability.
There were no transfers between any levels of the fair value hierarchy for any of the Company’s fair value measurements.
The following table shows the fair value of the Company’s non-financial assets and liabilities that were required to be remeasured at fair value on a nonrecurring basis (consisting principally of property, plant and equipment) during
2016
,
2015
and 2014, and the total impairments recorded as a result of the remeasurement process:
|
(In millions)
|
Fair Value Measurement Using
|
Fair Value
As Of Impairment Date |
Total
Impairments
|
||||||||||||
|
|
Level 1
|
Level 2
|
Level 3
|
||||||||||||
|
2016
|
N/A
|
N/A
|
$
|
0.4
|
|
$
|
0.4
|
|
$
|
10.1
|
|
||||
|
2015
|
N/A
|
N/A
|
$
|
1.4
|
|
$
|
1.4
|
|
$
|
11.4
|
|
||||
|
2014
|
N/A
|
N/A
|
$
|
1.3
|
|
$
|
1.3
|
|
$
|
29.7
|
|
||||
Long-lived assets with carrying amounts of
$10.5
million,
$12.8
million and
$13.3
million were written down to fair values of
$0.4
million,
$1.4
million and
$1.3
million during 2016, 2015 and 2014, respectively, in connection with the financial performance in certain of the Company’s retail stores. Fair value was determined based on the estimated discounted future cash flows associated with the assets using sales trends and market participant assumptions. The
$10.1
million impairment charge recorded in 2016 was included in selling, general and administrative expenses, of which
$1.0
million was recorded in the Calvin Klein North America segment,
$3.7
million was recorded in the Calvin Klein International segment,
$1.4
million was recorded in the Tommy Hilfiger North America segment and
$4.0
million was recorded in the Tommy Hilfiger International segment. The
$11.4
million impairment charge recorded in 2015 was included in selling, general and administrative expenses, of which
$2.0
million was recorded in the Calvin Klein North America segment,
$3.1
million was recorded in the Calvin Klein International segment and
$6.3
million was recorded in the Tommy Hilfiger International segment. The
$12.0
million impairment charge recorded in 2014 was included in selling, general and administrative expenses, of which
$0.1
million was recorded in the Calvin Klein North America segment,
$3.8
million was recorded in the Calvin Klein International segment,
$3.4
million was recorded in the Tommy Hilfiger North America segment,
$1.7
million was recorded in the Tommy Hilfiger International segment and
$3.0
million was recorded in the Heritage Brands Retail segment.
Long-lived assets with a carrying amount of
$5.8
million and goodwill of
$11.9
million were written down to a fair value of
zero
during 2014 in connection with the exit from the Company’s Izod retail business. The impairment charge was included in selling, general and administrative expenses in the Heritage Brands Retail segment.
The Company is deemed to have guaranteed lease payments for substantially all G. H. Bass & Co. (“Bass”) retail stores included in the sale of substantially all of the assets of the Company’s Bass business in the fourth quarter of 2013 pursuant to the terms of noncancelable leases expiring on various dates through
2022
. These obligations deemed to be guaranteed include minimum rent payments and relate to leases that commenced prior to the sale of the Bass assets. In certain instances, the Company’s obligations remain in effect when an option is exercised to extend the term of the lease. The estimated fair value of these obligations as of
January 29, 2017
and
January 31, 2016
was $
1.1
million and
$1.9
million, respectively, which was included in accrued expenses and other liabilities in the Company’s Consolidated Balance Sheets. The Company classifies these
F-33
PVH CORP.
NOTES TO CONSOLIDATED FINANCIAL STATEMENTS - (Continued)
as Level 3 measurements. The fair value of such obligations was determined using the discounted cash flow method, based on the lease payments, the estimated probability of lease extensions and estimates of the risk of default by the buyer of the Bass assets, and was discounted using rates of return that account for the relative risks of the estimated future cash flows.
The carrying amounts and the fair values of the Company’s cash and cash equivalents, short-term borrowings and long-term debt were as follows:
|
(In millions)
|
2016
|
2015
|
|||||||||||||
|
Carrying
Amount
|
Fair
Value
|
Carrying
Amount
|
Fair
Value
|
||||||||||||
|
Cash and cash equivalents
|
$
|
730.1
|
|
$
|
730.1
|
|
$
|
556.4
|
|
$
|
556.4
|
|
|||
|
Short-term borrowings
|
19.1
|
|
19.1
|
|
25.9
|
|
25.9
|
|
|||||||
|
Long-term debt (including portion classified as current)
|
3,197.3
|
|
3,248.7
|
|
3,168.3
|
|
3,190.5
|
|
|||||||
The fair values of cash and cash equivalents and short-term borrowings approximate their carrying amounts due to the short-term nature of these instruments. The Company estimates the fair value of its long-term debt using quoted market prices as of the last business day of the applicable year. The Company classifies the measurement of its long-term debt as a Level 1 measurement. The carrying amounts of long-term debt reflect the unamortized portions of debt issuance costs and the original issue discounts.
12. RETIREMENT AND BENEFIT PLANS
The Company has
five
qualified defined benefit pension plans as of
January 29, 2017
covering substantially all employees resident in the United States who meet certain age and service requirements. The plans provide monthly benefits upon retirement generally based on career average compensation and years of credited service. Vesting in plan benefits generally occurs after
five
years of service. The Company refers to these five noncontributory plans as its “Pension Plans.”
The Company also has for certain members of Tommy Hilfiger’s domestic senior management a supplemental executive retirement plan, which is an unfunded non-qualified supplemental defined benefit pension plan. Such plan is frozen and, as a result, participants do not accrue additional benefits. In addition, the Company has a capital accumulation program, which is an unfunded non-qualified supplemental defined benefit plan. Under the individual participants’ agreements, the participants in this plan will receive a predetermined amount during the
10
years following the attainment of age
65
, provided that prior to the termination of employment with the Company, the participant has been in the plan for at least
10
years and has attained age
55
. The Company also has for certain employees resident in the United States who meet certain age and service requirements an unfunded non-qualified supplemental defined benefit pension plan, which provides benefits for compensation in excess of Internal Revenue Service earnings limits and requires payments to vested employees upon, or shortly after, employment termination or retirement. The Company refers to these
three
noncontributory plans as its “SERP Plans.”
The Company also provides certain postretirement health care and life insurance benefits to certain retirees resident in the United States. Retirees contribute to the cost of this plan, which is unfunded. During 2002, the postretirement plan was amended to eliminate the Company contribution, which partially subsidized benefits, for active participants who, as of January 1, 2003, had not attained age
55
and
10
years of service. As a result of the Company’s acquisition of The Warnaco Group, Inc. (“Warnaco”) in 2013, the Company also provides certain postretirement health care and life insurance benefits to certain Warnaco retirees resident in the United States. Retirees contribute to the cost of this plan, which is unfunded. This plan was frozen on January 1, 2014. The Company refers to these two plans as its “Postretirement Plans.”
F-34
PVH CORP.
NOTES TO CONSOLIDATED FINANCIAL STATEMENTS - (Continued)
Reconciliations of the changes in the projected benefit obligation (Pension Plans and SERP Plans) and the accumulated benefit obligation (Postretirement Plans) for each of the last two years were as follows:
|
|
Pension Plans
|
SERP Plans
|
Postretirement Plans
|
||||||||||||||||||||
|
(In millions)
|
2016
|
2015
|
2016
|
2015
|
2016
|
2015
|
|||||||||||||||||
|
Balance at beginning of year
|
$
|
651.7
|
|
$
|
734.8
|
|
$
|
88.6
|
|
$
|
98.5
|
|
$
|
15.8
|
|
$
|
18.1
|
|
|||||
|
Service cost
|
24.4
|
|
29.9
|
|
4.3
|
|
5.6
|
|
—
|
|
—
|
|
|||||||||||
|
Interest cost
|
29.8
|
|
27.8
|
|
3.9
|
|
3.7
|
|
0.5
|
|
0.6
|
|
|||||||||||
|
Benefit payments
|
(75.6
|
)
|
(49.1
|
)
|
(8.5
|
)
|
(10.1
|
)
|
—
|
|
—
|
|
|||||||||||
|
Benefit payments, net of retiree contributions
|
—
|
|
—
|
|
—
|
|
—
|
|
(1.9
|
)
|
(1.9
|
)
|
|||||||||||
|
Medicare subsidy
|
—
|
|
—
|
|
—
|
|
—
|
|
0.0
|
|
0.0
|
|
|||||||||||
|
Actuarial gain
|
(2.8
|
)
|
(91.7
|
)
|
(0.7
|
)
|
(9.1
|
)
|
(3.0
|
)
|
(1.0
|
)
|
|||||||||||
|
Balance at end of year
|
$
|
627.5
|
|
$
|
651.7
|
|
$
|
87.6
|
|
$
|
88.6
|
|
$
|
11.4
|
|
$
|
15.8
|
|
|||||
In 2016 and 2015, benefit payments from the Pension Plans include lump sum payments, as certain vested participants, whose employment has been terminated, were offered an opportunity to elect a lump sum payment of their accrued pension benefit from the Pension Plans. Such payments totaling $
44.8
million and $
20.1
million were made in 2016 and 2015, respectively, using assets from the Pension Plans. The lump sum payments resulted in settlements of the Company’s benefit obligation. The actuarial gains in 2015 were due principally to increases in the discount rates.
Reconciliations of the fair value of the assets held by the Pension Plans and the funded status for each of the last two years were as follows:
|
(In millions)
|
2016
|
2015
|
|||||
|
Fair value of plan assets at beginning of year
|
$
|
567.4
|
|
$
|
654.8
|
|
|
|
Actual return (loss), net of plan expenses
|
67.7
|
|
(39.8
|
)
|
|||
|
Benefit payments
|
(75.6
|
)
|
(49.1
|
)
|
|||
|
Company contributions
|
100.0
|
|
1.5
|
|
|||
|
Fair value of plan assets at end of year
|
$
|
659.5
|
|
$
|
567.4
|
|
|
|
Funded status at end of year
|
$
|
32.0
|
|
$
|
(84.3
|
)
|
|
Amounts recognized in the Company’s Consolidated Balance Sheets were as follows:
|
|
Pension Plans
|
SERP Plans
|
Postretirement Plans
|
||||||||||||||||||||
|
(In millions)
|
2016
|
2015
|
2016
|
2015
|
2016
|
2015
|
|||||||||||||||||
|
Noncurrent assets
|
$
|
32.6
|
|
$
|
—
|
|
$
|
—
|
|
$
|
—
|
|
$
|
—
|
|
$
|
—
|
|
|||||
|
Current liabilities
|
—
|
|
—
|
|
(8.5
|
)
|
(7.5
|
)
|
(1.5
|
)
|
(1.9
|
)
|
|||||||||||
|
Non-current liabilities
|
(0.6
|
)
|
(84.3
|
)
|
(79.1
|
)
|
(81.1
|
)
|
(9.9
|
)
|
(13.9
|
)
|
|||||||||||
|
Net amount recognized
|
$
|
32.0
|
|
$
|
(84.3
|
)
|
$
|
(87.6
|
)
|
$
|
(88.6
|
)
|
$
|
(11.4
|
)
|
$
|
(15.8
|
)
|
|||||
Pre-tax amounts in AOCL that had not yet been recognized as components of net benefit cost in the Pension Plans, SERP Plans and Postretirement Plans were immaterial as of January 29, 2017 and January 31, 2016.
F-35
PVH CORP.
NOTES TO CONSOLIDATED FINANCIAL STATEMENTS - (Continued)
Pre-tax amounts in AOCL as of
January 29, 2017
expected to be recognized as components of net benefit cost in 2017 in the Pension Plans, SERP Plans and Postretirement Plans were immaterial.
The assets of the Pension Plans are invested with the objective of being able to meet current and future benefit payment needs, while controlling future contributions. The assets of the Pension Plans are diversified among United States equities, international equities, fixed income investments and cash. The strategic target allocation for the majority of the Pension Plans as of
January 29, 2017
was approximately
40%
United States equities,
20%
international equities and
40%
fixed income investments and cash. Equity securities primarily include investments in large-, mid- and small-cap companies located in the United States and abroad. Fixed income securities include corporate bonds of companies from diversified industries, municipal bonds, collective funds and United States Treasury bonds. Actual investment allocations may vary from the Company’s target investment allocations due to prevailing market conditions.
F-36
PVH CORP.
NOTES TO CONSOLIDATED FINANCIAL STATEMENTS - (Continued)
In accordance with the fair value hierarchy described in
Note 11
, “Fair Value Measurements,” the following tables show the fair value of the total assets of the Pension Plans for each major category as of
January 29, 2017
and
January 31, 2016
:
|
(In millions)
|
Fair Value Measurements as of
January 29, 2017
(8)
|
||||||||||||||
|
Asset Category
|
Total
|
Quoted Prices
In Active
Markets for
Identical Assets
(Level 1)
|
Observable
Inputs
(Level 2)
|
Unobservable
Inputs
(Level 3)
|
|||||||||||
|
Equity securities:
|
|
|
|
|
|||||||||||
|
United States equities
(1)
|
$
|
193.0
|
|
$
|
193.0
|
|
$
|
—
|
|
—
|
|
||||
|
International equities
(1)
|
12.2
|
|
12.2
|
|
—
|
|
—
|
|
|||||||
|
United States equity fund
(2)
|
51.6
|
|
—
|
|
51.6
|
|
—
|
|
|||||||
|
International equity funds
(3)
|
130.5
|
|
70.4
|
|
60.1
|
|
—
|
|
|||||||
|
Fixed income securities:
|
|
|
|
|
|
|
|
|
|||||||
|
Government securities
(4)
|
63.3
|
|
—
|
|
63.3
|
|
—
|
|
|||||||
|
Corporate securities
(4)
|
181.0
|
|
—
|
|
181.0
|
|
—
|
|
|||||||
|
Short-term investment funds
(5)
|
18.9
|
|
—
|
|
18.9
|
|
—
|
|
|||||||
|
Total return mutual fund
(6)
|
5.6
|
|
5.6
|
|
—
|
|
—
|
|
|||||||
|
Subtotal
|
$
|
656.1
|
|
$
|
281.2
|
|
$
|
374.9
|
|
—
|
|
||||
|
Other assets and liabilities
(7)
|
3.4
|
|
|
|
|
|
|
|
|||||||
|
Total
|
$
|
659.5
|
|
|
|
|
|
|
|
||||||
|
(In millions)
|
Fair Value Measurements as of
January 31, 2016
(8)
|
||||||||||||||
|
Asset Category
|
Total
|
Quoted Prices
In Active
Markets for
Identical Assets
(Level 1)
|
Observable
Inputs
(Level 2)
|
Unobservable
Inputs
(Level 3)
|
|||||||||||
|
Equity securities:
|
|
|
|
|
|||||||||||
|
United States equities
(1)
|
$
|
155.9
|
|
$
|
155.9
|
|
$
|
—
|
|
—
|
|
||||
|
International equities
(1)
|
13.2
|
|
13.2
|
|
—
|
|
—
|
|
|||||||
|
United States equity fund
(2)
|
34.1
|
|
—
|
|
34.1
|
|
—
|
|
|||||||
|
International equity funds
(3)
|
101.8
|
|
68.4
|
|
33.4
|
|
—
|
|
|||||||
|
Fixed income securities:
|
|
|
|
|
|
|
|
|
|||||||
|
Government securities
(4)
|
64.1
|
|
—
|
|
64.1
|
|
—
|
|
|||||||
|
Corporate securities
(4)
|
176.2
|
|
—
|
|
176.2
|
|
—
|
|
|||||||
|
Short-term investment funds
(5)
|
13.8
|
|
—
|
|
13.8
|
|
—
|
|
|||||||
|
Total return mutual fund
(6)
|
5.1
|
|
5.1
|
|
—
|
|
—
|
|
|||||||
|
Subtotal
|
$
|
564.2
|
|
$
|
242.6
|
|
$
|
321.6
|
|
—
|
|
||||
|
Other assets and liabilities
(7)
|
3.2
|
|
|
|
|
|
|
|
|||||||
|
Total
|
$
|
567.4
|
|
|
|
|
|
|
|
||||||
|
(1)
|
Valued at the closing price or unadjusted quoted price in the active market in which the individual securities are traded.
|
|
(2)
|
Valued at the net asset value of the fund, as determined by a pricing vendor or the fund family. The Company has the ability to redeem this investment at net asset value within the near term and therefore classifies this investment within Level 2. This commingled fund invests in United States large cap equities that track the Russell 1000 Index.
|
F-37
PVH CORP.
NOTES TO CONSOLIDATED FINANCIAL STATEMENTS - (Continued)
|
(3)
|
Valued at the net asset value of the funds, either as determined by the closing price in the active market in which the individual fund is traded and classified within Level 1, or as determined by a pricing vendor or the fund family and classified within Level 2. This category includes funds that invest in equities of companies outside of the United States.
|
|
(4)
|
Valued with bid evaluation pricing where the inputs are based on actual trades in active markets, when available, as well as observable market inputs that include actual and comparable trade data, market benchmarks, broker quotes, trading spreads and/or other applicable data.
|
|
(5)
|
Valued at the net asset value of the funds, as determined by a pricing vendor or the fund family. The Company has the ability to redeem these investments at net asset value within the near term and therefore classifies these investments within Level 2. These funds invest in high-grade, short-term, money market instruments.
|
|
(6)
|
Valued at the net asset value of the fund, as determined by the closing price in the active market in which the individual fund is traded. This fund invests in both equity securities and fixed income securities.
|
|
(7)
|
This category includes other pension assets and liabilities such as pending trades and accrued income.
|
|
(8)
|
The Company uses third party pricing services to determine the fair values of the financial instruments held by the Pension Plans. The Company obtains an understanding of the pricing services’ valuation methodologies and related inputs and validates a sample of prices provided by the pricing services by reviewing prices from other pricing sources and analyzing pricing data in certain instances. The Company has not adjusted any prices received from the third party pricing services.
|
The Company believes that there are no significant concentrations of risk within the plan assets as of
January 29, 2017
.
In 2016, two of the Company’s Pension Plans had projected benefit obligations in excess of plan assets and one of the Company’s Pension Plans had accumulated benefit obligations in excess of plan assets. In 2015, all of the Pension Plans had projected benefit obligations and accumulated benefit obligations in excess of plan assets. The balances were as follows:
|
(In millions, except plan count)
|
2016
|
2015
|
|||||
|
Number of plans with projected benefit obligations in excess of plan assets
|
2
|
|
5
|
|
|||
|
Aggregate projected benefit obligation
|
$
|
34.6
|
|
$
|
651.7
|
|
|
|
Aggregate fair value of related plan assets
|
$
|
34.0
|
|
$
|
567.4
|
|
|
|
Number of plans with accumulated benefit obligations in excess of plan assets
|
1
|
|
5
|
|
|||
|
Aggregate accumulated benefit obligation
|
$
|
3.3
|
|
$
|
610.7
|
|
|
|
Aggregate fair value of related plan assets
|
$
|
3.1
|
|
$
|
567.4
|
|
|
F-38
PVH CORP.
NOTES TO CONSOLIDATED FINANCIAL STATEMENTS - (Continued)
The components of net benefit cost and other pre-tax amounts recognized in other comprehensive loss in each of the last three years were as follows:
|
Net Benefit Cost Recognized in Selling, General and Administrative Expenses
|
||||||||||||||||||||||||||||||||||||
|
|
Pension Plans
|
SERP Plans
|
Postretirement Plans
|
|||||||||||||||||||||||||||||||||
|
(In millions)
|
2016
|
2015
|
2014
|
2016
|
2015
|
2014
|
2016
|
2015
|
2014
|
|||||||||||||||||||||||||||
|
Service cost, including plan expenses
|
$
|
25.2
|
|
$
|
30.6
|
|
$
|
20.0
|
|
$
|
4.4
|
|
$
|
5.6
|
|
$
|
4.5
|
|
$
|
—
|
|
$
|
—
|
|
$
|
—
|
|
|||||||||
|
Interest cost
|
29.8
|
|
27.8
|
|
28.5
|
|
3.9
|
|
3.7
|
|
4.0
|
|
0.5
|
|
0.6
|
|
0.8
|
|
||||||||||||||||||
|
Actuarial (gain) loss
|
(35.4
|
)
|
(10.1
|
)
|
121.8
|
|
(0.7
|
)
|
(9.1
|
)
|
13.9
|
|
(3.0
|
)
|
(1.0
|
)
|
3.2
|
|
||||||||||||||||||
|
Expected return on plan assets
|
(35.9
|
)
|
(42.5
|
)
|
(43.5
|
)
|
—
|
|
—
|
|
—
|
|
—
|
|
—
|
|
—
|
|
||||||||||||||||||
|
Amortization of prior service cost (credit)
|
0.0
|
|
0.0
|
|
0.0
|
|
(0.1
|
)
|
(0.1
|
)
|
(0.1
|
)
|
(0.3
|
)
|
(0.4
|
)
|
(0.8
|
)
|
||||||||||||||||||
|
Total
|
$
|
(16.3
|
)
|
$
|
5.8
|
|
$
|
126.8
|
|
$
|
7.5
|
|
$
|
0.1
|
|
$
|
22.3
|
|
$
|
(2.8
|
)
|
$
|
(0.8
|
)
|
$
|
3.2
|
|
|||||||||
|
Other Changes in Plan Assets and Benefit Obligations Recognized in Other Comprehensive Loss
|
|
|||||||||||||||||||||||||||||||||||
|
|
Pension Plans
|
SERP Plans
|
Postretirement Plans
|
|||||||||||||||||||||||||||||||||
|
(In millions)
|
2016
|
2015
|
2014
|
2016
|
2015
|
2014
|
2016
|
2015
|
2014
|
|||||||||||||||||||||||||||
|
Amortization of prior service (cost) credit
|
$
|
(0.0
|
)
|
$
|
(0.0
|
)
|
$
|
(0.0
|
)
|
$
|
0.1
|
|
$
|
0.1
|
|
$
|
0.1
|
|
$
|
0.3
|
|
$
|
0.4
|
|
$
|
0.8
|
|
|||||||||
Currently, the Company does not expect to make any material contributions to the Pension Plans in 2017. The Company’s actual contributions may differ from planned contributions due to many factors, including changes in tax and other benefit laws, or significant differences between expected and actual pension asset performance or interest rates. The expected benefit payments associated with the Pension Plans and SERP Plans, and expected benefit payments, net of retiree contributions, associated with the Postretirement Plans are as follows:
|
(In millions)
|
|
|
||||||||||
|
Fiscal Year
|
Pension Plans
|
SERP Plans
|
Postretirement Plans
|
|||||||||
|
2017
|
$
|
29.8
|
|
$
|
8.5
|
|
$
|
1.5
|
|
|||
|
2018
|
30.3
|
|
6.7
|
|
1.4
|
|
||||||
|
2019
|
30.7
|
|
6.8
|
|
1.3
|
|
||||||
|
2020
|
31.3
|
|
7.6
|
|
1.2
|
|
||||||
|
2021
|
32.1
|
|
7.9
|
|
1.1
|
|
||||||
|
2022-2026
|
175.0
|
|
46.7
|
|
4.2
|
|
||||||
The medical health care cost trend rate assumed for 2017 is
7.83%
and is assumed to decrease by approximately
0.17%
per year through 2038. Thereafter, the rate assumed is
4.48%
. If the assumed health care cost trend rate increased or decreased by
1%
, the aggregate effect on the service and interest cost components of the net postretirement benefit cost for
2016
and on the accumulated postretirement benefit obligation at
January 29, 2017
would be as follows:
|
(In millions)
|
1% Increase
|
1% Decrease
|
|||||
|
Impact on service and interest cost
|
$
|
0.0
|
|
$
|
(0.0
|
)
|
|
|
Impact on year end accumulated postretirement benefit obligation
|
0.7
|
|
(0.6
|
)
|
|||
F-39
PVH CORP.
NOTES TO CONSOLIDATED FINANCIAL STATEMENTS - (Continued)
Significant weighted average rate assumptions used in determining the projected and accumulated benefit obligations at the end of each year and benefit cost in the following year were as follows:
|
|
2016
|
2015
|
2014
|
|||||
|
Discount rate (applies to Pension Plans and SERP Plans)
|
4.59
|
%
|
4.72
|
%
|
3.94
|
%
|
||
|
Discount rate (applies to Postretirement Plans)
|
4.04
|
%
|
4.28
|
%
|
3.53
|
%
|
||
|
Rate of increase in compensation levels (applies to Pension Plans)
|
4.27
|
%
|
4.22
|
%
|
4.28
|
%
|
||
|
Long-term rate of return on assets (applies to Pension Plans)
|
6.50
|
%
|
6.50
|
%
|
6.75
|
%
|
||
To develop the expected weighted average long-term rate of return on assets assumption, the Company considered the historical level of the risk premium associated with the asset classes in which the portfolio is invested and the expectations for future returns of each asset class. The expected return for each asset class was then weighted based on the target asset allocation to develop the expected long-term rate of return on assets assumption for the portfolio.
The Company has savings and retirement plans and a supplemental savings plan for the benefit of its eligible employees in the United States who elect to participate. The Company matches a portion of employee contributions to the plans. The Company also has a defined contribution plan for certain employees associated with certain businesses acquired in the Tommy Hilfiger acquisition, whereby the Company pays a percentage of the contribution for the employee. The Company’s contributions to these plans were
$19.7
million,
$18.2
million and
$20.3
million in
2016
,
2015
and
2014
, respectively.
13. STOCKHOLDERS’ EQUITY
Acquisition of Treasury Shares
The Company’s Board of Directors authorized a $
500.0
million three-year stock repurchase program effective June 3, 2015. On March 21, 2017, the Board of Directors authorized a $
750
million increase to the program and extended the program to June 3, 2020. Repurchases under the program may be made from time to time over the period through open market purchases, accelerated share repurchase programs, privately negotiated transactions or other methods, as the Company deems appropriate. Purchases are made based on a variety of factors, such as price, corporate requirements and overall market conditions, applicable legal requirements and limitations, restrictions under the Company’s debt arrangements, trading restrictions under the Company’s insider trading policy and other relevant factors. The program may be modified by the Board of Directors, including to increase or decrease the repurchase limitation or extend, suspend, or terminate the program, at any time, without prior notice.
During 2016 and 2015, the Company purchased
3.2
million shares and
1.3
million shares, respectively, of its common stock under the program in open market transactions for $
315.1
million and $
126.2
million, respectively. As of January 29, 2017, the repurchased shares were held as treasury stock and $
58.7
million of the authorization remained available for future share repurchases.
Treasury stock activity also includes shares that were withheld in conjunction with the settlement of vested restricted stock, restricted stock units and performance share units to satisfy tax withholding requirements.
Common Stock Dividends
During each of
2016
,
2015
and
2014
, the Company paid
four
$0.0375
per share cash dividends on its common stock.
14. STOCK-BASED COMPENSATION
The Company grants stock-based awards under its 2006 Stock Incentive Plan (the “2006 Plan”). The 2006 Plan replaced certain other prior stock option plans. These other plans terminated upon the 2006 Plan’s initial stockholder approval in June 2006. Shares issued as a result of stock-based compensation transactions generally have been funded with the issuance of new shares of the Company’s common stock.
F-40
PVH CORP.
NOTES TO CONSOLIDATED FINANCIAL STATEMENTS - (Continued)
The Company may grant the following types of incentive awards under the 2006 Plan: (i) non-qualified stock options (“NQs”); (ii) incentive stock options (“ISOs”); (iii) stock appreciation rights; (iv) restricted stock; (v) restricted stock units (“RSUs”); (vi) performance shares; (vii) performance share units (“PSUs”); and (viii) other stock-based awards. Each award granted under the 2006 Plan is subject to an award agreement that incorporates, as applicable, the exercise price, the term of the award, the periods of restriction, the number of shares to which the award pertains, performance periods and performance measures, and such other terms and conditions as the plan committee determines.
Through
January 29, 2017
, the Company has granted under the 2006 Plan (i) service-based NQs, RSUs and restricted stock; (ii) contingently issuable PSUs; and (iii) RSUs that are intended to satisfy the performance-based condition for deductibility under Section 162(m) of the Internal Revenue Code. According to the terms of the 2006 Plan, for purposes of determining the number of shares available for grant, each share underlying a stock option award reduces the number available by
one
share and each share underlying a restricted stock award, RSU or PSU reduces the number available by
two
shares. The per share exercise price of options granted under the 2006 Plan cannot be less than the closing price of the common stock on the date of grant.
Total shares available for grant at
January 29, 2017
amounted to
7.0
million shares.
Net income for
2016
,
2015
and
2014
included $
38.2
million,
$42.0
million and
$48.7
million, respectively, of pre-tax expense related to stock-based compensation, with recognized income tax benefits of $
11.5
million, $
10.7
million and $
12.7
million, respectively.
The Company receives a tax deduction for certain transactions associated with its stock plan awards. The actual income tax benefits realized from these transactions were $
6.6
million,
$10.2
million and
$20.1
million in
2016
,
2015
and
2014
, respectively. Of those amounts, $
0.9
million,
$5.5
million and
$11.0
million, respectively, were reported as excess tax benefits. Excess tax benefits arise when the actual tax benefit resulting from a stock plan award transaction exceeds the tax benefit associated with the grant date fair value of the related stock award.
Stock Options
Stock options currently outstanding are generally exercisable in four equal annual installments commencing one year after the date of grant. The vesting of such options outstanding is also generally accelerated upon retirement (as defined in the 2006 Plan). Such options are granted with a 10-year term.
The Company estimates the fair value of stock options granted at the date of grant using the Black-Scholes-Merton model. The estimated fair value of the options, net of estimated forfeitures, is expensed over the options’ vesting periods.
The following summarizes the assumptions used to estimate the fair value of service-based stock options granted during
2016
,
2015
and
2014
:
|
|
2016
|
2015
|
2014
|
||||||||
|
Weighted average risk-free interest rate
|
1.45
|
%
|
1.54
|
%
|
2.15
|
%
|
|||||
|
Weighted average expected option term (in years)
|
6.25
|
|
6.25
|
|
6.25
|
|
|||||
|
Weighted average Company volatility
|
34.54
|
%
|
36.26
|
%
|
44.12
|
%
|
|||||
|
Expected annual dividends per share
|
$
|
0.15
|
|
$
|
0.15
|
|
$
|
0.15
|
|
||
|
Weighted average grant date fair value per option
|
$
|
35.62
|
|
$
|
40.20
|
|
$
|
56.21
|
|
||
The risk-free interest rate is based on United States Treasury yields in effect at the date of grant for periods corresponding to the expected option term. The expected option term represents the weighted average period of time that options granted are expected to be outstanding, based on vesting schedules and the contractual term of the options. Company volatility is based on the historical volatility of the Company’s common stock over a period of time corresponding to the expected option term. Expected dividends are based on the Company’s common stock cash dividend rate at the date of grant.
F-41
PVH CORP.
NOTES TO CONSOLIDATED FINANCIAL STATEMENTS - (Continued)
The Company has continued to utilize the simplified method to estimate the expected term for its “plain vanilla” stock options granted due to a lack of relevant historical data resulting, in part, from changes in the pool of employees receiving option grants, mainly due to acquisitions. The Company will continue to evaluate the appropriateness of utilizing such method.
Service-based stock option activity for the year was as follows:
|
(In thousands, except years and per option data)
|
Options
|
Weighted Average Exercise
Price Per Option
|
Weighted Average Remaining Contractual Life (Years)
|
Aggregate Intrinsic Value
|
||||||||
|
Outstanding at January 31, 2016
|
1,443
|
|
$
|
70.79
|
|
5.3
|
$
|
26,643
|
|
|||
|
Granted
|
237
|
|
99.59
|
|
|
|
|
|||||
|
Exercised
|
201
|
|
66.05
|
|
|
|
|
|||||
|
Cancelled
|
13
|
|
108.65
|
|
|
|
|
|||||
|
Outstanding at January 29, 2017
|
1,466
|
|
$
|
75.74
|
|
5.3
|
$
|
34,996
|
|
|||
|
Exercisable at January 29, 2017
|
1,009
|
|
$
|
61.90
|
|
3.9
|
$
|
34,996
|
|
|||
As of
January 29, 2017
, any service-based stock options that were outstanding but not yet exercisable had an intrinsic value of
zero
.
The aggregate grant date fair value of service-based options granted during
2016
,
2015
and
2014
was $
8.4
million,
$7.0
million and
$7.9
million, respectively.
The aggregate grant date fair value of service-based options that vested during
2016
,
2015
and
2014
was $
6.9
million,
$7.2
million and
$9.8
million, respectively.
The aggregate intrinsic value of service-based options exercised was $
6.9
million,
$8.4
million and
$15.6
million in
2016
,
2015
and
2014
, respectively.
At
January 29, 2017
, there was $
12.1
million of unrecognized pre-tax compensation expense, net of estimated forfeitures, related to non-vested stock options, which is expected to be recognized over a weighted average period of
1.6
years.
Restricted Stock Units
RSUs granted to employees in 2016 generally vest in four equal annual installments commencing one year after the date of grant. Outstanding RSUs granted to employees prior to 2016 generally vest in three annual installments of
25%
,
25%
and
50%
commencing
two
years after the date of grant. Service-based RSUs granted to non-employee directors vest in full
one
year after the date of grant. The underlying RSU award agreements (excluding agreements for non-employee director awards) generally provide for accelerated vesting upon the award recipient’s retirement (as defined in the 2006 Plan). The fair value of RSUs is equal to the closing price of the Company’s common stock on the date of grant and is expensed, net of estimated forfeitures, over the RSUs’ vesting periods.
F-42
PVH CORP.
NOTES TO CONSOLIDATED FINANCIAL STATEMENTS - (Continued)
RSU activity for the year was as follows:
|
(In thousands, except per RSU data)
|
RSUs
|
Weighted Average
Grant Date
Fair Value Per RSU
|
||||
|
Non-vested at January 31, 2016
|
653
|
|
$
|
111.61
|
|
|
|
Granted
|
394
|
|
98.29
|
|
||
|
Vested
|
159
|
|
108.88
|
|
||
|
Cancelled
|
76
|
|
108.61
|
|
||
|
Non-vested at January 29, 2017
|
812
|
|
$
|
105.96
|
|
|
The aggregate grant date fair value of RSUs granted during
2016
,
2015
and
2014
was $
38.8
million,
$31.7
million and
$29.3
million, respectively. The aggregate grant date fair value of RSUs vested during
2016
,
2015
and
2014
was $
17.3
million,
$18.1
million and
$18.5
million, respectively.
At
January 29, 2017
, there was $
45.1
million of unrecognized pre-tax compensation expense, net of estimated forfeitures, related to non-vested RSUs, which is expected to be recognized over a weighted average period of
1.7
years.
Performance Share Units
The Company granted contingently issuable PSUs to certain of the Company’s senior executives during 2013 and 2014 subject to the achievement of an earnings per share goal for the two-year performance period beginning with the year of grant and a service period of one year beyond the certification of performance. For the awards granted in 2014, the two-year performance period has ended and the holders did not earn any shares based on earnings per share growth over the performance period. For the awards granted in 2013, the holders earned an aggregate of
26,000
shares, which were paid out in 2016. For such awards, the Company recorded expense ratably over each applicable vesting period based on fair value and the Company’s expectations of the probable number of shares to be issued. The fair value of these contingently issuable PSUs was equal to the closing price of the Company’s common stock on the date of grant, reduced for the present value of any dividends expected to be paid on the Company’s common stock during the performance cycle, as these contingently issuable PSUs did not accrue dividends prior to the completion of the performance cycle.
In addition, the Company granted contingently issuable PSUs to certain of the Company’s executives during 2013 and to certain of the Company’s senior executives during 2015 and 2016 subject to a three-year performance period. For such awards, the final number of shares to be earned, if any, is contingent upon the Company’s achievement of goals for the applicable performance period, of which 50% is based upon the Company’s absolute stock price growth during the applicable performance period and 50% is based upon the Company’s total shareholder return during the applicable performance period relative to other companies included in the S&P 500 as of the date of grant. For the awards granted in 2013, the performance period ended on May 5, 2016 and the holders did not earn any shares, as the Company did not achieve either of the threshold performance levels required for payout. The Company records expense ratably over the applicable vesting period, net of estimated forfeitures, regardless of whether the market condition is satisfied because the awards are subject to market conditions. The fair value of the awards granted in 2016 and 2015 was established for each grant on the grant date using the Monte Carlo simulation model, which was based on the following assumptions:
|
2016
|
2015
|
||||||
|
Risk-free interest rate
|
1.04
|
%
|
0.90
|
%
|
|||
|
Expected Company volatility
|
28.33
|
%
|
29.10
|
%
|
|||
|
Expected annual dividends per share
|
$
|
0.15
|
|
$
|
0.15
|
|
|
|
Weighted average grant date fair value per PSU
|
$
|
87.16
|
|
$
|
101.23
|
|
|
Certain of the awards granted in 2016 are subject to a holding period of one year after the vesting date. For such awards, the grant date fair value was discounted
12.99%
for the restriction of liquidity.
F-43
PVH CORP.
NOTES TO CONSOLIDATED FINANCIAL STATEMENTS - (Continued)
PSU activity for the year was as follows:
|
(In thousands, except per PSU data)
|
PSUs
|
Weighted Average
Grant Date
Fair Value Per PSU
|
||||
|
Non-vested at January 31, 2016
|
493
|
|
$
|
121.41
|
|
|
|
Granted
|
79
|
|
87.16
|
|
||
|
Vested
|
26
|
|
114.77
|
|
||
|
Cancelled
|
421
|
|
124.01
|
|
||
|
Non-vested at January 29, 2017
|
125
|
|
$
|
92.32
|
|
|
The aggregate grant date fair value of PSUs granted during 2016, 2015 and 2014 was $
6.9
million,
$4.6
million and
$10.4
million, respectively. The aggregate grant date fair value of PSUs vested during 2016 and 2015 was $
3.0
million and
$4.8
million, respectively. No PSUs vested during 2014. PSUs in the above table and the aggregate grant date fair value amounts reflect (i) PSUs subject to market conditions at the target level, which is consistent with how expense will be recorded, regardless of the numbers of shares actually earned; and (ii) PSUs that are not subject to market conditions at the maximum level.
At
January 29, 2017
, there was $
7.1
million of unrecognized pre-tax compensation expense, net of estimated forfeitures, related to non-vested PSUs, which is expected to be recognized over a weighted average period of
2.0
years.
15. ACCUMULATED OTHER COMPREHENSIVE LOSS
The following table presents the changes in AOCL, net of related taxes, by component:
|
(In millions)
|
Foreign currency translation adjustments
|
Retirement liability adjustment
|
Net unrealized and realized gain on effective cash flow hedges
|
Total
|
|||||||||||
|
Balance at February 1, 2015
|
$
|
(496.2
|
)
|
$
|
0.4
|
|
$
|
79.3
|
|
$
|
(416.5
|
)
|
|||
|
Other comprehensive (loss) income before reclassifications
|
(234.3
|
)
|
—
|
|
33.1
|
|
(201.2
|
)
|
|||||||
|
Less: Amounts reclassified from AOCL
|
—
|
|
0.3
|
|
86.2
|
|
86.5
|
|
|||||||
|
Other comprehensive loss
|
(234.3
|
)
|
(0.3
|
)
|
(53.1
|
)
|
(287.7
|
)
|
|||||||
|
Balance at January 31, 2016
|
$
|
(730.5
|
)
|
$
|
0.1
|
|
$
|
26.2
|
|
$
|
(704.2
|
)
|
|||
|
Other comprehensive (loss) income before reclassifications
|
(63.8
|
)
|
(1)
|
—
|
|
5.2
|
|
(58.6
|
)
|
||||||
|
Less: Amounts reclassified from AOCL
|
(56.7
|
)
|
(2)
|
0.2
|
|
4.5
|
|
(52.0
|
)
|
||||||
|
Other comprehensive (loss) income
|
(7.1
|
)
|
(0.2
|
)
|
0.7
|
|
(6.6
|
)
|
|||||||
|
Balance at January 29, 2017
|
$
|
(737.6
|
)
|
$
|
(0.1
|
)
|
$
|
26.9
|
|
$
|
(710.8
|
)
|
|||
F-44
PVH CORP.
NOTES TO CONSOLIDATED FINANCIAL STATEMENTS - (Continued)
The following table presents reclassifications out of AOCL to earnings:
|
(In millions)
|
Amount Reclassified from AOCL
|
Amount Reclassified from AOCL
|
Affected Line Item in the Company’s Consolidated Income Statements
|
||||||
|
2016
|
2015
|
||||||||
|
Realized gain (loss) on effective cash flow hedges:
|
|||||||||
|
Foreign currency forward exchange contracts (inventory purchases)
|
$
|
14.0
|
|
$
|
92.1
|
|
Cost of goods sold
|
||
|
Interest rate contracts
|
(12.1
|
)
|
(3.7
|
)
|
Interest expense
|
||||
|
Less: Tax effect
|
(2.6
|
)
|
2.2
|
|
Income tax expense
|
||||
|
Total, net of tax
|
$
|
4.5
|
|
$
|
86.2
|
|
|||
|
Amortization of retirement liability items:
|
|||||||||
|
Prior service credit
|
$
|
0.4
|
|
$
|
0.5
|
|
Selling, general and administrative expenses
|
||
|
Less: Tax effect
|
0.2
|
|
0.2
|
|
Income tax expense
|
||||
|
Total, net of tax
|
$
|
0.2
|
|
$
|
0.3
|
|
|||
|
Foreign currency translation adjustments:
|
|||||||||
|
Mexico deconsolidation
|
$
|
(56.7
|
)
|
(2)
|
$
|
—
|
|
Other noncash gain, net
|
|
|
Less: Tax effect
|
—
|
|
—
|
|
Income tax expense
|
||||
|
Total, net of tax
|
$
|
(56.7
|
)
|
$
|
—
|
|
|||
|
(1)
|
Foreign currency translation adjustment losses included a net gain on net investment hedge of $
14.1
million.
|
|
(2)
|
Foreign currency translation adjustment losses were reclassified from AOCL during the fourth quarter of 2016 in connection with the Mexico deconsolidation. Please see
Note 5
, “Investments in Unconsolidated Affiliates,” for a further discussion.
|
16. LEASES
The Company leases retail locations, warehouses, showrooms, office space, equipment and a factory in Ethiopia. The leases, excluding equipment leases, generally provide for the payment of real estate taxes and certain other occupancy expenses. Retail location leases generally are renewable and provide for the payment of percentage rentals based on location sales and other costs associated with the leased property.
F-45
PVH CORP.
NOTES TO CONSOLIDATED FINANCIAL STATEMENTS - (Continued)
At
January 29, 2017
, minimum annual rental commitments under non-cancelable leases were as follows:
|
(In millions)
|
Capital
Leases
|
Operating
Leases
|
Total
|
||||||||
|
2017
|
$
|
4.7
|
|
$
|
457.6
|
|
$
|
462.3
|
|
||
|
2018
|
3.9
|
|
394.3
|
|
398.2
|
|
|||||
|
2019
|
2.9
|
|
327.5
|
|
330.4
|
|
|||||
|
2020
|
2.0
|
|
266.9
|
|
268.9
|
|
|||||
|
2021
|
1.8
|
|
221.2
|
|
223.0
|
|
|||||
|
Thereafter
|
4.0
|
|
697.6
|
|
701.6
|
|
|||||
|
Total minimum lease payments
|
$
|
19.3
|
|
$
|
2,365.1
|
|
$
|
2,384.4
|
|
||
|
Less: Amount representing interest
|
(2.9
|
)
|
|
|
|
|
|||||
|
Present value of net minimum capital lease payments
|
$
|
16.4
|
|
|
|
|
|
||||
The Company’s retail location leases represent $
1,575.8
million of the total minimum lease payments. The Company’s administrative offices and showrooms located in New York, New York represent $
465.9
million of the total minimum lease payments. The Company’s Europe headquarters and showrooms, the largest of which are located in Amsterdam, the Netherlands, represent $
114.2
million of the total minimum lease payments.
At
January 29, 2017
, aggregate future minimum rentals to be received under non-cancelable capital and operating subleases were $
2.1
million and $
3.0
million, respectively.
Rent expense was as follows:
|
(In millions)
|
2016
|
2015
|
2014
|
||||||||
|
Minimum
|
$
|
437.0
|
|
$
|
413.8
|
|
$
|
434.5
|
|
||
|
Percentage and other
|
143.0
|
|
146.7
|
|
158.8
|
|
|||||
|
Less: Sublease rental income
|
(4.9
|
)
|
(4.6
|
)
|
(4.9
|
)
|
|||||
|
Total
|
$
|
575.1
|
|
$
|
555.9
|
|
$
|
588.4
|
|
||
The gross book value of assets under capital leases, which are classified within property, plant and equipment in the Company’s Consolidated Balance Sheets, amounted to $
30.1
million and
$25.1
million as of
January 29, 2017
and
January 31, 2016
, respectively. Accumulated amortization related to assets under capital leases amounted to $
13.5
million and
$10.1
million as of
January 29, 2017
and
January 31, 2016
, respectively. The Company includes amortization of assets under capital leases in depreciation and amortization expense. The Company did not incur any expense in percentage rentals under capital leases during the years ended
January 29, 2017
and
January 31, 2016
.
F-46
PVH CORP.
NOTES TO CONSOLIDATED FINANCIAL STATEMENTS - (Continued)
17. NET INCOME PER COMMON SHARE
The Company computed its basic and diluted net income per common share as follows:
|
(In millions, except per share data)
|
2016
|
2015
|
2014
|
||||||||
|
Net income attributable to PVH Corp.
|
$
|
549.0
|
|
$
|
572.4
|
|
$
|
439.0
|
|
||
|
Weighted average common shares outstanding for basic net income per common share
|
80.2
|
|
82.4
|
|
82.4
|
|
|||||
|
Weighted average impact of dilutive securities
|
0.7
|
|
0.7
|
|
0.9
|
|
|||||
|
Total shares for diluted net income per common share
|
80.9
|
|
83.1
|
|
83.3
|
|
|||||
|
Basic net income per common share attributable to PVH Corp.
|
$
|
6.84
|
|
$
|
6.95
|
|
$
|
5.33
|
|
||
|
Diluted net income per common share attributable to PVH Corp.
|
$
|
6.79
|
|
$
|
6.89
|
|
$
|
5.27
|
|
||
Potentially dilutive securities excluded from the calculation of diluted net income per common share as the effect would be anti-dilutive were as follows:
|
(In millions)
|
2016
|
2015
|
2014
|
|||||
|
Weighted average potentially dilutive securities
|
0.8
|
|
0.6
|
|
0.4
|
|
||
Shares underlying contingently issuable awards that have not met the necessary conditions as of the end of a reporting period are not included in the calculation of diluted net income per common share for that period. The Company had contingently issuable awards outstanding that did not meet the performance conditions as of
January 29, 2017
,
January 31, 2016
and
February 1, 2015
and, therefore, were excluded from the calculation of diluted net income per common share for each applicable year. The maximum number of potentially dilutive shares that could be issued upon vesting for such awards was
0.3
million,
0.9
million and
0.9
million as of
January 29, 2017
,
January 31, 2016
and
February 1, 2015
, respectively. These amounts were also excluded from the computation of weighted average potentially dilutive securities in the table above.
18. NONCASH INVESTING AND FINANCING TRANSACTIONS
Omitted from the Company’s Consolidated Statement of Cash Flows for
2016
were capital expenditures related to property, plant and equipment of $
35.6
million, which will not be paid until 2017. The Company paid
$24.5
million in cash during
2016
related to property, plant and equipment that was acquired in
2015
. This amount was omitted from the Company’s Consolidated Statement of Cash Flows for
2015
. The Company paid
$17.0
million in cash during
2015
related to property, plant and equipment that was acquired in
2014
. This amount was omitted from the Company’s Consolidated Statement of Cash Flows for
2014
.
Omitted from purchases of property, plant and equipment in the Company’s Consolidated Statements of Cash Flows for
2016
,
2015
and
2014
were $
6.8
million,
$4.3
million and
$4.2
million, respectively, of assets acquired through capital leases.
Omitted from purchases of property, plant and equipment in the Company’s Consolidated Statement of Cash Flows for 2015 was
$4.1
million of leasehold improvements paid for directly by the lessor as a lease incentive to the Company.
The Company recorded increases to goodwill of $
52.6
million,
$51.7
million and
$50.5
million during
2016
,
2015
and
2014
, respectively, related to liabilities incurred for contingent purchase price payments to Mr. Calvin Klein. Such amounts are not due or paid in cash until 45 days subsequent to the Company’s applicable quarter end. As such, during
2016
,
2015
and
2014
, the Company paid $
53.1
million,
$50.7
million and
$51.1
million, respectively, in cash related to contingent purchase price payments to Mr. Calvin Klein that were recorded as additions to goodwill during the periods the liabilities were incurred.
The Company completed during 2016 the acquisition of TH China. Included in the acquisition consideration was the elimination of a $
2.8
million pre-acquisition receivable owed to the Company by TH China.
F-47
PVH CORP.
NOTES TO CONSOLIDATED FINANCIAL STATEMENTS - (Continued)
The Company recorded during 2016 a loss of $
11.2
million to write-off previously capitalized debt issuance costs in connection with the amendment of its credit facilities.
The Company recorded during 2014 a loss of $
17.5
million to write-off previously capitalized debt issuance costs in connection with the amendment and restatement of its senior secured credit facilities and the related redemption of its
7 3/8%
senior notes due 2020.
Omitted from investments in unconsolidated affiliates in the Company’s Consolidated Statement of Cash Flows for 2016 was a noncash increase in the investment balance related to the Company’s PVH Mexico joint venture of $
64.3
million resulting from the deconsolidation of the Mexico business during 2016. Please see
Note 5
, “Investments in Unconsolidated Affiliates” for further discussion.
Omitted from investments in unconsolidated affiliates in the Company’s Consolidated Statement of Cash Flows for 2014 were noncash increases in the investment balances related to the Company’s Calvin Klein Australia joint venture and Calvin Klein India joint venture of $
3.7
million and $
6.2
million, respectively, resulting from the deconsolidation of the Australia business and CK India during 2014. Please see
Note 5
, “Investments in Unconsolidated Affiliates,” and
Note 6
, “Redeemable Non-Controlling Interests,” for further discussion.
19. SEGMENT DATA
The Company manages its operations through its operating divisions, which are presented as
six
reportable segments: (i) Calvin Klein North America; (ii) Calvin Klein International; (iii) Tommy Hilfiger North America; (iv) Tommy Hilfiger International; (v) Heritage Brands Wholesale; and (vi) Heritage Brands Retail.
Calvin Klein North America Segment
- This segment consists of the Company’s Calvin Klein North America division. This segment derives revenue principally from (i) marketing
CALVIN KLEIN
branded apparel and related products at wholesale in North America, primarily to department and specialty stores and digital commerce sites operated by key department store customers and pure play digital commerce retailers; (ii) operating retail stores, which are primarily located in premium outlet centers in the United States and Canada, and digital commerce sites in North America, which sell
CALVIN KLEIN
branded apparel, accessories and related products; and (iii) licensing and similar arrangements relating to the use by third parties of the brand names
CALVIN KLEIN
,
CALVIN KLEIN 205 W39 NYC
and
CK Calvin Klein
for a broad array of products and retail services in North America. This segment also includes, since December 2016, the Company’s proportionate share of the net income or loss of its investment in its unconsolidated Calvin Klein foreign affiliate in Mexico.
Calvin Klein International Segment -
This segment consists of the Company’s Calvin Klein International division. This segment derives revenue principally from (i) marketing
CALVIN KLEIN
branded apparel and related products at wholesale principally in Europe, Asia and Brazil, primarily to department and specialty stores, digital commerce sites operated by key department store customers and pure play digital commerce retailers, franchisees of
CALVIN KLEIN,
distributors and licensees; (ii) operating retail stores and digital commerce sites in Europe, Asia and Brazil, which sell
CALVIN KLEIN
branded apparel, accessories and related products; and (iii) licensing and similar arrangements relating to the use by third parties of the brand names
CALVIN KLEIN 205 W39 NYC
,
CK Calvin Klein
and
CALVIN KLEIN
for a broad array of products and retail services outside of North America. This segment also includes the Company’s proportionate share of the net income or loss of its investments in unconsolidated Calvin Klein foreign affiliates in Australia and India.
Tommy Hilfiger North America Segment
- This segment consists of the Company’s Tommy Hilfiger North America division. This segment derives revenue principally from (i) marketing
Tommy Hilfiger
branded apparel and related products at wholesale in North America, primarily to department stores, principally Macy’s, Inc. and Hudson’s Bay Company, as well as digital commerce sites operated by these department store customers and pure play digital commerce retailers; (ii) operating retail stores, which are primarily located in premium outlet centers in North America, and digital commerce sites in North America, which sell
Tommy Hilfiger
branded apparel, accessories and related products; and (iii) licensing and similar arrangements relating to the use by third parties of the
Tommy Hilfiger
brand name for a broad array of products in North America. This segment also includes, since December 2016, the Company’s proportionate share of the net income or loss of its investment in its unconsolidated Tommy Hilfiger foreign affiliate in Mexico.
F-48
PVH CORP.
NOTES TO CONSOLIDATED FINANCIAL STATEMENTS - (Continued)
Tommy Hilfiger International Segment
- This segment consists of the Company’s Tommy Hilfiger International division. This segment derives revenue principally from (i) marketing
Tommy Hilfiger
branded apparel and related products at wholesale principally in Europe and China, primarily to department and specialty stores, digital commerce sites operated by key department store customers and pure play digital commerce retailers, franchisees of
Tommy Hilfiger
, distributors and licensees; (ii) operating retail stores in Europe, China and Japan and international digital commerce sites, which sell
Tommy Hilfiger
branded apparel, accessories and related products; and (iii) licensing and similar arrangements relating to the use by third parties of the
Tommy Hilfiger
brand name for a broad array of products outside of North America. This segment also includes the Company’s proportionate share of the net income or loss of its investments in unconsolidated Tommy Hilfiger foreign affiliates in Brazil, India and Australia. This segment included the Company’s proportionate share of the net income or loss of its investment in TH China until April 13, 2016, on which date the Company began to consolidate the operations as a wholly owned subsidiary of the Company in conjunction with the TH China acquisition. Please see
Note 2
, “Acquisitions,” for a further discussion.
Heritage Brands Wholesale Segment
- This segment consists of the Company’s Heritage Brands Wholesale division. This segment derives revenue primarily from the marketing to department, chain and specialty stores, digital commerce sites operated by select wholesale partners and pure play digital commerce retailers in North America of (i) dress shirts and neckwear under various owned and licensed brand names, including several private label brands; (ii) men’s sportswear principally under the brand names
Van Heusen
,
IZOD
and
ARROW
; (iii) swimwear, fitness apparel, swim accessories and related products under the brand name
Speedo
; and (iv) women’s intimate apparel under the brand names
Warner’s
and
Olga
. This segment also includes the Company’s proportionate share of the net income or loss of its investments in its unconsolidated Heritage Brands foreign affiliates in Australia and, since December 2016, in Mexico.
Heritage Brands Retail Segment -
This segment consists of the Company’s Heritage Brands Retail division. This segment derives revenue principally from operating retail stores, primarily located in outlet centers throughout the United States and Canada, which primarily sell apparel, accessories and related products
.
The Company exited the Izod retail business in the third quarter of 2015. As of the end of 2015, the Company’s Heritage Brands retail business primarily consisted of its
Van Heusen
stores but, beginning in 2015, the Company started offering a limited selection of
IZOD Golf
,
Warner’s
and
Speedo
products in some of its Heritage Brands stores. A majority of the Company’s Heritage Brands stores now offer a broad selection of
Van Heusen
men’s and women’s apparel with limited selections of these other brands, some of which feature multiple brand names on the door signage.
F-49
PVH CORP.
NOTES TO CONSOLIDATED FINANCIAL STATEMENTS - (Continued)
The following tables present summarized information by segment:
|
(In millions)
|
2016
|
(1)
|
2015
|
(1)
|
2014
|
||||||||
|
Revenue – Calvin Klein North America
|
|
|
|
||||||||||
|
Net sales
|
$
|
1,513.0
|
|
$
|
1,457.0
|
|
$
|
1,391.1
|
|
||||
|
Royalty revenue
|
131.7
|
|
133.7
|
|
115.6
|
|
|||||||
|
Advertising and other revenue
|
45.2
|
|
44.0
|
|
44.1
|
|
|||||||
|
Total
|
1,689.9
|
|
1,634.7
|
|
1,550.8
|
|
|||||||
|
Revenue – Calvin Klein International
|
|
|
|
|
|
|
|||||||
|
Net sales
|
1,346.2
|
|
1,183.4
|
|
1,198.8
|
|
|||||||
|
Royalty revenue
|
72.9
|
|
78.2
|
|
78.6
|
|
|||||||
|
Advertising and other revenue
|
26.2
|
|
26.3
|
|
30.6
|
|
|||||||
|
Total
|
1,445.3
|
|
1,287.9
|
|
1,308.0
|
|
|||||||
|
Revenue – Tommy Hilfiger North America
|
|
|
|
|
|
|
|||||||
|
Net sales
|
1,502.4
|
|
1,567.6
|
|
1,595.6
|
|
|||||||
|
Royalty revenue
|
48.9
|
|
42.4
|
|
30.2
|
|
|||||||
|
Advertising and other revenue
|
12.0
|
|
12.7
|
|
10.0
|
|
|||||||
|
Total
|
1,563.3
|
|
1,622.7
|
|
1,635.8
|
|
|||||||
|
Revenue – Tommy Hilfiger International
|
|
|
|
|
|
|
|||||||
|
Net sales
|
1,899.4
|
|
1,693.6
|
|
1,886.1
|
|
|||||||
|
Royalty revenue
|
44.5
|
|
49.3
|
|
56.2
|
|
|||||||
|
Advertising and other revenue
|
3.6
|
|
3.9
|
|
3.7
|
|
|||||||
|
Total
|
1,947.5
|
|
1,746.8
|
|
1,946.0
|
|
|||||||
|
Revenue – Heritage Brands Wholesale
|
|
|
|
|
|
|
|||||||
|
Net sales
|
1,271.6
|
|
1,387.6
|
|
1,425.1
|
|
|||||||
|
Royalty revenue
|
20.3
|
|
19.0
|
|
17.2
|
|
|||||||
|
Advertising and other revenue
|
3.9
|
|
2.9
|
|
2.7
|
|
|||||||
|
Total
|
1,295.8
|
|
1,409.5
|
|
1,445.0
|
|
|||||||
|
Revenue – Heritage Brands Retail
|
|
|
|
|
|
|
|||||||
|
Net sales
|
258.8
|
|
316.3
|
|
352.4
|
|
|||||||
|
Royalty revenue
|
2.3
|
|
2.2
|
|
2.7
|
|
|||||||
|
Advertising and other revenue
|
0.2
|
|
0.2
|
|
0.5
|
|
|||||||
|
Total
|
261.3
|
|
318.7
|
|
355.6
|
|
|||||||
|
Total Revenue
|
|
|
|
|
|
|
|||||||
|
Net sales
|
7,791.4
|
|
7,605.5
|
|
7,849.1
|
|
|||||||
|
Royalty revenue
|
320.6
|
|
324.8
|
|
300.5
|
|
|||||||
|
Advertising and other revenue
|
91.1
|
|
90.0
|
|
91.6
|
|
|||||||
|
Total
(2)
|
$
|
8,203.1
|
|
$
|
8,020.3
|
|
$
|
8,241.2
|
|
||||
|
(1)
|
Revenue was impacted by the strengthening of the United States dollar against foreign currencies in which the Company transacts significant levels of business. Please see section entitled “Results of Operations” in Management’s Discussion and Analysis of Financial Condition and Results of Operations included in Item 7 of this report for a further discussion.
|
|
(2)
|
No single customer accounted for more than
10%
of the Company’s revenue in
2016
,
2015
or
2014
.
|
F-50
PVH CORP.
NOTES TO CONSOLIDATED FINANCIAL STATEMENTS - (Continued)
|
(In millions)
|
2016
|
(1)
|
2015
|
(1)
|
2014
|
||||||||||||
|
Income before interest and taxes – Calvin Klein North America
|
$
|
123.9
|
|
(3)(7)(9)
|
$
|
226.4
|
|
(10)
|
$
|
225.6
|
|
(13)
|
|||||
|
Income before interest and taxes – Calvin Klein International
|
209.6
|
|
(7)(9)
|
186.6
|
|
(10)
|
118.7
|
|
(13)(15)
|
||||||||
|
Income before interest and taxes – Tommy Hilfiger North America
|
135.8
|
|
(4)
|
173.9
|
|
242.9
|
|
||||||||||
|
Income before interest and taxes – Tommy Hilfiger International
|
328.3
|
|
(5)(6)
|
224.7
|
|
261.2
|
|
||||||||||
|
Income before interest and taxes – Heritage Brands Wholesale
|
90.2
|
|
(7)
|
90.4
|
|
(10)(11)
|
96.6
|
|
(13)
|
||||||||
|
Income (loss) before interest and taxes – Heritage Brands Retail
|
8.8
|
|
(3.4
|
)
|
(12)
|
(24.8
|
)
|
(14)
|
|||||||||
|
Loss before interest and taxes – Corporate
(2)
|
(107.4
|
)
|
(7)(8)
|
(138.1
|
)
|
(10)
|
(390.3
|
)
|
(13)(16)
|
||||||||
|
Income before interest and taxes
|
$
|
789.2
|
|
|
$
|
760.5
|
|
$
|
529.9
|
|
|
||||||
|
(1)
|
Income (loss) before interest and taxes was significantly impacted by the strengthening of the United States dollar against foreign currencies in which the Company transacts significant levels of business. Please see section entitled “Results of Operations” in Management’s Discussion and Analysis of Financial Condition and Results of Operations included in Item 7 of this report for a further discussion.
|
|
(2)
|
Includes corporate expenses not allocated to any reportable segments, the Company’s proportionate share of the net income or loss of its investment in Karl Lagerfeld and Gazal and the results of PVH Ethiopia. Corporate expenses represent overhead operating expenses and include expenses for senior corporate management, corporate finance, information technology related to corporate infrastructure and actuarial gains and losses from the Company’s pension and other postretirement plans. Actuarial gains (losses) from the Company’s United States pension and other postretirement plans totaled $
39.1
million, $
20.2
million and $
(138.9)
million in
2016
,
2015
and
2014
, respectively.
|
|
(3)
|
Income before interest and taxes for 2016 included a noncash loss of $
81.8
million related to the Mexico deconsolidation. Please see
Note 5
, “Investments in Unconsolidated Affiliates” for a further discussion.
|
|
(4)
|
Income before interest and taxes for 2016 included costs of $
11.0
million associated with the early termination of the license agreement for the Tommy Hilfiger men’s tailored clothing business in North America in order to consolidate the men’s tailored businesses for all brands in North America under one partner (the “TH men’s tailored license termination”).
|
|
(5)
|
Income before interest and taxes for 2016 included a gain of $
18.1
million associated with a payment made to the Company to exit a
Tommy Hilfiger
flagship store in Europe.
|
|
(6)
|
Income before interest and taxes for 2016 included a noncash gain of $
153.1
million to write-up the Company’s equity investment in TH China to fair value in connection with the TH China acquisition. Partially offsetting the gain were acquisition related costs of $
76.9
million, principally consisting of valuation adjustments and amortization of short-lived assets, and a one-time cost of $
5.9
million recorded on the Company’s equity investment in TH China. Please see
Note 2
, “Acquisitions,” for a further discussion.
|
|
(7)
|
Income (loss) before interest and taxes for 2016 included costs of $
9.8
million associated with the integration of Warnaco and the related restructuring. Such costs were included in the Company’s segments as follows: $
0.2
million in Calvin Klein North America; $
2.6
million in Calvin Klein International; $
0.4
million in Heritage Brands Wholesale; and $
6.6
million in corporate expenses not allocated to any reportable segments.
|
|
(8)
|
Loss before interest and taxes for 2016 included costs of $
15.8
million related to the Company’s amendment of its credit facilities. Please see
Note 8
, “Debt,” for a further discussion.
|
F-51
PVH CORP.
NOTES TO CONSOLIDATED FINANCIAL STATEMENTS - (Continued)
|
(9)
|
Income before interest and taxes for 2016 included costs of $
5.5
million associated with the restructuring related to the new global creative strategy for
CALVIN KLEIN
. Such costs were included in the Company’s segments as follows: $
2.7
million in Calvin Klein North America; and $
2.8
million in Calvin Klein International.
|
|
(10)
|
Income (loss) before interest and taxes for 2015 includes costs of $
73.4
million associated with the integration of Warnaco and the related restructuring. Such costs were included in the Company’s segments as follows: $
8.3
million in Calvin Klein North America; $
12.9
million in Calvin Klein International; $
8.1
million in Heritage Brands Wholesale and $
44.1
million in corporate expenses not allocated to any reportable segments.
|
|
(11)
|
Income before interest and taxes for 2015 included costs of $
16.5
million principally related to the discontinuation of several licensed product lines in the Heritage Brands dress furnishings business.
|
|
(12)
|
Loss before interest and taxes for 2015 includes costs of $
10.3
million related to the operation of and exit from the Izod retail business.
|
|
(13)
|
Income (loss) before interest and taxes for 2014 includes costs of $
139.4
million associated with the integration of Warnaco and the related restructuring. Such costs were included in the Company’s segments as follows: $
14.0
million in Calvin Klein North America; $
51.1
million in Calvin Klein International; $
17.7
million in Heritage Brands Wholesale and $
56.6
million in corporate expenses not allocated to any reportable segments.
|
|
(14)
|
Loss before interest and taxes for 2014 includes costs of $
21.0
million associated with the exit from the Company’s Izod retail business, the majority of which was noncash impairment charges.
|
|
(15)
|
Income before interest and taxes for 2014 includes a net gain of $
8.0
million associated with the deconsolidation of certain Calvin Klein subsidiaries in Australia and the Company’s previously consolidated Calvin Klein joint venture in India. Please see
Note 5
, “Investments in Unconsolidated Affiliates” and
Note 6
, “Redeemable Non-Controlling Interests” for further discussion.
|
|
(16)
|
Loss before interest and taxes for 2014 includes costs of $
93.1
million associated with the Company’s amendment and restatement of its credit facilities and the related redemption of its 7 3/8% senior notes due 2020. Please see
Note 8
, “Debt,” for a further discussion.
|
Intersegment transactions primarily consist of transfers of inventory principally from the Heritage Brands Wholesale segment to the Heritage Brands Retail segment, the Calvin Klein North America segment and the Tommy Hilfiger North America segment. These transfers are recorded at cost plus a standard markup percentage. Such markup percentage on ending inventory is eliminated principally in the Heritage Brands Retail segment, the Calvin Klein North America segment and the Tommy Hilfiger North America Segment.
F-52
PVH CORP.
NOTES TO CONSOLIDATED FINANCIAL STATEMENTS - (Continued)
|
(In millions)
|
2016
|
2015
|
2014
|
||||||||||
|
Identifiable Assets
|
|
|
|
||||||||||
|
Calvin Klein North America
(1)
|
$
|
1,752.1
|
|
$
|
1,935.7
|
|
$
|
1,834.9
|
|
||||
|
Calvin Klein International
|
2,821.0
|
|
2,752.8
|
|
2,819.9
|
|
|||||||
|
Tommy Hilfiger North America
|
1,229.8
|
|
1,222.8
|
|
1,258.6
|
|
|||||||
|
Tommy Hilfiger International
(2)
|
3,481.3
|
|
3,213.1
|
|
3,255.8
|
|
|||||||
|
Heritage Brands Wholesale
|
1,203.5
|
|
1,297.0
|
|
1,342.7
|
|
|||||||
|
Heritage Brands Retail
|
75.5
|
|
76.1
|
|
91.9
|
|
|||||||
|
Corporate
(3)
|
504.7
|
|
176.3
|
|
192.8
|
|
|||||||
|
Total
|
$
|
11,067.9
|
|
$
|
10,673.8
|
|
$
|
10,796.6
|
|
||||
|
Depreciation and Amortization
|
|
|
|
|
|
|
|||||||
|
Calvin Klein North America
|
$
|
47.6
|
|
$
|
43.3
|
|
$
|
38.0
|
|
||||
|
Calvin Klein International
|
70.5
|
|
61.1
|
|
58.6
|
|
|||||||
|
Tommy Hilfiger North America
|
35.3
|
|
35.4
|
|
31.9
|
|
|||||||
|
Tommy Hilfiger International
(4)
|
139.2
|
|
87.0
|
|
87.4
|
|
|||||||
|
Heritage Brands Wholesale
|
15.6
|
|
15.3
|
|
14.6
|
|
|||||||
|
Heritage Brands Retail
|
5.4
|
|
5.2
|
|
7.2
|
|
|||||||
|
Corporate
|
8.2
|
|
10.1
|
|
7.0
|
|
|||||||
|
Total
|
$
|
321.8
|
|
$
|
257.4
|
|
$
|
244.7
|
|
||||
|
Identifiable Capital Expenditures
(5)
|
|
|
|
|
|
|
|||||||
|
Calvin Klein North America
|
$
|
39.3
|
|
$
|
55.1
|
|
$
|
52.1
|
|
||||
|
Calvin Klein International
|
79.5
|
|
70.6
|
|
49.9
|
|
|||||||
|
Tommy Hilfiger North America
|
26.9
|
|
36.1
|
|
38.9
|
|
|||||||
|
Tommy Hilfiger International
|
82.0
|
|
83.2
|
|
93.2
|
|
|||||||
|
Heritage Brands Wholesale
|
14.1
|
|
14.6
|
|
10.2
|
|
|||||||
|
Heritage Brands Retail
|
7.0
|
|
4.4
|
|
8.2
|
|
|||||||
|
Corporate
|
8.9
|
|
7.3
|
|
6.7
|
|
|||||||
|
Total
|
$
|
257.7
|
|
$
|
271.3
|
|
$
|
259.2
|
|
||||
|
(1)
|
Identifiable assets in 2016 included a net reduction of $
125.6
million resulting from the Mexico deconsolidation. Please see
Note 5
, “Investments in Unconsolidated Affiliates,” for a further discussion.
|
|
(2)
|
Identifiable assets in 2016 included a net increase of $
387.3
million resulting from the TH China acquisition. Please see
Note 2
, “Acquisitions,” for a further discussion.
|
|
(3)
|
The increase in Corporate identifiable assets in 2016 is largely due to an increase in cash.
|
|
(4)
|
Depreciation and amortization in 2016 included a $
47.1
million increase in amortization resulting from the TH China acquisition. Please see
Note 2
, “Acquisitions,” and Note 7, “Goodwill and Other Intangible Assets,” for further discussion.
|
|
(5)
|
Capital expenditures in
2016
included $
35.6
million of accruals that will not be paid until 2017. Capital expenditures in
2015
included $
24.5
million of accruals that were not paid until
2016
. Capital expenditures in
2014
included $
17.0
million of accruals that were not paid until
2015
.
|
F-53
PVH CORP.
NOTES TO CONSOLIDATED FINANCIAL STATEMENTS - (Continued)
Property, plant and equipment, net based on the location where such assets are held, was as follows:
|
(In millions)
|
2016
(1)
|
2015
(1)
|
2014
|
||||||||
|
Domestic
|
$
|
412.8
|
|
$
|
419.1
|
|
$
|
388.6
|
|
||
|
Canada
|
31.0
|
|
31.8
|
|
38.3
|
|
|||||
|
Europe
|
230.5
|
|
221.6
|
|
230.2
|
|
|||||
|
Asia
(2)
|
66.8
|
|
57.9
|
|
53.1
|
|
|||||
|
Other foreign
(3)
|
18.8
|
|
14.2
|
|
15.5
|
|
|||||
|
Total
|
$
|
759.9
|
|
$
|
744.6
|
|
$
|
725.7
|
|
||
|
(1)
|
Property, plant and equipment, net was impacted by the strengthening of the United States dollar against certain foreign currencies in which the Company transacts significant levels of business. Please see section entitled “Results of Operations” in Management’s Discussion and Analysis of Financial Condition and Results of Operations included in Item 7 of this report for a further discussion.
|
|
(2)
|
Property, plant and equipment, net as of January 29, 2017 included an increase resulting from the TH China acquisition. Please see
Note 2
, “Acquisitions,” for a further discussion of the TH China acquisition.
|
|
(3)
|
Property, plant and equipment, net as of January 29, 2017 included a net increase, consisting of an increase related to PVH Ethiopia, partially offset by a decrease as a result of the Mexico deconsolidation. Please see
Note 6
, “Redeemable Non-Controlling Interests”and
Note 5
, “Investments in Unconsolidated Affiliates,” for further discussion of PVH Ethiopia and the Mexico deconsolidation, respectively.
|
Revenue, based on location of origin, was as follows:
|
(In millions)
|
2016
(1)
|
2015
(1)
|
2014
|
||||||||
|
Domestic
|
$
|
4,226.6
|
|
$
|
4,406.2
|
|
$
|
4,404.8
|
|
||
|
Canada
|
484.5
|
|
454.2
|
|
468.5
|
|
|||||
|
Europe
|
2,372.7
|
|
2,130.8
|
|
2,304.9
|
|
|||||
|
Asia
(2)
|
910.4
|
|
785.3
|
|
779.3
|
|
|||||
|
Other foreign
(3)
|
208.9
|
|
243.8
|
|
283.7
|
|
|||||
|
Total
|
$
|
8,203.1
|
|
$
|
8,020.3
|
|
$
|
8,241.2
|
|
||
|
(1)
|
Revenue was impacted by the strengthening of the United States dollar against foreign currencies in which the Company transacts significant levels of business. Please see section entitled “Results of Operations” in Management’s Discussion and Analysis of Financial Condition and Results of Operations included in Item 7 of this report for a further discussion.
|
|
(2)
|
Revenue in Asia in 2016 included an increase resulting from the TH China acquisition. Please see
Note 2
, “Acquisitions,” for a further discussion of the TH China acquisition.
|
|
(3)
|
Revenue in other foreign countries in 2016 included a decrease resulting from the Mexico deconsolidation. Please see
Note 5
, “Investments in Unconsolidated Affiliates,” for a further discussion of the Mexico deconsolidation.
|
20. GUARANTEES
The Company is deemed to have guaranteed lease payments for substantially all
Bass
retail stores included in the sale of substantially all of the assets of the Company’s Bass business in the fourth quarter of 2013 pursuant to the terms of noncancelable leases expiring on various dates through
2022
. These obligations deemed to be guaranteed include minimum rent
F-54
PVH CORP.
NOTES TO CONSOLIDATED FINANCIAL STATEMENTS - (Continued)
payments and relate to leases that commenced prior to the sale of the Bass assets. In certain instances, the Company’s obligations remain in effect when an option is exercised to extend the term of the lease. The maximum amount deemed to have been guaranteed for all leases as of
January 29, 2017
was $
23.2
million and the Company has the right to seek recourse from the buyer of the Bass assets for the full amount. The estimated fair value of these obligations as of
January 29, 2017
and
January 31, 2016
was $
1.1
million and $
1.9
million, respectively, which was included in accrued expenses and other liabilities in the Company’s Consolidated Balance Sheets. Please see
Note 11
, “Fair Value Measurements,” for a further discussion.
In connection with the Company’s investments in PVH Australia and CK India, the Company has guaranteed a portion of the entities’ debt and other obligations. The maximum amount guaranteed as of
January 29, 2017
was approximately $
11.5
million, which is subject to exchange rate fluctuation.
The guarantees are in effect for the entire terms of the respective obligations. The estimated fair value of these guarantee obligations was immaterial as of
January 29, 2017
and
January 31, 2016
, respectively.
The Company has certain other guarantees whereby it guaranteed the payment of amounts on behalf of certain other parties, none of which are material individually or in the aggregate.
21. OTHER COMMENTS
Included in accrued expenses in the Company’s Consolidated Balance Sheets were certain incentive compensation accruals of $
96.1
million and $
56.5
million as of
January 29, 2017
and
January 31, 2016
, respectively, and certain wholesale sales allowance accruals of $
113.7
million and
$112.6
million as of
January 29, 2017
and
January 31, 2016
, respectively.
The Company’s asset retirement obligations are included in other liabilities in the Company’s Consolidated Balance Sheets and relate to the Company’s obligation to dismantle or remove leasehold improvements from leased office, retail store or warehouse locations at the end of a lease term in order to restore a facility to a condition specified in the lease agreement. The Company records the fair value of the liability for asset retirement obligations in the period in which it is legally or contractually incurred. Upon initial recognition of the asset retirement liability, an asset retirement cost is capitalized by increasing the carrying amount of the asset by the same amount as the liability. In periods subsequent to initial measurement, the asset retirement cost is recognized as expense through depreciation over the asset’s useful life. Changes in the liability for the asset retirement obligations are recognized for the passage of time and revisions to either the timing or the amount of estimated cash flows. Accretion expense is recognized in selling, general and administrative expenses for the impacts of increasing the discounted fair value to its estimated settlement value.
The following table presents the activity related to the Company’s asset retirement obligations for each of the last two years:
|
(In millions)
|
2016
|
2015
|
|||||
|
Balance at beginning of year
|
$
|
17.9
|
|
$
|
16.2
|
|
|
|
Business acquisitions
|
0.4
|
|
—
|
|
|||
|
Liabilities incurred
|
3.9
|
|
4.4
|
|
|||
|
Liabilities settled (payments)
|
(0.6
|
)
|
(2.2
|
)
|
|||
|
Accretion expense
|
0.4
|
|
0.4
|
|
|||
|
Revisions in estimated cash flows
|
(0.2
|
)
|
(0.5
|
)
|
|||
|
Currency translation adjustment
|
0.0
|
|
(0.4
|
)
|
|||
|
Balance at end of year
|
$
|
21.8
|
|
$
|
17.9
|
|
|
The Company is a party to certain litigation which, in management’s judgment, based in part on the opinions of legal counsel, will not have a material adverse effect on the Company’s financial position.
Wuxi Jinmao Foreign Trade Co., Ltd. (“Wuxi”), one of the Company’s finished goods inventory suppliers, has a wholly owned subsidiary with which the Company entered into a loan agreement in 2016. Under the agreement, Wuxi’s subsidiary borrowed a principal amount of $
13.8
million for the development and operation of a fabric mill. Principal payments are due in semi-annual installments through November 29, 2026. The outstanding principal balance of the loan bears interest at a rate of
F-55
PVH CORP.
NOTES TO CONSOLIDATED FINANCIAL STATEMENTS - (Continued)
(i)
4.50%
per annum until the sixth anniversary of the closing date of the loan and (ii) a rate of LIBOR plus
4.00%
thereafter. As of
January 29, 2017
, the outstanding balance, including accrued interest, of $
13.9
million was included in other assets in the Company’s Consolidated Balance Sheet.
22. SUBSEQUENT EVENTS (UNAUDITED)
Subsequent to January 29, 2017, the Company completed the purchase of a group annuity using assets from the Pension Plans. Under the group annuity, the accrued pension obligations of approximately
4,000
select retiree participants who have deferred vested benefits under the Pension Plans were transferred to an insurer. The amount of the pension benefit obligation transferred was approximately $
65.3
million.
On March 20, 2017, the Company entered into agreements for a transaction to restructure its supply chain relationship with Li & Fung Trading Limited (“Li & Fung”). The transaction establishes a new strategic partnership with Li & Fung to provide services to the Company and also provides for the termination of the Company’s non-exclusive buying agency agreement with Li & Fung, pursuant to which the Company is obligated to source certain
Calvin Klein Jeans
products and at least
54%
of certain
Tommy Hilfiger
products through Li & Fung. The transaction is expected to close July 1, 2017. The Company expects to incur one-time costs of approximately $
55.0
million principally in connection with the termination of the non-exclusive buying agency agreement.
F-56
PVH CORP.
SELECTED QUARTERLY FINANCIAL DATA - UNAUDITED
(In millions, except per share data)
The following table sets forth selected quarterly financial data (unaudited) for the corresponding thirteen week periods of the fiscal years presented:
|
|
1
st
Quarter
|
2
nd
Quarter
|
|
3
rd
Quarter
|
|
4
th
Quarter
|
|||||||||||||||||||||||||
|
|
2016
(1),(2),(3),(4),(5)
|
2015
(11),(12),(13)
|
2016
(1),(2),(6)
|
2015
(11),(12),(13),(14)
|
2016
(1),(3),(7),(8)
|
2015
(11),(12),(13),(14)
|
2016
(1),(3),(8),(9),(10)
|
2015
(11),(12),(13),(14),(15),(16)
|
|||||||||||||||||||||||
|
Total revenue
|
$
|
1,917.8
|
|
$
|
1,879.3
|
|
$
|
1,933.3
|
|
|
$
|
1,864.0
|
|
|
$
|
2,244.3
|
|
|
$
|
2,164.5
|
|
|
$
|
2,107.7
|
|
|
$
|
2,112.5
|
|
||
|
Gross profit
|
1,006.9
|
|
985.6
|
|
1,033.8
|
|
|
1,002.1
|
|
|
1,191.6
|
|
|
1,101.0
|
|
|
1,138.0
|
|
|
1,072.9
|
|
||||||||||
|
Net income attributable to PVH Corp.
|
231.6
|
|
114.1
|
|
90.5
|
|
102.2
|
|
|
126.2
|
|
|
221.9
|
|
|
100.7
|
|
|
134.2
|
|
|||||||||||
|
Basic net income per common share attributable to PVH Corp.
|
2.85
|
|
1.38
|
|
1.12
|
|
1.24
|
|
|
1.58
|
|
|
2.69
|
|
|
1.27
|
|
|
1.64
|
|
|||||||||||
|
Diluted net income per common share attributable to PVH Corp.
|
2.83
|
|
1.37
|
|
1.11
|
|
1.22
|
|
|
1.56
|
|
|
2.67
|
|
|
1.26
|
|
|
1.63
|
|
|||||||||||
|
Price range of stock per common share
|
|
|
|
|
|
|
|
|
|
|
|
|
|
|
|
|
|
|
|
|
|||||||||||
|
High
|
100.00
|
|
113.84
|
|
103.36
|
|
|
118.27
|
|
|
115.40
|
|
|
120.67
|
|
|
114.88
|
|
|
96.16
|
|
||||||||||
|
Low
|
68.96
|
|
93.80
|
|
82.10
|
|
|
102.12
|
|
|
92.83
|
|
|
87.12
|
|
|
88.71
|
|
|
64.16
|
|
||||||||||
|
(1)
|
The first, second, third and fourth quarters of 2016 included pre-tax costs of $30.1 million, $20.3 million, $17.3 million and $15.1 million, respectively, associated with the TH China acquisition.
|
|
(2)
|
The first and second quarters of 2016 included pre-tax costs of $7.5 million and $2.3 million, respectively, associated with the integration of Warnaco and the related restructuring.
|
|
(3)
|
The first, third and fourth quarters of 2016 included tax benefits of $5.8 million, $7.8 million and $1.1 million, respectively, associated with discrete items related to the resolution of uncertain tax positions.
|
|
(4)
|
The first quarter of 2016 included pre-tax costs of $5.5 million associated with the restructuring related to the new global creative strategy for
CALVIN KLEIN
.
|
|
(5)
|
The first quarter of 2016 included a pre-tax noncash gain of $153.1 million to write-up the Company’s equity investment in TH China to fair value in connection with the TH China acquisition.
|
|
(6)
|
The second quarter of 2016 included pre-tax costs of $15.8 million associated with the Company’s amendment of its credit facilities.
|
|
(7)
|
The third quarter of 2016 included a pre-tax gain of $18.1 million associated with a payment made to the Company to exit a
Tommy Hilfiger
flagship store in Europe.
|
|
(8)
|
The third and fourth quarters of 2016 included pre-tax noncash losses of $76.9 million and $4.9 million, respectively, related to the Mexico deconsolidation.
|
|
(9)
|
The fourth quarter of 2016 included pre-tax costs of $11.0 million associated with the TH men’s tailored license termination.
|
|
(10)
|
The fourth quarter of 2016 included a pre-tax actuarial gain of $39.1 million from the Company’s pension and other postretirement plans.
|
F-57
|
(11)
|
The first, second, third and fourth quarters of 2015 included pre-tax costs of $18.8 million, $13.1 million, $18.9 million and $22.6 million, respectively, associated with the integration of Warnaco and the related restructuring.
|
|
(12)
|
The first, second, third and fourth quarters of 2015 included pre-tax costs of $0.5 million, $5.8 million, $2.8 million and $1.2 million, respectively, related to the operation of and exit from the Izod retail business.
|
|
(13)
|
The first, second, third and fourth quarters of 2015 included tax benefits of $2.3 million, $0.7 million, $18.5 million and $1.8 million, respectively, associated with discrete items primarily related to the resolution of uncertain tax positions.
|
|
(14)
|
The second, third and fourth quarters of 2015 included pre-tax costs of $3.3 million, $13.1 million and $0.1 million, respectively, principally related to the discontinuation of several licensed product lines in the Heritage Brands dress furnishings business.
|
|
(15)
|
The fourth quarter of 2015 included a pre-tax actuarial gain of $20.2 million from the Company’s pension and other postretirement plans.
|
|
(16)
|
The fourth quarter of 2015 included tax benefits of $11.2 million associated with discrete items related to the impact of enacted tax law and tax rate changes on deferred taxes.
|
F-58
MANAGEMENT’S REPORT ON INTERNAL CONTROL OVER FINANCIAL REPORTING
The management of the Company is responsible for the preparation and integrity of the consolidated financial statements appearing in this Annual Report on Form 10-K. The consolidated financial statements were prepared in conformity with accounting principles generally accepted in the United States and, accordingly, include certain amounts based on management’s best judgments and estimates.
The management of the Company is responsible for establishing and maintaining adequate internal control over financial reporting, as defined in Rules 13a-15(f) under the Securities Exchange Act of 1934. The Company’s internal control over financial reporting is designed to provide reasonable assurance regarding the reliability of financial reporting and the preparation of financial statements for external purposes in accordance with accounting principles generally accepted in the United States. The Company’s internal control over financial reporting includes those policies and procedures that (i) pertain to the maintenance of records that, in reasonable detail, accurately and fairly reflect the underlying transactions, including the acquisition and disposition of assets; (ii) provide reasonable assurance that the Company’s assets are safeguarded and transactions are executed in accordance with management’s authorization and are recorded as necessary to permit preparation of the Company’s consolidated financial statements in accordance with accounting principles generally accepted in the United States; and (iii) provide reasonable assurance regarding prevention or timely detection of unauthorized acquisition, use, or disposition of the Company’s assets that could have a material effect on the consolidated financial statements.
Because of its inherent limitations, internal control over financial reporting may not prevent or detect misstatements and even when determined to be effective, can only provide reasonable assurance with respect to financial statement preparation and presentation. Also, projections of any evaluation of effectiveness to future periods are subject to the risk that controls may become inadequate because of changes in conditions, or that the degree of compliance with the policies or procedures may deteriorate.
The Audit & Risk Management Committee of the Company’s Board of Directors, composed solely of directors who are independent in accordance with New York Stock Exchange listing standards, the Securities Exchange Act of 1934, the Company’s Corporate Governance Guidelines and the Committee’s charter, meets periodically with the Company’s independent auditors, the Company’s internal auditors and management to discuss internal control over financial reporting, auditing and financial reporting matters. Both the independent auditors and the Company’s internal auditors periodically meet alone with the Audit Committee and have free access to the Committee.
Management assessed the effectiveness of the Company’s internal control over financial reporting as of
January 29, 2017
. In making this assessment, management used the criteria set forth by the Committee of Sponsoring Organizations of the Treadway Commission (COSO) in Internal Control – Integrated Framework (2013 framework). Based on management’s assessment and those criteria, management believes that the Company maintained effective internal control over financial reporting as of
January 29, 2017
.
The Company’s independent auditors, Ernst & Young LLP, a registered public accounting firm, are appointed by the Audit & Risk Management Committee, subject to ratification by the Company’s stockholders. Ernst & Young LLP have audited and reported on the consolidated financial statements of the Company and the effectiveness of the Company’s internal control over financial reporting. The reports of the independent auditors are contained in this Annual Report on Form 10-K.
|
/s/ EMANUEL CHIRICO
|
/s/ MICHAEL SHAFFER
|
|
|
|
|
Emanuel Chirico
|
Michael Shaffer
|
|
Chairman and Chief Executive Officer
|
Executive Vice President and Chief
|
|
March 24, 2017
|
Operating & Financial Officer
|
|
|
March 24, 2017
|
F-59
REPORT OF INDEPENDENT REGISTERED PUBLIC ACCOUNTING FIRM
To the Board of Directors and Stockholders of PVH Corp.
We have audited PVH Corp.’s internal control over financial reporting as of
January 29, 2017
, based on criteria established in Internal Control-Integrated Framework issued by the Committee of Sponsoring Organizations of the Treadway Commission (2013 framework) (the COSO criteria). PVH Corp.’s management is responsible for maintaining effective internal control over financial reporting, and for its assessment of the effectiveness of internal control over financial reporting included in the accompanying Management’s Report on Internal Control over Financial Reporting. Our responsibility is to express an opinion on the company’s internal control over financial reporting based on our audit.
We conducted our audit in accordance with the standards of the Public Company Accounting Oversight Board (United States). Those standards require that we plan and perform the audit to obtain reasonable assurance about whether effective internal control over financial reporting was maintained in all material respects. Our audit included obtaining an understanding of internal control over financial reporting, assessing the risk that a material weakness exists, testing and evaluating the design and operating effectiveness of internal control based on the assessed risk, and performing such other procedures as we considered necessary in the circumstances. We believe that our audit provides a reasonable basis for our opinion.
A company’s internal control over financial reporting is a process designed to provide reasonable assurance regarding the reliability of financial reporting and the preparation of financial statements for external purposes in accordance with generally accepted accounting principles. A company’s internal control over financial reporting includes those policies and procedures that (1) pertain to the maintenance of records that, in reasonable detail, accurately and fairly reflect the transactions and dispositions of the assets of the company; (2) provide reasonable assurance that transactions are recorded as necessary to permit preparation of financial statements in accordance with generally accepted accounting principles, and that receipts and expenditures of the company are being made only in accordance with authorizations of management and directors of the company; and (3) provide reasonable assurance regarding prevention or timely detection of unauthorized acquisition, use, or disposition of the company’s assets that could have a material effect on the financial statements.
Because of its inherent limitations, internal control over financial reporting may not prevent or detect misstatements. Also, projections of any evaluation of effectiveness to future periods are subject to the risk that controls may become inadequate because of changes in conditions, or that the degree of compliance with the policies or procedures may deteriorate.
In our opinion, PVH Corp. maintained, in all material respects, effective internal control over financial reporting as of
January 29, 2017
, based on the COSO criteria.
We also have audited, in accordance with the standards of the Public Company Accounting Oversight Board (United States), the consolidated balance sheets of PVH Corp. as of
January 29, 2017
and
January 31, 2016
, and the related consolidated income statements, statements of comprehensive income (loss), statements of changes in stockholders’ equity and redeemable non-controlling interest and statements of cash flows for each of the three years in the period ended
January 29, 2017
of PVH Corp. and our report dated
March 24, 2017
expressed an unqualified opinion thereon.
/s/ ERNST & YOUNG LLP
New York, New York
March 24, 2017
F-60
REPORT OF INDEPENDENT REGISTERED PUBLIC ACCOUNTING FIRM
To the Board of Directors and Stockholders of PVH Corp.
We have audited the accompanying consolidated balance sheets of PVH Corp. as of
January 29, 2017
and
January 31, 2016
, and the related consolidated income statements, statements of comprehensive income (loss), statements of changes in stockholders' equity and redeemable non-controlling interest and statements of cash flows for each of the three years in the period ended
January 29, 2017
. Our audits also included the financial statement schedule listed in the Index at Item 15(a)(2). These financial statements and schedule are the responsibility of the Company's management. Our responsibility is to express an opinion on these financial statements and schedule based on our audits.
We conducted our audits in accordance with the standards of the Public Company Accounting Oversight Board (United States). Those standards require that we plan and perform the audit to obtain reasonable assurance about whether the financial statements are free of material misstatement. An audit includes examining, on a test basis, evidence supporting the amounts and disclosures in the financial statements. An audit also includes assessing the accounting principles used and significant estimates made by management, as well as evaluating the overall financial statement presentation. We believe that our audits provide a reasonable basis for our opinion.
In our opinion, the financial statements referred to above present fairly, in all material respects, the consolidated financial position of PVH Corp. at
January 29, 2017
and
January 31, 2016
, and the consolidated results of its operations and its cash flows for each of the three years in the period ended
January 29, 2017
, in conformity with U.S. generally accepted accounting principles. Also, in our opinion, the related financial statement schedule, when considered in relation to the basic financial statements taken as a whole, presents fairly in all material respects, the information set forth therein.
We also have audited, in accordance with the standards of the Public Company Accounting Oversight Board (United States), PVH Corp.’s internal control over financial reporting as of
January 29, 2017
, based on criteria established in Internal Control-Integrated Framework issued by the Committee of Sponsoring Organizations of the Treadway Commission (2013 framework) and our report dated
March 24, 2017
expressed an unqualified opinion thereon.
/s/ ERNST & YOUNG LLP
New York, New York
March 24, 2017
F-61
PVH CORP.
FIVE YEAR FINANCIAL SUMMARY
(In millions, except per share data, percents and ratios)
|
|
2016
(1)
|
2015
(2)
|
2014
(3)
|
2013
(4)
|
2012
(5)
|
||||||||||||||
|
Summary of Operations
|
|
|
|
|
|
||||||||||||||
|
Revenue
|
$
|
8,203.1
|
|
$
|
8,020.3
|
|
$
|
8,241.2
|
|
$
|
8,186.4
|
|
$
|
6,043.0
|
|
||||
|
Cost of goods sold, expenses and other income items
|
7,413.9
|
|
7,259.8
|
|
7,711.3
|
|
7,673.0
|
|
5,382.7
|
|
|||||||||
|
Income before interest and taxes
|
789.2
|
|
760.5
|
|
529.9
|
|
513.4
|
|
660.3
|
|
|||||||||
|
Interest expense, net
|
115.0
|
|
113.0
|
|
138.5
|
|
184.7
|
|
117.2
|
|
|||||||||
|
Income tax expense (benefit)
|
125.5
|
|
75.1
|
|
(47.5
|
)
|
185.3
|
|
109.3
|
|
|||||||||
|
Net loss attributable to redeemable non-controlling interest
|
(0.3
|
)
|
—
|
|
(0.1
|
)
|
(0.1
|
)
|
—
|
|
|||||||||
|
Net income attributable to PVH Corp.
|
$
|
549.0
|
|
$
|
572.4
|
|
$
|
439.0
|
|
$
|
143.5
|
|
$
|
433.8
|
|
||||
|
Per Share Statistics
|
|
|
|
|
|
|
|
|
|
|
|||||||||
|
Basic net income per common share attributable to PVH Corp.
|
$
|
6.84
|
|
$
|
6.95
|
|
$
|
5.33
|
|
$
|
1.77
|
|
$
|
5.98
|
|
||||
|
Diluted net income per common share attributable to PVH Corp.
|
6.79
|
|
6.89
|
|
5.27
|
|
1.74
|
|
5.87
|
|
|||||||||
|
Dividends paid per common share
|
0.15
|
|
0.15
|
|
0.15
|
|
0.15
|
|
0.15
|
|
|||||||||
|
Stockholders’ equity per common share
|
61.16
|
|
55.86
|
|
52.89
|
|
52.76
|
|
44.61
|
|
|||||||||
|
Financial Position
|
|
|
|
|
|
|
|
|
|
|
|||||||||
|
Current assets
(6)
|
$
|
2,879.6
|
|
$
|
2,804.5
|
|
$
|
2,777.7
|
|
$
|
2,831.3
|
|
$
|
2,387.3
|
|
||||
|
Current liabilities (including short-term borrowings and current portion of long-term debt)
|
1,564.8
|
|
1,527.2
|
|
1,428.1
|
|
1,551.2
|
|
1,162.4
|
|
|||||||||
|
Working capital
(6)
|
1,314.8
|
|
1,277.3
|
|
1,349.6
|
|
1,280.1
|
|
1,224.9
|
|
|||||||||
|
Total assets
(6)
|
11,067.9
|
|
10,673.8
|
|
10,796.6
|
|
11,376.1
|
|
7,654.7
|
|
|||||||||
|
Capital leases
|
16.4
|
|
14.6
|
|
18.1
|
|
25.3
|
|
31.1
|
|
|||||||||
|
Long-term debt
(6)
|
3,197.3
|
|
3,031.7
|
|
3,410.4
|
|
3,828.1
|
|
2,167.3
|
|
|||||||||
|
Stockholders’ equity
|
4,804.5
|
|
4,552.3
|
|
4,364.3
|
|
4,335.2
|
|
3,252.6
|
|
|||||||||
|
Other Statistics
|
|
|
|
|
|
|
|
|
|||||||||||
|
Total debt to total capital
(6)(7)
|
40.2
|
%
|
41.3
|
%
|
44.8
|
%
|
47.6
|
%
|
41.4
|
%
|
|||||||||
|
Net debt to net capital
(6)(8)
|
34.2
|
%
|
36.8
|
%
|
41.2
|
%
|
43.6
|
%
|
30.2
|
%
|
|||||||||
|
Current ratio
(6)
|
1.8
|
|
1.8
|
|
1.9
|
|
1.8
|
|
2.1
|
|
|||||||||
|
(1)
|
2016 includes (a) pre-tax costs of $9.8 million associated with the integration of Warnaco and related restructuring; (b) pre-tax costs of $5.5 million associated with the restructuring related to the new global creative strategy for
CALVIN KLEIN
; (c) a pre-tax noncash gain of $153.1 million to write up the Company’s equity investment in TH China to fair value in connection with the TH China acquisition, partially offset by pre-tax acquisition costs of $76.9 million, principally consisting of valuation adjustments and amortization of short-lived assets, and a one-time cost of $5.9 million recorded on the Company’s equity investment in TH China; (d) pre-tax costs of $15.8 million associated with the Company’s amendment of its credit facilities; (e) a pre-tax loss of $81.8 million related to the Mexico deconsolidation; (f) a pre-tax gain of $18.1 million associated with a payment made to the Company to exit a
Tommy Hilfiger
flagship store in Europe; (g) pre-tax costs of $11.0 million associated with the TH men’s tailored license termination; (h) a pre-tax actuarial gain of $39.1 million on pension and other postretirement plans; and (i) discrete tax benefits of $14.7 million related to the resolution of uncertain tax positions.
|
|
(2)
|
2015 includes (a) pre-tax costs of $73.4 million associated with the integration of Warnaco and the related restructuring; (b) pre-tax costs of $10.3 million related to the operation of and exit from the Izod retail business; (c) pre-tax costs of $16.5 million principally related to the discontinuation of several licensed product lines in the Heritage Brands dress furnishings business; (d) a pre-tax actuarial gain of $20.2 million on pension and other postretirement plans; and (e) discrete tax benefits of $34.5 million primarily related to the resolution of uncertain tax positions and the impact of enacted tax law and tax rate changes on deferred taxes.
|
|
(3)
|
2014 includes (a) pre-tax costs of $139.4 million associated with the integration of Warnaco and the related restructuring; (b) a net gain of $8.0 million associated with the deconsolidation of certain Calvin Klein subsidiaries in Australia and the previously consolidated Calvin Klein joint venture in India; (c) pre-tax costs
of $93.1 million associated with the amendment and restatement of the Company’s senior secured credit facilities and redemption of its 7 3/8% senior notes due 2020; (d) pre-tax costs of $21.0 million associated with the exit from the Izod retail business; (e) a pre-tax actuarial loss of $138.9 million on pension and other
|
F-62
postretirement plans; and (f) discrete tax benefits of $91.5 million primarily related to Warnaco integration activities and the resolution of uncertain tax positions.
|
(4)
|
2013 includes (a) pre-tax costs of $469.7 million associated with the acquisition and integration of Warnaco and the related restructuring; (b) pre-tax costs of $40.4 million associated with the debt modification and extinguishment; (c) pre-tax income of $24.3 million due to the amendment of an unfavorable contract; (d) a pre-tax loss of $20.2 million associated with the sale of substantially all of the assets of the Bass business; (e) a pre-tax actuarial gain of $52.5 million on pension and other postretirement plans; (f) a net tax expense of $5.2 million associated with non-recurring discrete items related to the Warnaco acquisition; and (g) a tax expense of $120.0 million related to an increase to a previously established liability for an uncertain tax position related to European and United States transfer pricing arrangements.
|
|
(5)
|
2012 includes (a) pre-tax costs of $20.5 million associated with the integration of Tommy Hilfiger and the related restructuring; (b) pre-tax costs of $42.6 million associated with the acquisition of Warnaco; (c) a pre-tax actuarial loss of $28.1 million on pension and other postretirement plans; and (d) a tax benefit of $14.0 million resulting from the recognition of previously unrecognized net operating loss assets and tax credits.
|
|
(6)
|
Amounts have been adjusted to reflect the retrospective application of the FASB guidance related to debt issuance costs, which was adopted by the Company in the first quarter of 2016. Please see
Note 1
, “Summary of Significant Accounting Policies” in the Notes to Consolidated Financial Statements included in Item 8 of this report for a further discussion.
|
|
(7)
|
Total capital equals total debt (including capital leases) plus stockholders’ equity.
|
|
(8)
|
Net debt and net capital equal total debt (including capital leases) plus total capital reduced by cash.
|
F-63
SCHEDULE II
PVH CORP.
VALUATION AND QUALIFYING ACCOUNTS
(In millions)
|
Column A
|
Column B
|
Column C
|
|
Column D
|
|
Column E
|
||||||||||||||
|
|
|
Additions Charged to Costs and Expenses
|
Additions Charged to
Other
Accounts
|
|
|
|
|
|||||||||||||
|
|
Balance at Beginning
of Period
|
|
|
|
Balance
at End
of Period
|
|||||||||||||||
|
|
|
|
|
|||||||||||||||||
|
Description
|
|
Deductions
|
(b)
|
|||||||||||||||||
|
Year Ended January 29, 2017
|
|
|
|
|
|
|
|
|||||||||||||
|
Allowance for doubtful accounts
|
$
|
18.1
|
|
$
|
6.1
|
|
$
|
—
|
|
$
|
9.2
|
|
(c)
|
$
|
15.0
|
|
||||
|
Allowance/accrual for operational chargebacks and customer markdowns (a)
|
291.9
|
|
551.0
|
|
|
—
|
|
553.4
|
|
(d)
|
289.5
|
|
||||||||
|
Total
|
$
|
310.0
|
|
$
|
557.1
|
|
$
|
—
|
|
$
|
562.6
|
|
|
$
|
304.5
|
|
||||
|
Year Ended January 31, 2016
|
|
|
|
|
|
|
|
|
|
|
|
|
||||||||
|
Allowance for doubtful accounts
|
$
|
19.0
|
|
$
|
5.1
|
|
$
|
—
|
|
$
|
6.0
|
|
(c)
|
$
|
18.1
|
|
||||
|
Allowance/accrual for operational chargebacks and customer markdowns (a)
|
273.3
|
|
554.4
|
|
—
|
|
535.8
|
|
|
291.9
|
|
|||||||||
|
Total
|
$
|
292.3
|
|
$
|
559.5
|
|
$
|
—
|
|
|
$
|
541.8
|
|
|
$
|
310.0
|
|
|||
|
Year Ended February 1, 2015
|
|
|
|
|
|
|
|
|
|
|
|
|
||||||||
|
Allowance for doubtful accounts
|
$
|
26.4
|
|
$
|
5.4
|
|
$
|
—
|
|
$
|
12.8
|
|
(c)
|
$
|
19.0
|
|
||||
|
Allowance/accrual for operational chargebacks and customer markdowns (a)
|
250.6
|
|
547.0
|
|
—
|
|
524.3
|
|
|
273.3
|
|
|||||||||
|
Total
|
$
|
277.0
|
|
$
|
552.4
|
|
$
|
—
|
|
|
$
|
537.1
|
|
|
$
|
292.3
|
|
|||
|
(a)
|
Contains activity associated with the wholesale sales allowance accrual included in accrued expenses. Please see
Note 21
, “Other Comments” for specified amounts.
|
|
(b)
|
Includes changes due to foreign currency translation.
|
|
(c)
|
Principally accounts written off as uncollectible, net of recoveries.
|
|
(d)
|
Includes impact of Mexico deconsolidation.
|
F-64
TABLE OF CONTENTS
Part IItem 1. BusinessItem 1A. Risk FactorsItem 1B. Unresolved Staff CommentsItem 2. PropertiesItem 3. Legal ProceedingsItem 4. Mine Safety DisclosuresPart IIItem 5. Market For Registrant S Common Equity, Related Stockholder Matters and Issuer Purchases Of Equity SecuritiesItem 6. Selected Financial DataItem 7. Management S Discussion and Analysis Of Financial Condition and Results Of OperationsItem 7A. Quantitative and Qualitative Disclosures About Market RiskItem 8. Financial Statements and Supplementary DataItem 9. Changes in and Disagreements with Accountants on Accounting and Financial DisclosureItem 9A. Controls and ProceduresItem 9B. Other InformationPart IIIItem 10. Directors, Executive Officers and Corporate GovernanceItem 11. Executive CompensationItem 12. Security Ownership Of Certain Beneficial Owners and Management and Related Stockholder MattersItem 13. Certain Relationships and Related Transactions, and Director IndependenceItem 14. Principal Accounting Fees and ServicesPart IVItem 15. Exhibits, Financial Statement SchedulesItem 16. Form 10-k Summary