PVH CORP. /DE/
10-Ks and 10-Qs
|
|
|
|
|
|
|
|
|
|
|
|
|
|
|
|
|
|
|
|
|
|
|
|
|
|
|
|
|
|
|
|
|
|
|
|
|
|
|
|
|
|
|
|
|
|
|
|
|
|
|
|
|
|
|
|
|
|
|
UNITED STATES
SECURITIES AND EXCHANGE COMMISSION
Washington, D. C. 20549
FORM 10-K
|
(Mark One)
|
|
|
|
x
|
ANNUAL REPORT PURSUANT TO SECTION 13 OR 15(d) OF THE SECURITIES EXCHANGE ACT OF 1934
|
|
|
|
For the fiscal year ended February 3, 2019
|
|
|
|
OR
|
|
|
o
|
TRANSITION REPORT PURSUANT TO SECTION 13 OR 15(d) OF THE SECURITIES EXCHANGE ACT OF 1934
|
|
|
|
For the transition period from _________ to ___________
|
|
|
|
Commission File Number
001-07572
|
|
|
PVH CORP.
|
(Exact name of registrant as specified in its charter)
|
Delaware
|
13-1166910
|
|
|
(State or other jurisdiction of incorporation or organization)
|
(I.R.S. Employer Identification No.)
|
|
|
200 Madison Avenue, New York, New York
|
10016
|
|
|
(Address of principal executive offices)
|
(Zip Code)
|
|
|
212-381-3500
|
|
(Registrant’s telephone number, including area code)
|
Securities registered pursuant to Section 12(b) of the Act:
|
Title of Each Class
|
Name of Each Exchange
on Which Registered
|
|
|
Common Stock, $1.00 par value
|
New York Stock Exchange
|
|
Securities registered pursuant to Section 12(g) of the Act:
None
______________________________
(Title of Class)
Indicate by check mark if the registrant is a well-known seasoned issuer, as defined in Rule 405 of the Securities Act. Yes
x
No
o
Indicate by check mark if the registrant is not required to file reports pursuant to Section 13 or Section 15(d) of the Act. Yes
o
No
x
Indicate by check mark whether registrant (1) has filed all reports required to be filed by Section 13 or 15(d) of the Securities Exchange Act of 1934 during the preceding 12 months (or for such shorter period that the registrant was required to file such reports), and (2) has been subject to such filing requirements for the past 90 days. Yes
x
No
o
Indicate by check mark whether the registrant has submitted electronically every Interactive Data File required to be submitted and posted pursuant to Rule 405 of Regulation S-T (§ 232.405 of this chapter) during the preceding 12 months (or for such shorter period that the registrant was required to submit such files). Yes
x
No
o
Indicate by check mark if disclosure of delinquent filers pursuant to Item 405 of Regulation S-K (§ 229.405 of this chapter) is not contained herein, and will not be contained, to the best of registrant’s knowledge, in definitive proxy or information statements incorporated by reference in Part III of this Form 10-K or any amendment to this Form 10-K.
o
Indicate by check mark whether the registrant is a large accelerated filer, an accelerated filer, a non-accelerated filer, or a smaller reporting company. or an emerging growth company. See the definitions of “large accelerated filer,” “accelerated filer,” “smaller reporting company,” and “emerging growth company” in Rule 12b-2 of the Exchange Act.
|
Large accelerated filer
x
|
Accelerated filer
o
|
|
Non-accelerated filer
o
(Do not check if a smaller reporting company)
|
Smaller reporting company
o
|
|
Emerging growth company
o
|
|
If an emerging growth company, indicate by check mark if the registrant has elected not to use the extended transition period for complying with any new or revised financial accounting standards provided pursuant to Section 13(a) of the Exchange Act.
o
Indicate by check mark whether the registrant is a shell company (as defined in Rule 12b-2 of the Act). Yes
o
No
x
The aggregate market value of the registrant’s voting and non-voting common equity held by non-affiliates of the registrant (assuming, for purposes of this calculation only, that the registrant’s directors and corporate officers are affiliates of the registrant) based upon the closing sale price of the registrant’s common stock on August 5, 2018 (the last business day of the registrant’s most recently completed second quarter) was
$11,484,972,142
.
Number of shares of Common Stock outstanding as of March 18, 2019:
75,146,409
DOCUMENTS INCORPORATED BY REFERENCE
|
Document
|
Location in Form 10-K
in which incorporated
|
|
|
Registrant’s Proxy Statement
for the Annual Meeting of Stockholders to be held on June 20, 2019 |
Part III
|
|
SAFE HARBOR STATEMENT UNDER THE PRIVATE SECURITIES LITIGATION REFORM ACT OF 1995: Forward-looking statements in this Annual Report on Form 10-K including, without limitation, statements relating to our future revenue, earnings and cash flows, plans, strategies, objectives, expectations and intentions are made pursuant to the safe harbor provisions of the Private Securities Litigation Reform Act of 1995. Investors are cautioned that such forward-looking statements are inherently subject to risks and uncertainties, many of which cannot be predicted with accuracy and some of which might not be anticipated, including, without limitation, (i) our plans, strategies, objectives, expectations and intentions are subject to change at any time at our discretion; (ii) we may be considered to be highly leveraged and we use a significant portion of our cash flows to service our indebtedness, as a result of which we might not have sufficient funds to operate our businesses in the manner we intend or have operated in the past; (iii) the levels of sales of our apparel, footwear and related products, both to our wholesale customers and in our retail stores, the levels of sales of our licensees at wholesale and retail, and the extent of discounts and promotional pricing in which we and our licensees and other business partners are required to engage, all of which can be affected by weather conditions, changes in the economy, fuel prices, reductions in travel, fashion trends, consolidations, repositionings and bankruptcies in the retail industries, repositionings of brands by our licensors, and other factors; (iv) our ability to manage our growth and inventory, including our ability to realize benefits from acquisitions, such as the acquisitions identified in this Annual Report on Form 10-K; (v) quota restrictions, the imposition of safeguard controls and the imposition of duties or tariffs on goods from the countries where we or our licensees produce goods under our trademarks, any of which, among other things, could limit the ability to produce products in cost-effective countries, or in countries that have the labor and technical expertise needed; (vi) the availability and cost of raw materials; (vii) our ability to adjust timely to changes in trade regulations and the migration and development of manufacturers (which can affect where our products can best be produced); (viii) changes in available factory and shipping capacity, wage and shipping cost escalation, civil conflict, war or terrorist acts, the threat of any of the foregoing, or political or labor instability in any of the countries where our or our licensees’ or other business partners’ products are sold, produced or are planned to be sold or produced; (ix) disease epidemics and health related concerns, which could result in closed factories, reduced workforces, scarcity of raw materials and scrutiny or embargoing of goods produced in infected areas, as well as reduced consumer traffic and purchasing, as consumers become ill or limit or cease shopping in order to avoid exposure; (x) acquisitions and divestitures and issues arising with acquisitions, divestitures and proposed transactions, including, without limitation, the ability to integrate an acquired entity or business into us with no substantial adverse effect on the acquired entity’s, the acquired business’s or our existing operations, employee relationships, vendor relationships, customer relationships or financial performance, and the ability to operate effectively and profitably our continuing businesses after the sale or other disposal of a subsidiary, business or the assets thereof; (xi) the failure of our licensees to market successfully licensed products or to preserve the value of our brands, or their misuse of our brands; (xii) significant fluctuations of the United States dollar against foreign currencies in which we transact significant levels of business; (xiii) our retirement plan expenses recorded throughout the year are calculated using actuarial valuations that incorporate assumptions and estimates about financial market, economic and demographic conditions, and differences between estimated and actual results give rise to gains and losses, which can be significant, that are recorded immediately in earnings, generally in the fourth quarter of the year; (xiv) the impact of new and revised tax legislation and regulations, particularly the United States Tax Cuts and Jobs Act of 2017 that might disproportionately affect us as compared to some of our peers due to our specific tax structure and greater percentage of revenues and income generated outside of the United States, and the legislation enacted in the Netherlands known as the “2019 Dutch Tax Plan”; and (xv) other risks and uncertainties indicated from time to time in our filings with the Securities and Exchange Commission.
We do not undertake any obligation to update publicly any forward-looking statement, including, without limitation, any estimate regarding revenue, earnings or cash flows, whether as a result of the receipt of new information, future events or otherwise.
PVH Corp.
Form 10-K
For the Year Ended February 3, 2019
Table of Contents
|
PART I
|
||
|
Item 1.
|
Business
|
|
|
Item 1A.
|
Risk Factors
|
|
|
Item 1B.
|
Unresolved Staff Comments
|
|
|
Item 2.
|
Properties
|
|
|
Item 3.
|
Legal Proceedings
|
|
|
Item 4.
|
Mine Safety Disclosures
|
|
|
PART II
|
||
|
Item 5.
|
Market for Registrant’s Common Equity, Related Stockholder Matters and Issuer Purchases of Equity Securities
|
|
|
Item 6.
|
Selected Financial Data
|
|
|
Item 7.
|
Management’s Discussion and Analysis of Financial Condition and Results of Operations
|
|
|
Item 7A.
|
Quantitative and Qualitative Disclosures About Market Risk
|
|
|
Item 8.
|
Financial Statements and Supplementary Data
|
|
|
Item 9.
|
Changes in and Disagreements with Accountants on Accounting and Financial Disclosure
|
|
|
Item 9A.
|
Controls and Procedures
|
|
|
Item 9B.
|
Other Information
|
|
|
PART III
|
||
|
Item 10.
|
Directors, Executive Officers and Corporate Governance
|
|
|
Item 11.
|
Executive Compensation
|
|
|
Item 12.
|
Security Ownership of Certain Beneficial Owners and Management and Related Stockholder Matters
|
|
|
Item 13.
|
Certain Relationships and Related Transactions, and Director Independence
|
|
|
Item 14.
|
Principal Accounting Fees and Services
|
|
|
PART IV
|
||
|
Item 15.
|
Exhibits, Financial Statement Schedules
|
|
|
Item 16.
|
Form 10-K Summary
|
|
|
Signatures
|
||
|
Index to Financial Statements and Financial Statement Schedule
|
||
PART I
Item 1. Business
Introduction
Unless the context otherwise requires, the terms “we,” “our” or “us” refer to PVH Corp. and its subsidiaries.
Our fiscal years are based on the 52-53 week period ending on the Sunday closest to February 1 and are designated by the calendar year in which the fiscal year commences. References to a year are to our fiscal year, unless the context requires otherwise. Our 2018 year commenced on February 5, 2018 and ended on February 3, 2019; our 2017 year commenced on January 30, 2017 and ended on February 4, 2018; and our 2016 year commenced on February 1, 2016 and ended on January 29, 2017.
References to the brand names
TOMMY HILFIGER
,
HILFIGER COLLECTION
,
TOMMY HILFIGER TAILORED
,
TOMMY JEANS, TOMMY SPORT
,
CALVIN KLEIN
,
CALVIN KLEIN 205 W39 NYC
,
CK CALVIN KLEIN
,
CALVIN KLEIN JEANS
,
CALVIN KLEIN UNDERWEAR
,
CALVIN KLEIN PERFORMANCE
,
Van Heusen
,
IZOD
,
ARROW
,
Speedo
,
Warner’s
,
Olga
,
True&Co.
,
Geoffrey Beene
,
Kenneth Cole New York
,
Kenneth Cole Reaction
,
Unlisted, a Kenneth Cole Production, MICHAEL Michael Kors
,
Michael Kors Collection
,
DKNY
and
Chaps
, and to other brand names in this report are to registered and common law trademarks owned by us or licensed to us by third parties and are identified by italicizing the brand name.
References to the acquisition of Warnaco refer to our February 2013 acquisition of The Warnaco Group, Inc. and its subsidiaries, which companies we refer to collectively as “Warnaco.”
References to the acquisition of Tommy Hilfiger refer to our May 2010 acquisition of Tommy Hilfiger B.V. and certain affiliated companies, which companies we refer to collectively as “Tommy Hilfiger.”
References to the acquisition of Calvin Klein refer to our February 2003 acquisition of Calvin Klein, Inc. and certain affiliated companies, which companies we refer to collectively as “Calvin Klein.”
We obtained the market and competitive position data used throughout this report from research, surveys or studies conducted by third parties (including, with respect to the brand rankings, the NPD Group/POS Tracking Service), information provided by customers, and industry or general publications. The United States department and chain store rankings to which we refer in this report are on a unit basis. Industry publications and surveys generally state that they have obtained information from sources believed to be reliable but do not guarantee the accuracy and completeness of such information. While we believe that each of these studies and publications and all other information are reliable, we have not independently verified such data and we do not make any representation as to the accuracy of such information.
Company Information
We were incorporated in the State of Delaware in 1976 as the successor to a business begun in 1881. Our principal executive offices are located at 200 Madison Avenue, New York, New York 10016; our telephone number is (212) 381-3500.
We make available at no cost, on our corporate website, PVH.com, our annual reports on Form 10-K, quarterly reports on Form 10-Q, current reports on Form 8-K and amendments to those reports filed or furnished pursuant to Section 13(a) or 15(d) of the Exchange Act as soon as reasonably practicable after we have electronically filed such material with the Securities and Exchange Commission (“SEC”). All such filings are also available on the SEC’s website at sec
.
gov.
We also make available at no cost on PVH.com, the charters of the committees of our Board of Directors, as well as our Corporate Governance Guidelines and Code of Business Conduct and Ethics.
Company Overview
We are one of the largest branded apparel companies in the world, with a history going back over 135 years. We have over 38,000 associates operating in over 40 countries and generated $9.7 billion in revenues in 2018. Our brand portfolio consists of nationally and internationally recognized trademarks, including the global designer lifestyle brands
TOMMY HILFIGER
and
CALVIN KLEIN
, as well as
Van Heusen
,
IZOD
,
ARROW
,
Warner’s
,
Olga
,
True&Co
and
Geoffrey Beene.
We
1
also license brands from third parties, including
Speedo
(licensed in perpetuity for North America and the Caribbean),
Kenneth Cole New York
,
Kenneth Cole Reaction
,
Unlisted, a Kenneth Cole Production, MICHAEL Michael Kors
,
Michael Kors Collection, DKNY
and
Chaps
. Our brand portfolio also consists of various other owned, licensed and private label brands.
We design and market branded dress shirts, neckwear, sportswear, jeanswear, performance apparel, intimate apparel, underwear, swimwear, swim products, handbags, accessories, footwear and other related products. Our brands are positioned to sell globally at various price points and in multiple channels of distribution. This enables us to offer products to a broad range of consumers, while minimizing competition among our brands and reducing our reliance on any one demographic group, product category, price point, distribution channel or region. We also license the use of our trademarks to third parties and joint ventures for product categories and in regions where we believe our licensees’ expertise can better serve our brands. During 2018, our directly operated businesses in North America consisted principally of wholesale sales under our
TOMMY HILFIGER
,
CALVIN KLEIN
,
Van Heusen
,
IZOD
,
ARROW
,
Speedo
,
Warner’s
,
Olga
and
Geoffrey Beene
trademarks; the operation of digital commerce sites under the
TOMMY HILFIGER
,
CALVIN KLEIN
,
Speedo
,
True&Co.
,
Van Heusen
and
IZOD
trademarks and the
styleBureau
.com digital commerce site; and the operation of retail stores, principally in premium outlet centers, primarily under our
TOMMY HILFIGER, CALVIN KLEIN
and certain of our heritage brands trademarks. Our directly operated businesses outside of North America consisted principally of our wholesale and retail sales in Europe and Asia under our
TOMMY HILFIGER
trademarks; our wholesale and retail sales in Europe, Asia and Latin America under our
CALVIN KLEIN
trademarks; and the operation of digital commerce sites under the
TOMMY HILFIGER
and
CALVIN KLEIN
trademarks. Our licensing activities principally related to the licensing worldwide of our
TOMMY HILFIGER
and
CALVIN KLEIN
trademarks for a broad array of product categories and for use in numerous discrete jurisdictions.
Our history of growth has been achieved through organic growth, as well as a number of acquisitions and strategic partnerships that have made us a more diversified global organization, with an extensive brand portfolio, retail footprint and distribution network, as well as a large consumer base. These acquisitions included Calvin Klein in 2003, Tommy Hilfiger in 2010, and Warnaco in 2013. We have also acquired or announced plans to acquire several regional licensed businesses where we believe that we have a core expertise and will continue to explore strategic acquisitions of licensed businesses, trademarks and companies that we believe are additive to our overall business.
We entered into on March 25, 2019 a definitive agreement to acquire the Tommy Hilfiger retail business in Hong Kong and certain other countries in Central and Southeast Asia from our current licensee in those markets (the “TH CSAP acquisition”). The closing is subject to customary conditions and regulatory approval and is expected to occur in the second quarter of 2019.
We entered into on February 20, 2019 a definitive agreement to acquire the approximately 78% interest in Gazal Corporation Limited (“Gazal”) that we do not already own (the “Australia acquisition”). We, along with Gazal, jointly own and manage a joint venture, PVH Brands Australia Pty. Limited (“PVH Australia”), which licenses and operates businesses under the
TOMMY HILFIGER
,
CALVIN KLEIN
and
Van Heusen
brands, along with other licensed and owned brands. PVH Australia will come under our full ownership as a result of the Australia acquisition. The closing is subject to customary conditions, including shareholder, court and regulatory approvals, and is expected to occur in the second quarter of 2019.
We acquired the
Geoffrey Beene
tradename from Geoffrey Beene, LLC (“Geoffrey Beene”) on April 20, 2018. Prior to the acquisition, we had licensed the rights to design, market and distribute
Geoffrey Beene
dress shirts and neckwear from Geoffrey Beene.
We restructured our supply chain relationship with Li & Fung Trading Limited (“Li & Fung”) in a transaction that closed on September 30, 2017. Our non-exclusive buying agency agreement with Li & Fung was terminated in connection with this transaction (the “Li & Fung termination”).
We acquired True & Co., a direct-to-consumer intimate apparel digital commerce retailer on March 30, 2017. This acquisition enabled us to participate further in the fast-growing online channel and provided a platform to increase innovation, data-driven decisions and speed in the way we serve our consumers across our channels of distribution.
We formed a joint venture in Mexico (“PVH Mexico”) in which we own a 49% economic interest on November 30, 2016. The joint venture was formed by merging our wholly owned subsidiary that principally operated and managed our Calvin Klein business in Mexico with a wholly owned subsidiary of Grupo Axo, S.A.P.I. de C.V. (“Grupo Axo”) that distributes certain
TOMMY HILFIGER
brand products in Mexico. In connection with the formation of PVH Mexico, we deconsolidated our wholly owned subsidiary (the “Mexico deconsolidation”). PVH Mexico licenses from certain of our wholly owned subsidiaries
2
the rights to distribute and sell certain
TOMMY HILFIGER
,
CALVIN KLEIN
,
Warner’s
,
Olga
and
Speedo
brand products in Mexico.
We acquired the 55% of the ownership interests in TH Asia, Ltd. (“TH China”), our former joint venture for
TOMMY HILFIGER
in China, that we did not already own (the “TH China acquisition”) on April 13, 2016. As a result of the TH China acquisition, we now operate directly our Tommy Hilfiger business in this market.
We entered into a licensing agreement with G-III Apparel Group, Ltd. (“G-III”) for the design, production and wholesale distribution of
TOMMY HILFIGER
womenswear in the United States and Canada (the “G-III license”) on February 1, 2016, which resulted in the discontinuation of our directly operated Tommy Hilfiger North America womenswear wholesale business in the fourth quarter of 2016.
We aggregate our reportable segments into three main businesses: (i) Tommy Hilfiger, which consists of the Tommy Hilfiger North America and Tommy Hilfiger International segments; (ii) Calvin Klein, which consists of the Calvin Klein North America and Calvin Klein International segments; and (iii) Heritage Brands, which consists of the Heritage Brands Wholesale and Heritage Brands Retail segments.
Note 20
, “
Segment Data
,” in the Notes to Consolidated Financial Statements included in Item 8 of this report contains information with respect to revenue, income before interest and taxes, assets, depreciation and amortization, and capital expenditures related to each segment, as well as information regarding our revenue generated by distribution channel and from foreign and domestic sources, and the geographic locations where our net property, plant and equipment is held.
Our 2018 revenue was $9.7 billion, of which over 50% was generated outside of the United States. Our global designer lifestyle brands,
TOMMY HILFIGER
and
CALVIN KLEIN
,
together generated over 80% of our revenue during 2018.
Tommy Hilfiger Business Overview
We believe
TOMMY HILFIGER
is one of the world’s leading designer lifestyle brands and is internationally recognized for celebrating the essence of classic American cool style with a preppy twist. Global retail sales of products sold under the
TOMMY HILFIGER
brands, including sales by our licensees, were approximately $8.5 billion in 2018. Our Tommy Hilfiger business markets its products under several brands in order to fully capitalize on its global appeal, as each brand varies in terms of price point, product offerings, demographic target or distribution. The
TOMMY HILFIGER
brands consist of:
|
•
|
HILFIGER COLLECTION —
the pinnacle of the
TOMMY HILFIGER
product offerings,
HILFIGER COLLECTION
is sophisticated and elevated, blending the brand’s Americana heritage with contemporary influences and a playful fashion edge. The collection targets consumers between 25 and 40 years old.
HILFIGER COLLECTION
is available globally at select
TOMMY HILFIGER
stores, through our wholesale partners (in stores and online) and on
tommy
.com.
|
|
•
|
TOMMY HILFIGER TAILORED —
targeting 25 to 40 year-old consumers, this line integrates a sharp, sophisticated style with the
TOMMY HILFIGER
brand’s American menswear heritage. From structured suiting to casual weekend wear, classics are modernized with precision fit, premium fabrics, updated cuts, rich colors and luxe details, executed with the
TOMMY HILFIGER
brand’s signature twist.
TOMMY HILFIGER TAILORED
is available globally at select
TOMMY HILFIGER
stores, through our wholesale partners (in stores and online) and on
tommy
.com.
|
|
•
|
TOMMY HILFIGER —
targeting 25 to 40 year-old consumers, our core line is globally recognized for bringing to life the brand’s classic American cool spirit with a broad selection of designs across more than 25 categories, including men’s, women’s and children’s sportswear, footwear and accessories. Products are sold globally in our
TOMMY HILFIGER
stores, through our wholesale partners (in stores and online), through pure play digital commerce retailers and on
tommy.
com.
|
|
•
|
TOMMY JEANS —
targeting 18 to 30 year-old denim-oriented consumers, this line focuses on premium denim separates, footwear, accessories and fragrance.
TOMMY JEANS
is available globally at select
TOMMY HILFIGER
stores,
TOMMY JEANS
stores, through our wholesale partners (in stores and online), through pure play digital commerce retailers and on
tommy.
com.
|
|
•
|
TOMMY SPORT
—
this line is engineered for performance and infused with the brand’s bold red, white and blue heritage. Silhouettes evoke the classic American cool spirit of the
TOMMY HILFIGER
brand with unique details and functional features.
TOMMY SPORT
is available globally at select
TOMMY HILFIGER
stores, through our wholesale partners (in stores and online), through pure play digital commerce retailers and on
tommy.
com.
|
3
Tommy Hilfiger’s global marketing and communications strategy is to build a consumer-centric, go-to-market strategy that maintains the brand’s momentum, driving awareness, consistency and relevancy across product lines and regions. We engage consumers through comprehensive 360° marketing campaigns, which have a particular focus on innovative experiences and digital marketing initiatives. Marketing campaigns for the brand are focused on attracting a new generation of consumers worldwide through a blend of global and regional brand ambassadors and expanding
TOMMY HILFIGER
’s global growth categories (womenswear, denim, accessories, underwear and men’s tailored clothing), as well as its core men’s apparel and denim businesses. Tommy Hilfiger spent over $210 million on global marketing and communications efforts in 2018. The global brand power and digital expertise of Tommy Hilfiger are being recognized; in 2018, Fast Company ranked
TOMMY HILFIGER
#3 on its “World’s Most Innovative Companies” list in the Style category.
Through our Tommy Hilfiger North America and Tommy Hilfiger International segments, we sell
TOMMY HILFIGER
products in a variety of distribution channels, including:
|
•
|
Wholesale — principally consists of the distribution and sale of products in North America, Europe, Japan and China under the
TOMMY HILFIGER
brands. In North America, distribution is primarily through department stores, warehouse clubs, and off-price and independent retailers, as well as digital commerce sites operated by the department store customers and pure play digital commerce retailers. In Europe, Japan and China, distribution is through department and specialty stores, and digital commerce sites operated by department store customers and pure play digital commerce retailers, as well as through distributors and franchisees.
|
|
•
|
Retail — principally consists of the distribution and sale of products under the
TOMMY HILFIGER
brands in our stores in North America, Europe, Japan, and China, as well as on the
tommy
.com sites we operate in over 30 countries. Our stores in North America are primarily located in premium outlet centers. In Europe, China and Japan, we operate full-price specialty and outlet stores, as well as select flagship stores and concession locations.
|
|
•
|
Licensing — we license the
TOMMY HILFIGER
brands to third parties globally for a broad range of products through approximately 30 license agreements. We provide support to our licensees and seek to preserve the integrity of our brands by taking an active role in the design, quality control, advertising, marketing and distribution of each licensed product, most of which are subject to our prior approval and continuing oversight. The arrangements generally are exclusive to a territory or product category. Territorial licensees include our joint ventures in Australia, Brazil, India and Mexico.
|
4
Tommy Hilfiger’s key licensees, and the products and territories licensed, include:
|
Licensee
|
|
Product Category and Territory
|
|
|
|
|
|
American Sportswear S.A.
|
|
Men’s, women’s and children’s apparel, footwear and accessories (Central America, South America (excluding Brazil) and the Caribbean)
|
|
Dickson Concepts (International) Limited
|
|
Men’s, women’s and children’s sportswear and men’s and women’s jeans and athletic wear (Hong Kong, Macau, Malaysia, Singapore and Taiwan) (We entered into a definitive agreement in March 2019 to acquire this licensed business, which is expected to close in the second quarter of 2019)
|
|
|
|
|
|
F&T Apparel LLC
|
|
Children’s apparel (United States and Canada) and school uniforms (United States)
|
|
|
|
|
|
G-III
|
Men’s and women’s outerwear, luggage and women’s apparel, dresses, suits and swimwear (excluding intimates, sleepwear, loungewear, hats, scarves, gloves and footwear) (United States and Canada)
|
|
|
Hyundai G&F Co., Ltd.
|
|
Men’s, women’s and children’s apparel, sportswear, socks and accessories and men’s and women’s outerwear (South Korea)
|
|
MBF Holdings LLC
|
|
Men’s and women’s footwear (United States and Canada)
|
|
|
|
|
|
Movado Group, Inc. & Swissam Products, Ltd.
|
|
Men’s and women’s watches and jewelry (worldwide, excluding Japan (except certain customers))
|
|
Peerless Clothing International, Inc.
|
Men’s tailored clothing (United States and Canada)
|
|
|
PVH Mexico
|
|
Men’s, women’s and children’s sportswear, apparel, footwear and accessories and men’s tailored clothing (Mexico)
|
|
|
|
|
|
Safilo Group S.P.A.
|
|
Men’s, women’s and children’s eyeglasses and non-ophthalmic sunglasses (worldwide, excluding India)
|
Our Tommy Hilfiger North America segment includes the results of our Tommy Hilfiger wholesale, retail and licensing activities in the United States, Canada and Mexico, and our proportionate share of the net income or loss of our investment in PVH Mexico relating to the joint venture’s Tommy Hilfiger business. Our Tommy Hilfiger International segment includes the results of our Tommy Hilfiger wholesale, retail and licensing activities outside of North America, and our proportionate share of the net income or loss of our investments in joint ventures in Australia, Brazil and India relating to the joint ventures’ Tommy Hilfiger businesses.
Calvin Klein Business Overview
CALVIN KLEIN
is one of the world’s most recognized brands, synonymous with bold, progressive ideals and a seductive aesthetic. Global retail sales of products sold under the
CALVIN KLEIN
brands, including sales by our licensees, were approximately $9.8 billion in 2018. The
CALVIN KLEIN
brands provide us with the opportunity to market products both domestically and internationally at various price points, through multiple distribution channels and to different consumer groups. Our tiered-brand strategy provides a focused, consistent approach to global growth and development that preserves the brand’s prestige and image. The
CALVIN KLEIN
brands consist of:
|
•
|
CALVIN KLEIN 205 W39 NYC
(formerly
Calvin Klein Collection
) — our top-tier brand, offering men’s and women’s high-end designer apparel and accessories, as well as items for the home. Distribution is through our wholesale partners globally (in stores and online), pure play digital commerce retailers and
calvinklein
.com. While we are selling products under this brand through Spring 2019, we plan to close our collection business in 2019.
|
|
•
|
CK CALVIN KLEIN
— our “contemporary” brand, offering modern, sophisticated items including apparel and accessories. Distribution is in Asia through our
wholesale partners (in stores and online) and through our own stores and online.
|
5
|
•
|
CALVIN KLEIN
— our “master” brand, offering men’s and women’s sportswear, outerwear, fragrance, accessories, footwear, men’s dress furnishings, women’s dresses, suits and handbags, and items for the home. Distribution is primarily in North America, Europe and Asia through our own stores, our wholesale partners (in stores and online), pure play digital commerce retailers and
calvinklein
.com.
|
|
•
|
CALVIN KLEIN JEANS
— the casual expression of the
CALVIN KLEIN
brand with roots in denim, offering men’s and women’s jeanswear, related apparel and accessories.
CALVIN KLEIN
jeanswear is known for its unique details and innovative washes. Distribution is worldwide through our own stores, our wholesale partners (in stores and online), pure play digital commerce retailers and
calvinklein
.com.
|
|
•
|
CALVIN KLEIN UNDERWEAR
— known across the globe for provocative, cutting-edge products and marketing campaigns and consistently delivering innovative designs with superior fit and quality. Offerings include men’s and women’s underwear, women’s intimates, sleepwear and loungewear. Distribution is worldwide through
our own stores, our wholesale partners (in stores and online), pure play digital commerce retailers and
calvinklein
.com.
|
|
•
|
CALVIN KLEIN PERFORMANCE
— built on the foundation of innovation, fit and function. Designs are fashion-inspired and feature trend-driven, modern pieces that unite innovative fabric technology with classic American design elements. Already an established business in North America and Asia, this line launched in Europe in Fall 2018. Distribution is primarily in North America, Europe and Asia through our own stores, our wholesale partners (in stores and online), pure play digital commerce retailers and
calvinklein
.com.
|
Over $380 million was spent globally in 2018 in connection with the advertising, marketing and promotion of the
CALVIN KLEIN
brands and approximately 40% of these expenses were funded by Calvin Klein’s licensees and other authorized users of the brands. We announced in January 2019 that we established a Consumer Marketing Organization (the “CMO”), which will focus on creative consistency and consumer-centric marketing to drive sales, while also building personalized relationships and tailoring the overall consumer experience through highly specialized teams. We believe that this enhanced marketing approach will better meet our consumers’ needs as we adapt to their rapidly changing demands.
Through our Calvin Klein North America and Calvin Klein International segments, we sell
CALVIN KLEIN
products in a variety of distribution channels, including:
|
•
|
Wholesale — principally consists of the distribution and sale of products in North America, Europe, Asia and Brazil under the
CALVIN KLEIN
brands. In North America, distribution is primarily through warehouse clubs, department and specialty stores, and off-price and independent retailers, as well as digital commerce sites operated by department store customers and pure play digital commerce retailers. In Europe, Asia and Brazil, distribution is through department and specialty stores, and digital commerce sites operated by department store customers and pure play digital commerce retailers, as well as through distributors and franchisees.
|
|
•
|
Retail — principally consists of the distribution and sale of apparel, accessories and related products under the
CALVIN KLEIN
brands in our stores in North America, Europe, Asia and Brazil, as well as on the
calvinklein
.com sites we operate in over 35 countries. Our stores in North America are primarily located in premium outlet centers. In Europe, Asia and Brazil, we operate full-price and outlet stores and concession locations.
|
|
•
|
Licensing — we license the
CALVIN KLEIN
brands throughout the world in connection with a broad array of product categories. In these arrangements, Calvin Klein combines its design, marketing and branding skills with the specific manufacturing, distribution and geographic capabilities of its partners to develop, market and distribute these goods, most of which are subject to our prior approval and continuing oversight. Calvin Klein has approximately 50 licensing and other arrangements across the
CALVIN KLEIN
brands. The arrangements generally are exclusive to a territory or product category. Territorial licensees include our joint ventures in Australia, India and Mexico.
|
6
Calvin Klein’s key licensees, and the products and territories licensed, include:
|
Licensee
|
|
Product Category and Territory
|
|
|
|
|
|
CK21 Holdings Pte. Ltd.
|
|
Men’s and women’s
CK CALVIN KLEIN
apparel (Asia, excluding Japan)
|
|
CK Watch & Jewelry Co., Ltd.
(Swatch SA) |
|
Men’s and women’s watches and jewelry (worldwide)
|
|
|
|
|
|
Coty Inc.
|
|
Men’s and women’s fragrance, bath products and color cosmetics (worldwide)
|
|
|
|
|
|
DWI Holdings, Inc. / Himatsingka Seide, Ltd.
|
|
Soft home bed and bath furnishings (United States, Canada, Mexico, Europe, Middle East, Asia and India)
|
|
|
|
|
|
G-III
|
|
Women’s coats, suits, dresses, sportswear, active performancewear, handbags and small leather goods, men’s coats, luggage and men’s and women’s swimwear (United States, Canada and Mexico with distribution for luggage in Europe and elsewhere)
|
|
|
|
|
|
Jimlar Corporation / LF USA, Inc.
|
|
Men’s and women’s footwear (various jurisdictions)
|
|
|
|
|
|
Marchon Eyewear, Inc.
|
|
Men’s and women’s optical frames and sunglasses (worldwide)
|
|
|
|
|
|
McGregor Industries, Inc. / American Essentials, Inc.
|
|
Men’s and women’s socks and women’s tights (United States, Canada, Mexico, Central and South America, Europe, Middle East and Asia, excluding Japan)
|
|
|
|
|
|
Onward Kashiyama Co. Ltd.
|
|
Men’s and women’s
CK CALVIN KLEIN
apparel (Japan)
|
|
|
|
|
|
Peerless Clothing International, Inc.
|
|
Men’s tailored clothing (United States, Canada and Mexico)
|
Our Calvin Klein North America segment includes the results of our Calvin Klein wholesale, retail and licensing activities in the United States, Canada and Mexico, and our proportionate share of the net income or loss of our investment in PVH Mexico relating to the joint venture’s Calvin Klein business. Our Calvin Klein International segment includes the results of our Calvin Klein wholesale, retail and licensing activities outside of North America, and our proportionate share of the net income or loss of our investments in joint ventures in Australia and India relating to the joint ventures’ Calvin Klein businesses.
Heritage Brands Business Overview
Our Heritage Brands business designs, sources and markets a varied selection of prominent brand label dress shirts, neckwear, sportswear, swim products, intimate apparel, underwear and related apparel and accessories, and licenses certain of our brands for an assortment of products. The Heritage Brands business also offers private label dress furnishings programs, particularly in neckwear. We design, source and market substantially all of these products on a brand-by-brand basis, targeting distinct consumer demographics and lifestyles in an effort to minimize competition among our brands. Global retail sales of products sold under our owned and licensed heritage brands, including sales by our licensees, were approximately $3.5 billion in 2018.
Through our Heritage Brands Wholesale and Heritage Brands Retail segments, we sell heritage brands products in a variety of distribution channels, including:
Wholesale
—
We principally distribute our Heritage Brands products at wholesale in the United States and Canada through department, chain and specialty stores, warehouse clubs, and mass market, off-price and independent retailers (in stores and online), as well as through pure play digital commerce retailers and, for
Speedo
products, through sporting goods stores, team dealers, swimclubs and catalog retailers. Products sold through this channel principally consist of:
|
•
|
Men’s dress shirts and neckwear under brands including
Van Heusen
,
IZOD
,
ARROW
,
Geoffrey Beene
,
Kenneth Cole New York
,
Kenneth Cole Reaction
,
Unlisted, a Kenneth Cole Production
,
MICHAEL Michael Kors, Michael Kors Collection
and
DKNY
. We also market dress shirts under the
Chaps
brand, among others. We also offer private label dress shirt and neckwear programs to retailers, primarily national department stores and mass market retailers. We believe our product offerings collectively represent a sizeable portion of the domestic dress furnishings market.
|
7
We license certain of the brands under which we sell men’s dress shirts and neckwear. The following table provides information with respect to the expiration of the licenses for the more significant brands (as determined based on 2018 sales volume):
|
Brand Name
|
Licensor
|
Expiration
|
|
MICHAEL Michael Kors
and
Michael Kors Collection
|
Michael Kors, LLC
|
January 31, 2022
|
|
DKNY
|
Donna Karan Studio LLC
|
December 31, 2020, with right of renewal (subject to certain conditions) through December 31, 2023
|
|
Kenneth Cole New York
,
Kenneth Cole Reaction
and
Unlisted, a Kenneth Cole Production
|
Kenneth Cole Productions (Lic), Inc.
|
December 31, 2022, with a right of renewal (subject to certain conditions) through December 31, 2025
|
|
Chaps
|
The Polo/Lauren Company, LP and PRL USA, Inc.
|
March 31, 2020
|
|
•
|
Men’s sportswear, including sport shirts, sweaters, bottoms and outerwear, principally under the
Van Heusen
,
IZOD
and
ARROW
brands.
Van Heusen
and
IZOD
were the first and second best selling national brand men’s woven sport shirts, respectively, in United States department and chain stores in 2018. We also produce men’s sportswear under a license agreement for the
DKNY
brand as noted in the table above.
|
|
•
|
Men’s, women’s and children’s swimwear, pool and deck footwear, and swim-related products and accessories, such as swim goggles, learn-to-swim aids, water-based fitness products and training accessories under the
Speedo
trademark. The
Speedo
brand is exclusively licensed to us for North America and the Caribbean in perpetuity from Speedo International Limited.
|
|
•
|
Women’s intimate apparel under the
Warner’s
,
Olga
and
True&Co.
brands.
Warner’s
was the fourth best selling brand for bras and panties in United States department and chain stores in 2018.
True&Co.
is primarily distributed in the United States through our
TrueAndCo.
com digital commerce site.
|
Retail
—
We also market products directly to consumers through our Heritage Brands stores, primarily located in outlet centers throughout the United States and Canada. A majority of our stores offer a broad selection of
Van Heusen
men’s and women’s apparel, along with a limited selection of our dress shirt and neckwear offerings, and
IZOD
Golf
,
Warner’s
and, to a lesser extent,
Speedo
products. The majority of these stores feature multiple brand names on the store signage, with the remaining stores operating under the
Van Heusen
name. We also sell our products in the United States through our directly operated digital commerce sites for
Speedo
and
True&Co.
, as well as our
IZOD.
com
,
VanHeusen.
com and
styleBureau.
com sites, which launched in July 2018.
Licensing
—
We license our
Van Heusen
,
IZOD
,
ARROW
,
Geoffrey Beene
,
Speedo
,
Warner’s
and
Olga
brands globally for a broad range of products through approximately 90 license agreements. We provide support to our licensees and seek to preserve the integrity of our brands by taking an active role in the design, quality control, advertising, marketing and distribution of each licensed product, most of which are subject to our prior approval and continuing oversight. The arrangements generally are exclusive to a territory or product category. Territorial licenses include our joint ventures in Australia and Mexico.
8
Our heritage brands licensees, and the products and territories licensed by them, include:
|
Licensee
|
|
Product Category and Territory
|
|
|
|
|
|
Arvind Fashions Limited
|
|
ARROW
men’s and women’s dresswear, sportswear and accessories (India, Middle East, Egypt, Ethiopia, Maldives, Nepal, Sri Lanka and South Africa);
IZOD
men’s and women’s sportswear and accessories (India)
|
|
|
|
|
|
Basic Resources, Inc. / USA Legwear, LLC
|
|
Van Heusen
and
IZOD
men’s and boys’ knit and woven underwear;
Van Heusen, IZOD
and
Warner’s
hosiery (United States and Canada)
|
|
Five Star Blue, LLC
|
IZOD
men’s denim, twill pants and shorts (United States, Canada and Mexico)
|
|
|
F&T Apparel LLC
|
|
Van Heusen
and
ARROW
boys’ dress furnishings and sportswear;
IZOD
boys’ sportswear;
IZOD
and
ARROW
boys’ and
girls’ school uniforms;
ARROW
men’s tailored clothing;
IZOD
boys’ tailored clothing (United States and Canada)
|
|
|
|
|
|
I.C.C. International Public Company, Ltd.
|
ARROW
men’s dress furnishings, tailored clothing, sportswear and accessories;
ARROW
women’s dresswear and sportswear (Thailand, Myanmar, Laos, Cambodia and Vietnam)
|
|
|
|
|
|
|
Peerless Delaware, Inc.
|
Van Heusen
and
IZOD
men’s tailored clothing (United States, Canada and Mexico)
|
|
|
Van Dale Industries, Inc
|
|
IZOD
women’s intimates and sleepwear;
Warner’s
and
Olga
women’s shapewear, sleepwear, loungewear and athletic wear (United States and Canada)
|
Our Heritage Brands Wholesale segment includes the results of our Heritage Brands wholesale and licensing activities, the results of our directly operated digital commerce sites, and our proportionate share of the net income or loss of our investments in the joint ventures in Australia and Mexico relating to the joint ventures’ Heritage Brands businesses. Our Heritage Brands Retail segment includes the results of our Heritage Brands stores.
Our Business Strategy
We see opportunities for growth as we employ our strategic priorities across our organization. Our global growth strategies include:
|
•
|
Driving consumer engagement through innovative designs and personalized brand and shopping experiences that capture the heart of the consumer.
|
|
•
|
Expanding our worldwide reach through organic growth and acquisitions.
|
|
•
|
Investing in and evolving how we operate by leveraging technology and data to be dynamic, nimble and forward-thinking.
|
|
•
|
Developing a talented and skilled workforce that embodies our core values and an entrepreneurial spirit while empowering our associates to design their future.
|
|
•
|
Delivering sustainable, profitable growth and generating free cash flow to create long-term stockholder value.
|
Tommy Hilfiger Business
We believe that we can further grow
TOMMY HILFIGER
global retail sales
through a number of product and regional initiatives, which include:
|
•
|
Being consumer-centric and enhancing global brand relevance with marketing campaigns and consumer engagement initiatives designed to drive growth and reflect
TOMMY HILFIGER
’s accessible premium positioning and classic American cool aesthetic.
|
|
•
|
Driving category expansion within womenswear, accessories, denim, underwear and men’s tailored clothing.
|
|
•
|
Driving regional expansion, particularly in Asia Pacific.
|
9
|
•
|
Gaining greater control of the brand by acquiring licensed businesses to operate them directly.
|
|
•
|
Digitizing the complete brand experience, from our stores to our online offerings.
|
|
•
|
Evolving our supply chain to adapt more quickly to change.
|
|
•
|
Sharpening our processes and personalizing our customer relationships as we enhance our data capabilities.
|
Calvin Klein Business
We believe growth opportunities exist to drive further global retail sales and improvements in operating margins of
CALVIN KLEIN
over time, including through:
|
•
|
Being consumer-centric and enhancing global brand relevance through marketing campaigns and consumer engagement initiatives designed to drive growth and further resonate with youth-minded consumers.
|
|
•
|
Commercializing the
CALVIN KLEIN
creative vision to drive product improvement and expansion, particularly within men’s and women’s sportswear, performance apparel, jeanswear, accessories and women’s intimates.
|
|
•
|
Expanding our distribution by increasing our digital businesses and growing our presence in specialty stores.
|
|
•
|
Identifying operating efficiencies across the business to drive improvements in our operating margins.
|
|
•
|
Sharpening our processes and personalizing our customer relationships as we enhance our data capabilities.
|
|
•
|
Enhancing our supply chain to react more quickly to emerging business trends.
|
|
•
|
Gaining greater control of the brand by acquiring licensed businesses to operate them directly.
|
Heritage Brands Business
Our Heritage Brands business represents our original business, where we developed our core competencies, and is an important complement to our global designer brand businesses. We believe that this business can continue to capture market share and generate healthy cash flows as we execute against our key strategic initiatives, which include:
|
•
|
Being consumer-centric by designing and marketing quality, trend-right products that offer great value to our consumers and introducing products with new technologies and new features.
|
|
•
|
Driving consumer engagement by leveraging and enhancing each brand’s position in the market and delivering compelling marketing campaigns.
|
|
•
|
Seeking to maximize distribution, with the greatest opportunities in mass market retailers and digital commerce (through our wholesale partners, our own digital commerce sites and pure play digital commerce retailers).
|
|
•
|
Enhancing profitability by capitalizing on supply chain opportunities, reducing costs and maintaining a critical focus on inventory management.
|
|
•
|
Sharpening our processes and personalizing our customer relationships as we enhance our data capabilities.
|
Other Strategic Opportunities
While we believe we have an attractive and diverse portfolio of brands with growth potential, we will continue to explore strategic acquisitions of companies or trademarks and licensing opportunities that we believe are additive to our overall business. New license opportunities allow us to fill new product and brand portfolio needs. We take a disciplined approach to acquisitions, seeking brands with broad consumer recognition that we can grow profitably and expand by leveraging our infrastructure and core competencies and, where appropriate, by extending the brand through licensing.
10
Seasonality
Our business generally follows a seasonal pattern. Our wholesale businesses tend to generate higher levels of sales in the first and third quarters, while our retail businesses tend to generate higher levels of sales in the fourth quarter. Royalty, advertising and other revenue tends to be earned somewhat evenly throughout the year, although the third quarter has the highest level of royalty revenue due to higher sales by licensees in advance of the holiday selling season. We expect this seasonal pattern will generally continue. Working capital requirements vary throughout the year to support these seasonal patterns and business trends.
Design
Our business depends on our ability to stimulate and respond to consumer tastes and demands, as well as on our ability to remain competitive in the areas of quality and delivering a compelling price value proposition.
Our in-house design teams are significant contributors to the continued strength of our brands. Each of our branded businesses employs its own teams of designers and merchandisers that develop products representing its brand’s aesthetics, while also being mindful of consumers’ tastes, lifestyle needs and current fashion trends. To reflect consumer variances in each of our regional markets, the businesses tailor their products and offerings to appeal to local tastes, fit differences or other preferences, while maintaining the cohesive creative vision for each brand.
Product Sourcing
Our capabilities for worldwide procurement and sourcing enable us to deliver to our customers competitive and high quality goods at an attractive value and on a timely basis. We have an extensive established network of worldwide sourcing partners that enables us to meet our customers’ needs in an efficient manner and not rely on any one vendor or factory or on vendors or factories in any one country. Our products were produced in over 1,200 factories in approximately 50 countries during 2018. All but one of these factories were operated by independent manufacturers, with most being located in Asia.
We source finished products and, to a lesser extent, raw materials and trim. Raw materials and trim include fabric, buttons, thread, labels and similar components. Finished products consist of manufactured and fully assembled products ready for shipment to our customers and our stores. Raw material, trim, and finished product commitments are generally made two to six months prior to production. We believe we are one of the largest users of shirting fabric in the world. We believe that an ample number of alternative suppliers exist should we need to secure additional or replacement production capacity and raw materials.
Our purchases from our suppliers are effected through individual purchase orders specifying the price, quantity, delivery date and destination of the items to be produced. Sales are monitored regularly at both the retail and wholesale levels and modifications in production can be made either to increase or reduce inventories. We look to establish long-term supplier relationships in the appropriate locations throughout the world to meet our needs and we place our orders in a manner designed to limit the risk that a production disruption at any one facility could cause a serious inventory problem, while seeking to maximize the pricing opportunities.
The manufacturers of our products are required to meet our quality, human rights, safety, environmental and cost requirements. Our global supply chain teams, offices and buying agents enable us to monitor the quality of the goods manufactured by, and the delivery performance of, our suppliers, and work with our global compliance teams to ensure the enforcement of our human rights and labor standards and other code of conduct requirements through our ongoing extensive training, approval and monitoring system. They also monitor and track the primary cost inputs to the finished product to ensure that we pay the most appropriate cost for our finished goods. We continue to assess our manufacturing footprint to ensure we have the best infrastructure to meet the needs of our global wholesale and retail businesses.
We continue to make progress on maintaining an agile and data-driven supply chain. We have made advancements to capture additional gross margin opportunities, as we continue to optimize our vendor base to work more closely with long-term strategic partners, focus on core replenishment for select categories and improve our speed to market. We have also developed a country of origin strategy that provides a flexible approach to product sourcing, which enables us to maximize regional opportunities and mitigate our potential exposure to risks associated with new duties, tariffs, surcharges, or other import controls or restrictions. We believe the enhancement of our supply chain efficiencies and working capital management through the effective use of our distribution network and overall infrastructure will allow us to control costs better and provide improved service to our customers.
11
We restructured our supply chain relationship with Li & Fung in 2017 in line with our supply chain priorities. In connection with this transaction, we terminated our non-exclusive buying agency agreement with Li & Fung and entered into a new agreement that will allow us to evolve our supply chain, while also building upon our operating platforms to enhance our efficiencies across the organization.
We also began producing finished products in Ethiopia during 2017 to evolve our supply chain and become more dynamic. Production is through a joint venture, PVH Arvind Manufacturing Private Limited Company (“PVH Ethiopia”), that we formed with Arvind Limited (“Arvind”). The goods produced are primarily distributed in the United States by our Heritage Brands business.
Corporate Responsibility
As an industry leader and one of the largest branded apparel companies in the world, we recognize that we have a responsibility to address our social and environmental impacts. Corporate responsibility is central to how we conduct business and it is a crucial consideration embodied in all of the strategic business decisions that we make.
Building on our long-standing commitment to responsible business, in January 2019 we launched the next evolution of our Corporate Responsibility strategy -
Forward Fashion
. Our
Forward Fashion
strategy supports the standards released by the Global Fashion Agenda in its
CEO Agenda 2019
, which reflect global developments and focus on climate change as a core priority.
Our three strategic focus areas are:
|
•
|
Reduce negative impacts — Our ambition is for our products and business operations to generate zero waste, zero carbon and zero hazardous chemicals. This means protecting our global climate by reducing energy use and powering our business through renewable sources, diverting the waste we send to landfills, eliminating water pollution from our wet processors, and fostering and harnessing innovation to design and manufacture products that eliminate product waste.
|
|
•
|
Increase positive impacts — Our ambition is for 100% of our products and packaging to be ethically and sustainably sourced from suppliers who respect human rights and are good employers.
|
|
•
|
Improve lives across our value chain — Our ambition is to improve the lives of over one million people across our value chain, focusing on education and opportunities for women and children, ensuring access to clean water and continuing to champion inclusion and diversity.
|
We issue an annual report on our corporate responsibility efforts that can be found on our corporate website at PVH.com/responsibility.
Warehousing, Distribution and Logistics
Our products are shipped from manufacturers to our wholesale and retail warehousing and distribution centers for inspection, sorting, packing and shipment. Centers range in size and our main facilities, some of which are operated by independent third parties, are located in the United States, the Netherlands, Canada, China, Japan, Hong Kong, South Korea, Taiwan and Brazil. Our warehousing and distribution centers are designed to provide responsive service to our customers and our retail stores on a cost-effective basis.
Our backlog of customer orders totaled $1.652 billion and $2.097 billion as of
February 3, 2019
and
February 4, 2018
, respectively. The size of our order backlog depends upon a number of factors, including the timing of the market weeks for our particular lines, during which a significant percentage of our orders are received, and the timing of the shipments, which varies from year-to-year with consideration for holidays, consumer trends, concept plans, and the usage of our basic stock replenishment programs. As a consequence, a comparison of the size of our order backlog from period to period may not be meaningful, nor may it be indicative of eventual shipments.
Material Customers
Our largest customers account for significant portions of our revenue. Sales to our five largest customers were 18.9% of our revenue in each of 2018 and 2017, and 21.3% of our revenue in 2016. No single customer accounted for more than 10% of our revenue in 2018, 2017 or 2016.
12
Advertising and Promotion
Our marketing programs are an integral component of the success of our brands and the products offered under them. We intend for each of our brands to be a leader in its respective market segment, with strong consumer awareness, relevance and consumer loyalty. We believe that our brands are successful in their respective market segments because we have strategically positioned each brand to target a distinct consumer demographic. Advertisements generally portray a lifestyle representation of our category offerings rather than a specific item. We design and market our products to complement each other, satisfy lifestyle needs, emphasize product features important to our target consumers, deliver a strong price/value proposition and encourage consumer loyalty.
A significant component of our marketing programs is digital media, including our digital commerce platforms and social media channels, which allow us to expand our reach to customers and enable us to provide timely information in an entertaining fashion to consumers about our products, special events, promotions and store locations. Tommy Hilfiger’s digital commerce site,
tommy
.com, and Calvin Klein’s digital commerce site,
calvinklein
.com, serve as marketing vehicles to complement the ongoing development of the
TOMMY HILFIGER
and
CALVIN KLEIN
lifestyle brands, respectively, in addition to offering a broad array of apparel and licensed products. Additionally, during 2018, we launched our own Heritage Brands digital commerce sites.
We also advertise through print media (including fashion, entertainment/human interest, business, men’s, women’s and sports magazines and newspapers), on television, through outdoor signage and through in-store point of sale materials, as well as participate in cooperative advertising programs with our retail partners. In addition, we advertise our brands through sport sponsorships and product tie-ins. We believe that our use of high-profile brand ambassadors and well-known social media influencers across our marketing programs helps drive our brand awareness and cultural relevance.
With respect to our retail outlet stores, the majority of which are located in premium outlet centers in the United States and Canada, we generally rely upon local outlet mall developers to promote traffic for their centers. Outlet center developers employ multiple formats, including signage, print advertising, direct marketing, radio and television advertising, and special promotions.
Tommy Hilfiger Business
We believe that
TOMMY HILFIGER
is one of the world’s leading designer lifestyle brands and is internationally recognized for celebrating the essence of classic American cool style with a preppy twist. Tommy Hilfiger employs advertising, marketing and communications staff, including an in-house creative team, as well as outside agencies, to implement its global marketing and communications strategy across all channels of distribution. The Tommy Hilfiger marketing and communications team develops and coordinates
TOMMY HILFIGER
advertising for all regions and product lines, licensees and regional distributors. Advertisements for
TOMMY HILFIGER
brand products appear primarily in social media outlets, fashion and lifestyle magazines, newspapers, outdoor media and cinema and on television. The digital and online focus of marketing for the
TOMMY HILFIGER
brands is integral to its campaigns and continues to increase. Additionally, the marketing and communications team coordinates personal appearances by Mr. Tommy Hilfiger, including at runway shows and brand events as part of its efforts. Tommy Hilfiger maintains multiple showroom facilities and sales offices around the world. Nearly all of its showrooms are digitized, offering a more engaging, integrated and seamless buying experience for its wholesale partners.
Tommy Hilfiger embarked on new exclusive, high-profile partnerships in 2018 to continue its efforts to reach new, younger audiences, while also appealing to its existing consumers. It delivered celebrity partnerships and exciting new brand activations, with a particular focus on the product categories where we see the greatest expansion opportunities - womenswear, accessories, denim, underwear and men’s tailored clothing.
One of Tommy Hilfiger’s largest collaborations during the year was its partnership with British Formula One
TM
racing driver and five-time Formula One
TM
World Champion
Lewis Hamilton, who appeared as the global brand ambassador for
TOMMY HILFIGER
men’s for Spring and Fall 2018. In conjunction with this,
TOMMY HILFIGER
formed a multi-year strategic partnership with four-time World Champions Mercedes-AMG Petronas Motorsport as their Official Apparel Partner, beginning in Spring 2018. These partnerships reflect the brand’s strategic commitment to build on its strong menswear heritage and further drive the global growth of its men’s business, while also bringing the next generation of fans to the brand. To capitalize on the power of the collaboration, Tommy Hilfiger offered its first
TommyXLewis
collaborative collection in Fall 2018 with a world tour that included the
TOMMYNOW
Fall 2018 fashion show in Shanghai, an industry event in New York City, and a presentation as a 3D holographic water projection in Tokyo. In conjunction with these events, we launched a Super
13
Brand day on Tmall, which offered a seamless consumer experience, including order delivery within 24 hours in key Chinese cities.
Tommy Hilfiger also delivered engaging marketing campaigns geared toward the female consumer, as we believe that it is significantly underpenetrated in women’s apparel and accessories. The brand continued its successful partnership with Gigi Hadid for Spring 2018, which marked her final season serving as a brand ambassador and designer of the
TommyXGigi
capsule collection. Continuing with the “see now, buy now” realm, the brand’s
TOMMYNOW
Spring 2018 fashion show in Milan featured the
TommyXGigi
capsule collection, which allowed consumers to purchase immediately items featured on the runway through
tommy
.com, as well as in
TOMMY HILFIGER
stores and through select wholesale partners globally. As the year progressed, Tommy Hilfiger enlisted model Hailey Bieber, model and activist Winnie Harlow and actress Maggie Jiang as the newest members of the
TOMMY HILFIGER
family, with the celebrities serving as the new global brand ambassadors for
TOMMY HILFIGER
women’s for Fall 2018, as well as starring in the Fall 2018
TOMMY ICONS
capsule collection for women.
Tommy Hilfiger named Zendaya as the brand’s female brand ambassador beginning in Spring 2019. Zendaya helped to design a
TommyXZendaya
capsule collection as part of our vision to collaborate with icons who share the brand’s spirit and values of breaking conventions and celebrating diversity.
Tommy Hilfiger also offered exciting brand activations and more frequent product drops. It collaborated with several of the trendiest streetwear brands, including
KITH
,
Vetements
and
Monkey Time
, to drive desire for
TOMMY HILFIGER
with the younger fashion consumer. Additionally, the
TOMMY JEANS
Spring and Fall 2018 marketing campaigns featured a collection of millennial influencers.
Calvin Klein Business
We believe Calvin Klein is one of the best known designer names in the world, exemplifying bold, progressive ideals and a seductive, often minimalist aesthetic. As the
CALVIN KLEIN
brand celebrates its 51st year in business, it continues to experience compelling brand and cultural relevancy by evolving and driving consumer engagement. We announced in January 2019 that we established the CMO, which encompasses the business’s marketing, communications, social media, celebrity dressing and special events. The CMO will focus on creative consistency and consumer-centric marketing to drive sales, while also building personalized relationships and tailoring the overall consumer experience through its highly specialized teams. We believe that this enhanced marketing approach will better meet our consumers’ needs as we adapt to their rapidly changing demands. Calvin Klein maintains showrooms and sales offices around the world.
Consumer engagement remained at the core of Calvin Klein
in 2018, as it delivered immersive brand experiences, with a particular focus on youth-minded consumers. Calvin Klein leveraged the already-successful
#MYCALVINS
legacy and amplified its commerciality by enlisting sisters Kim Kardashian West, Khloé Kardashian, Kourtney Kardashian, Kendall Jenner and Kylie Jenner as brand ambassadors for
CALVIN KLEIN JEANS
and
CALVIN KLEIN UNDERWEAR
in Spring and Fall 2018. Calvin Klein also engaged Taiwanese musician Jam Hsiao and Chinese actress Jelly Lin as local brand ambassadors for the Spring and Fall 2018 men’s and women’s collections.
Understanding that today’s consumer is increasingly sophisticated and places a premium on brand authenticity, Calvin Klein began to balance the global brand campaigns with the use of smaller-scale regional and micro-influencers. Also under the
#MYCALVINS
platform, Calvin Klein enlisted a diverse set of models, artists, fashion bloggers and other social influencers wearing a wide array of C
ALVIN KLEIN
product offerings and plans to expand significantly upon this in 2019.
Digital experiences remained a priority as we continued to grow online sales. Calvin Klein invested in key partnerships, including its collaboration with Zalando in Europe for their 10th anniversary. To celebrate, Calvin Klein offered an exclusive capsule collection, which featured model siblings Kaia and Presley Gerber and was accompanied by a television and social media campaign.
Heritage Brands Business
In our Heritage Brands business, we leveraged and enhanced each brand’s position in the market by delivering engaging marketing campaigns, with a particular focus on driving relevance with younger consumers. We launched a partnership for
Van Heusen
with the UFC
®
that featured MMA fighters Stephen Thompson and T.J. Dillashaw as brand ambassadors. The campaign had digital and social engagement rates that far exceeded our expectations. We also launched our largest media campaign to-date for
IZOD
that features Green Bay Packers quarterback Aaron Rodgers and comedian Colin Jost from
Saturday Night Live
. There were engagement opportunities for
Speedo
, as well, including industry events such as Miami
14
Swim Week, and a celebration of Fitness Month by having our Speedo USA team ring the opening bell at the New York Stock Exchange on January 2, 2018, the first trading day of the new year.
We continue to promote our Heritage Brands business through sport sponsorships. Four-time PGA Tour winner Marc Leishman serves as brand ambassador for
IZOD
Golf
, which includes wearing
IZOD Golf
apparel on-course. Olympic gold medalists and World No. 1 ranked men’s double tennis team, Bob and Mike Bryan continue to serve as brand ambassadors for
IZOD
. Team
Speedo
USA consists of world-class swimmers, including Caeleb Dressel, Ryan Murphy, Nathan Adrian, Kathleen Baker and Para-Olympian Becca Meyers. These athletes wear
Speedo
products exclusively in competition and participate in various promotional activities on behalf of the brand. In addition, we have an all-brand, regional sponsorship relationship with the New York Giants.
We also advertised the
Warner’s No Side Effects
and
Cloud 9
bras and
True&Co.
True Body Collection
bras
on television during 2018. Additionally, we leveraged strategic new platforms to commercialize Heritage Brands products, including efforts to develop the
Speedo Fit
training program by building relevancy through partnerships with personal trainers, gyms and fitness professionals.
Trademarks
We own the
TOMMY HILFIGER
,
CALVIN KLEIN
,
Van Heusen
,
IZOD
,
ARROW
,
Warner’s
,
Olga
,
True&Co.
and
Geoffrey Beene
brands, as well as related trademarks (
e.g.
, the interlocking “
IZ
” logo for
IZOD
and the
TOMMY HILFIGER
flag logo and crest design) and lesser-known names. These trademarks are registered for use in each of the primary countries where our products are sold and additional applications for registration of these and other trademarks are made in jurisdictions to accommodate new marks, uses in additional trademark classes or additional categories of goods or expansion into new countries.
Mr. Tommy Hilfiger is prohibited in perpetuity from using, or authorizing others to use, the
TOMMY HILFIGER
marks (except for the use by Mr. Hilfiger of his name personally and in connection with certain specified activities). In addition, we are prohibited in perpetuity from selling products not ordinarily sold under the names of prestige designer businesses or prestige global lifestyle brands without Mr. Hilfiger’s consent, from engaging in new lines of business materially different from such types of lines of business without Mr. Hilfiger’s consent, or from disparaging or intentionally tarnishing the
TOMMY HILFIGER
-related marks or Mr. Hilfiger’s personal name.
We own the
CALVIN KLEIN
marks and derivative marks in all trademark classes and for all product categories through our Calvin Klein and Warnaco subsidiaries’ ownership of the Calvin Klein Trademark Trust (“the Trust”), which is the sole and exclusive title owner of substantially all registrations of the
CALVIN KLEIN
trademarks. The sole purpose of the Trust is to hold these marks. Calvin Klein maintains and protects the marks on behalf of the Trust. The Trust licenses to Calvin Klein and Warnaco on an exclusive, irrevocable, perpetual and royalty-free basis the use of the marks.
Mr. Calvin Klein retains the right to use his name, on a non-competitive basis, with respect to his right of publicity, unless those rights are already being used in the Calvin Klein business. Mr. Klein has also been granted a royalty-free worldwide right to use the
CALVIN KLEIN
mark with respect to certain personal businesses and activities, subject to certain limitations designed to protect the image and prestige of the
CALVIN KLEIN
brands and to avoid competitive conflicts.
Our trademarks are the subject of registrations and pending applications throughout the world for use on a variety of apparel, footwear and related products, as well as licensed product categories, and we continue to expand our worldwide usage and registration of new and related trademarks. In general, trademarks remain valid and enforceable as long as the marks continue to be used in connection with the products and services with which they are identified and, as to registered tradenames, the required registration renewals are filed. In markets where products bearing any of our brands are not sold by us or any of our licensees or other authorized users, our rights to the use of trademarks may not be clearly established.
Our trademarks and other intellectual property rights are valuable assets and we vigorously seek to protect them on a worldwide basis against infringement. We are susceptible to others imitating our products and infringing on our intellectual property rights. This is especially the case with respect to the
TOMMY HILFIGER
and
CALVIN KLEIN
brands, as these brands enjoy significant worldwide consumer recognition and their generally higher pricing (as compared to our heritage brands) provides significant opportunity and incentive for counterfeiters and infringers. We have broad, proactive enforcement programs that we believe have been generally effective in controlling the sale of counterfeit products in the United States and in major markets abroad.
15
Competition
The apparel industry is competitive as a result of its fashion orientation, mix of large and small producers, low barriers to entry, the flow of domestic and imported merchandise and the wide diversity of retailing methods. We compete with numerous domestic and foreign designers, brands owners, manufacturers and retailers of apparel, accessories and footwear, including, in certain circumstances, the private label brands of our wholesale customers. Additionally, with the shift in consumer shopping preferences driving growth in the digital channel, there are more companies in the apparel sector and an increased level of transparency in pricing and product comparisons, which impacts purchasing decisions.
We believe we are well-positioned to compete in the apparel industry on the basis of style, quality, price and service. Our business depends on our ability to stimulate consumer tastes and demands, as well as on our ability to remain competitive in these areas. Our diversified portfolio of brands and products and our use of multiple channels of distribution have allowed us to develop a business that produces results that are not dependent on any one demographic group, merchandise preference, distribution channel or region. We have developed a portfolio of brands that appeals to a broad spectrum of consumers. Our owned brands have long histories and enjoy high recognition and awareness within their respective consumer segments. We develop our owned and licensed brands to complement each other and to generate strong consumer loyalty. The worldwide recognition of the
TOMMY HILFIGER
and
CALVIN KLEIN
brands generally provide us with significant global opportunities and the opportunity to develop businesses that target different consumer groups at higher price points and in higher-end distribution channels than our heritage brands.
Imports and Import Restrictions
A substantial portion of our products is imported into the United States, Canada, Europe, Asia and Latin America. These products are subject to various customs laws, which may impose tariffs, as well as quota restrictions. In addition, each of the countries in which our products are sold has laws and regulations covering imports. The United States and other countries in which our products are sold may impose, from time to time, new duties, tariffs, surcharges, or other import controls or restrictions, including the imposition of a “safeguard quota,” or adjust presently prevailing duty or tariff rates or levels. We, therefore, maintain a program of intensive monitoring of import restrictions and developments. We seek to minimize our potential exposure to import related risks through, among other measures, adjustments in product design and fabrication, shifts of production among countries, including consideration of countries with tariff preference and free trade agreements, and manufacturers, and geographical diversification of our sources of supply.
Environmental Matters
Our facilities and operations are subject to various environmental, health and safety laws and regulations. In addition, we may incur liability under environmental statutes and regulations with respect to the contamination of sites that we own or operate or previously owned or operated (including contamination caused by prior owners and operators of such sites, abutters or other persons) and the off-site disposal of hazardous materials. We believe our operations are in compliance with the terms of all applicable laws and regulations and our compliance with these laws and regulations has not had, and is not expected to have, a material effect on our capital expenditures, cash flows, earnings or competitive position.
Employees
As of
February 3, 2019
, we employed approximately 20,500 persons on a full-time basis and approximately 17,500 persons on a part-time basis. Approximately 2% of our employees were represented for the purpose of collective bargaining by four different unions in the United States. Additional persons, some represented by these four unions, are employed from time to time based upon our manufacturing schedules and retailing seasonal needs. Our collective bargaining agreements generally are for three-year terms. In some international markets, a significant percentage of employees are covered by governmental labor arrangements. We believe that our relations with our employees are good.
16
Executive Officers of the Registrant
The following table sets forth the name, age and position of each of our executive officers:
|
Name
|
Age
|
Position
|
|||
|
Emanuel Chirico
|
61
|
|
Chairman and Chief Executive Officer
|
||
|
Michael A. Shaffer
|
56
|
|
Executive Vice President and Chief Operating & Financial Officer
|
||
|
Francis K. Duane
|
62
|
|
Vice Chairman and Chief Executive Officer, Heritage Brands
|
||
|
Daniel Grieder
|
57
|
|
Chief Executive Officer, Tommy Hilfiger Global and PVH Europe
|
||
|
Steven B. Shiffman
|
61
|
|
Chief Executive Officer, Calvin Klein
|
||
|
Mark D. Fischer
|
57
|
|
Executive Vice President, General Counsel & Secretary
|
||
|
David F. Kozel
|
63
|
|
Executive Vice President, Chief Human Resources Officer
|
||
Mr. Chirico joined us as Vice President and Controller in 1993. Mr. Chirico was named Executive Vice President and Chief Financial Officer in 1999, President and Chief Operating Officer in 2005, Chief Executive Officer in 2006, and Chairman of the Board in 2007.
Mr. Shaffer has been employed by us since 1990. He served as Senior Vice President, Retail Operations immediately prior to being named Executive Vice President, Finance in 2005, Executive Vice President and Chief Financial Officer in 2006, and Executive Vice President and Chief Operating & Financial Officer in 2012.
Mr. Duane served as President of our Izod division from 1998 until 2001, was named Vice Chairman, Sportswear in 2001, Vice Chairman, Wholesale Apparel in 2006, Chief Executive Officer, Wholesale Apparel in 2012, Chief Executive Officer, Heritage Brands and North America Wholesale in 2013, and Vice Chairman and Chief Executive Officer, Heritage Brands in 2018.
Mr. Grieder has been employed by Tommy Hilfiger since 2004. He served as Chief Executive Officer, Tommy Hilfiger Europe from 2008 until 2014, prior to being named Chief Executive Officer, Tommy Hilfiger Global and PVH Europe in July 2014.
Mr. Shiffman has been employed by us since 1992. Mr. Shiffman was named President & Chief Commercial Officer, Calvin Klein Retail in 2009, Group President, Calvin Klein Global Licensing and Retail in 2013, and Chief Executive Officer, Calvin Klein in 2014.
Mr. Fischer joined us as Vice President, General Counsel & Secretary in 1999. He became Senior Vice President in 2007 and Executive Vice President in 2013.
Mr. Kozel served as Vice President, Human Resources from 2003 until 2007, was named Senior Vice President, Human Resources in 2007, Executive Vice President, Human Resources in 2013, and Executive Vice President and Chief Human Resources Officer in 2015.
Item 1A. Risk Factors
The following risk factors should be read in conjunction with the other information set forth in this Annual Report on Form 10-K when evaluating our business and the forward-looking statements contained within this report. The occurrence of one or more of the circumstances or events described below could have a material adverse effect on our business, financial condition or results of operations. Additional risks and uncertainties not currently known to us or that we currently deem to be immaterial may occur or become material and may also adversely affect our business, financial condition or results of operations.
A substantial portion of our revenue and gross profit is derived from a small number of large wholesale customers and the loss of any of these customers or significant financial difficulties in their businesses could substantially reduce our revenue.
A few of our customers account for significant portions of our revenue. Sales to our five largest customers were 18.9% of our revenue in each of 2018 and 2017, and 21.3% of our revenue in 2016. No single customer accounted for more than 10%
17
of our revenue in 2018, 2017 or 2016. Collectively, Macy’s and J. C. Penney Company, Inc. (“J. C. Penney”), two of our ten largest customers in 2018, have closed over 200 stores since 2016 and will be closing additional stores. These store closings have resulted and may continue to result in a decrease in the total amount of purchases made by Macy’s and J. C. Penney. A continued decline in purchases made over the next several years could have a materially adverse effect on our United States wholesale business.
We had an agreement with Macy’s pursuant to which Macy’s was the exclusive department store distributor in the United States of men’s sportswear under the
TOMMY HILFIGER
brand; G-III, a licensee of the
TOMMY HILFIGER
brand, had a similar arrangement with Macy’s for women’s sportswear under the
TOMMY HILFIGER
brand. As a result of these strategic alliances, the success of Tommy Hilfiger’s North American men’s wholesale business and its licensed women’s wholesale business with G-III were substantially dependent on these relationships and on the ability of Macy’s to maintain and increase sales of
TOMMY HILFIGER
products. The exclusive arrangements are both being terminated effective for the Spring 2019 selling season. We cannot assure you that Macy’s will continue to order the same volume of
TOMMY HILFIGER
products from us or our licensees or that other department stores will purchase
TOMMY HILFIGER
products in sufficient volume to offset any reduction in sales to Macy’s. This could result in a decline in overall revenue and have a material adverse effect on our results of operations.
We do not have long-term agreements with any of our customers and purchases generally occur on an order-by-order basis. A decision by any of our major customers, whether motivated by marketing strategy, competitive conditions, financial difficulties or otherwise, to decrease significantly the amount of merchandise purchased from us or our licensing or other partners, or to change their manner of doing business with us or our licensing or other partners, could substantially reduce our revenue and materially adversely affect our profitability. The retail industry’s recent history has seen a great deal of consolidation, particularly in the United States, and other ownership changes, as well as management changes and store closing programs, and we expect such changes to be ongoing. Store closing programs, such as those described above, decrease the number of stores carrying our products, while the remaining stores may purchase a smaller amount of our products and may reduce the retail floor space designated for our brands. In the future, retailers may further consolidate, undergo restructurings or reorganizations, realign their affiliations or reposition their stores’ target markets or marketing strategies. Any of these types of actions could decrease the number of stores that carry our products or increase the ownership concentration within the retail industry. These changes could decrease our opportunities in the market, increase our reliance on a smaller number of large customers and decrease our negotiating strength with our customers. These factors could have a material adverse effect on our financial condition and results of operations.
We may not be able to continue to develop and grow our Tommy Hilfiger and Calvin Klein businesses.
A significant portion of our business strategy involves growing our Tommy Hilfiger and Calvin Klein businesses. Our achievement of revenue and profitability growth from Tommy Hilfiger and Calvin Klein will depend largely upon our ability to:
|
•
|
continue to maintain and enhance the distinctive brand identities of the
TOMMY HILFIGER
and
CALVIN KLEIN
brands;
|
|
•
|
continue to maintain good working relationships with Tommy Hilfiger’s and Calvin Klein’s licensees;
|
|
•
|
continue to enter into new, or renew or extend existing, license agreements for the
TOMMY HILFIGER
and
CALVIN KLEIN
brands; and
|
|
•
|
continue to strengthen and expand the Tommy Hilfiger and Calvin Klein businesses.
|
We cannot assure you that we can successfully execute any of these actions or our growth strategy for these businesses, nor can we assure you that the launch of any additional product lines or businesses by us or our licensees or that the continued offering of these lines will achieve the degree of consistent success necessary to generate profits or positive cash flow. Our ability to successfully carry out our growth strategy may be affected by, among other things, our ability to enhance our relationships with existing customers to obtain additional selling space or add additional product lines, our ability to develop new relationships with retailers, economic and competitive conditions, changes in consumer spending patterns and changes in consumer tastes and style trends. If we fail to continue to develop and grow the Tommy Hilfiger or Calvin Klein business, our financial condition and results of operations may be materially and adversely affected.
18
The success of our Tommy Hilfiger and Calvin Klein
businesses depends on the value of our “TOMMY HILFIGER” and “CALVIN KLEIN” brands, and if the value of either of those brands were to diminish, our business could be adversely affected.
Our success depends on our brands and their value. The
TOMMY HILFIGER
name is integral to the existing Tommy Hilfiger business, as well as to our strategies for continuing to grow and expand the business. Mr. Hilfiger, who remains active in the business, is closely identified with the
TOMMY HILFIGER
brand and any negative perception with respect to Mr. Hilfiger could adversely affect the
TOMMY HILFIGER
brands. In addition, under Mr. Hilfiger’s employment agreement, if his employment is terminated for any reason, his agreement not to compete with the Tommy Hilfiger business will expire two years after such termination. Although Mr. Hilfiger could not use any
TOMMY HILFIGER
trademark in connection with a competitive business, his association with a competitive business could adversely affect the Tommy Hilfiger business. We also have exposure with respect to the
CALVIN KLEIN
brands, which are integral to the existing Calvin Klein business and could be adversely affected if Mr. Klein’s public image or reputation were to be tarnished.
Our retail stores are heavily dependent on the ability and desire of consumers to travel and shop.
We have retail stores located near vacation destinations and the majority of our United States retail stores are located away from major residential centers. As a result, reduced travel resulting from economic conditions, fuel shortages, increased fuel prices, travel restrictions, travel concerns and other circumstances, including adverse weather conditions, natural disasters, disease epidemics and other health-related concerns, war, terrorist attacks or the perceived threat of war or terrorist attacks could have a material adverse effect on our financial condition and results of operations, particularly if such events impact our higher-volume retail locations. Additionally, during times of a strengthening United States dollar, particularly against the euro, the Brazilian real, the Canadian dollar, the Mexican peso and the Chinese yuan renminbi, international tourism to the United States could be reduced, as could the extent to which international tourists shop at our retail stores, which could have a material adverse effect on our sales in our United States retail stores, as they are material contributors of revenue and profits. Other factors that could affect the success of our stores include:
|
•
|
the location of the store or mall, including the location of a particular store within the mall;
|
|
•
|
the other tenants occupying space at the mall;
|
|
•
|
increased competition in areas where the stores are located;
|
|
•
|
the amount of advertising and promotional dollars spent on attracting consumers to the store or mall;
|
|
•
|
the changing patterns of consumer shopping behavior;
|
|
•
|
increased competition from online retailers; and
|
|
•
|
the diversion of sales from our retail stores due to our digital commerce business.
|
Acquisitions may not be successful in achieving intended benefits, cost savings and synergies.
One component of our growth strategy has been to make acquisitions, such as the Tommy Hilfiger, Calvin Klein and Warnaco acquisitions. Prior to completing any acquisition, our management team identifies expected synergies, cost savings and growth opportunities but, due to legal and business limitations, we may not have access to all necessary information. The integration process may be complex, costly and time-consuming. The potential difficulties of integrating the operations of an acquired business and realizing our expectations for an acquisition, including the benefits that may be realized, include, among other things:
|
•
|
failure to implement our business plan for the combined business;
|
|
•
|
delays or difficulties in completing the integration of acquired companies or assets;
|
|
•
|
higher than expected costs, lower than expected cost savings or a need to allocate resources to manage unexpected operating difficulties;
|
|
•
|
unanticipated issues in integrating manufacturing, logistics, information, communications and other systems;
|
|
•
|
unanticipated changes in applicable laws and regulations affecting the acquired business;
|
|
•
|
unanticipated changes in the combined business due to potential divestitures or other requirements imposed by antitrust regulators;
|
|
•
|
retaining key customers, suppliers and employees;
|
19
|
•
|
retaining and obtaining required regulatory approvals, licenses and permits;
|
|
•
|
operating risks inherent in the acquired business;
|
|
•
|
diversion of the attention and resources of management;
|
|
•
|
consumers’ failure to accept product offerings by us or our licensees;
|
|
•
|
assumption of liabilities not identified in due diligence;
|
|
•
|
the impact on our or an acquired business’ internal controls and compliance with the requirements under applicable regulation; and
|
|
•
|
other unanticipated issues, expenses and liabilities.
|
We have completed acquisitions that have not performed as well as initially expected and cannot assure you that any acquisition will not have a material adverse impact on our financial condition and results of operations.
Future economic conditions, including volatility in the financial and credit markets may adversely affect our business.
Economic conditions in the past have adversely affected, and in the future may adversely affect, our business, our customers and their businesses, and our financing and other contractual arrangements. Such conditions, among other things, have resulted, and in the future may result, in financial difficulties leading to restructurings, bankruptcies, liquidations and other unfavorable events for our customers, and may continue to cause such customers to reduce or discontinue orders of our products or be unable to pay us for products they have purchased from us. Financial difficulties of customers may also affect the ability of our customers to access credit markets or lead to higher credit risk relating to receivables from customers.
Future volatility in the financial and credit markets could make it more difficult for us to obtain financing or refinance existing debt when the need arises, including upon maturity, which for our senior secured credit facilities is currently scheduled for May 2021, or on terms that would be acceptable to us.
Our business is exposed to foreign currency exchange rate fluctuations and control regulations.
Our Tommy Hilfiger and Calvin Klein businesses each have substantial international components that expose us to significant foreign exchange risk. Our Heritage Brands business also has international components but those components are not significant. Changes in exchange rates between the United States dollar and other currencies can impact our financial results in two ways: a translational impact and a transactional impact.
The translational impact refers to the impact that changes in exchange rates can have on our results of operations and financial position as our results of operations in local foreign currencies are translated into United States dollars using an average exchange rate over the representative period and our assets and liabilities in local foreign currencies are translated into United States dollars using the closing exchange rate at the balance sheet date. Foreign exchange differences that arise from the translation of our foreign subsidiaries’ assets and liabilities into United States dollars are recorded as foreign currency translation adjustments in other comprehensive (loss) income. Accordingly, our results of operations and other comprehensive (loss) income will be unfavorably impacted during times of a strengthening United States dollar, particularly against the euro, the Brazilian real, the Japanese yen, the Korean won, the British pound sterling, the Canadian dollar and the Chinese yuan renminbi, and favorably impacted during times of a weakening United States dollar against those currencies.
A transactional impact on financial results is common for apparel companies operating outside the United States that purchase goods in United States dollars, as is the case with most of our foreign operations. As with translation, our results of operations will be unfavorably impacted during times of a strengthening United States dollar as the increased local currency value of inventory results in a higher cost of goods in local currency when the goods are sold and favorably impacted during times of a weakening United States dollar as the decreased local currency value of inventory results in a lower cost of goods in local currency when the goods are sold. We also have exposure to changes in foreign currency exchange rates related to certain intercompany transactions and selling, general and administrative (commonly referred to as “SG&A”) expenses. We currently use and plan to continue to use foreign currency forward exchange contracts or other derivative instruments to mitigate the cash flow or market value risks associated with these inventory and intercompany transactions, but we are unable to entirely eliminate these risks.
20
We are also exposed to foreign exchange risk in connection with our licensing businesses. Most of our license agreements require the licensee to report sales to us in the licensee’s local currency but to pay us in United States dollars based on the exchange rate as of the last day of the contractual selling period. Thus, while we are not generally exposed to exchange rate gains and losses between the end of the selling period and the date we collect payment, we are exposed to exchange rate changes during and up to the last day of the selling period. In addition, certain of our other foreign license agreements expose us to exchange rate changes up to the date we collect payment or convert local currency payments into United States dollars. As a result, during times of a strengthening United States dollar, our foreign royalty revenue will be negatively impacted, and during times of a weakening United States dollar, our foreign royalty revenue will be favorably impacted.
We also have exposure to changes in foreign currency exchange rates related to our €950 million aggregate principal amount of euro-denominated senior notes. During times of a weakening United States dollar against the euro, we could be required to use a greater amount of our cash flows from operations to pay interest and make long-term debt repayments on our euro-denominated senior notes.
We conduct business, directly or through licensees and other partners, in countries that are or have been subject to exchange rate control regulations and have, as a result, experienced difficulties in receiving payments owed to us when due, with amounts left unpaid for extended periods of time. Although the amounts to date have been immaterial to our results, as our international businesses grow and if controls are enacted or enforced in additional countries, there can be no assurance that such controls would not have a material and adverse effect on our business, financial condition or results of operations.
Our level of debt could impair our financial condition and ability to operate.
We had outstanding as of
February 3, 2019
an aggregate of $2.839 billion of indebtedness under our senior secured credit facilities, our senior unsecured notes and our secured debentures. Our level of debt could have important consequences to investors, including:
|
•
|
requiring a substantial portion of our cash flows from operations be used for the payment of interest on our debt, thereby reducing the funds available to us for our operations or other capital needs;
|
|
•
|
limiting our flexibility in planning for, or reacting to, changes in our business and the industry in which we operate because our available cash flow after paying principal and interest on our debt may not be sufficient to make the capital and other expenditures necessary to address these changes;
|
|
•
|
increasing our vulnerability to general adverse economic and industry conditions because, during periods in which we experience lower earnings and cash flow, we will be required to devote a proportionally greater amount of our cash flow to paying principal and interest on our debt;
|
|
•
|
limiting our ability to obtain additional financing in the future to fund working capital, capital expenditures, acquisitions, contributions to our pension plans and general corporate requirements;
|
|
•
|
placing us at a competitive disadvantage to other relatively less leveraged competitors that have more cash flow available to fund working capital, capital expenditures, acquisitions, share repurchases, dividend payments, contributions to pension plans and general corporate requirements; and
|
|
•
|
with respect to any borrowings we make at variable interest rates, including under our senior secured credit facilities, leaving us vulnerable to increases in interest rates to the extent the borrowings are not subject to an interest rate swap agreement.
|
We primarily use foreign suppliers for our products and raw materials, which poses risks to our business operations.
The majority of our apparel, footwear and accessories are produced by and purchased or procured from independent manufacturers located in countries in Asia, South America, Europe, the Middle East, North America, Africa, Central America and the Caribbean. Although no single supplier or country is or is expected to become critical to our production needs, any of the following could materially and adversely affect our ability to produce or deliver our products and, as a result, have a material adverse effect on our business, financial condition and results of operations:
|
•
|
political or labor instability or military conflict involving any of the countries in which we, our contractors, or our suppliers operate, which could cause a delay in the transportation of our products and raw materials to us and an increase in transportation costs;
|
21
|
•
|
heightened terrorism security concerns, which could subject imported or exported goods to additional, more frequent or more thorough inspections, leading to delays in deliveries or impoundments of goods for extended periods or could result in decreased scrutiny by customs officials for counterfeit goods, leading to lost sales, increased costs for our anti-counterfeiting measures and damage to the reputation of our brands;
|
|
•
|
a significant decrease in availability or increase in cost of raw materials or the inability to use raw materials produced in a country that is a major provider due to political, human rights, labor, environmental, animal cruelty or other concerns;
|
|
•
|
a significant decrease in factory and shipping capacity or increase in demand for such capacity;
|
|
•
|
a significant increase in wage and shipping costs;
|
|
•
|
natural disasters, which could result in closed factories and scarcity of raw materials;
|
|
•
|
disease epidemics and health-related concerns, which could result in closed factories, reduced workforces, scarcity of raw materials and scrutiny or embargoing of goods produced in infected areas;
|
|
•
|
migration and development of manufacturers, which could affect where our products are or are planned to be produced;
|
|
•
|
imposition of regulations, quotas and safeguards relating to imports and our ability to adjust timely to changes in trade regulations, which, among other things, could limit our ability to produce products in cost-effective countries that have the labor and expertise needed; and
|
|
•
|
imposition of duties, taxes and other charges on imports.
|
The United States government imposed tariffs in 2018 on a variety of imports from China into the United States, including certain categories of accessories, and may impose significant tariffs on additional goods imported from China into the United States. China is the largest sourcing country of apparel, footwear and accessories for us and most of our licensees. We imported approximately $400 million of inventory into the United States from China in 2018. Accordingly, any tariffs on apparel, footwear and accessories imported from China into the United States result in an increase in our cost of goods sold for that product. We may not be able to shift production of inventory bound for the United States from China to other countries or pass the entire cost increase onto consumers or could choose not to. Any increase in prices to consumers could have an adverse impact on our direct sales to consumers, as well as sales by our wholesale customers and our licensees. Any adverse impact on such sales or increase in our cost of goods sold could have a material adverse effect on our business and results of operations.
If our manufacturers, the manufacturers used by our licensees, or our licensees themselves fail to use legal and ethical business practices, our business could suffer.
We require our manufacturers, the manufacturers used by our licensees and the licensees themselves to operate in compliance with applicable laws, rules and regulations regarding working conditions, employment practices and environmental compliance. Additionally, we impose upon our business partners operating guidelines that require additional obligations in those areas in order to promote ethical business practices. We audit, or have third parties audit, the operations of these independent parties to determine compliance. We are a signatory of the Accord on Fire and Building Safety in Bangladesh to improve fire and building safety in Bangladesh’s apparel factories and we continue to collaborate with factories, suppliers, industry participants and other engaged stakeholders to improve the lives of our factory workers and others in our sourcing communities. However, we do not control our manufacturers, the manufacturers used by our licensees, or our licensees themselves, or their labor, manufacturing and other business practices.
If any of these manufacturers or licensees violates labor, environmental, building and fire safety, or other laws or implements labor, manufacturing or other business practices that are generally regarded as unethical in the United States, the shipment of finished products to us could be interrupted, orders could be canceled and relationships could be terminated. In addition, we could be the focus of adverse publicity and our reputation could be damaged. Any of these events could have a material adverse effect on our revenue and, consequently, our results of operations.
22
We are dependent on third parties to source and manufacture our products and any disruption in our relationships with these parties or in their businesses may materially adversely affect our businesses.
We rely upon independent third parties for the manufacturing of the vast majority of our apparel, footwear and accessories. A manufacturer’s failure to ship products to us in a timely manner or to meet required quality standards could cause us to miss the delivery date requirements of our customers for those products. As a result, customers could cancel their orders, refuse to accept deliveries or demand reduced prices. Any of these actions taken by our customers could have a material adverse effect on our revenue and, consequently, our results of operations.
We use third party buying offices for a portion of our product sourcing. Any interruption in the operations of these buying offices, or the failure of these buying offices to perform effectively their services for us, could result in material delays, reductions of shipments and increased costs. Furthermore, such events could harm our wholesale and retail relationships. Any disruption in our relationships with these buying offices or in their businesses could have a material adverse effect on our cash flows, business, financial condition and results of operations.
We are dependent on a limited number of distribution facilities. If one becomes inoperable, our business, financial condition and operating results could be negatively impacted.
We operate a limited number of distribution facilities and also engage independently operated distribution facilities around the world to warehouse and ship products to our customers and our retail stores, as well as perform related logistics services. Our ability to meet the needs of our wholesale customers and of our retail stores depends on the proper operation of our primary facilities. If any of our primary facilities were to shut down or otherwise become inoperable or inaccessible, we could have a substantial loss of inventory or disruptions of deliveries to our customers and our stores, incur significantly higher costs or experience longer lead times associated with the distribution of our products during the time it takes to reopen or replace the facility. This could materially and adversely affect our business, financial condition and operating results.
A portion of our revenue is dependent on royalties and licensing.
The operating profit associated with our royalty, advertising and other revenue is significant because the operating expenses directly associated with administering and monitoring an individual license or similar agreement are minimal. Therefore, the loss of a significant licensee, whether due to the termination or expiration of the relationship, the cessation of the licensee’s operations or otherwise (including as a result of financial difficulties of the licensee), without an equivalent replacement, could materially impact our profitability.
While we generally have significant control over our licensees’ products and advertising, we rely on them for, among other things, operational and financial controls over their businesses. Our licensees’ failure to successfully market licensed products or our inability to replace our existing licensees could materially and adversely affect our revenue both directly from reduced royalty, advertising and other revenue received and indirectly from reduced sales of our other products. Risks are also associated with our licensees’ ability to obtain capital, execute their business plans, timely deliver quality products, manage their labor relations, maintain relationships with their suppliers, manage their credit risk effectively and maintain relationships with their customers.
Our licensing business makes us susceptible to the actions of third parties over whom we have limited control.
We rely on our licensees to preserve the value of our brands. Although we attempt to protect our brands through, among other things, approval rights over design, production quality, packaging, merchandising, distribution, advertising and promotion of our products, we cannot assure you that we can control our licensees’ use of our brands. The misuse of our brands by a licensee could have a material adverse effect on our business, financial condition and results of operations.
We may be unable to protect our trademarks and other intellectual property rights.
Our trademarks and other intellectual property rights are important to our success and our competitive position. We are susceptible to others imitating our products and infringing on our intellectual property rights, especially with respect to the
TOMMY HILFIGER
and
CALVIN KLEIN
brands, as they enjoy significant worldwide consumer recognition and the generally premium pricing of
TOMMY HILFIGER
and
CALVIN KLEIN
brand products creates additional incentive for counterfeiters and infringers. Imitation or counterfeiting of our products or infringement of our intellectual property rights could diminish the value of our brands or otherwise adversely affect our revenue. We cannot assure you that the actions we take to establish and protect our trademarks and other intellectual property rights will be adequate to prevent imitation of our products by others. We
23
cannot assure you that other third parties will not seek to invalidate our trademarks or block sales of our products as a violation of their own trademarks and intellectual property rights. In addition, we cannot assure you that others will not assert rights in, or ownership of, trademarks and other intellectual property rights of ours or in marks that are similar to ours or marks that we license or market or that we will be able to successfully resolve these types of conflicts to our satisfaction. In some cases, there may be trademark owners who have prior rights to our marks because the laws of certain foreign countries may not protect intellectual property rights to the same extent as do the laws of the United States. In other cases, there may be holders who have prior rights to similar marks. For example, in the past we were involved in proceedings relating to a company’s claim of prior rights to the
IZOD
mark in Mexico and to another company’s claim of prior rights to the
CALVIN KLEIN
mark in Chile. We are currently involved in opposition and cancellation proceedings with respect to marks similar to some of our brands, both domestically and internationally.
We face intense competition in the apparel industry.
Competition is intense in the apparel industry. We compete with numerous domestic and foreign designers, brand owners, manufacturers and retailers of apparel, accessories and footwear, some of which have greater resources than we do. We also face increased competition from online retailers in the digital channel, which is characterized by low barriers to entry. In addition, in certain instances, we compete directly with our wholesale customers, as they also sell their own private label products in their stores and online. We compete within the apparel industry primarily on the basis of:
|
•
|
anticipating and responding to changing consumer tastes, demands and shopping preferences in a timely manner and developing attractive, quality products;
|
|
•
|
maintaining favorable brand recognition and relevance, including through digital brand engagement and online and social media presence;
|
|
•
|
appropriately pricing products and creating an acceptable value proposition for customers;
|
|
•
|
providing strong and effective marketing support;
|
|
•
|
ensuring product availability and optimizing supply chain efficiencies with third party manufacturers and retailers; and
|
|
•
|
obtaining sufficient retail floor space at retail and effective presentation of our products at retail and on our digital commerce sites.
|
The failure to compete effectively or to keep pace with rapidly changing markets could have a material adverse effect on our business, financial condition and results of operations.
Our profitability may decline as a result of increasing pressure on margins.
The apparel industry, particularly in the United States (our largest market), is subject to significant pricing pressure caused by many factors, including intense competition, consolidation in the retail industry, pressure from retailers and changes in consumer demand. These factors may cause us to reduce our sales prices to retailers and consumers, which could cause our profitability to decline if we are unable to appropriately manage inventory levels or offset price reductions with sufficient reductions in product costs or operating expenses. This could have a material adverse effect on our results of operations, liquidity and financial condition.
If we are unable to manage our inventory effectively and accurately forecast demand for our products, our results of operations could be materially adversely affected.
We have made investments in our supply chain management systems and processes that enable us to respond more rapidly to changes in sales trends and consumer demands and enhance our ability to manage inventory. However, we cannot assure you that we will be able to anticipate and respond successfully to changing consumer tastes and style trends or economic conditions and, as a result, we may not be able to manage inventory levels to meet our future order requirements. If we fail to accurately forecast consumer demand, we may experience excess inventory levels or a shortage of product required to meet demand. Inventory levels in excess of consumer demand may result in inventory write-downs and the sale of excess inventory at discounted prices, which could have a material adverse effect on the reputation of our brands and our profitability. If we underestimate consumer demand for our products, we may not have sufficient inventories of product to meet consumer requirements in a timely manner, which could result in lost revenues, as well as damage to our reputation and relationships.
24
The loss of members of our executive management and other key employees could have a material adverse effect on our business.
We depend on the services and management experience of our executive officers, who have substantial experience and expertise in our business. We also depend on other key executives in various areas of our businesses and operations. Competition for qualified personnel in the apparel industry is intense and competitors may use aggressive tactics to recruit our key employees. The unexpected loss of services of one or more of these individuals could have a material adverse effect on us.
A significant shift in the relative sources of our earnings, adverse decisions of tax authorities or changes in tax treaties, laws, rules or interpretations could have a material adverse effect on our results of operations and cash flow.
We have direct operations in many countries and the applicable tax rates vary by jurisdiction. As a result, our overall effective tax rate could be materially affected by the relative level of earnings in the various taxing jurisdictions to which our earnings are subject. In addition, the tax laws and regulations in the countries where we operate may be subject to change, as evidenced by the United States Tax Cuts and Jobs Act of 2017 (the “U.S. Tax Legislation”) enacted in December 2017 that significantly changed the way we are taxed. Moreover, there may be changes from time to time in interpretation and enforcement of tax law. As a result, we may pay additional taxes if tax rates increase or if tax laws, regulations or treaties in the jurisdictions where we operate are modified by the authorities in an adverse manner.
In addition, various national and local taxing authorities periodically examine us and our subsidiaries. The resolution of an examination or audit may result in us paying more than the amount that we may have reserved for a particular tax matter, which could have a material adverse effect on our cash flows, business, financial condition and results of operations for any affected reporting period.
We and our subsidiaries are engaged in a number of intercompany transactions. Although we believe that these transactions reflect arm’s length terms and that proper transfer pricing documentation is in place, which should be respected for tax purposes, the transfer prices and conditions may be scrutinized by local tax authorities, which could result in additional tax liabilities.
If we are unable to fully utilize our deferred tax assets, our profitability could be reduced.
Our deferred income tax assets are valuable to us. These assets include tax loss and foreign tax credit carryforwards in various jurisdictions. Realization of deferred tax assets is based on a number of factors, including whether there will be adequate levels of taxable income in future periods to offset the tax loss and foreign tax credit carryforwards in jurisdictions where such assets have arisen. Valuation allowances are recorded in order to reduce the deferred tax assets to the amount expected to be realized in the future. In assessing the adequacy of our valuation allowances, we consider various factors including reversal of deferred tax liabilities, forecasted future taxable income and potential tax planning strategies. These factors could reduce the value of the deferred tax assets, which could have a material effect on our profitability.
We rely significantly on information technology. Our business and reputation could be adversely impacted if our computer systems, or systems of our business partners and service providers, are disrupted or cease to operate effectively or if we or they are subject to a data security or privacy breach.
Our ability to manage and operate our business effectively depends significantly on information technology systems. We process, transmit, store and maintain information about consumers and our employees in the ordinary course of business, including personally identifiable information protected under applicable laws. This includes the collection and processing of customers’ credit and debit card numbers and reliance on systems maintained by third parties with whom we contract to provide payment processing. The failure of any system to operate effectively or disruption in these systems could adversely impact our operations.
We take, and require third party providers to take, measures to protect data but have no control over their efforts and are limited in our ability to assess their systems and processes. Furthermore, while we invest, and believe our service providers invest, considerable resources in protecting systems and information, we all are still subject to security events, including but not limited to cybercrimes and cybersecurity attacks, such as those perpetrated by sophisticated and well-resourced bad actors attempting to disrupt operations or access or steal data. Security events may not be detected for an extended period of time, which could compound the scope and extent of the damages and problems. Such security events could disrupt our business, severely damage our reputation and our relationship with consumers, and expose us to risks of litigation and liability, which may not be covered by insurance or may result in costs in excess of the insurance coverage we maintain.
25
We regularly implement new systems and hardware and are currently undertaking a major upgrade of our platforms and systems worldwide. The implementation of new software and hardware involves risks and uncertainties that could cause disruptions, delays or deficiencies that could adversely impact our operations. In addition, intended improvements may not be realized. Our business partners and service providers face the same risks, which could also adversely impact our business and operations.
We are subject to data privacy and security laws and regulations, the number and complexity of which are increasing globally. We may be the subject of enforcement or other legal actions despite our compliance efforts.
We collect, use, store, and otherwise process or rely upon access to data, including personally identifiable information, of consumers, employees, and other individuals in the daily conduct of our business. There have been significant developments in the area of data privacy and cybersecurity law and regulation. Significant new laws, such as the European Union’s General Data Protection Regulation, the Brazilian General Data Protection Law and the California Consumer Privacy Act, are continuously being proposed and enacted around the world. These laws and regulations have and could continue to cause us to change the way we operate, including in a less efficient manner, in order to comply with local requirements. We have a privacy compliance program, but our compliance efforts are not an assurance that we will not be the subject of regulatory or other legal actions. We could expend significant management and associate time and incur significant cost investigating and defending ourselves against the claims in any such matter, which matters also could result in us being the subject of significant fines, judgments or settlements. In addition, any such claim could give rise to significant reputational damage, whether or not we are ultimately successful in defending ourselves.
Volatility in securities markets, interest rates and other economic factors could increase substantially our defined benefit pension costs and liabilities.
We have significant obligations under our defined benefit pension plans. The funded status of our pension plans is dependent on many factors, including returns on invested plan assets and the discount rate used to measure pension obligations. Unfavorable returns on plan assets, a lower discount rate or unfavorable changes in the applicable laws or regulations could materially change the timing and amount of pension funding requirements, which could reduce cash available for our business.
Our operating performance also may be significantly impacted by the amount of expense recorded for our pension plans. Pension expense recorded throughout the year is calculated using actuarial valuations that incorporate assumptions and estimates about financial market, economic and demographic conditions. Differences between estimated and actual results give rise to gains and losses that are recorded immediately in pension expense, generally in the fourth quarter of the year. These gains and losses can be significant and can create volatility in our operating results.
Our balance sheet includes a significant amount of intangible assets and goodwill. A decline in the estimated fair value of an intangible asset or of a reporting unit could result in an impairment charge recorded in our operating results, which could be material.
Goodwill and other indefinite-lived intangible assets are tested for impairment annually and between annual tests if an event occurs or circumstances change that would indicate the carrying amount may be impaired. Also, we review our amortizable intangible assets for impairment if an event occurs or circumstances change that would indicate the carrying amount may not be recoverable. If the carrying value of our goodwill or an other intangible asset were to exceed its fair value, the asset would be written down to its fair value, with the impairment charge recognized as a noncash expense in our operating results. Adverse changes in future market conditions or weaker operating results compared to our expectations may impact our projected cash flows and estimates of weighted average cost of capital, which could result in a potentially material impairment charge if we are unable to recover the carrying value of our goodwill and other intangible assets.
As of
February 3, 2019
, we had approximately $3.671 billion of goodwill and $3.569 billion of other identifiable intangible assets on our balance sheet, which together represented 61% of our total assets. No impairment was recorded in 2018 based on our annual goodwill and other indefinite-lived intangible assets impairment tests.
Provisions in our certificate of incorporation and our by-laws and Delaware General Corporation Law could make it more difficult to acquire us and may reduce the market price of our common stock.
Our certificate of incorporation and by-laws contain certain provisions, including provisions requiring supermajority voting (80% of the outstanding voting power) to approve certain business combinations, permitting the Board of Directors to fill vacancies on the Board and authorizing the Board to issue shares of preferred stock without approval of our stockholders. These provisions could also have the effect of deterring changes of control.
26
In addition, Section 203 of the Delaware General Corporation Law imposes restrictions on mergers and other business combinations between us and any holder of 15% or more of our common stock. The existence of this provision may have an anti-takeover effect with respect to transactions not approved in advance by the Board.
The United Kingdom’s proposed withdrawal from the European Union could harm our business and financial results.
In June 2016, voters in the United Kingdom approved a referendum to withdraw from the European Union (commonly referred to as “Brexit”). Subsequently, in March 2017, the United Kingdom submitted a formal notification of its intention to withdraw from the European Union, which began a two-year negotiation period that culminated in an agreement upon the withdrawal terms, which was subject to approval by British Parliament. Parliament rejected the agreement and the British Prime Minister requested an extension to June 30, 2019 of the March 29, 2019 effective date for Brexit. On March 21, 2019, the leaders of the other member countries of the European Union agreed to extend the deadline for Brexit until April 12, 2019. However, if the British Parliament approves the previously rejected terms of withdrawal, then the deadline would be further extended to May 22, 2019. Additionally, if the United Kingdom agrees to hold elections for European Parliament that are scheduled for May 23, 2019, the deadline could be further extended. As a result, there remains considerable uncertainty around the withdrawal. If the British Parliament does not agree to terms of withdrawal and the United Kingdom does not agree to participate in the European Parliament elections, the United Kingdom would leave the European Union on April 12, 2019 without an agreement. There is also significant discussion regarding submitting Brexit to a second referendum. The uncertainty surrounding the United Kingdom’s withdrawal and its consequences could adversely impact consumer and investor confidence and the level of consumer purchases of discretionary items and retail products, including our products. The withdrawal could also significantly disrupt the free movement of goods, services and people between the United Kingdom and the European Union and may result in increased legal and regulatory complexities and higher costs of conducting business in Europe. Volatility in the value of the British pound sterling, the euro and other European currencies could also result. Any of these effects, among others, could adversely affect our business, results of operations and financial condition.
Item 1B. Unresolved Staff Comments
None.
27
Item 2. Properties
The general location, use, ownership status and approximate size of the principal properties that we occupied as of
February 3, 2019
are set forth below:
|
Location
|
Use
|
Ownership
Status
|
Approximate
Area in
Square Feet
|
|||
|
New York, New York
|
Corporate and Heritage Brands administrative offices and showrooms
|
Leased
|
209,000
|
|
||
|
New York, New York
|
Calvin Klein administrative offices and showrooms
|
Leased
|
462,000
|
|
||
|
New York, New York
|
Tommy Hilfiger administrative offices and showrooms
|
Leased
|
206,000
|
|
||
|
Bridgewater, New Jersey
|
Corporate and retail administrative offices
|
Leased
|
285,000
|
|
||
|
Amsterdam, The Netherlands
|
Tommy Hilfiger and Calvin Klein administrative offices, warehouse and showrooms
|
Leased
|
499,000
|
|
||
|
Venlo/Oud Gastel, The Netherlands
|
Warehouse and distribution centers
|
Leased
|
2,051,000
|
|
||
|
McDonough, Georgia
|
Warehouse and distribution center
|
Leased
|
851,000
|
|
||
|
Jonesville, North Carolina
|
Warehouse and distribution center
|
Owned
|
778,000
|
|
||
|
Reading, Pennsylvania
|
Warehouse and distribution center
|
Owned
|
410,000
|
|
||
|
Los Angeles, California
|
Neckwear administrative offices and warehouse
|
Leased
|
200,000
|
|
||
|
Montreal, Canada
|
Administrative offices, warehouse and distribution center
|
Leased
|
183,000
|
|
||
|
Hong Kong, China
|
Corporate, Tommy Hilfiger and Calvin Klein administrative offices
|
Leased
|
170,000
|
|
||
|
Hawassa, Ethiopia
|
Manufacturing facility
|
Leased
|
155,000
|
|
||
|
Brinkley, Arkansas
|
Warehouse and distribution center
|
Owned
|
112,000
|
|
||
|
Dusseldorf, Germany
|
Tommy Hilfiger and Calvin Klein administrative offices and showrooms
|
Leased
|
91,000
|
|
||
|
Cypress, California
|
Speedo administrative offices
|
Leased
|
69,000
|
|
||
|
Paris, France
|
Tommy Hilfiger and Calvin Klein administrative offices and showrooms
|
Leased
|
62,000
|
|
||
|
Milan, Italy
|
Tommy Hilfiger and Calvin Klein administrative offices and showrooms
|
Leased
|
58,000
|
|
||
|
Shanghai, China
|
Tommy Hilfiger and Calvin Klein administrative offices
|
Leased
|
60,000
|
|
||
In addition, as of
February 3, 2019
, we leased certain other administrative offices and showrooms in various domestic and international locations. We also leased and operated as of
February 3, 2019
over 1,700 retail locations in the United States, Canada, Europe, Asia and Brazil.
Our Jonesville, North Carolina property is subject to a lien under our senior secured credit facilities.
Information with respect to minimum annual rental commitments under leases in which we are a lessee is included in
Note 16
, “
Leases
,” in the Notes to Consolidated Financial Statements included in Item 8 of this report.
Item 3. Legal Proceedings
We are a party to certain litigations which, in management’s judgment based, in part, on the opinions of legal counsel, will not have a material adverse effect on our financial position.
28
Item 4. Mine Safety Disclosures
Not applicable.
29
PART II
Item 5. Market for Registrant’s Common Equity, Related Stockholder Matters and Issuer Purchases of Equity Securities
Our common stock is traded on the New York Stock Exchange under the symbol “PVH.” Certain information with respect to the dividends declared on our common stock appear in the Consolidated Statements of Changes in Stockholders’ Equity and Redeemable Non-Controlling Interest included in Item 8 of this report. Please see
Note 8
, “
Debt
,” in the Notes to Consolidated Financial Statements included in Item 8 of this report for a description of the restrictions to our paying dividends on our common stock. As of March 18, 2019, there were 590 stockholders of record of our common stock.
ISSUER PURCHASES OF EQUITY SECURITIES
|
Period
|
(a) Total Number of Shares (or Units) Purchased
(1)(2)
|
(b) Average Price Paid
per Share
(or Unit)
(1)(2)
|
(c) Total Number of Shares (or Units) Purchased as Part of Publicly Announced Plans or Programs
(1)
|
(d) Maximum Number (or Approximate Dollar Value) of Shares (or Units) that May Yet Be Purchased Under the Plans or Programs
(1)
|
||||||||||
|
November 5, 2018 -
|
|
|
||||||||||||
|
December 2, 2018
|
158,007
|
|
$
|
116.13
|
|
157,695
|
|
$
|
292,665,255
|
|
||||
|
December 3, 2018 -
|
|
|
|
|
|
|
||||||||
|
January 6, 2019
|
240,657
|
|
95.72
|
|
240,352
|
|
269,662,940
|
|
||||||
|
January 7, 2019 -
|
|
|
|
|
|
|
|
|
||||||
|
February 3, 2019
|
110,154
|
|
103.76
|
|
110,000
|
|
258,257,007
|
|
||||||
|
Total
|
508,818
|
|
$
|
103.80
|
|
508,047
|
|
$
|
258,257,007
|
|
||||
___________________
|
(1)
|
On June 1, 2015, we announced that our Board of Directors had authorized us to repurchase up to $500 million of our outstanding common stock. The Board of Directors’ authorization was effective through June 3, 2018. On March 21, 2017, the Board of Directors authorized a $750 million increase to the program and extended it to June 3, 2020. On March 26, 2019, the Board of Directors authorized a further $750 million increase to the program and extended it to June 3, 2023, which is not reflected in the table above. Repurchases under the program may be made from time to time over the period through open market purchases, accelerated share repurchase programs, privately negotiated transactions or other methods, as we deem appropriate. Purchases are made based on a variety of factors, such as price, corporate requirements and overall market conditions, applicable legal requirements and limitations, restrictions under our debt arrangements, trading restrictions under our insider trading policy and other relevant factors. The program may be modified by the Board of Directors, including to increase or decrease the repurchase limitation or extend, suspend, or terminate the program, at any time, without prior notice.
|
|
(2)
|
Our 2006 Stock Incentive Plan provides us with the right to deduct or withhold, or require employees to remit to us, an amount sufficient to satisfy any applicable tax withholding requirements applicable to stock-based compensation awards. To the extent permitted, employees may elect to satisfy all or part of such withholding requirements by tendering previously owned shares or by having us withhold shares having a fair market value equal to the minimum statutory tax withholding rate that could be imposed on the transaction. Included in this table are shares withheld during the
fourth quarter of 2018
principally in connection with the settlement of restricted stock units to satisfy tax withholding requirements, in addition to the shares repurchased as part of the stock repurchase program discussed above.
|
The following performance graph and return to stockholders information shown below are provided pursuant to Item 201(e) of Regulation S-K promulgated under the Exchange Act. The graph and information are not deemed to be “filed” under the Exchange Act or otherwise subject to liabilities thereunder, nor are they to be deemed to be incorporated by reference in any filing under the Securities Act or Exchange Act unless we specifically incorporate them by reference.
30
The performance graph compares the yearly change in the cumulative total stockholder return on our common stock against the cumulative return of the S&P 500 Index and the S&P 500 Apparel, Accessories & Luxury Goods Index for the five fiscal years ended
February 3, 2019
.
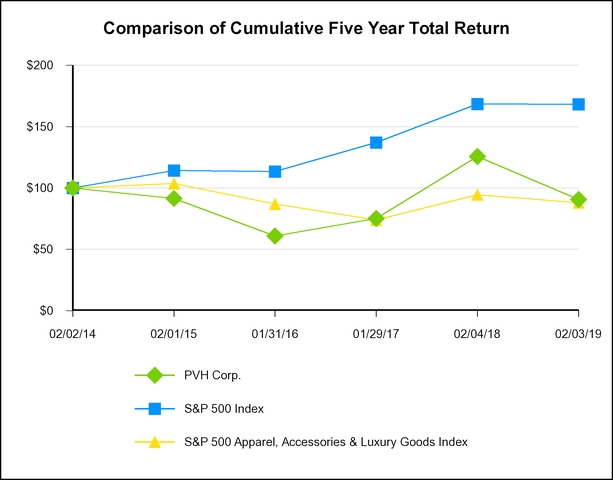
|
Value of $100.00 invested after 5 years:
|
|
||
|
Our Common Stock
|
$
|
90.62
|
|
|
S&P 500 Index
|
$
|
168.36
|
|
|
S&P 500 Apparel, Accessories & Luxury Goods Index
|
$
|
88.04
|
|
Item 6. Selected Financial Data
Selected Financial Data appears under the heading “Five Year Financial Summary” on pages F-63 and F-64.
31
Item 7. Management’s Discussion and Analysis of Financial Condition and Results of Operations
OVERVIEW
The following discussion and analysis is intended to help you understand us, our operations and our financial performance. It should be read in conjunction with our consolidated financial statements and the accompanying notes, which are included elsewhere in this report.
We are one of the largest branded apparel companies in the world, with a history going back over 135 years. Our brand portfolio consists of nationally and internationally recognized trademarks, including
TOMMY HILFIGER
,
CALVIN KLEIN
,
Van Heusen
,
IZOD
,
ARROW
,
Speedo
(licensed in perpetuity for North America and the Caribbean from Speedo International Limited),
Warner’s
,
Olga
,
True&Co.
and
Geoffrey Beene.
Our brand portfolio also consists of various other owned, licensed and private label brands.
Our business strategy is to position our brands to sell globally at various price points and in multiple channels of distribution. This enables us to offer products to a broad range of consumers, while minimizing competition among our brands and reducing our reliance on any one demographic group, product category, price point, distribution channel or region. We also license the use of our trademarks to third parties and joint ventures for product categories and in regions where we believe our licensees’ expertise can better serve our brands.
Our revenue was $9.657 billion in 2018, of which over 50% was generated outside of the United States. Our global designer lifestyle brands,
TOMMY HILFIGER
and
CALVIN KLEIN
, together generated over 80% of our revenue.
RESULTS OF OPERATIONS
Operations Overview
We generate net sales from (i) the wholesale distribution to retailers, franchisees, licensees and distributors of dress shirts, neckwear, sportswear, jeanswear, performance apparel, intimate apparel, underwear, swim products, handbags, accessories, footwear and other related products under owned and licensed trademarks, including through digital commerce sites operated by our wholesale partners and pure play digital commerce retailers, and (ii) the sale of certain of these products through (a) approximately 1,700 Company-operated free-standing retail store locations worldwide under our
TOMMY HILFIGER
,
CALVIN KLEIN
and certain of our heritage brands trademarks, (b) approximately 1,500 Company-operated shop-in-shop/concession locations worldwide under our
TOMMY HILFIGER
and
CALVIN KLEIN
trademarks, and (c) digital commerce sites in over 30 countries under each of our
TOMMY HILFIGER
and
CALVIN KLEIN
trademarks and in the United States through our
SpeedoUSA
.com,
TrueAndCo
.com,
VanHeusen
.com,
IZOD
.com and
styleBureau
.com digital commerce sites. Additionally, we generate royalty, advertising and other revenue from fees for licensing the use of our trademarks. We manage our operations through our operating divisions, which are presented as
six
reportable segments: (i) Tommy Hilfiger North America; (ii) Tommy Hilfiger International; (iii) Calvin Klein North America; (iv) Calvin Klein International; (v) Heritage Brands Wholesale; and (vi) Heritage Brands Retail.
We have entered into the following transactions, which impact our results of operations and comparability among the years, including our 2019 expectations as compared to 2018, as discussed in the section entitled “Result of Operations” below:
|
•
|
We will be closing our
TOMMY HILFIGER
flagship and anchor stores in the United States in the first quarter of 2019. We expect to incur pre-tax costs of approximately $60 million during 2019, primarily consisting of severance, noncash asset impairments and lease and other contract termination costs.
|
|
•
|
We announced in the first quarter of 2019 that we had entered into definitive agreements for two pending acquisitions. The first is for purposes of acquiring the approximately 78% interest in Gazal that we do not already own. We, along with Gazal, jointly own and manage PVH Australia, which licenses and operates businesses under the
TOMMY HILFIGER
,
CALVIN KLEIN
and
Van Heusen
brands, along with other licensed and owned brands. PVH Australia will come under our full ownership as a result of the acquisition. The aggregate net purchase price for the shares being acquired is approximately A$124 million (approximately $90 million based on the current exchange rate in effect), after taking into account the divestiture to a third party of an office building and warehouse owned by Gazal. The second is for purposes of acquiring the Tommy Hilfiger retail business in Hong Kong and certain other countries in Central and Southeast Asia from our current licensee in those markets. The purchase price is estimated to be approximately $75 million. The closings of these two pending acquisitions are subject to customary conditions,
|
32
including in respect of the Australia acquisition, shareholder and court approvals, and are expected to occur in the second quarter of 2019. We expect to record a net pre-tax gain of approximately $70 million during 2019 in connection with the Australia acquisition and TH CSAP acquisition, consisting of a noncash gain to write up our equity investments in Gazal and PVH Australia to fair value, partially offset by pre-tax costs related to both acquisitions, primarily consisting of noncash valuation adjustments and amortization of short-lived assets.
|
•
|
We announced on January 10, 2019 a restructuring in connection with strategic changes for our
Calvin Klein business (the “Calvin Klein restructuring”). The strategic changes include (i) the closure of the
CALVIN KLEIN 205 W39 NYC
brand (formerly
Calvin Klein Collection
), (ii) the closure of the flagship store on Madison Avenue in New York, New York, (iii) the restructuring of the Calvin Klein creative and design teams globally, and (iv) the consolidation of operations for the men’s Calvin Klein Sportswear and Calvin Klein Jeans businesses. We recorded pre-tax costs of $41 million in the fourth quarter of 2018, consisting of $27 million of severance, $7 million of noncash asset impairments, $4 million of contract termination and other costs and $2 million of inventory markdowns. We expect to incur additional pre-tax costs of approximately $130 million during 2019 in connection with the Calvin Klein restructuring, primarily consisting of severance, noncash asset impairments, lease and other contract termination costs, and inventory markdowns. Please see
Note 17
, “
Exit Activity Costs
,” in the Notes to Consolidated Financial Statements included in Item 8 of this report for further discussion.
|
|
•
|
We acquired on April 20, 2018 the
Geoffrey Beene
tradename from Geoffrey Beene for $17 million, of which $16 million was paid in cash. Prior to the acquisition, we had licensed the rights to design, market and distribute
Geoffrey Beene
dress shirts and neckwear from Geoffrey Beene.
|
|
•
|
We issued on December 21, 2017 €600 million euro-denominated principal amount of 3 1/8% senior notes due December 15, 2027. We redeemed on January 5, 2018 our $700 million principal amount of 4 1/2% senior notes due December 15, 2022 (using the proceeds of the senior notes due December 15, 2027) and recorded pre-tax debt extinguishment charges of $24 million. Please see the section entitled “Liquidity and Capital Resources” below for further discussion.
|
|
•
|
We amended on December 20, 2017 Mr. Tommy Hilfiger’s employment agreement, pursuant to which we made a cash buyout of a portion of the future payment obligation (the “Mr. Hilfiger amendment”). We recorded pre-tax charges of $83 million in 2017 in connection with the amendment.
|
|
•
|
We restructured our supply chain relationship with Li & Fung in a transaction that closed on September 30, 2017. Our non-exclusive buying agency agreement with Li & Fung was terminated in connection with this transaction. We recorded pre-tax charges of $54 million in 2017 in connection with the termination.
|
|
•
|
We acquired on September 1, 2017 the Tommy Hilfiger and Calvin Klein wholesale and concessions businesses in Belgium and Luxembourg from a former agent (the “Belgian acquisition”). As a result of this acquisition, we now operate directly our Tommy Hilfiger and Calvin Klein businesses in this region. The total consideration for the acquisition was $12 million.
|
|
•
|
We acquired on March 30, 2017 True & Co., a direct-to-consumer intimate apparel digital commerce retailer. This acquisition enabled us to participate further in the fast-growing online channel and provided a platform to increase innovation, data-driven decisions and speed in the way we serve our consumers across our channels of distribution. The total consideration for the acquisition was $28 million, net of $400,000 of cash acquired.
|
|
•
|
We completed the relocation of our Tommy Hilfiger office in New York in 2017 and recorded related pre-tax charges of $19 million, including noncash depreciation expense.
|
|
•
|
We purchased a group annuity in 2017 for certain participants of our retirement plans under which certain of our benefit obligations were transferred to an insurer. We recorded a pre-tax loss of $9 million in connection with the noncash settlement of such benefit obligations.
|
|
•
|
We completed a consolidation within our warehouse and distribution network in North America in 2017 and recorded related net pre-tax charges of $8 million, which included a $3 million gain on the sale of a warehouse and distribution center.
|
33
|
•
|
We entered into an agreement on January 24, 2017 to terminate the license for the Tommy Hilfiger men’s tailored clothing business in North America held by Marcraft Clothes, Inc. effective December 31, 2017 (the “TH men’s tailored license termination”). Peerless Clothing International, Inc. became the licensee for the business effective January 1, 2018. These transactions were undertaken in order to consolidate with Peerless Clothing International, Inc. our men’s tailored businesses for all of our brands in North America. We recorded a pre-tax charge of $11 million in 2016 in connection with the TH men’s tailored license termination.
|
|
•
|
We formed on November 30, 2016 a joint venture in Mexico, PVH Mexico, in which we own a 49% economic interest. The joint venture was formed by merging our wholly owned subsidiary that principally operated and managed our Calvin Klein business in Mexico with a wholly owned subsidiary of Grupo Axo that distributes certain
TOMMY HILFIGER
brand products in Mexico. In connection with the formation of PVH Mexico, we deconsolidated our wholly owned subsidiary. We recorded a pre-tax noncash loss of $82 million in 2016 (including $
57
million related to foreign currency translation adjustment losses previously recorded in accumulated other comprehensive loss) in connection with the Mexico deconsolidation.
|
|
•
|
We, along with Arvind, formed PVH Ethiopia on June 29, 2016, in which we own a 75% interest. We have consolidated the joint venture in our consolidated financial statements. PVH Ethiopia was formed to operate a manufacturing facility that produces finished products for us for distribution primarily in the United States. The manufacturing facility began operations in 2017.
|
|
•
|
We issued on June 20, 2016 €350 million euro-denominated principal amount of 3 5/8% senior notes due July 15, 2024. Please see the section entitled “Liquidity and Capital Resources” below for further discussion.
|
|
•
|
We amended on May 19, 2016 our senior secured credit facilities and recorded pre-tax debt modification and extinguishment charges of $16 million. Please see the section entitled “Liquidity and Capital Resources” below for further discussion.
|
|
•
|
We acquired on April 13, 2016 the 55% of the ownership interests in TH China, our former joint venture for
TOMMY HILFIGER
in China, that we did not already own. As a result of the TH China acquisition, we now operate directly our Tommy Hilfiger business in this market. The total consideration for the acquisition was $161 million (including the elimination of a $3 million pre-acquisition receivable owed to us by TH China), net of cash acquired of $105 million. We recorded a net pre-tax gain of $70 million in 2016, including a noncash gain of $153 million to write-up our equity investment to fair value prior to the acquisition closing and costs of $83 million, which primarily consisted of noncash valuation adjustments and amortization of short-lived assets. We recorded pre-tax charges of $24 million and $27 million in 2018 and 2017, respectively, primarily consisting of noncash amortization of short-lived assets.
|
|
•
|
We exited a
TOMMY HILFIGER
flagship store in Europe in 2016 and recorded a pre-tax gain of $18 million in connection with a payment made to us.
|
Our Tommy Hilfiger and Calvin Klein businesses each have substantial international components that expose us to significant foreign exchange risk. Our Heritage Brands business also has international components but those components are not significant to the business. Our results of operations in local foreign currencies are translated into United States dollars using an average exchange rate over the representative period. Accordingly, our results of operations are unfavorably impacted during times of a strengthening United States dollar against the foreign currencies in which we generate significant revenue and earnings and favorably impacted during times of a weakening United States dollar against those currencies. Over 50% of our $9.657 billion of revenue in 2018 was subject to foreign currency translation.
There is also a transactional impact on our financial results because inventory typically is purchased in United States dollars by our foreign subsidiaries. As with translation, our results of operations will be unfavorably impacted during times of a strengthening United States dollar as the increased local currency value of inventory results in a higher cost of goods in local currency when the goods are sold and favorably impacted during times of a weakening United States dollar as the decreased local currency value of inventory results in a lower cost of goods in local currency when the goods are sold. We use foreign currency forward exchange contracts to hedge against a portion of the exposure related to this transactional impact. The contracts cover at least 70% of the projected inventory purchases in United States dollars by our foreign subsidiaries. These contracts are generally entered into 12 months in advance of the related inventory purchases. Therefore, the impact of fluctuations of the United States dollar on the cost of inventory purchases covered by these contracts may be realized in our results of operations in the year following their inception, as the underlying inventory hedged by the contracts is sold.
34
Additionally, there is a transactional impact related to changes in SG&A expenses as a result of fluctuations in foreign currency exchange rates.
Based on current foreign currency exchange rates, we expect a decrease in revenue of approximately $150 million, or 1%, and a slight decrease in net income in 2019 as compared to 2018 due to the impact of foreign currency exchange.
Further, we have exposure to changes in foreign currency exchange rates related to our €950 million aggregate principal amount of euro-denominated senior notes, as the weakening of the United States dollar against the euro would require us to use a greater amount of our cash flows from operations to pay interest and make long-term debt repayments. We designated the carrying amount of these euro-denominated senior notes that we had issued in the United States as net investment hedges of our investments in certain of our foreign subsidiaries that use the euro as their functional currency. As a result, the remeasurement of these foreign currency borrowings at the end of each period is recorded in equity.
Retail comparable store sales discussed below refer to sales from retail stores that have been open for at least 12 months, as well as sales from Company-operated digital commerce sites for those businesses and regions that have operated the related digital commerce site for at least 12 months. Sales from retail stores and Company-operated digital commerce sites that are closed or shut down during the year are excluded from the calculation of retail comparable store sales. Sales for retail stores that are relocated, materially altered in size or closed for a certain number of consecutive days and sales from Company-operated digital commerce sites that are materially altered are also excluded from the calculation of retail comparable store sales until such stores or sites have been in their new location or in their newly renovated state, as applicable, for at least 12 months. Retail comparable store sales are based on local currencies and comparable weeks. As a result of the 53rd week in 2017, the 2018 retail comparable store sales are more appropriately compared with the 52 week period ended February 4, 2018 (which excludes for this purpose the first week of 2017). All 2018 retail comparable store sales are presented on this shifted basis. 2017 retail comparable store sales exclude the extra week in 2017.
The following table summarizes our income statements in 2018, 2017 and 2016:
|
|
2018
|
2017
|
2016
|
||||||||
|
(Dollars in millions)
|
|
|
|
||||||||
|
Net sales
|
$
|
9,154
|
|
$
|
8,439
|
|
$
|
7,791
|
|
||
|
Royalty revenue
|
376
|
|
366
|
|
321
|
|
|||||
|
Advertising and other revenue
|
127
|
|
109
|
|
91
|
|
|||||
|
Total revenue
|
9,657
|
|
8,915
|
|
8,203
|
|
|||||
|
Gross profit
|
5,308
|
|
4,894
|
|
4,370
|
|
|||||
|
% of total revenue
|
55.0
|
%
|
54.9
|
%
|
53.3
|
%
|
|||||
|
SG&A
|
4,433
|
|
4,245
|
|
3,678
|
|
|||||
|
% of total revenue
|
45.9
|
%
|
47.6
|
%
|
44.8
|
%
|
|||||
|
Non-service related pension and postretirement cost (income)
|
5
|
|
3
|
|
(41
|
)
|
|||||
|
Debt modification and extinguishment costs
|
—
|
|
24
|
|
16
|
|
|||||
|
Other noncash gain, net
|
—
|
|
—
|
|
71
|
|
|||||
|
Equity in net income of unconsolidated affiliates
|
21
|
|
10
|
|
0
|
|
|||||
|
Income before interest and taxes
|
892
|
|
632
|
|
789
|
|
|||||
|
Interest expense
|
121
|
|
128
|
|
121
|
|
|||||
|
Interest income
|
5
|
|
6
|
|
6
|
|
|||||
|
Income before taxes
|
776
|
|
510
|
|
674
|
|
|||||
|
Income tax expense (benefit)
|
31
|
|
(26
|
)
|
125
|
|
|||||
|
Net income
|
745
|
|
536
|
|
549
|
|
|||||
|
Less: Net loss attributable to redeemable non-controlling interest
|
(2
|
)
|
(2
|
)
|
0
|
|
|||||
|
Net income attributable to PVH Corp.
|
$
|
746
|
|
$
|
538
|
|
$
|
549
|
|
||
35
Total Revenue
Total revenue was $9.657 billion in 2018, $8.915 billion in 2017 and $8.203 billion in 2016. Revenue in 2017 included the benefit of a 53rd week. The increase in revenue of $742 million, or 8%, in 2018 as compared to 2017 was due principally to the effect of the following items:
|
•
|
The addition of an aggregate $451 million of revenue, or a 12% increase over the prior year, attributable to our Tommy Hilfiger International and Tommy Hilfiger North America segments, which included the addition of $49 million, or 1%, related to the impact of foreign currency translation. Tommy Hilfiger International segment revenue increased 15% (including a 2% positive foreign currency impact), driven by continued strong performance across all regions and channels. Tommy Hilfiger International comparable store sales increased 13%. Revenue in our Tommy Hilfiger North America segment increased 6%, principally attributable to strength in the wholesale business and a 5% comparable store sales increase.
|
|
•
|
The addition of an aggregate $270 million of revenue, or an 8% increase over the prior year, attributable to our Calvin Klein International and Calvin Klein North America segments, which included the addition of $12 million related to the impact of foreign currency translation. Calvin Klein International segment revenue increased 10%, driven by growth in Europe and Asia. Calvin Klein International comparable store sales increased 5%. Revenue in our Calvin Klein North America segment increased 5% primarily as a result of growth in the wholesale business and a 1% comparable store sales increase.
|
|
•
|
The addition of an aggregate $21 million of revenue, or a 1% increase over the prior year, attributable to our Heritage Brands Retail and Heritage Brands Wholesale segments. Comparable store sales increased 1%.
|
The increase in revenue of $712 million, or 9%, in 2017 as compared to 2016 was due principally to the effect of the following items, inclusive of a 53rd week in 2017:
|
•
|
The addition of an aggregate $382 million of revenue, or an 11% increase over the prior year, attributable to our Tommy Hilfiger International and Tommy Hilfiger North America segments, which included an addition of approximately $73 million, or 2%, related to the impact of foreign currency translation. Tommy Hilfiger International segment revenue increased 19% (including a 4% positive foreign currency impact), driven principally by outstanding performance in Europe and Asia, as well as the inclusion of a full first quarter of revenue from the China business as a result of the TH China acquisition in April 2016. Tommy Hilfiger International comparable store sales increased 8%. Revenue in our Tommy Hilfiger North America segment was flat, as a reduction of approximately $75 million resulting from the discontinuation of our directly operated womenswear wholesale business in the United States and Canada during the fourth quarter of 2016 in connection with the licensing of this business to G-III offset growth in the retail business. Tommy Hilfiger North America comparable store sales increased 3%.
|
|
•
|
The addition of an aggregate $326 million of revenue, or a 10% increase over the prior year, attributable to our Calvin Klein International and Calvin Klein North America segments, which included an addition of approximately $49 million, or 2%, related to the impact of foreign currency translation. Calvin Klein International segment revenue increased 21% (including a 3% positive foreign currency impact), driven by strength in Europe and China. Calvin Klein International comparable store sales increased 6%. Revenue in our Calvin Klein North America segment increased 1%, principally due to growth in the wholesale business and an increase in royalty revenue, partially offset by a reduction of approximately $60 million resulting from the Mexico deconsolidation and a 1% decline in comparable store sales.
|
|
•
|
The addition of an aggregate $3 million of revenue attributable to our Heritage Brands Retail and Heritage Brands Wholesale segments. Comparable store sales increased 2%.
|
We currently expect that revenue will increase 4% in 2019 compared to 2018, inclusive of a negative impact of approximately 1% related to foreign currency translation. Revenue for the Tommy Hilfiger business is expected to increase approximately 6% compared to 2018, inclusive of a negative impact of approximately 2% related to foreign currency translation. Revenue for the Calvin Klein business is expected to increase approximately 2% compared to 2018, inclusive of a negative impact of approximately 1% related to foreign currency translation. Revenue for our Heritage Brands business is expected to increase approximately 3% compared to 2018. Our 2019 guidance assumes that both the Australia acquisition and the TH CSAP acquisition will close in the second quarter of 2019. These pending acquisitions are expected to add approximately $150 million of revenue in 2019.
36
Gross Profit
Gross profit is calculated as total revenue less cost of goods sold and gross margin is calculated as gross profit divided by total revenue. Included as cost of goods sold are costs associated with the production and procurement of product, such as inbound freight costs, purchasing and receiving costs and inspection costs. Also included as cost of goods sold are the amounts recognized on foreign currency forward exchange contracts as the underlying inventory hedged by such forward exchange contracts is sold. Warehousing and distribution expenses are included in SG&A expenses. All of our royalty, advertising and other revenue is included in gross profit because there is no cost of goods sold associated with such revenue. As a result, our gross profit may not be comparable to that of other entities.
The following table shows our revenue mix between net sales and royalty, advertising and other revenue, as well as our gross margin for
2018
,
2017
and
2016
:
|
2018
|
2017
|
2016
|
||||||
|
Components of revenue:
|
|
|
|
|||||
|
Net sales
|
94.8
|
%
|
94.7
|
%
|
95.0
|
%
|
||
|
Royalty, advertising and other revenue
|
5.2
|
|
5.3
|
|
5.0
|
|
||
|
Total
|
100.0
|
%
|
100.0
|
%
|
100.0
|
%
|
||
|
Gross margin
|
55.0
|
%
|
54.9
|
%
|
53.3
|
%
|
||
Gross profit in 2018 was $5.308 billion, or 55.0% of total revenue, as compared to $4.894 billion, or 54.9% of total revenue, in 2017. The 10 basis point increase in gross margin was principally driven by (i) a favorable mix of business due to faster growth in our Tommy Hilfiger International and Calvin Klein International segments than in our North America segments, as our International segments generally carry higher gross margins, and (ii) gross margin improvement in our Tommy Hilfiger business. Partially offsetting these increases were gross margin declines in our Calvin Klein and Heritage Brands businesses principally due to more promotional selling.
Gross profit in 2017 was $4.894 billion, or 54.9% of total revenue, as compared to $4.370 billion, or 53.3% of total revenue, in 2016. The 160 basis point increase in gross margin was principally driven by (i) a favorable mix of business due to faster growth in our Tommy Hilfiger International and Calvin Klein International segments than in our North America segments, as our International segments generally carry higher gross margins, (ii) gross margin improvements in our North America segments due to less promotional selling, and (iii) gross margin improvements related to the Mexico deconsolidation and the G-III license, as the directly operated businesses in Mexico and the directly operated Tommy Hilfiger wholesale womenswear business in the United States and Canada were replaced by royalty revenues from PVH Mexico and G-III, which carry no cost of goods sold. These increases were partially offset by the unfavorable impact of the stronger United States dollar on our international businesses that purchase inventory in United States dollars, particularly our European businesses, as the increased local currency value of inventory resulted in higher cost of goods in local currency when the goods were sold.
We currently expect that gross margin in 2019 will increase as compared to 2018 due to (i) the impact of expected faster growth in our Tommy Hilfiger International and Calvin Klein International segments than in our North America segments, as our International segments generally carry higher gross margins, and (ii) an expected increase in gross margin in our Calvin Klein business due to less promotional selling resulting from the restructuring initiatives being implemented related to our creative and design functions. These increases will be partially offset by short-lived noncash valuation adjustments expected to be recorded principally in connection with the Australia acquisition.
SG&A Expenses
Our SG&A expenses were as follows:
|
|
2018
|
2017
|
2016
|
||||||||
|
(Dollars in millions)
|
|
|
|
||||||||
|
SG&A expenses
|
$
|
4,433
|
|
$
|
4,245
|
|
$
|
3,678
|
|
||
|
% of total revenue
|
45.9
|
%
|
47.6
|
%
|
44.8
|
%
|
|||||
SG&A expenses in 2018 were $4.433 billion, or 45.9% of total revenue, as compared to $4.245 billion, or 47.6% of total revenue in 2017. The 170 basis point decrease in SG&A expenses as a percentage of total revenue was principally
37
attributable to the absence in 2018 of costs that were recorded in 2017 in connection with (i) the Mr. Hilfiger amendment, (ii) the Li & Fung termination, (iii) the relocation of our Tommy Hilfiger office in New York, including noncash depreciation expense, and (iv) the consolidation within our warehouse and distribution network in North America. Also contributing to the decrease was a leveraging of expenses in the Tommy Hilfiger business. These decreases were partially offset by (i) a change in the mix of business due to faster growth in our Tommy Hilfiger International and Calvin Klein International segments than in our North America segments, as our International segments generally carry higher SG&A expenses as percentages of total revenue, (ii) the costs incurred in connection with the Calvin Klein restructuring and (iii) an increase in corporate expenses due, in part, to investments in digital and information technology initiatives.
SG&A expenses in 2017 were $4.245 billion, or 47.6% of total revenue, as compared to $3.678 billion, or 44.8% of total revenue in 2016. The 280 basis point increase in SG&A expenses as a percentage of total revenue was principally attributable to (i) a change in the mix of business due to faster growth in our Tommy Hilfiger International and Calvin Klein International segments than in our North America segments, as our International segments generally carry higher SG&A expenses as percentages of total revenue, (ii) the costs incurred in connection with the Mr. Hilfiger amendment, (iii) the costs incurred in connection with the Li & Fung termination, (iv) an increase in marketing expenditures, particularly in the Calvin Klein business, (v) an increase in corporate expenses due, in part, to investments in digital and sourcing initiatives, including start-up costs associated with PVH Ethiopia, (vi) the costs incurred in connection with the relocation of our Tommy Hilfiger office in New York, including noncash depreciation expense, (vii) the absence of the gain recorded in 2016 in connection with a payment made to us to exit a
TOMMY HILFIGER
flagship store in Europe and (viii) the costs incurred in connection with the consolidation within our warehouse and distribution network in North America. These increases were partially offset by (i) a reduction of costs incurred in connection with the TH China acquisition, primarily consisting of noncash valuation adjustments and amortization of short-lived assets, (ii) the absence of the costs incurred in connection with the TH men’s tailored license termination and (iii) the absence of costs incurred in connection with the Warnaco integration and related restructuring.
We currently expect that SG&A expenses as a percentage of total revenue in 2019 will increase as compared to 2018 due to (i) an increase in costs expected to be incurred in connection with the Calvin Klein restructuring, (ii) costs expected to be incurred in connection with the closure of our
TOMMY HILFIGER
flagship and anchor stores in the United States, (iii) costs expected to be incurred in connection with the Australia acquisition and the TH CSAP acquisition, primarily consisting of noncash valuation adjustments and amortization of short-lived assets, and (iv) a change in the mix of business due to faster growth in our Tommy Hilfiger International and Calvin Klein International segments than in our North America segments, as our International segments generally carry higher SG&A expenses as percentages of total revenue. These increases will be partially offset by the absence in 2019 of costs that were recorded in 2018 in connection with the TH China acquisition, consisting of noncash amortization of short-lived assets.
Non-Service Related Pension and Postretirement Cost (Income)
Non-service related pension and postretirement cost in 2018 was $5 million as compared to $3 million in 2017. Non-service related pension and postretirement cost in 2018 included a $15 million actuarial loss on our retirement plans. Non-service related pension and postretirement cost in 2017 included a $9 million loss recorded in connection with the noncash settlement of certain of our benefit obligations related to our retirement plans as a result of a group annuity purchased for certain participants under which such obligations were transferred to an insurer, as well as a $3 million actuarial loss on our retirement plans. Please see
Note 12
, “
Retirement and Benefit Plans
,” in the Notes to Consolidated Financial Statements included in Item 8 of this report for further discussion.
Non-service related pension and postretirement cost in 2017 was $3 million as compared to non-service related pension and postretirement income of $41 million in 2016. Non-service related pension and postretirement cost in 2017 included a $9 million loss recorded in connection with the noncash settlement of certain of our benefit obligations related to our retirement plans as a result of a group annuity purchased for certain participants under which such obligations were transferred to an insurer, as well as a $3 million actuarial loss on our retirement plans. Non-service related pension and postretirement income in 2016 included a $39 million actuarial gain on our retirement plans. Please see
Note 12
, “
Retirement and Benefit Plans
,” in the Notes to Consolidated Financial Statements included in Item 8 of this report for further discussion.
We currently expect that non-service related pension and postretirement income for 2019 will be approximately $7 million compared to non-service related pension and postretirement cost of $5 million in 2018. Non-service related pension and postretirement (income) cost recorded throughout the year is calculated using actuarial valuations that incorporate assumptions and estimates about financial market, economic and demographic conditions. Differences between estimated and actual results give rise to gains and losses that are recorded immediately in earnings, generally in the fourth quarter of the year, which can create volatility in our results of operations. Our 2018 non-service related pension and postretirement cost included a $15
38
million actuarial loss on our retirement plans recorded in the fourth quarter. Based on current market, economic and demographic conditions, we are not aware of any changes to the actuarial valuations for 2019 and as such, our expectation for 2019 assumes there is no actuarial gain or loss. Our actual 2019 non-service related pension and postretirement (income) cost may be significantly different than our projections.
Debt Modification and Extinguishment Costs
We incurred costs totaling $24 million in 2017 in connection with the early redemption of our $700 million 4 1/2% senior notes due December 15, 2022. Please see the section entitled “Liquidity and Capital Resources” below for further discussion.
We incurred costs totaling $16 million in 2016 in connection with the amendment of our senior secured credit facilities. Please see the section entitled “Liquidity and Capital Resources” below for further discussion.
Other Noncash Gain, Net
We recorded a pre-tax noncash gain of $153 million in 2016 to write up our equity investment in TH China to fair value in connection with the TH China acquisition. Please see
Note 3
, “
Acquisitions
,” in the Notes to Consolidated Financial Statements included in Item 8 of this report for further discussion.
We recorded a pre-tax noncash loss of $82 million in 2016 (including $
57
million related to foreign currency translation adjustment losses previously recorded in accumulated other comprehensive loss) in connection with the Mexico deconsolidation. Please see
Note 5
, “
Investments in Unconsolidated Affiliates
,” in the Notes to Consolidated Financial Statements included in Item 8 of this report for further discussion.
We expect to record in 2019 a significant noncash gain to write up our equity investments in Gazal and PVH Australia to fair market value in connection with the Australia acquisition. The closing is expected to occur in the second quarter of 2019.
Equity in Net Income of Unconsolidated Affiliates
The equity in net income of unconsolidated affiliates was $21 million in 2018 as compared to $10 million during 2017 and $100,000 during 2016. These amounts relate to our share of income (loss) from our PVH Australia joint venture, PVH Mexico joint venture (since the formation of PVH Mexico on November 30, 2016), our former joint venture for the
TOMMY HILFIGER
brand in China (prior to the TH China acquisition on April 13, 2016), and our joint ventures for
TOMMY HILFIGER
in India and Brazil, and for
CALVIN KLEIN
in India. Also included is our share of (loss) income from our investments in Karl Lagerfeld Holding B.V. (“Karl Lagerfeld”) and, beginning in the third quarter of 2016, in Gazal. Our investments in the continuing joint ventures, Karl Lagerfeld and Gazal are being accounted for under the equity method of accounting. Please see the section entitled “Investments in Unconsolidated Affiliates” within “Liquidity and Capital Resources” below for further discussion. The equity in net income of unconsolidated affiliates in 2016 included a one-time expense of $6 million recorded on our equity investment in TH China prior to the acquisition closing.
We currently expect that our equity in net income of unconsolidated affiliates for 2019 will decrease as compared to 2018 as the income we recognize on our investments in Gazal and PVH Australia in 2019 will only be for a partial year. Following the closing of the Australia acquisition, which is expected to occur in the second quarter of 2019, we will consolidate the results of Gazal and PVH Australia into our financial statements.
Interest Expense, Net
Net interest expense decreased to $116 million in 2018 from $122 million in 2017 primarily due to (i) the net impact of the early redemption of our $700 million 4 1/2% senior notes in January 2018 and issuance of €600 million euro-denominated 3 1/8% senior notes in December 2017 and (ii) the cumulative impact of long-term debt repayments made during 2018 and 2017, partially offset by an increase in short-term borrowings and interest rates as compared to 2017. Please see the section entitled “Financing Arrangements” within “Liquidity and Capital Resources” below for further discussion.
Net interest expense increased to $122 million in 2017 from $115 million in 2016 primarily due to the net impact of the issuance of €350 million euro-denominated 3 5/8% senior notes in June 2016 and increases in short-term borrowings and interest rates as compared to 2016, partially offset by the cumulative impact of long-term debt repayments made during 2017
39
and 2016. Please see the section entitled “Financing Arrangements” within “Liquidity and Capital Resources” below for further discussion.
Net interest expense in 2019 is currently expected to be approximately $128 million compared to $116 million in 2018 primarily due to higher interest rates, as well as an increase in short-term borrowings, including as a result of the Australia acquisition, the TH CSAP acquisition and costs expected to be incurred in connection with the Calvin Klein restructuring.
Income Taxes
Income tax expense (benefit) was as follows:
|
|
2018
|
2017
|
2016
|
||||||||
|
(Dollars in millions)
|
|
|
|
||||||||
|
Income tax expense (benefit)
|
$
|
31
|
|
$
|
(26
|
)
|
$
|
125
|
|
||
|
Income tax expense (benefit) as a % of pre-tax income
|
4.0
|
%
|
(5.1
|
)%
|
18.6
|
%
|
|||||
The U.S. Tax Legislation was enacted on December 22, 2017. The U.S. Tax Legislation is comprehensive and significantly revised the United States tax code. The revisions that significantly impact us are (i) the reduction of the corporate income tax rate from 35.0% to 21.0%, (ii) the imposition of a one-time transition tax on earnings of foreign subsidiaries deemed to be repatriated, (iii) the implementation of a modified territorial tax system, (iv) the introduction of a tax on foreign income in excess of a deemed return on tangible assets of foreign corporations (known as “GILTI”) and a beneficial tax rate to be applied against foreign derived intangible income (known as “FDII”) and (v) the introduction of a base erosion anti-abuse tax measure (known as “BEAT”) that taxes certain payments between United States corporations and their subsidiaries.
We recorded a provisional net tax benefit of $53 million in the fourth quarter of 2017 in connection with the U.S. Tax Legislation, consisting of a $265 million benefit primarily from the remeasurement of our net United States deferred tax liabilities, partially offset by a $38 million valuation allowance on our foreign tax credits and a $174 million transition tax on earnings of foreign subsidiaries deemed to be repatriated. In the fourth quarter of 2018, we completed our final analysis of the impacts of the U.S. Tax Legislation and recorded a net tax benefit of $25 million to adjust the provisional amount recorded in 2017, during the measurement period allowed by the Securities and Exchange Commission. The $25 million net tax benefit included the release of a $26 million valuation allowance on our foreign tax credits, partially offset by a $2 million expense related to the remeasurement of our net United States deferred tax liabilities.
We file income tax returns in more than 40 international jurisdictions each year. Most of the international jurisdictions in which we file tax returns had lower statutory tax rates than the United States statutory tax rate in 2016 and in 2017 prior to the effective date of the U.S. Tax Legislation. A substantial amount of our earnings comes from our international operations, particularly in the Netherlands and Hong Kong, where income tax rates, coupled with special rates levied on income from certain of our jurisdictional activities, continue to be lower than the United States statutory income tax rate after giving effect to the U.S. Tax Legislation, and reduced our consolidated effective income tax rate during 2018, 2017 and 2016. We expect to benefit from these special rates until 2022. The reduction in the United States statutory income tax rate from 35.0% to 21.0% did not have a significant impact on our overall effective tax rate due to our mix of earnings.
Our effective income tax rate for 2018 was lower than the 21.0% United States statutory income tax rate primarily due to (i) a $41 million benefit from the remeasurement of certain of our net deferred tax liabilities in connection with the enactment of legislation in the Netherlands known as the “2019 Dutch Tax Plan,” which became effective on January 1, 2019 and includes a gradual reduction of the corporate income tax rate by 2021, and resulted in a benefit to our effective income tax rate of 5.3%, (ii) the favorable impact on certain liabilities for uncertain tax positions resulting from the expiration of applicable statutes of limitation, which resulted in a benefit to our effective income tax rate of 3.7%, (iii) a net tax benefit of $25 million recorded in 2018 to adjust the provisional amount recorded in 2017 in connection with the U.S. Tax Legislation, which resulted in a benefit to our effective income tax rate of 3.2%, and (iv) the benefit of overall lower tax rates in certain international jurisdictions where we file tax returns.
The effective income tax rate for 2018 was 4.0% compared with (5.1)% in 2017. The 2018 effective income tax rate was higher than the effective income tax rate for 2017 primarily due to (i) a lower net benefit recorded in connection with the U.S. Tax Legislation, which resulted in a 3.2% benefit to our 2018 effective income tax rate compared with a 10.4% benefit to our 2017 effective income tax rate, (ii) an unfavorable change in our uncertain tax positions activity of 3.8%, and (iii) the absence of a 3.0% benefit to our 2017 effective income tax rate resulting from an excess tax benefit from the exercise of stock
40
options by our Chairman and Chief Executive Officer. These unfavorable impacts to our effective income tax rate for 2018 were partially offset by a 5.3% benefit to our 2018 effective income tax rate from the remeasurement of certain of our net deferred tax liabilities in connection with the 2019 Dutch Tax Plan.
As a result of the U.S. Tax Legislation, which reduced the United States statutory income tax rate from 35.0% to 21.0% effective January 1, 2018, our United States statutory income tax rate for 2017 was a blended rate of 33.7%. Our effective income tax rate for 2017 was lower than the United States statutory income tax rate primarily due to (i) the provisional net benefit of $53 million recorded in connection with the U.S. Tax Legislation, which resulted in a benefit to our 2017 effective income tax rate of 10.4%, (ii) the benefit of overall lower tax rates in certain international jurisdictions where we file tax returns, and (iii) the overall benefit of certain discrete items, including the favorable impact on certain liabilities for uncertain tax positions and an excess tax benefit from the exercise of stock options by our Chairman and Chief Executive Officer, which resulted in benefits to our 2017 effective income tax rate of 7.5% and 3.0%, respectively.
The effective income tax rate for 2017 was (5.1)% compared with 18.6% in 2016. The 2017 effective income tax rate was significantly lower than the effective income tax rate for 2016 primarily due to (i) the impact of the U.S. Tax Legislation in 2017, which resulted in a benefit to our 2017 effective income tax rate of 10.4%, (ii) a favorable change in our uncertain tax positions activity of 3.8%, (iii) an excess tax benefit from the exercise of stock options by our Chairman and Chief Executive Officer, which resulted in a benefit to our 2017 effective income tax rate of 3.0%, and (iv) faster growth in our international pre-tax earnings as compared to our domestic pre-tax earnings. These favorable impacts to our effective income tax rate for 2017 were partially offset by the absence of a 5.7% benefit to our 2016 effective income tax rate related to the pre-tax gain recorded to write-up our equity investment in TH China to fair value.
The effective income tax rate for 2016 was lower than the 35.0% United States statutory income tax rate due to the benefit of overall lower tax rates in certain international jurisdictions where we file tax returns. Also contributing to the lower effective income tax rate for 2016 was the benefit of discrete items, including the lower tax rate applicable to the pre-tax gain recorded to write-up our equity investment in TH China to fair value that resulted in a 5.7% benefit to our effective income tax rate.
We currently expect that our effective income tax rate in 2019 will be in a range of 15% to 16%. Our expectation that our effective income tax rate in 2019 will be lower than the United States statutory income tax rate is principally due to the overall benefit of certain discrete items, including the favorable impact on certain liabilities for uncertain tax positions. Our expectation that the effective income tax rate in 2019 will increase compared to 2018 is primarily due to (i) the absence of a 5.3% benefit to our 2018 effective income tax rate related to the remeasurement of certain of our net deferred tax liabilities in connection with the 2019 Dutch Tax Plan and (ii) the absence of a 3.2% benefit to our 2018 effective income tax rate related to the U.S. Tax Legislation.
Our tax rate is affected by many factors, including the mix of international and domestic pre-tax earnings, discrete events arising from specific transactions, and new regulations, as well as audits by tax authorities and the receipt of new information, which can cause us to change our estimate for uncertain tax positions. Please see
Note 9
, “
Income Taxes
,” in the Notes to Consolidated Financial Statements included in Item 8 of this report for further discussion.
Redeemable Non-Controlling Interest
We have a joint venture in Ethiopia with Arvind named PVH Ethiopia, in which we own a 75% interest. We consolidate the results of PVH Ethiopia in our consolidated financial statements. PVH Ethiopia was formed to operate a manufacturing facility that produces finished products for us for distribution primarily in the United States. The manufacturing facility began operations in 2017.
The net loss attributable to the redeemable non-controlling interest was immaterial in 2018, 2017 and 2016. We currently expect that the net loss attributable to the redeemable non-controlling interest for 2019 will be immaterial. Please see
Note 6
, “
Redeemable Non-Controlling Interest
,” in the Notes to Consolidated Financial Statements included in Item 8 of this report for further discussion.
41
LIQUIDITY AND CAPITAL RESOURCES
Cash Flow Summary
Cash and cash equivalents at
February 3, 2019
was $452 million, a decrease of $42 million from the amount at
February 4, 2018
of $494 million. The change in cash and cash equivalents included the impact of (i) $302 million of common stock repurchases under the stock repurchase program, (ii) $150 million of long-term debt repayments, (iii) a $16 million payment made in connection with the acquisition of the
Geoffrey Beene
tradename, and (iv) a $10 million contribution to our defined benefit pension plans.
Cash flow in 2019 will be impacted by various factors in addition to those noted below in this “Liquidity and Capital Resources” section, including (i) expected long-term debt repayments of approximately $150 million, (ii) expected common stock repurchases under the stock repurchase program of approximately $200
million, (iii) the expected net consideration to be paid for the Australia acquisition of A$124 million (approximately $90 million based on the current exchange rate in effect), and (iv) the expected consideration to be paid for the TH CSAP acquisition, which is estimated to be approximately $75 million.
As of February 3, 2019, approximately $415 million of cash and cash equivalents was held by international subsidiaries. Prior to the enactment of the U.S. Tax Legislation, our undistributed foreign earnings were considered permanently reinvested and, as such, United States federal and state income taxes were not previously recorded on these earnings. As a result of the U.S. Tax Legislation, substantially all of our earnings in foreign subsidiaries generated prior to the enactment of the U.S. Tax Legislation were deemed to have been repatriated and, as a result, we recorded a one-time transition tax of $174 million in 2017. Our intent is to reinvest indefinitely substantially all of our earnings in foreign subsidiaries outside of the United States. However, if management decides at a later date to repatriate these earnings to the United States, we may be required to accrue and pay additional taxes, including any applicable foreign withholding tax and United States state income taxes. It is not practicable to estimate the amount of tax that might be payable if these earnings were repatriated due to the complexities associated with the hypothetical calculation.
Operations
Cash provided by operating activities was $852 million in 2018 compared to $644 million in 2017. The increase in cash provided by operating activities as compared to the prior year was primarily driven by an increase in net income as adjusted for noncash charges, partially offset by changes in working capital, including (i) an increase in trade receivables due, in part, to an increase in wholesale sales and (ii) an increase in inventories, primarily due to an expected increase in sales for the first quarter of 2019 as compared to the prior year period, as well as an acceleration of receipts in advance of potential tariffs on goods imported from China.
In connection with our acquisition of Calvin Klein, we were obligated to pay Mr. Calvin Klein contingent purchase price payments based on 1.15% of total worldwide net sales (as defined in the acquisition agreement, as amended) of products bearing any of the
CALVIN KLEIN
brands with respect to sales made through February 12, 2018. A significant portion of the sales on which the payments to Mr. Klein have been made were wholesale sales by us and our licensees and other partners to retailers. Contingent purchase price payments totaled $16 million, $56 million and $53 million
in 2018, 2017 and 2016, respectively. All payments due to Mr. Klein under the agreement have been made. All contingent purchase price payments are subject to audit, as per the terms of the acquisition agreement. As a result of accounting guidance adopted in the first quarter of 2018, contingent purchase price payments to Mr. Klein are now classified as operating activities in our Consolidated Statements of Cash Flows, instead of the previous classification as investing activities. Please see
Note 1
, “
Summary of Significant Accounting Policies
,” in the Notes to Consolidated Financial Statements included in Item 8 of this report for further discussion of the accounting guidance.
Capital Expenditures
Our capital expenditures in 2018 were $379 million compared to $358 million in 2017. The capital expenditures in 2018 primarily related to (i) upgrading and enhancing our operating, supply chain and logistics systems and our digital commerce platforms, (ii) the renovation and expansion of our administrative offices in Amsterdam, and (iii) investments in new stores and store expansions. We currently expect that capital expenditures for 2019 will increase to approximately $425 million and will include expenditures primarily related to (i) investments in new stores and store expansions, (ii) continued investments to upgrade and enhance our operating, supply chain and logistics systems and our digital commerce platforms, and (iii) the expansion of our warehouse and distribution network in North America.
42
Investments in Unconsolidated Affiliates
We own a 50% economic interest in PVH Australia. We received dividends of $6 million, $3 million and $1 million from PVH Australia during 2018, 2017 and 2016, respectively.
We acquired approximately 10% of the outstanding capital stock of Gazal, which is listed on the Australian Securities Exchange, in 2016 for $9 million. We acquired additional capital stock for $8 million in 2017. Our current ownership interest in Gazal is approximately 22%. We received dividends of $1 million from Gazal in each of 2018 and 2017.
We entered into on February 20, 2019 a definitive agreement to acquire the approximately 78% interest in Gazal that we do not already own. PVH Australia will come under our full ownership as a result of the Australia acquisition. The aggregate net purchase price for the shares being acquired is approximately A$124 million (approximately $90 million based on the current exchange rate in effect), after taking into account the divestiture to a third party of an office building and warehouse owned by Gazal. The closing is subject to customary conditions, including shareholder, court and regulatory approvals, and is expected to occur in the second quarter of 2019.
We acquired a 51% economic interest in a joint venture, Calvin Klein Arvind Fashion Private Limited (“CK India”) in 2013. We sold 1% of our interest for $400,000 in 2017, decreasing our economic interest in CK India to 50%. Prior to the sale, we were not deemed to hold a controlling interest in CK India as the shareholders agreement provided the partners with equal rights. CK India licenses from one of our subsidiaries the rights to the
CALVIN KLEIN
trademarks in India for certain product categories. We made payments of $2 million to CK India in each of 2017 and 2016 to contribute our share of the joint venture funding.
We own a 50% economic interest in a joint venture, Tommy Hilfiger Arvind Fashion Private Limited (“TH India”). TH India licenses from one of our subsidiaries the rights to the
TOMMY HILFIGER
trademarks in India for certain product categories. Arvind, our joint venture partner in PVH Ethiopia and CK India, is also our joint venture partner in TH India. We made payments of $3 million to TH India during 2017 to contribute our share of the joint venture funding.
We acquired a 40% economic interest in a joint venture, Tommy Hilfiger do Brasil S.A. (“TH Brazil”) in 2012. We acquired an approximately 1% additional interest for $300,000 in 2017, increasing our economic interest in TH Brazil to approximately 41%. TH Brazil licenses from one of our subsidiaries the rights to the
TOMMY HILFIGER
trademarks in Brazil for certain product categories. We made payments of $3 million and $2 million to TH Brazil during 2017 and 2016, respectively, to contribute our share of the joint venture funding. We issued a note receivable to TH Brazil in 2016 for $12 million, of which $6 million was repaid in 2016 and the remaining balance, including accrued interest, was repaid in 2017.
We and Grupo Axo formed PVH Mexico in 2016. We own a
49%
economic interest in the joint venture. PVH Mexico licenses from certain of our wholly owned subsidiaries the rights to distribute and sell certain
TOMMY HILFIGER
,
CALVIN KLEIN
,
Warner’s
,
Olga
and
Speedo
brand products in Mexico. PVH Mexico was formed by merging our wholly owned subsidiary that principally operated and managed the Calvin Klein business in Mexico (the “Mexico business”) with a wholly owned subsidiary of Grupo Axo that distributes certain
TOMMY HILFIGER
brand products in Mexico. In connection with the formation of PVH Mexico, we deconsolidated the Mexico business and began accounting for our 49% interest under the equity method of accounting in 2016. We made payments of $
7
million to PVH Mexico during 2016 to contribute our share of the joint venture funding. Please see
Note 5
, “
Investments in Unconsolidated Affiliates
,” in the Notes to Consolidated Financial Statements included in Item 8 of this report for further discussion.
Loan to a Supplier
Wuxi Jinmao Foreign Trade Co., Ltd. (“Wuxi”), one of our finished goods inventory suppliers, has a wholly owned subsidiary with which we entered into a loan agreement in 2016. Under the agreement, Wuxi’s subsidiary borrowed a principal amount of $14 million for the development and operation of a fabric mill. Principal payments are due in semi-annual installments beginning March 31, 2018 through September 30, 2026. The outstanding principal balance of the loan bears interest at a rate of (i) 4.50% per annum until the sixth anniversary of the closing date of the loan and (ii) London interbank offered rate (“LIBOR”) plus 4.00% thereafter. We received principal payments of $200,000 during 2018. The outstanding balance, including accrued interest, was $14 million as of both
February 3, 2019
and
February 4, 2018
.
43
Acquisition of the Geoffrey Beene Tradename
We acquired the
Geoffrey Beene
tradename on April 20, 2018 for $17 million, of which $16 million was paid in cash. Please see
Note 3
, “
Acquisitions
,” in the Notes to Consolidated Financial Statements included in Item 8 of this report for further discussion.
Acquisition of the Wholesale and Concessions Businesses in Belgium and Luxembourg
We completed the Belgian acquisition on September 1, 2017. We paid $12 million as cash consideration for this transaction. Please see
Note 3
, “
Acquisitions
,” in the Notes to Consolidated Financial Statements included in Item 8 of this report for further discussion.
Acquisition of True & Co.
We acquired True & Co. on March 30, 2017. We paid $28 million, net of $400,000 of cash acquired, as cash consideration for this transaction. Please see
Note 3
, “
Acquisitions
,” in the Notes to Consolidated Financial Statements included in Item 8 of this report for further discussion.
Acquisition of TH China
We completed the TH China acquisition on April 13, 2016. Prior to this acquisition, we had a 45% interest in TH China, which we accounted for under the equity method of accounting. We paid $158 million, net of cash acquired of $105 million, as cash consideration for this transaction. Please see
Note 3
, “
Acquisitions
,” in the Notes to Consolidated Financial Statements included in Item 8 of this report for further discussion.
TH CSAP Acquisition
We entered into on March 25, 2019 a definitive agreement to acquire the Tommy Hilfiger retail business in Hong Kong and certain other countries in Central and Southeast Asia from our current licensee in those markets. The purchase price is estimated to be approximately $75 million. The closing is subject to customary conditions and regulatory approval and is expected to occur in the second quarter of 2019.
Sale of Assets
We sold a building in Chattanooga, Tennessee in 2017 for $3 million in connection with the consolidation within our warehouse and distribution network in North America.
One of our European subsidiaries sold a building in Amsterdam, the Netherlands in 2016 for €15 million (approximately $17 million based on the exchange rate in effect on the date of the sale).
Dividends
Our common stock currently pays annual dividends totaling $0.15 per share. Dividends on common stock totaled $12 million in each of 2018, 2017 and 2016.
We currently project that cash dividends on our common stock in 2019 will be approximately $11 million based on our current dividend rate, the number of shares of our common stock outstanding as of
February 3, 2019
, our estimate of stock to be issued during 2019 under our stock incentive plans and our estimate of stock repurchases during 2019.
Acquisition of Treasury Shares
Our Board of Directors authorized a $500 million three-year stock repurchase program effective June 3, 2015. On March 21, 2017, the Board of Directors authorized a $750 million increase to the program and extended it to June 3, 2020. On March 26, 2019, the Board of Directors authorized a further $750 million increase to the program and extended it to June 3, 2023. Repurchases under the program may be made from time to time over the period through open market purchases, accelerated share repurchase programs, privately negotiated transactions or other methods, as we deem appropriate. Purchases are made based on a variety of factors, such as price, corporate requirements and overall market conditions, applicable legal requirements and limitations, restrictions under our debt arrangements, trading restrictions under our insider trading policy and
44
other relevant factors. The program may be modified by the Board of Directors, including to increase or decrease the repurchase limitation or extend, suspend, or terminate the program, at any time, without prior notice.
During 2018, 2017 and 2016, we purchased approximately 2.2 million, 2.2 million and 3.2 million shares, respectively, of our common stock under the program in open market transactions for $300 million, $250 million and $315 million, respectively. Purchases of $2 million that were accrued for in the Consolidated Balance Sheet as of
February 4, 2018
were paid in 2018. The repurchased shares were held as treasury stock and $258 million of the authorization remained available for future share repurchases as of
February 3, 2019
.
Treasury stock activity also includes shares that were withheld principally in conjunction with the settlement of vested restricted stock, restricted stock units and performance share units to satisfy tax withholding requirements.
Tommy Hilfiger India Contingent Purchase Price Payments
We reacquired in 2011 the rights in India to the
TOMMY HILFIGER
trademarks that had been subject to a perpetual license previously granted to a third party. We were required to make annual contingent purchase price payments to the seller based on a percentage of sales of
TOMMY HILFIGER
products in India in excess of an agreed upon threshold during each of six consecutive 12-month periods immediately following the acquisition, with the final payment made in 2017. We made contingent purchase price payments of approximately $1 million in each of 2017 and 2016. As a result of accounting guidance adopted in 2018, these contingent purchase price payments are now classified as financing activities in our Consolidated Statements of Cash Flows, instead of the previous classification as investing activities. Please see to
Note 1
, “
Summary of Significant Accounting Policies
,” in the Notes to Consolidated Financial Statements included in Item 8 of this report for further discussion of the accounting guidance.
Financing Arrangements
Our capital structure was as follows:
|
(In millions)
|
February 3, 2019
|
February 4, 2018
|
|||||
|
Short-term borrowings
|
$
|
13
|
|
$
|
20
|
|
|
|
Current portion of long-term debt
|
—
|
|
—
|
|
|||
|
Capital lease obligations
|
17
|
|
16
|
|
|||
|
Long-term debt
|
2,819
|
|
3,061
|
|
|||
|
Stockholders’ equity
|
5,828
|
|
5,536
|
|
|||
In addition, we had $452 million and $494 million of cash and cash equivalents as of
February 3, 2019
and
February 4, 2018
, respectively.
Short-Term Borrowings
We have the ability to draw revolving borrowings under our senior secured credit facilities, as discussed in the section entitled “2016 Senior Secured Credit Facilities” below. We had $8 million outstanding under these facilities as of
February 3, 2019
. The weighted average interest rate on funds borrowed as of February 3, 2019 was 4.45%. The maximum amount of revolving borrowings outstanding under these facilities during 2018 was $274 million. There were no borrowings outstanding under these facilities as of
February 4, 2018
.
Additionally, we have the availability to borrow under short-term lines of credit, overdraft facilities and short-term revolving credit facilities denominated in various foreign currencies. These facilities provided for borrowings of up to $102 million based on exchange rates in effect on
February 3, 2019
and are utilized primarily to fund working capital needs. We had $5 million and $20 million outstanding under these facilities as of
February 3, 2019
and
February 4, 2018
, respectively. The weighted average interest rate on funds borrowed as of
February 3, 2019
and
February 4, 2018
was 0.21% and 1.19%, respectively. The maximum amount of borrowings outstanding under these facilities during 2018 was $39 million.
Capital Lease Obligations
Our cash payments for capital lease obligations totaled $5 million, $5 million and $7 million in 2018, 2017 and 2016, respectively.
45
2016 Senior Secured Credit Facilities
We have senior secured credit facilities due May 19, 2021 (the “2016 facilities”) that consist of a $2.347 billion United States dollar-denominated Term Loan A facility and senior secured revolving credit facilities consisting of (i) a $475 million United States dollar-denominated revolving credit facility, (ii) a $25 million United States dollar-denominated revolving credit facility available in United States dollars and Canadian dollars and (iii) a €186 million euro-denominated revolving credit facility available in euro, British pound sterling, Japanese yen and Swiss francs. Borrowings under the 2016 facilities bear interest at variable rates calculated in the manner as described below. The senior secured revolving credit facilities also include amounts available for letters of credit. A portion of each of the United States dollar-denominated revolving credit facilities is also available for the making of swingline loans. The issuance of such letters of credit and the making of any swingline loan reduces the amount available under the applicable revolving credit facility.
We had prior senior secured credit facilities outstanding through May 19, 2016 (the “2014 facilities”), which were amended by the 2016 facilities in 2016. Among other things, this amendment provided for (i) us to borrow an additional $582 million principal amount of loans under the Term Loan A facility, (ii) the repayment of all outstanding loans under the previously outstanding Term Loan B facility with the proceeds of the additional loans under the Term Loan A facility, and (iii) the termination of the Term Loan B facility. We paid debt issuance costs of $11 million (of which $5 million was expensed as debt modification costs and $6 million is being amortized over the term of the related debt agreement) and recorded debt extinguishment costs of $11 million to write-off previously capitalized debt issuance costs.
We had loans outstanding of $1.644 billion, net of original issue discounts and debt issuance costs, under the Term Loan A facility, $8 million of borrowings outstanding under the senior secured revolving credit facilities and $20 million of outstanding letters of credit under the senior secured revolving credit facilities as of
February 3, 2019
.
We made payments of $150 million, $250 million and $350 million during 2018, 2017 and 2016, respectively, on our term loans under the 2016 facilities and 2014 facilities. As a result of the voluntary repayments we have made to date, as of
February 3, 2019
, we are not required to make a long-term debt repayment until June 2020.
The United States dollar-denominated borrowings under the 2016 facilities bear interest at a rate equal to an applicable margin plus, as determined at our option, either (a) a base rate determined by reference to the greater of (i) the prime rate, (ii) the United States federal funds rate plus 1/2 of 1.00% and (iii) a one-month adjusted Eurocurrency rate plus 1.00% or (b) an adjusted Eurocurrency rate, calculated in a manner set forth in the 2016 facilities.
The Canadian dollar-denominated borrowings under the 2016 facilities bear interest at a rate equal to an applicable margin plus, as determined at our option, either (a) a Canadian prime rate determined by reference to the greater of (i) the rate of interest per annum that Royal Bank of Canada establishes as the reference rate of interest in order to determine interest rates for loans in Canadian dollars to its Canadian borrowers and (ii) the sum of (x) the average of the rates per annum for Canadian dollar bankers’ acceptances having a term of one month and (y) 0.75%, or (b) an adjusted Eurocurrency rate, calculated in a manner set forth in the 2016 facilities.
The borrowings under the 2016 facilities in currencies other than United States dollars or Canadian dollars bear interest at a rate equal to an applicable margin plus an adjusted Eurocurrency rate, calculated in a manner set forth in the 2016 facilities.
The current applicable margin with respect to the Term Loan A facility and each revolving credit facility is 1.50% for adjusted Eurocurrency rate loans and 0.50% for base rate loans, respectively. After the date of delivery of the compliance certificate and financial statements with respect to each of our fiscal quarters, the applicable margin for borrowings under the Term Loan A facility and the revolving credit facilities is subject to adjustment based upon our net leverage ratio.
46
We entered into interest rate swap agreements designed with the intended effect of converting notional amounts of our variable rate debt obligation to fixed rate debt. Under the terms of the agreements, for the outstanding notional amount, our exposure to fluctuations in the one-month LIBOR is eliminated and we pay a fixed rate plus the current applicable margin. The following interest rate swap agreements were entered into or in effect during 2018, 2017 and 2016:
|
(In millions)
|
|||||||||
|
Designation Date
|
Commencement Date
|
Initial Notional Amount
|
Notional Amount Outstanding as of February 3, 2019
|
Fixed Rate
|
Expiration Date
|
||||
|
January 2019
|
February 2020
|
$
|
50
|
|
$
|
—
|
|
2.4187%
|
February 2021
|
|
November 2018
|
February 2019
|
139
|
|
—
|
|
2.8645%
|
February 2021
|
||
|
October 2018
|
February 2019
|
116
|
|
—
|
|
2.9975%
|
February 2021
|
||
|
June 2018
|
August 2018
|
50
|
|
50
|
|
2.6825%
|
February 2021
|
||
|
June 2017
|
February 2018
|
306
|
|
182
|
|
1.566%
|
February 2020
|
||
|
July 2014
|
February 2016
|
683
|
|
—
|
|
1.924%
|
February 2018
|
||
The notional amounts of the outstanding interest rate swap that commenced in February 2018 and the interest rate swaps that will commence in February 2019 will be adjusted according to pre-set schedules during the terms of the swap agreements such that, based on our projections for future debt repayments, our outstanding debt under the 2016 facilities is expected to always equal or exceed the combined notional amount of the then-outstanding interest rate swaps.
4 1/2% Senior Notes Due 2022
We had outstanding $700 million principal amount of 4 1/2% senior notes due December 15, 2022. We redeemed these notes on January 5, 2018 in connection with the issuance of €600 million euro-denominated principal amount of 3 1/8% senior notes due December 15, 2027, as discussed below. We paid a premium of $16 million to the holders of these notes in connection with the redemption and recorded debt extinguishment costs of $8 million to write-off previously capitalized debt issuance costs associated with these notes during 2017.
7 3/4% Debentures Due 2023
We have outstanding $100 million of debentures due November 15, 2023 that accrue interest at the rate of 7 3/4%. The debentures are not redeemable at our option prior to maturity.
3 5/8% Euro Senior Notes Due 2024
We issued on June 20, 2016 €350 million euro-denominated principal amount of 3 5/8% senior notes due July 15, 2024. Interest on the notes is payable in euros. We paid €6 million (approximately $7 million based on exchange rates in effect on the payment date) of fees during 2016 in connection with the issuance of these notes, which are amortized over the term of the notes. We may redeem some or all of these notes at any time prior to April 15, 2024 by paying a “make whole” premium plus any accrued and unpaid interest. In addition, we may redeem some or all of these notes on or after April 15, 2024 at their principal amount plus any accrued and unpaid interest.
3 1/8% Euro Senior Notes Due 2027
We issued on December 21, 2017 €
600
million euro-denominated principal amount of 3 1/8% senior notes due December 15, 2027. Interest on the notes is payable in euros. We paid €
9
million (approximately $
10
million based on exchange rates in effect on the payment date) of fees during 2017 in connection with the issuance of these notes, which are amortized over the term of the notes. We may redeem some or all of these notes at any time prior to September 15, 2027 by paying a “make whole” premium plus any accrued and unpaid interest. In addition, we may redeem some or all of these notes on or after September 15, 2027 at their principal amount plus any accrued and unpaid interest.
Our financing arrangements contain financial and non-financial covenants and customary events of default. As of
February 3, 2019
, we were in compliance with all applicable covenants under our financing arrangements.
47
As of
February 3, 2019
, our issuer credit was rated BBB- by Standard & Poor’s with a stable outlook and our corporate credit was rated Ba1 by Moody’s with a positive outlook. In assessing our credit strength, we believe that both Standard & Poor’s and Moody’s considered, among other things, our capital structure and financial policies, our consolidated balance sheet, our historical acquisition activity and other financial information, as well as industry and other qualitative factors.
Please see
Note 8
, “
Debt
,” in the Notes to Consolidated Financial Statements included in Item 8 of this report for further discussion of our debt.
Contractual Obligations
The following table summarizes, as of
February 3, 2019
, our contractual cash obligations by future period:
|
|
Payments Due by Period
|
|||||||||||||||||||
|
Description
|
Total
Obligations
|
2019
|
2020-2021
|
2022-2023
|
Thereafter
|
|||||||||||||||
|
(In millions)
|
||||||||||||||||||||
|
Long-term debt
(1)
|
$
|
2,839
|
|
$
|
—
|
|
$
|
1,649
|
|
$
|
100
|
|
$
|
1,090
|
|
|||||
|
Interest payments on long-term debt
|
469
|
|
111
|
|
178
|
|
87
|
|
93
|
|
||||||||||
|
Short-term borrowings
|
13
|
|
13
|
|
—
|
|
—
|
|
—
|
|
||||||||||
|
Operating and capital leases
(2)
|
2,171
|
|
408
|
|
694
|
|
447
|
|
621
|
|
||||||||||
|
Inventory purchase commitments
(3)
|
1,074
|
|
1,074
|
|
—
|
|
—
|
|
—
|
|
||||||||||
|
Minimum contractual royalty payments
(4)
|
32
|
|
18
|
|
12
|
|
2
|
|
—
|
|
||||||||||
|
Non-qualified supplemental defined benefit plan
(5)
|
9
|
|
1
|
|
2
|
|
1
|
|
5
|
|
||||||||||
|
Sponsorship and model payments
(6)
|
57
|
|
28
|
|
25
|
|
3
|
|
1
|
|
||||||||||
|
Total contractual cash obligations
|
$
|
6,664
|
|
$
|
1,653
|
|
$
|
2,560
|
|
$
|
640
|
|
$
|
1,810
|
|
|||||
______________________
|
(1)
|
At
February 3, 2019
, we had outstanding $1.649 billion under a senior secured Term Loan A facility, which requires mandatory payments through May 19, 2021 (according to the mandatory repayment schedules), $100 million of 7 3/4% debentures due November 15, 2023, $401 million of 3 5/8% senior unsecured euro notes due July 15, 2024 and $688 million of 3 1/8% senior unsecured euro notes due December 15, 2027.
|
|
(2)
|
Includes retail store, warehouse, distribution centers, showroom, office and equipment operating leases, as well as capital leases. Retail store operating leases generally provide for payment of direct operating costs in addition to rent. The obligation amounts listed include future minimum lease payments and exclude such direct operating costs. Please see
Note 16
, “
Leases
,” in the Notes to Consolidated Financial Statements included in Item 8 of this report for further information.
|
|
(3)
|
Represents contractual commitments that are enforceable and legally binding for goods on order and not received or paid for as of
February 3, 2019
. Inventory purchase commitments also include fabric commitments with our suppliers, which secure a portion of our material needs for future seasons. Substantially all of these goods are expected to be received and the related payments are expected to be made within six months of our year end. This amount does not include foreign currency forward exchange contracts that we have entered into to manage our exposure to exchange rate changes with respect to certain of these purchases. Please see
Note 10
, “
Derivative Financial Instruments
,” in the Notes to Consolidated Financial Statements included in Item 8 of this report for further information.
|
|
(4)
|
Our minimum contractual royalty payments arise under numerous license agreements we have with third parties, each of which has different terms. Agreements typically require us to make minimum payments to the licensors of the licensed trademarks based on expected or required minimum levels of sales of licensed products, as well as additional royalty payments based on a percentage of sales when our sales exceed such minimum sales. Certain of our license agreements require that we pay a specified percentage of net sales to the licensor for advertising and promotion of the licensed products, in some cases requiring a minimum amount to be paid. Any advertising payments, with the exception of minimum payments to licensors, are excluded from the minimum contractual royalty payments shown in the table. There is no guarantee that we will exceed the minimum payments under any of these license agreements. However, given our projected sales levels for products covered under these agreements, we currently anticipate that
|
48
future payments required under our license agreements on an aggregate basis will exceed the contractual minimums shown in the table.
|
(5)
|
We have an unfunded, non-qualified supplemental defined benefit plan covering certain retired executives under which the participants will receive a predetermined amount during the 10 years following the attainment of age 65, provided that prior to the termination of employment with us, the participant has been in such plan for at least 10 years and has attained age 55.
|
|
(6)
|
Represents payment obligations for sponsorships. We have agreements relating to our sponsorship of the Barclays Center, the Brooklyn Nets, Mercedes-AMG Petronas Motorsport in Formula One
TM
racing and certain other professional sports teams and athletes and other similar sponsorships, as well as agreements with celebrities, models and stylists.
|
Not included in the above table are contributions to our qualified defined benefit pension plans, or payments to employees and retirees in connection with our unfunded supplemental executive retirement, supplemental pension and postretirement health plans. Contractual cash obligations for these plans cannot be determined due to the number of assumptions required to estimate our future benefit obligations, including return on assets, discount rate and future compensation increases. The liabilities associated with these plans, together with the liability for the non-qualified supplemental defined benefit plans included in the above table, are presented in
Note 12
, “
Retirement and Benefit Plans
,” in the Notes to Consolidated Financial Statements included in Item 8 of this report. Currently, we do not expect to make any material contributions to our pension plans in 2018. Our actual contributions may differ from our planned contributions due to many factors, including changes in tax and other benefit laws, or significant differences between expected and actual pension asset performance or interest rates.
Not included in the above table are $184 million of net potential cash obligations associated with uncertain tax positions due to the uncertainty regarding the future cash outflows associated with such obligations. Please see
Note 9
, “
Income Taxes
,” in the Notes to Consolidated Financial Statements included in Item 8 of this report for further information related to uncertain tax positions.
Not included in the above table are $32 million of asset retirement obligations related to leased office and retail store locations due to the uncertainty of timing of future cash outflows associated with such obligations. Please see
Note 22
, “
Other Comments
,” in the Notes to Consolidated Financial Statements included in Item 8 of this report for further information related to asset retirement obligations.
Not included in the above table are contractual royalty obligations related to our perpetual license agreement with Speedo International Limited. Under the terms of the agreement, our contractual minimum payments each year are $1 million, which is subject to annual increases based on the Consumer Price Index.
Off-Balance Sheet Arrangements
We do not have any off-balance sheet arrangements that have a material current effect, or that are reasonably likely to have a material future effect, on our financial position, changes in financial position, revenue, expenses, results of operations, liquidity, capital expenditures or capital resources.
49
MARKET RISK
Financial instruments held by us as of
February 3, 2019
include cash and cash equivalents, short-term borrowings, long-term debt, foreign currency forward exchange contracts and interest rate swap agreements.
Note 11
, “
Fair Value Measurements
,” in the Notes to Consolidated Financial Statements included in Item 8 of this report outlines the fair value of our financial instruments as of
February 3, 2019
. Cash and cash equivalents held by us are affected by short-term interest rates, which are currently low. The potential for a significant decrease in short-term interest rates is low due to the currently low rates of return we are receiving on our cash and cash equivalents and, therefore, a further decrease would not have a material impact on our interest income. However, there is potential for a more significant increase in short-term interest rates, which could have a more material impact on our interest income. Given our balance of cash and cash equivalents at
February 3, 2019
, the effect of a 10 basis point change in short-term interest rates on our interest income would be approximately $450,000 annually. Borrowings under our 2016 facilities bear interest at a rate equal to an applicable margin plus a variable rate. As such, our 2016 facilities expose us to market risk for changes in interest rates. We have entered into interest rate swap agreements for the intended purpose of reducing our exposure to interest rate volatility. As of
February 3, 2019
, after taking into account the effect of our interest rate swap agreements that were in effect as of such date, approximately 50% of our long-term debt was at a fixed interest rate, with the remainder at variable interest rates. Given our debt position at
February 3, 2019
, the effect of a 10 basis point change in interest rates on our variable interest expense would be approximately $1 million annually. Please see the section entitled “Liquidity and Capital Resources” above for further discussion of our credit facilities and interest rate swap agreements.
Our Tommy Hilfiger and Calvin Klein businesses each have substantial international components that expose us to significant foreign exchange risk. Our Heritage Brands business also has international components but those components are not significant to the business. Over 50% of our $9.657 billion of revenue in 2018 was generated outside of the United States. Changes in exchange rates between the United States dollar and other currencies can impact our financial results in two ways: a translational impact and a transactional impact.
The translational impact refers to the impact that changes in exchange rates can have on our results of operations and financial position. The functional currencies of our foreign subsidiaries are generally the applicable local currencies. Our consolidated financial statements are presented in United States dollars. The results of operations in local foreign currencies are translated into United States dollars using an average exchange rate over the representative period and the assets and liabilities in local foreign currencies are translated into United States dollars using the closing exchange rate at the balance sheet date. Foreign exchange differences that arise from the translation of our foreign subsidiaries’ assets and liabilities into United States dollars are recorded as foreign currency translation adjustments in other comprehensive (loss) income. Accordingly, our results of operations and other comprehensive (loss) income will be unfavorably impacted during times of a strengthening United States dollar, particularly against the euro, the Brazilian real, the Japanese yen, the Korean won, the British pound sterling, the Canadian dollar and the Chinese yuan renminbi, and favorably impacted during times of a weakening United States dollar against those currencies.
In 2018, we recognized unfavorable foreign currency translation adjustments of $361 million within other comprehensive loss, principally driven by a strengthening of the United States dollar against the euro of 8% since
February 4, 2018
. Our foreign currency translation adjustments recorded in other comprehensive (loss) income are significantly impacted by the substantial amount of goodwill and other intangible assets denominated in the euro, which represented 34% of our $7.2 billion total goodwill and other intangible assets as of
February 3, 2019
. This translational impact was partially mitigated by the change in the fair value of our net investment hedges discussed below.
A transactional impact on financial results is common for apparel companies operating outside the United States that purchase goods in United States dollars, as is the case with most of our foreign operations. As with translation, our results of operations will be unfavorably impacted during times of a strengthening United States dollar as the increased local currency value of inventory results in a higher cost of goods in local currency when the goods are sold and favorably impacted during times of a weakening United States dollar as the decreased local currency value of inventory results in a lower cost of goods in local currency when the goods are sold. We also have exposure to changes in foreign currency exchange rates related to certain intercompany transactions and SG&A expenses. We currently use and plan to continue to use foreign currency forward exchange contracts or other derivative instruments to mitigate the cash flow or market value risks associated with these inventory and intercompany transactions, but we are unable to entirely eliminate these risks. The foreign currency forward exchange contracts cover at least 70% of the projected inventory purchases in United States dollars by our foreign subsidiaries.
50
Given our foreign currency forward exchange contracts outstanding at
February 3, 2019
, the effect of a 10% change in foreign currency exchange rates against the United States dollar would result in a change in the fair value of these contracts of approximately $105 million. Any change in the fair value of these contracts would be substantially offset by a change in the fair value of the underlying hedged items.
Based on current foreign currency exchange rates, we expect a decrease in revenue of approximately $150 million, or 1%, and a slight decrease in net income in 2019 as compared to 2018 due to the impact of foreign currency exchange.
In order to mitigate a portion of our exposure to changes in foreign currency exchange rates related to the value of our investments in foreign subsidiaries denominated in the euro, we designated the carrying amount of our €950 million aggregate principal amount of euro-denominated senior notes that we had issued in the United States as net investment hedges of our investments in certain of our foreign subsidiaries that use the euro as their functional currency. The effect of a 10% change in the euro against the United States dollar would result in a change in the fair value of the net investment hedges of approximately $110 million. Any change in the fair value of the net investment hedges would be more than offset by a change in the value of our investments in certain of our European subsidiaries. Additionally, during times of a weakening United States dollar against the euro, we would be required to use a greater amount of our cash flows from operations to pay interest and make long-term debt repayments on our euro-denominated senior notes.
Included in the calculations of expense and liabilities for our pension plans are various assumptions, including return on assets, discount rates, mortality rates and future compensation increases. Actual results could differ from these assumptions, which would require adjustments to our balance sheet and could result in volatility in our future pension expense. Holding all other assumptions constant, a 1% change in the assumed rate of return on assets would result in a change to 2019 net benefit cost related to the pension plans of approximately $6 million. Likewise, a 0.25% change in the assumed discount rate would result in a change to 2019 net benefit cost of approximately $31 million.
SEASONALITY
Our business generally follows a seasonal pattern. Our wholesale businesses tend to generate higher levels of sales in the first and third quarters, while our retail businesses tend to generate higher levels of sales in the fourth quarter. Royalty, advertising and other revenue tends to be earned somewhat evenly throughout the year, although the third quarter has the highest level of royalty revenue due to higher sales by licensees in advance of the holiday selling season. We expect this seasonal pattern will generally continue. Working capital requirements vary throughout the year to support these seasonal patterns and business trends.
RECENT ACCOUNTING PRONOUNCEMENTS
Please see
Note 1
, “
Summary of Significant Accounting Policies
,” in the Notes to Consolidated Financial Statements included in Item 8 of this report for a discussion of recently issued and adopted accounting standards.
CRITICAL ACCOUNTING POLICIES AND ESTIMATES
Our consolidated financial statements are based on the selection and application of significant accounting policies, which require management to make significant estimates and assumptions. Our significant accounting policies are outlined in
Note 1
, “
Summary of Significant Accounting Policies
,” in the Notes to Consolidated Financial Statements included in Item 8 of this report. We believe that the following are the more critical judgmental areas in the application of our accounting policies that currently affect our financial position and results of operations:
Sales allowances and returns
—We have arrangements with many of our department and specialty store customers to support their sales of our products. We establish accruals which, based on a review of the individual customer arrangements and the expected performance of our products in their stores, we believe will be required to satisfy our sales allowance obligations. We also establish accruals, which are based on historical experience, an evaluation of current sales trends and market conditions, and authorized amounts, that we believe are necessary to provide for sales allowances and inventory returns. Our historical accrual estimates have not differed materially from actual results. It is possible that the accrual estimates could vary from actual results, which would require adjustment to the allowance and returns accruals.
Inventories—
Inventories are comprised principally of finished goods and are stated at the lower of cost or net realizable value, except for certain retail inventories in North America that are stated at the lower of cost or market using the
51
retail inventory method. Cost for substantially all wholesale inventories in North America and certain wholesale inventories in Asia is determined using the first-in, first-out method. Cost for all other inventories is determined using the weighted average cost method. We review current business trends, inventory aging and discontinued merchandise categories to determine adjustments which we estimate will be needed to liquidate existing clearance inventories and record inventories at either the lower of cost or net realizable value or the lower of cost or market using the retail inventory method, as applicable. We believe that all inventory writedowns required at
February 3, 2019
have been recorded. Our historical estimates of inventory reserves have not differed materially from actual results. If market conditions were to change, it is possible that the required level of inventory reserves would need to be adjusted.
Asset impairments
—We determined during each of 2018, 2017 and 2016 that long-lived assets in certain of our retail stores and shop-in-shops were not recoverable, which resulted in us recording impairment charges. In order to calculate the impairment charges, we estimated the undiscounted future cash flows and the related fair value of each asset. The undiscounted future cash flows for each asset were estimated using current sales trends and other factors. If different assumptions had been used for future sales trends, the recorded impairment charges could have been significantly higher or lower.
Note 11
, “
Fair Value Measurements
,” in the Notes to Consolidated Financial Statements included in Item 8 of this report includes further discussion of the circumstances surrounding the impairments and the assumptions related to the impairment charges.
Allowance for doubtful accounts
—Trade receivables, as presented in our Consolidated Balance Sheets, are net of an allowance for doubtful accounts. An allowance for doubtful accounts is determined through an analysis of the aging of accounts receivable and assessments of collectibility based on historic trends, the financial condition of our customers and an evaluation of economic conditions. Because we cannot predict future changes in economic conditions and in the financial stability of our customers, actual future losses from uncollectible accounts may differ from our estimates and could impact our allowance for doubtful accounts.
Income taxes
—Deferred income tax balances reflect the effects of temporary differences between the carrying amounts of assets and liabilities and their tax bases and are stated at enacted tax rates expected to be in effect when taxes are actually paid or recovered. Deferred tax assets are evaluated for future realization and reduced by a valuation allowance to the extent we believe a portion will not be realized. We consider many factors when assessing the likelihood of future realization of our deferred tax assets, including our recent earnings experience and expectations of future taxable income by taxing jurisdiction, the carryforward periods available to us for tax reporting purposes and other relevant factors. The actual realization of deferred tax assets may differ significantly from the amounts we have recorded.
During the ordinary course of business, there are many transactions and calculations for which the ultimate tax determination is uncertain.
Accounting for income taxes requires a two-step approach to recognizing and measuring uncertain tax positions. The first step is to evaluate the tax position for recognition by determining if available evidence indicates it is more likely than not that the tax position will be fully sustained upon review by taxing authorities, including resolution of related appeals or litigation processes, if any. The second step is to measure the tax benefit as the largest amount with a greater than 50 percent likelihood of being realized upon ultimate settlement. For tax positions that are 50 percent or less likely of being sustained upon audit, we do not recognize any portion of that benefit in the financial statements. We consider many factors when evaluating and estimating our tax positions and tax benefits, which may require periodic adjustments and which may not accurately anticipate actual outcomes. Our actual results have differed materially in the past and could differ materially in the future from our current estimates.
The U.S. Tax Legislation was enacted on December 22, 2017. The U.S. Tax Legislation is comprehensive and significantly revised the United States tax code. Please see
Note 9
, “
Income Taxes
,” in the Notes to Consolidated Financial Statements in Item 8 of this report for further discussion of the impacts of the U.S. Tax Legislation.
Goodwill and other intangible assets
— Goodwill and other indefinite-lived intangible assets are tested for impairment annually, at the beginning of the third quarter of each fiscal year, and between annual tests if an event occurs or circumstances change that would indicate that it is more likely than not that the carrying amount may be impaired. Impairment testing for goodwill is done at the reporting unit level. A reporting unit is defined as an operating segment or one level below the operating segment, called a component. However, two or more components of an operating segment will be aggregated and deemed a single reporting unit if the components have similar economic characteristics.
We assess qualitative factors to determine whether it is necessary to perform a more detailed quantitative impairment test for goodwill and other indefinite-lived intangible assets. We may elect to bypass the qualitative assessment and proceed directly to the quantitative test for any reporting units or indefinite-lived intangible assets. Qualitative factors that we consider as part of our assessment include a change in our market capitalization and its implied impact on reporting unit fair value, a change in our weighted average cost of capital, industry and market conditions, macroeconomic conditions, trends in product
52
costs and financial performance of our businesses. If we perform the quantitative test for any reporting units or indefinite-lived intangible assets, we generally use a discounted cash flow method to estimate fair value. The discounted cash flow method is based on the present value of projected cash flows. Assumptions used in these cash flow projections are generally consistent with our internal forecasts. The estimated cash flows are discounted using a rate that represents our weighted average cost of capital. The weighted average cost of capital is based on a number of variables, including the equity-risk premium and risk-free interest rate. Management believes the assumptions used for the impairment tests are consistent with those that would be utilized by a market participant performing similar analysis and valuations. Adverse changes in future market conditions or weaker operating results compared to our expectations may impact our projected cash flows and estimates of weighted average cost of capital, which could result in a potential impairment charge if we are unable to recover the carrying value of our goodwill and other indefinite-lived intangible assets. For goodwill, if the carrying amount of a reporting unit exceeds its fair value, an impairment loss is recognized to the extent the carrying amount of the reporting unit’s goodwill exceeds the implied fair value of the goodwill. For indefinite-lived intangible assets, an impairment loss is recognized to the extent the carrying amount of the asset exceeds its fair value.
For the 2018 annual goodwill impairment test, we elected to bypass the qualitative assessment and proceeded directly to the quantitative impairment test using a discounted cash flow method to estimate the fair value of our reporting units. The annual goodwill impairment test during 2018 yielded estimated fair values in excess of the carrying amounts for our reporting units, all of which had fair values in excess of the carrying amounts by more than 50%, and therefore the second step of the quantitative goodwill impairment test was not required. No impairment of goodwill resulted from our annual impairment test in 2018.
For the 2017 annual goodwill impairment test, we elected to first assess qualitative factors to determine whether it was more likely than not that the fair value of any reporting unit was less than its carrying amount as a basis for determining whether it was necessary to perform the two-step goodwill impairment test. In evaluating whether it was more likely than not that the fair value of any reporting unit was less than its carrying amount, we assessed relevant events and circumstances including the change in our market capitalization and its implied impact on reporting unit fair value, a change in our weighted average cost of capital, industry and market conditions, macroeconomic conditions, trends in product costs and financial performance of our businesses. After assessing these events and circumstances, we determined that it was not more likely than not that the fair value of any reporting unit was less than its carrying amount and concluded that the quantitative goodwill impairment test was not required. No impairment of goodwill resulted from our annual impairment test in 2017.
For the 2018 annual impairment test of all indefinite-lived intangible assets, except for the
Geoffrey Beene
tradename, we elected to bypass the qualitative assessment and proceeded directly to the quantitative impairment test using a discounted cash flow method to estimate fair value. For the
Geoffrey Beene
tradename, since only a few months had passed since the acquisition on April 20, 2018 and there had not been any significant changes in the business, we determined qualitatively that it was not more likely than not that the fair value of this tradename was less than the carrying amount and concluded that the quantitative impairment test was not required. No impairment of indefinite-lived intangible assets resulted from our annual impairment tests in 2018.
For the 2017 annual impairment test of certain indefinite-lived intangible assets, we elected to first assess qualitative factors to determine whether it was more likely than not that the fair value of any asset was less than its carrying amount. In performing this evaluation, we assessed relevant events and circumstances including industry and market conditions, a change in our weighted average cost of capital, macroeconomic conditions, trends in product costs and financial performance of our businesses. After assessing these events and circumstances, we determined that it was not more likely than not that the fair value of these certain indefinite-lived intangible assets were less than their carrying amounts and concluded that the quantitative impairment test was not required. For certain other indefinite-lived intangible assets impairment tests, we elected to bypass the qualitative assessment and proceeded directly to the quantitative impairment test using a discounted cash flow method to estimate fair value. No impairment of indefinite-lived intangible assets resulted from our annual impairment tests in 2017.
If different assumptions for our goodwill and other indefinite-lived intangible assets impairment tests had been applied, significantly different outcomes could have resulted. There can be no assurance that the estimates and assumptions used in our goodwill and indefinite-lived intangible assets impairment testing performed in 2018 will prove to be accurate predictions of the future. For example, if general macroeconomic conditions deteriorate or otherwise vary from current assumptions (including those resulting in changes in the weighted average cost of capital), industry or market conditions deteriorate, business conditions or strategies for a specific reporting unit change from current assumptions, including cost increases or loss of major customers, our businesses do not perform as projected, or there is an extended period of a significant decline in our stock price, this could be an indicator that the excess fair value of our reporting units could be lessened and the chance of an impairment of goodwill and other indefinite-lived intangible assets could be raised.
53
Pension and Benefit Plans
—Pension and benefit plan expenses are recorded throughout the year based on calculations using actuarial valuations that incorporate estimates and assumptions that depend in part on financial market, economic and demographic conditions, including expected long-term rate of return on assets, discount rate and mortality rates. These assumptions require significant judgment. Actuarial gains and losses, which occur when actual experience differs from our actuarial assumptions, are recognized in the year in which they occur and could have a material impact on our operating results. These gains and losses are measured at least annually at the end of our fiscal year and, as such, are generally recorded during the fourth quarter of each year.
The expected long-term rate of return on assets is based on historical returns and the level of risk premium associated with the asset classes in which the portfolio is invested as well as expectations for the long-term future returns of each asset class. The expected long-term rate of return for each asset class is then weighted based on the target asset allocation to develop the expected long-term rate of return on assets assumption for the portfolio. The expected return on plan assets is recognized quarterly and determined by applying the long-term expected rate of return on assets to the actual fair value of plan assets adjusted for expected benefit payments, contributions and plan expenses. At the end of the year, the fair value of the assets is remeasured and any difference between the actual return on assets and the expected return is recorded in earnings as part of the actuarial gain or loss.
The discount rate is determined based on current market interest rates. It is selected by constructing a hypothetical portfolio of high quality corporate bonds that matches the cash flows from interest payments and principal maturities of the portfolio to the timing of benefit payments to participants. The yield on such a portfolio is the basis for the selected discount rate. Service and interest cost is measured using the discount rate as of the beginning of the year, while the projected benefit obligation is measured using the discount rate as of the end of the year. The impact of the change in the discount rate on our projected benefit obligation is recorded in earnings as part of the actuarial gain or loss.
We revised during each of 2018 and 2017 the mortality assumptions used to determine our benefit obligations based on recently published actuarial mortality tables. These changes in life expectancy resulted in changes to the period for which we expect benefits to be paid. In 2018, the decrease in life expectancy decreased our benefit obligations and future expense, and, in 2017, the increase in life expectancy increased our benefit obligations and future expense.
We also periodically review and revise, as necessary, other plan assumptions such as rates of compensation increases, retirement, and termination based on historical experience and anticipated future management actions. We have not historically had significant adjustments to these assumptions.
Actual results could differ from our assumptions, which would require adjustments to our balance sheet and could result in volatility in our future net benefit cost. Holding all other assumptions constant, a 1% change in the assumed rate of return on assets would result in a change to 2019 net benefit cost related to the pension plans of approximately $6 million. Likewise, a 0.25% change in the assumed discount rate would result in a change to 2019 net benefit cost of approximately $31 million.
Note 12
, “
Retirement and Benefit Plans
,” in the Notes to Consolidated Financial Statements included in Item 8 of this report sets forth certain significant rate assumptions and information regarding our target asset allocation, which are used in performing calculations related to our pension plans.
Stock-based compensation
—Accounting for stock-based compensation requires measurement of compensation cost for all stock-based awards at fair value on the date of grant and recognition of compensation cost over the service period for awards expected to vest. We use the Black-Scholes-Merton option pricing model to determine the fair value of our stock options. This model uses assumptions that include the risk-free interest rate, expected volatility, expected dividend yield and expected life of the options. The fair value of restricted stock units is determined based on the quoted price of our common stock on the date of grant. The fair value of our stock options and restricted stock units is recognized as expense over the service period, net of actual forfeitures.
The fair value of contingently issuable performance shares that are subject to market conditions is established using a Monte Carlo simulation model. Certain contingently issuable performance shares that are subject to market conditions are also subject to a holding period of one year after the vesting date. For such awards, the grant date fair value is discounted for the restriction of liquidity, which is calculated using the Chaffe model. We record expense for the awards that are subject to market conditions ratably over the vesting period, net of actual forfeitures, regardless of whether the market condition is satisfied.
54
Item 7A. Quantitative and Qualitative Disclosures About Market Risk
Information with respect to Quantitative and Qualitative Disclosures About Market Risk appears under the heading “Market Risk” in Item 7.
Item 8. Financial Statements and Supplementary Data
See page F-1 of this report for a listing of the consolidated financial statements and supplementary data included in this report.
Item 9. Changes in and Disagreements with Accountants on Accounting and Financial Disclosure
None.
Item 9A. Controls and Procedures
Evaluation of Disclosure Controls and Procedures
As of the end of the period covered by this report, we carried out an evaluation, under the supervision and with the participation of our management, including our Chairman and Chief Executive Officer and Chief Operating & Financial Officer, of the effectiveness of the design and operation of our disclosure controls and procedures. Based upon that evaluation, our Chairman and Chief Executive Officer and Chief Operating & Financial Officer concluded that our disclosure controls and procedures were effective as of the end of the period covered by this report. Disclosure controls and procedures are designed to ensure that information required to be disclosed in our reports filed or submitted under the Securities Exchange Act of 1934, as amended, is recorded, processed, summarized and reported within the time periods specified in the Securities and Exchange Commission’s rules and forms and that such information is accumulated and communicated to our management, including our Chairman and Chief Executive Officer and Chief Operating & Financial Officer, as appropriate to allow timely decisions regarding required disclosure.
Management’s Report on Internal Control over Financial Reporting
Management’s report on internal control over financial reporting and our independent registered public accounting firm’s audit report on our assessment of our internal control over financial reporting can be found on pages F-60 and F-61.
Changes in Internal Control over Financial Reporting
There have been no changes in our internal control over financial reporting during the period to which this report relates that have materially affected, or are reasonably likely to materially affect, our internal control over financial reporting.
Item 9B. Other Information
Not applicable.
55
PART III
Item 10. Directors, Executive Officers and Corporate Governance
Information with respect to Directors of the Registrant is incorporated herein by reference to the section entitled “Election of Directors” in our proxy statement for the Annual Meeting of Stockholders to be held on
June 20, 2019
. Information with respect to compliance by our officers and directors with Section 16(a) of the Securities Exchange Act is incorporated herein by reference to the section entitled “Section 16(a) Beneficial Ownership Reporting Compliance” in our proxy statement for the Annual Meeting of Stockholders to be held on
June 20, 2019
. Information with respect to our executive officers is contained in the section entitled “Executive Officers of the Registrant” in Part I, Item 1 of this report. Information with respect to the procedure by which security holders may recommend nominees to our Board of Directors and with respect to our Audit & Risk Management Committee, our Audit Committee Financial Expert and our Code of Ethics for the Chief Executive and Senior Financial Officers is incorporated herein by reference to the section entitled “Election of Directors” in our proxy statement for the Annual Meeting of Stockholders to be held on
June 20, 2019
.
Item 11. Executive Compensation
Information with respect to Executive Compensation is incorporated herein by reference to the sections entitled “Executive Compensation,” “Compensation Committee Report,” “Compensation Discussion and Analysis” and “Compensation Committee Interlocks and Insider Participation” in our proxy statement for the Annual Meeting of Stockholders to be held on
June 20, 2019
.
Item 12. Security Ownership of Certain Beneficial Owners and Management and Related Stockholder Matters
Information with respect to the Security Ownership of Certain Beneficial Owners and Management and Equity Compensation Plan Information is incorporated herein by reference to the sections entitled “Security Ownership of Certain Beneficial Owners and Management” and “Equity Compensation Plan Information” in our proxy statement for the Annual Meeting of Stockholders to be held on
June 20, 2019
.
Item 13. Certain Relationships and Related Transactions, and Director Independence
Information with respect to Certain Relationships and Related Transactions and Director Independence is incorporated herein by reference to the sections entitled “Transactions with Related Persons,” “Election of Directors” and “Director Compensation” in our proxy statement for the Annual Meeting of Stockholders to be held on
June 20, 2019
.
Item 14. Principal Accounting Fees and Services
Information with respect to Principal Accounting Fees and Services is incorporated herein by reference to the section entitled “Ratification of the Appointment of Auditor” in our proxy statement for the Annual Meeting of Stockholders to be held on
June 20, 2019
.
56
PART IV
Item 15. Exhibits, Financial Statement Schedules
|
(a)(1)
|
See page F-1 for a listing of the consolidated financial statements included in Item 8 of this report.
|
|
(a)(2)
|
See page F-1 for a listing of consolidated financial statement schedules submitted as part of this report.
|
|
(a)(3)
|
The following exhibits are included in this report:
|
57
58
59
60
________________
|
+
|
Filed or furnished herewith.
|
|
*
|
Management contract or compensatory plan or arrangement required to be identified pursuant to Item 15(a)(3) of this report.
|
Exhibits 32.1 and 32.2 shall not be deemed “filed” for purposes of Section 18 of the Securities Exchange Act of 1934, or otherwise subject to the liability of that Section. Such exhibits shall not be deemed incorporated by reference into any filing under the Securities Act of 1933 or the Securities Exchange Act of 1934.
|
(b)
|
Exhibits: See (a)(3) above for a listing of the exhibits included as part of this report.
|
|
(c)
|
Financial Statement Schedules: See page F-1 for a listing of the consolidated financial statement schedules submitted as part of this report.
|
61
Item 16. Form 10-K Summary
None.
62
SIGNATURES
Pursuant to the requirements of Section 13 or 15(d) of the Securities Exchange Act of 1934, the registrant has duly caused this report to be signed on its behalf by the undersigned, thereunto duly authorized.
Dated:
March 29, 2019
|
|
PVH CORP.
|
|
|
|
|
|
|
|
By:
|
/s/ EMANUEL CHIRICO
|
|
|
|
Emanuel Chirico
|
|
|
|
Chairman and Chief Executive Officer
|
Pursuant to the requirements of the Securities Exchange Act of 1934, this report has been signed below by the following persons on behalf of the registrant and in the capacities and on the dates indicated.
|
Signature
|
Title
|
Date
|
|
|
|
|
|
/s/ EMANUEL CHIRICO
|
Chairman and Chief Executive Officer
|
March 29, 2019
|
|
Emanuel Chirico
|
(Principal Executive Officer)
|
|
|
|
|
|
|
/s/ MICHAEL SHAFFER
|
Executive Vice President and Chief Operating &
|
March 29, 2019
|
|
Michael Shaffer
|
Financial Officer (Principal Financial Officer)
|
|
|
|
|
|
|
/s/ JAMES W. HOLMES
|
Senior Vice President and Controller
|
March 29, 2019
|
|
James W. Holmes
|
(Principal Accounting Officer)
|
|
|
|
|
|
|
/s/ MARY BAGLIVO
|
Director
|
March 29, 2019
|
|
Mary Baglivo
|
||
|
|
|
|
|
/s/ BRENT CALLINICOS
|
Director
|
March 29, 2019
|
|
Brent Callinicos
|
||
|
/s/ JUAN FIGUEREO
|
Director
|
March 29, 2019
|
|
Juan Figuereo
|
||
|
|
|
|
|
/s/ JOSEPH B. FULLER
|
Director
|
March 29, 2019
|
|
Joseph B. Fuller
|
||
|
/s/ JUDITH AMANDA SOURRY KNOX
|
Director
|
March 29, 2019
|
|
Judith Amanda Sourry Knox
|
||
|
|
|
|
|
/s/ V. JAMES MARINO
|
Director
|
March 29, 2019
|
|
V. James Marino
|
||
|
|
|
|
|
/s/ GERALDINE (PENNY) MCINTYRE
|
Director
|
March 29, 2019
|
|
Geraldine (Penny) McIntyre
|
||
|
/s/ AMY MCPHERSON
|
Director
|
March 29, 2019
|
|
Amy McPherson
|
||
|
/s/ HENRY NASELLA
|
Director
|
March 29, 2019
|
|
Henry Nasella
|
||
|
|
|
|
|
/s/ EDWARD ROSENFELD
|
Director
|
March 29, 2019
|
|
Edward Rosenfeld
|
||
|
/s/ CRAIG RYDIN
|
Director
|
March 29, 2019
|
|
Craig Rydin
|
||
63
FORM 10-K-ITEM 15(a)(1) and 15(a)(2)
PVH CORP.
INDEX TO FINANCIAL STATEMENTS AND FINANCIAL STATEMENT SCHEDULE
|
15(a)(1) The following consolidated financial statements and supplementary data are included in Item 8 of this report:
|
|
|
||
|
|
||
|
|
||
|
|
|
|
|
|
||
|
|
||
|
|
|
|
|
|
||
|
|
|
|
|
|
||
|
|
|
|
|
|
||
|
|
|
|
|
|
||
|
|
|
|
|
15(a)(2) The following consolidated financial statement schedule is included herein:
|
All other schedules for which provision is made in the applicable accounting regulation of the Securities and Exchange Commission are not required under the related instructions or are inapplicable and therefore have been omitted.
F-1
PVH CORP.
CONSOLIDATED INCOME STATEMENTS
(In millions, except per share data)
|
|
2018
|
2017
|
2016
|
||||||||
|
Net sales
|
$
|
9,154.2
|
|
$
|
8,439.4
|
|
$
|
7,791.4
|
|
||
|
Royalty revenue
|
375.9
|
|
366.3
|
|
320.6
|
|
|||||
|
Advertising and other revenue
|
126.7
|
|
109.1
|
|
91.1
|
|
|||||
|
Total revenue
|
9,656.8
|
|
8,914.8
|
|
8,203.1
|
|
|||||
|
Cost of goods sold (exclusive of depreciation and amortization)
|
4,348.5
|
|
4,020.4
|
|
3,832.8
|
|
|||||
|
Gross profit
|
5,308.3
|
|
4,894.4
|
|
4,370.3
|
|
|||||
|
Selling, general and administrative expenses
|
4,432.8
|
|
4,245.2
|
|
3,677.9
|
|
|||||
|
Non-service related pension and postretirement cost (income)
|
5.1
|
|
3.0
|
|
(41.2
|
)
|
|||||
|
Debt modification and extinguishment costs
|
—
|
|
23.9
|
|
15.8
|
|
|||||
|
Other noncash gain, net
|
—
|
|
—
|
|
71.3
|
|
|||||
|
Equity in net income of unconsolidated affiliates
|
21.3
|
|
10.1
|
|
0.1
|
|
|||||
|
Income before interest and taxes
|
891.7
|
|
632.4
|
|
789.2
|
|
|||||
|
Interest expense
|
120.8
|
|
128.5
|
|
120.9
|
|
|||||
|
Interest income
|
4.7
|
|
6.3
|
|
5.9
|
|
|||||
|
Income before taxes
|
775.6
|
|
510.2
|
|
674.2
|
|
|||||
|
Income tax expense (benefit)
|
31.0
|
|
(25.9
|
)
|
125.5
|
|
|||||
|
Net income
|
744.6
|
|
536.1
|
|
548.7
|
|
|||||
|
Less: Net loss attributable to redeemable non-controlling interest
|
(1.8
|
)
|
(1.7
|
)
|
(0.3
|
)
|
|||||
|
Net income attributable to PVH Corp.
|
$
|
746.4
|
|
$
|
537.8
|
|
$
|
549.0
|
|
||
|
Basic net income per common share attributable to PVH Corp.
|
$
|
9.75
|
|
$
|
6.93
|
|
$
|
6.84
|
|
||
|
Diluted net income per common share attributable to PVH Corp.
|
$
|
9.65
|
|
$
|
6.84
|
|
$
|
6.79
|
|
||
See notes to consolidated financial statements.
F-2
PVH CORP.
CONSOLIDATED STATEMENTS OF COMPREHENSIVE INCOME
(In millions)
|
2018
|
2017
|
2016
|
|||||||||
|
Net income
|
$
|
744.6
|
|
$
|
536.1
|
|
$
|
548.7
|
|
||
|
Other comprehensive (loss) income:
|
|||||||||||
|
Foreign currency translation adjustments
|
(361.3
|
)
|
561.3
|
|
(21.4
|
)
|
|||||
|
Net unrealized and realized gain (loss) related to effective cash flow hedges, net of tax expense of $3.2, $0.1 and $1.2
|
101.8
|
|
(99.1
|
)
|
0.7
|
|
|||||
|
Net gain (loss) on net investment hedges, net of tax expense (benefit) of $22.5, $(28.7) and $8.6
|
73.1
|
|
(70.8
|
)
|
14.1
|
|
|||||
|
Total other comprehensive (loss) income
|
(186.4
|
)
|
391.4
|
|
(6.6
|
)
|
|||||
|
Comprehensive income
|
558.2
|
|
927.5
|
|
542.1
|
|
|||||
|
Less: Comprehensive loss attributable to redeemable non-controlling interest
|
(1.8
|
)
|
(1.7
|
)
|
(0.3
|
)
|
|||||
|
Comprehensive income attributable to PVH Corp.
|
$
|
560.0
|
|
$
|
929.2
|
|
$
|
542.4
|
|
||
See notes to consolidated financial statements.
F-3
PVH CORP.
CONSOLIDATED BALANCE SHEETS
(In millions, except share and per share data)
|
February 3,
2019 |
February 4,
2018 |
||||||
|
ASSETS
|
|
|
|||||
|
Current Assets:
|
|
|
|||||
|
Cash and cash equivalents
|
$
|
452.0
|
|
$
|
493.9
|
|
|
|
Trade receivables, net of allowances for doubtful accounts of $21.6 and $21.1
|
777.8
|
|
658.5
|
|
|||
|
Other receivables
|
26.0
|
|
37.9
|
|
|||
|
Inventories, net
|
1,732.4
|
|
1,591.3
|
|
|||
|
Prepaid expenses
|
168.7
|
|
184.5
|
|
|||
|
Other
|
81.7
|
|
64.7
|
|
|||
|
Total Current Assets
|
3,238.6
|
|
3,030.8
|
|
|||
|
Property, Plant and Equipment, net
|
984.5
|
|
899.8
|
|
|||
|
Goodwill
|
3,670.5
|
|
3,834.7
|
|
|||
|
Tradenames
|
2,863.7
|
|
2,928.4
|
|
|||
|
Other Intangibles, net
|
705.5
|
|
798.2
|
|
|||
|
Other Assets, including deferred taxes of $40.5 and $25.4
|
400.9
|
|
393.8
|
|
|||
|
Total Assets
|
$
|
11,863.7
|
|
$
|
11,885.7
|
|
|
|
LIABILITIES, REDEEMABLE NON-CONTROLLING INTEREST AND STOCKHOLDERS’ EQUITY
|
|||||||
|
Current Liabilities:
|
|
|
|
|
|||
|
Accounts payable
|
$
|
924.2
|
|
$
|
889.8
|
|
|
|
Accrued expenses
|
891.6
|
|
923.1
|
|
|||
|
Deferred revenue
|
65.3
|
|
39.2
|
|
|||
|
Short-term borrowings
|
12.8
|
|
19.5
|
|
|||
|
Current portion of long-term debt
|
—
|
|
—
|
|
|||
|
Total Current Liabilities
|
1,893.9
|
|
1,871.6
|
|
|||
|
Long-Term Debt
|
2,819.4
|
|
3,061.3
|
|
|||
|
Other Liabilities, including deferred taxes of $565.2 and $663.0
|
1,322.4
|
|
1,414.4
|
|
|||
|
Redeemable Non-Controlling Interest
|
0.2
|
|
2.0
|
|
|||
|
Stockholders’ Equity:
|
|||||||
|
Preferred stock, par value $100 per share; 150,000 total shares authorized
|
—
|
|
—
|
|
|||
|
Common stock, par value $1 per share; 240,000,000 shares authorized; 85,446,141 and 84,851,079 shares issued
|
85.4
|
|
84.9
|
|
|||
|
Additional paid in capital – common stock
|
3,017.3
|
|
2,941.2
|
|
|||
|
Retained earnings
|
4,350.1
|
|
3,625.2
|
|
|||
|
Accumulated other comprehensive loss
|
(507.9
|
)
|
(321.5
|
)
|
|||
|
Less: 10,042,510 and 7,672,317 shares of common stock held in treasury, at cost
|
(1,117.1
|
)
|
(793.4
|
)
|
|||
|
Total Stockholders’ Equity
|
5,827.8
|
|
5,536.4
|
|
|||
|
Total Liabilities, Redeemable Non-Controlling Interest and Stockholders’ Equity
|
$
|
11,863.7
|
|
$
|
11,885.7
|
|
|
See notes to consolidated financial statements.
F-4
PVH CORP.
CONSOLIDATED STATEMENTS OF CASH FLOWS
(In millions)
|
|
2018
|
2017
|
2016
|
||||||||
|
OPERATING ACTIVITIES
|
|
|
|
||||||||
|
Net income
|
$
|
744.6
|
|
$
|
536.1
|
|
$
|
548.7
|
|
||
|
Adjustments to reconcile to net cash provided by operating activities:
|
|
|
|
|
|
|
|||||
|
Depreciation and amortization
|
334.8
|
|
324.9
|
|
321.8
|
|
|||||
|
Equity in net income of unconsolidated affiliates
|
(21.3
|
)
|
(10.1
|
)
|
(0.1
|
)
|
|||||
|
Deferred taxes
|
(113.3
|
)
|
(1)
|
(224.6
|
)
|
(1)
|
1.3
|
|
|||
|
Stock-based compensation expense
|
56.2
|
|
44.9
|
|
38.2
|
|
|||||
|
Impairment of long-lived assets
|
17.9
|
|
7.5
|
|
10.1
|
|
|||||
|
Actuarial loss (gain) on retirement and benefit plans
|
15.0
|
|
2.5
|
|
(39.1
|
)
|
|||||
|
Settlement loss on retirement plans
|
—
|
|
9.4
|
|
—
|
|
|||||
|
Debt modification and extinguishment costs
|
—
|
|
23.9
|
|
15.8
|
|
|||||
|
Gain to write-up equity investment in joint venture to fair value
|
—
|
|
—
|
|
(153.1
|
)
|
|||||
|
Net loss on deconsolidation of subsidiary
|
—
|
|
—
|
|
81.8
|
|
|||||
|
Changes in operating assets and liabilities:
|
|
|
|
|
|
|
|||||
|
Trade receivables, net
|
(151.4
|
)
|
3.3
|
|
22.3
|
|
|||||
|
Other receivables
|
10.7
|
|
(11.7
|
)
|
4.2
|
|
|||||
|
Inventories, net
|
(212.1
|
)
|
(163.5
|
)
|
2.2
|
|
|||||
|
Accounts payable, accrued expenses and deferred revenue
|
112.9
|
|
185.9
|
|
166.9
|
|
|||||
|
Prepaid expenses
|
8.5
|
|
(41.0
|
)
|
19.2
|
|
|||||
|
Employer pension contributions
|
(10.0
|
)
|
(0.3
|
)
|
(100.0
|
)
|
|||||
|
Contingent purchase price payments to Mr. Calvin Klein
|
(15.9
|
)
|
(55.6
|
)
|
(53.1
|
)
|
|||||
|
Other, net
|
75.9
|
|
12.6
|
|
15.5
|
|
|||||
|
Net cash provided by operating activities
|
852.5
|
|
644.2
|
|
902.6
|
|
|||||
|
INVESTING ACTIVITIES
(2)
|
|
|
|
|
|
|
|||||
|
Acquisitions, net of cash acquired
|
(15.9
|
)
|
(40.1
|
)
|
(157.7
|
)
|
|||||
|
Purchases of property, plant and equipment
|
(379.5
|
)
|
(358.1
|
)
|
(246.6
|
)
|
|||||
|
Proceeds from sale of building
|
—
|
|
3.4
|
|
16.7
|
|
|||||
|
Investments in and advance to unconsolidated affiliates
|
—
|
|
(14.2
|
)
|
(32.0
|
)
|
|||||
|
Payment received on advance to unconsolidated affiliate
|
—
|
|
6.3
|
|
6.2
|
|
|||||
|
Loan to a supplier
|
—
|
|
—
|
|
(13.8
|
)
|
|||||
|
Net cash used by investing activities
|
(395.4
|
)
|
(402.7
|
)
|
(427.2
|
)
|
|||||
|
FINANCING ACTIVITIES
(2)
|
|
|
|
|
|
|
|||||
|
Net (payments on) proceeds from short-term borrowings
|
(6.7
|
)
|
0.4
|
|
(6.8
|
)
|
|||||
|
Proceeds from 3 1/8% senior notes, net of related fees
|
—
|
|
701.6
|
|
—
|
|
|||||
|
Redemption of 4 1/2% senior notes, including premium
|
—
|
|
(715.8
|
)
|
—
|
|
|||||
|
Proceeds from 2016 facilities, net of related fees
|
—
|
|
—
|
|
571.1
|
|
|||||
|
Repayment of Term Loan B in connection with amendment to 2014 facilities
|
—
|
|
—
|
|
(582.0
|
)
|
|||||
|
Repayment of 2016/2014 facilities
|
(150.0
|
)
|
(250.0
|
)
|
(350.0
|
)
|
|||||
|
Proceeds from 3 5/8% senior notes, net of related fees
|
—
|
|
—
|
|
389.6
|
|
|||||
|
Net proceeds from settlement of awards under stock plans
|
20.4
|
|
30.0
|
|
13.1
|
|
|||||
|
Cash dividends
|
(11.6
|
)
|
(11.9
|
)
|
(12.2
|
)
|
|||||
|
Acquisition of treasury shares
|
(325.2
|
)
|
(259.1
|
)
|
(322.1
|
)
|
|||||
|
Payments of capital lease obligations
|
(5.4
|
)
|
(5.1
|
)
|
(7.0
|
)
|
|||||
|
Tommy Hilfiger India contingent purchase price payments
|
—
|
|
(0.8
|
)
|
(0.6
|
)
|
|||||
|
Contributions from non-controlling interest
|
—
|
|
1.7
|
|
2.2
|
|
|||||
|
Net cash used by financing activities
|
(478.5
|
)
|
(509.0
|
)
|
(304.7
|
)
|
|||||
|
Effect of exchange rate changes on cash and cash equivalents
|
(20.5
|
)
|
31.3
|
|
3.0
|
|
|||||
|
(Decrease) increase in cash and cash equivalents
|
(41.9
|
)
|
(236.2
|
)
|
173.7
|
|
|||||
|
Cash and cash equivalents at beginning of year
|
493.9
|
|
730.1
|
|
556.4
|
|
|||||
|
Cash and cash equivalents at end of year
|
$
|
452.0
|
|
$
|
493.9
|
|
$
|
730.1
|
|
||
(1)
Includes the impact of the U.S. Tax Legislation in 2018 and 2017 and the impact of the 2019 Dutch Tax Plan in 2018. Please see
Note 9
for further information.
(2)
Please see
Note 19
for information on noncash investing and financing transactions.
See notes to consolidated financial statements.
F-5
PVH CORP.
CONSOLIDATED STATEMENTS OF CHANGES IN STOCKHOLDERS’ EQUITY AND REDEEMABLE NON-CONTROLLING INTEREST
(In millions, except share and per share data)
|
Stockholders’ Equity
|
||||||||||||||||||||||||||||||||||
|
Common Stock
|
Additional
Paid In Capital-
Common
Stock
|
Accumulated
Other
Comprehensive Loss
|
Total Stockholders’ Equity
|
|||||||||||||||||||||||||||||||
|
Redeemable
Non-Controlling
Interest
|
Preferred
Stock
|
Shares
|
$1 par
Value
|
Retained
Earnings
|
Treasury
Stock
|
|||||||||||||||||||||||||||||
|
January 31, 2016
|
$
|
—
|
|
$
|
—
|
|
83,545,818
|
|
$
|
83.5
|
|
$
|
2,822.5
|
|
$
|
2,561.2
|
|
$
|
(704.2
|
)
|
$
|
(210.7
|
)
|
$
|
4,552.3
|
|
||||||||
|
Net income attributable to PVH Corp.
|
|
|
|
|
|
|
|
549.0
|
|
|
|
|
|
549.0
|
|
|||||||||||||||||||
|
Foreign currency translation adjustments
|
|
|
|
|
|
|
|
|
|
(21.4
|
)
|
|
|
(21.4
|
)
|
|||||||||||||||||||
|
Net unrealized and realized gain related to effective cash flow hedges, net of tax expense of $1.2
|
|
|
|
|
|
|
|
|
|
0.7
|
|
|
|
0.7
|
|
|||||||||||||||||||
|
Net gain on net investment hedge, net of tax expense of $8.6
|
14.1
|
|
14.1
|
|
||||||||||||||||||||||||||||||
|
Total comprehensive income attributable to PVH Corp.
|
|
|
|
|
|
|
|
|
|
|
|
|
|
542.4
|
|
|||||||||||||||||||
|
Settlement of awards under stock plans
|
|
377,366
|
|
0.4
|
|
12.7
|
|
|
|
|
|
|
|
13.1
|
|
|||||||||||||||||||
|
Tax deficiency from awards under stock plans
|
|
|
|
|
|
(7.2
|
)
|
|
|
|
|
|
|
(7.2
|
)
|
|||||||||||||||||||
|
Stock-based compensation expense
|
|
|
|
|
|
38.2
|
|
|
|
|
|
|
|
38.2
|
|
|||||||||||||||||||
|
Cash dividends ($0.15 per share)
|
|
|
|
|
|
(12.2
|
)
|
|
|
|
|
(12.2
|
)
|
|||||||||||||||||||||
|
Acquisition of 3,313,810 treasury shares
|
|
|
|
|
|
|
|
|
|
(322.1
|
)
|
(322.1
|
)
|
|||||||||||||||||||||
|
Acquisition date fair value of redeemable non-controlling interest
|
0.1
|
|
|
|
||||||||||||||||||||||||||||||
|
Contributions from the minority shareholder
|
2.2
|
|
|
|
||||||||||||||||||||||||||||||
|
Net loss attributable to redeemable non-controlling interest
|
(0.3
|
)
|
|
|
||||||||||||||||||||||||||||||
|
January 29, 2017
|
2.0
|
|
—
|
|
83,923,184
|
|
83.9
|
|
2,866.2
|
|
3,098.0
|
|
(710.8
|
)
|
(532.8
|
)
|
4,804.5
|
|
||||||||||||||||
|
Net income attributable to PVH Corp.
|
537.8
|
|
537.8
|
|
||||||||||||||||||||||||||||||
|
Foreign currency translation adjustments
|
561.3
|
|
561.3
|
|
||||||||||||||||||||||||||||||
|
Net unrealized and realized loss related to effective cash flow hedges, net of tax expense of $0.1
|
(99.1
|
)
|
(99.1
|
)
|
||||||||||||||||||||||||||||||
|
Net loss on net investment hedges, net of tax benefit of $(28.7)
|
(70.8
|
)
|
(70.8
|
)
|
||||||||||||||||||||||||||||||
|
Total comprehensive income attributable to PVH Corp.
|
929.2
|
|
||||||||||||||||||||||||||||||||
|
Reclassification related to the adoption of accounting guidance for certain tax effects in connection with the U.S. Tax Legislation
|
2.1
|
|
(2.1
|
)
|
—
|
|
||||||||||||||||||||||||||||
|
Cumulative-effect adjustment related to the adoption of accounting guidance for share-based payment award transactions
|
1.1
|
|
(0.8
|
)
|
0.3
|
|
||||||||||||||||||||||||||||
|
Settlement of awards under stock plans
|
927,895
|
|
1.0
|
|
29.0
|
|
30.0
|
|
||||||||||||||||||||||||||
|
Stock-based compensation expense
|
44.9
|
|
44.9
|
|
||||||||||||||||||||||||||||||
|
Cash dividends ($0.15 per share)
|
(11.9
|
)
|
(11.9
|
)
|
||||||||||||||||||||||||||||||
|
Acquisition of 2,300,657 treasury shares
|
(260.6
|
)
|
(260.6
|
)
|
||||||||||||||||||||||||||||||
|
Contributions from the minority shareholder
|
1.7
|
|
|
|
||||||||||||||||||||||||||||||
|
Net loss attributable to redeemable non-controlling interest
|
(1.7
|
)
|
|
|
||||||||||||||||||||||||||||||
|
February 4, 2018
|
2.0
|
|
—
|
|
84,851,079
|
|
84.9
|
|
2,941.2
|
|
3,625.2
|
|
(321.5
|
)
|
(793.4
|
)
|
5,536.4
|
|
||||||||||||||||
|
Net income attributable to PVH Corp.
|
746.4
|
|
746.4
|
|
||||||||||||||||||||||||||||||
|
Foreign currency translation adjustments
|
(361.3
|
)
|
(361.3
|
)
|
||||||||||||||||||||||||||||||
|
Net unrealized and realized gain related to effective cash flow hedges, net of tax expense of $3.2
|
101.8
|
|
101.8
|
|
||||||||||||||||||||||||||||||
|
Net gain on net investment hedges, net of tax expense of $22.5
|
73.1
|
|
73.1
|
|
||||||||||||||||||||||||||||||
|
Total comprehensive income attributable to PVH Corp.
|
560.0
|
|
||||||||||||||||||||||||||||||||
|
Cumulative-effect adjustment related to the adoption of accounting guidance for revenue recognition
|
(1.9
|
)
|
(1.9
|
)
|
||||||||||||||||||||||||||||||
|
Cumulative-effect adjustment related to the adoption of accounting guidance for income tax accounting on intercompany sales or transfers of assets other than inventory
|
(8.0
|
)
|
(8.0
|
)
|
||||||||||||||||||||||||||||||
|
Settlement of awards under stock plans
|
595,062
|
|
0.5
|
|
19.9
|
|
20.4
|
|
||||||||||||||||||||||||||
|
Stock-based compensation expense
|
56.2
|
|
56.2
|
|
||||||||||||||||||||||||||||||
|
Cash dividends ($0.15 per share)
|
(11.6
|
)
|
(11.6
|
)
|
||||||||||||||||||||||||||||||
|
Acquisition of 2,370,193 treasury shares
|
(323.7
|
)
|
(323.7
|
)
|
||||||||||||||||||||||||||||||
|
Net loss attributable to redeemable non-controlling interest
|
(1.8
|
)
|
||||||||||||||||||||||||||||||||
|
February 3, 2019
|
$
|
0.2
|
|
$
|
—
|
|
85,446,141
|
|
$
|
85.4
|
|
$
|
3,017.3
|
|
$
|
4,350.1
|
|
$
|
(507.9
|
)
|
$
|
(1,117.1
|
)
|
$
|
5,827.8
|
|
||||||||
See notes to consolidated financial statements.
F-6
PVH CORP.
NOTES TO CONSOLIDATED FINANCIAL STATEMENTS
1. SUMMARY OF SIGNIFICANT ACCOUNTING POLICIES
Description of Business
— PVH Corp. and its consolidated subsidiaries (collectively, the “Company”) constitute a global apparel company with a brand portfolio consisting of nationally and internationally recognized trademarks, including
TOMMY HILFIGER, CALVIN KLEIN, Van Heusen, IZOD, ARROW, Warner’s, Olga
,
True&Co.
and
Geoffrey Beene
, which are owned, and
Speedo
, which is licensed in perpetuity for North America and the Caribbean, as well as
various other owned, licensed and private label brands
.
The Company designs and markets branded dress shirts, neckwear, sportswear, jeanswear, performance apparel, intimate apparel, underwear, swimwear, swim products, handbags, accessories, footwear and other related products and licenses its owned brands globally over a broad array of products categories and for use in numerous discrete jurisdictions.
Principles of Consolidation
— The consolidated financial statements include the accounts of the Company. Intercompany accounts and transactions have been eliminated in consolidation. Investments in entities that the Company does not control but has the ability to exercise significant influence over are accounted for using the equity method of accounting. The Company’s Consolidated Income Statements include its proportionate share of the net income or loss of these entities. Please see
Note 5
, “
Investments in Unconsolidated Affiliates
,” for further discussion. The Company and Arvind Limited (“Arvind”) have a joint venture in Ethiopia, PVH Arvind Manufacturing Private Limited Company (“PVH Ethiopia”), in which the Company owns a
75%
interest. PVH Ethiopia is consolidated and the minority shareholder’s proportionate share (
25%
) of the equity in this joint venture is accounted for as a redeemable non-controlling interest. Please see
Note 6
, “
Redeemable Non-Controlling Interest
,” for further discussion.
Use of Estimates
— The preparation of the consolidated financial statements in conformity with accounting principles generally accepted in the United States requires management to make estimates and assumptions that affect the amounts reported in the consolidated financial statements and accompanying notes. Actual results could differ materially from the estimates.
Fiscal Year
— The Company uses a
52
-
53
week fiscal year ending on the Sunday closest to February 1. References to a year are to the Company’s fiscal year, unless the context requires otherwise. Results for
2018
,
2017
and
2016
represent the
52
weeks ended
February 3, 2019
,
53
weeks ended
February 4, 2018
and
52
weeks ended
January 29, 2017
, respectively.
Cash and Cash Equivalents
— The Company considers all highly liquid investments with original maturities of three months or less when purchased to be cash equivalents. Cash equivalents also includes amounts due from third party credit card processors for the settlement of customer debit and credit card transactions that are collectible in one week or less. The Company’s cash and cash equivalents at
February 3, 2019
consisted principally of bank deposits and investments in money market funds.
Accounts Receivable
— Trade receivables, as presented in the Company’s Consolidated Balance Sheets, are net of returns and allowances. An allowance for doubtful accounts is determined through an analysis of the aging of accounts receivable and assessments of collectibility based on historic trends, the financial condition of the Company’s customers and an evaluation of economic conditions. The Company writes off uncollectible trade receivables once collection efforts have been exhausted and third parties confirm the balance is not recoverable. Costs associated with allowable customer markdowns and operational chargebacks, net of the expected recoveries, are part of the provision for allowances included in accounts receivable. These provisions result from seasonal negotiations, historical experience, and an evaluation of current market conditions.
Goodwill and Other Intangible Assets
— The Company assesses the recoverability of goodwill annually, at the beginning of the third quarter of each fiscal year, and between annual tests if an event occurs or circumstances change that would indicate that it is more likely than not that the carrying amount may be impaired. Impairment testing for goodwill is done at the reporting unit level. A reporting unit is defined as an operating segment or one level below the operating segment, called a component. However, two or more components of an operating segment will be aggregated and deemed a single reporting unit if the components have similar economic characteristics.
The Company assesses qualitative factors to determine whether it is necessary to perform a more detailed two-step quantitative goodwill impairment test. The Company may elect to bypass the qualitative assessment and proceed directly to the quantitative test for any reporting unit. The quantitative goodwill impairment test, if necessary, is a two-step process. The first
F-7
PVH CORP.
NOTES TO CONSOLIDATED FINANCIAL STATEMENTS - (Continued)
step is to identify the existence of a potential impairment by comparing the fair value of a reporting unit (the fair value of a reporting unit is estimated using a discounted cash flow model) with its carrying amount, including goodwill. If the fair value of a reporting unit exceeds its carrying amount, the reporting unit’s goodwill is considered not to be impaired and performance of the second step of the quantitative goodwill impairment test is unnecessary. However, if the carrying amount of a reporting unit exceeds its fair value, the second step of the quantitative goodwill impairment test is performed to measure the amount of impairment loss to be recorded, if any. The second step of the quantitative goodwill impairment test compares the implied fair value of a reporting unit’s goodwill with the carrying amount of that goodwill. If the carrying amount of a reporting unit’s goodwill exceeds its implied fair value, an impairment loss is recognized in an amount equal to that excess. The implied fair value of goodwill is determined using the same approach as used when determining the amount of goodwill that would be recognized in a business combination. That is, the fair value of the reporting unit is allocated to all of its assets and liabilities as if the reporting unit had been acquired in a business combination and the fair value was the purchase price paid to acquire the reporting unit.
For the 2018 annual goodwill impairment test, the Company elected to bypass the qualitative assessment and proceeded directly to the quantitative impairment test using a discounted cash flow method to estimate the fair value of its reporting units. The Company’s annual goodwill impairment test during 2018 yielded estimated fair values in excess of the carrying amounts for the Company’s reporting units, all of which had fair values in excess of the carrying amounts by more than
50%
, and therefore the second step of the quantitative goodwill impairment test was not required. No impairment of goodwill resulted from the Company’s annual impairment test in 2018.
For the 2017 annual goodwill impairment test, the Company elected to first assess qualitative factors to determine whether it was more likely than not that the fair value of any reporting unit was less than its carrying amount as a basis for determining whether it was necessary to perform the two-step goodwill impairment test. In evaluating whether it was more likely than not that the fair value of any reporting unit was less than its carrying amount, the Company assessed relevant events and circumstances including the change in the Company’s market capitalization and its implied impact on reporting unit fair value, industry and market conditions, a change in the Company’s weighted average cost of capital, macroeconomic conditions, trends in product costs and financial performance of the Company’s businesses. After assessing these events and circumstances, the Company determined that it was not more likely than not that the fair value of any reporting unit was less than its carrying amount and concluded that the quantitative goodwill impairment test was not required. No impairment of goodwill resulted from the Company’s annual impairment test in 2017.
Indefinite-lived intangible assets not subject to amortization are tested for impairment annually, at the beginning of the third quarter of each fiscal year, and between annual tests if an event occurs or circumstances change that would indicate that it is more likely than not that the carrying amount may be impaired. The Company assesses qualitative factors to determine whether it is necessary to perform a more detailed quantitative impairment test for its indefinite-lived intangible assets. The Company may elect to bypass the qualitative assessment and proceed directly to the quantitative impairment test. When performing the quantitative test, an impairment loss is recognized if the carrying amount of the asset exceeds the fair value of the asset, which is generally determined using the estimated discounted cash flows associated with the asset’s use. Intangible assets with finite lives are amortized over their estimated useful lives and are tested for impairment along with other long-lived assets when events and circumstances indicate that the assets might be impaired.
For the 2018 annual impairment test of all indefinite-lived intangible assets, except for the
Geoffrey Beene
tradename, the Company elected to bypass the qualitative assessment and proceeded directly to the quantitative impairment test using a discounted cash flow method to estimate fair value. For the
Geoffrey Beene
tradename, since only a few months had passed since the acquisition on April 20, 2018 and there had not been any significant changes in the business, the Company determined qualitatively that it was not more likely than not that the fair value of this tradename was less than the carrying amount and concluded that the quantitative impairment test was not required. No impairment of indefinite-lived intangible assets resulted from the Company’s annual impairment tests in 2018.
For the 2017 annual impairment test of certain indefinite-lived intangible assets, the Company elected to first assess qualitative factors to determine whether it was more likely than not that the fair value of any asset was less than its carrying amount. In performing this evaluation, the Company assessed relevant events and circumstances including industry and market conditions, a change in the Company’s weighted average cost of capital, macroeconomic conditions, trends in product costs and financial performance of the Company’s businesses. After assessing these events and circumstances, the Company determined that it was not more likely than not that the fair values of these certain indefinite-lived intangible assets were less than their
F-8
PVH CORP.
NOTES TO CONSOLIDATED FINANCIAL STATEMENTS - (Continued)
carrying amounts and concluded that the quantitative impairment test was not required. For certain other indefinite-lived intangible assets impairment tests, the Company elected to bypass the qualitative assessment and proceeded directly to the quantitative impairment test using a discounted cash flow method to estimate fair value. No impairment of indefinite-lived intangible assets resulted from the Company’s annual impairment tests in 2017.
Asset Impairments
— The Company reviews for impairment of long-lived assets (excluding goodwill and other indefinite-lived intangible assets) when events and circumstances indicate that the assets might be impaired. The Company records an impairment loss when the carrying amount of the asset is not recoverable and exceeds its fair value. Please see
Note 11
, “
Fair Value Measurements
,” for further discussion.
Inventories
—
Inventories are comprised principally of finished goods and are stated at the lower of cost or net realizable value, except for certain retail inventories in North America that are stated at the lower of cost or market using the retail inventory method. Cost for substantially all wholesale inventories in North America and certain wholesale inventories in Asia is determined using the first-in, first-out method. Cost for all other inventories is determined using the weighted average cost method. The Company reviews current business trends, inventory aging and discontinued merchandise categories to determine adjustments that it estimates will be needed to liquidate existing clearance inventories and record inventories at either the lower of cost or net realizable value or the lower of cost or market using the retail inventory method, as applicable.
Property, Plant and Equipment
— Property, plant and equipment is stated at cost less accumulated depreciation. Depreciation is generally provided over the estimated useful lives of the related assets on a straight-line basis. The range of useful lives is principally as follows: Buildings and building improvements —
15
to
40
years; machinery, software and equipment —
2
to
10
years; furniture and fixtures —
2
to
10
years; and fixtures located in third party customer locations (“shop-in-shops”) and their related costs —
3
to
4
years. Leasehold improvements are depreciated using the straight-line method over the lesser of the term of the related lease or the estimated useful life of the asset. In certain circumstances, contractual renewal options are considered when determining the term of the related lease. Major additions and improvements that extend the useful life of the asset are capitalized, and repairs and maintenance are charged to operations in the period incurred. Depreciation expense totaled $
263.9
million, $
252.2
million and $
228.4
million in
2018
,
2017
and
2016
, respectively.
Cloud Computing Arrangements
— The Company incurs costs to implement cloud computing arrangements that are hosted by a third party vendor. Generally, these arrangements are service contracts that do not provide the Company with the right to take possession of the software or the ability to run the software on its own hardware or contract with another party, other than the vendor, to host the software. As such, the costs incurred to implement the Company’s cloud computing arrangements have generally been expensed as incurred.
The Financial Accounting Standards Board (“FASB”) issued in August 2018 an update to accounting guidance related to implementation costs incurred in a cloud computing arrangement that is a service contract. As described below in the section “
Accounting Guidance Issued But Not Adopted as of February 3, 2019
,” the updated guidance aligns the requirements for capitalizing implementation costs incurred under cloud computing arrangements with the requirements for capitalizing costs incurred to develop or obtain internal-use software. The Company will early adopt the new cloud computing guidance in the first quarter of 2019 using the prospective approach.
Leases
— The Company leases retail locations, warehouses, distribution centers, showrooms, office space and equipment. Assets held under capital leases are included in property, plant and equipment and are amortized over the lesser of the term of the related lease or the estimated useful life of the asset. The Company accounts for rent expense under noncancelable operating leases with scheduled rent increases and rent holidays on a straight-line basis over the lease term. The Company determines the lease term at the inception of a lease, and where renewal options are reasonably assured of being exercised because of the significant economic penalty that exists for not exercising those options, they are included in the lease term. The excess of straight-line rent expense over scheduled payments is recorded as a deferred liability. For certain retail store leases that require variable lease payments based on sales, when sales at those locations exceed a stated base amount, additional rent expense is recognized when the liability is probable. In addition, the Company receives build out contributions from landlords primarily as an incentive for the Company to lease space from the landlords. Such amounts are amortized as a reduction of rent expense over the life of the related lease.
The FASB issued in February 2016 new guidance on leases. As described below in the section “
Accounting Guidance Issued But Not Adopted as of
February 3, 2019
,” the new guidance, among other changes, will require lessees to recognize a
F-9
PVH CORP.
NOTES TO CONSOLIDATED FINANCIAL STATEMENTS - (Continued)
right-of-use asset and a lease liability in the balance sheet for most leases, but retains an expense recognition model similar to the current guidance.
The Company will adopt the new lease guidance in the first quarter of 2019.
Revenue Recognition
— Revenue is recognized upon the transfer of control of products or services to the Company’s customers in an amount that reflects the consideration to which it expects to be entitled in exchange for those products or services. Revenue from the Company’s wholesale distribution of its products is generally recognized at the time title to the goods is passed and the risk of loss is transferred to the customer. Depending on the contract terms, transfer of control is upon shipment of goods to or upon receipt of goods by the customer. Revenue from the Company’s retail distribution of its products is recognized at the point of sale in its free-standing stores and shop-in-shop/concession locations and upon estimated time of delivery for sales through the Company’s digital commerce sites, at which point control of the products passes to the customer. The amount of revenue is recognized net of estimated returns, sales allowances and discounts offered to its customers. The Company estimates returns based on an analysis of historical experience and specific customer arrangements and estimates sales allowances and other discounts based on seasonal negotiations, historical experience and an evaluation of current market conditions.
Royalty and advertising revenue from the Company’s license agreements, which are licenses of symbolic intellectual property, is recognized over time. For license agreements where the sales-based percentage fee exceeds the contractual minimum fee, the Company recognizes revenue as the licensed products are sold as reported to the Company by its licensees. For license agreements where the sales-based percentage fee does not exceed the contractual minimum fee, the Company recognizes the contractual minimum fee as revenue ratably over the contractual period.
The Company sells gift cards to customers in its retail stores. The Company does not charge administrative fees on gift cards nor do they expire. Upon the purchase of a gift card by a customer, the Company records deferred revenue for the cash value of the gift card. Deferred revenue is relieved and revenue is recognized when the gift card is redeemed by the customer. The portion of gift cards that the Company does not expect to be redeemed (referred to as “breakage”) is recognized proportionately over the estimated customer redemption period, subject to the constraint that it must be probable that a significant reversal of revenue will not occur, if the Company determines that it does not have a legal obligation to remit the value of such unredeemed gift cards to any jurisdiction. Gift card breakage was immaterial in each of the last three years.
Certain of the Company’s retail operations use sales incentive programs, such as customer loyalty programs and the issuance of coupons. The Company’s loyalty programs offer customers of its retail businesses specified amounts off of future purchases for a specified period of time after certain levels of spending are achieved. Customers that are enrolled in the programs earn loyalty points for each purchase made. For each transaction where a customer earns loyalty points, the Company allocates revenue between the products purchased and the loyalty points earned based on the relative standalone selling prices. Revenue allocated to loyalty points is recorded as deferred revenue until the loyalty points are redeemed or expire. Costs associated with coupons are recorded as a reduction of revenue at the time of coupon redemption.
The Company’s revenue recognition policy reflects changes made in 2018 following the adoption of the updated revenue recognition guidance. Please see the section “
Recently Adopted Accounting Guidance
” below for further discussion.
Cost of Goods Sold and Selling, General and Administrative Expenses
— Costs associated with the production and procurement of product are included in cost of goods sold, including inbound freight costs, purchasing and receiving costs, inspection costs and other product procurement related charges. Shipping and handling costs incurred by the Company associated with digital commerce transactions are also included in cost of goods sold, as well as the amounts recognized on foreign currency forward exchange contracts as the underlying inventory hedged by such forward exchange contracts is sold. Generally, all other expenses, excluding non-service related pension and post retirement (income) costs, interest and income taxes, are included in selling, general and administrative (“SG&A”) expenses, including warehousing and distribution expenses, as the predominant expenses associated therewith are general and administrative in nature, including rent, utilities, payroll and depreciation and amortization. Warehousing and distribution expenses, which are subject to exchange rate fluctuations, totaled $
307.7
million, $
272.6
million and $
246.5
million in
2018
,
2017
and
2016
, respectively.
Shipping and Handling Fees
— Shipping and handling fees that are billed to customers are included in net sales, with costs recorded in cost of goods sold. Shipping and handling costs that occur after control of goods has been transferred to the customer and that are not billed to the customer are accounted for as fulfillment costs in SG&A expenses.
F-10
PVH CORP.
NOTES TO CONSOLIDATED FINANCIAL STATEMENTS - (Continued)
Advertising
— Advertising costs are expensed as incurred and are included in SG&A expenses. Advertising expenses, which are subject to exchange rate fluctuations, totaled $
526.0
million,
$501.3
million and
$416.3
million in
2018
,
2017
and
2016
, respectively. Prepaid advertising expenses recorded in prepaid expenses and other assets totaled $
7.3
million and
$3.9
million at
February 3, 2019
and
February 4, 2018
, respectively. Costs associated with cooperative advertising programs, under which the Company shares the cost of a customer’s advertising expenditures, are treated as a reduction of revenue.
Sales Taxes
— The Company accounts for sales taxes and other related taxes on a net basis, excluding such taxes from revenue.
Income Taxes
— Deferred tax assets and liabilities are recognized for temporary differences between the tax bases of assets and liabilities and their reported amounts in the consolidated financial statements. Deferred tax assets and liabilities are measured using enacted tax rates expected to apply in the periods in which those temporary differences are expected to be recovered or settled. The effect on deferred tax assets and liabilities of a change in tax rates is recognized in the period that includes the enactment date. Valuation allowances are established when necessary to reduce deferred tax assets to the amounts more likely than not to be realized.
Significant judgment is required in assessing the timing and amount of deductible and taxable items, evaluating tax positions and determining the income tax provision. The Company recognizes income tax benefits only when it is more likely than not that the tax position will be fully sustained upon review by taxing authorities, including resolution of related appeals or litigation processes, if any. If the recognition threshold is met, the Company measures the tax benefit at the largest amount with a greater than
50
percent likelihood of being realized upon ultimate settlement. For tax positions that are
50
percent or less likely of being sustained upon audit, the Company does not recognize any portion of that benefit in the financial statements. When the outcome of these tax matters changes, the change in estimate impacts the provision for income taxes in the period that such a determination is made. The Company recognizes interest and penalties related to unrecognized tax benefits in the Company’s income tax provision.
The United States Tax Cuts and Jobs Act of 2017 (the “U.S. Tax Legislation”) was enacted on December 22, 2017. The U.S. Tax Legislation is comprehensive and significantly revised the United States tax code. Please see
Note 9
, “
Income Taxes
,” for further discussion of the U.S. Tax Legislation.
Financial
Instruments
— The Company has exposure to changes in foreign currency exchange rates related to anticipated cash flows primarily associated with certain international inventory purchases. The Company uses foreign currency forward exchange contracts to hedge against a portion of this exposure. The Company also has exposure to interest rate volatility related to its secured term loan facility. The Company enters into interest rate swap agreements to hedge against a portion of this exposure. The Company records the foreign currency forward exchange contracts and interest rate swap agreements at fair value in its Consolidated Balance Sheets and does not net the related assets and liabilities. The fair value of the foreign currency forward exchange contracts is measured as the total amount of currency to be purchased, multiplied by the difference between (i) the forward rate as of the period end and (ii) the settlement rate specified in each contract. The fair value of the interest rate swap agreements is based on observable interest rate yield curves and represents the expected discounted cash flows underlying the financial instruments. Changes in fair value of the foreign currency forward exchange contracts primarily associated with certain international inventory purchases and the interest rate swap agreements that are designated as effective hedging instruments (collectively referred to as “cash flow hedges”) are recorded in equity as a component of accumulated other comprehensive loss (“AOCL”). Any ineffectiveness in such cash flow hedges is immediately recognized in earnings.
The Company also has exposure to changes in foreign currency exchange rates related to the value of its investments in foreign subsidiaries denominated in a currency other than the United States dollar. To hedge against a portion of this exposure, the Company designates certain foreign currency borrowings issued in the United States as a net investment hedge of its investments in certain of its foreign subsidiaries that use a functional currency other than the United States dollar. Changes in fair value of the foreign currency borrowings designated as net investment hedges are recorded in equity as a component of AOCL. The Company evaluates the effectiveness of its net investment hedges as of the beginning of each quarter. Any ineffectiveness in such net investment hedges is immediately recognized in earnings.
The Company records immediately in earnings changes in the fair value of hedges that are not designated as effective hedging instruments (“undesignated contracts”). Undesignated contracts include all of the foreign currency forward exchange contracts related to intercompany transactions and intercompany loans that are not of a long-term investment nature. Any gains
F-11
PVH CORP.
NOTES TO CONSOLIDATED FINANCIAL STATEMENTS - (Continued)
and losses that are immediately recognized in earnings on such contracts are largely offset by the remeasurement of the underlying intercompany balances. Undesignated contracts also include foreign currency option contracts previously used by the Company to hedge against changes in foreign currency exchange rates related to the translation of the earnings of the Company’s subsidiaries that use a functional currency other than the United States dollar. The fair value of the foreign currency option contracts was estimated based on external valuation models, which used the original strike price, then current foreign currency exchange rates, the implied volatility in foreign currency exchange rates at the time and length of time to expiration as inputs. All foreign currency option contracts expired in 2017.
The Company does not use derivative or non-derivative financial instruments for trading or speculative purposes. Cash flows from the Company’s hedges are presented in the Consolidated Statements of Cash Flows in the same category as the items being hedged. Please see
Note 10
, “
Derivative Financial Instruments
,” for further discussion.
Foreign Currency Translation and Transactions
— The consolidated financial statements of the Company are prepared in United States dollars. If the functional currency of a foreign subsidiary is not the United States dollar, assets and liabilities are translated to United States dollars at the closing exchange rate in effect at the applicable balance sheet date and revenue and expenses are translated to United States dollars at the average exchange rate for the applicable period. Gains and losses on the revaluation of intercompany loans made between foreign subsidiaries that are of a long-term investment nature are included in AOCL. Gains and losses arising from transactions denominated in a currency other than the functional currency of a particular entity, not including inventory purchases, are principally included in SG&A expenses and totaled a loss (gain) of $
17.3
million, $
(10.2)
million and $
4.7
million in
2018
,
2017
and
2016
, respectively.
Balance Sheet Classification of Early Settlements of Long-Term Obligations
— The Company classifies obligations settled after the balance sheet date but prior to the issuance of the consolidated financial statements based on the contractual payment terms of the underlying agreements.
Pension and Benefit Plans
— Employee pension benefits earned during the year, as well as interest on the projected benefit obligations or accumulated benefit obligations, are accrued quarterly. The expected return on plan assets is recognized quarterly and determined by applying the expected long-term rate of return on assets to the actual fair value of plan assets adjusted for expected benefit payments, contributions and plan expenses. Actuarial gains and losses are recognized in the Company’s operating results in the year in which they occur. These gains and losses include the difference between the actual return on plan assets and the expected return that was recognized quarterly, as well as the change in the projected benefit obligation caused by actual experience and updated actuarial assumptions differing from those assumptions used to record service and interest cost throughout the year. Actuarial gains and losses are measured at least annually at the end of the Company’s fiscal year and, as such, are generally recorded during the fourth quarter of each year. The service cost component of net benefit cost is recorded in SG&A expenses and the other components of net benefit cost are recorded in non-service related pension and postretirement cost (income) in the Company’s Consolidated Income Statements. Please see
Note 12
, “
Retirement and Benefit Plans
,” for further discussion of the Company’s pension and benefit plans.
Stock-Based Compensation
—
The Company recognizes all share-based payments to employees and non-employee directors, net of actual forfeitures, as compensation expense in the consolidated financial statements based on their grant date fair values. Please see
Note 13
, “Stock-Based Compensation,” for further discussion.
Recently Adopted Accounting Guidance
— The FASB issued in May 2014 guidance that superseded most of the previous revenue recognition requirements. The core principle of the guidance is that an entity should recognize revenue to depict the transfer of promised goods or services to customers in an amount that reflects the consideration to which the entity expects to be entitled in exchange for those goods or services. New disclosures about the nature, amount, timing and uncertainty of revenue and cash flows arising from contracts with customers are also required under the new guidance.
The majority of the Company’s revenue is generated from sales of finished products, which continues to be recognized when control of the product is transferred to the customer. Under the guidance, the Company’s royalty and advertising revenue continues to be recognized over time, however, the timing of the recognition of revenue among quarters was affected for certain of the Company’s license agreements. For loyalty programs, the Company previously recorded costs associated with such programs ratably as a cost of goods sold based on enrolled customers’ spending. Under the guidance, the revenue associated with loyalty awards is deferred initially when the loyalty awards are earned, and recognized, along with the related cost of
F-12
PVH CORP.
NOTES TO CONSOLIDATED FINANCIAL STATEMENTS - (Continued)
goods sold, as the loyalty awards are redeemed or, if not redeemed, as they expire. Revenue for the unredeemed portion of gift cards, which was previously recognized when the likelihood of redemption became remote, is now recognized under the guidance proportionately over the estimated customer redemption period, subject to the constraint that it must be probable that a significant reversal of revenue will not occur. The Company adopted the guidance in the first quarter of 2018 by applying a modified retrospective approach to all contracts. As a result of the adoption, the Company recognized the cumulative effect of initially applying the guidance as a $
1.9
million decrease to opening retained earnings with offsetting increases to deferred revenue and accrued expenses of $
1.5
million and $
0.4
million, respectively. Additionally, at the time of adoption, the Company reclassified the liabilities related to loyalty awards and the unredeemed portion of gift cards of $
7.2
million and $
6.9
million, respectively, from accrued expenses to deferred revenue in the Company’s Consolidated Balance Sheet. Otherwise, the adoption of the guidance did not have a material impact on the Company’s consolidated financial statements as of and for the fiscal year ended
February 3, 2019
, including the Company’s Consolidated Income Statement and Consolidated Balance Sheet, or on any individual caption therein. Please see Note 2, “Revenue,” for further discussion.
The FASB issued in January 2016 an update to accounting guidance for the recognition and measurement of financial instruments. The update requires equity investments that are not accounted for under the equity method of accounting to be measured at fair value with changes recognized in net income and revises certain presentation and disclosure requirements. The Company adopted this update in the first quarter of 2018 and it did not have any impact on the Company’s consolidated financial statements as the Company does not currently have such investments.
The FASB issued in August 2016 an update to accounting guidance to clarify and provide specific guidance on how certain cash receipts and cash payments are classified in the statement of cash flows with the objective of reducing existing diversity in practice with respect to these items. Among the types of cash flows addressed are payments for costs related to debt prepayments or extinguishments, payments of contingent consideration after a business combination and distributions from equity method investees. The Company adopted this update in the first quarter of 2018 on a retrospective basis. As a result, contingent purchase price payments to Mr. Calvin Klein of $
55.6 million
and $
53.1 million
were reclassified from investing activities to operating activities, consistent with the current period classification under the update, and contingent purchase price payments related to the reacquisition of the rights in India to the
TOMMY HILFIGER
trademarks of $
0.8 million
and $
0.6 million
were reclassified from investing activities to financing activities in the Company’s Consolidated Statements of Cash Flows for the fiscal years ended February 4, 2018 and January 29, 2017, respectively. Otherwise, the adoption of the update did not have a material impact on the Company’s Consolidated Statements of Cash Flows, as the Company’s historical presentation of cash receipts and cash payments has been consistent with this guidance.
The FASB issued in October 2016 an update to accounting guidance to simplify income tax accounting on intercompany sales or transfers of assets other than inventory. Previous guidance required entities to defer the income tax effect of intercompany transfers of assets until the asset was sold to an outside party or otherwise recognized. The update requires companies to recognize immediately in their income statement the income tax effects of an intercompany sale or transfer of an asset other than inventory. The Company adopted this update in the first quarter of 2018 using a modified retrospective approach, resulting in a cumulative-effect adjustment to decrease opening retained earnings by $
8.0
million, with a corresponding decrease in other assets.
The FASB issued in November 2016 an update to accounting guidance to clarify and provide specific guidance on the cash flow classification and presentation of changes in restricted cash. The update requires that restricted cash be included with cash and cash equivalents when reconciling the beginning of period and end of period total amounts shown in the statement of cash flows. The Company adopted this update in the first quarter of 2018 and it did not have any impact on the Company’s Consolidated Statements of Cash Flows, as the Company does not currently have any restricted cash.
The FASB issued in January 2017 an update to accounting guidance to revise the definition of a business. The update requires that when substantially all of the fair value of the gross assets acquired (or disposed of) is concentrated in a single identifiable asset or a group of similar identifiable assets, the set of assets would not represent a business. Also, in order to be considered a business, an acquisition would have to include an input and a substantive process that together significantly contribute to the ability to produce outputs. Under the update, fewer sets of assets are expected to be considered businesses. The Company adopted this update in the first quarter of 2018. This updated guidance was applied to applicable transactions after the adoption date and did not have a material impact on the Company’s consolidated financial statements.
F-13
PVH CORP.
NOTES TO CONSOLIDATED FINANCIAL STATEMENTS - (Continued)
The FASB issued in March 2017 an update to accounting guidance to change the income statement presentation of net periodic pension and postretirement benefit cost. The update requires employers to report the service cost component of net periodic benefit cost in the same income statement line item as other compensation costs arising from services rendered by the employees during the applicable period. The other components of net periodic benefit cost are required to be presented in the income statement separately from the service component and outside a subtotal of income from operations, if one is presented. Additionally, only the service cost component of net periodic benefit cost is eligible for capitalization, when applicable. The Company adopted this update in the first quarter of 2018 on a retrospective basis. As a result, the Company reclassified $
3.0
million and $
(41.2)
million from SG&A expenses to non-service related pension and postretirement cost (income) within income before interest and taxes in the Company’s Consolidated Income Statements for the fiscal years ended February 4, 2018 and January 29, 2017, respectively. Otherwise, the adoption of the update did not have a material impact on the Company’s consolidated financial statements.
The FASB issued in January 2018 guidance related to the accounting for tax on the global intangible low-taxed income (“GILTI”) provisions of the U.S. Tax Legislation. The GILTI provisions impose a tax on foreign income in excess of a deemed return on tangible assets of foreign corporations for tax years beginning after December 31, 2017. The guidance indicates that companies must make a policy election to either record deferred taxes for basis differences expected to reverse as a result of the GILTI provisions in future years or treat any taxes on GILTI inclusions as period costs when incurred. The Company has completed its analysis of the tax effects of the GILTI provisions and has elected to account for these tax effects as period costs when incurred.
Accounting Guidance Issued But Not Adopted as of
February 3, 2019
— The FASB issued in February 2016 new guidance on leases. The new guidance, among other changes, will require lessees to recognize a right-of-use asset and a lease liability in the balance sheet for most leases, but retains an expense recognition model similar to the current guidance. The lease liability will be measured at the present value of the lease payments over the lease term. The right-of-use asset will be measured at the lease liability amount, adjusted for lease prepayments, lease incentives received and the lessee’s initial direct costs (
e.g.
, commissions). The guidance also requires additional quantitative and qualitative disclosures. The guidance will be effective for the Company in the first quarter of 2019. Entities are required to adopt the guidance using a modified retrospective approach, with the option to apply the guidance either at the beginning of the earliest period presented or at the beginning of the period in which it is adopted.
The Company formed a global, cross-functional project team to implement the new guidance and analyze its impacts. The Company has collected relevant data for all of its leases and has implemented changes needed to its policies, processes and internal controls as a result of the guidance. To facilitate the adoption and the related reporting requirements, the Company selected a global lease management and accounting software, which has been implemented globally. The Company will adopt the guidance in the first quarter of 2019 using the modified retrospective approach applied as of the period of adoption, with no restatement of prior periods, and will elect the package of practical expedients permitted under the transition guidance. Upon adoption, the Company expects to recognize right-of-use assets of approximately $
1.7
billion and lease liabilities of approximately $
1.8
billion with an immaterial adjustment to opening retained earnings in its Consolidated Balance Sheet. The Company does not expect there to be a material impact on the Company’s results of operations.
The FASB issued in August 2017 an update to accounting guidance to simplify the application of hedge accounting in certain situations and allow companies to better align their hedge accounting with their risk management activities. The update eliminates the requirement to separately measure and report hedge ineffectiveness and requires companies to recognize all elements of hedge accounting that impact earnings in the same income statement line as the hedged item. The update also simplifies the requirements for hedge documentation and effectiveness assessments and amends the presentation and disclosure requirements. The update will be effective for the Company in the first quarter of 2019. Entities are required to adopt the update using a modified retrospective approach, except for the presentation and disclosure guidance, which is required to be applied on a prospective basis. The adoption of this update is not expected to have a material impact on the Company’s consolidated financial statements.
The FASB issued in August 2018 an update to accounting guidance related to implementation costs incurred in a cloud computing arrangement that is a service contract. The update aligns the requirements for capitalizing implementation costs incurred under such arrangements with the requirements for capitalizing costs incurred to develop or obtain internal-use software. Under current accounting guidance, the Company generally expenses the implementation costs incurred in connection with a cloud computing arrangement that is a service contract. The update will be effective for the Company in the first quarter
F-14
PVH CORP.
NOTES TO CONSOLIDATED FINANCIAL STATEMENTS - (Continued)
of 2020, with early adoption permitted. Entities have the option of adopting the guidance using either a prospective or retrospective approach. The Company intends to adopt the update in the first quarter of 2019 using the prospective approach. The Company will apply the update to applicable implementation costs incurred after the adoption date and the impact on the Company’s consolidated financial statements will depend on the nature and amount of such costs.
2. REVENUE
The Company generates revenue primarily from sales of finished products under its owned and licensed trademarks through its wholesale and retail operations. The Company also generates royalty and advertising revenue from licensing the rights to its trademarks to third parties. Revenue is recognized upon the transfer of control of products or services to the Company’s customers in an amount that reflects the consideration to which it expects to be entitled in exchange for those products or services.
Product Sales
The Company generates revenue from the wholesale distribution of its products to traditional retailers (including for sale through their digital commerce sites), pure play digital commerce retailers, franchisees, licensees and distributors. Revenue is recognized upon transfer of control of goods to the customer, which generally occurs when title to goods is passed and risk of loss transfers to the customer. Depending on the contract terms, transfer of control is upon shipment of goods to or upon receipt of goods by the customer.
Payment is typically due within 30 to 90 days.
The amount of revenue recognized is net of returns, sales allowances and other discounts that the Company offers to its wholesale customers. The Company estimates returns based on an analysis of historical experience and specific customer arrangements and estimates sales allowances and other discounts based on seasonal negotiations, historical experience and an evaluation of current market conditions.
The Company also generates revenue from the retail distribution of its products through its free-standing stores, shop-in-shop/concession locations and digital commerce sites. Revenue is recognized at the point of sale in the stores and shop-in-shop/concession locations and upon estimated time of delivery for sales through the Company’s digital commerce sites, at which point control of the products passes to the customer. The amount of revenue recognized is net of returns, which are estimated based on an analysis of historical experience.
The Company excludes from revenue taxes collected from customers and remitted to government authorities related to sales of the Company’s products. Shipping and handling costs that are billed to customers are included in net sales, with costs recorded in cost of goods sold. Shipping and handling costs that occur after control of goods has been transferred to the customer and that are not billed to the customer are accounted for as fulfillment costs.
Customer Loyalty Programs
The Company uses loyalty programs that offer customers of its retail businesses specified amounts off of future purchases for a specified period of time after certain levels of spending are achieved. Customers that are enrolled in the programs earn loyalty points for each purchase made.
Loyalty points earned under the customer loyalty programs provide the customer a material right to acquire additional products and give rise to the Company having a separate performance obligation. For each transaction where a customer earns loyalty points, the Company allocates revenue between the products purchased and the loyalty points earned based on the relative standalone selling prices. Revenue allocated to loyalty points is recorded as deferred revenue until the loyalty points are redeemed or expire.
Gift Cards
The Company sells gift cards to customers in its retail stores. Gift card purchases by a customer are prepayments for products to be provided by the Company in the future and are therefore considered to be performance obligations of the Company. Upon the purchase of a gift card by a customer, the Company records deferred revenue for the cash value of the gift card. Deferred revenue is relieved and revenue is recognized when the gift card is redeemed by the customer. The portion of gift cards that the Company does not expect to be redeemed (referred to as “breakage”) is recognized proportionately over the estimated customer redemption period, subject to the constraint that it must be probable that a significant reversal of revenue
F-15
PVH CORP.
NOTES TO CONSOLIDATED FINANCIAL STATEMENTS - (Continued)
will not occur, if the Company determines that it does not have a legal obligation to remit the value of such unredeemed gift cards to any jurisdiction.
License Agreements
The Company generates royalty and advertising revenue from licensing the rights to access its trademarks to third parties, including the Company’s joint ventures. The license agreements are generally exclusive to a territory or product category, have terms in excess of one year and, in most cases, include renewal options. In exchange for providing these rights, the license agreements require the licensees to pay the Company a royalty and, in certain agreements, an advertising fee. In both cases, the Company generally receives the greater of (i) a sales-based percentage fee and (ii) a contractual minimum fee for each annual performance period under the license agreement.
In addition to the rights to access its trademarks, the Company provides ongoing support to its licensees over the term of the agreements. As such, the Company’s license agreements are licenses of symbolic intellectual property and, therefore, revenue is recognized over time. For license agreements where the sales-based percentage fee exceeds the contractual minimum fee, the Company recognizes revenues as the licensed products are sold as reported to the Company by its licensees. For license agreements where the sales-based percentage fee does not exceed the contractual minimum fee, the Company recognizes the contractual minimum fee as revenue ratably over the contractual period.
Under the terms of the license agreements, payments are generally due quarterly from the licensees. The Company records deferred revenue when amounts are received or receivable from the licensee in advance of the recognition of revenue.
As of
February 3, 2019
, the contractual minimum fees related to future periods for all license agreements totaled $
1.300
billion, of which the Company expects to recognize $
292.8
million in 2019,
$235.7
million in 2020 and $
771.8
million thereafter.
Deferred Revenue
Changes in deferred revenue related to customer loyalty programs, gift cards and license agreements for the year ended
February 3, 2019
were as follows:
|
(In millions)
|
2018
|
||
|
Deferred revenue balance at February 4, 2018
|
$
|
39.2
|
|
|
Impact of adopting the new revenue standard
(1)
|
15.6
|
|
|
|
Net additions to deferred revenue during the period
|
61.3
|
|
|
|
Reductions in deferred revenue for revenue recognized during the period
(2)
|
(50.8
|
)
|
|
|
Deferred revenue balance at February 3, 2019
|
$
|
65.3
|
|
(1)
Please see Note 1, “Summary of Significant Accounting Policies,” for further discussion of the adoption of the new revenue standard.
(2)
Represents the amount of revenue recognized during the period that was included in the deferred revenue balance at February 4, 2018, as adjusted for the impact of adopting the new revenue standard, and does not contemplate revenue recognized from amounts deferred after February 4, 2018.
The Company also had long-term deferred revenue liabilities included in other liabilities in its Consolidated Balance Sheets of $
2.3
million and $
3.9
million as of
February 3, 2019
and
February 4, 2018
, respectively.
F-16
PVH CORP.
NOTES TO CONSOLIDATED FINANCIAL STATEMENTS - (Continued)
Optional Exemptions
The Company elected not to disclose the remaining performance obligations for contracts that have an original expected term of one year or less (
e.g.
, backlog of customer orders) and expected sales-based percentage fees for the portion of all license agreements not yet satisfied.
Please see
Note 20
, “
Segment Data
,” for information on the disaggregation of revenue by segment and distribution channel.
3. ACQUISITIONS
Acquisition of the
Geoffrey Beene
Tradename
The Company acquired on April 20, 2018 the
Geoffrey Beene
tradename from Geoffrey Beene, LLC (“Geoffrey Beene”). Prior to the acquisition, the Company had licensed the rights to design, market and distribute
Geoffrey Beene
dress shirts and neckwear from Geoffrey Beene.
The tradename was acquired for $
17.0
million, consisting of $
15.9
million paid in cash, $
0.7
million of royalties prepaid to Geoffrey Beene by the Company under the license agreement, and $
0.4
million of liabilities assumed by the Company. The transaction was accounted for as an asset acquisition.
Acquisition of the Wholesale and Concessions Businesses in Belgium and Luxembourg
The Company acquired on September 1, 2017 the Tommy Hilfiger and Calvin Klein wholesale and concessions businesses in Belgium and Luxembourg from a former agent (the “Belgian acquisition”). As a result of the Belgian acquisition, the Company now operates directly the Tommy Hilfiger and Calvin Klein businesses in this region.
The acquisition date fair value of the consideration paid was $
12.0
million. The estimated fair value of assets acquired and liabilities assumed consisted of $
12.4
million of goodwill and $
0.4
million of other net liabilities. The goodwill of $
12.4
million was assigned as of the acquisition date to the Company’s Tommy Hilfiger International and Calvin Klein International segments in the amounts of $
11.1
million and $
1.3
million, respectively, which are the Company’s reporting units that are expected to benefit from the synergies of the combination. Goodwill is not deductible for tax purposes. The Company finalized the purchase price allocation in 2018.
Acquisition of True & Co.
The Company acquired on March 30, 2017 True & Co., a direct-to-consumer intimate apparel digital commerce retailer. This acquisition enabled the Company to participate further in the fast-growing online channel and provided a platform to increase innovation, data-driven decisions and speed in the way it serves its consumers across its channels of distribution.
The acquisition date fair value of the consideration paid was $
28.5
million. The estimated fair value of assets acquired and liabilities assumed consisted of $
20.9
million of goodwill and $
7.6
million of other net assets (including $
7.3
million of deferred tax assets and $
0.4
million of cash acquired). The goodwill of $
20.9
million was assigned as of the acquisition date to the Company’s Calvin Klein North America, Calvin Klein International and Heritage Brands Wholesale segments in the amounts of $
5.4
million, $
4.8
million and $
10.7
million, respectively, which include the Company’s reporting units that are expected to benefit from the synergies of the combination. For those reporting units that had not been assigned any of the assets acquired or liabilities assumed in the acquisition, the amount of goodwill assigned was determined by calculating the estimated fair value of such reporting units before and after the acquisition. Goodwill is not deductible for tax purposes. The Company finalized the purchase price allocation in 2017.
Acquisition of TH China
The Company acquired on April 13, 2016 the
55%
of the ownership interests in TH Asia, Ltd. (“TH China”), its former joint venture for
TOMMY HILFIGER
in China, that it did not already own (the “TH China acquisition”). Prior to April 13, 2016, the Company accounted for its
45%
interest in TH China under the equity method of accounting. Since the completion of the TH China acquisition, the results of TH China’s operations have been consolidated in the Company’s consolidated financial
F-17
PVH CORP.
NOTES TO CONSOLIDATED FINANCIAL STATEMENTS - (Continued)
statements. As a result of the TH China acquisition, the Company now operates directly the Tommy Hilfiger business in this market.
TH China began operating the Tommy Hilfiger wholesale and retail distribution businesses in China in 2011 and held a license from a subsidiary of the Company for the
TOMMY HILFIGER
trademarks for use in connection with these businesses.
The carrying value of the Company’s
45%
interest in TH China prior to the acquisition was $
52.5
million. In connection with the acquisition, this investment was remeasured to a fair value of $
205.6
million, resulting in the recognition during 2016 of a pre-tax noncash gain of $
153.1
million. Such fair value was estimated using future operating cash flow projections that were discounted at a rate of
14.4%
, which accounted for the relative risks of the estimated future cash flows. Such fair value also included an estimated discount for a lack of marketability of
10.0%
. The Company classified this as a Level 3 fair value measurement due to the use of these significant unobservable inputs.
The acquisition date fair value of the consideration for the
55%
interest that the Company did not already own was $
265.8
million, consisting of $
263.0
million paid in cash and the elimination of a $
2.8
million pre-acquisition receivable owed to the Company by TH China. The total fair value of TH China (at
100%
) was $
471.4
million. The estimated fair value of assets acquired and liabilities assumed consisted of $
258.6
million of goodwill, $
110.6
million of other intangible assets and $
102.2
million of other net assets (including $
105.3
million of cash acquired). The goodwill of $
258.6
million was assigned as of the acquisition date to the Company’s Tommy Hilfiger International segment. Goodwill is not deductible for tax purposes. The other intangible assets of $
110.6
million consisted of reacquired license rights of $
72.0
million, order backlog of $
26.2
million and customer relationships of $
12.4
million. The Company finalized the purchase price allocation during 2016.
4. PROPERTY, PLANT AND EQUIPMENT
Property, plant and equipment, at cost, was as follows:
|
(In millions)
|
2018
|
2017
|
|||||
|
Land
|
$
|
1.0
|
|
$
|
1.0
|
|
|
|
Buildings and building improvements
|
54.8
|
|
55.3
|
|
|||
|
Machinery, software and equipment
|
697.6
|
|
609.5
|
|
|||
|
Furniture and fixtures
|
540.0
|
|
494.9
|
|
|||
|
Shop-in-shops
|
230.9
|
|
208.6
|
|
|||
|
Leasehold improvements
|
790.3
|
|
724.5
|
|
|||
|
Construction in progress
|
83.9
|
|
35.9
|
|
|||
|
Property, plant and equipment, gross
|
2,398.5
|
|
2,129.7
|
|
|||
|
Less: Accumulated depreciation
|
(1,414.0
|
)
|
(1,229.9
|
)
|
|||
|
Property, plant and equipment, net
|
$
|
984.5
|
|
$
|
899.8
|
|
|
Construction in progress at
February 3, 2019
and
February 4, 2018
represents costs incurred for machinery, software and equipment, furniture and fixtures, and leasehold improvements not yet placed in use. Construction in progress at
February 3, 2019
and
February 4, 2018
principally related to upgrades and enhancements to operating, supply chain and logistics systems. Interest costs capitalized in construction in progress were immaterial during
2018
,
2017
and
2016
.
5. INVESTMENTS IN UNCONSOLIDATED AFFILIATES
Included in other assets in the Company’s Consolidated Balance Sheets was $
207.1
million as of
February 3, 2019
and $
208.4
million as of
February 4, 2018
related to the following investments in unconsolidated affiliates:
PVH Australia
The Company owns a
50%
economic interest in a joint venture, PVH Brands Australia Pty. Limited (“PVH Australia”). PVH Australia licenses from subsidiaries of the Company the rights to distribute and sell certain
TOMMY HILFIGER
,
CALVIN KLEIN
and
Van Heusen
brand products in Australia, New Zealand and, in the cases of
TOMMY HILFIGER
and
CALVIN
F-18
PVH CORP.
NOTES TO CONSOLIDATED FINANCIAL STATEMENTS - (Continued)
KLEIN
, other island nations in the South Pacific. Additionally, subsidiaries of PVH Australia sell apparel and related products under other owned and licensed trademarks. This investment is being accounted for under the equity method of accounting.
The Company received dividends of $
6.3
million, $
3.1
million and $
1.5
million from PVH Australia during
2018
,
2017
and
2016
, respectively.
Gazal
The Company acquired approximately
10%
of the outstanding capital stock of Gazal Corporation Limited (“Gazal”), which is listed on the Australian Securities Exchange, in 2016 for $
9.2
million. The Company acquired additional capital stock of Gazal for $
7.5
million in 2017. The Company’s current ownership interest in Gazal is approximately
22%
. The Company is deemed to have significant influence with respect to this investment, which is being accounted for under the equity method of accounting. Gazal is the Company’s joint venture partner in PVH Australia.
The Company received dividends of $
1.3
million and $
0.6
million from Gazal during
2018
and
2017
, respectively.
CK India
The Company acquired a
51%
economic interest in a joint venture, Calvin Klein Arvind Fashion Private Limited (“CK India”) in 2013. The Company sold
1%
of its interest for $
0.4
million in 2017, decreasing its economic interest in CK India to
50%
.
Prior to the sale, the Company was not deemed to hold a controlling interest in CK India as the shareholders agreement provided the partners with equal rights. This investment is being accounted for under the equity method of accounting. CK India licenses from a subsidiary of the Company the rights to the
CALVIN KLEIN
trademarks in India for certain product categories.
The Company made payments of $
1.6
million and $
1.5
million to CK India during
2017
and
2016
, respectively, to contribute its share of the joint venture funding.
TH India
The Company owns a
50%
economic interest in a joint venture, Tommy Hilfiger Arvind Fashion Private Limited (“TH India”). TH India licenses from a subsidiary of the Company the rights to the
TOMMY HILFIGER
trademarks in India for certain product categories. This investment is being accounted for under the equity method of accounting. Arvind, the Company’s joint venture partner in PVH Ethiopia and CK India, is also the Company’s joint venture partner in TH India.
The Company made payments of $
2.7
million to TH India during 2017 to contribute its share of the joint venture funding.
TH Brazil
The Company acquired a
40%
economic interest in a joint venture, Tommy Hilfiger do Brasil S.A. (“TH Brazil”) in 2012. The Company acquired an approximately
1%
additional interest for $
0.3
million in 2017, increasing its economic interest in TH Brazil to approximately
41%
. TH Brazil licenses from a subsidiary of the Company the rights to the
TOMMY HILFIGER
trademarks in Brazil for certain product categories. This investment is being accounted for under the equity method of accounting.
The Company made payments of $
2.5
million and $
1.5
million to TH Brazil during
2017
and
2016
, respectively, to contribute its share of the joint venture funding.
The Company issued a note receivable to TH Brazil in 2016 for $
12.5
million, of which $
6.2
million was repaid in 2016 and the remaining balance, including accrued interest, was repaid in 2017.
PVH Mexico
The Company and Grupo Axo, S.A.P.I. de C.V. (“Grupo Axo”) formed a joint venture (“PVH Mexico”) in 2016, in which the Company owns a
49%
economic interest. PVH Mexico licenses from certain wholly owned subsidiaries of the Company the
F-19
PVH CORP.
NOTES TO CONSOLIDATED FINANCIAL STATEMENTS - (Continued)
rights to distribute and sell certain
TOMMY HILFIGER
,
CALVIN KLEIN
,
Warner’s
,
Olga
and
Speedo
brand products in Mexico. PVH Mexico was formed by merging the Company’s wholly owned subsidiary that principally operated and managed the Calvin Klein business in Mexico (the “Mexico business”) with a wholly owned subsidiary of Grupo Axo that distributes certain
TOMMY HILFIGER
brand products in Mexico. In connection with the formation of PVH Mexico, the Company deconsolidated the Mexico business (the “Mexico deconsolidation”) and began accounting for its
49%
interest under the equity method of accounting in 2016.
In connection with the Mexico deconsolidation, the Company recorded a pre-tax noncash loss of $
81.8
million in 2016 (including $
56.7
million related to foreign currency translation adjustment losses previously recorded in AOCL) to write down the net assets of the Mexico business to fair value. The loss was included in other noncash gain, net in the Company’s Consolidated Income Statement for 2016. The fair value of the net assets of $
64.3
million was estimated as the fair value of the
49%
interest in PVH Mexico that the Company acquired upon its formation, based on future operating cash flow projections that were discounted at a rate of
15.0%
, which accounted for the relative risks of the estimated future cash flows. Such fair value also included an estimated discount for a lack of marketability of
10.0%
. The Company classified this as a Level 3 fair value measurement due to the use of these significant unobservable inputs.
The Company made payments of $
7.3
million to PVH Mexico during 2016 to contribute its share of the joint venture funding.
Karl Lagerfeld
The Company owns an economic interest of approximately
8%
in Karl Lagerfeld Holding B.V. (“Karl Lagerfeld”). The Company is deemed to have significant influence with respect to this investment, which is being accounted for under the equity method of accounting.
6. REDEEMABLE NON-CONTROLLING INTEREST
The Company and Arvind formed PVH Ethiopia, in which the Company owns a
75%
interest, during 2016. The Company consolidates PVH Ethiopia in its consolidated financial statements. PVH Ethiopia was formed to operate a manufacturing facility that produces finished products for the Company for distribution primarily in the United States. The manufacturing facility began operations in 2017.
The shareholders agreement governing PVH Ethiopia (the “Shareholders Agreement”) contains a put option under which Arvind can require the Company to purchase all of its shares in the joint venture during various future periods as specified in the Shareholders Agreement. The first such period immediately precedes the ninth anniversary of the date of incorporation of PVH Ethiopia. The Shareholders Agreement also contains call options under which the Company can require Arvind to sell to the Company (i) all or a portion of its shares during various future periods as specified in the Shareholders Agreement; (ii) all of its shares in the event of a change of control of Arvind; or (iii) all of its shares in the event that Arvind ceases to hold at least
10%
of the outstanding shares. The Company’s first call option referred to in clause (i) immediately follows the fifth anniversary of the date of incorporation of PVH Ethiopia. The put and call prices are the fair market value of the shares on the redemption date based upon a multiple of PVH Ethiopia’s earnings before interest, taxes, depreciation and amortization for the prior 12 months, less PVH Ethiopia’s net debt.
The fair value of the redeemable non-controlling interest (“RNCI”) as of the date of formation of PVH Ethiopia was $
0.1
million. The carrying amount of the RNCI is adjusted to equal the redemption amount at the end of each reporting period, provided that this amount at the end of each reporting period cannot be lower than the initial fair value adjusted for the minority shareholder’s share of net income or loss. Any adjustment to the redemption amount of the RNCI is determined after attribution of net income or loss of the RNCI and will be recognized immediately in retained earnings of the Company, since it is probable that the RNCI will become redeemable in the future based on the passage of time. The carrying amount of the RNCI, which is also its fair value, decreased to $
0.2
million as of
February 3, 2019
from $
2.0
million as of
February 4, 2018
, resulting from a net loss attributable to the RNCI for 2018 of $
1.8
million.
F-20
PVH CORP.
NOTES TO CONSOLIDATED FINANCIAL STATEMENTS - (Continued)
7. GOODWILL AND OTHER INTANGIBLE ASSETS
The changes in the carrying amount of goodwill, by segment (please see
Note 20
, “
Segment Data
,” for further discussion of the Company’s reportable segments), were as follows:
|
(In millions)
|
Calvin Klein North America
|
Calvin Klein International
|
Tommy Hilfiger North America
|
Tommy Hilfiger International
|
Heritage Brands Wholesale
|
Heritage Brands Retail
|
Total
|
||||||||||||||||||||
|
Balance as of January 29, 2017
|
|||||||||||||||||||||||||||
|
Goodwill, gross
|
$
|
739.4
|
|
$
|
864.5
|
|
$
|
204.4
|
|
$
|
1,425.8
|
|
$
|
235.8
|
|
$
|
11.9
|
|
$
|
3,481.8
|
|
||||||
|
Accumulated impairment losses
|
—
|
|
—
|
|
—
|
|
—
|
|
—
|
|
(11.9
|
)
|
(11.9
|
)
|
|||||||||||||
|
Goodwill, net
|
739.4
|
|
864.5
|
|
204.4
|
|
1,425.8
|
|
235.8
|
|
—
|
|
3,469.9
|
|
|||||||||||||
|
Contingent purchase price payments to Mr. Calvin Klein
|
34.2
|
|
23.1
|
|
—
|
|
—
|
|
—
|
|
—
|
|
57.3
|
|
|||||||||||||
|
True & Co. acquisition
|
5.4
|
|
4.8
|
|
—
|
|
—
|
|
10.7
|
|
—
|
|
20.9
|
|
|||||||||||||
|
Belgian acquisition
|
—
|
|
1.3
|
|
—
|
|
11.1
|
|
—
|
|
—
|
|
12.4
|
|
|||||||||||||
|
Currency translation
|
1.2
|
|
48.3
|
|
—
|
|
224.7
|
|
—
|
|
—
|
|
274.2
|
|
|||||||||||||
|
Balance as of February 4, 2018
|
|||||||||||||||||||||||||||
|
Goodwill, gross
|
780.2
|
|
942.0
|
|
204.4
|
|
1,661.6
|
|
246.5
|
|
11.9
|
|
3,846.6
|
|
|||||||||||||
|
Accumulated impairment losses
|
—
|
|
—
|
|
—
|
|
—
|
|
—
|
|
(11.9
|
)
|
(11.9
|
)
|
|||||||||||||
|
Goodwill, net
|
780.2
|
|
942.0
|
|
204.4
|
|
1,661.6
|
|
246.5
|
|
—
|
|
3,834.7
|
|
|||||||||||||
|
Contingent purchase price payments to Mr. Calvin Klein
|
1.0
|
|
0.7
|
|
—
|
|
—
|
|
—
|
|
—
|
|
1.7
|
|
|||||||||||||
|
Currency translation
|
(0.9
|
)
|
(33.2
|
)
|
—
|
|
(131.8
|
)
|
—
|
|
—
|
|
(165.9
|
)
|
|||||||||||||
|
Balance as of February 3, 2019
|
|||||||||||||||||||||||||||
|
Goodwill, gross
|
780.3
|
|
909.5
|
|
204.4
|
|
1,529.8
|
|
246.5
|
|
11.9
|
|
3,682.4
|
|
|||||||||||||
|
Accumulated impairment losses
|
—
|
|
—
|
|
—
|
|
—
|
|
—
|
|
(11.9
|
)
|
(11.9
|
)
|
|||||||||||||
|
Goodwill, net
|
$
|
780.3
|
|
$
|
909.5
|
|
$
|
204.4
|
|
$
|
1,529.8
|
|
$
|
246.5
|
|
$
|
—
|
|
$
|
3,670.5
|
|
||||||
The Company was required to make contingent purchase price payments to Mr. Calvin Klein in connection with the Company’s acquisition of all of the issued and outstanding stock of Calvin Klein, Inc. and certain affiliated companies. Such payments were based on
1.15%
of total worldwide net sales, as defined in the acquisition agreement (as amended), of products bearing any of the
CALVIN KLEIN
brands and were required to be made with respect to sales made through February 12, 2018. A significant portion of the sales on which the payments to Mr. Klein were made were wholesale sales by the Company and its licensees and other partners to retailers. All payments due to Mr. Klein under the agreement have been made. All payments are subject to audit, as per the terms of the acquisition agreement.
F-21
PVH CORP.
NOTES TO CONSOLIDATED FINANCIAL STATEMENTS - (Continued)
The Company’s other intangible assets consisted of the following:
|
|
2018
|
2017
|
|||||||||||||||||||||
|
(In millions)
|
Gross
Carrying
Amount
|
Accumulated
Amortization
|
Net
|
Gross
Carrying
Amount
|
Accumulated
Amortization
|
Net
|
|||||||||||||||||
|
Intangible assets subject to amortization:
|
|||||||||||||||||||||||
|
Customer relationships
|
$
|
307.4
|
|
$
|
(186.1
|
)
|
$
|
121.3
|
|
$
|
324.7
|
|
$
|
(169.4
|
)
|
$
|
155.3
|
|
|||||
|
Reacquired license rights
|
523.8
|
|
(154.4
|
)
|
369.4
|
|
550.7
|
|
(124.4
|
)
|
426.3
|
|
|||||||||||
|
Total intangible assets subject to amortization
|
831.2
|
|
(340.5
|
)
|
490.7
|
|
875.4
|
|
(293.8
|
)
|
581.6
|
|
|||||||||||
|
Indefinite-lived intangible assets:
|
|||||||||||||||||||||||
|
Tradenames
|
2,863.7
|
|
—
|
|
2,863.7
|
|
2,928.4
|
|
—
|
|
2,928.4
|
|
|||||||||||
|
Perpetual license rights
|
203.8
|
|
—
|
|
203.8
|
|
204.7
|
|
—
|
|
204.7
|
|
|||||||||||
|
Reacquired perpetual license rights
|
11.0
|
|
—
|
|
11.0
|
|
11.9
|
|
—
|
|
11.9
|
|
|||||||||||
|
Total indefinite-lived intangible assets
|
3,078.5
|
|
—
|
|
3,078.5
|
|
3,145.0
|
|
—
|
|
3,145.0
|
|
|||||||||||
|
Total other intangible assets
|
$
|
3,909.7
|
|
$
|
(340.5
|
)
|
$
|
3,569.2
|
|
$
|
4,020.4
|
|
$
|
(293.8
|
)
|
$
|
3,726.6
|
|
|||||
The gross carrying amount and accumulated amortization of certain intangible assets include the impact of changes in foreign currency exchange rates.
Amortization expense related to the Company’s intangible assets subject to amortization was $
62.8
million and
$65.0
million for
2018
and
2017
, respectively.
Assuming constant foreign currency exchange rates and no change in the gross carrying amount of the intangible assets, amortization expense for the next five years related to the Company’s intangible assets subject to amortization as of
February 3, 2019
is expected to be as follows:
|
(In millions)
|
||||
|
Fiscal Year
|
Amount
|
|||
|
2019
|
$
|
39.0
|
|
|
|
2020
|
39.0
|
|
||
|
2021
|
38.7
|
|
||
|
2022
|
36.5
|
|
||
|
2023
|
23.3
|
|
||
8. DEBT
Short-Term Borrowings
The Company has the ability to draw revolving borrowings under its senior secured credit facilities, as discussed in the section entitled “2016 Senior Secured Credit Facilities” below. The Company had $
7.8
million outstanding under these facilities as of
February 3, 2019
. The weighted average interest rate on funds borrowed as of
February 3, 2019
was
4.45%
. The maximum amount of revolving borrowings outstanding under these facilities during
2018
was $
274.4
million. The Company had no borrowings outstanding under these facilities as of
February 4, 2018
.
Additionally, the Company has the availability to borrow under short-term lines of credit, overdraft facilities and short-term revolving credit facilities denominated in various foreign currencies. These facilities provided for borrowings of up to
F-22
PVH CORP.
NOTES TO CONSOLIDATED FINANCIAL STATEMENTS - (Continued)
$
101.9
million based on exchange rates in effect on
February 3, 2019
and are utilized primarily to fund working capital needs. The Company had $
5.1
million and $
19.5
million outstanding under these facilities as of
February 3, 2019
and
February 4, 2018
, respectively. The weighted average interest rate on funds borrowed as of
February 3, 2019
and
February 4, 2018
was
0.21
% and
1.19
%, respectively. The maximum amount of borrowings outstanding under these facilities during
2018
was $
38.6
million.
Long-Term Debt
The carrying amounts of the Company’s long-term debt were as follows:
|
(In millions)
|
2018
|
2017
|
|||||
|
Senior secured Term Loan A facility due 2021
|
$
|
1,643.8
|
|
$
|
1,792.1
|
|
|
|
7 3/4% debentures due 2023
|
99.6
|
|
99.5
|
|
|||
|
3 5/8% senior unsecured euro notes due 2024
(1)
|
396.5
|
|
430.8
|
|
|||
|
3 1/8% senior unsecured euro notes due 2027
(1)
|
679.5
|
|
738.9
|
|
|||
|
Total
|
2,819.4
|
|
3,061.3
|
|
|||
|
Less: Current portion of long-term debt
|
—
|
|
—
|
|
|||
|
Long-term debt
|
$
|
2,819.4
|
|
$
|
3,061.3
|
|
|
|
(1)
|
The carrying amount of the Company’s senior unsecured euro notes includes the impact of changes in the exchange rate of the United States dollar against the euro.
|
Please see
Note 11
, “
Fair Value Measurements
,” for the fair value of the Company’s long-term debt as of
February 3, 2019
and
February 4, 2018
.
As of
February 3, 2019
, the Company’s mandatory long-term debt repayments for the next five years were as follows:
|
(In millions)
|
|||
|
Fiscal Year
|
Amount
|
||
|
2019
|
$
|
—
|
|
|
2020
|
123.5
|
|
|
|
2021
|
1,525.8
|
|
|
|
2022
|
—
|
|
|
|
2023
|
100.0
|
|
|
Total debt repayments for the next five years exceed the total carrying amount of the Company’s Term Loan A facility and 7 3/4% debentures due 2023 as of
February 3, 2019
because the carrying amount reflects the unamortized portions of debt issuance costs and the original issue discounts.
As of
February 3, 2019
, after taking into account the effect of the Company’s interest rate swap agreements discussed in the section entitled “2016 Senior Secured Credit Facilities,” which were in effect as of such date, approximately
50
% of the Company’s long-term debt had fixed interest rates, with the remainder at variable interest rates.
2016 Senior Secured Credit Facilities
The Company has senior secured credit facilities due May 19, 2021 (the “2016 facilities”) that consist of a $
2,347.4
million United States dollar-denominated Term Loan A facility and senior secured revolving credit facilities consisting of (i) a $
475.0
million United States dollar-denominated revolving credit facility, (ii) a $
25.0
million United States dollar-denominated revolving credit facility available in United States dollars and Canadian dollars and (iii) a €
185.9
million euro-denominated revolving credit facility available in euro, British pound sterling, Japanese yen and Swiss francs.
F-23
PVH CORP.
NOTES TO CONSOLIDATED FINANCIAL STATEMENTS - (Continued)
The senior secured revolving credit facilities also include amounts available for letters of credit. A portion of each of the United States dollar-denominated revolving credit facilities is also available for the making of swingline loans. The issuance of such letters of credit and the making of any swingline loan reduces the amount available under the applicable revolving credit facility. So long as certain conditions are satisfied, the Company may add one or more term loan facilities or increase the commitments under the senior secured revolving credit facilities by an aggregate amount not to exceed the sum of (1) the sum of (x)
$1,350.0
million plus (y) the aggregate amount of all voluntary prepayments of loans under the Term Loan A and the senior secured revolving credit facilities (to the extent, in the case of voluntary prepayments of loans under the senior secured revolving credit facilities, there is an equivalent permanent reduction of the revolving commitments) plus (z) an amount equal to the aggregate revolving commitments of any defaulting lender (to the extent the commitments with respect thereto have been terminated) and (2) an additional unlimited amount as long as the ratio of the Company’s senior secured net debt to consolidated adjusted earnings before interest, taxes, depreciation and amortization (in each case calculated as set forth in the documentation relating to the 2016 facilities) would not exceed 3 to 1 after giving pro forma effect to the incurrence of such increase. The lenders under the 2016 facilities are not required to provide commitments with respect to such additional facilities or increased commitments.
The Company had prior senior secured credit facilities (the “2014 facilities”) that were amended by the 2016 facilities on May 19, 2016 (the “Amendment Date”). Among other things, this amendment provided for (i) the Company to borrow an additional $
582.0
million principal amount of loans under the Term Loan A facility, (ii) the repayment of all outstanding loans under the previously outstanding Term Loan B facility with the proceeds of the additional loans under the Term Loan A facility, and (iii) the termination of the Term Loan B facility. The Company paid debt issuance costs of $
10.9
million (of which $
4.6
million was expensed as debt modification costs and $
6.3
million is being amortized over the term of the related debt agreement) and recorded debt extinguishment costs of $
11.2
million to write-off previously capitalized debt issuance costs.
The Company had loans outstanding of $
1,643.8
million, net of original issue discounts and debt issuance costs, under the Term Loan A facility, $
7.8
million of borrowings outstanding under the senior secured revolving credit facilities and $
20.4
million of outstanding letters of credit under the senior secured revolving credit facilities as of
February 3, 2019
.
The terms of the Term Loan A facility require the Company to make quarterly repayments of amounts outstanding under the 2016 facilities, which commenced with the calendar quarter ended June 30, 2016. Such amounts equal
5.00%
per annum of the principal amount outstanding on the Amendment Date for the first eight calendar quarters following the Amendment Date,
7.50%
per annum of the principal amount for the four calendar quarters thereafter and
10.00%
per annum of the principal amount for the remaining calendar quarters, in each case paid in equal installments and in each case subject to certain customary adjustments, with the balance due on the maturity date of the Term Loan A facility.
The Company made payments of $
150.0
million, $
250.0
million and $
350.0
million during
2018
,
2017
and
2016
, respectively, on its term loans under the 2016 facilities and 2014 facilities. As a result of the voluntary repayments the Company has made to date, it is not required to make a long-term debt repayment until June 2020.
The Company’s obligations under the 2016 facilities are guaranteed by substantially all of its existing and future direct and indirect United States subsidiaries, with certain exceptions. Obligations of the European borrower, PVH B.V., under the 2016 facilities are guaranteed by the Company, substantially all of the Company’s existing and future direct and indirect United States subsidiaries (with certain exceptions) and Tommy Hilfiger Europe B.V., one of the Company’s wholly owned subsidiaries. The Company and its United States subsidiary guarantors have pledged certain of their assets as security for the obligations under the 2016 facilities.
The outstanding borrowings under the 2016 facilities are prepayable at any time without penalty (other than customary breakage costs). The terms of the 2016 facilities require the Company to repay certain amounts outstanding thereunder with (a) net cash proceeds of the incurrence of certain indebtedness, (b) net cash proceeds of certain asset sales or other dispositions (including as a result of casualty or condemnation) that exceed certain thresholds, to the extent such proceeds are not reinvested or committed to be reinvested in the business in accordance with customary reinvestment provisions, and (c) a percentage of excess cash flow that exceeds the voluntary debt payments the Company has made during the applicable year, which percentage is based upon its net leverage ratio during the relevant fiscal period.
The United States dollar-denominated borrowings under the 2016 facilities bear interest at a rate equal to an applicable margin plus, as determined at the Company’s option, either (a) a base rate determined by reference to the greater of (i) the prime
F-24
PVH CORP.
NOTES TO CONSOLIDATED FINANCIAL STATEMENTS - (Continued)
rate, (ii) the United States federal funds rate plus 1/2 of
1.00%
and (iii) a one-month adjusted Eurocurrency rate plus
1.00%
or (b) an adjusted Eurocurrency rate, calculated in a manner set forth in the 2016 facilities.
The Canadian dollar-denominated borrowings under the 2016 facilities bear interest at a rate equal to an applicable margin plus, as determined at the Company’s option, either (a) a Canadian prime rate determined by reference to the greater of (i) the rate of interest per annum that Royal Bank of Canada establishes as the reference rate of interest in order to determine interest rates for loans in Canadian dollars to its Canadian borrowers and (ii) the sum of (x) the average of the rates per annum for Canadian dollar bankers’ acceptances having a term of one month and (y)
0.75%
, or (b) an adjusted Eurocurrency rate, calculated in a manner set forth in the 2016 facilities.
The borrowings under the 2016 facilities in currencies other than United States dollars or Canadian dollars bear interest at a rate equal to an applicable margin plus an adjusted Eurocurrency rate, calculated in a manner set forth in the 2016 facilities.
The current applicable margin with respect to the Term Loan A facility and each revolving credit facility is
1.50
% for adjusted Eurocurrency rate loans and
0.50
% for base rate loans, respectively. After the date of delivery of the compliance certificate and financial statements with respect to each of the Company’s fiscal quarters, the applicable margin for borrowings under the Term Loan A facility and the revolving credit facilities is subject to adjustment based upon the Company’s net leverage ratio.
The Company entered into interest rate swap agreements designed with the intended effect of converting notional amounts of its variable rate debt obligation to fixed rate debt. Under the terms of the agreements, for the outstanding notional amount, the Company’s exposure to fluctuations in the one-month London interbank offered rate (“LIBOR”) is eliminated and the Company pays a fixed rate plus the current applicable margin. The following interest rate swap agreements were entered into or in effect during 2018, 2017 and 2016:
|
(In millions)
|
||||||||||||||
|
Designation Date
|
Commencement Date
|
Initial Notional Amount
|
Notional Amount Outstanding as of February 3, 2019
|
Fixed Rate
|
Expiration Date
|
|||||||||
|
January 2019
|
February 2020
|
$
|
50.0
|
|
$
|
—
|
|
2.4187%
|
February 2021
|
|||||
|
November 2018
|
February 2019
|
139.2
|
|
—
|
|
2.8645%
|
February 2021
|
|||||||
|
October 2018
|
February 2019
|
115.7
|
|
—
|
|
2.9975%
|
February 2021
|
|||||||
|
June 2018
|
August 2018
|
50.0
|
|
50.0
|
|
2.6825%
|
February 2021
|
|||||||
|
June 2017
|
February 2018
|
306.5
|
|
181.5
|
|
1.566%
|
February 2020
|
|||||||
|
July 2014
|
February 2016
|
682.6
|
|
—
|
|
1.924%
|
February 2018
|
|||||||
The notional amounts of the outstanding interest rate swap that commenced in February 2018 and the interest rate swaps that will commence in February 2019 will be adjusted according to pre-set schedules during the terms of the swap agreements such that, based on the Company’s projections for future debt repayments, the Company’s outstanding debt under the 2016 facilities is expected to always equal or exceed the combined notional amount of the then-outstanding interest rate swaps.
The 2016 facilities contain customary events of default, including but not limited to nonpayment; material inaccuracy of representations and warranties; violations of covenants; certain bankruptcies and liquidations; cross-default to material indebtedness; certain material judgments; certain events related to the Employee Retirement Income Security Act of 1974, as amended; certain events related to certain of the guarantees by the Company and certain of its subsidiaries, and certain pledges of the Company’s assets and those of certain of the Company’s subsidiaries, as security for the obligations under the 2016 facilities; and a change in control (as defined in the 2016 facilities).
F-25
PVH CORP.
NOTES TO CONSOLIDATED FINANCIAL STATEMENTS - (Continued)
The 2016 facilities also contain covenants that restrict the Company’s ability to finance future operations or capital needs, to take advantage of other business opportunities that may be in its interest or to satisfy its obligations under its other outstanding debt. These covenants restrict its ability to, among other things:
|
•
|
incur or guarantee additional debt or extend credit;
|
|
•
|
make restricted payments, including paying dividends or making distributions on, or redeeming or repurchasing, the Company’s capital stock or certain debt;
|
|
•
|
make acquisitions and investments;
|
|
•
|
dispose of assets;
|
|
•
|
engage in transactions with affiliates;
|
|
•
|
enter into agreements restricting the Company’s subsidiaries’ ability to pay dividends;
|
|
•
|
create liens on the Company’s assets or engage in sale/leaseback transactions; and
|
|
•
|
effect a consolidation or merger, or sell, transfer, or lease all or substantially all of the Company’s assets.
|
The 2016 facilities require the Company to comply with certain financial covenants, including minimum interest coverage and maximum net leverage. A breach of any of these operating or financial covenants would result in a default under the 2016 facilities. If an event of default occurs and is continuing, the lenders could elect to declare all amounts then outstanding, together with accrued interest, to be immediately due and payable, which would result in acceleration of its other debt. If the Company were unable to repay any such borrowings when due, the lenders could proceed against the Company’s collateral, which also secures some of its other indebtedness.
4 1/2% Senior Notes Due 2022
The Company had outstanding
$700.0
million principal amount of
4 1/2%
senior notes due December 15, 2022. The Company redeemed these notes on January 5, 2018 in connection with the issuance of €
600.0
million euro-denominated principal amount of
3 1/8%
senior notes due December 15, 2027, as discussed below. The Company paid a premium of $
15.8
million to the holders of these notes in connection with the redemption and recorded debt extinguishment costs of $
8.1
million to write-off previously capitalized debt issuance costs associated with these notes during 2017.
7 3/4% Debentures Due 2023
The Company has outstanding
$100.0
million of debentures due November 15, 2023 that accrue interest at the rate of
7 3/4%
. Pursuant to the indenture governing the debentures, the Company must maintain a certain level of stockholders’ equity in order to pay cash dividends and make other restricted payments, as defined in the indenture governing the debentures. The debentures are not redeemable at the Company’s option prior to maturity.
3 5/8% Euro Senior Notes Due 2024
The Company issued on June 20, 2016 €
350.0
million euro-denominated principal amount of
3 5/8%
senior notes due July 15, 2024. Interest on the notes is payable in euros. The Company paid €
6.4
million (approximately $
7.3
million based on exchange rates in effect on the payment date) of fees during 2016 in connection with the issuance of these notes, which are amortized over the term of the notes. The Company may redeem some or all of these notes at any time prior to April 15, 2024 by paying a “make whole” premium plus any accrued and unpaid interest. In addition, the Company may redeem some or all of these notes on or after April 15, 2024 at their principal amount plus any accrued and unpaid interest.
The Company’s ability to create liens on the Company’s assets or engage in sale/leaseback transactions is restricted as defined in the indenture governing the notes.
3 1/8% Euro Senior Notes Due 2027
The Company issued on December 21, 2017 €
600.0
million euro-denominated principal amount of
3 1/8%
senior notes due December 15, 2027. Interest on the notes is payable in euros. The Company paid €
8.7
million (approximately $
10.3
million based on exchange rates in effect on the payment date) of fees during 2017 in connection with the issuance of these notes, which are amortized over the term of the notes. The Company may redeem some or all of these notes at any time prior to
F-26
PVH CORP.
NOTES TO CONSOLIDATED FINANCIAL STATEMENTS - (Continued)
September 15, 2027 by paying a “make whole” premium plus any accrued and unpaid interest. In addition, the Company may redeem some or all of these notes on or after September 15, 2027 at their principal amount plus any accrued and unpaid interest.
The Company’s ability to create liens on the Company’s assets or engage in sale/leaseback transactions is restricted as defined in the indenture governing the notes.
Substantially all of the Company’s assets have been pledged as collateral to secure the Company’s obligations under its 2016 facilities and the 7 3/4% debentures due 2023.
As of
February 3, 2019
, the Company was in compliance with all applicable financial and non-financial covenants under its financing arrangements.
Interest paid was $
114.6
million,
$120.2
million and
$109.8
million during
2018
,
2017
and
2016
, respectively.
9. INCOME TAXES
The domestic and foreign components of (loss) income before (benefit) provision for income taxes were as follows:
|
(In millions)
|
2018
|
2017
|
2016
|
||||||||
|
Domestic
|
$
|
(5.3
|
)
|
$
|
(102.0
|
)
|
$
|
60.9
|
|
||
|
Foreign
|
780.9
|
|
612.2
|
|
613.3
|
|
|||||
|
Total
|
$
|
775.6
|
|
$
|
510.2
|
|
$
|
674.2
|
|
||
The domestic loss before benefit for income taxes in 2018 and 2017 is primarily attributable to the domestic portion of certain non-recurring charges incurred in 2018 and 2017. Please see Note 20, “Segment Data,” for further discussion of these costs.
Taxes paid were $
138.4
million,
$164.6
million and
$85.3
million in
2018
,
2017
and
2016
, respectively.
The provision (benefit) for income taxes attributable to income consisted of the following:
|
(In millions)
|
2018
|
2017
|
2016
|
||||||||
|
Federal:
|
|
|
|
||||||||
|
Current
|
$
|
(30.5
|
)
|
$
|
51.7
|
|
$
|
(2.7
|
)
|
||
|
Deferred
|
(53.2
|
)
|
(1)
|
(198.3
|
)
|
(1)
|
(9.3
|
)
|
|||
|
State and local:
|
|
|
|
|
|
|
|||||
|
Current
|
4.6
|
|
3.5
|
|
(2.4
|
)
|
|||||
|
Deferred
|
9.6
|
|
(7.8
|
)
|
(0.9
|
)
|
|||||
|
Foreign:
|
|
|
|
|
|
|
|||||
|
Current
|
170.2
|
|
143.5
|
|
129.3
|
|
|||||
|
Deferred
|
(69.7
|
)
|
(2)
|
(18.5
|
)
|
11.5
|
|
||||
|
Total
|
$
|
31.0
|
|
$
|
(25.9
|
)
|
$
|
125.5
|
|
||
(1)
Includes a $
24.7
million benefit in 2018 and a $
52.8
million benefit in 2017 related to the U.S. Tax Legislation.
|
(2)
|
Includes a $
41.1
million benefit related to the remeasurement of certain net deferred tax liabilities in connection with the enactment of legislation in the Netherlands known as the “2019 Dutch Tax Plan,” which became effective on January 1, 2019 and includes a gradual reduction of the corporate income tax rate by 2021.
|
F-27
PVH CORP.
NOTES TO CONSOLIDATED FINANCIAL STATEMENTS - (Continued)
The provision (benefit) for income taxes for the years
2018
,
2017
and
2016
was different from the amount computed by applying the statutory United States federal income tax rate to the underlying income as follows:
|
|
2018
|
2017
|
2016
|
|||||
|
Statutory federal income tax rate
(1)
|
21.0
|
%
|
33.7
|
%
|
35.0
|
%
|
||
|
State and local income taxes, net of federal income tax benefit
|
0.5
|
%
|
(1.1
|
)%
|
0.4
|
%
|
||
|
Effects of international jurisdictions, including foreign tax credits
|
(9.5
|
)%
|
(2)
|
(20.3
|
)%
|
(12.9
|
)%
|
|
|
Change in estimates for uncertain tax positions
|
(3.7
|
)%
|
(7.5
|
)%
|
(3.7
|
)%
|
||
|
Change in valuation allowance
|
(5.3
|
)%
|
(3)
|
11.0
|
%
|
(4)
|
(0.1
|
)%
|
|
One-time transition tax due to U.S. Tax Legislation
|
—
|
%
|
34.0
|
%
|
—
|
%
|
||
|
Remeasurement due to U.S. Tax Legislation
|
0.2
|
%
|
(51.9
|
)%
|
—
|
%
|
||
|
Tax on foreign earnings (U.S. Tax Legislation - GILTI and FDII)
|
1.9
|
%
|
—
|
%
|
—
|
%
|
||
|
Excess tax benefits related to stock-based compensation
|
(0.6
|
)%
|
(2.8
|
)%
|
(5)
|
—
|
%
|
|
|
Other, net
|
(0.5
|
)%
|
(0.2
|
)%
|
(0.1
|
)%
|
||
|
Effective income tax rate
|
4.0
|
%
|
(5.1
|
)%
|
18.6
|
%
|
||
|
(1)
|
The United States statutory federal income tax rate changed from
35.0%
to
21.0%
, effective January 1, 2018, as a result of the U.S. Tax Legislation. The United States statutory federal income tax rate for 2017 is a blended rate of
33.7%
.
|
|
(2)
|
Includes a $
41.1
million benefit related to the remeasurement of certain net deferred tax liabilities in connection with the 2019 Dutch Tax Plan.
|
|
(3)
|
Includes the release of a $
26.3
million valuation allowance on the Company’s foreign tax credits to adjust the provisional amount recorded in 2017 as a result of the U.S. Tax Legislation.
|
|
(4)
|
Includes the recognition of a $
38.5
million provisional valuation allowance on the Company’s foreign tax credits as a result of the U.S. Tax Legislation.
|
|
(5)
|
Includes an excess tax benefit from the exercise of stock options by the Company’s Chairman and Chief Executive Officer.
|
The Company files income tax returns in more than
40
international jurisdictions each year. Most of the international jurisdictions in which the Company files tax returns had lower statutory tax rates than the United States statutory tax rate in 2016 and in 2017 prior to the effective date of the U.S. Tax Legislation. A substantial amount of the Company’s earnings comes from international operations, particularly in the Netherlands and Hong Kong, where income tax rates, coupled with special rates levied on income from certain of our jurisdictional activities, continue to be lower than the United States statutory income tax rate after giving effect to the U.S. Tax Legislation, and reduced the Company’s consolidated effective income tax rate during
2018
,
2017
and
2016
. The effects of international jurisdictions, including foreign tax credits, reflected in the above table for
2018
,
2017
and
2016
included those taxes at statutory income tax rates and at special rates levied on income from certain jurisdictional activities. The Company expects to benefit from these special rates until 2022.
The U.S. Tax Legislation enacted on December 22, 2017 significantly revised the United States tax code by, among other things, (i) reducing the corporate income tax rate from
35.0%
to
21.0%
, effective January 1, 2018, (ii) imposing a one-time transition tax on earnings of foreign subsidiaries deemed to be repatriated, (iii) implementing a modified territorial tax system, (iv) introducing a tax on foreign income in excess of a deemed return on tangible assets of foreign corporations (known as “GILTI”) and a beneficial tax rate to be applied against foreign derived intangible income (known as “FDII”) and (v) introducing a base erosion anti-abuse tax measure (known as “BEAT”) that taxes certain payments between United States corporations and their subsidiaries.
The Company recorded a provisional net tax benefit of $
52.8
million in the fourth quarter of 2017 in connection with the U.S. Tax Legislation, consisting of a $
265.0
million benefit primarily from the remeasurement of the Company’s net deferred tax liabilities to the lower United States corporate income tax rate, partially offset by a $
38.5
million valuation allowance on the
F-28
PVH CORP.
NOTES TO CONSOLIDATED FINANCIAL STATEMENTS - (Continued)
Company’s foreign tax credits and a $
173.7
million transition tax on undistributed post-1986 earnings and profits of foreign subsidiaries deemed to be repatriated.
The Company finalized its accounting related to the impacts of the U.S. Tax Legislation on the one-time transition tax liability, deferred taxes, valuation allowances, state tax considerations, and any remaining outside basis differences in the Company’s foreign subsidiaries during 2018. The analysis resulted in the Company recording an additional net tax benefit of $
24.7
million to adjust the provisional net tax benefit recorded in the fourth quarter of 2017, during the measurement period allowed by the Securities and Exchange Commission. The net tax benefit included the release of a $
26.3
million valuation allowance on the Company’s foreign tax credits, partially offset by a $
1.6
million expense related to the remeasurement of the Company’s net deferred tax liabilities.
The GILTI provisions of the U.S. Tax Legislation impose a tax on foreign income in excess of a deemed return on tangible assets of foreign corporations for tax years beginning after December 31, 2017. The guidance indicates that companies must make a policy election to either record deferred taxes for basis differences expected to reverse as a result of the GILTI provisions in future years or treat any taxes on GILTI inclusions as period costs when incurred. The Company has completed its analysis of the tax effects of the GILTI provisions and has elected to account for these tax effects as period costs when incurred.
The components of deferred income tax assets and liabilities were as follows:
|
(In millions)
|
2018
|
2017
|
|||||
|
Gross deferred tax assets
|
|||||||
|
Tax loss and credit carryforwards
|
$
|
230.1
|
|
$
|
247.0
|
|
|
|
Employee compensation and benefits
|
83.1
|
|
72.2
|
|
|||
|
Inventories
|
26.8
|
|
22.1
|
|
|||
|
Accounts receivable
|
17.1
|
|
17.6
|
|
|||
|
Accrued expenses
|
30.2
|
|
25.5
|
|
|||
|
Derivative financial instruments
|
—
|
|
18.3
|
|
|||
|
Other, net
|
13.8
|
|
8.7
|
|
|||
|
Subtotal
|
401.1
|
|
411.4
|
|
|||
|
Valuation allowances
|
(62.6
|
)
|
(106.3
|
)
|
|||
|
Total gross deferred tax assets, net of valuation allowances
|
$
|
338.5
|
|
$
|
305.1
|
|
|
|
Gross deferred tax liabilities
|
|
|
|
|
|||
|
Intangibles
|
$
|
(825.3
|
)
|
$
|
(898.9
|
)
|
|
|
Property, plant and equipment
|
(33.6
|
)
|
(43.8
|
)
|
|||
|
Derivative financial instruments
|
(4.3
|
)
|
—
|
|
|||
|
Total gross deferred tax liabilities
|
$
|
(863.2
|
)
|
$
|
(942.7
|
)
|
|
|
Net deferred tax liability
|
$
|
(524.7
|
)
|
$
|
(637.6
|
)
|
|
At the end of 2018, the Company had on a tax effected basis approximately $
240.4
million of net operating loss and tax credit carryforwards available to offset future taxable income in various jurisdictions. This included net operating loss carryforwards of approximately $
3.2
million and $
48.2
million for federal and various state and local jurisdictions, respectively, and $
11.7
million for various foreign jurisdictions. The Company also had federal and state tax credit and other carryforwards of $
177.3
million. The carryforwards expire principally between 2019 and 2038.
Prior to the enactment of the U.S. Tax Legislation, the Company's undistributed foreign earnings were considered
permanently reinvested and, as such, United States federal and state income taxes were not previously recorded on these
earnings. As a result of the U.S. Tax Legislation, substantially all of the Company’s earnings in foreign subsidiaries generated prior to the enactment of the U.S. Tax Legislation were deemed to have been repatriated and, as a result, the Company recorded a one-time transition tax of $
173.7
million in 2017. The Company's intent is to reinvest indefinitely substantially all of its foreign earnings outside of the United States. However, if the Company decides at a later date to repatriate these earnings to the
F-29
PVH CORP.
NOTES TO CONSOLIDATED FINANCIAL STATEMENTS - (Continued)
United States, the Company may be required to accrue and pay additional taxes, including any applicable foreign withholding tax and United States state income taxes. It is not practicable to estimate the amount of tax that might be payable if these earnings were repatriated due to the complexities associated with the hypothetical calculation.
Uncertain tax positions activity for each of the last three years was as follows:
|
(In millions)
|
2018
|
2017
|
2016
|
||||||||
|
Balance at beginning of year
|
$
|
297.1
|
|
$
|
245.6
|
|
$
|
226.8
|
|
||
|
Increases related to prior year tax positions
|
13.9
|
|
15.4
|
|
2.8
|
|
|||||
|
Decreases related to prior year tax positions
|
(24.9
|
)
|
(10.3
|
)
|
(9.9
|
)
|
|||||
|
Increases related to current year tax positions
|
25.5
|
|
79.7
|
|
52.0
|
|
|||||
|
Lapses in statute of limitations
|
(54.7
|
)
|
(46.3
|
)
|
(24.4
|
)
|
|||||
|
Effects of foreign currency translation
|
(8.6
|
)
|
13.0
|
|
(1.7
|
)
|
|||||
|
Balance at end of year
|
$
|
248.3
|
|
$
|
297.1
|
|
$
|
245.6
|
|
||
The entire amount of uncertain tax positions as of
February 3, 2019
, if recognized, would reduce the future effective tax rate under current accounting guidance.
Interest and penalties related to uncertain tax positions are recorded in the Company’s income tax provision. Interest and penalties recognized in the Company’s Consolidated Income Statements for the years
2018
,
2017
and
2016
totaled an expense of $
12.1
million,
$0.9
million and
$1.0
million, respectively. Interest and penalties accrued in the Company’s Consolidated Balance Sheets as of
February 3, 2019
,
February 4, 2018
and
January 29, 2017
totaled $
44.1
million,
$29.8
million and
$27.8
million, respectively. The Company recorded its liabilities for uncertain tax positions principally in accrued expenses and other liabilities in its Consolidated Balance Sheets.
The Company files income tax returns in the United States and in various foreign, state and local jurisdictions. Most examinations have been completed by tax authorities or the statute of limitations has expired for United States federal, foreign, state and local income tax returns filed by the Company for years through 2006. It is reasonably possible that a reduction of uncertain tax positions in a range of $
40.0
million to $
65.0
million may occur within
12
months of
February 3, 2019
.
10. DERIVATIVE FINANCIAL INSTRUMENTS
Cash Flow Hedges
The Company has exposure to changes in foreign currency exchange rates related to anticipated cash flows associated with certain international inventory purchases. The Company uses foreign currency forward exchange contracts to hedge against a portion of this exposure.
The Company also has exposure to interest rate volatility related to its term loans under the 2016 facilities. The Company has entered into interest rate swap agreements to hedge against a portion of this exposure. Please see
Note 8
, “
Debt
,” for further discussion of the 2016 facilities and these agreements.
The Company records the foreign currency forward exchange contracts and interest rate swap agreements at fair value in its Consolidated Balance Sheets and does not net the related assets and liabilities. The foreign currency forward exchange contracts associated with certain international inventory purchases and the interest rate swap agreements are designated as effective hedging instruments (collectively referred to as “cash flow hedges”). The changes in the fair value of the cash flow hedges are recorded in equity as a component of AOCL. No amounts were excluded from effectiveness testing. There was no ineffective portion of the cash flow hedges during 2018, 2017 and 2016.
Net Investment Hedges
The Company has exposure to changes in foreign currency exchange rates related to the value of its investments in foreign subsidiaries denominated in a currency other than the United States dollar. To hedge against a portion of this exposure,
F-30
PVH CORP.
NOTES TO CONSOLIDATED FINANCIAL STATEMENTS - (Continued)
the Company designated the carrying amounts of its €
600.0
million euro-denominated principal amount of 3 1/8% senior notes due 2027 and €
350.0
million euro-denominated principal amount of 3 5/8% senior notes due 2024 (collectively referred to as the “foreign currency borrowings”), that it had issued in the United States, as net investment hedges of its investments in certain of its foreign subsidiaries that use the euro as their functional currency. Please see
Note 8
, “
Debt
,” for further discussion of the Company’s foreign currency borrowings.
The Company records the foreign currency borrowings at carrying value in its Consolidated Balance Sheets. The carrying value of the foreign currency borrowings is remeasured at the end of each reporting period to reflect changes in the foreign currency exchange spot rate. Since the foreign currency borrowings are designated as net investment hedges, such remeasurement is recorded in equity as a component of AOCL. The fair value and the carrying value of the foreign currency borrowings designated as net investment hedges were $
1,098.3
million and $
1,076.0
million, respectively, as of
February 3, 2019
and $
1,226.7
million and $
1,169.7
million, respectively, as of
February 4, 2018
. The Company evaluates the effectiveness of its net investment hedges at inception and at the beginning of each quarter thereafter. No amounts were excluded from effectiveness testing. There was no ineffective portion of the net investment hedges during 2018, 2017 and 2016.
Undesignated Contracts
The Company records immediately in earnings changes in the fair value of hedges that are not designated as effective hedging instruments (“undesignated contracts”), including all of the foreign currency forward exchange contracts related to intercompany transactions and intercompany loans that are not of a long-term investment nature. Any gains and losses that are immediately recognized in earnings on such contracts are largely offset by the remeasurement of the underlying intercompany balances.
In addition, the Company has exposure to changes in foreign currency exchange rates related to the translation of the earnings of its subsidiaries denominated in a currency other than the United States dollar. To hedge against a portion of this exposure, the Company entered into several foreign currency option contracts during 2017 and 2016. These contracts represented the Company’s purchase of euro put/United States dollar call options and Chinese yuan renminbi put/United States dollar call options. All foreign currency option contracts expired in 2017.
The Company’s foreign currency option contracts were also undesignated contracts. As such, the changes in the fair value of these foreign currency option contracts were immediately recognized in earnings. This mitigated, to an extent, the effect of any strengthening of the United States dollar against the euro and Chinese yuan renminbi on the reporting of the Company’s euro-denominated and Chinese yuan renminbi-denominated earnings, respectively.
The Company does not use derivative or non-derivative financial instruments for trading or speculative purposes. The cash flows from the Company’s hedges are presented in the same category in the Company’s Consolidated Statements of Cash Flows as the items being hedged.
F-31
PVH CORP.
NOTES TO CONSOLIDATED FINANCIAL STATEMENTS - (Continued)
The following table summarizes the fair value and presentation of the Company’s derivative financial instruments in its Consolidated Balance Sheets:
|
(In millions)
|
Assets
|
Liabilities
|
|||||||||||||||||||||||||||||
|
|
2018
|
2017
|
2018
|
2017
|
|||||||||||||||||||||||||||
|
Other Current Assets
|
Other Assets
|
Other Current Assets
|
Other Assets
|
Accrued Expenses
|
Other Liabilities
|
Accrued Expenses
|
Other Liabilities
|
||||||||||||||||||||||||
|
Contracts designated as cash flow hedges:
|
|||||||||||||||||||||||||||||||
|
Foreign currency forward exchange contracts (inventory purchases)
|
$
|
24.0
|
|
$
|
0.7
|
|
$
|
0.9
|
|
$
|
0.1
|
|
$
|
3.5
|
|
$
|
0.7
|
|
$
|
62.4
|
|
$
|
4.1
|
|
|||||||
|
Interest rate swap agreements
|
1.4
|
|
0.0
|
|
1.1
|
|
1.3
|
|
1.2
|
|
1.6
|
|
0.1
|
|
—
|
|
|||||||||||||||
|
Total contracts designated as cash flow hedges
|
25.4
|
|
0.7
|
|
2.0
|
|
1.4
|
|
4.7
|
|
2.3
|
|
62.5
|
|
4.1
|
|
|||||||||||||||
|
Undesignated contracts:
|
|||||||||||||||||||||||||||||||
|
Foreign currency forward exchange contracts
|
0.1
|
|
—
|
|
0.5
|
|
—
|
|
2.0
|
|
—
|
|
0.9
|
|
—
|
|
|||||||||||||||
|
Total
|
$
|
25.5
|
|
$
|
0.7
|
|
$
|
2.5
|
|
$
|
1.4
|
|
$
|
6.7
|
|
$
|
2.3
|
|
$
|
63.4
|
|
$
|
4.1
|
|
|||||||
The notional amount outstanding of foreign currency forward exchange contracts was $
1,183.6
million at
February 3, 2019
. Such contracts expire principally between February 2019 and June 2020.
The following table summarizes the effect of the Company’s hedges designated as cash flow and net investment hedging instruments:
|
Gain (Loss)
Recognized in Other
Comprehensive (Loss) Income
|
(Loss) Gain Reclassified from
AOCL into (Expense) Income
|
||||||||||||||||
|
(In millions)
|
Location
|
Amount
|
|||||||||||||||
|
2018
|
2017
|
|
2018
|
2017
|
|||||||||||||
|
Foreign currency forward exchange contracts (inventory purchases)
|
$
|
97.1
|
|
$
|
(122.0
|
)
|
Cost of goods sold
|
$
|
(11.6
|
)
|
$
|
(13.6
|
)
|
||||
|
Interest rate swap agreements
|
(2.6
|
)
|
3.2
|
|
Interest expense
|
1.1
|
|
(6.2
|
)
|
||||||||
|
Foreign currency borrowings (net investment hedges)
|
95.6
|
|
(99.5
|
)
|
N/A
|
—
|
|
—
|
|
||||||||
|
Total
|
$
|
190.1
|
|
$
|
(218.3
|
)
|
$
|
(10.5
|
)
|
$
|
(19.8
|
)
|
|||||
A net gain in AOCL on foreign currency forward exchange contracts at
February 3, 2019
of $
32.1
million is estimated to be reclassified in the next
12
months in the Company’s Consolidated Income Statement to costs of goods sold as the underlying inventory hedged by such forward exchange contracts is sold. In addition, a net gain in AOCL for interest rate swap agreements at
February 3, 2019
of $
0.2
million is estimated to be reclassified to interest expense within the next
12
months. Amounts recognized in AOCL for foreign currency borrowings would be recognized in earnings only upon the sale or substantially complete liquidation of the hedged net investment.
F-32
PVH CORP.
NOTES TO CONSOLIDATED FINANCIAL STATEMENTS - (Continued)
The following table summarizes the effect of the Company’s undesignated contracts recognized in SG&A expenses in its Consolidated Income Statements:
|
Loss Recognized in Expense
|
||||||||
|
(In millions)
|
2018
|
2017
|
||||||
|
Foreign currency forward exchange contracts
|
$
|
(1.5
|
)
|
$
|
(4.6
|
)
|
||
|
Foreign currency option contracts
|
—
|
|
(4.3
|
)
|
||||
The Company had no derivative financial instruments with credit risk-related contingent features underlying the related contracts as of
February 3, 2019
.
11. FAIR VALUE MEASUREMENTS
In accordance with accounting principles generally accepted in the United States, fair value is defined as the price that would be received to sell an asset or paid to transfer a liability in an orderly transaction between market participants at the measurement date. A three level hierarchy prioritizes the inputs used to measure fair value as follows:
Level 1 – Inputs are unadjusted quoted prices in active markets for identical assets or liabilities that the Company has the ability to access at the measurement date.
Level 2 – Observable inputs other than quoted prices included in Level 1, including quoted prices for similar assets or liabilities in active markets, quoted prices for identical assets or liabilities in inactive markets, inputs other than quoted prices that are observable for the asset or liability and inputs derived principally from or corroborated by observable market data.
Level 3 – Unobservable inputs reflecting the Company’s own assumptions about the inputs that market participants would use in pricing the asset or liability based on the best information available.
In accordance with the fair value hierarchy described above, the following table shows the fair value of the Company’s financial assets and liabilities that are required to be remeasured at fair value on a recurring basis:
|
(In millions)
|
2018
|
2017
|
|||||||||||||||||||||
|
Level 1
|
Level 2
|
Level 3
|
Total
|
Level 1
|
Level 2
|
Level 3
|
Total
|
||||||||||||||||
|
Assets:
|
|||||||||||||||||||||||
|
Foreign currency forward exchange contracts
|
N/A
|
$
|
24.8
|
|
N/A
|
$
|
24.8
|
|
N/A
|
$
|
1.5
|
|
N/A
|
$
|
1.5
|
|
|||||||
|
Interest rate swap agreements
|
N/A
|
1.4
|
|
N/A
|
1.4
|
|
N/A
|
2.4
|
|
N/A
|
2.4
|
|
|||||||||||
|
Total Assets
|
N/A
|
$
|
26.2
|
|
N/A
|
$
|
26.2
|
|
N/A
|
$
|
3.9
|
|
N/A
|
$
|
3.9
|
|
|||||||
|
Liabilities:
|
|||||||||||||||||||||||
|
Foreign currency forward exchange contracts
|
N/A
|
$
|
6.2
|
|
N/A
|
$
|
6.2
|
|
N/A
|
$
|
67.4
|
|
N/A
|
$
|
67.4
|
|
|||||||
|
Interest rate swap agreements
|
N/A
|
2.8
|
|
N/A
|
2.8
|
|
N/A
|
0.1
|
|
N/A
|
0.1
|
|
|||||||||||
|
Total Liabilities
|
N/A
|
$
|
9.0
|
|
N/A
|
$
|
9.0
|
|
N/A
|
$
|
67.5
|
|
N/A
|
$
|
67.5
|
|
|||||||
The fair value of the foreign currency forward exchange contracts is measured as the total amount of currency to be purchased, multiplied by the difference between (i) the forward rate as of the period end and (ii) the settlement rate specified in each contract. The fair value of the interest rate swap agreements is based on observable interest rate yield curves and represents the expected discounted cash flows underlying the financial instruments.
F-33
PVH CORP.
NOTES TO CONSOLIDATED FINANCIAL STATEMENTS - (Continued)
Pursuant to the agreement governing the reacquisition of the rights in India to the
TOMMY HILFIGER
trademarks (which the Company entered into in September 2011), the Company was required to make annual contingent purchase price payments, with the final payment made in 2017. The Company was required to remeasure this liability at fair value on a recurring basis and classified this as a Level 3 measurement.
The following table presents the change in the Level 3 contingent purchase price payment liability during
2017
:
|
(In millions)
|
2017
|
|||
|
Beginning Balance
|
$
|
1.6
|
|
|
|
Payments
|
(0.8
|
)
|
||
|
Adjustments included in earnings
|
(0.8
|
)
|
||
|
Ending Balance
|
$
|
—
|
|
|
There were no transfers between any levels of the fair value hierarchy for any of the Company’s fair value measurements.
The following table shows the fair value of the Company’s non-financial assets and liabilities that were required to be remeasured at fair value on a non-recurring basis (consisting of property, plant and equipment) during
2018
,
2017
and 2016, and the total impairments recorded as a result of the remeasurement process:
|
(In millions)
|
Fair Value Measurement Using
|
Fair Value
As Of Impairment Date |
Total
Impairments
|
||||||||||||
|
|
Level 1
|
Level 2
|
Level 3
|
||||||||||||
|
2018
|
N/A
|
N/A
|
$
|
0.6
|
|
$
|
0.6
|
|
$
|
17.9
|
|
||||
|
2017
|
N/A
|
N/A
|
0.6
|
|
0.6
|
|
7.5
|
|
|||||||
|
2016
|
N/A
|
N/A
|
0.4
|
|
0.4
|
|
10.1
|
|
|||||||
Long-lived assets with a carrying amount of
$18.5
million were written down to a fair value of
$0.6
million during 2018 in connection with the financial performance in certain of the Company’s retail stores and shop-in-shops, and the closure of the
CALVIN KLEIN 205 W39 NYC
brand
(formerly
Calvin Klein Collection
). Please see
Note 17
, “
Exit Activity Costs
,” for further discussion. Fair value of the Company’s retail stores and shop-in-shops was determined based on the estimated discounted future cash flows associated with the assets using sales trends and market participant assumptions. The
$17.9
million impairment charge was included in SG&A expenses, of which
$0.2
million was recorded in the Tommy Hilfiger North America segment,
$1.6
million was recorded in the Tommy Hilfiger International segment,
$5.1
million was recorded in the Calvin Klein North America segment,
$8.5
million was recorded in the Calvin Klein International segment and
$2.5
million was recorded in the Heritage Brands Wholesale segment.
Long-lived assets with a carrying amount of
$8.1
million were written down to a fair value of
$0.6
million during 2017 in connection with the financial performance in certain of the Company’s retail stores. Fair value was determined based on the estimated discounted future cash flows associated with the assets using sales trends and market participant assumptions. The
$7.5
million impairment charge was included in SG&A expenses, of which
$0.4
million was recorded in the Tommy Hilfiger North America segment,
$1.9
million was recorded in the Tommy Hilfiger International segment,
$1.8
million was recorded in the Calvin Klein North America segment and
$3.4
million was recorded in the Calvin Klein International segment.
Long-lived assets with a carrying amount of
$10.5
million were written down to a fair value of
$0.4
million during 2016 in connection with the financial performance in certain of the Company’s retail stores. Fair value was determined based on the estimated discounted future cash flows associated with the assets using sales trends and market participant assumptions. The
$10.1
million impairment charge was included in SG&A expenses, of which
$1.4
million was recorded in the Tommy Hilfiger North America segment,
$4.0
million was recorded in the Tommy Hilfiger International segment,
$1.0
million was recorded in the Calvin Klein North America segment and
$3.7
million was recorded in the Calvin Klein International segment.
F-34
PVH CORP.
NOTES TO CONSOLIDATED FINANCIAL STATEMENTS - (Continued)
The carrying amounts and the fair values of the Company’s cash and cash equivalents, short-term borrowings and long-term debt were as follows:
|
(In millions)
|
2018
|
2017
|
|||||||||||||
|
Carrying
Amount
|
Fair
Value
|
Carrying
Amount
|
Fair
Value
|
||||||||||||
|
Cash and cash equivalents
|
$
|
452.0
|
|
$
|
452.0
|
|
$
|
493.9
|
|
$
|
493.9
|
|
|||
|
Short-term borrowings
|
12.8
|
|
12.8
|
|
19.5
|
|
19.5
|
|
|||||||
|
Long-term debt
|
2,819.4
|
|
2,853.7
|
|
3,061.3
|
|
3,140.9
|
|
|||||||
The fair values of cash and cash equivalents and short-term borrowings approximate their carrying amounts due to the short-term nature of these instruments. The Company estimates the fair value of its long-term debt using quoted market prices as of the last business day of the applicable year. The Company classifies the measurement of its long-term debt as a Level 1 measurement. The carrying amounts of long-term debt reflect the unamortized portions of debt issuance costs and the original issue discounts.
12. RETIREMENT AND BENEFIT PLANS
The Company, as of
February 3, 2019
, has
five
noncontributory qualified defined benefit pension plans covering substantially all employees resident in the United States who meet certain age and service requirements. The plans provide monthly benefits upon retirement generally based on career average compensation and years of credited service. Vesting in plan benefits generally occurs after
five
years of service. The Company refers to these
five
plans as its “Pension Plans.”
The Company also has
three
noncontributory unfunded non-qualified supplemental defined benefit pension plans, including:
|
–
|
A plan for certain current and former members of Tommy Hilfiger’s domestic senior management. The plan is frozen and, as a result, participants do not accrue additional benefits.
|
|
–
|
A capital accumulation program for certain current and former senior executives. Under the individual participants’ agreements, the participants in the program will receive a predetermined amount during the
ten
years following the attainment of age
65
, provided that prior to the termination of employment with the Company, the participant has been in the plan for at least
ten
years and has attained age
55
.
|
|
–
|
A plan for certain employees resident in the United States who meet certain age and service requirements that provides benefits for compensation in excess of Internal Revenue Service earnings limits and requires payments to vested employees upon, or shortly after, employment termination or retirement.
|
The Company refers to these
three
plans as its “SERP Plans.”
The Company also provides certain postretirement health care and life insurance benefits to certain retirees resident in the United States. As a result of the Company’s acquisition of The Warnaco Group, Inc. (“Warnaco”), the Company also provides certain postretirement health care and life insurance benefits to certain Warnaco retirees resident in the United States. Retirees contribute to the cost of the applicable plan, both of which are unfunded and frozen. The Company refers to these
two
plans as its “Postretirement Plans.”
F-35
PVH CORP.
NOTES TO CONSOLIDATED FINANCIAL STATEMENTS - (Continued)
Reconciliations of the changes in the projected benefit obligation (Pension Plans and SERP Plans) and the accumulated benefit obligation (Postretirement Plans) were as follows:
|
|
Pension Plans
|
SERP Plans
|
Postretirement Plans
|
||||||||||||||||||||
|
(In millions)
|
2018
|
2017
|
2018
|
2017
|
2018
|
2017
|
|||||||||||||||||
|
Balance at beginning of year
|
$
|
648.0
|
|
$
|
627.5
|
|
$
|
96.9
|
|
$
|
87.6
|
|
$
|
10.5
|
|
$
|
11.4
|
|
|||||
|
Service cost, net of plan expenses
|
31.4
|
|
26.3
|
|
5.8
|
|
4.5
|
|
—
|
|
—
|
|
|||||||||||
|
Interest cost
|
26.0
|
|
25.7
|
|
3.9
|
|
3.8
|
|
0.4
|
|
0.4
|
|
|||||||||||
|
Benefit payments
|
(26.0
|
)
|
(29.4
|
)
|
(6.1
|
)
|
(5.1
|
)
|
—
|
|
—
|
|
|||||||||||
|
Benefit payments, net of retiree contributions
|
—
|
|
—
|
|
—
|
|
—
|
|
(1.4
|
)
|
(1.6
|
)
|
|||||||||||
|
Plan curtailments
|
—
|
|
(0.3
|
)
|
—
|
|
—
|
|
—
|
|
—
|
|
|||||||||||
|
Plan settlements
|
—
|
|
(65.3
|
)
|
—
|
|
—
|
|
—
|
|
—
|
|
|||||||||||
|
Actuarial (gain) loss
|
(28.4
|
)
|
63.5
|
|
(1.3
|
)
|
6.1
|
|
(1.1
|
)
|
0.3
|
|
|||||||||||
|
Balance at end of year
|
$
|
651.0
|
|
$
|
648.0
|
|
$
|
99.2
|
|
$
|
96.9
|
|
$
|
8.4
|
|
$
|
10.5
|
|
|||||
The actuarial gains in 2018 were due principally to increases in the discount rates. The actuarial losses in 2017 were due principally to decreases in the discount rates.
In 2017, the Company completed the purchase of a group annuity using assets from the Pension Plans. Under the group annuity, the accrued pension obligations for approximately
4,000
retiree participants who had deferred vested benefits under the Pension Plans were transferred to an insurer. As a result, the Company recognized a loss of $
9.4
million, which was recorded in non-service related pension and postretirement cost (income) in the Company’s Consolidated Income Statement for 2017. The amount of the pension benefit obligation settled was $
65.3
million.
Reconciliations of the fair value of the assets held by the Pension Plans and the funded status were as follows:
|
(In millions)
|
2018
|
2017
|
|||||
|
Fair value of plan assets at beginning of year
|
$
|
660.6
|
|
$
|
659.5
|
|
|
|
Actual return, net of plan expenses
|
(7.8
|
)
|
95.5
|
|
|||
|
Benefit payments
|
(26.0
|
)
|
(29.4
|
)
|
|||
|
Plan settlements
|
—
|
|
(65.3
|
)
|
|||
|
Company contributions
|
10.0
|
|
0.3
|
|
|||
|
Fair value of plan assets at end of year
|
$
|
636.8
|
|
$
|
660.6
|
|
|
|
Funded status at end of year
|
$
|
(14.2
|
)
|
$
|
12.6
|
|
|
Amounts recognized in the Company’s Consolidated Balance Sheets were as follows:
|
|
Pension Plans
|
SERP Plans
|
Postretirement Plans
|
||||||||||||||||||||
|
(In millions)
|
2018
|
2017
|
2018
|
2017
|
2018
|
2017
|
|||||||||||||||||
|
Non-current assets
|
$
|
1.8
|
|
$
|
19.1
|
|
$
|
—
|
|
$
|
—
|
|
$
|
—
|
|
$
|
—
|
|
|||||
|
Current liabilities
|
—
|
|
—
|
|
(7.4
|
)
|
(7.4
|
)
|
(1.1
|
)
|
(1.4
|
)
|
|||||||||||
|
Non-current liabilities
|
(16.0
|
)
|
(6.5
|
)
|
(91.8
|
)
|
(89.5
|
)
|
(7.3
|
)
|
(9.1
|
)
|
|||||||||||
|
Net amount recognized
|
$
|
(14.2
|
)
|
$
|
12.6
|
|
$
|
(99.2
|
)
|
$
|
(96.9
|
)
|
$
|
(8.4
|
)
|
$
|
(10.5
|
)
|
|||||
F-36
PVH CORP.
NOTES TO CONSOLIDATED FINANCIAL STATEMENTS - (Continued)
The components of net benefit cost recognized were as follows:
|
|
Pension Plans
|
SERP Plans
|
Postretirement Plans
|
|||||||||||||||||||||||||||||||||
|
(In millions)
|
2018
|
2017
|
2016
|
2018
|
2017
|
2016
|
2018
|
2017
|
2016
|
|||||||||||||||||||||||||||
|
Service cost
|
$
|
33.7
|
|
$
|
27.3
|
|
$
|
25.2
|
|
$
|
5.8
|
|
$
|
4.5
|
|
$
|
4.4
|
|
$
|
—
|
|
$
|
—
|
|
$
|
—
|
|
|||||||||
|
Interest cost
|
26.0
|
|
25.7
|
|
29.8
|
|
3.9
|
|
3.8
|
|
3.9
|
|
0.4
|
|
0.4
|
|
0.5
|
|
||||||||||||||||||
|
Actuarial loss (gain)
|
17.4
|
|
(3.9
|
)
|
(35.4
|
)
|
(1.3
|
)
|
6.1
|
|
(0.7
|
)
|
(1.1
|
)
|
0.3
|
|
(3.0
|
)
|
||||||||||||||||||
|
Expected return on plan assets
|
(40.3
|
)
|
(38.6
|
)
|
(35.9
|
)
|
—
|
|
—
|
|
—
|
|
—
|
|
—
|
|
—
|
|
||||||||||||||||||
|
Amortization of prior service cost (credit)
|
0.1
|
|
0.1
|
|
0.0
|
|
—
|
|
(0.0
|
)
|
(0.1
|
)
|
—
|
|
—
|
|
(0.3
|
)
|
||||||||||||||||||
|
Curtailment gain
|
—
|
|
(0.3
|
)
|
—
|
|
—
|
|
—
|
|
—
|
|
—
|
|
—
|
|
—
|
|
||||||||||||||||||
|
Settlement loss
|
—
|
|
9.4
|
|
—
|
|
—
|
|
—
|
|
—
|
|
—
|
|
—
|
|
—
|
|
||||||||||||||||||
|
Total
|
$
|
36.9
|
|
$
|
19.7
|
|
$
|
(16.3
|
)
|
$
|
8.4
|
|
$
|
14.4
|
|
$
|
7.5
|
|
$
|
(0.7
|
)
|
$
|
0.7
|
|
$
|
(2.8
|
)
|
|||||||||
The service cost component of net benefit cost is recorded in SG&A expenses and the other components of net benefit cost are recorded in non-service related pension and postretirement cost (income) in the Company’s Consolidated Income Statements. Please see Note 1, “Summary of Significant Accounting Policies,” for further discussion of the updated guidance related to the presentation of net benefit cost.
The actuarial gains in 2018 were due principally to increases in the discount rates. For the Pension Plans, these gains were more than offset by the actuarial loss as a result of the difference between the actual and expected returns on plan assets.
Amortization of prior service credits recognized in other comprehensive (loss) income for Pension Plans, SERP Plans, and Postretirement Plans was immaterial during
2018
,
2017
and
2016
.
Pre-tax amounts in AOCL that had not yet been recognized as components of net benefit cost in the Pension Plans, SERP Plans and Postretirement Plans were immaterial as of
February 3, 2019
and
February 4, 2018
.
Pre-tax amounts in AOCL as of
February 3, 2019
expected to be recognized as components of net benefit cost in 2019 in the Pension Plans, SERP Plans and Postretirement Plans were immaterial.
The accumulated benefit obligation (Pension Plans and SERP Plans) were as follows:
|
Pension Plans
|
SERP Plans
|
||||||||||||||
|
(In millions)
|
2018
|
2017
|
2018
|
2017
|
|||||||||||
|
Accumulated benefit obligation
|
$
|
598.9
|
|
$
|
595.6
|
|
$
|
81.5
|
|
$
|
79.6
|
|
|||
F-37
PVH CORP.
NOTES TO CONSOLIDATED FINANCIAL STATEMENTS - (Continued)
In 2018, three of the Company’s Pension Plans had projected benefit obligations in excess of plan assets and two of the Company’s Pension Plans had accumulated benefit obligations in excess of plan assets. In 2017, two of the Company’s Pension Plans had projected benefit obligations and accumulated benefit obligations in excess of plan assets. The balances were as follows:
|
(In millions, except plan count)
|
2018
|
2017
|
|||||
|
Number of plans with projected benefit obligations in excess of plan assets
|
3
|
|
2
|
|
|||
|
Aggregate projected benefit obligation
|
$
|
634.7
|
|
$
|
41.6
|
|
|
|
Aggregate fair value of related plan assets
|
$
|
618.8
|
|
$
|
35.1
|
|
|
|
Number of plans with accumulated benefit obligations in excess of plan assets
|
2
|
|
2
|
|
|||
|
Aggregate accumulated benefit obligation
|
$
|
38.5
|
|
$
|
37.4
|
|
|
|
Aggregate fair value of related plan assets
|
$
|
38.0
|
|
$
|
35.1
|
|
|
In 2018 and 2017, all of the Company’s SERP Plans had projected benefit obligations and accumulated benefit obligations in excess of plan assets as the plans are unfunded.
Significant weighted average rate assumptions used in determining the projected and accumulated benefit obligations at the end of each year and benefit cost in the following year were as follows:
|
|
2018
|
2017
|
2016
|
|||||
|
Discount rate (applies to Pension Plans and SERP Plans)
|
4.35
|
%
|
4.08
|
%
|
4.59
|
%
|
||
|
Discount rate (applies to Postretirement Plans)
|
4.16
|
%
|
3.91
|
%
|
4.04
|
%
|
||
|
Rate of increase in compensation levels (applies to Pension Plans)
|
4.24
|
%
|
4.24
|
%
|
4.27
|
%
|
||
|
Expected long-term rate of return on assets (applies to Pension Plans)
|
6.50
|
%
|
6.25
|
%
|
6.50
|
%
|
||
To develop the expected long-term rate of return on assets assumption, the Company considered the historical level of the risk premium associated with the asset classes in which the portfolio is invested and the expectations for future returns of each asset class. The expected return for each asset class was then weighted based on the target asset allocation.
The assets of the Pension Plans are invested with the objective of being able to meet current and future benefit payment needs, while managing future contributions. The investment policy aims to earn a reasonable rate of return while minimizing the risk of large losses. Assets are diversified by asset class in order to reduce volatility of overall results from year to year and to take advantage of various investment opportunities. The assets of the Pension Plans are diversified among United States equities, international equities, fixed income investments and cash. The strategic target allocation for the majority of the Pension Plans as of
February 3, 2019
was approximately
40%
United States equities,
20%
international equities and
40%
fixed income investments and cash. Equity securities primarily include investments in large-, mid- and small-cap companies located in the United States and abroad. Fixed income securities include corporate bonds of companies from diversified industries, municipal bonds, collective funds and United States Treasury bonds. Actual investment allocations may vary from the Company’s target investment allocations due to prevailing market conditions.
F-38
PVH CORP.
NOTES TO CONSOLIDATED FINANCIAL STATEMENTS - (Continued)
In accordance with the fair value hierarchy described in
Note 11
, “
Fair Value Measurements
,” the following tables show the fair value of the total assets of the Pension Plans for each major category as of
February 3, 2019
and
February 4, 2018
:
|
(In millions)
|
Fair Value Measurements as of
February 3, 2019
(1)
|
|||||||||||||||
|
Asset Category
|
Total
|
Quoted Prices
In Active
Markets for
Identical Assets
(Level 1)
|
Observable
Inputs
(Level 2)
|
Unobservable
Inputs
(Level 3)
|
||||||||||||
|
Equity securities:
|
|
|
|
|
||||||||||||
|
United States equities
(2)
|
$
|
170.9
|
|
$
|
170.9
|
|
$
|
—
|
|
$
|
—
|
|
||||
|
International equities
(2)
|
12.2
|
|
12.2
|
|
—
|
|
—
|
|
||||||||
|
United States equity fund
(3)
|
58.9
|
|
—
|
|
58.9
|
|
—
|
|
||||||||
|
International equity funds
(4)
|
126.5
|
|
60.3
|
|
66.2
|
|
—
|
|
||||||||
|
Fixed income securities:
|
|
|
|
|
|
|
|
|
||||||||
|
Government securities
(5)
|
70.3
|
|
—
|
|
70.3
|
|
—
|
|
||||||||
|
Corporate securities
(5)
|
173.7
|
|
—
|
|
173.7
|
|
—
|
|
||||||||
|
Short-term investment funds
(6)
|
16.7
|
|
—
|
|
16.7
|
|
—
|
|
||||||||
|
Total return mutual fund
(7)
|
6.3
|
|
6.3
|
|
—
|
|
—
|
|
||||||||
|
Subtotal
|
$
|
635.5
|
|
$
|
249.7
|
|
$
|
385.8
|
|
$
|
—
|
|
||||
|
Other assets and liabilities
(8)
|
1.3
|
|
|
|
|
|
|
|
||||||||
|
Total
|
$
|
636.8
|
|
|
|
|
|
|
|
|||||||
|
(In millions)
|
Fair Value Measurements as of
February 4, 2018
(1)
|
|||||||||||||||
|
Asset Category
|
Total
|
Quoted Prices
In Active
Markets for
Identical Assets
(Level 1)
|
Observable
Inputs
(Level 2)
|
Unobservable
Inputs
(Level 3)
|
||||||||||||
|
Equity securities:
|
|
|
|
|
||||||||||||
|
United States equities
(2)
|
$
|
179.8
|
|
$
|
179.8
|
|
$
|
—
|
|
$
|
—
|
|
||||
|
International equities
(2)
|
13.0
|
|
13.0
|
|
—
|
|
—
|
|
||||||||
|
United States equity fund
(3)
|
58.9
|
|
—
|
|
58.9
|
|
—
|
|
||||||||
|
International equity funds
(4)
|
140.0
|
|
65.6
|
|
74.4
|
|
—
|
|
||||||||
|
Fixed income securities:
|
|
|
|
|
|
|
|
|
||||||||
|
Government securities
(5)
|
58.1
|
|
—
|
|
58.1
|
|
—
|
|
||||||||
|
Corporate securities
(5)
|
183.3
|
|
—
|
|
183.3
|
|
—
|
|
||||||||
|
Short-term investment funds
(6)
|
18.4
|
|
—
|
|
18.4
|
|
—
|
|
||||||||
|
Total return mutual fund
(7)
|
6.6
|
|
6.6
|
|
—
|
|
—
|
|
||||||||
|
Subtotal
|
$
|
658.1
|
|
$
|
265.0
|
|
$
|
393.1
|
|
$
|
—
|
|
||||
|
Other assets and liabilities
(8)
|
2.5
|
|
|
|
|
|
|
|
||||||||
|
Total
|
$
|
660.6
|
|
|
|
|
|
|
|
|||||||
|
(1)
|
The Company uses third party pricing services to determine the fair values of the financial instruments held by the Pension Plans. The Company obtains an understanding of the pricing services’ valuation methodologies and related inputs and validates a sample of prices provided by the pricing services by reviewing prices from other
|
F-39
PVH CORP.
NOTES TO CONSOLIDATED FINANCIAL STATEMENTS - (Continued)
pricing sources and analyzing pricing data in certain instances. The Company has not adjusted any prices received from the third party pricing services.
|
(2)
|
Valued at the closing price or unadjusted quoted price in the active market in which the individual securities are traded.
|
|
(3)
|
Valued at the net asset value of the fund, as determined by a pricing vendor or the fund family. The Company has the ability to redeem this investment at net asset value within the near term and therefore classifies this investment within Level 2. This commingled fund invests in United States large cap equities that track the Russell 1000 Index.
|
|
(4)
|
Valued at the net asset value of the fund, either as determined by the closing price in the active market in which the individual fund is traded and classified within Level 1, or as determined by a pricing vendor or the fund family and classified within Level 2. This category includes funds that invest in equities of companies outside of the United States.
|
|
(5)
|
Valued with bid evaluation pricing where the inputs are based on actual trades in active markets, when available, as well as observable market inputs that include actual and comparable trade data, market benchmarks, broker quotes, trading spreads and/or other applicable data.
|
|
(6)
|
Valued at the net asset value of the funds, as determined by a pricing vendor or the fund family. The Company has the ability to redeem these investments at net asset value within the near term and therefore classifies these investments within Level 2. These funds invest in high-grade, short-term, money market instruments.
|
|
(7)
|
Valued at the net asset value of the fund, as determined by the closing price in the active market in which the individual fund is traded. This mutual fund invests in both equity securities and fixed income securities.
|
|
(8)
|
This category includes other pension assets and liabilities such as pending trades and accrued income.
|
The Company believes that there are no significant concentrations of risk within the plan assets as of
February 3, 2019
.
Currently, the Company does not expect to make material contributions to the Pension Plans in 2019. The Company’s actual contributions may differ from planned contributions due to many factors, including changes in tax and other laws, as well as significant differences between expected and actual pension asset performance or interest rates. The expected benefit payments associated with the Pension Plans and SERP Plans, and expected benefit payments, net of retiree contributions, associated with the Postretirement Plans are as follows:
|
(In millions)
|
|
|
||||||||||
|
Fiscal Year
|
Pension Plans
|
SERP Plans
|
Postretirement Plans
|
|||||||||
|
2019
|
$
|
25.5
|
|
$
|
7.4
|
|
$
|
1.1
|
|
|||
|
2020
|
26.1
|
|
8.3
|
|
1.0
|
|
||||||
|
2021
|
27.0
|
|
8.8
|
|
1.0
|
|
||||||
|
2022
|
28.1
|
|
11.6
|
|
0.9
|
|
||||||
|
2023
|
29.1
|
|
10.6
|
|
0.8
|
|
||||||
|
2024-2028
|
164.1
|
|
51.1
|
|
3.1
|
|
||||||
A
1%
change in the assumed medical health care cost trend rate for the Postretirement Plans would not have a material impact on the Company’s net benefit cost for
2018
or the accumulated benefit obligation at
February 3, 2019
.
The Company has savings and retirement plans and a supplemental savings plan for the benefit of its eligible employees in the United States who elect to participate. The Company matches a portion of employee contributions to the plans. The Company also has a defined contribution plan for certain employees associated with certain businesses acquired in the Tommy Hilfiger acquisition, whereby the Company pays a percentage of the contribution for the employee. The Company’s contributions to these plans were $
25.4
million,
$22.1
million and
$19.7
million in
2018
,
2017
and
2016
, respectively.
F-40
PVH CORP.
NOTES TO CONSOLIDATED FINANCIAL STATEMENTS - (Continued)
13. STOCK-BASED COMPENSATION
The Company grants stock-based awards under its 2006 Stock Incentive Plan (the “2006 Plan”). Shares issued as a result of stock-based compensation transactions generally have been funded with the issuance of new shares of the Company’s common stock.
The Company may grant the following types of incentive awards under the 2006 Plan: (i) non-qualified stock options (“stock options”); (ii) incentive stock options; (iii) stock appreciation rights; (iv) restricted stock; (v) restricted stock units (“RSUs”); (vi) performance shares; (vii) performance share units (“PSUs”); and (viii) other stock-based awards. Each award granted under the 2006 Plan is subject to an award agreement that incorporates, as applicable, the exercise price, the term of the award, the periods of restriction, the number of shares to which the award pertains, performance periods and performance measures, and such other terms and conditions as the plan committee determines. Awards granted under the 2006 Plan are classified as equity awards, which are recorded in stockholders’ equity in the Company’s Consolidated Balance Sheets.
Through
February 3, 2019
, the Company has granted under the 2006 Plan (i) service-based stock options, RSUs and restricted stock; and (ii) contingently issuable PSUs and RSUs. All restricted stock granted by the Company was fully vested at the end of 2015.
According to the terms of the 2006 Plan, for purposes of determining the number of shares available for grant, each share underlying a stock option award reduces the number available by
one
share and each share underlying an RSU or PSU award reduces the number available by
two
shares. Total shares available for grant at
February 3, 2019
amounted to
5.1
million shares.
Net income for
2018
,
2017
and
2016
included $
56.2
million,
$44.9
million and
$38.2
million, respectively, of pre-tax expense related to stock-based compensation, with related recognized income tax benefits of $
8.9
million, $
8.8
million and $
11.5
million, respectively.
The Company adopted in 2017 an update to accounting guidance that simplifies several aspects of accounting for share-based payment award transactions, which resulted in the Company’s election to recognize forfeitures as they occur rather than continue to estimate expected forfeitures in determining compensation expense. This accounting change was applied on a modified retrospective basis and resulted in a cumulative-effect adjustment to decrease 2017 beginning retained earnings by $
0.8
million, with an offsetting increase to additional paid in capital of $
1.1
million and an increase to deferred tax assets of $
0.3
million.
The Company receives a tax deduction for certain transactions associated with its stock-based plan awards. The actual income tax benefits realized from these transactions in
2018
,
2017
and
2016
were $
13.2
million, $
27.2
million and
$6.6
million, respectively. The tax benefits realized in 2018 and 2017 included discrete net excess tax benefits of $
4.9
million and $
15.4
million, respectively, which were recognized in the Company’s provision for income taxes. Prior to the Company’s adoption in 2017 of the update to accounting guidance for share-based payment award transactions, the Company recognized excess tax benefits or tax deficiencies in equity as a component of additional paid in capital. Such amount was a net excess tax deficiency of $
7.2
million in 2016.
Stock Options
Stock options granted to employees are generally exercisable in four equal annual installments commencing one year after the date of grant. The underlying stock option award agreements generally provide for accelerated vesting upon the award recipient’s retirement (as defined in the 2006 Plan). Such stock options are granted with a 10-year term and the per share exercise price cannot be less than the closing price of the common stock on the date of grant.
The Company estimates the fair value of stock options at the date of grant using the Black-Scholes-Merton model. The estimated fair value of the stock options granted is expensed over the stock options’ vesting periods.
F-41
PVH CORP.
NOTES TO CONSOLIDATED FINANCIAL STATEMENTS - (Continued)
The following summarizes the assumptions used to estimate the fair value of stock options granted during
2018
,
2017
and
2016
and the resulting weighted average grant date fair value per stock option:
|
|
2018
|
2017
|
2016
|
||||||||
|
Weighted average risk-free interest rate
|
2.78
|
%
|
2.10
|
%
|
1.45
|
%
|
|||||
|
Weighted average expected stock option term (in years)
|
6.25
|
|
6.25
|
|
6.25
|
|
|||||
|
Weighted average Company volatility
|
26.92
|
%
|
29.46
|
%
|
34.54
|
%
|
|||||
|
Expected annual dividends per share
|
$
|
0.15
|
|
$
|
0.15
|
|
$
|
0.15
|
|
||
|
Weighted average grant date fair value per stock option
|
$
|
51.66
|
|
$
|
33.50
|
|
$
|
35.62
|
|
||
The risk-free interest rate is based on United States Treasury yields in effect at the date of grant for periods corresponding to the expected stock option term. The expected stock option term represents the weighted average period of time that stock options granted are expected to be outstanding, based on vesting schedules and the contractual term of the stock options. Company volatility is based on the historical volatility of the Company’s common stock over a period of time corresponding to the expected stock option term. Expected dividends are based on the Company’s common stock cash dividend rate at the date of grant.
The Company has continued to utilize the simplified method to estimate the expected term for its “plain vanilla” stock options granted due to a lack of relevant historical data resulting, in part, from changes in the pool of employees receiving stock option grants. The Company will continue to evaluate the appropriateness of utilizing such method.
Stock option activity for the year was as follows:
|
(In thousands, except years and per stock option data)
|
Stock Options
|
Weighted Average Exercise
Price Per Stock Option
|
Weighted Average Remaining Contractual Life (Years)
|
Aggregate Intrinsic Value
|
||||||||
|
Outstanding at February 4, 2018
|
921
|
|
$
|
102.18
|
|
6.6
|
$
|
45,020
|
|
|||
|
Granted
|
86
|
|
158.53
|
|
|
|
|
|||||
|
Exercised
|
200
|
|
103.04
|
|
|
|
|
|||||
|
Cancelled
|
16
|
|
116.31
|
|
|
|
|
|||||
|
Outstanding at February 3, 2019
|
791
|
|
$
|
107.81
|
|
6.1
|
$
|
6,568
|
|
|||
|
Exercisable at February 3, 2019
|
463
|
|
$
|
102.05
|
|
4.9
|
$
|
4,833
|
|
|||
The aggregate grant date fair value of stock options granted during
2018
,
2017
and
2016
was $
4.4
million, $
4.8
million and $
8.4
million, respectively.
The aggregate grant date fair value of stock options that vested during
2018
,
2017
and
2016
was $
6.5
million, $
7.2
million and $
6.9
million, respectively.
The aggregate intrinsic value of stock options exercised during 2018, 2017 and 2016 was $
10.9
million,
$56.9
million and
$6.9
million, respectively.
At
February 3, 2019
, there was $
4.4
million of unrecognized pre-tax compensation expense related to non-vested stock options, which is expected to be recognized over a weighted average period of
1.1
years.
RSUs
RSUs granted to employees since 2016 generally vest in four equal annual installments commencing one year after the date of grant. Outstanding RSUs granted to employees prior to 2016 generally vest in three annual installments of
25%
,
25%
and
50%
commencing
two
years after the date of grant. Service-based RSUs granted to non-employee directors vest in full
one
year after the date of grant. The underlying RSU award agreements (excluding agreements for non-employee director awards)
F-42
PVH CORP.
NOTES TO CONSOLIDATED FINANCIAL STATEMENTS - (Continued)
generally provide for accelerated vesting upon the award recipient’s retirement (as defined in the 2006 Plan). The fair value of RSUs is equal to the closing price of the Company’s common stock on the date of grant and is expensed over the RSUs’ vesting periods.
RSU activity for the year was as follows:
|
(In thousands, except per RSU data)
|
RSUs
|
Weighted Average
Grant Date
Fair Value Per RSU
|
||||
|
Non-vested at February 4, 2018
|
917
|
|
$
|
103.90
|
|
|
|
Granted
|
339
|
|
157.85
|
|
||
|
Vested
|
328
|
|
107.10
|
|
||
|
Cancelled
|
81
|
|
117.28
|
|
||
|
Non-vested at February 3, 2019
|
847
|
|
$
|
122.97
|
|
|
The aggregate grant date fair value of RSUs granted during
2018
,
2017
and
2016
was $
53.5
million, $
46.0
million and
$38.8
million, respectively. The aggregate grant date fair value of RSUs vested during
2018
,
2017
and
2016
was $
35.1
million,
$28.7
million and
$17.3
million, respectively.
At
February 3, 2019
, there was $
61.6
million of unrecognized pre-tax compensation expense related to non-vested RSUs, which is expected to be recognized over a weighted average period of
1.7
years.
PSUs
Contingently issuable PSUs granted to certain of the Company’s senior executives since 2015 are subject to a three-year performance period. For such awards, the final number of shares to be earned, if any, is contingent upon the Company’s achievement of goals for the applicable performance period, of which 50% is based upon the Company’s absolute stock price growth during the applicable performance period and 50% is based upon the Company’s total shareholder return during the applicable performance period relative to other companies included in the S&P 500 as of the date of grant. For awards granted in 2015, the three-year performance period ended during 2018. Holders of the awards earned an aggregate of
78,000
shares, which was between the target and maximum levels. The Company records expense ratably over the applicable vesting period regardless of whether the market condition is satisfied because the awards are subject to market conditions. The fair value of the awards granted was established for each grant on the grant date using the Monte Carlo simulation model.
The following summarizes the assumptions used to estimate the fair value of PSUs granted during
2018
,
2017
and
2016
and the resulting weighted average grant date fair value per PSU:
|
2018
|
2017
|
2016
|
||||||||||
|
Risk-free interest rate
|
2.62
|
%
|
1.49
|
%
|
1.04
|
%
|
||||||
|
Expected Company volatility
|
29.78
|
%
|
31.29
|
%
|
28.33
|
%
|
||||||
|
Expected annual dividends per share
|
$
|
0.15
|
|
$
|
0.15
|
|
$
|
0.15
|
|
|||
|
Weighted average grant date fair value per PSU
|
$
|
159.53
|
|
$
|
96.81
|
|
$
|
87.16
|
|
|||
Certain of the awards granted in
2018
,
2017
and
2016
are subject to a holding period of one year after the vesting date. For such awards, the grant date fair value was discounted
7.09%
in 2018,
12.67%
in 2017 and
12.99%
in 2016 for the restriction of liquidity, which was calculated using the Chaffe model.
F-43
PVH CORP.
NOTES TO CONSOLIDATED FINANCIAL STATEMENTS - (Continued)
PSU activity for the year was as follows:
|
(In thousands, except per PSU data)
|
PSUs
|
Weighted Average
Grant Date
Fair Value Per PSU
|
||||
|
Non-vested at February 4, 2018
|
197
|
|
$
|
93.97
|
|
|
|
Granted at target
|
44
|
|
159.53
|
|
||
|
Change due to market condition achieved above target
|
32
|
|
101.23
|
|
||
|
Vested
|
78
|
|
101.23
|
|
||
|
Cancelled
|
1
|
|
143.65
|
|
||
|
Non-vested at February 3, 2019
|
194
|
|
$
|
106.76
|
|
|
The aggregate grant date fair value of PSUs granted during
2018
,
2017
and
2016
was $
7.0
million,
$7.0
million and
$6.9
million, respectively. The aggregate grant date fair value of PSUs that vested during 2018 and 2016 was $
4.6
million and
$3.0
million, respectively. No PSUs vested in 2017. PSUs in the above table are subject to market conditions. As such, the non-vested PSUs are reflected at the target level, which is consistent with how expense will be recorded, regardless of the numbers of shares that will actually be earned.
At
February 3, 2019
, there was $
3.8
million of unrecognized pre-tax compensation expense related to non-vested PSUs, which is expected to be recognized over a weighted average period of
0.7
years.
14. STOCKHOLDERS’ EQUITY
The Company’s Board of Directors authorized a $
500.0
million three-year stock repurchase program effective June 3, 2015. On March 21, 2017, the Board of Directors authorized a $
750.0
million increase to the program and extended the program to June 3, 2020. On March 26, 2019, the Board of Directors authorized a further $
750.0
million increase to the program and extended it to June 3, 2023. Repurchases under the program may be made from time to time over the period through open market purchases, accelerated share repurchase programs, privately negotiated transactions or other methods, as the Company deems appropriate. Purchases are made based on a variety of factors, such as price, corporate requirements and overall market conditions, applicable legal requirements and limitations, restrictions under the Company’s debt arrangements, trading restrictions under the Company’s insider trading policy and other relevant factors. The program may be modified by the Board of Directors, including to increase or decrease the repurchase limitation or extend, suspend, or terminate the program, at any time, without prior notice.
During
2018
,
2017
and
2016
, the Company purchased
2.2
million,
2.2
million and
3.2
million shares, respectively, of its common stock under the program in open market transactions for $
300.1
million, $
250.4
million and $
315.1
million, respectively. As of
February 3, 2019
, the repurchased shares were held as treasury stock and $
258.3
million of the authorization remained available for future share repurchases.
Treasury stock activity also includes shares that were withheld principally in conjunction with the settlement of restricted stock, RSUs and PSUs to satisfy tax withholding requirements.
F-44
PVH CORP.
NOTES TO CONSOLIDATED FINANCIAL STATEMENTS - (Continued)
15. ACCUMULATED OTHER COMPREHENSIVE LOSS
The following table presents the changes in AOCL, net of related taxes, by component:
|
(In millions)
|
Foreign currency translation adjustments
|
Net unrealized and realized gain (loss) on effective cash flow hedges
|
Total
|
||||||||
|
Balance at January 29, 2017
|
$
|
(737.7
|
)
|
$
|
26.9
|
|
$
|
(710.8
|
)
|
||
|
Other comprehensive income (loss) before reclassifications
|
490.5
|
|
(1)(2)
|
(116.0
|
)
|
374.5
|
|
||||
|
Less: Amounts reclassified from AOCL
|
—
|
|
(16.9
|
)
|
(16.9
|
)
|
|||||
|
Other comprehensive income (loss)
|
490.5
|
|
(99.1
|
)
|
391.4
|
|
|||||
|
Impact of the U.S. Tax Legislation
(4)
|
(2.2
|
)
|
0.1
|
|
(2.1
|
)
|
|||||
|
Balance at February 4, 2018
|
$
|
(249.4
|
)
|
$
|
(72.1
|
)
|
$
|
(321.5
|
)
|
||
|
Other comprehensive (loss) income before reclassifications
|
(288.2
|
)
|
(1)(3)
|
92.0
|
|
(196.2
|
)
|
||||
|
Less: Amounts reclassified from AOCL
|
—
|
|
(9.8
|
)
|
(9.8
|
)
|
|||||
|
Other comprehensive (loss) income
|
(288.2
|
)
|
101.8
|
|
(186.4
|
)
|
|||||
|
Balance at February 3, 2019
|
$
|
(537.6
|
)
|
$
|
29.7
|
|
$
|
(507.9
|
)
|
||
The following table presents reclassifications from AOCL to earnings:
|
(In millions)
|
Amount Reclassified from AOCL
|
Affected Line Item in the Company’s Consolidated Income Statements
|
|||||||
|
2018
|
2017
|
||||||||
|
Realized (loss) gain on effective cash flow hedges:
|
|||||||||
|
Foreign currency forward exchange contracts (inventory purchases)
|
$
|
(11.6
|
)
|
$
|
(13.6
|
)
|
Cost of goods sold
|
||
|
Interest rate swap agreements
|
1.1
|
|
(6.2
|
)
|
Interest expense
|
||||
|
Less: Tax effect
|
(0.7
|
)
|
(2.9
|
)
|
Income tax expense (benefit)
|
||||
|
Total, net of tax
|
$
|
(9.8
|
)
|
$
|
(16.9
|
)
|
|||
|
(1)
|
Foreign currency translation adjustments included a net gain (loss) on net investment hedges of $
73.1
million and $(
70.8
) million in 2018 and 2017, respectively.
|
|
(2)
|
Favorable foreign currency translation adjustments were principally driven by a weakening of the United States dollar against the euro.
|
|
(3)
|
Unfavorable foreign currency translation adjustments were principally driven by a strengthening of the United States dollar against the euro.
|
|
(4)
|
The stranded tax effects resulting from the U.S. Tax Legislation were reclassified from AOCL to retained earnings as a result of the Company’s early adoption of an update to accounting guidance in the fourth quarter of 2017. The amount of the reclassification was calculated based on the effect of the change in the United States federal corporate income tax rate on the gross deferred tax amounts at the date of the enactment of the U.S. Tax Legislation related to items that remained in AOCL at that time.
|
F-45
PVH CORP.
NOTES TO CONSOLIDATED FINANCIAL STATEMENTS - (Continued)
16. LEASES
The Company leases retail locations, warehouses, distribution centers, showrooms, office space, equipment and a factory in Ethiopia. The leases, excluding equipment leases, generally provide for the payment of real estate taxes and certain other occupancy expenses. Retail location leases generally are renewable and provide for the payment of percentage rentals based on location sales and other costs associated with the leased property.
At
February 3, 2019
, minimum annual rental commitments under noncancelable leases were as follows:
|
(In millions)
|
Capital
Leases
|
Operating
Leases
|
Total
|
||||||||
|
2019
|
$
|
5.6
|
|
$
|
402.4
|
|
$
|
408.0
|
|
||
|
2020
|
4.4
|
|
371.9
|
|
376.3
|
|
|||||
|
2021
|
3.8
|
|
314.0
|
|
317.8
|
|
|||||
|
2022
|
1.8
|
|
255.0
|
|
256.8
|
|
|||||
|
2023
|
0.6
|
|
189.9
|
|
190.5
|
|
|||||
|
Thereafter
|
2.5
|
|
618.7
|
|
621.2
|
|
|||||
|
Total minimum lease payments
|
$
|
18.7
|
|
$
|
2,151.9
|
|
$
|
2,170.6
|
|
||
|
Less: Amount representing interest
|
(2.2
|
)
|
|
|
|
|
|||||
|
Present value of net minimum capital lease payments
|
$
|
16.5
|
|
|
|
|
|
||||
The Company’s retail location leases represent $
1,425.3
million of the total minimum lease payments. The Company’s administrative offices and showrooms located in New York and New Jersey represent $
374.5
million of the total minimum lease payments. The Company’s Europe headquarters and showrooms, the largest of which are located in Amsterdam, the Netherlands, represent $
141.1
million of the total minimum lease payments.
Aggregate future minimum rentals to be received under noncancelable capital and operating subleases were $
0.6
million and $
0.2
million, respectively, at
February 3, 2019
.
Rent expense was as follows:
|
(In millions)
|
2018
|
2017
|
2016
|
||||||||
|
Minimum
|
$
|
465.3
|
|
$
|
455.2
|
|
$
|
421.8
|
|
||
|
Percentage and other
|
128.6
|
|
103.0
|
|
90.9
|
|
|||||
|
Less: Sublease rental income
|
(1.4
|
)
|
(1.8
|
)
|
(4.9
|
)
|
|||||
|
Total
|
$
|
592.5
|
|
$
|
556.4
|
|
$
|
507.8
|
|
||
The gross book value of assets under capital leases, which are classified within property, plant and equipment in the Company’s Consolidated Balance Sheets, amounted to $
37.0
million and
$34.5
million as of
February 3, 2019
and
February 4, 2018
, respectively. Accumulated amortization related to assets under capital leases amounted to $
21.6
million and
$18.8
million as of
February 3, 2019
and
February 4, 2018
, respectively. The Company includes amortization of assets under capital leases in depreciation and amortization expense. The Company did not incur any expense in percentage rentals under capital leases during
2018
or
2017
.
17. EXIT ACTIVITY COSTS
Calvin Klein Restructuring Costs
The Company announced on January 10, 2019 a restructuring in connection with strategic changes for its
Calvin Klein business (the “Calvin Klein restructuring”). The strategic changes include (i) the closure of the
CALVIN KLEIN 205 W39 NYC
brand (formerly
Calvin Klein Collection
), (ii) the closure of the flagship store on Madison Avenue in New York, New York, (iii) the restructuring of the Calvin Klein creative and design teams globally, and (iv) the consolidation of operations for the men’s
F-46
PVH CORP.
NOTES TO CONSOLIDATED FINANCIAL STATEMENTS - (Continued)
Calvin Klein Sportswear and Calvin Klein Jeans businesses. In connection with the Calvin Klein restructuring, the Company recorded pre-tax costs during 2018 and expects to incur total costs as follows:
|
(In millions)
|
Total Costs Expected to be Incurred
|
Costs Incurred During 2018
|
|||||
|
Severance, termination benefits and other employee costs
|
$
|
65.7
|
|
$
|
27.3
|
|
|
|
Long-lived asset impairments
|
55.0
|
|
(1)
|
6.9
|
|
||
|
Lease/contract termination and other costs
|
45.0
|
|
4.3
|
|
|||
|
Inventory markdowns
|
5.0
|
|
2.2
|
|
|||
|
Total
|
$
|
170.7
|
|
$
|
40.7
|
|
|
(1)
Includes the estimated impact of the closure of the flagship store on Madison Avenue in New York, New York, which will be accounted for as an asset impairment following the Company’s adoption of the new lease accounting guidance in the first quarter of 2019.
Of the charges for severance, termination benefits and other employee costs, long-lived asset impairments and lease/contract termination and other costs incurred during 2018,
$18.9 million
relate to SG&A expenses of the Calvin Klein North America segment and
$19.6 million
relate to SG&A expenses of the Calvin Klein International segment. The charges for inventory markdowns incurred during 2018 were recorded in cost of goods sold of the Company’s Calvin Klein International segment. The Company expects to incur total costs of
$170.7 million
through the end of 2019 in connection with the restructuring activities, of which approximately
$80 million
is estimated to relate to the Calvin Klein North America segment and approximately
$90 million
is estimated to relate to the Calvin Klein International segment. Please see
Note 20
, “
Segment Data
,” for further discussion of the Company’s reportable segments.
Please see
Note 11
, “
Fair Value Measurements
,” for further discussion of the long-lived asset impairments recorded during 2018.
The liabilities at February 3, 2019 related to these costs were principally recorded in accrued expenses in the Company’s Consolidated Balance Sheets and were as follows:
|
(In millions)
|
Liability at 2/4/18
|
Costs Incurred During 2018
|
Costs Paid During 2018
|
Liability at 2/3/19
|
|||||||||||
|
Severance, termination benefits and other employee costs
|
$
|
—
|
|
$
|
27.3
|
|
$
|
1.5
|
|
$
|
25.8
|
|
|||
|
Lease/contract termination and other costs
|
—
|
|
4.3
|
|
2.0
|
|
2.3
|
|
|||||||
|
Total
|
$
|
—
|
|
$
|
31.6
|
|
$
|
3.5
|
|
$
|
28.1
|
|
|||
F-47
PVH CORP.
NOTES TO CONSOLIDATED FINANCIAL STATEMENTS - (Continued)
18. NET INCOME PER COMMON SHARE
The Company computed its basic and diluted net income per common share as follows:
|
(In millions, except per share data)
|
2018
|
2017
|
2016
|
||||||||
|
Net income attributable to PVH Corp.
|
$
|
746.4
|
|
$
|
537.8
|
|
$
|
549.0
|
|
||
|
Weighted average common shares outstanding for basic net income per common share
|
76.5
|
|
77.6
|
|
80.2
|
|
|||||
|
Weighted average impact of dilutive securities
|
0.8
|
|
1.0
|
|
0.7
|
|
|||||
|
Total shares for diluted net income per common share
|
77.3
|
|
78.6
|
|
80.9
|
|
|||||
|
Basic net income per common share attributable to PVH Corp.
|
$
|
9.75
|
|
$
|
6.93
|
|
$
|
6.84
|
|
||
|
Diluted net income per common share attributable to PVH Corp.
|
$
|
9.65
|
|
$
|
6.84
|
|
$
|
6.79
|
|
||
Potentially dilutive securities excluded from the calculation of diluted net income per common share as the effect would be anti-dilutive were as follows:
|
(In millions)
|
2018
|
2017
|
2016
|
|||||
|
Weighted average potentially dilutive securities
|
0.4
|
|
0.5
|
|
0.8
|
|
||
Shares underlying contingently issuable awards that have not met the necessary conditions as of the end of a reporting period are not included in the calculation of diluted net income per common share for that period. The Company had contingently issuable awards outstanding that did not meet the performance conditions as of
February 3, 2019
,
February 4, 2018
and
January 29, 2017
and, therefore, were excluded from the calculation of diluted net income per common share for each applicable year. The maximum number of potentially dilutive shares that could be issued upon vesting for such awards was
0.3
million,
0.1
million and
0.3
million as of
February 3, 2019
,
February 4, 2018
and
January 29, 2017
, respectively. These amounts were also excluded from the computation of weighted average potentially dilutive securities in the table above.
19. NONCASH INVESTING AND FINANCING TRANSACTIONS
Omitted from the Company’s Consolidated Statement of Cash Flows for
2018
were capital expenditures related to property, plant and equipment of $
43.7
million, which will not be paid until 2019. The Company paid
$41.9
million in cash during
2018
related to property, plant and equipment that was acquired in
2017
. This amount was omitted from the Company’s Consolidated Statement of Cash Flows for
2017
. The Company paid
$35.6
million in cash during
2017
related to property, plant and equipment that was acquired in
2016
. This amount was omitted from the Company’s Consolidated Statement of Cash Flows for
2016
.
Omitted from purchases of property, plant and equipment in the Company’s Consolidated Statements of Cash Flows for
2018
,
2017
and
2016
were $
6.0
million,
$3.6
million and
$6.8
million, respectively, of assets acquired through capital leases.
The Company completed the acquisition of the Geoffrey Beene tradename during 2018. Omitted from acquisitions, net of cash acquired in the Company’s Consolidated Statement of Cash Flows for 2018 was $
0.7
million of acquisition consideration related to royalties prepaid to Geoffrey Beene by the Company under the prior license agreement and $
0.4
million of liabilities assumed by the Company.
Omitted from acquisition of treasury shares in the Company’s Consolidated Statement of Cash Flows for 2017 were $
1.5
million of shares repurchased under the stock repurchase program for which the trades occurred but remained unsettled as of February 4, 2018.
The Company recorded a loss of $
8.1
million during 2017 to write-off previously capitalized debt issuance costs in connection with the early redemption of its 4 1/2% senior notes due 2022.
F-48
PVH CORP.
NOTES TO CONSOLIDATED FINANCIAL STATEMENTS - (Continued)
The Company recorded a loss of $
11.2
million during 2016 to write-off previously capitalized debt issuance costs in connection with the amendment of its credit facilities.
The Company completed the TH China acquisition during 2016. Included in the acquisition consideration was the elimination of a $
2.8
million pre-acquisition receivable owed to the Company by TH China.
Omitted from investments in unconsolidated affiliates in the Company’s Consolidated Statement of Cash Flows for 2016 was a noncash increase in the investment balance related to the Company’s PVH Mexico joint venture of $
64.3
million resulting from the deconsolidation of the Mexico business during 2016. Please see
Note 5
, “
Investments in Unconsolidated Affiliates
,” for further discussion.
20. SEGMENT DATA
The Company manages its operations through its operating divisions, which are presented as
six
reportable segments: (i) Tommy Hilfiger North America; (ii) Tommy Hilfiger International; (iii) Calvin Klein North America; (iv) Calvin Klein International; (v) Heritage Brands Wholesale; and (vi) Heritage Brands Retail.
Tommy Hilfiger North America Segment
- This segment consists of the Company’s Tommy Hilfiger North America division. This segment derives revenue principally from (i) marketing
TOMMY HILFIGER
branded apparel and related products at wholesale in the United States and Canada, primarily to department stores, warehouse clubs, and off-price and independent retailers, as well as digital commerce sites operated by the department store customers and pure play digital commerce retailers; (ii) operating retail stores, which are primarily located in premium outlet centers in the United States and Canada, and a digital commerce site in the United States, which sell
TOMMY HILFIGER
branded apparel, accessories and related products; and (iii) licensing and similar arrangements relating to the use by third parties of the
TOMMY HILFIGER
brand names for a broad array of product categories in North America. This segment also includes, since December 2016, the Company’s proportionate share of the net income or loss of its investment in its unconsolidated foreign affiliate in Mexico relating to the affiliate’s Tommy Hilfiger business.
Tommy Hilfiger International Segment
- This segment consists of the Company’s Tommy Hilfiger International division. This segment derives revenue principally from (i) marketing
TOMMY HILFIGER
branded apparel and related products at wholesale principally in Europe, China and Japan, primarily to department and specialty stores, and digital commerce sites operated by department store customers and pure play digital commerce retailers, as well as through distributors and franchisees; (ii) operating retail stores and concession locations in Europe, China and Japan and international digital commerce sites, which sell
TOMMY HILFIGER
branded apparel, accessories and related products; and (iii) licensing and similar arrangements relating to the use by third parties of the
TOMMY HILFIGER
brand names for a broad array of product categories outside of North America. This segment also includes the Company’s proportionate share of the net income or loss of its investments in its unconsolidated Tommy Hilfiger foreign affiliates in Brazil and India and its unconsolidated foreign affiliate in Australia relating to the affiliate’s Tommy Hilfiger business. This segment included the Company’s proportionate share of the net income or loss of its investment in TH China until April 13, 2016, on which date the Company began to consolidate the operations as a wholly owned subsidiary of the Company in conjunction with the TH China acquisition. Please see
Note 3
, “
Acquisitions
,” for further discussion.
Calvin Klein North America Segment
- This segment consists of the Company’s Calvin Klein North America division. This segment derives revenue principally from (i) marketing
CALVIN KLEIN
branded apparel and related products at wholesale in the United States and Canada, primarily to warehouse clubs, department and specialty stores, and off-price and independent retailers, as well as digital commerce sites operated by department store customers and pure play digital commerce retailers; (ii) operating retail stores, which are primarily located in premium outlet centers, and digital commerce sites in the United States and Canada, which sell
CALVIN KLEIN
branded apparel, accessories and related products; and (iii) licensing and similar arrangements relating to the use by third parties of the
CALVIN KLEIN
brand names for a broad array of product categories in North America. This segment also includes, since December 2016, the Company’s proportionate share of the net income or loss of its investment in its unconsolidated foreign affiliate in Mexico relating to the affiliate’s Calvin Klein business.
Calvin Klein International Segment -
This segment consists of the Company’s Calvin Klein International division. This segment derives revenue principally from (i) marketing
CALVIN KLEIN
branded apparel and related products at
F-49
PVH CORP.
NOTES TO CONSOLIDATED FINANCIAL STATEMENTS - (Continued)
wholesale principally in Europe, Asia and Brazil, primarily to department and specialty stores, and digital commerce sites operated by department store customers and pure play digital commerce retailers, as well as through distributors and franchisees; (ii) operating retail stores, concession locations and digital commerce sites in Europe, Asia and Brazil, which sell
CALVIN KLEIN
branded apparel, accessories and related products; and (iii) licensing and similar arrangements relating to the use by third parties of the
CALVIN KLEIN
brand names for a broad array of product categories outside of North America. This segment also includes the Company’s proportionate share of the net income or loss of its investments in its unconsolidated foreign affiliate in Australia relating to the affiliate’s Calvin Klein business and its unconsolidated Calvin Klein foreign affiliate in India.
Heritage Brands Wholesale Segment
- This segment consists of the Company’s Heritage Brands Wholesale division. This segment derives revenue primarily from the marketing to department, chain and specialty stores, warehouse clubs, and mass market, off-price and independent retailers, as well as digital commerce sites operated by select wholesale partners and pure play digital commerce retailers in North America of (i) men’s dress shirts and neckwear under various owned and licensed brand names, including several private label brands; (ii) men’s sportswear principally under the brand names
Van Heusen
,
IZOD, ARROW
and
DKNY
; (iii) men’s, women’s and children’s swimwear, pool and deck footwear, and swim-related products and accessories under the
Speedo
trademark; and (iv) women’s intimate apparel under the
Warner’s
,
Olga
and
True&Co.
brands. Additionally, this segment derives revenue from Company operated digital commerce sites in the United States through
SpeedoUSA
.com,
TrueAndCo
.com,
VanHeusen
.com,
IZOD
.com and
styleBureau
.com. This segment also includes the Company’s proportionate share of the net income or loss of its investments in its unconsolidated foreign affiliates in Australia and, since December 2016, in Mexico relating to the affiliates’ Heritage Brands businesses.
Heritage Brands Retail Segment -
This segment consists of the Company’s Heritage Brands Retail division. This segment derives revenue principally from operating retail stores, primarily located in outlet centers throughout the United States and Canada, which primarily sell apparel, accessories and related products
.
A majority of the Company’s Heritage Brands stores offer a broad selection of
Van Heusen
men’s and women’s apparel, along with a limited selection of the Company’s dress shirt and neckwear offerings, and
IZOD Golf
,
Warner’s
and, to a lesser extent,
Speedo
products. The majority of these stores feature multiple brand names on the store signage, with the remaining stores operating under the
Van Heusen
name.
F-50
PVH CORP.
NOTES TO CONSOLIDATED FINANCIAL STATEMENTS - (Continued)
The Company’s revenue by segment was as follows:
|
(In millions)
|
2018
|
(1)
|
2017
|
(1)
|
2016
|
(1)
|
|||||||
|
Revenue – Tommy Hilfiger North America
|
|
|
|
|
|
|
|||||||
|
Net sales
|
$
|
1,574.3
|
|
$
|
1,482.2
|
|
$
|
1,502.4
|
|
||||
|
Royalty revenue
|
76.2
|
|
68.9
|
|
48.9
|
|
|||||||
|
Advertising and other revenue
|
18.7
|
|
16.7
|
|
12.0
|
|
|||||||
|
Total
|
1,669.2
|
|
1,567.8
|
|
1,563.3
|
|
|||||||
|
Revenue – Tommy Hilfiger International
|
|
|
|
|
|
|
|||||||
|
Net sales
|
2,599.7
|
|
2,268.0
|
|
1,899.4
|
|
|||||||
|
Royalty revenue
|
52.7
|
|
47.8
|
|
44.5
|
|
|||||||
|
Advertising and other revenue
|
22.9
|
|
9.6
|
|
3.6
|
|
|||||||
|
Total
|
2,675.3
|
|
2,325.4
|
|
1,947.5
|
|
|||||||
|
Revenue – Calvin Klein North America
|
|
|
|
||||||||||
|
Net sales
|
1,599.9
|
|
1,511.3
|
|
1,513.0
|
|
|||||||
|
Royalty revenue
|
143.6
|
|
146.4
|
|
131.7
|
|
|||||||
|
Advertising and other revenue
|
49.8
|
|
50.1
|
|
45.2
|
|
|||||||
|
Total
|
1,793.3
|
|
1,707.8
|
|
1,689.9
|
|
|||||||
|
Revenue – Calvin Klein International
|
|
|
|
|
|
|
|||||||
|
Net sales
|
1,827.9
|
|
1,645.0
|
|
1,346.2
|
|
|||||||
|
Royalty revenue
|
78.9
|
|
80.0
|
|
72.9
|
|
|||||||
|
Advertising and other revenue
|
31.1
|
|
28.8
|
|
26.2
|
|
|||||||
|
Total
|
1,937.9
|
|
1,753.8
|
|
1,445.3
|
|
|||||||
|
Revenue – Heritage Brands Wholesale
|
|
|
|
|
|
|
|||||||
|
Net sales
|
1,293.2
|
|
1,274.4
|
|
1,271.6
|
|
|||||||
|
Royalty revenue
|
20.5
|
|
19.5
|
|
20.3
|
|
|||||||
|
Advertising and other revenue
|
3.7
|
|
3.5
|
|
3.9
|
|
|||||||
|
Total
|
1,317.4
|
|
1,297.4
|
|
1,295.8
|
|
|||||||
|
Revenue – Heritage Brands Retail
|
|
|
|
|
|
|
|||||||
|
Net sales
|
259.2
|
|
258.5
|
|
258.8
|
|
|||||||
|
Royalty revenue
|
4.0
|
|
3.7
|
|
2.3
|
|
|||||||
|
Advertising and other revenue
|
0.5
|
|
0.4
|
|
0.2
|
|
|||||||
|
Total
|
263.7
|
|
262.6
|
|
261.3
|
|
|||||||
|
Total Revenue
|
|
|
|
|
|
|
|||||||
|
Net sales
|
9,154.2
|
|
8,439.4
|
|
7,791.4
|
|
|||||||
|
Royalty revenue
|
375.9
|
|
366.3
|
|
320.6
|
|
|||||||
|
Advertising and other revenue
|
126.7
|
|
109.1
|
|
91.1
|
|
|||||||
|
Total
(2)
|
$
|
9,656.8
|
|
$
|
8,914.8
|
|
$
|
8,203.1
|
|
||||
|
(1)
|
Revenue was impacted by fluctuations of the United States dollar against foreign currencies in which the Company transacts significant levels of business. Please see section entitled “Results of Operations” in Management’s Discussion and Analysis of Financial Condition and Results of Operations included in Item 7 of this report for further discussion.
|
|
(2)
|
No single customer accounted for more than
10%
of the Company’s revenue in
2018
,
2017
or
2016
.
|
F-51
PVH CORP.
NOTES TO CONSOLIDATED FINANCIAL STATEMENTS - (Continued)
The Company’s revenue by distribution channel was as follows:
|
(In millions)
|
2018
|
2017
|
2016
|
||||||||
|
Wholesale net sales
|
$
|
4,969.6
|
|
$
|
4,504.3
|
|
$
|
4,195.9
|
|
||
|
Retail net sales
|
4,184.6
|
|
3,935.1
|
|
3,595.5
|
|
|||||
|
Net sales
|
9,154.2
|
|
8,439.4
|
|
7,791.4
|
|
|||||
|
Royalty revenue
|
375.9
|
|
366.3
|
|
320.6
|
|
|||||
|
Advertising and other revenue
|
126.7
|
|
109.1
|
|
91.1
|
|
|||||
|
Total
|
$
|
9,656.8
|
|
$
|
8,914.8
|
|
$
|
8,203.1
|
|
||
The Company has not disclosed net sales by product category as it is impracticable to do so.
The Company’s income before interest and taxes by segment was as follows:
|
(In millions)
|
2018
|
(1)
|
2017
|
(1)
|
2016
|
(1)
|
|||||||||||
|
Income before interest and taxes – Tommy Hilfiger North America
|
$
|
233.8
|
|
$
|
97.0
|
|
(5)(6)(7)
|
$
|
135.8
|
|
(11)
|
||||||
|
Income before interest and taxes – Tommy Hilfiger International
|
377.1
|
|
(3)
|
221.5
|
|
(3)(5)(6)
|
328.3
|
|
(12)(13)
|
||||||||
|
Income before interest and taxes – Calvin Klein North America
|
166.7
|
|
(4)
|
184.0
|
|
123.9
|
|
(14)
|
|||||||||
|
Income before interest and taxes – Calvin Klein International
|
211.5
|
|
(4)
|
226.5
|
|
209.6
|
|
||||||||||
|
Income before interest and taxes – Heritage Brands Wholesale
|
83.3
|
|
96.7
|
|
90.2
|
|
|||||||||||
|
Income before interest and taxes – Heritage Brands Retail
|
7.4
|
|
7.6
|
|
8.8
|
|
|||||||||||
|
Loss before interest and taxes – Corporate
(2)
|
(188.1
|
)
|
(200.9
|
)
|
(8)(9)(10)
|
(107.4
|
)
|
(15)
|
|||||||||
|
Income before interest and taxes
|
$
|
891.7
|
|
|
$
|
632.4
|
|
$
|
789.2
|
|
|
||||||
|
(1)
|
Income (loss) before interest and taxes was impacted by fluctuations of the United States dollar against foreign currencies in which the Company transacts significant levels of business. Please see section entitled “Results of Operations” in Management’s Discussion and Analysis of Financial Condition and Results of Operations included in Item 7 of this report for further discussion.
|
|
(2)
|
Includes corporate expenses not allocated to any reportable segments, the Company’s proportionate share of the net income or loss of its investments in Gazal and Karl Lagerfeld and the results of PVH Ethiopia. Corporate expenses represent overhead operating expenses and include expenses for senior corporate management, corporate finance, information technology related to corporate infrastructure, certain digital investments, actuarial gains and losses on the Company’s Pension Plans, SERP Plans and Postretirement Plans and gains and losses from changes in the fair value of foreign currency option contracts. Actuarial (losses) gains on the Company’s Pension Plans, SERP Plans and Postretirement Plans totaled $(
15.0
) million, $(
2.5
) million and $
39.1
million in
2018
,
2017
and
2016
, respectively.
|
|
(3)
|
Income before interest and taxes for 2018 and 2017 included costs of $
23.6
million and $
26.9
million, respectively, associated with the TH China acquisition, primarily consisting of noncash amortization of short-lived assets. Please see
Note 3
, “
Acquisitions
,” for further discussion.
|
|
(4)
|
Income before interest and taxes for 2018 included costs of $
40.7
million incurred in connection with the Calvin Klein restructuring. Such costs were included in the Company’s segments as follows: $
18.9
million in Calvin Klein North America and $
21.8
million in Calvin Klein International. Please see
Note 17
, “
Exit Activity Costs
,” for further discussion.
|
|
(5)
|
Income before interest and taxes for 2017 included costs of $
82.9
million incurred in connection with an amendment to Mr. Tommy Hilfiger’s employment agreement pursuant to which the Company made a cash buyout
|
F-52
PVH CORP.
NOTES TO CONSOLIDATED FINANCIAL STATEMENTS - (Continued)
of a portion of the future payments to Mr. Hilfiger (the “Mr. Hilfiger amendment”). Such costs were included in the Company’s segments as follows: $
34.7
million in Tommy Hilfiger North America and $
48.2
million in Tommy Hilfiger International.
|
(6)
|
Income before interest and taxes for 2017 included costs of $
54.2
million associated with the agreements to restructure the Company’s supply chain relationship with Li & Fung Trading Limited (“Li & Fung”), under which the Company terminated its non-exclusive buying agency agreement with Li & Fung in 2017 (the “Li & Fung termination”). Such costs were included in the Company’s segments as follows: $
31.3
million in Tommy Hilfiger North America and $
22.9
million in Tommy Hilfiger International.
|
|
(7)
|
Income before interest and taxes for 2017 included costs of $
19.2
million associated with the relocation of the Tommy Hilfiger office in New York, including noncash depreciation expense.
|
|
(8)
|
Loss before interest and taxes for 2017 included costs of $
23.9
million related to the early redemption of the Company’s $700 million 4 1/2% senior notes due 2022. Please see
Note 8
, “
Debt
,” for further discussion.
|
|
(9)
|
Loss before interest and taxes for 2017 included net costs of $
8.0
million associated with the consolidation within the Company’s warehouse and distribution network in North America, which included a $
3.1
million gain on the sale of a warehouse and distribution center.
|
|
(10)
|
Loss before interest and taxes for 2017 included costs of $
9.4
million related to the noncash settlement of certain of the Company’s benefit obligations related to its Pension Plans as a result of an annuity purchased for certain participants, under which such obligations were transferred to an insurer. Please see
Note 12
, “
Retirement and Benefit Plans
,” for further discussion.
|
|
(11)
|
Income before interest and taxes for 2016 included costs of $
11.0
million associated with the early termination of the previous license agreement for the Tommy Hilfiger men’s tailored clothing business in North America (the “TH men’s tailored license termination”) in order to consolidate with Peerless Clothing International, Inc. the Company’s men’s tailored businesses for all of its brands in North America.
|
|
(12)
|
Income before interest and taxes for 2016 included a gain of $
18.1
million associated with a payment made to the Company to exit a
TOMMY HILFIGER
flagship store in Europe.
|
|
(13)
|
Income before interest and taxes for 2016 included a noncash gain of $
153.1
million to write up the Company’s equity investment in TH China to fair value in connection with the TH China acquisition. Partially offsetting the gain were acquisition related costs of $
76.9
million, principally consisting of valuation adjustments and amortization of short-lived assets, and a one-time cost of $
5.9
million recorded on the Company’s equity investment in TH China. Please see
Note 3
, “
Acquisitions
,” for further discussion.
|
|
(14)
|
Income before interest and taxes for 2016 included a noncash loss of $
81.8
million related to the Mexico deconsolidation, including $
56.7
million related to foreign currency translation adjustment losses previously recorded in AOCL. Please see
Note 5
, “
Investments in Unconsolidated Affiliates
,” for further discussion.
|
|
(15)
|
Loss before interest and taxes for 2016 included costs of $
15.8
million related to the Company’s amendment of its 2014 facilities. Please see
Note 8
, “
Debt
,” for further discussion.
|
Intersegment transactions primarily consist of transfers of inventory principally from the Heritage Brands Wholesale segment to the Heritage Brands Retail segment, the Tommy Hilfiger North America segment and the Calvin Klein North America segment. These transfers are recorded at cost plus a standard markup percentage. Such markup percentage on ending inventory is eliminated principally in the Heritage Brands Retail segment, the Tommy Hilfiger North America segment and the Calvin Klein North America Segment.
F-53
PVH CORP.
NOTES TO CONSOLIDATED FINANCIAL STATEMENTS - (Continued)
The Company’s identifiable assets by segment were as follows:
|
(In millions)
|
2018
|
2017
|
2016
|
||||||||||
|
Identifiable Assets
(1)
|
|
|
|
||||||||||
|
Tommy Hilfiger North America
|
$
|
1,330.5
|
|
$
|
1,276.5
|
|
$
|
1,229.8
|
|
||||
|
Tommy Hilfiger International
|
3,949.3
|
|
4,047.3
|
|
3,481.3
|
|
|||||||
|
Calvin Klein North America
|
1,817.9
|
|
1,836.9
|
|
1,752.1
|
|
|||||||
|
Calvin Klein International
|
3,114.9
|
|
3,138.0
|
|
2,821.0
|
|
|||||||
|
Heritage Brands Wholesale
|
1,178.1
|
|
1,123.5
|
|
1,203.5
|
|
|||||||
|
Heritage Brands Retail
|
86.6
|
|
81.6
|
|
75.5
|
|
|||||||
|
Corporate
(2)
|
386.4
|
|
381.9
|
|
504.7
|
|
|||||||
|
Total
|
$
|
11,863.7
|
|
$
|
11,885.7
|
|
$
|
11,067.9
|
|
||||
|
Depreciation and Amortization
|
|
|
|
|
|
|
|||||||
|
Tommy Hilfiger North America
|
$
|
37.9
|
|
$
|
45.1
|
|
$
|
35.3
|
|
||||
|
Tommy Hilfiger International
(3)
|
133.9
|
|
124.5
|
|
139.2
|
|
|||||||
|
Calvin Klein North America
|
41.5
|
|
43.8
|
|
47.6
|
|
|||||||
|
Calvin Klein International
|
90.6
|
|
83.1
|
|
70.5
|
|
|||||||
|
Heritage Brands Wholesale
|
14.9
|
|
14.3
|
|
15.6
|
|
|||||||
|
Heritage Brands Retail
|
5.6
|
|
5.3
|
|
5.4
|
|
|||||||
|
Corporate
|
10.4
|
|
8.8
|
|
8.2
|
|
|||||||
|
Total
|
$
|
334.8
|
|
$
|
324.9
|
|
$
|
321.8
|
|
||||
|
Identifiable Capital Expenditures
(4)
|
|
|
|
|
|
|
|||||||
|
Tommy Hilfiger North America
(5)
|
$
|
56.1
|
|
$
|
82.0
|
|
$
|
26.9
|
|
||||
|
Tommy Hilfiger International
|
143.9
|
|
126.7
|
|
82.0
|
|
|||||||
|
Calvin Klein North America
|
36.0
|
|
36.8
|
|
39.3
|
|
|||||||
|
Calvin Klein International
|
102.7
|
|
96.6
|
|
79.5
|
|
|||||||
|
Heritage Brands Wholesale
|
15.8
|
|
8.0
|
|
14.1
|
|
|||||||
|
Heritage Brands Retail
|
8.5
|
|
4.2
|
|
7.0
|
|
|||||||
|
Corporate
|
18.3
|
|
10.1
|
|
8.9
|
|
|||||||
|
Total
|
$
|
381.3
|
|
$
|
364.4
|
|
$
|
257.7
|
|
||||
|
(1)
|
Identifiable assets included the impact of changes in foreign currency exchange rates.
|
|
(2)
|
The changes in Corporate identifiable assets in 2017 were primarily due to changes in cash and cash equivalents.
|
|
(3)
|
Depreciation and amortization in 2018, 2017 and 2016 included $
24.6
million, $
26.8
million and $
47.1
million, respectively, related to the amortization of intangible assets recorded in connection with the TH China acquisition. Please see
Note 3
, “
Acquisitions
,” for further discussion.
|
|
(4)
|
Capital expenditures in
2018
included $
43.7
million of accruals that will not be paid until 2019. Capital expenditures in
2017
included $
41.9
million of accruals that were not paid until
2018
. Capital expenditures in
2016
included $
35.6
million of accruals that were not paid until
2017
.
|
|
(5)
|
The increase in Tommy Hilfiger North America capital expenditures in 2017 was primarily driven by the relocation of the Tommy Hilfiger office in New York.
|
F-54
PVH CORP.
NOTES TO CONSOLIDATED FINANCIAL STATEMENTS - (Continued)
Property, plant and equipment, net based on the location where such assets are held, was as follows:
|
(In millions)
|
2018
(1)
|
2017
(1)
|
2016
(1)
|
||||||||
|
Domestic
|
$
|
500.5
|
|
$
|
449.2
|
|
$
|
412.8
|
|
||
|
Canada
|
28.8
|
|
30.0
|
|
31.0
|
|
|||||
|
Europe
|
362.7
|
|
325.5
|
|
230.5
|
|
|||||
|
Asia
|
73.4
|
|
73.8
|
|
66.8
|
|
|||||
|
Other foreign
|
19.1
|
|
21.3
|
|
18.8
|
|
|||||
|
Total
|
$
|
984.5
|
|
$
|
899.8
|
|
$
|
759.9
|
|
||
|
(1)
|
Property, plant and equipment, net included the impact of changes in foreign currency exchange rates.
|
Revenue, based on location of origin, was as follows:
|
(In millions)
|
2018
(1)
|
2017
(1)
|
2016
(1)
|
||||||||
|
Domestic
|
$
|
4,481.3
|
|
$
|
4,290.1
|
|
$
|
4,226.6
|
|
||
|
Canada
|
528.8
|
|
512.2
|
|
484.5
|
|
|||||
|
Europe
|
3,362.1
|
|
2,907.2
|
|
2,372.7
|
|
|||||
|
Asia
|
1,163.7
|
|
1,059.3
|
|
910.4
|
|
|||||
|
Other foreign
(2)
|
120.9
|
|
146.0
|
|
208.9
|
|
|||||
|
Total
|
$
|
9,656.8
|
|
$
|
8,914.8
|
|
$
|
8,203.1
|
|
||
|
(1)
|
Revenue was impacted by fluctuations of the United States dollar against foreign currencies in which the Company transacts significant levels of business. Please see section entitled “Results of Operations” in Management’s Discussion and Analysis of Financial Condition and Results of Operations included in Item 7 of this report for further discussion.
|
|
(2)
|
Other foreign revenue in 2017 included the revenue reduction resulting from the Mexico deconsolidation in the fourth quarter of 2016. Please see
Note 5
, “
Investments in Unconsolidated Affiliates
,” for further discussion of the Mexico deconsolidation.
|
21. GUARANTEES
The Company is deemed to have guaranteed lease payments for substantially all G. H. Bass & Co. (“Bass”) retail stores included in the 2013 sale of substantially all of the assets of the Company’s Bass business pursuant to the terms of noncancelable leases expiring on various dates through
2022
. These obligations deemed to be guaranteed include minimum rent payments and relate to leases that commenced prior to the sale of the Bass assets. In certain instances, the Company’s obligations remain in effect when an option is exercised to extend the term of the lease. The maximum amount deemed to have been guaranteed for all leases as of
February 3, 2019
was $
9.0
million and the Company has the right to seek recourse from the buyer of the Bass assets for the full amount. The liability for the guaranteed lease payments was immaterial as of
February 3, 2019
and
February 4, 2018
.
The Company has guaranteed a portion of the respective debt and other obligations of its joint venture in Australia and one of its joint ventures in India. The maximum amount guaranteed as of
February 3, 2019
was approximately $
11.0
million, which is subject to exchange rate fluctuation.
The guarantees are in effect for the entire terms of the respective obligations. The liability for these guarantee obligations was immaterial as of
February 3, 2019
and
February 4, 2018
.
The Company has guaranteed to a financial institution the repayment of a store security deposit in Japan paid to a landlord on behalf of the Company. The amount guaranteed as of
February 3, 2019
was approximately $
4.6
million, which is subject to exchange rate fluctuation. The Company has the right to seek recourse from the landlord for the full amount. The guarantee expires on March 28, 2022. The liability for this guarantee obligation was immaterial as of
February 3, 2019
.
F-55
PVH CORP.
NOTES TO CONSOLIDATED FINANCIAL STATEMENTS - (Continued)
The Company has guaranteed the payment of amounts on behalf of certain other parties, none of which are material individually or in the aggregate.
22. OTHER COMMENTS
Included in accrued expenses in the Company’s Consolidated Balance Sheets were certain incentive compensation accruals of $
99.4
million and $
108.9
million as of
February 3, 2019
and
February 4, 2018
, respectively.
The Company’s asset retirement liabilities are included in other liabilities in the Company’s Consolidated Balance Sheets and relate to the Company’s obligation to dismantle or remove leasehold improvements from leased office, retail store or warehouse locations at the end of a lease term in order to restore a facility to a condition specified in the lease agreement. The Company records the fair value of the liability for asset retirement obligations in the period in which it is legally or contractually incurred. Upon initial recognition of the asset retirement liability, an asset retirement cost is capitalized by increasing the carrying amount of the asset by the same amount as the liability. In periods subsequent to initial measurement, the asset retirement cost is recognized as expense through depreciation over the asset’s useful life. Changes in the liability for the asset retirement obligations are recognized for the passage of time and revisions to either the timing or the amount of estimated cash flows. Accretion expense is recognized in SG&A expenses for the impacts of increasing the discounted fair value to its estimated settlement value.
The following table presents the activity related to the Company’s asset retirement liabilities, included in other liabilities in the Company’s Consolidated Balance Sheets, for each of the last two years:
|
(In millions)
|
2018
|
2017
|
|||||
|
Balance at beginning of year
|
$
|
27.1
|
|
$
|
21.8
|
|
|
|
Liabilities incurred
|
7.4
|
|
4.1
|
|
|||
|
Liabilities settled (payments)
|
(1.7
|
)
|
(1.0
|
)
|
|||
|
Accretion expense
|
0.4
|
|
0.5
|
|
|||
|
Revisions in estimated cash flows
|
(0.1
|
)
|
0.3
|
|
|||
|
Currency translation adjustment
|
(0.8
|
)
|
1.4
|
|
|||
|
Balance at end of year
|
$
|
32.3
|
|
$
|
27.1
|
|
|
The Company is a party to certain litigation which, in management’s judgment, based in part on the opinions of legal counsel, will not have a material adverse effect on the Company’s financial position.
Wuxi Jinmao Foreign Trade Co., Ltd. (“Wuxi”), one of the Company’s finished goods inventory suppliers, has a wholly owned subsidiary with which the Company entered into a loan agreement in 2016. Under the agreement, Wuxi’s subsidiary borrowed a principal amount of $
13.8
million for the development and operation of a fabric mill. Principal payments are due in semi-annual installments beginning March 31, 2018 through September 30, 2026. The outstanding principal balance of the loan bears interest at a rate of (i)
4.50%
per annum until the sixth anniversary of the closing date of the loan and (ii) LIBOR plus
4.00%
thereafter. The Company received principal payments of $
0.2
million during 2018. The outstanding balance, including accrued interest, was $
13.8
million and $
14.0
million as of
February 3, 2019
and
February 4, 2018
, respectively, and was included in other assets in the Company’s Consolidated Balance Sheets.
One of the Company’s European subsidiaries completed the sale of a building during 2016 for €
15.0
million (approximately $
16.7
million based on the exchange rate in effect on that date) and recorded a gain of $
1.5
million, which represented the excess of the proceeds, less costs to sell, over the carrying value on that date. The gain was recorded in SG&A expenses in the Company’s Consolidated Income Statement during 2016 and was included in the Calvin Klein International segment.
F-56
PVH CORP.
NOTES TO CONSOLIDATED FINANCIAL STATEMENTS - (Continued)
23. SUBSEQUENT EVENTS (UNAUDITED)
The Company entered into on February 20, 2019 a definitive agreement to acquire the approximately
78%
interest in Gazal that it does not already own. The Company, along with Gazal, jointly own and manage a joint venture, PVH Australia, which will come under the Company's full ownership as a result of this acquisition. The aggregate net purchase price for the shares being acquired is approximately A$
124
million (approximately $
90
million based on the current exchange rate in effect), after taking into account the divestiture to a third party of an office building and warehouse owned by Gazal. The closing is subject to customary conditions, including shareholder and court approvals, and is expected to occur in the second quarter of 2019.
The Company entered into on March 25, 2019 a definitive agreement to acquire the Tommy Hilfiger retail business in Hong Kong and certain other countries in Central and Southeast Asia from the Company’s current licensee in those markets, Dickson Concepts (International) Limited. The purchase price is estimated to be approximately $
75
million. The closing is subject to customary conditions and is expected to occur in the second quarter of 2019.
The Company will be closing its
TOMMY HILFIGER
flagship and anchor stores in the United States in the first quarter of 2019. The Company expects to incur pre-tax costs of approximately $
60
million during 2019, primarily consisting of severance, noncash asset impairments and lease and other contract termination costs.
F-57
PVH CORP.
SELECTED QUARTERLY FINANCIAL DATA - UNAUDITED
(In millions, except per share data)
The following table sets forth selected quarterly financial data (unaudited) for the corresponding thirteen week periods (except the fourth quarter of 2017, which included fourteen weeks) of the fiscal years presented:
|
|
1
st
Quarter
|
2
nd
Quarter
|
|
3
rd
Quarter
|
|
4
th
Quarter
|
|||||||||||||||||||||||||
|
|
2018
(1)
|
2017
(6),(7),(8),(9),(10)
|
2018
(1)
|
2017
(6),(7),(8)
|
2018
(1)
|
2017
(6),(7),(8)
|
2018
(1),(2),(3),(4),(5)
|
2017
(6),(7),(11),(12),(13),(14),(15)
|
|||||||||||||||||||||||
|
Total revenue
|
$
|
2,314.6
|
|
$
|
1,989.0
|
|
$
|
2,333.7
|
|
|
$
|
2,069.9
|
|
|
$
|
2,524.5
|
|
|
$
|
2,357.0
|
|
|
$
|
2,484.0
|
|
|
$
|
2,498.9
|
|
||
|
Gross profit
|
1,291.0
|
|
1,080.8
|
|
1,297.0
|
|
|
1,147.3
|
|
|
1,364.8
|
|
|
1,297.3
|
|
|
1,355.5
|
|
|
1,369.0
|
|
||||||||||
|
Net income
|
178.9
|
|
70.1
|
|
164.7
|
|
119.4
|
|
242.6
|
|
238.7
|
|
158.4
|
|
107.9
|
|
|||||||||||||||
|
Net income attributable to PVH Corp.
|
179.4
|
|
70.4
|
|
165.2
|
|
119.7
|
|
|
243.1
|
|
|
239.2
|
|
|
158.7
|
|
|
108.5
|
|
|||||||||||
|
Basic net income per common share attributable to PVH Corp.
|
2.33
|
|
0.90
|
|
2.15
|
|
1.54
|
|
|
3.18
|
|
|
3.09
|
|
|
2.10
|
|
|
1.41
|
|
|||||||||||
|
Diluted net income per common share attributable to PVH Corp.
|
2.29
|
|
0.89
|
|
2.12
|
|
1.52
|
|
|
3.15
|
|
|
3.05
|
|
|
2.09
|
|
|
1.39
|
|
|||||||||||
|
(1)
|
The first, second, third and fourth quarters of 2018 included pre-tax costs of $6.9 million, $6.7 million, $6.3 million and $3.7 million, respectively, associated with the TH China acquisition.
|
|
(2)
|
The fourth quarter of 2018 included pre-tax costs of $40.7 million associated with the Calvin Klein restructuring, of which $2.2 million of costs are included in gross profit.
|
|
(3)
|
The fourth quarter of 2018 included a discrete tax benefit of $41.1 million related to the remeasurement of certain net deferred tax liabilities in connection with the 2019 Dutch Tax Plan.
|
|
(4)
|
The fourth quarter of 2018 included a discrete net tax benefit of $24.7 million related to the U.S. Tax Legislation.
|
|
(5)
|
The fourth quarter of 2018 included a pre-tax actuarial loss of $15.0 million on the Company’s Pension Plans, SERP Plans and Postretirement Plans.
|
|
(6)
|
The first, second, third and fourth quarters of 2017 included pre-tax costs of $6.9 million, $6.6 million, $6.4 million and $7.0 million, respectively, associated with the TH China acquisition.
|
|
(7)
|
The first, second, third and fourth quarters of 2017 included pre-tax net costs of $1.8 million, $5.5 million, $2.5 million and $(1.8) million, respectively, associated with the consolidation within the Company’s warehouse and distribution network in North America, which included a gain on the sale of a warehouse and distribution center in the fourth quarter of 2017.
|
|
(8)
|
The first, second and third quarters of 2017 included pre-tax costs of $7.0 million, $7.1 million and $5.1 million, respectively, associated with the relocation of the Tommy Hilfiger office in New York.
|
|
(9)
|
The first quarter of 2017 included pre-tax costs of $54.2 million associated with the Li & Fung termination.
|
|
(10)
|
The first quarter of 2017 included pre-tax costs of $9.4 million associated with the noncash settlement of certain of the Company’s benefit obligations related to its Pension Plans as a result of an annuity purchased for certain participants, under which such obligations were transferred to an insurer.
|
|
(11)
|
The fourth quarter of 2017 included pre-tax costs of $82.9 million associated with the Mr. Hilfiger amendment.
|
|
(12)
|
The fourth quarter of 2017 included pre-tax costs of $23.9 million associated with the early redemption of the Company’s $700 million 4 1/2% senior notes due 2022.
|
|
(13)
|
The fourth quarter of 2017 included a discrete net tax benefit of $52.8 million related to the U.S. Tax Legislation.
|
F-58
|
(14)
|
The fourth quarter of 2017 included a discrete tax benefit of $15.2 million related to an excess tax benefit from the exercise of stock options by the Company’s Chairman and Chief Executive Officer.
|
|
(15)
|
The fourth quarter of 2017 included a pre-tax actuarial loss of $2.5 million on the Company’s Pension Plans, SERP Plans and Postretirement Plans.
|
F-59
MANAGEMENT’S REPORT ON INTERNAL CONTROL OVER FINANCIAL REPORTING
The management of the Company is responsible for the preparation and integrity of the consolidated financial statements appearing in this Annual Report on Form 10-K. The consolidated financial statements were prepared in conformity with accounting principles generally accepted in the United States and, accordingly, include certain amounts based on management’s best judgments and estimates.
The management of the Company is responsible for establishing and maintaining adequate internal control over financial reporting, as defined in Rules 13a-15(f) under the Securities Exchange Act of 1934. The Company’s internal control over financial reporting is designed to provide reasonable assurance regarding the reliability of financial reporting and the preparation of financial statements for external purposes in accordance with accounting principles generally accepted in the United States. The Company’s internal control over financial reporting includes those policies and procedures that (i) pertain to the maintenance of records that, in reasonable detail, accurately and fairly reflect the underlying transactions, including the acquisition and disposition of assets; (ii) provide reasonable assurance that the Company’s assets are safeguarded and transactions are executed in accordance with management’s authorization and are recorded as necessary to permit preparation of the Company’s consolidated financial statements in accordance with accounting principles generally accepted in the United States; and (iii) provide reasonable assurance regarding prevention or timely detection of unauthorized acquisition, use, or disposition of the Company’s assets that could have a material effect on the consolidated financial statements.
Because of its inherent limitations, internal control over financial reporting may not prevent or detect misstatements and even when determined to be effective, can only provide reasonable assurance with respect to financial statement preparation and presentation. Also, projections of any evaluation of effectiveness to future periods are subject to the risk that controls may become inadequate because of changes in conditions, or that the degree of compliance with the policies or procedures may deteriorate.
The Audit & Risk Management Committee of the Company’s Board of Directors, composed solely of directors who are independent in accordance with New York Stock Exchange listing standards, the Securities Exchange Act of 1934, the Company’s Corporate Governance Guidelines and the Committee’s charter, meets periodically with the Company’s independent auditors, the Company’s internal auditors and management to discuss internal control over financial reporting, auditing and financial reporting matters. Both the independent auditors and the Company’s internal auditors periodically meet alone with the Audit Committee and have free access to the Committee.
Management assessed the effectiveness of the Company’s internal control over financial reporting as of
February 3, 2019
. In making this assessment, management used the criteria set forth by the Committee of Sponsoring Organizations of the Treadway Commission (COSO) in Internal Control – Integrated Framework (2013 framework). Based on management’s assessment and those criteria, management believes that the Company maintained effective internal control over financial reporting as of
February 3, 2019
.
The Company’s independent auditors, Ernst & Young LLP, a registered public accounting firm, are appointed by the Audit & Risk Management Committee, subject to ratification by the Company’s stockholders. Ernst & Young LLP have audited and reported on the consolidated financial statements of the Company and the effectiveness of the Company’s internal control over financial reporting. The reports of the independent auditors are contained in this Annual Report on Form 10-K.
|
/s/ EMANUEL CHIRICO
|
/s/ MICHAEL SHAFFER
|
|
|
|
|
Emanuel Chirico
|
Michael Shaffer
|
|
Chairman and Chief Executive Officer
|
Executive Vice President and Chief
|
|
March 29, 2019
|
Operating & Financial Officer
|
|
|
March 29, 2019
|
F-60
REPORT OF INDEPENDENT REGISTERED PUBLIC ACCOUNTING FIRM
To the Stockholders and the Board of Directors of PVH Corp.
Opinion on Internal Control Over Financial Reporting
We have audited PVH Corp.’s internal control over financial reporting as of
February 3, 2019
, based on criteria established in Internal Control-Integrated Framework issued by the Committee of Sponsoring Organizations of the Treadway Commission (2013 framework) (the COSO criteria). In our opinion, PVH Corp. (the Company) maintained, in all material respects, effective internal control over financial reporting as of
February 3, 2019
, based on the COSO criteria.
We also have audited, in accordance with the standards of the Public Company Accounting Oversight Board (United States) (PCAOB), the consolidated balance sheets of the Company as of
February 3, 2019
and
February 4, 2018
, the related consolidated income statements, statements of comprehensive income, statements of changes in stockholders’ equity and redeemable non-controlling interest and statements of cash flows for each of the three years in the period ended
February 3, 2019
, and the related notes and financial statement schedule listed in the Index at Item 15(a)(2) and our report dated March 29, 2019 expressed an unqualified opinion thereon.
Basis for Opinion
The Company’s management is responsible for maintaining effective internal control over financial reporting and for its assessment of the effectiveness of internal control over financial reporting included in the accompanying Management’s Report on Internal Control over Financial Reporting. Our responsibility is to express an opinion on the Company’s internal control over financial reporting based on our audit. We are a public accounting firm registered with the PCAOB and are required to be independent with respect to the Company in accordance with the U.S. federal securities laws and the applicable rules and regulations of the Securities and Exchange Commission and the PCAOB.
We conducted our audit in accordance with the standards of the PCAOB. Those standards require that we plan and perform the audit to obtain reasonable assurance about whether effective internal control over financial reporting was maintained in all material respects.
Our audit included obtaining an understanding of internal control over financial reporting, assessing the risk that a material weakness exists, testing and evaluating the design and operating effectiveness of internal control based on the assessed risk, and performing such other procedures as we considered necessary in the circumstances. We believe that our audit provides a reasonable basis for our opinion.
Definition and Limitations of Internal Control Over Financial Reporting
A company’s internal control over financial reporting is a process designed to provide reasonable assurance regarding the reliability of financial reporting and the preparation of financial statements for external purposes in accordance with generally accepted accounting principles. A company’s internal control over financial reporting includes those policies and procedures that (1) pertain to the maintenance of records that, in reasonable detail, accurately and fairly reflect the transactions and dispositions of the assets of the company; (2) provide reasonable assurance that transactions are recorded as necessary to permit preparation of financial statements in accordance with generally accepted accounting principles, and that receipts and expenditures of the company are being made only in accordance with authorizations of management and directors of the company; and (3) provide reasonable assurance regarding prevention or timely detection of unauthorized acquisition, use, or disposition of the company’s assets that could have a material effect on the financial statements.
Because of its inherent limitations, internal control over financial reporting may not prevent or detect misstatements. Also, projections of any evaluation of effectiveness to future periods are subject to the risk that controls may become inadequate because of changes in conditions, or that the degree of compliance with the policies or procedures may deteriorate.
/s/ Ernst & Young LLP
New York, New York
March 29, 2019
F-61
REPORT OF INDEPENDENT REGISTERED PUBLIC ACCOUNTING FIRM
To the Stockholders and the Board of Directors of PVH Corp.
Opinion on the Financial Statements
We have audited the accompanying consolidated balance sheets of PVH Corp. (the Company) as of
February 3, 2019
and
February 4, 2018
, the related consolidated income statements, statements of comprehensive income, statements of changes in stockholders' equity and redeemable non-controlling interest and statements of cash flows for each of the three years in the period ended
February 3, 2019
, and the related notes and financial statement schedule listed in the Index at Item 15(a)(2) (collectively referred to as the “consolidated financial statements”). In our opinion, the consolidated financial statements present fairly, in all material respects, the financial position of the Company at
February 3, 2019
and
February 4, 2018
, and the results of its operations and its cash flows for each of the three years in the period ended
February 3, 2019
, in conformity with U.S. generally accepted accounting principles.
We also have audited, in accordance with the standards of the Public Company Accounting Oversight Board (United States) (PCAOB), the Company’s internal control over financial reporting as of
February 3, 2019
, based on criteria established in Internal Control-Integrated Framework issued by the Committee of Sponsoring Organizations of the Treadway Commission (2013 framework) and our report dated March 29, 2019 expressed an unqualified opinion thereon.
Basis for Opinion
These financial statements are the responsibility of the Company’s management. Our responsibility is to express an opinion on the Company’s financial statements based on our audits. We are a public accounting firm registered with the PCAOB and are required to be independent with respect to the Company in accordance with the U.S. federal securities laws and the applicable rules and regulations of the Securities and Exchange Commission and the PCAOB.
We conducted our audits in accordance with the standards of the PCAOB. Those standards require that we plan and perform the audit to obtain reasonable assurance about whether the financial statements are free of material misstatement, whether due to error or fraud. Our audits included performing procedures to assess the risks of material misstatement of the financial statements, whether due to error or fraud, and performing procedures that respond to those risks. Such procedures included examining, on a test basis, evidence regarding the amounts and disclosures in the financial statements. Our audits also included evaluating the accounting principles used and significant estimates made by management, as well as evaluating the overall presentation of the financial statements. We believe that our audits provide a reasonable basis for our opinion.
/s/ Ernst & Young LLP
We have served as the Company’s auditor since 1938.
New York, New York
March 29, 2019
F-62
PVH CORP.
FIVE YEAR FINANCIAL SUMMARY
(In millions, except per share data, percents and ratios)
|
|
2018
(1)
|
2017
(2),(6)
|
2016
(3),(6)
|
2015
(4),(6)
|
2014
(5),(6)
|
||||||||||||||
|
Summary of Operations
|
|
|
|
|
|
||||||||||||||
|
Revenue
|
$
|
9,656.8
|
|
$
|
8,914.8
|
|
$
|
8,203.1
|
|
$
|
8,020.3
|
|
$
|
8,241.2
|
|
||||
|
Cost of goods sold, expenses and other income items
|
8,765.1
|
|
8,282.4
|
|
7,413.9
|
|
7,259.8
|
|
7,711.3
|
|
|||||||||
|
Income before interest and taxes
|
891.7
|
|
632.4
|
|
789.2
|
|
760.5
|
|
529.9
|
|
|||||||||
|
Interest expense, net
|
116.1
|
|
122.2
|
|
115.0
|
|
113.0
|
|
138.5
|
|
|||||||||
|
Income tax expense (benefit)
|
31.0
|
|
(25.9
|
)
|
125.5
|
|
75.1
|
|
(47.5
|
)
|
|||||||||
|
Net loss attributable to redeemable non-controlling interest
|
(1.8
|
)
|
(1.7
|
)
|
(0.3
|
)
|
—
|
|
(0.1
|
)
|
|||||||||
|
Net income attributable to PVH Corp.
|
$
|
746.4
|
|
$
|
537.8
|
|
$
|
549.0
|
|
$
|
572.4
|
|
$
|
439.0
|
|
||||
|
Per Share Statistics
|
|
|
|
|
|
|
|
|
|
|
|||||||||
|
Basic net income per common share attributable to PVH Corp.
|
$
|
9.75
|
|
$
|
6.93
|
|
$
|
6.84
|
|
$
|
6.95
|
|
$
|
5.33
|
|
||||
|
Diluted net income per common share attributable to PVH Corp.
|
9.65
|
|
6.84
|
|
6.79
|
|
6.89
|
|
5.27
|
|
|||||||||
|
Dividends paid per common share
|
0.15
|
|
0.15
|
|
0.15
|
|
0.15
|
|
0.15
|
|
|||||||||
|
Stockholders’ equity per common share
|
77.29
|
|
71.73
|
|
61.16
|
|
55.86
|
|
52.89
|
|
|||||||||
|
Financial Position
|
|
|
|
|
|
|
|
|
|
|
|||||||||
|
Current assets
|
$
|
3,238.6
|
|
$
|
3,030.8
|
|
$
|
2,879.6
|
|
$
|
2,804.5
|
|
$
|
2,777.7
|
|
||||
|
Current liabilities (including short-term borrowings and current portion of long-term debt)
|
1,893.9
|
|
1,871.6
|
|
1,564.8
|
|
1,527.2
|
|
1,428.1
|
|
|||||||||
|
Working capital
|
1,344.7
|
|
1,159.2
|
|
1,314.8
|
|
1,277.3
|
|
1,349.6
|
|
|||||||||
|
Total assets
|
11,863.7
|
|
11,885.7
|
|
11,067.9
|
|
10,673.8
|
|
10,796.6
|
|
|||||||||
|
Capital leases
|
16.5
|
|
16.0
|
|
16.4
|
|
14.6
|
|
18.1
|
|
|||||||||
|
Long-term debt
|
2,819.4
|
|
3,061.3
|
|
3,197.3
|
|
3,031.7
|
|
3,410.4
|
|
|||||||||
|
Stockholders’ equity
|
5,827.8
|
|
5,536.4
|
|
4,804.5
|
|
4,552.3
|
|
4,364.3
|
|
|||||||||
|
Other Statistics
|
|
|
|
|
|
|
|
|
|||||||||||
|
Total debt to total capital
(7)
|
32.8
|
%
|
35.9
|
%
|
40.2
|
%
|
41.3
|
%
|
44.8
|
%
|
|||||||||
|
Net debt to net capital
(8)
|
29.1
|
%
|
32.0
|
%
|
34.2
|
%
|
36.8
|
%
|
41.2
|
%
|
|||||||||
|
Current ratio
|
1.7
|
|
1.6
|
|
1.8
|
|
1.8
|
|
1.9
|
|
|||||||||
|
(1)
|
2018 includes (a) pre-tax costs of $40.7 million associated with the Calvin Klein restructuring; (b) pre-tax costs of $23.6 million associated with the TH China acquisition, consisting of noncash amortization of short-lived assets; (c) a pre-tax actuarial loss of $15.0 million on the Company’s Pension Plans, SERP Plans and Postretirement Plans; (d) a discrete net tax benefit of $24.7 million related to the U.S. Tax Legislation; and (e) a discrete tax benefit of $41.1 million related to the remeasurement of certain net deferred tax liabilities in connection with the 2019 Dutch Tax Plan.
|
|
(2)
|
2017 includes (a) pre-tax costs of $82.9 million associated with the Mr. Hilfiger amendment; (b) pre-tax costs of $54.2 million associated with the Li & Fung termination; (c) pre-tax costs of $23.9 million associated with the early redemption of the Company’s $700 million 4 1/2% senior notes due 2022; (d) pre-tax costs of $26.9 million associated with the TH China acquisition, primarily consisting of noncash amortization of short-lived assets; (e) pre-tax costs of $19.2 million associated with relocation of the Tommy Hilfiger office in New York, including noncash depreciation expense; (f) pre-tax costs of $9.4 million associated with the noncash settlement of certain of the Company’s benefit obligations related to its Pension Plans as a result of an annuity purchased for certain participants, under which such obligations were transferred to an insurer; (g) pre-tax net costs of $8.0 million associated with the consolidation within the Company’s warehouse and distribution network in North America, which included a $3.1 million gain on the sale of a warehouse and distribution center; (h) a pre-tax actuarial loss of $2.5 million on the Company’s Pension Plans, SERP Plans and Postretirement Plans; (i) a discrete net tax benefit of $52.8 million related to the U.S. Tax Legislation; and (j) a discrete tax benefit of $15.2 million related to an excess tax benefit from the exercise of stock options by the Company’s Chairman and Chief Executive Officer.
|
|
(3)
|
2016 includes (a) a pre-tax noncash gain of $153.1 million to write up the Company’s equity investment in TH China to fair value in connection with the TH China acquisition, partially offset by pre-tax acquisition related costs of $76.9 million, primarily consisting of valuation adjustments and amortization of short-lived assets, and a one-time cost of $5.9 million recorded on the Company’s equity investment in TH China; (b) pre-tax costs of $15.8 million associated with the Company’s amendment of its 2014 facilities; (c) a pre-tax noncash loss of $81.8 million recorded in connection with the Mexico deconsolidation; (d) a pre-tax
|
F-63
gain of $18.1 million associated with a payment made to the Company to exit a
TOMMY HILFIGER
flagship store in Europe; (e) pre-tax costs of $11.0 million associated with the TH men’s tailored license termination; and (f) a pre-tax actuarial gain of $39.1 million on the Company’s Pension Plans, SERP Plans and Postretirement Plans.
|
(4)
|
2015 includes (a) pre-tax costs of $73.4 million associated with the integration of Warnaco and the related restructuring; (b) pre-tax costs of $10.3 million related to the operation of and exit from the Izod retail business; (c) pre-tax costs of $16.5 million principally related to the discontinuation of several licensed product lines in the Heritage Brands dress furnishings business; and (d) a pre-tax actuarial gain of $20.2 million on the Company’s Pension Plans, SERP Plans and Postretirement Plans.
|
|
(5)
|
2014 includes (a) pre-tax costs of $139.4 million associated with the integration of Warnaco and the related restructuring; (b) a net gain of $8.0 million associated with the deconsolidation of certain Calvin Klein subsidiaries in Australia and the previously consolidated Calvin Klein joint venture in India; (c) pre-tax costs
of $93.1 million associated with the amendment and restatement of the Company’s senior secured credit facilities and redemption of its 7 3/8% senior notes due 2020; (d) pre-tax costs of $21.0 million associated with the exit from the Izod retail business; (e) a pre-tax actuarial loss of $138.9 million on the Company’s Pension Plans, SERP Plans and Postretirement Plans; and (f) discrete tax benefits of $9.6 million primarily related to Warnaco integration activities.
|
|
(6)
|
The Company adopted the update to accounting guidance related to revenue recognition in 2018 by applying a modified retrospective approach to all contracts. The adoption of the guidance did not have a material impact on the Company’s consolidated financial statements as of and for the fiscal year ended February 3, 2019, including the Company’s Consolidated Income Statement and Consolidated Balance Sheet, or on any individual caption therein. Amounts have not been restated. Please see
Note 1
, “
Summary of Significant Accounting Policies
,” in the Notes to Consolidated Financial Statements included in Item 8 of this report for further discussion.
|
|
(7)
|
Total capital equals total debt (including capital leases) plus stockholders’ equity.
|
|
(8)
|
Net debt equals total debt (including capital leases) reduced by cash. Net capital equals total capital reduced by cash.
|
F-64
SCHEDULE II
PVH CORP.
VALUATION AND QUALIFYING ACCOUNTS
(In millions)
|
Column A
|
Column B
|
Column C
|
|
Column D
|
|
Column E
|
||||||||||||||
|
|
|
Additions Charged to Costs and Expenses
|
Additions Charged to
Other
Accounts
|
|
|
|
|
|||||||||||||
|
|
Balance at Beginning
of Period
|
|
|
|
Balance
at End
of Period
|
|||||||||||||||
|
|
|
|
|
|||||||||||||||||
|
Description
|
|
Deductions
|
(1)
|
|||||||||||||||||
|
Year Ended February 3, 2019
|
|
|
|
|
|
|
|
|||||||||||||
|
Allowance for doubtful accounts
|
$
|
21.1
|
|
$
|
14.2
|
|
$
|
—
|
|
$
|
13.7
|
|
(2)
|
$
|
21.6
|
|
||||
|
Allowance/accrual for operational chargebacks and customer markdowns
|
271.0
|
|
403.8
|
|
|
—
|
|
448.0
|
|
226.8
|
|
|||||||||
|
Valuation allowance for deferred income tax assets
|
106.3
|
|
12.9
|
|
—
|
|
56.6
|
|
(3)
|
62.6
|
|
|||||||||
|
Year Ended February 4, 2018
|
|
|
|
|
|
|
|
|
|
|
|
|
||||||||
|
Allowance for doubtful accounts
|
$
|
15.0
|
|
$
|
7.5
|
|
$
|
—
|
|
$
|
1.4
|
|
(2)
|
$
|
21.1
|
|
||||
|
Allowance/accrual for operational chargebacks and customer markdowns
|
289.5
|
|
498.2
|
|
—
|
|
516.7
|
|
271.0
|
|
||||||||||
|
Valuation allowance for deferred income tax assets
|
43.9
|
|
64.3
|
|
(4)
|
1.9
|
|
3.8
|
|
106.3
|
|
|||||||||
|
Year Ended January 29, 2017
|
|
|
|
|
|
|
|
|
|
|
|
|
||||||||
|
Allowance for doubtful accounts
|
$
|
18.1
|
|
$
|
6.1
|
|
$
|
—
|
|
$
|
9.2
|
|
(2)
|
$
|
15.0
|
|
||||
|
Allowance/accrual for operational chargebacks and customer markdowns
|
291.9
|
|
551.0
|
|
—
|
|
553.4
|
|
(5)
|
289.5
|
|
|||||||||
|
Valuation allowance for deferred income tax assets
|
43.8
|
|
6.0
|
|
—
|
|
5.9
|
|
43.9
|
|
||||||||||
|
(1)
|
Includes changes due to foreign currency translation.
|
|
(2)
|
Principally accounts written off as uncollectible, net of recoveries.
|
|
(3)
|
Includes the release of a $
26.3
million valuation allowance on the Company’s foreign tax credits to adjust the provisional amount recorded in 2017 as a result of the U.S. Tax Legislation.
|
|
(4)
|
Includes the recognition of a $
38.5
million provisional valuation allowance on the Company’s foreign tax credits as a result of the U.S. Tax Legislation.
|
|
(5)
|
Includes the impact of the Mexico deconsolidation.
|
F-65
TABLE OF CONTENTS
Part IItem 1. BusinessItem 1A. Risk FactorsItem 1B. Unresolved Staff CommentsItem 2. PropertiesItem 3. Legal ProceedingsItem 4. Mine Safety DisclosuresPart IIItem 5. Market For Registrant S Common Equity, Related Stockholder Matters and Issuer Purchases Of Equity SecuritiesItem 6. Selected Financial DataItem 7. Management S Discussion and Analysis Of Financial Condition and Results Of OperationsItem 7A. Quantitative and Qualitative Disclosures About Market RiskItem 8. Financial Statements and Supplementary DataItem 9. Changes in and Disagreements with Accountants on Accounting and Financial DisclosureItem 9A. Controls and ProceduresItem 9B. Other InformationPart IIIItem 10. Directors, Executive Officers and Corporate GovernanceItem 11. Executive CompensationItem 12. Security Ownership Of Certain Beneficial Owners and Management and Related Stockholder MattersItem 13. Certain Relationships and Related Transactions, and Director IndependenceItem 14. Principal Accounting Fees and ServicesPart IVItem 15. Exhibits, Financial Statement SchedulesItem 16. Form 10-k Summary