PAYPAL HOLDINGS, INC.
10-Ks and 10-Qs
|
|
|
|
|
|
|
|
|
|
|
|
|
|
|
|
|
|
|
|
|
|
|
|
|
|
|
|
|
|
|
|
|
|
|
|
|
|
UNITED STATES
SECURITIES AND EXCHANGE COMMISSION
Washington, D.C. 20549
FORM 10-K
|
ý
|
ANNUAL REPORT PURSUANT TO SECTION 13 OR 15(d) OF THE SECURITIES EXCHANGE ACT OF 1934
|
For the fiscal year ended
December 31, 2015
.
OR
|
o
|
TRANSITION REPORT PURSUANT TO SECTION 13 OR 15(d) OF THE SECURITIES EXCHANGE ACT OF 1934
|
For the Transition Period from to .
Commission file number 001-36859
PayPal Holdings, Inc.
(Exact Name of Registrant as Specified in Its Charter)
|
Delaware
|
47-2989869
|
|
(State or Other Jurisdiction of
Incorporation or Organization)
|
(I.R.S. Employer
Identification No.)
|
|
2211 North First Street
San Jose, California
|
95131
|
|
(Address of Principal Executive Offices)
|
(Zip Code)
|
(408) 967-1000
(Registrant’s telephone number, including area code)
Securities registered pursuant to Section 12(b) of the Act:
|
Title of each class
|
Name of each exchange on which
registered
|
|
Common Stock, $0.0001 par value per share
|
The NASDAQ Stock Market LLC
|
Securities registered pursuant to Section 12(g) of the Securities Exchange Act of 1934:
None
Indicate by check mark if the registrant is a well-known seasoned issuer, as defined in Rule 405 of the Securities Act.
Yes [x] No [ ]
Indicate by check mark if the registrant is not required to file reports pursuant to Section 13 or Section 15(d) of the Exchange Act. Yes [ ] No [x]
Indicate by check mark whether the registrant (1) has filed all reports required to be filed by Section 13 or 15(d) of the Exchange Act during the preceding 12 months (or for such shorter period that the registrant was required to file such reports), and (2) has been subject to such filing requirements for the past 90 days. Yes [x] No [ ]
Indicate by check mark whether the registrant has submitted electronically and posted on its corporate Web site, if any, every Interactive Data File required to be submitted and posted pursuant to Rule 405 of Regulation S-T (§ 232.405 of this chapter)
during the preceding 12 months (or for such shorter period that the registrant was required to submit and post such files). Yes [x] No [ ]
Indicate by check mark whether the registrant is a large accelerated filer, an accelerated filer, a non-accelerated filer, or a smaller reporting company. See the definitions of “large accelerated filer,” “accelerated filer” and “smaller reporting company” in Rule 12b-2 of the Exchange Act. (Check one):
|
Large accelerated filer
|
ý
|
Accelerated filer
|
o
|
|
Non-accelerated filer
|
o
(Do not check if a smaller reporting company)
|
Smaller reporting company
|
o
|
Indicate by check mark whether the registrant is a shell company (as defined in Rule 12b-2 of the Exchange Act). Yes [ ] No [x]
As of June 30, 2015, the registrant's common stock was not publicly traded.
As of February 5, 2016, there were 1,222,675,902 shares of common stock outstanding.
DOCUMENTS INCORPORATED BY REFERENCE
Part III incorporates information by reference from the definitive proxy statement for the registrant's Annual Meeting of Stockholders expected to be held in May 2016.
TABLE OF CONTENTS
|
|
Page
|
|
|
Part I
|
||
|
Item 1.
|
||
|
Item 1A.
|
||
|
Item 1B.
|
||
|
Item 2.
|
||
|
Item 3.
|
||
|
Item 4.
|
||
|
Part II
|
||
|
Item 5.
|
||
|
Item 6.
|
||
|
Item 7.
|
||
|
Item 7A.
|
||
|
Item 8.
|
||
|
Item 9.
|
||
|
Item 9A.
|
||
|
Item 9B.
|
||
|
Part III
|
||
|
Item 10.
|
||
|
Item 11.
|
||
|
Item 12.
|
||
|
Item 13.
|
||
|
Item 14.
|
||
|
Part IV
|
||
|
Item 15.
|
||
Presentation of Information
On July 17, 2015, PayPal Holdings, Inc. (“PayPal Holdings”) became an independent publicly-traded company through the pro rata distribution by eBay Inc. (“eBay”) of 100% of the outstanding common stock of PayPal to eBay’s stockholders (which we refer to as the “separation” or the “distribution”). For additional information, see “Business—Separation from eBay Inc.” To accomplish this separation, in January 2015, eBay incorporated PayPal Holdings, Inc. (“PayPal Holdings”) which ultimately became the parent of PayPal, Inc. and holds directly or indirectly all of the assets and liabilities associated with PayPal, Inc. Unless otherwise expressly stated or the context otherwise requires, references to “we,” “our,” “us,” “the Company” or “PayPal” refer to PayPal Holdings, Inc. and its consolidated subsidiaries or, in the case of information as of dates or for periods prior to our separation from eBay, the combined and consolidated entities of the payments business of eBay, including PayPal, Inc. and certain other assets and liabilities that were historically held at the eBay corporate level, but were specifically identifiable and attributable to the payments business, and references to our “Payments Platform” mean our combined payment solution capabilities, including our PayPal, PayPal Credit, Braintree, Venmo and Xoom products.
References in this Annual Report on Form 10-K to “eBay” refer to eBay Inc., a Delaware corporation, and its consolidated subsidiaries, which prior to the separation and distribution, but not after such date, included the business and operations of PayPal.
Trademarks, Trade Names and Service Marks
PayPal owns or has rights to use the trademarks, service marks and trade names that it uses in conjunction with the operation of its business. Some of the more important trademarks that PayPal owns or has rights to use that appear in this Annual Report on Form 10-K include: PayPal
®
, PayPal Credit
®
, Braintree, Venmo and Xoom, which may be registered or trademarked in the United States and other jurisdictions. PayPal’s rights to some of these trademarks may be limited to select markets. Each trademark, trade name or service mark of any other company appearing in this Annual Report on Form 10-K is, to PayPal’s knowledge, owned by such other company.
FORWARD-LOOKING STATEMENTS
This Annual Report on Form 10-K contains forward-looking statements within the meaning of Section 27A of the Securities Act of 1933 and Section 21E of the Securities Exchange Act of 1934, including statements that involve expectations, plans or intentions (such as those relating to future business, future results of operations or financial condition, new or planned features or services, or management strategies). You can identify these forward-looking statements by words such as “may,” “will,” “would,” “should,” “could,” “expect,” “anticipate,” “believe,” “estimate,” “intend,” “plan” and other similar expressions. These forward-looking statements involve risks and uncertainties that could cause our actual results to differ materially from those expressed or implied in our forward-looking statements. Such risks and uncertainties include, among others, those discussed in “Item 1A: Risk Factors” of this Annual Report on Form 10-K, as well as in our combined and consolidated financial statements, related notes, and the other information appearing elsewhere in this report and our other filings with the Securities and Exchange Commission (“SEC"). We do not intend, and undertake no obligation, to update any of our forward-looking statements after the date of this report to reflect actual results or future events or circumstances. Given these risks and uncertainties, readers are cautioned not to place undue reliance on such forward-looking statements. You should read the information in this report in conjunction with the audited combined and consolidated financial statements and the related notes that appear elsewhere in this report.
Overview
PayPal Holdings, Inc. (“we,” “our,” “us,” “the Company” or “PayPal”) is a leading technology platform company that enables digital and mobile payments on behalf of consumers and merchants worldwide. We believe in providing simple, affordable, secure and reliable financial services and digital payments to help our customers around the world to achieve their financial goals. We strive to increase our relevance for consumers, merchants, friends and family to access and move their money anywhere in the world, anytime, on any platform and through any device (e.g., mobile, tablets, personal computers or wearables). We provide safer and simpler ways for businesses of all sizes to accept payments from merchant websites, mobile devices and applications, and at offline retail locations through a wide range of payment solutions. We also facilitate person to person payments through PayPal, Venmo and Xoom (acquired in November 2015). Our combined payment solution capabilities, including our PayPal, PayPal Credit, Braintree, Venmo, and Xoom products, comprise our proprietary Payments Platform. The terms "we," "our," "us," "the Company," and "PayPal" mean PayPal Holdings, Inc. and, unless otherwise expressly stated or the context requires, its subsidiaries.
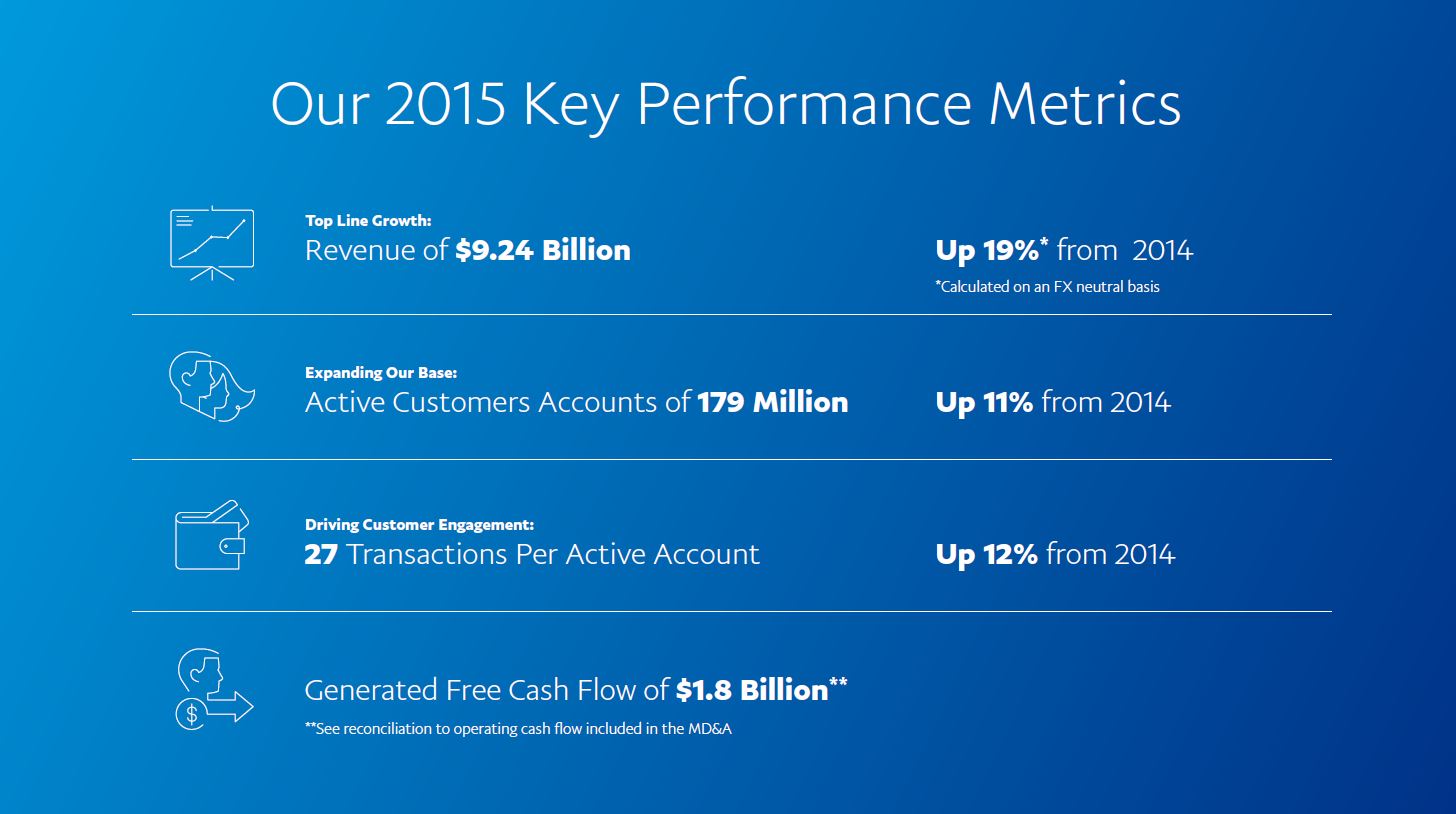
We enable global commerce by providing payment solutions for our approximately
179 million
active customer accounts in over 200 markets as of December 31, 2015, while providing customers a choice of how they would like to pay or get paid. A market is a geographic area or political jurisdiction, such as a country, territory, or protectorate, in which we offer our services. A country, territory or protectorate is identified by a distinct set of laws and regulations. An active customer account is a registered account that successfully sent or received at least one payment or payment reversal through our Payments Platform, excluding transactions processed through our gateway and Paydiant products, in the past 12 months. Our gateway products include our Payflow Payments and certain Braintree products. A payment gateway links a merchant’s website to that merchant’s processing network and merchant account.
We offer our customers the flexibility to use their account to both purchase and be paid for goods, as well as transfer and withdraw funds. A consumer can typically fund a purchase using a bank account, a PayPal account balance, a PayPal Credit account, a credit or debit card or other stored value products such as coupons and gift cards. Our PayPal, Venmo, and Xoom products also make it safer and simpler for friends and family to transfer funds to each other, including cross border transfers using several of these funding sources. We offer merchants an end-to-end payments solution that provides authorization and settlement capabilities, as well as instant access to funds. We help merchants connect with their customers and manage risk. PayPal's aim is to create deeper, more relevant relationships with each of its customers. We measure the relevance of our products in the lives of our customers, and therefore the success of our business, through both payment volume and payment transactions. Payment volume is the value of payments, net of payment reversals, successfully completed through our Payments Platform, excluding transactions processed through our gateway and Paydiant products (“Total Payment Volume” or “TPV”). During 2015, our TPV was approximately
$282 billion
, representing growth of
20%
over 2014. “Payment transactions” is the total number of payments, net of payment reversals, successfully completed through our Payments Platform, excluding transactions processed through our gateway and Paydiant products. During 2015, we processed approximately
4.9 billion
payment transactions, representing growth of
24%
over 2014. This translated to
27.5
payment transactions per active customer account in 2015. This is an increase from
24.5
payment transactions per active customer account in 2014. "Payment transactions per active customer account" reflects the total number of payment transactions within the previous 12 month period, divided by active customer accounts at the end of the period.
1
Our Payments Platform is built to make the existing global financial infrastructure work for people in the digital and mobile age. PayPal allows people to make seamless transactions between different markets and networks. Our Payments Platform connects with financial institutions around the world and allows consumers to make purchases using a broad range of payment methods, regardless of where a merchant is located. Consumers who use our Payments Platform can engage in cross-border shopping by sending payments in more than 200 markets across the globe and in more than 100 currencies. This enables merchants to extend their reach across borders to an expanded customer base.
We generate revenues by charging fees for providing transaction processing and other payment-related services, primarily based on the volume of activity, or TPV, processed through our Payments Platform. We also earn revenue by providing value added services to consumers and merchants, such as our PayPal Credit and Paydiant products. During 2015, we generated revenue of
$9.2 billion
, representing growth of
15%
over 2014 (19% on an foreign currency neutral basis).
Our revenue is influenced by, among other things, consumer spending patterns, merchant adoption of payment methods other than traditional credit or debit cards and cash, the expansion of multi-channel retail, the growth of mobile devices and merchant applications on those devices, the growth of consumers with access to the Internet globally, the pace of transition from paper-based forms of payment to digital forms of payment, our share of the digital payments market, and our ability to innovate new methods of payment that merchants and consumers find to be valuable. Our strategy is to drive growth by:
|
•
|
Growing our core businesses globally through expanding our capabilities and base of active customer accounts, increasing our customers’ use of our products and services by better addressing our customers’ everyday needs in managing and moving money and expanding the adoption of our solutions by new merchants and consumers;
|
|
•
|
Expanding our value proposition for customers by providing risk management, insights from our two-sided Payments Platform, and scale;
|
|
•
|
Extending our existing business by seeking new areas of growth in markets around the world and focusing on innovation both in the digital and the physical world; and
|
|
•
|
Enhancing our strong foundation focused on trust, simplicity, and being technology agnostic.
|
2

In line with our strategy to drive growth, we focus on the generation of free cash flow. Free cash flow is a non-GAAP financial measure defined as cash flow from operations less purchases of property and equipment. We consider free cash flow to be a key performance measure that provides useful information to management and investors about the amount of operating cash flow generated by the business after the purchases of property and equipment, which can then be used to, among other things, invest in our business, make strategic acquisitions, and return cash to shareholders. In 2015, we generated
$1.8 billion
in free cash flow; this represents an increase of
$96 million
from 2014. Please refer to Part II, Item 7 "Management's Discussion and Analysis of Financial Condition and Results of Operations - Non-GAAP Financial Information" for information on how we compute free cash flow and a reconciliation of free cash flow to the most directly comparable GAAP financial measure.
PayPal is a popular form of payment for mobile commerce, and our business has grown with the increased adoption of mobile devices. We believe that our Braintree products strengthen our position in mobile payments and extend our coverage to a new class of retailers who offer their services primarily through mobile applications. These products have expanded our footprint with earlier stage merchants. Our Venmo app is a leading mobile application to move money between friends and family using their mobile device. With Venmo, we have a diversified demographic of consumers. In April 2015, we completed our acquisition of Paydiant to further expand our capabilities in mobile payments. Using Paydiant’s platform, our merchant partners can create their own branded wallets to accelerate mobile-in-store payments and drive consumer engagement through mobile payments, loyalty, offers and the prioritization of preferred payment types, such as store branded credit cards and gift cards. In November 2015, we completed our acquisition of Xoom. Xoom enables consumers to send money, pay bills and send mobile phone reloads to family and friends around the world using mobile devices. We believe that mobile devices are the bridge between online, in-app, and in-store offerings, creating a pathway to a larger addressable market. In addition, mobile becomes a conduit
that facilitates the movement and management of money, including remittances, consumer lending, and person-to-person ("P2P") transactions.
We operate globally and in a rapidly evolving regulatory environment characterized by a heightened regulatory focus on all aspects of the payments industry. That focus continues to become even more heightened as regulators on a global basis focus on such important issues as countering terrorist financing, anti-money laundering, privacy and consumer protection. Some of the laws and regulations to which we are subject were enacted recently and the laws and regulations applicable to us, including those enacted prior to the advent of digital and mobile payments, are continuing to evolve through legislative and regulatory action and judicial interpretation. Non-compliance with laws and regulations, increased penalties and enforcement actions related to non-compliance, changes in laws and regulations or their interpretation, and the enactment of new laws and regulations applicable to us could have a material adverse impact on our business, results of operations and financial condition. Therefore, we monitor these areas closely to ensure compliant solutions for our customers who depend on us.
3
Connecting Merchants and Consumers
We operate a proprietary global technology platform that links merchants and consumers around the globe to facilitate the processing of payment transactions, allowing us to connect millions of merchants and consumers worldwide. Our Payments Platform facilitates an efficient and secure means for merchants to receive payments, and a convenient, secure way for consumers to make payments. We process transactions through our Payments Platform in more than 200 markets, allowing customers to pay and get paid in more than 100 currencies, withdraw funds to their bank accounts in 57 currencies and hold balances in their PayPal accounts in 26 currencies.
A transaction on our Payments Platform can involve up to three participants in addition to us: a merchant, a consumer and the consumer’s funding source provider. The following diagram illustrates a typical payment transaction between a consumer and a merchant on our Payments Platform:
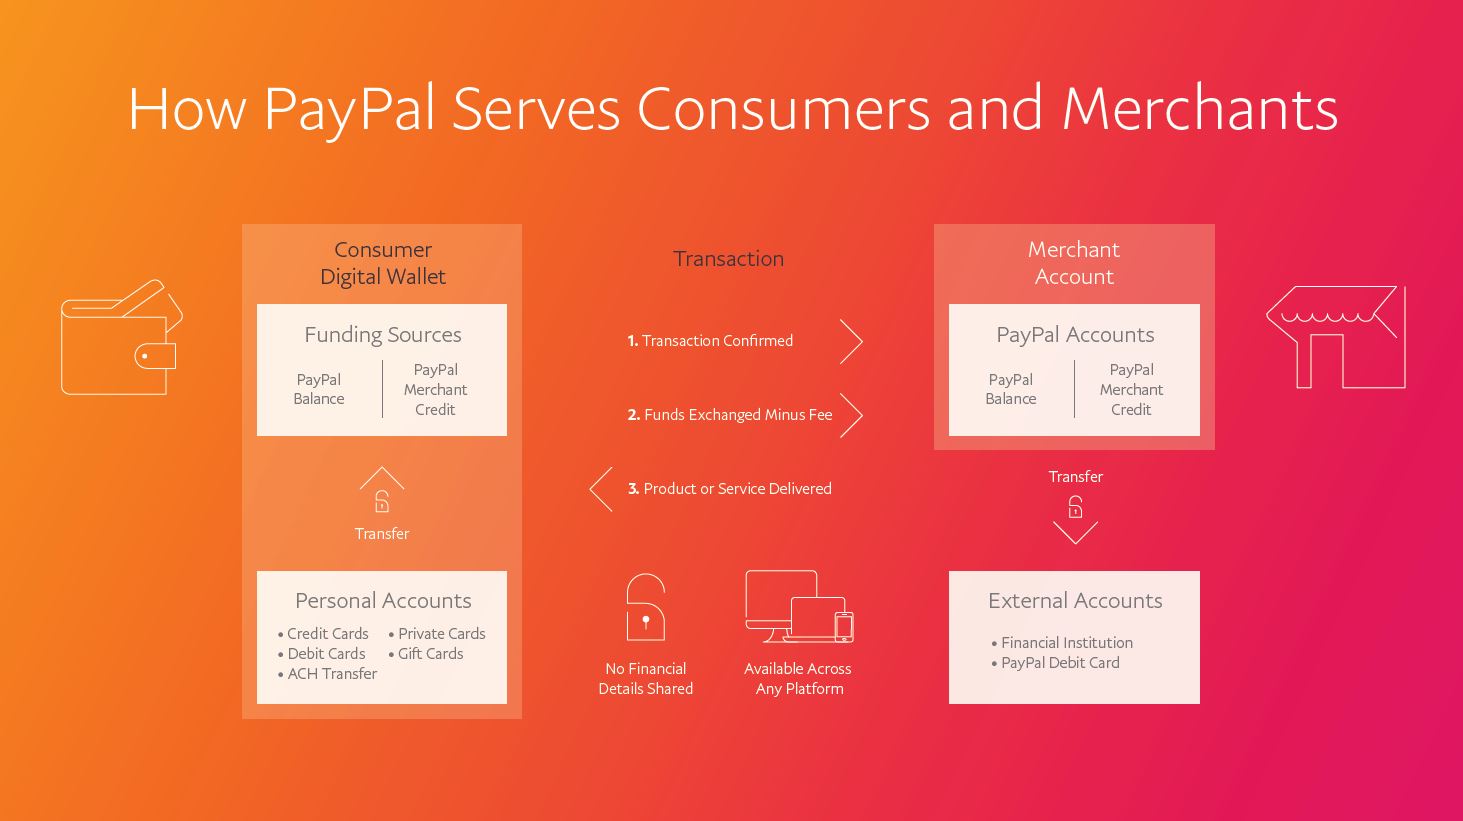
Consumers
We enable consumers to more safely exchange funds with merchants using their PayPal digital wallet. Our digital wallet provides consumers with the ability to draw funds from a variety of their financial resources, which may include both “internal” sources of funds (i.e., a PayPal account balance or PayPal Credit account) and sources of funds that are “external” to PayPal (e.g., bank transfers, credit and debit cards or gift cards), within one application. We generally do not charge consumers to fund or draw from their accounts; however, we generate revenue from consumers on fees charged to exchange currencies and on interest and fees from consumer loans originated through our PayPal Credit products.
We value our relationship with our consumers and invest in this relationship. We strive to provide efficient customer service, account support, and protection from loss, and to create relevant products. As of December 31, 2015, over 8,000 people in our customer service organization worked to provide our consumers with answers and solutions when and where they need them, in over 20 languages. We have operations centers around the world, including in the U.S., Europe, Asia and South America, that strive to provide high-quality service and support for our customers. We have also developed a number of trust and security programs, including PayPal’s Buyer Protection Program, that provide additional protection to consumers for qualifying purchases by reimbursing the consumer for the full amount of the purchase if a purchased item does not arrive or is significantly different than the seller’s description (see "Revenue Sources—Protecting Merchants and Consumers" below).
Traditional financial institutions often charge fees for basic services provided to their customers, and existing alternatives to these financial institutions, including services to cash a check or pay a bill, can be inconvenient and expensive. We focus on providing
4
affordable consumer products that democratize the access to and movement of money. We believe that managing and moving a consumer’s money should be a right, not a privilege. Through our technology and products, we believe we can change the status quo and make digital payments more efficient and accessible. We expect P2P transfers to contribute to this strategy. We believe that our P2P products have network effects and help to establish relationships with potential PayPal users by allowing them to join the Payments Platform at the time of making or receiving payments, which encourages our natural, customer-driven growth. PayPal offers P2P payment solutions through its website, its PayPal mobile application, through Venmo, a mobile application that enables payment transactions between non-merchant account holders, and through Xoom, a service enabling payments from customers in the United States to family and friends in a secure, fast and cost-effective way, using their mobile phones or computers. Xoom offers money transfer services from the United States to 41 countries, cross-border bill payment services from the United States to 7 countries and prepaid mobile phone reload services in 25 countries.
We also provide the ability for consumers to receive a line of credit through our PayPal Credit consumer products. Consumers access this credit through their PayPal account or directly with merchants. As of December 31, 2015, we have purchased or extended approximately
$7.4 billion
in credit to consumers, of which
$4.0 billion
is currently outstanding. We currently fund the purchase of PayPal Credit consumer receivables with international and domestic cash resources. Our chartered financial institution in Luxembourg, or an independent chartered financial institution in the U.S. with whom we partner, extends credit to the consumer, funds the extension of credit at the point of sale (“POS”) and advances funds to the merchant. In the U.S., we subsequently purchase the consumer receivables related to the consumer loans from the independent chartered financial institution with whom we partnered and as a result of that purchase, bear the risk of loss on the related consumer receivables, less a participation interest held by the independent chartered financial institution. As we expand the availability of our credit products, we expect to utilize capital from internal and external sources. In the second quarter of 2015, we concluded an arrangement with certain investors whereby we sold a participation interest in certain consumer receivables originated by PayPal Credit. We will continue to evaluate partnerships and third party sources of funding of our credit portfolio, including, but not limited to, commercial banks, securitization markets, private equity firms, sovereign wealth funds and under certain specific circumstances, the use of customer funds. For additional information concerning our consumer credit products, see “Management’s Discussion and Analysis of Financial Condition and Results of Operations -Future Liquidity and Obligations” and “Note 9—Loans and Interest Receivable Net” to our combined and consolidated financial statements included elsewhere herein.
Merchants
As commerce continues to transition from the physical world to the digital world and from domestic commerce to global commerce, our proprietary Payments Platform provides opportunities for merchants to grow their businesses. We partner with merchants to help them grow and expand their businesses by improving sales conversion, providing global reach, offering alternative payment methods (such as easy integration credit products and mobile capabilities), reducing losses through proprietary protection programs, and leveraging data analytics. We focus on growing merchant acceptance through business development activities and direct relationships with merchants. We enable merchants to more safely and simply receive payments from our active customer accounts, providing global reach while reducing some of the complexity and friction involved in enabling overseas and cross-border trade. For the year ended December 31, 2015, approximately
45%
of our TPV involved a merchant outside of the U.S., and approximately
22%
was cross-border (i.e., transactions where the merchant or consumer were in different countries).
A merchant can typically open a standard PayPal account and begin accepting payments through PayPal within a few minutes. Most online or mobile merchants can onboard quickly and are not required to invest in new or specialized hardware. Our Payments Platform supports growth with a variety of value added services designed to help businesses of all sizes manage their cash flow, invoice clients, pay bills, and reduce the need for merchants to receive and store sensitive customer financial information. For our standard service, we do not charge merchants setup or recurring fees. A merchant can also integrate with Braintree to begin accepting payments with credit or debit cards, PayPal, Venmo, digital currencies such as Bitcoin, or other payment solutions with a single integration.
Our payment and PayPal Credit products are designed to help merchants increase the conversion rate of consumer purchases on their websites and mobile applications. For example, our One Touch product allows consumers to authenticate their account during their first One Touch purchase. This enables them to skip the login process for future payments and turn shopping into a one touch operation with near-instant authentication. With a faster authentication process, we believe that fewer customers will abandon a potential transaction before completing it. We also provide the ability for merchants to offer (and consumers to fund) payments via a deferred payment option using our PayPal Credit consumer products. In addition, our PayPal Working Capital (“PPWC”) product provides merchants with a working capital advance, which is paid back to PayPal through a percentage of a merchant’s sales that PayPal processes. In 2015, we achieved the milestone of having originated more than $1 billion in working capital advances. As of December 31, 2015, we had
$421 million
PayPal Working Capital advances and fees receivable outstanding. Our PPWC product allows us to deepen our engagement with our small business customers by offering them additional services. For additional information concerning our merchant credit products, see “Management’s Discussion and Analysis of Financial
5
Condition and Results of Operations -Future Liquidity and Obligations” and “Note 9—Loans and Interest Receivable, Net” to our combined and consolidated financial statements included elsewhere in this Annual Report on Form 10-K.
We value our relationship with merchants and invest in this relationship by providing customer service, account support, developer advocacy and support, and proprietary risk and security solutions. In addition to our consumer protection programs, we have also developed PayPal’s Seller Protection Program. This program provides protection to merchants against claims that a transaction was not authorized by the buyer or claims that an item was not received by covering the seller for the full amount of the payment on eligible sales. By offering dual buyer and seller protection programs, both the consumer and merchant can transact with confidence.
Our Payments Platform and open application programming interfaces (“APIs”) are designed to allow developers to innovate with ease and to offer cutting edge applications to a large ecosystem of merchants and consumers, while at the same time maintaining the security of our customers’ financial information. We provide developers with easy to use, flexible and powerful tools that are designed to leverage our global reach and payment capabilities. Our software developer kits (“SDKs”) are specifically focused on the mobile application market and are designed to remove friction by not requiring a redirect to the PayPal website or an additional log-in. We are using a true “mobile first” approach to make payments simple and intuitive.
Competition
The global payments industry is highly competitive. We compete against businesses in varied industries, many of which are larger than we are, have a dominant and secure position in other industries, or offer other goods and services to consumers and merchants which we do not offer. We compete against all forms of payments, including credit and debit cards; automated clearing house and bank transfers; other online payment services; mobile payments; and offline payment methods, including cash and check.
We compete primarily on the basis of the following:
|
•
|
ability to attract, retain and engage both merchants and consumers;
|
|
•
|
ability to show that merchants will achieve incremental sales by offering our PayPal services;
|
|
•
|
security of transactions and the ability for consumers to use our PayPal products and services without sharing their financial information with the merchant or the party they are paying;
|
|
•
|
simplicity of our fee structure;
|
|
•
|
ability to develop services across multiple commerce channels, including mobile payments and payments at the retail point of sale;
|
|
•
|
trust in our dispute resolution and buyer and seller protection programs;
|
|
•
|
customer service;
|
|
•
|
brand recognition;
|
|
•
|
website, mobile platform and application onboarding, ease-of-use and accessibility;
|
|
•
|
system reliability and data security;
|
|
•
|
ease and quality of integration into third-party mobile applications and operating systems; and
|
|
•
|
quality of developer tools such as our application programming interfaces and software development kits.
|
For additional information concerning competition and our competitors, see Item 1A: “Risk Factors- Substantial and increasingly intense competition worldwide in the global payments industry may harm our business.”
PayPal seeks to differentiate itself from industry participants on the safety of the transaction (our risk management capabilities as well as protection of consumer account details), the simplicity provided for digital transactions, and being both brand and technology agnostic. Further, unlike traditional four-party networks or other mobile payment solutions, PayPal has a direct financial relationship with both its consumers and merchants. As a result of our risk management capabilities, PayPal can provide its customers with protection from fraud and other losses incurred by participants to a transaction.
To compete effectively, we will need to continue to expend significant resources in technology and marketing. During 2015, PayPal incurred
$947 million
on product innovation and development and enhancing our infrastructure to ensure our customers have the capabilities they need and want to complete transactions safely and simply. Further, in 2015, we incurred over $900 million related to our efforts to promote our brands through advertising, promotions, and other strategic initiatives. Our marketing efforts play an important role in building brand visibility, usage and overall preference among consumers at checkout.
Our strengths
Our business is built on a strong foundation designed to allow PayPal to differentiate itself from our competitors and drive growth.
6
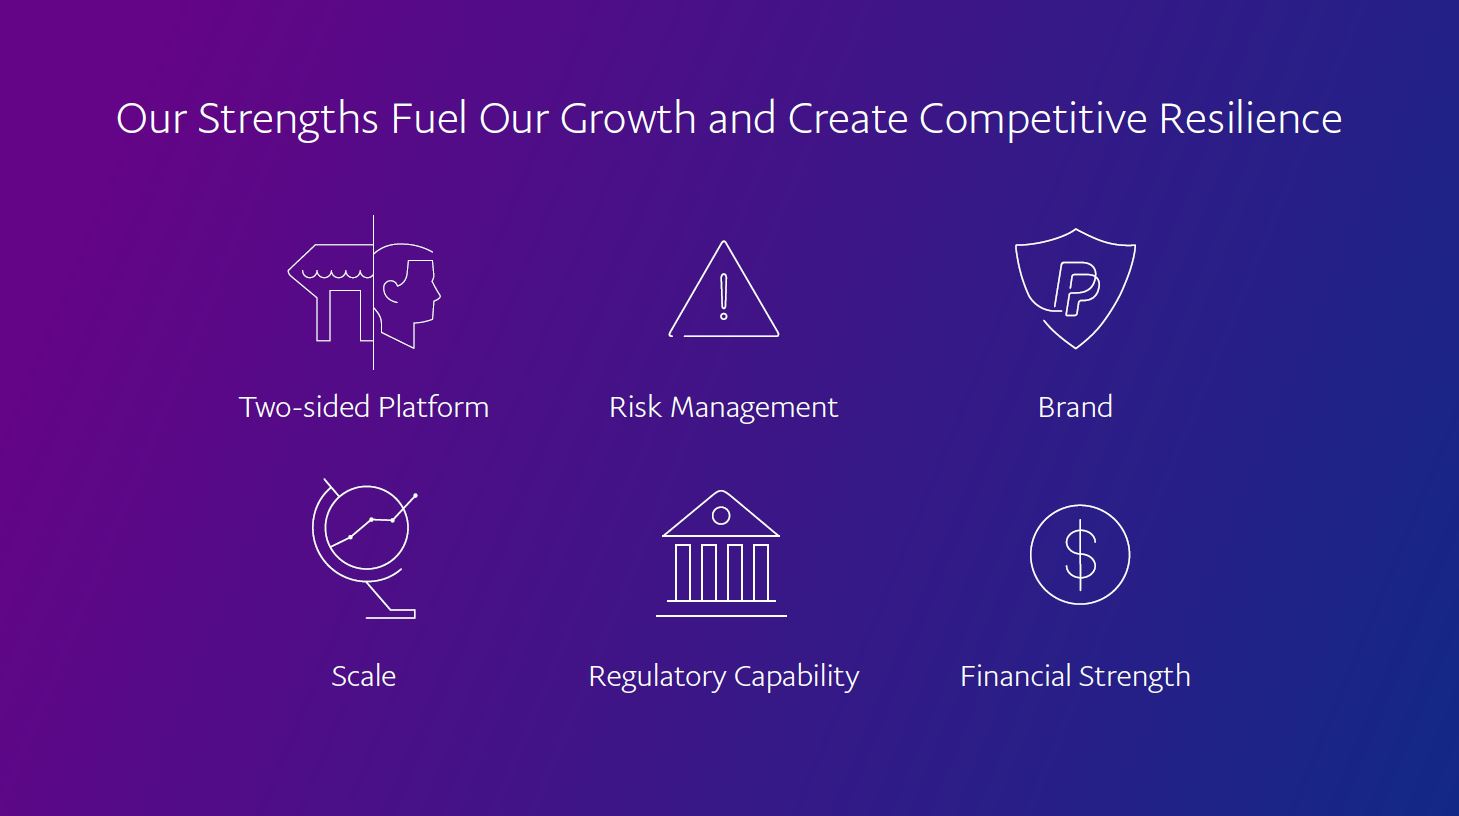
Our competitive capabilities include:
|
•
|
Two-sided Platform -
our platform connecting merchants and consumers enables PayPal to offer unique end-to-end product experiences while gaining valuable insights into customer behavior through our data. Our platform provides for simple digital and mobile transactions (use of an email address, a mobile phone number, or our One Touch product) while being both brand and technology agnostic.
|
|
•
|
Risk Management -
our risk management system and tokenization allows us to keep our customers safer and to process legitimate transactions around the world while preventing illegal, high-risk, or fraudulent transactions.
|
|
•
|
Brand -
PayPal has built a well-recognized and trusted brand and was named one of Interbrand’s best global brands of 2015.
|
|
•
|
Scale -
our global scale
gives us impressive reach. As of December 31, 2015, we had
179 million
active customer accounts which included 13 million merchants, and in 2015, PayPal processed
$282 billion
of total payment volume in more than 200 markets around the world.
|
|
•
|
Regulatory Capability -
we believe that our regulatory licenses that give us the ability to operate in markets around the world are a clear advantage and help our business grow.
|
|
•
|
Financial Strength -
the diversity of our funding mix gives us confidence we can continue to grow profitably. Our strong balance sheet, low debt and cash balance allow us to aggressively pursue new opportunities.
|
In addition to the discussion in this section, see “Substantial and increasingly intense competition worldwide in the global payments industry may harm our business” in “Item 1A: Risk Factors” below for further discussion of the potential impact of competition on our business.
Revenue Sources
We earn revenues primarily by processing customer transactions on our Payments Platform and from other value added services. Our revenues are classified into the following two categories:
|
•
|
Transaction revenues:
Net transaction fees charged to consumers and merchants based on the volume of activity processed through our Payments Platform, including our PayPal, PayPal Credit, Venmo, Braintree and Xoom products.
|
7
|
•
|
Other value added services
: Net revenues derived principally from interest and fees earned on our PayPal Credit loans receivable portfolio, subscription fees, gateway fees, gain on sale of participation interest in certain consumer loans receivable, revenue share we earn through partnerships, interest earned on certain PayPal customer account balances, fees earned through our Paydiant products and other services that we provide to consumers and merchants.
|
Transaction revenues are generated from fees charged to consumers and merchants on the TPV that we enable. Growth in TPV is also directly impacted by the number of active customer accounts and the payment transactions that we enable on our payments platform. In 2015, transaction revenues generated from customers and merchants on eBay’s marketplace who completed a transaction using our products constituted
26%
of our net revenues, down from
29%
in 2014. The decline in percentage of revenues generated from eBay buyers and eBay sellers reflects the growth in adoption of PayPal solutions on platforms other than eBay. No other source of revenue represented more than 10% of our revenues.
Our pricing varies among regions and can be modified for individual merchants through customer-specific agreements which provide merchants with financial incentives and other benefits to issue, accept, route, prioritize and promote our branded products and other payment programs. These financial incentives may be based on TPV or other performance-based criteria, such as issuance of new payment products, increased acceptance of our products, launch of new programs, or execution of marketing initiatives.
Protecting Merchants and Consumers
Protecting merchants and consumers from loss is imperative to successfully competing in the payments industry. Trust and security are essential for our customers, and PayPal invests significantly in providing both merchants and consumers with comprehensive protection. The risk to merchants and consumers (and their payments partners) from fraudulent activities, such as account takeover, identity theft and counterparty malicious intent, is growing. Our ability to protect both consumers and merchants is based largely on our ability to leverage the data we collect on transactions and our analytical capabilities. We believe mobile devices will play an important part in the future of commerce, creating the opportunities to make our ecosystem safer. For example, PayPal is able to use location data from mobile devices and growing protection for the mobile operating environment to reduce risk to merchants and consumers.
We enable consumers to make payments safely and simply without sharing sensitive financial information, such as credit card or debit card numbers, with merchants or other consumers. To make payments using PayPal, consumers need to disclose only their email address or mobile phone number to merchants. The account-based nature of our Payments Platform helps us to better detect and prevent fraud when funds enter, flow through and exit the Payments Platform because our transactions are tokenized and because payment authorization credentials are separated from account holder information. Our ongoing investment in systems and processes designed to enhance the safety and security of our products reflects our goal of having PayPal recognized as one of the world’s most trusted payments brands.
We provide merchants and consumers with protection programs on substantially all transactions completed through our Payments Platform, except for transactions using our gateway and Paydiant products. These programs protect both merchants and consumers from loss primarily due to fraud and counterparty non-performance. Our risk management capabilities allow us to provide these protections, which are generally much broader than those protections provided by other participants in the payments industry. Most payments providers do not offer merchant protection in general, and those that do so generally do not provide protection of online or card not present transactions. As a result, merchants may incur losses for chargebacks and other claims on certain transactions when using other payments providers that they would not incur if they had used PayPal’s payments services. PayPal also provides consumer protection against losses on qualifying purchases and accepts claims for 180 days post transaction in the markets that PayPal serves. This protection is generally consistent with, or better than, that offered by other payments providers. We believe that as a result of these programs, consumers can be confident that they will only be required to pay if they receive the product in the condition as described, and merchants can be confident that they will receive payment for the product that they are delivering to the customer.
Our Payments Platform utilizes a combination of proprietary technologies and services as well as technologies and services provided by third parties. We have developed intuitive user interfaces, customer tools and transaction processing, database and network applications that help enable our users to reliably and securely complete transactions on our sites and help our customers to utilize our suite of services. Our technology infrastructure simplifies the storage and processing of large amounts of data, eases the deployment and operation of large-scale global products and services, and automates much of the administration of large-scale clusters of computers. Our technology infrastructure has been designed around industry-standard architectures to reduce downtime in the event of outages or catastrophic occurrences. We strive to continually improve our technology infrastructure to enhance the customer experience and to increase efficiency, scalability, and security.
8
Our Payments Platform’s architecture enables us to connect parties regardless of whether the transaction is occurring at a traditional physical location, online, or through a mobile device. The Payments Platform incorporates multiple layers of protection, both for continuity purposes and to help address cyber-security challenges. We engage in multiple efforts to protect the Payments Platform against these challenges, including regularly testing our systems to address potential vulnerabilities.
Intellectual Property
The protection of our intellectual property, including our trademarks (particularly those covering the PayPal name), patents, copyrights, domain names, trade dress and trade secrets is critical to our success. We aggressively protect our intellectual property rights by relying on applicable laws and regulations in the U.S. and internationally, as well as a variety of administrative procedures. We also rely on contractual restrictions to protect our proprietary rights in products and services. We have routinely entered into confidentiality and invention assignment agreements with our employees and contractors and nondisclosure agreements with parties with whom we conduct business to control access to and limit disclosure of our proprietary information.
We pursue the registration of our domain names, trademarks and service marks in the U.S. and internationally. Additionally, we have filed U.S. and international patent applications covering certain aspects of our proprietary technology. Effective trademark, copyright, patent, domain name, trade dress and trade secret protection is very expensive to maintain and may require litigation and may not be effective in preventing third parties from infringing upon our intellectual property rights. We must protect our intellectual property and other proprietary rights in an increasing number of jurisdictions, a process that is expensive and time consuming and may not be successful.
We have registered our core brands as trademarks and domain names in the U.S. and a large number of other jurisdictions and have in place an active program to continue to secure trademarks and domain names that correspond to our brands in markets of interest.
Government Regulation
Government regulation impacts key aspects of our business. We are subject to regulations that affect the payments industry in the markets we operate.
Payments Regulation.
Various laws and regulations govern the payments industry in the U.S. and globally. In the U.S., several of our subsidiaries hold licenses to operate as a money transmitter (or its equivalent), which, among other things, subjects those subsidiaries to reporting requirements, bonding requirements, limitations on the investment of customer funds and inspection by state regulatory agencies. Outside the U.S., we provide localized versions of our service to customers through various foreign subsidiaries. The activities of those non-U.S. entities are, or may, be supervised by a financial regulatory authority in the jurisdictions in which they operate. Among other regulatory authorities, the Luxembourg Commission de Surveillance du Secteur Financier (the “CSSF”), the Australian Securities and Investment Commission, the Monetary Authority of Singapore, the Reserve Bank of India, and the Central Bank of Russia have asserted jurisdiction over some or all of our activities in a particular country. This list is not exhaustive, as there are numerous other regulatory agencies that have or may assert jurisdiction. The laws and regulations applicable to the payments industry in any given jurisdiction are subject to interpretation and change.
Banking Agency Supervision
. We serve our customers in the European Union through PayPal (Europe) S.à.r.l. et Cie, SCA, a wholly-owned subsidiary that is licensed and subject to regulation as a bank in Luxembourg by the CSSF. Consequently, we must comply with rules and regulations of the banking industry, including those related to capitalization, funds management, corporate governance, anti-money laundering, disclosure, reporting and inspection. We also are, or may be, subject to banking-related regulations in other countries now or in the future related to our role in the financial industry. In addition, based on our relationships with our partner financial institutions in the U.S., we are subject to indirect regulation and examination by these financial institutions’ regulators.
Consumer Financial Protection Bureau
. The Consumer Financial Protection Bureau (the “CFPB”) has significant authority to regulate consumer financial products in the United States, including consumer credit, deposit, payment, and similar products. The CFPB and other similar regulatory agencies in other jurisdictions may have broad consumer protection mandates that could result in the promulgation and interpretation of rules and regulations that may affect our business.
Anti-Money Laundering and Counter Terrorist Financing.
PayPal is subject to anti-money laundering (“AML”) laws and regulations in the U.S. and other jurisdictions outside of the U.S., as well as laws designed to prevent the use of the financial systems to facilitate terrorist activities. We have implemented a comprehensive AML program designed to prevent our payment network from being used to facilitate money laundering, terrorist financing, and other illicit activity, or to do business in countries
9
or with persons and entities included on designated country or person lists promulgated by the U.S. Department of the Treasury’s Office of Foreign Assets Controls (“OFAC”) and equivalent authorities in other countries. Our AML compliance program is comprised of policies, procedures and internal controls, including the designation of a compliance officer, and is designed to address these legal and regulatory requirements and assist in managing money laundering and terrorist financing risks.
Interchange Fees.
Interchange fees associated with four-party payments systems are being reviewed or challenged in various jurisdictions. For example, in the European Union, the Multilateral Interchange Fee (“MIF”) Regulation (which became effective in December 2015) caps credit and debit interchange fees for cards payments and provides for business rules to be complied with by any company dealing with card transactions, including PayPal. As a result, the fees that we collect in certain jurisdictions may become the subject of regulatory challenge.
Data Protection and Information Security.
Aspects of our operations or business are subject to privacy and data protection regulation in the United States, the European Union and elsewhere. For example, in the United States, we are subject to information safeguarding requirements under the Gramm-Leach-Bliley Act that require the maintenance of a written, comprehensive information security program and in Europe, the operations of our Luxembourg bank are subject to information safeguarding requirements under the Luxembourg Banking Act, among other laws. Regulatory authorities around the world are considering numerous legislative and regulatory proposals concerning privacy and data protection. In addition, the interpretation and application of these privacy and data protection laws in the United States, Europe and elsewhere are often uncertain and in a state of flux.
Anti-Corruption.
PayPal is subject to applicable anti-corruption laws, such as the U.S. Foreign Corrupt Practices Act and the U.K. Bribery Act, in the jurisdictions in which it operates. Anti-corruption laws generally prohibit offering, promising, giving, or authorizing others to give anything of value, either directly or indirectly, to a government official or private party in order to influence official action or otherwise gain an unfair business advantage, such as to obtain or retain business. We have implemented policies, procedures, and internal controls that are designed to comply with these laws and regulations.
Additional Regulatory Developments.
Various regulatory agencies also continue to examine a wide variety of issues, including virtual currencies, identity theft, account management guidelines, privacy, disclosure rules, security and marketing that would impact PayPal.
For an additional discussion on governmental regulation affecting our business, please see the risk factors related to regulation of our payments business and regulation in the areas of consumer privacy, data use and/or security in “Item 1A: Risk Factors -Risk Factors That May Affect Our Business, Results of Operations and Financial Condition” and Item 3: Legal Proceedings" included elsewhere in this Annual Report on Form 10-K.
Seasonality
The Company does not experience meaningful seasonality. No individual quarter in
2015
,
2014
or
2013
accounted for more than 30% of net revenue.
Research and Development
Total research and development expense was
$947 million
,
$890 million
and
$727 million
in 2015, 2014 and 2013, respectively.
Financial Information About Segments
See “Note 10—Segment and Geographical Information” to the combined and consolidated financial statements included in this Annual Report on Form 10-K for certain financial information about segments. Additionally, please see the information in "Item 1A: Risk Factors" under the caption "Our international operations are subject to increased risks, which could harm our business," which describes risks associated with the foreign operations of segments.
10
Employees
As of
December 31, 2015
, we employed approximately 16,800 people globally, of whom approximately 9,800 were located in the U.S. We consider our relationship with employees to be good.
Separation from eBay Inc.
PayPal Holdings, Inc. was incorporated in Delaware in January 2015 for the purpose of owning and operating eBay’s Payments business in connection with the separation and distribution described below. Prior to the contribution of this business to PayPal Holdings, Inc., which occurred prior to the distribution in July 2015, PayPal Holdings, Inc. had no operations. On July 17, 2015 (the “distribution date”), PayPal became an independent publicly-traded company through the pro rata distribution by eBay of 100% of the outstanding common stock of PayPal to eBay stockholders (which we refer to as the “separation” or the “distribution”). Each eBay stockholder of record as of the close of business on July 8, 2015 received one share of PayPal common stock for every share of eBay common stock held on the record date. Approximately 1.2 billion shares of PayPal common stock were distributed on July 17, 2015 to eBay stockholders. PayPal’s common stock began “regular way” trading under the ticker symbol “PYPL” on The NASDAQ Stock Market on July 20, 2015. Prior to the separation, eBay transferred substantially all of the assets and liabilities and operations of eBay’s payments business to PayPal, which was completed in June 2015.
Available Information
The address of our principal executive offices is PayPal Holdings, Inc., 2211 North First Street, San Jose, California 95131 and our telephone number is (408) 967-1000. We maintain an Internet site at www.paypal.com, and our investor relations site at http://investor.paypal-corp.com. From time to time, we may use our investor relations site and other online and social media channels, including our PayPal Stories Blog, Twitter handle and LinkedIn page to disclose material non-public information and comply with our disclosure obligations under Regulation FD. Our Annual Report on Form 10-K, quarterly reports on Form 10-Q, current reports on Form 8-K and amendments to those reports are available, without charge, for review on our investor relations site as soon as reasonably practicable after they are electronically filed with, or furnished to, the SEC. The content of our websites and information that we may post on or provide to online and social media channels, including those mentioned above, is not incorporated by reference into this Annual Report on Form 10-K or in any other report or document we file with the SEC, and any references to our websites are intended to be inactive textual references only.
11
The following discussion is divided into three sections. The first section, which begins immediately following this paragraph, discusses some of the risks that may affect our business, results of operations and financial condition. The second section, captioned “Risks Related to the Separation and Our Operation as an Independent Publicly Traded Company,” discusses some of the risks relating to our separation into an independent publicly traded company. The third section, captioned “Risks Related to Our Common Stock,” discusses some of the risks relating to an investment in our Common Stock. You should carefully review all of these sections, as well as our combined and consolidated financial statements and notes thereto and the other information appearing in this report, for important information regarding risks that affect us.
Risk Factors That May Affect Our Business, Results of Operations and Financial Condition
Substantial and increasingly intense competition worldwide in the global payments industry may harm our business.
The global payments industry is highly competitive. We compete against businesses in varied industries, many of which are larger than we are, have a dominant and secure position in other industries, or offer other goods and services to consumers and merchants which we do not offer. As online and offline commerce are increasingly converging, the pace of change, innovation and disruption is also increasing. The global payments industry is rapidly changing, highly innovative and increasingly subject to regulatory scrutiny, which may negatively affect the competitive landscape. We compete against a wide range of businesses with varying roles in all forms of payments, including:
|
•
|
paper-based transactions (principally cash and checks);
|
|
•
|
providers of traditional payment methods, particularly credit and debit cards, and Automated Clearing House transactions (in particular, well-established banks);
|
|
•
|
payment networks which facilitate payments for credit card users;
|
|
•
|
providers of “digital wallets” which offer customers the ability to pay online and/or on mobile devices through a variety of payment methods, including with mobile applications, through contactless payments, and with a variety of payment cards (these providers include Visa, MasterCard, American Express, Amazon.com, Wal-Mart, the Merchant Customer Exchange (MCX) initiative supported by major U.S. retailers, Apple, Google, and others);
|
|
•
|
providers of mobile payments solutions that use tokenized card data approaches and Near Field Communication (NFC) functionality (e.g., Apple's mobile Apple Pay) or Host Card Emulation (HCE) functionality to eliminate the need for access to the physical secure element in the device (e.g., Google's Android solution);
|
|
•
|
payment-card processors that offer their services to merchants, including for “card on file” payments where the merchant invites the consumer to select a payment method for their first transaction, and subsequently uses the same payment method for subsequent transactions;
|
|
•
|
providers of “person-to-person” payments that facilitate individuals sending money with an email address or mobile phone number, such as Facebook messaging payments, Google and many banks;
|
|
•
|
merchants and merchant associations providing proprietary payment networks to facilitate payments within their own retail network, such as Wal-Mart;
|
|
•
|
money remitters, such as MoneyGram, Western Union, Global Payments, Inc. and Euronet; and
|
|
•
|
providers of card readers for mobile devices and of other point-of-sale and multi-channel technologies.
|
We often partner with many of these businesses.
We also face competition and potential competition from:
|
•
|
services that provide online merchants the ability to offer their customers the option of paying for purchases from their bank account or paying on credit in the United States and abroad;
|
|
•
|
issuers of stored value targeted at online payments;
|
|
•
|
other international online payment-services providers;
|
|
•
|
other providers of online account-based payments;
|
|
•
|
payment services targeting users of social networks and online gaming, including those offering billing to the consumer’s mobile phone account;
|
|
•
|
mobile payment services between bank accounts;
|
|
•
|
payment services enabling banks to offer their online banking customers the ability to send and receive payments through their bank account;
|
|
•
|
online shopping services that provide special offers linked to a specific payment provider; and
|
|
•
|
services that help merchants accept and manage virtual currencies.
|
12
Some of these payment providers have greater customer bases, volume, scale, resources, and market share than we do, which may provide significant competitive advantages. Some of our competitors may also be subject to less burdensome licensing, anti-money laundering, counter-terrorist financing, and other regulatory requirements. They may devote greater resources to the development, promotion, and sale of products and services, and they may offer lower prices or more effectively introduce their own innovative programs and services that adversely impact our growth. We also expect new entrants, as well as established banks and other financial institutions that do not currently offer online payments, to offer competitive products and services in the future. In addition, some merchants provide such services for themselves. Competing services tied to established banks and other financial institutions may engender greater consumer confidence in the safety and efficacy of their services. In certain countries, such as Germany, Netherlands and Australia, electronic funds transfer is a leading method of payment for both online and offline transactions with which our products compete.
We compete primarily on the basis of the following:
|
•
|
ability to attract, retain and engage both merchants and consumers;
|
|
•
|
ability to show that merchants will achieve incremental sales by offering our PayPal services;
|
|
•
|
security of transactions and the ability for consumers to use our PayPal products and services without sharing their financial information with the merchant or the party they are paying;
|
|
•
|
simplicity of our fee structure;
|
|
•
|
ability to develop services across multiple commerce channels, including mobile payments and payments at the retail point of sale;
|
|
•
|
trust in our dispute resolution and buyer and seller protection programs;
|
|
•
|
customer service;
|
|
•
|
brand recognition;
|
|
•
|
website, mobile platform and application onboarding, ease-of-use and accessibility;
|
|
•
|
system reliability and data security;
|
|
•
|
ease and quality of integration into third-party mobile applications and operating systems; and
|
|
•
|
quality of developer tools, such as our application programming interfaces and software development kits.
|
If we are not able to differentiate our business from those of our competitors, drive value for our customers, or effectively align our resources with our goals and objectives, we may not be able to compete effectively against our competitors. Our failure to compete effectively against any of the foregoing competitive threats could materially and adversely harm our business.
Our operating and financial results come primarily from transactions involving payments made in a reporting period and are therefore subject to fluctuations that could adversely affect our business, financial condition, results of operations and cash flows, as well as the trading price of our common stock.
Our operating and financial results have varied on a quarterly basis during our operating history and may continue to fluctuate significantly as a result of a variety of factors, including as a result of the risks set forth in this “Risk Factors” section. It is difficult for us to forecast the level or source of our revenues or earnings (loss) accurately. In view of the rapidly evolving nature of our business, period-to-period comparisons of our operating results may not be meaningful, and you should not rely upon them as an indication of future performance. We do not have a backlog, and substantially all of our net revenues each quarter come primarily from transactions involving payments during that quarter. Due to the inherent difficulty in forecasting revenues, it is also difficult to forecast expenses as a percentage of net revenues. Quarterly and annual expenses as a percentage of net revenues reflected in our financial statements may be significantly different from historical or projected rates. Our operating results in one or more future quarters may fall below the expectations of securities analysts and investors. The trading price of our common stock could decline, perhaps substantially, as a result of the factors described in this paragraph.
Global and regional economic conditions could harm our business.
Our operations and performance depend significantly on global and regional economic conditions. Adverse economic conditions and events have negatively impacted regional and global financial markets in the past and will likely continue to do so from time to time in the future. These events and conditions could have a negative and adverse impact on the companies and customers with which we do business. In addition, financial turmoil affecting the banking system or financial markets could cause additional consolidation of the financial services industry, significant financial service institution failures, new or incremental tightening in the credit markets, low liquidity, and extreme volatility or distress in the fixed income, credit, currency, and equity markets. Adverse impacts to the companies and customers with which we do business, the banking system, or financial markets could have a material adverse effect on our business, including a reduction in the volume and prices of transactions on our payments platforms.
13
If we cannot keep pace with rapid technological developments, particularly developments with respect to mobile payments, to provide new and innovative programs, products and services, the use of our products and our revenues could decline.
Rapid, significant, and disruptive technological changes continue to impact the industries in which we operate, including developments in payment card tokenization, ecommerce (e.g., social commerce), mobile, virtual currencies and near field communication and other proximity payment devices, such as contactless payments. We cannot predict the effects of technological changes on our business. In addition to our own initiatives and innovations, we rely in part on third parties, including some of our competitors, for the development of and access to new technologies. We expect that new services and technologies applicable to the industries in which we operate will continue to emerge, which may be superior to, or render obsolete, the technologies we currently use in our products and services. Developing and incorporating new technologies into our products and services may require substantial expenditures, take considerable time, and ultimately may not be successful. In addition, our ability to adopt new services and develop new technologies may be inhibited by industry-wide standards, payments networks, new laws and regulations, resistance to change from consumers or merchants, or third-party intellectual property rights. Our success will depend on our ability to develop and incorporate new technologies and adapt to technological changes and evolving industry standards; if we are unable to do so in a timely or cost-effective manner, our business could be harmed.
For example, mobile devices are increasingly used for ecommerce transactions and payments, and a significant and growing portion of our customers access our Payments Platform through mobile devices. We may lose customers if we are not able to continue to meet our customers’ mobile and multi-screen experience expectations. The variety of technical and other configurations across different mobile devices and platforms increases the challenges associated with this environment. In addition, a number of other companies with significant resources and a number of innovative startups have introduced products and services focusing on mobile markets. Our ability to successfully address the challenges posed by the rapidly evolving market for mobile transactions is crucial to our continued success, and any failure to continue to increase the volume of mobile transactions effected through our Payments Platform could harm our business.
Changes in how consumers fund their PayPal transactions could harm our business.
We pay significant transaction fees when consumers fund payment transactions using credit cards, lower fees when consumers fund payments with debit cards, nominal fees when consumers fund payment transactions by electronic transfer of funds from bank accounts, and nominal fees when consumers fund payment transactions from an existing PayPal account balance or through our PayPal Credit products. Our financial success is highly sensitive to changes in the rate at which our consumers fund payments using credit and debit cards (collectively, “payment cards”), which can significantly increase our costs. Some of our consumers may prefer to use payment cards, especially if these payment cards offer functionality and benefits not associated with the use of their bank accounts. Some of our offerings, including the ability of consumers to make a limited number of “guest” payments without opening a PayPal account, have a higher rate of payment card funding than our basic product offering. An increase in the portion of our payment volume funded using payment cards or in fees associated with our funding mix, or other events or developments that make it more difficult or costly for us to fund transactions by electronic transfer of funds from bank accounts or existing PayPal account balances, could materially and adversely affect our financial performance and significantly harm our business. Some of our plans to lower our funding costs, including our PayPal Credit products and enabling consumers to defer payment for a short period of time on some transactions, may increase the risk to us of nonpayment by consumers.
Our business is subject to cyberattacks and security and privacy breaches.
Our business involves the collection, storage, processing and transmission of customers’ personal data, including financial information. In addition, a significant number of our customers authorize us to bill their payment card or bank accounts directly for all transaction and other fees charged by us. We have built our reputation on the premise that our Payments Platform offers customers a secure way to make payments. An increasing number of organizations, including large on-line and off-line merchants and businesses, other large Internet companies, financial institutions, and government institutions, have disclosed breaches of their information security systems, some of which have involved sophisticated and highly targeted attacks, including on portions of their websites or infrastructure. For example, in May 2014, eBay Inc. publicly announced that criminals were able to penetrate and steal certain data, including user names, encrypted user passwords and other non-financial user data, from certain of eBay's Marketplaces business unit databases, which led to eBay Marketplaces requiring a password reset and fewer eBay Marketplaces transactions using our PayPal services.
The techniques used to obtain unauthorized, improper or illegal access to our systems, our data or customers' data, disable or degrade service, or sabotage systems are constantly evolving, may be difficult to detect quickly, and often are not recognized until launched against a target. Unauthorized parties may attempt to gain access to our systems or facilities through various means, including, among others, hacking into the systems or facilities of us or our partners or customers, or attempting to fraudulently
14
induce our employees, partners, customers or others into disclosing user names, passwords, payment card information, or other sensitive information, which may in turn be used to access our information technology systems. Certain efforts may be state-sponsored and supported by significant financial and technological resources, making them even more difficult to detect. As a result of our prominence, we believe that we are a particularly attractive target for such breaches and attacks. Although we have developed systems and processes that are designed to protect our data and customer data and to prevent data loss and other security breaches, and expect to expend significant additional resources to bolster these protections, these security measures cannot provide absolute security, Our information technology and infrastructure may be vulnerable to cyberattacks or security breaches, and third parties may be able to access our customers’ personal or proprietary information and payment card data that are stored on or accessible through those systems. Our security measures may also be breached due to employee error, malfeasance, system errors or vulnerabilities, or other irregularities. Any actual or perceived breach of our security could interrupt our operations; result in our systems or services being unavailable; result in improper disclosure of data; materially harm our reputation and brand; result in significant legal and financial exposure; lead to loss of customer confidence in, or decreased use of, our products and services; and adversely affect our business and results of operations. Any breaches of network or data security at our partners or customers could have similar effects. In addition, our customers could have vulnerabilities on their own computer systems that are entirely unrelated to our systems, but could mistakenly attribute their own vulnerabilities to PayPal.
In addition, under payment card rules and our contracts with our card processors, if there is a breach of payment card information that we store, or that is stored by our direct payment card processing customers, we could be liable to the payment card issuing banks for their cost of issuing new cards and related expenses. We also expect to expend significant additional resources to protect against security or privacy breaches, and may be required to redress problems caused by breaches. Among other reasons, financial services regulators in various jurisdictions, including the United States and the European Union, have implemented or are considering proposals to impose new authentication requirements on banks and payment processors intended to reduce online fraud, which could impose significant costs, require us to change our business practices, make it more difficult for new customers to join PayPal, and reduce the ease of use of our products, which could harm our business. Additionally, our insurance policies carry low coverage limits, which may not be adequate to reimburse us for losses caused by security breaches, and we may not be able to collect fully, if at all, under these insurance policies.
Systems failures and resulting interruptions in the availability of our websites, applications, products or services could harm our business.
Our systems may experience service interruptions or degradation because of hardware and software defects or malfunctions, computer denial-of-service and other cyberattacks, human error, earthquakes, hurricanes, floods, fires, natural disasters, power losses, disruptions in telecommunications services, fraud, military or political conflicts, terrorist attacks, computer viruses or other malware, or other events. Our systems also may be subject to break-ins, sabotage and intentional acts of vandalism. Some of our systems are not fully redundant, and our disaster recovery planning may not be sufficient for all eventualities. In addition, as a provider of payments solutions, we are subject to increased scrutiny by regulators that may require specific business continuity, resiliency and disaster recovery plans and more rigorous testing of such plans. This increased scrutiny may be costly and time-consuming and may divert our resources from other business priorities.
We have experienced and will likely continue to experience system failures, denial of service attacks and other events or conditions from time to time that interrupt the availability or reduce or affect the speed or functionality of our products and services. These events have resulted and likely will result in loss of revenue. A prolonged interruption in the availability or reduction in the availability, speed or other functionality of our products and services could materially harm our business. Frequent or persistent interruptions in our services could cause current or potential customers to believe that our systems are unreliable, leading them to switch to our competitors or to avoid our products and services, and could permanently harm our reputation and brands. Moreover, to the extent that any system failure or similar event results in damages to our customers or their businesses, these customers could seek significant compensation or contractual penalties from us for their losses and those claims, even if unsuccessful, would likely be time-consuming and costly for us to address, and could have other consequences described in this “Risk Factors” section under the caption “Our business is subject to cyberattacks and security and privacy breaches.”
Our Payments Platform has suffered significant intermittent unavailability. Reliability is particularly critical for us because the full-time availability of our PayPal products and services is critical to our goal of gaining widespread acceptance among consumers and merchants for digital and mobile payments. We have undertaken certain system upgrades and re-platforming efforts designed to improve our reliability and speed. These efforts are costly and time-consuming, involve significant technical risk and may divert our resources from new features and products, and there can be no guarantee that these efforts will succeed. Because we are a regulated financial institution in certain jurisdictions, frequent or persistent site interruptions could lead to regulatory scrutiny, significant fines and penalties, and mandatory and costly changes to our business practices, and ultimately could cause us to lose
15
existing licenses that we need to operate or prevent or delay us from obtaining additional licenses that we need to expand our business.
We also rely on facilities, components and services supplied by third parties, including eBay, and our business may be materially adversely affected to the extent these components or services do not meet our expectations or these third parties cease to provide the services or facilities. We do not carry business interruption insurance sufficient to compensate us for all losses that may result from interruptions in our service as a result of systems failures and similar events.
Changes to payment card networks or bank fees, rules, or practices could harm our business.
We do not directly access the payment card networks, such as Visa and MasterCard, that enable our acceptance of credit cards and debit cards, including some types of prepaid cards. Accordingly, we must rely on banks or other payment processors to process transactions and must pay fees for the services. From time to time, payment card networks have increased, and may increase in the future, the interchange fees and assessments that they charge for each transaction which accesses their networks. Our payment card processors may have the right to pass any increases in interchange fees and assessments on to us as well as increase their own fees for processing. Any changes in interchange fees and assessments could increase our operating costs and reduce our operating income.
In addition, in some jurisdictions, governments have required Visa and MasterCard to reduce interchange fees, or have opened investigations as to whether Visa’s or MasterCard’s interchange fees and practices violate antitrust law. In the United States, the Federal Reserve Board issued a final rule capping debit card interchange fees at significantly lower rates than Visa or MasterCard previously charged. In the European Union, the Multilateral Interchange Fee (“MIF”) Regulation limits credit and debit interchange fees for payments and imposes business rules on card processing services. Any material reduction in credit or debit card interchange rates in the United States or other markets could adversely affect our competitive position against traditional credit and debit card service providers, and may subject us to pricing pressure, although it would also lower our costs. Future changes to those regulations could potentially adversely affect our business.
We are required by our processors to comply with payment card network operating rules, including special operating rules for payment service providers to merchants, and we have agreed to reimburse our processors for any fines they are assessed by payment card networks as a result of any rule violations by us or our merchants. The payment card networks set and interpret the card operating rules. From time to time, the networks have alleged that various aspects of our business model violate these operating rules. If such allegations are not resolved, they may result in material fines and penalties or require changes in our business practices that may be costly. The payment card networks could adopt new operating rules or interpret or re-interpret existing rules that we or our processors might find difficult or even impossible to follow, or costly to implement. As a result, we could lose our ability to give consumers the option of using payment cards to fund their payments or the choice of currency in which they would like their payment card to be charged. If we are unable to accept payment cards or are meaningfully limited in our ability to do so, our business would be adversely affected.
We and our payment card processors have implemented specific business processes for merchants to comply with payment card network operating rules for providing services to merchants. Any failure to comply with these rules could result in fines. We are also subject to fines from payment card networks if we fail to detect that merchants are engaging in activities that are illegal or that are considered “high risk,” primarily the sale of certain types of digital content. For “high risk” merchants, we must either prevent such merchants from using our PayPal services or register such merchants with the payment card networks and conduct additional monitoring with respect to such merchants. Although the amount of these fines has not been material to date, additional fines in the future could become material and could result in a termination of our ability to accept payment cards or require changes in our process for registering new customers, which would materially harm our business. Payment card network rules may also increase the cost of, impose restrictions on, or otherwise negatively impact the development of, our retail point-of-sale solutions, which may negatively impact their deployment and adoption.
Failure to deal effectively with fraud, fictitious transactions, bad transactions, and negative customer experiences would increase our loss rate and harm our business, and could severely diminish merchant and consumer confidence in and use of our services.
We incur substantial losses due to claims from consumers that merchants have not performed or that their goods or services do not match the merchant’s description. We seek to recover such losses from the merchant, but may not be able to recover in full if the merchant is unwilling or unable to pay. We also incur losses from claims that the consumer did not authorize the purchase, from consumer fraud, from erroneous transmissions and from customers who have closed bank accounts or have insufficient funds in them to satisfy payments. In addition, if losses incurred by us related to payment card transactions become excessive, they could
16
potentially result in our losing the right to accept payment cards for payment, which would harm our business. Our PayPal Credit products are similarly subject to the risk of fraudulent activity. We have taken measures to detect and reduce the risk of fraud, but these measures need to be continually improved and may not be effective against new and continually evolving forms of fraud or in connection with new product offerings. If these measures do not succeed, our business could be harmed.
We are exposed to fluctuations in foreign currency exchange rates.
We have significant operations internationally that are denominated in foreign currencies, primarily the British Pound, Euro, Australian Dollar and Canadian Dollar, subjecting us to foreign currency risk. The strengthening or weakening of the U.S. dollar versus the British Pound, Euro, Australian Dollar, and Canadian Dollar impacts the translation of our net revenues generated in these foreign currencies into the U.S. dollar. Additionally, in connection with providing our services in multiple currencies, we set our foreign exchange rates twice per day. We may face financial exposure if we incorrectly set our foreign exchange rates or as a result of fluctuations in foreign exchange rates between the times that we set them. Given that we also hold some corporate and customer funds in non-U.S. currencies, our financial results are affected by the translation of these non-U.S. currencies into U.S. dollars. We also have foreign exchange risk on our assets and liabilities denominated in currencies other than the functional currency of our subsidiaries. While we regularly enter into transactions to hedge portions of our foreign currency translation and balance sheet exposure, it is impossible to predict or eliminate the effects of this exposure. Fluctuations in foreign exchange rates could significantly impact our financial results.
Any factors that reduce cross-border trade or make such trade more difficult could harm our business.
Cross-border trade (i.e., transactions where the merchant or consumer were in different countries) is an important source of our revenue and profits. Cross-border transactions generally provide higher revenues and operating income than similar transactions that take place within a single country or market. Cross-border trade also represents our primary (and in some cases, our only) presence in certain important markets.
Cross-border trade is subject to, and may be impacted by, foreign exchange rate fluctuations. In addition, the potential interpretation and application of laws of multiple jurisdictions (e.g., the jurisdiction of the merchant and of the consumer) are often extremely complicated in the context of cross-border trade. The interpretation and/or application of such laws could impose additional requirements (which may impose conflicting obligations) and restrictions on cross-border trade. Any factors that increase the costs of cross-border trade or restrict, delay, or make cross-border trade more difficult or impractical would lower our revenues and profits and could harm our business.
Our business is subject to extensive government regulation and oversight, as well as
extensive, complex, overlapping and frequently changing rules, regulations and legal interpretations.
Our business is subject to extensive government regulation and oversight. For a discussion of how government regulation impacts key aspects of our business, please see Item I - “Business—Government Regulation” in this Annual Report on Form 10-K.
Our business is also subject to laws, rules, regulations, policies and legal interpretations in the markets in which we operate, including (but not limited to) those governing
banking, credit, deposit taking, cross-border and domestic money transmission, foreign exchange, privacy, data protection, banking secrecy, payment services (including payment processing and settlement services), consumer protection, anti-money laundering, and counter-terrorist financing. The legal and regulatory requirements applicable to us are
extensive, complex, frequently changing, and increasing in number, and may impose overlapping and/or conflicting requirements or obligations.
Financial and political events have increased the level of regulatory scrutiny on the payments industry, and regulatory agencies may view matters or interpret laws and regulations differently than they have in the past and in a manner adverse to our business. Our success and increased visibility may result in increased regulatory oversight and tighter enforcement of rules and regulations that may apply to our business.
As we expand and localize our international activities, we are increasingly becoming obligated to comply with the laws of the countries or markets in which we operate. In addition, because our services are accessible worldwide and we facilitate sales of goods and provide services to customers worldwide, one or more jurisdictions may claim that we or our customers are required to comply with their laws. Laws regulating the Internet, mobile and related technologies outside of the United States often impose different, more specific, or even conflicting obligations on us , as well as broader liability. For example, certain transactions that may be permissible in a local jurisdiction may be prohibited by regulations of U.S. Department of Treasury’s Office of Foreign Assets Control (“OFAC”) or U.S. anti-money laundering or counter-terrorist financing regulations.
17
Any failure or perceived failure to comply with existing or new laws and regulations (including changes to or expansion of the interpretation of those laws and regulations), including those discussed in this risk factor, may subject us to significant fines, penalties,
criminal and civil lawsuits, forfeiture of significant assets, and other enforcement actions
in one or more jurisdictions; result in additional compliance and licensure requirements;
increase regulatory scrutiny of our business; restrict our operations; force us to change our business practices, make product or operational changes or delay planned product launches or improvements. The foregoing could, individually or in the aggregate, expose us to significant liability, impose significant costs, require us to expend substantial resources, increase the cost and complexity of compliance, damage our brand and business, make our products and services less attractive, result in the loss of customers, limit our ability to grow the business, adversely affect our results of operations, and harm our reputation.
The complexity of U.S. federal and state regulatory and enforcement regimes, coupled with the global scope of our operations and the evolving global regulatory environment, could result in a single event giving rise to a large number of overlapping investigations and legal and regulatory proceedings by multiple government authorities in different jurisdictions.
We have implemented policies and procedures designed to help ensure compliance with applicable laws, and regulations, but there can be no assurance that our employees, contractors, or agents will not violate such laws and regulations.
Payments Regulation
In the United States, PayPal, Inc. has obtained licenses to operate as a money transmitter (or its equivalent) in the states where it is required, as well as in the District of Columbia, the U.S. Virgin Islands and Puerto Rico. This license includes not only the PayPal branded products and services in these states, but also our Venmo branded products and services. Our subsidiary, Xoom, is also licensed as a money transmitter in certain U.S. states. As licensed money transmitters, PayPal and Xoom are subject to restrictions with respect to their investment of customer funds, reporting requirements, bonding requirements and inspection by state regulatory agencies. Accordingly, if we violate these laws or regulations, we could be subject to liability and/or additional restrictions, forced to cease doing business with residents of certain states, forced to change our business practices or be required to obtain additional licenses or regulatory approvals that could impose substantial costs.
While we currently allow our consumers with credit cards to send payments from approximately 200 markets, we allow customers in only approximately half of those markets (including the United States) to also receive payments, in some cases with significant restrictions on the manner in which customers can withdraw funds. These limitations may affect our ability to grow our business in these markets. Of the markets whose residents can use our PayPal services, approximately 30 markets are in member states of the European Union. We provide our services to customers in the European Union through PayPal (Europe) S.à r.l. et Cie, SCA (“PayPal (Europe)”), our wholly-owned subsidiary that is licensed and subject to regulation as a bank in Luxembourg. Accordingly, PayPal (Europe) is subject to significant fines or other enforcement action if it violates the disclosure, reporting, anti-money-laundering, capitalization, fund management, corporate governance, privacy, data protection, information security, banking secrecy, taxation, sanctions, or other requirements imposed on Luxembourg banks. In addition, European Union laws and regulations are typically subject to different and potentially inconsistent interpretations by the countries that are members of the European Union, which can make compliance more costly and operationally difficult to manage.
In Australia, we serve our customers through PayPal Australia Pty. Ltd. (“PayPal Australia”), which is licensed by the Australian Securities and Investments Commission as a provider of a non-cash payment product and by the Australian Prudential Regulation Authority as a purchased payment facility provider, which is a type of authorized depository institution. Accordingly, PayPal Australia is subject to significant fines or other enforcement action if it violates the product disclosure, reporting, anti-money laundering, capitalization, privacy, corporate governance or other requirements imposed on Australian depository institutions.
In many of the other markets in which we do business, including Canada and a number of markets in Asia, Central America and South America, we serve our customers through PayPal Pte. Ltd., our wholly-owned subsidiary that is based in Singapore. PayPal Pte. Ltd. is supervised by the Monetary Authority of Singapore and is designated as a holder of a stored value facility and does not hold a remittance license. As a result, PayPal Pte. Ltd. is not able to offer outbound remittance payments (including donations to charities) from Singapore, and can only offer payments for the purchase of goods and services in Singapore. In many of the markets (other than Singapore) served by PayPal Pte. Ltd., it is unclear and uncertain whether our Singapore-based service is subject only to Singapore law or, if it is subject to the application of local laws, whether such local laws would require a payment processor like us to be licensed as a payments service, bank, financial institution or otherwise.
We are also subject to regulation in other markets in which we do business and we have been and expect to continue to be required to apply for various licenses, certifications and regulatory approvals in a number of the countries where we provide our services. There can be no assurance that we will be able to obtain any such licenses. Even if we were able to obtain such licenses, there are substantial costs and potential product changes involved in maintaining such licenses, and we could be subject to fines or other enforcement action if we are found to violate disclosure, reporting, anti-money laundering, capitalization, corporate governance
18
or other requirements of such licenses. These factors could impose substantial additional costs and involve considerable delay to the development or provision of our products in certain countries.
In many other countries it may not be clear whether we are required to be licensed as a payment services provider, bank, financial institution or otherwise. In such markets, we may rely on local banks to process payments and conduct foreign exchange in local currency. Local regulators may use their power to slow or halt payments to local merchants conducted through the local bank. Such regulatory actions or the need to obtain licenses, certifications or other regulatory approvals could impose substantial costs and involve considerable delay to the provision or development of our services in a given market, or could require significant and costly operational changes or prevent us from providing any services in a given market.
Consumer Protection
We are subject to consumer protection laws and regulations in the countries in which we operate. The financial services sector has been increasingly subject to regulatory scrutiny. In the U.S., we have been, and we expect that we will continue to be, required to make additional disclosures to our consumers and to comply with new restrictions and requirements on our activities. Among other things, our services are subject to the Electronic Fund Transfer Act and Regulation E issued by the Consumer Financial Protection Bureau (“CFPB”). Under such regulations, among other things, we are required to provide advance disclosure of changes to our services, to follow specified error resolution procedures and to reimburse consumers for losses from certain transactions not authorized by the consumer. Additionally, even technical violations of these laws can result in assessment of actual damages or statutory damages or penalties of up to $1,000 in individual cases or up to $500,000 per violation in any class action and treble damages in some instances, and we could also be liable for plaintiffs’ attorneys’ fees. We are subject to, and have paid amounts in settlement of, lawsuits containing allegations that our business violated the Electronic Fund Transfer Act and Regulation E or otherwise advance claims for relief relating to our business practices (e.g., that we improperly held consumer funds or otherwise improperly limited consumer accounts).
In January 2012, the CFPB finalized rules under Regulation E, mandated by the Dodd-Frank Act, which required us, beginning in October 2013, to provide additional disclosures, error resolution rights, and cancellation rights to U.S. consumers who make international remittance payments. In November 2014, the CFPB proposed a new prepaid account rule that would apply to prepaid cards, mobile wallets and potentially PayPal accounts. In December 2014, we became subject to CFPB supervision and examination pursuant to a new regulation that allows the CFPB to supervise all companies, including PayPal, that provide more than one million international remittance transfers per year. Under the regulation, CFPB examiners are now able to examine us for compliance with the remittance transfer rule and other laws and regulations. These and other rules promulgated by the CFPB could increase our costs and require us to expend substantial resources and make changes to our business practices.
In May 2015, we entered into a Stipulated Final Judgment and Consent Order ("Consent Order") with the CFPB in which we settled regulatory claims arising from PayPal Credit practices between 2011 and 2015. The Consent Order included obligations on PayPal to pay $15 million in redress to consumers and a $10 million civil monetary penalty, and required PayPal to make various changes to the PayPal Credit disclosures and related business practices. We continue to cooperate and engage with the CFPB and work to ensure compliance with the Consent Order, which may result in us incurring additional costs associated with compliance or redress.
PayPal (Europe) offers its services in European Union countries through a “passport” notification process through the Luxembourg regulator to regulators in other European Union member states pursuant to European Union Directives, and has completed the “passport” notification process in all European Union member countries. The regulators in these countries could notify PayPal (Europe) of local consumer protection laws that apply to its business, in addition to Luxembourg consumer protection law, and could also seek to persuade the Luxembourg regulator to order PayPal (Europe) to conduct its activities in the local country through a branch office. These or similar actions by these regulators could increase the cost of, or delay, our plans for expanding our business in European Union countries. In addition, the countries that are members of the European Union may each have different and potentially inconsistent interpretations of regulations implementing the European Union Payment Services Directive, which could make compliance more costly and operationally difficult to manage. The European Commission has proposed revisions to the Payments Services and Anti-Money Laundering Directives, which could make compliance more costly and operationally difficult to manage. Finally, if the assets of PayPal (Europe) exceed certain thresholds, or if the European Central Bank ("ECB") determines that PayPal (Europe) is a significant supervised entity or that some activity of PayPal (Europe) is subject to oversight by the ECB, PayPal (Europe) or certain of its activities could become directly regulated by the ECB in addition to the Luxembourg regulator, the
Commission de surveillance du secteur financier
, as our national supervisor, which could subject us to additional requirements and would likely increase compliance costs.
19
Anti-Money Laundering and Counter-Terrorist Financing
We are subject to various anti-money laundering and counter-terrorist financing laws and regulations around the world that prohibit, among other things, our involvement in transferring the proceeds of criminal activities. We routinely report to the U.S. Department of the Treasury’s Office of Foreign Assets Control ("OFAC") on payments we have rejected or blocked pursuant to OFAC sanctions regulations and on any possible violations of those regulations. In March 2015, we reached a settlement with OFAC regarding possible violations arising from our practices between 2009 and 2013. In addition, we continue to cooperate with OFAC regarding other transactions that could also possibly be in violation of OFAC sanctions regulations. In addition, we continue to cooperate with OFAC regarding other transactions that we have self-reported could also possibly be in violation of OFAC sanctions regulations. Subsequent to our March 2015 settlement, we have received new subpoenas from OFAC seeking additional information about certain of these transactions. Such self-reported transactions could result in claims or actions against us including litigation, injunctions, damage awards, fines or penalties, or require us to change our business practices that could result in a material loss, require significant management time, result in the diversion of significant operational resources or otherwise harm our business. Violation of OFAC sanctions regulations that OFAC determines to be egregious can result in statutory penalties of up to $250,000 per transaction. For a discussion of our dealings with OFAC, please see “Note 11: Commitments and Contingencies - Litigation and Regulatory Matters.”
U.S. and other regulators globally continue to increase their scrutiny of compliance with these obligations, which may require us to further revise or expand our compliance program, including the procedures we use to verify the identity of our customers and to monitor international and domestic transactions. Many countries in which we operate also have anti-money laundering and counter-terrorist financing laws and regulations, and we have been and continue to be required to make changes to our compliance program in various jurisdictions in response. Regulators regularly re-examine the transaction volume thresholds at which we must obtain and keep applicable records or verify identities of customers and any change in such thresholds could result in greater costs for compliance.
Privacy and Protection of User Data
We are subject to a number of laws, rules and directives (which we refer to as "privacy laws") relating to the collection, use, retention, security, processing and transfer (which we refer to as "process") of personally identifiable information about our customers and employees (sometimes called personal data) in the countries where we operate. Much of the personal information that we process, especially financial information, is regulated by multiple privacy laws and, in some cases, the privacy laws of multiple jurisdictions. In many cases, these laws apply not only to third-party transactions, but also to transfers of information between or among us, our subsidiaries, and other parties with which we have commercial relationships. The European Court of Justice in the Schrems case has ruled that the U.S.-E.U. Safe Harbor framework clauses, one compliance method by which companies could transfer personal data regarding citizens of the European Union to the United States, could no longer be relied upon. The potential impact of this ruling is subject to further determination and additional developments, including the potential development of a new form of Safe Harbor framework or a requirement to find alternative bases for the compliant transfer of personal data from the E.U. to the U.S. PayPal, Inc. has not relied on the Safe Harbor framework for the transfer of E.U. personal data to the United States. Rather, when our company was a subsidiary of eBay Inc., we relied on binding corporate rules that permitted such transfers; upon separation from eBay, we have continued to operate under these same binding corporate rules pending the approval of our application for our own independent binding corporate rules. While PayPal, Inc. has not relied on the Safe Harbor framework, some of our data processing subsidiaries, service providers, customers or other business partners do. In addition, because PayPal (Europe) is headquartered in Luxembourg and subject to regulation as a bank in that jurisdiction, we have relied on the “one-stop-shop” concept under which Luxembourg has been our lead data protection regulator in the E.U. However, a recent European Court of Justice ruling (Weltimmo) affecting companies that do business in the E.U. potentially could make us subject to the local data protection laws or regulatory enforcement activities of the various E.U. member states in which we have established legal entities.
Regulatory scrutiny of privacy, data protection, collection, use and sharing of data is increasing on a global basis. There is uncertainty associated with the legal and regulatory environment around privacy and data protection laws, which continue to develop in ways we cannot predict. Privacy and data protection laws may be interpreted and applied inconsistently from country to country and impose inconsistent or conflicting requirements. Complying with varying jurisdictional requirements could increase the costs and complexity of compliance or require us to change our business practices in a manner adverse to our business, and violations of privacy and data protection-related laws can result in significant penalties and damage to our brand and business. In addition, compliance with inconsistent privacy laws may restrict our ability to provide services to our customers. A determination that there have been violations of laws of privacy or data protection laws could expose us to significant damage awards, fines and other penalties that could, individually or in the aggregate, materially harm our business and reputation.
20
In addition, because of the large number of text messages, emails, phone calls and other communications we send or make to our customers for various business purposes, communication-related privacy laws that provide a specified monetary damage award or fine for each violation could result in particularly significant damage awards or fines. For example, under the Telephone Consumer Protection Act ("TCPA"), in the U.S., plaintiffs may seek actual monetary loss or statutory damages of $500 per violation, whichever is greater, and courts may treble the damage award for willful or knowing violations. We have been and may be subject to lawsuits (including class-action lawsuits) containing allegations that our business violated the TCPA. These lawsuits seek damages (including statutory damages) and injunctive relief, among other remedies. Given the large number of communications we send to our customers, a determination that there have been violations of the TCPA or other communications-based statutes could expose us to significant damage awards that could, individually or in the aggregate, materially harm our business.
We post on our websites our privacy policies and practices including concerning the collection, use and disclosure of user data. Any failure, or perceived failure, by us to comply with our posted privacy policies or with any applicable regulatory requirements or orders, or privacy, data protection, information security or consumer protection-related privacy laws and regulations in one or more jurisdictions could result in proceedings or actions against us by governmental entities or others, including class action privacy litigation in certain jurisdictions, subject us to significant fines, penalties, judgments and negative publicity, require us to change our business practices, increase the costs and complexity of compliance, and adversely affect our business. Data protection, privacy and information security have become the subject of increasing public, media and legislative concern. If our customers were to reduce their use of our products and services as a result of these concerns, our business could be harmed. As noted above, we are also subject to the possibility of security and privacy breaches, which themselves may result in a violation of these privacy laws.
PayPal is not a bank or licensed lender in the United States and relies upon third parties to make loans and provide other products critical to our business.
As PayPal is neither a chartered financial institution nor licensed to make loans in any state, we rely on a third party chartered financial institution to issue the PayPal Credit consumer product in the United States, and a different chartered financial institution to issue the PayPal Working Capital product in the United States. Both of these chartered financial institutions are industrial banks chartered by the State of Utah. In the event of a termination or interruption in the ability of the chartered financial institution that currently issues the PayPal Credit consumer product in the United States to lend under the PayPal Credit consumer product, our chartered financial institution that issues the PayPal Working Capital product in the U.S. has agreed to take ownership of (and originate loans with respect to) all consumer accounts. Nevertheless, any termination or interruption of either bank’s ability to lend could result in the inability to originate any new PayPal Credit or PayPal Working Capital loans. In the event of either bank’s inability to lend, we would either need to reach a similar agreement with another chartered financial institution or obtain our own bank charter or licenses. We may be unable to reach a similar agreement with another partner on favorable terms or at all, and obtaining a bank charter or lending licenses would be a time-consuming and costly process and would subject us to additional laws and regulatory requirements, which could be burdensome and increase our costs. In addition, our commercial relationships with third parties which are federally supervised U.S. financial institutions could subject us to examination by their federal banking regulators with respect to certain services that we provide.
Our credit products expose us to additional risks.
Our PayPal Credit and PayPal Working Capital products are offered to a wide range of consumers and merchants, and the financial success of these products depends on the effective management of the risk related to these products. The lender for the PayPal Credit product extends credit using proprietary segmentation and credit algorithms and other analytical techniques designed to analyze the credit risk of specific consumers based on their past purchasing and payment history as well as their credit scores. Similarly, to assess a merchant who wishes to obtain a PayPal Working Capital advance, among other indicators, the lender applies a proprietary risk model to help predict the merchant's ability to repay the working capital advance. These risk models may not accurately predict the creditworthiness of a consumer or merchant due to inaccurate assumptions about the particular consumer or merchant or the economic environment or limited product history, among other factors. The accuracy of these risk models and the ability of the lender and our ability to manage credit risk related to our PayPal Credit and PayPal Working Capital products may also be affected by legal or regulatory changes (e.g., bankruptcy laws and minimum payment regulations), competitors’ actions, changes in consumer behavior, changes in the economic environment and other factors.
Like other businesses with significant exposure to losses from consumer credit, we face the risk that PayPal Credit consumer account holders will default on their payment obligation, making the receivables uncollectible and creating the risk of potential charge-offs. The non-payment rate among account holders may increase due to, among other things, changes to underwriting standards, worsening economic conditions, such as a recession or greater austerity in various countries, and high unemployment
21
rates. Account holders who miss payments often fail to repay their loans, and account holders who file for protection under the bankruptcy laws generally do not repay their loans.
We purchase receivables related to PayPal Credit and PayPal Working Capital products. If we are unable to fund our purchase of these receivables adequately or in a cost-effective manner, or if we are unable to efficiently manage the cash resources utilized for these purposes, our business could be harmed.
Our international expansion of our PayPal Credit product offerings exposes us to additional risks, including those discussed below under the risk factor titled “Our international operations are subject to increased risks, which could harm our business.”
We are exposed to fluctuations in interest rates.
We are exposed to interest rate risk from our investment portfolio and from interest-rate sensitive assets underlying the customer balances we hold on our balance sheet as customer accounts. The assets underlying our customer balances we hold on our balance sheet as customer accounts are maintained in interest and non-interest bearing bank deposits, time deposits, corporate debt securities and U.S. and foreign government and agency securities. We seek to preserve principal while holding eligible liquid assets, as defined by applicable regulatory requirements and commercial law in jurisdictions in which we operate, equal to at least 100% of the aggregate amount of all customer balances. We do not pay interest on amounts due to customers.
In addition, fluctuations in interest rates may adversely impact our customers’ spending levels and ability and willingness to pay outstanding amounts owed to us. Higher interest rates often lead to higher payment obligations by customers to us and other lenders under mortgage, credit card and other consumer loans, which may reduce our customers’ ability to remain current on their obligations to us and therefore lead to increased delinquencies, charge-offs and allowance for loan and interest receivable which could have an adverse effect on our net income.
In July 2015, we entered into a revolving credit facility. As a result, we will be exposed to fluctuations in interest rates to the extent of our borrowings under the facility, which bear interest at a floating rate.
Changes to our buyer and seller protection programs could increase our loss rate.
Our buyer and seller protection programs protect merchants and consumers from fraudulent transactions. In 2015, we increased the scope of our buyer protection program to cover digital goods and intangible goods and services. In addition, consumers who pay through PayPal may have reimbursement rights from their payment card issuer (usually a bank), which in turn will seek recovery from us. The risk of losses from our buyer and seller protection programs are specific to individual buyers, sellers and transactions, and may also be impacted by regional variations to these programs, modifications to these programs resulting from changes in regulatory requirements, or changes that we decide to implement, such as expanding the scope of transactions covered by one or more of these programs. Upon PayPal becoming an independent publicly-traded company on July 17, 2015 through the distribution of 100 percent of the outstanding capital stock of PayPal to eBay’s stockholders, which we refer to as the distribution, we extended our protection programs in several countries to cover certain customers’ purchases on eBay, and our costs associated with these programs have therefore increased. Increases in our loss rate, including as a result of changing our buyer and seller protection programs, could harm our business.
Our international operations are subject to increased risks, which could harm our business.
Our international operations, especially in European Union countries (in particular, United Kingdom and Germany) and China, have generated approximately one-half of our net revenues in recent years. In addition to uncertainty about our ability to generate revenues from our foreign operations and expand into international markets, and the foreign currency risks discussed earlier in this “Risk Factors” section under the caption “We are exposed to fluctuations in foreign currency exchange rates,” there are risks inherent in doing business internationally, including:
|
•
|
expenses associated with localizing our products and services and customer data, including offering customers the ability to transact business in the local currency and adapting our products and services to local preferences (e.g., payment methods) with which we may have limited or no experience;
|
|
•
|
trade barriers and changes in trade regulations;
|
|
•
|
difficulties in developing, staffing, and simultaneously managing a large number of varying foreign operations as a result of distance, language, and cultural differences;
|
|
•
|
stringent local labor laws and regulations;
|
22
|
•
|
credit risk and higher levels of payment fraud;
|
|
•
|
profit repatriation restrictions, foreign currency exchange restrictions or extreme fluctuations in foreign currency exchange rates for a particular currency;
|
|
•
|
political or social unrest, economic instability, repression, or human rights issues;
|
|
•
|
geopolitical events, including natural disasters, public health issues, acts of war, and terrorism;
|
|
•
|
import or export regulations;
|
|
•
|
compliance with U.S. laws and foreign laws prohibiting corrupt payments to government officials, such as the Foreign Corrupt Practices Act and the U.K. Bribery Act, and other local anticorruption laws;
|
|
•
|
compliance with U.S. and foreign laws designed to combat money laundering and the financing of terrorist activities;
|
|
•
|
antitrust and competition regulations;
|
|
•
|
potentially adverse tax developments and consequences;
|
|
•
|
economic uncertainties relating to sovereign and other debt;
|
|
•
|
different, uncertain, or more stringent user protection, data protection, privacy, and other laws;
|
|
•
|
risks related to other government regulation or required compliance with local laws;
|
|
•
|
risks related to multiple overlapping legal or regulatory regimes, which may impose conflicting requirements on us;
|
|
•
|
national or regional differences in macroeconomic growth rates;
|
|
•
|
local licensing and reporting obligations; and
|
|
•
|
increased difficulties in collecting accounts receivable.
|
Violations of the complex foreign and U.S. laws, rules and regulations that apply to our international operations may result in fines, criminal actions, or sanctions against us, our officers, or our employees; prohibitions on the conduct of our business; and damage to our reputation. Although we have implemented policies and procedures designed to promote compliance with these laws, violations by our employees, contractors, or agents could nevertheless occur. These risks are inherent in our international operations and expansion, may increase our costs of doing business internationally, and could harm our business.
Use of our payments services for illegal purposes could harm our business.
Our payment system is susceptible to potentially illegal or improper uses, including money laundering, terrorist financing, illegal online gambling, fraudulent sales of goods or services, illicit sales of prescription medications or controlled substances, piracy of software, movies, music, and other copyrighted or trademarked goods (in particular, digital goods), money laundering, bank fraud, child pornography trafficking, prohibited sales of alcoholic beverages or tobacco products, online securities fraud, or to facilitate other illegal activity. Certain activity that may be legal in one country may be illegal in another country, and a merchant may intentionally or inadvertently be found responsible for importing illegal goods, creating liability to us. Changes in law have increased the penalties for intermediaries providing payment services for certain illegal activities and additional payments-related proposals are under active consideration by government authorities. Intellectual property rights owners or government authorities may seek to bring legal action against providers of payments solutions, including PayPal, that are peripherally involved in the sale of infringing items. Any resulting claims could result in reputational harm and any resulting liabilities, loss of transaction volume or increased costs could harm our business.
Our failure to manage the assets underlying our customer funds properly could harm our business.
Our ability to manage and account accurately for the assets underlying our customer funds requires a high level of internal controls. As our business continues to grow and we expand our product offerings, we must continue to strengthen our associated internal controls. Our success requires significant public confidence in our ability to handle large and growing transaction volumes and amounts of customer funds. Any failure to maintain the necessary controls or to manage the assets underlying our customer funds accurately could result in reputational harm, lead customers to discontinue or reduce their use of our products and result in significant penalties and fines, which could harm our business.
We are subject to regulatory activity and antitrust litigation under competition laws.
We are subject to scrutiny by various government agencies under U.S. and foreign laws and regulations, including antitrust and competition laws. An increasing number of jurisdictions also provide private rights of action for competitors or consumers to assert claims of anti-competitive conduct. Other companies and government agencies have in the past and may in the future allege that our actions violate the antitrust or competition laws of the United States, individual states, other countries, or the European Commission, or otherwise constitute unfair competition. An increasing number of governments are regulating competition law activities, including increased scrutiny in large markets such as China. Our business agreements or arrangements with customers or other companies could give rise to regulatory action or antitrust litigation. Some regulators, particularly those outside of the
23
United States, may perceive our business to be used so broadly that otherwise uncontroversial business practices could be deemed anticompetitive. Any claims or investigations, even if without foundation, may be very expensive to defend or respond to, involve negative publicity and substantial diversion of management time and effort and could result in significant judgments against us or require us to change our business practices.
We are subject to patent litigation.
We have repeatedly been sued for allegedly infringing other parties’ patents. At any given time, we are typically a defendant in a number of patent lawsuits and have been notified of several other potential patent disputes. We expect that we will increasingly be subject to patent infringement claims because, among other reasons:
|
•
|
our products and services continue to expand in scope and complexity;
|
|
•
|
we continue to expand into new business areas, including through acquisitions; and
|
|
•
|
the number of patent owners who may claim that we, any of the companies that we have acquired, or our customers infringe their patents, and the aggregate number of patents controlled by such patent owners, continues to increase.
|
Such claims may be brought directly against us and/or against our customers whom we may indemnify either because we are contractually obligated to do so or we choose to do so as a business matter. We believe that an increasing number of these claims against us and other technology companies have been, and continue to be, initiated by third parties whose sole or primary business is to assert such claims. In addition, we have seen significant patent disputes between operating companies in some technology industries. Patent claims, whether meritorious or not, are time-consuming and costly to defend and resolve, and could require us to make expensive changes in our methods of doing business, enter into costly royalty or licensing agreements, make substantial payments to satisfy adverse judgments or settle claims or proceedings, or cease conducting certain operations, which would harm our business.
We may be unable to adequately protect or enforce our intellectual property rights, or third parties may allege that we are infringing their intellectual property rights.
We believe the protection of our intellectual property, including our trademarks, patents, copyrights, domain names, trade dress, and trade secrets, is critical to our success. We seek to protect our intellectual property rights by relying on applicable laws and regulations in the United States and internationally, as well as a variety of administrative procedures. We also rely on contractual restrictions to protect our proprietary rights when offering or procuring products and services, including confidentiality and invention assignment agreements entered into with our employees and contractors and confidentiality agreements with parties with whom we conduct business.
Effective intellectual property protection may not be available in every country in which our products and services are made available, and contractual arrangements and other steps that we have taken to protect our intellectual property may not prevent third parties from infringing or misappropriating our intellectual property or deter independent development of equivalent or superior intellectual property rights by others. We must protect our intellectual property rights, including our trademarks, patents, copyrights, domain names, trade dress, trade secrets, and other proprietary rights in an increasing number of jurisdictions, a process that is expensive and time-consuming. We may not be successful in protecting or enforcing our rights in every jurisdiction. Also, we may not be able to discover or determine the extent of any unauthorized use of our proprietary rights. We have licensed in the past, and expect to license in the future, certain of our proprietary rights, such as trademarks or copyrighted material, to others. These licensees may take actions that diminish the value of our proprietary rights or harm our reputation. Any failure to adequately protect or enforce our intellectual property rights, or significant costs incurred in doing so, could materially harm our business.
As the number of products in the software industry increases and the functionality of these products further overlaps, and as we acquire technology through acquisitions or licenses, we may become increasingly subject to intellectual property infringement and other claims. Litigation may be necessary to determine the validity and scope of the patent and other intellectual property rights of others. The ultimate outcome of any allegation is uncertain and, regardless of the outcome, any such claim, with or without merit, may be time-consuming, result in costly litigation, divert management’s time and attention from our business, and require us to, among other things, stop providing transaction processing and other payment related services or redesign, stop selling our products or services, pay substantial amounts to satisfy judgments or settle claims or lawsuits, pay substantial royalty or licensing fees, or satisfy indemnification obligations that we have with certain parties with whom we have commercial relationships. Our failure to obtain necessary license or other rights, or litigation or claims arising out of intellectual property matters, may harm our business.
24
We are regularly subject to general litigation, regulatory disputes, and government inquiries.
We are regularly subject to claims, lawsuits (including class actions and individual lawsuits), government and regulatory investigations, and other proceedings involving competition and antitrust law, intellectual property, privacy, data protection, information security, consumer protection, accessibility claims, securities, tax, labor and employment, commercial disputes, services, escheatment of unclaimed or abandoned property, and other matters. In particular, our business faces ongoing consumer protection and intellectual property litigation, as discussed above. The number and significance of these disputes and inquiries have increased as our company has grown larger, our business has expanded in scope and geographic reach, and our products and services have increased in complexity. In addition, the laws, rules and regulations affecting our business, including those pertaining to Internet and mobile commerce, payments services, and credit, are subject to ongoing interpretation by the courts and governmental authorities, and the resulting uncertainty in the scope and application of these laws, rules and regulations increases the risk that we will be subject to private claims and governmental actions alleging violations of those laws, rules and regulations.
The scope, outcome and impact of claims, lawsuits, government investigations, and proceedings that we are subject to cannot be predicted with certainty. Regardless of the outcome, such investigations and proceedings can have an adverse impact on us because of legal costs, diversion of management resources, and other factors. Determining reserves for our pending litigation is a complex, fact-intensive process that is subject to management’s judgment. Resolving one or more such legal and regulatory proceedings could potentially require us to make substantial payments to satisfy judgments, fines or penalties or to settle claims or proceedings, any of which could materially and adversely affect our business. These proceedings could also result in reputational harm, criminal sanctions, consent decrees, or orders preventing us from offering certain products or services, requiring a change in our business practices in costly ways or development of non-infringing or otherwise altered products or technologies. Any of these consequences could materially and adversely affect our business.
Certain of our customer agreements contain arbitration provisions with class action waiver provisions that may limit our exposure to consumer class action litigation, but there can be no assurance that we will be successful in enforcing these arbitration provisions, or the class action waiver provisions in them, in the future or in any given case. Legislative, administrative or regulatory developments may directly or indirectly prohibit or limit the use of pre-dispute arbitration clauses and class action waiver provisions. Any such prohibitions or limitations on or discontinuation of the use of such arbitration or class action waiver provisions could subject us to additional lawsuits, including additional consumer class action litigation, or materially impact our ability to avoid exposure from consumer class action litigation.
We may have exposure to greater than anticipated tax liabilities.
The determination of our worldwide provision for income taxes and other tax liabilities requires estimation and significant judgment, and there are many transactions and calculations where the ultimate tax determination is uncertain. Like many other multinational corporations, we are subject to tax in multiple U.S. and foreign tax jurisdictions. Our determination of our tax liability is always subject to audit and review by applicable domestic and foreign tax authorities, and we are currently undergoing a number of investigations, audits and reviews by taxing authorities throughout the world, including with respect to our tax structure. Any adverse outcome of any such audit or review could have a negative effect on our business and the ultimate tax outcome may differ from the amounts recorded in our financial statements and may materially affect our financial results in the periods for which such determination is made. While we have established reserves based on assumptions and estimates that we believe are reasonable to cover such eventualities, these reserves may prove to be insufficient.
In addition, our future income taxes could be adversely affected by earnings being lower than anticipated (or by the incurrence of losses) in jurisdictions that have lower statutory tax rates and higher than anticipated in jurisdictions that have higher statutory tax rates, by changes in the valuation of our deferred tax assets and liabilities, as a result of gains on our foreign exchange risk management program, or changes in tax laws, regulations, or accounting principles, as well as certain discrete items.
In light of continuing global fiscal challenges, various levels of government and international organizations such as the Organization for Economic Co-operation and Development (OECD) and European Union (EU) are increasingly focused on tax reform and other legislative or regulatory action to increase tax revenue. These tax reform efforts are designed to ensure that corporate entities are taxed on a larger percentage of their earnings. Any such tax reform or other legislative or regulatory actions to increase tax revenue could increase our effective tax rate.
We and our merchants may be subject to sales reporting and record-keeping obligations.
One or more states or the federal government or foreign countries may seek to impose reporting or record-keeping obligations on companies that engage in or facilitate ecommerce. Such an obligation could be imposed by legislation intended to improve tax
25
compliance (and legislation to such effect has been contemplated by several additional states and is in the process of being implemented by a number of foreign jurisdictions) or if one of our companies was deemed to be the legal agent of our merchants by a jurisdiction in which it operates. We have modified our software to meet these requirements and expect increased operational costs and changes to our customer experience in connection with complying with these reporting obligations. Any failure by us to comply with these and similar reporting and record-keeping obligations could result in substantial monetary penalties and other sanctions and could harm our business.
Acquisitions, joint ventures, and strategic investments could result in operating difficulties and could harm our business.
We have acquired a significant number of businesses, technologies, services, and products. We expect to continue to evaluate and consider a wide array of potential strategic transactions as part of our overall business strategy, including business combinations, acquisitions, and dispositions of certain businesses, technologies, services, products, and other assets, as well as strategic investments and joint ventures. These transactions may involve significant challenges and risks, including:
|
•
|
the potential loss of key customers, vendors and other key business partners of the companies we acquire, or dispose of, following and continuing after announcement of our transaction plans;
|
|
•
|
declining employee morale and retention issues affecting employees of companies that we acquire or dispose of, which may result from changes in compensation, management, reporting relationships, future prospects, or the direction of the acquired or disposed business;
|
|
•
|
difficulty making strategic hires of new employees;
|
|
•
|
diversion of management time and a shift of focus from operating the business to the transaction, and in the case of an acquisition, integration and administration;
|
|
•
|
the need to integrate the operations, systems (including accounting, management, information, compliance, human resource and other administrative systems), technologies, products and personnel of each acquired company, which is an inherently risky and potentially lengthy and costly process;
|
|
•
|
the inefficiencies and lack of control that may result if such integration is delayed or not implemented, and unforeseen difficulties and expenditures that may arise as a result;
|
|
•
|
the need to implement or improve controls, procedures and policies appropriate for a larger public company at companies that, prior to acquisition, may have lacked such controls, procedures and policies or whose controls, procedures and policies did not meet applicable legal and other standards;
|
|
•
|
potential exposure to new or increased regulatory oversight associated with new lines of business;
|
|
•
|
risks associated with our expansion into new international markets;
|
|
•
|
lawsuits resulting from the acquisition;
|
|
•
|
liability for activities of the acquired company before the acquisition, including intellectual property and other litigation claims or disputes, violations of laws, rules and regulations, commercial disputes, tax liabilities and other known and unknown liabilities;
|
|
•
|
the potential loss of key employees following the transaction;
|
|
•
|
the acquisition of new customer and employee personal information, which in and of itself may require regulatory approval and or additional controls, policies and procedures and subject us to additional exposure and additional complexity and costs of compliance; and
|
|
•
|
our dependence on the acquired business’ accounting, financial reporting, operating metrics and similar systems, controls and processes and the risk that errors or irregularities in those systems, controls and processes will lead to errors in our financial statements or make it more difficult to manage the acquired business.
|
At any given time we may be engaged in discussions or negotiations with respect to one or more of these types of transactions and any of these transactions could, individually or in the aggregate, be material to our financial condition and results of operations. It may take us longer than expected to fully realize the anticipated benefits of these transactions, and those benefits may ultimately be smaller than anticipated or may not be realized at all, which could adversely affect our business and operating results. Any acquisitions or dispositions may also require us to issue additional equity securities, spend our cash, or incur debt (and increased interest expense), liabilities, and amortization expenses related to intangible assets or write-offs of goodwill, which could adversely affect our results of operations and dilute the economic and voting rights of our stockholders.
We may make certain investments, including through joint ventures, in which we have a minority equity interest and/or lack management and operational control. Under such circumstances, the controlling joint venture partner in a joint venture investment may have business interests, strategies or goals that are inconsistent with ours, and business decisions or other actions or omissions of the controlling investor, joint venture partner or joint venture company may result in reputational harm or adversely affect the value of our investment.
26
We are subject to risks associated with information disseminated through our services.
Companies providing online services may be subject to claims relating to information disseminated through their services, including claims alleging defamation, libel, breach of contract, invasion of privacy, negligence, copyright or trademark infringement, among other things. The laws relating to the liability of companies providing online services for information disseminated through their services are subject to frequent challenges both in the United States and foreign jurisdictions. We are also subject to potential liability to third parties for the customer-provided content on our sites, particularly in jurisdictions outside the United States where the applicable laws are unsettled. If we become liable for information provided by our customers and carried on our service, we could be directly harmed and we may be forced to implement new measures to reduce our exposure to this liability, including expending substantial resources or discontinuing certain service offerings, which could harm our business.
Problems with or price increases by third parties who provide services to us or to our customers could harm our business.
A number of third parties provide services to us or to our customers. As discussed in this Risk Factors section under the caption “Changes to payment card networks or bank fees, rules, or practices could harm our business,” we are dependent on banks and other payment processors that link us to the payment card and bank clearing networks to process transactions. We rely on unaffiliated third party lenders to make the consumer and other loans originated through the PayPal Credit and PayPal Working Capital products. We also rely heavily on third parties to operate our services, including merchant processors and payment gateways to process transactions and third parties that provide loan receivable tracking and customer statements processing. Financial or regulatory issues, labor issues, or other problems that prevent these companies from providing services to us or our customers could harm our business. We have outsourced certain functions to third-party providers, including some customer support and product development functions, which are critical to our operations. If our service providers do not perform satisfactorily, our operations could be disrupted, which could result in customer dissatisfaction and harm our business.
Price increases or financial penalties by, or service terminations, disruptions or interruptions at, companies that provide services to us and our customers and clients could also make it more difficult for our merchants to complete transactions, thereby harming our business. Some third parties who provide services to us may have or gain market power and be able to increase their prices to us without competitive constraint. In addition, there can be no assurance that third parties who provide services directly to us or our customers will continue to do so on acceptable terms, or at all. If any third parties were to stop providing services to us or our customers on acceptable terms, including as a result of bankruptcy, we may be unable to procure alternatives from other third parties in a timely and efficient manner and on acceptable terms, or at all.
Our developer platforms, which are open to merchants and third-party developers, subject us to additional risks.
We provide third-party developers with access to application programming interfaces, software development kits and other tools designed to allow them to produce applications for use, with a particular focus on mobile applications. There can be no assurance that merchants or third-party developers will develop and maintain applications and services on our open platforms on a timely basis or at all, and a number of factors could cause such third-party developers to curtail or stop development for our platforms. In addition, our business is subject to many regulatory restrictions. It is possible that merchants and third-party developers who utilize our development platforms or tools could violate these regulatory restrictions and we may be held responsible for such violations, which could harm our business.
Our retail point of sale solutions expose us to additional risks.
We have announced several retail point of sale solutions, which enable merchants to accept payments using a payments card reader attached to, or otherwise communicating with, a mobile device or to scan payment cards and codes using the mobile device’s embedded camera, and which enable consumers to use their mobile devices to pay at the point of sale. As we continue to expand our product and service offerings at the retail point of sale, we will face additional risks, including:
|
•
|
increased expectations from offline retailers regarding the reliability and availability of our systems and services and correspondingly lower amounts of downtime, which we may not be able to meet;
|
|
•
|
significant competition at the retail point of sale, particularly from established payment card providers such as Visa, MasterCard and American Express, many of which have substantially greater resources than we do;
|
|
•
|
increased targeting by fraudsters; given that our fraud models are less developed in this area, we may experience increases in fraud and associated transaction losses as we adjust to fraudulent activity at the point of sale;
|
27
|
•
|
exposure to product liability claims to the extent that hardware devices that we produce for use at the retail point of sale malfunction or are not in compliance with laws, which could result in substantial liability and require product recalls or other actions;
|
|
•
|
exposure to additional laws, rules and regulations;
|
|
•
|
increased reliance on third parties involved with processing in-store payments, including independent software providers, electronic point of sale providers, hardware providers (such as cash register and pin-pad providers), payment processors and banks that enable in-store transactions; and
|
|
•
|
lower operating income than our other payment solutions.
|
Unless we are able to successfully manage these risks, including driving adoption of, and significant volume through, our retail point of sale solutions over time, our business may be harmed.
Our success largely depends on key personnel. Because competition for our key employees is intense, we may not be able to attract, retain, and develop the highly skilled employees we need to support our business. The loss of senior management or other key personnel could harm our business.
Our future performance depends substantially on the continued services of our senior management and other key personnel, including engineering and product development personnel, and our ability to attract, retain, and motivate such personnel. Competition for key personnel is intense, especially in the Silicon Valley where our corporate headquarters are located, and we may be unable to successfully attract, integrate, or retain sufficiently qualified key personnel. In making employment decisions, particularly in high-technology and payments industries, job candidates often consider the value of the equity awards they would receive in connection with their employment, and fluctuations in our stock price may make it more difficult to attract, retain, and motivate employees. In addition, we do not have long-term employment agreements with any of our key personnel and do not maintain any “key person” life insurance policies. The loss of the services of any of our senior management or other key personnel, or our inability to attract highly qualified senior management and other key personnel, could harm our business.
Risks Related to the Separation and Our Operation as an Independent Publicly Traded Company
We may not achieve some or all of the expected benefits of the separation.
We may not be able to achieve the full strategic and financial benefits expected to result from the separation of PayPal from eBay Inc., which we refer to as the separation, or such benefits may be delayed or not occur at all. The separation and distribution were expected to provide the following benefits, among others: enhanced strategic and management focus; better ability to form strategic relationships; faster decision-making; more efficient allocation of capital; alignment of incentives with performance objectives; direct access to the capital markets; and a distinct investment identity. If we fail to achieve some or all of the benefits expected to result from the separation, or if such benefits are delayed, our business could be harmed.
If the distribution, together with certain related transactions, does not qualify as a transaction that is generally tax-free for U.S. federal income tax purposes under Sections 368(a)(1)(D) and 355 of the Internal Revenue Code (the “Code”), eBay,PayPal and eBay stockholders could be subject to significant tax liabilities and, in certain circumstances, we could be required to indemnify eBay for material taxes pursuant to indemnification obligations under the tax matters agreement.
eBay received an opinion from its outside legal counsel regarding the qualification of the distribution, together with certain related transactions, as a transaction that is generally tax-free for U.S. federal income tax purposes under Sections 368(a)(1)(D) and 355 of the Code. The opinion was based on and relied on, among other things, certain facts and assumptions, as well as certain representations, statements and undertakings of eBay and PayPal, including those relating to the past and future conduct of eBay and PayPal. If any of these representations, statements or undertakings are, or become, inaccurate or incomplete, or if eBay or PayPal breach any of their respective covenants in the separation documents, the opinion of counsel may be invalid and the conclusions reached therein could be jeopardized.
Notwithstanding the opinion of counsel, the IRS could determine that the distribution, together with certain related transactions, should be treated as a taxable transaction if the IRS determines that any of these representations, assumptions, or undertakings upon which such opinion was based are incorrect or have been violated or if the IRS disagrees with the conclusions in the opinion of counsel. An opinion of counsel is not binding on the IRS or any court and there can be no assurance that the IRS will not challenge the conclusions reached in the opinion. The IRS did not provide any opinion in advance of the separation that our proposed transaction will be tax-free.
28
If the distribution, together with certain related transactions, failed to qualify as a transaction that is generally tax-free under Sections 368(a)(1)(D) and 355 of the Code, in general, eBay would recognize taxable gain as if it had sold the PayPal common stock in a taxable sale for its fair market value, eBay stockholders who received PayPal common stock in the distribution may be subject to tax as if they had received a taxable distribution equal to the fair market value of such shares and we could incur significant liabilities.
We may not be able to engage in desirable strategic or capital-raising transactions following the separation. In addition, we could be liable for adverse tax consequences resulting from engaging in significant strategic or capital-raising transactions.
To preserve the tax-free treatment to eBay of the separation and the distribution, under the tax matters agreement that we entered into with eBay, for a period of time following the distribution, we are generally prohibited from taking certain actions that prevent the distribution and related transactions from qualifying as a transaction that is generally tax-free, for U.S. federal income tax purposes under Sections 368(a)(1)(D) and 355 of the Code. These restrictions may limit our ability to pursue certain strategic transactions or other transactions that we or our stockholders might consider desirable or may present us from engaging in certain capital-raising transactions.
We have no history of operating as an independent, publicly traded company in our current form, and our historical financial information is not necessarily representative of the results that we would have achieved as a separate, publicly traded company and may not be a reliable indicator of our future results.
The combined and consolidated financial statements included in Part IV, Item 15 of this Annual Report on Form 10-K were derived from the consolidated financial statements and accounting records of eBay and do not necessarily reflect the financial condition, results of operations, or cash flows that we would have achieved as a separate, independent, publicly traded company during the periods presented or those that we will achieve in the future, primarily as a result of the factors described below:
|
•
|
Prior to the separation, our business was operated by eBay as part of its broader corporate organization, rather than as an independent company. eBay or its affiliates performed various corporate functions for us, such as legal, finance, treasury, accounting, tax, auditing, human resources, certain compliance functions, and public affairs. Our historical financial results reflect allocations of corporate expenses from eBay for such functions, which are likely to be less than the comparable expenses we would have incurred had we operated as a separate publicly traded company. In addition, we may need to significantly increase our investment in certain of these functions to maintain appropriate levels of administrative, legal and regulatory compliance.
|
|
•
|
Prior to the separation, our business was integrated with the other businesses of eBay. Historically, we shared economies of scope and scale in costs, employees, vendor relationships and customer relationships. Although we have entered into arm’s length agreements with eBay, including the operating agreement, these arrangements may not retain or fully capture the benefits that we enjoyed as a result of being integrated with eBay and may result in our paying higher charges than in the past for these services. This could have an adverse effect on our results of operations and financial condition.
|
|
•
|
As a part of eBay, we benefited from, among other things, the acquisition of new customers from eBay, capital to fund acquisitions, investments and credit, and data from eBay that helps us to manage risks and maintain a low loss rate. In addition, being a part of eBay enabled us to leverage eBay’s technology capabilities, data, commerce platforms and relationships with retailers, brands and large merchants worldwide. The loss of these synergies and benefits could adversely affect our results of operations and financial condition.
|
|
•
|
Generally, our working capital requirements and capital for our general corporate purposes, including acquisitions and capital expenditures, were historically satisfied as part of the corporate-wide cash management policies of eBay. We may need to obtain additional financing from banks, through public offerings or private placements of debt or equity securities, or through strategic relationships or other arrangements, which may or may not be available and may be more costly.
|
|
•
|
The cost of capital for our business may be higher than eBay’s cost of capital prior to the separation.
|
Other significant changes may occur in our cost structure, management, financing, and business operations as a result of operating as an independent company separate from eBay. For additional information, please see “Management’s Discussion and Analysis of Financial Condition and Results of Operations” and the combined and consolidated financial statements and accompanying notes included in Part IV, Item 15 of this Annual Report on Form 10-K.
29
eBay remains a significant source of our revenues after the distribution.
After the distribution, we continue to derive a significant amount of revenues and operating income from eBay. If the operating agreement expires or is terminated prior to its expiration, or if there is a significant change in our relationship with eBay, including if eBay becomes a merchant of record, eliminates or modifies any of its risk management or customer protection programs, directs transactions to a different provider of payment services or offers eBay customers more payment options, our business could be materially harmed.
eBay may fail to perform under various agreements that were executed as part of the separation or we may fail to have necessary systems and services in place when certain of the transaction agreements expire.
In connection with the separation, we entered into a separation and distribution agreement with eBay as well as various other agreements, including an operating agreement, colocation services agreements, transition services agreements, a tax matters agreement, an employee matters agreement, an intellectual property matters agreement, a data sharing addendum, and a product development agreement. The separation agreement, the tax matters agreement, the employee matters agreement, and the intellectual property matters agreement determine the allocation of assets and liabilities (including by means of licensing) between the companies following the separation for those respective areas and include any necessary indemnifications related to liabilities and obligations. The operating agreement, the colocation services agreements and the data sharing addendum establish certain commercial relationships between eBay and us related to payment processing, credit, information technology infrastructure and data sharing. The transition services agreements provide for the performance of certain services by each company for the benefit of the other for a limited period of time after the separation. If we or eBay is unable to satisfy its performance and payment obligations under these agreements, including its respective indemnification obligations, we could incur operational difficulties or losses or be required to make substantial indemnification or other payments to eBay. If we do not have in place our own systems and services, or if we do not have agreements with other providers of these services once these transaction agreements expire or terminate, we may not be able to operate our business effectively and our financial condition and result of operations may be adversely affected.
After the separation, certain of our directors may have actual or potential conflicts of interest because of their previous or continuing positions at eBay.
Because of their current or former positions with eBay, certain of our directors own eBay common stock and equity awards. Following the separation, even though our board of directors consists of a majority of directors who are independent, some of our directors continue to have a financial interest in eBay common stock and equity awards. In addition, one of our directors continues to serve on the eBay board of directors. Continuing ownership of eBay common stock and equity awards or service as a director at both companies could create, or appear to create, potential conflicts of interest if PayPal and eBay were to have disagreements about the agreements between them or face decisions that could have different implications for PayPal and eBay.
Risks Related to Our Common Stock
The price of our common stock may fluctuate significantly.
The price of our common stock may fluctuate significantly due to a number of factors, some of which may be beyond our control, including:
|
•
|
actual or anticipated fluctuations in our operating results;
|
|
•
|
changes in earnings estimated by securities analysts or our ability to meet those estimates;
|
|
•
|
the change in our stockholder base following the distribution;
|
|
•
|
the operating and stock price performance of comparable companies;
|
|
•
|
changes to the regulatory and legal environment under which we operate; and
|
|
•
|
market conditions in the payments industry, the industries of merchants and the domestic and worldwide economy as a whole.
|
30
PayPal’s amended and restated certificate of incorporation designates the state courts of the State of Delaware, or, if no state court located in the State of Delaware has jurisdiction, the federal court for the District of Delaware, as the sole and exclusive forum for certain types of actions and proceedings that may be initiated by PayPal’s stockholders, which could discourage lawsuits against PayPal and PayPal’s directors and officers.
PayPal’s amended and restated certificate of incorporation provides that unless the corporation otherwise determines, the state courts of the State of Delaware, or, if no state court located in the State of Delaware has jurisdiction, the federal court for the District of Delaware, will be the sole and exclusive forum for any derivative action or proceeding brought on behalf of PayPal, any action asserting a claim of breach of a fiduciary duty owed by any director or officer of PayPal to PayPal or PayPal’s stockholders, creditors or other constituents, any action asserting a claim against PayPal or any director or officer of PayPal arising pursuant to any provision of the Delaware General Corporation Law ("DGCL") or PayPal’s amended and restated certificate of incorporation or bylaws, or any action asserting a claim against PayPal or any director or officer of PayPal governed by the internal affairs doctrine. This exclusive forum provision may limit the ability of PayPal’s stockholders to bring a claim in a judicial forum that such stockholders find favorable for disputes with PayPal or PayPal’s directors or officers, which may discourage such lawsuits against PayPal and PayPal’s directors and officers. Alternatively, if a court outside of Delaware were to find this exclusive forum provision inapplicable to, or unenforceable in respect of, one or more of the specified types of actions or proceedings described above, PayPal could incur additional costs associated with resolving such matters in other jurisdictions, which could adversely affect PayPal’s business, financial condition or results of operations.
Certain provisions in PayPal’s amended and restated certificate of incorporation and bylaws may prevent or delay an acquisition of PayPal, which could decrease the trading price of PayPal common stock.
PayPal’s amended and restated certificate of incorporation and amended and restated bylaws contain certain provisions that may have the effect of deterring coercive takeover practices and inadequate takeover bids by making such practices or bids unacceptably expensive to the bidder and by encouraging prospective acquirers to negotiate with PayPal’s board of directors rather than to attempt a hostile takeover. These provisions include, among others:
|
•
|
rules regarding how stockholders may present proposals or nominate directors for election at stockholder meetings;
|
|
•
|
the fact that directors may not be elected, removed or replaced at stockholder-requested special meetings unless a person, entity or group owns at least a majority of PayPal’s outstanding common stock;
|
|
•
|
the right of PayPal’s board to issue preferred stock and to determine the voting, dividend and other rights of preferred stock without stockholder approval; and
|
|
•
|
the ability of PayPal’s directors, and not stockholders, to fill vacancies on PayPal’s board of directors in most circumstances.
|
PayPal has also elected not to be governed by Section 203 of the DGCL, which provides that, subject to limited exceptions, persons that acquire, or are affiliated with a person that acquires, more than 15% of the outstanding voting stock of a Delaware corporation shall not engage in any business combination with that corporation, including by merger, consolidation or acquisitions of additional shares, for a three-year period following the date on which that person or its affiliates becomes the holder of more than 15% of the corporation’s outstanding voting stock. PayPal’s amended and restated certificate of incorporation, however, contains a provision that generally mirrors Section 203 of the DGCL, except that it provides for a 20% threshold instead of the 15% provided for by the DGCL. These provisions could delay or prevent a change of control that PayPal’s stockholders may favor.
Certain of the above provisions were added pursuant to the agreement between eBay Inc. and certain entities under the control of Carl C. Icahn. These provisions are not intended to make PayPal immune from takeovers. However, these provisions will apply even if the offer may be considered beneficial by some stockholders and may delay or prevent an acquisition that PayPal’s board of directors determines is not in the best interests of PayPal and PayPal’s stockholders. These provisions may also prevent or discourage attempts to remove and replace incumbent directors.
In addition, an acquisition or further issuance of PayPal’s stock (including preferred stock) could trigger the application of Section 355(e) of the Code. For a discussion of Section 355(e), see “Material U.S. Federal Income Tax Consequences” in our registration statement on Form 10, as amended, filed with the Securities and Exchange Commission. Under the tax matters agreement, in such circumstances, PayPal would be required to indemnify eBay for any resulting taxes, which could materially and adversely affect us. Moreover, this indemnity obligation might discourage, delay or prevent a change of control that PayPal’s stockholders may consider favorable. Please refer to “Certain Relationships and Related Person Transactions” and “Description of PayPal’s Capital Stock” in our registration statement on Form 10, as amended, filed with the Securities and Exchange Commission for a more detailed description of these agreements and provisions.
31
None.
We own and lease various properties in the U.S. and other countries around the world. We use the properties for executive and administrative offices, data centers, product development offices, fulfillment centers and customer service offices. As of
December 31, 2015
, our owned and leased properties provided us with aggregate square footage as follows:
|
United States
|
Other Countries
|
Total
|
||||||
|
|
(In millions)
|
|||||||
|
Owned facilities
|
1.2
|
|
—
|
|
1.2
|
|
||
|
Leased facilities
|
1.0
|
|
1.3
|
|
2.3
|
|
||
|
Total facilities
|
2.2
|
|
1.3
|
|
3.5
|
|
||
Our corporate headquarters are located in San Jose, California and occupy approximately 0.7 million of owned square feet.
The information set forth under “Note 11 — Commitments and Contingencies — Litigation and Regulatory Matters” to the combined and consolidated financial statements included in Part IV, Item 15 of this Annual Report on Form 10-K is incorporated herein by reference.
Not applicable.
32
Price Range of Common Stock
Our common stock began "regular way" trading under the ticker symbol "PYPL" on The NASDAQ Stock Market on July 20, 2015. The following table sets forth the range of market prices as reported by The NASDAQ Stock Market for the period from July 20, 2015 to December 31, 2015.
|
|
High
|
Low
|
|||||
|
Year Ended December 31, 2015
|
|||||||
|
Third Quarter (July 20, 2015 - September 30, 2015)
|
$
|
42.55
|
|
|
$
|
30.00
|
|
|
Fourth Quarter
|
$
|
38.52
|
|
|
$
|
30.75
|
|
As of February 5, 2016, there were approximately 3,972 holders of record of our common stock. The actual number of stockholders is significantly greater than this number of record holders, and includes stockholders who are beneficial owners, but whose shares are held in street name by brokers and other nominees.
We have never paid any cash dividends and we currently do not anticipate paying any cash dividends in the foreseeable future.
We did not repurchase any shares of our common stock in 2015. In January 2016, our Board of Directors authorized a stock repurchase program that provides for the repurchase of up to $2 billion of our common stock, with no expiration from the date of authorization. This stock repurchase program is intended to offset the impact of dilution from our equity compensation programs and, subject to market conditions and other factors, may also be used to make opportunistic repurchases of our common stock to reduce outstanding share count. Any share repurchases under our stock repurchase program may be made through open market transactions, block trades, privately negotiated transactions or other means at times and in such amounts as management deems appropriate and will be funded from our working capital or other financing alternatives. However, any stock repurchases are subject to market conditions and other uncertainties and we cannot predict if or when any stock repurchases will be made. Moreover, we may terminate our stock repurchase program at any time without notice.
33
The following selected financial data reflect the combined and consolidated operations of PayPal. PayPal derived the selected combined and consolidated income statement data for the years ended
December 31, 2015
,
2014
and
2013
and the selected combined and consolidated balance sheet data as of
December 31, 2015
and
2014
, as set forth below, from its audited combined financial statements, which are included in Item 15: Exhibits and Financial Statement Schedules of this report. PayPal derived the selected combined income statement data for the years ended
December 31, 2012
and
2011
and the selected combined balance sheet data as of
December 31, 2013
,
2012
and
2011
from PayPal’s underlying financial records, which were derived from the financial records of eBay. The historical results do not necessarily indicate the results expected for any future period. To ensure a full understanding, you should read the selected combined and consolidated financial data presented below in conjunction with “Management’s Discussion and Analysis of Financial Condition and Results of Operations” and the combined and consolidated financial statements and accompanying notes included elsewhere in this report.
|
|
Year Ended December 31,
|
||||||||||||||||||
|
|
2015
|
2014
|
2013
|
2012
|
2011
|
||||||||||||||
|
|
(In millions)
|
||||||||||||||||||
|
Combined and Consolidated Statement of Income Date:
|
|||||||||||||||||||
|
Net revenue
|
$
|
9,248
|
|
$
|
8,025
|
|
$
|
6,727
|
|
$
|
5,662
|
|
$
|
4,499
|
|
||||
|
Operating income
|
1,461
|
|
1,268
|
|
1,091
|
|
880
|
|
556
|
|
|||||||||
|
Net income
|
1,228
|
|
419
|
|
955
|
|
778
|
|
460
|
|
|||||||||
|
Combined and Consolidated Balance Sheet Data:
|
|||||||||||||||||||
|
Total assets
|
$
|
28,881
|
|
$
|
21,917
|
|
$
|
19,160
|
|
$
|
16,183
|
|
$
|
11,140
|
|
||||
|
Total long term liabilities
|
1,505
|
|
386
|
|
509
|
|
428
|
|
306
|
|
|||||||||
34
This Annual Report on Form 10-K contains forward-looking statements within the meaning of Section 27A of the Securities Act of 1933 and Section 21E of the Securities Exchange Act of 1934, including statements that involve expectations, plans or intentions (such as those relating to future business, future results of operations or financial condition, new or planned features or services, or management strategies). You can identify these forward-looking statements by words such as “may,” “will,” “would,” “should,” “could,” “expect,” “anticipate,” “believe,” “estimate,” “intend,” “plan” and other similar expressions. These forward-looking statements involve risks and uncertainties that could cause our actual results to differ materially from those expressed or implied in our forward-looking statements. Such risks and uncertainties include, among others, those discussed in “Item 1A: Risk Factors” of this Annual Report on Form 10-K, as well as in our combined and consolidated financial statements, related notes, and the other information appearing elsewhere in this report and our other filings with the SEC. We do not intend, and undertake no obligation, to update any of our forward-looking statements after the date of this report to reflect actual results or future events or circumstances. Given these risks and uncertainties, readers are cautioned not to place undue reliance on such forward-looking statements. You should read the following "Management's Discussion and Analysis of Financial Condition and Results of Operations" in conjunction with the audited combined and consolidated financial statements and the related notes that appear elsewhere in this report.
The Separation from eBay
On September 30, 2014, eBay Inc. (“eBay”) announced its intent to separate its payments business into an independent, publicly-traded company. To accomplish this separation, in January 2015, eBay incorporated PayPal Holdings, Inc. (“PayPal Holdings”) which is now the parent of PayPal, Inc. and holds directly or indirectly all of the assets and liabilities associated with PayPal, Inc. In June 2015, the board of directors of eBay approved the separation (the "separation") of eBay's payments business through the distribution (the "distribution") of 100% of the outstanding common stock of PayPal to eBay's stockholders. PayPal Holdings' registration statement on Form 10, as amended, was declared effective by the U.S. Securities and Exchange Commission on June 29, 2015. On July 17, 2015 (the "distribution date"), PayPal Holdings became an independent publicly-traded company through the pro rata distribution by eBay of 100% of the outstanding common stock of PayPal Holdings to eBay stockholders. Each eBay stockholder of record as of the close of business on July 8, 2015 received one share of PayPal Holdings common stock for every share of eBay common stock held on the record date. Approximately 1.2 billion shares of PayPal Holdings common stock were distributed on July 17, 2015 to eBay stockholders. PayPal Holdings' common stock began "regular way" trading under the ticker symbol "PYPL" on The NASDAQ Stock Market on July 20, 2015.
Prior to the separation, eBay transferred substantially all of the assets and liabilities and operations of eBay's payments business to PayPal Holdings, which was completed in June 2015 (the "capitalization"). The combined financial statements prior to the capitalization were prepared on a stand-alone basis and were derived from eBay's consolidated financial statements and accounting records. The combined financial statements reflect our financial position, results of operations, comprehensive income and cash flows as our business was operated as part of eBay prior to the capitalization. Following the capitalization, our consolidated financial statements include the accounts of PayPal Holdings and its wholly-owned subsidiaries. The combined and consolidated financial position, results of operations and cash flows as of dates and for periods prior to the separation may not be indicative of what our financial position, results of operations and cash flows would have been as a separate stand-alone entity during the periods presented, nor are they indicative of what our financial position, results of operations and cash flows may be in the future. For additional information, see "Note 1—Overview and Summary of Significant Accounting Policies" to our combined and consolidated financial statements included elsewhere in this Annual Report on Form 10-K.
Unless otherwise expressly stated or the context otherwise requires, references to “we,” “our,” “us,” “the Company” and “PayPal” refer to PayPal Holdings and its consolidated subsidiaries or, in the case of information as of dates or for periods prior to the separation, the combined and consolidated entities of the payments business of eBay, including PayPal, Inc. and certain other assets and liabilities that had been historically held at the eBay corporate level but were specifically identifiable and attributable to the payments business.
35
Overview
Net revenues
increased
$1.2 billion
, or
15%
in
2015
and
$1.3 billion
, or
19%
in
2014
. The increase was primarily driven by growth in total payment volume (“TPV”) of
20%
in
2015
and
26%
in
2014
. Operating expenses
increased
$1 billion
and
$1.1 billion
, or
15%
and
20%
, in
2015
and
2014
, respectively. The increase in 2015 was primarily due to an increase in transaction expense, customer support and operations expense, and transaction and loan losses. The increase in 2014 was primarily due to an increase in transaction expense, higher expenses due to additional sales and marketing programs and product development initiatives, and an increase in transaction and loan losses.
Operating income
increased
$193 million
, or
15%
, in
2015
compared to
2014
, and
$177 million
, or
16%
, in
2014
compared to
2013
. Non-GAAP operating income
increased
$327 million
, or
20%
, in
2015
compared to
2014
and
$237 million
, or
17%
, in
2014
compared to
2013
. Our non-GAAP operating margin was
21%
in
2015
,
2014
and
2013
. Operating income and non-GAAP operating income increased in
2015
and
2014
primarily as a result of higher net revenues partially offset by increased operating expenses.
We recorded net income of
$1.2 billion
in
2015
,
$419 million
in
2014
and
$955 million
in
2013
. The
increase
in net income in
2015
compared to 2014 was primarily attributable to an increase in operating income of
$193 million
and a
decrease
in income tax expense of
$582 million
primarily resulting from the recognition of deferred tax liabilities in 2014 relating to undistributed foreign earnings of certain foreign subsidiaries for 2013 and prior years. The decrease in net income in 2014 compared to 2013 also was primarily attributable to the recognition of deferred tax liabilities in 2014 relating to undistributed foreign earnings of certain foreign subsidiaries for 2013 and prior years which resulted in an increase in income tax expense in 2014. We recorded non-GAAP net income of
$1.6 billion
in
2015
,
$1.3 billion
in
2014
and
$1.2 billion
in
2013
. The increase in non-GAAP net income in
2015
and
2014
was primarily attributable to an increase in operating income in each of these periods. Our diluted net income per share was
$1.00
in
2015
,
$0.34
in
2014
and
$0.78
in
2013
. Our non-GAAP diluted net income per share was
$1.29
in
2015
,
$1.10
in
2014
and
$0.97
in
2013
.
We generated net cash flows from operations of
$2.5 billion
in 2015, compared to
$2.2 billion
and
$2.0 billion
in 2014 and 2013, respectively. We generated free cash flow of
$1.8 billion
,
$1.7 billion
and
$1.6 billion
in
2015
,
2014
and
2013
, respectively.
The following table provides a summary of our combined and consolidated operating results for the years ended
December 31, 2015, 2014 and 2013
:
|
|
Year Ended December 31,
|
Percent Increase/(Decrease)
|
|||||||||||||||
|
|
2015
|
2014
|
2013
|
2015
|
2014
|
||||||||||||
|
|
(In millions, except percentages)
|
||||||||||||||||
|
Net Revenues
|
$
|
9,248
|
|
$
|
8,025
|
|
$
|
6,727
|
|
15
|
%
|
19
|
%
|
||||
|
Operating Expenses
|
7,787
|
|
6,757
|
|
5,636
|
|
15
|
%
|
20
|
%
|
|||||||
|
Operating Income
|
1,461
|
|
1,268
|
|
1,091
|
|
15
|
%
|
16
|
%
|
|||||||
|
Income Tax Expense
|
260
|
|
842
|
|
129
|
|
(69
|
)%
|
553
|
%
|
|||||||
|
Effective income tax rate
|
17
|
%
|
67
|
%
|
12
|
%
|
**
|
|
**
|
|
|||||||
|
Net Income
|
$
|
1,228
|
|
$
|
419
|
|
$
|
955
|
|
193
|
%
|
(56
|
)%
|
||||
|
Net income per diluted share
(1)(2)
|
$
|
1.00
|
|
$
|
0.34
|
|
$
|
0.78
|
|
192
|
%
|
(56
|
)%
|
||||
1
On July 17, 2015, the distribution date, eBay stockholders of record as of the close of business on July 8, 2015 received
one
share of PayPal common stock for every share of eBay common stock held as of the record date. Basic and diluted net income per share for the years ended December 31, 2014 and 2013 were calculated using the number of common shares distributed on July 17, 2015.
2
Diluted net income per share for the year ended December 31, 2015, was calculated using the number of common shares distributed on July 17, 2015 for periods prior to distribution.
** Not Meaningful
36
The following table provides a summary of our combined and consolidated non-GAAP financial measures for the years ended
December 31, 2015, 2014 and 2013
:
|
|
Year Ended December 31,
|
Percent Increase/(Decrease)
|
|||||||||||||||
|
|
2015
|
2014
|
2013
|
2015
|
2014
|
||||||||||||
|
|
(In millions, except percentages*)
|
||||||||||||||||
|
Non-GAAP operating income
|
$
|
1,975
|
|
$
|
1,648
|
|
$
|
1,411
|
|
20
|
%
|
17
|
%
|
||||
|
Non-GAAP operating margin
|
21
|
%
|
21
|
%
|
21
|
%
|
**
|
|
**
|
|
|||||||
|
Non-GAAP net income
|
$
|
1,588
|
|
$
|
1,343
|
|
$
|
1,186
|
|
18
|
%
|
13
|
%
|
||||
|
Non-GAAP net income per diluted share
(1)(2)
|
$
|
1.29
|
|
$
|
1.10
|
|
$
|
0.97
|
|
18
|
%
|
13
|
%
|
||||
|
Free Cash Flow
|
$
|
1,824
|
|
$
|
1,728
|
|
$
|
1,602
|
|
6
|
%
|
8
|
%
|
||||
1
On July 17, 2015, the distribution date, eBay stockholders of record as of the close of business on July 8, 2015 received
one
share of PayPal common stock for every share of eBay common stock held as of the record date. Basic and diluted net income per share for the years ended December 31, 2014 and 2013 was calculated using the number of common shares distributed on July 17, 2015.
2
Diluted net income per share for the year ended December 31, 2015, was calculated using the number of common shares distributed on July 17, 2015 for periods prior to distribution.
* All amounts in tables are rounded to the nearest millions, except as otherwise noted. As a result, certain amounts may not recalculate using the rounded amounts provided.
** Not Meaningful
Non-GAAP operating income, non-GAAP operating margin, non-GAAP net income, non-GAAP diluted net income and free cash flow are not financial measures prepared in accordance with generally accepted accounting principles (“GAAP”) For information on how we compute these non-GAAP financial measures and a reconciliation to the most directly comparable financial measures prepared in accordance with GAAP, please refer to “
Non
-GAAP Financial Information” below.
Business Environment
We are a leading technology platform company that enables digital and mobile payments on behalf of consumers and merchants worldwide. We believe in providing simple, affordable, secure and reliable financial services and digital payments to help our customers around the world to achieve their financial goals. We strive to increase our relevance for consumers, merchants, friends and family to access and move their money anywhere in the world, anytime, on any platform and through any device (e.g., mobile, tablets, personal computers or wearables). We provide safer and simpler ways for businesses of all sizes to accept payments from merchant websites, mobile devices and applications, and at offline retail locations through a wide range of payment solutions. We also facilitate person to person payments through PayPal, Venmo and Xoom (acquired in November 2015). Our combined payment solution capabilities, including our PayPal, PayPal Credit, Braintree, Venmo, and Xoom products, comprise our proprietary Payments Platform.
We provide merchants and consumers with protection programs on substantially all transactions completed through our Payments Platform, except for transactions using our gateway and Paydiant products. Our gateway products include our Payflow Payments and certain Braintree products. A payment gateway links a merchant's website to their processing network and merchant account. These programs protect both merchants and consumers from loss primarily due to fraud and counterparty non-performance. Our risk management capabilities allow us to provide these protections, which are generally much broader than those protections provided by other participants in the payments industry. Most payments providers do not offer merchant protection in general, and those that do so generally do not provide protection of online or card not present transactions. As a result, merchants may incur losses for chargebacks and other claims on certain transactions when using other payments providers that they would not incur if they had used PayPal’s payments services. PayPal also provides consumer protection against losses on qualifying purchases and accepts claims for 180 days post transaction in the markets that PayPal serves. This protection is generally consistent with, or better than, that offered by other payments providers. We believe that as a result of these programs, consumers can be confident that they will only be required to pay if they receive the product in the condition as described, and merchants can be confident that they will receive payment for the product that they are delivering to the customer.
Our Payments Platform and open application programming interfaces (“APIs”) are designed to allow developers to innovate with ease and to offer cutting edge applications to a large ecosystem of merchants and consumers, while at the same time maintaining the security of our customers’ financial information. We provide developers with easy to use, flexible and powerful tools that are designed to leverage our global reach and payment capabilities. Our software developer kits (“SDKs”) are specifically focused on the mobile application market and are designed to remove friction by not requiring a redirect to PayPal.com or an additional login. We are using a true “mobile first” approach to make payments simple and intuitive.
37
Information security risks for global payments and technology companies have significantly increased in recent years. Although we have not experienced any material impacts relating to cyber-attacks or other information security breaches on our Payments Platform, there can be no assurance that we are immune to these risks and will not suffer such losses in the future. See “Risk Factors-Risk Factors That May Affect Our Business, Results of Operations and Financial Condition-Our business is subject to online security risks, including security and privacy breaches.”
We operate globally and in a rapidly evolving regulatory environment characterized by a heightened regulatory focus on all aspects of the payments industry. That focus continues to become even more heightened as regulators on a global basis focus on such important issues as countering terrorist financing, anti-money laundering, privacy and consumer protection. Some of the laws and regulations to which we are subject were enacted recently and the laws and regulations applicable to us, including those enacted prior to the advent of digital and mobile payments, are continuing to evolve through legislative and regulatory action and judicial interpretation. Non-compliance with laws and regulations, increased penalties and enforcement actions related to non-compliance, changes in laws and regulations or their interpretation, and the enactment of new laws and regulations applicable to us could have a material adverse impact on our business, results of operations and financial condition. Therefore, we monitor these areas closely to ensure compliant solutions for our customers who depend on us.
Impact of Foreign Currency Rates
We have significant operations internationally that are denominated in foreign currencies, primarily the British Pound, Euro, Australian Dollar and Canadian Dollar, subjecting us to foreign currency risk which may adversely impact our financial results. The strengthening or weakening of the U.S. dollar versus the British Pound, Euro, Australian Dollar and Canadian Dollar, as well as other currencies in which we conduct our international operations, impacts the translation of our net revenues and expenses generated in these foreign currencies into the U.S. dollar. We generated approximately 50% of our
2015
net revenues, 52% of our
2014
net revenues and 52% of our
2013
net revenues from merchants or consumers domiciled outside of the United States. Other than the United States, the United Kingdom was the only country where we generated more than 10% of total net revenues in
2015
,
2014
and
2013
. During each of these periods, we have also generated more than 10% of total net revenues in the Euro zone. Because we have generated substantial net revenues internationally in recent periods, including 2015, 2014 and 2013, we are subject to the risks of doing business in foreign countries as discussed under “Risk Factors—Risk Factors That May Affect Our Business, Results of Operations and Financial Condition.”
We calculate the year-over-year impact of foreign currency movements on our business using prior period foreign currency exchange rates applied to current year transactional currency amounts. While changes in foreign currency exchange rates affect our reported results, we have a foreign exchange exposure management program whereby we designate certain foreign currency exchange contracts as cash flow hedges to help minimize the impact on earnings from foreign currency rate movements. Gains and losses from these foreign currency exchange contracts are recognized as a component of transaction revenues in the same period the forecasted transactions impact earnings. In
2015
, foreign currency movements relative to the U.S. dollar negatively impacted net revenues by approximately
$345 million
(inclusive of a
$182 million
favorable impact from hedging activities) and favorably impacted operating expenses by approximately $310 million. In
2014
, foreign currency movements relative to the U.S. dollar negatively impacted net revenues by approximately $58 million (inclusive of a $36 million negative impact from hedging activities) and favorably impacted operating expenses by approximately $55 million. While we enter into foreign currency exchange contracts to minimize the impact on earnings from foreign currency rate movements, it is impossible to predict or eliminate the effects of this exposure.
Additionally, in connection with our services in multiple currencies, we set our foreign exchange rates twice per day, and may face financial exposure if we incorrectly set our foreign exchange rates or as a result of fluctuations in foreign exchange rates between the times that we set our foreign exchange rates. Given that we also have foreign exchange risk on our assets and liabilities denominated in currencies other than the functional currency of our subsidiaries, we have an additional foreign exchange exposure management program whereby we use foreign exchange contracts to offset the impact of currency exchange rate movements on our assets and liabilities. The foreign currency gains and losses on our assets and liabilities are recorded in “Other income (expense), net,” which are offset by the gains and losses on the foreign exchange contracts. These foreign exchange contracts reduce, but do not entirely eliminate, the impact of currency exchange rate movements on our assets and liabilities.
38
Financial Results
Net revenues
Revenue description
We earn revenue primarily by processing customer transactions on our Payments Platform and from other value added services. Our revenues are classified into the following two categories:
|
•
|
Transaction revenues:
Net transaction fees charged to consumers and merchants based on the volume of activity processed through our Payments Platform, including our PayPal, PayPal Credit, Venmo, Braintree and Xoom products.
|
|
•
|
Other value added services
: Net revenues derived principally from interest and fees earned on our PayPal Credit loans receivable portfolio, subscription fees, gateway fees, gain on sale of participation interests in certain consumer loans receivable, revenue share we earn through partnerships, interest earned on certain PayPal customer account balances, fees earned through our Paydiant products and other services that we provide to consumers and merchants.
|
Transaction revenues are generated from fees charged to consumers and merchants on the volume of activity we enable (“Total Payments Volume” or “TPV”). We define TPV as the value of payments, net of payment reversals, successfully completed through our Payments Platform, excluding transactions processed through our gateway and Paydiant products. Growth in TPV is also directly impacted by the payment transactions that we enable on our Payments Platform. Payment transactions are the total number of payments, net of payment reversals, successfully completed through our Payments Platform, excluding transactions processed through our gateway and Paydiant products. We earn additional fees on transactions settled in foreign currencies when we enable cross-border transactions (i.e., transactions where the merchant or consumer were in different countries).
Our revenues can be significantly impacted by the following:
|
•
|
The mix of merchants, products and services;
|
|
•
|
Mix between domestic and cross-border transactions;
|
|
•
|
Geographic region or country in which a transaction occurs; and
|
|
•
|
The amount of PayPal Credit loans receivable outstanding with consumers and merchants.
|
Net revenues analysis
The significant components of our net revenue for the years ended
December 31, 2015
,
2014
and
2013
were as follows:
|
|
Year Ended December 31,
|
Percent Increase/
(Decrease)
|
|||||||||||||||
|
|
2015
|
2014
|
2013
|
2015
|
2014
|
||||||||||||
|
|
(In millions, except percentages)
|
||||||||||||||||
|
Transaction revenues
|
$
|
8,128
|
|
$
|
7,107
|
|
$
|
5,992
|
|
14
|
%
|
19
|
%
|
||||
|
Other value added services
|
1,120
|
|
918
|
|
735
|
|
22
|
%
|
25
|
%
|
|||||||
|
Net revenues
|
$
|
9,248
|
|
$
|
8,025
|
|
$
|
6,727
|
|
15
|
%
|
19
|
%
|
||||
Net revenues from transaction revenues increased by
$1.0 billion
, or
14%
, in 2015 compared to 2014. Net revenues from transaction revenues increased by $1.1 billion, or 19%, in 2014 compared to 2013. The increase in transaction revenues in
2015
and 2014 was due primarily to the growth in TPV and the growth in total number of payment transactions on our Payments Platform. Acquisitions were not material to total transaction revenue growth in 2015 or 2014. The impact of increases or decreases in prices charged to our customers did not significantly impact revenue growth in
2015
or
2014
.
39
The following table provides a summary of our active customer accounts, number of payment transactions, TPV and related metrics:
|
|
Year Ended December 31,
|
Percent Increase/
(Decrease)
|
|||||||||||||||
|
|
2015
|
2014
|
2013
|
2015
|
2014
|
||||||||||||
|
|
(In millions, except percentages*)
|
||||||||||||||||
|
Active customer accounts
(1)
|
179
|
|
162
|
|
143
|
|
11
|
%
|
13
|
%
|
|||||||
|
Number of payment transactions
(2)
|
4,928
|
|
3,964
|
|
3,261
|
|
24
|
%
|
22
|
%
|
|||||||
|
Payment transactions per active account
(3)
|
27.5
|
|
24.5
|
|
22.9
|
|
12
|
%
|
7
|
%
|
|||||||
|
Total TPV
(4)
|
$
|
281,764
|
|
$
|
234,635
|
|
$
|
185,606
|
|
20
|
%
|
26
|
%
|
||||
|
Percent of cross-border TPV
|
22
|
%
|
24
|
%
|
24
|
%
|
**
|
|
**
|
|
|||||||
1
An active customer account is a registered account that successfully sent or received at least one payment or payment reversal through our Payments Platform, excluding transactions processed through our gateway and Paydiant products, in the past 12 months.
2
Payment transactions are the total number of payments, net of payment reversals, successfully completed through our Payments Platform, excluding transactions processed through our gateway and Paydiant products.
3
Number of payment transactions per active customer account reflects the total number of payment transactions within the previous 12 month period, divided by active customer accounts at the end of the period
4
Total Payment Volume or “TPV” is the value of payments, net of payment reversals, successfully completed through our Payments Platform, excluding transactions processed through our gateway and Paydiant products.
* All amounts in tables are rounded to the nearest millions, except as otherwise noted. As a result, certain amounts may not recalculate using the rounded amounts provided.
** Not Meaningful
The growth in TPV of
20%
in 2015 and
26%
in 2014 was driven by growth in active accounts, a higher number of payment transactions driven by the increase in engagement from our customers and growth from our Braintree and Venmo products. TPV growth in 2015 was negatively impacted by foreign currency fluctuations due to the strengthening of the U.S. dollar. The growth in transaction revenues was lower than the growth in TPV and growth in payment transactions in 2015 and 2014 due to a higher portion of TPV generated by large merchants who generally pay lower rates on higher transaction volume and a lower mix of cross-border transactions. The percent of TPV generated by large merchants increased four percentage points in 2015 and three percentage points in 2014. Cross-border transactions generally provide higher revenues than similar transactions that take place within a single country or market.
Net revenues from other value added services increased by
$202 million
, or
22%
in 2015 compared to 2014. Net revenues from other value added services increased by
$183 million
or
25%
in 2014 compared to 2013. The increase in net revenues from other value added services in 2015 was due primarily to interest and fee income earned on loans receivable outstanding from consumers and merchants that used our PayPal Credit products, revenue share earned under our credit program agreement with Synchrony Financial (formerly GE Capital Retail Bank), and the gain on sale of a participation interest in certain consumer loans receivable that we purchased, as described further below. The increase in net revenues from other value added services in 2014 was due primarily to interest and fee income earned on loans receivable outstanding from consumers and merchants that used our PayPal Credit products.
In the third quarter of 2015, we amended the terms of our credit program agreement with Synchrony Financial. As a result of the amendment, we recognized $78 million of additional revenue under the agreement during 2015. In addition, as part of the amended agreement, our obligation to purchase the portfolio of consumer loan receivables relating to the customer accounts arising out of the credit program agreement with Synchrony Financial was terminated. We retain an option to purchase the portfolio at the end of the new contract term.
In the second quarter of 2015, we completed an arrangement with certain investors under which we sold participation interests in certain consumer loans and interest receivable related to our PayPal Credit products with a gross book value of approximately
$708 million
. As a result of the arrangement, the impact to net revenues from other value added services during 2015 was a net decrease of $35 million compared to 2014 due to the reduction in net revenues earned from interest and fees on the participation interests sold, partially offset by the gain recognized on the sale of the participation interest (inclusive of the gain of $26 million recognized on the initial sale of approximately $708 million in certain consumer loans receivable) and servicing fees.
40
Operating Expenses
The following table summarizes our operating expenses and related metrics we use to assess the trend in each:
|
|
Year Ended December 31,
|
Percent Increase/
(Decrease)
|
|||||||||||||||
|
|
2015
|
2014
|
2013
|
2015
|
2014
|
||||||||||||
|
|
(In millions, except percentages)
|
||||||||||||||||
|
Transaction expense
|
$
|
2,610
|
|
$
|
2,170
|
|
$
|
1,835
|
|
20
|
%
|
18
|
%
|
||||
|
Transaction and loan losses
|
809
|
|
646
|
|
502
|
|
25
|
%
|
29
|
%
|
|||||||
|
Customer support and operations
|
1,220
|
|
1,055
|
|
950
|
|
16
|
%
|
11
|
%
|
|||||||
|
Sales and marketing
|
985
|
|
998
|
|
791
|
|
(1
|
)%
|
26
|
%
|
|||||||
|
Product development
|
947
|
|
890
|
|
727
|
|
6
|
%
|
22
|
%
|
|||||||
|
General and administrative
|
560
|
|
482
|
|
378
|
|
16
|
%
|
28
|
%
|
|||||||
|
Depreciation and amortization
|
608
|
|
516
|
|
453
|
|
18
|
%
|
14
|
%
|
|||||||
|
Restructuring
|
48
|
|
—
|
|
—
|
|
**
|
|
**
|
|
|||||||
|
Total operating expenses
|
$
|
7,787
|
|
$
|
6,757
|
|
$
|
5,636
|
|
15
|
%
|
20
|
%
|
||||
|
Transaction expense rate
1
|
0.93
|
%
|
0.92
|
%
|
0.99
|
%
|
|||||||||||
|
Transaction and loan loss rate
2
|
0.29
|
%
|
0.28
|
%
|
0.27
|
%
|
|||||||||||
2
Transaction and loan loss rate is calculated by dividing transaction and loan losses by TPV
**Not Meaningfu
l
Transaction expense
Transaction expense is primarily comprised of the costs we incur to accept a customer’s funding source of payment. These costs include fees paid to payment processors and other financial institutions in order to draw funds from a customer’s credit or debit card, bank account or other funding source they have stored in their digital wallet. Transaction expense also includes fees paid to disbursement partners for processing and disbursement costs to enable a transaction and interest expense on borrowings incurred to finance our portfolio of loans receivable arising from our PayPal Credit funding option. We refer to the allocation of funding sources used by our consumers as our “funding mix.” The cost of funding a transaction with a credit or debit card is generally more costly than the cost of funding a transaction from a bank or through internal sources such as a PayPal account balance or PayPal Credit. As we expand the availability of alternative funding sources to our customers, a change in funding mix can increase or decrease our transaction expense rate. The cost of funding a transaction is also impacted by the geographic region or country in which a transaction occurs because we generally pay lower rates for transactions funded with credit cards outside the U.S. than in the U.S. For the years ended
December 31, 2015
,
2014
and
2013
, approximately 45%, 48%, and 48% of TPV, respectively, was generated outside of the U.S.
Transaction expense increased
$440 million
, or
20%
, in 2015 compared to 2014. The increases in transaction expense in 2015 was primarily attributable to an increase in TPV, offset by favorable foreign currency fluctuations due to the strengthening of the U.S. dollar. Transaction expense increased by
$335 million
, or
18%
, in 2014 compared to 2013, due primarily to an increase in TPV. The impact from acquisitions was not material to our total transaction expense growth in 2015 or 2014.
Our transaction expense rate in 2015 increased compared to 2014 due to higher assessments charged by payments processors and other financial institutions when we draw funds from a customer’s credit or debit card, bank account or other funding sources partially offset by cost efficiencies from our Payments Platform and a favorable funding mix. Our transaction expense rates in 2014 decreased compared to 2013 due to cost efficiencies from our Payments Platform, a favorable funding mix and a larger share of TPV in countries where we pay lower rates for transactions funded with credit cards than in the U.S. Interest expense on borrowings incurred to finance our portfolio of loans receivable, included in transaction expense, was $3 million, $7 million and $14 million for the years ended
December 31, 2015
,
2014
and
2013
, respectively.
Transaction and loan losses
Transaction losses include the expense associated with our customer protection programs, fraud, and chargebacks. Loan losses include the losses associated with our loans receivable balances. We expect our transaction and loan losses to fluctuate depending on many factors, including TPV, macroeconomic conditions, the extent of our customer protection programs, the impact of regulatory changes, and the credit quality of loans receivable arising from transactions funded with our PayPal Credit products and working capital advances to selected merchant sellers. Additionally, prior to the distribution we recovered certain amounts
41
from eBay related to customer protection programs offered on eligible eBay purchases made with PayPal. These costs include the actual amount of protection losses associated with eBay's customer protection programs that we administer and fund on behalf of eBay, which are included as a reduction of transaction and loan losses. Recoveries associated with protection losses incurred on eligible eBay purchases during the years ended
December 31, 2015
,
2014
and
2013
were
$27 million
,
$43 million
and
$48 million
, respectively. Following the distribution, we no longer administer eBay's customer protection programs or recover amounts from eBay associated with protection losses incurred on eligible eBay purchases; instead, we and eBay each independently administer our own customer protection programs. Further, our customer protection programs extend to customers’ eligible purchases on eBay and therefore we have incurred and expect to continue to incur related incremental costs associated with our customer protection programs following the distribution.
Transaction and loan losses increased
$163 million
or
25%
in
2015
compared to
2014
, and increased
$144 million
or
29%
in
2014
compared to
2013
. Transaction losses were
$511 million
in
2015
,
$408 million
in
2014
and
$310 million
in
2013
, reflecting an
increase
of
25%
in 2015 compared to 2014, and an
increase
of
32%
in 2014 compared to 2013. The increase in each of these periods was predominately attributable to higher TPV. Our transaction loss rate in 2015 increased compared to 2014 due to lower recoveries in 2015 associated with transaction losses incurred on eligible eBay purchases offset by improved consumer loss performance and a higher provision in the prior year from actual losses incurred. Our transaction loss rate in 2014 increased compared to 2013 due to a higher provision in 2014 from actual losses incurred.
Loan losses relating to our loans receivable portfolio were $298 million in
2015
, $238 million in
2014
and $192 million in
2013
, reflecting an increase of 25% in
2015
compared to
2014
, and an increase of 23% in
2014
compared to
2013
. The increase in loan losses in both 2015 and 2014 was due primarily to growth in the portfolio of loans receivable outstanding arising from consumers who chose PayPal Credit as a funding option and an increase in working capital advances to selected merchant sellers.
The total consumer loans receivable balance as of
December 31, 2015
and
2014
was
$4.0 billion
and
$3.7 billion
, respectively, reflecting a year over year
increase
of
8%
in 2015, including the sale of additional participation interests to certain investors in the second quarter of 2015. The following table provides information regarding the credit quality of our pool of U.S. consumer loans and interest receivable balance:
|
|
December 31,
|
||||
|
|
2015
|
2014
|
|||
|
Percentage of Loans Receivable with FICO scores > 680
|
54
|
%
|
54
|
%
|
|
|
Percentage of Loans Receivable with FICO scores < 599
|
9
|
%
|
9
|
%
|
|
|
Percent of Loans Receivable current
|
90
|
%
|
90
|
%
|
|
|
Percent of Loans Receivable > 90 days outstanding
|
4
|
%
|
4
|
%
|
|
We offer credit products to certain existing small and medium-sized merchants through our PayPal Working Capital product.
The total PayPal Working Capital advances and fees receivable ("Merchant Receivables") outstanding as of
December 31, 2015
and
2014
was
$421 million
and
$103 million
, respectively, reflecting a year over year increase of
309%
. To assess a merchant seeking a PayPal Working Capital advance, we use, among other indicators, a risk model that we have internally developed that we refer to as our PayPal Working Capital Risk Model (“PRM”), as a credit quality indicator to help predict the merchant's ability to repay the principal balance and fixed fee related to the working capital advance. The PRM uses multiple variables as predictors of the merchant's ability to repay a working capital advance. Drivers of the model include the merchant's annual payment volume and payment processing history with PayPal, prior repayment history with the PayPal Working Capital product, and other measures. Merchants are assigned a PRM credit score within the range of
350
to
750
. We generally expect that merchants to which we extend a working capital advance will have PRM scores greater than
525
. We generally consider scores above
610
to be very good and to pose limited credit risk. We assess a participating merchant’s PRM score on a recurring basis. At
December 31, 2015
and
2014
, the weighted average PRM score related to our PayPal Working Capital balances outstanding was
630
and
622
, respectively.
The determination of delinquency for merchant receivables is based on the current expected repayment period of the advance and fixed fee as compared to the original expected repayment period. We calculate the repayment rate based on the merchant's expected future payment volume such that repayment of the advance and fixed fee is typically expected to occur within 9 to 12 months from the date of the advance. On a monthly basis, we recalculate the repayment period based on the actual repayment activity on the receivable. As such, actual repayment periods are dependent on actual payment processing volumes.
42
The following table provides information regarding the credit quality of our merchant receivables:
|
|
December 31,
|
||||
|
|
2015
|
2014
|
|||
|
Percentage of Merchant Receivable with PRM scores > 610
|
61
|
%
|
56
|
%
|
|
|
Percentage of Merchant Receivable with PRM scores < 565
|
17
|
%
|
21
|
%
|
|
|
Percent of Merchant Receivable within original expected repayment period
|
77
|
%
|
77
|
%
|
|
|
Percent of Merchant Receivable > 90 days outstanding
|
6
|
%
|
9
|
%
|
|
Modifications to the acceptable risk parameters of our PayPal Credit products for the periods presented did not have a material impact on our loan losses.
Customer support and operations
Customer support and operations expenses include costs incurred to provide 24-hour call support to our customers, our site operations and other infrastructure costs incurred to support our Payments Platform, costs to support our trust and security programs protecting our merchants and consumers and other costs incurred in our operations centers. Customer support and operations costs increased
$165 million
, or
16%
, in
2015
compared to
2014
and $
105 million
, or
11%
, in
2014
compared to
2013
. The increase in 2015 and 2014 was predominantly related to an increase in headcount to service the growth in our active customer accounts and the number of payment transactions occurring on our Payments Platform and an increase in expenses incurred in 2015 to operate as an independent public company. This increase was offset in part by favorable foreign currency fluctuations due to the strengthening of the U.S. dollar.
Sales and marketing
Sales and marketing expenses consist primarily of customer acquisition, business development, advertising, marketing programs, and employee compensation and contractor costs to support these programs. Sales and marketing expenses decreased
$13 million
, or
1%
, in
2015
compared to
2014
. Sales and marketing expense increased by
$207 million
, or
26%
, in
2014
compared to
2013
. The decrease in 2015 was due to a decrease in employee and contractor related expenses and favorable foreign currency fluctuations due to the strengthening of the U.S. dollar, offset in part by higher marketing spend. The increase in sales and marketing expenses in
2014
was due primarily to higher spend to support our strategic initiatives. In 2014, we redesigned our PayPal logo and carried out significant campaigns designed to enhance our global brand recognition and drive consumer engagement.
Product development
Product development expenses consist primarily of employee compensation and contractor costs that are incurred in connection with the development of our Payments Platform, new products and the improvement of our existing products. Product development expenses exclude software and website development costs that are capitalized. The amortization of developed technology is included in depreciation and amortization expense.
Product development expenses increased
$57 million
, or
6%
, in
2015
compared to
2014
and
$163 million
, or
22%
, in
2014
compared to
2013
. The increase in 2015 was due primarily to investments in our Payments Platform, creating new mobile experiences for our customers and supporting our strategic initiatives, partially offset by a decrease in employee and contractor related expenses. The increase in 2014 was due primarily to investments in our Payments Platform, creating new mobile experiences for our customers and supporting our strategic initiatives. The acquisition of Braintree also impacted the growth in product development expenses in 2014 compared to 2013.
General and Administrative
General and administrative expenses consist primarily of costs incurred to provide support to our business, including legal, human resources, finance, executive and other support operations. Our legal expenses, including those related to ongoing legal proceedings, case settlements and judgments, and regulatory proceedings and fines, may fluctuate substantially from period to period.
For periods prior to the separation, our combined and consolidated financial statements include expenses associated with workplace resources and information technology that were previously allocated to the Payments segment of eBay, and additional expenses related to certain corporate functions, including senior management, legal, human resources and finance. These expenses also include allocations related to stock based compensation. The expenses that were incurred by eBay have been allocated to us based on direct usage or benefit where identifiable, with the remainder allocated on a pro rata basis of revenue, headcount, or other systematic measure. The corporate costs and allocation of expenses from eBay may not be indicative of the expenses that may
43
have been incurred had we been a separate stand-alone entity during the periods presented, nor are the results stated herein indicative of the expenses we may incur in the future. Such expenses could be higher or lower. In the periods presented, a significant portion of expenses associated with these functions and allocated to us in our combined and consolidated financial statements are included in general and administrative expenses.
General and administrative expenses increased
$78 million
, or
16%
, in
2015
compared to
2014
and
$104 million
, or
28%
, in
2014
compared to
2013
. In 2015, increase in general and administrative expenses related primarily to an increase in expenses incurred to operate as an independent public company and an increase in expenses associated with professional services, including contractor related expenses, and regulatory matters. In
2015
, $121 million of corporate costs and expenses allocated to us by eBay were included in general and administrative expenses representing a decrease of $86 million, or 42% compared to
2014
. In
2014
, $207 million of corporate costs and expenses allocated to us by eBay were included in general and administrative expenses representing an increase of $24 million, or 13%, compared to
2013
. In 2014, the remaining increase in general and administrative expenses related primarily to higher employee-related costs, including those related to the separation, and other costs incurred to operate as an independent public company.
Depreciation and Amortization
The primary components of our depreciation and amortization expenses include the depreciation and amortization of software, including our technology platform, equipment used to deliver our services and the amortization of acquired intangible assets. Depreciation and amortization expenses increased
$92 million
, or
18%
, in
2015
compared to
2014
and
$63 million
, or
14%
, in
2014
compared to
2013
. The increases in
2015
and
2014
were predominantly due to additional depreciation expenses associated with investments in our technology platforms and an increase in capital expenditures to operate as an independent public company. Amortization expense for intangible assets was
$93 million
,
$84 million
and
$70 million
for the years ended
December 31, 2015
,
2014
and
2013
respectively. The increase in amortization of intangibles in 2015 and 2014 was due primarily to our acquisitions.
Restructuring
In January 2015, at a regular meeting of eBay’s board of directors (the “eBay Board”), the eBay Board approved a plan to implement a strategic reduction of its existing global workforce. The reduction was completed by the end of 2015 primarily impacting sales and marketing and product development expenses. Restructuring expenses were
$48 million
in 2015. No restructuring expenses were recognized in 2014 or 2013.
Income Tax Expense
Our effective tax rate was 17% in
2015
, 67% in
2014
, and 12% in
2013
. The decrease in our effective tax rate during
2015
compared to
2014
and increase in our effective tax rate during 2014 compared to 2013 was due primarily to the recognition in 2014 of a U.S. deferred tax liability of approximately $650 million on $1.9 billion of undistributed foreign earnings of certain of our foreign subsidiaries for 2013 and prior years. See “Note 14—Income Taxes” to the combined and consolidated financial statements included in this report for more information on our effective tax rate.
Non-GAAP Financial Information
Non-GAAP financial information is defined as a numerical measure of a company’s performance that excludes or includes amounts that are different than the most comparable measure calculated and presented in accordance with accounting principles generally accepted in the United States (“GAAP”). Pursuant to the requirements of Regulation S-K, portions of this “Management’s Discussion and Analysis of Financial Condition and Results of Operations” include a reconciliation of certain non-GAAP financial measures to the most directly comparable GAAP financial measures. The presentation of non-GAAP financial measures should not be considered in isolation or as a substitute for the Company’s related financial results prepared in accordance with GAAP.
We present non-GAAP financial measures to enhance an investor’s evaluation of our ongoing operating results and to facilitate meaningful comparison of our results between periods. Management uses these non-GAAP financial measures to, among other things, evaluate our ongoing operations, for internal planning and forecasting purposes and in the calculation of performance-based compensation.
We exclude the following items from non-GAAP net income, non-GAAP net income per diluted share, non-GAAP operating income, non-GAAP operating margin and non-GAAP effective tax rate:
|
•
|
Stock-based compensation expense and related employer payroll taxes.
This consists of expenses for stock options, restricted stock and employee stock purchases. We exclude stock-based compensation expense from our non-GAAP
|
44
measures primarily because they are non-cash expenses that management does not believe are reflective of ongoing operating results. The related employer payroll taxes is dependent on our stock price and the timing and size of exercises by employees of their stock options and the vesting of their restricted stock, over which management has limited to no control, and as such management does not believe it correlates to the operation of our business.
|
•
|
Amortization or impairment of acquired intangible assets, impairment of goodwill, and transaction expenses from the acquisition or disposal of a business
. We incur amortization or impairment of acquired intangible assets and goodwill in connection with acquisitions and may incur significant gains or losses or transactional expenses from the acquisition or disposal of a business and therefore exclude these amounts from our non-GAAP measures. We exclude these items because management does not believe they are reflective of our ongoing operating results.
|
|
•
|
Separation
. These are significant expenses related to the separation of our business from eBay into a separate, independent publicly-traded company. These consist primarily of third-party consulting fees, legal fees, employee retention payments and other expenses incurred to complete the separation. We exclude these items because management does not believe they are reflective of our ongoing operating results.
|
|
•
|
Restructuring.
These consist of expenses for employee severance and other exit and disposal costs. We exclude restructuring charges primarily because management does not believe they are reflective of ongoing operating results.
|
|
•
|
Other certain significant gains, losses, or charges that are not indicative of our core operating results.
These are significant gains, losses, or charges during a period that are the result of isolated events or transactions which have not occurred frequently in the past and are not expected to occur regularly in the future. We exclude these amounts from our results because management does not believe they are indicative of our ongoing operating results. For the year ended December 31, 2014, this includes the recognition of a U.S. deferred tax liability of approximately $650 million.
|
|
•
|
Tax effect of non-GAAP adjustments.
This amount is used to present stock-based compensation and the other amounts described above on an after-tax basis consistent with the presentation of non-GAAP net income.
|
|
|
Year Ended December 31,
|
||||||||||
|
|
2015
|
2014
|
2013
|
||||||||
|
|
(In millions)
|
||||||||||
|
GAAP operating income
|
$
|
1,461
|
|
$
|
1,268
|
|
$
|
1,091
|
|
||
|
Stock-based compensation expense and related employer payroll taxes
|
356
|
|
309
|
|
269
|
|
|||||
|
Amortization of acquired intangible assets
|
85
|
|
70
|
|
55
|
|
|||||
|
Separation
|
15
|
|
—
|
|
—
|
|
|||||
|
Restructuring
|
48
|
|
1
|
|
(4
|
)
|
|||||
|
Acquisition related transaction expense
|
10
|
|
—
|
|
—
|
|
|||||
|
Total non-GAAP operating income adjustments
|
514
|
|
380
|
|
320
|
|
|||||
|
Non-GAAP operating income
|
$
|
1,975
|
|
$
|
1,648
|
|
$
|
1,411
|
|
||
|
Non-GAAP operating margin
|
21
|
%
|
21
|
%
|
21
|
%
|
|||||
45
|
|
Year Ended December 31,
|
||||||||||
|
|
2015
|
2014
|
2013
|
||||||||
|
|
(In millions)
|
||||||||||
|
GAAP income before income taxes
|
$
|
1,488
|
|
$
|
1,261
|
|
$
|
1,084
|
|
||
|
GAAP provision for income taxes
|
260
|
|
842
|
|
129
|
|
|||||
|
GAAP net income
|
1,228
|
|
419
|
|
955
|
|
|||||
|
Non-GAAP adjustments to net income:
|
|||||||||||
|
Non-GAAP operating income adjustments (see table above)
|
514
|
|
380
|
|
320
|
|
|||||
|
Amortization of investments
|
—
|
|
4
|
|
7
|
|
|||||
|
Other certain significant gains, losses, or charges
|
—
|
|
646
|
|
—
|
|
|||||
|
Separation (other income and expense)
|
(12
|
)
|
—
|
|
—
|
|
|||||
|
Tax effect of non-GAAP adjustments
|
(142
|
)
|
(106
|
)
|
(96
|
)
|
|||||
|
Non-GAAP net income
|
$
|
1,588
|
|
$
|
1,343
|
|
$
|
1,186
|
|
||
|
GAAP net income per diluted share
|
$
|
1.00
|
|
$
|
0.34
|
|
$
|
0.78
|
|
||
|
Non-GAAP net income per diluted share
|
$
|
1.29
|
|
$
|
1.10
|
|
$
|
0.97
|
|
||
|
Shares used in GAAP diluted share calculation
(1)(2)
|
1,229
|
|
1,224
|
|
1,224
|
|
|||||
|
Shares used in non-GAAP diluted share calculation
(1)(2)
|
1,229
|
|
1,224
|
|
1,224
|
|
|||||
|
GAAP effective tax rate
|
17
|
%
|
67
|
%
|
12
|
%
|
|||||
|
Tax effect of non-GAAP adjustments to net income
|
3
|
%
|
(49
|
)%
|
4
|
%
|
|||||
|
Non-GAAP effective tax rate
|
20
|
%
|
18
|
%
|
16
|
%
|
|||||
1
On July 17, 2015, the distribution date, eBay stockholders of record as of the close of business on July 8, 2015 received
one
share of PayPal common stock for every share of eBay common stock held as of the record date. Basic and diluted net income per share for the years ended December 31, 2014 and 2013 was calculated using the number of common shares distributed on July 17, 2015.
2
Basic and diluted net income per share for the year ended December 31, 2015 was calculated using the number of common shares distributed on July 17, 2015 for periods prior to distribution.
In addition to the non-GAAP measures discussed above, we also use free cash flow to assess our operating performance. Free cash flow represents cash flows from operating activities less purchases of property and equipment. We consider free cash flow to be a key performance measure that provides useful information to management and investors about the amount of cash generated by the business after the purchases of property and equipment and including investments in our Payments Platform, which can then be used to, among other things, invest in our business, make strategic acquisitions, and return cash to shareholders. A limitation of the utility of free cash flow as a measure of financial performance is that it does not represent the total increase or decrease in our cash balance for the period.
|
|
Year Ended December 31,
|
||||||||||
|
|
2015
|
2014
|
2013
|
||||||||
|
|
(In millions)
|
||||||||||
|
Net cash provided by operating activities
|
$
|
2,546
|
|
$
|
2,220
|
|
$
|
1,993
|
|
||
|
Less: Purchases of property and equipment
|
(722
|
)
|
(492
|
)
|
(391
|
)
|
|||||
|
Free cash flow
|
$
|
1,824
|
|
$
|
1,728
|
|
$
|
1,602
|
|
||
Liquidity and Capital Resources
We require liquidity and access to capital to fund our global operations, including customer protection programs, our PayPal Credit products, capital expenditures, investments in our business, potential acquisitions, working capital and other cash needs. The following table summarizes the cash, cash equivalents and available-for-sale investment balances available as of
December 31, 2015
and
2014
:
|
|
December 31,
|
||||||
|
|
2015
|
2014
|
|||||
|
|
(in millions)
|
||||||
|
Cash, cash equivalents and available-for-sale investment securities
1
|
$
|
5,732
|
|
$
|
2,230
|
|
|
1
Excludes assets related to customer accounts of
$12.3 billion
and
$10.6 billion
at
December 31, 2015
and
2014
, respectively.
46
Cash, cash equivalents and available-for-sale investments held by our foreign subsidiaries (i.e., any entities where earnings would be subject to United States tax upon repatriation) were $4.2 billion as of
December 31, 2015
and $2.0 billion at
December 31, 2014
, or 74% and 90% of our total cash, cash equivalents and available-for-sale investments as of those dates, respectively. During the first quarter of 2014, eBay changed its capital allocation strategy to reflect its objective of increasing its available U.S. cash, preserving its credit rating, and providing greater liquidity to meet its other cash needs in the U.S., including potential merger and acquisition activity and funding opportunistic share repurchases on an accelerated basis. As a result of the change in eBay’s capital allocation strategy, we provided for U.S. income and applicable foreign withholding taxes on $1.9 billion of undistributed foreign earnings of certain of our non-U.S. subsidiaries for 2013 and prior years. We recorded a deferred tax liability of approximately $650 million based on the estimated tax consequences of repatriating these earnings. We did not provide for U.S. federal income and foreign withholding taxes on $2.3 billion of our non-U.S. subsidiaries’ undistributed earnings as of
December 31, 2015
. Since we do not know the time or manner in which we may repatriate those funds, we cannot determine the impact of local taxes, withholding taxes and foreign tax credits associated with the future repatriation of such earnings and therefore cannot quantify the tax liability.
In the second quarter of 2015, we received a contribution of approximately $3.8 billion of cash from eBay, as well as a related estimated deferred tax liability of $236 million associated with the foreign earnings that are not considered indefinitely reinvested. In the fourth quarter of 2015, we reassessed the measurement of the deferred tax liability based on updated valuation information and reduced the deferred tax liability balance to $172 million as of December 31, 2015. The adjustment to the deferred tax liability was recorded as a contribution from eBay and resulted in an increase to net parent investment within stockholders' equity. This cash is being used for general corporate purposes in both our international and domestic operations.
In the third quarter of 2015, we entered into a credit agreement ("Credit Agreement") that provides for an unsecured $2.0 billion, five-year revolving credit facility that includes a $150 million letter of credit sub-facility and a $150 million swingline sub-facility, with available borrowings under the revolving credit facility reduced by the amount of any letters of credit and swingline borrowings outstanding from time to time. Borrowings and other amounts payable under the Credit Agreement are guaranteed by PayPal, Inc. (the "Guarantor"). We may also, subject to the agreement of the applicable lenders, increase the commitments under the revolving credit facility by up to $500 million. Subject to specified conditions, we may designate one or more of our subsidiaries as additional borrowers under the Credit Agreement provided that we and the Guarantor guarantee all borrowings and other obligations of any such subsidiaries under the Credit Agreement. As of
December 31, 2015
, no subsidiaries were designated as additional borrowers. Funds borrowed under the Credit Agreement may be used for working capital, capital expenditures, acquisitions and other general corporate purposes .
As of
December 31, 2015
, no borrowings or letters of credit were outstanding under the Credit Agreement. Accordingly, at
December 31, 2015
, $2.0 billion of borrowing capacity was available for the purposes permitted by the Credit Agreement.
Loans under the Credit Agreement will bear interest at either (i) the London Interbank Offered Rate (“LIBOR”) plus a margin (based on our public debt ratings) ranging from 1.00 percent to 1.625 percent or (ii) a formula based on the agent bank’s prime rate, the federal funds effective rate or LIBOR plus a margin (based on our public debt ratings) ranging from zero percent to 0.625 percent. Subject to certain conditions stated in the Credit Agreement, we and any of our subsidiaries designated as additional borrowers may borrow, prepay and reborrow amounts under the revolving credit facility at any time during the term of the Credit Agreement. The Credit Agreement will terminate and all amounts owing thereunder will be due and payable on July 17, 2020, unless (a) the commitments are terminated earlier, either at our request or, if an event of default occurs, by the lenders (or automatically in the case of certain bankruptcy-related events), or (b) the maturity date is extended upon our request , subject to the agreement of the lenders. The Credit Agreement contains customary representations, warranties, affirmative and negative covenants, including financial covenants, events of default and indemnification provisions in favor of the banks. The negative covenants include restrictions regarding the incurrence of liens, subject to certain exceptions. The financial covenants require us to meet a quarterly financial test with respect to a minimum consolidated interest coverage ratio and a maximum consolidated leverage ratio, based on our public debt ratings.
We have a cash pooling arrangement with a financial institution for cash management purposes. The arrangement allows for cash withdrawals from the financial institution based upon our aggregate operating cash balances held within the financial institution (“Aggregate Cash Deposits”). The arrangement also allows us to withdraw amounts exceeding the Aggregate Cash Deposits up to an agreed-upon limit. The net balance of the withdrawals and the Aggregate Cash Deposits are used by the financial institution as a basis for calculating our net interest expense or income under these arrangements. As of
December 31, 2015
, we had a total of $2.0 billion in cash withdrawals offsetting our $2.0 billion in Aggregate Cash Deposits held within the financial institution under the cash pooling arrangement.
47
As of
December 31, 2015
, we were rated investment grade by Standard and Poor's Financial Services, LLC and Fitch Ratings, Inc. We expect that these credit rating agencies will continue to monitor our performance now that we have separated from eBay, including our capital structure and results of operations. Our goal is to be rated investment grade, but as circumstances change there are factors that could drive the long term credit ratings both down and up. If that were to occur, it could increase our borrowing costs, including the interest rate on loans under our Credit Agreement.
The risk of losses from our customer protection programs are specific to individual customers, merchants and transactions, and may also be impacted by regional variations in these programs and modifications to the program resulting from changes to regulatory requirements. For the periods presented in these combined and consolidated financial statements included in this report, payments under these customer protection programs have ranged between 0.08% and 0.12% of TPV. Historical trends may not be an indication of future results. In addition, prior to the distribution, we recovered certain amounts from eBay related to customer protection programs offered on eligible eBay purchases made with PayPal. These costs included the actual amount of protection losses associated with eBay's customer protection programs that we administered and funded on behalf of eBay, which are included as a reduction of transaction and loan losses. Following the distribution, we no longer administer eBay's customer protection programs or recover amounts from eBay associated with transaction losses incurred on eligible eBay purchases; instead, we and eBay each independently administer our own customer protection programs. Further, our customer protection programs extend to customers’ eligible purchases on eBay and therefore we have incurred and expect to continue to incur incremental costs associated with our customer protection programs following the distribution.
We currently fund the purchase of the PayPal Credit consumer receivables with international and domestic cash resources. To the extent that our PayPal Credit products become more widely available, and as we further promote PayPal Credit, customer adoption and usage of such products may expand. Any resulting growth in the portfolio of loan receivables would increase our liquidity needs and any failure to meet those liquidity needs could adversely affect our business. In the second quarter of 2015, we completed an arrangement with certain investors under which we sold a participation interest in certain consumer loan and interest receivables related to our PayPal Credit products with a gross book value of approximately $708 million. The sale resulted in cash proceeds of approximately $710 million, of which $692 million related to the outstanding principal and $18 million related to the interest receivable. We will continue to evaluate partnerships and third party sources of funding of our credit portfolio, including, but not limited to, commercial banks, securitization markets, private equity firms and sovereign wealth funds and under certain specific circumstances, the use of customer funds. Our objective is to expand the availability of our credit products with capital from external sources, although there can be no assurance that we will be successful in achieving that goal. We believe that our access to the capital markets and funds that may be available from other third party sources, together with cash expected to be generated from operations, will be sufficient to fund our PayPal Credit products for the foreseeable future.
In the second quarter of 2014, we agreed, subject to certain conditions, that we, one of our affiliates or a designated third party would purchase a portfolio of consumer loan receivables relating to the customer accounts arising out of our credit program agreement with Synchrony Financial (formerly GE Capital Retail Bank) for a price based on the book value of the consumer loan receivables portfolio at the time of the purchase (expected to be October 2016), subject to certain adjustments and exclusions. In the third quarter of 2015, we amended and extended the existing credit card program agreement on new terms. As part of the amended agreement, our obligation to purchase the portfolio of consumer loan receivables relating to the customer accounts arising out of the credit program agreement with Synchrony Financial was terminated. We retain an option to purchase the portfolio at the end of the new contract term.
In January 2016, our Board of Directors authorized a stock repurchase program that provides for the repurchase of up to $2 billion of our common stock, with no expiration from the date of authorization. This stock repurchase program is intended to offset the impact of dilution from our equity compensation programs and, subject to market conditions and other factors, may also be used to make opportunistic repurchases of our common stock to reduce outstanding share count. Any share repurchases under our stock repurchase program may be made through open market transactions, block trades, privately negotiated transactions or other means at times and in such amounts as management deems appropriate and will be funded from our working capital or other financing alternatives. However, any stock repurchases are subject to market conditions and other uncertainties and we cannot predict if or when any stock repurchases will be made. Moreover, we may terminate our stock repurchase program at any time without notice.
Our liquidity, access to capital and borrowing costs could be adversely impacted by declines in our credit rating, our financial performance, and global credit market conditions, as well as a broad range of other factors. In addition, our liquidity, access to capital and borrowing costs could also be negatively impacted by the outcome of any of the legal or regulatory proceedings to which we are a party. See “Risk Factors—Risk Factors That May Affect Our Business, Results of Operations and Financial Condition” and “Note 11—Commitments and Contingencies” to the combined and consolidated financial statements for additional discussion of these and other risks facing our business.
48
We believe that our existing cash, cash equivalents, available-for-sale investments, cash expected to be generated from operations, and our expected access to capital markets, together with potential external funding through third party sources, such as commercial banks, private equity firms, and sovereign wealth funds, will be sufficient to fund our operating activities, anticipated capital expenditures, and PayPal Credit products for the foreseeable future.
Cash Flows
|
|
Year Ended December 31,
|
||||||||||
|
|
2015
|
2014
|
2013
|
||||||||
|
|
(In millions)
|
||||||||||
|
Net cash provided by (used in):
|
|||||||||||
|
Operating activities
|
$
|
2,546
|
|
$
|
2,220
|
|
$
|
1,993
|
|
||
|
Investing activities
|
(6,389
|
)
|
(1,546
|
)
|
(1,721
|
)
|
|||||
|
Financing activities
|
3,079
|
|
(51
|
)
|
(85
|
)
|
|||||
|
Effect of exchange rates on cash and cash equivalents
|
(44
|
)
|
(26
|
)
|
3
|
|
|||||
|
Net increase/(decrease) in cash and cash equivalents
|
$
|
(808
|
)
|
$
|
597
|
|
$
|
190
|
|
||
Operating Activities
Cash flows from operating activities includes net income adjusted for certain non-cash expenses, timing differences between expenses recognized for provision for transaction and loan losses and actual transaction losses paid, and changes in other assets and liabilities. Significant non-cash expenses for the period include depreciation and amortization, stock-based compensation, and deferred tax expenses. The expenses recognized for provision for transaction losses are estimates of the transaction losses incurred during the period but for which cash has not been paid. The cash impact from actual transaction losses paid during a period are reflected as a negative impact to changes in other current and non-current assets in cash from operating activities. The expenses recognized during the period for provision for loan losses are estimates of probable incurred losses on our PayPal Credit products for which the receivable has not been charged off. Actual charge offs of receivables related to our PayPal Credit products are reflected as a reduction in changes in principal loans receivable impacting investing activities and thus have no impact on cash from operating activities.
We generated cash from operating activities of
$2.5 billion
in 2015 due primarily to operating income of approximately
$1.5 billion
. Adjustments for non-cash expenses of depreciation and amortization and stock-based compensation including excess tax benefits from stock-based compensation were approximately
$928 million
during 2015. Adjustments for non-cash expenses related to transaction and loan losses were approximately
$809 million
during 2015. The cash generated from operating activities was offset by uses of cash from increases in working capital primarily related to transaction loss allowance for cash losses, net. Additional uses of cash impacting cash generated from operating activities include net cash outflows relating to settlement of eBay payables and receivables of approximately
$96 million
and increases in accounts receivable of approximately
$22 million
.
We generated cash from operating activities of
$2.2 billion
in 2014 and
$2.0 billion
in 2013, due primarily to operating income of
$1.3 billion
in 2014 and
$1.1 billion
in 2013. Adjustments for non-cash expenses of depreciation and amortization and stock-based compensation including excess tax benefits from stock-based compensation were approximately
$774 million
during 2014 and
$630 million
during 2013. Adjustments for non-cash expenses for transaction and loan losses were
$646 million
during 2014 and
$502 million
during 2013. The cash generated from operating activities was offset by uses of cash primarily related to transaction loss allowance for cash losses, net and changes in other working capital.
Cash paid for income taxes in
2015
,
2014
and
2013
was
$216 million
,
$47 million
and
$28 million
, respectively.
Investing Activities
The net cash used in investing activities of
$6.4 billion
in 2015 was due primarily to purchases of available for sale investments of
$7.5 billion
, cash paid for acquisitions (net of cash acquired) of
$1.2 billion
, increases in our loan receivable portfolio (net of collections) originated through our PayPal Credit products of
$819 million
and purchases of property and equipment of
$722 million
, due in part to the separation from eBay. These net cash outflows were offset by maturities and sales of investments of
$3.3 billion
and net cash inflows relating to receivables from eBay of
$575 million
.
49
The net cash used in investing activities of
$1.5 billion
in 2014 was due primarily to increases in our loan receivable portfolio (net of collections) originated through our PayPal Credit products of
$1.0 billion
, purchases of property and equipment of
$492 million
and net cash outflows relating to receivables from eBay of
$362 million
, offset by and net cash received for maturities and sales of investments of
$409 million
.
The net cash used in investing activities of
$1.7 billion
in 2013 was due primarily to increases in our loan receivable portfolio (net of collections and charge-offs) originated through our PayPal Credit products of
$793 million
, cash paid for acquisitions (net of cash acquired) of
$731 million
, purchases of investments of
$610 million
and purchases of property and equipment of
$391 million
, offset by net cash inflows relating to receivables from eBay of
$484 million
and cash received for maturities and sales of investments of
$320 million
.
Financing Activities
The net cash provided by financing activities of
$3.1 billion
in 2015 was due primarily to a contribution of approximately
$3.9 billion
of cash from eBay, offset by repayments of borrowings from eBay of
$862 million
.
The net cash used in financing activities of
$51 million
in 2014 and
$85 million
in 2013 was due primarily to net cash outflows relating to repayments of borrowings from eBay.
Free Cash Flow
We define free cash flow as cash flows from operating activities less purchases of property and equipment. Free cash flow was
$1.8 billion
in 2015, an increase of
$96 million
from 2014. The increase in free cash flow during the period was primarily due to higher cash generated from operating activities of
$326 million
offset by higher purchases of property and equipment of
$230 million
. Free cash flow generated during 2015 was used for general business purposes and towards our acquisitions completed in 2015.
Free cash flow was $1.7 billion in 2014, an increase of $126 million from 2013. The increase in free cash flow during the period was primarily due to higher cash generated from operating activities of $227 million offset by higher purchases of property and equipment of $101 million. Free cash flow generated during 2014 was used to fund our increase in loans to consumers and merchants.
Free cash flow is a non-GAAP financial measure. See "Non-GAAP Financial Information" for information on how we compute free cash flow and a reconciliation to the most directly comparable GAAP financial measure.
Effect of Exchange Rates on Cash
The negative effect of currency exchange rates on cash and cash equivalents during
2015
and
2014
of
$44 million
and
$26 million
, respectively, was due to the strengthening of the U.S. dollar against certain foreign currencies, primarily the Euro. There was minimal impact of currency exchange rates on cash and cash equivalents during
2013
.
Off-Balance Sheet Arrangements
As of
December 31, 2015
and
2014
, we had no off-balance sheet arrangements that have, or are reasonably likely to have, a current or future material effect on our combined and consolidated financial condition, results of operations, liquidity, capital expenditures or capital resources.
Future Liquidity and Obligations
As of
December 31, 2015
, approximately
$24.8 billion
of unused credit was available to PayPal Credit account holders. While this amount represents the total unused credit available, we have not experienced, and do not anticipate, that all of our PayPal Credit account holders will access their entire available credit at any given point in time. In addition, the individual lines of credit that make up this unused credit are subject to periodic review and termination by the chartered financial institution that is the issuer of PayPal Credit products based on, among other things, account usage and customer creditworthiness. When a consumer funds a purchase in the U.S. using a PayPal Credit product issued by a chartered financial institution, the chartered financial institution extends credit to the consumer, funds the extension of credit at the point of sale and advances funds to the merchant. We subsequently purchase the receivables related to the consumer loans extended by the chartered financial institution and, as a result of such purchase, bear the risk of loss in the event of loan defaults. Although the chartered financial institution continues
50
to own each customer account, we own the related receivable (excluding participation interests sold) and are responsible for all servicing functions related to the account.
We have certain fixed contractual obligations and commitments that include future estimated payments for general operating purposes. Changes in our business needs, contractual cancellation provisions, fluctuating interest rates, and other factors may result in actual payments differing from the estimates. We cannot provide certainty regarding the timing and amounts of these payments. The following table summarizes our obligations as of
December 31, 2015
that are expected to impact liquidity and cash flow in future periods. We believe we will be able to fund these obligations through our existing cash and investment portfolio and cash expected to be generated from operations.
|
Payments Due During the Year Ending December 31,
|
Purchase
Obligations
|
Operating
Leases
|
Total
|
||||||||
|
|
(In millions)
|
||||||||||
|
2016
|
$
|
269
|
|
$
|
55
|
|
$
|
324
|
|
||
|
2017
|
73
|
|
51
|
|
124
|
|
|||||
|
2018
|
32
|
|
49
|
|
81
|
|
|||||
|
2019
|
20
|
|
38
|
|
58
|
|
|||||
|
2020
|
10
|
|
32
|
|
42
|
|
|||||
|
Thereafter
|
—
|
|
129
|
|
129
|
|
|||||
|
$
|
404
|
|
$
|
354
|
|
$
|
758
|
|
|||
The significant assumptions used in our determination of amounts presented in the above table are as follows:
|
•
|
Purchase obligation amounts include minimum purchase commitments for advertising, capital expenditures (computer equipment, software applications, engineering development services, construction contracts) and other goods and services entered into in the ordinary course of business.
|
|
•
|
Lease amounts include minimum rental payments under our non-cancelable operating leases for office facilities, fulfillment centers, as well as computer and office equipment that we utilize under lease arrangements. The amounts presented are consistent with contractual terms and are not expected to differ significantly from actual results under our existing leases, unless a substantial change in our headcount needs requires us to expand our occupied space or exit an office facility early.
|
As we are unable to reasonably predict the timing of settlement of liabilities related to unrecognized tax benefits, net, the table does not include $288 million of such non-current liabilities included in deferred and other tax liabilities recorded on our consolidated balance sheet as of
December 31, 2015
.
Seasonality
The Company does not experience meaningful seasonality. No individual quarter in
2015
,
2014
or
2013
accounted for more than 30% of net revenue.
Critical Accounting Policies and Estimates
The application of U.S. GAAP requires us to make estimates and assumptions about certain items and future events that directly affect our reported financial condition. We have established detailed policies and control procedures to provide reasonable assurance that the methods used to make estimates and assumptions are well controlled and are applied consistently from period to period. The accounting estimates and assumptions discussed in this section are those that we consider to be the most critical to our financial statements. An accounting estimate is considered critical if both (a) the nature of the estimate or assumption is material due to the levels of subjectivity and judgment involved, and (b) the impact within a reasonable range of outcomes of the estimate and assumption is material to our financial condition. Senior management has discussed the development, selection and disclosure of these estimates with the Audit Committee of our Board of Directors. Our significant accounting policies, including recent accounting pronouncements, are described in Note 1 - Overview and Summary of Significant Accounting Policies to the combined and consolidated annual financial statements.
A quantitative sensitivity analysis is provided where that information is reasonably available, can be reliably estimated and provides material information to investors. The amounts used to assess sensitivity are included to allow users of this report to understand a general direction cause and effect of changes in the estimates and do not represent management’s predictions of variability. For all of these estimates, it should be noted that future events rarely develop exactly as forecasted, and estimates require regular review and adjustment.
Transaction and loan losses
Transaction and loan losses include the expense associated with our customer protection programs, fraud, chargebacks, and credit losses associated with our loans receivable balances. We expect our transaction and loan losses to fluctuate depending on many factors, including: the total TPV, macroeconomic conditions, the extent of our customer protection programs, the impact of regulatory changes, and the credit quality of loans receivable arising from transactions funded with our PayPal Credit products and working capital advances to selected merchant sellers.
We establish allowances for estimated transaction losses arising from processing customer transactions, such as chargebacks for unauthorized credit card use and merchant-related chargebacks due to non-delivery of goods or services, ACH returns, buyer protection program claims, account take-overs, and account overdrafts. Additions to the allowance, in the form of provisions, are reflected in transaction and loan losses in our combined and consolidated statements of income. The allowances, which involve the use of actuarial techniques, are monitored monthly and are updated based on actual claims data reported by our claims processors and other actual data received. The allowances are based on known facts and circumstances, internal factors including experience with similar cases, historical trends involving loss payment patterns, and the mix of transaction and loss types.
We also establish an allowance for loans receivable which represents our estimate of probable incurred loan losses inherent in our consumer loans receivable and merchant working capital advances. Increases to the allowance for loans receivable are reflected as transaction and loan losses in our combined and consolidated financial statements. This evaluation process is subject to numerous estimates and judgments, and is primarily based on forecasted principal balance delinquency rates (“roll rates”). Roll rates represent the percentage of balances which we estimate will migrate from one stage of delinquency to the next based on our historical experience, as well as external factors such as estimated bankruptcies and levels of unemployment. Roll rates are applied to principal balances for each stage of delinquency, from current to 180 days past due, in order to estimate the principal loans which have incurred a loss event and are probable to be charged off.
The determination of delinquency, from current to 180 days past due, for principal balances related to merchant working capital advances is based on the current expected repayment period of the advance and fixed fee as compared to the original expected repayment period. We calculate the repayment rate based on the merchant's expected future payment volume such that repayment of the advance and fixed fee is typically expected to occur within 9 to 12 months from the date of the advance. On a monthly basis, we recalculate the repayment period based on the actual repayment activity on the receivable. As such, actual repayment periods are dependent on actual payment processing volumes.
51
The allowance for loss against the interest and fees receivable is primarily determined by applying historical average customer account roll rates to the interest receivable balance in each stage of delinquency to project the value of accounts that have incurred losses and are probable to be charged off.
We charge off loans receivable balances in the month in which the customer balance becomes 180 days past due. Bankrupt accounts are charged off within 60 days of receiving notification from the bankruptcy courts. Past due loans receivable continue to accrue interest until such time as they are charged off, with the portion of the reserve related to interest receivable balance classified as a reduction of revenue.
Determining appropriate allowances for these losses is an inherently uncertain process and ultimate losses may vary from the current estimates. We regularly update our allowance estimates as new facts become known and events occur that may impact the settlement or recovery of losses. The allowances are maintained at a level we deem appropriate to adequately provide for losses incurred at the balance sheet date. Based on our results for the year ended
December 31, 2015
, an aggregate ten percentage increase in our transaction and loan loss rate would negatively impact transaction and loan losses by approximately $81 million.
Accounting for Income Taxes
Our annual tax rate is based on our income, statutory tax rates and tax planning opportunities available to us in the various jurisdictions in which we operate. Tax laws are complex and subject to different interpretations by the taxpayer and respective government taxing authorities. Significant judgment is required in determining our tax expense and in evaluating our tax positions, including evaluating uncertainties. We review our tax positions quarterly and adjust the balances as new information becomes available. Our income tax rate is significantly affected by the tax rates that apply to our foreign earnings. In addition to local country tax laws and regulations, our income tax rate depends on the extent that our earnings are indefinitely reinvested outside the U.S. Indefinite reinvestment is determined by management’s judgment about and intentions concerning our future operations. To the extent we do not intend to repatriate these earnings to fund U.S. operations, we do not provide for U.S. federal income and foreign withholding tax on these earnings.
Deferred tax assets represent amounts available to reduce income taxes payable on taxable income in future years. Such assets arise because of temporary differences between the financial reporting and tax bases of assets and liabilities, as well as from net operating loss and tax credit carryforwards. We evaluate the recoverability of these future tax deductions and credits by assessing the adequacy of future expected taxable income from all sources, including reversal of taxable temporary differences, forecasted operating earnings and available tax planning strategies. These sources of income rely heavily on estimates that are based on a number of factors, including our historical experience and short range and long-range business forecasts. To the extent deferred tax assets are not expected to be realized, we record a valuation allowance.
We recognize and measure uncertain tax positions in accordance with GAAP, pursuant to which we only recognize the tax benefit from an uncertain tax position if it is more likely than not that the tax position will be sustained on examination by the taxing authorities, based on the technical merits of the position. The tax benefits recognized in the financial statements from such positions are then measured based on the largest benefit that has a greater than 50 percent likelihood of being realized upon ultimate settlement. We report a liability for unrecognized tax benefits resulting from uncertain tax positions taken or expected to be taken in a tax return. GAAP further requires that a change in judgment related to the expected ultimate resolution of uncertain tax positions be recognized in earnings in the quarter in which such change occurs. We recognize interest and penalties, if any, related to unrecognized tax benefits in income tax expense.
We file annual income tax returns in multiple taxing jurisdictions around the world. A number of years may elapse before an uncertain tax position is audited by the relevant tax authorities and finally resolved. While it is often difficult to predict the final outcome or the timing of resolution of any particular uncertain tax position, we believe that our reserves for income taxes are adequate such that we reflect the benefits more likely than not to be sustained in an examination. We adjust these reserves, as well as the related interest, where appropriate in light of changing facts and circumstances. Settlement of any particular position could require the use of cash.
Based on our results for the year ended
December 31, 2015
, a one-percentage point increase in our provision for income taxes as a percentage of income before taxes would have resulted in an increase in the provision of approximately $15 million.
52
Loss Contingencies
We are currently involved in various claims, legal proceedings and investigations of potential operating violations by regulatory oversight authorities. We regularly review the status of each significant matter and assess our potential financial exposure. If the potential loss from any claim, legal proceeding or potential regulatory violation is considered probable and the amount can be reasonably estimated, we accrue a liability for the estimated loss. Significant judgment is required in both the determination of probability and the determination of whether an exposure is reasonably estimable. Our judgments are subjective based on the status of the legal or regulatory proceedings, the merits of our defenses and consultation with in-house and outside legal counsel. Because of uncertainties related to these matters, accruals are based only on the best information available at the time. As additional information becomes available, we reassess the potential liability related to pending claims, litigation or other violation and may revise our estimates. Due to the inherent uncertainties of the legal and regulatory process in the multiple jurisdictions in which we operate, our judgments may be materially different than the actual outcomes.
Revenue Recognition
Application of the various accounting principles in U.S. GAAP related to the measurement and recognition of revenue requires us to make judgments and estimates. Complex arrangements with nonstandard terms and conditions may require significant contract interpretation to determine the appropriate accounting. Specifically, the determination of whether we are a principal to a transaction (gross revenue) or an agent (net revenue) can require considerable judgment. Further, we provide incentive payments to consumers and merchants, which require judgment to determine whether the payments should be recorded as a reduction to gross revenue. Changes in judgments with respect to these assumptions and estimates could impact the amount of revenue recognized.
Valuation of Goodwill and Intangibles
The valuation of assets acquired in a business combination and asset impairment reviews require the use of significant estimates and assumptions. The acquisition method of accounting for business combinations requires us to estimate the fair value of assets acquired, liabilities assumed, and any non-controlling interest in the acquiree to properly allocate purchase price consideration between assets that are depreciated and amortized from goodwill. Impairment testing for assets, other than goodwill and indefinite-lived intangible assets, requires the allocation of cash flows to those assets or group of assets and if required, an estimate of fair value for the assets or group of assets. Our estimates are based upon assumptions believed to be reasonable, but which are inherently uncertain and unpredictable. These valuations require the use of management’s assumptions, which would not reflect unanticipated events and circumstances that may occur.
We evaluate goodwill and intangible assets for impairment on an annual basis or sooner if indicators of impairment exist. Under the Financial Accounting Standards Board (“FASB”) guidance, the evaluation of indefinite-lived intangible assets for impairment allows for qualitative assessment to be performed, which is similar to the FASB guidance for evaluating goodwill for impairment. In performing these qualitative assessments, we consider relevant events and conditions, including but not limited to: macroeconomic trends, industry and market conditions, overall financial performance, cost factors, company-specific events, legal and regulatory factors and our market capitalization (previously assessed under eBay). If the qualitative assessments indicate that it is more likely than not that the fair value of the reporting unit or indefinite-lived intangible assets are less than their carrying amounts, we must perform a quantitative impairment test.
Under the quantitative impairment test, if the carrying amount of the reporting unit goodwill or indefinite-lived intangible asset exceeds the implied fair value of that goodwill or indefinite-lived intangible asset, an impairment loss is recorded in the Combined and Consolidated Statement of Income. Measurement of the fair value of a reporting unit is based on one or more of the following fair value measures: amounts at which the unit as a whole could be bought or sold in a current transaction between willing parties, using present value techniques of estimated future cash flows, or using valuation techniques based on multiples of earnings or revenue, or a similar performance measure.
53
Market risk is the potential for economic losses to be incurred on market risk sensitive instruments arising from adverse changes in market factors such as interest rates, foreign currency exchange rates and equity price risk. Management establishes and oversees the implementation of policies governing our investing, funding, and foreign currency derivative activities in order to mitigate market risks. We monitor risk exposures on an ongoing basis.
Interest Rate Risk
We are exposed to interest rate risk relating to our investment portfolio and from interest-rate sensitive assets underlying the customer balances we hold on our condensed combined and consolidated balance sheet as customer accounts. We seek to reduce earnings volatility that may result from changes in interest rates.
As of
December 31, 2015
and
December 31, 2014
, approximately
24%
and
97%
of our total cash and investment portfolio was held in cash and cash equivalents.
The proportionate decrease was primarily driven by an increase in available-for-sale investments of $4.3 billion for 2015. Prior to the separation, PayPal participated in eBay Inc.’s cash pooling arrangement and had limited available-for-sale investment activity. As part of the capitalization we received from eBay a cash contribution of approximately $3.8 billion which was used to purchase available-for-sale investments. We held no direct investments in auction rate securities, collateralized debt obligations, structured investment vehicles or mortgage-backed securities in any periods presented. For additional details related to our investment activities, please see “Note 5—Investments” to the combined and consolidated financial statements included in this report.
The assets underlying the customer balances we hold on our combined and consolidated balance sheet as customer accounts are maintained in interest and non-interest bearing bank deposits, time deposits, and U.S. and foreign government and agency securities. We classify the assets underlying the customer balances as current based on their purpose and availability to fulfill our direct obligation under amounts due to customers. We seek to preserve principal while holding eligible liquid assets, as defined by applicable regulatory requirements and commercial law in jurisdictions where we operate, equal to at least 100% of the aggregate amount of all customer balances. We do not pay interest on amounts due to customers.
In the third quarter of 2015, we entered into a $2 billion senior unsecured credit facility maturing in 2020. Borrowings under the revolving facility, if any, bear interest at floating rates. As a result, we will be exposed to fluctuations in interest rates to the extent of our borrowings under the revolving credit facility. As of
December 31, 2015
, no borrowings or letters of credit were outstanding under the Credit Agreement.
Interest rates may also adversely impact our customers’ spending levels and ability and willingness to pay outstanding amounts owed to us. Higher interest rates often lead to higher payment obligations by customers to us and other lenders under mortgage, credit card and other consumer loans, which may reduce our customers’ ability to remain current on their obligations to us and therefore lead to increased delinquencies, charge-offs and allowance for loan and interest receivable which could have an adverse effect on our net earnings.
A 100 basis point increase in interest rates would not have had a material impact on our financial assets or liabilities as of
December 31, 2015
and 2014.
Foreign Currency Risk
We have significant operations internationally that are denominated in foreign currencies, primarily the British Pound, Euro, Australian Dollar and Canadian Dollar, subjecting us to foreign currency risk which may adversely impact our financial results. We transact business in various foreign currencies and have significant international revenues as well as costs. In addition, we charge our international subsidiaries for their use of intellectual property and technology and for certain corporate services. Our cash flow, results of operations and certain of our intercompany balances that are exposed to foreign exchange rate fluctuations may differ materially from expectations and we may record significant gains or losses due to foreign currency fluctuations and related hedging activities. We are generally a net receiver of foreign currencies and therefore benefit from a weakening of the U.S. dollar, and are adversely affected by a strengthening of the U.S. dollar, relative to foreign currencies.
We have a foreign exchange exposure management program designed to identify material foreign currency exposures, manage these exposures and reduce the potential effects of currency fluctuations on our reported combined and consolidated cash flows and results of operations through the execution of foreign currency exchange contracts. These foreign currency exchange contracts are accounted for as derivative instruments; for additional details related to our foreign currency exchange contracts, please see “Note 7—Derivative Instruments” to the combined and consolidated financial statements included in this report.
54
We use foreign exchange forward contracts to protect our forecasted U.S. dollar-equivalent earnings from adverse changes in foreign currency exchange rates. These hedging contracts reduce, but do not entirely eliminate, the impact of adverse currency exchange rate movements. We designate these contracts as cash flow hedges for accounting purposes. The effective portion of the derivative’s gain or loss is initially reported as a component of accumulated other comprehensive income ("AOCI") and subsequently reclassified into revenue in the same period the forecasted transaction affects earnings. The ineffective portion of the unrealized gains and losses on these contracts, if any, is recorded immediately in earnings.
We considered the historical trends in currency exchange rates and determined that it was reasonably possible that changes in exchange rates of 20% for all currencies could be experienced in the near term. If the U.S. dollar weakened by 20% at
December 31, 2015
and
December 31, 2014
, the amount recorded in AOCI related to our foreign exchange forward contracts, before taxes, would have been approximately $321 million and $294 million lower, respectively. If the U.S. dollar strengthened by 20% at
December 31, 2015
and
December 31, 2014
, the amount recorded in AOCI related to our foreign exchange forward contracts, before taxes, would have been approximately $321 million and $294 million higher, respectively.
We have an additional foreign exchange management program whereby we use foreign exchange contracts to offset the foreign exchange risk on our assets and liabilities denominated in currencies other than the functional currency of our subsidiaries. These contracts reduce, but do not entirely eliminate, the impact of currency exchange rate movements on our assets and liabilities. The foreign currency gains and losses on our assets and liabilities are recorded in “Other income (expense), net,” which are offset by the gains and losses on the foreign exchange contracts.
Adverse changes in exchange rates of 20% for all currencies would have resulted in an adverse impact on income before income taxes of approximately $136 million and $32 million at
December 31, 2015
and
December 31, 2014
, respectively, without considering the offsetting effect of hedging. Foreign exchange contracts in place as of
December 31, 2015
would have positively impacted income before income taxes by approximately $133 million, resulting in a net negative impact of approximately $3 million. Foreign exchange contracts in place as of
December 31, 2014
would have positively impacted income before income taxes by approximately $34 million, resulting in a net positive impact of approximately $2 million. These reasonably possible adverse changes in exchange rates of 20% were applied to total monetary assets and liabilities denominated in currencies other than the functional currencies of our subsidiaries at the balance sheet dates to compute the adverse impact these changes would have had on our income before income taxes in the near term.
Equity Price Risk
As of
December 31, 2015
and
December 31, 2014
, our cost and equity method investments totaled
$26 million
and
$31 million
, respectively, which represented less than 1% of our total cash and investment portfolio and were primarily related to cost method investments in privately held companies. We did not hold any marketable equity instruments. We review our investments for impairment when events and circumstances indicate a decline in fair value of such assets below carrying value is other-than-temporary. Our analysis includes a review of recent operating results and trends, recent sales and acquisitions of the securities in which we have invested and other publicly available data.
European Debt Exposures
We actively monitor our exposure to the European markets, including the impact of sovereign debt issues associated with Cyprus, Greece, Ireland, Italy, Portugal and Spain. As of
December 31, 2015
and
December 31, 2014
, we did not have any direct investments in the sovereign debt of these countries or in debt securities issued by corporations or financial institutions organized in these countries. We maintain a small number of operating bank accounts with local and foreign banks in the aforementioned countries that have balances that we do not consider material.
55
The combined and consolidated financial statements and accompanying notes listed in Part IV, Item 15(a)(1) of this Annual Report on Form 10-K are included elsewhere in this report.
None.
Evaluation of disclosure controls and procedures.
Based on the evaluation of our disclosure controls and procedures (as defined in the Rules 13a-15(e) and 15d-15(e) under the Securities Exchange Act of 1934, as amended, or the Exchange Act), our principal executive officer and our principal financial officer have concluded that as of December 31, 2015, the end of the period covered by this report, our disclosure controls and procedures were effective.
Management's report on internal control over financial reporting.
Our management is responsible for establishing and maintaining adequate internal control over financial reporting. Our management, including our principal executive officer and principal financial officer, conducted an evaluation of the effectiveness of our internal control over financial reporting based on the framework in
Internal Control - Integrated Framework (2013)
issued by the Committee of Sponsoring Organizations of the Treadway Commission. Based on its evaluation under the framework in
Internal Control - Integrated Framework
, our management concluded that our internal control over financial reporting was effective as of
December 31, 2015
.
The effectiveness of our internal control over financial reporting as of
December 31, 2015
has been audited by PricewaterhouseCoopers LLP, an independent registered public accounting firm, as stated in their report which appears in Item 15(a) of this Annual Report on Form 10-K.
Changes in internal controls over financial reporting.
There were no changes in our internal controls over financial reporting as defined in Exchange Act Rule 13a-15(f) that occurred during our most recently completed fiscal quarter that have materially affected, or are reasonably likely to materially affect, our internal control over financial reporting.
Not applicable.
56
Incorporated by reference from our Proxy Statement for our 2016 Annual Meeting of Stockholders to be filed with the SEC within 120 days after December 31, 2015.
Code of Ethics, Governance Guidelines and Committee Charters
We have adopted a Code of Business Conduct and Ethics that applies to all PayPal employees and directors. We have also adopted a Code of Ethics for Senior Financial Officers that applies to our senior financial officers, including our principal executive officer, principal financial officer and principal accounting officer. The Code of Ethics for Senior Financial Officers is included in our Code of Business Conduct and Ethics posted on our website at https://investor.paypal-corp.com/corporate-governance.cfm. We will post any amendments to or waivers from the Code of Ethics for Senior Financial Officers at that location.
Incorporated by reference from our Proxy Statement for our 2016 Annual Meeting of Stockholders to be filed with the SEC within 120 days after December 31, 2015.
Incorporated by reference from our Proxy Statement for our 2016 Annual Meeting of Stockholders to be filed with the SEC within 120 days after December 31, 2015.
Incorporated by reference from our Proxy Statement for our 2016 Annual Meeting of Stockholders to be filed with the SEC within 120 days after December 31, 2015.
Incorporated by reference from our Proxy Statement for our 2016 Annual Meeting of Stockholders to be filed with the SEC within 120 days after
December 31, 2015
.
57
(a) The following documents are filed as part of this report:
|
1. Combined and Consolidated Financial Statements:
|
|
|
|
Page
Number
|
|
2. Financial Statement Schedule
|
|
|
All other schedules have been omitted because the information required to be set forth therein is not applicable or is shown in the financial statements or notes thereto.
|
|
|
3. Exhibits Required by Item 601 of Regulation S-K
|
|
|
The information required by this Item is set forth in the Index of Exhibits that follows the signature page of this Annual Report.
|
|
58
Report of Independent Registered Public Accounting Firm
To
the Board of Directors and Shareholders of PayPal Holdings, Inc.
In our opinion, the financial statements listed in the accompanying index present fairly, in all material respects, the financial position of PayPal Holdings, Inc. and its subsidiaries at December 31, 2015 and December 31, 2014, and the results of their operations and their cash flows for each of the three years in the period ended December 31, 2015 in conformity with accounting principles generally accepted in the United States of America. In addition, in our opinion, the financial statement schedule listed in the accompanying index presents fairly, in all material respects, the information set forth therein when read in conjunction with the related financial statements. Also in our opinion, the Company maintained, in all material respects, effective internal control over financial reporting as of December 31, 2015, based on criteria established in
Internal Control - Integrated Framework
(2013) issued by the Committee of Sponsoring Organizations of the Treadway Commission (COSO). The Company's management is responsible for these financial statements and financial statement schedule, for maintaining effective internal control over financial reporting and for its assessment of the effectiveness of internal control over financial reporting, included in Management’s Report on Internal Control Over Financial Reporting appearing under Item 9A. Our responsibility is to express opinions on these financial statements, on the financial statement schedule, and on the Company’s internal control over financial reporting based on our audits (which was an integrated audit in 2015). We conducted our audits in accordance with the standards of the Public Company Accounting Oversight Board (United States). Those standards require that we plan and perform the audits to obtain reasonable assurance about whether the financial statements are free of material misstatement and whether effective internal control over financial reporting was maintained in all material respects. Our audits of the financial statements included examining, on a test basis, evidence supporting the amounts and disclosures in the financial statements, assessing the accounting principles used and significant estimates made by management, and evaluating the overall financial statement presentation. Our audit of internal control over financial reporting included obtaining an understanding of internal control over financial reporting, assessing the risk that a material weakness exists, and testing and evaluating the design and operating effectiveness of internal control based on the assessed risk. Our audits also included performing such other procedures as we considered necessary in the circumstances. We believe that our audits provide a reasonable basis for our opinions.
As discussed in Note 1 to the consolidated financial statements, the Company changed the manner in which it classifies deferred tax assets and liabilities in 2015.
A company’s internal control over financial reporting is a process designed to provide reasonable assurance regarding the reliability of financial reporting and the preparation of financial statements for external purposes in accordance with generally accepted accounting principles. A company’s internal control over financial reporting includes those policies and procedures that (i) pertain to the maintenance of records that, in reasonable detail, accurately and fairly reflect the transactions and dispositions of the assets of the company; (ii) provide reasonable assurance that transactions are recorded as necessary to permit preparation of financial statements in accordance with generally accepted accounting principles, and that receipts and expenditures of the company are being made only in accordance with authorizations of management and directors of the company; and (iii) provide reasonable assurance regarding prevention or timely detection of unauthorized acquisition, use, or disposition of the company’s assets that could have a material effect on the financial statements.
Because of its inherent limitations, internal control over financial reporting may not prevent or detect misstatements. Also, projections of any evaluation of effectiveness to future periods are subject to the risk that controls may become inadequate because of changes in conditions, or that the degree of compliance with the policies or procedures may deteriorate.
/s/ PricewaterhouseCoopers LLP
San Jose, California
February 11, 2016
59
PayPal Holdings, Inc.
|
December 31,
2015 |
December 31,
2014 |
||||||
|
|
(In millions, except par value)
|
||||||
|
ASSETS
|
|||||||
|
Current assets:
|
|||||||
|
Cash and cash equivalents
|
$
|
1,393
|
|
$
|
2,201
|
|
|
|
Short-term investments
|
2,018
|
|
29
|
|
|||
|
Accounts receivable, net
|
137
|
|
65
|
|
|||
|
Loans and interest receivable, net of allowances of $233 in 2015 and $195 in 2014
|
4,184
|
|
3,586
|
|
|||
|
Funds receivable and customer accounts
|
12,261
|
|
10,612
|
|
|||
|
Notes and receivables from eBay
|
—
|
|
694
|
|
|||
|
Prepaid expenses and other current assets
|
655
|
|
378
|
|
|||
|
Total current assets
|
20,648
|
|
17,565
|
|
|||
|
Long-term investments
|
2,348
|
|
31
|
|
|||
|
Property and equipment, net
|
1,344
|
|
922
|
|
|||
|
Goodwill
|
4,069
|
|
3,189
|
|
|||
|
Intangible assets, net
|
358
|
|
156
|
|
|||
|
Other assets
|
114
|
|
54
|
|
|||
|
Total assets
|
$
|
28,881
|
|
$
|
21,917
|
|
|
|
LIABILITIES AND EQUITY
|
|||||||
|
Current liabilities:
|
|||||||
|
Accounts payable
|
$
|
145
|
|
$
|
115
|
|
|
|
Funds payable and amounts due to customers
|
12,261
|
|
10,612
|
|
|||
|
Notes and payables to eBay
|
—
|
|
1,093
|
|
|||
|
Accrued expenses and other current liabilities
|
1,179
|
|
1,434
|
|
|||
|
Income taxes payable
|
32
|
|
29
|
|
|||
|
Total current liabilities
|
13,617
|
|
13,283
|
|
|||
|
Deferred tax liability and other long-term liabilities
|
1,505
|
|
386
|
|
|||
|
Total liabilities
|
15,122
|
|
13,669
|
|
|||
|
Commitments and contingencies (Note 11)
|
|
|
|||||
|
Equity:
|
|||||||
|
Net parent investment
|
—
|
|
8,138
|
|
|||
|
Common stock, $0.0001 par value; 4,000 shares authorized; 1,224 and 1,218 outstanding
|
—
|
|
—
|
|
|||
|
Additional paid-in-capital
|
13,100
|
|
—
|
|
|||
|
Retained earnings
|
668
|
|
—
|
|
|||
|
Accumulated other comprehensive (loss) income
|
(9
|
)
|
110
|
|
|||
|
Total equity
|
13,759
|
|
8,248
|
|
|||
|
Total liabilities and equity
|
$
|
28,881
|
|
$
|
21,917
|
|
|
The accompanying notes are an integral part of these combined and consolidated financial statements.
60
PayPal Holdings, Inc.
|
|
Year Ended December 31,
|
||||||||||
|
|
2015
|
2014
|
2013
|
||||||||
|
|
(In millions)
|
||||||||||
|
Net revenues
|
$
|
9,248
|
|
$
|
8,025
|
|
$
|
6,727
|
|
||
|
Operating expenses:
|
|||||||||||
|
Transaction expense
|
2,610
|
|
2,170
|
|
1,835
|
|
|||||
|
Transaction and loan losses
|
809
|
|
646
|
|
502
|
|
|||||
|
Customer support and operations
|
1,220
|
|
1,055
|
|
950
|
|
|||||
|
Sales and marketing
|
985
|
|
998
|
|
791
|
|
|||||
|
Product development
|
947
|
|
890
|
|
727
|
|
|||||
|
General and administrative
|
560
|
|
482
|
|
378
|
|
|||||
|
Depreciation and amortization
|
608
|
|
516
|
|
453
|
|
|||||
|
Restructuring
|
48
|
|
—
|
|
—
|
|
|||||
|
Total operating expenses
|
7,787
|
|
6,757
|
|
5,636
|
|
|||||
|
Operating income
|
1,461
|
|
1,268
|
|
1,091
|
|
|||||
|
Other income (expense), net
|
27
|
|
(7
|
)
|
(7
|
)
|
|||||
|
Income before income taxes
|
1,488
|
|
1,261
|
|
1,084
|
|
|||||
|
Income tax expense
|
260
|
|
842
|
|
129
|
|
|||||
|
Net income
|
$
|
1,228
|
|
$
|
419
|
|
$
|
955
|
|
||
|
Net income per share:
|
|||||||||||
|
Basic
|
$
|
1.00
|
|
$
|
0.34
|
|
$
|
0.78
|
|
||
|
Diluted
|
$
|
1.00
|
|
$
|
0.34
|
|
$
|
0.78
|
|
||
|
Weighted average shares:
|
|||||||||||
|
Basic
|
1,222
|
|
1,218
|
|
1,218
|
|
|||||
|
Diluted
|
1,229
|
|
1,224
|
|
1,224
|
|
|||||
The accompanying notes are an integral part of these combined and consolidated financial statements.
61
PayPal Holdings, Inc.
COMBINED AND CONSOLIDATED STATEMENT OF COMPREHENSIVE INCOME
|
|
Year Ended December 31,
|
||||||||||
|
|
2015
|
2014
|
2013
|
||||||||
|
|
(In millions)
|
||||||||||
|
Net income
|
$
|
1,228
|
|
$
|
419
|
|
$
|
955
|
|
||
|
Other comprehensive income (loss), net of reclassification adjustments:
|
|||||||||||
|
Foreign currency translation
|
(37
|
)
|
(42
|
)
|
11
|
|
|||||
|
Unrealized losses on investments, net
|
(16
|
)
|
—
|
|
—
|
|
|||||
|
Tax benefit on unrealized losses on investments, net
|
3
|
|
—
|
|
—
|
|
|||||
|
Change in unrealized (losses) gains on hedging activities, net
|
(69
|
)
|
217
|
|
(45
|
)
|
|||||
|
Tax (expense) benefit on unrealized gains (losses) on hedging activities, net
|
—
|
|
(4
|
)
|
2
|
|
|||||
|
Other comprehensive (loss) income, net of tax
|
(119
|
)
|
171
|
|
(32
|
)
|
|||||
|
Comprehensive income
|
$
|
1,109
|
|
$
|
590
|
|
$
|
923
|
|
||
The accompanying notes are an integral part of these combined and consolidated financial statements.
62
PayPal Holdings, Inc.
COMBINED AND CONSOLIDATED STATEMENT OF EQUITY
|
Common Stock Shares
|
Additional Paid-In Capital
|
Net Parent Investment
|
Accumulated Other
Comprehensive Income
(Loss)
|
Retained Earnings
|
Total
Equity
|
|||||||||||||||||
|
|
(In millions)
|
|||||||||||||||||||||
|
Balances at December 31, 2012
|
—
|
|
$
|
—
|
|
$
|
6,210
|
|
$
|
(29
|
)
|
$
|
—
|
|
$
|
6,181
|
|
|||||
|
Net income
|
—
|
|
—
|
|
955
|
|
—
|
|
|
|
955
|
|
||||||||||
|
Net transfers from eBay
|
—
|
|
—
|
|
286
|
|
—
|
|
—
|
|
286
|
|
||||||||||
|
Foreign currency translation
|
—
|
|
—
|
|
—
|
|
11
|
|
—
|
|
11
|
|
||||||||||
|
Unrealized losses on hedging activities, net
|
—
|
|
—
|
|
—
|
|
(45
|
)
|
—
|
|
(45
|
)
|
||||||||||
|
Tax benefit on unrealized losses on hedging activities, net
|
—
|
|
—
|
|
—
|
|
2
|
|
—
|
|
$
|
2
|
|
|||||||||
|
Balances at December 31, 2013
|
—
|
|
$
|
—
|
|
$
|
7,451
|
|
$
|
(61
|
)
|
$
|
—
|
|
$
|
7,390
|
|
|||||
|
Net income
|
—
|
|
—
|
|
419
|
|
—
|
|
|
|
419
|
|
||||||||||
|
Net transfers from eBay
|
—
|
|
—
|
|
268
|
|
—
|
|
—
|
|
268
|
|
||||||||||
|
Foreign currency translation
|
—
|
|
—
|
|
—
|
|
(42
|
)
|
—
|
|
(42
|
)
|
||||||||||
|
Unrealized gains on hedging activities, net
|
—
|
|
—
|
|
—
|
|
217
|
|
—
|
|
217
|
|
||||||||||
|
Tax expense on unrealized gains on hedging activities, net
|
—
|
|
—
|
|
—
|
|
(4
|
)
|
—
|
|
(4
|
)
|
||||||||||
|
Balances at December 31, 2014
|
—
|
|
$
|
—
|
|
$
|
8,138
|
|
$
|
110
|
|
$
|
—
|
|
$
|
8,248
|
|
|||||
|
Net income
|
—
|
|
—
|
|
560
|
|
—
|
|
668
|
|
1,228
|
|
||||||||||
|
Net transfers from eBay
|
—
|
|
—
|
|
4,143
|
|
—
|
|
—
|
|
4,143
|
|
||||||||||
|
Foreign currency translation
|
—
|
|
—
|
|
—
|
|
(37
|
)
|
—
|
|
(37
|
)
|
||||||||||
|
Unrealized losses on investments, net
|
—
|
|
—
|
|
—
|
|
(16
|
)
|
—
|
|
(16
|
)
|
||||||||||
|
Tax benefit on unrealized losses on investments, net
|
—
|
|
—
|
|
—
|
|
3
|
|
—
|
|
3
|
|
||||||||||
|
Change in unrealized (losses) gains on hedging activities, net
|
—
|
|
—
|
|
—
|
|
(69
|
)
|
—
|
|
(69
|
)
|
||||||||||
|
Tax expense on unrealized gains on hedging activities, net
|
—
|
|
—
|
|
—
|
|
—
|
|
—
|
|
—
|
|
||||||||||
|
Common stock and stock-based awards issued and assumed
|
—
|
|
64
|
|
—
|
|
—
|
|
—
|
|
64
|
|
||||||||||
|
Stock-based compensation
|
—
|
|
185
|
|
—
|
|
—
|
|
—
|
|
185
|
|
||||||||||
|
Stock-based compensation tax impact
|
—
|
|
10
|
|
—
|
|
—
|
|
—
|
|
10
|
|
||||||||||
|
Reclassification of net parent investment in connection with separation
|
—
|
|
12,841
|
|
(12,841
|
)
|
—
|
|
—
|
|
$
|
—
|
|
|||||||||
|
Balances at December 31, 2015
|
—
|
|
$
|
13,100
|
|
$
|
—
|
|
$
|
(9
|
)
|
$
|
668
|
|
$
|
13,759
|
|
|||||
The accompanying notes are an integral part of these combined and consolidated financial statements.
63
PayPal Holdings, Inc.
|
|
Year Ended December 31,
|
||||||||||
|
|
2015
|
2014
|
2013
|
||||||||
|
|
(In millions)
|
||||||||||
|
Cash flows from operating activities:
|
|||||||||||
|
Net income
|
$
|
1,228
|
|
$
|
419
|
|
$
|
955
|
|
||
|
Adjustments:
|
|||||||||||
|
Transaction and loan losses
|
809
|
|
646
|
|
502
|
|
|||||
|
Depreciation and amortization
|
608
|
|
516
|
|
453
|
|
|||||
|
Stock-based compensation
|
346
|
|
299
|
|
253
|
|
|||||
|
Deferred income taxes
|
127
|
|
680
|
|
52
|
|
|||||
|
Excess tax benefits from stock-based compensation
|
(26
|
)
|
(41
|
)
|
(76
|
)
|
|||||
|
Gain on sale of principal loans receivable held for sale
|
(40
|
)
|
—
|
|
—
|
|
|||||
|
Changes in assets and liabilities:
|
|||||||||||
|
Accounts receivable
|
(22
|
)
|
(13
|
)
|
1
|
|
|||||
|
Receivable from eBay
|
121
|
|
(24
|
)
|
79
|
|
|||||
|
Principal loans receivable held for sale, net
|
14
|
|
—
|
|
—
|
|
|||||
|
Transaction loss allowance for cash losses, net
|
(493
|
)
|
(414
|
)
|
(304
|
)
|
|||||
|
Other current assets and non-current assets
|
(384
|
)
|
(38
|
)
|
(62
|
)
|
|||||
|
Accounts payable
|
12
|
|
42
|
|
(13
|
)
|
|||||
|
Payable to eBay
|
(217
|
)
|
(2
|
)
|
43
|
|
|||||
|
Income taxes payable
|
40
|
|
37
|
|
41
|
|
|||||
|
Other current liabilities and non-current liabilities
|
423
|
|
113
|
|
69
|
|
|||||
|
Net cash provided by operating activities
|
2,546
|
|
2,220
|
|
1,993
|
|
|||||
|
Cash flows from investing activities:
|
|||||||||||
|
Purchases of property and equipment
|
(722
|
)
|
(492
|
)
|
(391
|
)
|
|||||
|
Proceeds from sales of property and equipment
|
26
|
|
—
|
|
—
|
|
|||||
|
Changes in principal loans receivable, net
|
(819
|
)
|
(1,023
|
)
|
(793
|
)
|
|||||
|
Purchases of investments
|
(7,542
|
)
|
(76
|
)
|
(610
|
)
|
|||||
|
Maturities and sales of investments
|
3,318
|
|
409
|
|
320
|
|
|||||
|
Acquisitions, net of cash acquired
|
(1,225
|
)
|
(2
|
)
|
(731
|
)
|
|||||
|
Notes and receivable from eBay
|
575
|
|
(362
|
)
|
484
|
|
|||||
|
Net cash used in investing activities
|
(6,389
|
)
|
(1,546
|
)
|
(1,721
|
)
|
|||||
|
Cash flows from financing activities:
|
|||||||||||
|
Proceeds from issuance of common stock
|
75
|
|
—
|
|
—
|
|
|||||
|
Excess tax benefits from stock-based compensation
|
26
|
|
41
|
|
76
|
|
|||||
|
Contribution from (to) eBay
|
3,858
|
|
(71
|
)
|
(28
|
)
|
|||||
|
Tax withholdings related to net share settlements of restricted stock units and restricted stock awards
|
(18
|
)
|
—
|
|
—
|
|
|||||
|
Repayments borrowings under financing arrangements
|
(862
|
)
|
(21
|
)
|
(133
|
)
|
|||||
|
Funds receivable and customer accounts
|
(1,649
|
)
|
(1,335
|
)
|
(1,653
|
)
|
|||||
|
Funds payable and amounts due to customers
|
1,649
|
|
1,335
|
|
1,653
|
|
|||||
|
Net cash provided by (used in) financing activities
|
3,079
|
|
(51
|
)
|
(85
|
)
|
|||||
|
Effect of exchange rate changes on cash and cash equivalents
|
(44
|
)
|
(26
|
)
|
3
|
|
|||||
|
Net increase (decrease) in cash and cash equivalents
|
(808
|
)
|
597
|
|
190
|
|
|||||
|
Cash and cash equivalents at beginning of period
|
2,201
|
|
1,604
|
|
1,414
|
|
|||||
|
Cash and cash equivalents at end of period
|
$
|
1,393
|
|
$
|
2,201
|
|
$
|
1,604
|
|
||
64
PayPal Holdings, Inc.
COMBINED AND CONSOLIDATED STATEMENT OF CASH FLOWS—(Continued)
|
|
Year Ended December 31,
|
||||||||||
|
|
2015
|
2014
|
2013
|
||||||||
|
|
(In millions)
|
||||||||||
|
Supplemental cash flow disclosures:
|
|||||||||||
|
Cash paid for interest
|
$
|
16
|
|
$
|
19
|
|
$
|
14
|
|
||
|
Cash paid for income taxes
|
$
|
216
|
|
$
|
47
|
|
$
|
28
|
|
||
The accompanying notes are an integral part of these combined and consolidated financial statements.
65
NOTES TO COMBINED AND CONSOLIDATED FINANCIAL STATEMENTS
Overview and Organization
PayPal Holdings, Inc. ("PayPal", the "Company", "we", "us", or "our") was incorporated in Delaware in January 2015 and is a leading technology platform company that enables digital and mobile payments on behalf of consumers and merchants worldwide. We put our customers at the center of everything we do. We strive to increase our relevance for consumers, merchants, friends and family to access and move their money anywhere in the world, anytime, on any platform and through any device (e.g., mobile, tablets, personal computers or wearables). We provide safer and simpler ways for businesses of all sizes to accept payments from merchant websites, mobile devices and applications, and at offline retail locations through a wide range of payment solutions. We also facilitate person to person payments through PayPal, Venmo and Xoom (acquired in November 2015). Our combined payment solution capabilities, including our PayPal, PayPal Credit, Braintree, Venmo, and Xoom products, comprise our proprietary Payments Platform.
We operate globally in a rapidly evolving regulatory environment characterized by a heightened regulatory focus on all aspects of the payments industry. Government regulation impacts key aspects of our business, and we are subject to regulations that affect the payments industry in the many countries in which we operate. Changes in or non-compliance with laws and regulations, changes in the interpretation of laws and regulations, and the enactment of new laws and regulations applicable to us could have a material adverse impact on our business, results of operations and financial condition.
Significant Accounting Policies
Basis of Presentation and Principles of Combination and Consolidation
On July 17, 2015 (the "distribution date"), PayPal became an independent publicly-traded company through the pro rata distribution by eBay Inc. ("eBay") of
100%
of the outstanding common stock of PayPal to eBay stockholders (which we refer to as the "separation" or the "distribution"). Each eBay stockholder of record as of the close of business on July 8, 2015 received
one
share of PayPal common stock for every share of eBay common stock held on the record date. Approximately
1.2 billion
shares of PayPal common stock were distributed on July 17, 2015 to eBay stockholders. PayPal's common stock began "regular way" trading under the ticker symbol "PYPL" on The NASDAQ Stock Market on July 20, 2015.
Prior to the separation, eBay transferred substantially all of the assets and liabilities and operations of eBay's payments business to PayPal, which was completed in June 2015 (the "capitalization"). The combined financial statements prior to the capitalization were prepared on a stand-alone basis and were derived from eBay's consolidated financial statements and accounting records. The combined financial statements reflect our financial position, results of operations, comprehensive income and cash flows as our business was operated as part of eBay prior to the capitalization. Following the capitalization, the consolidated financial statements include the accounts of the Company and its wholly-owned subsidiaries. All periods presented have been accounted for in conformity with U.S. generally accepted accounting principles ("GAAP").
For periods prior to the capitalization, the combined financial statements include expenses associated with workplace resources and information technology that were previously allocated to the payments business of eBay, and additional expenses related to certain corporate functions, including senior management, legal, human resources and finance. These expenses also include allocations related to stock-based compensation. The expenses that were incurred by eBay were allocated to us based on direct usage or benefit where identifiable, with the remainder allocated on a pro rata basis of revenue, headcount, or other systematic measure. We consider the expense allocation methodology and results to be reasonable for all periods presented. The combined and consolidated financial statements also include certain assets and liabilities that were historically held at the eBay corporate level, but which are specifically identifiable and attributable to us. The combined and consolidated financial position, results of operations and cash flows of PayPal may not be indicative of our results had we been a separate stand-alone entity throughout the periods presented, nor are the results stated herein indicative of what the Company’s financial position, results of operations and cash flows may be in the future. All intercompany transactions and accounts have been eliminated. Transactions between the Company and eBay are included in these combined and consolidated financial statements for all periods presented.
The accompanying combined and consolidated financial statements include the financial statements of PayPal and our wholly and majority-owned subsidiaries. Investments in entities where we hold at least a 20% ownership interest and have the ability to exercise significant influence, but not control, over the investee are accounted for using the equity method of accounting. For such investments, our share of the investees’ results of operations is included in other income (expense), net and our investment balance is included in long-term investments on our combined and consolidated balance sheet. Investments in entities where we hold less
66
PayPal Holdings, Inc.
NOTES TO COMBINED AND CONSOLIDATED FINANCIAL STATEMENTS—(Continued)
than a 20% ownership interest are generally accounted for using the cost method of accounting, and our share of the investees’ results of operations is included in other income (expense), net in our combined and consolidated statement of income to the extent dividends are received and our investment balance is included in long-term investments on our combined and consolidated balance sheet.
In the opinion of management, these combined and consolidated financial statements reflect all adjustments, consisting only of normal recurring adjustments, which are necessary for fair presentation of the combined and consolidated financial statements for all periods presented. We have evaluated all subsequent events through the date the financial statements were issued. Certain amounts for prior years have been reclassified to conform to the financial statement presentation as of and for the year ended December 31, 2015.
Use of estimates
The preparation of combined and consolidated financial statements in conformity with GAAP requires management to make estimates and assumptions that affect the reported amounts of assets and liabilities and disclosure of contingent assets and liabilities at the date of the combined and consolidated financial statements and the reported amounts of revenues and expenses, including allocations from eBay, during the reporting period. On an ongoing basis, we evaluate our estimates, including but not limited to those related to provisions for transaction and loan losses, legal contingencies, income taxes, revenue recognition, and the valuation of goodwill and intangible assets. We base our estimates on historical experience and on various other assumptions which we believe to be reasonable under the circumstances. Actual results could differ from these estimates.
Cash and cash equivalents
Cash and cash equivalents are short-term, highly liquid investments with original maturities of three months or less when purchased and are comprised primarily of bank deposits, government and agency securities and commercial paper.
Investments
Short-term investments, which include time deposits, government and agency securities and corporate debt securities with original maturities of greater than three months but less than one year when purchased, are classified as available-for-sale and are reported at fair value using the specific identification method. Unrealized gains and losses are excluded from earnings and reported as a component of other comprehensive income (loss), net of related estimated tax provisions or benefits.
Long-term investments include corporate debt securities, equity method and cost method investments with maturities exceeding one year. Debt securities are classified as available-for-sale and are reported at fair value using the specific identification method. Unrealized gains and losses are excluded from earnings and reported as a component of other comprehensive income (loss), net of related estimated tax provisions or benefits.
We elect to account for certain assets underlying customer accounts, including foreign-currency denominated available-for-sale investments, under the fair value option. The changes in fair value related to initial measurement and subsequent changes in fair value are included in earnings as a component of other income (expense), net.
Our cost method investments consist of investments in privately held companies where we do not have the ability to exercise significant influence, or have control over the investee. These investments are recorded at cost and are subject to periodic tests for other-than-temporary impairment. Our equity method investments are investments in privately held companies where we have the ability to exercise significant influence, but not control, over the investee. Our proportionate share of the net income (loss) of our equity method investments is recognized on a one quarter lag as a component of other income (expense), net in our combined and consolidated statements of income. Our share of investees’ results of operations was not significant for any period presented.
We assess whether an other-than-temporary impairment loss on our investments has occurred due to declines in fair value or other market conditions. If any impairment is considered other-than-temporary, we will write down the investment to its fair value and record the corresponding charge through other income (expense), net in our combined and consolidated statements of income. With respect to our debt securities, this assessment takes into account the severity and duration of the decline in value, our intent to sell the security, whether it is more likely than not we will be required to sell the security before recovery of its amortized cost basis, and whether we expect to recover the entire amortized cost basis of the security (that is, whether a credit loss exists).
67
PayPal Holdings, Inc.
NOTES TO COMBINED AND CONSOLIDATED FINANCIAL STATEMENTS—(Continued)
Loans and interest receivable, net
Loans and interest receivable, net represents consumer receivables originated under PayPal Credit consumer accounts and working capital advances to certain small and medium-sized PayPal merchants through our PayPal Working Capital product. In the U.S., we work with independent chartered financial institutions that extend credit to the consumer or merchant using our PayPal credit products.
For our consumer credit products outside the U.S., we extend credit through our Luxembourg banking subsidiary. For our merchant credit products outside the U.S., we extend working capital advances in the U.K. through our Luxembourg banking subsidiary, and we extend working capital advances in Australia through an Australian subsidiary. We purchase the related receivables extended by the independent chartered financial institution and are responsible for servicing functions related to all of our credit products. As part of the arrangement with the independent chartered financial institution in the U.S. that we work with, we sell back a participation interest in the pool of consumer receivables outstanding under PayPal Credit consumer accounts. For this arrangement, we do not recognize gains or losses on the sale of the participation interest as the carrying amount of the participation interest sold approximates the fair value at time of transfer. However, we have a separate arrangement with certain investors under which we sell to these investors a participation interest in certain consumer loans receivable that we purchased, where the consideration received exceeded the carrying amount of the participation interest sold which resulted in a gain reflected as net revenues in our combined and consolidated financial statements. See “Note 9—Loans and Interest Receivable, net” for additional information related to this arrangement. We apply a control-oriented, financial-components approach and account for the asset transfer as a sale and derecognize the portion of the participation interest for which control has been surrendered.
Loans, advances and interest and fees receivable are reported at their outstanding principal balances, net of any participation interest sold and pro-rata allowances, including unamortized deferred origination costs and estimated collectible interest and fees. We maintain the servicing rights for the entire pool of consumer receivables outstanding and receive a fee approximating the fair value for servicing the assets underlying the participation interest sold.
The terms of our consumer relationships require us to submit monthly bills to the consumer detailing loan repayment requirements. The terms also allow us to charge the consumer interest and fees in certain circumstances. Due to the relatively small dollar amount of individual loans and interest receivable, we do not require collateral on these balances.
Allowance for loans and interest receivable
The allowance for loans and interest receivable represents management’s estimate of probable incurred losses inherent in our PayPal Credit portfolio of receivables. Increases to the allowance for loans receivable are reflected as transaction and loan losses in our combined and consolidated financial statements. The evaluation process to assess the adequacy of allowances is subject to numerous estimates and judgments, primarily forecasted principal balance delinquency rates (“roll rates”). Roll rates are the percentage of balances which we estimate will migrate from one stage of delinquency to the next based on our historical experience, as well as external factors such as estimated bankruptcies and levels of unemployment. Roll rates are applied to principal balances for each stage of delinquency, from current to
180
days past due, in order to estimate the principal loans and advances which have incurred losses and are probable to be charged off.
The determination of delinquency, from current to
180
days past due, for principal balances related to merchant working capital advances is based on the current expected repayment period of the advance and fixed fee as compared to the original expected repayment period. We calculate the repayment rate based on the merchant's expected future payment volume such that repayment of the advance and fixed fee is typically expected to occur within
9
to
12
months from the date of the advance. On a monthly basis, we recalculate the repayment period based on the actual repayment activity on the receivable. As such, actual repayment periods are dependent on actual payment processing volumes. See “Note 9—Loans and Interest Receivable, net” for additional information on the delinquency status of our PayPal Credit portfolio of receivables.
The allowance for loss against the interest and fees receivable is primarily determined by applying historical average customer account roll rates to the interest receivable balance in each stage of delinquency to project the value of accounts that have incurred losses and are probable to be charged off. Increases to the allowance for interest and fees receivable are reflected as a reduction of net revenues in our combined and consolidated financial statements.
We charge off consumer loan receivable balances in the month in which a customer balance becomes
180
days past due. We charge off the merchant receivable when the updated repayment period is
180
days past the original expected repayment period and the merchant has not repaid a minimum of
5%
of the original advance in the past 90 days.
68
PayPal Holdings, Inc.
NOTES TO COMBINED AND CONSOLIDATED FINANCIAL STATEMENTS—(Continued)
Bankrupt accounts are charged off within
60
days of receiving notification from the bankruptcy courts. Past due consumer loans receivable continue to accrue interest until such time as they are charged off. Charge-offs that are recovered are recorded as a reduction to our allowance for loans and interest receivable.
Customer accounts
We hold all customer balances (both in the U.S. and internationally) as direct claims against us which are reflected on our combined and consolidated balance sheet as a liability classified as amounts due to customers. Further, various jurisdictions where PayPal operates require us to hold eligible liquid assets, as defined by the regulators in these jurisdictions, equal to at least
100%
of the aggregate amount of all customer balances. Therefore, we use the assets underlying the customer balances to meet these regulatory requirements and separately classify the assets as customer accounts in our combined and consolidated balance sheets. We do not commingle the assets underlying the customer balances with corporate funds and separately maintain these assets in interest and non-interest bearing bank deposits, time deposits, corporate debt securities and U.S. and foreign government and agency securities. We classify the assets underlying the customer balances as current based on their purpose and availability to fulfill our direct obligation under amounts due to customers.
Funds receivable and funds payable
Funds receivable and funds payable arise due to the time required to initiate collection from and clear transactions through external payment networks. When customers fund their account using their bank account or a credit card or debit card, or withdraw funds from their PayPal account to their bank account or through a debit card transaction, there is a clearing period before the cash is received or settled, usually
one
to
three
business days for U.S. transactions and generally up to
five
business days for international transactions.
Allowance for negative customer balances
Negative customer balances occur primarily when there are insufficient funds in a customer’s PayPal account to cover charges applied for Automated Clearing House (“ACH”) returns, debit card transactions, chargebacks, nondelivery or unsatisfactory delivery of goods or services. Negative balances can be cured by the customer by adding funds to the account, receiving payments, or through back-up funding sources. We also utilize third party collection agents. For negative customer balances that are not expected to be cured or otherwise collected, we provide an allowance for uncollectible accounts. The allowance is estimated based on known facts and circumstances, internal factors including our experience with similar cases, and historical trends involving collection and write-off patterns. Negative customer balances are included in other current assets, net of the allowance. Adjustments to the allowance for negative customer balances are recorded as a component of transaction and loan loss. The allowance for negative customer balances was
$119 million
and
$118 million
at
December 31, 2015
and
2014
, respectively.
Property and equipment
Property and equipment consists primarily of computer equipment, software and website development costs, land and buildings and leasehold improvements. Property and equipment are stated at historical cost less accumulated depreciation. Depreciation and amortization are computed using the straight-line method over the estimated useful lives of the assets; generally,
one
to
three
years for computer equipment and software, including capitalized software and website development costs,
three
years for furniture and fixtures, up to
thirty
years for buildings and building improvements, and the shorter of
five
years or the term of the lease for leasehold improvements.
Goodwill and intangible assets
Goodwill is tested for impairment at a minimum on an annual basis. Goodwill is tested for impairment at the reporting unit level by first performing a qualitative assessment to determine whether it is more likely than not that the fair value of the reporting unit is less than its carrying value. If the reporting unit does not pass the qualitative assessment, then the reporting unit’s carrying value is compared to its fair value. The fair value of the reporting unit is estimated using income and market approaches. Goodwill is considered impaired if the carrying value of the reporting unit exceeds its fair value. The discounted cash flow method, a form of the income approach, uses expected future operating results and a market participant discount rate. The market approach uses comparable company prices and other relevant information generated by market transactions (either publicly traded entities or merger and acquisitions) to develop pricing metrics to be applied to historical and expected future operating results of the reporting unit. Failure to achieve these expected results, changes in the discount rate or market pricing metrics, may cause a future impairment of goodwill at the reporting unit. We conducted our annual impairment test of goodwill as of August 31, 2015 and 2014. We
69
PayPal Holdings, Inc.
NOTES TO COMBINED AND CONSOLIDATED FINANCIAL STATEMENTS—(Continued)
determined that no adjustment to the carrying value of goodwill of our reporting unit was required. As of December 31, 2015, we determined that no events or circumstances from August 31, 2015 through December 31, 2015 indicated that a further assessment was necessary.
Intangible assets consist of purchased partner relationships, technology and customer-related intangible assets, marketing related intangibles, developed technologies and other intangible assets, including patents and contractual agreements. Intangible assets are amortized over the period of estimated benefit using the straight-line method and estimated useful lives ranging from
one
to
eight
years. No significant residual value is estimated for intangible assets.
Impairment of long-lived assets
We evaluate long-lived assets (including intangible assets) for impairment whenever events or changes in circumstances indicate that the carrying amount of a long-lived asset may not be recoverable. An asset is considered impaired if its carrying amount exceeds the future net cash flow the asset is expected to generate.
Allowance for transaction losses
We are exposed to transaction losses due to credit card and other payment misuse as well as nonperformance of and credit losses from sellers who accept payments through PayPal. We establish an allowance for estimated losses arising from processing customer transactions, such as chargebacks for unauthorized credit card use and merchant-related chargebacks due to non-delivery of goods or services, ACH returns, buyer protection program claims, account takeovers, and debit card overdrafts. This allowance represents an accumulation of the estimated amounts necessary to provide for transaction losses incurred as of the reporting date, including those for which we have not yet identified. The allowance, which involves the use of actuarial techniques, is monitored monthly and is updated based on actual claims data reported by our claims processors and other actual data received. The allowance is based on known facts and circumstances, internal factors including experience with similar cases, historical trends involving loss payment patterns, and the mix of transaction and loss types. Additions to the allowance are reflected as transaction and loan losses in our combined and consolidated statements of income. At both December 31, 2015 and 2014, the allowance for transaction losses totaled
$66 million
and
$48 million
, respectively, and was included in accrued expenses and other current liabilities.
Derivative instruments
We have significant international revenues and costs denominated in foreign currencies, subjecting our operations to foreign currency risk. We enter into foreign currency exchange contracts that qualify as cash flow hedges, generally with maturities of
18
months or less, to reduce the volatility of cash flows primarily related to forecasted revenue denominated in certain foreign currencies. All outstanding derivatives are recognized on the balance sheet at fair value. The effective portion of the designated derivative’s gain or loss is initially reported as a component of accumulated other comprehensive income (loss) and is subsequently reclassified into the financial statement line item in which the hedged item is recorded in the period the forecasted transaction affects earnings.
We also hedge our economic exposure to foreign currency denominated monetary assets and liabilities with foreign currency contracts. The gains and losses on the foreign exchange contracts economically offset transaction gains and losses on certain foreign currency denominated monetary assets and liabilities recognized in earnings. Accordingly, these outstanding non-designated derivatives are recognized on the balance sheet at fair value and changes in fair value from these contracts are recorded in other income (expense), net in the combined and consolidated statement of income. Our hedging program is not designed or operated for trading or speculative purposes.
Our derivative instruments expose us to credit risk to the extent counterparties may be unable to meet the terms of the agreements. We seek to mitigate this risk by limiting counterparties to major financial institutions and by spreading the risk across several major financial institutions. In addition, the potential risk of loss with one counterparty resulting from this type of credit risk is monitored on an ongoing basis. See “Note 7—Derivative Instruments” for additional information related to the derivative instruments.
Fair value of financial instruments
Our financial assets and liabilities are valued using market prices on both active markets (Level 1) and less active markets (Level 2). Level 1 instrument valuations are obtained from real-time quotes for transactions in active exchange markets involving identical assets. Level 2 instrument valuations are obtained from readily available pricing sources for comparable instruments, identical
70
PayPal Holdings, Inc.
NOTES TO COMBINED AND CONSOLIDATED FINANCIAL STATEMENTS—(Continued)
instruments in less active markets, or models using market observable inputs. As of December 31, 2015, and 2014 we did not have any assets or liabilities requiring measurement at fair value without observable market values that would require a high level of judgment to determine fair value (Level 3). Our financial instruments, including cash, cash equivalents, accounts receivable, loans and interest receivable, funds receivable, certain customer accounts, accounts payable, and funds payable and amounts due to customers are carried at cost, which approximates their fair value due to the short-term maturity of these instruments.
Concentrations of risk
Our cash, cash equivalents, accounts receivable, loans and interest receivable, and funds receivable and customer accounts are potentially subject to concentration of credit risk. Cash, cash equivalents and customer accounts are placed with financial institutions that management believes are of high credit quality. In addition, funds receivable are generated primarily with financial institutions or credit card companies which management believes are of high credit quality. We invest our cash, cash equivalents and customer accounts primarily in highly liquid, highly rated instruments which are uninsured. From time to time, we may also have corporate deposit balances with financial services institutions which exceed the Federal Deposit Insurance Corporation (“FDIC”) insurance limit of $250,000. As part of our cash management process, we perform periodic evaluations of the relative credit standing of these financial institutions. Our accounts receivable are derived from revenue earned from customers located in the U.S. and internationally. Our loans and interest receivable are derived primarily from consumer financing activities for customers located in the U.S. As of
December 31, 2015
three
customers accounted for
19%
,
15%
and
13%
of net accounts receivables.
No
customer accounted for more than
10%
of net loans receivable as of December 31, 2015. As of
December 31, 2014
,
no
customer accounted for more than 10% of net accounts receivable and net loans receivable. During the years ended
December 31, 2015
,
2014
and
2013
,
no
customer accounted for more than 10% of net revenues. During the years ended
December 31, 2015
,
2014
and
2013
, we earned approximately
26%
,
29%
and
32%
of revenue from customers on eBay’s Marketplaces platform. No other source of revenue represented more than 10% of our revenue.
Revenue recognition
We earn net revenues primarily from fees charged to customers on the volume of activity processed through our Payments Platform. Net transaction revenues resulting from a payment processing transaction are recognized once the transaction is complete. Based on historical experience, specified credits are made at the time revenue is recognized and recorded as a reduction to revenue. In certain circumstances, we are required to record payments to a customer as a reduction to revenue. These payments to customers primarily originate from certain customer acquisition arrangements. Net revenues also include revenue earned from eBay and its subsidiaries for payment processing services.
We also earn net revenues from other value added services, including interest and fees earned on our PayPal Credit loans receivable portfolio, subscription fees, gateway fees, gain on sale of participation interest in certain consumer loans receivable, revenue share we earn through partnerships, interest earned on certain PayPal customer account balances, fees earned through our Paydiant products and other services that we provide to our consumers and merchants.
Interest and fees earned on the PayPal Credit portfolio of loans receivable are computed and recognized based on contractual interest and fee rates, and are net of any required reserves and amortization of deferred origination costs.
Net revenues earned from other value added services are recognized over the period services are performed and when amounts are deemed to be fixed or determinable.
Advertising expense
We expense the cost of producing advertisements at the time production occurs and expense the cost of communicating advertisements in the period during which the advertising space or airtime is used as sales and marketing expense. Internet advertising expenses are recognized based on the terms of the individual agreements, which is generally over the greater of the ratio of the number of impressions delivered over the total number of contracted impressions, on a pay-per-click basis, or on a straight-line basis over the term of the contract. Advertising expense totaled
$303 million
,
$272 million
and
$176 million
for the years ended
December 31, 2015
,
2014
, and
2013
, respectively.
Internal use software and website development costs
Direct costs incurred to develop software for internal use and website development costs are capitalized and amortized over an estimated useful life of
one
to
three
years and are recorded as depreciation and amortization. PayPal capitalized
$254 million
and
71
PayPal Holdings, Inc.
NOTES TO COMBINED AND CONSOLIDATED FINANCIAL STATEMENTS—(Continued)
$200 million
of internally developed software and website development costs for the years ended
December 31, 2015
and
2014
, respectively. Amortization expense for these capitalized costs was
$166 million
,
$129 million
and
$97 million
for the years ended
December 31, 2015
,
2014
and
2013
, respectively. Costs related to the maintenance of internal use software and website development costs are expensed as incurred.
Defined contribution savings plans
We have a defined contribution savings plan in the U.S. which qualifies under Section 401(k) of the Internal Revenue Code (the “Code”). Our non U.S. employees are covered by other savings plans. Expenses related to our defined contribution savings plans are recorded when services are rendered by our employees.
Stock-based compensation
Prior to the separation, our employees participated in eBay’s equity incentive plans, including stock options, restricted stock units and performance-based restricted stock units and the employee stock purchases made under eBay's employee stock purchase plan.
All awards granted under these plans consisted of eBay common shares. Our combined and consolidated statement of income reflected compensation expense for these stock-based plans associated with the portion of eBay's incentive plans in which our employees participated as well as an allocation of stock-based compensation
of certain employees of eBay who provided general and administrative services on our behalf.
Following separation, outstanding awards granted to PayPal employees under eBay's equity incentive plans were converted into PayPal awards under PayPal's equity incentive plans based on a conversion ratio. This conversion ratio was determined as the closing per-share price of eBay shares on the last regular trading session prior to separation divided by the opening per-share price of PayPal shares on the first regular trading session after separation. There was no significant incremental stock-based compensation expense recorded as a result of the share conversions.
For periods up to separation, we determine compensation expense associated with restricted stock units based on the fair value of eBay’s common stock on the date of grant. Following separation, we determine compensation expense associated with restricted stock units based on the fair value of our common stock on the date of grant. We determine compensation expense associated with stock options based on the estimated grant date fair value method using the Black-Scholes valuation model. We generally recognize compensation expense using a straight-line amortization method over the respective vesting period for awards that are ultimately expected to vest. Accordingly, stock-based compensation expense for
2015
,
2014
and
2013
has been reduced for estimated forfeitures. When estimating forfeitures, we consider voluntary termination behavior of our employees as well as trends of actual option forfeitures.
Foreign currency
Most of our foreign subsidiaries use the local currency of their respective countries as their functional currency. Assets and liabilities are translated at exchange rates prevailing at the balance sheet dates. Revenues, costs and expenses are translated into U.S. dollars using daily exchange rates. Gains and losses resulting from the translation of our combined balance sheet are recorded as a component of accumulated other comprehensive income.
Gains and losses from foreign currency transactions are recognized as other income (expense), net.
Income taxes
We account for income taxes using an asset and liability approach which requires the recognition of taxes payable or refundable for the current year and deferred tax liabilities and assets for the future tax consequences of events that have been recognized in the financial statements or tax returns. The measurement of current and deferred tax assets and liabilities is based on provisions of enacted tax laws; the effects of future changes in tax laws or rates are not anticipated. If necessary, the measurement of deferred tax assets is reduced by the amount of any tax benefits that are not expected to be realized based on available evidence. We report a liability for unrecognized tax benefits resulting from uncertain tax positions taken or expected to be taken in a tax return. We recognize interest and penalties, if any, related to unrecognized tax benefits in income tax expense.
72
PayPal Holdings, Inc.
NOTES TO COMBINED AND CONSOLIDATED FINANCIAL STATEMENTS—(Continued)
Net income per share
Basic net income per share is computed by dividing net income for the period by the weighted average number of common shares outstanding during the period. The weighted average number of common shares outstanding for basic and diluted earnings per share for the year ended December 31, 2015 was based on the number of common shares distributed on July 17, 2015 for periods prior to distribution and the weighted average number of common shares outstanding for the period beginning after the distribution date. The weighted average number of common shares outstanding for basic and diluted earnings per share for the years ended December 31, 2014 and 2013 was based on the number of shares of PayPal common stock outstanding on the distribution date. On July 17, 2015, the distribution date, eBay stockholders of record as of the close of business on July 8, 2015 received
one
share of PayPal common stock for every share of eBay common stock held as of the record date. Diluted net income per share is computed by dividing net income for the period by the weighted average number of shares of common stock and potentially dilutive common stock outstanding for the period. The dilutive effect of outstanding options and equity incentive awards is reflected in diluted net income per share by application of the treasury stock method. The calculation of diluted net income per share excludes all anti-dilutive common shares. The same number of shares was used to calculate diluted earnings per share for the years ended December 31, 2014 and 2013 since the
1.2 billion
shares that were distributed on the distribution date were not outstanding for those periods.
Recent Accounting Pronouncements
In 2014, the FASB issued new accounting guidance related to revenue recognition. This new standard will replace all current U.S. GAAP guidance on this topic and eliminate all industry-specific guidance. The new revenue recognition guidance provides a unified model to determine when and how revenue is recognized. The core principle is that a company should recognize revenue to depict the transfer of promised goods or services to customers in an amount that reflects the consideration for which the entity expects to be entitled in exchange for those goods or services. This guidance will be effective for fiscal years beginning after December 15, 2017 and can be applied either retrospectively to each period presented or as a cumulative-effect adjustment as of the date of adoption. We are evaluating the impact and approach to adopting this new accounting guidance on our financial statements.
In 2015, the FASB issued new guidance related to extraordinary and unusual items. The new standard eliminates the concept of extraordinary items from GAAP. The new standard is effective for fiscal years, and interim periods within those fiscal years, beginning after December 15, 2015. Early adoption is permitted. We may apply the standard prospectively or retrospectively to all periods presented. The adoption of this standard is not expected to have a material impact on our financial statements.
In 2015, the FASB issued new accounting guidance related to business combinations to simplify the accounting for adjustments made to provisional amounts recognized in a business combination. This amendment eliminates the requirement to retrospectively account for those adjustments. The new guidance is effective for fiscal years beginning after December 15, 2015, including interim periods within those fiscal years, beginning after December 15, 2015. The amendment should be applied prospectively to adjustments to provisional amounts that occur after the effective date of this amendment with earlier application permitted for financial statements that have not been issued. We do not anticipate this new accounting standard will have a material impact on our consolidated financial statements.
In 2015, the FASB issued new accounting guidance related to income taxes to simplify the presentation of deferred income taxes. This guidance requires that deferred tax liabilities and assets be classified as noncurrent in a classified statement of financial position. The amendment is effective for fiscal years, and interim periods within those fiscal years, beginning after December 15, 2016. Early application is permitted as of the beginning of an interim or annual reporting period. We have early adopted the FASB's new accounting guidance prospectively for the year ended December 31, 2015. The adoption of this new accounting guidance resulted in all deferred tax liabilities and assets to be classified as noncurrent on our consolidated balance sheet for the year ended December 31, 2015. See "Note 14—Income Taxes" for additional information related to our presentation of deferred income taxes.
In 2016, the FASB issued new accounting guidance related to the classification and measurement of financial instruments. This new standard makes limited amendments to the guidance in U.S. GAAP by requiring equity investments to be measured at fair value with changes in fair value recognized in net income. This new standard also amends the presentation of certain fair value changes for financial liabilities measured at fair value and it also amends certain disclosure requirements associated with the fair value of financial instruments. The new standard is effective for fiscal years, and interim periods within those fiscal years, beginning after December 15, 2017. Early adoption is permitted in limited situations. We are evaluating the impact and approach to adopting this new accounting guidance on our financial statements.
73
PayPal Holdings, Inc.
NOTES TO COMBINED AND CONSOLIDATED FINANCIAL STATEMENTS—(Continued)
The following table sets forth the computation of basic and diluted net income per share for the periods indicated:
|
|
Year Ended December 31,
|
||||||||||
|
|
2015
(2)
|
2014
(1)
|
|
2013
(1)
|
|||||||
|
Numerator:
|
|||||||||||
|
Net income
|
$
|
1,228
|
|
$
|
419
|
|
$
|
955
|
|
||
|
Denominator:
|
|||||||||||
|
Weighted average shares of common stock - basic
|
1,222
|
|
1,218
|
|
1,218
|
|
|||||
|
Dilutive effect of equity incentive awards
|
7
|
|
6
|
|
6
|
|
|||||
|
Weighted average shares of common stock - diluted
|
1,229
|
|
1,224
|
|
1,224
|
|
|||||
|
Net income per share:
|
|||||||||||
|
Basic
|
$
|
1.00
|
|
$
|
0.34
|
|
$
|
0.78
|
|
||
|
Diluted
|
$
|
1.00
|
|
$
|
0.34
|
|
$
|
0.78
|
|
||
|
Common stock equivalents excluded from income per diluted share because their effect would have been anti-dilutive
|
12
|
|
2
|
|
2
|
|
|||||
1
On July 17, 2015, the distribution date, eBay stockholders of record as of the close of business on July 8, 2015 received
one
share of PayPal common stock for every share of eBay common stock held as of the record date. Basic and diluted net income per share for the years ended December 31, 2014 and 2013 was calculated using the number of common shares distributed on July 17, 2015.
2
Basic and diluted net income per share for the year ended December 31, 2015 was calculated using the number of common shares distributed on July 17, 2015 for periods prior to distribution.
2015 Acquisition and Divestiture Activity
During 2015, we completed
four
acquisitions, reflecting
100%
of the equity interests of the acquired companies, for an aggregate amount of $
1.4 billion
:
Xoom
We completed the acquisition of Xoom Corporation in November 2015 by acquiring all of the outstanding shares of Xoom for
$25
per share in cash. We acquired Xoom to offer a broader range of services to our global customer base, increase customer engagement and accelerate our entrance into the international remittances markets. The total purchase price of
$1.1 billion
included cash consideration paid of approximately
$942 million
, net of cash acquired of
$92 million
, and the fair value of assumed unvested equity totaling
$7 million
. As of December 31, 2015 we are expecting to pay an additional
$19 million
of cash consideration for dissenting shares relating to stockholders who exercised their appraisal rights, which was recorded as a liability within "Accrued expenses and other current liabilities" on the consolidated balance sheet.
The following table summarizes the preliminary allocation of the purchase consideration to the fair value of the assets acquired and liabilities assumed:
|
(In Millions)
|
|||
|
Goodwill
|
$
|
655
|
|
|
Intangibles
|
217
|
|
|
|
Cash
|
92
|
|
|
|
Short-term investments
|
72
|
|
|
|
Accounts Receivable
|
40
|
|
|
|
Other net liabilities
|
(16
|
)
|
|
|
Total purchase consideration
|
$
|
1,060
|
|
74
PayPal Holdings, Inc.
NOTES TO COMBINED AND CONSOLIDATED FINANCIAL STATEMENTS—(Continued)
The intangibles acquired consists primarily of partner relationships, technology, trade name and customer-related intangible assets, with an estimated useful life of
2
to
5
years. The excess of the purchase consideration over the fair value of net tangible and identifiable intangible assets acquired was recorded as goodwill which is attributable to the workforce of Xoom and the synergies expected to arise from the acquisition. We do not expect goodwill to be deductible for income tax purposes. The allocation of the purchase price for this acquisition has been prepared on a preliminary basis and changes to the allocation may occur as additional information becomes available.
Paydiant
We completed the acquisition of Paydiant, Inc. ("Paydiant") in April 2015 for total consideration of approximately
$230 million
, net of cash acquired. We acquired Paydiant to expand our capabilities in mobile payments. The allocation of purchase consideration resulted in approximately
$49 million
of technology and customer-related intangible assets, net liabilities of approximately
$6 million
, and initial goodwill of approximately
$187 million
. We do not expect goodwill to be deductible for income tax purposes. The allocation of the purchase price for this acquisition has been prepared on a preliminary basis and changes to the allocation may occur as additional information becomes available.
CyActive
We completed the acquisition of CyActive Security, Ltd. ("CyActive") in April 2015 for total consideration of approximately
$43 million
, net of cash acquired. We acquired CyActive to further enhance our information security capabilities. The allocation of purchase consideration resulted in approximately
$8 million
of technology-related intangible assets, net liabilities of approximately
$2 million
, and initial goodwill of approximately
$37 million
. We do not expect goodwill to be deductible for income tax purposes. The allocation of the purchase price for this acquisition has been prepared on a preliminary basis and changes to the allocation may occur as additional information becomes available.
Other
During 2015, we completed
one
other acquisition for total consideration of approximately
$10 million
. The allocation of the purchase consideration resulted in approximately
$3 million
of purchased intangible assets and initial goodwill of approximately
$7 million
. We do not expect goodwill to be deductible for income tax purposes. The allocation of the purchase price for this acquisition has been prepared on a preliminary basis and changes to the allocation may occur as additional information becomes available.
We have included the financial results of these acquired businesses in our combined and consolidated financial statements from their respective dates of acquisition. Revenues and expenses related to these acquisitions for the year ended December 31, 2015 were not material. Pro forma results of operations have not been presented because the effect of these acquisitions were not material to our financial results.
2014 Acquisition and Divestiture Activity
There were
no
acquisitions or divestitures completed in 2014.
2013 Acquisition and Divestiture Activity
During 2013, we completed
three
acquisitions, reflecting
100%
of the equity interests of the acquired companies, for an aggregate amount of
$729 million
:
Braintree
We completed the acquisition of Braintree in December 2013. We acquired Braintree to accelerate PayPal’s growth in mobile payments for total consideration of approximately
$713 million
, consisting primarily of cash. The allocation of purchase consideration resulted in approximately
$126 million
of intangible assets, net liabilities of approximately
$16 million
, and initial goodwill of
$590 million
, which was adjusted by
$13 million
in 2014. We do not expect goodwill to be deductible for income tax purposes. We have included the financial results of Braintree in our combined and consolidated financial statements from the date of acquisition. Revenues and expenses related to Braintree for the period ending December 31, 2013 were not material.
75
PayPal Holdings, Inc.
NOTES TO COMBINED AND CONSOLIDATED FINANCIAL STATEMENTS—(Continued)
Other
We completed
two
other acquisitions during 2013 for aggregate purchase consideration of approximately
$16 million
, consisting primarily of cash. The allocation of the purchase consideration resulted in net liabilities of approximately
$1 million
, purchased intangible assets of approximately
$5 million
and goodwill of approximately
$12 million
. The combined and consolidated financial statements include the operating results of the acquired businesses since the respective dates of the acquisitions. Pro forma results of operations have not been presented because the effect of the acquisitions was not material to our financial results.
Goodwill
The following table presents goodwill balances and adjustments to those balances for the years ended
December 31, 2015
and
2014
:
|
December 31, 2013
|
Goodwill
Acquired
|
Adjustments/
Allocations
|
December 31, 2014
|
Goodwill
Acquired
|
Adjustments/
Allocations
|
December 31, 2015
|
|||||||||||||||||||||
|
|
(In millions)
|
||||||||||||||||||||||||||
|
Total Goodwill
|
$
|
3,187
|
|
$
|
—
|
|
$
|
2
|
|
$
|
3,189
|
|
$
|
886
|
|
$
|
(6
|
)
|
$
|
4,069
|
|
||||||
The goodwill acquired in 2015 was due primarily to our acquisitions. The adjustments to goodwill during 2015 relate to foreign exchange rate translations.
Intangible Assets
The components of identifiable intangible assets are as follows:
|
|
December 31, 2015
|
December 31, 2014
|
|||||||||||||||||||||||||
|
|
Gross
Carrying
Amount
|
Accumulated
Amortization
|
Net
Carrying
Amount
|
Weighted
Average
Useful
Life
(Years)
|
Gross
Carrying
Amount
|
Accumulated
Amortization
|
Net
Carrying
Amount
|
Weighted
Average
Useful
Life
(Years)
|
|||||||||||||||||||
|
|
(In millions, except years)
|
||||||||||||||||||||||||||
|
Intangible assets:
|
|||||||||||||||||||||||||||
|
Customer lists and user base
|
$
|
605
|
|
$
|
(501
|
)
|
$
|
104
|
|
4
|
$
|
520
|
|
$
|
(477
|
)
|
$
|
43
|
|
6
|
|||||||
|
Marketing related
|
197
|
|
(150
|
)
|
47
|
|
3
|
181
|
|
(117
|
)
|
64
|
|
3
|
|||||||||||||
|
Developed technologies
|
245
|
|
(176
|
)
|
69
|
|
3
|
167
|
|
(153
|
)
|
14
|
|
3
|
|||||||||||||
|
All other
|
243
|
|
(105
|
)
|
138
|
|
5
|
105
|
|
(70
|
)
|
35
|
|
5
|
|||||||||||||
|
Intangible assets, net
|
$
|
1,290
|
|
$
|
(932
|
)
|
$
|
358
|
|
$
|
973
|
|
$
|
(817
|
)
|
$
|
156
|
|
|||||||||
During the second and third quarters of 2015, eBay contributed intangible assets with a gross carrying amount of
$37 million
and a net book value of
$18 million
. All identifiable intangible assets are subject to amortization and no significant residual value is estimated for the intangible assets. Amortization expense for intangible assets was
$93 million
,
$84 million
and
$70 million
for the years ended
December 31, 2015, 2014 and 2013
, respectively.
76
PayPal Holdings, Inc.
NOTES TO COMBINED AND CONSOLIDATED FINANCIAL STATEMENTS—(Continued)
Expected future intangible asset amortization as of
December 31, 2015
is as follows (in millions):
|
Fiscal years:
|
|||
|
2016
|
$
|
151
|
|
|
2017
|
99
|
|
|
|
2018
|
68
|
|
|
|
2019
|
23
|
|
|
|
2020
|
17
|
|
|
|
Thereafter:
|
—
|
|
|
|
$
|
358
|
|
|
At
December 31, 2015
and
2014
, the estimated fair value of our short-term and long-term investments classified as available for sale was as follows:
|
|
December 31, 2015
|
||||||||||||||
|
|
Gross
Amortized
Cost
|
|
Gross
Unrealized
Gains
|
|
Gross
Unrealized
Losses
|
|
Estimated
Fair Value
|
||||||||
|
(In millions)
|
|||||||||||||||
|
Short-term investments
(1)(2)
:
|
|
|
|
||||||||||||
|
Corporate debt securities
|
2,000
|
|
—
|
|
(2
|
)
|
1,998
|
|
|||||||
|
Time deposits
|
2
|
|
|
—
|
|
|
—
|
|
|
2
|
|
||||
|
Long-term investments
(1)
:
|
|||||||||||||||
|
Corporate debt securities
|
2,328
|
|
—
|
|
(14
|
)
|
2,314
|
|
|||||||
|
Total
|
$
|
4,330
|
|
$
|
—
|
|
$
|
(16
|
)
|
$
|
4,314
|
|
|||
(1)
Excludes short-term restricted cash of
$18 million
and long-term restricted cash of
$8 million
.
(2)
Excludes funds receivable and customer accounts of
$12.3 billion
, of which
$5.3 billion
of customer account balances was invested primarily in government and agency securities and time deposits, and the remainder was held in cash and cash equivalents. The gross unrealized gains and losses associated with the short-term investments underlying customer account balances were not material for the periods presented.
The aggregate fair value of short-term and long-term investments in an unrealized loss position was
$4.3 billion
as of December 31, 2015. The aggregate gross unrealized loss on our short-term and long-term investments was
$16 million
as of December 31, 2015. We believe the decline in value is due to temporary market conditions and expect to recover the entire amortized cost basis of the securities. We neither intend nor anticipate the need to sell the securities before recovery. We continue to monitor the performance of the investment portfolio and assess market and interest rate risk when evaluating whether other-than-temporary impairment exists.
|
|
December 31, 2014
|
||||||||||||||
|
|
Gross
Amortized
Cost
|
Gross
Unrealized
Gains
|
Gross
Unrealized
Losses
|
Estimated
Fair Value
|
|||||||||||
|
|
(In millions)
|
||||||||||||||
|
Short-term investments
(1)
:
|
|||||||||||||||
|
Time Deposits
|
$
|
29
|
|
$
|
—
|
|
$
|
—
|
|
$
|
29
|
|
|||
(1)
Excludes funds receivable and customer accounts of
$10.6 billion
, of which
$4.2 billion
of customer account balances was invested primarily in government and agency securities and the remainder was held in cash and cash equivalents. The gross unrealized gains and losses associated with the short-term investments underlying customer account balances were not material for the periods presented.
In the third quarter, prior to separation, eBay contributed cash of
$16 million
that we intend to use to support our global sabbatical program. Balances used to support our global sabbatical program are presented as short-term restricted cash. In addition, in connection with the acquisition of Xoom, we recorded
$8 million
of long-term restricted cash in the fourth quarter of 2015. The balances are required as collateral by payment processors and for licensing rules in India.
77
PayPal Holdings, Inc.
NOTES TO COMBINED AND CONSOLIDATED FINANCIAL STATEMENTS—(Continued)
We had no material short-term or long-term investments that have been in a continuous unrealized loss position for greater than 12 months as of
December 31, 2015
and
2014
. No amounts were reclassified to earnings from unrealized gains and losses in
2015
and
2014
.
The estimated fair values of our short-term and long-term investments classified as available for sale by date of contractual maturity at
December 31, 2015
were as follows:
|
|
December 31, 2015
|
||
|
(In millions)
|
|||
|
One year or less
|
$
|
2,000
|
|
|
One year through two years
|
1,602
|
|
|
|
Two years through three years
|
518
|
|
|
|
Three years through four years
|
151
|
|
|
|
Four years through five years
|
38
|
|
|
|
Greater than five years
|
5
|
|
|
|
Total
(1)
|
$
|
4,314
|
|
(1)
Excludes
$5.3 billion
of customer account balances invested primarily in government and agency securities and time deposits, of which
$4.2 billion
had a contractual maturity of one year or less. We classify the assets underlying the customer accounts as current based on their purpose and availability to fulfill our direct obligations under amounts due to customers.
Equity and Cost Method Investments
We have made equity and cost method investments which are reported in long-term investments on our combined and consolidated balance sheet. As of
December 31, 2015
and
2014
, our equity and cost method investments totaled
$26 million
and
$31 million
, respectively.
Our financial assets and liabilities are valued using market prices on both active markets (Level 1) and less active markets (Level 2). Refer to “Note 1—Overview and Summary of Significant Accounting Policies” for additional information on how Level 1 and Level 2 instrument valuations are obtained.
The following table summarizes our financial assets and liabilities measured at fair value on a recurring basis as of
December 31, 2015
and
2014
:
78
PayPal Holdings, Inc.
NOTES TO COMBINED AND CONSOLIDATED FINANCIAL STATEMENTS—(Continued)
|
Description
|
Balances at
December 31, 2015 |
Quoted Prices in
Active Markets for
Identical Assets
(Level 1)
|
Significant Other
Observable Inputs
(Level 2)
|
||||||||
|
|
(In millions)
|
||||||||||
|
Assets:
|
|
|
|
||||||||
|
Cash and cash equivalents
|
$
|
1,393
|
|
$
|
987
|
|
$
|
406
|
|
||
|
Short-term investments:
|
|||||||||||
|
Restricted Cash
|
18
|
|
18
|
|
—
|
|
|||||
|
Corporate debt securities
|
1,998
|
|
—
|
|
1,998
|
|
|||||
|
Time deposits
|
2
|
|
—
|
|
2
|
|
|||||
|
Total short-term investments
|
$
|
2,018
|
|
$
|
18
|
|
$
|
2,000
|
|
||
|
Funds receivable and customer accounts
|
6,978
|
|
—
|
|
6,978
|
|
|||||
|
Derivatives
|
97
|
|
—
|
|
97
|
|
|||||
|
Long-term investments:
|
|||||||||||
|
Restricted Cash
|
8
|
|
8
|
|
—
|
|
|||||
|
Corporate debt securities
|
2,314
|
|
—
|
|
2,314
|
|
|||||
|
Total financial assets
|
$
|
12,808
|
|
$
|
1,013
|
|
$
|
11,795
|
|
||
|
Liabilities:
|
|||||||||||
|
Derivatives
|
$
|
25
|
|
$
|
—
|
|
$
|
25
|
|
||
|
Description
|
Balances at
December 31, 2014 |
Quoted Prices in
Active Markets for
Identical Assets
(Level 1)
|
Significant Other
Observable Inputs
(Level 2)
|
||||||||
|
|
(In millions)
|
||||||||||
|
Assets:
|
|||||||||||
|
Cash and cash equivalents
|
$
|
2,201
|
|
$
|
2,201
|
|
$
|
—
|
|
||
|
Short-term investments:
|
|||||||||||
|
Time Deposits
|
29
|
|
—
|
|
29
|
|
|||||
|
Total short-term investments
|
29
|
|
—
|
|
29
|
|
|||||
|
Funds receivable and customer accounts
|
4,161
|
|
—
|
|
4,161
|
|
|||||
|
Derivatives
|
135
|
|
—
|
|
135
|
|
|||||
|
Total financial assets
|
$
|
6,526
|
|
$
|
2,201
|
|
$
|
4,325
|
|
||
|
Liabilities:
|
|||||||||||
|
Derivatives
|
$
|
7
|
|
$
|
—
|
|
$
|
7
|
|
||
Our financial assets and liabilities are valued using market prices on both active markets (level 1) and less active markets (level 2). Level 1 instrument valuations are obtained from real-time quotes for transactions in active exchange markets involving identical assets. Level 2 instrument valuations are obtained from readily available pricing sources for comparable instruments, identical instruments in less active markets, or models using market observable inputs.
The majority of our derivative instruments are valued using pricing models that take into account the contract terms as well as multiple inputs where applicable, such as currency exchange rates, interest rate yield curves, option volatility and equity prices. Our derivative instruments are primarily short-term in nature, generally
one month
to
one year
in duration. Certain foreign currency contracts designated as cash flow hedges may have a duration of up to
18
months.
We did not have any transfers of financial instruments between valuation levels during
2015
or
2014
. As of
December 31, 2015
and
2014
we did not have any assets or liabilities requiring measurement at fair value without observable market values that would require a high level of judgment to determine fair value (Level 3).
79
PayPal Holdings, Inc.
NOTES TO COMBINED AND CONSOLIDATED FINANCIAL STATEMENTS—(Continued)
Cash and cash equivalents are short-term, highly liquid investments with original or remaining maturities of three months or less when purchased and are comprised primarily of bank deposits, government and agency securities and commercial paper. We had total funds receivable and customer accounts of
$12.3 billion
and
$10.6 billion
as of
December 31, 2015
and
2014
, respectively, of which
$5.3 billion
and
$4.2 billion
, respectively, was invested primarily in short-term investments. We elect to account for certain customer accounts, including foreign-currency denominated available-for-sale investments, under the fair value option. Election of the fair value option allows us to significantly reduce the accounting asymmetry that would otherwise arise when recognizing foreign exchange gains and losses relating to available-for-sale investments and the corresponding customer liabilities. Fair value changes related to customer accounts accounted for under the fair value option are recognized in other income (expense), net, and were immaterial for all periods presented.
Summary of Derivative Instruments
Our primary objective in holding derivatives is to reduce the volatility of earnings and cash flows associated with changes in foreign currency exchange rates. Our derivatives expose us to credit risk to the extent that our counterparties may be unable to meet the terms of the arrangement. We seek to mitigate such risk by limiting our counterparties to, and by spreading the risk across, major financial institutions. In addition, the potential risk of loss with any one counterparty resulting from this type of credit risk is monitored on an ongoing basis.
Foreign Exchange Contracts
We transact business in various foreign currencies and have significant international revenues as well as costs denominated in foreign currencies, which subjects us to foreign currency risk. We have a foreign currency exposure management program whereby we designate certain foreign currency exchange contracts, generally with maturities of
18
months or less, to reduce the volatility of cash flows primarily related to forecasted revenues and expenses denominated in foreign currencies. The objective of the foreign exchange contracts is to help mitigate the risk that the U.S. dollar-equivalent cash flows are adversely affected by changes in the applicable U.S. dollar/foreign currency exchange rate. These derivative instruments are designated as cash flow hedges and accordingly, the effective portion of the derivative’s gain or loss is initially reported as a component of accumulated other comprehensive income (loss) and subsequently reclassified into earnings in the same period the forecasted transaction affects earnings. The ineffective portion of the unrealized gains and losses on these contracts, if any, is recorded immediately in earnings. We evaluate the effectiveness of our foreign exchange contracts on a quarterly basis by comparing the change in the fair value of the derivative instruments with the change in the fair value of the forecasted cash flows of the hedged item. We do not use any foreign exchange contracts for trading or speculative purposes.
For our derivative instruments designated as cash flow hedges, the amounts recognized in earnings related to the ineffective portion were not material in each of the periods presented, and we did not exclude any component of the changes in fair value of the derivative instruments from the assessment of hedge effectiveness. During the years ended December 31, 2015, 2014 and 2013 we did not discontinue any cash flow hedges because it was probable that the original forecasted transaction would not occur and as such, did not reclassify any gains or losses to earnings. As of
December 31, 2015
, we estimated that
$52 million
of net derivative gains related to our cash flow hedges included in accumulated other comprehensive income will be reclassified into earnings within the next 12 months.
We have an additional foreign exchange management program whereby we use foreign exchange contracts to offset the foreign exchange risk on our assets and liabilities denominated in currencies other than the functional currency of our subsidiaries. These contracts are not designated as hedging instruments and reduce, but do not entirely eliminate, the impact of currency exchange rate movements on our assets and liabilities. The foreign currency gains and losses on our assets and liabilities are recorded in “Other income (expense), net,” which are offset by the gains and losses on the foreign exchange contracts
80
PayPal Holdings, Inc.
NOTES TO COMBINED AND CONSOLIDATED FINANCIAL STATEMENTS—(Continued)
Fair Value of Derivative Contracts
The fair value of our outstanding derivative instruments as of
December 31, 2015
and
2014
was as follows:
|
Balance Sheet Location
|
December 31, 2015
|
December 31, 2014
|
|||||||
|
|
|
(In millions)
|
|||||||
|
Derivative Assets:
|
|||||||||
|
Foreign exchange contracts designated as cash flow hedges
|
Other Current Assets
|
$
|
59
|
|
$
|
128
|
|
||
|
Foreign exchange contracts not designated as hedging instruments
|
Other Current Assets
|
38
|
|
7
|
|
||||
|
Total derivative assets
|
$
|
97
|
|
$
|
135
|
|
|||
|
Derivative Liabilities:
|
|||||||||
|
Foreign exchange contracts designated as cash flow hedges
|
Other Current Liabilities
|
$
|
2
|
|
$
|
2
|
|
||
|
Foreign exchange contracts not designated as hedging instruments
|
Other Current Liabilities
|
23
|
|
5
|
|
||||
|
Total derivative liabilities
|
$
|
25
|
|
$
|
7
|
|
|||
|
Total fair value of derivative instruments
|
$
|
72
|
|
$
|
128
|
|
|||
Under the master netting agreements with the respective counterparties to our foreign exchange contracts, subject to applicable requirements, we are allowed to net settle transactions of the same type with a single net amount payable by one party to the other. However, we have elected to present the derivative assets and derivative liabilities on a gross basis in our balance sheet. As of
December 31, 2015
, the potential effect of rights of set-off associated with our foreign exchange contracts would be an offset to both assets and liabilities by
$25 million
, resulting in net derivative assets of
$72 million
. We are not required to pledge, nor are we entitled to receive cash collateral related to these derivative transactions.
Effect of Derivative Contracts on Accumulated Other Comprehensive Income
The following tables summarize the activity of derivative contracts that qualify for hedge accounting as of
December 31, 2015
and
2014
, and the impact of designated derivative instruments on accumulated other comprehensive income for the years ended
December 31, 2015
and
2014
:
|
December 31, 2014
|
Amount of gain (loss)
recognized in other
comprehensive income
(effective portion)
|
Amount of gain (loss)
reclassified from
accumulated other
comprehensive income
to net revenue
(effective portion)
|
December 31, 2015
|
||||||||||
|
|
(In millions)
|
||||||||||||
|
Foreign exchange contracts designated as cash flow hedges
|
$
|
126
|
|
113
|
|
182
|
|
$
|
57
|
|
|||
|
December 31, 2013
|
Amount of gain (loss)
recognized in other
comprehensive income
(effective portion)
|
Amount of gain (loss)
reclassified from
accumulated other
comprehensive income
to net revenue
(effective portion)
|
December 31, 2014
|
||||||||||
|
|
(In millions)
|
||||||||||||
|
Foreign exchange contracts designated as cash flow hedges
|
$
|
(91
|
)
|
181
|
|
(36
|
)
|
$
|
126
|
|
|||
81
PayPal Holdings, Inc.
NOTES TO COMBINED AND CONSOLIDATED FINANCIAL STATEMENTS—(Continued)
Effect of Derivative Contracts on Combined and Consolidated Statements of Income
The following table provides the location in the financial statements of the recognized gains or losses related to our derivative instruments:
|
|
Year Ended December 31,
|
||||||||||
|
|
2015
|
2014
|
2013
|
||||||||
|
|
(In millions)
|
||||||||||
|
Foreign exchange contracts designated as cash flow hedges recognized in net revenues
|
$
|
182
|
|
$
|
(36
|
)
|
$
|
(4
|
)
|
||
|
Foreign exchange contracts not designated as cash flow hedges recognized in other income (expense), net
|
17
|
|
(2
|
)
|
3
|
|
|||||
|
Total gain (loss) recognized from derivative contracts in the combined statement of income
|
$
|
199
|
|
$
|
(38
|
)
|
$
|
(1
|
)
|
||
Notional Amounts of Derivative Contracts
Derivative transactions are measured in terms of the notional amount, but this amount is not recorded on the balance sheet and is not, when viewed in isolation, a meaningful measure of the risk profile of the derivative instruments. The notional amount is generally not exchanged, but is used only as the basis on which the value of foreign exchange payments under these contracts is determined. The following table provides the notional amounts of our outstanding derivatives:
|
|
December 31,
|
||||||
|
|
2015
|
2014
|
|||||
|
|
(In millions)
|
||||||
|
Foreign exchange contracts designated as cash flow hedges
|
$
|
1,688
|
|
$
|
1,598
|
|
|
|
Foreign exchange contracts not designated as hedging instruments
|
2,802
|
|
642
|
|
|||
|
Total
|
$
|
4,490
|
|
$
|
2,240
|
|
|
|
|
As of December 31,
|
||||||
|
2015
|
2014
|
||||||
|
(In millions)
|
|||||||
|
Property and equipment, net:
|
|||||||
|
Computer equipment
|
$
|
1,818
|
|
$
|
1,446
|
|
|
|
Software & website development costs
|
1,150
|
|
832
|
|
|||
|
Land and buildings
|
352
|
|
162
|
|
|||
|
Building improvements
|
297
|
|
186
|
|
|||
|
Furniture and fixtures
|
99
|
|
72
|
|
|||
|
Development in progress and other
|
133
|
|
164
|
|
|||
|
3,849
|
|
2,862
|
|
||||
|
Accumulated depreciation
|
(2,505
|
)
|
(1,940
|
)
|
|||
|
$
|
1,344
|
|
$
|
922
|
|
||
During the second and third quarters of 2015, eBay contributed property and equipment with a gross carrying amount of
$355 million
and a net book value of
$224 million
. Additionally, we sold certain property and equipment to eBay with a gross carrying amount of
$63 million
and a net book value of
$15 million
for proceeds of approximately
$26 million
. The proceeds in excess of net book value were recorded as a contribution from eBay and resulted in an increase to net parent investment within stockholders' equity.
Depreciation expense was
$515 million
in
2015
,
$432 million
in
2014
and
$383 million
in
2013
.
82
PayPal Holdings, Inc.
NOTES TO COMBINED AND CONSOLIDATED FINANCIAL STATEMENTS—(Continued)
We offer credit products to consumers who choose PayPal Credit as their funding source at checkout and working capital advances to certain small and medium-sized PayPal merchants through our PayPal Working Capital product. In the U.S., we work with independent chartered financial institutions that extend credit to the consumer or merchant using our credit products. For our consumer credit products outside the U.S., we extend credit through our Luxembourg banking subsidiary. For our merchant credit products outside the U.S., we extend working capital advances in the U.K. through our Luxembourg banking subsidiary, and we extend working capital advances in Australia through an Australian subsidiary. We purchase the related receivables extended by the independent chartered financial institutions and are responsible for servicing functions related to all our credit products. During the
year ended
December 31, 2015
and
2014
, we purchased approximately
$7.4 billion
and
$5.6 billion
, respectively, in credit receivables. As part of the arrangement with an independent chartered financial institution in the U.S. that we work with, and an additional arrangement with certain investors, we sell back a participation interest in the pool of consumer receivables outstanding under PayPal Credit consumer accounts. In addition, we have a separate arrangement with certain investors under which we sell to these investors a participation interest in certain consumer loans receivable that we purchased, where the consideration received exceeded the carrying amount of the participation interest sold, which resulted in a gain of
$40 million
reflected as net revenues in our combined and consolidated financial statements in 2015. Loans, advances and interest and fees receivable are reported at their outstanding principal balances, net of any participation interest sold and pro-rata allowances, including unamortized deferred origination costs and estimated collectible interest and fees.
Consumer receivables
As discussed above, in the second quarter of 2015, we completed an arrangement with certain investors under which we sold participation interests in certain consumer loans receivable originated using our PayPal Credit products with a gross book value of approximately
$708 million
. As a result of the arrangement, the impact to net revenues from other value added services during 2015 was a net decrease of
$35 million
due to a reduction in net revenues earned from interest and fees on the participation interests sold partially offset by the gain recognized in net revenues from other value added services on the sale of the participation interest (inclusive of the gain of
$26 million
recognized on the initial sale of approximately
$708 million
in certain consumer loans receivable) and servicing fee recognized approximating the fair value for servicing the assets underlying the participation interest sold.
As of
December 31, 2015
, the total outstanding balance in our pool of consumer receivables was
$4.0 billion
, net of participation interest sold to the independent chartered financial institution and other investors of
$950 million
. As of
December 31, 2014
, the total outstanding balance in our pool of consumer receivables was
$3.7 billion
net of participation interest sold to the independent chartered financial institution and other investors of
$163 million
.The independent chartered financial institution and other investors have no recourse related to their participation interests for failure of debtors to pay when due. The participation interests held by the chartered financial institution and other investors have the same priority to the interests held by us and are subject to the same credit, prepayment, and interest rate risk associated with this pool of consumer receivables. All risks of loss are shared equally amongst all participating stakeholders.
We use a consumer's FICO score, where available, among other measures, in evaluating the credit quality of our PayPal Credit U.S. consumer receivables. A FICO score is a type of credit score that lenders use to assess an applicant's credit risk and whether to extend credit. Individual FICO scores generally are obtained each quarter the U.S. consumer has an outstanding consumer receivable owned by PayPal Credit. The weighted average U.S. consumer FICO scores related to our loans and interest receivable balance outstanding at
December 31, 2015
and
2014
were
686
and
687
, respectively.
As of
December 31, 2015
and
2014
, approximately
53.6%
and
54.2%
, respectively, of the pool of U.S. consumer receivables and interest receivable balance was due from U.S. consumers with FICO scores greater than
680
, which are generally considered "prime" by the consumer credit industry. As of
December 31, 2015
and
2014
, approximately
9.4%
and
9.3%
, respectively, of the pool of U.S. consumer receivables and interest receivable balance was due from U.S. customers with FICO scores below
599
. As of
December 31, 2015
and
2014
, approximately
90.1%
and
89.9%
, respectively, of the portfolio of consumer receivables and interest receivable was current.
83
PayPal Holdings, Inc.
NOTES TO COMBINED AND CONSOLIDATED FINANCIAL STATEMENTS—(Continued)
The following table presents the principal amount of U.S. consumer loans and interest receivable segmented by a FICO score range:
|
|
As of December 31,
|
||||||
|
2015
|
2014
|
||||||
|
(In millions)
|
|||||||
|
> 760
|
$
|
569
|
|
$
|
553
|
|
|
|
680-759
|
1,529
|
|
1,439
|
|
|||
|
600-679
|
1,449
|
|
1,344
|
|
|||
|
< 599
|
369
|
|
341
|
|
|||
|
Total
|
$
|
3,916
|
|
|
$
|
3,677
|
|
The table above excludes certain outstanding consumer loans outside of the U.S., for which no FICO scores are available, with an outstanding balance of
$70 million
and
$8 million
at
December 31, 2015
and
2014
, respectively.
The following tables present the delinquency status of the U.S. and international principal amount of loans and interest receivable:
|
December 31, 2015
|
|||||||||||||||
|
(In millions)
|
|||||||||||||||
|
Current
|
30-59 Days
Past Due
|
60-89 Days
Past Due
|
90-180 Days
Past Due
|
Total Past
Due
|
Total Consumer Receivables
|
||||||||||
|
3,593
|
172
|
|
66
|
|
155
|
|
393
|
|
3,986
|
|
|||||
|
December 31, 2014
|
|||||||||||||||
|
(In millions)
|
|||||||||||||||
|
Current
|
30-59 Days
Past Due
|
60-89 Days
Past Due
|
90-180 Days
Past Due
|
Total Past
Due
|
Total Consumer Receivables
|
||||||||||
|
3,311
|
163
|
|
62
|
|
149
|
|
374
|
|
3,685
|
|
|||||
We charge off consumer loan receivable balances in the month in which a customer balance becomes
180
days past due. Bankrupt accounts are charged off
60
days after receipt of notification of bankruptcy. Past due loans receivable continue to accrue interest until such time they are charged off. We record an allowance for loss against the interest and fees receivable.
The following table summarizes the activity in the allowance for consumer loans and interest receivable, net of participation interest sold for the period indicated:
|
2015
|
2014
|
||||||
|
|
(In millions)
|
||||||
|
Balance as of January 1
|
$
|
188
|
|
$
|
145
|
|
|
|
Transfer attributed to participation interest sold
|
(22
|
)
|
|||||
|
Charge-offs
|
(335
|
)
|
(309
|
)
|
|||
|
Recoveries
|
24
|
|
28
|
|
|||
|
Provisions
|
356
|
|
324
|
|
|||
|
Balance as of December 31
|
$
|
211
|
|
$
|
188
|
|
|
Merchant receivables
We offer credit products to certain existing small and medium-sized merchants through our PayPal Working Capital product. We closely monitor credit quality for all working capital advances that we extend or purchase through that product to manage and evaluate our related exposure to credit risk. To assess a merchant seeking a PayPal Working Capital advance, we use, among other indicators, a risk model that we have internally developed that we refer to as our PayPal Working Capital Risk Model (“PRM”), as a credit quality indicator to help predict the merchant's ability to repay the principal balance and fixed fee related to the working
84
PayPal Holdings, Inc.
NOTES TO COMBINED AND CONSOLIDATED FINANCIAL STATEMENTS—(Continued)
capital advance. The PRM uses multiple variables as predictors of the merchant's ability to repay a working capital advance. Drivers of the model include the merchant's annual payment volume and payment processing history with PayPal, prior repayment history with the PayPal Working Capital product, and other measures. Merchants are assigned a PRM credit score within the range of
350
to
750
. We generally expect that merchants to which we extend a working capital advance will have PRM scores greater than
525
. We generally consider scores above
610
to be very good and to pose limited credit risk. We assess a participating merchant’s PRM score on a recurring basis for all outstanding working capital advances owned by PayPal. At
December 31, 2015
and
2014
, the weighted average PRM score related to our PayPal Working Capital balances outstanding was
630
and
622
, respectively.
The following table presents the principal amount of PayPal Working Capital advances and fees receivable segmented by our internal PRM score range:
|
December 31, 2015
|
|
December 31, 2014
|
|||||
|
(In millions)
|
|||||||
|
> 630
|
$
|
255
|
|
$
|
58
|
|
|
|
566-629
|
94
|
|
23
|
|
|||
|
<565
|
72
|
|
22
|
|
|||
|
Total
|
$
|
421
|
|
$
|
103
|
|
|
Through our PayPal Working Capital product, merchants can borrow a certain percentage of their annual payment volume processed by PayPal and are charged a fixed fee for the advance, which approximates an Annual Percentage Rate ("APR") based on the overall credit assessment of the merchant. Advances are repaid through a fixed percentage of the merchant's future payment volume that PayPal processes. The fee is fixed at the time the advance is extended and we estimate the repayment period based on PayPal's payment processing history with the merchant. There is no stated interest rate and there is a general requirement that at least
10%
of the original amount advanced plus the fixed fee must be repaid every 90 days. We generally calculate the repayment rate of the merchant's future payment volume so that repayment of the advance and fixed fee is expected to occur within
9
to
12
months from the date of the advance. On a monthly basis, we recalculate the repayment period based on the repayment activity on the receivable. As such, actual repayment periods are dependent on actual payment processing volumes. We monitor receivables with repayment periods greater than the original expected repayment period. We charge off the receivable when the updated repayment period is
180
days past the original expected repayment period and the merchant has not repaid a minimum of
5%
of the original advance in the past 90 days. The total PayPal Working Capital advances and fees receivable outstanding as of
December 31, 2015
and
2014
were approximately
$421 million
and
$103 million
, respectively.
The following tables present the current repayment periods of the principal amount of PayPal Working Capital advances and fees receivable as compared to their original expected repayment period:
|
December 31, 2015
|
||||||||||||||||||||||||||
|
(In millions)
|
||||||||||||||||||||||||||
|
Within Original Period
|
30 - 59 Days Greater
|
60 - 89 Days Greater
|
90 - 180 Days Greater
|
180+ Days with minimum payment in last 90 days
|
Total Past Original Expected Repayment
|
Total Merchant Receivables
|
||||||||||||||||||||
|
$
|
326
|
|
$
|
47
|
|
$
|
21
|
|
$
|
24
|
|
$
|
3
|
|
$
|
95
|
|
$
|
421
|
|
||||||
|
December 31, 2014
|
||||||||||||||||||||||||||
|
(In millions)
|
||||||||||||||||||||||||||
|
Within Original Period
|
30 - 59 Days Greater
|
60 - 89 Days Greater
|
90 - 180 Days Greater
|
180+ Days with minimum payment in last 90 days
|
Total Past Original Expected Repayment
|
Total Merchant Receivables
|
||||||||||||||||||||
|
$
|
79
|
|
$
|
10
|
|
$
|
5
|
|
$
|
7
|
|
$
|
2
|
|
$
|
24
|
|
$
|
103
|
|
||||||
85
PayPal Holdings, Inc.
NOTES TO COMBINED AND CONSOLIDATED FINANCIAL STATEMENTS—(Continued)
The following table summarizes the activity in the allowance for PayPal Working Capital advances and fees receivable, for the period indicated:
|
Year Ended December 31,
|
|||||||
|
2015
|
|
2014
|
|||||
|
(In millions)
|
|||||||
|
Balance as of January 1
|
$
|
7
|
|
$
|
1
|
|
|
|
Provisions
|
29
|
|
9
|
|
|||
|
Charge-offs
|
(16
|
)
|
(3
|
)
|
|||
|
Recoveries
|
2
|
|
—
|
|
|||
|
Balance as of December 31
|
$
|
22
|
|
$
|
7
|
|
|
We determine operating segments based on how our chief operating decision maker manages the business, including making operating decisions, deciding how to allocate resources and evaluating operating performance. Our chief operating decision-maker is our Chief Executive Officer who reviews our operating results on a consolidated basis. We operate in
one
segment and have
one
reportable segment.
The following tables summarize the allocation of net revenues and long-lived assets based on geography:
|
|
Year Ended December 31,
|
||||||||||
|
|
2015
|
2014
|
2013
|
||||||||
|
|
(In millions)
|
||||||||||
|
Net revenues:
|
|||||||||||
|
U.S.
|
$
|
4,640
|
|
$
|
3,877
|
|
$
|
3,240
|
|
||
|
United Kingdom
|
1,191
|
|
1,155
|
|
949
|
|
|||||
|
Other Countries
|
3,417
|
|
2,993
|
|
2,538
|
|
|||||
|
Total net revenues
|
$
|
9,248
|
|
$
|
8,025
|
|
$
|
6,727
|
|
||
|
|
December 31,
|
||||||
|
|
2015
|
2014
|
|||||
|
|
(In millions)
|
||||||
|
Long-lived assets:
|
|||||||
|
U.S.
|
$
|
1,256
|
|
$
|
846
|
|
|
|
Other Countries
|
88
|
|
76
|
|
|||
|
Total long-lived assets
|
$
|
1,344
|
|
$
|
922
|
|
|
Net revenues are attributed to U.S., UK and other countries primarily based upon the country in which the merchant is located, or in the case of a cross border transaction, may be earned from the countries in which the consumer and the merchant respectively reside. Net revenues earned from value added services are typically attributed to the country in which either the consumer or the merchant reside. Tangible long-lived assets for the years ended
December 31, 2015
,
2014
consisted of property and equipment. Long-lived assets attributed to the U.S. and other countries are based upon the country in which the asset is located or owned.
86
PayPal Holdings, Inc.
NOTES TO COMBINED AND CONSOLIDATED FINANCIAL STATEMENTS—(Continued)
Information regarding net revenues by major products and services for the years ended
December 31, 2015
,
2014
and
2013
was as follows:
|
|
Year Ended December 31,
|
||||||||||
|
|
2015
|
|
2014
|
2013
|
|||||||
|
(In millions)
|
|||||||||||
|
Transaction revenues
|
$
|
8,128
|
|
$
|
7,107
|
|
$
|
5,992
|
|
||
|
Other value added services:
|
1,120
|
|
918
|
|
735
|
|
|||||
|
Total net revenues
|
$
|
9,248
|
|
$
|
8,025
|
|
$
|
6,727
|
|
||
Commitments
As of
December 31, 2015
, approximately
$24.8 billion
of unused credit was available to PayPal Credit account holders. While this amount represents the total unused credit available, we have not experienced, and do not anticipate, that all of our PayPal Credit account holders will access their entire available credit at any given point in time. In addition, the individual lines of credit that make up this unused credit are subject to periodic review and termination by the chartered financial institution that is the issuer of PayPal Credit products based on, among other things, account usage and customer creditworthiness. When a consumer funds a purchase in the U.S. using a PayPal Credit product issued by a chartered financial institution, the chartered financial institution extends credit to the consumer, funds the extension of credit at the point of sale and advances funds to the merchant. We subsequently purchase the receivables related to the consumer loans extended by the chartered financial institution and, as a result of such purchase, bear the risk of loss in the event of loan defaults. Although the chartered financial institution continues to own each customer account, we own the related receivable (excluding participation interests sold) and are responsible for all servicing functions related to the account.
In the third quarter of 2015, we entered into a credit agreement ("Credit Agreement") that provides for an unsecured
$2.0 billion
,
five
-year revolving credit facility that includes a
$150 million
letter of credit sub-facility and a
$150 million
swingline sub-facility, with available borrowings under the revolving credit facility reduced by the amount of any letters of credit and swingline borrowings outstanding from time to time. Borrowings and other amounts payable under the credit agreement are guaranteed by PayPal, Inc. (the "Guarantor"). We may also, subject to the agreement of the applicable lenders, increase the commitments under the revolving credit facility by up to
$500 million
. Subject to specified conditions, we may designate one or more of our subsidiaries as additional borrowers under the Credit Agreement provided that we and the Guarantor guarantee all borrowings and other obligations of any such subsidiaries under the Credit Agreement. As of
December 31, 2015
, no subsidiaries were designated as additional borrowers. Funds borrowed under the Credit Agreement may be used for working capital, capital expenditures, acquisitions and other general corporate purposes of the Company and its subsidiaries. As of
December 31, 2015
,
no
borrowings or letters of credit were outstanding under the Credit Agreement. Accordingly, at
December 31, 2015
,
$2.0 billion
of borrowing capacity was available for the purposes permitted by the Credit Agreement.
In the second quarter of 2014, we agreed, subject to certain conditions, that we, one of our affiliates or a designated third party would purchase a portfolio of consumer loan receivables relating to the customer accounts arising out of our credit program agreement with Synchrony Financial (formerly GE Capital Retail Bank) for a price based on the book value of the consumer loan receivables portfolio at the time of the purchase, subject to certain adjustments and exclusions. In the third quarter of 2015, PayPal and Synchrony Financial agreed to amend and extend the existing credit card program agreement on new terms. As part of the amended agreement, PayPal’s obligation to purchase the portfolio of consumer loan receivables relating to the customer accounts arising out of the credit program agreement with Synchrony Financial was terminated. PayPal retains an option to purchase the portfolio at the end of the new contract term.
87
PayPal Holdings, Inc.
NOTES TO COMBINED AND CONSOLIDATED FINANCIAL STATEMENTS—(Continued)
Lease Arrangements
We have lease obligations under certain non-cancelable operating leases. Future minimum rental payments under non-cancelable operating leases at
December 31, 2015
, are as follows:
|
|
Operating
Leases
|
||
|
|
(In millions)
|
||
|
2016
|
$
|
55
|
|
|
2017
|
51
|
|
|
|
2018
|
49
|
|
|
|
2019
|
38
|
|
|
|
2020
|
32
|
|
|
|
Thereafter
|
129
|
|
|
|
Total minimum lease payments
|
$
|
354
|
|
Rent expense for the years ended
December 31, 2015
,
2014
and
2013
totaled
$59 million
,
$43 million
and
$44 million
, respectively. The future minimum lease payments include the minimum commitments for our facilities.
Litigation and Regulatory Matters
Overview
We are involved in legal and regulatory proceedings on an ongoing basis. Many of these proceedings are in early stages, and may seek an indeterminate amount of damages. If we believe that a loss arising from such matters is probable and can be reasonably estimated, we accrue the estimated liability in our financial statements. If only a range of estimated losses can be determined, we accrue an amount within the range that, in our judgment, reflects the most likely outcome; if none of the estimates within that range is a better estimate than any other amount, we accrue the low end of the range. For those proceedings in which an unfavorable outcome is reasonably possible but not probable, we have disclosed an estimate of the reasonably possible loss or range of losses or we have concluded that an estimate of the reasonably possible loss or range arising directly from the proceeding (i.e., monetary damages or amounts paid in judgment or settlement) are not material. If we cannot estimate the probable or reasonably possible loss or range of losses arising from a legal proceeding, we have disclosed that fact. In assessing the materiality of a legal proceeding, we evaluate, among other factors, the amount of monetary damages claimed, as well as the potential impact of non-monetary remedies sought by plaintiffs (e.g., injunctive relief) that may require us to change our business practices in a manner that could have a material adverse impact on our business. With respect to the matters disclosed in this Note 11, we are unable to estimate the possible loss or range of losses that could potentially result from the application of such non-monetary remedies.
Amounts accrued for legal and regulatory proceedings for which we believe a loss is probable were not material for the year ended
December 31, 2015
. Except as otherwise noted for the proceedings described in this Note 11, we have concluded, based on currently available information, that reasonably possible losses arising directly from these proceedings (i.e., monetary damages or amounts paid in judgment or settlement) in excess of our recorded accruals are also not material. However, legal and regulatory proceedings are inherently unpredictable and subject to significant uncertainties. If one or more matters were resolved against us in a reporting period for amounts in excess of management’s expectations, the impact on our operating results or financial condition for that reporting period could be material.
Regulatory Proceedings
We routinely report to the U.S. Department of the Treasury’s Office of Foreign Assets Control ("OFAC") on payments we have rejected or blocked pursuant to OFAC sanctions regulations and on any possible violations of those regulations. We have cooperated with OFAC in recent years regarding our review process over transaction monitoring and have self-reported a large number of transactions that could possibly be in violation of OFAC sanctions regulations. In March 2015, we reached a settlement with OFAC regarding possible violations arising from our practices between 2009 and 2013. In addition, we continue to cooperate with OFAC regarding other transactions that we have self-reported could also possibly be in violation of OFAC sanctions regulations. Subsequent to our March 2015 settlement, we have received new subpoenas from OFAC seeking additional information about certain of these transactions. Such self-reported transactions could result in claims or actions against us, including litigation,
88
PayPal Holdings, Inc.
NOTES TO COMBINED AND CONSOLIDATED FINANCIAL STATEMENTS—(Continued)
injunctions, damage awards, fines or penalties, or require us to change our business practices that could result in a material loss, require significant management time, result in the diversion of significant operational resources or otherwise harm our business.
General Matters
Other third parties have from time to time claimed, and others may claim in the future, that we have infringed their intellectual property rights. We are subject to patent disputes, and expect that we will increasingly be subject to additional patent infringement claims involving various aspects of our business as our products and services continue to expand in scope and complexity. Such claims may be brought directly or indirectly against our companies and/or against our customers (who may be entitled to contractual indemnification under their contracts with us), and we are subject to increased exposure to such claims as a result of our acquisitions, particularly in cases where we are entering into new lines of business in connection with such acquisitions. We have in the past been forced to litigate such claims, and we believe that additional lawsuits alleging such claims will be filed against us. Intellectual property claims, whether meritorious or not, are time consuming and costly to defend and resolve, could require expensive changes in our methods of doing business or could require us to enter into costly royalty or licensing agreements on unfavorable terms or make substantial payments to settle claims or to satisfy damages awarded by courts.
From time to time, we are involved in other disputes or regulatory inquiries that arise in the ordinary course of business, including suits by our customers (individually or as class actions) alleging, among other things, improper disclosure of our prices, rules or policies, that our practices, prices, rules, policies or customer/user agreements violate applicable law or that we have acted unfairly and/or not acted in conformity with such prices, rules, policies or agreements. In addition to these types of disputes and regulatory inquiries, our operations are also subject to regulatory and/or legal review and/or challenges that tend to reflect the increasing global regulatory focus to which the payments industry is subject and, when taken as a whole with other regulatory and legislative action, such actions could result in the imposition of costly new compliance burdens on our business and customers and may lead to increased costs and decreased transaction volume and revenue. Further, the number and significance of these disputes and inquiries are increasing as our Company has grown larger, our business has expanded in scope (both in terms of the range of products and services that we offer and our geographical operations) and our products and services have increased in complexity. Any claims or regulatory actions against us, whether meritorious or not, could be time consuming, result in costly litigation, settlement payments, damage awards (including statutory damages for certain causes of action in certain jurisdictions), fines, penalties, injunctive relief or increased costs of doing business through adverse judgment or settlement, require us to change our business practices in expensive ways, require significant amounts of management time, result in the diversion of significant operational resources or otherwise harm our business.
Indemnification Provisions
We entered into a separation and distribution agreement and various other agreements with eBay to govern the separation and relationship of the two companies going forward. These agreements provide for specific indemnity and liability obligations and could lead to disputes between us and eBay, which may be significant. In addition, the indemnity rights we have against eBay under the agreements may not be sufficient to protect us and our indemnity obligations to eBay may be significant.
In the ordinary course of business, we include limited indemnification provisions in certain of our agreements with parties with whom we have commercial relationships, including our standard marketing, promotions, and application-programming-interface license (API) agreements. Under these contracts, we generally indemnify, hold harmless, and agree to reimburse the indemnified party for losses suffered or incurred by the indemnified party in connection with claims by any third party with respect to our domain names, trademarks, logos, and other branding elements to the extent that such marks are related to the subject agreement. In a limited number of agreements, we have provided an indemnity for other types of third-party claims, which are indemnities mainly related to intellectual property rights. We have also provided an indemnity to our payments processors in the event of certain third-party claims or card association fines against the processor arising out of conduct by us or our customers. It is not possible to determine the maximum potential loss under these indemnification provisions due to our limited history of prior indemnification claims and the unique facts and circumstances involved in each particular situation. To date, no significant costs have been incurred, either individually or collectively, in connection with our indemnification provisions.
Off-Balance Sheet Arrangements
As of
December 31, 2015
and
2014
, we had no off-balance sheet arrangements that have, or are reasonably likely to have, a current or future material effect on our combined and consolidated financial condition, results of operations, liquidity, capital expenditures or capital resources.
89
PayPal Holdings, Inc.
NOTES TO COMBINED AND CONSOLIDATED FINANCIAL STATEMENTS—(Continued)
Protection Programs
We provide merchants and consumers with protection programs on substantially all transactions completed through our Payments Platform, except for transactions using our gateway and Paydiant products. These programs protect both merchants and consumers from loss primarily due to fraud and counterparty performance. Our Buyer Protection Program provides protection to consumers for qualifying purchases by reimbursing the consumer for the full amount of the purchase if a purchased item does not arrive or does not match the seller’s description. Our Seller Protection Programs provide protection to merchants against claims that a transaction was not authorized by the buyer or claims that an item was not received by covering the seller for the full amount of the payment on eligible sales.
The maximum potential exposure under our protection programs is estimated to be the portion of total eligible transaction volume (TPV) for which buyer or seller protection claims may be raised under our existing user agreements. Since eligible transactions are typically completed in a period significantly shorter than the period under which disputes may be opened, and based on our historical losses to date, we do not believe that that the maximum potential exposure is representative of our actual potential exposure. The actual amount of potential exposure cannot be quantified as we are unable to determine total eligible transactions where performance by a merchant or customer is incomplete or completed transactions that may result in a claim under our protection programs. We record a liability with respect to losses under these protection programs when they are probable and the amount can be reasonably estimated.
The following table provides management's estimate of the maximum potential exposure related to our protection programs as of
December 31, 2015
and
2014
:
|
December 31, 2015
|
|
December 31, 2014
|
|||||
|
(In millions)
|
|||||||
|
Maximum potential exposure
|
$
|
109,496
|
|
$
|
75,833
|
|
|
The following table provides the amount of allowance for transaction losses related to our
protection programs as of
December 31, 2015
and
2014
:
|
December 31, 2015
|
|
December 31, 2014
|
|||||
|
(In millions)
|
|||||||
|
Allowance for transaction losses
|
$
|
185
|
|
$
|
166
|
|
|
Prior to the distribution, our business comprised the Payments segment of eBay and thus our transactions with eBay were considered related party transactions.
In connection with the separation
, we entered into a separation and distribution agreement as well as various other agreements that govern our relationships with eBay going forward, including an operating agreement, transition services agreement, tax matters agreement, employee matters agreement, intellectual property matters agreement and colocation services agreements.
Information included in this Note 12 with respect to eBay is strictly limited to our related party transactions with eBay prior to the separation (i.e., periods up to July 17, 2015).
We earned net revenues of
$59 million
,
$113 million
and
$92 million
from eBay and its subsidiaries for the years ended
December 31, 2015
,
2014
and
2013
, respectively.
Prior to the distribution, we recovered certain amounts from eBay related to customer protection programs offered on eligible eBay purchases made with PayPal. These costs included the actual transaction losses associated with customer-filed claims as well as an allocation of salary-related expenses for our customer support teams working on customer claims and disputes related to eligible eBay purchases. Recoveries associated with transaction losses incurred on eligible eBay purchases for the years ended
December 31, 2015
,
2014
and
2013
were
$27 million
,
$43 million
and
$48 million
, respectively, which were recorded as a reduction to transaction and loan loss. Other costs recovered from eBay related to the customer protection programs for the years ended
December 31, 2015
,
2014
and
2013
were
$12 million
,
$22 million
and
$19 million
, respectively, and were included as a reduction to customer support and operations and general and administrative expenses in our combined statement of income. Following the
90
PayPal Holdings, Inc.
NOTES TO COMBINED AND CONSOLIDATED FINANCIAL STATEMENTS—(Continued)
distribution, eBay's customer protection programs are no longer administered by us, and therefore these costs are no longer reimbursed by eBay.
Prior to the distribution, we incurred user acquisition fees from eBay on payment volume which we processed from purchases made on eBay’s platform. User acquisition fees during for the years ended
December 31, 2015
,
2014
and
2013
were
$64 million
,
$119 million
and
$109 million
, respectively. Following the distribution, pursuant to the operating agreement, we incur referral services fees from eBay based on a fixed rate per new user.
These combined and consolidated financial statements include expenses associated with workplace resources and information technology that were previously allocated to the Payments segment of eBay, and additional expenses related to certain corporate functions, including senior management, legal, human resources and finance. These expenses also include allocations related to share based compensation. These expenses were allocated to us by eBay based on direct usage or benefit where identifiable, with the remainder allocated on a pro rata basis of revenue, headcount, or other systematic measure. We consider the expense allocation methodology and results to be reasonable for all periods presented. The corporate costs and allocation of expenses to us from eBay included within customer support and operations, sales and marketing, product development, and general and administrative expenses were
$303 million
,
$443 million
and
$410 million
for the years ended
December 31, 2015
,
2014
and
2013
, respectively, of which
$121 million
,
$207 million
and
$183 million
were included in general and administrative expenses for the respective periods.
In the second and third quarter of 2015, pursuant to the Separation and Distribution Agreement between eBay and us, eBay transferred substantially all of the assets and liabilities and operations of eBay's payments business to PayPal, which was completed in June 2015 (the "capitalization"). As part of the capitalization, we received from eBay a contribution of cash of approximately
$3.8 billion
, as well as a related estimated deferred tax liability of
$236 million
associated with the foreign earnings that are not considered indefinitely reinvested. In the fourth quarter of 2015, we reassessed the measurement of the deferred tax liability and, based on updated valuation information, reduced the deferred tax liability balance to
$172 million
as of December 31, 2015. The adjustment to deferred tax liability was recorded as a contribution from eBay and resulted in an increase to
net parent investment
within stockholders' equity. During the second and third quarter of 2015, eBay also contributed property and equipment with a net book value of approximately
$224 million
and intangible assets with a net book value of approximately
$18 million
. Additionally, we sold certain property and equipment to eBay with a gross carrying amount of
$63 million
and a net book value of
$15 million
for proceeds of approximately
$26 million
. The proceeds in excess of net book value were recorded as a contribution from eBay and resulted in an increase to net parent investment within stockholders' equity.
All other contracts with related parties are at rates and terms that we believe are comparable with those that could be entered into with independent third parties. There were no other material related party transactions in the periods presented. As of
December 31, 2015
, there were no other material amounts payable to or amounts receivable from related parties. Following separation, transactions with eBay represent third-party transactions on an arms-length basis.
Prior to the separation (i.e., periods up to July 17, 2015), PayPal employees participated in eBay's equity incentive plans, including stock options, restricted stock units and performance-based restricted stock units. In addition, certain PayPal employees participated in eBay's employee stock purchase plan. All awards granted under these plans consisted of eBay common shares. PayPal's combined and consolidated statement of income reflected compensation expense for these stock-based plans associated with the portion of eBay's equity incentive plans in which PayPal employees participated.
Following separation, outstanding awards granted to PayPal employees under eBay's equity incentive plans were converted into PayPal awards under PayPal's equity incentive plans based on a conversion ratio. This conversion ratio was determined as the closing per-share price of eBay shares on the last regular trading session prior to separation divided by the opening per-share price of PayPal shares on the first regular trading session after separation. There was no significant incremental stock-based compensation expense recorded as a result of the share conversions.
Equity Incentive Plans
The Board of Directors adopted the PayPal Holdings, Inc. 2015 Equity Incentive Award Plan (the Plan) on June 16, 2015. Under the terms of the Plan, equity awards, including stock options, restricted stock units, restricted stock awards, performance-based restricted stock units, and deferred stock units, may be granted to our directors, officers and employees. At
December 31, 2015
, we
91
PayPal Holdings, Inc.
NOTES TO COMBINED AND CONSOLIDATED FINANCIAL STATEMENTS—(Continued)
had
108 million
shares authorized under our equity incentive plans and
72 million
shares were available for future grant. Shares issued as a result of stock option exercises and the release of stock awards were funded primarily with the issuance of new shares of common stock.
All stock options granted under these plans generally vest
12.5%
six months from the date of grant (or
25%
one year from the date of hire for grants to new employees) with the remainder vesting at a rate of
2.08%
per month thereafter, and generally expire
seven
to
ten
years from the date of grant. The cost of stock options is determined using the Black-Scholes option pricing model on the date of grant.
Restricted stock units are granted to eligible employees under our equity incentive plans. In general, restricted stock unit vest in equal annual installments over a period of
three
to
five
years, are subject to the employees’ continuing service to us and do not have an expiration date. The cost of restricted stock units granted prior to the separation was determined using the fair value of eBay's common stock on the date of grant. For restricted stock units granted following separation, the cost of restricted stock units was determined using the fair value of PayPal's common stock on the date of grant.
Certain of our executives are eligible to receive performance-based restricted stock units. The number of restricted stock units ultimately received depends on our business performance against specified performance targets set by the Compensation Committee. If the performance criteria is satisfied, the performance-based restricted stock units are granted, generally with one-half of the grant vesting in March following the end of the performance period and the remaining one-half vesting one year later.
Beginning in the fourth quarter of 2015, we granted deferred stock units to each non-employee director that elected to receive, in lieu of annual retainer and committee chair fees and at the time these fees would otherwise be payable (i.e., on a quarterly basis in arrears for services provided), fully vested deferred stock units with an initial value equal to the amount based on the fair market value of common stock at the date of grant. Each deferred stock unit constitutes an unfunded and unsecured right to receive one share of our common stock. Following the termination of a non-employee director's service on the Board of Directors, deferred stock units are payable solely in stock. As of December 31, 2015, there were approximately
0.3 million
deferred stock units outstanding included in our restricted stock unit activity below.
Employee Stock Purchase Plan
Prior to separation, eligible employees participated in eBay’s employee stock purchase plan. Effective July 17, 2015, the Board of Directors adopted the PayPal Holdings, Inc. Employee Stock Purchase Plan ("ESPP"). Under the terms of this plan, shares of our common stock may be purchased over an offering period with a maximum duration of
two
years at
85%
of the lower of the fair market value on the first day of the applicable offering period or on the last business day of each
six
-month purchase period within the offering period. Employees may purchase shares between
2%
and
10%
of their gross compensation during an offering period but not more than the statutory limitation of $25,000 per year. For the year ended December 31, 2015, our employees purchased
0.9 million
shares of eBay common stock at an average price of
$44.37
and
1.2 million
shares of PayPal common stock at an average price of
$28.12
. Under eBay's employee stock purchase plans for the years ended December 31, 2014 and 2013 our employees purchased approximately
1.5 million
shares of eBay common stock at an average purchase price of
$42.16
and
1.7 million
shares at an average price of
$35.29
, respectively.
Employee Saving Plans
Prior to separation, eligible employees participated in eBay's savings plan, which qualifies under Section 401(k) of the Code. Effective July 17, 2015, the Board of Directors adopted the PayPal Holdings, Inc. Deferred Compensation Plan. Under the terms of this plan, participating employees may contribute up to
50%
of their eligible compensation, but not more than statutory limits. In
2015
,
2014
and
2013
, under eBay's and PayPal's savings plans, eligible employees received one dollar for each dollar contributed, up to
4%
of each employee’s eligible salary, subject to a maximum employer contribution of
$10,600
,
$10,400
and
$10,200
respectively, per employee. Our non U.S. employees are covered by other savings plans. For the years ended
December 31, 2015
,
2014
and
2013
, the matching contribution expense for our US and international savings plans were approximately
$42 million
,
$37 million
and
$35 million
, respectively.
92
PayPal Holdings, Inc.
NOTES TO COMBINED AND CONSOLIDATED FINANCIAL STATEMENTS—(Continued)
Stock Option Activity
The following table summarizes stock option activity of our employees under eBay's and PayPal's equity incentive plans for the year ended
December 31, 2015
:
|
Shares
|
Weighted
Average
Exercise
Price
|
Weighted
Average
Remaining
Contractual
Term (Years)
|
Aggregate
Intrinsic Value
|
||||||||||
|
|
(In thousands, except per share amounts and years)
|
||||||||||||
|
Outstanding at January 1, 2015
|
2,409
|
|
$
|
20.93
|
|
—
|
|
—
|
|
||||
|
Granted and assumed
|
2,571
|
|
$
|
25.58
|
|
—
|
|
—
|
|
||||
|
Exercised
|
(3,321
|
)
|
$
|
16.03
|
|
—
|
|
—
|
|
||||
|
Forfeited/expired/canceled
|
(309
|
)
|
$
|
28.18
|
|
—
|
|
—
|
|
||||
|
Shares granted as a result of conversion and employee transitions
|
4,658
|
|
$
|
24.64
|
|
—
|
|
—
|
|
||||
|
Outstanding at December 31, 2015
|
6,008
|
|
$
|
25.94
|
|
4.72
|
|
$
|
62,156
|
|
|||
|
Expected to vest
|
2,712
|
|
$
|
26.85
|
|
6.09
|
|
$
|
25,813
|
|
|||
|
Options exercisable
|
2,940
|
|
$
|
24.87
|
|
3.24
|
|
$
|
33,321
|
|
|||
The weighted average grant date fair value of options granted to our employees during the years
2015
,
2014
and
2013
was
$11.20
,
$13.38
and
$14.90
respectively. The aggregate intrinsic value was calculated as the difference between the exercise price of the underlying awards and the quoted price of our common stock at December 31, 2015. During the years
2015
,
2014
and
2013
, the aggregate intrinsic value of options exercised under eBay's and PayPal's equity incentive plans was
$72 million
,
$57 million
and
$97 million
, respectively, determined as of the date of option exercise. At
December 31, 2015
,
5.8 million
options were in-the-money.
Restricted Stock Units Activity and Performance Based Restricted Stock Units Activity
The following table summarizes the restricted stock units granted (including performance‑based restricted stock units that have been earned) under eBay's and PayPal's equity incentive plans as of
December 31, 2015
and changes during the year ended
December 31, 2015
:
|
Units
|
Weighted Average
Grant-Date
Fair Value
(per share)
|
|||||
|
|
(In thousands, except per share amounts)
|
|||||
|
Outstanding at January 1, 2015
|
14,715
|
|
$
|
32.09
|
|
|
|
Awarded and assumed
|
14,702
|
|
$
|
35.81
|
|
|
|
Vested
|
(8,701
|
)
|
$
|
30.07
|
|
|
|
Forfeited
|
(4,762
|
)
|
$
|
33.32
|
|
|
|
Shares granted as a result of conversion and employee transitions
|
12,051
|
|
$
|
34.31
|
|
|
|
Outstanding at December 31, 2015
|
28,005
|
|
$
|
34.45
|
|
|
|
Expected to vest
|
24,001
|
|
—
|
|
||
During the years
2015
,
2014
and
2013
, the aggregate intrinsic value of restricted stock units vested under eBay's and PayPal's equity incentive plans was
$315 million
,
$292 million
and
$303 million
, respectively.
Stock-Based Compensation Expense
Prior to the separation, we were charged by eBay for stock-based compensation expense related to our direct employees. eBay allocated to us costs of certain employees of eBay (including stock-based compensation) who provided general and administrative services on our behalf. For periods prior to the separation, information included in this note is strictly limited to stock-based compensation associated with the employees wholly dedicated to PayPal (see “Note 12— Related Party Transactions” for total
93
PayPal Holdings, Inc.
NOTES TO COMBINED AND CONSOLIDATED FINANCIAL STATEMENTS—(Continued)
costs allocated to us by eBay). Following the separation, we record stock-based compensation expense for our equity incentive plans in accordance with the provisions of the authoritative accounting guidance, which requires the measurement and recognition of compensation expense based on estimated fair values.
T
he impact on our results of operations of recording stock-based compensation expense under eBay's and PayPal's equity incentive plans for the years ended
December 31, 2015
,
2014
and
2013
was as follows:
|
|
Year Ended December 31,
|
||||||||||
|
|
2015
|
2014
|
2013
|
||||||||
|
|
(In millions)
|
||||||||||
|
Customer support and operations
|
$
|
62
|
|
$
|
63
|
|
$
|
74
|
|
||
|
Sales and marketing
|
52
|
|
55
|
|
46
|
|
|||||
|
Product development
|
132
|
|
109
|
|
87
|
|
|||||
|
General and administrative
|
85
|
|
55
|
|
27
|
|
|||||
|
Depreciation and amortization
|
7
|
|
4
|
|
7
|
|
|||||
|
Total stock-based compensation expense
|
$
|
338
|
|
$
|
286
|
|
$
|
241
|
|
||
|
Income tax benefit recognized for stock-based compensation arrangements
|
98
|
|
77
|
|
60
|
|
|||||
As of
December 31, 2015
, there was approximately
$664 million
of unearned stock-based compensation estimated to be expensed from 2016 through 2020. If there are any modifications or cancellations of the underlying unvested awards, we may be required to accelerate, increase or cancel all or a portion of the remaining unearned stock-based compensation expense. Future unearned stock-based compensation will increase to the extent we grant additional equity awards, change the mix of grants between stock options and restricted stock units or assume unvested equity awards in connection with acquisitions. Total stock-based compensation costs included in capitalized software costs were
$7 million
,
$10 million
, and
$10 million
, respectively, for the years ended
December 31, 2015
,
2014
, and
2013
.
Stock Option Valuation Assumptions
We calculated the fair value of each option award on the date of grant using the Black-Scholes option pricing model. The following weighted average assumptions were used for the years ended
December 31, 2015
,
2014
and
2013
:
|
|
Year Ended December 31,
|
|||||||
|
|
2015
|
2014
|
2013
|
|||||
|
Risk-free interest rate
|
1.4
|
%
|
1.2
|
%
|
0.6
|
%
|
||
|
Expected life (in years)
|
4.3
|
|
4.1
|
|
4.1
|
|
||
|
Dividend yield
|
—
|
|
—
|
|
—
|
|
||
|
Expected volatility
|
26
|
%
|
29
|
%
|
34
|
%
|
||
For periods prior to separation, our computation of expected volatility was based on a combination of historical and market-based implied volatility from traded options on eBay’s stock. The computation of expected life was determined based on historical experience of similar awards, giving consideration to the contractual terms of the stock-based awards, vesting schedules, and expectations of future employee behavior. The interest rate for periods within the contractual life of the award was based on the U.S. Treasury yield curve in effect at the time of grant.
For periods subsequent to the separation, the risk-free interest rate for periods within the contractual life of the award was based upon the U.S. Treasury yield curve in effect at the time of the grant. Due to our limited history of stock option exercises, we estimated the expected term of options granted based on the midpoint between the vesting date and the end of the contractual term using the "simplified” method under the SEC guidance. The computation of expected volatility for our employee stock option awards was based on the historical volatility of selected peer companies.
For periods ended on or prior to July 17, 2015, we were a member of the eBay consolidated group and our U.S. taxable income was included in the consolidated U.S. federal income tax return of eBay as well as in returns filed by eBay with certain state and local taxing jurisdictions. Our foreign income tax returns are filed on a separate company basis. For periods ended on or prior to July 17, 2015, our income tax liability has been computed and presented herein under the “separate return method” as if it were a
94
PayPal Holdings, Inc.
NOTES TO COMBINED AND CONSOLIDATED FINANCIAL STATEMENTS—(Continued)
separate tax paying entity, as modified by the benefits-for-loss approach. Accordingly, our operating losses and other tax attributes are characterized as utilized when those attributes have been utilized by other members of the eBay consolidated group; however, the benefits-for-loss approach does not impact our tax expense. Federal and unitary state income taxes incurred for periods ended on or prior to July 17, 2015 are remitted to eBay pursuant to a tax sharing agreement between the companies.
In connection with the distribution, eBay and PayPal entered into various agreements that govern the relationship between the parties going forward, including a tax matters agreement. The tax matters agreement was entered into on the distribution date. Under the tax matters agreement, eBay generally is responsible for all additional taxes (and will be entitled to all related refunds of taxes) imposed on eBay and its subsidiaries (including subsidiaries that were transferred to PayPal pursuant to the separation) arising after the distribution date with respect to the taxable periods (or portions thereof) ended on or prior to July 17, 2015 except for those taxes for which PayPal has reflected an unrecognized tax benefit in its financial statements on the distribution date.
The components of pretax income (loss) are as follows (in millions):
|
|
Year Ended December 31,
|
||||||||||
|
|
2015
|
2014
|
2013
|
||||||||
|
United States
|
$
|
(253
|
)
|
$
|
(111
|
)
|
$
|
3
|
|
||
|
International
|
1,741
|
|
1,372
|
|
1,081
|
|
|||||
|
$
|
1,488
|
|
$
|
1,261
|
|
$
|
1,084
|
|
|||
The provision for income taxes is composed of the following (in millions):
|
|
Year Ended December 31,
|
||||||||||
|
|
2015
|
2014
|
2013
|
||||||||
|
Current:
|
|||||||||||
|
Federal
|
$
|
34
|
|
$
|
90
|
|
$
|
45
|
|
||
|
State and local
|
(5
|
)
|
13
|
|
2
|
|
|||||
|
Foreign
|
104
|
|
59
|
|
30
|
|
|||||
|
$
|
133
|
|
$
|
162
|
|
$
|
77
|
|
|||
|
Deferred:
|
|||||||||||
|
Federal
|
$
|
126
|
|
$
|
699
|
|
$
|
72
|
|
||
|
State and local
|
1
|
|
(3
|
)
|
(3
|
)
|
|||||
|
Foreign
|
—
|
|
(16
|
)
|
(17
|
)
|
|||||
|
127
|
|
680
|
|
52
|
|
||||||
|
Income tax expense
|
$
|
260
|
|
$
|
842
|
|
$
|
129
|
|
||
The following is a reconciliation of the difference between the actual provision for income taxes and the provision computed by applying the federal statutory rate.
|
|
Year Ended December 31,
|
|||||||
|
|
2015
|
2014
|
2013
|
|||||
|
Provision computed at federal statutory rate
|
35.0
|
%
|
35.0
|
%
|
35.0
|
%
|
||
|
State taxes, net of federal benefit
|
(0.3
|
)%
|
0.8
|
%
|
(0.1
|
)%
|
||
|
Foreign income taxed at different rates
|
(20.9
|
)%
|
(22.2
|
)%
|
(22.6
|
)%
|
||
|
Prior year foreign earnings no longer considered indefinitely reinvested
|
—
|
|
50.8
|
%
|
—
|
|
||
|
Stock based compensation
|
1.5
|
%
|
1.5
|
%
|
1.1
|
%
|
||
|
Tax credits
|
(0.7
|
)%
|
(0.8
|
)%
|
(1.3
|
)%
|
||
|
Change in valuation allowances
|
0.3
|
%
|
—
|
|
(0.3
|
)%
|
||
|
Other
|
2.6
|
%
|
1.7
|
%
|
0.1
|
%
|
||
|
Effective income tax rate
|
17.5
|
%
|
66.8
|
%
|
11.9
|
%
|
||
95
PayPal Holdings, Inc.
NOTES TO COMBINED AND CONSOLIDATED FINANCIAL STATEMENTS—(Continued)
The difference between the actual provision for income taxes and the provision computed by applying the federal statutory rate of
35%
to income before income taxes is primarily the result of foreign income taxed at different rates and, for the year ended December 31, 2014, the accrual of U.S. income tax on undistributed foreign profits for 2013 and prior years previously indefinitely reinvested outside of the U.S.
Deferred tax assets and liabilities are recognized for the future tax consequences of differences between the carrying amounts of assets and liabilities and their respective tax basis using enacted tax rates in effect for the year in which the differences are expected to reverse. Significant deferred tax assets and liabilities consist of the following (in millions):
|
|
December 31,
|
||||||
|
|
2015
|
2014
|
|||||
|
Deferred tax assets:
|
|||||||
|
Net operating loss and credit carryforwards
|
$
|
90
|
|
$
|
42
|
|
|
|
Accruals and allowances
|
153
|
|
138
|
|
|||
|
Partnership investment
|
14
|
|
12
|
|
|||
|
Stock-based compensation
|
82
|
|
60
|
|
|||
|
Net unrealized (gains) losses
|
16
|
|
8
|
|
|||
|
Total deferred tax assets
|
355
|
|
260
|
|
|||
|
Valuation allowance
|
(13
|
)
|
(8
|
)
|
|||
|
Net deferred tax assets
|
$
|
342
|
|
$
|
252
|
|
|
|
Deferred tax liabilities:
|
|||||||
|
Unremitted foreign earnings
|
$
|
(1,156
|
)
|
$
|
(886
|
)
|
|
|
Fixed assets and other intangibles
|
(191
|
)
|
(151
|
)
|
|||
|
Acquired intangibles
|
(131
|
)
|
(55
|
)
|
|||
|
Net unrealized losses (gains)
|
(1
|
)
|
(1
|
)
|
|||
|
Total deferred tax liabilities
|
(1,479
|
)
|
(1,093
|
)
|
|||
|
Net deferred tax assets (liabilities)
|
$
|
(1,137
|
)
|
$
|
(841
|
)
|
|
The following table shows the deferred tax assets and liabilities within our combined and consolidated balance sheet.
|
Balance Sheet Location
|
December 31, 2015
|
December 31, 2014
|
|||||||
|
|
|
(In millions)
|
|||||||
|
Deferred tax assets:
|
|||||||||
|
Current
|
Other Current Assets
|
$
|
—
|
|
$
|
2
|
|
||
|
Non-Current
|
Other Assets
|
38
|
|
10
|
|
||||
|
Total Deferred tax assets
|
$
|
38
|
|
$
|
12
|
|
|||
|
Deferred tax liabilities:
|
|||||||||
|
Current
|
Accrued expenses and other current liabilities
|
$
|
—
|
|
$
|
(708
|
)
|
||
|
Non-Current
|
Long-term liabilities
|
(1,175
|
)
|
(145
|
)
|
||||
|
Total Deferred tax liabilities
|
$
|
(1,175
|
)
|
$
|
(853
|
)
|
|||
In 2015, the FASB issued Accounting Standards Update (“ASU”) 2015-17, “Balance Sheet Classification of Deferred Taxes”, which simplifies the presentation of deferred income taxes. This guidance requires that deferred tax liabilities and assets be classified as non-current in a classified statement of financial position. We have early adopted the FASB's new accounting guidance prospectively for the year ended December 31, 2015. The prior reporting period was not retrospectively adjusted.
In 2015, pursuant to the Separation and Distribution Agreement between eBay and us, we received from eBay a contribution of cash of approximately
$3.8 billion
, as well as a related estimated deferred tax liability of
$172 million
associated with the foreign earnings that are not considered indefinitely reinvested. The adjustment to deferred tax liability was recorded as a contribution from eBay and resulted in an increase to net parent investment within stockholders' equity.
96
PayPal Holdings, Inc.
NOTES TO COMBINED AND CONSOLIDATED FINANCIAL STATEMENTS—(Continued)
As of
December 31, 2015
, our federal, state and foreign net operating loss carryforwards for income tax purposes were approximately
$196 million
,
$183 million
, and
$38 million
, respectively. The federal and state net operating loss carryforwards are subject to various limitations under Section 382 of the Code. If not utilized, the federal net operating loss carryforwards will begin to expire in 2019, and the state net operating loss carryforwards will begin to expire in 2016. The majority of the foreign net operating loss carryforwards have no expiration date and may be carried forward indefinitely. As of
December 31, 2015
, our state tax credit carryforwards for income tax purposes were approximately
$29 million
. Most of the state tax credits carry forward indefinitely.
In assessing the realizability of deferred tax assets, management considers whether it is more likely than not that all or some portion of the deferred tax assets will not be realized. At
December 31, 2015
, we maintained a valuation allowance with respect to certain of our deferred tax assets relating primarily to operating losses in certain states and foreign jurisdictions that we believe are not likely to be realized. At December 31, 2014, we maintained a valuation allowance related to deferred tax assets for operating losses in certain states that we believe are not likely to be realized.
At December 31, 2013, we had approximately
$3.4 billion
of indefinitely reinvested foreign earnings for which we had not provided U.S. income or applicable foreign withholding taxes. During 2014, we altered our capital allocation strategy, which included changing our intent with regard to the indefinite reinvestment of foreign earnings from certain of our foreign subsidiaries for 2013 and prior years. As a result, we provided taxes and recorded a deferred tax liability of approximately
$650 million
on
$1.9 billion
of undistributed foreign earnings of certain of our foreign subsidiaries for 2013 and prior years.
We have not provided for U.S. federal income and foreign withholding taxes on
$3.5 billion
of our non-U.S. subsidiaries’ undistributed earnings as of
December 31, 2015
, because such earnings are intended to be indefinitely reinvested in our international operations. We do not know the time or manner in which we would repatriate those funds therefore we cannot quantify the tax liability associated with the future repatriation of such earnings. In cases where we intend not to indefinitely reinvest a portion of our foreign subsidiaries’ undistributed earnings, we provide U.S. taxes on such earnings and such taxes are included in deferred taxes or tax payable liabilities depending upon the planned timing and manner of such repatriation.
We benefit from tax rulings concluded in several different jurisdictions, most significantly Singapore and Luxembourg. These rulings result in significantly lower rates of taxation on certain classes of income and require various thresholds of investment and employment in those jurisdictions. We review our compliance on an annual basis to ensure we continue to meet our obligations under these tax rulings. These rulings resulted in tax savings of approximately
$285 million
,
$217 million
and
$211 million
in
2015
,
2014
and
2013
, respectively. The benefit of these tax rulings on our net income per share (diluted) was approximately
$0.23
,
$0.18
and
$0.17
in 2015, 2014 and 2013, respectively. These tax rulings are in effect currently and expire over periods ranging from 2020 to 2021.
On July 27, 2015, the U.S. Tax Court, in Altera Corp. v. Commissioner, invalidated part of a Treasury Regulation requiring stock based compensation to be included in a qualified intercompany cost sharing arrangement. A final decision was entered by the U.S. Tax Court on December 1, 2015. There is uncertainty as to whether the Internal Revenue Service will appeal the U.S. Tax Court decision and whether any claim for relief from U.S. Federal tax for past or future years can be sustained. We have reviewed this case and its impact on PayPal and concluded that no adjustment to the consolidated financial statements is appropriate at this time. We will continue to monitor ongoing developments and potential impacts to our consolidated financial statements.
The following table reflects changes in unrecognized tax benefits since January 1, 2013:
|
|
Year Ended December 31,
|
||||||||||
|
|
2015
|
2014
|
2013
|
||||||||
|
|
(In millions)
|
||||||||||
|
Gross amounts of unrecognized tax benefits as of the beginning of the period
|
$
|
165
|
|
$
|
134
|
|
$
|
148
|
|
||
|
Increases related to prior period tax positions
|
39
|
|
7
|
|
20
|
|
|||||
|
Decreases related to prior period tax positions
|
(4
|
)
|
(2
|
)
|
(44
|
)
|
|||||
|
Increases related to current period tax positions
|
68
|
|
31
|
|
10
|
|
|||||
|
Settlements
|
(1
|
)
|
(5
|
)
|
—
|
|
|||||
|
Statute of limitation expirations
|
|||||||||||
|
Gross amounts of unrecognized tax benefits as of the end of the period
|
$
|
267
|
|
$
|
165
|
|
$
|
134
|
|
||
97
PayPal Holdings, Inc.
NOTES TO COMBINED AND CONSOLIDATED FINANCIAL STATEMENTS—(Continued)
If the remaining balance of unrecognized tax benefits were realized in a future period, it would result in a tax benefit of
$216 million
.
During all years presented, we recognized interest and penalties related to uncertain tax positions in income tax expense. In
2015
we recognized interest and penalties of
$16 million
in income tax expense. The amount of interest and penalties accrued as of
December 31, 2015
and
2014
was approximately
$54 million
and
$36 million
, respectively.
We are subject to taxation in the U.S. and various state and foreign jurisdictions. We are under examination by certain tax authorities for the 2003 to 2013 tax years. The material jurisdictions in which we are subject to examination by tax authorities for tax years after 2002 primarily include the U.S. (Federal and California), France, Germany, India, Israel, Luxembourg, Singapore and United Kingdom. We believe that adequate amounts have been reserved for any adjustments that may ultimately result from these examinations.
Although the timing of the resolution of these audits is uncertain, we do not expect the total amount of unrecognized tax benefits as of
December 31, 2015
will materially change in the next 12 months. However, given the number of years remaining subject to examination and the number of matters being examined, we are unable to estimate the full range of possible adjustments to the balance of gross unrecognized tax benefits.
In January 2015, at a regular meeting of the eBay board of directors (the "eBay Board"), the eBay Board approved a plan to implement a strategic reduction of its existing global workforce. The reduction was completed by the end of 2015.
The following table summarizes the restructuring costs recognized during the year ended
December 31, 2015
:
|
2015
|
|||
|
(In millions)
|
|||
|
Employee severance and benefits
|
$
|
48
|
|
|
Total
|
$
|
48
|
|
No
restructuring expenses were recognized during the years ended December 31, 2014 and 2013.
The following table summarizes the restructuring reserve activity during the year ended
December 31, 2015
:
|
|
Employee Severance and Benefits
|
Other Associated Costs
|
Total
|
||||||||
|
(In millions)
|
|||||||||||
|
Accrued liability as of January 1, 2015
|
$
|
—
|
|
$
|
—
|
|
$
|
—
|
|
||
|
Charges
|
48
|
|
—
|
|
48
|
|
|||||
|
Payments
|
(48
|
)
|
—
|
|
(48
|
)
|
|||||
|
Accrued liability as of December 31, 2015
|
$
|
—
|
|
$
|
—
|
|
$
|
—
|
|
||
98
PayPal Holdings, Inc.
NOTES TO COMBINED AND CONSOLIDATED FINANCIAL STATEMENTS—(Continued)
The following table summarizes the changes in accumulated balances of other comprehensive income for the year ended
December 31, 2015
:
|
Unrealized
Gains (Losses)
on Cash Flow
Hedges
|
Unrealized Gains (Losses) on Investments
|
Foreign
Currency
Translation
|
Estimated tax
(expense)
benefit
|
Total
|
|||||||||||||||
|
|
(In millions)
|
||||||||||||||||||
|
Beginning balance
|
$
|
126
|
|
$
|
—
|
|
$
|
(16
|
)
|
$
|
—
|
|
$
|
110
|
|
||||
|
Other comprehensive income before reclassifications
|
113
|
|
(16
|
)
|
(37
|
)
|
3
|
|
63
|
|
|||||||||
|
Amount of gain (loss) reclassified from accumulated other comprehensive income
|
182
|
|
—
|
|
—
|
|
—
|
|
182
|
|
|||||||||
|
Net current period other comprehensive income
|
(69
|
)
|
(16
|
)
|
(37
|
)
|
3
|
|
(119
|
)
|
|||||||||
|
Ending balance
|
$
|
57
|
|
$
|
(16
|
)
|
$
|
(53
|
)
|
$
|
3
|
|
$
|
(9
|
)
|
||||
The following table summarizes the changes in accumulated balances of other comprehensive income for the year ended
December 31, 2014
:
|
Unrealized
Gains (Losses)
on Cash Flow
Hedges
|
Foreign
Currency
Translation
|
Estimated tax
(expense)
benefit
|
Total
|
||||||||||||
|
|
(In millions)
|
||||||||||||||
|
Beginning balance
|
$
|
(91
|
)
|
$
|
26
|
|
$
|
4
|
|
$
|
(61
|
)
|
|||
|
Other comprehensive income before reclassifications
|
181
|
|
(42
|
)
|
(4
|
)
|
135
|
|
|||||||
|
Amount of gain (loss) reclassified from accumulated other comprehensive income
|
(36
|
)
|
—
|
|
—
|
|
(36
|
)
|
|||||||
|
Net current period other comprehensive income
|
217
|
|
(42
|
)
|
(4
|
)
|
171
|
|
|||||||
|
Ending balance
|
$
|
126
|
|
$
|
(16
|
)
|
$
|
—
|
|
$
|
110
|
|
|||
The following table provides details about reclassifications out of accumulated other comprehensive income for the years ended
December 31, 2015
and 2014:
|
Details about Accumulated Other Comprehensive
Income Components
|
Amount of Gain (Loss)
Reclassified from
Accumulated Other
Comprehensive
Income
|
Affected Line Item in the Statement of
Income
|
||||||||
|
|
2015
|
2014
|
|
|||||||
|
|
(In millions)
|
|
||||||||
|
Gains (losses) on cash flow hedges—foreign exchange contracts
|
$
|
182
|
|
$
|
(36
|
)
|
Net revenues
|
|||
|
$
|
182
|
|
$
|
(36
|
)
|
Total, before income taxes
|
||||
|
—
|
|
—
|
|
Provision for income taxes
|
||||||
|
$
|
182
|
|
$
|
(36
|
)
|
Total, net of income taxes
|
||||
|
Total reclassifications for the period
|
$
|
182
|
|
$
|
(36
|
)
|
Total, net of income taxes
|
|||
In January 2016, our Board of Directors authorized a stock repurchase program that provides for the repurchase of up to
$2 billion
of our common stock, with no expiration from the date of authorization. This stock repurchase program is intended to offset the impact of dilution from our equity compensation programs and, subject to market conditions and other factors, to be used to make opportunistic repurchases of our common stock to reduce outstanding share count. Any share repurchases under our stock repurchase program may be made through open market transactions, block trades, privately negotiated transactions or other means at times and in such amounts as management deems appropriate and will be funded from our working capital or other financing alternatives.
99
PayPal Holdings, Inc.
NOTES TO COMBINED AND CONSOLIDATED FINANCIAL STATEMENTS—(Continued)
However, any stock repurchases are subject to market conditions and other uncertainties and we cannot predict if or when any stock repurchases will be made. Moreover, we may terminate our stock repurchase program at any time without notice.
100
Supplementary Data — Quarterly Unaudited Financial Data
The following tables present certain unaudited combined and consolidated quarterly financial information for the years ended December 31, 2015 and 2014. The fourth quarter of 2015 was the first full quarter post separation and represents our actual results as an independent public company. Results for the first three quarters of 2015 as well as all four quarters of 2014 include allocations from eBay and may not be indicative of our results had we been a separate stand-alone entity during those periods.
|
(Unaudited, in millions, except per share amounts)
|
Quarter Ended
|
||||||||||||||
|
2015
|
March 31
(1)
|
June 30
(1)
|
September 30
(2)
|
December 31
(2)
|
|||||||||||
|
Net Revenues
|
$
|
2,137
|
|
$
|
2,297
|
|
$
|
2,258
|
|
$
|
2,556
|
|
|||
|
Net income
|
$
|
255
|
|
$
|
305
|
|
$
|
301
|
|
$
|
367
|
|
|||
|
Net income per share-basic
|
$
|
0.21
|
|
$
|
0.25
|
|
$
|
0.25
|
|
$
|
0.30
|
|
|||
|
Net income per share-diluted
|
$
|
0.21
|
|
$
|
0.25
|
|
$
|
0.25
|
|
$
|
0.30
|
|
|||
|
Weighted-average shares:
(1)(2)
|
|||||||||||||||
|
Basic
|
1,218
|
|
1,218
|
|
1,221
|
|
1,223
|
|
|||||||
|
Diluted
|
1,224
|
|
1,224
|
|
1,227
|
|
1,230
|
|
|||||||
|
(Unaudited, in millions, except per share amounts)
|
Quarter Ended
|
||||||||||
|
2014
|
March 31
(1)
|
June 30
(1)
|
September 30
(1)
|
December 31
(1)
|
|||||||
|
Net Revenues
|
1,874
|
|
1,983
|
|
1,975
|
|
2,193
|
|
|||
|
Net income
|
(382
|
)
|
281
|
|
234
|
|
286
|
|
|||
|
Net income per share-basic
|
(0.31
|
)
|
0.23
|
|
0.19
|
|
0.23
|
|
|||
|
Net income per share-diluted
|
(0.31
|
)
|
0.23
|
|
0.19
|
|
0.23
|
|
|||
|
Weighted-average shares:
|
|||||||||||
|
Basic
|
1,218
|
|
1,218
|
|
1,218
|
|
1,218
|
|
|||
|
Diluted
|
1,218
|
|
1,224
|
|
1,224
|
|
1,224
|
|
|||
1
On July 17, 2015, the distribution date, eBay stockholders of record as of the close of business on July 8, 2015 received
one
share of PayPal common stock for every share of eBay common stock held as of the record date. Basic and diluted net income per share for the first two quarters of 2015 and all four quarters of 2014 is calculated using the number of common shares distributed on July 17, 2015. Refer to Note 2 of the combined and consolidated financial statements for information regarding net income per share.
2
Basic and diluted net income per share for the third and fourth quarters of 2015 is calculated using the weighted average number of common shares outstanding for the period beginning after the distribution date. Refer to Note 2 of the combined and consolidated financial statements for information regarding net income per share.
101
FINANCIAL STATEMENT SCHEDULE
The Financial Statement Schedule II—VALUATION AND QUALIFYING ACCOUNTS is filed as part of this Annual Report on Form 10-K.
|
Balance at
Beginning of
Period
|
Charged/
(Credited) to
Net Income
|
Charges
Utilized/
(Write-offs)
|
Balance at
End of Period
|
||||||||||||
|
|
(In millions)
|
||||||||||||||
|
Allowance for Transaction Losses
(1)
|
|||||||||||||||
|
Year Ended December 31, 2013
|
$
|
107
|
|
$
|
310
|
|
$
|
(280
|
)
|
$
|
137
|
|
|||
|
Year Ended December 31, 2014
|
137
|
|
408
|
|
(379
|
)
|
$
|
166
|
|
||||||
|
Year Ended December 31, 2015
|
$
|
166
|
|
$
|
511
|
|
$
|
(492
|
)
|
$
|
185
|
|
|||
|
Allowance for Loans and Interest Receivable
(1)
|
|
|
|||||||||||||
|
Year Ended December 31, 2013
|
$
|
101
|
|
$
|
276
|
|
$
|
(231
|
)
|
$
|
146
|
|
|||
|
Year Ended December 31, 2014
|
146
|
|
333
|
|
(284
|
)
|
$
|
195
|
|
||||||
|
Year Ended December 31, 2015
|
$
|
195
|
|
$
|
385
|
|
$
|
(347
|
)
|
$
|
233
|
|
|||
(1)
Certain amounts for prior years have been reclassified to conform to current period presentation.
102
|
Incorporated by Reference
|
|||||
|
Exhibit
Number
|
|
Exhibit Description
|
Filed with this Form 10-K
|
Form
|
Date Filed
|
|
2.01
|
|
Separation and Distribution Agreement by and between eBay Inc. and PayPal Holdings, Inc.
|
10-12B/A
|
6/26/2015
|
|
|
3.01
|
|
PayPal Holdings, Inc.’s Amended and Restated Certificate of Incorporation.
|
8-K
|
7/20/2015
|
|
|
3.02
|
|
PayPal Holdings, Inc.’s Amended and Restated Bylaws.
|
8-K
|
7/20/2015
|
|
|
10.01
|
|
Operating Agreement by and among eBay Inc., eBay International AG, PayPal Holdings, Inc., PayPal, Inc., PayPal Pte. Ltd. and PayPal Payments Pte. Holdings S.C.S., dated July 17, 2015.
|
8-K
|
7/20/2015
|
|
|
10.02
|
|
Transition Services Agreement by and between eBay Inc. and PayPal Holdings, Inc., dated July 17, 2015.
|
8-K
|
7/20/2015
|
|
|
10.03
|
|
Tax Matters Agreement by and between eBay Inc. and PayPal Holdings, Inc., dated July 17, 2015.
|
8-K
|
7/20/2015
|
|
|
10.04
|
|
Employee Matters Agreement by and between eBay Inc. and PayPal Holdings, Inc., dated July 17, 2015.
|
8-K
|
7/20/2015
|
|
|
10.05
|
|
Intellectual Property Matters Agreement by and among eBay Inc., eBay International AG, PayPal Holdings, Inc., PayPal, Inc., PayPal Pte. Ltd. and PayPal Payments Pte. Holdings S.C.S., dated July 17, 2015.
|
8-K
|
7/20/2015
|
|
|
10.06
|
|
Credit and Guarantee Agreement, dated as of July 17, 2015, by and among PayPal Holdings, Inc., PayPal, Inc., JPMorgan Chase Bank, N.A., as Administrative Agent, and the other parties thereto.
|
8-K
|
7/20/2015
|
|
|
10.07+
|
PayPal Employee Incentive Plan.
|
8-K
|
7/20/2015
|
||
|
10.08+
|
PayPal Holdings, Inc. 2015 Equity Incentive Award Plan.
|
8-K
|
7/20/2015
|
||
|
10.09+
|
PayPal Holdings, Inc. Deferred Compensation Plan.
|
8-K
|
7/20/2015
|
||
|
10.10+
|
PayPal Holdings, Inc. Change in Control Severance Plan for Key Employees, dated June 16, 2015.
|
10-12B/A
|
6/18/2015
|
||
|
10.11+
|
PayPal Holdings, Inc. SVP and Above Standard Severance Plan, dated June 16, 2015.
|
10-12B/A
|
6/18/2015
|
||
|
10.12+
|
Letter Agreement dated July 13, 2015 between Marcia Morales-Jaffe and PayPal Holdings, Inc.
|
10-Q
|
10/29/2015
|
||
|
10.13+
|
Letter Agreement dated July 29, 2015 between John Rainey and PayPal Holdings, Inc.
|
10-Q
|
10/29/2015
|
||
|
10.14+
|
Offer Letter dated September 29, 2014 between eBay Inc. and Daniel Schulman.
|
10-12B/A
|
5/14/2015
|
||
|
10.15+
|
Amendment dated December 31, 2014 to Offer Letter between eBay Inc. and Daniel Schulman.
|
10-12B/A
|
5/14/2015
|
||
|
10.16
|
Form of Indemnity Agreement between PayPal Holdings, Inc. and individual directors and officers.
|
10-12B/A
|
5/14/2015
|
||
|
10.17+
|
Form of Global Restricted Stock Unit Award Agreement (and Performance-Based Restricted Stock Unit Agreement) under the PayPal Holdings, Inc. 2015 Equity Incentive Award Plan.
|
10-12B/A
|
5/14/2015
|
||
|
10.18+
|
Form of Global Stock Option Agreement under the PayPal Holdings, Inc. 2015 Equity Incentive Award Plan.
|
10-12B/A
|
5/14/2015
|
||
|
10.19+
|
Form of Director Annual Award Agreement under the PayPal Holdings, Inc. 2015 Equity Incentive Award Plan.
|
10-12B/A
|
5/14/2015
|
||
|
10.20+
|
Form of Electing Director Quarterly Award Agreement under the PayPal Holdings, Inc. 2015 Equity Incentive Award Plan.
|
10-12B/A
|
5/14/2015
|
||
|
10.21+
|
Form of PayPal Holdings, Inc. Employee Stock Purchase Plan.
|
10-12B/A
|
5/14/2015
|
||
|
10.22+
|
Form of Braintree, Inc. Restricted Stock Unit Agreement between Braintree, Inc. and William J. Ready dated September 25, 2013.
|
10-12B/A
|
6/2/2015
|
||
103
|
10.23+
|
Letter dated May 19, 2015 from eBay Inc. to William Ready.
|
10-12B/A
|
6/2/2015
|
||
|
10.24+
|
Letter dated May 22, 2015 from eBay Inc. to James Barrese.
|
10-12B/A
|
6/2/2015
|
||
|
10.25+
|
Letter dated December 31, 2014 from eBay Inc. to Patrick Dupuis.
|
10-12B/A
|
6/2/2015
|
||
|
10.26+
|
Letter dated April 7, 2015 from eBay Inc. to Louise Pentland.
|
X
|
|||
|
10.27+
|
Letter dated April 13, 2015 from eBay Inc. to Jonathan Auerbach.
|
X
|
|||
|
10.28+
|
Letter dated May 5, 2013 from eBay Inc. to Tomer Barel.
|
X
|
|||
|
10.29+
|
Independent Director Compensation Policy.
|
8-K
|
1/14/2016
|
||
|
21.01
|
List of Subsidiaries.
|
X
|
|||
|
23.01
|
PricewaterhouseCoopers LLP consent.
|
X
|
|||
|
24.01
|
Power of Attorney (see signature page).
|
X
|
|||
|
31.01
|
Certification of PayPal Holdings, Inc.’s Chief Executive Officer, as required by Section 302 of the Sarbanes-Oxley Act of 2002.
|
X
|
|||
|
31.02
|
Certification of PayPal Holdings, Inc.’s Chief Financial Officer, as required by Section 302 of the Sarbanes-Oxley Act of 2002.
|
X
|
|||
|
32.01
|
Certification of PayPal Holdings, Inc.’s Chief Executive Officer, as required by Section 906 of the Sarbanes-Oxley Act of 2002.
|
X
|
|||
|
32.02
|
Certification of PayPal Holdings, Inc.’s Chief Financial Officer, as required by Section 906 of the Sarbanes-Oxley Act of 2002.
|
X
|
|||
|
101.INS
|
XBRL Instance Document
|
X
|
|||
|
101.SCH
|
XBRL Taxonomy Extension Schema Document
|
X
|
|||
|
101.CAL
|
XBRL Taxonomy Extension Calculation Linkbase Document
|
X
|
|||
|
101.DEF
|
XBRL Taxonomy Extension Definition Linkbase Document
|
X
|
|||
|
101.LAB
|
XBRL Taxonomy Extension Label Linkbase Document
|
X
|
|||
|
101.PRE
|
XBRL Taxonomy Extension Presentation Linkbase Document
|
X
|
|||
+ Indicates a management contract or compensatory plan or arrangement
104
SIGNATURES
Pursuant to the requirements of Section 13 or 15(d) of the Securities Exchange Act of 1934, as amended, the Registrant has duly caused this report to be signed on its behalf by the undersigned, thereunto duly authorized, in the City of San Jose, State of California, on February 11, 2016.
|
PayPal Holdings, Inc.
|
|||
|
By:
|
/s/ Daniel H. Schulman
|
||
|
Name: Daniel H. Schulman
Title: President, Chief Executive Officer and Director
|
|||
POWER OF ATTORNEY
KNOW ALL PERSONS BY THESE PRESENTS, that each person whose signature appears below constitutes and appoints Daniel H. Schulman, John D. Rainey, A. Louise Pentland, Russell S. Elmer and Aaron A. Anderson, and each or any one of them, each with the power of substitution, his or her attorney-in-fact, to sign any amendments to this report, with exhibits thereto and other documents in connection therewith, with the Securities and Exchange Commission, hereby ratifying and confirming all that each of said attorneys-in-fact, or his substitute or substitutes, may do or cause to be done by virtue hereof.
Pursuant to the requirements of the Securities Exchange Act of 1934, as amended, this report has been signed below by the following persons on behalf of the Registrant and in the capacities indicated on February 11, 2016.
|
Principal Executive Officer:
|
Principal Financial Officer:
|
|||
|
By:
|
/s/ Daniel H. Schulman
|
By:
|
/s/ John D. Rainey
|
|
|
Daniel H. Schulman
|
John D. Rainey
|
|||
|
President, Chief Executive Officer and Director
|
Senior Vice President, Chief Financial Officer
|
|||
|
Principal Accounting Officer:
|
||||
|
By:
|
/s/ Aaron A. Anderson
|
|||
|
Aaron A. Anderson
|
||||
|
Vice President, Chief Accounting Officer
|
||||
Additional Directors
|
By:
|
/s/ Wences Casares
|
By:
|
/s/ Jonathan Christodoro
|
|
|
Wences Casares
|
Jonathan Christodoro
|
|||
|
Director
|
Director
|
|||
|
By:
|
/s/ John J. Donahoe
|
By:
|
/s/ David W. Dorman
|
|
|
John J. Donahoe
|
David W. Dorman
|
|||
|
Director
|
Director
|
|||
|
By:
|
/s/ Gail J. McGovern
|
By:
|
/s/ David M. Moffett
|
|
|
Gail J. McGovern
|
David M. Moffett
|
|||
|
Director
|
Director
|
|||
|
By:
|
/s/ Pierre M. Omidyar
|
By:
|
/s/ Frank D. Yeary
|
|
|
Pierre M. Omidyar
|
Frank D. Yeary
|
|||
|
Director
|
Director
|
|||
TABLE OF CONTENTS
Part IItem 1: BusinessItem 1A. Risk FactorsItem 1B. Unresolved Staff CommentsItem 2. PropertiesItem 3. Legal ProceedingsItem 4. Mine Safety DisclosuresPart IIItem 5: Market For Registrant's Common Equity, Related Stockholder Matters and Issuer Purchases Of Equity SecuritiesItem 6: Selected Financial DataItem 7: Management S Discussion and Analysis Of Financial Condition and Results Of OperationsItem 7A: Quantitative and Qualitative Disclosures About Market RiskItem 8: Financial Statements and Supplementary DataItem 9: Changes in and Disagreements with Accountants on Accounting and Financial DisclosureItem 9A: Controls and ProceduresItem 9B: Other InformationPart IIIItem 10: Directors, Executive Officers and Corporate GovernanceItem 11: Executive CompensationItem 12: Security Ownership Of Certain Beneficial Owners and Management and Related Stockholder MattersItem 13: Certain Relationships and Related Transactions, and Director IndependenceItem 14: Principal Accountant Fees and ServicesPart IVItem 15. Exhibits and Financial Statement SchedulesNote 1 Overview and Summary Of Significant Accounting PoliciesNote 2 Net Income Per ShareNote 3 Business CombinationsNote 4 Goodwill and Intangible AssetsNote 5 InvestmentsNote 6 Fair Value Measurement Of Financial Assets and LiabilitiesNote 7 Derivative InstrumentsNote 8 Property and Equipment, NetNote 9 Loans and Interest Receivable, NetNote 10 Segment and Geographical InformationNote 11 Commitments and ContingenciesNote 12 Related Party TransactionsNote 13 Stock-based and Employee Savings PlansNote 14 Income TaxesNote 15 RestructuringNote 16 Accumulated Other Comprehensive (loss) IncomeNote 17 Subsequent Events