PYXUS INTERNATIONAL, INC.
10-Ks and 10-Qs
|
|
|
|
|
|
|
|
|
|
|
|
|
|
|
|
|
|
|
|
|
|
|
|
|
|
|
|
|
|
|
|
|
|
|
|
|
|
|
|
|
|
|
|
|
|
|
|
|
|
|
|
|
|
|
|
|
|
|
|
|
|
UNITED STATES
SECURITIES AND EXCHANGE COMMISSION
SECURITIES AND EXCHANGE COMMISSION
WASHINGTON, D.C. 20549
FORM 10-K
[X] ANNUAL REPORT PURSUANT TO SECTION 13 OR 15(d) OF THE SECURITIES
EXCHANGE ACT OF 1934 FOR THE FISCAL YEAR ENDED March 31, 2016
[ ] TRANSITION REPORT PURSUANT TO SECTION 13 OR 15(d) OF THE SECURITIES
EXCHANGE ACT OF 1934 FOR THE TRANSITION PERIOD FROM _______ TO _______.

Alliance One International, Inc.
(Exact name of registrant as specified in its charter)
|
Virginia
|
001-13684
|
54-1746567
|
|
(State or other jurisdiction
of incorporation) |
(Commission File Number)
|
(I.R.S. Employer
Identification No.) |
8001 Aerial Center Parkway
Morrisville, North Carolina 27560-8417
(Address of principal executive offices)
Telephone Number (919) 379-4300
(Registrant’s telephone number, including area code)
Securities registered pursuant to Section 12(b) of the Act:
|
Title of Each Class
|
Name of Exchange On Which Registered
|
|
Common Stock (no par value)
|
New York Stock Exchange
|
Securities registered pursuant to Section 12(g) of the Act: None
Indicate by check mark if the registrant is a well-known seasoned issuer, as defined in Rule 405 of the Securities Act.
Yes [ ] No[X]
Indicate by check mark if the registrant is not required to file reports pursuant to Section 13 or Section 15(d) of the
Exchange Act. Yes [ ] No [X]
Indicate by check mark whether the registrant (1) has filed all reports required to be filed by Section 13 or 15(d) of the Securities Exchange Act of 1934 during the preceding 12 months (or for such shorter period that the registrant was required to file such reports), and (2) has been subject to such filing requirements for the past 90 days. Yes [X] No [ ]
Indicate by check mark whether the registrant has submitted electronically and posted on its corporate Web site, if any, every Interactive Data File required to be submitted and posted pursuant to Rule 405 of Regulation S-T (§232.405 of this chapter) during the preceding 12 months (or for such shorter period that the registrant was required to submit and post such files). Yes [X] No [ ]
Indicate by check mark if disclosure of delinquent filers pursuant to Item 405 of Regulation S-K (§229.405 of this chapter) is not contained herein, and will not be contained, to the best of registrant's knowledge, in definitive proxy or information statements incorporated by reference in Part III of this Form 10-K or any amendment to this Form 10-K. [X]
Indicate by check mark whether the registrant is a large accelerated filer, an accelerated filer, a non-accelerated filer, or a smaller reporting company. See the definitions of “large accelerated filer,” “accelerated filer,” and “smaller reporting company” in Rule 12b-2 of the Exchange Act. (Check one):
Large Accelerated Filer [] Accelerated Filer [X] Non-Accelerated filer [] Smaller Reporting Company []
(Do not check if a smaller reporting company)
Indicate by check mark whether the registrant is a shell company (as defined in Rule 12b-2 of the Exchange Act). Yes [ ] No [X]
As of September 30, 2015, the aggregate market value of the registrant’s common stock held by non-affiliates of the registrant was approximately $167.6 million based on the closing sale price of the common stock as reported on the New York Stock Exchange. As of July 1, 2016, there were 8,923,319 shares of Common Stock outstanding (no par value) excluding 785,313 shares owned by a wholly owned subsidiary.
DOCUMENTS INCORPORATED BY REFERENCE
Certain information contained in the Proxy Statement for the Annual Meeting of Shareholders (to be held August 11, 2016) of the registrant is incorporated by reference into Part III hereof.
|
TABLE OF CONTENTS
|
|
|
PART I
|
|
|
ITEM 1.
|
|
|
ITEM 1A.
|
|
|
ITEM 1B.
|
|
|
ITEM 2.
|
|
|
ITEM 3.
|
|
|
ITEM 4.
|
|
|
PART II
|
|
|
ITEM 5.
|
|
|
ITEM 6.
|
|
|
ITEM 7.
|
|
|
ITEM 7A.
|
|
|
ITEM 8.
|
|
|
ITEM 9.
|
|
|
ITEM 9A.
|
|
|
ITEM 9B.
|
|
|
PART III
|
|
|
ITEM 10.
|
|
|
ITEM 11.
|
|
|
ITEM 12.
|
|
|
ITEM 13.
|
|
|
ITEM 14.
|
|
|
PART IV
|
|
|
ITEM 15.
|
|
- 2
-
A. The Company
Alliance One International, Inc. ("we," "Alliance One" or the "Company") is a Virginia corporation with revenues of approximately $1.9 billion and operating income of approximately $201.8 million for the year ended March 31, 2016. Our common stock has been traded on the New York Stock Exchange since 1995. Through our predecessor companies, we have a long operating history in the leaf tobacco industry with some customer relationships beginning in the early 1900s. Alliance One is one of only two global publicly held leaf tobacco merchants, each with similar global market shares. We have broad geographic processing capabilities, a diversified product offering and an established customer base, including all of the major consumer tobacco product manufacturers. Our goal is to be the preferred supplier of quality tobacco products and innovative solutions to the world’s manufacturers and marketers of tobacco products.
Additional Information
We are required to file annual, quarterly and current reports, proxy statements and other information with the U.S. Securities and Exchange Commission (“SEC”). The public may read and copy any materials that we file with the SEC at the SEC’s Public Reference Room at 100 F Street, NE, Washington, D.C. 20549. Information on the Public Reference Room may be obtained by calling the SEC at 1-800-SEC-0330. In addition, the SEC maintains an internet site that contains reports, proxy and information statements, and other information regarding issuers that file with the SEC at
http://www.sec.gov
.
Our website address is
http://www.aointl.com
. We make available free of charge through our website our annual report on Form 10-K, quarterly reports on Form 10-Q, current reports on Form 8-K and all amendments to those reports as soon as reasonably practicable after such material is electronically filed with or furnished to the SEC. The information contained on our website shall not be deemed part of this annual report on Form 10-K for any reason.
B. The Business
Leaf tobacco merchants purchase, process, pack, store and ship tobacco to manufacturers of cigarettes and other consumer tobacco products throughout the world. In an increasing number of markets, we also provide agronomy expertise for growing leaf tobacco. Our revenues are primarily comprised of sales of processed tobacco and fees charged for processing and related services to these manufacturers of tobacco products. Processing and other revenues are less than 5% of our total revenues. We do not manufacture cigarettes or other consumer tobacco products.
We deal primarily in flue-cured, burley, and oriental tobaccos that are used in international brand cigarettes. Several of the large multinational cigarette manufacturers have operations throughout the world, particularly in Asia, Eastern Europe and the former Soviet Union, in order to access and penetrate the international brand cigarette markets. As cigarette manufacturers expand their global operations, we believe that demand will increase for local sources of leaf tobacco and local tobacco processing and distribution, primarily due to beneficial tariff rates and lower freight costs. We believe that for some large multinational cigarette manufacturers, international expansion will cause them to place greater reliance on the services of leaf tobacco merchants with the ability to source and process tobacco on a global basis and to help develop higher quality local sources of tobacco by improving local agronomic practices. For other large multinational cigarette manufacturers, international expansion also includes vertical integration of their operations, either through acquisition of the operations of existing leaf tobacco merchants, establishing new operations or contracting directly with suppliers. In fiscal 2014, we completed the formation of a joint venture in Brazil with China Tobacco International, Inc. The joint venture entity had previously operated as one of our subsidiaries since its formation in 2012. In recent years, Japan Tobacco, Inc. (“JTI”) enhanced their direct leaf procurement capabilities with the acquisition of small leaf processors in Malawi and Brazil and the formation a joint venture for tobacco leaf in the United States. Philip Morris International, Inc. (“PMI”) has also strengthened their direct leaf procurement capabilities with the acquisition of supplier contracts and the related assets from Alliance One and from another tobacco merchant in Brazil. In addition, some customers have entered into joint venture arrangements to secure their future leaf requirements. In fiscal 2016, some customers began reversing certain aspects of their previous vertical integration of operations. We will continue to work with our customers to meet all their needs as their buying patterns and business models change while continuing to be a provider of quality tobacco products and innovative solutions.
Purchasing
Tobacco is primarily purchased directly from suppliers with small quantities still sold at auction. In non-auction markets, we purchase tobacco directly from suppliers and we assume the risk of matching the quantities and grades required by our customers to the entire crop we must purchase under contract. In other non-auction markets, such as China, we buy tobacco from local entities that have purchased tobacco from suppliers and supervise the processing of that tobacco by those local entities. Principal auction markets include India, Malawi and Zimbabwe and our network of tobacco operations and buyers allows us to cover the major auctions of flue-cured and burley tobacco throughout the world. In the United States and other locations, a number of our customers purchase tobacco directly from the suppliers in addition to the leaf merchants. Although our facilities process the tobacco purchased directly from suppliers by these customers, we do not take ownership of that tobacco and do not record sales revenues associated with its resale.
- 3
-
Purchasing (continued)
Our arrangements with suppliers vary from locale to locale depending on our predictions of future supply and demand, local historical practice and availability of capital. In certain jurisdictions, we purchase seeds, fertilizer, pesticides and other products related to growing tobacco and advance them to suppliers, which represents prepaid inventory. The suppliers then utilize these inputs to grow tobacco, which we are contractually obligated to purchase. The advances of inputs for the current crop generally include the original cost of the inputs plus a mark-up and interest as it is earned. Where contractually permitted, we charge interest to the suppliers during the period the current crop advance is outstanding. We generally advance inputs at a price greater than our cost, which results in a mark-up on the inputs. We account for our advances to tobacco suppliers using a cost accumulation model, which results in us reporting our advances at the lower of cost or recoverable amounts excluding the mark-up and interest. The mark-up and interest on our advances are recognized when the tobacco is delivered as a decrease in our cost of the current crop. Upon delivery of tobacco, part of the purchase price paid to the supplier is paid in cash and part through a reduction of the advance balance. The advances applied to the delivery are reclassified out of advances and into unprocessed inventory. We advance inputs only to suppliers with whom we have purchase contracts. For example, in Brazil, we generally contract to purchase a supplier's entire tobacco crop at the market price per grade at the time of harvest based on the quality of the tobacco delivered. Pursuant to these purchase contracts, we provide suppliers with fertilizer and other materials necessary to grow tobacco and may guarantee Brazilian rural credit loans to suppliers to finance the crop. Under longer-term arrangements with suppliers, we may advance or guarantee financing on suppliers' capital assets, which are also recovered through the delivery of tobacco to us by our suppliers.
In these jurisdictions, our agronomists maintain frequent contact with suppliers prior to and during the growing and curing seasons to provide technical assistance to improve the quality and yield of the crop. As a result of various factors including weather, not all suppliers are able to settle the entire amount of advances through delivery of tobacco in a given crop year. Throughout the crop cycle, we monitor events that may impact the suppliers’ ability to deliver tobacco. If we determine we will not be able to recover the original cost of the advances with deliveries of the current crop, or future crop deliveries, the unit cost of tobacco actually received is increased when unrecoverable costs are within a normal range which is based on our historical results or expensed immediately when they are above a normal range based on our historical results. We account for the unrecoverable costs in this manner to ensure only costs within a normal range are capitalized in inventory and costs that are above a normal range are expensed immediately as current period charges.
Alliance One has developed an extensive international network through which we purchase, process and sell tobacco and we hold a leading position in most tobacco growing regions in the world. We purchase tobacco in more than 35 countries. During the three years ended March 31, 2016, 2015 and 2014, approximately 24%, 20% and 21%, respectively, of our purchases of tobacco were from the North America operating segment and approximately 76%, 80% and 79%, respectively, were from the Other Regions operating segment. Within the Other Regions operating segment, approximately 61%, 63% and 63% of our total purchases for the three years ended March 31, 2016, 2015 and 2014, respectively, were from China, Brazil, Turkey and the Africa Region.
Processing
We process tobacco to meet each customer's specifications as to quality, yield, chemistry, particle size, moisture content and other characteristics. Unprocessed tobacco is a semi-perishable commodity that generally must be processed within a relatively short period of time to prevent fermentation or deterioration in quality. The processing of leaf tobacco facilitates shipping and prevents spoilage and is an essential service to our customers because the quality of processed leaf tobacco substantially affects the quality of the manufacturer’s end product. Accordingly, we have located our production facilities in proximity to our principal sources of tobacco.
We process tobacco in more than 35 owned and third-party facilities around the world including Argentina, Brazil, China, Zimbabwe, Jordan, Guatemala, India, Tanzania, the United States, Malawi, Thailand, Germany, Indonesia, Macedonia, Bulgaria and Turkey. These facilities encompass all leading export locations of flue-cured, burley and oriental tobaccos. In addition, we have entered into contracts, joint ventures and other arrangements for the purchase of tobacco grown in substantially all other countries that produce export-quality flue-cured and burley tobacco.
Upon arrival at our processing plants, flue-cured and burley tobacco is first reclassified according to grade. Most of that tobacco is then blended to meet customer specifications regarding color, body and chemistry, threshed to remove the stem from the leaf and further processed to produce strips of tobacco and sieve out small scrap. We also sell a small amount of processed but unthreshed flue-cured and burley tobacco in loose-leaf and bundle form to certain customers. Oriental tobaccos are handled and processed in a similar manner other than that the tobaccos are not threshed to remove stems.
Processed flue-cured, burley and oriental tobacco is redried to remove excess moisture so that it can be held in storage by customers or us for long periods of time. After redrying, whole leaves, bundles, strips or stems and scrap where applicable are separately packed in cases, bales, cartons or hogsheads for storage and shipment. Packed flue-cured, burley and oriental tobacco generally is transported in the country of origin by truck or rail, and exports are moved by ship. Prior to and during processing, steps are taken to ensure consistent quality of the tobacco, including the regrading and removal of undesirable leaves, dirt and other non-tobacco related material. Customer representatives are frequently present at our facilities to monitor the processing of their particular orders. Throughout the processing, our technicians use quality control laboratory test equipment to ensure that the product meets all customer specifications.
- 4
-
Selling
We ship tobacco to manufacturers of cigarettes and other consumer tobacco products located in approximately 90 countries around the world as designated by these manufacturers. We recognize sales revenue when persuasive evidence of an arrangement exists, the price to the customer is fixed, collectability is reasonably assured and title and risk of ownership is passed to the customer, which is upon either shipment or delivery. In certain countries we also use commissioned agents to supplement our selling efforts. Individual shipments may be large, and since the customer typically specifies shipping dates, our financial results may vary significantly between reporting periods due to timing of sales. In some markets, principally the United States, we process tobacco that is owned by our customers, and revenue is recognized when the processing is completed.
The consumer tobacco business is dominated by a relatively small number of large multinational cigarette manufacturers and by government controlled entities. Including their respective affiliates, accounting for more than 10% of our revenues were each of PMI and China Tobacco International, Inc. for the years ended March 31, 2016, 2015 and 2014.
In 2016, Alliance One delivered approximately 44% of its tobacco sales to customers in Europe and approximately 16% to customers in the United States. One customer directs shipments to its Belgium storage and distribution center before shipment to its manufacturing facilities in Europe and Asia. In 2016, these Belgium sales accounted for 7% of sales to customers in Europe. The remaining sales are to customers located in Asia, Africa and other geographic regions of the world.
Seasonality
The purchasing and processing activities of our tobacco business are seasonal. Flue-cured tobacco grown in the United States is purchased, processed and marketed generally during the five-month period beginning in July and ending in November. U.S. grown burley tobacco is purchased, processed and marketed usually from late November through January or February. Tobacco grown in Brazil is usually purchased, processed and marketed from January through July and in Africa from April through September. Other markets around the world have similar purchasing periods, although at different times of the year.
During the purchasing, processing and marketing seasons, inventories of unprocessed tobacco, inventories of redried tobacco and trade accounts receivable normally reach peak levels in succession. Current liabilities, particularly advances from customers and short-term notes payable to banks, normally reach their peak in this period as a means of financing the seasonal expansion of current assets. At March 31, the end of our fiscal year, the seasonal components of our working capital reflect primarily the operations related to foreign grown tobacco.
Competition
Alliance One is one of only two global publicly held leaf tobacco merchants, with substantially similar global market shares in markets in which we both operate. We hold a leading position in most major tobacco growing regions in the world, including the principal export markets for flue-cured, burley and oriental tobacco and, as a result of our scale, global reach, and financial resources, we believe we are well-suited to serve the needs of all manufacturers of cigarettes and other consumer tobacco products.
The leaf tobacco industry is highly competitive and competition is based primarily on the price charged for products and services as well as the merchant's ability to meet customer specifications in the buying, processing, residue compliance and financing of tobacco. In addition to the primary global independent leaf tobacco merchants, there are a number of other independent global, regional or national competitors. Local independent leaf merchants with low fixed costs and overhead also supply cigarette manufacturers. Recent vertical integration initiatives and other changes in customer buying patterns have resulted in a more dynamic and competitive operating environment. There is also competition in all countries to buy the available leaf tobacco and in many areas, total leaf tobacco processing capacity exceeds demand.
Reportable Segments
The purchasing, processing, selling and storing of leaf tobacco is similar throughout our business. However, we maintain regional operating and financial management in North America, South America, Europe, Africa and Asia to monitor our various operations in these areas. In reviewing these operations, we have concluded that the economic characteristics of North America are dissimilar from the other operating regions. Based on this fact, we disclose North America separately and aggregate the remaining four operating segments, Africa, Asia, Europe and South America into one reportable segment “Other Regions.” Our financial performance is reviewed at this level and these regions represent our operating segments. See Note 14 “Segment Information” to the “Notes to Consolidated Financial Statements” for financial information attributable to our reportable segments.
C. Other
Research and Development
We routinely cooperate with both our customers and the manufacturers of the equipment used in our processing facilities to improve processing technologies. However, no material amounts are expended for research and development, and we hold no material patents, licenses, franchises, or concessions.
- 5
-
Alliance One Employees
Alliance One's consolidated entities employed approximately 3,299 persons, excluding seasonal employees, in our worldwide operations at March 31, 2016. In the Other Regions operating segment, Alliance One's consolidated entities employed approximately 2,665 employees at March 31, 2016, excluding approximately 4,536 seasonal employees. Most seasonal employees are covered by collective bargaining agreements. In the North America operating segment, Alliance One's consolidated entities employed approximately 634 employees at March 31, 2016, excluding approximately 206 seasonal employees. Most seasonal employees as well as approximately 202 full-time factory personnel in the United States are covered by collective bargaining agreements. We consider Alliance One's employee relations to be satisfactory.
Government Regulation and Environmental Compliance
See Item 1A. “Risk Factors” for a discussion of government regulation. Currently there are no material estimated capital expenditures related to environmental control facilities. In addition, there is no material effect on capital expenditures, results of operations or competitive position anticipated as a result of compliance with current or pending federal or state laws and regulations relating to protection of the environment.
EXECUTIVE OFFICERS OF ALLIANCE ONE INTERNATIONAL, INC.
The following information is furnished with respect to the Company's executive officers as of April 1, 2016, and the capacities in which they serve. These officers serve at the pleasure of the Board of Directors and are elected at each annual organizational meeting of the Board.
|
NAME
|
AGE
|
TITLE
|
|
J. Pieter Sikkel
|
52
|
President and Chief Executive Officer
|
|
Graham J. Kayes
|
51
|
Executive Vice President - Business Relationship Management and Leaf
|
|
Jose Maria Costa Garcia
|
50
|
Executive Vice President - Global Operations and Supply Chain
|
|
Joel L. Thomas
|
49
|
Executive Vice-President - Chief Financial Officer
|
|
William L. O’Quinn, Jr.
|
47
|
Senior Vice President - Chief Legal Officer and Secretary
|
The business experience summaries provided below for the Company's executive officers describe positions held by the named individuals during the last five years.
J. Pieter Sikkel
has served as President and Chief Executive Officer of Alliance One International, Inc., since March 2013, having previously served as President from December 14, 2010 through February 2013, Executive Vice President - Business Strategy and Relationship Management from May 2007 through December 13, 2010, and as Regional Director of Asia from May 2005 through April 2007.
Graham J. Kayes
has served as Executive Vice President - Business Relationship Management and Leaf since July 2014, having previously served as Regional Director - Africa from February 2011 through June 2014, and as Managing Director of the Company's Tanzanian subsidiary from June 2007 through January 2011.
Jose Maria Costa Garcia
has served as Executive Vice President - Global Operations and Supply Chain since August 2012, having previously served as Regional Director - Europe from September 2008 through July 2012, and as Regional Financial Director - Europe from April 2005 through August 2008.
Joel L. Thomas
has served as Executive Vice President - Chief Financial Officer since January 2014, having previously served as Vice President - Treasurer from December 2005 through December 2013.
William L. O’Quinn, Jr.
has served as Senior Vice President - Chief Legal Officer and Secretary since April 2011, having previously served as Senior Vice President - Assistant General Counsel and Secretary from January 2011 through March 2011, and as Assistant General Counsel and Assistant Secretary from August 2005 through December 2010.
- 6
-
ITEM 1A.
RISK FACTORS
The following risk factors should be read carefully in connection with evaluating our business and the forward-looking statements contained in this Annual Report on Form 10-K. Any of the following risks could materially adversely affect our business, our operating results, our financial condition and the actual outcome of matters as to which forward-looking statements are made in this Annual Report.
We may from time to time make written or oral forward-looking statements, including statements contained in filings with the SEC, in reports to stockholders and in press releases and investor calls and webcasts. You can identify these forward-looking statements by use of words such as “strategy,” “expects,” “continues,” “plans,” “anticipates,” “believes,” “will,” “estimates,” “intends,” “projects,” “goals,” “targets” and other words of similar meaning. You can also identify them by the fact that they do not relate strictly to historical or current facts.
We cannot guarantee that any forward-looking statement will be realized, although we believe we have been prudent in our plans and assumptions. Achievement of future results is subject to risks, uncertainties and inaccurate assumptions. Should known or unknown risks or uncertainties materialize, or should underlying assumptions prove inaccurate, actual results could vary materially from those anticipated, estimated or projected. Investors should bear this in mind as they consider forward-looking statements and whether to invest in or remain invested in Alliance One International, Inc. securities. In connection with the “safe harbor” provisions of the Private Securities Litigation Reform Act of 1995, we are identifying important risk factors that, individually or in the aggregate, could cause actual results and outcomes to differ materially from those contained in any forward-looking statements made by us; any such statement is qualified by reference to the following cautionary statements. We elaborate on these and other risks we face throughout this document. You should understand that it is not possible to predict or identify all risk factors. Consequently, you should not consider the following to be a complete discussion of all potential risks or uncertainties. We do not undertake to update any forward-looking statement that we may make from time to time.
Risks Relating to Our Operations
Our reliance on a small number of significant customers may adversely affect our financial statements.
Our customers are manufacturers of cigarette and other tobacco products. Several of these customers individually account for a significant portion of our sales in a normal year.
For the year ended March 31, 2016, each of Philip Morris International, Inc. and China Tobacco International Inc., including their respective affiliates, accounted for more than 10% of our revenues from continuing operations. In addition, tobacco product manufacturers have experienced consolidation and further consolidation among our customers could decrease such customers’ demand for our leaf tobacco or processing services. The loss of any one or more of our significant customers could have a material adverse effect on our financial statements.
Continued vertical integration by our customers could materially adversely affect our financial statements.
Demand for our leaf tobacco or processing services could be materially reduced if cigarette manufacturers continue to significantly vertically integrate their operations, either through acquisition of our competitors, establishing new operations or contracting directly with suppliers. During fiscal 2014, we completed the formation of a joint venture in Brazil with China Tobacco International Inc. The joint venture entity had previously operated as one of our subsidiaries since its formation in 2012. In recent years, Japan Tobacco, Inc. vertically integrated operations in Malawi, Brazil and the United States. In addition, Philip Morris International, Inc. acquired supplier contracts and related assets in Brazil in order to procure leaf directly. In general, our results of operations have been adversely affected by vertical integration initiatives. Although in fiscal 2016, some customers began reversing certain aspects of their previous vertical integration of operations, further vertical integration by our customers could have a material adverse effect on our financial statements.
Global shifts in sourcing customer requirements may negatively impact our organizational structure and asset base.
The global leaf tobacco industry has experienced shifts in the sourcing of customer requirements for tobacco. For example, significant tobacco production volume decreases have occurred in the United States, Zimbabwe and Western Europe from historical levels. At the same time, production volumes in other sourcing origins, such as Brazil and other areas of Africa, have stabilized. Additional shifts in sourcing may occur as a result of currency fluctuations, including devaluation of the U.S. dollar. A shift in sourcing origins in Europe has been influenced by modifications to the tobacco price support system in the European Union (EU). Customer requirements have changed due to these variations in production, which could influence our ability to plan effectively for the longer term in Europe.
We may not be able to timely or efficiently adjust to shifts in sourcing origins, and adjusting to shifts may require changes in our production facilities in certain origins and changes in our fixed asset base. We have incurred, and may continue to incur, restructuring charges as we continue to adjust to shifts in sourcing. Adjusting our capacity and adjusting to shifts in sourcing may have an adverse impact on our ability to manage our costs, and could have an adverse effect on our financial performance.
- 7
-
Risks Relating to Our Operations
(continued)
Our financial results will vary according to growing conditions, customer indications and other factors, which reduces your ability to gauge our quarterly and annual financial performance.
Our financial results, particularly the quarterly financial results, may be significantly affected by fluctuations in tobacco growing seasons and crop sizes which affect the supply of tobacco. Crop sizes may be affected by, among other things, crop infestation and disease, the volume of annual tobacco plantings and yields realized by supplier and suppliers' elections to grow crops other than tobacco. The cultivation period for tobacco is dependent upon a number of factors, including the weather and other natural events, such as hurricanes or tropical storms, and our processing schedule and results of operations for any quarterly period can be significantly altered by these factors.
The cost of acquiring tobacco can fluctuate greatly due to crop sizes and increased competition in certain markets in which we purchase tobacco. For example, short crops in periods of high demand translate into higher average green prices, higher throughput costs and less volume to sell. Furthermore, large crops translate into lower average green prices, lower throughput costs and excess volume to sell.
Further, the timing and unpredictability of customer indications, orders and shipments cause us to keep tobacco in inventory, increase our risk and result in variations in quarterly and annual financial results. The timing of shipments can be materially impacted by shortages of containers and vessels for shipping as well as infrastructure and accessibility issues in ports we use for shipment. We may from time to time in the ordinary course of business keep a significant amount of processed tobacco in inventory for our customers to accommodate their inventory management and other needs. Sales recognition by us and our subsidiaries is based on the passage of ownership, usually with shipment of product. Because individual shipments may represent significant amounts of revenue, our quarterly and annual financial results may vary significantly depending on our customers’ needs and shipping instructions. These fluctuations result in varying volumes and sales in given periods, which also reduces your ability to compare our financial results in different periods or in the same periods in different years.
Suppliers who have historically grown tobacco and from whom we have purchased tobacco may elect to grow other crops instead of tobacco, which affects the world supply of tobacco and may impact our quarterly and annual financial performance.
Increases in the prices for other crops have led and may in the future lead suppliers who have historically grown tobacco, and from whom we have purchased tobacco, to elect to grow these other, more profitable items instead of tobacco. A decrease in the volume of tobacco available for purchase may increase the purchase price of such tobacco. As a result, we could experience an increase in tobacco crop acquisition costs which may impact our quarterly and annual financial performance.
Our advancement of inputs to tobacco suppliers could expose us to losses.
We advance seeds, fertilizer, pesticides and other products related to growing tobacco to our suppliers, which represent prepaid inventory, in many countries to allow the suppliers to grow tobacco, which we are contractually obligated to purchase. The advances to tobacco suppliers are settled as part of the consideration paid upon the suppliers delivering us unprocessed tobacco at market prices. Two primary factors determine the market value of the tobacco suppliers deliver to us: the quantity of tobacco delivered and the quality of the tobacco delivered. Unsatisfactory quantities or quality of the tobacco delivered could result in losses with respect to advances to our tobacco suppliers or the deferral of those advances.
When we purchase tobacco directly from suppliers, we bear the risk that the tobacco will not meet our customers’ quality and quantity requirements.
In countries where we contract directly with tobacco suppliers, including Argentina, Brazil, the United States and certain African countries, we bear the risk that the tobacco delivered will not meet quality and quantity requirements of our customers. If the tobacco does not meet such market requirements, we may not be able to sell the tobacco we agreed to buy and may not be able to meet all of our customers’ orders, which would have an adverse effect on our profitability and results of operations.
Weather and other conditions can affect the marketability of our inventory.
Like other agricultural products, the quality of tobacco is affected by weather and the environment, which can change the quality or size of the crop. If a weather event is particularly severe, such as a major drought or hurricane, the affected crop could be destroyed or damaged to an extent that it would be less desirable to our customers, which would result in a reduction in revenues. If such an event is also widespread, it could affect our ability to acquire the quantity of products required by customers. In addition, other items can affect the marketability of tobacco, including, among other things, the presence of:
|
•
|
non-tobacco related material;
|
|
•
|
genetically modified organisms; and
|
|
•
|
excess residues of pesticides, fungicides and herbicides.
|
A significant event impacting the condition or quality of a large amount of any of the tobacco crops we buy could make it difficult for us to sell such tobacco or to fill our customers’ orders. In addition, in the event of climate change, adverse weather patterns could develop in the growing regions in which we purchase tobacco. Such adverse weather patterns could result in more permanent disruptions in the quality and size of the available crop, which could adversely affect our business.
- 8
-
Risks relating to Our Operations
(continued)
We face increased risks of doing business due to the extent of our international operations.
We do business in more than 35 countries, some of which do not have stable economies or governments. Our international operations are subject to international business risks, including unsettled political conditions, uncertainty in the enforcement of legal obligations, including the collection of accounts receivable, fraud risks, expropriation, import and export restrictions, exchange controls, inflationary economies, currency risks and risks related to the restrictions on repatriation of earnings or proceeds from liquidated assets of foreign subsidiaries. These risks are exacerbated in countries where we have advanced substantial sums or guaranteed local loans or lines of credit for the purchase of tobacco from suppliers. For example, in 2006 as a result of the political environment, economic instability, foreign currency controls and governmental regulations in Zimbabwe, we deconsolidated our Zimbabwe subsidiary, Mashonaland Tobacco Company LTD ("MTC"). Subsequently, we determined that the significant doubt about our ability to control MTC was eliminated and we have reconsolidated MTC as of March 31, 2016.
Our international operations are in areas where the demand is for the export of lower priced tobacco. We have significant investments in our purchasing, processing and exporting operations in Argentina, Brazil, Malawi, Tanzania and Turkey.
In recent years, economic problems in certain African countries have received wide publicity related to devaluation and appreciation of the local currency and inflation, including the classification of Malawi's economy as highly inflationary. Devaluation and appreciation can affect our purchase costs of tobacco and our processing costs. In addition, we conduct business with suppliers and customers in countries that have recently had or may be subject to dramatic political regime change, such as Egypt. In the event of such dramatic changes in the government of such countries, we may be unable to continue to operate our business, or adequately enforce legal obligations, after the change in a manner consistent with prior practice.
We are subject to the Foreign Corrupt Practices Act (the “FCPA”) and operate in jurisdictions that pose a high risk of potential FCPA violations.
We are subject to the FCPA, which generally prohibits companies and their intermediaries from making improper payments to foreign officials for the purpose of obtaining or keeping business and/or other benefits. We operate in a number of jurisdictions that pose a high risk of potential FCPA violations. Although our corporate policy prohibits foreign bribery and we have adopted procedures to promote compliance, there is no assurance that our policy or procedures will work effectively all of the time or protect us against liability under the FCPA for actions taken by our agents, employees and intermediaries with respect to our business or any businesses that we acquire. Failure to comply with the FCPA, other anti-corruption laws and other laws governing the conduct of business with government entities (including local laws) could lead to criminal and civil penalties and other remedial measures (including further changes or enhancements to our procedures, policies, and controls, the imposition of a compliance monitor at our expense and potential personnel changes and/or disciplinary actions), any of which could have an adverse impact on our business, financial condition, results of operations and liquidity. Any investigation of any potential violations of the FCPA or other anti-corruption laws by U.S. or foreign authorities also could have an adverse impact on our business, financial condition and results of operations.
In 2010, we entered into settlements with the SEC and the U.S. Department of Justice to resolve their investigations regarding potential criminal and civil violations of the FCPA. The settlements resulted in the disgorgement in profits and fines totaling $19.45 million, which have been paid. Both settlements also required us to retain an independent compliance monitor for a three year term that was completed September 30, 2013.
Our exposure to changes in foreign tax regimes could adversely impact our business.
We do business in countries that have tax regimes in which the rules are not clear, are not consistently applied and are subject to sudden change. This is especially true with regard to international transfer pricing. Our earnings could be reduced by the uncertain and changing nature of these tax regimes.
Fluctuations in foreign currency exchange and interest rates could adversely affect our results of operations.
We conduct our business in many countries around the world. Our business is generally conducted in U.S. dollars, as is the business of the leaf tobacco industry as a whole. However, we generally must purchase tobacco in non-U.S. countries using local currency. As a result, local country operating costs, including the purchasing and processing costs for tobaccos, are subject to the effects of exchange fluctuations of the local currency against the U.S. dollar. When the U.S. dollar weakens against foreign currencies, our costs for purchasing and processing tobacco in such currencies increases. We attempt to minimize such currency risks by matching the timing of our working capital borrowing needs against the tobacco purchasing and processing funds requirements in the currency of the country where the tobacco is grown. Fluctuations in the value of foreign currencies can significantly affect our operating results.
In addition, the devaluation of foreign currencies has resulted and may in the future result in reduced purchasing power from customers whose capital resources are denominated in those currencies. We may incur a loss of business as a result of the devaluation of these currencies now or in the future.
- 9
-
Risks relating to Our Operations
(continued)
Low investment performance by our defined benefit pension plan assets may increase our pension expense, and may require us to fund a larger portion of our pension obligations, thus, diverting funds from other potential uses.
We sponsor defined benefit pension plans that cover certain eligible employees. Our pension expense and required contributions to our pension plans are directly affected by the value of plan assets, the projected rate of return on plan assets, the actual rate of return on plan assets, and the actuarial assumptions we use to measure the defined benefit pension plan obligations.
If plan assets perform below the assumed rate of return used to determine pension expense, future pension expense will increase. Further, as a result of the global economic instability or other economic market events, our pension plan investment portfolio may experience significant volatility.
The proportion of pension assets to liabilities, which is called the funded status, determines the level of contribution to the plan that is required by law. In recent years, we have funded the plan in amounts as required, but changes in the plan’s funded status related to the value of assets or liabilities could increase the amount required to be funded. We cannot predict whether changing market or economic conditions, regulatory changes or other factors will further increase our pension funding obligations, diverting funds that would otherwise be available for other uses.
Competition could erode our earnings.
The leaf tobacco industry is highly competitive. We are one of two global publicly held competitors in the leaf tobacco industry, each with similar global market shares. Competition is based primarily on the prices charged for products and services as well as the merchant’s ability to meet customer specifications in the buying, processing and financing of tobacco. In addition, there is competition in all countries to buy the available tobacco. The loss or substantial reduction of any large or significant customer could reduce our earnings.
In addition to the two primary global independent leaf tobacco merchants, the cigarette manufacturers increasingly buy tobacco directly from suppliers. We also face increasing competition from new local and regional independent leaf merchants with low fixed costs and overhead and good customer connections at the local level, particularly Brazil and parts of Africa, where the new entrants have been able to capitalize in the global transition to those markets. Any of these sources of new competition may result in less tobacco available for us to purchase and process in the applicable markets.
We rely on internal and externally hosted information technology systems and disruption, failure or security breaches of these systems could adversely affect our business.
We rely on information technology (IT) systems, including systems hosted by service providers. The enterprise resource planning system (SAP) we are implementing in stages throughout the company, for example, is hosted by Capgemini and our domestic employee payroll system is hosted by Ceridian. Although we have disaster recovery plans and several intrusion preventive mitigating tools and services in place, which are active inline services or are tested routinely, our portfolio of hardware and software products, solutions and services and our enterprise IT systems, including those hosted by service providers, may be vulnerable to damage or disruption caused by circumstances beyond our control, such as catastrophic events, power outages, natural disasters, computer system or network failures, computer viruses or other malicious software programs and cyber-attacks, including system hacking and other cyber-security breaches. The failure or disruption of our IT systems to perform as anticipated for any reason could disrupt our business and result in decreased performance, significant remediation costs, transaction errors, loss of data, processing inefficiencies, downtime, litigation, and the loss of suppliers or customers. A significant disruption or failure could have a material adverse effect on our business operations, financial performance and financial condition.
We have identified material weaknesses related to our internal controls and there can be no assurance that material weaknesses will not be identified in the future.
On February 19, 2016, we concluded that the financial statements included in our Annual Form 10-K for the year ended March 31, 2015 could not be relied upon due to improper accounting for accounts receivable and inventory in Kenya. As a result, we identified certain matters involving our internal control over financial reporting that we determined to be material weaknesses. We believe we will complete the remediation of those material weaknesses in internal control over financial reporting during fiscal 2017. Although we intend to aggressively monitor and improve our internal controls, we cannot assure you that other material weaknesses will not occur in the future. Any failure to implement required new or improved controls, or difficulties encountered in their implementation, could cause us to fail to meet our reporting obligations or result in misstatements in our financial statements in amounts that could be material. Ineffective internal controls could cause investors to lose confidence in our reported financial information, which could have a negative effect on the value of our common stock and could also require additional restatements of our prior reported financial information.
- 10
-
Risks Relating to Our Capital Structure
We may not continue to have access to the capital markets to obtain long-term and short-term financing on acceptable terms and conditions.
We access the short-term capital markets and, from time to time, the long-term markets to obtain financing. Although we believe that we can continue to access the capital markets in fiscal 2017 on acceptable terms and conditions, our access and the availability of acceptable terms and conditions are impacted by many factors, including: (i) our credit ratings; (ii) the liquidity and volatility of the overall capital markets; and (iii) the current state of the economy, including the tobacco industry. There can be no assurances that we will continue to have access to the capital markets on terms acceptable to us. Our U.S. revolver matures April 15, 2017 and we plan to either extend or refinance this facility during fiscal year 2017. Our inability to extend or refinance our U.S. revolver could impact our ability to meet our future liquidity requirements.
We may not have access to available capital to finance our local operations in non-U.S. jurisdictions.
We have typically financed our non-U.S. local operations with uncommitted short-term operating credit lines at the local level. These operating lines are typically seasonal in nature, normally extending for a term of 180 to 270 days corresponding to the tobacco crop cycle in that location. These facilities are typically uncommitted in that the lenders have the right to cease making loans or demand payment of outstanding loans at any time. In addition, each of these operating lines must be renewed with each tobacco crop season in that jurisdiction. Although our foreign subsidiaries are the borrowers under these lines, many of them are guaranteed by us.
As of March 31, 2016, we had approximately $486.0 million drawn and outstanding on short-term and long-term foreign seasonal lines with maximum capacity totaling $910.1 million subject to limitations under our senior secured credit facility. Additionally against these lines there was $13.1 million available in unused letter of credit capacity with $4.7 million issued but unfunded.
Because the lenders under these operating lines typically have the right to cancel the loan at any time and each line must be renewed with each crop season, there can be no assurance that this capital will be available to our subsidiaries. If a number of these lenders cease lending to our subsidiaries or dramatically decrease such lending, it could have a material adverse affect on our liquidity.
Failure of foreign banks in which our subsidiaries deposit funds or the failure to transfer funds or honor withdrawals may affect our results of operations.
Funds held by our foreign subsidiaries are often deposited in their local banks. Banks in certain foreign jurisdictions may be subject to a higher rate of failure or may not honor withdrawals of deposited funds. In addition, the countries in which these local banks operate may lack sufficient regulatory oversight or suffer from structural weaknesses in the local banking system. Due to uncertainties and risks relating to the political stability of certain foreign governments, these local banks also may be subject to exchange controls and therefore unable to perform transfers of certain currencies. If our ability to gain access to these funds was impaired, it could have a material adverse effect on our results of operations.
We have substantial debt which may adversely affect us by limiting future sources of financing, interfering with our ability to pay interest and principal on the senior notes and subjecting us to additional risks.
We have a significant amount of indebtedness and debt service obligations. As of March 31, 2016, we had approximately $1,396.5 million of indebtedness. In addition, the indenture governing the senior secured second lien notes allows us to incur additional indebtedness under certain circumstances. If we add new indebtedness to our current indebtedness levels, the related risks that we now face could increase.
Our substantial debt will have important consequences, including:
|
•
|
that our indebtedness may make it more difficult for us to satisfy our obligations with respect to the senior notes and our other obligations;
|
|
•
|
that our indebtedness may limit our ability to obtain additional financing on satisfactory terms and to otherwise fund working capital, capital expenditures, debt refinancing, acquisitions and other general corporate requirements;
|
|
•
|
that a significant portion of our cash flow from operations must be dedicated to paying interest on and the repayment of the principal of our indebtedness. This reduces the amount of cash we have available for making principal and interest payments under the senior notes and for other purposes and makes us more vulnerable to a decrease in demand for leaf tobacco, increases in our operating costs or general economic or industry conditions;
|
|
•
|
that our ability to adjust to changing market conditions and to compete with other global leaf tobacco merchants may be hampered by the amount of debt we owe;
|
|
•
|
increasing our vulnerability to general adverse economic and industry conditions;
|
|
•
|
placing us at a competitive disadvantage compared to our competitors that have less debt or are less leveraged;
|
|
•
|
limiting our flexibility in planning for, or reacting to, changes in our business and the industry in which we operate; and
|
|
•
|
restricting us from making strategic acquisitions or exploiting business opportunities.
|
- 11
-
Risks Relating to Our Capital Structure
(continued)
We have substantial debt which may adversely affect us by limiting future sources of financing, interfering with our ability to pay interest and principal on the senior notes and subjecting us to additional risks.
(continued)
In addition, the indenture governing the senior secured second lien notes and our senior secured credit facility each contain financial and other restrictive covenants that will limit our ability to engage in activities that may be in our long-term best interests. Our failure to comply with those covenants could result in an event of default which, if not cured or waived, could result in the acceleration of all of our debt. Also, a substantial portion of our debt, including borrowings under our senior secured credit facility, bears interest at variable rates. If market interest rates increase, variable-rate debt will create higher debt service requirements, which would adversely affect our cash flow. While we may enter into agreements limiting our exposure to higher debt service requirements, any such agreements may not offer complete protection from this risk.
Despite current indebtedness levels, we may still be able to incur substantially more debt. This could exacerbate further the risks associated with our significant leverage.
We may be able to incur substantial additional indebtedness in the future. The terms of the indenture governing our publicly traded senior secured second lien notes and our credit agreement restrict, but do not completely prohibit, us from doing so. Our senior secured credit facility provides for a revolving credit line of $210.3 million. There was $200.0 million outstanding under this facility at March 31, 2016. If new debt is added to our current debt levels, the related risks we now face could intensify.
The indentures governing the senior notes and our senior secured credit facility contain, and in the future could contain additional, covenants and tests that limit our ability to take actions or cause us to take actions we may not normally take.
The indenture governing the senior secured second lien notes and our senior secured credit facility contain a number of significant covenants. These covenants limit our ability to, among other things:
|
•
|
incur additional indebtedness;
|
|
•
|
issue preferred stock;
|
|
•
|
merge, consolidate or dispose of substantially all of our assets;
|
|
•
|
grant liens on our assets;
|
|
•
|
pay dividends, redeem stock or make other distributions or restricted payments;
|
|
•
|
repurchase or redeem capital stock or prepay subordinated debt;
|
|
•
|
make certain investments;
|
|
•
|
agree to restrictions on the payment of dividends to us by our subsidiaries;
|
|
•
|
sell or otherwise dispose of assets, including equity interests of our subsidiaries;
|
|
•
|
enter into transactions with our affiliates; and
|
|
•
|
enter into certain sale and leaseback transactions.
|
Our senior secured credit facility and the indenture require us to meet certain financial tests. Complying with these covenants and tests may cause us to take actions that we otherwise would not take or not take actions that we otherwise would take. The failure to comply with these covenants and tests would cause a default under the credit facility and, under the indenture, would prevent us from taking certain actions, such as incurring additional debt, paying dividends or redeeming senior notes or subordinated debt. A default, if not waived, could result in the debt under our senior secured credit facility and the indenture becoming immediately due and payable and could result in a default or acceleration of our other indebtedness with cross-default provisions. If this occurs, we may not be able to pay our debt or borrow sufficient funds to refinance it. Even if new financing is available, it may not be on terms that are acceptable to us.
We may not be able to satisfy the covenants included in our financing arrangements which could result in the default of our outstanding debt obligations.
In the recent past, we have sought and obtained waivers and amendments under our then existing financing arrangements to avoid future non-compliance with financial covenants and cure past defaults under restrictive covenants. We also paid significant fees to obtain these waivers and consents. You should consider this in evaluating our ability to comply with restrictive covenants in our debt instruments and the financial costs of our ability to do so. Any future defaults for which we do not obtain waivers or amendments could result in the acceleration of a substantial portion of our indebtedness, much of which is cross-defaulted to other indebtedness.
- 12
-
Risks Relating to Our Capital Structure
(continued)
We will require a significant amount of cash to service our indebtedness. Our ability to generate cash depends on many factors beyond our control.
Our ability to make payments on and to refinance our indebtedness, including the notes, and to fund planned capital expenditures will depend on our ability to generate cash in the future. This is subject to general economic, financial, competitive and other factors that may be beyond our control. We cannot assure you that our business will generate sufficient cash flow from operations or that future borrowings will be available to us under our senior secured credit facility or otherwise in an amount sufficient to enable us to pay our indebtedness, including the senior secured second lien notes, or to fund our other liquidity needs. We may need to refinance all or a portion of our indebtedness, including the senior secured second lien notes, on or before maturity. We cannot assure you that we will be able to refinance any of our debt, including our senior secured credit facility or the senior secured second lien notes, on commercially reasonable terms or at all. Additionally, to the extent permitted under our senior secured credit agreement and indenture, we may repurchase, repay or tender for our bank debt or our senior secured second lien notes, which may place pressure on future cash requirements to the extent that the debt repurchased, repaid or tendered cannot be redrawn.
If we refinance our current credit facilities, we may not be able to obtain the same credit availability or at interest rates similar to our current credit facilities.
If credit market conditions worsen, it could have a material adverse impact on our ability to refinance our current credit facilities on similar or better terms than our current credit facility.
Risks Related to Global Financial and Credit Markets
Volatility and disruption of global financial and credit markets may negatively impact our ability to access financing and expose us to unexpected risks.
Global financial and credit markets exposes us to a variety of risks as we fund our business with a combination of cash from operations, short-term seasonal credit lines, our revolving credit facility, long-term debt securities and customer advances. We have financed our non-U.S. operations with uncommitted unsecured short term seasonal lines of credit at the local level. These local operating lines typically extend for a term of up to one year and are typically uncommitted in that the lenders have the right to cease making loans and demand repayment of loans at any time. As of March 31, 2016, we had approximately $486.0 million drawn and outstanding on short-term and long-term foreign seasonal lines with maximum capacity totaling $910.1 million. Changes in the global financial and credit markets could create uncertainty as to whether local seasonal lines will continue to be available to finance our non-U.S. operations to the extent or on terms similar to what has been available in the past and whether repayment of existing loans under these lines will be demanded prior to maturity. To the extent that local seasonal lines cease to be available at levels necessary to finance our non-U.S. operations or we are required to repay loans under the lines prior to maturity, we may be required to seek alternative financing sources beyond our existing committed sources of funding. Based on the current financial and credit markets, we cannot assure you that such alternative funding will be available to us on terms and conditions acceptable to us, or at all. In the event that we may be required to support our non-U.S. operations by borrowing U.S. dollars under our existing senior secured credit facility, we may be exposed to additional currency exchange risk that we may be unable to successfully hedge. Further, there is additional risk that certain banks that are lenders in the U.S. senior secured credit facility could be unable to meet contractually obligated borrowing requests in the future if their financial condition were to deteriorate. In addition, we maintain deposit accounts with numerous financial institutions around the world in amounts that exceed applicable governmental deposit insurance levels. While we actively monitor our deposit relationships, we are subject to risk of loss in the event of the unanticipated failure of a financial institution in which we maintain deposits, which loss could be material to our results of operations and financial condition.
Derivative transactions may expose us to potential losses and counterparty risk.
We have entered into certain derivative transactions, including interest rate swaps and foreign exchange contracts. Changes in the fair value of these derivative financial instruments that are not accounted for as cash flow hedges are reported as income, and accordingly could materially affect our reported income in any period. In addition, the counterparties to these derivative transactions are financial institutions or affiliates of financial institutions, and we are subject to risks that these counterparties default under these transactions. In some of these transactions, our exposure to counterparty credit risk is not secured by any collateral. Global economic conditions over the last few years have resulted in the actual or perceived failure or financial difficulties of many financial institutions, including bankruptcy. If one or more of the counterparties to one or more of our derivative transactions not secured by any collateral becomes subject to insolvency proceedings, we will become an unsecured creditor in those proceedings with a claim equal to our exposure at the time under those transactions. We can provide no assurances as to the financial stability or viability of any of our counterparties.
- 13
-
Risks Relating to the Tobacco Industry
Reductions in demand for consumer tobacco products could adversely affect our results of operations.
The tobacco industry, both in the United States and abroad, continues to face a number of issues that may reduce the consumption of cigarettes and adversely affect our business, sales volume, results of operations, cash flows and financial condition.
These issues, some of which are more fully discussed below, include:
|
•
|
governmental actions seeking to ascribe to tobacco product manufacturers liability for adverse health effects associated with smoking and exposure to environmental tobacco smoke;
|
|
•
|
smoking and health litigation against tobacco product manufacturers;
|
|
•
|
increased consumer acceptance of electronic cigarettes;
|
|
•
|
tax increases on consumer tobacco products;
|
|
•
|
current and potential actions by state attorneys general to enforce the terms of the Master Settlement Agreement, or MSA, between state governments in the United States and tobacco product manufacturers;
|
|
•
|
governmental and private bans and restrictions on smoking;
|
|
•
|
actual and proposed price controls and restrictions on imports in certain jurisdictions outside the United States;
|
|
•
|
restrictions on tobacco product manufacturing, marketing, advertising and sales;
|
|
•
|
the diminishing social acceptance of smoking;
|
|
•
|
increased pressure from anti-smoking groups;
|
|
•
|
other tobacco product legislation that may be considered by Congress, the states, municipalities and other countries; and
|
|
•
|
the impact of consolidation among multinational cigarette manufacturers.
|
Tobacco product manufacturer litigation may reduce demand for our products and services.
Our primary customers, the leading cigarette manufacturers, face thousands of lawsuits brought throughout the United States and, to a lesser extent, the rest of the world. These lawsuits have been brought by plaintiffs, including (1) individuals and classes of individuals alleging personal injury and/or misleading advertising, (2) governments (including governmental and quasi-governmental entities in the United States and abroad) seeking recovery of health care costs allegedly caused by cigarette smoking, and (3) other groups seeking recovery of health care expenditures allegedly caused by cigarette smoking, including third-party health care payors, such as unions and health maintenance organizations. Damages claimed in some of the smoking and health cases range into the billions of dollars. There have been several jury verdicts in tobacco product litigation during the past several years. Additional plaintiffs continue to file lawsuits. The effects of the lawsuits on our customers could reduce their demand for tobacco from us.
Legislation and regulatory and other governmental initiatives could impose burdensome restrictions on the tobacco industry and reduce consumption of consumer tobacco products and demand for our services.
The Family Smoking Prevention and Tobacco Control Act, which amended the Food, Drug, and Cosmetic Act, extends the authority of the Food and Drug Administration ("FDA") to regulate tobacco products. This act authorizes the FDA to adopt product standards for tobacco products, including the level of nicotine yield and the reduction or elimination of other constituents of the products, along with provisions for the testing of products against these standards. The act imposes further restrictions on advertising of tobacco products, authorizes the FDA to limit the sales of tobacco products to face-to-face transactions permitting the verification of the age of the purchaser, authorizes a study to determine whether the minimum age for the purchase of tobacco products should be increased and requires submission of reports from manufacturers of tobacco products to the FDA regarding product ingredients and other matters, including reports on health, toxicological, behavioral, or physiologic effects of tobacco products and their constituents. The act also mandates warning labels and requires packaging to indicate the percentage of domestically grown tobacco and foreign grown tobacco included in the product. The FDA has adopted regulations under the act establishing requirements for the sale, distribution and marketing of cigarettes, as well as package warnings and advertising limitations.
In addition, the act directs the FDA to promulgate regulations requiring that the methods used in, and the facilities and controls used for, the manufacture, preproduction design validation, packing, and storage of a tobacco product conform to current good manufacturing practice. Regulations under the act do not apply to tobacco leaf that is not in the possession of a manufacturer of tobacco products, or to the producers of tobacco leaf, including tobacco suppliers, tobacco warehouses, and tobacco supplier cooperatives unless those entities are controlled by a tobacco product manufacturer, but do apply to our U.S. cut rag processing facility with respect to covered tobacco products.
In May 2016, the FDA finalized regulations, to be effective in August 2016, that extends its regulatory authority under the act to tobacco products not previously covered by its regulations, including vaporizers, vape pens, hookah pens, electronic cigarettes (or, e-cigarettes), e-pipes, and other types of electronic nicotine delivery systems, including e-liquids used in these devices, as well as pipe tobacco and cigars (including little cigars and cigarillos), and future novel tobacco products. These regulations require manufacturers of these additional tobacco products to, among other things submit an application and obtain FDA authorization to market a new tobacco product; register establishment(s) and submit product listing to FDA by December 31, 2016; submit listing of ingredients; submit information on harmful and potentially harmful constituents; submit tobacco health documents; not introduce into interstate commerce modified-risk tobacco products (e.g., products with label, labeling, or advertising representing that they
- 14
-
Risks Relating to the Tobacco Industry
(continued)
Legislation and regulatory and other governmental initiatives could impose burdensome restrictions on the tobacco industry and reduce consumption of consumer tobacco products and demand for our services.
(
continued)
reduce risk or are less harmful compared to other tobacco products on the market) without an FDA order; and include the required warning statement on packaging and advertisements. These regulations will extend to certain of our operations that had not previously been subject to the act, including the processing of pipe tobacco and tobacco for little cigars and cigarillos at our U.S. cut rag processing facility, and to Purilum, LLC, a 50% owned joint venture that develops, produces and sells consumable e-liquids to manufacturers and distributors of e-vapor products. In addition, the May 2016 regulations make these additional tobacco products subject to certain existing restrictions on the sale of cigarettes, including restrictions prohibiting sale to individuals under 18 years of age. In addition, in finalizing the May 2016 regulations, the FDA announced that it intends in the future to issue a proposed product standard that would, if finalized, eliminate characterizing flavors in all cigars, including cigarillos and little cigars.
The full impact of the act, including the May 2016 regulations and any future regulatory action to implement the act, is uncertain. However, if the effect of the act and FDA regulations under the act is a significant reduction in consumption of tobacco products, it could materially adversely affect our business, volume, results of operations, cash flows and financial condition.
Reports with respect to the harmful physical effects of cigarette smoking have been publicized for many years, and the sale, promotion and use of cigarettes continue to be subject to increasing governmental regulation. Since 1964, the Surgeon General of the United States and the Secretary of Health and Human Services have released a number of reports linking cigarette smoking with a broad range of health hazards, including various types of cancer, coronary heart disease and chronic lung disease, and recommending various governmental measures to reduce the incidence of smoking. More recent reports focus upon the addictive nature of cigarettes, the effects of smoking cessation, the decrease in smoking in the United States, the economic and regulatory aspects of smoking in the Western Hemisphere, and cigarette smoking by adolescents, particularly the addictive nature of cigarette smoking in adolescence. Numerous state and municipal governments have taken and others may take actions to diminish the social acceptance of smoking of tobacco products, including banning smoking in certain public and private locations.
A number of foreign nations also have taken steps to restrict or prohibit cigarette advertising and promotion, to increase taxes on cigarettes and to discourage cigarette smoking. In some cases, such restrictions are more onerous than those in the United States. For example, advertising and promotion of cigarettes has been banned or severely restricted for a number of years in Australia, Canada, Finland, France, Italy, Singapore and other countries. Further, in February 2005, the World Health Organization (“WHO”) treaty, the Framework Convention for Tobacco Control (“FCTC”), entered into force. This treaty, to which 180 nations were parties at March 31, 2015, requires signatory nations to enact legislation that would require, among other things, specific actions to prevent youth smoking; restrict or prohibit tobacco product marketing; inform the public about the health consequences of smoking and the benefits of quitting; regulate the content of tobacco products; impose new package warning requirements including the use of pictorial or graphic images; eliminate cigarette smuggling and counterfeit cigarettes; restrict smoking in public places; increase and harmonize cigarette excise taxes; abolish duty-free tobacco sales; and permit and encourage litigation against tobacco product manufacturers.
Due to the present regulatory and legislative environment, a substantial risk exists that past growth trends in tobacco product sales may not continue and that existing sales may decline. A significant decrease in worldwide tobacco consumption brought about by existing or future governmental laws and regulations would reduce demand for tobacco products and services and could have a material adverse effect on our results of operations.
Government actions can have a significant effect on the sourcing of tobacco. If some of the current efforts are successful, we could have difficulty obtaining sufficient tobacco to meet our customers’ requirements, which could have an adverse effect on our performance and results of operations.
The WHO, through the FCTC, created a formal study group to identify and assess crop diversification initiatives and alternatives
to leaf tobacco growing in countries whose economies depend upon tobacco production. The study group began its work in February 2007. In its initial report published later that year, the study group indicated that the FCTC did not aim to phase out tobacco growing, but the study group's focus on alternatives to tobacco crops was in preparation for its anticipated eventual decrease in demand resulting from the FCTC's other tobacco control initiatives.
If the objective of the FCTC study group were to change to seek to eliminate or significantly reduce leaf tobacco production and certain countries were to partner with the study group in pursuing this objective, we could encounter difficulty in sourcing leaf tobacco to fill customer requirements, which could have an adverse effect on our results of operations.
In addition, continued government and public emphasis on environmental issues, including climate change, conservation, and natural resource management, could result in new or more stringent forms of regulatory oversight of industry activities, which may lead to increased levels of expenditures for environmental controls, land use restrictions affecting us or our suppliers, and other conditions that could have a material adverse effect on our business, financial condition, and results of operations. For example, certain aspects of our business generate carbon emissions. Regulatory restrictions on greenhouse gas emissions have been proposed in certain countries in which we operate. These may include limitations on such emissions, taxes or emission allowance fees on such emissions, various restrictions on industrial operations, and other measures that could affect land-use decisions, the cost of agricultural production, and the cost and means of processing and transporting our products. These actions could adversely affect our business, financial condition, and results of operations.
- 15
-
Risks Relating to the Tobacco Industry
(continued)
We have been subject to governmental investigations into, and litigation concerning, leaf tobacco industry buying and other payment practices.
The leaf tobacco industry, from time to time, has been the subject of government investigations regarding trade practices. For example, we were the subject of an investigation by the Antitrust Division of the United States Department of Justice into certain buying practices alleged to have occurred in the industry, we were named defendants in an antitrust class action litigation alleging a conspiracy to rig bids in the tobacco auction markets, and we were the subject of an administrative investigation into certain tobacco buying and selling practices alleged to have occurred within the leaf tobacco industry in some countries within the European Union, including Spain, Italy, Greece and potentially other countries.
ITEM 1B.
UNRESOLVED STAFF COMMENTS
None.
ITEM 2.
PROPERTIES
Following is a description of Alliance One’s material properties as of March 31, 2016.
Corporate
Our corporate headquarters are located in Morrisville, North Carolina and are leased under an agreement that expires in May 2021.
Facilities
We own a total of 12 production facilities in 8 countries. We operate each of our tobacco processing plants for seven to nine months during the year to correspond with the applicable harvesting season. While we believe our production facilities have been efficiently utilized, we continually compare our production capacity and organization with the transitions occurring in global sourcing of tobacco. We also believe our domestic production facilities and certain foreign production facilities have the capacity to process additional volumes of tobacco if required by customer demand.
The following is a listing of the various material properties used in operations all of which are owned by Alliance One:
|
LOCATION
|
USE
|
|
NORTH AMERICA SEGMENT
|
|
|
UNITED STATES
|
|
|
WILSON, N.C.
|
FACTORY/STORAGE
|
|
FARMVILLE, N.C.
|
FACTORY/STORAGE
|
|
DANVILLE, VA
|
STORAGE
|
|
OTHER REGIONS SEGMENT
|
|
|
SOUTH AMERICA
|
|
|
VENANCIO AIRES, BRAZIL
|
FACTORY/STORAGE
|
|
ARARANGUA, BRAZIL
|
FACTORY/STORAGE
|
|
EL CARRIL, ARGENTINA
|
FACTORY/STORAGE
|
|
AFRICA
|
|
|
LILONGWE, MALAWI
|
FACTORY/STORAGE
|
|
MOROGORO, TANZANIA
|
FACTORY/STORAGE
|
|
HARARE, ZIMBABWE
|
FACTORY/STORAGE
|
|
EUROPE
|
|
|
KARLSRUHE, GERMANY
|
FACTORY/STORAGE
|
|
ASIA
|
|
|
NGORO, INDONESIA
|
FACTORY/STORAGE
|
- 16
-
ITEM 3.
LEGAL PROCEEDINGS
Mindo, S.r.l., the purchaser in 2004 of the Company's Italian subsidiary Dimon Italia, S.r.l., asserted claims against a subsidiary of the Company arising out of that sale transaction in an action filed before the Court of Rome on April 12, 2007. The claim involved a guaranty letter issued by a consolidated subsidiary of the Company in connection with the sale transaction
,
and sought the recovery of €7.4 million plus interest and costs.
On November 11, 2013, the court issued its judgment in favor of the Company’s subsidiary, rejecting the claims asserted by Mindo, S.r.l., and awarding the Company’s subsidiary legal costs of €0.05 million. On December 23, 2014, Mindo, S.r.l. appealed the judgment of the Court of Rome to the Court of Appeal of Rome. A hearing before the Court of Appeal of Rome was held on June 12, 2015, which was adjourned pending a further hearing set for February 2018. The outcome of, and timing of a decision on, the appeal are uncertain.
In addition to the above-mentioned matter, certain of the Company’s subsidiaries are involved in other litigation or legal matters incidental to their business activities, including tax matters. While the outcome of these matters cannot be predicted with certainty, the Company is vigorously defending them and does not currently expect that any of them will have a material adverse effect on its business or financial position. However, should one or more of these matters be resolved in a manner adverse to its current expectation, the effect on the Company’s results of operations for a particular fiscal reporting period could be material.
ITEM 4.
MINE SAFETY DISCLOSURES
N/A
ITEM 5.
MARKET FOR REGISTRANT'S COMMON EQUITY, RELATED STOCKHOLDER MATTERS AND
ISSUER PURCHASES OF EQUITY SECURITIES
Alliance One’s common stock is traded on the New York Stock Exchange, under the ticker symbol "AOI."
The following table sets forth for the periods indicated the high and low reported sales prices of our common stock as reported by the NYSE and the amount of dividends declared per share for the periods indicated. Stock prices are adjusted for a 1-to-10 reverse stock split that was effective June 26, 2015.
|
High
|
Low
|
Dividends
Declared |
|||||
|
Year Ended March 31, 2016
|
|||||||
|
Fourth Quarter
|
$
|
17.94
|
|
$
|
8.33
|
|
$—
|
|
Third Quarter
|
21.03
|
|
10.35
|
|
—
|
||
|
Second Quarter
|
26.47
|
|
18.79
|
|
—
|
||
|
First Quarter
|
25.40
|
|
10.80
|
|
—
|
||
|
Year Ended March 31, 2015
|
|||||||
|
Fourth Quarter
|
$
|
16.30
|
|
$
|
8.30
|
|
$—
|
|
Third Quarter
|
21.00
|
|
15.20
|
|
—
|
||
|
Second Quarter
|
27.40
|
|
19.30
|
|
—
|
||
|
First Quarter
|
30.10
|
|
23.00
|
|
—
|
||
As of June 10, 2016, there were 4,465 shareholders, including 3,709 non-objecting beneficial holders of our common stock.
The payment of dividends by Alliance One is subject to the discretion of our board of directors and will depend on business conditions, compliance with debt agreements, achievement of anticipated cost savings, financial condition and earnings, regulatory considerations and other factors. Our senior secured credit facility and the indenture governing our senior secured second lien notes restrict our ability to pay dividends. See “Management’s Discussion and Analysis of Financial Condition and Results of Operations – Liquidity and Capital Resources – Dividends.”
- 17
-
ITEM 5.
MARKET FOR REGISTRANT'S COMMON EQUITY, RELATED STOCKHOLDER MATTERS AND
ISSUER PURCHASES OF EQUITY SECURITIES
(continued)
Alliance One International, Inc. Comparison of Cumulative Total Return to Shareholders
The following line graph and table presents the cumulative total shareholder return of a $100 investment including reinvestment of dividends and price appreciation over the last five years in each of the following: Alliance One International, Inc. (AOI) common stock, the S&P 500 Index, the S&P 600 Small Cap Index and an index of peer companies. The sole company in the peer group is Universal Corporation (UVV).
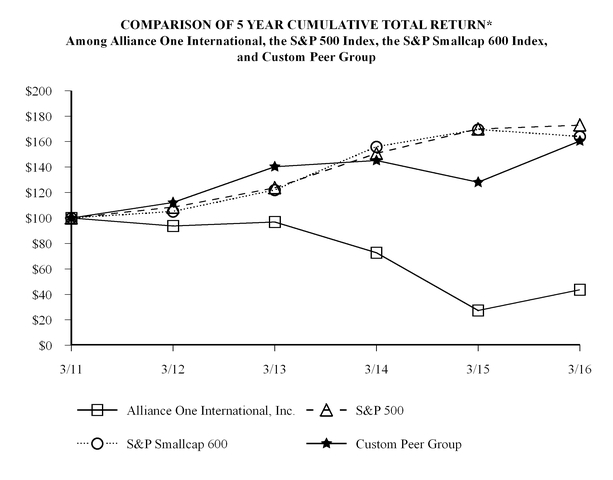
*$100 invested on 3/31/11 in stock or index, including reinvestment of dividends.
Fiscal year ending March 31.
Copyright ©2016 S&P, a division of McGraw Hill Financial. All rights reserved.
|
Cumulative Total Return
|
||||||||||||||||
|
03/31/2011
|
|
03/31/2012
|
|
03/31/2013
|
|
03/31/2014
|
|
03/31/2015
|
|
03/31/2016
|
|
|||||
|
Alliance One International, Inc.
|
$
|
100.00
|
|
$
|
93.78
|
|
$
|
96.77
|
|
$
|
72.64
|
|
27.36
|
|
43.68
|
|
|
S&P 500
|
$
|
100.00
|
|
$
|
108.54
|
|
$
|
123.69
|
|
$
|
150.73
|
|
169.92
|
|
172.95
|
|
|
S&P Smallcap 600
|
$
|
100.00
|
|
$
|
105.03
|
|
$
|
121.98
|
|
$
|
155.90
|
|
169.50
|
|
164.07
|
|
|
Custom Peer Group
|
$
|
100.00
|
|
$
|
112.11
|
|
$
|
140.32
|
|
$
|
145.22
|
|
128.04
|
|
160.54
|
|
ITEM 6.
SELECTED FINANCIAL DATA
FIVE YEAR FINANCIAL STATISTICS
Alliance One International, Inc. and Subsidiaries
|
Years Ended March 31,
|
|||||||||||||||
|
(in thousands, except per share amount, ratio and number of stockholders)
|
2016
|
2015 (6)
|
2014 (6)
|
2013 (6)
|
2012 (6)
|
||||||||||
|
Summary of Operations
|
|||||||||||||||
|
Sales and other operating revenues
|
$
|
1,904,592
|
|
$
|
2,066,865
|
|
$
|
2,354,996
|
|
$
|
2,240,996
|
|
$
|
2,149,468
|
|
|
Other income (expense) (1)
|
105,427
|
|
(66
|
)
|
18,760
|
|
20,721
|
|
15,725
|
|
|||||
|
Restructuring and asset impairment charges
(recoveries)
|
5,888
|
|
9,118
|
|
5,111
|
|
(55
|
)
|
1,006
|
|
|||||
|
Operating income
|
201,787
|
|
97,295
|
|
105,513
|
|
162,201
|
|
149,636
|
|
|||||
|
Debt retirement expense (income) (2)
|
—
|
|
(771
|
)
|
57,449
|
|
1,195
|
|
—
|
|
|||||
|
Net income (loss)
|
65,445
|
|
(28,034
|
)
|
(102,876
|
)
|
24,612
|
|
24,908
|
|
|||||
|
Net income (loss) attributable to
Alliance One International, Inc. |
65,532
|
|
(27,862
|
)
|
(102,533
|
)
|
23,913
|
|
25,168
|
|
|||||
|
Earnings Per Share Attributable to Alliance
One International, Inc.:
|
|||||||||||||||
|
Basic earnings (loss) per share
|
$
|
7.38
|
|
$
|
(3.16
|
)
|
$
|
(11.69
|
)
|
$
|
2.74
|
|
$
|
2.89
|
|
|
Diluted earnings (loss) per share (3)
|
$
|
7.38
|
|
$
|
(3.16
|
)
|
$
|
(11.69
|
)
|
$
|
2.53
|
|
$
|
2.61
|
|
|
Cash dividends paid
|
—
|
|
—
|
|
—
|
|
—
|
|
—
|
|
|||||
|
Balance Sheet Data
|
|||||||||||||||
|
Working capital
|
$
|
815,532
|
|
$
|
641,275
|
|
$
|
803,038
|
|
$
|
841,700
|
|
$
|
824,838
|
|
|
Total assets
|
1,978,073
|
|
1,634,206
|
|
1,758,348
|
|
1,907,181
|
|
1,945,675
|
|
|||||
|
Long-term debt
|
920,089
|
|
738,943
|
|
900,363
|
|
830,780
|
|
821,453
|
|
|||||
|
Stockholders’ equity attributable to
Alliance One International, Inc. |
271,126
|
|
190,790
|
|
243,830
|
|
324,504
|
|
313,918
|
|
|||||
|
Other Data
|
|||||||||||||||
|
Ratio of earnings to fixed charges
|
1.75
|
|
—
|
|
—
|
|
1.44
|
|
1.49
|
|
|||||
|
Coverage deficiency
|
n/a
|
|
$
|
8,939
|
|
60,852
|
|
n/a
|
|
n/a
|
|
||||
|
Common shares outstanding at year end (4)
|
8,900
|
|
8,858
|
|
8,816
|
|
8,764
|
|
8,738
|
|
|||||
|
Number of stockholders at year end (5)
|
4,465
|
|
4,995
|
|
5,346
|
|
5,582
|
|
6,380
|
|
|||||
(1) As of March 31, 2016, the Company determined that the significant doubt about our ability to control MTC was eliminated and recorded a gain of $106,203 upon reconsolidation.
(2) For the year ended March 31, 2014, the Company refinanced its credit facility and long-term debt which resulted in recognition of significant costs to retire existing debt and accelerated recognition of related deferred financing costs and original issue discounts. For the year ended March 31, 2013, the Company terminated a long-term foreign seasonal borrowing which resulted in accelerated recognition of related deferred financing costs.
(3) For the years ended March 31, 2015 and 2014, all outstanding restricted shares and shares applicable to stock options and restricted stock units are excluded because their inclusion would have an antidilutive effect on the loss per share. For the years ended March 31, 2015 and 2014, assumed conversion of convertible notes at the beginning of the period has an antidultive effect on the loss per share.
(4) Excluding 785 shares owned by a wholly owned subsidiary.
(5) Includes the number of stockholders of record and non-objecting beneficial owners.
(6) Includes adjustments for certain immaterial errors in previously issued financial statements. See Note 1, “Significant Accounting Policies” to the “Notes to Consolidated Financial Statements" for further information.
- 18
-
ITEM 7.
MANAGEMENT’S DISCUSSION AND ANALYSIS OF FINANCIAL
CONDITION AND RESULTS OF OPERATIONS
The following discussions should be read in conjunction with the other sections of this report, including the consolidated financial statements and related notes contained in Item 8 of this Form 10-K:
Executive Overview
The following executive overview is intended to provide significant highlights of the discussion and analysis that follows.
Financial Results
Operating income for the fiscal year ended March 31, 2016 improved by $104.5 million to $201.8 million. This was the result of slight growth in full service sales volumes despite an oversupply of tobacco in global markets, reduced SG&A and restructuring costs and a one-time gain of $106.2 million in other operating income related to the reconsolidation of MTC. Total sales and other operating revenues decreased by 7.9% to $1,904.6 million mainly as a result of lower green leaf costs and lower processing revenues due to a stronger U.S. dollar, reduced crop sizes and a change from processing to full service by a customer in the United States leading to reduced throughput in the factories. However, gross margin as a percentage of sales remained consistent with the prior year. Full service volumes were bolstered by increased full service volumes from Uganda and the United States related to changes in customer sourcing models.
Liquidity
Our liquidity requirements are affected by various factors including crop seasonality, foreign currency and interest rates, green tobacco prices, customer mix, crop size and quality. Again, this year, working capital and cash cycle improvements are focal areas. Our improved cost structure and well-positioned inventories at year end are important elements. Inventories at year end are positioned below our internal plan and uncommitted inventories are lower than the prior year even with the inclusion of Zimbabwe inventories. We will continue to monitor and adjust funding sources as needed to enhance and drive various business opportunities that maintain flexibility and meet cost expectations.
Outlook
Global markets are tightening as we emerge from an oversupply situation. Market prices paid in U.S dollars for suppliers’ green tobacco have again been generally lower this year. We anticipate that oversupply will further correct through the current crop cycle. We have seen considerable effects on crop sizes through the EL Nino weather pattern that we have been experiencing with reduced crop sizes experienced in the 2015 United States crop and 2016 Brazil crop due to higher rainfall. We continue to make progress toward our global plans and strategies. Those plans include investing in sustainable tobacco production where appropriate returns are achievable, eliminating costs from the supply chain and optimizing our global footprint to match future customer requirements. We have made solid progress in all these initiatives during the quarter and expect execution of these plans to improve our results and shareholder value.
- 19
-
ITEM 7.
MANAGEMENT’S DISCUSSION AND ANALYSIS OF FINANCIAL
CONDITION AND RESULTS OF OPERATIONS
(continued)
Results of Operations
|
|
||||||||||||||||||||||||
|
Twelve Months Ended March 31,
|
||||||||||||||||||||||||
|
Change
|
Change
|
|||||||||||||||||||||||
|
(in millions, except per kilo amounts)
|
2016
|
$
|
%
|
2015
|
$
|
%
|
2014
|
|||||||||||||||||
|
Kilos sold
|
382.4
|
|
4.0
|
|
1.1
|
|
378.4
|
|
(46.4
|
)
|
(10.9
|
)
|
424.8
|
|
||||||||||
|
Tobacco sales and other operating revenues:
|
||||||||||||||||||||||||
|
Sales and other operating revenues
|
$
|
1,827.9
|
|
$
|
(120.6
|
)
|
(6.2
|
)
|
$
|
1,948.5
|
|
$
|
(320.1
|
)
|
(14.1
|
)
|
$
|
2,268.6
|
|
|||||
|
Average price per kilo
|
4.78
|
|
(0.37
|
)
|
(7.2
|
)
|
5.15
|
|
(0.19
|
)
|
(3.6
|
)
|
5.34
|
|
||||||||||
|
Processing and other revenues
|
76.7
|
|
(41.7
|
)
|
(35.2
|
)
|
118.4
|
|
32.5
|
|
37.8
|
|
85.9
|
|
||||||||||
|
Total sales and other operating revenues
|
1,904.6
|
|
(162.3
|
)
|
(7.9
|
)
|
2,066.9
|
|
(287.6
|
)
|
(12.2
|
)
|
2,354.5
|
|
||||||||||
|
Tobacco cost of goods sold:
|
||||||||||||||||||||||||
|
Tobacco costs
|
1,553.2
|
|
(120.4
|
)
|
(7.2
|
)
|
1,673.6
|
|
(298.8
|
)
|
(15.1
|
)
|
1,972.4
|
|
||||||||||
|
Transportation, storage and other period
costs
|
71.4
|
|
(6.8
|
)
|
(8.7
|
)
|
78.2
|
|
(17.7
|
)
|
(18.5
|
)
|
95.9
|
|
||||||||||
|
Derivative financial instrument and
exchange (gains) losses
|
2.9
|
|
3.4
|
|
680.0
|
|
(0.5
|
)
|
(8.6
|
)
|
(106.2
|
)
|
8.1
|
|
||||||||||
|
Total tobacco cost of goods sold
|
1,627.5
|
|
(123.8
|
)
|
(7.1
|
)
|
1,751.3
|
|
(325.1
|
)
|
(15.7
|
)
|
2,076.4
|
|
||||||||||
|
Average cost per kilo
|
4.26
|
|
(0.37
|
)
|
(8.0
|
)
|
4.63
|
|
(0.26
|
)
|
(5.3
|
)
|
4.89
|
|
||||||||||
|
Processing and other revenues cost of services
sold
|
51.3
|
|
(20.8
|
)
|
(28.8
|
)
|
72.1
|
|
19.9
|
|
38.1
|
|
52.2
|
|
||||||||||
|
Total cost of goods and services sold
|
1,678.8
|
|
(144.6
|
)
|
(7.9
|
)
|
1,823.4
|
|
(305.2
|
)
|
(14.3
|
)
|
2,128.6
|
|
||||||||||
|
Gross profit
|
225.8
|
|
(17.7
|
)
|
(7.3
|
)
|
243.5
|
|
17.6
|
|
7.8
|
|
225.9
|
|
||||||||||
|
Selling, general, and administrative expenses
|
123.5
|
|
(13.5
|
)
|
(9.9
|
)
|
137.0
|
|
2.9
|
|
2.2
|
|
134.1
|
|
||||||||||
|
Other income (expense)
|
105.4
|
|
105.5
|
|
105,500.0
|
|
(0.1
|
)
|
(18.9
|
)
|
(100.5
|
)
|
18.8
|
|
||||||||||
|
Restructuring and asset impairment charges
|
5.9
|
|
(3.2
|
)
|
(35.2
|
)
|
9.1
|
|
4.0
|
|
78.4
|
|
5.1
|
|
||||||||||
|
Operating income
|
201.8
|
|
104.5
|
|
107.4
|
|
97.3
|
|
(8.2
|
)
|
(7.8
|
)
|
105.5
|
|
||||||||||
|
Debt retirement expense (income)
|
—
|
|
0.8
|
|
100.0
|
|
(0.8
|
)
|
(58.2
|
)
|
(101.4
|
)
|
57.4
|
|
||||||||||
|
Interest expense
|
117.2
|
|
3.9
|
|
3.4
|
|
113.3
|
|
(3.5
|
)
|
(3.0
|
)
|
116.8
|
|
||||||||||
|
Interest income
|
7.1
|
|
0.8
|
|
12.7
|
|
6.3
|
|
(0.8
|
)
|
(11.3
|
)
|
7.1
|
|
||||||||||
|
Income tax expense
|
32.2
|
|
10.3
|
|
47.0
|
|
21.9
|
|
(19.3
|
)
|
(46.8
|
)
|
41.2
|
|
||||||||||
|
Equity in net income of investee companies
|
6.0
|
|
3.2
|
|
114.3
|
|
2.8
|
|
2.7
|
|
2,700.0
|
|
0.1
|
|
||||||||||
|
Loss attributable to noncontrolling
interests
|
(0.1
|
)
|
0.1
|
|
50.0
|
|
(0.2
|
)
|
0.1
|
|
33.3
|
|
(0.3
|
)
|
||||||||||
|
Income (loss) attributable to Alliance One
International, Inc.
|
$
|
65.5
|
|
*
|
$
|
93.4
|
|
*
|
334.8
|
|
$
|
(27.9
|
)
|
*
|
74.6
|
|
*
|
72.8
|
|
$
|
(102.5
|
)
|
*
|
|
*Amounts do not equal column totals due to rounding.
Comparison of the Year Ended March 31, 2016 to the Year Ended March 31, 2015
Summary
Total sales and other operating revenues decreased by 7.9% to $1,904.6 million. Tobacco revenues decreased 6.2% and average sales prices decreased 7.2% due to changes in product mix, the negative impact on pricing resulting from an oversupply of tobacco in the market and lower prices paid to tobacco suppliers in most regions due to a stronger U.S. dollar. Certain customers in North America changed their requirements during the current year from processing services only to purchases of full service tobaccos. This shift in requirements resulted in increased volumes, tobacco revenues and tobacco costs which were partially offset by decreased processing revenues and processing costs related to the change in sales terms and weather-related reduced crop sizes when compared with the previous year. However, volumes remained consistent with the prior year from reduced requirements in some markets and the timing of shipments in North America and Europe. Changes in product mix and lower prices paid to tobacco suppliers across all regions partially offset by currency movement reduced tobacco costs overall as well as lowered average
- 20
-
ITEM 7.
MANAGEMENT'S DISCUSSION AND ANALYSIS OF FINANCIAL
CONDITION AND RESULTS OF OPERATIONS
(continued)
Results of Operations
(continued)
Comparison of the Year Ended March 31, 2016 to the Year Ended March 31, 2015
Summary (continued)
tobacco costs on a per kilo basis. As a result, gross margin decreased 7.3% to $225.8 million however gross margin as a percentage of sales remained consistent with the prior year. SG&A decreased primarily from the non-recurrence of reserves for customer receivables in the prior year, decreased compensation costs due to headcount reduction, lower travel costs and the favorable impact of currency movement that were partially offset by increased legal and professional fees in respect of the errors identified in our Kenya operation during the second quarter of the current year. During the fourth quarter of the current year, we determined that the significant doubt about our ability to control MTC was eliminated and we reconsolidated it as of March 31, 2016. As a result, we recorded a gain of $106.2 million in other operating income. Restructuring and asset impairment charges in the current year are primarily attributable to impairment of advances to tobacco suppliers and real property in Africa and to changes in certain defined benefit plans as a result of our restructuring initiative that began in the prior fiscal year. Charges in the prior year are primarily employee severance charges in connection with our restructuring plan that began in the fourth quarter of the prior year. Due to the changes in our results for the year, operating income increased 107.4% to $201.8 million.
Our interest costs increased from the prior year primarily due to higher amortization of debt costs and higher average borrowings. Our effective tax rate was 35.1% this year compared to (245.2)% last year. The variance in the effective tax rate between this year and last year is the result of many factors that include but are not limited to differences in income for the respective years; certain losses for which no tax benefit is recorded; and, differences between discrete items recognized for the years that include changes in valuation allowances, net exchanges losses on income tax accounts, and net exchange gains related to liabilities for unrecognized tax benefits.
North America Region
|
North America Region Supplemental Information
|
||||||||||||
|
Twelve Months Ended March 31,
|
||||||||||||
|
Change
|
||||||||||||
|
(in millions, except per kilo amounts)
|
2016
|
$
|
%
|
2015
|
||||||||
|
Kilos sold
|
71.6
|
|
18.0
|
|
33.6
|
|
53.6
|
|
||||
|
Tobacco sales and other operating revenues:
|
||||||||||||
|
Sales and other operating revenues
|
$
|
420.7
|
|
$
|
57.4
|
|
15.8
|
|
$
|
363.3
|
|
|
|
Average price per kilo
|
5.88
|
|
(0.90
|
)
|
(13.3
|
)
|
6.78
|
|
||||
|
Processing and other revenues
|
47.4
|
|
(30.3
|
)
|
(39.0
|
)
|
77.7
|
|
||||
|
Total sales and other operating revenues
|
468.1
|
|
27.1
|
|
6.1
|
|
441.0
|
|
||||
|
Tobacco cost of goods sold
|
||||||||||||
|
Tobacco costs
|
369.7
|
|
53.5
|
|
16.9
|
|
316.2
|
|
||||
|
Transportation, storage and other period costs
|
13.0
|
|
2.0
|
|
18.2
|
|
11.0
|
|
||||
|
Derivative financial instrument and exchange (gains) losses
|
0.8
|
|
3.1
|
|
134.8
|
|
(2.3
|
)
|
||||
|
Total tobacco cost of goods sold
|
383.5
|
|
58.6
|
|
18.0
|
|
324.9
|
|
||||
|
Average cost per kilo
|
5.36
|
|
(0.70
|
)
|
(11.6
|
)
|
6.06
|
|
||||
|
Processing and other revenues costs of services sold
|
33.6
|
|
(11.9
|
)
|
(26.2
|
)
|
45.5
|
|
||||
|
Total cost of goods and services sold
|
417.1
|
|
46.7
|
|
12.6
|
|
370.4
|
|
||||
|
Gross profit
|
51.0
|
|
(19.6
|
)
|
(27.8
|
)
|
70.6
|
|
||||
|
Selling, general and administrative expenses
|
25.9
|
|
(4.0
|
)
|
(13.4
|
)
|
29.9
|
|
||||
|
Other income
|
0.1
|
|
(0.1
|
)
|
(50.0
|
)
|
0.2
|
|
||||
|
Restructuring and asset impairment charges
|
—
|
|
(0.5
|
)
|
(100.0
|
)
|
0.5
|
|
||||
|
Operating income
|
$
|
25.2
|
|
$
|
(15.2
|
)
|
(37.6
|
)
|
$
|
40.4
|
|
|
- 21
-
ITEM 7.
MANAGEMENT'S DISCUSSION AND ANALYSIS OF FINANCIAL
CONDITION AND RESULTS OF OPERATIONS
(continued)
Results of Operations
(continued)
Comparison of the Year Ended March 31, 2016 to the Year Ended March 31, 2015
(continued)
North America Region
(continued)
Total sales and other operating revenues increased 6.1% to $468.1 million while total cost of goods and services sold increased 12.6% to $417.1 million. In the current year, certain customer requirements changed from providing processing services only in the prior year to providing full service tobacco sales in the current year. As a result, volumes, tobacco revenues and tobacco costs increased but were partially offset by the related decrease in processing revenues and cost of services. The 33.6% increase in volumes was partially offset by the timing of shipments. Tobacco revenues and tobacco costs of goods sold increases due to the change in customer requirements were partially offset by the timing of shipments and product mix which also decreased average sales prices and average cost of tobacco on a per kilo basis. In addition, the decrease in tobacco costs of goods sold was partially offset by increased period costs as a result of maintaining two U.S. cut rag facilities in the current year and the negative impact of exchange rate movement. Processing revenues and costs of services also decreased due to weather-related reduced crop sizes which particularly negatively impacted costs of services as a result of lower throughput. As a result, gross margin decreased 27.8% to $51.0 million and gross margin as a percentage of sales decreased from 16.0% to 10.9% when compared to the prior year. Reductions in SG&A were attributable to allocations for general corporate services. Asset impairment charges in the prior year are for machinery and equipment related to our previous U.S. cut rag facility due to the construction of a new facility. Operating income declined 37.6% from the prior year as a result of the impact of the change in results for the region.
Other Regions
|
Other Regions Supplemental Information
|
|||||||||||||
|
Twelve Months Ended March 31,
|
|||||||||||||
|
Change
|
|||||||||||||
|
(in millions, except per kilo amounts)
|
2016
|
$
|
%
|
2015
|
|||||||||
|
Kilos sold
|
310.8
|
|
(14.0
|
)
|
(4.3
|
)
|
324.8
|
|
|||||
|
Tobacco sales and other operating revenues:
|
|||||||||||||
|
Sales and other operating revenues
|
$
|
1,407.2
|
|
$
|
(178.0
|
)
|
(11.2
|
)
|
$
|
1,585.2
|
|
||
|
Average price per kilo
|
4.53
|
|
(0.35
|
)
|
(7.2
|
)
|
4.88
|
|
|||||
|
Processing and other revenues
|
29.3
|
|
(11.4
|
)
|
(28.0
|
)
|
40.7
|
|
|||||
|
Total sales and other operating revenues
|
1,436.5
|
|
(189.4
|
)
|
(11.6
|
)
|
1,625.9
|
|
|||||
|
Tobacco cost of goods sold
|
|||||||||||||
|
Tobacco costs
|
1,183.5
|
|
(173.9
|
)
|
(12.8
|
)
|
1,357.4
|
|
|||||
|
Transportation, storage and other period costs
|
58.4
|
|
(8.8
|
)
|
(13.1
|
)
|
67.2
|
|
|||||
|
Derivative financial instrument and exchange losses
|
2.1
|
|
0.3
|
|
16.7
|
|
1.8
|
|
|||||
|
Total tobacco cost of goods sold
|
1,244.0
|
|
(182.4
|
)
|
(12.8
|
)
|
1,426.4
|
|
|||||
|
Average cost per kilo
|
4.00
|
|
(0.39
|
)
|
(8.9
|
)
|
4.39
|
|
|||||
|
Processing and other revenues costs of services sold
|
17.7
|
|
(8.9
|
)
|
(33.5
|
)
|
26.6
|
|
|||||
|
Total cost of goods and services sold
|
1,261.7
|
|
(191.3
|
)
|
(13.2
|
)
|
1,453.0
|
|
|||||
|
Gross profit
|
174.8
|
|
1.9
|
|
1.1
|
|
172.9
|
|
|||||
|
Selling, general and administrative expenses
|
97.6
|
|
(9.5
|
)
|
(8.9
|
)
|
107.1
|
|
|||||
|
Other income (expense)
|
105.3
|
|
105.6
|
|
35,200.0
|
|
(0.3
|
)
|
|||||
|
Restructuring and asset impairment charges
|
5.9
|
|
(2.7
|
)
|
(31.4
|
)
|
8.6
|
|
|||||
|
Operating income
|
$
|
176.6
|
|
$
|
119.7
|
|
210.3
|
|
$
|
56.9
|
|
||
- 22
-
ITEM 7.
MANAGEMENT'S DISCUSSION AND ANALYSIS OF FINANCIAL
CONDITION AND RESULTS OF OPERATIONS
(continued)
Results of Operations
(continued)
Other Regions
(continued)
Total sales and other operating revenues decreased 11.6% to $1,436.5 million primarily due to a 4.3% decrease in volumes sold primarily due to lower customer requirements in Asia and Europe and the timing of shipments in Europe. Average sales prices decreased 7.2% and average tobacco costs per kilo decreased 8.9% primarily due to product mix, lower prices paid to tobacco suppliers across all regions and the impact on costs due to a stronger U.S. dollar. Processing and other revenues and processing costs decreased primarily due to timing of processing for our former Brazilian subsidiary. As a result of product mix, gross margin increased slightly to $174.8 million and gross margin as a percentage of sales increased from 10.6% to 12.2%. Decreases in SG&A are associated with the non-recurrence of reserves for customer receivables in the prior year, decreased compensation costs due to headcount reduction, lower travel costs and the favorable impact of currency movement that were partially offset by increased legal and professional fees in respect of the errors identified in our Kenya operation during the second quarter of the current year. During the fourth quarter of the current year, we determined that the significant doubt about our ability to control MTC was eliminated and we reconsolidated it as of March 31, 2016. As a result, we recorded a gain of $106.2 million in other operating income. Restructuring and asset impairment charges in the current year are primarily attributable to impairment of advances to tobacco suppliers and real property in Africa and to changes in certain defined benefit plans as a result of our restructuring initiative that began in the prior fiscal year compared to charges in the prior year primarily due to employee severance costs in connection the same restructuring plan. Operating income improved 210.3% from the prior year as a result of the impact of these changes.
Comparison of the Year Ended March 31, 2015 to the Year Ended March 31, 2014
Summary
Total sales and other operating revenues decreased 12.2% to $2,066.9 million primarily due to a 10.9% decrease in volumes and a 3.6% decrease in average sales price. Processing revenues and cost of services increases were primarily due to processing for our former Brazilian subsidiary that is now deconsolidated following the completion of a joint venture in March 2014 and increased customer requirements due to a larger U.S. flue cured crop this year. Reduced volumes were primarily from Brazil due to the deconsolidation of the former Brazilian subsidiary as well as the impact of an oversupply of tobacco in the global market. Lower average sales prices and average tobacco costs on a per kilo basis were primarily the result of product mix, lower prices paid to tobacco suppliers across most regions in response to the oversupply market and exchange rate movement. Average tobacco costs per kilo were further decreased due to lower period costs primarily from the non-recurrence of prior year losses in Zambia related to reduced recoveries from tobacco suppliers. The decreases in tobacco costs more than offset the decreases in tobacco revenues and gross margin increased 7.8% to $243.5 million. Although volumes decreased this year, the impact of product mix, higher green costs not fully recovered from customers in the prior year, the non-recurrence of Zambia losses and improvement in currency movements, our gross margin as a percentage of sales improved from 9.6% to 11.8%. SG&A increased primarily from increased reserves for customer receivables that were substantially offset by lower compensation costs, professional fees, and amortization related to internally developed software. Other income decreased primarily due to the prior year gain of $20.4 million from the sale of 51% interest in a Brazilian subsidiary to complete the formation of a new joint venture. Restructuring and asset impairment charges in the current year are primarily related to employee severance costs in connection with our restructuring and cost reduction plan announced during the quarter ended March 31, 2015. The prior year included restructuring and asset impairment charges primarily attributable to our agreement for a joint processing venture in Turkey and equipment charges in Africa. Primarily due to the non-recurrence of the prior year Brazil other income gain, operating income decreased 7.8% compared with the prior year.
In the prior year, we refinanced our 10% senior notes and purchased $60.0 million of our convertible notes. As a result, one-time debt retirement costs of $57.4 million were recorded including $21.3 million of accelerated amortization of debt issuance costs and recognition of original issue discount related to the 10% senior notes. Our interest costs decreased from the prior year related primarily due to lower amortization of debt costs and average borrowings partially offset by higher average rates. Our effective tax rate was (245.2)% this year compared to (66.8)% last year. The variance in the effective tax rate between this year and last year is mainly related to differences in forecasted income for the respective years, differences in year-to-date income; certain losses for which no tax benefit is recorded; and, differences between discrete items recognized that include changes in valuation allowances, net exchanges losses on income tax accounts and net exchange gains related to liabilities for unrecognized tax benefits.
- 23
-
ITEM 7.
MANAGEMENT'S DISCUSSION AND ANALYSIS OF FINANCIAL
CONDITION AND RESULTS OF OPERATIONS
(continued)
Results of Operations
(continued)
Comparison of the Year Ended March 31, 2015 to the Year Ended March 31, 2014
(continued)
North America Region
|
North America Region Supplemental Information
|
||||||||||||
|
Twelve Months Ended March 31,
|
||||||||||||
|
Change
|
||||||||||||
|
(in millions, except per kilo amounts)
|
2015
|
$
|
%
|
2014
|
||||||||
|
Kilos sold
|
53.6
|
|
(10.6
|
)
|
(16.5
|
)
|
64.2
|
|
||||
|
Tobacco sales and other operating revenues:
|
||||||||||||
|
Sales and other operating revenues
|
$
|
363.3
|
|
$
|
(71.2
|
)
|
(16.4
|
)
|
$
|
434.5
|
|
|
|
Average price per kilo
|
6.78
|
|
0.01
|
|
0.1
|
|
6.77
|
|
||||
|
Processing and other revenues
|
77.7
|
|
13.8
|
|
21.6
|
|
63.9
|
|
||||
|
Total sales and other operating revenues
|
441.0
|
|
(57.4
|
)
|
(11.5
|
)
|
498.4
|
|
||||
|
Tobacco cost of goods sold
|
||||||||||||
|
Tobacco costs
|
316.2
|
|
(69.6
|
)
|
(18.0
|
)
|
385.8
|
|
||||
|
Transportation, storage and other period costs
|
11.0
|
|
0.4
|
|
3.8
|
|
10.6
|
|
||||
|
Derivative financial instrument and exchange gains
|
(2.3
|
)
|
(1.4
|
)
|
(155.6
|
)
|
(0.9
|
)
|
||||
|
Total tobacco cost of goods sold
|
324.9
|
|
(70.6
|
)
|
(17.9
|
)
|
395.5
|
|
||||
|
Average cost per kilo
|
6.06
|
|
(0.10
|
)
|
(1.6
|
)
|
6.16
|
|
||||
|
Processing and other revenues costs of services sold
|
45.5
|
|
4.8
|
|
11.8
|
|
40.7
|
|
||||
|
Total cost of goods and services sold
|
370.4
|
|
(65.8
|
)
|
(15.1
|
)
|
436.2
|
|
||||
|
Gross profit
|
70.6
|
|
8.4
|
|
13.5
|
|
62.2
|
|
||||
|
Selling, general and administrative expenses
|
29.9
|
|
(0.6
|
)
|
(2.0
|
)
|
30.5
|
|
||||
|
Other income
|
0.2
|
|
0.2
|
|
100.0
|
|
—
|
|
||||
|
Restructuring and asset impairment charges
|
0.5
|
|
0.5
|
|
100.0
|
|
—
|
|
||||
|
Operating income
|
$
|
40.4
|
|
$
|
8.7
|
|
27.4
|
|
$
|
31.7
|
|
|
Total sales and other operating revenues as well as total cost of goods and services sold decreased due to a 16.5% decrease in volumes primarily the result of an oversupply of tobacco in the global market and the timing of shipments. Average sales prices were consistent with the prior year while average cost of tobacco on a per kilo basis decreased as a result of a larger U.S. crop this year. Processing revenues and cost of services increases were due to increased customer volumes also related to a larger U.S. crop this year. Although tobacco volumes were lower, the increased throughput resulted in a 13.5% increase in gross margin and gross margin as a percentage of sales improved from 12.5% in the prior year to 16.0% in the current year. Reductions in SG&A were attributable to lower compensation costs. With the construction of a new U.S. cut rag facility with state of the art machinery and equipment, an asset impairment charge of $0.5 million was taken during the current year related to machinery and equipment at the previous facility. Operating income improved 27.4% from the prior year as a result of the impact of the change in results for the region.
- 24
-
ITEM 7.
MANAGEMENT'S DISCUSSION AND ANALYSIS OF FINANCIAL
CONDITION AND RESULTS OF OPERATIONS
(continued)
Results of Operations
(continued)
Comparison of the Year Ended March 31, 2015 to the Year Ended March 31, 2014
(continued)
Other Regions
|
Other Regions Supplemental Information
|
||||||||||||
|
Twelve Months Ended March 31,
|
||||||||||||
|
Change
|
||||||||||||
|
(in millions, except per kilo amounts)
|
2015
|
$
|
%
|
2014
|
||||||||
|
Kilos sold
|
324.8
|
|
(35.8
|
)
|
(9.9
|
)
|
360.6
|
|
||||
|
Tobacco sales and other operating revenues:
|
||||||||||||
|
Sales and other operating revenues
|
$
|
1,585.2
|
|
$
|
(248.9
|
)
|
(13.6
|
)
|
$
|
1,834.1
|
|
|
|
Average price per kilo
|
4.88
|
|
(0.21
|
)
|
(4.1
|
)
|
5.09
|
|
||||
|
Processing and other revenues
|
40.7
|
|
18.7
|
|
85.0
|
|
22.0
|
|
||||
|
Total sales and other operating revenues
|
1,625.9
|
|
(230.2
|
)
|
(12.4
|
)
|
1,856.1
|
|
||||
|
Tobacco cost of goods sold
|
||||||||||||
|
Tobacco costs
|
1,357.4
|
|
(229.2
|
)
|
(14.4
|
)
|
1,586.6
|
|
||||
|
Transportation, storage and other period costs
|
67.2
|
|
(18.1
|
)
|
(21.2
|
)
|
85.3
|
|
||||
|
Derivative financial instrument and exchange losses
|
1.8
|
|
(7.2
|
)
|
(80.0
|
)
|
9.0
|
|
||||
|
Total tobacco cost of goods sold
|
1,426.4
|
|
(254.5
|
)
|
(15.1
|
)
|
1,680.9
|
|
||||
|
Average cost per kilo
|
4.39
|
|
(0.27
|
)
|
(5.8
|
)
|
4.66
|
|
||||
|
Processing and other revenues costs of services sold
|
26.6
|
|
15.1
|
|
131.3
|
|
11.5
|
|
||||
|
Total cost of goods and services sold
|
1,453.0
|
|
(239.4
|
)
|
(14.1
|
)
|
1,692.4
|
|
||||
|
Gross profit
|
172.9
|
|
9.2
|
|
5.6
|
|
163.7
|
|
||||
|
Selling, general and administrative expenses
|
107.1
|
|
3.5
|
|
3.4
|
|
103.6
|
|
||||
|
Other income (expense)
|
(0.3
|
)
|
(19.1
|
)
|
(101.6
|
)
|
18.8
|
|
||||
|
Restructuring and asset impairment charges
|
8.6
|
|
3.5
|
|
68.6
|
|
5.1
|
|
||||
|
Operating income
|
$
|
56.9
|
|
$
|
(16.9
|
)
|
(22.9
|
)
|
$
|
73.8
|
|
|
Total sales and other operating revenues and total cost of goods and services sold decreased primarily due to a 9.9% decrease in volumes after the deconsolidation of a Brazilian subsidiary following completion of a joint venture in March 2014. Lower average sales prices and costs on a per kilo basis are primarily due to product mix, lower prices paid to tobacco suppliers as well as the oversupply of tobacco in the global market. Lower tobacco revenues and costs were partially offset by opportunistic sales of Asian tobacco. Currency movements in Euro-denominated sales and costs also lowered average sales prices and tobacco costs on a per kilo basis. Average tobacco costs per kilo were further reduced by the non-recurrence of the prior year charge for lower recoveries from Zambian tobacco suppliers of approximately $11.0 million. The decrease in tobacco costs more than offset the decrease in revenues. Processing and other revenue and cost increases this year were the result of processing for the former Brazilian subsidiary that is now deconsolidated and the delay in delivery of the current crop. As a result, gross margin increased 5.6% to $172.9 million and gross margin as a percentage of sales increased from 8.8% to 10.6%. Increases in SG&A are associated with increased reserves for customer receivables which were partially offset by lower compensation costs, professional fees and amortization related to internally developed software. Other income decreased primarily due to the prior year gain of $20.9 million from the sale of 51% interest in a Brazilian subsidiary to complete the formation of a new joint venture. Restructuring and asset impairment charges in the current year are employee severance costs as part of our restructuring and cost reduction plan announced during the quarter ended March 31, 2015. The prior year restructuring and asset impairment charges were related to a joint processing venture in Turkey and equipment charges in Africa. As a result of the decrease in other income in Brazil, operating income decreased 22.9% to $56.9 million this year.
- 25
-
ITEM 7.
MANAGEMENT'S DISCUSSION AND ANALYSIS OF FINANCIAL
CONDITION AND RESULTS OF OPERATIONS
(continued)
Liquidity and Capital Resources
Overview
Historically we have needed capital in excess of cash flow from operations to finance accounts receivable, inventory and advances to suppliers for tobacco crops in certain foreign countries. Purchasing, processing and selling activities of our business are seasonal and our need for capital fluctuates with corresponding peaks where outstanding indebtedness may be greater or less as a result. Our long-term borrowings consist of senior secured second lien notes and a senior secured revolving credit facility. We also have a combination of short-term and long term seasonal lines of credit available with a number of banks throughout the world that finances seasonal working capital and corresponds to regional peak requirements.
At March 31, 2016, we had $199.7 million in cash on our balance sheet, $10.3 million available under the senior secured revolving credit facility, $486.0 million outstanding under short-term and long term foreign lines with an additional $416.4 million available under those lines and $1.3 million outstanding of other debt for a total of $626.3 million of debt availability and cash on hand around the world, excluding $4.7 million in issued but unfunded letters of credit with $13.1 million available. Another source of liquidity as of March 31, 2016 was $171.3 million funded under our accounts receivable sale programs. Additionally, customer advances were $9.9 million in 2016 compared to $18.9 million in 2015. To the extent that these customers do not provide this advance funding, we must provide financing for their inventories. Should customers pre-finance less in the future for committed inventories, this action could impact our short-term liquidity. We believe that the sources of capital we have access to are sufficient to fund our anticipated needs for fiscal year 2017. Effective March 31, 2016, we did not meet the fixed charge coverage ratio of 2.0 to 1.0 required under the indenture governing our senior secured second lien notes to permit us to access the restricted payments basket for the purchase of common stock and other actions under that basket. From time to time we may not satisfy the required ratio. See Note 7 “Short-term Borrowing Arrangements” and Note 17 “Sale of Receivables” to the “Notes to Consolidated Financial Statements” for further information. Note that in March 2016, Moody's Investors Service downgraded the Corporate Family Rating of the Company to Caa2 from Caa1. Moody's also downgraded the Probability of Default Rating to Caa2-PD from Caa1-PD, and the senior secured second lien note rating to Caa3 with a Loss Given Default (“LGD”) of 5 from Caa2 and a LGD of 5. At the same time Moody's affirmed the Company's senior secured bank credit facility rating at B1 with a LGD of 1 and the Speculative Grade Liquidity Rating at SGL-4. Standard & Poor’s (“S&P”) ratings are Corporate Credit Rating CCC+, senior secured second lien note rating CCC with a recovery rating (“RR”) of 5 and a senior secured debt rating of B with a RR of 1. S&P currently has outlook negative and as of June 3, 2016, Moody's has outlook positive. However, we affirm our belief that the sources of capital we have access to are sufficient to fund our anticipated needs for fiscal year 2017. Our U.S revolver matures April 15, 2017 and we plan to either extend or refinance this facility during fiscal year 2017. Our access to capital meets our current expectations and outlook that is anticipated to provide sufficient liquidity to fulfill our future funding requirements. General deterioration of our business and the cash flow that it generates, failure to renew foreign lines or an inability to extend or refinance our U.S. revolver could impact our ability to meet our future liquidity requirements.
Seasonal liquidity beyond cash flow from operations is provided by our senior secured credit facility, seasonal working capital lines throughout the world, advances from customers and sale of accounts receivable. For the years ended March 31, 2016 and 2015, our average short-term borrowings, aggregated peak short-term borrowings outstanding and weighted-average interest rate on short-term borrowings were as follows:
|
(dollars in millions)
|
2016
|
|
2015
|
|
||
|
Average short-term borrowings
|
$
|
444.8
|
|
$
|
454.8
|
|
|
Aggregated peak short-term borrowings outstanding
|
$
|
665.0
|
|
$
|
662.5
|
|
|
Weighted-average interest rate on short-term borrowings
|
5.18
|
%
|
5.12
|
%
|
||
Aggregated peak borrowings for 2016 were during the fourth quarter of 2016 compared to during the third quarter for 2015. The peak borrowings occurred in the fourth quarter of 2016 due to the timing of repayments in the South America and Africa regions as compared to 2015. Peak borrowings for 2016 and 2015 were repaid with cash provided by operating activities.
As of March 31, 2016, we are in our working capital build. In South America we are in the process of purchasing and processing the most recent crop, while the peak tobacco sales season for South America is at its beginning stages. Africa is also in the middle of its buying, processing and selling season and is utilizing working capital funding as well. North America and Europe are still selling and planning for the next crop that is now being grown.
Working Capital
Our working capital increased to $815.5 million at March 31, 2016 from $641.3 million at March 31, 2015. Our current ratio was 2.2 to 1 at March 31, 2016 compared to 2.1 to 1 at March 31, 2015. The reconsolidation of MTC at March 31, 2016 contributed $15.4 million to the increase in working capital. The remaining increase in working capital is attributable to higher cash balances due to the collection of receivables in accordance with terms, higher accounts receivable due to the timing of sales and higher
- 26
-
ITEM 7.
MANAGEMENT'S DISCUSSION AND ANALYSIS OF FINANCIAL
CONDITION AND RESULTS OF OPERATIONS
(continued)
Liquidity and Capital Resources
(continued)
Working Capital
(continued)
inventory and advances to tobacco suppliers due to the timing of shipments and the continued oversupply of tobacco in the market.
The following table is a summary of items from the Consolidated Balance Sheets and Consolidated Statements of Cash Flows. Approximately $192.2 million of our outstanding cash balance at March 31, 2016 was held in foreign jurisdictions. If these funds in foreign jurisdictions were repatriated, due to the valuation allowance on U.S. tax loss carryovers and foreign tax credit carryovers, the cost of repatriation would not have a material financial impact.
|
As of March 31,
|
||||||||||||||||||||
|
Change
|
Change
|
|||||||||||||||||||
|
(in millions except for current ratio)
|
2016
|
$
|
%
|
2015
|
$
|
%
|
2014
|
|||||||||||||
|
Cash and cash equivalents
|
$
|
199.7
|
|
$
|
55.9
|
|
38.9
|
|
$
|
143.8
|
|
$
|
(91.0
|
)
|
(38.8
|
)
|
$
|
234.8
|
|
|
|
Net trade and other receivables
|
401.0
|
|
161.5
|
|
67.4
|
|
239.5
|
|
20.0
|
|
9.1
|
|
219.5
|
|
||||||
|
Inventories and advances to tobacco
suppliers |
833.2
|
|
55.9
|
|
7.2
|
|
777.3
|
|
(14.5
|
)
|
(1.8
|
)
|
791.8
|
|
||||||
|
Total current assets
|
1,490.4
|
|
264.7
|
|
21.6
|
|
1,225.7
|
|
(77.7
|
)
|
(6.0
|
)
|
1,303.4
|
|
||||||
|
Notes payable to banks
|
476.0
|
|
(1)
|
145.7
|
|
44.1
|
|
330.3
|
|
117.6
|
|
55.3
|
|
212.7
|
|
|||||
|
Accounts payable
|
81.6
|
|
8.3
|
|
11.3
|
|
73.3
|
|
(41.9
|
)
|
(36.4
|
)
|
115.2
|
|
||||||
|
Advances from customers
|
9.9
|
|
(9.0
|
)
|
(47.6
|
)
|
18.9
|
|
(3.2
|
)
|
(14.5
|
)
|
22.1
|
|
||||||
|
Total current liabilities
|
674.8
|
|
90.4
|
|
15.5
|
|
584.4
|
|
84.0
|
|
16.8
|
|
500.4
|
|
||||||
|
Current ratio
|
2.2 to 1
|
|
2.1 to 1
|
|
|
|
2.6 to 1
|
|
||||||||||||
|
Working capital
|
815.5
|
|
174.2
|
|
27.2
|
|
641.3
|
|
(161.7
|
)
|
(20.1
|
)
|
803.0
|
|
||||||
|
Total long term debt
|
920.1
|
|
181.2
|
|
24.5
|
|
738.9
|
|
(161.5
|
)
|
(17.9
|
)
|
900.4
|
|
||||||
|
Stockholders’ equity attributable to
Alliance One International, Inc. |
271.1
|
|
80.3
|
|
42.1
|
|
190.8
|
|
(53.0
|
)
|
(21.7
|
)
|
243.8
|
|
||||||
|
Net cash provided (used) by:
|
||||||||||||||||||||
|
Operating activities
|
$
|
(135.3
|
)
|
$
|
(80.1
|
)
|
$
|
(55.2
|
)
|
$
|
(317.7
|
)
|
$
|
262.5
|
|
|||||
|
Investing activities
|
(13.5
|
)
|
(1.8
|
)
|
(11.7
|
)
|
8.7
|
|
(20.4
|
)
|
||||||||||
|
Financing activities
|
193.6
|
|
217.0
|
|
(23.4
|
)
|
77.1
|
|
(100.5
|
)
|
||||||||||
(1) Includes $130.6 million of debt owed by MTC under a short-term credit facility in which one of our other subsidiaries has a participation interest in the lender’s rights and obligations under the facility. At March 31, 2016, $84.3 million of that amount was attributed to outstanding borrowings by MTC funded under that facility by such other subsidiary pursuant to that participation interest. Because such other subsidiary’s funding is pursuant to a participation interest through a third-party lender and not a direct intercompany loan between such other subsidiary and MTC, the total amount of debt under the facility is required to be reflected as consolidated debt upon the reconsolidation of MTC.
Operating Cash Flows
Net cash used by operating activities increased $80.1 million compared to 2015 which increased $317.7 million compared to 2014. The increase in cash used in 2016 compared to 2015 is primarily due to the increase in accounts receivable as a result of the timing of sales in the fourth quarter partially offset by less cash used for accounts payable due to the timing of payments in accordance with terms. The increase in cash used in 2015 compared to 2014 is primarily due to increased inventory and advances to suppliers due to the impact of an oversupply in the global market, increased accounts receivable due to the timing of sales in the fourth quarter in accordance with terms and decreased accounts payable due to the timing of payments in accordance with terms.
Investing Cash Flows
Net cash used by investing activities increased $1.8 million in 2016 compared to 2015 which decreased $8.7 million compared to 2014. The increase in cash used in 2016 is primarily due to lower purchases of property and equipment partially offset by lower proceeds from the sale of property. The decrease in cash used in 2015 is primarily due to higher proceeds from the sale of property. Lower purchases of intangible assets in 2015 were offset by lower proceeds from surrender of life insurance policies and net cash received from the sale of 51% interest in a Brazilian subsidiary in 2014, and increased restrictions on cash primarily for social responsibility programs.
- 27
-
ITEM 7.
MANAGEMENT'S DISCUSSION AND ANALYSIS OF FINANCIAL
CONDITION AND RESULTS OF OPERATIONS
(continued)
Liquidity and Capital Resources
(continued)
Financing Cash Flows
Net cash provided by financing activities increased $217.0 million in 2016 compared to 2015 which increased $77.1 million compared to 2014. The increase in cash provided in 2016 is primarily due to less repayment of our revolver during the year due to the higher balance outstanding at year end. The increase in cash provided in 2015 compared to 2014 is primarily related to lower debt issuance and debt retirement costs due to the debt refinancing in 2014. Cash used in 2015 also decreased due to higher net proceeds from short term borrowings due to the timing of shipments in the fourth quarter which were substantially offset by lower net proceeds from long-term borrowings due to the debt refinancing in 2014.
Certain debt agreements contain certain cross-default or cross-acceleration provisions. The following table summarizes our debt financing as of March 31, 2016:
|
March 31, 2016
|
||||||||||||||||||||||||||||||
|
Outstanding
|
Lines and
|
|||||||||||||||||||||||||||||
|
March 31,
2015
|
March 31,
2016
|
Letters
|
Interest
|
Long Term Debt Repayment Schedule by Fiscal Year
|
||||||||||||||||||||||||||
|
(in millions)
|
Available
|
Rate
|
2017
|
|
2018
|
|
2019
|
|
2020
|
|
2021
|
|
Later
|
|||||||||||||||||
|
Senior secured credit facility:
|
||||||||||||||||||||||||||||||
|
Revolver
(1)
|
$
|
—
|
|
$
|
200.0
|
|
$
|
10.3
|
|
5.4
|
%
|
(2)
|
$
|
—
|
|
$
|
200.0
|
|
$
|
—
|
|
$
|
—
|
|
$
|
—
|
|
$
|
—
|
|
|
Senior notes:
|
||||||||||||||||||||||||||||||
|
9.875% senior secured
second lien notes due 2021
(4)
|
707.7
|
|
709.2
|
|
—
|
|
9.9
|
%
|
—
|
|
—
|
|
—
|
|
—
|
|
—
|
|
709.2
|
|
||||||||||
|
Long-term foreign seasonal borrowings
|
30.0
|
|
10.0
|
|
—
|
|
3.8
|
%
|
(2)
|
—
|
|
10.0
|
|
—
|
|
—
|
|
—
|
|
—
|
|
|||||||||
|
Other long-term debt
|
4.1
|
|
1.3
|
|
—
|
|
7.2
|
%
|
(2)
|
0.4
|
|
0.2
|
|
0.1
|
|
0.3
|
|
0.1
|
|
0.2
|
|
|||||||||
|
Notes payable to banks
(3)
|
330.3
|
|
476.0
|
|
416.4
|
|
5.2
|
%
|
(2)
|
476.0
|
|
—
|
|
—
|
|
—
|
|
—
|
|
—
|
|
|||||||||
|
Total debt
|
$
|
1,072.1
|
|
$
|
1,396.5
|
|
426.7
|
|
$
|
476.4
|
|
$
|
210.2
|
|
$
|
0.1
|
|
$
|
0.3
|
|
$
|
0.1
|
|
$
|
709.4
|
|
||||
|
Short-term
(3)
|
$
|
330.3
|
|
$
|
476.0
|
|
||||||||||||||||||||||||
|
Long-term:
|
||||||||||||||||||||||||||||||
|
Long-term debt current
|
$
|
2.9
|
|
$
|
0.4
|
|
||||||||||||||||||||||||
|
Long-term debt
|
738.9
|
|
920.1
|
|
||||||||||||||||||||||||||
|
$
|
741.8
|
|
$
|
920.5
|
|
|||||||||||||||||||||||||
|
Letters of credit
|
$
|
6.3
|
|
$
|
4.7
|
|
13.1
|
|
||||||||||||||||||||||
|
Total credit available
|
$
|
439.8
|
|
|||||||||||||||||||||||||||
(1) As of March 31, 2016, pursuant to Section 2.1 (A) (iv) of the Credit Agreement, the full $210.3 million Revolving Committed Amount was available based on the calculation of the lesser of the Revolving Committed Amount and the Working Capital Amount.
(2) Weighted average rate for the twelve months ended March 31, 2016.
(3) Primarily foreign seasonal lines of credit. At March 31, 2016, the outstanding amount includes $130.6 million of debt owed by MTC under a short-term credit facility in which one of our other subsidiaries has a participation interest in the lender’s rights and obligations under the facility. At March 31, 2016, $84.3 million of that amount was attributed to outstanding borrowings by MTC funded under that facility by such other subsidiary pursuant to that participation interest. Because such other subsidiary’s funding is pursuant to a participation interest through a third-party lender and not a direct intercompany loan between such other subsidiary and MTC, the total amount of debt under the facility is required to be reflected as consolidated debt upon the reconsolidation of MTC.
(4) Repayment of $709.2 million is net of original issue discount of $10.8 million. Total repayment will be $720.0 million.
Senior Secured Credit Facility
On August 1, 2013, the agreement governing the Company's senior secured credit facility was amended and restated to provide for a senior secured revolving credit facility with a syndicate of banks of approximately $303.9 million, that automatically reduced to approximately $210.3 million on April 15, 2014, and will mature in April 15, 2017. Borrowings under the senior secured credit facility initially bear interest at an annual rate of LIBOR plus 3.75% and base rate plus 2.75%, as applicable, though the interest rate under the senior secured credit facility is subject to increase or decrease according to the Company's consolidated interest coverage ratio.
Borrowings under the senior secured credit facility are secured by a first priority lien on specified property of the Company, including the capital stock of specified subsidiaries, all U.S. accounts receivable, certain U.S. inventory, intercompany notes evidencing loans or advances and certain U.S. fixed assets.
- 28
-
ITEM 7.
MANAGEMENT'S DISCUSSION AND ANALYSIS OF FINANCIAL
CONDITION AND RESULTS OF OPERATIONS
(continued)
Liquidity and Capital Resources
(continued)
Senior Secured Credit Facility
(continued)
First amendment.
On May 30, 2014, the Company entered into the First Amendment to the Amended and Restated Credit Agreement (the “First Amendment"), which amended the credit agreement (the “Credit Agreement”) governing the Company’s senior secured credit facility. The First Amendment modified the definition of Consolidated EBIT to permit add backs in connection with dispositions of, and investments in, certain subsidiaries and permitted joint ventures and certain other accounting adjustments, modified the Minimum Consolidated Interest Coverage Ratio to
1.85
to 1.00 for the period ending March 31, 2014 and
1.70
to 1.00 for the periods ending June 30, 2014, September 30, 2014, December 31, 2014 and March 31, 2015, modified the Maximum Consolidated Leverage Ratio to
7.25
to 1.00 for the period ending June 30, 2014 and
7.50
to 1.00 for the period ending September 30, 2014 and increased the basket to
$200,000
for permitted Guaranty Obligations that can be incurred by the Company and its subsidiaries with respect to indebtedness of China Brasil Tabacos Exportadora Ltda. (which is the joint venture entity with China Tobacco in Brazil) while striking the requirement that such Guaranty Obligations of the Company and its subsidiaries may not exceed the percentage of the Company’s direct or indirect ownership of China Brasil Tabacos Exportadora Ltda. in relation to all Guaranty Obligations with respect to Indebtedness of China Brasil Tabacos Exportadora Ltda.
Second amendment.
On February 6, 2015, the Company entered into the Second Amendment to Amended and Restated Credit Agreement (the “Second Amendment"), which amended the Credit Agreement. The Second Amendment modified the Minimum Consolidated Interest Coverage Ratio (as defined in the Credit Agreement) to 1.50 to 1.00 for the period ended December 31, 2014 and the period ending March 31, 2015 and modified the Maximum Consolidated Leverage Ratio (as defined in the Credit Agreement) to 7.90 to 1.00 for the period ended December 31, 2014.
Third amendment
. On June 2, 2015, the Company entered into the Third Amendment to the Amended and Restated Credit Agreement (the “Third Amendment"), which amended the Credit Agreement. The Third Amendment modified the definition of Consolidated EBIT to permit add backs for specified periods for reserves taken with respect to receivables, restructuring charges and adjustments for applying the rule of lower of cost or market to inventories, modified the Minimum Consolidated Interest Coverage Ratio to 1.60 to 1.00 for the periods ending June 30, 2015 and September 30, 2015, 1.65 to 1.00 for the period ending December 31, 2015 and 1.70 to 1.00 for the period ending March 31, 2016, modified the Maximum Consolidated Leverage Ratio to 7.60 to 1.00 for the periods ending June 30, 2015 and September 30, 2015 and 7.15 to 1.00 for the period ending December 31, 2015, modified the restricted payments covenant to permit repayment of the Company’s Senior Secured Second Lien Notes by up to $50.0 million in any fiscal year, with carry forward of any unused amount into the next fiscal year, modified a covenant to provide a 90-day cure period if Uncommitted Inventories (as defined in the Credit Agreement) exceed the threshold of $250.0 million, but only to the extent that they do not exceed $285.0 million, and provides for first-lien mortgages on the Company’s facilities located in Farmville, King and Wilson, North Carolina.
Fourth amendment
. On May 20, 2016, the Company entered into the Fourth Amendment to the Amended and Restated Credit Agreement (the "Fourth Amendment"), which amended the Credit Agreement. See Note 21 "Subsequent Events" to the Notes to Consolidated Financial Statements.
Fifth amendment
. On July 6, 2016, the Company entered into the Fifth Amendment to the Amended and Restated Credit Agreement (the “Fifth Amendment"), which amended the Credit Agreement. See Note 21 "Subsequent Events" to the Notes to Consolidated Financial Statements.
Financial covenants
. After giving effect to the First Amendment, the Second Amendment, the Third Amendment, the Fourth Amendment and the Fifth Amendment to the Amended and Restated Credit Agreement, the financial covenants and required financial ratios at March 31, 2016 are as follows:
• a minimum consolidated interest coverage ratio of not less than 1.70 to 1.00 for the fiscal quarter ended March 31, 2016 (1.90 to 1.00 for the fiscal quarters ending June 30, 2016, September 30, 2016 and December 31, 2016 and 1.65 to 1.00 for the fiscal quarter ending March 31, 2017);
• a maximum consolidated leverage ratio specified for each fiscal quarter, which ratio is 5.50 to 1.00 for the fiscal quarter ended March 31, 2016 (6.25 to 1.00 for the fiscal quarter ending June 30, 2016, 6.45 to 1.00 for the fiscal quarter ending and September 30, 2016, 6.25 to 1.00 for the fiscal quarter ending December 31, 2016, and 5.50 to 1.00 for the fiscal quarter ending March 31, 2017);
• a maximum consolidated total senior debt to working capital ratio of not more than 0.80 to 1.00 other than during periods in which the consolidated leverage ratio is less than 4.00 to 1.00 if the consolidated leverage ratio has been less than 4.00 to 1.00 for the prior two consecutive fiscal quarters; and
- 29
-
ITEM 7.
MANAGEMENT'S DISCUSSION AND ANALYSIS OF FINANCIAL
CONDITION AND RESULTS OF OPERATIONS
(continued)
Liquidity and Capital Resources
(continued)
Senior Secured Credit Facility
(continued)
Financial covenants
(continued)
• a maximum amount of the Company's annual capital expenditures of $52.5 million during the fiscal year ending March 31, 2016 and $40.0 million during any fiscal year thereafter, in each case with a one-year carry-forward (not in excess of $40.0 million) for unused capital expenditures in any fiscal year below the maximum amount.
Certain of these financial covenants are calculated on a rolling twelve-month basis and certain of these financial covenants and required financial ratios adjust over time in accordance with schedules in the agreement governing the senior secured credit facility.
Affirmative and restrictive covenants
. The agreement governing the senior secured credit facility contains affirmative and negative covenants (subject, in each case, to exceptions and qualifications), including covenants that limit the Company's ability to, among other things, incur additional indebtedness, incur certain guarantees, merge, consolidate or dispose of substantially all of its assets, grant liens on its assets, pay dividends, redeem stock or make other distributions or restricted payments, create certain dividend and payment restrictions on its subsidiaries, repurchase or redeem capital stock or prepay subordinated debt, make certain investments, agree to restrictions on the payment of dividends to it by its subsidiaries, sell or otherwise dispose of assets, including equity interests of its subsidiaries, enter into transactions with its affiliates, and enter into certain sale and leaseback transactions.
Senior Secured Second Lien Notes
On August 1, 2013, the Company issued $735.0 million in aggregate principal amount of the Second Lien Notes. The Second Lien Notes were sold at 98% of the face value, for gross proceeds of approximately $720.3 million. The Second Lien Notes bear interest at a rate of 9.875% per year, payable semi-annually in arrears in cash on January 15 and July 15 of each year, beginning January 15, 2014, to holders of record at the close of business on the preceding January 1 and July 1, respectively. The Second Lien Notes will mature on July 15, 2021. The Second Lien Notes are secured by a second priority lien on specified property of Alliance One International, Inc. for which the senior secured credit facility is secured by a first priority lien. The indenture governing the Second Lien Notes restricts (subject to exceptions and qualifications) the Company's ability and the ability of its restricted subsidiaries to, among other things, incur additional indebtedness or issue disqualified stock or preferred stock, pay dividends and make other restricted payments (including restricted investments), sell assets, create liens, consolidate, merge, sell or otherwise dispose of all or substantially all of its assets, enter into transactions with its affiliates, enter into certain sale and leaseback transactions, create certain dividend and payment restrictions on its restricted subsidiaries, and designate its subsidiaries as unrestricted subsidiaries.
The indenture governing the Second Lien Notes requires the Company's existing and future material domestic subsidiaries to guarantee the Second Lien Notes. The Company has no material domestic subsidiaries, and the Second Lien Notes are not presently guaranteed by any subsidiary. If a change of control (as defined in the indenture governing the Second Lien Notes) occurs at any time, holders of the Second Lien Notes will have the right, at their option, to require the Company to repurchase all or a portion of the Second Lien Notes for cash at a price equal to 101% of the principal amount of Second Lien Notes being repurchased, plus accrued and unpaid interest and special interest, if any, to, but excluding, the date of repurchase.
During the year ended March 31, 2015, the Company purchased $15.0 million of its senior notes on the open market. All purchased securities were canceled leaving $720.0 million of the 9.875% senior notes outstanding at March 31, 2015. Associated costs paid were $.04 million and related discounts were $(1.3) million resulting in net cash repayment of $13.7 million and recorded in Repayment of Long-Term Borrowings in the Consolidated Statements of Cash Flows. Deferred financing costs and amortization of original issue discount of $.5 million were accelerated.
Foreign Seasonal Lines of Credit
The Company has typically financed its non-U.S. operations with uncommitted unsecured short-term seasonal lines of credit at the local level. These operating lines are seasonal in nature, normally extending for a term of 180 to 270 days corresponding to the tobacco crop cycle in that location. These facilities are typically uncommitted in that the lenders have the right to cease making loans and certain lenders can demand repayment of loans at any time. These loans are typically renewed at the outset of each tobacco season. As of March 31, 2016, the Company had approximately $476.0 million drawn and outstanding on foreign seasonal lines with maximum capacity totaling $910.1 million subject to limitations as provided for in the Credit Agreement. Additionally, against these lines there was $13.1 million available in unused letter of credit capacity with $4.7 million issued but unfunded.
Long-Term Foreign Seasonal Borrowings
The Company had foreign seasonal borrowings with original maturities greater than one year. At March 31, 2016, approximately $10.0 million was drawn and outstanding with maximum capacity totaling $10.0 million.
- 30
-
ITEM 7.
MANAGEMENT'S DISCUSSION AND ANALYSIS OF FINANCIAL
CONDITION AND RESULTS OF OPERATIONS
(continued)
Liquidity and Capital Resources
(continued)
Dividends
The senior secured credit facility restricts the Company from paying any dividends during the remaining term of the facility. In addition, the indenture governing the Secured Second Lien Notes contains similar restrictions and also prohibits the payment of dividends and other distributions if we fail to satisfy a ratio of consolidated EBITDA to fixed charges of at least 2.0 to 1.0. At March 31, 2016, we did not satisfy this fixed charge coverage ratio. We may from time to time not satisfy this ratio.
Aggregate Contractual Obligations and Off-Balance Sheet Arrangements
We have summarized in the table below our contractual cash obligations and other commercial commitments as of March 31, 2016.
|
Payments / Expirations by Period
|
||||||||||||||||
|
(in millions)
|
Total
|
2017
|
|
Years
2018-2019 |
Years
2020-2021 |
After
2021 |
||||||||||
|
Long-Term Debt Obligations*
|
$
|
1,319.4
|
|
$
|
84.3
|
|
$
|
357.0
|
|
$
|
147.3
|
|
$
|
730.8
|
|
|
|
Other Long-Term Obligations**
|
46.4
|
|
6.8
|
|
8.5
|
|
8.9
|
|
22.2
|
|
||||||
|
Operating Lease Obligations
|
46.6
|
|
16.9
|
|
20.4
|
|
7.8
|
|
1.5
|
|
||||||
|
Tobacco and Other Purchase Obligations
|
800.0
|
|
588.0
|
|
212.0
|
|
—
|
|
—
|
|
||||||
|
Beneficial Interest in Receivables Sold
|
40.4
|
|
40.4
|
|
—
|
|
—
|
|
—
|
|
||||||
|
Amounts Guaranteed for Tobacco Suppliers
|
210.7
|
|
210.7
|
|
—
|
|
—
|
|
—
|
|
||||||
|
Total Contractual Obligations and Other
Commercial Commitments |
$
|
2,463.5
|
|
$
|
947.1
|
|
$
|
597.9
|
|
$
|
164.0
|
|
$
|
754.5
|
|
|
*
Long-Term Debt Obligations include projected interest for both fixed and variable rate debt. We assume that there will be no additional drawings after March 31, 2016 on the senior secured credit facility until the maturity of April 15, 2017, in these calculations. The variable rate used in the projections is the rate that was being charged on our variable rate debt as of March 31, 2016. These calculations also assume that there is no refinancing of debt during any period. These calculations are on Long-Term Debt Obligations only.
**Other long-term obligations consist of accrued pension and postretirement costs. Contributions for funded pension plans are based on the Pension Protection Act and tax deductibility and are not reasonably estimable beyond one year. Contributions for unfunded pension plans and postretirement plans captioned under "After 2021" include obligations during the next five years only. These obligations are not reasonably estimable beyond ten years. In addition, the following long-term liabilities included on the consolidated balance sheet are excluded from the table above: accrued postemployment costs, income taxes and tax contingencies, and other accruals. We are unable to estimate the timing of payments for these items.
We do not have any other off-balance sheet arrangements that are reasonably likely to have a current or future effect on our financial condition, results of operations, liquidity, capital expenditures or capital resources, as defined under the rules of SEC Release No. FRR-67,
Disclosure in Management’s Discussion and Analysis about Off-Balance Sheet Arrangements and Aggregate Contractual Obligations
.
Lease Obligations
We have operating leases for land, buildings, automobiles and other equipment. In accordance with accounting principles generally accepted in the United States, operating leases are not reflected in the accompanying Consolidated Balance Sheet. Operating assets that are of long-term and continuing benefit are generally purchased.
Tobacco and Other Purchase Obligations
Tobacco purchase obligations result from contracts with suppliers, primarily in the United States, Brazil, Malawi and Turkey, to buy either specified quantities of tobacco or the supplier’s total tobacco production. Amounts shown as tobacco purchase obligations are estimates based on projected purchase prices of the future crop tobacco. Payment of these obligations is net of our advances to these suppliers. Our tobacco purchase obligations do not exceed our projected requirements over the related terms and are in the normal course of business. Other purchase obligations consist primarily of purchase commitments of agricultural material.
Beneficial Interest in Receivables Sold
We sell accounts receivable under two revolving trade accounts receivable securitization programs. Under the agreements, we receive either 80% or 90% of the face value of the receivable sold, less contractual dilutions which limit the amount that may be outstanding from any one particular customer and insurance reserves that also have the effect of limiting the risk attributable to any one customer. Our beneficial interest is subordinate to the purchaser of the receivables. See Note 17 “Sale of Receivables” to the “Notes to Consolidated Financial Statements” for further information.
- 31
-
ITEM 7.
MANAGEMENT'S DISCUSSION AND ANALYSIS OF FINANCIAL
CONDITION AND RESULTS OF OPERATIONS
(continued)
Liquidity and Capital Resources
(continued)
Aggregate Contractual Obligations and Off-Balance Sheet Arrangements
(continued)
Amounts Guaranteed for Tobacco Suppliers
In Brazil and Malawi, we provide guarantees to ensure financing is available to our tobacco suppliers. In the event these suppliers should default, we would be responsible for repayment of the funds provided to these suppliers. We also provide guarantees for financing by certain unconsolidated subsidiaries in Asia and Brazil. See Note 1 “Significant Accounting Policies – Advances to Tobacco Suppliers” to the “Notes to Consolidated Financial Statements” for further information.
Planned Capital Expenditures
We have projected a total of $22.0 million in capital investments for our 2017 fiscal year. We forecast our capital expenditure needs for routine replacement of equipment as well as investment in assets that will add value to the customer or increase efficiency.
Tax and Repatriation Matters
We are subject to income tax laws in each of the countries in which we do business through wholly owned subsidiaries and through affiliates. We make a comprehensive review of the income tax requirements of each of our operations, file appropriate returns and make appropriate income tax planning analyses directed toward the minimization of our income tax obligations in these countries. Appropriate income tax provisions are determined on an individual subsidiary level and at the corporate level on both an interim and annual basis. These processes are followed using an appropriate combination of internal staff at both the subsidiary and corporate levels as well as independent outside advisors in review of the various tax laws and in compliance reporting for the various operations.
We regularly review the status of the accumulated unremitted earnings of each of our foreign subsidiaries. We would provide deferred income taxes, net of any foreign tax credits, if applicable, on any earnings that are determined to no longer be indefinitely invested. See Note 12 “Income Taxes” to the “Notes to Consolidated Financial Statements” for further information.
Critical Accounting Estimates
The preparation of financial statements in accordance with generally accepted accounting principles in the United States (GAAP) requires the use of estimates and assumptions that have an impact on the assets, liabilities, revenue and expense amounts reported. These estimates can also affect supplemental disclosures including information about contingencies, risk and financial condition.
Critical accounting estimates are defined as those that are reflective of significant judgments and uncertainties and potentially yield materially different results under different assumptions or conditions. Given current facts and circumstances, we believe that our estimates and assumptions are reasonable, adhere to GAAP and are consistently applied. Our selection and disclosure of our critical accounting policies and estimates has been reviewed with our Audit Committee. Following is a review of the more significant assumptions and estimates and the accounting policies and methods used in the preparation of our consolidated financial statements. For all of these estimates, we caution that future events rarely develop exactly as forecast, and the best estimates routinely require adjustment. See Note 1 “Significant Accounting Policies” to the “Notes to Consolidated Financial Statements” which discusses the significant accounting policies that we have adopted.
Inventories
Costs included in inventory include processed tobacco inventory, unprocessed tobacco inventory and other inventory costs. Inventories are valued at the lower of cost or market (“LCM”), which requires us to make significant estimates in assessing our inventory balances for potential LCM adjustments. We evaluate our inventories for LCM adjustments by country and type of inventory. Therefore, processed tobacco and unprocessed tobacco are evaluated separately for LCM purposes. We compare the cost of our processed tobacco to market values based on recent sales of similar grades when evaluating those balances for LCM adjustments. We also consider whether our processed tobacco is committed to a customer, whereby the expected sales price would be utilized in determining the market value for committed tobacco. We also review data on market conditions in performing our LCM evaluation for our unprocessed tobacco. See Note 1 “Significant Accounting Policies - Inventories” and Note 2 “Inventories” to the “Notes to Consolidated Financial Statements” for further information.
- 32
-
ITEM 7.
MANAGEMENT'S DISCUSSION AND ANALYSIS OF FINANCIAL
CONDITION AND RESULTS OF OPERATIONS
(continued)
Critical Accounting Estimates
(continued)
Income Taxes
Our annual tax rate is based on our income, statutory tax rates, exchange rates and tax planning opportunities available to us in the various jurisdictions in which we operate. Tax laws are complex and subject to different interpretations by the taxpayer and respective governmental taxing authorities. Significant judgment is required in determining our tax expense and in evaluating our tax positions including evaluating uncertainties under ASC 740. We review our tax positions quarterly and adjust the balances as new information becomes available.
Deferred income tax assets represent amounts available to reduce income taxes payable on taxable income in future years. Such assets arise because of temporary differences between the financial reporting and tax bases of assets and liabilities, as well as from net operating loss and tax credit carryforwards. We evaluate the recoverability of these future tax deductions by assessing the adequacy of future expected taxable income from all sources, including reversal of taxable temporary differences, forecasted operating earnings and available tax planning strategies. These sources of income inherently rely heavily on estimates. To provide insight, we use our historical experience and our short and long-range business forecasts. We believe it is more likely than not that a portion of the deferred income tax assets may expire unused and have established a valuation allowance against them. Although realization is not assured for the remaining deferred income tax assets, we believe it is more likely than not the deferred tax assets will be fully recoverable within the applicable statutory expiration periods. However, deferred tax assets could be reduced in the near term if our estimates of taxable income are significantly reduced. See Note 12 “Income Taxes” to the “Notes to Consolidated Financial Statements” for further information.
Advances to Tobacco Suppliers
We evaluate our advances to tobacco suppliers, which represent prepaid inventory, for recoverability by crop and country. Our recoverability assessment for our advances to tobacco suppliers and our LCM evaluation for our inventories achieve a similar objective. We reclassify the advances to inventory at the time suppliers deliver tobacco. The purchase price for the tobacco delivered by the suppliers is based on market prices. Two primary factors determine the market value of the tobacco suppliers deliver to us: the quantity of tobacco delivered and the quality of the tobacco delivered. Therefore, and at the time of delivery, we ensure our advances to tobacco suppliers are appropriately stated at the lower of cost or their recoverable amounts.
Upon delivery of tobacco, part of the purchase price to the supplier is paid in cash and part through a reduction of the advance balance. If a sufficient value of tobacco is not delivered to allow the reduction of the entire advance balance, then we first determine how much of the deficiency for the current crop is recoverable through future crops. This determination is made by analyzing the suppliers’ ability-to-deliver a sufficient supply of tobacco. This analysis includes historical quantity and quality of production with monitoring of crop information provided by our field service technicians related to flood, drought and disease. The remaining recoverable advance balance would then be classified as noncurrent. Any increase in the estimate of unrecoverable advances associated with the noncurrent portion is charged to cost of goods and services sold in the income statement when determined.
Amounts not expected to be recovered through current or future crops are then evaluated to determine whether the yield is considered to be normal or abnormal. If the yield adjustment is normal, then we capitalize the applicable variance in the current crop of inventory. If the yield adjustment is considered abnormal, then we immediately charge the applicable variance to cost of goods and services sold in the income statement. A normal yield adjustment is based on the range of unrecoverability for the previous three years by country. Our normal yield adjustment in the South America region is to
5.0%
.
We account for our advances to tobacco suppliers using a cost accumulation model, which results in reporting our advances at the lower of cost or recoverable amounts exclusive of the mark-up and interest. The mark-up and interest on our advances are recognized upon delivery of tobacco as a decrease in our cost of the current crop.
The following table illustrates the amounts of favorable and unfavorable variances on current crop advances to tobacco suppliers (prepaid inventory) that will be capitalized into inventory when the crop has been purchased as of March 31, 2016, 2015 and 2014. The current crop is primarily sold in the next fiscal year when the net favorable / (unfavorable) variance is recognized through cost of sales. See Note 1 “Significant Accounting Policies – Advances to Tobacco Suppliers” for further information on the various components noted below. Variances on advances serve to state the tobacco inventory at cost by accumulating actual total cash expended and allocating it to the tobacco received during the crop cycle.
|
(in millions)
|
2016
|
2015
|
2014
|
||||||
|
Favorable variances (including mark-up)
|
$
|
14.2
|
|
$
|
19.8
|
|
$
|
18.2
|
|
|
Unfavorable variances (including unrecoverable advances)
|
(8.5
|
)
|
(11.4
|
)
|
(15.3
|
)
|
|||
|
Net favorable variance in crop cost in inventory
|
$
|
5.7
|
|
$
|
8.4
|
|
$
|
2.9
|
|
- 33
-
ITEM 7.
MANAGEMENT'S DISCUSSION AND ANALYSIS OF FINANCIAL
CONDITION AND RESULTS OF OPERATIONS
(continued)
Critical Accounting Estimates
(continued)
Advances to Tobacco Suppliers
(continued)
Other Regions
The price, and the resulting mark-up, of the inputs we advance is determined at the beginning of each season and depends on various market considerations. The interest rate charged on advances depends on market conditions as well. We purchase and advance the inputs based on an expected crop production. These advances are in the currency of the local market. We base our estimate of the unrecoverable advances on numerous factors, including, but not limited to our expectations of the quantity and quality of tobacco our suppliers will deliver to us.
Within the Other Regions, Brazil and Africa are the primary areas where we advance some inputs to suppliers for the coming crop based on expected crop production. Advances to tobacco suppliers in most other areas are primarily cash advances to third party commercial suppliers.
For 2016, favorable variances decreased due to the currency impact in South America and due to smaller crops in Other Regions due to the global oversupply situation. Additionally, unfavorable variances decreased for similar reasons, as well as fewer unrecoverable advances in certain locations.
For 2015, favorable and unfavorable variances decreased primarily due to the deconsolidation of our former Brazilian subsidiary following the completion of a joint venture in March 2014. This decrease in favorable variances was offset by the positive currency impact on this year's prices charged to tobacco suppliers for agricultural products as well as the cost of those agricultural products due to timing that resulted in increased favorable variances on a U.S. dollar basis.
We believe the favorable variances relating to the 2016, 2015 and 2014 crops are representative of average favorable variance percentages based on market conditions and currency rates in each year. The Company did not incur any other changes in net variances within the Other Regions operating segments for 2016, 2015 and 2014 that were absorbed into inventory.
North America Region
In Guatemala, we advance some inputs to suppliers for the coming crop based on expected crop production. For 2016, 2015, and 2014, advances in North America have a minor impact to the consolidated favorable and unfavorable variances.
Asset Impairment
Long-lived assets, including recoverable intrastate trade tax credits, are reviewed for impairment whenever events or changes in circumstances indicate that the related carrying amounts may not be recoverable. Determining whether an impairment has occurred typically requires various estimates and assumptions, including determining which undiscounted cash flows are directly related to the potentially impaired asset, the useful life over which cash flows will occur, their amount, and the asset’s residual value, if any. In turn, measurement of an impairment loss requires a determination of fair value, which is based on the best information available. We derive the required undiscounted cash flow estimates from our historical experience and our internal business plans. To determine fair value, we use our internal cash flow estimates discounted at an appropriate interest rate, quoted market prices when available and independent appraisals, as appropriate. Accordingly, the fair value of an asset could be different using different estimates and assumptions in these valuation techniques which would increase or decrease the impairment charge.
Other Intangible Assets
We have no intangible assets with indefinite useful lives. We test identified intangible assets with defined useful lives and subject to amortization whenever events or changes in circumstances indicate that the related carrying amounts may not be recoverable. We perform this test by initially comparing the carrying amount to the sum of undiscounted cash flows expected to be generated by the asset. If the carrying amount of an intangible asset exceeds its estimated future undiscounted cash flows, then an impairment loss would be indicated. The amount of the impairment loss to be recorded would be based on the excess of the carrying amount of the intangible asset over its discounted future cash flows. We use judgment in assessing whether the carrying amount of our intangible assets is not expected to be recoverable over their estimated remaining useful lives. See Note 5 “Goodwill and Other Intangibles” to the “Notes to Consolidated Financial Statements” for further information.
Business Combinations
The reconsolidation of MTC has been treated as a purchase business combination which requires recording the assets and liabilities of MTC at their estimated fair values. The Company employed a discounted cash flow model to estimate the fair values of the assets and liabilities. The model used assumptions and estimates including projections of financial information; forecasted capital expenditure requirements and related tax depreciation; cash-free, debt-free long-term growth rate; and discount rate. Management's estimates were based on historical performance, current market conditions and industry trends, long-term customer relationships and strategic plans for future business growth and opportunities. Liquidity assumptions were based on the historical and current economic environments in capital markets.
- 34
-
ITEM 7.
MANAGEMENT'S DISCUSSION AND ANALYSIS OF FINANCIAL
CONDITION AND RESULTS OF OPERATIONS
(continued)
Critical Accounting Estimates
(continued)
Pensions and Postretirement Health Care and Life Insurance Benefits
The valuation of our pension and other postretirement health care and life insurance plans requires the use of assumptions and estimates that are used to develop actuarial valuations of expenses, assets and liabilities. These assumptions include discount rates, investment returns, projected salary increases and benefits and mortality rates. The significant assumptions used in the calculation of pension and postretirement obligations are:
|
Discount rate: The discount rate is based on investment yields available at the measurement date on high-quality fixed income obligations, such as those included in the Moody’s Aa bond index.
|
|
Salary increase assumption: The salary increase assumption reflects our expectations with respect to long-term salary increases of our workforce. Historical pay increases, expectations for the future, and anticipated inflation and promotion rates are considered in developing this assumption.
|
|
Cash Balance Crediting Rate: Interest is credited on cash balance accounts based on the yield on one-year Treasury Constant Maturities plus 1%. The assumed crediting rate thus considers the discount rate, current treasury rates, current inflation rates, and expectations for the future.
|
|
Mortality Rates: Mortality rates are based on gender-distinct group annuity mortality (GAM) tables.
|
|
Expected return on plan assets: The expected return reflects asset allocations, investment strategy and our historical actual returns.
|
|
Termination and Retirement Rates: Termination and retirement rates are based on standard tables reflecting past experience and anticipated future experience under the plan. No early retirement rates are used since benefits provided are actuarially equivalent and there are not early retirement subsidies in the plan.
|
Management periodically reviews actual demographic experience as it compares to the actuarial assumptions. Changes in assumptions are made if there are significant deviations or if future expectations change significantly. Based upon anticipated changes in assumptions, pension and postretirement expense is expected to decrease by $4.5 million in the fiscal year ended March 31, 2017 as compared to March 31, 2016. We continually evaluate ways to better manage benefits and control costs. The cash contribution to our employee benefit plans in fiscal 2016 was $7.7 million and is expected to be $6.8 million in fiscal 2017.
The effect of actual results differing from our assumptions are accumulated and amortized over future periods and, therefore, generally affect our recognized expense in such future periods. Changes in other assumptions and future investment returns could potentially have a material impact on our pension and postretirement expenses and related funding requirements.
The effect of a change in certain assumptions is shown below:
|
Estimated Change
in Projected Benefit Obligation Increase (Decrease) (in 000’s) |
Estimated Change in
Annual Expense Increase (Decrease) (in 000’s) |
|||||||
|
Change in Assumption (Pension and Postretirement Plans)
|
||||||||
|
1% increase in discount rate
|
$
|
(17,093
|
)
|
$
|
(290
|
)
|
||
|
1% decrease in discount rate
|
$
|
20,082
|
|
$
|
211
|
|
||
|
1% increase in salary increase assumption
|
$
|
192
|
|
$
|
44
|
|
||
|
1% decrease in salary increase assumption
|
$
|
(177
|
)
|
$
|
(46
|
)
|
||
|
1% increase in cash balance crediting rate
|
$
|
1,449
|
|
$
|
105
|
|
||
|
1% decrease in cash balance crediting rate
|
$
|
(1,250
|
)
|
$
|
(90
|
)
|
||
|
1% increase in rate of return on assets
|
$
|
(905
|
)
|
|||||
|
1% decrease in rate of return on assets
|
$
|
905
|
|
|||||
Changes in assumptions for other post retirement benefits are no longer applicable as the benefit is capped and no longer subject to inflation. See Note 13 “Employee Benefits” to the “Notes to Consolidated Financial Statements” for further information.
- 35
-
ITEM 7.
MANAGEMENT'S DISCUSSION AND ANALYSIS OF FINANCIAL
CONDITION AND RESULTS OF OPERATIONS
(continued)
Recent Accounting Pronouncements Not Yet Adopted
See Note 1 "Significant Accounting Policies" to the "Notes to Consolidated Financial Statements" for further information.
ITEM 7A.
QUANTITATIVE AND QUALITATIVE DISCLOSURES ABOUT MARKET RISK
Derivatives policies:
Hedging interest rate exposure using swaps and hedging foreign exchange exposure using forward contracts are specifically contemplated to manage risk in keeping with management’s policies. We may use derivative instruments, such as swaps or forwards, which are based directly or indirectly upon interest rates and currencies to manage and reduce the risks inherent in interest rate and currency fluctuations.
We do not utilize derivatives for speculative purposes, and we do not enter into market risk sensitive instruments for trading purposes. Derivatives are transaction specific so that a specific debt instrument, contract, or invoice determines the amount, maturity, and other specifics of the hedge.
Foreign exchange rates:
Our business is generally conducted in U.S. dollars, as is the business of the tobacco industry as a whole.
However, local country operating costs, including the purchasing and processing costs for tobaccos, are subject to the effects of exchange fluctuations of the local currency against the U.S. dollar. We attempt to minimize such currency risks by matching the timing of our working capital borrowing needs against the tobacco purchasing and processing funds requirements in the currency of the country where the tobacco is grown. Also, in some cases, our sales pricing arrangements with our customers allow adjustments for the effect of currency exchange fluctuations on local purchasing and processing costs. Fluctuations in the value of foreign currencies can significantly affect our operating results. In our cost of goods and services sold, we have recognized exchange gains (losses) of $(0.9) million, $3.8 million and $(4.7) million for the fiscal years ended March 31, 2016, 2015 and 2014, respectively. We recognized exchange losses of $5.6 million, $7.9 million and $7.6 million related to tax balances in our tax expense for the fiscal years ended March 31, 2016, 2015 and 2014, respectively. In addition, foreign currency fluctuations in the Euro and (U.K.) Sterling can significantly impact the currency translation adjustment component of accumulated other comprehensive income. We recognized gains (losses) of $0.1 million, $(12.5) million and $4.1 million in 2016, 2015, and 2014, respectively, as a result of fluctuations in these currencies.
Our consolidated SG&A expenses denominated in foreign currencies are subject to translation risks from currency exchange fluctuations. These foreign denominated expenses accounted for approximately 27.3% or $33.8 million of our total SG&A expenses for the twelve months ended March 31, 2016. A 10% change in the value of the U.S. dollar relative to those currencies would have caused the reported value of those expenses to increase or decrease by approximately $3.4 million.
Interest rates:
We manage our exposure to interest rate risk through the proportion of fixed rate and variable rate debt in our total debt portfolio. A 1% change in variable interest rates would increase or decrease our reported interest cost by approximately $6.7 million. A substantial portion of our borrowings are denominated in U.S. dollars and bear interest at commonly quoted rates.
- 36
-
ITEM 8.
FINANCIAL STATEMENTS AND SUPPLEMENTARY DATA
STATEMENTS OF CONSOLIDATED OPERATIONS
Alliance One International, Inc. and Subsidiaries
Alliance One International, Inc. and Subsidiaries
|
Years Ended March 31,
|
||||||||||
|
(in thousands, except per share data)
|
2016
|
2015
|
2014
|
|||||||
|
Sales and other operating revenues
|
$
|
1,904,592
|
|
$
|
2,066,865
|
|
$
|
2,354,536
|
|
|
|
Cost of goods and services sold
|
1,678,798
|
|
1,823,366
|
|
2,128,586
|
|
||||
|
Gross profit
|
225,794
|
|
243,499
|
|
225,950
|
|
||||
|
Selling, general and administrative expenses
|
123,546
|
|
137,020
|
|
134,086
|
|
||||
|
Other income (expense)
|
105,427
|
|
(66
|
)
|
18,760
|
|
||||
|
Restructuring and asset impairment charges
|
5,888
|
|
9,118
|
|
5,111
|
|
||||
|
Operating income
|
201,787
|
|
97,295
|
|
105,513
|
|
||||
|
Debt retirement expense (income)
|
—
|
|
(771
|
)
|
57,449
|
|
||||
|
Interest expense
|
117,190
|
|
113,273
|
|
116,827
|
|
||||
|
Interest income
|
7,077
|
|
6,268
|
|
7,068
|
|
||||
|
Income (loss) before income taxes and other items
|
91,674
|
|
(8,939
|
)
|
(61,695
|
)
|
||||
|
Income tax expense
|
32,215
|
|
21,918
|
|
41,241
|
|
||||
|
Equity in net income of investee companies
|
5,986
|
|
2,823
|
|
60
|
|
||||
|
Net income (loss)
|
65,445
|
|
(28,034
|
)
|
(102,876
|
)
|
||||
|
Less: Net loss attributable to noncontrolling interests
|
(87
|
)
|
(172
|
)
|
(343
|
)
|
||||
|
Net income (loss) attributable to Alliance One International, Inc.
|
$
|
65,532
|
|
$
|
(27,862
|
)
|
$
|
(102,533
|
)
|
|
|
Earnings (loss) per share:
|
||||||||||
|
Basic
|
$
|
7.38
|
|
$
|
(3.16
|
)
|
$
|
(11.69
|
)
|
|
|
Diluted
|
$
|
7.38
|
|
$
|
(3.16
|
)
|
$
|
(11.69
|
)
|
|
|
See notes to consolidated financial statements.
|
||||||||||
- 37
-
ITEM 8.
FINANCIAL STATEMENTS AND SUPPLEMENTARY DATA
(continued)
CONSOLIDATED STATEMENTS OF COMPREHENSIVE INCOME (LOSS)
Alliance One International, Inc. and Subsidiaries
|
Years Ended March 31,
|
||||||||||
|
(in thousands)
|
2016
|
2015
|
2014
|
|||||||
|
Net income (loss)
|
$
|
65,445
|
|
$
|
(28,034
|
)
|
$
|
(102,876
|
)
|
|
|
Other comprehensive income (loss), net of tax:
|
||||||||||
|
Currency translation adjustment
|
108
|
|
(12,514
|
)
|
4,084
|
|
||||
|
Pension prior service credit (cost) and net actuarial gain (loss), net of tax of
$(328) in 2016, $186 in 2015 and $(306) in 2014
|
12,437
|
|
(15,546
|
)
|
13,007
|
|
||||
|
Total other comprehensive income (loss), net of tax
|
12,545
|
|
(28,060
|
)
|
17,091
|
|
||||
|
Total comprehensive income (loss)
|
77,990
|
|
(56,094
|
)
|
(85,785
|
)
|
||||
|
Comprehensive loss attributable to noncontrolling interests
|
(80
|
)
|
(172
|
)
|
(343
|
)
|
||||
|
Comprehensive income (loss) attributable to Alliance One International, Inc.
|
$
|
78,070
|
|
$
|
(55,922
|
)
|
$
|
(85,442
|
)
|
|
|
See notes to consolidated financial statements.
|
||||||||||
- 38
-
ITEM 8.
FINANCIAL STATEMENTS AND SUPPLEMENTARY DATA
(continued)
Alliance One International, Inc. and Subsidiaries
|
March 31, 2016
|
March 31, 2015
|
||||||
|
(in thousands)
|
|||||||
|
ASSETS
|
|||||||
|
Current assets
|
|||||||
|
Cash and cash equivalents
|
$
|
199,720
|
|
$
|
143,849
|
|
|
|
Trade receivables, net
|
303,907
|
|
184,772
|
|
|||
|
Other receivables
|
97,101
|
|
54,731
|
|
|||
|
Accounts receivable, related parties
|
1,920
|
|
7,491
|
|
|||
|
Inventories
|
791,340
|
|
739,563
|
|
|||
|
Advances to tobacco suppliers
|
41,837
|
|
37,767
|
|
|||
|
Recoverable income taxes
|
13,421
|
|
3,433
|
|
|||
|
Current deferred taxes
|
—
|
|
15,586
|
|
|||
|
Prepaid expenses
|
20,016
|
|
23,901
|
|
|||
|
Current derivative asset
|
—
|
|
1,373
|
|
|||
|
Other current assets
|
21,096
|
|
13,233
|
|
|||
|
Total current assets
|
1,490,358
|
|
1,225,699
|
|
|||
|
Other assets
|
|||||||
|
Investments in unconsolidated affiliates
|
58,259
|
|
54,694
|
|
|||
|
Goodwill
|
16,463
|
|
2,794
|
|
|||
|
Other intangible assets
|
50,571
|
|
29,097
|
|
|||
|
Long-term recoverable income taxes
|
8,686
|
|
6,571
|
|
|||
|
Deferred income taxes
|
38,773
|
|
32,111
|
|
|||
|
Other deferred charges
|
13,809
|
|
17,695
|
|
|||
|
Other noncurrent assets
|
23,629
|
|
27,631
|
|
|||
|
210,190
|
|
170,593
|
|
||||
|
Property, plant and equipment, net
|
277,525
|
|
237,914
|
|
|||
|
$
|
1,978,073
|
|
$
|
1,634,206
|
|
||
|
LIABILITIES AND STOCKHOLDERS’ EQUITY
|
|||||||
|
Current liabilities
|
|||||||
|
Notes payable to banks
|
$
|
475,989
|
|
$
|
330,254
|
|
|
|
Accounts payable
|
81,649
|
|
73,349
|
|
|||
|
Due to related parties
|
20,490
|
|
58,512
|
|
|||
|
Advances from customers
|
9,895
|
|
18,906
|
|
|||
|
Accrued expenses and other current liabilities
|
74,425
|
|
87,815
|
|
|||
|
Income taxes
|
12,022
|
|
12,694
|
|
|||
|
Long-term debt current
|
356
|
|
2,894
|
|
|||
|
Total current liabilities
|
674,826
|
|
584,424
|
|
|||
|
Long-term debt
|
920,089
|
|
738,943
|
|
|||
|
Deferred income taxes
|
16,924
|
|
2,454
|
|
|||
|
Liability for unrecognized tax benefits
|
9,809
|
|
11,011
|
|
|||
|
Pension, postretirement and other long-term liabilities
|
81,753
|
|
103,310
|
|
|||
|
1,028,575
|
|
855,718
|
|
||||
|
Commitments and contingencies
|
|
|
|
|
|||
|
Stockholders’ equity
|
|||||||
|
Common stock—no par value:
|
|||||||
|
250,000 authorized shares, 9,685 issued and outstanding (9,644 at March 31,
2015)
|
470,830
|
|
468,564
|
|
|||
|
Retained deficit
|
(145,856
|
)
|
(211,388
|
)
|
|||
|
Accumulated other comprehensive loss
|
(53,848
|
)
|
(66,386
|
)
|
|||
|
Total stockholders’ equity of Alliance One International, Inc.
|
271,126
|
|
190,790
|
|
|||
|
Noncontrolling interests
|
3,546
|
|
3,274
|
|
|||
|
Total equity
|
274,672
|
|
194,064
|
|
|||
|
$
|
1,978,073
|
|
$
|
1,634,206
|
|
||
|
See notes to consolidated financial statements.
|
|||||||
- 39
-
ITEM 8.
FINANCIAL STATEMENTS AND SUPPLEMENTARY DATA
(continued)
STATEMENTS OF CONSOLIDATED STOCKHOLDERS’ EQUITY
Alliance One International, Inc. and Subsidiaries
|
Attributable to Alliance One International, Inc.
|
|||||||||||||||||||
|
Accumulated Other
Comprehensive Income |
|||||||||||||||||||
|
(in thousands)
|
Common
Stock |
Retained
Deficit |
Currency
Translation Adjustment |
Pensions,
Net of Tax |
Noncontrolling
Interest |
Total
Stockholders’ Equity |
|||||||||||||
|
Balance, March 31, 2013
|
$
|
460,914
|
|
$
|
(80,993
|
)
|
$
|
(5,724
|
)
|
$
|
(49,693
|
)
|
$
|
3,638
|
|
$
|
328,142
|
|
|
|
Net loss
|
—
|
|
(102,533
|
)
|
—
|
|
—
|
|
(343
|
)
|
(102,876
|
)
|
|||||||
|
Restricted stock surrendered
|
(337
|
)
|
—
|
|
—
|
|
—
|
|
—
|
|
(337
|
)
|
|||||||
|
Stock-based compensation
|
5,105
|
|
—
|
|
—
|
|
—
|
|
—
|
|
5,105
|
|
|||||||
|
Other comprehensive income, net of
tax
|
—
|
|
—
|
|
4,084
|
|
13,007
|
|
—
|
|
17,091
|
|
|||||||
|
Balance, March 31, 2014
|
$
|
465,682
|
|
$
|
(183,526
|
)
|
$
|
(1,640
|
)
|
$
|
(36,686
|
)
|
$
|
3,295
|
|
$
|
247,125
|
|
|
|
Net loss
|
—
|
|
(27,862
|
)
|
—
|
|
—
|
|
(172
|
)
|
(28,034
|
)
|
|||||||
|
Acquisition of noncontrolling interest
|
—
|
|
—
|
|
—
|
|
—
|
|
151
|
|
151
|
|
|||||||
|
Restricted stock surrendered
|
(146
|
)
|
—
|
|
—
|
|
—
|
|
—
|
|
(146
|
)
|
|||||||
|
Stock-based compensation
|
3,028
|
|
—
|
|
—
|
|
—
|
|
—
|
|
3,028
|
|
|||||||
|
Other comprehensive loss, net of
tax
|
—
|
|
—
|
|
(12,514
|
)
|
(15,546
|
)
|
—
|
|
(28,060
|
)
|
|||||||
|
Balance, March 31, 2015
|
$
|
468,564
|
|
$
|
(211,388
|
)
|
$
|
(14,154
|
)
|
$
|
(52,232
|
)
|
$
|
3,274
|
|
$
|
194,064
|
|
|
|
Net income (loss)
|
—
|
|
65,532
|
|
—
|
|
—
|
|
(87
|
)
|
65,445
|
|
|||||||
|
Acquisition of noncontrolling interest
|
—
|
|
—
|
|
—
|
|
—
|
|
352
|
|
352
|
|
|||||||
|
Restricted stock surrendered
|
(157
|
)
|
—
|
|
—
|
|
—
|
|
—
|
|
(157
|
)
|
|||||||
|
Stock-based compensation
|
2,423
|
|
—
|
|
—
|
|
—
|
|
—
|
|
2,423
|
|
|||||||
|
Other comprehensive income, net of
tax
|
—
|
|
—
|
|
108
|
|
12,430
|
|
7
|
|
12,545
|
|
|||||||
|
Balance, March 31, 2016
|
$
|
470,830
|
|
$
|
(145,856
|
)
|
$
|
(14,046
|
)
|
$
|
(39,802
|
)
|
$
|
3,546
|
|
$
|
274,672
|
|
|
|
See notes to consolidated financial statements.
|
|||||||||||||||||||
- 40
-
ITEM 8.
FINANCIAL STATEMENTS AND SUPPLEMENTARY DATA
(continued)
Alliance One International, Inc. and Subsidiaries
|
|
|||||||||
|
Years Ended March 31,
|
|||||||||
|
(in thousands)
|
2016
|
2015
|
2014
|
||||||
|
Operating activities
|
|||||||||
|
Net income (loss)
|
$
|
65,445
|
|
$
|
(28,034
|
)
|
$
|
(102,876
|
)
|
|
Adjustments to reconcile net income (loss) to net cash provided (used) by operating activities:
|
|||||||||
|
Depreciation and amortization
|
28,361
|
|
29,623
|
|
32,427
|
|
|||
|
Debt amortization/interest
|
11,333
|
|
8,816
|
|
12,707
|
|
|||
|
Debt retirement
|
—
|
|
(771
|
)
|
57,449
|
|
|||
|
Restructuring and asset impairment charges
|
5,888
|
|
9,118
|
|
5,111
|
|
|||
|
Loss on foreign currency transactions
|
6,498
|
|
8,274
|
|
12,348
|
|
|||
|
Gain on sale of property, plant and equipment
|
(597
|
)
|
(1,751
|
)
|
(3,175
|
)
|
|||
|
Reconsolidation of subsidiary
|
(106,203
|
)
|
—
|
|
—
|
|
|||
|
Gain on disposition of stock in subsidiaries
|
—
|
|
—
|
|
(20,369
|
)
|
|||
|
Loss on acquisition of equity method investment
|
—
|
|
—
|
|
1,253
|
|
|||
|
Bad debt expense
|
(169
|
)
|
12,368
|
|
312
|
|
|||
|
Equity in net income of unconsolidated affiliates, net of dividends
|
(4,105
|
)
|
(2,823
|
)
|
783
|
|
|||
|
Stock-based compensation
|
2,874
|
|
3,194
|
|
3,222
|
|
|||
|
Changes in operating assets and liabilities, net:
|
|||||||||
|
Trade and other receivables
|
(149,825
|
)
|
(50,358
|
)
|
51,085
|
|
|||
|
Inventories and advances to tobacco suppliers
|
(13,747
|
)
|
(3,992
|
)
|
168,900
|
|
|||
|
Deferred items
|
(2,439
|
)
|
(18,025
|
)
|
4,888
|
|
|||
|
Recoverable income taxes
|
(8,563
|
)
|
(1,372
|
)
|
(1,370
|
)
|
|||
|
Payables and accrued expenses
|
46,767
|
|
(23,408
|
)
|
26,838
|
|
|||
|
Advances from customers
|
(19,224
|
)
|
(3,638
|
)
|
3,330
|
|
|||
|
Current derivative asset
|
1,373
|
|
(1,373
|
)
|
3,145
|
|
|||
|
Prepaids
|
6,218
|
|
1,743
|
|
4,238
|
|
|||
|
Income taxes
|
2,943
|
|
5,511
|
|
538
|
|
|||
|
Other operating assets and liabilities
|
(8,382
|
)
|
1,452
|
|
(1,127
|
)
|
|||
|
Other, net
|
227
|
|
223
|
|
2,815
|
|
|||
|
Net cash provided (used) by operating activities
|
(135,327
|
)
|
(55,223
|
)
|
262,472
|
|
|||
|
Investing activities
|
|||||||||
|
Purchases of property, plant and equipment
|
(17,194
|
)
|
(25,273
|
)
|
(24,928
|
)
|
|||
|
Intangibles, including internally developed software costs
|
—
|
|
(781
|
)
|
(7,803
|
)
|
|||
|
Proceeds from sale of property, plant and equipment
|
2,270
|
|
16,840
|
|
9,336
|
|
|||
|
Proceeds on sale of subsidiaries, net of cash divested
|
—
|
|
—
|
|
3,513
|
|
|||
|
Payments to acquire equity method investments
|
—
|
|
(1,655
|
)
|
(3,500
|
)
|
|||
|
Change in restricted cash
|
(276
|
)
|
(1,678
|
)
|
268
|
|
|||
|
Surrender of life insurance policies
|
1,675
|
|
1,194
|
|
2,861
|
|
|||
|
Other, net
|
—
|
|
(309
|
)
|
(196
|
)
|
|||
|
Net cash used by investing activities
|
(13,525
|
)
|
(11,662
|
)
|
(20,449
|
)
|
|||
|
Years Ended March 31,
|
|||||||||
|
(in thousands)
|
2016
|
2015
|
2014
|
||||||
|
Financing activities
|
|||||||||
|
Net proceeds (repayments) of short-term borrowings
|
$
|
21,360
|
|
$
|
145,988
|
|
$
|
(87,398
|
)
|
|
Proceeds from long-term borrowings
|
210,000
|
|
300,000
|
|
1,075,877
|
|
|||
|
Repayment of long-term borrowings
|
(32,867
|
)
|
(463,341
|
)
|
(1,030,256
|
)
|
|||
|
Debt issuance cost
|
(5,325
|
)
|
(6,538
|
)
|
(22,764
|
)
|
|||
|
Debt retirement cost
|
—
|
|
—
|
|
(36,033
|
)
|
|||
|
Other, net
|
455
|
|
455
|
|
111
|
|
|||
|
Net cash used by financing activities
|
193,623
|
|
(23,436
|
)
|
(100,463
|
)
|
|||
|
Effect of exchange rate changes on cash
|
823
|
|
(608
|
)
|
1,192
|
|
|||
|
Increase (decrease) in cash and cash equivalents
|
45,594
|
|
(90,929
|
)
|
142,752
|
|
|||
|
Cash and cash equivalents at beginning of year
|
143,849
|
|
234,778
|
|
92,026
|
|
|||
|
Cash assumed in reconsolidation of subsidiary
|
10,277
|
|
—
|
|
—
|
|
|||
|
Cash and cash equivalents at end of year
|
$
|
199,720
|
|
$
|
143,849
|
|
$
|
234,778
|
|
|
Other information:
|
|||||||||
|
Cash paid for income taxes
|
$
|
20,369
|
|
$
|
16,192
|
|
$
|
17,911
|
|
|
Cash paid for interest
|
104,882
|
|
98,957
|
|
105,192
|
|
|||
|
Cash received from interest
|
(7,291
|
)
|
(6,529
|
)
|
(8,799
|
)
|
|||
|
See notes to consolidated financial statements.
|
|||||||||
- 41
-
ITEM 8.
FINANCIAL STATEMENTS AND SUPPLEMENTARY DATA
(continued)
NOTES TO CONSOLIDATED FINANCIAL STATEMENTS
Alliance One International, Inc. and Subsidiaries
(in thousands)
Note 1
– Significant Accounting Policies
Description of Business
The Company is principally engaged in purchasing, processing, storing, and selling leaf tobacco. The Company purchases tobacco primarily in the United States, Africa, Europe, South America and Asia for sale to customers primarily in the United States, Europe and Asia.
Basis of Presentation
The accounts of the Company and its consolidated subsidiaries are included in the consolidated financial statements after elimination of intercompany accounts and transactions. The Company uses the cost or equity method of accounting for its investments in affiliates that are owned
50%
or less and are not variable interest entities where the Company is the primary beneficiary.
On March 26, 2014, the Company sold
51%
of a Brazilian subsidiary to China Tobacco and reported its remaining
49%
interest in the subsidiary under the equity method of accounting at March 31, 2014. For the year ending March 31, 2014, the Consolidated Statements of Operations include the results of operations for this subsidiary through March 26, 2014. After March 26, 2014, results of operations for this subsidiary are reported in accordance with equity method accounting. See Note 10 “Equity in Net Assets of Investee Companies” to the “Notes to Consolidated Financial Statements” for further information.
In fiscal 2006, the Company deconsolidated its Zimbabwe subsidiary, Mashonaland Tobacco Company LTD ("MTC") in accordance with accounting requirements that apply to foreign subsidiaries that are subject to foreign exchange controls and other government restrictions that casted significant doubt on the parent's ability to control the subsidiary. As of March 31, 2016, the Company determined that significant doubt about its ability to control MTC was eliminated due to changes in the political landscape and the recent issuance of clarifications to the indigenization laws within Zimbabwe. The recent issuance of clarifications to the indigenization law within Zimbabwe resulted in the Company's development and filing with the Zimbabwean government of a plan of compliance with the indigenization law on March 31, 2016, the date of reconsolidation of MTC. The reconsolidation has been treated as a purchase business combination for accounting purposes, with the Company designated as the acquirer. As such, the Consolidated Balance Sheet includes 100% of the fair value of the assets and liabilities of MTC as of March 31, 2016. See Note 22 “Reconsolidation of MTC” to the “Notes to Consolidated Financial Statements” for further information.
Prior to March 31, 2016, the Company accounted for its investment in MTC on the cost method and had been reporting it in Investments in Unconsolidated Affiliates in the Consolidated Balance Sheets since March 31, 2006 and had written its investment in MTC down to
zero
in fiscal 2007. At March 31, 2015, the Company guaranteed an amount outstanding to MTC of
$49,208
at March 31, 2015.
Restatement of Previously Reported Financial Information
During the year ended March 31, 2016, the Company identified certain immaterial errors in previously issued financial statements related to inventory, cost of goods sold and income tax.
|
•
|
The Company became aware of improper inventory entries in a European subsidiary's records resulting in an understatement of cost of goods sold of
$674
for the year ended March 31, 2015 and
$706
for the year ended March 31, 2014.
|
|
•
|
The Company identified a misstatement of recoverable income tax in an international jurisdiction in prior periods resulting in an understatement of income tax expense of
$1,058
for the year ended March 31, 2015 and
$766
for the year ended March 31, 2014.
|
Additionally, the Company corrected the classification of amounts between line items on the Consolidated Statements of Operations and the Consolidated Balance Sheets included in the previously issued financial statements. For the year ended March 31, 2015, reclassification of
$1,456
was made between “Other income (expense)” and “Cost of goods and services sold.” There was no change to operating income or net income as a result of this reclassification. For the year ended March 31, 2015, reclassifications of
$1,044
between deferred tax assets and liabilities and
$11,808
between "Accounts receivable, related parties" and "Pension, postretirement and other long-term liabilities" were made.
The Company has evaluated the effects of the above misstatements on its consolidated financial statements for each of these years in accordance with the guidance provided by SEC Staff Accounting Bulletin No. 108, codified as SAB Topic 1.N, “Considering the Effects of Prior Year Misstatements When Quantifying Misstatements in the Current Year Financial Statements,” and concluded that none of these years are materially misstated. The effect of correcting these misstatements within the accompanying consolidated financial statements, and as permitted by SAB Topic 1.N, the Company was to increase Net Loss attributable to Alliance One International, Inc.” for the years ended March 31, 2015 and 2014 by
$1,732
and
$1,472
, respectively. See Note 23 “Reconciliation
- 42
-
ITEM 8.
FINANCIAL STATEMENTS AND SUPPLEMENTARY DATA
(continued)
NOTES TO CONSOLIDATED FINANCIAL STATEMENTS
(continued)
Alliance One International, Inc. and Subsidiaries
(in thousands)
Note 1
- Significant Accounting Policies
(continued)
Restatement of Previously Reported Financial Information
(continued)
of Previously Reported Amounts to Amounts Revised and Restated” to the “Notes to Consolidated Financial Statements” for the impact of these corrections on previously reported amounts for the years ended March 31, 2015 and 2014.
Investments in Unconsolidated Affiliates
The Company’s equity method investments and its cost method investments are non-marketable securities. The Company reviews such investments for impairment whenever events or changes in circumstances indicate that the carrying amount of an investment may not be recovered. For example, the Company would test such an investment for impairment if the investee were to lose a significant customer, suffer a large reduction in sales margins, experience a major change in its business environment, or undergo any other significant change in its normal business. In assessing the recoverability of equity or cost method investments, the Company uses discounted cash flow models. If the fair value of an equity investee is determined to be lower than its carrying value, an impairment loss is recognized. The preparation of discounted future cash flow analysis requires significant management judgment with respect to future operating earnings growth rates and the selection of an appropriate discount rate. The use of different assumptions could increase or decrease estimated future operating cash flows, and the discounted value of those cash flows, and therefore could increase or decrease any impairment charge.
Use of Estimates
The preparation of financial statements in conformity with accounting principles generally accepted in the United States requires management to make estimates and assumptions. These estimates and assumptions affect the reported amounts of assets and liabilities. They also affect the disclosure of contingent assets and liabilities at the date of the financial statements and the reported amounts of revenues and expenses during the reporting period. Actual results could differ from these estimates, and changes in these estimates are recorded when known. Estimates are used in accounting for, among other things, pension and postretirement health care benefits, inventory market values, allowances for doubtful accounts and advances, bank loan guarantees to suppliers and unconsolidated subsidiaries, useful lives for depreciation and amortization, future cash flows associated with impairment testing for long-lived assets, deferred tax assets and uncertain income tax positions, intrastate tax credits in Brazil and fair value determinations of financial assets and liabilities including derivatives, securitized beneficial interests and counterparty risk. Changes
in market and economic conditions, local tax laws, and other related factors are considered each reporting period, and adjustments to the accounts are made based on the Company’s best judgment.
Revenue Recognition
The Company recognizes revenue from the sale of tobacco when persuasive evidence of an arrangement exists, the price to the customer is fixed or determinable, collectibility is reasonably assured and title and risk of ownership is passed to the customer, which is upon shipment or delivery. The Company requires that all customer-specific acceptance provisions be met at the time title and risk of ownership passes to the customer. Furthermore, the Company’s sales history indicates customer returns and rejections are not significant.
The Company also processes tobacco owned by its customers and revenue is recognized based on contractual terms as the service is provided. The revenue and cost associated with processing is recorded gross in the Statements of Consolidated Operations. The Company’s history indicates customer requirements for processed tobacco are met upon completion of processing. In addition, advances from customers are deferred and recognized as revenue upon shipment or delivery.
Taxes Collected from Customers
Certain subsidiaries are subject to value added taxes on local sales. These amounts have been included in sales and cost of goods and services sold and were
$23,451
,
$25,282
and
$22,778
for the years ended
March 31, 2016
, 2015 and
2014
, respectively.
Shipping and Handling
Shipping and handling costs are included in cost of goods and services sold in the statement of operations.
- 43
-
ITEM 8.
FINANCIAL STATEMENTS AND SUPPLEMENTARY DATA
(continued)
NOTES TO CONSOLIDATED FINANCIAL STATEMENTS
(
continued)
Alliance One International, Inc. and Subsidiaries
(in thousands)
Note 1
- Significant Accounting Policies
(continued)
Other Income (Expense)
At March 31, 2016, the Company reconsolidated MTC. As a result, the Company recorded a gain of
$106,203
to record the fair value of MTC of which
$10,277
was cash and the remaining
$95,926
was non-cash. During the quarter ended March 31, 2014, the Company completed the formation of a new joint venture company in Brazil with the sale of
51%
of a formerly wholly owned Brazilian subsidiary. The transaction consisted of receiving
$8,761
of cash in exchange for the sale of
51%
of the shares of the subsidiary. The Company accounted for the transaction as a deconsolidation of a subsidiary, which required the Company’s retained noncontrolling interest to be recorded at fair value, which equaled
$19,691
. The carrying amount of the former subsidiary’s assets and liabilities equaled
$7,553
, which resulted in a gain of
$20,899
that was recorded in Other Income in the Statements of Consolidated Operations.
Other Income (Expense) also includes gains on sales of property, plant and equipment and assets held for sale. This caption also includes expenses related to the Company’s sale of receivables. See Note 17 “Sale of Receivables” to the “Notes to Consolidated Financial Statements” for further information.
The following table summarizes the significant components of Other Income (Expense).
|
Years Ending March 31,
|
|||||||||
|
2016
|
2015
|
2014
|
|||||||
|
Turkey other property sales
|
$
|
—
|
|
$
|
—
|
|
$
|
2,700
|
|
|
Brazil 51% subsidiary investment sale
|
—
|
|
—
|
|
20,899
|
|
|||
|
Gain on reconsolidation of subsidiary
|
106,203
|
|
—
|
|
—
|
|
|||
|
Other sales of assets and expenses
|
4,904
|
|
7,359
|
|
2,138
|
|
|||
|
Losses on sale of receivables
|
(5,680
|
)
|
(7,425
|
)
|
(6,977
|
)
|
|||
|
$
|
105,427
|
|
$
|
(66
|
)
|
$
|
18,760
|
|
|
Cash and Cash Equivalents
Cash equivalents are defined as temporary investments of cash with original maturities of less than
90
days. At
March 31, 2016
and 2015, respectively, customer funding that was restricted for social responsibility programs maintained by the Company of
$188
and
$599
and cash held on deposit as a compensating balance for short-term borrowings of
$2,137
and
$2,122
were included in Other Current Assets.
Trade Receivables, Net
Trade receivables are amounts owed to the Company from its customers. Trade receivables are recorded at invoiced amounts and primarily have net
30
day terms. The Company extends credit to its customers based on an evaluation of a company’s financial condition and collateral is generally not required.
The Company maintains an allowance for doubtful accounts for estimated uncollectible accounts receivable. The allowance is based on the Company’s assessment of known delinquent accounts, other currently available evidence of collectability and the aging of accounts receivable. The Company’s allowance for doubtful accounts was
$12,984
and
$13,687
at
March 31, 2016
and 2015 respectively. The provision for doubtful accounts was
$(169)
,
$12,446
and
$551
for the years ending
March 31, 2016
, 2015 and 2014, respectively and is reported in Selling, General and Administrative Expenses in the Statements of Consolidated Operations.
Other Receivables
Other receivables consist primarily of receivables related to participation in a subsidiary funding arrangement of
$84,258
and
$46,132
; and value added tax receivables of
$9,377
and
$7,334
at March 31, 2016 and 2015, respectively.
Other Deferred Charges
Other deferred charges are primarily deferred financing costs that are amortized over the life of long-term debt.
Sale of Accounts Receivable
The Company is currently engaged in two revolving trade accounts receivable securitization arrangements to sell receivables. The Company records the transaction as a sale of receivables, removes such receivables from its financial statements and records a receivable for the beneficial interest in such receivables. The losses on the sale of receivables are recognized in Other Income. As of
March 31, 2016
and 2015, respectively, accounts receivable sold and outstanding were
$188,764
and
$235,162
. See Note 17 “Sale of Receivables” and Note 18 “Fair Value Measurements” to the “Notes to Consolidated Financial Statements” for further information.
- 44
-
ITEM 8.
FINANCIAL STATEMENTS AND SUPPLEMENTARY DATA
(continued)
NOTES TO CONSOLIDATED FINANCIAL STATEMENTS
(
continued)
Alliance One International, Inc. and Subsidiaries
(in thousands)
Note 1
- Significant Accounting Policies
(continued)
Inventories
Costs in inventory include processed tobacco inventory, unprocessed tobacco inventory and other inventory. Costs of unprocessed tobacco inventories are determined by the average cost method, which include the cost of green tobacco. Costs of processed tobacco inventories are determined by the average cost method, which include both the cost of unprocessed tobacco, as well as direct and indirect costs that are related to the processing of the product. Costs of other non-tobacco inventory are determined by the first-in, first-out method, which include costs of packing materials, non-tobacco agricultural products and agricultural supplies including seed, fertilizer, herbicides and pesticides.
Inventories are carried at the lower of cost or market (“LCM”). The Company evaluates its inventories for LCM adjustments by country and type of inventory. Therefore, processed tobacco and unprocessed tobacco are evaluated separately for LCM purposes. The Company compares the cost of its processed tobacco to market values based on recent sales of similar grades when evaluating those balances for LCM adjustments. The Company also considers whether its processed tobacco is committed to a customer, whereby the expected sales price would be utilized in determining the market value for committed tobacco. The Company also reviews data on market conditions in performing its LCM evaluation for unprocessed tobacco.
See Note 2 “Inventories” to the “Notes to Consolidated Financial Statements” for further information.
Advances to Tobacco Suppliers
The Company purchases seeds, fertilizer, pesticides and other products related to growing tobacco and advances them to suppliers, which represents prepaid inventory and is recorded as advances to tobacco suppliers. The advances of current crop inputs generally include the original cost of the inputs plus a mark-up and interest as it is earned. Where contractually permitted, the Company charges interest to the suppliers during the period the current crop advance is outstanding. The Company generally advances the inputs at a price that is greater than its cost, which results in a mark-up on the inputs. The suppliers then utilize these inputs to grow tobacco, which the Company is contractually obligated to purchase. Upon delivery of tobacco, part of the purchase price to the supplier is paid in cash and part through a reduction of the advance balance. The advances applied to the delivery are reclassified out of advances and into unprocessed inventory. Advances to tobacco suppliers are accounted for utilizing a cost accumulation methodology.
The Company has current and noncurrent advances to tobacco suppliers. The current advances represent the cost of the seeds, fertilizer and other materials that are advanced for the current crop of inventory. The noncurrent advances generally represent the cost of advances to suppliers for infrastructure, such as curing barns, which is also recovered through the delivery of tobacco to the Company by the suppliers. As a result of various factors in a given crop year (weather, etc.) not all suppliers are able to settle the entire amount of advances that are due that year. In these situations, the Company may allow the suppliers to deliver tobacco over future crop years to recover its advances. The advance balances that are deferred over future crop years are also classified as noncurrent.
Advances to tobacco suppliers are carried at cost and evaluated for recoverability. The realizability evaluation process is similar to that of the LCM evaluation process for inventories. The Company evaluates its advances for recoverability by crop and country. The Company reclasses the advance to inventory at the time suppliers deliver tobacco. The purchase price for the tobacco delivered by the suppliers is based on market prices. Two primary factors determine the market value of the tobacco suppliers deliver: the quantity of tobacco delivered and the quality of the tobacco delivered. Therefore, the Company ensures its advances are appropriately stated at the lower of cost or estimated recoverable amounts.
Upon delivery of tobacco, part of the purchase price to the supplier is paid in cash and part through a reduction of the advance balance. If a sufficient value of tobacco is not delivered to allow the reduction of the entire advance balance, then the Company first determines how much of the deficiency for the current crop is recoverable through future crops. This determination is made by analyzing the suppliers’ ability-to-deliver a sufficient supply of tobacco. This analysis includes historical quantity and quality of production with monitoring of crop information provided by field service technicians related to flood, drought and disease. The remaining recoverable advance balance would then be classified as noncurrent. Any increase in the estimate of unrecoverable advances associated with the noncurrent portion is charged to cost of goods and services sold in the income statement when determined. Amounts not expected to be recovered through current or future crops are then evaluated to determine whether the yield is considered to be normal or abnormal. If the yield adjustment is normal, then the Company capitalizes the applicable variance in the current crop of inventory. If the yield adjustment is considered abnormal, then the Company immediately charges the applicable variance to cost of goods and services sold in the income statement. A normal yield adjustment is based on the range of unrecoverability for the previous three years by country.
- 45
-
ITEM 8.
FINANCIAL STATEMENTS AND SUPPLEMENTARY DATA
(continued)
NOTES TO CONSOLIDATED FINANCIAL STATEMENTS
(
continued)
Alliance One International, Inc. and Subsidiaries
(in thousands)
Note 1
- Significant Accounting Policies
(continued)
Advances to Tobacco Suppliers
(continued)
The Company accounts for its advances to tobacco suppliers using a cost accumulation model, which results in the reporting of its advances at the lower of cost or recoverable amounts exclusive of the mark-up and interest. The mark-up and interest on its advances are recognized upon delivery of tobacco as a decrease in the cost of the current crop. The mark-up and interest capitalized or to be capitalized into inventory for the current crop was
$14,208
and
$19,823
as of
March 31, 2016
and 2015, respectively. Unrecoverable advances and other costs capitalized or to be capitalized into the current crop was
$8,535
and
$11,404
at
March 31, 2016
and 2015, respectively. The following table reflects the classification of advances to tobacco suppliers:
|
March 31, 2016
|
March 31, 2015
|
|||||
|
Current
|
$
|
41,837
|
|
$
|
37,767
|
|
|
Noncurrent
|
2,612
|
|
3,758
|
|
||
|
$
|
44,449
|
|
$
|
41,525
|
|
|
Noncurrent advances to tobacco suppliers are recorded in Other Noncurrent Assets in the Consolidated Balance Sheets.
Unrecovered amounts expensed directly to cost of goods and services sold in the income statement for abnormal yield adjustments or unrecovered amounts from prior crops were
$1,085
and
$11,587
for the years ended March 31,
2015
and
2014
, respectively. There were
no
such abnormal yield adjustments or unrecovered amounts for the year ended March 31, 2016. Normal yield adjustments are capitalized into the cost of the current crop and are expensed as cost of goods and services sold as that crop is sold.
Guarantees
The Company and certain of its foreign subsidiaries guarantee bank loans to suppliers to finance their crops. Under longer-term arrangements, the Company may also guarantee financing on suppliers’ construction of curing barns or other tobacco production assets. Guaranteed loans are generally repaid concurrent with the delivery of tobacco to the Company. The Company is obligated to repay any guaranteed loan should the supplier default. If default occurs, the Company has recourse against the supplier. The Company also guarantees bank loans of certain unconsolidated subsidiaries in Asia and Brazil. The following table summarizes amounts guaranteed and the fair value of those guarantees:
|
March 31, 2016
|
March 31, 2015
|
|||||
|
Amounts guaranteed (not to exceed)
|
$
|
210,703
|
|
$
|
300,557
|
|
|
Amounts outstanding under guarantees
|
107,615
|
|
185,486
|
|
||
|
Fair value of guarantees
|
7,350
|
|
8,650
|
|
||
Of the guarantees outstanding at
March 31, 2016
, all expire within
one
year. The fair value of guarantees is recorded in Accrued Expenses and Other Current Liabilities in the Consolidated Balance Sheets and included in crop costs except for the joint venture in Brazil which are included in Accounts Receivable, Related Parties.
In Brazil, some suppliers obtain government subsidized rural credit financing from local banks that is guaranteed by the Company. The Company withholds amounts owed to suppliers related to the rural credit financing of the supplier upon delivery of tobacco to the Company. The Company remits payments to the local banks on behalf of the guaranteed suppliers. Terms of rural credit financing are such that repayment is due to local banks based on contractual due dates. As of
March 31, 2016
and 2015, respectively, the Company had balances of
$16,699
and
$16,412
that were due to local banks on behalf of suppliers. These amounts are included in Accounts Payable in the Consolidated Balance Sheets.
Goodwill and Other Intangibles
Goodwill represents the excess of purchase price over fair value of net assets acquired, and is allocated to the appropriate reporting unit when acquired. Goodwill is not amortized; rather it is evaluated for impairment annually or whenever events or changes in circumstances indicate that the value of the asset may be impaired. Goodwill is evaluated for impairment by determining the fair value of the related reporting unit. Fair value is measured based on a discounted cash flow method or relative market-based approach. If the carrying amount of goodwill exceeds its fair value, an impairment charge is recorded.
- 46
-
ITEM 8.
FINANCIAL STATEMENTS AND SUPPLEMENTARY DATA
(continued)
NOTES TO CONSOLIDATED FINANCIAL STATEMENTS
(continued)
Alliance One International, Inc. and Subsidiaries
(in thousands)
Note 1
- Significant Accounting Policies
(continued)
Goodwill and Other Intangibles
(continued)
The Company has no intangible assets with indefinite useful lives. It does have other intangible assets, production and supply contracts and a customer relationship intangible asset as well as internally developed software that is capitalized into intangibles. These intangible assets are stated at amortized cost and tested for impairment whenever factors indicate the carrying amount may not be recoverable. Supply contracts are amortized based on the expected realization of the benefit over the term of the contracts ranging from
3
to
5
years. Production contracts and the customer relationship intangible are both amortized on a straight-line basis ranging from
five
to
ten
years and
twenty
years, respectively. The amortization period is the term of the contract or, if no term is specified in the contract, management’s best estimate of the useful life based on past experience. Internally developed software is amortized on a straight-line basis over
five
years once the software testing is complete. Events and changes in circumstance may either result in a revision in the estimated useful life or impairment of an intangible. See Note 5 “Goodwill and Other Intangibles” to the “Notes to Consolidated Financial Statements” for further information.
Other Noncurrent Assets
For the year ended
March 31, 2016
, other noncurrent assets consist primarily of long-term VAT and intrastate tax receivables of
$4,816
, long-term advances to suppliers of
$2,612
and cash surrender value of life insurance of
$5,575
. For the year ended
March 31, 2015
, other noncurrent assets consist primarily of long-term VAT and intrastate tax receivables of $
8,098
, long-term advances to suppliers of $
3,758
and cash surrender value of life insurance of $
7,076
.
Property, Plant and Equipment
Property, plant and equipment at
March 31, 2016
and 2015, are summarized as follows:
|
2016
|
2015
|
|||||
|
Land
|
$
|
26,995
|
|
$
|
21,564
|
|
|
Buildings
|
211,540
|
|
170,937
|
|
||
|
Machinery and equipment
|
183,000
|
|
173,670
|
|
||
|
Total
|
421,535
|
|
366,171
|
|
||
|
Less accumulated depreciation
|
(144,010
|
)
|
(128,257
|
)
|
||
|
Total property, plant and equipment, net
|
$
|
277,525
|
|
$
|
237,914
|
|
Property, plant and equipment is stated at cost less accumulated depreciation. Provisions for depreciation are computed on a straight-line basis at annual rates calculated to amortize the cost of depreciable properties over their estimated useful lives. Buildings and machinery and equipment are depreciated over ranges of
20
to
30
years and
3
to
10
years, respectively. The consolidated financial statements do not include fully depreciated assets. Depreciation expense recorded in Cost of Goods and Services Sold for the years ended
March 31, 2016
, 2015 and
2014
was
$23,132
,
$24,179
and
$25,706
, respectively. Depreciation expense recorded in Selling, General and Administrative Expense for the years ended
March 31, 2016
, 2015 and
2014
was
$2,699
,
$2,998
and
$3,209
, respectively. Total property and equipment purchases, including internally developed software intangibles, were
$17,786
for the year ended
March 31, 2016
of which
$1,359
was unpaid at
March 31, 2016
and included in Accounts Payable;
$22,673
for the year ended
March 31, 2015
of which
$1,024
was unpaid at
March 31, 2015
and included in Accounts Payable; and
$27,755
for the year ended
March 31, 2014
of which
$4,322
was unpaid at
March 31, 2014
and included in Accounts Payable. Estimated useful lives are periodically reviewed and changes are made to the estimated useful lives when necessary. Long-lived assets are reviewed for indicators of impairment whenever events or changes in circumstances indicate that the carrying amount may not be recoverable. The evaluation is performed at the lowest level of identifiable cash flows. An impairment loss would be recognized when estimated undiscounted future cash flows from the use of the asset and its eventual disposition are less than its carrying amount. Measurement of an impairment loss would be based on the excess of the carrying amount of the asset over its fair value. Fair value is the amount at which the asset could be bought or sold in a current transaction between willing parties and may be estimated using a number of techniques, including quoted market prices or valuations, present value techniques based on estimates of cash flows, or multiples of earnings or revenue performance measures.
- 47
-
ITEM 8.
FINANCIAL STATEMENTS AND SUPPLEMENTARY DATA
(continued)
NOTES TO CONSOLIDATED FINANCIAL STATEMENTS
(continued)
Alliance One International, Inc. and Subsidiaries
(in thousands)
Note 1
- Significant Accounting Policies
(continued)
Derivative Financial Instruments
The Company uses forward or option currency contracts to protect against volatility associated with certain non-U.S. dollar denominated forecasted transactions. The contracts do not qualify for hedge accounting as defined by generally accepted accounting principles. As a result, the Company has recorded losses of
$2,001
,
$3,123
and
$1,468
in its Cost of Goods and Services Sold for the years ended
March 31, 2016
, 2015 and
2014
, respectively. See Note 6 “Derivative and Other Financial Instruments” to the "Notes to Consolidated Financial Statements" for further information.
Income Taxes
The Company uses the asset and liability method to account for income taxes. The objective of the asset and liability method is to establish deferred tax assets and liabilities for the temporary differences between the financial reporting basis and the income tax basis of the Company’s assets and liabilities at enacted tax rates expected to be in effect when such amounts are realized or settled.
The Company’s annual tax rate is based on its income, statutory tax rates and tax planning opportunities available to it in the various jurisdictions in which it operates. Tax laws are complex and subject to different interpretations by the taxpayer and respective governmental taxing authorities. Significant judgment is required in determining tax expense and in evaluating tax positions, including evaluating uncertainties. The Company reviews its tax positions quarterly and adjusts the balances as new information becomes available.
Deferred income tax assets represent amounts available to reduce income taxes payable on taxable income in future years. Such assets arise because of temporary differences between the financial reporting and tax bases of assets and liabilities, as well as from net operating loss and tax credit carryforwards. The Company evaluates the recoverability of these future tax deductions by assessing the adequacy of future expected taxable income from all sources, including reversal of taxable temporary differences, forecasted operating earnings and available tax planning strategies. These sources of income inherently rely on estimates. The Company uses historical experience and short and long-range business forecasts to provide insight. The Company believes it is more likely than not that a portion of the deferred income tax assets may expire unused and has established a valuation allowance against them. Although realization is not assured for the remaining deferred income tax assets, the Company believes it is more likely than not the deferred tax assets will be fully recoverable within the applicable statutory expiration periods. However, deferred tax assets could be reduced in the near term if estimates of taxable income are significantly reduced or available tax planning strategies are no longer viable. See Note 12 “Income Taxes” to the “Notes to Consolidated Financial Statements” for further information.
Stock-Based Compensation
The Company expenses the fair value of grants of various stock-based compensation programs at fair value over the vesting period of the awards. The fair value of stock options is estimated at the date of grant using the Black-Scholes-Merton option valuation model which was developed for use in estimating the fair value of exchange traded options that have no vesting restrictions and are fully transferable. Option valuation methods require the input of highly subjective assumptions, including the expected stock price volatility. See Note 11 “Stock-Based Compensation” to the “Notes to Consolidated Financial Statements” for further information.
New Accounting Standards
Recently Adopted Accounting Pronouncements
In November 2015, the FASB issued new accounting guidance regarding the balance sheet classification of deferred income taxes. The primary objective of this accounting guidance is to classify all deferred income tax assets and liabilities as noncurrent in a classified statement of financial position. The Company adopted this accounting guidance on March 31, 2016 on a prospective basis. Current deferred tax assets of
$16,284
and current deferred tax liabilities of
$4,236
were reclassified as noncurrent in the Consolidated Balance Sheet for the year ended March 31, 2016. There was no material impact to results of operations.
- 48
-
ITEM 8.
FINANCIAL STATEMENTS AND SUPPLEMENTARY DATA
(continued)
NOTES TO CONSOLIDATED FINANCIAL STATEMENTS
(continued)
Alliance One International, Inc. and Subsidiaries
(in thousands)
Note 1
- Significant Accounting Policies
(continued)
New Accounting Standards
(continued)
Recent Accounting Pronouncements Not Yet Adopted
In May 2014, the Financial Accounting Standards Board ("FASB") issued new accounting guidance that outlines a single comprehensive model to use in accounting for revenue from contracts with customers. The primary objective of this accounting guidance is to recognize revenue that depicts the transfer of promised goods or services to customers in an amount that reflects the consideration to which an entity expects to be entitled in exchange for those goods or services. This accounting guidance, as amended, is effective for the Company on April 1, 2018. The Company is currently evaluating the impact of this new guidance.
In August 2014, the FASB issued new accounting guidance on determining when and how to disclose going concern uncertainties in the financial statements. The primary objective of this accounting guidance is for management to perform interim and annual assessments of an entity’s ability to continue as a going concern within one year of the date the financial statements are issued and provide certain disclosures if conditions or events raise substantial doubt about the entity’s ability to continue as a going concern. This accounting guidance is effective for the Company on March 31, 2017. The Company is currently evaluating the impact of this new guidance and does not expect it to have a material impact on its financial condition or results of operations.
In April 2015, the FASB issued new accounting guidance that changes the presentation of debt issuance costs in financial statements. The primary objective of this accounting guidance is to present these costs in the balance sheet as a direct deduction from the related debt liability rather than as an asset. Amortization of the costs is still reported as interest expense. This accounting guidance is effective for the Company on April 1, 2016. The Company is currently evaluating the impact of this new guidance and does not expect it to have a material impact on its financial condition or results of operations.
In July 2015, the FASB issued new accounting guidance that simplifies the measurement of inventory. Under the previous accounting guidance, an entity measured inventory at the lower of cost or market with market defined as one of three different measures. The primary objective of this accounting guidance is to require a single measurement of inventory at the lower of cost and net realizable value. This accounting guidance is effective for the Company on April 1, 2017. The Company is currently evaluating the impact of this new guidance.
In August 2015, the FASB issued new accounting guidance that clarifies the presentation of debt issuance costs associated with line-of-credit arrangements in financial statements. The primary objective of this accounting guidance is to present these costs as an asset in the balance sheet. The accounting guidance issued in April 2015 did not address the presentation of debt issuance costs for this type of arrangement. This accounting guidance is effective for the Company on April 1, 2016. The Company is currently evaluating the impact of this new guidance and does not expect it to have a material impact on its financial condition or results of operations.
In January 2016, the FASB issued new accounting guidance regarding certain aspects of recognition, measurement, presentation, and disclosure of financial instruments. The primary objective of this accounting guidance is to provide users of financial statements with more decision-useful information. The accounting guidance will be effective for the Company on April 1, 2018. The Company is currently evaluating the impact of this guidance.
In February 2016, the FASB issued new accounting guidance regarding the treatment of leases. The primary objective of this accounting guidance is to increase transparency and comparability amount organization by recognizing lease assets and lease liabilities on the balance sheet and disclosing key information about leasing arrangements. This accounting guidance will be effective for the Company April 1, 2020. The Company is currently evaluating the impact of this new guidance.
In March 2016, the FASB issued new accounting guidance for simplifying the treatment of employee share-based payments. The primary objective is improve areas of GAAP for which cost and complexity can be reduced while maintaining or improving the usefulness of information provided to users of financial statements. This accounting guidance will be effective for the Company on April 1, 2017. The Company is currently evaluating the impact of this new guidance.
- 49
-
ITEM 8.
FINANCIAL STATEMENTS AND SUPPLEMENTARY DATA
(continued)
NOTES TO CONSOLIDATED FINANCIAL STATEMENTS
(continued)
Alliance One International, Inc. and Subsidiaries
(in thousands)
Note 1
- Significant Accounting Policies
(continued)
Computation of Earnings (Loss) Per Common Share
|
Years Ended March 31,
|
|||||||||||||
|
(in thousands, except per share data)
|
2016
|
2015
|
2014
|
||||||||||
|
BASIC EARNINGS (LOSS)
|
|||||||||||||
|
Net income (loss) attributable to Alliance One International, Inc.
|
$
|
65,532
|
|
$
|
(27,862
|
)
|
$
|
(102,533
|
)
|
||||
|
SHARES
|
|||||||||||||
|
Weighted Average Number of Shares Outstanding
|
8,882
|
|
8,829
|
|
8,772
|
|
|||||||
|
BASIC EARNINGS (LOSS) PER SHARE
|
$
|
7.38
|
|
$
|
(3.16
|
)
|
$
|
(11.69
|
)
|
||||
|
DILUTED EARNINGS (LOSS)
|
|||||||||||||
|
Net income (loss) attributable to Alliance One International, Inc.
|
$
|
65,532
|
|
$
|
(27,862
|
)
|
$
|
(102,533
|
)
|
||||
|
Plus interest expense on 5 ½% convertible notes, net of tax
|
—
|
|
—
|
|
*
|
—
|
|
*
|
|||||
|
Net income (loss) attributable to Alliance One International, Inc. as
adjusted
|
$
|
65,532
|
|
$
|
(27,862
|
)
|
$
|
(102,533
|
)
|
||||
|
SHARES
|
|||||||||||||
|
Weighted average number of shares outstanding
|
8,882
|
|
8,829
|
|
8,772
|
|
|||||||
|
Plus: Restricted shares issued and shares applicable to stock options
and restricted stock units, net of shares assumed to be purchased from proceeds at average market price |
1
|
|
—
|
|
*
|
—
|
|
||||||
|
Assuming conversion of 5 ½% convertible notes
|
—
|
|
*
|
—
|
|
*
|
—
|
|
|||||
|
Shares applicable to stock warrants
|
—
|
|
**
|
—
|
|
**
|
—
|
|
**
|
||||
|
Adjusted weighted average number of shares outstanding
|
8,883
|
|
8,829
|
|
8,772
|
|
|||||||
|
DILUTED EARNINGS (LOSS) PER SHARE
|
$
|
7.38
|
|
$
|
(3.16
|
)
|
$
|
(11.69
|
)
|
||||
|
*
|
Assumed conversion of convertible notes at the beginning of the period has an antidilutive effect on earnings (loss) per share. All outstanding restricted shares and shares applicable to stock options and restricted stock units are excluded because their inclusion would have an antidilutive effect on the loss per share.
|
|
**
|
For the years ended March 31, 2015 and 2014 the warrants were not assumed exercised because the exercise price was more than the average price for the period. The warrants were fully expired on April 8, 2015.
|
The weighted average number of common shares outstanding is reported as the weighted average of the total shares of common stock outstanding net of shares of common stock held by a wholly owned subsidiary. Shares of common stock owned by the subsidiary were
785
at
March 31, 2016
and 2015. This subsidiary waives its right to receive dividends and it does not have the right to vote.
Certain potentially dilutive options were not included in the computation of earnings per diluted share because their exercise prices were greater than the average market price of the shares of common stock during the period and their effect would be antidilutive. These shares totaled
471
at a weighted average exercise price of
$60.70
per share at
March 31, 2016
,
661
at a weighted average exercise price of
$60.37
per share at
March 31, 2015
and
688
at a weighted average exercise price of
$60.45
per share at March 31, 2014.
In connection with the offering of the Company’s
5.50%
Convertible Senior Subordinated Notes due 2014, issued on July 2, 2009 (the “Convertible Notes”), the Company entered into privately negotiated convertible note hedge transactions (the “convertible note hedge transactions”) equal to the number of shares that underlie the Company’s Convertible Notes. These convertible note hedge transactions were designed to reduce the potential dilution of the Company’s common stock upon conversion of the Convertible Notes in the event that the value per share of common stock exceeds the initial conversion price of
$50.28
per share. These shares were not included in the computation of earnings per diluted share because their inclusion would be antidilutive. The Convertible Notes matured during the second quarter of fiscal 2015.
- 50
-
ITEM 8.
FINANCIAL STATEMENTS AND SUPPLEMENTARY DATA
(continued)
NOTES TO CONSOLIDATED FINANCIAL STATEMENTS
(continued)
Alliance One International, Inc. and Subsidiaries
(in thousands)
Note 1
- Significant Accounting Policies
(continued)
Other Comprehensive Income (Loss)
The following tables set forth the changes in each component of accumulated other comprehensive income (loss), net of tax, attributable to the Company:
|
Currency Translation Adjustment
|
Pensions, Net of Tax
|
Accumulated Other Comprehensive Income (Loss)
|
|||||||
|
Balances, March 31, 2013
|
$
|
(5,724
|
)
|
$
|
(49,693
|
)
|
$
|
(55,417
|
)
|
|
Other comprehensive losses before reclassifications
|
4,084
|
|
10,129
|
|
14,213
|
|
|||
|
Amounts reclassified to net income, net of tax
|
—
|
|
2,878
|
|
2,878
|
|
|||
|
Other comprehensive losses, net of tax
|
4,084
|
|
13,007
|
|
17,091
|
|
|||
|
Balances, March 31, 2014
|
(1,640
|
)
|
(36,686
|
)
|
(38,326
|
)
|
|||
|
Other comprehensive income before reclassifications
|
(12,514
|
)
|
(16,257
|
)
|
(28,771
|
)
|
|||
|
Amounts reclassified to net loss, net of tax
|
—
|
|
711
|
|
711
|
|
|||
|
Other comprehensive income, net of tax
|
(12,514
|
)
|
(15,546
|
)
|
(28,060
|
)
|
|||
|
Balances, March 31, 2015
|
(14,154
|
)
|
(52,232
|
)
|
(66,386
|
)
|
|||
|
Other comprehensive losses before reclassifications
|
108
|
|
7,811
|
|
7,919
|
|
|||
|
Amounts reclassified to net loss, net of tax
|
—
|
|
4,619
|
|
4,619
|
|
|||
|
Other comprehensive losses, net of tax
|
108
|
|
12,430
|
|
12,538
|
|
|||
|
Balances, March 31, 2016
|
$
|
(14,046
|
)
|
$
|
(39,802
|
)
|
$
|
(53,848
|
)
|
The following table sets forth amounts by component, reclassified from accumulated other comprehensive income (loss) to net income (loss) for the years ended March 31, 2016, 2015 and 2014:
|
Years Ended
March 31,
|
|||||||||
|
2016
|
2015
|
2014
|
|||||||
|
Pension and postretirement plans *:
|
|||||||||
|
Actuarial loss
|
$
|
3,629
|
|
$
|
3,092
|
|
$
|
4,436
|
|
|
Amortization of prior service cost (credit)
|
840
|
|
(2,213
|
)
|
(1,369
|
)
|
|||
|
Deferred income tax benefit
|
150
|
|
(168
|
)
|
(189
|
)
|
|||
|
Amounts reclassified from accumulated other comprehensive income (loss) to net income (loss)
|
$
|
4,619
|
|
$
|
711
|
|
$
|
2,878
|
|
|
* Amounts are included in net periodic benefit costs for pension and postretirement plans.
|
|||||||||
Concentration of Credit Risk
The Company may potentially be subject to a concentration of credit risks due to tobacco supplier advances and trade receivables relating to customers in the tobacco industry as well as cash which is deposited with high-credit-quality financial institutions. See Note 14 “Segment Information” to the “Notes to Consolidated Financial Statements” for further information of particular concentrations.
- 51
-
ITEM 8.
FINANCIAL STATEMENTS AND SUPPLEMENTARY DATA
(continued)
NOTES TO CONSOLIDATED FINANCIAL STATEMENTS
(continued)
Alliance One International, Inc. and Subsidiaries
(in thousands)
Note 1
- Significant Accounting Policies
(continued)
Preferred Stock
The Board of Directors is authorized to issue shares of Preferred Stock in series with variations as to the number of shares in any series. The Board of Directors also is authorized to establish the rights and privileges of such shares issued, including dividend and voting rights. At
March 31, 2016
,
10,000
shares of preferred stock were authorized and
no
shares had been issued.
Note 2
– Inventories
|
March 31, 2016
|
March 31, 2015
|
|||||
|
Processed tobacco
|
$
|
584,158
|
|
$
|
491,319
|
|
|
Unprocessed tobacco
|
175,933
|
|
204,735
|
|
||
|
Other
|
31,249
|
|
43,509
|
|
||
|
$
|
791,340
|
|
$
|
739,563
|
|
|
See Note 1 “Significant Accounting Policies - Inventories” to the “Notes to Consolidated Financial Statements” for further information on the costs that comprise the inventory balances and the LCM testing methodologies.
The Company recorded LCM adjustments of
$5,996
,
$7,533
and
$6,314
for the years ended
March 31, 2016
, 2015 and
2014
, respectively.
Note 3
– Variable Interest Entities
The Company holds variable interests in
seven
joint ventures that are accounted for under the equity method of accounting. These joint ventures procure inventory on behalf of the Company and the other joint venture partners. The variable interests relate to equity investments and advances made by the Company to the joint ventures. In addition, the Company also guarantees
two
of its joint ventures' borrowings which also represent a variable interest in those joint ventures. The Company is not the primary beneficiary, as it does not have the power to direct the activities that most significantly impact the economic performance of the entities as a result of the entities’ management and board of directors structure. Therefore, these entities are not consolidated. At
March 31, 2016
and 2015, the Company’s investment in these joint ventures was
$57,243
and
$53,678
, respectively and is classified as Investments in Unconsolidated Affiliates in the Consolidated Balance Sheets. The Company’s advances to these joint ventures were
$1,920
and
$3,293
at
March 31, 2016
and 2015, respectively, and are classified as Accounts Receivable, Related Parties in the Consolidated Balance Sheets. The Company guaranteed an amount to two joint ventures not to exceed
$100,238
and
$105,983
at
March 31, 2016
and 2015, respectively. The investments, advances and guarantees in these joint ventures represent the Company’s maximum exposure to loss.
Note 4
– Restructuring and Asset Impairment Charges
During the quarter ended March 31, 2015, the Company announced the first phase of a global restructuring plan focusing on efficiency and cost improvements. The Company reviewed origin and corporate operations and initiatives were implemented to increase operational efficiency and effectiveness. These initiatives continue to occur as the Company restructures certain operations not meeting strategic business objectives and performance metrics in future periods. At March 31, 2016, the costs of these future initiatives is not estimable. During the fiscal year ended March 31, 2016 the Company recorded
$(498)
of employee severance charges and
$5,723
of asset impairment charges. The asset impairment charges were incurred due to restructuring of certain operations in Africa, Bulgaria and Brazil as well as the curtailment of certain U.S. pension plans. During the fiscal year ended March 31, 2015, charges of
$8,612
were incurred in connection with the reduction in the global workforce. Also during the fiscal year ended March 31, 2015, the Company recorded a
$500
asset impairment charge resulting from certain machinery in a former U.S. cut rag facility as operations moved to a new facility.
- 52
-
ITEM 8.
FINANCIAL STATEMENTS AND SUPPLEMENTARY DATA
(continued)
NOTES TO CONSOLIDATED FINANCIAL STATEMENTS
(continued)
Alliance One International, Inc. and Subsidiaries
(in thousands)
Note 4
– Restructuring and Asset Impairment Charges
(continued)
In prior fiscal years, the Company implemented several strategic initiatives in response to shifts in supply and demand balances and changing business models of its customers. These initiatives were substantially complete at March 31, 2014. The Company continued to focus on improving factory efficiencies and other core components of its business. As part of this focus, the Company agreed to a joint processing venture in one of its foreign locations during the three months ended June 30, 2013. As a result, the Company recorded pretax charges of
$2,745
in connection with the reduction in workforce including the effect on the Company's defined benefit pension plans of
$1,261
during the year ended March 31, 2014. Asset impairment charges of
$756
were recorded for certain processing equipment in connection with the new venture as of March 31, 2014. As the Company continued to respond to changes in its business, additional employee separation charges of
$791
and asset impairment charges of
$819
were incurred during the year ended March 31, 2014.
The following table summarizes the restructuring actions as of
March 31, 2016
, 2015 and
2014
:
|
Years Ended March 31,
|
|||||||||
|
Restructuring and Asset Impairment Charges
|
2016
|
2015
|
2014
|
||||||
|
Employee separation and other cash charges:
|
|||||||||
|
Beginning balance
|
$
|
8,087
|
|
$
|
397
|
|
$
|
668
|
|
|
Period Charges:
|
|||||||||
|
Employee separation charges (recoveries)
|
(498
|
)
|
8,612
|
|
2,275
|
|
|||
|
Other cash charges
|
662
|
|
6
|
|
—
|
|
|||
|
Total employee separation and other cash charges
|
164
|
|
8,618
|
|
2,275
|
|
|||
|
Payments
|
(7,853
|
)
|
(928
|
)
|
(2,546
|
)
|
|||
|
Ending balance March 31
|
$
|
398
|
|
$
|
8,087
|
|
$
|
397
|
|
|
Asset impairment and other non-cash charges
|
5,724
|
|
500
|
|
2,836
|
|
|||
|
Total restructuring and asset impairment charges
|
$
|
5,888
|
|
$
|
9,118
|
|
$
|
5,111
|
|
- 53
-
ITEM 8.
FINANCIAL STATEMENTS AND SUPPLEMENTARY DATA
(continued)
NOTES TO CONSOLIDATED FINANCIAL STATEMENTS
(continued)
Alliance One International, Inc. and Subsidiaries
(in thousands)
Note 4
– Restructuring and Asset Impairment Charges
(continued)
The following table summarizes the employee separation and other cash charges recorded in the Company’s North America and Other Regions segments as of
March 31, 2016
, 2015 and
2014
:
|
Years Ended March 31,
|
|||||||||
|
Employee Separation and Other Cash Charges
|
2016
|
2015
|
2014
|
||||||
|
Beginning balance:
|
$
|
8,087
|
|
$
|
397
|
|
$
|
668
|
|
|
North America
|
—
|
|
—
|
|
8
|
|
|||
|
Other regions
|
8,087
|
|
397
|
|
660
|
|
|||
|
Period charges:
|
$
|
164
|
|
$
|
8,618
|
|
$
|
2,275
|
|
|
North America
|
—
|
|
—
|
|
147
|
|
|||
|
Other regions
|
164
|
|
8,618
|
|
2,128
|
|
|||
|
Payments:
|
$
|
(7,853
|
)
|
$
|
(928
|
)
|
$
|
(2,546
|
)
|
|
North America
|
—
|
|
—
|
|
(155
|
)
|
|||
|
Other regions
|
(7,853
|
)
|
(928
|
)
|
(2,391
|
)
|
|||
|
Ending balance March 31:
|
$
|
398
|
|
$
|
8,087
|
|
$
|
397
|
|
|
North America
|
—
|
|
—
|
|
—
|
|
|||
|
Other regions
|
398
|
|
8,087
|
|
397
|
|
|||
The following table summarizes non-cash charges for the Company's North America and Other Regions segments for fiscal years ended March 31, 2016, 2015 and 2014:
|
North America
|
Other Regions
|
||||
|
Years ended March 31,
|
|||||
|
2016
|
712
|
|
5,012
|
|
|
|
2015
|
500
|
|
|||
|
2014
|
2,836
|
|
|||
Note 5
– Goodwill and Other Intangibles
The Company tests the carrying amount of goodwill annually as of the first day of the last quarter of the fiscal year and whenever events or circumstances indicate that impairment may have occurred. The Company evaluated its goodwill for impairment during fiscal 2016,
2015
and
2014
and determined that the fair value of each reporting unit is substantially in excess of its carrying value including goodwill.
The carrying value of other intangible assets as of
March 31, 2016
represents customer relationship, production and supply contracts and internally developed software. These intangible assets were determined by management to meet the criterion for recognition apart from goodwill and have finite lives. The Company uses judgment in assessing whether the carrying amount of its intangible assets is not expected to be recoverable over their estimated remaining useful lives. Amortization expense associated with these intangible assets was
$3,356
,
$3,532
and
$4,632
for the years ended
March 31, 2016
,
2015
and
2014
, respectively and is recorded in Selling, General and Administrative Expenses except for production and supply contracts which is recorded against the associated revenues.
The Company has no intangible assets with indefinite useful lives. It does have intangible assets which are amortized. The following table summarizes the changes in the Company's goodwill and other intangibles for the years ended
March 31, 2016
,
2015
and
2014
.
- 54
-
ITEM 8.
FINANCIAL STATEMENTS AND SUPPLEMENTARY DATA
(continued)
NOTES TO CONSOLIDATED FINANCIAL STATEMENTS
(continued)
Alliance One International, Inc. and Subsidiaries
(in thousands)
Note 5
– Goodwill and Other Intangibles
(continued)
Goodwill and Intangible Asset Rollforward:
|
Amortizable Intangibles
|
|||||||||||||||||||
|
Goodwill (1)
|
Customer
Relationship Intangible |
Production
and Supply Contract Intangibles |
Internally
Developed Software Intangible |
Total
|
|||||||||||||||
|
Weighted average remaining useful life in years as of March 31, 2016
|
|
|
13
|
|
4.75
|
|
—
|
|
|||||||||||
|
March 31, 2014 balance:
|
|||||||||||||||||||
|
Gross carrying amount
|
$
|
2,794
|
|
$
|
33,700
|
|
$
|
14,893
|
|
$
|
17,804
|
|
$
|
69,191
|
|
||||
|
Accumulated amortization
|
—
|
|
(14,954
|
)
|
(4,752
|
)
|
(14,760
|
)
|
(34,466
|
)
|
|||||||||
|
Net March 31, 2014 balance
|
2,794
|
|
18,746
|
|
10,141
|
|
3,044
|
|
34,725
|
|
|||||||||
|
Additions
|
—
|
|
—
|
|
—
|
|
698
|
|
698
|
|
|||||||||
|
Amortization expense
|
—
|
|
(1,685
|
)
|
(1,034
|
)
|
(813
|
)
|
(3,532
|
)
|
|||||||||
|
Net March 31, 2015 balance
|
2,794
|
|
17,061
|
|
9,107
|
|
2,929
|
|
31,891
|
|
|||||||||
|
Additions (2)
|
13,669
|
|
24,830
|
|
—
|
|
—
|
|
38,499
|
|
|||||||||
|
Amortization expense
|
—
|
|
(1,685
|
)
|
(825
|
)
|
(846
|
)
|
(3,356
|
)
|
|||||||||
|
Net March 31, 2016 balance
|
$
|
16,463
|
|
$
|
40,206
|
|
$
|
8,282
|
|
$
|
2,083
|
|
$
|
67,034
|
|
||||
(1) Goodwill of
$2,794
relates to the North America segment and
$13,669
relates to the Other Regions segment.
(2) Additions relate to the reconsolidation of MTC. See Note 22 "Reconsolidation of MTC" to the "Notes to Consolidated Financial Statements" for further information.
The following table summarizes the estimated intangible asset amortization expense for the next five years and beyond:
|
For Fiscal
Years Ended |
Customer
Relationship Intangible |
Production
and Supply Contract Intangible |
Internally
Developed Software Intangible * |
Total
|
||||||||||||
|
2017
|
$
|
3,340
|
|
$
|
1,282
|
|
$
|
848
|
|
$
|
5,470
|
|
||||
|
2018
|
3,340
|
|
1,405
|
|
620
|
|
5,365
|
|
||||||||
|
2019
|
3,340
|
|
1,405
|
|
367
|
|
5,112
|
|
||||||||
|
2020
|
3,340
|
|
1,397
|
|
248
|
|
4,985
|
|
||||||||
|
2021
|
3,340
|
|
1,397
|
|
—
|
|
4,737
|
|
||||||||
|
Later
|
23,506
|
|
1,396
|
|
—
|
|
24,902
|
|
||||||||
|
$
|
40,206
|
|
$
|
8,282
|
|
$
|
2,083
|
|
$
|
50,571
|
|
|||||
* Estimated amortization expense for the internally developed software is based on costs accumulated as of
March 31, 2016
.
These estimates will change as new costs are incurred and until the software is placed into service in all locations.
These estimates will change as new costs are incurred and until the software is placed into service in all locations.
Note 6
– Derivative and Other Financial Instruments
Fair Value of Derivative Financial Instruments
The Company recognizes all derivative financial instruments, such as foreign exchange contracts at fair value. Changes in the fair value of derivative financial instruments are either recognized periodically in income or in shareholders’ equity as a component of other comprehensive income depending on whether the derivative financial instrument qualifies for hedge accounting, and if so, whether it qualifies as a fair value hedge or a cash flow hedge. The Company has elected not to offset fair value amounts recognized for derivative instruments with the same counterparty under a master netting agreement. See Note 18 “Fair Value Measurements” to the “Notes to Consolidated Financial Statements” for further information of fair value methodology.
- 55
-
ITEM 8.
FINANCIAL STATEMENTS AND SUPPLEMENTARY DATA
(continued)
NOTES TO CONSOLIDATED FINANCIAL STATEMENTS
(continued)
Alliance One International, Inc. and Subsidiaries
(in thousands)
Note 6
– Derivative and Other Financial Instruments
(continued)
The following table summarizes the fair value of the Company’s derivatives by type at
March 31, 2016
and 2015.
|
Fair Values of Derivative Instruments
|
||||||
|
Derivatives Not Designated as Hedging Instruments Under ASC 815:
|
Balance Sheet Account
|
Fair Value
|
||||
|
Foreign currency contracts at March 31, 2016
|
Current Derivative Asset
|
$
|
—
|
|
||
|
Foreign currency contracts at March 31, 2015
|
Current Derivative Asset
|
$
|
1,373
|
|
||
Earnings Effects of Derivatives
The Company has entered into forward or option currency contracts to protect against volatility associated with certain non-U.S. dollar denominated forecasted transactions. These contracts are for green tobacco purchases and processing costs as well as selling, general and administrative costs as the Company deems necessary. These contracts do not meet the requirements for hedge accounting treatment under generally accepted accounting principles, and as such, changes in fair value are reported in income each period.
The following table summarizes the earnings effects of derivatives in the statements of consolidated operations for the years ending
March 31, 2016
, 2015 and
2014
.
|
Derivatives Not Designated
as Hedging Instruments Under ASC 815: |
Location of Gain
(Loss) Recognized in Income (Loss) |
Gain (Loss) Recognized in Income (Loss)
|
||||||||||||
|
2016
|
2015
|
2014
|
||||||||||||
|
Foreign currency contracts
|
Cost of Goods and Services Sold
|
$
|
(2,001
|
)
|
$
|
(3,123
|
)
|
$
|
(1,468
|
)
|
||||
Credit Risk
Financial instruments, including derivatives, expose the Company to credit loss in the event of non-performance by counterparties. The Company manages its exposure to counterparty credit risk through specific minimum credit standards, diversification of counterparties, and procedures to monitor concentrations of credit risk. If a counterparty fails to meet the terms of an arrangement, the Company’s exposure is limited to the net amount that would have been received, if any, over the arrangement’s remaining life. The Company does not anticipate non-performance by the counterparties and no material loss would be expected from non-performance by any one of such counterparties.
Note 7
– Short-Term Borrowing Arrangements
Excluding all long-term credit agreements, the Company has lines of credit arrangements with a number of banks under which the Company may borrow up to a total of
$910,131
and
$795,746
at
March 31, 2016
and 2015, respectively. The weighted average variable interest rate for the years ending
March 31, 2016
and 2015 was
5.2%
and
5.1%
, respectively. At
March 31, 2016
and 2015, amounts outstanding under the lines were
$475,989
and
$330,254
, respectively. Unused lines of credit at
March 31, 2016
amounted to
$416,352
(
$448,265
at
March 31, 2015
), net of
$17,790
of letters of credit. Certain non-U.S. borrowings of approximately
$103,366
and
$61,820
have inventories of
$99,442
and
$56,210
as collateral at
March 31, 2016
and 2015, respectively. At
March 31, 2016
and 2015, respectively,
$2,137
and
$2,122
were held on deposit as a compensating balance.
The foregoing amounts at March 31, 2016 reflect aggregate borrowing availability, outstanding borrowings and unused borrowing availability under a short-term credit facility extended to MTC in which one of the Company’s other subsidiaries has a participation interest in the lender’s rights and obligations under the facility. At March 31, 2016,
$100,000
of the aggregate borrowing availability was with respect to borrowing such other subsidiary would be required to fund under the terms of the participation interest. Aggregate outstanding borrowings attributed to outstanding borrowings by MTC funded under that facility by such other subsidiary pursuant to that participation interest are
$84,258
and
$15,742
of the unused borrowing availability was with respect to unused borrowing availability such other subsidiary would be required to fund under the terms of the participation interest. Because such other subsidiary’s funding is pursuant to a participation interest through a third-party lender and not a direct intercompany loan between such other subsidiary and MTC, the total amount of debt under the facility is required to be reflected as consolidated debt upon the reconsolidation of MTC. See Note 22 “Reconsolidation of MTC” to the “Notes to Consolidated Financial Statements” for further information.
- 56
-
ITEM 8.
FINANCIAL STATEMENTS AND SUPPLEMENTARY DATA
(continued)
NOTES TO CONSOLIDATED FINANCIAL STATEMENTS
(continued)
Alliance One International, Inc. and Subsidiaries
(in thousands)
Note 8
– Long-Term Debt
Senior Secured Credit Facility
On August 1, 2013, the agreement governing the Company's senior secured credit facility was amended and restated to provide for a senior secured revolving credit facility with a syndicate of banks of approximately
$303,900
, that automatically reduced to approximately
$210,300
on April 15, 2014, and will mature in April 15, 2017. Borrowings under the amended and restated senior secured credit facility initially bear interest at an annual rate of LIBOR plus
3.75%
and base rate plus
2.75%
, as applicable, though the interest rate under the amended and restated senior secured credit facility is subject to increase or decrease according to the Company's consolidated interest coverage ratio.
Borrowings under the amended and restated senior secured credit facility are secured by a first priority lien on specified property of the Company, including the capital stock of specified subsidiaries, all U.S. accounts receivable, certain U.S. inventory, intercompany notes evidencing loans or advances and certain U.S. fixed assets.
First amendment.
On May 30, 2014, the Company entered into the First Amendment to the Amended and Restated Credit Agreement (the “First Amendment"), which amended the credit agreement (the “Credit Agreement”) governing the Company’s senior secured credit facility. The First Amendment modified the definition of Consolidated EBIT to permit add backs in connection with dispositions of, and investments in, certain subsidiaries and permitted joint ventures and certain other accounting adjustments, modified the Minimum Consolidated Interest Coverage Ratio to
1.85
to 1.00 for the period ending March 31, 2014 and
1.70
to 1.00 for the periods ending June 30, 2014, September 30, 2014, December 31, 2014 and March 31, 2015, modified the Maximum Consolidated Leverage Ratio to
7.25
to 1.00 for the period ending June 30, 2014 and
7.50
to 1.00 for the period ending September 30, 2014 and increased the basket to
$200,000
for permitted Guaranty Obligations that can be incurred by the Company and its subsidiaries with respect to indebtedness of China Brasil Tabacos Exportadora Ltda. (which is the joint venture entity with China Tobacco in Brazil) while striking the requirement that such Guaranty Obligations of the Company and its subsidiaries may not exceed the percentage of the Company’s direct or indirect ownership of China Brasil Tabacos Exportadora Ltda. in relation to all Guaranty Obligations with respect to Indebtedness of China Brasil Tabacos Exportadora Ltda.
Second amendment.
On February 6, 2015, the Company entered into the Second Amendment to Amended and Restated Credit Agreement (the “Second Amendment"), which amended the Credit Agreement. The Second Amendment modified the Minimum Consolidated Interest Coverage Ratio (as defined in the Credit Agreement) to
1.50
to 1.00 for the period ended December 31, 2014 and the period ended March 31, 2015 and modified the Maximum Consolidated Leverage Ratio (as defined in the Credit Agreement) to
7.90
to 1.00 for the period ended December 31, 2014.
Third amendment
. On June 2, 2015, the Company entered into the Third Amendment to the Amended and Restated Credit Agreement (the “Third Amendment"), which amended the Credit Agreement. The Third Amendment modified the definition of Consolidated EBIT to permit add backs for specified periods for reserves taken with respect to receivables, restructuring charges and adjustments for applying the rule of lower of cost or market to inventories, modified the Minimum Consolidated Interest Coverage Ratio to
1.60
to 1.00 for the periods ending June 30, 2015 and September 30, 2015,
1.65
to 1.00 for the period ending December 31, 2015 and
1.70
to 1.00 for the period ending March 31, 2016, modified the Maximum Consolidated Leverage Ratio to
7.60
to 1.00 for the periods ending June 30, 2015 and September 30, 2015 and
7.15
to 1.00 for the period ending December 31, 2015, modified the restricted payments covenant to permit repayment of the Company’s Senior Secured Second Lien Notes by up to
$50,000
in any fiscal year, with carry forward of any unused amount into the next fiscal year, modified a covenant to provide a
90
-day cure period if Uncommitted Inventories (as defined in the Credit Agreement) exceed the threshold of
$250,000
, but only to the extent that they do not exceed
$285,000
, and provides for first-lien mortgages on the Company’s facilities located in Farmville, King and Wilson, North Carolina.
Fourth amendment
. On May 20, 2016, the Company entered into the Fourth Amendment to the Amended and Restated Credit Agreement (the “Fourth Amendment"), which amended the Credit Agreement. See Note 21 "Subsequent Events" to the Notes to Consolidated Financial Statements.
Fifth amendment
. On July 6, 2016, the Company entered into the Fifth Amendment to the Amended and Restated Credit Agreement (the “Fifth Amendment"), which amended the Credit Agreement. See Note 21 "Subsequent Events" to the Notes to Consolidated Financial Statements.
- 57
-
ITEM 8.
FINANCIAL STATEMENTS AND SUPPLEMENTARY DATA
(continued)
NOTES TO CONSOLIDATED FINANCIAL STATEMENTS
(continued)
Alliance One International, Inc. and Subsidiaries
(in thousands)
Note 8
– Long-Term Debt
(continued)
Senior Secured Credit Facility
(continued)
Financial covenants
. After giving effect to the First Amendment, the Second Amendment, the Third Amendment, the Fourth Amendment and the Fifth Amendment to the Amended and Restated Credit Agreement, the financial covenants and required financial ratios at March 31, 2016 are as follows:
• a minimum consolidated interest coverage ratio of not less than
1.70
to 1.00 for the fiscal quarter ended March 31, 2016 (
1.90
to 1.00 for the fiscal quarters ending June 30, 2016, September 30, 2016 and December 31, 2016 and
1.65
to 1.00 for the fiscal quarter ending March 31, 2017);
• a maximum consolidated leverage ratio specified for each fiscal quarter, which ratio is
5.50
to 1.00 for the fiscal quarter ended March 31, 2016 (
6.25
to 1.00 for the fiscal quarter ending June 30, 2016,
6.45
to 1.00 for the fiscal quarter ended September 30, 2016,
6.25
to 1.00 for the fiscal quarter ending December 31, 2016, and
5.50
to 1.00 for the fiscal quarter ending March 31, 2017);
• a maximum consolidated total senior debt to working capital ratio of not more than
0.80
to 1.00 other than during periods in which the consolidated leverage ratio is less than
4.00
to 1.00 if the consolidated leverage ratio has been less than
4.00
to 1.00 for the prior two consecutive fiscal quarters; and
• a maximum amount of the Company's annual capital expenditures of
$52,482
during the fiscal year ending March 31, 2016 and
$40,000
during any fiscal year thereafter, in each case with a one-year carry-forward (not in excess of
$40,000
) for unused capital expenditures in any fiscal year below the maximum amount.
Certain of these financial covenants are calculated on a rolling twelve-month basis and certain of these financial covenants and required financial ratios adjust over time in accordance with schedules in the agreement governing the senior secured credit facility. The Company continuously monitors compliance with debt covenants. At March 31, 2016 and during the fiscal year, the Company was in compliance with the financial covenants under the Fourth Amendment to the senior secured credit facility agreement. While the Company anticipates it will be in compliance in fiscal 2017, unanticipated changes in market conditions or other factors could adversely affect the Company’s business and future debt covenant compliance thereunder. In such a circumstance, the Company may not be able to maintain compliance with the covenants, which would cause a default under the credit facility. A default, if not waived and/or amended, would prevent us from taking certain actions, such as incurring additional debt, paying dividends, or redeeming senior notes or subordinated debt. A default also could result in a default or acceleration of our other indebtedness with cross-default provisions.
If the Company were unable to maintain compliance with the financial covenants in the senior secured credit facility agreement, it would seek modification to the then existing agreement to further amend covenants and extend maturities, as necessary. If the Company were unable to obtain such modification, it could potentially decide to pay off the credit facility and terminate the agreement. In such case, the liquidity provided by the agreement would not be available in the future; however, the Company believes it has sufficient liquidity from operations and other available funding sources to meet future operating, debt service and capital expenditure requirements for the next twelve months. Further, as noted above, the Company's U.S. revolver matures April 15, 2017 and the Company plans to either extend or refinance this facility during fiscal year 2017. The inability to extend or refinance its U.S. revolver could impact its ability to meet its future liquidity requirements.
Affirmative and restrictive covenants
. The agreement governing the senior secured credit facility contains affirmative and negative covenants (subject, in each case, to exceptions and qualifications), including covenants that limit the Company's ability to, among other things, incur additional indebtedness, incur certain guarantees, merge, consolidate or dispose of substantially all of its assets, grant liens on its assets, pay dividends, redeem stock or make other distributions or restricted payments, create certain dividend and payment restrictions on its subsidiaries, repurchase or redeem capital stock or prepay subordinated debt, make certain investments, agree to restrictions on the payment of dividends to it by its subsidiaries, sell or otherwise dispose of assets, including equity interests of its subsidiaries, enter into transactions with its affiliates, and enter into certain sale and leaseback transactions.
- 58
-
ITEM 8.
FINANCIAL STATEMENTS AND SUPPLEMENTARY DATA
(continued)
NOTES TO CONSOLIDATED FINANCIAL STATEMENTS
(continued)
Alliance One International, Inc. and Subsidiaries
(in thousands)
Note 8
- Long-Term Debt
(continued)
Senior Secured Second Lien Notes
On August 1, 2013, the Company issued
$735,000
in aggregate principal amount of the Second Lien Notes. The Second Lien Notes were sold at
98%
of the face value, for gross proceeds of approximately
$720,300
. The Second Lien Notes bear interest at a rate of
9.875%
per year, payable semi-annually in arrears in cash on January 15 and July 15 of each year, beginning January 15, 2014, to holders of record at the close of business on the preceding January 1 and July 1, respectively. The Second Lien Notes will mature on July 15, 2021. The Second Lien Notes are secured by a second priority lien on specified property of Alliance One International, Inc. for which the amended and restated senior secured credit facility is secured by a first priority lien. The indenture governing the Second Lien Notes restricts (subject to exceptions and qualifications) the Company's ability and the ability of its restricted subsidiaries to, among other things, incur additional indebtedness or issue disqualified stock or preferred stock, pay dividends and make other restricted payments (including restricted investments), sell assets, create liens, consolidate, merge, sell or otherwise dispose of all or substantially all of its assets, enter into transactions with its affiliates, enter into certain sale and leaseback transactions, create certain dividend and payment restrictions on its restricted subsidiaries, and designate its subsidiaries as unrestricted subsidiaries.
The indenture governing the Second Lien Notes requires the Company's existing and future material domestic subsidiaries to guarantee the Second Lien Notes. The Company has no material domestic subsidiaries, and the Second Lien Notes are not presently guaranteed by any subsidiary. If a change of control (as defined in the indenture governing the Second Lien Notes) occurs at any time, holders of the Second Lien Notes will have the right, at their option, to require the Company to repurchase all or a portion of the Second Lien Notes for cash at a price equal to
101%
of the principal amount of Second Lien Notes being repurchased, plus accrued and unpaid interest and special interest, if any, to, but excluding, the date of repurchase. In connection with the issuance of the Second Lien Notes, the Company entered into a registration rights agreement that requires the Company to pay additional special interest on the Second Lien Notes, at increasing annual rates up to a maximum of
1.0%
per year, if the Company fails to timely comply with its registration obligations thereunder. Pursuant to the registration rights agreement, on December 20, 2013, the Company completed a registered exchange offer in which it offered to exchange for the outstanding Second Lien Notes an equal amount of new Second Lien Notes having identical terms in all material respects. During the year ended March 31, 2015, the Company purchased
$15,000
of its senior notes on the open market. All purchased securities were canceled leaving
$720,000
of the
9.875%
senior notes outstanding at March 31, 2015. Associated costs paid were
$38
and related discounts were
$(1,323)
resulting in net cash repayment of
$13,715
and recorded in Repayment of Long-Term Borrowings in the Consolidated Statements of Cash Flows. Deferred financing costs and amortization of original issue discount of
$514
were accelerated.
Foreign Seasonal Lines of Credit
The Company has typically financed its non-U.S. operations with uncommitted unsecured short-term seasonal lines of credit at the local level. These operating lines are seasonal in nature, normally extending for a term of
180
to
270
days corresponding to the tobacco crop cycle in that location. These facilities are typically uncommitted in that the lenders have the right to cease making loans and demand repayment of loans at any time. These loans are typically renewed at the outset of each tobacco season. As of
March 31, 2016
, the Company had approximately
$475,989
drawn and outstanding on foreign seasonal lines with maximum capacity totaling $
910,131
subject to limitations as provided for in the Credit Agreement. Additionally, against these lines there was
$13,057
available in unused letter of credit capacity with
$4,733
issued but unfunded.
Long-Term Foreign Seasonal Borrowings
The Company had foreign seasonal borrowings with original maturities greater than one year. At March 31, 2016, approximately $
10,000
was drawn and outstanding with maximum capacity totaling $
10,000
.
Dividends
The senior secured credit facility restricts the Company from paying any dividends during the remaining term of the facility. In addition, the indenture governing the Second Lien Notes contains similar restrictions and also prohibits the payment of dividends and other distributions if the Company fails to satisfy a ratio of consolidated EBITDA to fixed charges of at least
2.0
to
1.0
. At
March 31, 2016
, the Company did not satisfy this fixed charge coverage ratio. The Company may from time to time not satisfy this ratio.
- 59
-
ITEM 8.
FINANCIAL STATEMENTS AND SUPPLEMENTARY DATA
(continued)
NOTES TO CONSOLIDATED FINANCIAL STATEMENTS
(continued)
Alliance One International, Inc. and Subsidiaries
(in thousands)
Note 8
- Long-Term Debt
(continued)
Certain debt agreements contain cross-default or cross-acceleration provisions. The following table summarizes the Company’s debt financing as of
March 31, 2016
:
|
March 31, 2016
|
||||||||||||||||||||||||||||||
|
Outstanding
|
Lines and
|
|||||||||||||||||||||||||||||
|
March 31, 2015
|
March 31, 2016
|
Letters
|
Interest
|
Long Term Debt Repayment Schedule by Fiscal Year
|
||||||||||||||||||||||||||
|
Available
|
Rate
|
2017
|
2018
|
2019
|
2020
|
2021
|
Later
|
|||||||||||||||||||||||
|
Senior secured credit facility:
|
||||||||||||||||||||||||||||||
|
Revolver
(1)
|
$
|
—
|
|
$
|
200,000
|
|
$
|
10,259
|
|
5.4
|
%
|
(2)
|
$
|
—
|
|
$
|
200,000
|
|
$
|
—
|
|
$
|
—
|
|
$
|
—
|
|
$
|
—
|
|
|
Senior notes:
|
||||||||||||||||||||||||||||||
|
9.875% senior secured
second lien notes due
2021
(4)
|
707,732
|
|
709,196
|
|
—
|
|
9.9
|
%
|
—
|
|
—
|
|
—
|
|
—
|
|
—
|
|
709,196
|
|
||||||||||
|
Long-term foreign seasonal borrowings
|
30,000
|
|
10,000
|
|
—
|
|
3.8
|
%
|
(2)
|
—
|
|
10,000
|
|
—
|
|
—
|
|
—
|
|
—
|
|
|||||||||
|
Other long-term debt
|
4,105
|
|
1,249
|
|
|
|
7.2
|
%
|
(2)
|
356
|
|
249
|
|
100
|
|
342
|
|
100
|
|
102
|
|
|||||||||
|
Notes payable to banks
(3)
|
330,254
|
|
475,989
|
|
416,352
|
|
5.2
|
%
|
(2)
|
475,989
|
|
—
|
|
—
|
|
—
|
|
—
|
|
—
|
|
|||||||||
|
Total debt
|
$
|
1,072,091
|
|
$
|
1,396,434
|
|
426,611
|
|
$
|
476,345
|
|
$
|
210,249
|
|
$
|
100
|
|
$
|
342
|
|
$
|
100
|
|
$
|
709,298
|
|
||||
|
Short term
(3)
|
$
|
330,254
|
|
$
|
475,989
|
|
||||||||||||||||||||||||
|
Long term:
|
||||||||||||||||||||||||||||||
|
Long term debt current
|
$
|
2,894
|
|
$
|
356
|
|
||||||||||||||||||||||||
|
Long term debt
|
738,943
|
|
920,089
|
|
||||||||||||||||||||||||||
|
$
|
741,837
|
|
$
|
920,445
|
|
|||||||||||||||||||||||||
|
Letters of credit
|
$
|
6,328
|
|
$
|
4,733
|
|
13,057
|
|
||||||||||||||||||||||
|
Total credit available
|
$
|
439,668
|
|
|||||||||||||||||||||||||||
(1) As of
March 31, 2016
, pursuant to Section 2.1 (A) (iv) of the Credit Agreement, the full
$210,259
Revolving Committed Amount was available based on the calculation of the lesser of the Revolving Committed Amount and the Working Capital Amount.
(2) Weighted average rate for the
twelve
months ended
March 31, 2016
.
(3) Primarily foreign seasonal lines of credit. At March 31, 2016, the outstanding amount includes
$130,600
of debt owed by MTC under a short-term credit facility in which one of the Company’s other subsidiaries has a participation interest in the lender’s rights and obligations under the facility. At March 31, 2016,
$84,258
of that amount was attributed to outstanding borrowings by MTC funded under that facility by such other subsidiary pursuant to that participation interest. Because such other subsidiary’s funding is pursuant to a participation interest through a third-party lender and not a direct intercompany loan between such other subsidiary and MTC, the total amount of debt under the facility is required to be reflected as consolidated debt upon the reconsolidation of MTC. See Note 22 “Reconsolidation of MTC” to the “Notes to Consolidated Financial Statements” for further information.
(4) Repayment of $
709,196
is net of original issue discount of $
10,804
. Total repayment will be $
720,000
.
Note 9
- Long-Term Leases
The Company has operating leases for land, buildings, automobiles and other equipment. Rent expense for all operating leases was
$22,989
,
$22,622
and
$23,313
for the years ended
March 31, 2016, 2015 and
2014
, respectively. Minimum future obligations are as follows:
|
Operating
Leases |
|||
|
2017
|
$
|
16,875
|
|
|
2018
|
11,427
|
|
|
|
2019
|
9,008
|
|
|
|
2020
|
4,645
|
|
|
|
2021
|
3,125
|
|
|
|
Remaining
|
1,543
|
|
|
|
$
|
46,623
|
|
|
- 60
-
ITEM 8.
FINANCIAL STATEMENTS AND SUPPLEMENTARY DATA
(continued)
NOTES TO CONSOLIDATED FINANCIAL STATEMENTS
(continued)
Alliance One International, Inc. and Subsidiaries
(in thousands)
Note 10
– Equity in Net Assets of Investee Companies
The Company has equity method investments in companies located in Asia which purchase and process tobacco. The Asia investees and ownership percentages are as follows: Alliance One Industries India Private Ltd. (India)
49%
, Siam Tobacco Export Company (Thailand)
49%
, and Adams International Ltd. (Thailand)
49%
. On March 10, 2014, the Company purchased a
50%
equity based interest in Oryantal Tutun Paketleme which processes tobacco in Turkey. On March 26, 2014, the Company completed the formation of a new joint venture in Brazil with the disposition of
51%
interest in China Brasil Tobacos Exportadora SA (“CBT”). The Company retained a
49%
equity based interest in CBT which purchases and processes tobacco. Upon the disposition of
51%
interest in CBT, the difference between the book basis of the Company’s
49%
interest and the fair value of the investment recorded created a basis difference of
$15,990
. The Company evaluated the contributed assets and identified basis differences in certain accounts, including inventory, intangible assets and deferred taxes. The basis differences are being amortized over the respective estimated lives of these assets and liabilities, which range from
one
to
ten
years. For the year ended March 31, 2016, the Company’s earnings from the equity method investment were reduced by amortization expense of
$1,554
related to these basis differences. At March 31, 2016, the basis difference was
$11,622
. On April 2, 2014 the Company completed the purchase of a
50%
interest in Purilum, LLC, a U.S. company that develops, produces and sells consumable e-liquids to manufacturers and distributors of e-vapor products. Summarized combined financial information for these investees for fiscal years ended
March 31, 2016
, 2015 and 2014 follows:
|
Years Ended March 31,
|
|||||||||
|
Operations Statement Information
|
2016
|
2015
|
2014
|
||||||
|
Sales
|
$
|
274,183
|
|
$
|
297,474
|
|
$
|
115,059
|
|
|
Gross profit
|
42,143
|
|
33,246
|
|
10,556
|
|
|||
|
Net income
|
15,254
|
|
11,394
|
|
122
|
|
|||
|
Company's dividends received
|
1,887
|
|
—
|
|
843
|
|
|||
|
March 31,
|
||||||
|
Balance Sheet Information
|
2016
|
2015
|
||||
|
Current assets
|
$
|
118,745
|
|
$
|
158,856
|
|
|
Property, plant and equipment and other assets
|
61,845
|
|
63,385
|
|
||
|
Current liabilities
|
77,908
|
|
127,793
|
|
||
|
Long-term obligations and other liabilities
|
10,222
|
|
12,315
|
|
||
Note 11
– Stock–Based Compensation
The Company expenses the fair value of grants of various stock-based compensation programs over the vesting period of the awards. Awards granted are recognized as compensation expense based on the grant-date fair value estimated in accordance with generally accepted accounting principles.
The table below summarizes certain data for the Company’s stock-based compensation plans:
|
Year Ended March 31,
|
|||||||||
|
2016
|
2015
|
2014
|
|||||||
|
Compensation expense for all stock based
compensation plans |
$
|
2,874
|
|
$
|
3,194
|
|
$
|
3,222
|
|
|
Tax (expense) benefits for stock-based compensation
|
$
|
—
|
|
$
|
—
|
|
$
|
—
|
|
|
Fair value of stock options vested
|
$
|
2,043
|
|
$
|
3,353
|
|
$
|
2,184
|
|
The Company’s shareholders approved the 2007 Incentive Plan (the “2007 Plan”) at its Annual Meeting of Shareholders on August 16, 2007 and amended the plan at its Annual Meeting of Shareholders on August 11, 2011 and August 6, 2009. The 2007 Plan is an omnibus plan that provides the flexibility to grant a variety of equity awards including stock options, stock appreciation rights, stock awards, stock units, performance awards and incentive awards to officers, directors and employees of the Company. A maximum of
1,390
shares may be issued under the plan as amended. However, the August 11, 2011 amendment requires that the shares available for grant be reduced by twice the number of shares issued for any awards other than options or stock appreciation rights. This has resulted in decreasing the shares available to grant by
288
. Additionally, shares that are settled in cash, and shares
- 61
-
ITEM 8.
FINANCIAL STATEMENTS AND SUPPLEMENTARY DATA
(continued)
NOTES TO CONSOLIDATED FINANCIAL STATEMENTS
(continued)
Alliance One International, Inc. and Subsidiaries
(in thousands)
Note 11
- Stock-Based Compensation
(continued)
Stock Option Awards
(
continued)
underlying substitute awards, do not reduce the number of shares available for award. The total of such shares is
85
. As of
March 31, 2016
,
1,903
equity awards have been granted,
886
equity awards have been cancelled and
342
vested under the 2007 Plan, leaving
171
shares available for future awards under the 2007 Plan. Total equity awards outstanding are
683
inclusive of
674
awards granted and outstanding under the 2007 plan and
8
awards granted under prior plans. Shares issued under both the 2007 plan and earlier plans are new shares which have been authorized and designated for award under the plans. Individual types of awards are discussed in greater detail below.
Stock Option Awards
Stock options allow for the purchase of common stock at a price determined at the time the option is granted. Stock options generally vest ratably over
five
years and generally expire after
ten
years. The fair value of these options is determined at grant date using the Black-Scholes valuation model and includes estimates of forfeiture based on historical experience. The fair value is then recognized as compensation expense ratably over the vesting term of the options.
No
stock options were granted during 2016, 2015 and 2014.
A summary of option activity for stock options follows:
|
Options
|
Shares
|
Weighted
Average Exercise Price |
Weighted
Average Remaining Contractual Term (Years) |
Aggregate
Intrinsic Value |
|||||
|
Outstanding at March 31, 2013
|
701
|
|
$
|
60.49
|
|
||||
|
Granted
|
—
|
|
—
|
|
|||||
|
Forfeited
|
(3
|
)
|
57.12
|
|
|||||
|
Expired
|
(10
|
)
|
64.41
|
|
|||||
|
Outstanding at March 31, 2014
|
688
|
|
60.45
|
|
|||||
|
Forfeited
|
(18
|
)
|
61.49
|
|
|||||
|
Expired
|
(9
|
)
|
64.50
|
|
|||||
|
Outstanding at March 31, 2015
|
661
|
|
60.37
|
|
|
|
|
||
|
Forfeited
|
(9
|
)
|
66.21
|
|
|||||
|
Expired
|
(182
|
)
|
59.23
|
|
|||||
|
Outstanding at March 31, 2016
|
470
|
|
60.70
|
|
5.18
|
$
|
—
|
|
|
|
Vested and expected to vest at March 31, 2016
|
469
|
|
60.70
|
|
5.18
|
$
|
—
|
|
|
|
Exercisable at March 31, 2016
|
433
|
|
60.76
|
|
5.11
|
$
|
—
|
|
|
The intrinsic values in the table above represent the total pre-tax intrinsic value which is the difference between the Company’s closing stock price and the exercise price multiplied by the number of options. The expense related to stock option awards for 2016, 2015, and 2014 was
$1,097
,
$1,363
, and
$1,366
, respectively. There were
no
options exercised in 2016, 2015 and 2014.
The table below shows the movement in unvested options from
March 31, 2015
to
March 31, 2016
.
|
Shares
|
Weighted Average
Grant Date Fair Value |
Aggregate
Grant Date Fair Value |
||||||
|
Unvested March 31, 2015
|
166
|
|
$
|
16.49
|
|
$
|
2,732
|
|
|
Forfeited
|
(5
|
)
|
17.78
|
|
(91
|
)
|
||
|
Vested
|
(123
|
)
|
16.65
|
|
(2,042
|
)
|
||
|
Unvested March 31, 2016
|
38
|
|
15.80
|
|
$
|
599
|
|
|
As of
March 31, 2016
, there is
$463
of unearned compensation, net of expected forfeitures, related to stock option awards which will vest over a weighted average remaining life of
1.0 year
.
- 62
-
ITEM 8.
FINANCIAL STATEMENTS AND SUPPLEMENTARY DATA
(continued)
NOTES TO CONSOLIDATED FINANCIAL STATEMENTS
(continued)
Alliance One International, Inc. and Subsidiaries
(in thousands)
Note 11
- Stock-Based Compensation
(continued)
Restricted Stock
Restricted stock is common stock that is both nontransferable and forfeitable unless and until certain conditions are satisfied. The fair value of restricted shares is determined on grant date and is amortized over the vesting period which is generally
three
years.
|
Restricted Stock
|
Shares
|
Weighted Average
Grant Date Fair Value |
|
|
Restricted at March 31, 2013
|
17
|
$
|
28.90
|
|
Granted
|
20
|
38.00
|
|
|
Vested
|
(17)
|
28.90
|
|
|
Restricted at March 31, 2014
|
20
|
38.00
|
|
|
Granted
|
27
|
16.12
|
|
|
Vested
|
(47)
|
25.39
|
|
|
Restricted at March 31, 2015
|
—
|
—
|
|
|
Granted
|
23
|
18.42
|
|
|
Vested
|
(23)
|
18.42
|
|
|
Restricted at March 31, 2016
|
—
|
—
|
|
As of
March 31, 2016
, there was
no
remaining unamortized deferred compensation. Expense recognized due to the vesting of restricted stock awards was
$417
,
$701
and
$658
for the years ended
March 31, 2016
, 2015 and 2014, respectively.
Restricted Stock Units
Restricted stock units differ from restricted stock in that
zero
shares are issued until restrictions lapse. Certain restricted stock units vest ratably over a
three
-year period and others vest
50%
in the first year and
25%
in each of the second and third years. The fair value of the restricted stock units is determined on the grant date and is amortized over the vesting period.
|
Restricted Stock Units
|
Shares
|
Weighted Average
Grant Date Fair Value |
||
|
Outstanding at March 31, 2013
|
43
|
|
$
|
45.59
|
|
Granted
|
64
|
|
38.50
|
|
|
Vested
|
(42
|
)
|
45.59
|
|
|
Forfeited
|
(2
|
)
|
38.50
|
|
|
Outstanding at March 31, 2014
|
63
|
|
38.50
|
|
|
Granted
|
22
|
|
27.20
|
|
|
Vested
|
(21
|
)
|
38.50
|
|
|
Forfeited
|
(6
|
)
|
38.50
|
|
|
Outstanding at March 31, 2015
|
58
|
|
34.18
|
|
|
Granted
|
58
|
|
14.73
|
|
|
Vested
|
(25
|
)
|
35.16
|
|
|
Forfeited
|
(2
|
)
|
38.50
|
|
|
Outstanding at March 31, 2016
|
89
|
|
21.28
|
|
As of
March 31, 2016
, there was
$666
of remaining unamortized deferred compensation associated with these restricted stock units that will be expensed over the remaining service period through February 23, 2019. Expense recognized due to the vesting of these awards was
$1,113
,
$859
and
$1,100
during the years ended
March 31, 2016
, 2015 and 2014 respectively.
On August 13, 2015, the Company's shareholders approved an exchange offer that would allow certain employees to surrender options and receive restricted stock units in exchange for these options. The offer was made on September 14, 2015 and applied only to grants made during years 2012 and 2013 that had an exercise price of
$60.00
following the reverse stock split on June 26, 2015. The exchange offer was consummated as of October 13, 2015 with no changes in the timing or material amount of expense recognized for stock based compensation.
- 63
-
ITEM 8.
FINANCIAL STATEMENTS AND SUPPLEMENTARY DATA
(continued)
NOTES TO CONSOLIDATED FINANCIAL STATEMENTS
(continued)
Alliance One International, Inc. and Subsidiaries
(in thousands)
Note 11
- Stock-Based Compensation
(continued)
Performance-Based Restricted Stock Units
Performance-based restricted stock units may vest at the end of either a
two
- or
three
-year performance period but the level of the awards to be earned at the end of the performance period is contingent upon attainment of specific business performance goals. If certain minimum performance levels are not attained, no compensation will be earned. The awards are variable in that compensation could range from
zero
to
200%
of the plan’s target contingent on the performance level attained. The table below includes the maximum number of restricted stock units that may be earned under the plan.
|
Performance-Based
Restricted Stock Units |
Shares
|
Weighted Average
Grant Date Fair Value |
||
|
Outstanding as of March 31, 2013
|
—
|
|
$
|
—
|
|
Granted
|
64
|
|
38.50
|
|
|
Forfeited
|
(2
|
)
|
38.50
|
|
|
Outstanding as of March 31, 2014
|
62
|
|
38.50
|
|
|
Granted
|
22
|
|
27.20
|
|
|
Forfeited
|
(1
|
)
|
38.50
|
|
|
Outstanding as of March 31, 2015
|
83
|
|
35.52
|
|
|
Granted
|
30
|
|
10.11
|
|
|
Forfeited
|
(61
|
)
|
38.50
|
|
|
Outstanding as of March 31, 2016
|
52
|
|
17.33
|
|
As of
March 31, 2016
, the Company anticipates that
no
performance-based restricted stock units will vest resulting in
$0
to be expensed over the remaining service life through February 23, 2019. Expense recognized due to the expected vesting of these awards were $
(202)
, $
104
, and $
98
during the years ended
March 31, 2016
, 2015 and 2014, respectively.
Cash-Settled Awards
Cash-settled awards differ from the Company's other awards in that
no
shares will be issued and the cumulative compensation expense is recognized as a liability rather than equity. Under both of our current Cash-Settled Awards, the fair value of the award is equal to the period-end closing price of one share. The liability recognized will be the product of the fair value multiplied ratably by the expired vesting term. The expense related to these awards is derived by appropriately adjusting the value of the liability. As a result, the expense will be variable as the value of the liability will increase or decrease subject to the period-end closing price.
Cash-Settled Restricted Stock Units
Cash-settled restricted stock units vest ratably over the first, second and third anniversaries of the date of award.
|
Cash-Settled Restricted Stock Units
|
Shares
|
Weighted Average
Grant Date Fair Value |
||
|
Outstanding as of March 31, 2015
|
44
|
|
27.06
|
|
|
Granted
|
1
|
|
19.65
|
|
|
Vested
|
(14
|
)
|
27.06
|
|
|
Forfeited
|
(2
|
)
|
27.20
|
|
|
Outstanding as of March 31, 2016
|
29
|
|
26.85
|
|
As of
March 31, 2016
, there was
$323
of remaining unamortized deferred compensation associated with these restricted stock units that will be expensed over the remaining service period through October 13, 2018. Expense recognized due to the vesting of these awards was
$488
and
$128
during the years ended
March 31, 2016
and 2015, respectively. There was
no
expense recognized in the year ending March 31,
2014
.
- 64
-
ITEM 8.
FINANCIAL STATEMENTS AND SUPPLEMENTARY DATA
(continued)
NOTES TO CONSOLIDATED FINANCIAL STATEMENTS
(continued)
Alliance One International, Inc. and Subsidiaries
(in thousands)
Note 11
- Stock-Based Compensation
(continued)
Cash-Settled Performance-Based Restricted Stock Units
Cash-settled restricted stock units vest at the end of a
three
year performance period but the level of the award to vest is subject to similar performance criteria as the Performance-Based Restricted Stock Units described above. The awards are also variable in that they range from
zero
to
200%
of the plan’s target contingent on the performance level attained. The table below includes the maximum number of restricted stock units that may be earned under the plan.
|
Cash-Settled Performance-Based
Restricted Stock Units |
Shares
|
Weighted Average
Grant Date Fair Value |
||
|
Outstanding as of March 31, 2015
|
44
|
|
27.06
|
|
|
Granted
|
—
|
|
—
|
|
|
Forfeited
|
(2
|
)
|
27.20
|
|
|
Outstanding as of March 31, 2016
|
42
|
|
27.10
|
|
As of
March 31, 2016
, the Company anticipates that
no
performance-based restricted stock units will vest resulting in
$0
to be expensed over the remaining service period through June 16, 2017. Expense recognized due to the expected vesting of these awards was $
(39)
and
$39
during the years ended
March 31, 2016
and 2015. There was
no
expense recognized for the year ending March 31,
2014
.
Note 12
– Income Taxes
Accounting for Uncertainty in Income Taxes
As of
March 31, 2016
, 2015 and 2014, the Company’s unrecognized tax benefits totaled
$16,675
,
$17,752
and
$12,635
, respectively, of which
$7,701
would impact the Company’s effective tax rate if recognized. The following table presents the changes to unrecognized tax benefits during the years ended
March 31, 2016
, 2015 and 2014:
|
2016
|
2015
|
2014
|
|||||||
|
Balance at April 1
|
$
|
17,752
|
|
$
|
12,635
|
|
$
|
8,678
|
|
|
Increase for current year tax positions
|
24
|
|
7,260
|
|
4,191
|
|
|||
|
Reduction for prior year tax positions
|
(223
|
)
|
(1,055
|
)
|
(111
|
)
|
|||
|
Impact of changes in exchange rates
|
(878
|
)
|
(1,088
|
)
|
(123
|
)
|
|||
|
Reduction for settlements
|
—
|
|
—
|
|
—
|
|
|||
|
Balance at March 31
|
$
|
16,675
|
|
$
|
17,752
|
|
$
|
12,635
|
|
The Company recognizes interest and penalties related to unrecognized tax benefits in income tax expense. During the years ended
March 31, 2016
and 2015, the Company accrued (reduced) interest, penalties and related exchange losses related to unrecognized tax benefits by
$(224)
and $
109
, respectively. As of
March 31, 2016
, accrued interest and penalties totaled
$1,315
and
$793
, respectively. During the year ending
March 31, 2016
, the Company reduced its accrued interest and penalties for $
387
related to the expiration of statute of limitations. As of
March 31, 2015
, accrued interest and penalties totaled
$1,276
and
$1,056
, respectively.
During the fiscal year ending
March 31, 2016
, the Company’s total liability for unrecognized tax benefits, including the related interest and penalties, decreased from
$20,085
to
$18,784
. The change in the liability for unrecognized tax benefits relates to expiration of statute of limitations of approximately
$688
, decreases related to current period activity of approximately
$613
.
The Company expects to continue accruing interest expenses related to the remaining unrecognized tax benefits. Additionally, the Company may be subject to fluctuations in the unrecognized tax liability due to currency exchange rate movements.
It is reasonably possible that the Company's unrecognized tax benefits may decrease in the next twelve months by
$333
due to the expiration of the statute of limitations but the Company must acknowledge circumstances can change due to unexpected developments in the law. In certain jurisdictions, tax authorities have challenged positions that the Company has taken that resulted in recognizing benefits that are material to its financial statements. The Company believes it is more likely than not that it will prevail in these situations and accordingly have not recorded liabilities for these positions. The Company expects the challenged positions to be settled at a time greater than twelve months from its balance sheet date.
- 65
-
ITEM 8.
FINANCIAL STATEMENTS AND SUPPLEMENTARY DATA
(continued)
NOTES TO CONSOLIDATED FINANCIAL STATEMENTS
(continued)
Alliance One International, Inc. and Subsidiaries
(in thousands)
Note 12
– Income Taxes
(continued)
Accounting for Uncertainty in Income Taxes
(continued)
The Company and its subsidiaries file a U.S. federal consolidated income tax return as well as returns in several U.S. states and a number of foreign jurisdictions. As of
March 31, 2016
, the Company’s earliest open tax year for U.S. federal income tax purposes was its fiscal year ended March 31, 2013; however, the Company's net operating loss carryovers from prior periods remain subject to adjustment. Open tax years in state and foreign jurisdictions generally range from
three
to
six
years.
Income Tax Provision
The components of income (loss) before income taxes, equity in net income of investee companies and minority interests consisted of the following:
|
Years Ended March 31,
|
|||||||||
|
2016
|
2015
|
2014
|
|||||||
|
U.S.
|
$
|
(55,073
|
)
|
$
|
(24,749
|
)
|
$
|
(91,290
|
)
|
|
Non-U.S.
|
146,747
|
|
15,810
|
|
29,595
|
|
|||
|
Total
|
$
|
91,674
|
|
$
|
(8,939
|
)
|
$
|
(61,695
|
)
|
The details of the amount shown for income taxes in the Consolidated Statements of Operations follow:
|
Years Ended March 31,
|
|||||||||
|
2016
|
2015
|
2014
|
|||||||
|
Current
|
|||||||||
|
Federal
|
$
|
—
|
|
$
|
—
|
|
$
|
—
|
|
|
State
|
—
|
|
—
|
|
—
|
|
|||
|
Non-U.S.
|
26,476
|
|
19,850
|
|
24,980
|
|
|||
|
$
|
26,476
|
|
$
|
19,850
|
|
$
|
24,980
|
|
|
|
Deferred
|
|||||||||
|
Federal
|
$
|
—
|
|
$
|
—
|
|
$
|
—
|
|
|
State
|
—
|
|
—
|
|
—
|
|
|||
|
Non-U.S.
|
5,739
|
|
2,068
|
|
16,261
|
|
|||
|
$
|
5,739
|
|
$
|
2,068
|
|
$
|
16,261
|
|
|
|
Total
|
$
|
32,215
|
|
$
|
21,918
|
|
$
|
41,241
|
|
The reasons for the difference between income tax expense based on income before income taxes, equity in net income of investee companies and minority interests and the amount computed by applying the U.S. statutory federal income tax rate to such income are as follows:
|
Years Ended March 31,
|
|||||||||
|
2016
|
2015
|
2014
|
|||||||
|
Tax expense at U.S. statutory rate
|
$
|
32,086
|
|
$
|
(3,129
|
)
|
$
|
(21,594
|
)
|
|
Effect of non-U.S. income taxes
|
(15,131
|
)
|
647
|
|
7,377
|
|
|||
|
U.S. taxes on non-U.S. income
|
23,734
|
|
14,768
|
|
(274
|
)
|
|||
|
Foreign tax credits expiration
|
47,552
|
|
—
|
|
—
|
|
|||
|
Change in valuation allowance
|
(47,135
|
)
|
(14,908
|
)
|
25,080
|
|
|||
|
Increase (decrease) in reserves for uncertain tax positions
|
(1,203
|
)
|
5,227
|
|
3,971
|
|
|||
|
Change in tax rates
|
2,480
|
|
—
|
|
—
|
|
|||
|
Exchange effects and currency translation
|
15,492
|
|
14,308
|
|
26,884
|
|
|||
|
Permanent items
|
891
|
|
5,005
|
|
(203
|
)
|
|||
|
Nontaxable gain - Zimbabwe subsidiary reconsolidation
|
(26,551
|
)
|
—
|
|
—
|
|
|||
|
Actual tax expense
|
$
|
32,215
|
|
$
|
21,918
|
|
$
|
41,241
|
|
- 66
-
ITEM 8.
FINANCIAL STATEMENTS AND SUPPLEMENTARY DATA
(continued)
NOTES TO CONSOLIDATED FINANCIAL STATEMENTS
(continued)
Alliance One International, Inc. and Subsidiaries
(in thousands)
Note 12
- Income Taxes
(continued)
Income Tax Provision
(continued)
The deferred tax liabilities (assets) are comprised of the following:
|
March 31, 2016
|
March 31, 2015
|
|||||
|
Deferred tax liabilities:
|
||||||
|
Unremitted earnings of foreign subsidiaries
|
$
|
27,641
|
|
$
|
22,043
|
|
|
Intangible assets
|
9,334
|
|
6,415
|
|
||
|
Fixed assets
|
11,435
|
|
3,488
|
|
||
|
Total deferred tax liabilities
|
$
|
48,410
|
|
$
|
31,946
|
|
|
Deferred tax assets:
|
||||||
|
Reserves and accruals
|
$
|
(23,870
|
)
|
$
|
(29,610
|
)
|
|
Tax credits
|
(8,191
|
)
|
(55,744
|
)
|
||
|
Tax loss carryforwards
|
(104,337
|
)
|
(105,345
|
)
|
||
|
Derivative transactions
|
(892
|
)
|
(567
|
)
|
||
|
Postretirement and other benefits
|
(30,635
|
)
|
(34,388
|
)
|
||
|
Unrealized exchange loss
|
(12,645
|
)
|
(10,057
|
)
|
||
|
Other
|
(8,207
|
)
|
(4,926
|
)
|
||
|
Gross deferred tax assets
|
(188,777
|
)
|
(240,637
|
)
|
||
|
Valuation allowance
|
118,518
|
|
169,804
|
|
||
|
Total deferred tax assets
|
$
|
(70,259
|
)
|
$
|
(70,833
|
)
|
|
Net deferred tax asset
|
$
|
(21,849
|
)
|
$
|
(38,887
|
)
|
The following table presents the breakdown between current and non-current (assets) liabilities:
|
March 31, 2016
|
March 31, 2015
|
|||||
|
Current asset
|
$
|
—
|
|
$
|
(15,586
|
)
|
|
Current liability
|
—
|
|
6,356
|
|
||
|
Non-current asset
|
(38,773
|
)
|
(32,111
|
)
|
||
|
Non-current liability
|
16,924
|
|
2,454
|
|
||
|
Net deferred tax asset
|
$
|
(21,849
|
)
|
$
|
(38,887
|
)
|
In November 2015, new accounting guidance was issued requiring all deferred tax assets and liabilities, and any related valuation allowance, to be classified as noncurrent on the balance sheet which eliminates the need to separately identify the net current and net noncurrent deferred tax assets or liabilities in each jurisdiction including valuation allowances. The Company adopted this guidance prospectively at March 31, 2016 and therefore March 31, 2015 balances were not adjusted.
During the year ended
March 31, 2016
, the net deferred tax asset balance decreased by
$11,363
for certain adjustments not included in the deferred tax expense (benefit), primarily for deferred tax assets related to pension accruals recorded in equity as part of Other Comprehensive Income (Loss), currency translation adjustments and the reconsolidation the Zimbabwe subsidiary.
For the year ended
March 31, 2016
, the valuation allowance decreased by
$51,286
which is inclusive of
$3,370
related to adjustments in other comprehensive income and
$813
related primarily to currency translation adjustments. The valuation allowance decreased primarily due to the accrual of a deferred liability on unremitted foreign earnings and the accrual of an additional liability for unrecognized tax benefits netted against tax loss carryovers. The valuation allowance is based on the Company's assessment that it is more likely than not that certain deferred tax assets, primarily foreign tax credits and net operating loss carryovers, will not be realized in the foreseeable future. Recent years' cumulative losses incurred in the United States as of
March 31, 2016
, combined with the effects of certain changes in the market, provide significant objective negative evidence in the evaluation of whether the U.S. entity will generate sufficient taxable income to realize the tax benefits of the deferred tax assets. This negative evidence carries greater weight than the more subjective positive evidence of favorable future projected income in the assessment of whether realization of the tax benefits of the deferred tax assets is more likely than not. Therefore, based on the
- 67
-
ITEM 8.
FINANCIAL STATEMENTS AND SUPPLEMENTARY DATA
(continued)
NOTES TO CONSOLIDATED FINANCIAL STATEMENTS
(continued)
Alliance One International, Inc. and Subsidiaries
(in thousands)
Note 12
- Income Taxes
(continued)
Income Tax Provision
(continued)
weight of presently objectively verifiable positive and negative evidence, it is management's judgment that realization of the tax benefits of the deferred tax assets is less than more likely than not.
At
March 31, 2016
, the Company has U.S federal tax loss carryovers of
$260,312
, non-U.S. tax loss carryovers of
$67,347
, and U.S. state tax loss carryovers of
$373,798
. The U.S. federal tax loss carryovers will expire in 2030 and thereafter. Of the non-U.S. tax loss carryovers,
$39,863
will expire within the next
5
years,
$22,873
will expire in later years, and
$4,612
can be carried forward indefinitely. Of the U.S. state tax loss carryovers,
$69,174
will expire within the next
five
years and
$304,624
will expire thereafter. At
March 31, 2016
, the Company has foreign tax credit carryovers in the United States of
$4,379
, of which
$1,634
will expire within the next five years.
Realization of deferred tax assets is dependent on generating sufficient taxable income prior to expiration of the loss carryovers. Although realization is not assured, management believes it is more likely than not that all of the deferred tax assets, net of applicable valuation allowances, will be realized. The amount of the deferred tax assets considered realizable could be reduced or increased if estimates of future taxable income change during the carryover period.
A provision of
$27,641
has been made for U.S. on foreign taxes that may result from future remittances of foreign earnings of
$75,568
. No provision has been made for U.S. or foreign taxes that may result from future remittances of approximately
$334,445
at
March 31, 2016
and
$409,505
at
March 31, 2015
of undistributed earnings of foreign subsidiaries because management expects that such earnings will be reinvested overseas indefinitely. Determination of the amount of any unrecognized deferred income tax liability on these unremitted earnings is not practicable.
Note 13
– Employee Benefits
Retirement Benefits
The Company has multiple benefit plans at several locations. The Company has a defined benefit plan that provides retirement benefits for substantially all U.S. salaried personnel based on years of service rendered, age and compensation. The Company also maintains various other Excess Benefit and Supplemental Plans that provide additional benefits to (1) certain individuals whose compensation and the resulting benefits that would have actually been paid are limited by regulations imposed by the Internal Revenue Code and (2) certain individuals in key positions. In addition, a Supplemental Retirement Account Plan ("SRAP"), a defined contribution program, is maintained.
The Company's policy is to contribute amounts to the plans sufficient to meet or exceed funding requirements of local governmental rules and regulations.
Additional non-U.S. plans sponsored by certain subsidiaries cover substantially all of the full-time employees located in Germany, Turkey and the United Kingdom.
- 68
-
ITEM 8.
FINANCIAL STATEMENTS AND SUPPLEMENTARY DATA
(continued)
NOTES TO CONSOLIDATED FINANCIAL STATEMENTS
(continued)
Alliance One International, Inc. and Subsidiaries
(in thousands)
Note 13
- Employee Benefits
(continued)
Retirement Benefits
(continued)
In fiscal 2014, the Company experienced a special termination benefit and curtailment loss of
$1,261
during the quarter ended June 30, 2013 in connection with restructuring in its Turkey location, which has been recorded in Restructuring and Asset Impairment Charges (Recoveries).
During the three months ended December 31, 2015, the Company announced that the U.S. Pension Plan would be frozen effective January 1, 2016. This change is accounted for as a curtailment and resulted in a curtailment loss of
$1,062
and a reduction in the benefit obligation and accumulated other comprehensive income of
$2,534
as of December 31, 2015. The curtailment loss is recorded in restructuring and asset impairment charges.
A reconciliation of benefit obligations, plan assets and funded status of the plans at
March 31, 2016
and 2015, the measurement dates, is as follows:
|
U.S. Plans
|
Non-U.S. Plans
|
|||||||||||||
|
March 31,
|
March 31,
|
|||||||||||||
|
2016
|
2015
|
2016
|
2015
|
|||||||||||
|
Change in Benefit Obligation
|
||||||||||||||
|
Benefit obligation, beginning
|
$
|
107,423
|
|
$
|
99,061
|
|
$
|
69,939
|
|
$
|
66,847
|
|
||
|
Service cost
|
1,434
|
|
1,856
|
|
271
|
|
173
|
|
||||||
|
Interest cost
|
3,640
|
|
3,969
|
|
2,146
|
|
2,711
|
|
||||||
|
Plan amendments
|
—
|
|
—
|
|
(4
|
)
|
—
|
|
||||||
|
Plan curtailments
|
(1,963
|
)
|
—
|
|
(256
|
)
|
—
|
|
||||||
|
Actuarial losses (gains)
|
(3,288
|
)
|
9,813
|
|
(5,025
|
)
|
9,349
|
|
||||||
|
Settlements/special termination benefits
|
—
|
|
(517
|
)
|
—
|
|
(136
|
)
|
||||||
|
Transfers
|
—
|
|
—
|
|
—
|
|
230
|
|
||||||
|
Effects of currency translation
|
—
|
|
—
|
|
(681
|
)
|
(5,985
|
)
|
||||||
|
Benefits paid
|
(7,614
|
)
|
(6,759
|
)
|
(2,820
|
)
|
(3,250
|
)
|
||||||
|
Benefit obligation, ending
|
$
|
99,632
|
|
$
|
107,423
|
|
$
|
63,570
|
|
$
|
69,939
|
|
||
|
Change in Plan Assets
|
||||||||||||||
|
Fair value of plan assets, beginning
|
$
|
44,921
|
|
$
|
44,597
|
|
$
|
53,709
|
|
$
|
52,133
|
|
||
|
Actual return on plan assets
|
(471
|
)
|
1,832
|
|
(289
|
)
|
5,137
|
|
||||||
|
Employer contributions
|
4,146
|
|
5,768
|
|
3,211
|
|
3,686
|
|
||||||
|
Plan settlements
|
—
|
|
(517
|
)
|
—
|
|
(208
|
)
|
||||||
|
Effects of currency translation
|
—
|
|
—
|
|
(1,037
|
)
|
(3,789
|
)
|
||||||
|
Benefits paid
|
(7,614
|
)
|
(6,759
|
)
|
(2,820
|
)
|
(3,250
|
)
|
||||||
|
Fair value of plan assets, ending
|
$
|
40,982
|
|
$
|
44,921
|
|
$
|
52,774
|
|
$
|
53,709
|
|
||
|
Net amount recognized
|
$
|
(58,650
|
)
|
$
|
(62,502
|
)
|
$
|
(10,796
|
)
|
$
|
(16,230
|
)
|
||
|
U.S. Plans
|
Non-U.S. Plans
|
|||||||||||||
|
March 31,
|
March 31,
|
|||||||||||||
|
2016
|
2015
|
2016
|
2015
|
|||||||||||
|
Amounts Recognized in the Consolidated Balance Sheets Consist of:
|
||||||||||||||
|
Noncurrent benefit asset recorded in Other Noncurrent Assets
|
$
|
—
|
|
$
|
—
|
|
$
|
2,450
|
|
$
|
175
|
|
||
|
Accrued current benefit liability recorded in Accrued Expenses and Other Current Liabilities
|
(2,967
|
)
|
(2,975
|
)
|
(1,166
|
)
|
(1,173
|
)
|
||||||
|
Accrued noncurrent benefit liability recorded in Pension, Postretirement and Other Long-Term Liabilities
|
(55,683
|
)
|
(59,527
|
)
|
(12,080
|
)
|
(15,232
|
)
|
||||||
|
Net amount recognized
|
$
|
(58,650
|
)
|
$
|
(62,502
|
)
|
$
|
(10,796
|
)
|
$
|
(16,230
|
)
|
||
- 69
-
ITEM 8.
FINANCIAL STATEMENTS AND SUPPLEMENTARY DATA
(continued)
NOTES TO CONSOLIDATED FINANCIAL STATEMENTS
(continued)
Alliance One International, Inc. and Subsidiaries
(in thousands)
Note 13
- Employee Benefits
(continued)
Retirement Benefits
(continued)
The pension obligations for all defined benefit pension plans:
|
U.S. Plans
|
Non-U.S. Plans
|
|||||||||||||
|
March 31,
|
March 31,
|
|||||||||||||
|
2016
|
2015
|
2016
|
2015
|
|||||||||||
|
Information for Pension Plans with Accumulated Benefit
|
||||||||||||||
|
Obligation in Excess of Plan Assets:
|
||||||||||||||
|
Projected benefit obligation
|
$
|
99,632
|
|
$
|
107,423
|
|
$
|
32,683
|
|
$
|
36,951
|
|
||
|
Accumulated benefit obligation
|
99,632
|
|
104,652
|
|
32,068
|
|
36,033
|
|
||||||
|
Fair value of plan assets
|
40,982
|
|
44,921
|
|
19,437
|
|
20,546
|
|
||||||
Net periodic pension costs included the following components:
|
U.S. Plans
|
Non-U.S. Plans
|
||||||||||||||||||
|
March 31,
|
March 31,
|
||||||||||||||||||
|
2016
|
2015
|
2014
|
2016
|
2015
|
2014
|
||||||||||||||
|
Service cost
|
$
|
1,434
|
|
$
|
1,856
|
|
$
|
1,839
|
|
$
|
271
|
|
$
|
173
|
|
$
|
282
|
|
|
|
Interest cost
|
3,640
|
|
3,969
|
|
3,956
|
|
2,146
|
|
2,711
|
|
2,820
|
|
|||||||
|
Expected return on plan assets
|
(3,070
|
)
|
(3,131
|
)
|
(3,078
|
)
|
(3,110
|
)
|
(3,477
|
)
|
(3,112
|
)
|
|||||||
|
Amortization of actuarial losses
|
1,809
|
|
1,440
|
|
1,808
|
|
1,388
|
|
740
|
|
1,262
|
|
|||||||
|
Amortization of prior service cost
|
136
|
|
192
|
|
195
|
|
1
|
|
1
|
|
5
|
|
|||||||
|
Curtailment loss
|
1,062
|
|
—
|
|
—
|
|
—
|
|
—
|
|
70
|
|
|||||||
|
Special termination benefits
|
—
|
|
—
|
|
—
|
|
—
|
|
72
|
|
1,226
|
|
|||||||
|
Effects of settlement
|
—
|
|
35
|
|
1,049
|
|
—
|
|
(13
|
)
|
—
|
|
|||||||
|
Net periodic pension cost
|
$
|
5,011
|
|
$
|
4,361
|
|
$
|
5,769
|
|
$
|
696
|
|
$
|
207
|
|
$
|
2,553
|
|
|
The amounts showing in accumulated other comprehensive income at
March 31, 2016
,
March 31, 2015
and movements for the year were as follows:
|
U.S. and Non-U.S.
Pension |
U.S. and Non-U.S.
Post-retirement |
Total
|
||||||||||
|
Prior service credit (cost)
|
$
|
(1,946
|
)
|
$
|
177
|
|
$
|
(1,769
|
)
|
|||
|
Net actuarial losses
|
(56,806
|
)
|
(4,803
|
)
|
(61,609
|
)
|
||||||
|
Deferred taxes
|
11,770
|
|
(624
|
)
|
11,146
|
|
||||||
|
Balance at March 31, 2015
|
$
|
(46,982
|
)
|
$
|
(5,250
|
)
|
$
|
(52,232
|
)
|
|||
|
Prior service credit (cost)
|
$
|
1,430
|
|
$
|
3,556
|
|
$
|
4,986
|
|
|||
|
Net actuarial gains
|
6,987
|
|
785
|
|
7,772
|
|
||||||
|
Deferred taxes
|
(423
|
)
|
95
|
|
(328
|
)
|
||||||
|
Total change for 2016
|
$
|
7,994
|
|
$
|
4,436
|
|
$
|
12,430
|
|
|||
|
Prior service credit (cost)
|
$
|
(516
|
)
|
$
|
3,733
|
|
$
|
3,217
|
|
|||
|
Net actuarial losses
|
(49,819
|
)
|
(4,018
|
)
|
(53,837
|
)
|
||||||
|
Deferred taxes
|
11,347
|
|
(529
|
)
|
10,818
|
|
||||||
|
Balance at March 31, 2016
|
$
|
(38,988
|
)
|
$
|
(814
|
)
|
$
|
(39,802
|
)
|
|||
- 70
-
ITEM 8.
FINANCIAL STATEMENTS AND SUPPLEMENTARY DATA
(continued)
NOTES TO CONSOLIDATED FINANCIAL STATEMENTS
(continued)
Alliance One International, Inc. and Subsidiaries
(in thousands)
Note 13
- Employee Benefits
(continued)
Retirement Benefits
(continued)
The following weighted average assumptions were used to determine the expense for the pension, postretirement, other postemployment, and employee savings plans as follows:
|
U.S. Plans
|
Non-U.S. Plans
|
||||||
|
March 31,
|
March 31,
|
||||||
|
2016
|
2015
|
2014
|
2016
|
2015
|
2014
|
||
|
Discount rate
|
3.60%
|
4.20%
|
3.86%
|
3.13%
|
4.30%
|
4.31%
|
|
|
Rate of increase in future compensation
|
4.50%
|
4.50%
|
4.00%
|
3.56%
|
3.94%
|
4.36%
|
|
|
Expected long-term rate of return on
plan assets |
7.25%
|
7.25%
|
7.25%
|
5.73%
|
6.83%
|
6.56%
|
|
In order to project the long-term investment return for the total portfolio, estimates are prepared for the total return of each major asset class over the subsequent
10
-year period, or longer. Those estimates are based on a combination of factors including the current market interest rates and valuation levels, consensus earnings expectations and historical long-term risk premiums. To determine the aggregate return for the pension trust, the projected return of each individual asset class is then weighted according to the allocation to that investment area in the trust’s long-term asset allocation policy.
A
March 31
measurement date is used for the pension, postretirement, other postemployment and employee savings plans. The expected long-term rate of return on assets was determined based upon historical investment performance, current asset allocation, and estimates of future investment performance by asset class.
The following assumptions were used to determine the benefit obligations disclosed for the pension plans at
March 31, 2016
and 2015:
|
U.S. Plans
|
Non-U.S. Plans
|
||||
|
March 31,
|
March 31,
|
||||
|
2016
|
2015
|
2016
|
2015
|
||
|
Discount rate
|
3.86%
|
3.60%
|
3.38%
|
3.13%
|
|
|
Rate of increase in future compensation
|
Not applicable
|
4.50%
|
3.47%
|
3.56%
|
|
Net gain (loss) and prior service credits (costs) for the combined U.S. and non-U.S. pension plans expected to be amortized from accumulated comprehensive income into net periodic benefit cost during fiscal 2017 is
$(1,187)
and
$(948)
, respectively.
Plan Assets
The Company’s asset allocations and the percentage of the fair value of plan assets at
March 31, 2016
and 2015 by asset category are as follows:
|
Target Allocations
|
U.S. Plans
|
Non-U.S. Plans
|
||||||||||
|
March 31, 2016
|
March 31,
|
March 31,
|
||||||||||
|
(percentages)
|
2016
|
2015
|
2016
|
2015
|
||||||||
|
Asset Category:
|
||||||||||||
|
Cash and cash equivalents
|
—
|
%
|
3.2
|
%
|
2.1
|
%
|
1.5
|
%
|
1.4
|
%
|
||
|
Equity securities
|
36.0
|
%
|
34.6
|
%
|
35.9
|
%
|
58.8
|
%
|
60.5
|
%
|
||
|
Debt securities
|
24.0
|
%
|
22.8
|
%
|
23.2
|
%
|
34.2
|
%
|
32.5
|
%
|
||
|
Real estate and other investments
|
40.0
|
%
|
39.4
|
%
|
38.8
|
%
|
5.5
|
%
|
5.6
|
%
|
||
|
Total
|
100.0
|
%
|
100.0
|
%
|
100.0
|
%
|
100.0
|
%
|
100.0
|
%
|
||
- 71
-
ITEM 8.
FINANCIAL STATEMENTS AND SUPPLEMENTARY DATA
(continued)
NOTES TO CONSOLIDATED FINANCIAL STATEMENTS
(continued)
Alliance One International, Inc. and Subsidiaries
(in thousands)
Note 13
- Employee Benefits
(continued)
Plan Assets
(continued)
The Company's investment objectives are to generate consistent total investment return to pay anticipated plan benefits, while minimizing long-term costs. Financial objectives underlying this policy include maintaining plan contributions at a reasonable level relative to benefits provided and assuring that unfunded obligations do not grow to a level that would adversely affect the Company's financial health. Manager performance is measured against investment objectives and objective benchmarks, including: Citibank 90 Day Treasury Bill, Barclays Intermediate Govt. Credit, Barclays Aggregate Index, Russell 1000 Value, Russell 1000 Growth, Russell 2500 Value, Russell 2500 Growth, and MSCI EAFE. The Portfolio Objective is to exceed the actuarial return on assets assumption. Management regularly reviews portfolio allocations and periodically rebalances the portfolio to the targeted allocations when considered appropriate. Equity securities do not include the Company's common stock. Our diversification and risk control processes serve to minimize the concentration of risk. There are no significant concentrations of risk, in terms of sector, industry, geography or companies.
The fair values for the pension plans by asset category are as follows:
|
U.S. Pension Plans
|
March 31, 2016
|
||||||||||||||
|
Total
|
Level 1
|
Level 2
|
Level 3
|
||||||||||||
|
Cash and cash equivalents
|
$
|
1,326
|
|
$
|
815
|
|
$
|
511
|
|
$
|
—
|
|
|||
|
U.S. equities / equity funds
|
8,712
|
|
8,712
|
|
—
|
|
—
|
|
|||||||
|
International equities / equity funds
|
5,466
|
|
5,466
|
|
—
|
|
—
|
|
|||||||
|
U.S. fixed income funds
|
8,178
|
|
8,178
|
|
—
|
|
—
|
|
|||||||
|
International fixed income funds
|
1,169
|
|
1,169
|
|
—
|
|
—
|
|
|||||||
|
Other investments:
|
|||||||||||||||
|
Diversified funds
|
11,791
|
|
11,741
|
|
—
|
|
50
|
|
|||||||
|
Real estate and other
|
4,352
|
|
—
|
|
—
|
|
4,352
|
|
|||||||
|
Total
|
$
|
40,994
|
|
$
|
36,081
|
|
$
|
511
|
|
$
|
4,402
|
|
|||
|
U.S. Pension Plans
|
March 31, 2015
|
||||||||||||||
|
Total
|
Level 1
|
Level 2
|
Level 3
|
||||||||||||
|
Cash and cash equivalents
|
$
|
965
|
|
$
|
434
|
|
$
|
531
|
|
$
|
—
|
|
|||
|
U.S. equities / equity funds
|
8,302
|
|
8,302
|
|
—
|
|
—
|
|
|||||||
|
International equities / equity funds
|
7,769
|
|
7,769
|
|
—
|
|
—
|
|
|||||||
|
U.S. fixed income funds
|
8,870
|
|
8,870
|
|
—
|
|
—
|
|
|||||||
|
International fixed income funds
|
1,564
|
|
1,564
|
|
—
|
|
—
|
|
|||||||
|
Other investments:
|
|||||||||||||||
|
Diversified funds
|
12,994
|
|
12,918
|
|
—
|
|
76
|
|
|||||||
|
Real estate
|
4,457
|
|
—
|
|
—
|
|
4,457
|
|
|||||||
|
Total
|
$
|
44,921
|
|
$
|
39,857
|
|
$
|
531
|
|
$
|
4,533
|
|
|||
- 72
-
ITEM 8.
FINANCIAL STATEMENTS AND SUPPLEMENTARY DATA
(continued)
NOTES TO CONSOLIDATED FINANCIAL STATEMENTS
(continued)
Alliance One International, Inc. and Subsidiaries
(in thousands)
Note 13
- Employee Benefits
(continued)
Plan Assets
(continued)
|
Non-U.S. Pension Plans
|
March 31, 2016
|
||||||||||||||
|
Total
|
Level 1
|
Level 2
|
Level 3
|
||||||||||||
|
Cash and cash equivalents
|
$
|
776
|
|
$
|
776
|
|
$
|
—
|
|
$
|
—
|
|
|||
|
U.S. equities / equity funds
|
7,340
|
|
7,340
|
|
—
|
|
—
|
|
|||||||
|
International equities / equity funds
|
13,615
|
|
4,335
|
|
9,280
|
|
—
|
|
|||||||
|
Global equity funds
|
10,083
|
|
—
|
|
10,083
|
|
—
|
|
|||||||
|
U.S. fixed income funds
|
2,829
|
|
2,829
|
|
—
|
|
—
|
|
|||||||
|
International fixed income funds
|
8,415
|
|
—
|
|
8,415
|
|
—
|
|
|||||||
|
Global fixed income funds
|
6,813
|
|
1,384
|
|
5,429
|
|
—
|
|
|||||||
|
Other investments:
|
|||||||||||||||
|
Diversified funds
|
1,685
|
|
1,685
|
|
—
|
|
—
|
|
|||||||
|
Real estate
|
1,268
|
|
1,268
|
|
—
|
|
—
|
|
|||||||
|
Total
|
$
|
52,824
|
|
$
|
19,617
|
|
$
|
33,207
|
|
$
|
—
|
|
|||
|
Non-U.S. Pension Plans
|
March 31, 2015
|
||||||||||||||
|
Total
|
Level 1
|
Level 2
|
Level 3
|
||||||||||||
|
Cash and cash equivalents
|
$
|
770
|
|
$
|
770
|
|
$
|
—
|
|
$
|
—
|
|
|||
|
U.S. equities / equity funds
|
7,862
|
|
7,862
|
|
—
|
|
—
|
|
|||||||
|
International equities / equity funds
|
14,191
|
|
4,797
|
|
9,394
|
|
—
|
|
|||||||
|
Global equity funds
|
10,372
|
|
—
|
|
10,372
|
|
—
|
|
|||||||
|
US fixed income funds
|
2,849
|
|
2,849
|
|
—
|
|
—
|
|
|||||||
|
International fixed income funds
|
8,507
|
|
—
|
|
8,507
|
|
—
|
|
|||||||
|
Global fixed income funds
|
6,135
|
|
1,295
|
|
4,840
|
|
—
|
|
|||||||
|
Other investments:
|
|||||||||||||||
|
Diversified funds
|
1,844
|
|
1,844
|
|
—
|
|
—
|
|
|||||||
|
Real estate
|
1,179
|
|
1,179
|
|
—
|
|
—
|
|
|||||||
|
Total
|
$
|
53,709
|
|
$
|
20,596
|
|
$
|
33,113
|
|
$
|
—
|
|
|||
The fair value hierarchy is described in Note 18 “Fair Value Measurements” to the “Notes to Consolidated Financial Statements."
A reconciliation of the beginning and ending balance of U.S. pension plan assets that are measured at fair value using significant unobservable inputs (Level 3) as of
March 31, 2016
is as follows:
|
U.S. Pension Plans
|
||||||||||||
|
Diversified funds
|
Real
estate |
Total
Level 3 Plan assets |
||||||||||
|
Fair value, March 31, 2014
|
$
|
99
|
|
$
|
4,020
|
|
$
|
4,119
|
|
|||
|
Total gains
|
5
|
|
437
|
|
442
|
|
||||||
|
Purchases, sales and settlements
|
(28
|
)
|
—
|
|
(28
|
)
|
||||||
|
Fair value, March 31, 2015
|
76
|
|
4,457
|
|
4,533
|
|
||||||
|
Total gains (losses)
|
(10
|
)
|
420
|
|
410
|
|
||||||
|
Purchases, sales and settlements
|
(16
|
)
|
(525
|
)
|
(541
|
)
|
||||||
|
Fair value, March 31, 2016
|
$
|
50
|
|
$
|
4,352
|
|
$
|
4,402
|
|
|||
For all periods presented, the Company had no Non-U.S. pension plan assets measured at fair value using significant unobservable inputs (Level 3). Plan assets are recognized and measured at fair value in accordance with the accounting standards regarding fair value measurements. The following are general descriptions of asset categories, as well as the valuation methodologies and inputs used to determine the fair value of each major category of plan assets.
- 73
-
ITEM 8.
FINANCIAL STATEMENTS AND SUPPLEMENTARY DATA
(continued)
NOTES TO CONSOLIDATED FINANCIAL STATEMENTS
(continued)
Alliance One International, Inc. and Subsidiaries
(in thousands)
Note 13
- Employee Benefits
(continued)
Plan Assets
(continued)
Cash and cash equivalents include short-term investment funds, primarily in diversified portfolios of investment grade money market instruments and are valued using quoted market prices or other valuation methods, and thus classified within Level 1 or Level 2 of the fair value hierarchy.
Equity securities are investments in common stock of domestic and international corporations in a variety of industry sectors, and are valued primarily using quoted market prices and generally classified within Level 1 in the fair value hierarchy.
Fixed income securities include U.S. Treasuries and agencies, debt obligations of foreign governments and debt obligations in corporations of domestic and foreign issuers. The fair value of fixed income securities are based on observable prices for identical or comparable assets, adjusted using benchmark curves, sector grouping, matrix pricing, broker/dealer quotes and issuer spreads, and are generally classified within Level 1 or Level 2 in the fair value hierarchy.
Investments in equity and fixed income mutual funds are publicly traded and valued primarily using quoted market prices and generally classified within Level 1 in the fair value hierarchy. Investments in commingled funds used in certain non-U.S. pension plans are not publicly traded, but the underlying assets held in these funds are traded in active markets and the prices for these assets are readily observable. Holdings in these commingled funds are generally classified as Level 2 investments.
Real estate investments include those in private limited partnerships that invest in various commercial and residential real estate projects both domestically and internationally as well as publicly traded REIT securities. The fair values of private real estate assets are typically determined by using income and/or cost approaches or comparable sales approach, taking into consideration discount and capitalization rates, financial conditions, local market conditions and the status of the capital markets, and thus are generally classified within Level 3 in the fair value hierarchy. Publicly traded REIT securities are valued primarily using quoted market prices and are generally classified within Level 1 in the fair value hierarchy.
Diversified investments include those in limited partnerships that invest in companies that are not publicly traded on a stock exchange and mutual funds with an absolute return strategy. Limited partnership investment strategies in non-publicly traded companies include leveraged buyouts, venture capital, distressed investments and investments in natural resources. These investments are valued using inputs such as trading multiples of comparable public securities, merger and acquisition activity and pricing data from the most recent equity financing taking into consideration illiquidity, and thus are classified within Level 3 in the fair value hierarchy. Mutual fund investments with absolute return strategies are publicly traded and valued using quoted market prices and are generally classified within Level 1 in the fair value hierarchy.
Cash Flows
Contributions
The Company expects to contribute
$2,967
to its U.S. benefits plans and
$3,493
to its non-U.S. benefit plans in fiscal 2017.
Estimated Future Benefit Payments
The following benefit payments, which reflect expected future service, as appropriate, are expected to be paid:
|
Pension Benefits
|
Other Benefits
|
||||||||||||||
|
U.S. Plans
|
Non-U.S. Plans
|
U.S. Plans
|
Non-U.S. Plans
|
||||||||||||
|
March 31, 2016
|
March 31, 2016
|
March 31, 2016
|
March 31, 2016
|
||||||||||||
|
2017
|
$
|
9,384
|
|
$
|
3,075
|
|
$
|
278
|
|
$
|
96
|
|
|||
|
2018
|
7,338
|
|
2,768
|
|
267
|
|
100
|
|
|||||||
|
2019
|
7,110
|
|
3,096
|
|
268
|
|
105
|
|
|||||||
|
2020
|
7,359
|
|
2,875
|
|
269
|
|
116
|
|
|||||||
|
2021
|
7,064
|
|
3,344
|
|
270
|
|
121
|
|
|||||||
|
Years 2022-2026
|
33,775
|
|
16,827
|
|
1,279
|
|
700
|
|
|||||||
The Company sponsors 401-k savings plans for most of its salaried employees located in the United States. The Supplemental Executive Retirement Plan and the Pension Equity Plan were replaced by the SRAP during 2008. The Company also maintains defined contribution plans at various foreign locations. The Company’s contributions to the defined contribution plans were
$3,978
in 2016,
$4,009
in 2015 and
$4,435
in 2014.
- 74
-
ITEM 8.
FINANCIAL STATEMENTS AND SUPPLEMENTARY DATA
(continued)
NOTES TO CONSOLIDATED FINANCIAL STATEMENTS
(continued)
Alliance One International, Inc. and Subsidiaries
(in thousands)
Note 13
- Employee Benefits
(continued)
Postretirement Health and Life Insurance Benefits
The Company provides certain health and life insurance benefits to retired U.S. employees (and their eligible dependents) who meet specified age and service requirements. The plan excludes new employees after September 2005 and caps the Company’s annual cost commitment to postretirement benefits for retirees. The Company retains the right, subject to existing agreements, to modify or eliminate these postretirement health and life insurance benefits in the future.
The Company provides certain health and life insurance benefits to retired Brazilian directors and certain retirees located in Europe including their eligible dependents who meet specified requirements.
During the three months ended September 30, 2015, the Company announced that certain U.S. postretirement medical benefits would no longer be provided effective January 1, 2016. This change is accounted for as a negative plan amendment and resulted in a reduction of
$4,461
in the benefit obligation and in accumulated other comprehensive income as of September 30, 2015. The Company retains the right, subject to existing agreements, to modify or eliminate the postretirement medical benefits.
The following assumptions were used to determine non-U.S. Plan postretirement benefit obligations at
March 31
:
|
2016
|
2015
|
|||
|
Discount rate
|
11.33
|
%
|
10.54
|
%
|
|
Health care cost trend rate assumed for next year
|
8.00
|
%
|
7.87
|
%
|
|
Ultimate trend rate
|
8.00
|
%
|
7.87
|
%
|
A
one-percentage-point
change in assumed health care cost trend rates would not have a significant effect on the amounts reported for health care plans.
For
2016
and
2015
, the annual rate of increase in the per capita cost of covered health care benefits is not applicable as the Company’s annual cost commitment to the benefits is capped and not adjusted for future medical inflation.
Additional retiree medical benefits are provided to certain U.S. individuals in accordance with their employment contracts. For
2016
the additional cost related to these contracts was $
34
.
Prior service credits of
$709
and unrecognized net actuarial losses of
$417
are expected to be amortized from accumulated comprehensive income into postretirement healthcare benefits net periodic benefit cost for the combined U.S. and non-U.S. postretirement benefits during fiscal 2017.
- 75
-
ITEM 8.
FINANCIAL STATEMENTS AND SUPPLEMENTARY DATA
(continued)
NOTES TO CONSOLIDATED FINANCIAL STATEMENTS
(continued)
Alliance One International, Inc. and Subsidiaries
(in thousands)
Note 13
- Employee Benefits
(continued)
Postretirement Health and Life Insurance Benefits
(continued)
A reconciliation of benefit obligations, plan assets and funded status of the plans is as follows:
|
U.S. Plans
|
Non-U.S. Plans
|
|||||||||||||||
|
March 31, 2016
|
March 31, 2015
|
March 31, 2016
|
March 31, 2015
|
|||||||||||||
|
Change in Benefit Obligation
|
||||||||||||||||
|
Benefit obligation, beginning
|
$
|
8,841
|
|
$
|
8,727
|
|
$
|
1,243
|
|
$
|
1,636
|
|
||||
|
Service cost
|
23
|
|
39
|
|
3
|
|
3
|
|
||||||||
|
Interest cost
|
247
|
|
361
|
|
113
|
|
154
|
|
||||||||
|
Effect of currency translation
|
—
|
|
—
|
|
(107
|
)
|
(446
|
)
|
||||||||
|
Plan amendments
|
(3,933
|
)
|
—
|
|
—
|
|
—
|
|
||||||||
|
Actuarial losses (gains)
|
(450
|
)
|
370
|
|
93
|
|
(6
|
)
|
||||||||
|
Benefits paid
|
(511
|
)
|
(656
|
)
|
(116
|
)
|
(98
|
)
|
||||||||
|
Benefit obligation, ending
|
$
|
4,217
|
|
$
|
8,841
|
|
$
|
1,229
|
|
$
|
1,243
|
|
||||
|
Change in Plan Assets
|
||||||||||||||||
|
Fair value of plan assets, beginning
|
$
|
—
|
|
$
|
—
|
|
$
|
—
|
|
$
|
—
|
|
||||
|
Employer contributions
|
511
|
|
656
|
|
116
|
|
98
|
|
||||||||
|
Benefits paid
|
(511
|
)
|
(656
|
)
|
(116
|
)
|
(98
|
)
|
||||||||
|
Fair value of plan assets, ending
|
$
|
—
|
|
$
|
—
|
|
$
|
—
|
|
$
|
—
|
|
||||
|
Net amount recognized
|
$
|
(4,217
|
)
|
$
|
(8,841
|
)
|
$
|
(1,229
|
)
|
$
|
(1,243
|
)
|
||||
|
U.S. Plans
|
Non-U.S. Plans
|
|||||||||||||||
|
March 31,
|
March 31,
|
|||||||||||||||
|
2016
|
2015
|
2016
|
2015
|
|||||||||||||
|
Amounts Recognized in the Consolidated
Balance Sheets Consist of: |
||||||||||||||||
|
Accrued current benefit liability recorded in Accrued Expenses and Other Current Liabilities
|
$
|
(278
|
)
|
$
|
(637
|
)
|
$
|
(96
|
)
|
$
|
(93
|
)
|
||||
|
Accrued non-current benefit liability recorded in Pension, Postretirement and Other Long-Term Liabilities
|
(3,939
|
)
|
(8,204
|
)
|
(1,133
|
)
|
(1,150
|
)
|
||||||||
|
Net amount recognized
|
$
|
(4,217
|
)
|
$
|
(8,841
|
)
|
$
|
(1,229
|
)
|
$
|
(1,243
|
)
|
||||
There are no plan assets for
2016
or
2015
. Net periodic benefit costs included the following components:
|
U.S. Plans
|
Non-U.S. Plans
|
||||||||||||||||||
|
March 31,
|
March 31,
|
||||||||||||||||||
|
2016
|
2015
|
2014
|
2016
|
2015
|
2014
|
||||||||||||||
|
Service cost
|
$
|
23
|
|
$
|
39
|
|
$
|
60
|
|
$
|
3
|
|
$
|
3
|
|
$
|
6
|
|
|
|
Interest cost
|
247
|
|
361
|
|
375
|
|
113
|
|
154
|
|
173
|
|
|||||||
|
Prior service credit
|
(349
|
)
|
(1,196
|
)
|
(1,622
|
)
|
(10
|
)
|
(14
|
)
|
(16
|
)
|
|||||||
|
Actuarial losses (gains)
|
432
|
|
450
|
|
474
|
|
(2
|
)
|
(5
|
)
|
15
|
|
|||||||
|
Net periodic benefit costs (income)
|
$
|
353
|
|
$
|
(346
|
)
|
$
|
(713
|
)
|
$
|
104
|
|
$
|
138
|
|
$
|
178
|
|
|
The Company continues to evaluate ways to better manage these benefits and control their costs. Any changes in the plan or revisions to assumptions that affect the amount of expected future benefits may have a significant effect on the amount of the reported obligation and annual expense. The Company expects to contribute
$374
to its combined U.S. and non-U.S. postretirement benefit plans in fiscal 2017.
Employees in operations located in certain other foreign operations are covered by various postretirement benefit arrangements. For these foreign plans, the cost of benefits charged to income was not material in
2016
,
2015
and
2014
.
- 76
-
ITEM 8.
FINANCIAL STATEMENTS AND SUPPLEMENTARY DATA
(continued)
NOTES TO CONSOLIDATED FINANCIAL STATEMENTS
(continued)
Alliance One International, Inc. and Subsidiaries
(in thousands)
Note 14
– Segment Information
The Company purchases, processes, sells, and stores leaf tobacco. Tobacco is purchased in more than
35
countries and shipped to approximately
90
countries. The sales, logistics and billing functions of the Company are primarily concentrated in service centers outside of the producing areas to facilitate access to our major customers. Within certain quality and grade constraints, tobacco is fungible and, subject to these constraints, customers may choose to fulfill their needs from any of the areas where the Company purchases tobacco.
Management evaluates performance using information included in management reports. The Company has
five
geographic operating segments: Africa, Asia, Europe, North America and South America. Beginning April 1, 2015, the Company's management ceased evaluating performance of value added services as a separate operating segment. The Company's cut rag and other specialty products and services are now combined within the geographic operating segments in which they operate. In reviewing these operations, the Company concluded that the economic characteristics of North America were dissimilar from the other operating segments. Based on this fact, the Company is disclosing North America separately and has aggregated the remaining
four
operating segments, Africa, Asia, Europe and South America into
one
reportable segment "Other Regions." The Company concluded that these operating segments have similar long term financial performance and similar economic characteristics in each of the following areas:
|
a.
|
the nature of the products and services;
|
|
b.
|
the nature of the production processes;
|
|
c.
|
the type or class of customer for their products and services;
|
|
d.
|
the methods used to distribute their products or provide their services; and
|
|
e.
|
the nature of the regulatory environment.
|
Selling, logistics, billing, and administrative overhead, including depreciation, which originates primarily from the Company’s corporate and sales offices, are allocated to the segments based upon segment operating income. The Company reviews performance data from purchase through sale based on the source of the product and all intercompany transactions are allocated to the region that either purchases or processes the tobacco.
|
Years Ended March 31,
|
||||||||||
|
Analysis of Segment Operations
|
2016
|
2015
|
2014
|
|||||||
|
Sales and other operating revenues:
|
||||||||||
|
North America
|
$
|
468,098
|
|
$
|
440,985
|
|
$
|
498,365
|
|
|
|
Other Regions
|
1,436,494
|
|
1,625,880
|
|
1,856,171
|
|
||||
|
Total revenue
|
$
|
1,904,592
|
|
$
|
2,066,865
|
|
$
|
2,354,536
|
|
|
|
Operating income:
|
||||||||||
|
North America
|
$
|
25,230
|
|
$
|
40,437
|
|
$
|
31,685
|
|
|
|
Other Regions
|
176,557
|
|
56,858
|
|
73,828
|
|
||||
|
Total operating income
|
201,787
|
|
97,295
|
|
105,513
|
|
||||
|
Debt retirement expense
|
—
|
|
(771
|
)
|
57,449
|
|
||||
|
Interest expense
|
117,190
|
|
113,273
|
|
116,827
|
|
||||
|
Interest income
|
7,077
|
|
6,268
|
|
7,068
|
|
||||
|
Income (loss) before income taxes and other items
|
$
|
91,674
|
|
$
|
(8,939
|
)
|
$
|
(61,695
|
)
|
|
- 77
-
ITEM 8.
FINANCIAL STATEMENTS AND SUPPLEMENTARY DATA
(continued)
NOTES TO CONSOLIDATED FINANCIAL STATEMENTS
(continued)
Alliance One International, Inc. and Subsidiaries
(in thousands)
Note 14
- Segment Information
(continued)
|
Years Ended March 31,
|
||||||||||
|
Analysis of Segment Assets
|
2016
|
2015
|
2014
|
|||||||
|
Segment assets:
|
||||||||||
|
North America
|
$
|
340,534
|
|
$
|
230,833
|
|
$
|
227,131
|
|
|
|
Other Regions
|
1,637,539
|
|
1,403,373
|
|
1,531,217
|
|
||||
|
Total assets
|
$
|
1,978,073
|
|
$
|
1,634,206
|
|
$
|
1,758,348
|
|
|
|
Trade and other receivables, net
|
||||||||||
|
North America
|
$
|
48,229
|
|
$
|
26,781
|
|
$
|
26,551
|
|
|
|
Other Regions
|
352,779
|
|
212,722
|
|
192,934
|
|
||||
|
Total trade and other receivables, net
|
$
|
401,008
|
|
$
|
239,503
|
|
$
|
219,485
|
|
|
|
Goodwill:
|
||||||||||
|
North America
|
2,794
|
|
2,794
|
|
2,794
|
|
||||
|
Other Regions
|
13,669
|
|
—
|
|
—
|
|
||||
|
Total Goodwill
|
$
|
16,463
|
|
$
|
2,794
|
|
$
|
2,794
|
|
|
|
Equity in net assets of investee companies:
|
||||||||||
|
North America
|
$
|
—
|
|
$
|
—
|
|
$
|
—
|
|
|
|
Other Regions
|
57,243
|
|
53,678
|
|
50,390
|
|
||||
|
Total equity in net assets of investee companies
|
$
|
57,243
|
|
$
|
53,678
|
|
$
|
50,390
|
|
|
|
Depreciation and amortization:
|
||||||||||
|
North America
|
$
|
6,432
|
|
$
|
5,618
|
|
$
|
5,899
|
|
|
|
Other Regions
|
21,929
|
|
24,005
|
|
26,528
|
|
||||
|
Total depreciation and amortization
|
$
|
28,361
|
|
$
|
29,623
|
|
$
|
32,427
|
|
|
|
Capital expenditures:
|
||||||||||
|
North America
|
$
|
7,516
|
|
$
|
10,044
|
|
$
|
13,802
|
|
|
|
Other Regions
|
10,270
|
|
12,629
|
|
13,953
|
|
||||
|
Total capital expenditures
|
$
|
17,786
|
|
$
|
22,673
|
|
$
|
27,755
|
|
|
Geographic information as to sales and other operating revenues is based on the destination of the product shipped. The Belgium destination represents a customer owned storage and distribution center from which the tobacco will be shipped on to manufacturing facilities.
|
Years Ended March 31,
|
||||||||||
|
Sales by Destination
|
2016
|
2015
|
2014
|
|||||||
|
Sales and Other Operating Revenues:
|
||||||||||
|
United States
|
$
|
311,634
|
|
$
|
363,964
|
|
$
|
467,111
|
|
|
|
China
|
209,781
|
|
254,658
|
|
401,480
|
|
||||
|
Belgium
|
132,817
|
|
137,513
|
|
125,377
|
|
||||
|
Russia
|
116,941
|
|
118,233
|
|
125,093
|
|
||||
|
Germany
|
110,318
|
|
116,713
|
|
130,163
|
|
||||
|
Indonesia
|
82,867
|
|
58,609
|
|
58,919
|
|
||||
|
Other
|
940,234
|
|
1,017,175
|
|
1,046,393
|
|
||||
|
$
|
1,904,592
|
|
$
|
2,066,865
|
|
$
|
2,354,536
|
|
||
Sales and Other Operating Revenues to Major Customers
Including their respective affiliates, accounting for more than
10
% of total sales and other operating revenues were each of Philip Morris International Inc. and China Tobacco International Inc. for the year ended
March 31, 2016
, 2015 and
2014
.
- 78
-
ITEM 8.
FINANCIAL STATEMENTS AND SUPPLEMENTARY DATA
(continued)
NOTES TO CONSOLIDATED FINANCIAL STATEMENTS
(continued)
Alliance One International, Inc. and Subsidiaries
(in thousands)
Note 14
- Segment Information
(continued)
|
Years Ended March 31,
|
||||||||||
|
Property, Plant and Equipment by Location
|
2016
|
2015
|
2014
|
|||||||
|
Property, Plant and Equipment, Net:
|
||||||||||
|
Brazil
|
$
|
82,307
|
|
$
|
87,161
|
|
$
|
92,142
|
|
|
|
United States
|
59,713
|
|
57,861
|
|
53,517
|
|
||||
|
Zimbabwe
|
51,295
|
|
—
|
|
—
|
|
||||
|
Malawi
|
24,609
|
|
25,704
|
|
27,227
|
|
||||
|
Tanzania
|
22,831
|
|
23,610
|
|
24,979
|
|
||||
|
Argentina
|
6,914
|
|
7,390
|
|
7,325
|
|
||||
|
Europe
|
6,895
|
|
15,191
|
|
19,711
|
|
||||
|
Asia
|
6,447
|
|
6,960
|
|
7,545
|
|
||||
|
Zambia
|
4,366
|
|
6,582
|
|
6,690
|
|
||||
|
Turkey
|
2,955
|
|
3,454
|
|
18,310
|
|
||||
|
Other
|
9,193
|
|
4,001
|
|
3,728
|
|
||||
|
$
|
277,525
|
|
$
|
237,914
|
|
$
|
261,174
|
|
||
Note 15
– Foreign Currency Translation
The financial statements of foreign entities included in the consolidated financial statements have been translated to U.S. dollars in accordance with generally accepted accounting principles.
The financial statements of foreign subsidiaries, for which the local currency is the functional currency, are translated into U.S. dollars using exchange rates in effect at period end for assets and liabilities and average exchange rates during each reporting period for results of operations. Adjustments resulting from translation of financial statements are reflected as a separate component of other comprehensive income.
The financial statements of foreign subsidiaries, for which the U.S. dollar is the functional currency and which have certain transactions denominated in a local currency, are remeasured into U.S. dollars. The remeasurement of local currencies into U.S. dollars creates remeasurement adjustments that are included in net income. Exchange losses in 2016,
2015
and
2014
were
$6,498
,
$8,274
and
$12,348
, respectively, and are included in the respective statements of income in cost of sales and income taxes.
- 79
-
ITEM 8.
FINANCIAL STATEMENTS AND SUPPLEMENTARY DATA
(continued)
NOTES TO CONSOLIDATED FINANCIAL STATEMENTS
(continued)
Alliance One International, Inc. and Subsidiaries
(in thousands)
Note 16
– Contingencies and Other Information
Non-Income Tax
The government in the Brazilian State of Parana (“Parana”) issued a tax assessment on October 26, 2007 with respect to local intrastate trade tax credits that result primarily from tobacco transferred between states within Brazil. The assessment for intrastate trade tax credits taken is
$3,701
and the total assessment including penalties and interest at
March 31, 2016
is
$11,097
. The Company believes it has properly complied with Brazilian law and will contest any assessment through the judicial process. Should the Company lose in the judicial process, the loss of the intrastate trade tax credits would have a material impact on the financial statements of the Company.
The Company also has local intrastate trade tax credits in the Brazil State of Rio Grande do Sul and the State of Santa Catarina. These jurisdictions permit the sale or transfer of excess credits to third parties, however approval must be obtained from the tax authorities. The Company has agreements with the state governments regarding the amounts and timing of credits that can be sold. The tax credits have a carrying value of
$3,696
. The intrastate trade tax credits are monitored for impairment in future periods based on market conditions and the Company’s ability to use or sell the tax credits.
In 1969, the Brazilian government created a tax credit program that allowed companies to earn IPI tax credits (“IPI credits”) based on the value of their exports. The government began to phase out this program in 1979, which resulted in numerous lawsuits between taxpayers and the Brazilian government. The Company has a long legal history with respect to credits it earned while the IPI credit program was in effect. In 2001, the Company won a claim related to certain IPI credits it earned between 1983 and 1990. The Brazilian government appealed this decision and numerous rulings and appeals were rendered on behalf of both the government and the Company from 2001 through 2013. Because of this favorable ruling, the Company began to use these earned IPI credits to offset federal taxes in 2004 and 2005, until it received a Judicial Order to suspend the IPI offsetting in 2005. The value of the federal taxes offset in 2004 and 2005 was
$24,142
and the Company established a reserve on these credits at the time of offsetting as they were not yet realizable due to the legal uncertainty that existed. Specifically, the Company extinguished other federal tax liabilities using IPI credits and recorded a liability in Pension, Postretirement and Other Long-Term Liabilities to reflect that the credits were not realizable at that time due to the prevalent legal uncertainty. On March 7, 2013, the Brazilian Supreme Court rendered a final decision in favor of the Company that recognized the validity of the IPI credits and secured the Company's right to benefit from the IPI credits earned from March 1983 to October 1990. This final decision expressly stated the Company has the right to the IPI credits. The Company estimates the total amount of the IPI credits to be approximately
$94,316
at March 31, 2013. Since the March 2013 ruling definitively (without the government's ability to appeal) granted the Company the ownership of the IPI credits generated between 1983 and 1990, the Company believes the amount of IPI credits that were used to offset other federal taxes in 2004 and 2005 are realizable beyond a reasonable doubt. Accordingly, at March 31, 2013, the Company recorded the
$24,142
IPI credits it realized in the Statements of Consolidated Operations in Other Income. No further benefit has been recognized pending the outcome of the judicial procedure to ascertain the final amount as those amounts have not yet been realized.
Other
Mindo, S.r.l., the purchaser in 2004 of the Company's Italian subsidiary Dimon Italia, S.r.l., asserted claims against a subsidiary of the Company arising out of that sale transaction in an action filed before the Court of Rome on April 12, 2007. The claim involved a guaranty letter issued by a consolidated subsidiary of the Company in connection with the sale transaction, and sought the recovery of €
7,400
plus interest and costs. On November 11, 2013, the court issued its judgment in favor of the Company’s subsidiary, rejecting the claims asserted by Mindo, S.r.l., and awarding the Company’s subsidiary legal costs of €
48
. On December 23, 2014, Mindo, S.r.l. appealed the judgment of the Court of Rome to the Court of Appeal of Rome. A hearing before the Court of Appeal of Rome was held on June 12, 2015, which was adjourned pending a further hearing set for February 2018. The outcome of, and timing of a decision on, the appeal are uncertain.
In addition to the above-mentioned matter, certain of the Company’s subsidiaries are involved in other litigation or legal matters incidental to their business activities, including tax matters. While the outcome of these matters cannot be predicted with certainty, the Company is vigorously defending them and does not currently expect that any of them will have a material adverse effect on its business or financial position. However, should one or more of these matters be resolved in a manner adverse to its current expectation, the effect on the Company’s results of operations for a particular fiscal reporting period could be material.
In accordance with generally accepted accounting principles, the Company records all known asset retirement obligations (“ARO”) for which the liability can be reasonably estimated. Currently, it has identified an ARO associated with one of its facilities that requires it to restore the land to its initial condition upon vacating the facility. The Company has not recognized a liability under generally accepted accounting principles for this ARO because the fair value of restoring the land at this site cannot be reasonably estimated since the settlement date is unknown at this time. The settlement date is unknown because the land restoration is not required until title is returned to the government, and the Company has no current or future plans to return the title. The Company will recognize a liability in the period in which sufficient information is available to reasonably estimate its fair value.
- 80
-
ITEM 8.
FINANCIAL STATEMENTS AND SUPPLEMENTARY DATA
(continued)
NOTES TO CONSOLIDATED FINANCIAL STATEMENTS
(continued)
Alliance One International, Inc. and Subsidiaries
(in thousands)
Note 17
– Sale of Receivables
During the year ended March 31, 2016, the Company sold trade receivables to unaffiliated financial institutions under
three
accounts receivable securitization programs, one of which expired prior to March 31, 2016 and has not been replaced. Under the first program, the Company continuously sells a designated pool of trade receivables to a special purpose entity, which in turn sells
100%
of the receivables to an unaffiliated financial institution. This program allows the Company to receive a cash payment and a deferred purchase price receivable for sold receivables. Following the sale and transfer of the receivables to the special purpose entity, the receivables are isolated from the Company and its affiliates, and upon the sale and transfer of the receivables from the special purpose entity to the unaffiliated financial institutions effective control of the receivables is passed to the unaffiliated financial institution, which has all rights, including the right to pledge or sell the receivables. The investment limit is
$150,000
, which was reduced to
$100,000
on May 26, 2016. The Company incurred program costs of
$1,580
and
$1,642
during the years ending March 31, 2016 and 2015 which were included in Other Income in the Statements of Consolidated Operations. The program requires a minimum level of deferred purchase price to be retained by the Company in connection with the sales. The Company continues to service, administer and collect the receivables on behalf of the special purpose entity and receives a servicing fee of
0.5%
of serviced receivables per annum. As the Company estimates the fee it receives in return for its obligation to service these receivables is at fair value, no servicing assets or liabilities are recognized. Servicing fees recognized were not material and are recorded as a reduction of Selling, General and Administrative Expenses within the Statements of Consolidated Operations.
The agreement for the second securitization program previously executed on September 28, 2011, as amended November 30, 2013, expired December 31, 2014. This securitization program was replaced by a securitization program with the same financial institution executed on March 31, 2015. The agreement for the third securitization program was executed on March 28, 2013, amended and restated March 25, 2014, and ended as of March 26, 2016. These programs also allow the Company to receive a cash payment and a deferred purchase price receivable for sold receivables. These are uncommitted programs, whereby the Company offers receivables for sale to the respective unaffiliated financial institution, which are then subject to acceptance by the unaffiliated financial institution. Following the sale and transfer of the receivables to the unaffiliated financial institution, the receivables are isolated from the Company and its affiliates, and effective control of the receivables is passed to the unaffiliated financial institution, which has all rights, including the right to pledge or sell the receivables. The Company receives no servicing fee from the unaffiliated financial institution and as a result, has established a servicing liability based upon unobservable inputs, primarily discounted cash flow. For the years ended March 31, 2016 and 2015, the expense for the servicing liability was
$87
and
$178
which is included in Other Income in the Statements of Consolidated Operations. The liability is recorded in Accrued Expenses and other Current Liabilities in the Consolidated Balance Sheets. As receivables sold under these facilities were settled in fiscal 2016 and 2015, the servicing liability was reduced by
$218
and
$115
and is included in Selling, General and Administrative Expenses in the Statements of Consolidated Operations. The investment limit under the second agreement is
$35,000
.
Under the programs, all of the receivables sold for cash are removed from the Consolidated Balance Sheets and the net cash proceeds received by the Company are included as cash provided by operating activities in the Statements of Consolidated Cash Flows. A portion of the purchase price for the receivables is paid by the unaffiliated financial institutions in cash and the balance is a deferred purchase price receivable, which is paid as payments on the receivables are collected from account debtors. The deferred purchase price receivable represents a continuing involvement and a beneficial interest in the transferred financial assets and is recognized at fair value as part of the sale transaction. The deferred purchase price receivables are included in Trade and Other Receivables, Net in the Consolidated Balance Sheets and are valued using unobservable inputs (i.e., level three inputs), primarily discounted cash flow. As servicer of these facilities, the Company may receive funds that are due to the unaffiliated financial institutions which are net settled on the next settlement date. As of March 31, 2016 and 2015, Trade and Other Receivables, Net in the Consolidated Balance Sheets has been reduced by $
9,113
and
$20,396
as a result of the net settlement. See Note 18 "Fair Value Measurements" to the "Notes to Consolidated Financial Statements" for further information.
The difference between the carrying amount of the receivables sold under these programs and the sum of the cash and fair value of the other assets received at the time of transfer is recognized as a loss on sale of the related receivables and recorded in Other Income in the Statements of Consolidated Operations.
- 81
-
ITEM 8.
FINANCIAL STATEMENTS AND SUPPLEMENTARY DATA
(continued)
NOTES TO CONSOLIDATED FINANCIAL STATEMENTS
(continued)
Alliance One International, Inc. and Subsidiaries
(in thousands)
Note 17
– Sale of Receivables
(continued)
The following table summarizes the Company’s accounts receivable securitization information as of
March 31
:
|
2016
|
2015
|
||||||
|
Receivables outstanding in facility as of March 31:
|
$
|
188,764
|
|
$
|
235,162
|
|
|
|
Beneficial interest as of March 31
|
$
|
40,368
|
|
$
|
40,712
|
|
|
|
Servicing Liability as of March 31
|
$
|
58
|
|
$
|
131
|
|
|
|
Cash proceeds for the twelve months ended March 31:
|
|||||||
|
Cash purchase price
|
$
|
585,648
|
|
$
|
622,844
|
|
|
|
Deferred purchase price
|
233,753
|
|
229,573
|
|
|||
|
Service fees
|
553
|
|
589
|
|
|||
|
Total
|
$
|
819,954
|
|
$
|
853,006
|
|
|
Note 18
– Fair Value Measurements
Fair value is defined as the exchange price that would be received for an asset or paid to transfer a liability (an exit price) in the principal or most advantageous market for the asset or liability in an orderly transaction between market participants. A three-level valuation hierarchy based upon observable and non-observable inputs is utilized. Observable inputs reflect market data obtained from independent sources, while unobservable inputs reflect the Company's market assumptions. Preference is given to observable inputs. These two types of inputs create the following fair value hierarchy:
|
•
|
Level 1 - Quoted prices for identical assets or liabilities in active markets.
|
|
•
|
Level 2 - Quoted prices for similar assets or liabilities in active markets; quoted prices for identical or similar assets or liabilities in markets that are not active; and model-derived valuations whose inputs are observable or whose significant value drivers are observable.
|
|
•
|
Level 3 - Significant inputs to the valuation model are unobservable.
|
The Company's financial assets and liabilities measured at fair value include derivative instruments, securitized beneficial interests and guarantees. The application of the fair value guidance to our non-financial assets and liabilities primarily includes assessments of investments in subsidiaries, goodwill and other intangible assets and long-lived assets for potential impairment.
Following are descriptions of the valuation methodologies the Company uses to measure different assets or liabilities at fair value.
Debt
The fair value of debt is measured for purpose of disclosure. Debt is shown at historical value in the Consolidated Balance Sheets. When possible, to measure the fair value of its debt the Company uses quoted market prices of its own debt with approximately the same remaining maturities. When this is not possible, the fair value of debt is calculated using discounted cash flow models with interest rates based upon market based expectations, the Company's credit risk and the contractual terms of the debt instrument. The Company has portions of its debt with maturities of one year or less for which book value is a reasonable approximation of the fair value of this debt. The fair value of debt is considered to fall within Level 2 of the fair value hierarchy as significant value drivers such as interest rates are readily observable. The carrying value and estimated fair value of the Company's Long-Term Debt are shown in the table below.
|
March 31,
|
||||||
|
2016
|
2015
|
|||||
|
Carrying value
|
$
|
920,444
|
|
$
|
741,837
|
|
|
Estimated fair value
|
753,038
|
|
653,548
|
|
||
- 82
-
ITEM 8.
FINANCIAL STATEMENTS AND SUPPLEMENTARY DATA
(continued)
NOTES TO CONSOLIDATED FINANCIAL STATEMENTS
(continued)
Alliance One International, Inc. and Subsidiaries
(in thousands)
Note 18
– Fair Value Measurements (
continued)
Derivative financial instruments
The Company's derivatives consist of foreign currency contracts. The fair value of the derivatives are determined using a discounted cash flow analysis on the expected future cash flows of each derivative. This analysis utilizes observable market data including forward yield curves and implied volatilities to determine the market's expectation of the future cash flows of the variable component. The fixed and variable components of the derivative are then discounted using calculated discount factors developed based on the LIBOR swap rate and are netted to arrive at a single valuation for the period. The Company also incorporates credit valuation adjustments to appropriately reflect both its own nonperformance risk and the respective counterparty's nonperformance risk in the fair value measurements. As of
March 31, 2016
and
March 31, 2015
the inputs used to value the Company's derivatives fall within Level 2 of the fair value hierarchy. However, credit valuation adjustments associated with its derivatives could utilize Level 3 inputs, such as estimates of current credit spreads to evaluate the likelihood of default by itself and its counterparties. Should the use of such credit valuation adjustment estimates result in a significant impact on the overall valuation, this would require reclassification to Level 3.
Securitized beneficial interests
The fair value of securitized beneficial interests is based upon a valuation model that calculates the present value of future expected cash flows using key assumptions for payment speeds and discount rates. The assumptions for payment speed are based on the Company's historical experience. The discount rates are based upon market trends and anticipated performance relative to the particular assets securitized which have been assumed to be commercial paper rate plus a margin or LIBOR plus a margin. Due to the use of the Company's own assumptions which are not observable, and the uniqueness of these transactions, securitized beneficial interests fall within Level 3 of the fair value hierarchy. Since the discount rate and the payment speed are components of the same equation, a change in either by
10%
or
20%
would change the value of the recorded beneficial interest at
March 31, 2016
by
$166
and
$333
, respectively.
Guarantees
The Company guarantees funds issued to tobacco suppliers by third party lending institutions and also guarantees funds borrowed by a deconsolidated subsidiary. The fair value of guarantees is based upon either the premium the Company would require to issue the same inputs or historical loss rates and as such these guarantees fall into Level 3 of the fair value hierarchy.
Tobacco Supplier Guarantees
- The Company provides guarantees to third parties for indebtedness of certain tobacco suppliers to finance their crops. The fair value of these guarantees is the greater of using a discounted cash flow based on rates with and without the guarantees or applying historical loss rates generated from guaranteed and non-guaranteed tobacco supplier loans. Should the loss rates change
10%
or
20%
, the fair value of the guarantee at March 31, 2016 would change by
$962
or
$1,901
, respectively.
Deconsolidated subsidiary guarantees
- Due to the reconsolidation of MTC, there are no deconsolidated subsidiary guarantees that have a fair value.
- 83
-
ITEM 8.
FINANCIAL STATEMENTS AND SUPPLEMENTARY DATA
(continued)
NOTES TO CONSOLIDATED FINANCIAL STATEMENTS
(continued)
Alliance One International, Inc. and Subsidiaries
(in thousands)
Note 18
– Fair Value Measurements (
continued)
Input Hierarchy of Items Measured at Fair Value on a Recurring Basis
The following tables present the Company’s assets and liabilities measured at fair value on a recurring basis:
|
March 31, 2016
|
March 31, 2015
|
||||||||||||||||||
|
Level 2
|
Level 3
|
Total Assets /
Liabilities, at Fair Value |
Level 2
|
Level 3
|
Total Assets /
Liabilities, at Fair Value |
||||||||||||||
|
Assets
|
|||||||||||||||||||
|
Derivative financial instruments
|
$
|
—
|
|
$
|
—
|
|
$
|
—
|
|
$
|
1,373
|
|
$
|
—
|
|
$
|
1,373
|
|
|
|
Securitized beneficial interests
|
—
|
|
40,368
|
|
40,368
|
|
—
|
|
40,712
|
|
40,712
|
|
|||||||
|
Total Assets
|
$
|
—
|
|
$
|
40,368
|
|
$
|
40,368
|
|
$
|
1,373
|
|
$
|
40,712
|
|
$
|
42,085
|
|
|
|
Liabilities
|
|||||||||||||||||||
|
Guarantees
|
$
|
—
|
|
$
|
7,350
|
|
$
|
7,350
|
|
$
|
—
|
|
$
|
8,650
|
|
$
|
8,650
|
|
|
|
Derivative financial instruments
|
—
|
|
—
|
|
—
|
|
—
|
|
—
|
|
—
|
|
|||||||
|
Total Liabilities
|
$
|
—
|
|
$
|
7,350
|
|
$
|
7,350
|
|
$
|
—
|
|
$
|
8,650
|
|
$
|
8,650
|
|
|
Reconciliation of Change in Recurring Level 3 Balances
The following tables present the changes in Level 3 instruments measured on a recurring basis.
|
Securitized Beneficial Interests
|
Guarantees
|
|||||
|
Beginning Balance March 31, 2014
|
$
|
35,559
|
|
$
|
7,344
|
|
|
Issuance of guarantees/sales of receivables
|
233,392
|
|
12,921
|
|
||
|
Settlements
|
(223,150
|
)
|
(9,304
|
)
|
||
|
Losses recognized in earnings
|
(5,089
|
)
|
(2,311
|
)
|
||
|
Ending Balance at March 31, 2015
|
40,712
|
|
8,650
|
|
||
|
Issuance of guarantees/sales of receivables
|
249,326
|
|
11,327
|
|
||
|
Settlements
|
(246,009
|
)
|
(11,719
|
)
|
||
|
Losses recognized in earnings
|
(3,661
|
)
|
(908
|
)
|
||
|
Ending Balance at March 31, 2016
|
$
|
40,368
|
|
$
|
7,350
|
|
The amount of total losses included in earnings for the years ended
March 31, 2016
and 2015 attributable to the change in unrealized losses relating to assets still held at the respective dates was
$1,521
and
$2,034
on securitized beneficial interests.
Gains and losses included in earnings are reported in Other Income.
- 84
-
ITEM 8.
FINANCIAL STATEMENTS AND SUPPLEMENTARY DATA
(continued)
NOTES TO CONSOLIDATED FINANCIAL STATEMENTS
(continued)
Alliance One International, Inc. and Subsidiaries
(in thousands)
Note 18
- Fair Value Measurements
(continued)
Information About Fair Value Measurements Using Significant Unobservable Inputs
The following table summarizes significant unobservable inputs and the valuation techniques thereof for the periods ended
March 31, 2016
and 2014:
|
Fair value at March 31, 2016
|
Valuation Technique
|
Unobservable Input
|
Range (Weighted Average)
|
|||
|
Securitized Beneficial Interests
|
|
Discount Rate
|
3.17% to 3.77%
|
|||
|
$
|
40,368
|
|
Discounted Cash Flow
|
Payment Speed
|
94.7 to 116.0 days
|
|
|
Tobacco Supplier Guarantees
|
3,278
|
|
Historical Loss
|
Historical Loss
|
5.0% to 15.9%
|
|
|
4,072
|
|
Discounted Cash Flow
|
Market Interest Rate
|
15.8% to 22.0%
|
||
|
Fair value at March 31,
2015
|
Valuation Technique
|
Unobservable Input
|
Range (Weighted Average)
|
||||
|
Securitized Beneficial Interests
|
$
|
40,712
|
|
Discounted Cash Flow
|
Discount Rate
|
2.73% to 2.74%
|
|
|
Payment Speed
|
116.0 to 119.4 days
|
|
|||||
|
Tobacco Supplier Guarantees
|
3,110
|
|
Historical Loss
|
Historical Loss
|
10.0% to 15.8%
|
|
|
|
3,412
|
|
Discounted Cash Flow
|
Market Interest Rate
|
13.0% to 22.0%
|
|
||
|
Deconsolidated Subsidiary Guarantees
|
2,128
|
|
Discounted Cash Flow
|
Market Interest Rate
|
12.0
|
%
|
|
Note 19
– Related Party Transactions
The Company’s operating subsidiaries engage in transactions with related parties in the normal course of business. The following is a summary of balances and transactions with related parties of the Company:
|
March 31, 2016
|
March 31, 2015
|
|||||
|
Balances:
|
||||||
|
Accounts receivable
|
$
|
1,920
|
|
$
|
7,491
|
|
|
Accounts payable
|
$
|
20,490
|
|
$
|
58,512
|
|
|
Year Ended March 31,
|
|||||||||
|
2016
|
2015
|
2014
|
|||||||
|
Transactions:
|
|||||||||
|
Sales
|
$
|
18,827
|
|
$
|
20,692
|
|
$
|
—
|
|
|
Purchases
|
$
|
264,707
|
|
$
|
271,466
|
|
$
|
258,169
|
|
The Company’s operating subsidiaries have entered into transactions with affiliates of the Company for the purpose of procuring inventory.
The Company’s balances due to and from related parties and transactions relate to the Company’s equity basis investments in companies located in Asia, South America, North America and Europe which grow, purchase, process and sell tobacco or produce consumable e-liquids.
- 85
-
ITEM 8.
FINANCIAL STATEMENTS AND SUPPLEMENTARY DATA
(continued)
NOTES TO CONSOLIDATED FINANCIAL STATEMENTS
(continued)
Alliance One International, Inc. and Subsidiaries
(in thousands)
Note 20
– Selected Quarterly Financial Data (Unaudited)
Summarized quarterly financial information is as follows:
|
First Quarter
|
Second Quarter (2)
|
Third Quarter (2)
|
Fourth Quarter (2)
|
Fiscal Year
|
||||||||||||||||
|
Year Ended March 31, 2016
|
||||||||||||||||||||
|
Sales and other operating revenue
|
$
|
266,282
|
|
$
|
414,853
|
|
$
|
491,139
|
|
$
|
732,318
|
|
$
|
1,904,592
|
|
|||||
|
Gross profit
|
29,398
|
|
54,874
|
|
68,738
|
|
72,784
|
|
225,794
|
|
||||||||||
|
Other income (expense)
|
560
|
|
(1,029
|
)
|
594
|
|
105,302
|
|
105,427
|
|
||||||||||
|
Restructuring
|
2,948
|
|
(386
|
)
|
1,525
|
|
1,801
|
|
5,888
|
|
||||||||||
|
Net income (loss)
|
(25,957
|
)
|
(21,123
|
)
|
11,685
|
|
100,840
|
|
65,445
|
|
||||||||||
|
Net earnings (loss) attributable to
noncontrolling interest |
(7
|
)
|
(58
|
)
|
(50
|
)
|
28
|
|
(87
|
)
|
||||||||||
|
Net income (loss) attributable to
Alliance One International, Inc. |
(25,950
|
)
|
(21,065
|
)
|
11,735
|
|
100,812
|
|
65,532
|
|
||||||||||
|
Per Share of Common Stock:
|
||||||||||||||||||||
|
Basic earnings (loss) attributable to
Alliance One International, Inc. (1) |
(2.93
|
)
|
(2.37
|
)
|
1.32
|
|
11.33
|
|
7.38
|
|
||||||||||
|
Diluted earnings (loss) attributable to
Alliance One International, Inc. (1) |
(2.93
|
)
|
(2.37
|
)
|
1.32
|
|
11.33
|
|
7.38
|
|
||||||||||
|
Market Price
|
- High
|
25.40
|
|
26.47
|
|
21.03
|
|
17.94
|
|
26.47
|
|
|||||||||
|
- Low
|
10.80
|
|
18.79
|
|
10.35
|
|
8.33
|
|
8.33
|
|
||||||||||
|
Year Ended March 31, 2015
|
||||||||||||||||||||
|
Sales and other operating revenue
|
$
|
249,144
|
|
$
|
596,970
|
|
$
|
489,227
|
|
$
|
731,524
|
|
$
|
2,066,865
|
|
|||||
|
Gross profit
|
33,271
|
|
64,876
|
|
68,581
|
|
76,771
|
|
243,499
|
|
||||||||||
|
Restructuring
|
—
|
|
500
|
|
—
|
|
8,618
|
|
9,118
|
|
||||||||||
|
Net income (loss)
|
(23,630
|
)
|
(8,158
|
)
|
1,333
|
|
2,421
|
|
(28,034
|
)
|
||||||||||
|
Net earnings (loss) attributable to
noncontrolling interest |
55
|
|
(7
|
)
|
(230
|
)
|
10
|
|
(172
|
)
|
||||||||||
|
Net income (loss) attributable to
Alliance One International, Inc. |
(23,685
|
)
|
(8,151
|
)
|
1,563
|
|
2,411
|
|
(27,862
|
)
|
||||||||||
|
Per Share of Common Stock:
|
||||||||||||||||||||
|
Basic earnings (loss) attributable to
Alliance One International, Inc. (1) |
(2.69
|
)
|
(0.92
|
)
|
0.18
|
|
0.27
|
|
(3.16
|
)
|
||||||||||
|
Diluted earnings (loss) attributable to
Alliance One International, Inc. (1) |
(2.69
|
)
|
(0.92
|
)
|
0.18
|
|
0.27
|
|
(3.16
|
)
|
||||||||||
|
Market Price
|
- High
|
30.10
|
|
27.40
|
|
21.00
|
|
16.30
|
|
30.10
|
|
|||||||||
|
- Low
|
23.00
|
|
19.30
|
|
15.20
|
|
8.30
|
|
8.30
|
|
||||||||||
(1) Does not add due to quarterly change in average shares outstanding.
(2) The second quarter and third quarter of fiscal 2016 and the third quarter and fourth quarter of fiscal 2015 include adjustments for certain immaterial errors in previously issued financial statements. See Note 1, “Significant Accounting Policies” to the “Notes to Consolidated Financial Statements" for further information.
Fourth Quarter 2016
- As of March 31, 2016, the Company determined that the significant doubt about the Company's ability to control MTC was eliminated and recorded a gain of
$106,203
upon reconsolidation.
Fourth Quarter 2015
- Restructuring charges of
$8,618
related to first phase of global restructuring plan in connection with reduction in global workforce.
- 86
-
ITEM 8.
FINANCIAL STATEMENTS AND SUPPLEMENTARY DATA
(continued)
NOTES TO CONSOLIDATED FINANCIAL STATEMENTS
(continued)
Alliance One International, Inc. and Subsidiaries
(in thousands)
Note 21
- Subsequent Events
On May 20, 2016, the Company entered into the Fourth Amendment to the Amended and Restated Credit Agreement (the “Fourth Amendment"), which amended the Credit Agreement dated as of July 2, 2009, as amended and restated as of August 1, 2013, between the Company, certain of its subsidiaries, the lenders party thereto and Deutsche Bank Trust Company Americas, as administrative agent (as so amended and restated, the “Credit Agreement”).
The Fourth Amendment effected the following modifications to the Credit Agreement (capitalized terms are as defined in the Credit Agreement):
|
•
|
modified the threshold for the Consolidated Interest Coverage Ratio for the fiscal quarter ending March 31, 2017 from
1.90
to 1.00 to
1.65
to 1.00;
|
|
•
|
modified the threshold for the Consolidated Leverage Ratio for the fiscal quarter ending March 31, 2017 from
5.10
to 1.00 to
5.50
to 1.00; and
|
|
•
|
modified the definition of Consolidated EBIT to permit the add backs for the specified periods as set forth in the table below in connection with certain discrepancies discovered with respect to the Company’s Kenyan subsidiary:
|
|
For the Quarter Ended
(in dollars)
|
Kenyan Discrepancies
|
Legal and Professional Costs in Respect of Kenyan Discrepancies
|
|
March 31, 2013
|
$(1,745,717)
|
0
|
|
June 30, 2013
|
$2,198,708
|
0
|
|
September 30, 2013
|
$(1,492,481)
|
0
|
|
December 31, 2013
|
$4,681,765
|
0
|
|
March 31, 2014
|
$7,869,112
|
0
|
|
June 30, 2014
|
$1,834,281
|
0
|
|
September 30, 2014
|
$6,606,350
|
0
|
|
December 31, 2014
|
$449,593
|
0
|
|
March 31, 2015
|
$3,577,392
|
0
|
|
June 30, 2015
|
$5,263,723
|
0
|
|
September 30, 2015
|
$5,821,224
|
0
|
|
December 31, 2015
|
0
|
$1,771,000
|
|
March 31, 2016
|
0
|
$6,129,000
|
|
June 30, 2016
|
0
|
$4,000,000
|
|
September 30, 2016
|
0
|
$3,500,000
|
Prior to the execution of the Fourth Amendment, the Company would have been in violation of one or more covenants in fiscal 2014 and 2015 as a result of improper accounting for accounts receivable, inventory, sales and cost of goods sold in Kenya. In the Fourth Amendment, the lenders modified certain financial covenants and definitions as described above and, as a result, the Company was in compliance with all such amended covenants for fiscal 2013, 2014 and 2015.
Note that in March 2016, Moody's Investors Service downgraded the Corporate Family Rating of the Company to Caa2 from Caa1. Moody's also downgraded the Probability of Default Rating to Caa2-PD from Caa1-PD, and the senior secured second lien note rating to Caa3 with a Loss Given Default (“LGD”) of 5 from Caa2 and a LGD of 5. At the same time Moody's affirmed the Company's senior secured bank credit facility rating at B1 with a LGD of 1 and the Speculative Grade Liquidity Rating at SGL-4. Standard & Poor’s (“S&P”) ratings are Corporate Credit Rating CCC+, senior secured second lien note rating CCC with a recovery rating (“RR”) of 5 and a senior secured debt rating of B with a RR of 1. S&P has outlook negative and as of June 3, 2016, Moody's has outlook positive. However, the Company affirms its belief that the sources of capital it has access to are sufficient to fund its anticipated needs for fiscal years 2016 and 2017. As of March 31, 2016, available credit lines and cash were
$639,388
, comprised of
$199,720
in cash;
$439,668
of credit lines, of which
$10,259
was available under
- 87
-
ITEM 8.
FINANCIAL STATEMENTS AND SUPPLEMENTARY DATA
(continued)
NOTES TO CONSOLIDATED FINANCIAL STATEMENTS
(continued)
Alliance One International, Inc. and Subsidiaries
(in thousands)
Note 21
- Subsequent Events
(continued)
the U.S. revolving credit facility; and
$429,409
of foreign seasonal credit lines with
$13,057
exclusively for letters of credit. Notes payable to banks are typically for 180 to 270 days and are entered into each year in various locales around the world. The U.S revolver matures April 15, 2017 and the Company plans to either extend or refinance this facility during fiscal year 2017. The Company's access to capital meets its current expectations and outlook that is anticipated to provide sufficient liquidity to fulfill its future funding requirements. General deterioration of its business and the cash flow that it generates, failure to renew foreign lines or an inability to extend or refinance its U.S. revolver could impact its ability to meet its future liquidity requirements.
On July 6, 2016, the Company entered into the Fifth Amendment to the Amended and Restated Credit Agreement (the “Fifth Amendment"), which further amended the Credit Agreement. The Fifth Amendment clarified that for the purpose of certain covenants under the Credit Agreement up to
$100,000
of debt of the Company’s MTC subsidiary in respect of loans under a credit facility with a third-party lender funded by another specified subsidiary of the Company pursuant to a participation interest in such loans or an assignment in respect of such loans consistent with past practices prior to the date of the Fifth Amendment (so long as such loan proceeds are used in connection with the purchase, processing, exporting and financing of the contract growing and buying of tobacco) shall be deemed to be debt owed by MTC to the other Company subsidiary (and not the third-party lender) as intercompany debt regardless of the presentation of such debt in the consolidated financial statements of the Company in accordance with GAAP. The Fifth Amendment also waived any noncompliance by the Company under the Credit Agreement that may have occurred prior to the effectiveness of the Fifth Amendment as a result of such debt not being treated as intercompany debt, as well as the Company’s failure to deliver audited financial statements for the fiscal year ended March 31, 2016 within the time period required under the Credit Agreement if such audited financial statements are delivered by July 19, 2016.
Note 22
- Reconsolidation of MTC
On March 31, 2016, the Company regained control over its wholly owned Zimbabwe subsidiary, Mashonaland Tobacco Company, LTD (“MTC”). The change in control was a result of the change in the political landscape in Zimbabwe and the recent issuance of clarifications to the indigenization laws within Zimbabwe that resulted in the elimination of significant doubt about the Company's ability to control MTC. The reconsolidation of MTC has been treated as a purchase business combination and as such, the fair value of the assets and liabilities has been recorded at their fair value.
Since the Company already owned
100%
of the equity interest, no consideration was transferred as part of the reconsolidation. The Company estimated the fair value of its equity interest in MTC at March 31, 2016 to be
$94,395
based on a discounted cash flow model. The amount was then allocated to the fair value of the acquired assets and liabilities, which were recorded on the Consolidated Balance Sheet at March 31, 2016. The fair value of the recognized assets included a customer relationship intangible asset of
$24,830
and goodwill of
$13,669
. The effect of the reconsolidation under the purchase business combination guidance resulted in a gain of
$106,203
which has been recorded and shown in “Other Income” on the Statement of Consolidated Operations for the year ended March 31, 2016. The gain is the result of the fair value of the equity interest of
$94,395
and the reversal of a deferred liability of
$11,808
.
- 88
-
ITEM 8.
FINANCIAL STATEMENTS AND SUPPLEMENTARY DATA
(continued)
NOTES TO CONSOLIDATED FINANCIAL STATEMENTS
(continued)
Alliance One International, Inc. and Subsidiaries
(in thousands)
Note 22
- Reconsolidation of MTC
(continued)
The following table summarizes the fair values of the assets acquired and liabilities assumed as of March 31, 2016.
|
thousands
|
March 31, 2016
|
|
|
|
Cash and cash equivalents
|
$
|
10,277
|
|
|
Trade and other receivables, net
|
4,377
|
|
|
|
Net intercompany receivable (eliminated in consolidation)
|
100,423
|
|
|
|
Inventories
|
38,087
|
|
|
|
Other current assets
|
1,663
|
|
|
|
Property, plant and equipment
|
51,295
|
|
|
|
Goodwill and other intangible assets
|
38,499
|
|
|
|
Other noncurrent assets
|
288
|
|
|
|
Total assets acquired
|
244,909
|
|
|
|
Notes payable to banks (1)
|
130,600
|
|
|
|
Accounts payable
|
3,344
|
|
|
|
Other current liabilities
|
5,480
|
|
|
|
Deferred tax liabilities
|
11,090
|
|
|
|
Total liabilities
|
150,514
|
|
|
|
Fair value of equity interest
|
$
|
94,395
|
|
(1) Includes
$130,600
of debt owed by MTC under a short-term credit facility in which one of the Company’s other subsidiaries, Intabex Netherlands BV (“Intabex”), has a participation interest in the lender’s rights and obligations under the facility. At March 31, 2016,
$84,258
of that amount was attributed to outstanding borrowings by MTC funded under that facility by Intabex pursuant to that participation interest. Because Intabex’s funding is pursuant to a participation interest through a third-party lender and not a direct intercompany loan between Intabex and MTC, the total amount of debt under the facility is required to be reflected as consolidated debt upon the reconsolidation of MTC.
As indicated in the above table, the goodwill and intangible asset balance relative to the reconsolidation of MTC is
$38,499
within the “Other Regions” segment and is non-deductible for tax purposes. Included within this balance is goodwill attributable in part to the workforce of the acquired business and a finite-lived customer relationship intangible of
$24,830
, which is being amortized over a useful life of
fifteen
years.
Alliance One Selected Unaudited Pro Forma Combined Financial Information
The unaudited pro forma information in the table below summarizes the combined results of the Company and MTC for the years ended March 31, 2016 and 2015 as if the companies were combined as of April 1, 2014. The pro forma information is presented for informational purposes only and is not indicative of the results of operations that would have been achieved had the reconsolidation taken place at the beginning of each period or results of future periods. The following information has been adjusted for intercompany eliminations as required for consolidation accounting.
|
|
Unaudited Proforma Twelve Months Ended March 31,
|
||||||
|
thousands except per share data
|
2016
|
|
2015
|
||||
|
Revenues
|
$
|
1,912,324
|
|
|
$
|
2,077,732
|
|
|
Operating income
|
114,615
|
|
|
108,669
|
|
||
|
Net loss
|
(31,409
|
)
|
|
(24,885
|
)
|
||
- 89
-
ITEM 8.
FINANCIAL STATEMENTS AND SUPPLEMENTARY DATA
(continued)
NOTES TO CONSOLIDATED FINANCIAL STATEMENTS
(continued)
Alliance One International, Inc. and Subsidiaries
(in thousands)
Note 23
- Reconciliation of Previously Reported Amounts to Amounts Restated
As described in Note 1, “Significant Accounting Policies” to the “Notes to Consolidated Financial Statements,” the Company has identified certain misstatements relating to prior years’ consolidated financial statements and has corrected these prior period misstatements in the accompanying consolidated financial statements. The impacts of these changes on selected financial amounts within the accompanying consolidated financial statements are summarized below:
|
Consolidated Balance Sheet as of
|
||||||||||||||||
|
March 31, 2015
|
||||||||||||||||
|
(in thousands)
|
As Previously Reported
|
Inventory Adjustments
|
Tax Adjustments
|
Other Adjustments
|
As Restated
|
|||||||||||
|
Total current assets
|
$
|
1,217,095
|
|
$
|
(1,380
|
)
|
$
|
(1,824
|
)
|
$
|
11,808
|
|
$
|
1,225,699
|
|
|
|
Total assets
|
1,626,646
|
|
(1,380
|
)
|
(1,824
|
)
|
10,764
|
|
1,634,206
|
|
||||||
|
Non-current liabilities
|
844,954
|
|
—
|
|
—
|
|
10,764
|
|
855,718
|
|
||||||
|
Total equity
|
197,268
|
|
(1,380
|
)
|
(1,824
|
)
|
—
|
|
194,064
|
|
||||||
|
Total liabilities and equity
|
1,626,646
|
|
(1,380
|
)
|
(1,824
|
)
|
10,764
|
|
1,634,206
|
|
||||||
|
Statement of Consolidated Operations
|
||||||||||||||||
|
March 31, 2015
|
||||||||||||||||
|
(in thousands, except for per share amounts)
|
As Previously Reported
|
Inventory Adjustments
|
Tax Adjustments
|
Other Adjustments
|
As Restated
|
|||||||||||
|
Cost of goods and services sold
|
$
|
1,824,148
|
|
$
|
674
|
|
$
|
—
|
|
$
|
(1,456
|
)
|
$
|
1,823,366
|
|
|
|
Gross profit
|
242,717
|
|
(674
|
)
|
—
|
|
1,456
|
|
243,499
|
|
||||||
|
Other income (expense)
|
1,390
|
|
—
|
|
—
|
|
(1,456
|
)
|
(66
|
)
|
||||||
|
Operating income
|
97,969
|
|
(674
|
)
|
—
|
|
—
|
|
97,295
|
|
||||||
|
Loss before income taxes and other
|
(8,265
|
)
|
(674
|
)
|
—
|
|
—
|
|
(8,939
|
)
|
||||||
|
Income tax expense
|
20,860
|
|
—
|
|
1,058
|
|
—
|
|
21,918
|
|
||||||
|
Net loss
|
(26,302
|
)
|
(674
|
)
|
(1,058
|
)
|
—
|
|
(28,034
|
)
|
||||||
|
Net loss attributable to Alliance One International, Inc.
|
(26,130
|
)
|
(674
|
)
|
(1,058
|
)
|
—
|
|
(27,862
|
)
|
||||||
|
Loss per share:
|
||||||||||||||||
|
Basic
|
(2.96
|
)
|
(0.08
|
)
|
(0.12
|
)
|
—
|
|
(3.16
|
)
|
||||||
|
Diluted
|
(2.96
|
)
|
(0.08
|
)
|
(0.12
|
)
|
—
|
|
(3.16
|
)
|
||||||
- 90
-
ITEM 8.
FINANCIAL STATEMENTS AND SUPPLEMENTARY DATA
(continued)
NOTES TO CONSOLIDATED FINANCIAL STATEMENTS
(continued)
Alliance One International, Inc. and Subsidiaries
(in thousands)
Note 23
- Reconciliation of Previously Reported Amounts to Amounts Revised and Restated
(continued)
|
Consolidated Statement of Comprehensive Income (Loss)
|
|||||||||||||
|
March 31, 2015
|
|||||||||||||
|
(in thousands)
|
As Previously Reported
|
Inventory Adjustments
|
Tax Adjustments
|
As Restated
|
|||||||||
|
Net loss
|
$
|
(26,302
|
)
|
$
|
(674
|
)
|
$
|
(1,058
|
)
|
$
|
(28,034
|
)
|
|
|
Total comprehensive loss
|
(54,362
|
)
|
(674
|
)
|
(1,058
|
)
|
(56,094
|
)
|
|||||
|
Comprehensive loss attributable to Alliance One International, Inc.
|
(54,190
|
)
|
(674
|
)
|
(1,058
|
)
|
(55,922
|
)
|
|||||
|
Statement of Consolidated Cash Flows
|
|||||||||||||
|
March 31, 2015
|
|||||||||||||
|
(in thousands)
|
As Previously Reported
|
Inventory Adjustments
|
Tax Adjustments
|
As Restated
|
|||||||||
|
Net loss
|
$
|
(26,302
|
)
|
$
|
(674
|
)
|
$
|
(1,058
|
)
|
$
|
(28,034
|
)
|
|
|
Inventories and advances to tobacco suppliers
|
(4,666
|
)
|
674
|
|
—
|
|
(3,992
|
)
|
|||||
|
Recoverable income taxes
|
(2,430
|
)
|
—
|
|
1,058
|
|
(1,372
|
)
|
|||||
|
Statement of Consolidated Operations
|
|||||||||||||
|
March 31, 2014
|
|||||||||||||
|
(in thousands)
|
As Previously Reported
|
Inventory Adjustments
|
Tax Adjustments
|
As Restated
|
|||||||||
|
Cost of goods and services sold
|
$
|
2,127,880
|
|
$
|
706
|
|
$
|
—
|
|
$
|
2,128,586
|
|
|
|
Gross profit
|
226,656
|
|
(706
|
)
|
—
|
|
225,950
|
|
|||||
|
Operating income
|
106,219
|
|
(706
|
)
|
—
|
|
105,513
|
|
|||||
|
Loss before income taxes and other
|
(60,989
|
)
|
(706
|
)
|
—
|
|
(61,695
|
)
|
|||||
|
Income tax expense
|
40,475
|
|
—
|
|
766
|
|
41,241
|
|
|||||
|
Net loss
|
(101,404
|
)
|
(706
|
)
|
(766
|
)
|
(102,876
|
)
|
|||||
|
Net loss attributable to Alliance One International, Inc.
|
(101,061
|
)
|
(706
|
)
|
(766
|
)
|
(102,533
|
)
|
|||||
|
Loss per share:
|
|||||||||||||
|
Basic
|
(11.52
|
)
|
(0.08
|
)
|
(0.09
|
)
|
(11.69
|
)
|
|||||
|
Diluted
|
(11.52
|
)
|
(0.08
|
)
|
(0.09
|
)
|
(11.69
|
)
|
|||||
|
Consolidated Statement of Comprehensive (Loss)
|
|||||||||||||
|
Income March 31, 2014
|
|||||||||||||
|
(in thousands)
|
As Previously Reported
|
Inventory Adjustments
|
Tax Adjustments
|
As Restated
|
|||||||||
|
Net loss
|
$
|
(101,404
|
)
|
$
|
(706
|
)
|
$
|
(766
|
)
|
$
|
(102,876
|
)
|
|
|
Total comprehensive loss
|
(84,313
|
)
|
(706
|
)
|
(766
|
)
|
(85,785
|
)
|
|||||
|
Comprehensive loss attributable to Alliance One International, Inc.
|
(83,970
|
)
|
(706
|
)
|
(766
|
)
|
(85,442
|
)
|
|||||
- 91
-
ITEM 8.
FINANCIAL STATEMENTS AND SUPPLEMENTARY DATA
(continued)
NOTES TO CONSOLIDATED FINANCIAL STATEMENTS
(continued)
Alliance One International, Inc. and Subsidiaries
(in thousands)
Note 23
- Reconciliation of Previously Reported Amounts to Amounts Revised and Restated
(continued)
|
Statement of Consolidated Cash Flows
|
|||||||||||||
|
March 31, 2014
|
|||||||||||||
|
(in thousands)
|
As Previously Reported
|
Inventory Adjustments
|
Tax Adjustments
|
As Restated
|
|||||||||
|
Net loss
|
$
|
(101,404
|
)
|
$
|
(706
|
)
|
$
|
(766
|
)
|
$
|
(102,876
|
)
|
|
|
Inventories and advances to tobacco suppliers
|
168,194
|
|
706
|
|
—
|
|
168,900
|
|
|||||
|
Recoverable income taxes
|
(2,136
|
)
|
—
|
|
766
|
|
(1,370
|
)
|
|||||
|
Statement of Consolidated Stockholders' Equity
|
|||||||||||||
|
(in thousands)
|
As Previously Reported
|
Inventory Adjustments
|
Tax Adjustments
|
As Restated
|
|||||||||
|
Retained Deficit at March 31, 2013
|
$
|
(80,993
|
)
|
$
|
—
|
|
$
|
—
|
|
$
|
(80,993
|
)
|
|
|
Net loss
|
(101,061
|
)
|
(706
|
)
|
(766
|
)
|
(102,533
|
)
|
|||||
|
Retained Deficit at March 31, 2014
|
(182,054
|
)
|
(706
|
)
|
(766
|
)
|
(183,526
|
)
|
|||||
|
Net loss
|
(26,130
|
)
|
(674
|
)
|
(1,058
|
)
|
(27,862
|
)
|
|||||
|
Retained Deficit at March 31, 2015
|
(208,184
|
)
|
(1,380
|
)
|
(1,824
|
)
|
(211,388
|
)
|
|||||
REPORT OF INDEPENDENT REGISTERED PUBLIC ACCOUNTING FIRM
To the Board of Directors and Stockholders of Alliance One International, Inc.:
We have audited the accompanying consolidated balance sheets of Alliance One International, Inc. and subsidiaries (the "Company") as of March 31, 2016, and 2015, and the related consolidated statements of operations, comprehensive income (loss), stockholders' equity, and cash flows for each of the three years in the period ended March 31, 2016. Our audits also included the financial statement schedule listed in the Index at Item 15. These financial statements and financial statement schedule are the responsibility of the Company's management. Our responsibility is to express an opinion on the financial statements and financial statement schedule based on our audits.
We conducted our audits in accordance with the standards of the Public Company Accounting Oversight Board (United States). Those standards require that we plan and perform the audit to obtain reasonable assurance about whether the financial statements are free of material misstatement. An audit includes examining, on a test basis, evidence supporting the amounts and disclosures in the financial statements. An audit also includes assessing the accounting principles used and significant estimates made by management, as well as evaluating the overall financial statement presentation. We believe that our audits provide a reasonable basis for our opinion.
In our opinion, such consolidated financial statements present fairly, in all material respects, the financial position of the Company as of March 31, 2016 and 2015, and the results of their operations and their cash flows for each of the three years in the period ended March 31, 2016, in conformity with accounting principles generally accepted in the United States of America. Also, in our opinion, such financial statement schedule, when considered in relation to the basic consolidated financial statements taken as a whole, presents fairly, in all material respects, the information set forth therein.
As discussed in Notes 1 and 22 to the consolidated financial statements, the Company recognized a $106 million non-cash gain in connection with the March 31, 2016 reconsolidation of its Zimbabwe subsidiary. Also, as discussed in Note 1, the Company prospectively adopted a new accounting standard for classification of deferred income taxes as of March 31, 2016.
We have also audited, in accordance with the standards of the Public Company Accounting Oversight Board (United States), the Company's internal control over financial reporting as of March 31, 2016, based on the criteria established in Internal Control - Integrated Framework (2013) issued by the Committee of Sponsoring Organizations of the Treadway Commission, and our report dated July 11, 2016, expressed an adverse opinion on the Company's internal control over financial reporting because of material weaknesses.
/s/ Deloitte & Touche LLP
_____________________________________
Raleigh, North Carolina
July 11, 2016
- 92
-
ITEM 9.
CHANGES IN AND DISAGREEMENTS WITH ACCOUNTANTS ON ACCOUNTING
AND FINANCIAL DISCLOSURE
None.
ITEM 9A.
CONTROLS AND PROCEDURES
Evaluation of Disclosure Controls and Procedures
In connection with the preparation of this Annual Report on Form 10-K, an evaluation was carried out by the Company’s management, with the participation of our Chief Executive Officer and Chief Financial Officer, of the effectiveness of our disclosure controls and procedures (as defined in Rules 13a-15(e) and 15d-15(e) under the Securities Exchange Act of 1934 (Exchange Act)) as of
March 31, 2016
. Disclosure controls and procedures are designed to ensure that information required to be disclosed in reports filed or submitted under the Exchange Act is recorded, processed, summarized and reported within the time periods specified in SEC rules and forms and that such information is accumulated and communicated to management, including the Chief Executive Officer and Chief Financial Officer, to allow timely decisions regarding required disclosures.
Based on this evaluation, our Chief Executive Office and Chief Financial Officer concluded our disclosure controls and procedures (as defined in Rules 13a-15(e) and 15d-15(e) under the Exchange Act) were not effective as of
March 31, 2016
as a result of the material weaknesses described below.
Management’s Report on Internal Control Over Financial Reporting
Management of the Company is responsible for establishing and maintaining adequate internal control over financial reporting. The Company’s internal control over financial reporting is a process, under the supervision of our Chief Executive Officer and Chief Financial Officer, designed to provide reasonable assurance regarding the reliability of financial reporting and the preparation of the Company’s financial statements for external purposes in accordance with accounting principles generally accepted in the United States of America (“U.S. GAAP”).
Our internal control over financial reporting includes those policies and procedures that:
|
i.
|
pertain to the maintenance of records that, in reasonable detail, accurately and fairly reflect the transactions and dispositions of our assets;
|
|
ii.
|
provide reasonable assurance that transactions are recorded as necessary to permit preparation of financial statements in accordance with generally accepted accounting principles, and that our receipts and expenditures are being made only in accordance with authorizations of our management and directors; and
|
|
iii.
|
provide reasonable assurance regarding prevention or timely detection of unauthorized acquisition, use or disposition of our assets that could have a material effect on the financial statements.
|
All internal control systems, no matter how well designed, have inherent limitations. Therefore, even those systems determined to be effective can provide only reasonable assurance with respect to financial statement preparation and presentation. Also, projections of any evaluation of effectiveness to future periods are subject to the risk that controls may become inadequate because of changes in conditions, or that the degree of compliance with the policies or procedures may deteriorate.
Management conducted an assessment of the effectiveness of the Company’s internal control over financial reporting as of
March 31, 2016
based on the criteria established in Internal Control — Integrated Framework issued by the Committee of Sponsoring Organizations of the Treadway Commission (COSO) in 2013. Based on that assessment, management believes our internal control over financial reporting was not effective as of
March 31, 2016
as a result of the material weaknesses described below.
Our Chief Executive Officer and Chief Financial Officer have concluded that the following material weaknesses in internal control over financial reporting existed at the Kenyan subsidiary as of March 31, 2016:
|
•
|
Processes and control activities designed to support the amounts of inventory recorded in the general ledger were not effective, were incorrectly applied or were overridden. It appears that local management, through collusion, overrode controls to record fictional inventory balances.
|
|
•
|
Processes and control activities designed to support the amounts of deferred crop costs recorded in the general ledger were not effective, were incorrectly applied or were overridden. It appears that local management, through collusion, overrode controls to inappropriately cost redried inventory and understate cost of goods sold.
|
|
•
|
Processes and control activities designed to support the revenue transactions recorded in the general ledger were not effective, were incorrectly applied or were overridden. Specifically, revenues were recorded based on estimated transactions and actual transactions were processed outside the general ledger system. As a result revenue recorded did not reflect actual sales transactions and accounts receivable balances were recorded which would not be realized.
|
- 93
-
ITEM 9A.
CONTROLS AND PROCEDURES (AS REVISED)
(continued)
Evaluation of Disclosure Controls and Procedures
(continued)
Our Chief Executive Officer and Chief Financial Officer have also concluded that the following material weaknesses existed at the regional and corporate levels as of March 31, 2016:
|
•
|
The Company’s regional review of operations at African origins was ineffective due to the lack of adequate qualified resources to appropriately examine and investigate financial results. Although the financial information from the Kenya origin was reviewed on a timely basis, the regional review did not incorporate the qualitative and operational context needed to perform an adequate review, which allowed the misstated balances to build up over extended periods of time.
|
|
•
|
The Company’s fraud risk assessment was not adequately designed or implemented to address the risks of fraud in certain origins. The Company’s assessment did not determine that certain regions warranted additional control activities to respond to additional fraud risks.
|
|
•
|
The Company's controls applicable to the accounting for the reconsolidation of its Zimbabwe subsidiary did not operate effectively.
|
Changes in Internal Control over Financial Reporting
Other than described below, during the three months ended March 31, 2016, there were no changes that have materially affected, or are reasonably likely to materially affect, the Company’s internal control over financial reporting.
The Company has completed or undertaken plans to remediate these control deficiencies that constituted material weaknesses:
|
•
|
The Kenyan management, including the Head of Operations, Deputy Managing and Finance Director, and Financial Controller believed to have been key directors of the collusion are no longer with the Company.
|
|
•
|
The Company is in the process of standardizing key controls. As part of this process, which is being led by Corporate Audit Services, the deficient control activities at the Kenya location will be replaced with the standardized key control activities. The control activities in Kenya will be tested for design and operating effectiveness in fiscal 2017.
|
|
•
|
Two new regional controller positions have been created for the Africa region. These positions will add an additional layer of review and oversight of African entities, and will function as “super” financial directors of three entities each, as well as being part of the regional team. The entities for which each position is responsible for will rotate every two years.
|
|
•
|
This African regional controller team will perform new analyses, which may include but are not limited to trend analyses over time, crop information and inventory turns (including by comparison to other origins within the region) to corroborate accounting amounts, sign off on quarterly packet reviews and account reconciliations, and monitoring controls around the financial close process. Additionally, the regional controllers will regularly visit origins for their work to help assess monthly and quarterly financial processes.
|
|
•
|
The Company will enhance regional review procedures at the Corporate level with the implementation of semi-annual regional risk management committee meetings to review business risks and controls, and results of the region based on new analyses and trends as well.
|
|
•
|
The Company’s fraud risk assessment of a location will be included as a factor in determining the scope of our SOX compliance program, in order to more specifically tailor the design of internal control over financial reporting to mitigate the risk of material misstatement caused by fraud or otherwise.
|
|
•
|
The Company modified its compliance program with the hiring of a new Corporate Compliance Director in January 2016. This modification bifurcated management of the compliance program from the Chief Accounting Officer's role and reports directly to the Chief Financial Officer. This position is dedicated to enhance and strengthen our global compliance environment. This position will also oversee the global administration and enforcement of our compliance policies and procedures.
|
|
•
|
The Company will continue to engage third party technical expertise to address complex and unusual transactions in the future.
|
In light of the material weakness referred to above, we performed additional analyses and procedures in order to conclude that our consolidated financial statements in this Form 10-K for the year ended March 31, 2016 are fairly presented, in all material respects, in accordance with US GAAP.
The effectiveness of our internal control over financial reporting as of March 31, 2016 has been audited by Deloitte & Touche, LLP, an independent registered public accounting firm, as stated in their attestation report that follows.
- 94
-
ITEM 9A.
CONTROLS AND PROCEDURES
(
continued)
Report of Independent Registered Public Accounting Firm
To the Board of Directors and Stockholders of Alliance One International, Inc.:
We have audited Alliance One International, Inc. and subsidiaries (the "Company's") internal control over financial reporting as of March 31, 2016, based on criteria established in
Internal Control - Integrated Framework (2013)
issued by the Committee of Sponsoring Organizations of the Treadway Commission. The Company's management is responsible for maintaining effective internal control over financial reporting and for its assessment of the effectiveness of internal control over financial reporting, included in the accompanying
Management’s Report on Internal Control Over Financial Reporting
. Our responsibility is to express an opinion on the Company's internal control over financial reporting based on our audit.
We conducted our audit in accordance with the standards of the Public Company Accounting Oversight Board (United States). Those standards require that we plan and perform the audit to obtain reasonable assurance about whether effective internal control over financial reporting was maintained in all material respects. Our audit included obtaining an understanding of internal control over financial reporting, assessing the risk that a material weakness exists, testing and evaluating the design and operating effectiveness of internal control based on that risk, and performing such other procedures as we considered necessary in the circumstances. We believe that our audit provides a reasonable basis for our opinion.
A company's internal control over financial reporting is a process designed by, or under the supervision of, the company's principal executive and principal financial officers, or persons performing similar functions, and effected by the company's board of directors, management, and other personnel to provide reasonable assurance regarding the reliability of financial reporting and the preparation of financial statements for external purposes in accordance with generally accepted accounting principles. A company's internal control over financial reporting includes those policies and procedures that (1) pertain to the maintenance of records that, in reasonable detail, accurately and fairly reflect the transactions and dispositions of the assets of the company; (2) provide reasonable assurance that transactions are recorded as necessary to permit preparation of financial statements in accordance with generally accepted accounting principles, and that receipts and expenditures of the company are being made only in accordance with authorizations of management and directors of the company; and (3) provide reasonable assurance regarding prevention or timely detection of unauthorized acquisition, use, or disposition of the company's assets that could have a material effect on the financial statements.
Because of the inherent limitations of internal control over financial reporting, including the possibility of collusion or improper management override of controls, material misstatements due to error or fraud may not be prevented or detected on a timely basis. Also, projections of any evaluation of the effectiveness of the internal control over financial reporting to future periods are subject to the risk that the controls may become inadequate because of changes in conditions, or that the degree of compliance with the policies or procedures may deteriorate.
A material weakness is a deficiency, or a combination of deficiencies, in internal control over financial reporting, such that there is a reasonable possibility that a material misstatement of the company’s annual or interim financial statements will not be prevented or detected on a timely basis. The following material weaknesses have been identified and included in management's assessment:
Control Activities - The design, implementation and operation of process level controls in the Kenya location were ineffective.
Monitoring - The Company’s regional monitoring controls were ineffective.
Risk Assessment - The Company’s risk assessment was not sufficient to address risks of material misstatement due to fraud.
Accounting for Reconsolidation of Subsidiary - The Company's controls applicable to the accounting for the reconsolidation of its Zimbabwe subsidiary did not operate effectively.
These material weaknesses were considered in determining the nature, timing, and extent of audit tests applied in our audit of the consolidated financial statements and financial statement schedule as of and for the year ended March 31, 2016, of the Company and this report does not affect our report on such financial statements and financial statement schedule.
In our opinion, because of the effect of the material weaknesses identified above on the achievement of the objectives of the control criteria, the Company has not maintained effective internal control over financial reporting as of March 31, 2016, based on the criteria established in
Internal Control - Integrated Framework (2013)
issued by the Committee of Sponsoring Organizations of the Treadway Commission.
We have also audited, in accordance with the standards of the Public Company Accounting Oversight Board (United States), the consolidated financial statements and financial statement schedule as of and for the year ended March 31, 2016, of the Company and our report dated July 11, 2016 expressed an unqualified opinion on those consolidated financial statements and financial statement schedule and included an explanatory paragraph regarding recognition of a non-cash gain in connection with the reconsolidation of its Zimbabwe subsidiary and the Company's adoption of a new accounting standard for classification of deferred taxes.
/s/ Deloitte & Touche LLP
Raleigh, North Carolina
July 11, 2016
- 95
-
ITEM 9B.
OTHER INFORMATION
On July 6, 2016, the Company entered into the Fifth Amendment to the Amended and Restated Credit Agreement (the “Fifth Amendment"), which amended the Credit Agreement dated as of July 2, 2009, as amended and restated as of August 1, 2013, between the Company, certain of its subsidiaries, the lenders party thereto and Deutsche Bank Trust Company Americas, as administrative agent (as so amended and restated, the “Credit Agreement”). The Fifth Amendment clarified that for the purpose of certain covenants under the Credit Agreement up to $100 million of debt of the Company’s MTC subsidiary in respect of loans under a credit facility with a third-party lender funded by the Company’s Intabex subsidiary pursuant to a participation interest in such loans or an assignment in respect of such loans consistent with past practices prior to the date of the Fifth Amendment (so long as such loan proceeds are used in connection with the purchase, processing, exporting and financing of the contract growing and buying of tobacco) shall be deemed to be debt owed by MTC to Intabex (and not the third-party lender) as intercompany debt regardless of the presentation of such debt in the consolidated financial statements of the Company in accordance with GAAP, and waived any noncompliance by the Company under the Credit Agreement that may have occurred prior to the effectiveness of the Fifth Amendment as a result of such debt not being treated as intercompany debt, as well as the Company’s failure to deliver audited financial statements for the fiscal year ended March 31, 2016 within the time period required under the Credit Agreement if such audited financial statements are delivered by July 19, 2016.
ITEM 10.
DIRECTORS, EXECUTIVE OFFICERS AND CORPORATE GOVERNANCE
The information concerning directors and persons nominated to become directors of Alliance One International, Inc. included in the Proxy Statement under the headings “Board of Directors - Proposal One-Election of Directors” and “Board of Directors - Director Biographies” is incorporated herein by reference. The information concerning the executive officers of the Company included in Part I, Item I of this Annual Report on Form 10-K under the heading “Business - Executive Officers of Alliance One International, Inc.” is incorporated herein by reference.
Audit Committee
The information included in the Proxy Statement under the headings “Board of Directors - Board Committees and Membership” and “Audit Matters” is incorporated herein by reference.
Section 16(a) Compliance
The information included in the Proxy Statement under the heading “Ownership of Equity Securities - Section 16(a) Beneficial Ownership Reporting Compliance” is incorporated herein by reference.
Code of Business Conduct
The information included in the Proxy Statement under the heading “Governance of the Company - Code of Business Conduct” is incorporated herein by reference.
Corporate Governance
The Board of Directors has adopted corporate governance guidelines and charters for its Audit Committee, Executive Compensation Committee and Governance and Nominating Committee. These governance documents are available on our website, www.aointl.com, or by written request, without charge, addressed to: Corporate Secretary, Alliance One International, Inc., 8001 Aerial Center Parkway, Morrisville, NC 27560-8417.
ITEM 11.
EXECUTIVE COMPENSATION
The information contained in the Proxy Statement under the captions “Board of Directors – Compensation of Directors” and “Executive Compensation” is incorporated herein by reference.
- 96
-
ITEM 12.
SECURITY OWNERSHIP OF CERTAIN BENEFICIAL OWNERS AND MANAGEMENT
AND RELATED STOCKHOLDER MATTERS
|
EQUITY COMPENSATION PLAN INFORMATION
|
|||
|
as of March 31, 2016
|
|||
|
Plan Category
|
Number of Securities to be Issued Upon Exercise of Outstanding Options, Warrants and Rights
(a) (1) |
Weighted-Average Exercise Price of Outstanding Options, Warrants and Rights
(b) (2) |
Number of Securities Remaining Available for Future Issuance Under Equity Compensation Plans
(excluding securities reflected in column (a)) (c) (3) |
|
Equity Compensation Plans Approved by Security Holders
|
611,860
|
$60.70
|
170,982
|
|
Equity Compensation Plans Not Approved by Security Holders
|
—
|
Not Applicable
|
—
|
|
Total
|
611,860
|
$60.70
|
170,982
|
1) These shares consist of 603,485 stock options, restricted stock units and performance share units issued and outstanding under the 2007 Incentive Plan and 8,375 stock options issued and outstanding under prior plans of the Company and its predecessors.
(2) The weighted-average exercise price does not take into account restricted stock units or performance share units.
(3) The Incentive Plan allows for these shares to be issued in a variety of forms, including stock options, stock appreciation rights, stock awards, stock units, performance awards and incentive awards. Further, the Number of Securities Remaining Available for Future Issuance as set forth in this column (c) will increase by the Number of Securities to be Issued (as reflected in column (a)) which are associated with options, rights and warrants plus other stock awards that are forfeited from time to time.
The information contained in the Proxy Statement under the caption "Ownership of Equity Securities," together with the information included herein is incorporated herein by reference.
ITEM 13.
CERTAIN RELATIONSHIPS AND RELATED TRANSACTIONS, AND DIRECTOR
INDEPENDENCE
The information contained in the Proxy Statement under the captions “Governance of the Company -Determination of Independence of Directors,” “Board of Directors - Independence,” “Board of Directors – Compensation of Directors,” and "Executive Compensation - Compensation Discussion and Analysis - Employment and Consulting Agreements" is incorporated herein by reference.
ITEM 14.
PRINCIPAL ACCOUNTING FEES AND SERVICES
The information contained in the Proxy Statement under the captions “Audit Matters - Policy for Pre-Approval of Audit and Non-Audit Services” and “Audit Matters - Audit and Non-Audit Fees” is incorporated herein by reference.
- 97
-
ITEM 15.
EXHIBITS, FINANCIAL STATEMENT SCHEDULES
(a)
(1) and (2)
LIST OF FINANCIAL STATEMENTS AND FINANCIAL STATEMENT SCHEDULES
Statements of Consolidated Operations –Years ended March 31, 2016, 2015 and 2014
Statements of Consolidated Comprehensive Income (Loss) - Years ended March 31, 2016, 2015 and 2014
Consolidated Balance Sheets - March 31, 2015 and 2015
Statements of Consolidated Stockholders' Equity - Years ended March 31, 2016, 2015 and 2014
Statements of Consolidated Cash Flows - Years ended March 31, 2016, 2015 and 2014
Notes to Consolidated Financial Statements
Report of Deloitte & Touche LLP
Management’s Report on Internal Control Over Financial Reporting
Report of Independent Registered Public Accounting Firm on Internal Control
Financial Statement Schedules:
Schedule II - Valuation and Qualifying Accounts
(b) Exhibits
|
The following documents are filed as exhibits to this Form 10‑K pursuant to Item 601 of Regulation S‑K:
|
||||
|
3.01
|
|
Amended and Restated Articles of Incorporation of Alliance One International, Inc., as amended, incorporated by reference to Exhibit 3.01 of the Quarterly Report on Form 10-Q for the period ended June 30, 2015, filed August 5, 2015 (SEC File No. 001-13684).
|
||
|
3.02
|
|
Amended and Restated Bylaws of Alliance One International, Inc., incorporated by reference to Exhibit 3.2 of the Current Report on Form 8-K, filed June 29, 2015 (SEC File No. 001-13684).
|
||
|
4.01
|
|
Specimen of Common Stock certificate incorporated by reference to Exhibit 4.1 to the Current Report on Form 8-K, filed June 29, 2015 (SEC File No. 001-13684).
|
||
|
4.02
|
|
Indenture dated as of August 1, 2013 among Alliance One International, Inc., Law Debenture Trust Company of New York, as trustee, Law Debenture Trust Company of New York, as collateral trustee, and Deutsche Bank Trust Company Americas, as registrar and paying agent, relating to 9.875% Senior Secured Second Lien Notes due 2021, incorporated by reference to Exhibit 4.1 to the Current Report on Form 8-K dated August 1, 2013 of Alliance One International, Inc. (SEC File No. 001-13684).
|
||
|
10.01
|
|
Amendment and Restatement Agreement dated as of July 26, 2013 among Alliance One International, Inc., Intabex Netherlands B.V., Alliance One International AG, the Lenders party thereto, and Deutsche Bank Trust Company Americas, as administrative agent, incorporated by reference to Exhibit 10.1 to the Current Report on Form 8-K dated August 1, 2013 of Alliance One International, Inc. (SEC File No. 001-13684).
|
||
|
10.02
|
|
First Amendment to Amended and Restated Credit Agreement dated as of May 30, 2014 among Alliance One International, Inc., Intabex Netherlands B.V., Alliance One International AG, the Lenders party thereto, and Deutsche Bank Trust Company Americas, as administrative agent, incorporated by reference to Exhibit 10.1 to the Quarterly Report on Form 10-Q for the period ended June 30, 2014 (SEC File No. 001-13684).
|
||
|
10.03
|
|
Second Amendment to Amended and Restated Credit Agreement dated as of February 6, 2015 among Alliance One International, Inc., Intabex Netherlands B.V., Alliance One International AG, the Lenders party thereto, and Deutsche Bank Trust Company Americas, as administrative agent, incorporated by reference to Exhibit 10.03 to the Annual Report on Form 10-K for the year ended March 31, 2015, filed June 8, 2015 (SEC File No. 001-13684).
|
||
|
10.04
|
|
Third Amendment to Amended and Restated Credit Agreement dated as of June 2, 2015 among Alliance One International, Inc., Intabex Netherlands B.V., Alliance One International AG, the Lenders party thereto, and Deutsche Bank Trust Company Americas, as administrative agent, incorporated by reference to Exhibit 10.04 to the Annual Report on Form 10-K for the year ended March 31, 2015, filed June 8, 2015 (SEC File No. 001-13684).
|
||
|
10.05
|
|
Amended and Restated Receivables Purchase Agreement dated as of March 30, 2012 among Alliance One International, Inc., Finacity Receivables 2006-2, LLC and Finacity Corporation, incorporated by reference to Exhibit 10.31 to Alliance One International, Inc.'s Annual Report on Form 10-K for the year ended March 31, 2012, filed June 13, 2012 (SEC File No. 001-13684).
|
||
- 98
-
ITEM 15.
EXHIBITS, FINANCIAL STATEMENT SCHEDULES
(continued)
(b)
Exhibits
(continued)
|
10.06
|
|
Second Amended and Restated Receivables Purchase Agreement dated as of March 30, 2012 among Alliance One International AG, Finacity Receivables 2006-2, LLC and Finacity Corporation, incorporated by reference to Exhibit 10.32 to Alliance One International, Inc.'s Annual Report on Form 10-K for the year ended March 31, 2012, filed June 13, 2012 (SEC File No. 001-13684).
|
||
|
10.07
|
|
Second Amended and Restated Receivables Sale Agreement dated as of March 30, 2012 among Finacity Receivables 2006-2, LLC, Finacity Corporation, Alliance One International AG, Norddeutsche Landesbank Girozentrale, Standard Chartered Bank, the other Purchaser Agents from time to time party thereto, the Bank Purchasers from time to time party thereto, Hannover Funding Company LLC, and the other Conduit Purchasers from time to time party thereto, incorporated by reference to Exhibit 10.33 to Alliance One International, Inc.'s Annual Report on Form 10-K for the year ended March 31, 2012, filed June 13, 2012 (SEC File No. 001-13684).
|
||
|
10.08
|
|
Amended and Restated Alliance One International, Inc. 2007 Incentive Plan, incorporated by reference to Appendix A to the definitive proxy statement of Alliance One International, Inc. filed on July 11, 2011 (SEC File No. 001-13684).*
|
||
|
10.09
|
|
Form of Restricted Stock Unit Agreement, incorporated by reference to Exhibit 10.2 to Alliance One International, Inc.’s Quarterly Report on Form 10-Q for the period ended December 31, 2010, filed February 4, 2011 (SEC File No. 001-13684).*
|
||
|
10.10
|
|
Form of Restricted Stock Unit Agreement (Supplemental Award), incorporated by reference to Exhibit 10.3 to Alliance One International, Inc.’s Quarterly Report on Form 10-Q for the period ended December 31, 2010, filed February 4, 2011 (SEC File No. 001-13684).*
|
||
|
10.11
|
|
Form of Performance-based Stock Unit Award Agreement, incorporated by reference to Exhibit 10.1 to Alliance One International, Inc.’s Quarterly Report on Form 10-Q for the period ended December 31, 2010, filed February 4, 2011 (SEC File No. 001-13684).*
|
||
|
10.12
|
|
Form of Non-Qualified Stock Option Award Agreement incorporated by reference to Exhibit 10.2 of the Current Report on Form 8-K, filed on March 28, 2011 (SEC File No 001-13684).*
|
||
|
10.13
|
|
DIMON Incorporated 2003 Incentive Plan, incorporated by reference to Exhibit 10.14 of DIMON’s Annual Report on Form 10-K for the year ended March 31, 2004, filed June 10, 2004 (SEC File No. 001-13684).*
|
||
|
10.14
|
|
Alliance One International, Inc. Pension Equity Plan (amended and restated effective January 1, 2009), incorporated by reference to Exhibit 10.04 to Alliance One International, Inc.’s Quarterly Report on Form 10-Q for the period ended December 31, 2008, filed February 17, 2009 (SEC File No. 001-13684).*
|
||
|
10.15
|
|
Standard Commercial Corporation Supplemental Retirement Plan, as Amended and Restated for Benefits Accrued after 2004, incorporated by reference to Alliance One International, Inc.’s Current Report on Form 8-K, filed January 7, 2009 (SEC File No. 001-13684).*
|
||
|
10.16
|
|
Alliance One International, Inc. Supplemental Executive Retirement Plan (amended and restated as of January 1, 2009), incorporated by reference to Exhibit 10.1 to Alliance One International, Inc.’s Amendment No. 1 to Form 10-Q/A for the period ended December 31, 2008, filed March 9, 2009 (SEC File No. 001-13684).*
|
||
|
10.17
|
|
Alliance One International, Inc. Supplemental Retirement Account Plan (amended and restated as of January 1, 2009), incorporated by reference to Exhibit 10.6 to Alliance One International, Inc.’s Quarterly Report on Form 10-Q for the period ended December 31, 2008, filed February 17, 2009 (SEC File No. 001-13684).*
|
||
|
10.18
|
|
Executive Employment Agreement dated as of March 1, 2013 between Alliance One International, Inc. and J. Pieter Sikkel, incorporated by reference to Exhibit 10.1 to the Current Report on Form 8-K, filed February 6, 2013 (SEC File No. 001-13684).*
|
||
|
10.19
|
|
Summary of director and executive officer compensation arrangements (filed herewith).*
|
||
|
10.20
|
|
Description of the material terms of the Alliance One International, Inc. management incentive plan as implemented by the Executive Compensation Committee of the Board of Directors, incorporated by reference to the text appearing under the heading “Executive Compensation—Compensation Discussion and Analysis—Incentives—Annual Incentives” beginning on page 25 of Alliance One International, Inc.’s definitive proxy statement on Schedule 14A, filed July 8, 2011 (SEC File No. 001-13684) *
|
||
- 99
-
ITEM 15.
EXHIBITS, FINANCIAL STATEMENT SCHEDULES
(continued)
(b)
Exhibits
(continued)
|
12
|
|
Ratio of Earnings to Fixed Charges (filed herewith).
|
||
|
21
|
|
List of Subsidiaries (filed herewith).
|
||
|
23.1
|
|
Consent of Deloitte & Touche LLP (filed herewith).
|
||
|
31.01
|
|
Certification of Chief Executive Officer pursuant to Section 302 of the Sarbanes-Oxley Act of 2002 (filed herewith).
|
||
|
31.02
|
|
Certification of Chief Financial Officer pursuant to Section 302 of the Sarbanes-Oxley Act of 2002 (filed herewith).
|
||
|
32
|
|
Certification of Chief Executive Officer and Chief Financial Officer pursuant to Section 906 of the Sarbanes-Oxley Act of 2002 (filed herewith).
|
||
|
101
|
|
The following materials from the Company's Annual Report on Form 10-K for the fiscal year ended March 31, 2016, formatted in XBRL: (i) Statements of Consolidated Operations for the three years ended March 31, 2016, 2015 and 2014; (ii) Consolidated Statements of Comprehensive Income (Loss) for the three years ended March 31, 2016, 2015 and 2014; (iii) Consolidated Balance Sheets as of March 31, 2016 and 2015; (iv) Statements of Consolidated Stockholders' Equity for the three years ended March 31, 2016, 2015 and 2014; (v) Statements of Consolidated Cash Flows for the three years ended March 31, 2016, 2015 and 2014; (vi) Notes to Consolidated Financial Statements; and (vii) Schedule II - Valuation and Qualifying Accounts (submitted herewith)
|
||
|
* Indicates management contract or compensatory plan or arrangement.
|
||||
|
Instruments with respect to long-term debt, the amount of securities authorized thereunder being less than ten percent
of the Company’s consolidated assets, have been omitted and the Company agrees to furnish such instruments to
the Securities and Exchange Commission upon request.
|
||||
(c) Financial Statement Schedules:
|
Schedule II – Valuation and Qualifying Accounts appears on the following page of this Form 10-K. All other schedules are not required under the related instructions or are not applicable and therefore have been omitted.
|
|||
- 100
-
|
SCHEDULE II‑VALUATION AND QUALIFYING ACCOUNTS
ALLIANCE ONE INTERNATIONAL, INC. AND SUBSIDIARIES |
|||||
|
COL. A
|
COL. B
|
COL. C
|
COL. D
|
COL. E
|
|
|
ADDITIONS
|
|||||
|
(1)
|
(2)
|
||||
|
DESCRIPTION
(in thousands)
|
Balance at
Beginning of Period |
Charged to
Costs and Expenses |
Charged to
Other Accounts |
Deductions
|
Balance at
End of Period |
|
Year ended March 31, 2014
|
|||||
|
Deducted from asset accounts:
|
|||||
|
Allowance for doubtful accounts
|
$3,370
|
$551
|
$—
|
$503 (A)
|
$3,418
|
|
Valuation allowance on
deferred tax assets
|
$160,232
|
$24,938
|
$(3,360) (B)
|
$(33) (A)
|
$181,843
|
|
Year ended March 31, 2015
|
|||||
|
Deducted from asset accounts:
|
|||||
|
Allowance for doubtful accounts
|
$3,418
|
$12,456
|
$—
|
$1,921 (A)
|
$13,953
|
|
Valuation allowance on
deferred tax assets
|
$181,843
|
$(14,926) (C)
|
$3,999 (B)
|
$1,112 (A)
|
$169,804
|
|
Year ended March 31, 2016
|
|||||
|
Deducted from asset accounts:
|
|||||
|
Allowance for doubtful accounts
|
$13,953
|
$(169)
|
$—
|
$(800) (A)
|
$12,984
|
|
Valuation allowance on
deferred tax assets
|
$169,804
|
(47,103) (C)
|
$(3,370) (B)
|
813 (A)
|
$118,518
|
(A) Currency translation and direct write off.
(B) Accumulated other comprehensive loss
(C) Deferred tax on unremitted earnings of foreign subsidiaries
- 101
-
|
SIGNATURES
|
|
|
Pursuant to the requirements of Section 13 or 15(d) of the Securities Exchange Act of 1934, the registrant has duly caused this report to be signed on its behalf by the undersigned, thereunto duly authorized on July 11, 2016.
|
|
|
ALLIANCE ONE INTERNATIONAL, INC. (Registrant)
|
|
|
/s/ J. Pieter Sikkel
By
________________________________________________
J. Pieter Sikkel
President and Chief Executive Officer
|
|
|
Pursuant to the requirements of the Securities Act of 1934, this report has been signed below by the following persons on behalf of the registrant and in the capacities indicated on July 11, 2016.
|
|
|
/s/ J. Pieter Sikkel
By
________________________________________________
J. Pieter Sikkel
President and Chief Executive Officer
(Principal Executive Officer)
|
/s/ Carl L. Hausmann
By
________________________________________________
Carl L. Hausmann
Director
|
|
/s/ Joel L. Thomas
By
________________________________________________
Joel L. Thomas
Executive Vice President and
Chief Financial Officer
(Principal Financial Officer)
|
/s/ Jeffrey A. Eckmann
By
________________________________________________
Jeffrey A. Eckmann
Director
|
|
/s/ Todd B. Compton
By
________________________________________________
Todd B. Compton
Vice President - Controller
(Principal Accounting Officer)
|
/s/ Norman A. Scher
By
________________________________________________
Norman A. Scher
Director
|
|
/s/ Joyce L. Fitzpatrick
By
________________________________________________
Joyce L. Fitzpatrick
Director
|
/s/ John D. Rice
By
________________________________________________
John D. Rice
Director
|
|
/s/ C. Richard Green, Jr.
By
________________________________________________
C. Richard Green Jr.
Director
|
/s/ Martin R. Wade III
By
________________________________________________
Martin R. Wade III
Director
|
|
/s/ Nigel G. Howard
By
________________________________________________
Nigel G. Howard
Director
|
|
|
/s/ Mark W. Kehaya
By
________________________________________________
Mark W. Kehaya
Chairman
|
|
- 102
-
|
EXHIBIT INDEX
|
|||
|
Exhibits
|
|||
|
3.01
|
Amended and Restated Articles of Incorporation of Alliance One International, Inc., as amended, incorporated by reference to Exhibit 3.01 of the Quarterly Report on Form 10-Q for the period ended June 30, 2015, filed August 5, 2015 (SEC File No. 001-13684).
|
||
|
3.02
|
Amended and Restated Bylaws of Alliance One International, Inc., incorporated by reference to Exhibit 3.2 of the Current Report on Form 8-K, filed June 29, 2015 (SEC File No. 001-13684).
|
||
|
4.01
|
Specimen of Common Stock certificate incorporated by reference to Exhibit 4.1 to the Current Report on Form 8-K, filed June 29, 2015 (SEC File No. 001-13684).
|
||
|
4.02
|
Indenture dated as of August 1, 2013 among Alliance One International, Inc., Law Debenture Trust Company of New York, as trustee, Law Debenture Trust Company of New York, as collateral trustee, and Deutsche Bank Trust Company Americas, as registrar and paying agent, relating to 9.875% Senior Secured Second Lien Notes due 2021, incorporated by reference to Exhibit 4.1 to the Current Report on Form 8-K dated August 1, 2013 of Alliance One International, Inc. (SEC File No. 001-13684).
|
||
|
10.01
|
Amendment and Restatement Agreement dated as of July 26, 2013 among Alliance One International, Inc., Intabex Netherlands B.V., Alliance One International AG, the Lenders party thereto, and Deutsche Bank Trust Company Americas, as administrative agent, incorporated by reference to Exhibit 10.1 to the Current Report on Form 8-K dated August 1, 2013 of Alliance One International, Inc. (SEC File No. 001-13684).
|
||
|
10.02
|
First Amendment to Amended and Restated Credit Agreement dated as of May 30, 2014 among Alliance One International, Inc., Intabex Netherlands B.V., Alliance One International AG, the Lenders party thereto, and Deutsche Bank Trust Company Americas, as administrative agent, incorporated by reference to Exhibit 10.1 to the Quarterly Report on Form 10-Q for the period ended June 30, 2014 (SEC File No. 001-13684).
|
||
|
10.03
|
Second Amendment to Amended and Restated Credit Agreement dated as of February 6, 2015 among Alliance One International, Inc., Intabex Netherlands B.V., Alliance One International AG, the Lenders party thereto, and Deutsche Bank Trust Company Americas, as administrative agent, incorporated by reference to Exhibit 10.03 to the Annual Report on Form 10-K for the year ended March 31, 2015, filed June 8, 2015 (SEC File No. 001-13684).
|
||
|
10.04
|
Third Amendment to Amended and Restated Credit Agreement dated as of June 2, 2015 among Alliance One International, Inc., Intabex Netherlands B.V., Alliance One International AG, the Lenders party thereto, and Deutsche Bank Trust Company Americas, as administrative agent, incorporated by reference to Exhibit 10.04 to the Annual Report on Form 10-K for the year ended March 31, 2015, filed June 8, 2015 (SEC File No. 001-13684).
|
||
|
10.05
|
Amended and Restated Receivables Purchase Agreement dated as of March 30, 2012 among Alliance One International, Inc., Finacity Receivables 2006-2, LLC and Finacity Corporation, incorporated by reference to Exhibit 10.31 to Alliance One International, Inc.'s Annual Report on Form 10-K for the year ended March 31, 2012, filed June 13, 2012 (SEC File No. 001-13684).
|
||
|
10.06
|
Second Amended and Restated Receivables Purchase Agreement dated as of March 30, 2012 among Alliance One International AG, Finacity Receivables 2006-2, LLC and Finacity Corporation, incorporated by reference to Exhibit 10.32 to Alliance One International, Inc.'s Annual Report on Form 10-K for the year ended March 31, 2012, filed June 13, 2012 (SEC File No. 001-13684).
|
||
|
10.07
|
Second Amended and Restated Receivables Sale Agreement dated as of March 30, 2012 among Finacity Receivables 2006-2, LLC, Finacity Corporation, Alliance One International AG, Norddeutsche Landesbank Girozentrale, Standard Chartered Bank, the other Purchaser Agents from time to time party thereto, the Bank Purchasers from time to time party thereto, Hannover Funding Company LLC, and the other Conduit Purchasers from time to time party thereto, incorporated by reference to Exhibit 10.33 to Alliance One International, Inc.'s Annual Report on Form 10-K for the year ended March 31, 2012, filed June 13, 2012 (SEC File No. 001-13684).
|
||
|
10.08
|
Amended and Restated Alliance One International, Inc. 2007 Incentive Plan, incorporated by reference to Appendix A to the definitive proxy statement of Alliance One International, Inc. filed on July 11, 2011(SEC File No. 001-13684).*
|
||
|
10.09
|
Form of Restricted Stock Unit Agreement, incorporated by reference to Exhibit 10.2 to Alliance One International, Inc.’s Quarterly Report on Form 10-Q for the period ended December 31, 2010, filed February 4, 2011 (SEC File No. 001-13684).*
|
||
|
10.10
|
Form of Restricted Stock Unit Agreement (Supplemental Award), incorporated by reference to Exhibit 10.3 to Alliance One International, Inc.’s Quarterly Report on Form 10-Q for the period ended December 31, 2010, filed February 4, 2011 (SEC File No. 001-13684).*
|
||
|
10.11
|
Form of Performance-based Stock Unit Award Agreement, incorporated by reference to Exhibit 10.1 to Alliance One International, Inc.’s Quarterly Report on Form 10-Q for the period ended December 31, 2010, filed February 4, 2011 (SEC File No. 001-13684).*
|
||
|
10.12
|
Form of Non-Qualified Stock Option Award Agreement incorporated by reference to Exhibit 10.2 of the Current Report on Form 8-K, filed on March 28, 2011 (SEC File No 001-13684).*
|
||
|
10.13
|
DIMON Incorporated 2003 Incentive Plan, incorporated by reference to Exhibit 10.14 of DIMON’s Annual Report on Form 10-K for the year ended March 31, 2004, filed June 10, 2004 (SEC File No. 001-13684).*
|
||
EXHIBIT INDEX
Exhibits
(continued)
|
10.14
|
|
Alliance One International, Inc. Pension Equity Plan (amended and restated effective January 1, 2009), incorporated by reference to Exhibit 10.04 to Alliance One International, Inc.’s Quarterly Report on Form 10-Q for the period ended December 31, 2008, filed February 17, 2009 (SEC File No. 001-13684).*
|
||
|
10.15
|
|
Standard Commercial Corporation Supplemental Retirement Plan, as Amended and Restated for Benefits Accrued after 2004, incorporated by reference to Alliance One International, Inc.’s Current Report on Form 8-K, filed January 7, 2009 (SEC File No. 001-13684).*
|
||
|
10.16
|
|
Alliance One International, Inc. Supplemental Executive Retirement Plan (amended and restated as of January 1, 2009), incorporated by reference to Exhibit 10.1 to Alliance One International, Inc.’s Amendment No. 1 to Form 10-Q/A for the period ended December 31, 2008, filed March 9, 2009 (SEC File No. 001-13684).*
|
||
|
10.17
|
|
Alliance One International, Inc. Supplemental Retirement Account Plan (amended and restated as of January 1, 2009), incorporated by reference to Exhibit 10.6 to Alliance One International, Inc.’s Quarterly Report on Form 10-Q for the period ended December 31, 2008, filed February 17, 2009 (SEC File No. 001-13684).*
|
||
|
10.18
|
|
Executive Employment Agreement dated as of March 1, 2013 between Alliance One International, Inc. and J. Pieter Sikkel, incorporated by reference to Exhibit 10.1 to the Current Report on Form 8-K, filed February 6, 2013 (SEC File No. 001-13684).*
|
||
|
10.19
|
|
Summary of director and executive officer compensation arrangements (file herewith).*
|
||
|
10.20
|
|
Description of the material terms of the Alliance One International, Inc. management incentive plan as implemented by the Executive Compensation Committee of the Board of Directors, incorporated by reference to the text appearing under the heading “Executive Compensation—Compensation Discussion and Analysis—Incentives—Annual Incentives” beginning on page 25 of Alliance One International, Inc.’s definitive proxy statement on Schedule 14A, filed July 8, 2011 (SEC File No. 001-13684).*
|
||
|
12
|
|
Ratio of Earnings to Fixed Charges (filed herewith).
|
||
|
21
|
|
List of Subsidiaries (filed herewith).
|
||
|
23.1
|
|
Consent of Deloitte & Touche LLP (filed herewith).
|
||
|
31.01
|
|
Certification of Chief Executive Officer pursuant to Section 302 of the Sarbanes-Oxley Act of 2002 (filed herewith).
|
||
|
31.02
|
|
Certification of Chief Financial Officer pursuant to Section 302 of the Sarbanes-Oxley Act of 2002 (filed herewith).
|
||
|
32
|
|
Certification of Chief Executive Officer and Chief Financial Officer pursuant to Section 906 of the Sarbanes-Oxley Act of 2002 (filed herewith).
|
||
|
101
|
|
The following materials from the Company's Annual Report on Form 10-K for the fiscal year ended March 31, 2016, formatted in XBRL: (i) Statements of Consolidated Operations for the three years ended March 31, 2016, 2015 and 2014; (ii) Consolidated Statements of Comprehensive Income (Loss) for the three years ended March 31, 2016, 2015 and 2014; (iii) Consolidated Balance Sheets as of March 31, 2016 and 2015; (iv) Statements of Consolidated Stockholders' Equity for the three years ended March 31, 2016, 2015 and 2014; (v) Statements of Consolidated Cash Flows for the three years ended March 31, 2016, 2015 and 2014; (vi) Notes to Consolidated Financial Statements; and (vii) Schedule II - Valuation and Qualifying Accounts (submitted herewith)
|
||
|
*
|
Indicates management contract or compensatory plan or arrangement.
|
|||
|
Instruments with respect to long-term debt, the amount of securities authorized thereunder being less than ten percent of the Company’s consolidated assets, have been omitted and the Company agrees to furnish such instruments to the Securities and Exchange Commission upon request.
|
||||
- 103
-
TABLE OF CONTENTS
Part IItem 1. BusinessItem 1A. Risk FactorsItem 1B. Unresolved Staff CommentsItem 2. PropertiesItem 3. Legal ProceedingsItem 4. Mine Safety DisclosuresPart IIItem 5. Market For Registrant's Common Equity, Related Stockholder Matters andItem 6. Selected Financial DataItem 7. Management S Discussion and Analysis Of FinancialItem 7. Management's Discussion and Analysis Of FinancialItem 7A. Quantitative and Qualitative Disclosures About Market RiskItem 8. Financial Statements and Supplementary DataItem 8. Financial Statements and Supplementary Data (continued)Note 1 Significant Accounting PoliciesNote 1 - Significant Accounting Policies (continued)Note 2 InventoriesNote 3 Variable Interest EntitiesNote 4 Restructuring and Asset Impairment ChargesNote 4 Restructuring and Asset Impairment Charges (continued)Note 5 Goodwill and Other IntangiblesNote 5 Goodwill and Other Intangibles (continued)Note 6 Derivative and Other Financial InstrumentsNote 6 Derivative and Other Financial Instruments (continued)Note 7 Short-term Borrowing ArrangementsNote 8 Long-term DebtNote 8 Long-term Debt (continued)Note 8 - Long-term Debt (continued)Note 9 - Long-term LeasesNote 10 Equity in Net Assets Of Investee CompaniesNote 11 Stock Based CompensationNote 11 - Stock-based Compensation (continued)Note 12 Income TaxesNote 12 Income Taxes (continued)Note 12 - Income Taxes (continued)Note 13 Employee BenefitsNote 13 - Employee Benefits (continued)Note 14 Segment InformationNote 14 - Segment Information (continued)Note 15 Foreign Currency TranslationNote 16 Contingencies and Other InformationNote 17 Sale Of ReceivablesNote 17 Sale Of Receivables (continued)Note 18 Fair Value MeasurementsNote 18 Fair Value Measurements ( Continued)Note 18 - Fair Value Measurements (continued)Note 19 Related Party TransactionsNote 20 Selected Quarterly Financial Data (unaudited)Note 21 - Subsequent EventsNote 21 - Subsequent Events (continued)Note 22 - Reconsolidation Of MtcNote 22 - Reconsolidation Of Mtc (continued)Note 23 - Reconciliation Of Previously Reported Amounts To Amounts RestatedNote 23 - Reconciliation Of Previously Reported Amounts To Amounts Revised and Restated (continued)Item 9. Changes in and Disagreements with Accountants on AccountingItem 9A. Controls and ProceduresItem 9A. Controls and Procedures (as Revised) (continued)Item 9A. Controls and Procedures ( Continued)Item 9B. Other InformationPart IIIItem 10. Directors, Executive Officers and Corporate GovernanceItem 11. Executive CompensationItem 12. Security Ownership Of Certain Beneficial Owners and ManagementItem 13. Certain Relationships and Related Transactions, and DirectorItem 14. Principal Accounting Fees and ServicesPart IVItem 15. Exhibits, Financial Statement SchedulesItem 15. Exhibits, Financial Statement Schedules (continued)