QUALCOMM INC/DE
10-Ks and 10-Qs
|
|
|
|
|
|
|
|
|
|
|
|
|
|
|
|
|
|
|
|
|
|
|
|
|
|
|
|
|
|
|
|
|
|
|
|
|
|
|
|
|
|
|
|
|
|
|
|
|
|
|
|
|
|
|
|
UNITED STATES
SECURITIES AND EXCHANGE COMMISSION
Washington, D.C. 20549
FORM 10-K
(Mark One)
|
|
|
|
|
þ
|
|
ANNUAL REPORT PURSUANT TO SECTION 13 OR 15(d) OF THE SECURITIES EXCHANGE ACT OF 1934
|
For the fiscal year ended
September 29, 2013
OR
|
|
|
|
|
o
|
|
TRANSITION REPORT PURSUANT TO SECTION 13 OR 15(d) OF THE SECURITIES EXCHANGE ACT OF 1934
|
For the transition period from
to
.
Commission file number 0-19528
QUALCOMM Incorporated
(Exact name of registrant as specified in its charter)
|
|
|
|
|
Delaware
(State or other jurisdiction of
incorporation or organization)
|
|
95-3685934
(I.R.S. Employer
Identification No.)
|
|
|
|
|
|
5775 Morehouse Drive
San Diego, California
(Address of principal executive offices)
|
|
92121-1714
(Zip Code)
|
Registrant’s telephone number, including area code: (858) 587-1121
Securities registered pursuant to section 12(b) of the Act:
|
|
|
|
|
Title of Each Class
|
|
Name of Each Exchange on Which Registered
|
|
Common stock, $0.0001 par value
|
|
NASDAQ Stock Market LLC
|
Securities registered pursuant to Section 12(g) of the Act:
None
Indicate by check mark if the registrant is a well-known seasoned issuer, as defined in Rule 405 of the Securities Act.
YES
þ
NO
o
Indicate by check mark if the registrant is not required to file reports pursuant to Section 13 or Section 15(d) of the Act. YES
o
NO
þ
Indicate by check mark whether the registrant (1) has filed all reports required to be filed by Section 13 or 15(d) of the Securities Exchange Act of 1934 during the preceding 12 months (or for such shorter period that the registrant was required to file such reports), and (2) has been subject to such filing requirements for the past 90 days. YES
þ
NO
o
Indicate by check mark whether the registrant has submitted electronically and posted on its corporate Web site, if any, every Interactive Data File required to be submitted and posted pursuant to Rule 405 of Regulation S-T (§232.405 of this chapter) during the preceding 12 months (or for such shorter period that the registrant was required to submit and post such files). YES
þ
NO
o
Indicate by check mark if disclosure of delinquent filers pursuant to Item 405 of Regulation S-K (§229.405 of this chapter) is not contained herein, and will not be contained, to the best of registrant’s knowledge, in definitive proxy or information statements incorporated by reference in Part III of this Form 10-K or any amendment to this Form 10-K.
o
Indicate by check mark whether the registrant is a large accelerated filer, an accelerated filer, a non-accelerated filer, or a smaller reporting company. See the definitions of “large accelerated filer,” “accelerated filer” and “smaller reporting company” in Rule 12b-2 of the Exchange Act. (Check one):
|
Large Accelerated Filer
|
þ
|
|
Accelerated Filer
|
o
|
|
|
Non-Accelerated Filer
|
o
|
(Do not check if a smaller reporting company)
|
|
Smaller Reporting Company
|
o
|
Indicate by check mark whether the registrant is a shell company (as defined in Rule 12b-2 of the Exchange Act). YES
o
NO
þ
The aggregate market value of the voting and non-voting common equity held by non-affiliates of the registrant at
March 31, 2013
was
$113,760,527,188
, based upon the closing price as reported on the NASDAQ Global Select Market.
The number of shares outstanding of the registrant’s common stock was
1,689,435,673
at
November 4, 2013
.
DOCUMENTS INCORPORATED BY REFERENCE
Portions of the registrant’s Definitive Proxy Statement to be filed with the Commission pursuant to Regulation 14A in connection with the registrant’s
2014
Annual Meeting of Stockholders, to be filed subsequent to the date hereof, are incorporated by reference into Part III of this Report.
QUALCOMM INCORPORATED
Form 10-K
For the Fiscal Year Ended
September 29, 2013
Index
|
|
Page
|
|
|
|
||
|
|
|
|
|
|
||
|
|
|
|
|
|
||
|
|
||
|
|
||
|
|
||
TRADEMARKS
Qualcomm, QChat, Brew, Snapdragon, MSM, Plaza and Wireless Reach are trademarks of Qualcomm Incorporated, registered in the United States and other countries. Omnitracs is a trademark of Omnitracs, Inc., registered in the United States and other countries.
Other products and brand names may be trademarks or registered trademarks of their respective owners.
In this document, the words “Qualcomm,” “we,” “our,” “ours” and “us” refer only to QUALCOMM Incorporated and its subsidiaries and not any other person or entity. This Annual Report (including, but not limited to, the section regarding Management’s Discussion and Analysis of Financial Condition and Results of Operations) contains forward-looking statements regarding our business, financial condition, results of operations and prospects. Words such as “expects,” “anticipates,” “intends,” “plans,” “believes,” “seeks,” “estimates” and similar expressions or variations of such words are intended to identify forward-looking statements, but are not the exclusive means of identifying forward-looking statements in this Annual Report. Additionally, statements concerning future matters such as the development of new products, enhancements or technologies, sales levels, expense levels and other statements regarding matters that are not historical are forward-looking statements.
Although forward-looking statements in this Annual Report reflect our good faith judgment, such statements can only be based on facts and factors currently known by us. Consequently, forward-looking statements are inherently subject to risks and uncertainties and actual results and outcomes may differ materially from the results and outcomes discussed in or anticipated by the forward-looking statements. Factors that could cause or contribute to such differences in results and outcomes include without limitation those discussed under the heading “Risk Factors” below, as well as those discussed elsewhere in this Annual Report. Readers are urged not to place undue reliance on these forward-looking statements, which speak only as of the date of this Annual Report. We undertake no obligation to revise or update any forward-looking statements in order to reflect any event or circumstance that may arise after the date of this Annual Report. Readers are urged to carefully review and consider the various disclosures made in this Annual Report, which attempt to advise interested parties of the risks and factors that may affect our business, financial condition, results of operations and prospects.
We incorporated in 1985 under the laws of the state of California. In 1991, we reincorporated in the state of Delaware. We operate and report using a 52-53 week fiscal year ending on the last Sunday in September. Our 52-week fiscal years consist of four equal quarters of 13 weeks each, and our 53-week fiscal years consist of three 13-week fiscal quarters and one 14-week fiscal quarter. The financial results for our 53-week fiscal years and our 14-week fiscal quarters will not be exactly comparable to our 52-week fiscal years and our 13-week fiscal quarters. Both of the fiscal years ended
September 29, 2013
and
September 25, 2011
included 52 weeks. The fiscal year ended
September 30, 2012
included 53 weeks.
Overview
We continue to lead the development and commercialization of a digital communication technology called CDMA (Code Division Multiple Access), and we own significant intellectual property applicable to products that implement any version of CDMA including patents, patent applications and trade secrets. The mobile communications industry generally recognizes that a company seeking to develop, manufacture and/or sell products that use CDMA technology will require a patent license from us. CDMA is one of the main technologies currently used in digital wireless communications networks (also known as wireless networks). CDMA and TDMA (Time Division Multiple Access), of which GSM (Global System for Mobile Communications) is the primary commercial form, are the primary digital technologies currently used to transmit a wireless device user’s voice or data over radio waves using a public cellular wireless network.
We also continue our leading role in the development and commercialization of OFDMA (Orthogonal Frequency Division Multiple Access) -based technologies for which we own substantial intellectual property. Sales of multimode CDMA and LTE, which stands for “Long Term Evolution”
and is an OFDMA-based standard for cellular wireless communication applications, wireless devices have grown significantly during the past several years.
In addition to licensing portions of our intellectual property portfolio, which includes certain patent rights essential to and/or useful in the manufacture and sale of certain wireless products, we design, manufacture, have manufactured on our behalf and market products and services based on CDMA, OFDMA and other digital communications technologies. Our products principally consist of integrated circuits (also known as chips or chipsets) and system software used in mobile devices and in wireless networks. We also sell other products and services, which include: integrated circuits for use in wired devices, particularly broadband gateway equipment, desktop computers, televisions, set-top boxes and Blu-ray players; content enablement services to wireless operators; development, other services and related wireless communications products used by the United States government; location awareness and commerce services; and software and hardware development services.
1
The Mobile Communications Industry
Mobile technology has seen significant growth and adoption since the first mobile phone call took place in 1973. The International Telecommunication Union (ITU) estimated that 90% of the world’s population lived in areas served by mobile network coverage as of 2010. As of September 30, 2013, there were approximately 6.8 billion cellular connections worldwide, comprised of approximately 3.2 billion unique individual cellular account holders, also known as subscribers (GSMA Intelligence estimates as of November 4, 2013). Information regarding wireless technologies used by the mobile industry is provided in the section entitled Wireless Technologies in this Annual Report.
Key trends shaping the evolution and growth of the mobile industry include the expanding role of mobile as the leading computing platform and the shift from primarily voice-centric feature phones to data-centric smartphones; the evolution of technologies aimed at accommodating the increase of data usage; the use of wireless technologies for machine-to-machine (M2M) applications; and the advent of new mobile devices, applications and services that provide new user experiences.
Mobile Computing.
Due to the processing power and “always on” connectivity available in advanced mobile devices, consumers are opting to use their smartphones and tablets to perform tasks previously reserved for their personal computers, such as email, web-browsing, gaming and social networking. That preference is reflected in sales trends. More than twice as many smartphones and tablets were shipped globally in 2012 as compared to personal computers (Gartner and IDC, September 2013). Additionally, in 2012, semiconductor industry revenues for mobile phones surpassed those for personal computers for the first time (Gartner, April 2013).
While some feature phones support Internet connectivity and other basic computing functions, the mobile industry is seeing a shift to smartphones. Global smartphone shipments reached approximately 700 million units in 2012, representing a year-over-year increase of approximately 44%, and smartphone shipments are projected to reach approximately 1.8 billion in 2017 (Gartner, September 2013). Growth is expected to be particularly strong in emerging regions, with a projected compound annual growth rate of smartphone shipments of approximately 30% between 2012 and 2017 (Gartner, September 2013). For many people, particularly in emerging regions where income levels may make purchasing a personal computer out of reach, the smartphone or tablet may be the first and only device that will be used to access the Internet and perform other computing functions.
As smartphone and tablet shipments achieve increasing scale, the chipsets powering these devices are becoming an increasingly important differentiator to industry participants. To compete effectively, suppliers are seeking to strike a balance between performance, form factor (size and design) and battery life of devices. To achieve that, there is a trend toward chipsets that integrate many of the essential components of the mobile device into a unified and optimized system-on-a-chip (SOC), which includes a modem, a central processor (CPU), a graphics processing unit (GPU), multimedia support and other components that work together.
Meeting the Needs for Increased Data.
The large-scale adoption of smartphones and other connected devices is creating a significant increase in demand for data services. To meet this demand, mobile operators are deploying 3G/4G (third generation/fourth generation) networks and investing in a variety of strategies to increase the capacity and performance of their networks.
The total number of 3G and multimode 3G/4G connections worldwide reached approximately 2.3 billion as of September 30, 2013, accounting for only approximately 34% of total cellular connections (GSMA Intelligence estimates as of November 4, 2013). Looking ahead, approximately 4.5 billion 3G and multimode 3G/4G connections are projected by 2017 (GSMA Intelligence estimates as of November 4, 2013). Globally, during the third calendar quarter of 2013, on average more than one million new 3G and multimode 3G/4G connections were being added every day (GSMA Intelligence estimates as of November 4, 2013). In emerging regions, 3G and multimode 3G/4G cellular connections account for more than three times the number of fixed broadband connections (GSMA Intelligence and WBIS, October 2013).
Additional data demands are being placed on the networks as mobile technology is incorporated into new connected devices in a growing number of sectors including the consumer electronics, automotive, health and life sciences and utilities sectors. We refer to this as the “Internet of Everything.”
To meet the increased demand for data, which we refer to as “the 1000x data challenge,” network operators are expected to deploy a variety of strategies (in addition to deploying 3G/4G technologies) aimed at increasing the performance and capacity of their networks. One key strategy is network densification, such as complementing existing cellular networks by deploying smaller sized, lower-power cellular base stations, commonly referred to as small cells.
Another key focus is on more efficient use of spectrum. Some relief from network congestion caused by the demand for data is expected to come from the proliferation of peer-to-peer communications in which devices communicate directly with other devices without having to access the cellular network. Additional efficiencies are expected to come from the continuing evolution of 3G/4G and Wi-Fi technologies and the use of broadcast capabilities made possible by LTE broadcast technology.
2
New User Capabilities.
There is a growing emphasis on finding ways to provide the ability to efficiently access, sense and control digital content and services. The evolution of mobile technology is expected to augment our senses, in effect creating what we refer to as the “digital 6th sense.” The industry is working on a variety of fronts toward this vision by investing in increased computing capabilities, enhanced connectivity and new ways for users to interact with technology. Among the areas of focus are peer-to-peer connectivity technologies, augmented reality and context awareness.
Wireless Technologies
The growth in the use of wireless devices worldwide, such as smartphones and tablets, and demand for data services and applications requires continuous innovation to further improve the user experience, enable new services and increase network capacity, make use of different frequency bands and enable dense network deployments. To meet these requirements, different wireless communications technologies continue to evolve. For over two decades, we have invested and continue to invest heavily in research and development of many of these cellular wireless communication technologies, including CDMA and OFDMA. As a result, we have developed and acquired (and continue to develop and acquire) significant related intellectual property. This intellectual property has been incorporated into the most widely accepted and deployed wireless communications technology standards, and we have licensed it to wireless device and infrastructure manufacturers (more than 250 licensees, including all leading manufacturers). Most of the cellular wireless technologies can be grouped into three categories.
TDMA-based.
TDMA-based technologies are characterized by their access method allowing several users to share the same frequency channel by dividing the signal into different time slots. Most of these systems are classified as 2G (second generation) technology.
The main examples of TDMA-based technologies are GSM (deployed worldwide), IS-136 (deployed in the Americas) and Personal Digital Cellular (PDC) (deployed in Japan). Compared to the earlier generations of analog technologies, these digital communications technologies provided for significantly enhanced efficiency within a fixed spectrum, resulting in increased voice capacity. These technologies also enable enhanced services, such as SMS (short message service) texting service, as well as low-speed data services. GSM has evolved to support mobile packet data transmission, such as GPRS (General Packet Radio Service) and EDGE (Enhanced Data Rates for Global Evolution).
According to GSMA Intelligence estimates as of November 4, 2013, there were approximately 4.4 billion GSM connections worldwide, representing approximately 65% of total cellular connections.
CDMA-based.
CDMA-based technologies are characterized by their access method allowing several users to share the same frequency and time by allocating different orthogonal codes to individual users. Most of the CDMA-based technologies are classified as 3G (third generation) technology.
There are a number of variants of CDMA-based technologies deployed around the world, in particular CdmaOne, Cdma2000, EV-DO (Evolution Data Optimized), WCDMA (Wideband CDMA) and TD-SCDMA (Time Division - Synchronous CDMA) (deployed exclusively in China). Similar to other digital communications technologies, CDMA-based technologies provided vastly improved capacity for voice and low-rate data services as compared to analog technologies. The following are the CDMA-based technologies and their standards revisions:
|
•
|
CDMA2000 revisions A through E
|
|
•
|
1xEV-DO revisions A through C
|
|
•
|
WCDMA/HSPA releases 4 through 12
|
|
•
|
TD-SCDMA releases 4 through 12
|
To date, these technologies have seen many revisions, and they continue to evolve, progressively offering higher capacity and data rates, improved user experiences and new applications and services. As these technologies continue to evolve, new features are being defined in their relevant standardization bodies, the 3rd Generation Partnership Project 2 (3GPP2) for CDMA2000 and 1xEV-DO and the 3rd Generation Partnership Project (3GPP) for WCDMA and TD-SCDMA.
For simplicity, the releases of these technologies are often combined and given “marketing” or “trade” names that also indicate their benefits. One example is the 3GPP releases: Releases 5 and 6 together are called “HSPA- High Speed Packet Access.” The releases from 7 to 10 are called HSPA+, indicating that they provide performance improvements over HSPA. We refer to releases 11 and beyond as HSPA+ Advanced, again indicating improvements beyond the ones that HSPA+ offers.
The naming convention also applies to the releases of CDMA2000, whose successive releases are grouped and referred to as CDMA2000 1X, 1x Advanced, as well as to 1xEV-DO, whose releases are called as EV-DO Rev. A, Rev. B and DO Advanced.
CDMA technologies ushered in a significant increase in broadband data services and continue to grow rapidly. According to GSMA Intelligence estimates as of November 4, 2013, there were approximately 2.2 billion CDMA-based connections
3
worldwide. As of the fourth quarter of calendar 2012, the first phases of 1x Advanced and DO Advanced, as well as up to the eighth release of HSPA+, were commercially launched.
OFDMA-based.
OFDMA-based technologies are characterized by their access method allowing several users to share the same frequency and time by allocating different subcarriers to individual users. Most of the OFDMA-based technologies are classified as 4G (fourth generation) technology.
The primary OFDMA-based technology is LTE and is incorporated in 3GPP specifications starting from release 8. LTE has two modes, FDD (frequency division duplex) and TDD (time division duplex) to support paired and unpaired spectrum, respectively, and is being developed by 3GPP. The principal benefit of LTE is its ability to leverage wide swaths of spectrum (bandwidths of 10 MHz or more). LTE is designed to seamlessly interwork with 3G through multimode 3G/4G devices. Currently, LTE relies on 2G/3G for voice services across the network, as well as for ubiquitous data services outside LTE coverage area, and on 4G for data services inside the coverage area.
LTE’s releases are often combined and given “marketing” or “trade” names that also indicate their benefits. The name LTE covers releases 8 and 9. Releases 10 and beyond are referred to as LTE Advanced. According to GSMA Intelligence estimates as of November 4, 2013, there were 144 million global 3G/4G multimode connections. The first step of LTE Advanced, referred to as carrier aggregation, was commercially launched in June 2013.
Other Wireless Technologies.
There are other non-cellular wireless technologies that have also been broadly adopted in mobile cellular devices.
Wireless Local Area Networks.
Wireless local area networks (WLAN, also known as Wi-Fi) link two or more devices using a wireless technology method and usually provide connectivity through an access point. WLAN systems have been standardized by the Institute of Electrical and Electronics Engineers (IEEE) standards committee in the various versions of 802.11, which include advanced features, such as multiple in/multiple out (MIMO), support for large bandwidth and support for different frequency bands and higher order modulation.
Bluetooth.
Bluetooth is a wireless personal area network that provides wireless connectivity between devices over short distances ranging from a few centimeters to a few meters. Bluetooth technology provides wireless connectivity to a wide range of fixed or mobile consumer electronics devices. Bluetooth functionalities are standardized by the Bluetooth Special Interest Group in various versions of the specification (from 1.0 to 4.0), which include different functionalities, such as enhanced data rate or low energy.
Location positioning technologies.
Location positioning technologies use satellite systems to provide accurate location of devices and primarily work outdoors, when devices have a clear view of the sky. Cell site assistance with location determination in addition to satellite system determination improves in-building performance. The device location can be used for navigation systems as well as location-based services (e.g., search results based on the location of the device). There are many satellite constellations in use or under development today. Global Positioning System (GPS) developed by the United States, GLONASS (Global Navigation Satellite System) developed by Russia and BeiDou developed by China are some examples of location position technology.
Operating Segments
We conduct business primarily through four reportable segments: QCT, QTL, QWI and QSI. QSI did not have revenues, or had negligible revenues, in all periods presented. Revenues in fiscal 2013, 2012 and 2011 for our other reportable segments were as follows (in millions, except percentage data):
|
QCT
|
QTL
|
QWI
|
|||||||||
|
2013
|
$
|
16,715
|
|
$
|
7,554
|
|
$
|
613
|
|
||
|
As a percent of total
|
67
|
%
|
30
|
%
|
2
|
%
|
|||||
|
2012
|
$
|
12,141
|
|
$
|
6,327
|
|
$
|
633
|
|
||
|
As a percent of total
|
63
|
%
|
33
|
%
|
3
|
%
|
|||||
|
2011
|
$
|
8,859
|
|
$
|
5,422
|
|
$
|
656
|
|
||
|
As a percent of total
|
59
|
%
|
36
|
%
|
4
|
%
|
|||||
QCT (Qualcomm CDMA Technologies) Segment.
QCT is a leading developer and supplier of integrated circuits and system software based on CDMA, OFDMA and other technologies for use in voice and data communications, networking, application processing, multimedia and global positioning system products. QCT’s integrated circuit products and system software are sold to and/or licensed to manufacturers that use our products in wireless devices, particularly mobile phones,
4
tablets, laptops, data modules, handheld wireless computers and gaming devices, access points and routers, data cards and infrastructure equipment, and in wired devices, particularly broadband gateway equipment, desktop computers, televisions, set-top boxes and Blu-ray players. Our Mobile Station Modem (MSM) integrated circuits, which include the Mobile Data Modem, Qualcomm Single Chip and Qualcomm Snapdragon processor devices, perform the core baseband modem functionality in wireless devices providing voice and data communications, as well as multimedia applications and global positioning functions. Our Snapdragon processors provide advanced application and graphics processing capabilities. QCT’s system software enables the other device components to interface with the integrated circuit products and is the foundation software enabling manufacturers to develop devices utilizing the functionality within our integrated circuits. Because of our experience in designing and developing CDMA- and OFDMA-based products, we design both the baseband integrated circuit and the supporting system as well, including the RF (Radio Frequency) devices, PM (Power Management) devices and accompanying software products. This approach enables us to optimize the performance of the wireless device with improved product features and integration with the network system. We also provide support, including reference designs and tools, to enable our customers to reduce the time required to design their products and bring their products to market faster. We plan to add additional features and capabilities to our integrated circuit products to help our customers reduce the cost and size of their products, to simplify our customers’ design processes and to enable more wireless devices and services.
QCT offers a broad portfolio of products, including both wireless device and infrastructure integrated circuits, in support of CDMA2000 1X and 1xEV-DO, as well as the EV-DO Revision A/B evolutions of CDMA 2000 technology. Leveraging our expertise in CDMA, we also develop and offer integrated circuits supporting the WCDMA version of 3G for manufacturers of wireless devices. More than 80 device manufacturers have selected our WCDMA products that support GSM/GPRS, WCDMA, HSDPA (High-Speed Downlink Packet Access), HSUPA (High-Speed Uplink Packet Access) and HSPA+ for their devices. QCT also sells multimode products for the LTE standard, which offer seamless backward compatibility to existing 3G technologies. Our integrated circuit products are included in a broad range of devices, from low-tier, entry-level devices for emerging regions, which may use our Qualcomm Reference Design (QRD) products, to premium-tier devices. In fiscal 2013, QCT shipped approximately 716 million MSM integrated circuits for wireless devices worldwide as compared to approximately 590 million and 483 million in fiscal 2012 and 2011, respectively.
Our modems are built to work with increasingly complex networks. They support the latest communication technologies and adapt to network conditions and user needs in real time to enable delivery of faster, smoother data and voice connections. Our 3G/4G modem roadmap delivers the latest network technologies across multiple product tiers and devices. This roadmap is the result of our years of research into emerging network standards and the development of chipsets that take advantage of these new standards, while maintaining backward compatibility with existing standards.
Each Snapdragon processor is a highly integrated, mobile optimized system on a chip incorporating our advanced technologies, including a high performance CPU, digital signal processor (DSP), GPU and modem, multimedia subsystems, including audio, high-definition video and camera capabilities, and highly accurate location positioning engines. Our CPU cores are designed to deliver high levels of compute performance at low power, allowing manufacturers to design slim and powerful devices with longer battery life between charges. Our GPUs are also designed to deliver graphics performance for visually rich 3D gaming and user interfaces. The heterogeneous compute architecture of our Snapdragon processors is designed to ensure that the CPU, DSP and GPU work efficiently together, each being powered up and utilized only when needed, which enhances the processing capacity, speed and efficiency of our Snapdragon processors and provides longer battery life of the devices using our processors. Most Snapdragon processors also incorporate our modem technology for advanced mobile broadband.
Our wireless products also consist of integrated circuits and system software for WLAN, Bluetooth, frequency modulation (FM) and near field communications (NFC) as well as technologies that enable location data and services, including GPS, GLONASS and BeiDou. Our wireless technologies are provided in the form of WLAN; Bluetooth and FM products, for which the technologies are integrated into the cellular modem and combined with a companion RF chip; WLAN and Bluetooth combination chips; and stand-alone products. Our wired connectivity products consist of integrated circuits and software for Ethernet and Powerline networks. Our wired portfolio enables delivery of richer, comprehensive multi-connectivity product platforms to our networking, computing and consumer electronics customer base. We also developed the combination of WLAN, Powerline and Ethernet technologies to deliver hybrid networking platforms designed for home, known as Hi-Fi products. The technology has now evolved to become the multiple-physical layer (multi-PHY) networking standard known as the IEEE 1905.1.
QCT utilizes a fabless production model, which means that we do not own or operate foundries for the production of silicon wafers from which our integrated circuits are made. Integrated circuits are die cut from silicon wafers that have been assembled into packages or modules and have completed the final test manufacturing processes. Die cut from silicon wafers are the essential components of all of our integrated circuits and a significant portion of the total integrated circuit cost. We employ both turnkey and two-stage manufacturing models to purchase our integrated circuits. Turnkey is when our foundry suppliers are responsible for delivering fully assembled and tested integrated circuits. Under the two-stage manufacturing model, we
5
purchase wafers and die from semiconductor manufacturing foundries and contract with separate third-party suppliers for probe, assembly and test services.
We rely on independent third-party suppliers to perform the manufacturing and assembly, and most of the testing, of our integrated circuits based primarily on our proprietary designs and test programs. Our suppliers also are responsible for the procurement of most of the raw materials used in the production of our integrated circuits, which we believe are currently generally available. The primary foundry suppliers for our various digital, analog/mixed-signal, RF and PM integrated circuits are Global Foundries Inc., International Business Machines Corporation, Samsung Electronics Co. Ltd., Semiconductor Manufacturing International Corporation, Taiwan Semiconductor Manufacturing Company and United Microelectronics Corporation. The primary semiconductor assembly and test suppliers are Advanced Semiconductor Engineering, Amkor Technology, Siliconware Precision Industries and STATSChipPAC. The majority of our foundry and subcontract assembly and test suppliers are located in the Asia-Pacific region.
QCT’s sales are primarily made through standard purchase orders for delivery of products. QCT generally allows customers to reschedule delivery dates within a defined time frame and to cancel orders prior to shipment with or without payment of a penalty, depending on when the order is canceled. The market in which QCT operates is intensely competitive. QCT competes worldwide with a number of United States and international designers and manufacturers of semiconductors. As a result of global expansion by foreign and domestic competitors, technological changes, device manufacturer concentrations and the potential for further industry consolidation, we anticipate the market to remain very competitive. We believe that the principal competitive factors for our products may include performance, level of integration, quality, compliance with industry standards, price, time-to-market, system cost, design and engineering capabilities, new product innovation and customer support. QCT also competes in both single- and dual-mode environments against alternative communications technologies including, but not limited to, GSM/GPRS/EDGE, TDMA and TD-SCDMA.
QCT’s current competitors include, but are not limited to, companies such as Broadcom, Ericsson, HiSilicon Technologies, Intel, Lantiq, Marvell Technology, Maxim Integrated Products, MediaTek, nVidia, Realtek Semiconductor, Samsung Electronics, Spreadtrum Communications, Texas Instruments and VIA Telecom. QCT also faces competition from internally developed products by our customers, including some of our largest customers, and from some early-stage companies. Our competitors devote significant amounts of their financial, technical and other resources to develop and market competitive products and, in some cases, to develop and adopt competitive digital communication or signal processing technologies, and those efforts may materially and adversely affect QCT. Moreover, some of these current and potential competitors have advantages over us that include, among others: motivation by our customers in certain circumstances to find alternate suppliers; foreign government support of other technologies or competitors; more extensive relationships with local distribution companies and original equipment manufacturers in emerging geographic regions (e.g., China); lower cost structures; and/or a more established presence in certain device markets.
QTL (Qualcomm Technology Licensing) Segment.
QTL grants licenses or otherwise provides rights to use portions of our intellectual property portfolio, which, among other rights, includes certain patent rights essential to and/or useful in the manufacture and sale of certain wireless products, including, without limitation, products implementing CDMA2000, WCDMA, CDMA TDD (including TD-SCDMA), GSM/GPRS/EDGE and/or OFDMA (including LTE) standards and their derivatives. Our licensees manufacture wireless products, such as mobile devices, also known as subscriber units, which include handsets, other consumer devices (e.g., tablets, personal computers, e-readers, personal navigation devices), machine-to-machine devices (e.g., telematics devices, meter reading devices) and plug-in end user data modem cards, certain embedded modules for incorporation into end user products, the infrastructure equipment required to establish and operate a network, and equipment to test networks and subscriber units. QTL licensing revenues are comprised of license fees as well as royalties based on worldwide sales by licensees of products incorporating or using our intellectual property. License fees are fixed amounts paid in one or more installments. Royalties are generally based upon a percentage of the wholesale (i.e., licensee’s) selling price of complete licensed products, net of certain permissible deductions (e.g., certain shipping costs, packing costs, VAT, etc.). Revenues generated from royalties are subject to quarterly and annual fluctuations. The vast majority of QTL revenues have been generated through our licensees’ sales of CDMA2000- and WCDMA-based products, such as feature phones and smartphones.
Separate and apart from licensing manufacturers of wireless products and devices and network equipment, we have entered into certain arrangements with competitors of our QCT segment, such as Broadcom, Fujitsu, MediaTek, NEC, Texas Instruments and VIA Telecom. A principal purpose of these arrangements is to provide our QCT segment and the counterparties certain freedom of operation with respect to each party’s integrated circuits business. In every case, these agreements expressly reserve the right for QTL to seek royalties from the customers of such integrated circuit suppliers with respect to such suppliers’ customers’ sales of CDMA-, WCDMA- and OFDMA-based wireless devices into which such suppliers’ integrated circuits are incorporated.
We face competition in the development of intellectual property for future generations of digital wireless communications technology and services. On a worldwide basis, we currently compete primarily with the GSM/GPRS/EDGE digital wireless
6
communications technologies. GSM has been utilized extensively in Europe, much of Asia, other than Japan and South Korea, and certain other countries. To date, GSM has been more widely adopted than CDMA; however, CDMA technologies have been adopted for all 3G wireless systems. In addition, most GSM operators deployed GPRS, a packet data technology, as a 2G bridge technology, and a number of GSM operators deployed EDGE. However, the majority of GSM operators have already augmented their networks with 3G WCDMA and HSPA. According to the Global mobile Suppliers Association (GSA), as of October 2013, more than 220 wireless operators have commercially deployed and other wireless operators have started testing LTE, a multi-carrier transmission technique based on OFDMA technology. According to GSA, more than 420 wireless operators have committed to deploy LTE networks. We have invested in both the acquisition and the development of OFDMA technology and intellectual property. We expect that upon the initial deployment of OFDMA-based networks, the products implementing such technologies generally will be multimode and will also implement CDMA-based technologies. The licenses granted under our existing CDMA license agreements generally cover multimode CDMA/OFDMA (3G/4G) devices, and our licensees are obligated to pay royalties under their CDMA license agreements for such devices. Further, over 90 companies (including LG, Nokia, Samsung and ZTE) have royalty-bearing licenses under our patent portfolio for use in single-mode OFDMA products (which do not implement any CDMA-based standards).
Since our founding in 1985, we have focused heavily on technology development and innovation. These efforts have resulted in a leading intellectual property portfolio related to, among other things, wireless technology. We have an extensive portfolio of United States and foreign patents, and we continue to pursue patent applications around the world. Our patents have broad coverage in many countries, including Brazil, China, India, Japan, South Korea, Taiwan and countries in Europe and elsewhere. A substantial portion of our patents and patent applications relate to digital wireless communications technologies, including patents that are essential or may be important to the commercial implementation of CDMA2000, WCDMA (UMTS), TD-SCDMA, TD-CDMA and OFDMA products. Because all commercially deployed forms of CDMA and their derivatives require the use of our patents, our patent portfolio is the most widely and extensively licensed portfolio in the industry with over 250 licensees. Over the years, a number of companies have challenged our patent position, but at this time, companies in the mobile communications industry generally recognize that any company seeking to develop, manufacture and/or sell subscriber units or infrastructure equipment that use CDMA and/or OFDMA technologies will require a license or other rights to use our patents.
As part of our strategy to generate licensing revenues that continue to support our research and development investments and support worldwide adoption of our CDMA, OFDMA and other technologies, we provide rights to design, manufacture and sell products utilizing certain portions of our intellectual property to other companies.
We have licensed or otherwise provided rights to use our patented technologies to interested companies on terms that are fair, reasonable and non-discriminatory. Unlike some other companies in our industry that hold back certain key technologies, we offer interested companies essentially our entire patent portfolio for use in cellular subscriber devices and cell site infrastructure equipment. Our strategy to make our patented technologies broadly available has been a catalyst for industry growth, helping to enable a wide range of companies offering a broad array of wireless products and features while increasing the capabilities of and/or driving down average and low-end selling prices for 3G handsets and other wireless devices. By licensing or otherwise providing rights to use our patented technologies to a wide range of equipment manufacturers, encouraging innovative applications, supporting equipment manufacturers with integrated chipset and software products, and focusing on improving the efficiency of the airlink for wireless operators, we have helped 3G CDMA evolve, grow and reduce device pricing all at a faster pace than the 2G technologies that preceded it (e.g., GSM).
Standards bodies have been informed that we hold patents that might be essential for all 3G standards that are based on CDMA. We have committed to such standards bodies that we will offer to license our essential patents for these CDMA standards on a fair, reasonable and non-discriminatory basis. We have also informed standards bodies that we hold patents that might be essential for certain standards that are based on OFDMA technology (e.g., 802.16e, 802.16m and LTE (including FDD and TDD versions)) and have committed to offer to license our essential patents for these OFDMA standards on a fair, reasonable and non-discriminatory basis.
Our license agreements generally provide us rights to use certain of our licensees’ technology and intellectual property to manufacture and sell certain components (e.g., Application-Specific Integrated Circuits) and related software, subscriber units and/or infrastructure equipment. In most cases, our use of our licensees’ technology and intellectual property does not require us to pay royalties based on the sale of our products. However, under some of the licenses, if we incorporate certain of our licensees’ licensed technology or intellectual property into certain of our products, we are obligated to pay royalties on the sale of such products.
7
QWI (Qualcomm Wireless & Internet) Segment.
The four divisions aggregated into QWI are:
Omnitracs Division
. Omnitracs designs, manufactures and sells equipment, licenses software and provides services to our customers to manage their assets, products and workforce. Omnitracs offers satellite- and terrestrial-based two-way wireless information and position location services to transportation and logistics fleets that enable customers to track the location and monitor performance of their assets, communicate with their personnel and collect data. On August 21, 2013, we entered into a definitive agreement under which we agreed to sell the North and Latin American operations of Omnitracs to a U.S.-based private equity firm for $800 million in cash, subject to the terms and conditions of the definitive agreement. The transaction is subject to customary closing conditions, including receipt of regulatory approvals, and is expected to close in the first quarter of fiscal 2014.
QIS (Qualcomm Internet Services) Division.
QIS provides software products and content enablement services to wireless operators worldwide to support and accelerate the growth and advancement of wireless data products and services. We offer Brew and Plaza platform products and services for wireless applications development, device configuration, application distribution and billing and payment. Our QChat product enables one-to-one (private) and one-to-many (group) push-to-talk (PTT) calls over 3G networks.
QGOV (Qualcomm Government Technologies) Division.
QGOV provides development and other services and related products involving wireless communications technologies to U.S. government agencies and their contractors. Based on the percentage of QGOV revenues to our total consolidated revenues, no government agencies or their contractors are major customers.
QRS (Qualcomm Retail Solutions) Division.
QRS, our retail services business, builds and manages software applications that enable certain mobile location-awareness and commerce services.
QSI (Qualcomm Strategic Initiatives) Segment.
QSI makes strategic investments that we believe may open new or expand opportunities for our technologies, support the design and introduction of new products and services for voice and data communications or possess unique capabilities or technology. Many of these strategic investments are in early-stage companies. QSI also holds wireless spectrum. As part of our strategic investment activities, we intend to pursue various exit strategies from each of our QSI investments in the future.
Other Businesses.
Nonreportable segments are comprised of our QMT (Qualcomm MEMS Technologies) division and other display, wireless technology and services initiatives that include, but are not limited to: low power consumption, high optical performance flat display modules; medical device connectivity and related data management; augmented reality; and device-to-device communication. QMT continues to develop an interferometric modulator (IMOD) display technology based on micro-electro-mechanical-systems (MEMS) structure combined with thin film optics.
Seasonality.
Many of our products or intellectual property are incorporated into consumer wireless devices, which are subject to seasonality and other fluctuations in demand. As a result, QCT has tended historically to have stronger sales toward the end of the calendar year as manufacturers prepare for major holiday selling seasons, and QTL has tended to record higher royalty revenues in the first calendar quarter when licensees report their sales made during the fourth calendar quarter. These seasonal trends may or may not continue in the future.
Additional information regarding our operating segments is provided in the notes to our consolidated financial statements in this Annual Report in “Notes to Consolidated Financial Statements, Note 8. Segment Information.”
Corporate Structure
We operate our businesses through our parent company, QUALCOMM Incorporated, and multiple direct and indirect subsidiaries. We have developed our corporate structure in order to address various legal, regulatory, tax, contractual compliance, operations and other matters.
At the beginning of fiscal 2013, we completed a corporate reorganization in which certain assets of QUALCOMM Incorporated, as well as the stock of certain of its direct and indirect subsidiaries, were contributed to its wholly-owned subsidiary Qualcomm Technologies, Inc. (QTI). QTL continues to be operated by QUALCOMM Incorporated, which continues to own the vast majority of our patent portfolio. Substantially all of our products and services businesses, including QCT, and substantially all of our engineering, research and development functions, are operated by QTI and its subsidiaries. Neither QTI nor any of its subsidiaries has any right, power or authority to grant any licenses or other rights under or to any patents owned by QUALCOMM Incorporated.
8
Revenue Concentrations, Significant Customers and Geographical Information
Consolidated revenues from international customers and licensees as a percentage of total revenues were 97%, 95% and 94% in fiscal
2013
,
2012
and
2011
, respectively. During fiscal
2013
,
49%
,
20%
and
11%
of our revenues were from customers and licensees based in China, South Korea and Taiwan, respectively, as compared to
42%
,
22%
and
14%
during fiscal
2012
, respectively, and
32%
,
19%
and
17%
during fiscal
2011
, respectively. We distinguish revenues from external customers by geographic areas based on the location to which our products, software or services are delivered, or for QTL licensing revenues, the invoiced addresses of our licensees. Additional geographic information is provided in the notes to our consolidated financial statements in this Annual Report in “Notes to Consolidated Financial Statements, Note 8. Segment Information.”
A small number of customers/licensees historically have accounted for a significant portion of our consolidated revenues. In fiscal
2013
,
2012
and
2011
, revenues from Samsung Electronics constituted more than 10% of consolidated revenues; in fiscal
2013
and 2012, revenues from Hon Hai Precision Industry Co., Ltd./Foxconn, its affiliates and other suppliers to Apple Inc. constituted more than 10% of consolidated revenues; and in fiscal
2011
, revenues from HTC constituted more than 10% of consolidated revenues.
Research and Development
The communications industry is characterized by rapid technological change, requiring a continuous effort to enhance existing products and technologies and to develop new products and technologies. We have significant engineering resources, including engineers with substantial expertise in CDMA, OFDMA and a broad range of other technologies. Using these engineering resources, we expect to continue to invest in research and development in a variety of ways in an effort to extend the demand for our products and services, including developing new versions of CDMA, OFDMA and other technologies, developing alternative technologies for certain specialized applications, participating in the formulation of new voice and data communication standards and technologies and assisting in deploying digital voice and data communications networks around the world.
Our research and development team has a demonstrated track record of innovation in voice and data communication technologies. Our research and development expenditures in fiscal 2013, 2012 and 2011 totaled approximately
$5.0 billion
,
$3.9 billion
and
$3.0 billion
, respectively, and as a result, we continue to expand and enhance our products, services and intellectual property portfolios.
We develop, commercialize and actively support 3G CDMA-based technologies, including CDMA2000 1X, 1xEV-DO, EV-DO Revision A, EV-DO Revision B, 1x Advanced, WCDMA, HSDPA, HSUPA and HSPA+, as well as OFDMA-based LTE technologies, products and network operations, to grow our royalty and integrated circuit and related software revenues. From time to time, we also make acquisitions to meet certain technology needs, to obtain development resources or to pursue new business opportunities.
We make investments to provide our integrated circuit customers with chipsets designed on leading-edge technology nodes that combine multiple technologies for use in consumer devices, including smartphones, consumer electronics and other devices. In addition to 3G and 4G LTE technologies, our chipsets support other wireless and wired connectivity technologies, including WLAN, Bluetooth, Ethernet, GPS, GLONASS and Powerline Communication. Our integrated chipsets often include multiple technologies, including advanced multimode modems, application processors and graphics engines, as well as the tools to connect these diverse technologies. We continue to support Android, Windows Phone/RT and other mobile client software environments in our chipsets.
We develop on our own, and with our partners, innovations that are integrated into our product portfolio to further expand the opportunity for wireless communications and enhance the value of our products and services. These innovations are expected to enable our customers to improve the performance or value of their existing services, offer these services more affordably and introduce revenue-generating broadband data services ahead of their competition.
We have research and development centers in various locations throughout the world that support our global development activities and ongoing efforts to advance CDMA, OFDMA and a broad range of other technologies. We continue to use our substantial engineering resources and expertise to develop new technologies, applications and services and make them available to licensees to help grow the communications industry and generate new or expanded licensing opportunities. In addition to internally sponsored research and development, we perform contract research and development for various government agencies and commercial contractors.
We continue to develop our interferometric modulator (IMOD) and other display technologies. We intend to license our next generation IMOD display technology, while we continue to develop and directly commercialize certain IMOD consumer-targeted mobile products. Our IMOD display technology, based on a micro-electro-mechanical-systems (MEMS) structure
9
combined with thin film optics, is intended to provide performance and power consumption benefits as compared to other display technologies.
We make investments across a broad spectrum of opportunities that leverage our existing technical and business expertise to deploy new business models and enter into new industry segments, such as technologies to address the growth of mobile data traffic, including 3G/LTE and Wi-Fi products designed for implementation of small cells, which can be used by carriers to extend the capacity of licensed and unlicensed wireless spectrum and the 1000x data challenge; wireless charging; proximity-based communications; very high speed connectivity; mobile location awareness and commerce; mobile health; wearable technology; gaming; and products for the connected home, the digital 6th sense and the Internet of Everything.
Sales and Marketing
Sales and marketing activities of our operating segments are discussed under Operating Segments. Other marketing activities include public relations, advertising, web-marketing, participation in technical conferences and trade shows, development of business cases and white papers, competitive analyses, industry intelligence and other marketing programs, such as marketing development funds with our customers. Our Corporate Marketing department provides company information on our Internet site and through other media regarding our products, strategies and technology to industry analysts and for publications.
Competition
Competition faced by our operating segments is discussed under Operating Segments. Competition in the communications industry throughout the world continues to increase at a rapid pace as consumers, businesses and governments realize the potential of wireless communications products and services. We have facilitated competition in the wireless communications industry by licensing our technologies to, and therefore enabling, a large number of manufacturers. Although we have attained a significant position in the industry, many of our current and potential competitors may have advantages over us, which include, among others, motivation by our customers in certain circumstances to find alternate suppliers or choose alternate technologies and foreign government support of other technologies (e.g., GSM) or our competitors. In addition, our competitors may have established more extensive relationships with local distribution and original equipment manufacturer companies in emerging geographic regions (e.g., China) or a more established presence in certain device markets. These relationships may affect customers’ decisions to purchase products or license technology from us. Accordingly, new competitors or alliances among competitors could emerge and rapidly acquire significant market positions to our detriment.
We expect to continue to face competition throughout the world as new technologies and services are introduced in the future and as additional companies compete with our products or services based on 3G, 4G or other technologies. Although we intend to continue to make substantial investments in developing new products and technologies and improving existing products and technologies, our competitors may introduce alternative products, services or technologies that threaten our business. It is also possible that the price we charge for our products and services may continue to decline as competition continues to intensify.
Corporate Responsibility
We strive to better our local and global communities through ethical business practices, socially empowering technology applications, educational and environmental programs and employee diversity and volunteerism.
|
•
|
Our Governance.
We aim to demonstrate accountability, transparency, integrity and ethical business practices throughout our operations and interactions with our stakeholders.
|
|
•
|
Our Products.
We strive to meet or exceed industry standards for product responsibility and supplier management.
|
|
•
|
Our Workplace.
We endeavor to provide a safe and healthy work environment where diversity is embraced and various opportunities for training, growth, and advancement are strongly encouraged for all employees.
|
|
•
|
Our Community.
We have strategic relationships with a wide range of local organizations and programs that develop and strengthen communities worldwide.
|
|
•
|
Our Environment.
We aim to expand our operations while minimizing our carbon footprint, conserving water and reducing waste.
|
|
•
|
Wireless Reach.
We invest in projects that foster entrepreneurship, aid in public safety, enhance delivery of health care, enrich teaching and learning and improve environmental sustainability through the use of 3G and next-generation technologies.
|
10
Employees
At
September 29, 2013
, we employed approximately 31,000 full-time, part-time and temporary employees. During fiscal
2013
, the number of employees increased by approximately 4,300, primarily due to increases in engineering resources.
Available Information
Our Internet address is www.qualcomm.com. There we make available, free of charge, our annual report on Form 10-K, quarterly reports on Form 10-Q, current reports on Form 8-K and any amendments to those reports, as soon as reasonably practicable after we electronically file such material with, or furnish it to, the Securities and Exchange Commission (SEC). We also make available on our Internet site public financial information for which a report is not required to be filed with or furnished to the SEC. Our SEC reports and other financial information can be accessed through the investor relations section of our Internet site. The information found on our Internet site is not part of this or any other report we file with or furnish to the SEC.
Executive Officers
Our executive officers (and their ages at
September 29, 2013
) are as follows:
Paul E. Jacobs, age 50, has served as Chairman of the Board of Directors since March 2009, as a director since June 2005 and as Chief Executive Officer since July 2005. He served as Group President of QWI from July 2001 to June 2005. In addition, he served as Executive Vice President from February 2000 to June 2005. Dr. Jacobs was a director of A123 Systems, Inc. from November 2002 to July 2012. Dr. Jacobs holds a B.S. degree in Electrical Engineering and Computer Science, an M.S. degree in Electrical Engineering and a Ph.D. degree in Electrical Engineering and Computer Science from the University of California, Berkeley.
Steven R. Altman, age 52, has served as Vice Chairman since November 2011. He served as President from July 2005 to November 2011, as Executive Vice President from November 1997 to June 2005 and as President of QTL from September 1995 to April 2005. Mr. Altman has been a director of Ubiquiti Networks, Inc. since October 2013 and DexCom, Inc. since November 2013. Mr. Altman holds a B.S. degree in Police Science and Administration from Northern Arizona University and a J.D. degree from the University of San Diego. Mr. Altman will retire from Qualcomm effective January 3, 2014.
Derek K. Aberle, age 43, has served as Executive Vice President and Group President since November 2011. He served as Executive Vice President and President of QTL from September 2008 to November 2011 and as Senior Vice President and General Manager of QTL from October 2006 to September 2008. Mr. Aberle joined Qualcomm in December 2000 and prior to October 2006 held positions ranging from Legal Counsel to Vice President and General Manager of QTL. Mr. Aberle holds a B.A. degree in Business Economics from the University of California, Santa Barbara and a J.D. degree from the University of San Diego.
Cristiano R. Amon, age 43, has served as Executive Vice President, Qualcomm Technologies, Inc. and Co-President of QCT since October 2012. He served as Senior Vice President, Qualcomm Incorporated and Co-President of QCT from June 2012 to October 2012, as Senior Vice President, QCT Product Management from October 2007 to June 2012 and as Vice President, QCT Product Management from September 2005 to October 2007. Mr. Amon joined Qualcomm in 1995 as an engineer and throughout his tenure at Qualcomm held several other technical and leadership roles. Mr. Amon holds a B.S. degree in Electrical Engineering from UNICAMP, the State University of Campinas, Brazil.
George S. Davis, age 55, has served as Executive Vice President and Chief Financial Officer since March 2013. Prior to joining Qualcomm, Mr. Davis was Chief Financial Officer of Applied Materials, Inc., a provider of equipment, services and software for the manufacture of advanced semiconductor, flat panel displays and solar photovoltaic products, from November 2006 to March 2013. Mr. Davis held several other leadership roles at Applied Materials from November 1999 to November 2006. Prior to joining Applied Materials, Mr. Davis served 19 years with Atlantic Richfield Company, a global oil, gas and chemical company, in a number of finance and other corporate positions. Mr. Davis holds a B.A. degree in Economics and Political Science from Claremont McKenna College and an M.B.A. degree from the University of California, Los Angeles.
Andrew M. Gilbert, age 50, has served as Executive Vice President, Qualcomm Europe, Inc. and European Innovation Development since January 2011. He served as Executive Vice President and President of Qualcomm Europe from September 2010 to January 2011, as Executive Vice President and President of QIS and Qualcomm Europe from May 2009 to September 2010 and as Executive Vice President and President of QIS, our former MFT division and Qualcomm Europe from January 2008 to May 2009. He served as Senior Vice President and President of Qualcomm Europe from November 2006 to January 2008 and as President of Qualcomm Europe from February 2006 to November 2006. Mr. Gilbert joined Qualcomm in January 2006 as Vice President of Qualcomm Europe. Prior to joining Qualcomm, he served as Vice President and General
11
Manager of Flarion Technologies, Inc.’s European, Middle Eastern and African regions from May 2002 to January 2006. Mr. Gilbert will retire from Qualcomm effective December 30, 2013.
Matthew S. Grob, age 47, has served as Executive Vice President, Qualcomm Technologies, Inc. and Chief Technology Officer since October 2012. He served as Executive Vice President, Qualcomm Incorporated and Chief Technology Officer from July 2011 to October 2012 and as Senior Vice President, Engineering from July 2006 to July 2011. Mr. Grob joined Qualcomm in August 1991 as an engineer and throughout his tenure at Qualcomm held several other technical and leadership roles. Mr. Grob holds a B.S. degree in Electrical Engineering from Bradley University and an M.S. degree in Electrical Engineering from Stanford University.
Margaret “Peggy” L. Johnson, age 51, has served as Executive Vice President, Qualcomm Technologies, Inc. and President of Global Market Development since October 2012. She served as Executive Vice President, Qualcomm Incorporated and President of Global Market Development from January 2011 to October 2012. She served as Executive Vice President of the Americas and India from January 2008 to January 2011 and as Executive Vice President since December 2006. She served as President of our former MFT division from December 2005 to January 2008 and as President of QIS from July 2001 to January 2008. She served as Senior Vice President and General Manager of QIS from September 2000 to July 2001. Ms. Johnson has been a director of Live Nation Entertainment, Inc. since June 2013. Ms. Johnson holds a B.S. degree in Electrical Engineering from San Diego State University.
James P. Lederer, age 53, has served as Executive Vice President, Qualcomm Technologies, Inc. and General Manager of QCT since October 2012. He served as Executive Vice President, Qualcomm Incorporated and General Manager of QCT from May 2009 to October 2012, as Executive Vice President, QCT Business Planning and Finance from May 2008 to May 2009 and as Senior Vice President, Finance from April 2005 to May 2008. Mr. Lederer joined Qualcomm in 1997 as Senior Manager, Corporate Finance and throughout his tenure at Qualcomm held several other finance and leadership roles. Mr. Lederer holds a B.S. degree in Business Administration (Finance/MIS) and an M.B.A. degree from the State University of New York at Buffalo. Mr. Lederer will retire from Qualcomm effective January 3, 2014.
Steven M. Mollenkopf, age 44, has served as President and Chief Operating Officer since November 2011. He served as Executive Vice President and Group President from September 2010 to November 2011, as Executive Vice President and President of QCT from August 2008 to September 2010, as Executive Vice President, QCT Product Management from May 2008 to July 2008, as Senior Vice President, Engineering and Product Management from July 2006 to May 2008 and as Vice President, Engineering from April 2002 to July 2006. Mr. Mollenkopf joined Qualcomm in 1994 as an engineer and throughout his tenure at Qualcomm held several other technical and leadership roles. Mr. Mollenkopf holds a B.S. degree in Electrical Engineering from Virginia Tech and an M.S. degree in Electrical Engineering from the University of Michigan.
Venkata S.M. “Murthy” Renduchintala, age 48, has served as Executive Vice President, Qualcomm Technologies, Inc. and Co-President of QCT since October 2012. He served as Senior Vice President, Qualcomm Incorporated and Co-President of QCT from June 2012 to October 2012, as Senior Vice President, QCT Engineering from October 2007 to June 2012 and as Vice President, QCT Engineering from April 2004 to October 2007. Dr. Renduchintala holds a B.E. degree in Electrical Engineering, an M.B.A. degree and a Ph.D. degree in Digital Communication from the University of Bradford, United Kingdom.
Donald J. Rosenberg, age 62, has served as Executive Vice President, General Counsel and Corporate Secretary since October 2007. He served as Senior Vice President, General Counsel and Corporate Secretary for Apple Inc. from December 2006 to October 2007. From May 1975 to November 2006, Mr. Rosenberg held numerous positions at IBM Corporation, including Senior Vice President and General Counsel. Mr. Rosenberg holds a B.S. degree in Mathematics from the State University of New York at Stony Brook and a J.D. degree from St. John’s University School of Law.
Daniel L. Sullivan, age 62, has served as Executive Vice President of Human Resources since August 2001. He previously served as Senior Vice President of Human Resources from February 1996 to July 2001. Dr. Sullivan holds a B.S. degree in Communication from Illinois State University, an M.A. degree in Communication from West Virginia University and a Ph.D. degree in Communication from the University of Nebraska.
James H. Thompson, age 49, has served as Executive Vice President, Engineering for Qualcomm Technologies, Inc. since October 2012. He served as Senior Vice President, Engineering for Qualcomm Incorporated from July 1998 to October 2012. Dr. Thompson joined Qualcomm in 1992 as a senior engineer and throughout his tenure at Qualcomm held several other technical and leadership roles. Dr. Thompson holds B.S., M.S. and Ph.D. degrees in Electrical Engineering from the University of Wisconsin.
You should consider each of the following factors as well as the other information in this Annual Report in evaluating our business and our prospects. The risks and uncertainties described below are not the only ones we face. Additional risks and
12
uncertainties not presently known to us or that we currently consider immaterial may also impair our business operations. If any of the following risks actually occur, our business and financial results could be harmed. In that case, the trading price of our common stock could decline. You should also refer to the other information set forth in this Annual Report, including our financial statements and the related notes.
Risks Related to Our Businesses
Our revenues depend on the commercial deployment of CDMA, OFDMA and other communications technologies, continuing growth in our customers’ and licensees’ sales of products and services based on these technologies and our ability to continue to drive customer demand for our products and services based on these technologies.
We develop, patent and commercialize technology and products based on CDMA, OFDMA and other communications technologies. We depend on our customers, licensees, operators of CDMA- and OFDMA-based wireless networks and other industries to use our technologies, and on the timing of their deployment of new products and services, and they may incur lower gross margins on products or services based on these technologies than on products and services based on alternative technologies. We also depend on our customers and licensees to develop products and services with value-added features to drive selling prices as well as consumer demand for new 3G and 3G/4G devices. Our revenues and/or growth in revenues could be negatively impacted, our business may be harmed and our substantial investments in these technologies may not provide us an adequate return, if:
|
•
|
wireless operators and other industries deploy alternative technologies;
|
|
•
|
wireless operators delay 3G and/or 3G/4G multimode network deployments, expansions or upgrades and/or delay moving 2G customers to 3G, 3G/4G multimode or 4G wireless devices;
|
|
•
|
LTE, an OFDMA-based 4G wireless technology, is not more widely deployed or commercial deployment is delayed;
|
|
•
|
government regulators delay the reallocation of 2G spectrum to allow wireless operators to upgrade their networks to 3G, thereby restricting the expansion of 3G/4G wireless connectivity;
|
|
•
|
wireless operators are unable to drive improvements in 3G or 3G/4G multimode network performance and/or capacity;
|
|
•
|
our customers’ and licensees’ sales of products and services using these technologies, particularly premium-tier device products, do not grow or do not grow as quickly as anticipated; or
|
|
•
|
we are unable to drive the adoption of our products and services into networks and devices based on CDMA, OFDMA and other communications technologies.
|
Our industry is subject to competition in an environment of rapid technological change that could result in decreased demand and/or declining average selling prices for our products and those of our customers and/or licensees and/or result in placing new specifications or requirements on our products, each of which could negatively affect our revenues and operating results.
Our products, services and technologies face significant competition, and the revenues they generate or the timing of their deployment, which may depend on the actions of others, may not meet expectations. Competition in the communications industry is affected by various factors that include, among others: evolving industry standards and business models; evolving methods of transmission for voice and data communications; networking and connectivity trends; evolving nature of computing (including demand for always on, always connected capabilities); rapid technological change; value-added features that drive selling prices as well as consumer demand for new 3G and 3G/4G devices; turnkey, integrated products that incorporate hardware, software, user interface, applications and reference designs; rapid growth in mobile data consumption; device manufacturer concentrations; growth in emerging geographic regions; scalability; and the ability of the system technology to meet customers’ immediate and future network requirements. We anticipate that additional competitors will introduce products as a result of growth opportunities in wireless communications, the trend toward global expansion by foreign and domestic competitors, technological and public policy changes and relatively low barriers to entry in selected segments of the industry.
Our future success will depend on, among other factors, our ability to:
|
•
|
develop innovative, differentiated integrated circuit products at competitive cost and price points for emerging and developed geographic regions and across device tiers (e.g., premium- and low-tier smartphones);
|
|
•
|
increase and/or accelerate demand for our integrated circuit products and drive their adoption into the most popular device models, particularly premium-tier models, and across a broad spectrum of devices, such as smartphones, tablets, e-readers, gaming devices and other mobile computing and connected devices;
|
|
•
|
strengthen our integrated circuit product roadmap for, and develop channel relationships in, emerging geographic regions, such as China and India, and provide turnkey products for low-tier smartphones;
|
13
|
•
|
be a preferred partner (and sustain preferred relationships) providing integrated circuit products that support multiple operating system platforms to the partners that effectively commercialize new devices using these platforms;
|
|
•
|
continue to be a leader in 4G technology evolution, including expansion of our OFDMA-based single mode licensing program, and continue to innovate and introduce 4G turnkey, integrated products and services that differentiate us from our competition;
|
|
•
|
be a leader serving original equipment manufacturers, high level operating systems (HLOS) providers, operators and other industry participants as competitors, new market entrants and other factors continue to affect the industry landscape;
|
|
•
|
increase and/or accelerate demand for our wired and wireless connectivity products, including networking products for consumers, carriers and enterprise equipment and connected devices;
|
|
•
|
become a leading supplier of small cell technology (which allows inexpensive cell sites deployed by users to connect to traditional cellular networks through wired internet connections) to enable significant network capacity expansion to meet anticipated growth in mobile data traffic;
|
|
•
|
continue to develop brand recognition to effectively compete against better known companies in mobile computing and other consumer driven segments and to deepen our presence in significant emerging geographic regions; and/or
|
|
•
|
create stand-alone value and/or contribute to the success of our existing businesses through investments in new industry segments and/or disruptive technologies, including new display technologies, wireless charging, mobile health, mobile location awareness and commerce, the connected home and the Internet of Everything, among others.
|
Competition and/or the introduction and growth in sales of low-tier products, particularly relative to premium-tier products, may reduce average selling prices for our chipset products and the products of our customers and licensees. This dynamic is particularly pronounced in emerging geographic regions. Reductions in the average selling prices of our chipset products, without corresponding decreases in average unit costs, would negatively impact our margins. In addition, total royalties payable to us would generally decrease, negatively impacting our revenues, as a result of reductions in the average selling prices of our licensees’ products, unless offset by an increase in volumes.
Companies that promote standards that are neither CDMA- nor OFDMA-based (e.g., GSM) as well as companies that design integrated circuits based on CDMA, OFDMA or their derivatives are generally competitors or potential competitors. Examples (some of which are strategic partners of ours in other areas) include Broadcom, Ericsson, Fujitsu, HiSilicon Technologies, Intel, Lantiq, Marvell Technology, Maxim Integrated Products, MediaTek, nVidia, Realtek Semiconductor, Samsung Electronics, Spreadtrum Communications, Texas Instruments and VIA Telecom. Some of these current and potential competitors have advantages over us that include, among others: motivation by our customers in certain circumstances to find alternate suppliers; foreign government support of other technologies or competitors; more extensive relationships with local distribution companies and original equipment manufacturers in emerging geographic regions (e.g., China); lower cost structures; and/or a more established presence in certain device markets.
Certain of our software and our suppliers’ software may contain or may be derived from “open source” software, and we have seen, and believe we will continue to see, an increase in customers requesting that we develop products, including software associated with our integrated circuit products, that incorporate open source software elements and operate in an open source environment, which, under certain open source licenses, may offer accessibility to a portion of a product’s source code and may expose related intellectual property to adverse licensing conditions. Licensing of such software may impose certain obligations on us if we were to distribute derivative works of the open source software. For example, these obligations may require us to make source code for the derivative works available to our customers in a manner that allows them to make such source code available to their customers, or license such derivative works under a particular type of license that is different than what we customarily use to license our software. Developing open source products, while adequately protecting the intellectual property rights upon which our licensing business depends, may prove burdensome and time-consuming under certain circumstances, thereby placing us at a competitive disadvantage for new product designs. Also, our use and our customers’ use of open source software may subject our products and our customers’ products to governmental scrutiny and delays in product certification, which could cause customers to view our products as less desirable than our competitors’ products. While we believe we have taken appropriate steps and employed adequate controls to protect our intellectual property rights, our use of open source software presents risks that could have an adverse effect on these rights and on our business.
We derive a significant portion of our consolidated revenues from a small number of customers and licensees. If revenues derived from these customers or licensees decrease or the timing of such revenues fluctuate, our operating results could be negatively affected.
Our QCT segment derives a significant portion of revenues from a small number of customers, and we may be unable to further diversify our customer base. In addition, our industry is experiencing and may continue to experience an increasing
14
concentration of device share among a few companies, and this trend may result in an increasing portion of our revenues being derived from a small number of customers. The loss of any one of our significant customers, a reduction in the purchases of our products by such customers or cancelation of significant purchases from any of these customers would reduce our revenues and could harm our ability to achieve or sustain expected operating results, and a delay of significant purchases, even if only temporary, would reduce our revenues in the period of the delay. Further, concentration of device share among a few companies, and the corresponding purchasing power of these companies, may result in lower prices for our products which, if not accompanied by a sufficient increase in the volume of purchases of our products, could have an adverse effect on our revenues and margins. In addition, the timing and size of purchases by our significant customers may be impacted by the timing of such customers’ new or next generation product introductions, over which we have little or no control, and the timing of such introductions may cause our operating results to fluctuate. Accordingly, if current industry dynamics and concentrations continue, our QCT segment’s revenues will continue to depend largely upon, and be impacted by, future purchases and the timing and size of any such future purchases by these significant customers.
Further, companies that provide HLOS for devices, including leading technology companies, have entered the device market. If we fail to effectively partner with these companies, or their partners or customers, they may decide not to purchase (either directly or through their contract manufacturers), or to reduce or discontinue their purchases of, our integrated circuit products.
In addition, there has been and continues to be litigation among certain of our customers and other industry participants, and the potential outcomes of such litigation, including but not limited to injunctions against devices that incorporate our products or rulings on certain patent law issues that create new legal precedent, could impact our business.
Although we have more than 250 CDMA-based licensees, our QTL segment derives a significant portion of licensing revenues from a limited number of licensees. Moreover, the future growth and success of our core licensing business will depend in part on the ability of our licensees to develop, introduce and deliver high-volume products that achieve and sustain customer acceptance. We have little or no control over the product development or sales efforts of our licensees, and our licensees might not be successful. Reductions in the average selling prices of wireless devices sold by our major licensees, without a sufficient increase in the volumes of such devices sold, would generally have an adverse effect on our revenues.
The continued and future success of our licensing programs can be impacted by the deployment of other technologies in place of technologies based on CDMA, OFDMA and their derivatives; the need to extend certain existing license agreements that are expiring and/or to cover additional later patents; and/or the success of our licensing programs for 4G single mode products and emerging industry segments.
Although we own a very strong portfolio of issued and pending patents related to GSM, GPRS, EDGE, OFDM, OFDMA, WLAN, MIMO and other technologies, our patent portfolio licensing program in these areas is less established and might not be as successful in generating licensing revenues as our CDMA licensing program. Many wireless operators are investigating or have selected OFDMA-based LTE as their next-generation 4G technology for deployment in existing or future wireless spectrum bands as complementary to their existing CDMA-based networks. While 3G/4G multimode products are generally covered by existing 3G licensing agreements, products that implement 4G and do not implement 3G are generally not covered by existing 3G licensing agreements. Although we believe that our patented technology is essential and useful to implementation of the LTE industry standards and have granted royalty-bearing licenses to more than 90 companies (including LG, Nokia, Samsung, Sony Mobile and ZTE) that have realized that they need a license under our patents to make and sell products implementing 4G standards but not implementing 3G standards, the royalty rates for single mode 4G products are generally lower than our royalty rates for 3G and 3G/4G multimode products, and therefore, we might not achieve the same licensing revenues on such LTE products as on 3G or 3G/4G multimode products. In addition, new connectivity services are emerging that rely on devices that may or may not be used on traditional cellular networks, such as devices used in the connected home or the Internet of Everything. Standards, even de facto standards, that develop as these technologies mature, in particular those that do not include a base level of interoperability, may impact our ability to obtain royalties that are equivalent to those that we receive for 3G products used in cellular communications. Although we believe that our patented technology is essential and useful to the commercialization of such services, the royalties we receive may be lower than those we receive from our current licensing program.
Over the long-term, we need to continue to evolve our patent portfolio. If we do not maintain a strong portfolio that is applicable to current and/or future products and/or services, our future licensing revenues could be negatively impacted.
The licenses granted to and from us under a number of our license agreements include only patents that are either filed or issued prior to a certain date and, in a small number of agreements, royalties are payable on those patents for a specified time period. As a result, there are agreements with some licensees where later patents are not licensed by or to us and/or royalties are not owed to us under such license agreements after the specified time period. In order to license or to obtain a license to such later patents, or to receive royalties after the specified time period, we will need to extend or modify such license agreements or enter into new license agreements with such licensees. We might not be able to modify those license agreements, or enter into
15
new license agreements, in the future without affecting the material terms and conditions of our license agreements with such licensees, and such modifications or new agreements may negatively impact our revenues. If we are unable to reach agreement on such modifications or new agreements, it could result in patent infringement litigation with such companies.
Efforts by some communications equipment manufacturers or their customers to avoid paying fair and reasonable royalties for the use of our intellectual property may require the investment of substantial management time and financial resources and may result in legal decisions and/or actions by governments, courts, regulators or agencies, Standards Development Organizations (SDOs) or other industry organizations that harm our business.
From time to time, companies initiate various strategies to attempt to renegotiate, mitigate and/or eliminate their need to pay royalties to us for the use of our intellectual property. These strategies have included: (i) litigation, often alleging infringement of patents held by such companies, patent misuse, patent exhaustion, patent invalidity and/or patent and/or license unenforceability, or some form of unfair competition; (ii) taking positions contrary to our understanding of their contracts with us; (iii) appeals to governmental authorities; (iv) collective action, including working with wireless operators, standards bodies, other like-minded companies and other organizations, on both formal and informal bases, to adopt intellectual property policies and practices that could have the effect of limiting returns on intellectual property innovations; and (v) lobbying governmental regulators and elected officials for the purpose of seeking the imposition of some form of compulsory licensing and/or to weaken a patent holder’s ability to enforce its rights or obtain a fair return for such rights.
In addition, in connection with our participation in SDOs, we, like other patent owners, generally make contractual commitments to such organizations to license those of our patents that would be infringed by standard-compliant products on terms that are fair, reasonable and nondiscriminatory (FRAND). Some manufacturers and users of standard-compliant products advance interpretations of these FRAND commitments that are adverse to our licensing business, including interpretations that would limit the amount of royalties that we could collect on the licensing of our patent portfolio.
Further, some companies or entities have proposed significant changes to existing intellectual property policies for implementation by SDOs and other industry organizations with the goal of significantly devaluing standards-essential patents. For example, some have put forth proposals which would require a maximum aggregate intellectual property royalty rate for the use of all essential patents owned by all of the member companies to be applied to the selling price of any product implementing the relevant standard. They have further proposed that such maximum aggregate royalty rate be apportioned to each member company with essential patents based upon the number of essential patents held by such company. Others have proposed that injunctions not be an available remedy for infringement of essential patents and/or have made proposals that could severely limit damage awards and other remedies by courts for patent infringement (e.g., by severely limiting the base upon which the royalty percentage may be applied). A number of these strategies are purportedly based on interpretations of the policies of certain SDOs concerning the licensing of patents that are or may be essential to industry standards and on our and/or other companies’ alleged failure to abide by these policies.
Some courts and governmental agencies have adopted and may in the future adopt some or all of these interpretations or proposals in a manner adverse to our interests, and SDOs may adopt such interpretations or proposals as so-called clarifications or amendments to their intellectual property policies.
We expect that such proposals, interpretations and strategies will continue in the future, and if successful in the future, our business model would be harmed, either by limiting or eliminating our ability to collect royalties on all or a portion of our patent portfolio, limiting our return on investment with respect to new technologies, limiting our ability to seek injunctions against infringers of our standards-essential patents, or forcing us to work outside of SDOs or other industry groups to promote our new technologies, and our results of operations could be negatively impacted. In addition, the legal and other costs associated with asserting or defending our positions have been and continue to be significant. We assume that such challenges, regardless of their merits, will continue into the foreseeable future and may require the investment of substantial management time and financial resources.
The enforcement and protection of our intellectual property rights may be expensive, could fail to prevent misappropriation or unauthorized use of our proprietary intellectual property rights, could result in the loss of our ability to enforce one or more patents, or could be adversely affected by changes in patent laws, by laws in certain foreign jurisdictions that may not effectively protect our intellectual property rights or by ineffective enforcement of laws in such jurisdictions.
We rely primarily on patent, copyright, trademark and trade secret laws, as well as nondisclosure and confidentiality agreements and other methods, to protect our proprietary information, technologies and processes, including our patent portfolio. Policing unauthorized use of our products, technologies and proprietary information is difficult and time consuming. We cannot be certain that the steps we have taken, or may take in the future, will prevent the misappropriation or unauthorized use of our proprietary information and technologies, particularly in foreign countries where the laws may not protect our proprietary intellectual property rights as fully or as readily as United States laws or where the enforcement of such laws may be lacking or ineffective. Some industry participants who have a vested interest in devaluing patents in general, or standards essential patents in particular, have mounted attacks on certain patent systems, increasing the likelihood of changes to
16
established patent laws. In the United States, there is continued discussion regarding potential patent law changes. Many observers anticipate that in the next few years the European Union will adopt a unitary patent system that may broadly impact that region’s patent regime. We cannot predict with certainty the long-term effects of any potential changes. In addition, we cannot be certain that the laws and policies of any country or the practices of any standards bodies, foreign or domestic, with respect to intellectual property enforcement or licensing or the adoption of standards, will not be changed in the future in a way detrimental to our licensing program or to the sale or use of our products or technology. We have had, and may continue to have, difficulty in certain circumstances in protecting or enforcing our intellectual property rights and/or contracts, including collecting royalties for use of our patent portfolio in particular foreign jurisdictions due to, among others: policies of foreign governments; challenges to our licensing practices under such jurisdictions’ competition laws; adoption of mandatory licensing provisions by foreign jurisdictions (either with controlled/regulated royalties or royalty free); failure of foreign courts to recognize and enforce judgments of contract breach and damages issued by courts in the United States; and/or challenges pending before foreign competition agencies to the pricing and integration of additional features and functionality into our chipset products.
We may need to litigate in the United States or elsewhere in the world to enforce our intellectual property rights, protect our trade secrets or determine the validity and scope of proprietary rights of others. As a result of any such litigation, we could lose our ability to enforce one or more patents or incur substantial unexpected operating costs. Any action we take to enforce our intellectual property rights could be costly and could absorb significant management time and attention, which, in turn, could negatively impact our operating results.
Our research, development and other investments in new technologies, products and services may not generate operating income or contribute to future operating results that meet our expectations.
Our industry is subject to rapid technological change, and we must make substantial research, development and other investments in new products, services and technologies to compete successfully. Technological innovations generally require significant research and development efforts before they are commercially viable. We intend to continue to make substantial investments in developing new products, services and technologies that we believe can create stand-alone value and/or contribute to the success of our existing businesses, and it is possible that these initiatives will not be successful and/or will not result in meaningful revenues or generate operating income that meets expectations. While we continue to focus our development efforts primarily in support of 3G CDMA- and 4G OFDMA-based technologies, we innovate across a broad spectrum of opportunities that leverage our existing technical and business expertise to deploy new business models and enter into new industry segments. Our recent investment initiatives relate to, among others, new display technologies, wireless charging technology, small cell technology and the 1000x data challenge, proximity-based communications, very high speed connectivity, mobile location awareness and commerce, mobile health, wearable technology, gaming and products for the connected home, the digital 6th sense and the Internet of Everything.
Our research, development and other investments in new technologies, products or services may not succeed due to, among others: improvements in alternate technologies in ways that reduce the advantages we anticipate from our investments; competitors’ products or services being more cost effective, having more capabilities or fewer limitations or being brought to market faster than our new products and services; and competitors having longer operating histories in industry segments that are new to us. We may also underestimate the costs of or overestimate the future operating income and/or margins that could result from these investments; and these investments may not, or may take many years to, generate material returns. If our new technologies, products or services are not successful, or are not successful in the time frame we anticipate, we may incur significant costs and/or asset impairments, our business may not grow as anticipated, our margins may be negatively impacted and/or our reputation may be harmed.
Claims by other companies that we infringe their intellectual property could adversely affect our business.
From time to time, companies have asserted, and may again assert, patent, copyright and other intellectual property rights against our products or products using our technologies or other technologies used in our industry. These claims have resulted and may again result in our involvement in litigation. We may not prevail in such litigation given the complex technical issues and inherent uncertainties in intellectual property litigation. If any of our products were found to infringe on another company’s intellectual property rights, we could be subject to an injunction or required to redesign our products, which could be costly, or to license such rights and/or pay damages or other compensation to such other company. If we are unable to redesign our products, license such intellectual property rights used in our products or otherwise distribute our products through a licensed supplier, we could be prohibited from making and selling such products. In any potential dispute involving other companies’ patents or other intellectual property, our chipset foundries, semiconductor assembly and test providers and customers could also become the targets of litigation. We are contingently liable under certain product sales, services, license and other agreements to indemnify certain customers against certain types of liability and/or damages arising from qualifying claims of patent infringement by products or services sold or provided by us. Reimbursements under indemnification arrangements could have an adverse effect on our results of operations. Furthermore, any such litigation could severely disrupt the supply of our products and the businesses of our chipset customers and their customers, which in turn could hurt our relationships with them
17
and could result in a decline in our chipset sales and/or reductions in our licensees’ sales, causing a corresponding decline in our chipset and/or licensing revenues. Any claims, regardless of their merit, could be time consuming to address, result in costly litigation, divert the efforts of our technical and management personnel or cause product release or shipment delays, any of which could have an adverse effect upon our operating results.
We expect that we may continue to be involved in litigation and may have to appear in front of administrative bodies (such as the U.S. International Trade Commission) to defend against patent assertions against our products by companies, some of whom are attempting to gain competitive advantage or leverage in licensing negotiations. We may not be successful in such proceedings, and if we are not, the range of possible outcomes includes everything from royalty payment to an injunction on the sale of certain of our integrated circuit products (and on the sale of our customers’ devices using such products). Any imposition of royalty payments might make purchases of our products less economical for our customers and could have an adverse effect upon our operating results. A negative outcome in any such proceeding could severely disrupt the business of our chipset customers and their wireless operator customers, which in turn could harm our relationships with them and could result in a decline in our share of worldwide chipset sales and/or a reduction in our licensees’ sales to wireless operators, causing corresponding declines in our chipset and/or licensing revenues.
A number of other companies have claimed to own patents applicable to products implementing various CDMA standards, GSM standards and OFDMA standards. In addition, existing standards continue to evolve, and new standards, including those applicable to new industry segments, continue to be developed. If future standards diminish, or fail to include, a base level of interoperability, our business may be harmed, and our investments in these new segments may not succeed. If we or other product manufacturers are required to obtain additional licenses and/or pay royalties to one or more of such other patent holders, this could have an adverse effect on the commercial implementation of our products and technologies, average sales prices of and demand for our licensees’ products and our results of operations.
We depend on a limited number of third-party suppliers for the procurement, manufacture and testing of our products. If we fail to execute supply strategies that provide supply assurance, technology leadership and low cost, our operating results and our business may be harmed.
Our QCT segment purchases wafers, die and fully-assembled and tested integrated circuits from third-party semiconductor manufacturing foundries. We also contract with third-party suppliers for assembly, test and other services related to the manufacture of our products. A reduction, interruption, delay or limitation in our product supply source, a failure by our suppliers to procure raw materials or to provide or allocate adequate manufacturing or test capacity for our products or their inability to react to shifts in product demand or an increase in raw material or component prices could have an adverse effect on our ability to meet customer demands, our business and/or our profitability. The loss of a supplier or the inability of a supplier to meet performance or quality specifications or delivery schedules could harm our ability to meet our delivery obligations to our customers and/or negatively impact our revenues, business operations and ability to compete for future business. In the event of a loss of or a decision to change a supplier, qualifying a new foundry supplier and commencing volume production or testing could cause us to incur additional expense and production delays, resulting in possible loss of customers.
While we have established alternate suppliers for certain technologies that we consider critical, we rely on sole- or limited-source suppliers for some products, subjecting us to significant risks, including: possible shortages of raw materials or manufacturing capacity; poor product performance; and reduced control over delivery schedules, manufacturing capability and yields, quality assurance, quantity and costs. To the extent we have established alternate suppliers, these suppliers may require significant levels of support to bring complex technologies to production. As a result, we may invest a significant amount of effort and resources and incur higher costs to support and maintain such alternate suppliers. Further, any future consolidation of foundry suppliers could increase our vulnerability to sole- or limited-source arrangements. Our arrangements with our suppliers may oblige us to incur costs to manufacture and test our products that do not decrease at the same rate as decreases in pricing to our customers. Our ability, and that of our suppliers, to develop or maintain leading process technologies, including transitions to smaller geometry process technologies, and to effectively compete with the manufacturing processes and performance of our competition, could also impact our ability to meet customer demand, increase our costs and subject us to the risk of excess inventories. Our inability to meet customer demand due to sole- or limited-sourcing and/or the additional costs that we incur because of these or other supply constraints or because of the need to support alternate suppliers could negatively impact our business, our revenues and our results of operations.
Although we have long-term contracts with our suppliers, many of these contracts do not provide for long-term capacity commitments. To the extent that we do not have firm commitments from our suppliers over a specific time period, or for any specific quantity, our suppliers may allocate, and in the past have allocated, capacity to the production and testing of products for their other customers while reducing or limiting capacity to manufacture or test our products. Accordingly, capacity for our products may not be available when we need it or at reasonable prices. To the extent we do obtain long-term capacity commitments, we may incur additional costs related to those commitments.
18
One or more of our suppliers or potential alternate suppliers may manufacture CDMA- or OFDMA-based integrated circuits that compete with our products. In this event, the supplier could elect to allocate raw materials and manufacturing capacity to their own products and reduce or limit deliveries to us to our detriment. In addition, we may not receive reasonable pricing, manufacturing or delivery terms. We cannot guarantee that the actions of our suppliers will not cause disruptions in our operations that could harm our ability to meet our delivery obligations to our customers or increase our cost of sales.
Our stock price and earnings are subject to substantial quarterly and annual fluctuations and to market downturns.
Our stock price and earnings have fluctuated in the past and are likely to fluctuate in the future. Factors that may have a significant impact on the market price of our stock and/or earnings include, among others:
|
•
|
volatility of the stock market in general and technology-based companies in particular that is often unrelated to the operating performance of any specific public company;
|
|
•
|
announcements concerning us, our competitors or our customers, including the selection of wireless communications technologies by wireless operators and the timing of the roll-out of those technologies, the use of our or our competitors’ integrated circuits in wireless devices by certain manufacturers or the business performance of our customers;
|
|
•
|
international developments, such as technology mandates, political developments or changes in economic policies;
|
|
•
|
changes in recommendations of securities analysts;
|
|
•
|
fluctuations (or market expectations of future fluctuations) in our operating margins and/or earnings (or forecasts) that exceed or fail to meet financial guidance that we provide to investors and/or the expectations of analysts or investors;
|
|
•
|
whether our return of capital to our stockholders meets, does not meet or exceeds the expectations of analysts or investors;
|
|
•
|
proprietary rights, product or patent litigation taken or threatened against us or against our customers or licensees;
|
|
•
|
strategic transactions, such as debt issuance, strategic equity or debt investments, acquisitions, divestitures or spin-offs;
|
|
•
|
unexpected and/or significant changes in the average selling prices of our licensees’ products and/or our products;
|
|
•
|
unresolved disputes with licensees that result in non-payment and/or non-recognition of royalty revenues that may be owed to us;
|
|
•
|
declines in the value or performance of our significant marketable securities portfolio, which is subject to financial market volatility and liquidity, interest rate, credit and other risks; or
|
|
•
|
inquiries, rumors or allegations regarding our financial disclosures, practices or compliance programs.
|
In the past, securities class action litigation often has been brought against a company following periods of volatility in the market price of its securities. Due to changes in our stock price, we may be the target of securities litigation in the future. Securities litigation could result in substantial uninsured costs and divert management’s attention and resources.
We are subject to government regulations and policies. Our business may suffer as a result of new or changes in laws, regulations or policies, our failure or inability to comply with laws, regulations or policies or adverse rulings in enforcement or other proceedings.
Our business, products and services, and those of our customers and licensees, are subject to various laws and regulations globally, as well as government policies and the specifications of international, national and regional communications standards bodies. The adoption of new laws, regulations or policies, changes in the interpretation of existing laws, regulations or policies, changes in the regulation of our activities by a government or standards body and/or adverse rulings in court, regulatory, administrative or other proceedings relating to such laws, regulations or policies, including, among others, those affecting the use of our technology or products, competitive business practices, licensing practices, protection of intellectual property, trade, foreign investments or loans, spectrum availability and license issuance, adoption of standards, the provision of device subsidies by wireless operators to their customers, taxation, environmental protection or employment, could have an adverse effect on our business. Delays in government approvals or other governmental activities that could result from, among others, a decrease in or a lack of funding for certain agencies or branches of the government and/or political changes, could result in our incurring higher costs, could negatively impact our ability to timely consummate strategic transactions and/or could have other negative impacts on our business and the businesses of our customers and licensees.
National, state and local environmental laws and regulations affect our operations around the world. These laws may make it more expensive to manufacture, have manufactured and sell products, and our costs could increase if our vendors (e.g., third-party manufacturers or utility companies) pass on their costs to us.
19
The SEC has recently adopted disclosure rules for companies that use conflict minerals in their products, with substantial supply chain verification requirements in the event that the materials come from, or could have come from, the Democratic Republic of the Congo or adjoining countries. These new rules and verification requirements, which apply to our activities in calendar 2013 and future years, impose additional costs on us and on our suppliers and may limit the sources or increase the prices of materials used in our products. Further, if we are unable to certify that our products are conflict free, we may face challenges with our customers that place us at a competitive disadvantage, and our reputation may be harmed.
Laws, regulations and standards relating to corporate governance, business conduct, public disclosure and health care are complex and changing and may create uncertainty regarding compliance. Laws, regulations and standards are subject to varying interpretations in many cases, and their application in practice may evolve over time. As a result, our efforts to comply may fail, particularly if there is ambiguity as to how they should be applied in practice. New laws, regulations and standards or evolving interpretations of legal requirements may cause us to incur higher costs as we revise current practices, policies and/or procedures and may divert management time and attention to compliance activities.
We may engage in acquisitions or strategic transactions or make strategic investments that could adversely affect our financial results or fail to enhance stockholder value.
We engage in acquisitions and strategic transactions and make strategic investments with the goal of maximizing stockholder value. We acquire businesses and other assets, including wireless spectrum, patents and other intangible assets, enter into joint ventures or other strategic transactions and purchase minority equity interests in or make loans to companies that may be
private and early-stage. Our strategic activities are generally focused on opening new or expanded opportunities for our technologies and supporting the design and introduction of new products and services for voice and data communications. Many of our acquisitions or strategic investments entail a high degree of risk, and investments may not become liquid for several years after the date of the investment, if at all. Our acquisitions or strategic investments may not generate financial returns or result in increased adoption or continued use of our technologies. In some cases, we may be required to consolidate or record our share of the earnings or losses of companies in which we have acquired ownership interests. In addition, we may record impairment charges related to our acquisitions and strategic investments. Any losses or impairment charges that we incur related to strategic investments or other transactions will have a negative impact on our financial results, and we may continue to incur new or additional losses related to strategic assets or investments that we have not fully impaired or exited.
Achieving the anticipated benefits of business acquisitions depends in part upon our ability to integrate the acquired businesses in an efficient and effective manner. The integration of companies that have previously operated independently may result in significant challenges, including, among others: retaining key employees; successfully integrating new employees, business systems and technology; retaining customers and suppliers of the acquired business; minimizing the diversion of management’s attention from ongoing business matters; coordinating geographically separate organizations; consolidating research and development operations; and consolidating corporate and administrative infrastructures. We may not derive any commercial value from acquired technology, products or intellectual property or from future technologies or products based on the acquired technology and/or intellectual property, and we may be subject to liabilities that are not covered by indemnification protection we may obtain or we may become subject to litigation. Additionally, we may not be successful in expanding into geographic regions and/or categories of products served by or adjacent to an acquired business or in addressing potential new opportunities that may arise out of the combination. Due to our inexperience with products of and/or geographic regions served by acquired businesses, we may underestimate the costs and/or overestimate the benefits, including product and other synergies and growth opportunities that we expect to realize, and we may not achieve them. If we do not achieve the anticipated benefits of business acquisitions, our results of operations may be adversely affected, and we may not enhance stockholder value by engaging in these transactions.
Global economic conditions that impact the mobile communications industry could negatively affect the demand for our products and services and our customers’ or licensees’ products and services, which may negatively affect our revenues.
A decline in global economic conditions, particularly in geographic regions with high concentrations of wireless voice and data users, could have adverse, wide-ranging effects on demand for our products and for the products and services of our customers or licensees, particularly equipment manufacturers or others in the wireless communications industry who buy their products, such as wireless operators. Any prolonged economic crisis may result in a downturn in demand for our products or technology; the insolvency of key suppliers; delays in reporting and/or payments from our licensees and/or customers; failures by counterparties; and negative effects on wireless device inventories. In addition, our direct and indirect customers’ ability to purchase or pay for our products and services, obtain financing and upgrade their wireless networks could be adversely affected by economic conditions, leading to a reduction, cancelation or delay of orders for our products or services.
Currency fluctuations could negatively affect future product sales or royalty revenues, harm our ability to collect receivables or increase the U.S. dollar cost of our products or the activities of our foreign subsidiaries and strategic investments.
20
Our customers sell their products throughout the world in various currencies. Consolidated revenues from international customers as a percentage of total revenues were greater than 90% during each of the last three fiscal years. Adverse movements in currency exchange rates may negatively affect our business and our operating results due to a number of factors, including, among others:
|
•
|
Our products and those of our customers and licensees that are sold outside the United States may become less price-competitive, which may result in reduced demand for those products and/or downward pressure on average selling prices;
|
|
•
|
Certain of our revenues, such as royalties, that are derived from licensee or customer sales denominated in foreign currencies could decrease;
|
|
•
|
Our foreign suppliers may raise their prices if they are impacted by currency fluctuations, resulting in higher than expected costs and lower margins;
|
|
•
|
Foreign exchange hedging transactions that we engage in to reduce the impact of currency fluctuations may require the payment of structuring fees, limit the U.S. dollar value of royalties from licensees’ sales that are denominated in foreign currencies, cause earnings volatility if the hedges do not qualify for hedge accounting and expose us to counterparty risk if the counterparty fails to perform; and
|
|
•
|
The U.S. dollar value of our marketable securities that are denominated directly or indirectly in foreign currencies may decline.
|
Failures in our products or services or in the products of our customers, including those resulting from security vulnerabilities, defects or errors, could harm our business.
The use of devices containing our products to access untrusted content creates a risk of exposing the system software in those devices to viral or malicious attacks. While we continue to focus on this issue and are taking measures to safeguard our products from cybersecurity threats, device capabilities continue to evolve, enabling more data and processes, such as mobile computing, and increasing the risk of security failures. Further, our products are inherently complex and may contain defects or errors that are detected only when the products are in use. For example, as our chipset product complexities increase, we are required to migrate to integrated circuit technologies with smaller geometric feature sizes. The design process interface issues in new domains of technology are complex and add risk to manufacturing yields and reliability. Manufacturing, testing, marketing and use of our products and those of our customers and licensees entail the risk of product liability. Because our products and services are responsible for critical functions in our customers’ products and/or networks, security failures, defects or errors in our components, materials or software or in our customers’ products could have an adverse impact on us, on our customers and on the end users of their products. Such adverse impact could include product liability claims or recalls, a decrease in demand for connected devices and wireless services, damage to our reputation and to our customer relationships and other financial liability or harm to our business.
Our business and operations could suffer in the event of security breaches.
Attempts by others to gain unauthorized access to our information technology systems are increasingly more sophisticated. These attempts, which might be related to industrial or other espionage, include covertly introducing malware to our computers and networks and impersonating authorized users, among others. We seek to detect and investigate all security incidents and to prevent their recurrence, but in some cases, we might be unaware of an incident or its magnitude and effects. While we have identified several incidents of unauthorized access, to date none have caused material damage to our business. The theft, unauthorized use or publication of our intellectual property and/or confidential business information could harm our competitive position, reduce the value of our investment in research and development and other strategic initiatives and/or otherwise adversely affect our business. To the extent that any security breach results in inappropriate disclosure of our customers’ or licensees’ confidential information, we may incur liability. We expect to continue to devote additional resources to the security of our information technology systems.
Potential tax liabilities could adversely affect our results of operations.
We are subject to income taxes in the United States and numerous foreign jurisdictions. Significant judgment is required in determining our provision for income taxes. Although we believe that our tax estimates are reasonable, the final determination of tax audits and any related litigation could materially differ from amounts reflected in historical income tax provisions and accruals. In such case, our income tax provision and results of operations in the period or periods in which that determination is made could be negatively affected.
Our QCT segment’s non-United States headquarters is located in Singapore. We obtained tax incentives in Singapore provided that we meet specified employment and incentive criteria, and as a result of expiration of these incentives, our Singapore tax rate is expected to increase in fiscal 2017 and again in fiscal 2027. If we do not meet the criteria required to
21
retain such incentives, our Singapore tax rate could increase prior to those dates, and our results of operations may be adversely affected.
Tax rules may change in a manner that adversely affects our future reported financial results or the way we conduct our business. For example, we consider the operating earnings of certain non-United States subsidiaries to be indefinitely invested outside the United States based on our current needs for those earnings to be reinvested offshore as well as estimates that future domestic cash generation will be sufficient to meet future domestic cash needs for the foreseeable future. No provision has been made for United States federal and state or foreign taxes that may result from future remittances of the undistributed earnings of these foreign subsidiaries. Our future financial results and liquidity may be adversely affected if tax rules regarding unrepatriated earnings change, if domestic cash needs require us to repatriate foreign earnings, or if the United States international tax rules change as part of comprehensive tax reform or other tax legislation.
If wireless devices pose safety risks, we may be subject to new regulations, and demand for our products and those of our customers and licensees may decrease.
Concerns over the effects of radio frequency emissions continue. Interest groups have requested that the Federal Communications Commission investigate claims that wireless communications technologies pose health concerns and cause interference with, among other things, airbags, hearing aids and medical devices, and there continues to be litigation in the industry with respect to these issues. Legislation that may be adopted in response to these concerns or adverse news or findings about safety risks could reduce demand for our products and those of our licensees and customers in the United States as well as in foreign countries.
We may not be able to attract and retain qualified employees.
Our future success depends largely upon the continued service of our executive officers and other key management and technical personnel and on our ability to continue to attract, retain and motivate qualified personnel. In addition, implementing our business strategy requires specialized engineering and other talent, and our revenues are highly dependent on technological and product innovations. The market for employees in our industry is extremely competitive. Further, existing immigration laws make it more difficult for us to recruit and retain highly skilled foreign national graduates of universities in the United States, making the pool of available talent even smaller. We continue to anticipate increases in human resource needs, particularly in engineering. If we are unable to attract and retain qualified employees, our business may be harmed.
None.
22
At
September 29, 2013
, we occupied the indicated square footage in the owned or leased facilities described below (square footage in thousands):
|
Number
|
|
|
Total
|
|
||||||||
|
of
|
|
|
Square
|
|
||||||||
|
Buildings
|
Location
|
Status
|
Footage
|
Primary Use
|
Primary Segment(s)
|
|||||||
|
35
|
|
United States
|
Owned
|
4,660
|
|
Executive and administrative offices, research and development, sales and marketing, service functions, manufacturing and network management hub.
|
All
|
|||||
|
50
|
|
United States
|
Leased
|
1,804
|
|
Administrative offices, research and development, sales and marketing, service functions and network management hub.
|
All
|
|||||
|
2
|
|
Taiwan
|
Owned
|
1,824
|
|
Administrative offices, research and development, manufacturing and sales and marketing.
|
QMT, QCT
|
|||||
|
9
|
|
India
|
Leased
|
678
|
|
Administrative offices, research and development and sales and marketing.
|
QCT
|
|||||
|
15
|
|
China
|
Leased
|
386
|
|
Administrative offices, research and development, sales and marketing, service functions and network operating centers.
|
All
|
|||||
|
7
|
|
Taiwan
|
Leased
|
137
|
|
Administrative offices, research and development and sales and marketing.
|
QMT
|
|||||
|
3
|
|
India
|
Owned
|
136
|
|
Administrative offices, research and development and sales and marketing.
|
QCT
|
|||||
|
7
|
|
Canada
|
Leased
|
134
|
|
Administrative offices, research and development and sales and marketing.
|
QCT, Omnitracs
|
|||||
|
5
|
|
Israel
|
Leased
|
126
|
|
Administrative offices, research and development and sales and marketing.
|
QCT, QTL
|
|||||
|
3
|
|
Mexico
|
Leased
|
118
|
|
Administrative offices, sales and marketing, service functions, manufacturing and network management hub.
|
QWI, QTL
|
|||||
|
3
|
|
South Korea
|
Leased
|
99
|
|
Administrative offices, research and development and sales and marketing.
|
QCT
|
|||||
|
2
|
|
Singapore
|
Leased
|
62
|
|
Administrative offices, research and development and sales and marketing.
|
QCT
|
|||||
|
4
|
|
England
|
Leased
|
55
|
|
Administrative offices, research and development and sales and marketing.
|
QCT
|
|||||
|
7
|
|
Germany
|
Leased
|
48
|
|
Administrative offices, research and development and sales and marketing.
|
QCT, QTL
|
|||||
|
39
|
|
Other International
|
Leased
|
172
|
|
Administrative offices, research and development and sales and marketing.
|
All
|
|||||
|
|
Total square footage
|
10,439
|
|
|
||||||||
In addition to the facilities above, we own or lease approximately 4,000 square feet of properties that are leased or subleased to third parties. Our facility leases expire at varying dates through 2029, not including renewals that would be at our option.
Several owned and leased facilities are under construction totaling approximately 468,000 additional square feet to meet the requirements projected in our long-term business plan. In connection with our intention to license our next generation interferometric modulator (IMOD) display technology in the future, while directly commercializing only certain IMOD products, we are evaluating strategic options for one of our manufacturing facilities in Taiwan, which include, but are not limited to, operating the facility in support of our commercialization efforts and/or
a sale to, or joint venture with, third parties.
We believe that our facilities will be suitable and adequate for the present purposes and that the productive capacity in facilities that are not under construction is substantially utilized. In the future, we may need to purchase, build or lease additional facilities to meet the requirements projected in our long-term business plan.
23
Tessera, Inc. v. QUALCOMM Incorporated
: On April 17, 2007, Tessera filed a patent infringement lawsuit in the United States District Court for the Eastern District of Texas and a complaint with the United States International Trade Commission (ITC) pursuant to Section 337 of the Tariff Act of 1930 against us and other companies, alleging infringement of two patents. The district court action was stayed pending resolution of the ITC proceeding, including all appeals. On May 20, 2009, the ITC issued a limited exclusion order and a cease and desist order, both of which were terminated when the patents expired on September 24, 2010. During the period of the exclusion order, we shifted supply of accused chips for customers who manufacture products that may be imported to the United States to a licensed supplier of Tessera, and we continued to supply those customers without interruption. The ITC’s orders were affirmed on appeal, and on November 28, 2011, the United States Supreme Court denied our petition for review. On January 18, 2012, pursuant to the parties’ stipulation, the District Court in the Eastern District of Texas lifted the stay and ordered that the case be moved to the United States District Court for the Northern District of California. On March 1, 2012, that court consolidated the case with an earlier-filed lawsuit filed by Tessera against multiple parties, including some of our semiconductor chip package suppliers. The court has set April 24, 2014 as the hearing date for claims construction and any summary judgment motions that may be filed. Trial is scheduled for August 25, 2014. Tessera may continue to seek alleged past damages in the district court, but it cannot obtain injunctive relief due to the expiration of the patents.
MOSAID Technologies Incorporated v. Dell, Inc. et al.
: On March 16, 2011, MOSAID filed a complaint against Atheros Communications, Inc. (Atheros Communications), which we acquired in May 2011 and renamed Qualcomm Atheros, Inc. (Qualcomm Atheros), and 32 other entities in the United States District Court for the Eastern District of Texas alleging that certain Wi-Fi products infringed six MOSAID patents and seeking damages for the relevant statutory period prior to May 2011. On July 17, 2013, we entered into an agreement with MOSAID pursuant to which MOSAID agreed to dismiss with prejudice all claims against us, licensed to us certain MOSAID patents and provided other considerations, and we paid to MOSAID an amount that was not material to our financial statements. The court dismissed the claims against us with prejudice on August 2, 2013.
ParkerVision, Inc. v. QUALCOMM Incorporated
: On July 20, 2011, ParkerVision filed a complaint against us in the United States District Court for the Middle District of Florida alleging that certain of our products infringe seven of its patents alleged to cover direct down-conversion receivers. ParkerVision’s complaint sought damages and injunctive and other relief. On February 28, 2012, ParkerVision filed an amended complaint dropping two patents from the case and adding one new patent. On January 22, 2013, the court granted in part ParkerVision’s motion to dismiss our counterclaim for inequitable conduct, and we subsequently withdrew the remainder of our inequitable conduct counterclaim. On February 20, 2013, the court issued its claim construction order. We filed our amended answer and counterclaims on April 11, 2013. Subsequently, ParkerVision narrowed its allegations to assert only four patents. The trial began on October 7, 2013. On October 17, 2013, the jury returned a verdict finding all asserted claims of the four at-issue patents to be infringed and finding that none of the asserted claims are invalid. On October 24, 2013, the jury returned a separate verdict assessing total past damages of approximately $173 million and finding that our infringement was not willful. We recorded a $173 million charge in other expenses in fiscal 2013 as a result of this verdict. The court will set a schedule for post-verdict proceedings, including the parties’ respective motions for judgment as a matter of law and ParkerVision’s request for ongoing equitable relief. We intend to appeal.
Icera Complaint to the European Commission
: On June 7, 2010, the European Commission (the Commission) notified and provided us with a redacted copy of a complaint filed with the Commission by Icera, Inc. alleging that we have engaged in anticompetitive activity. We were asked by the Commission to submit a preliminary response to the portions of the complaint disclosed to us, and we submitted our response in July 2010. On October 19, 2011, the Commission notified us that we should provide to the Commission additional documents and information. On January 16, 2012, we provided additional documents and information in response to that request. On July 10, 2013, the Commission ordered us to provide additional documents and information. We continue to cooperate fully with the Commission’s preliminary investigation.
Korea Fair Trade Commission (KFTC) Complaint
: On January 4, 2010, the KFTC issued a written decision finding that we had violated South Korean law by offering certain discounts and rebates for purchases of our CDMA chips and for including in certain agreements language requiring the continued payment of royalties after all licensed patents have expired. The KFTC levied a fine, which we paid in the second quarter of fiscal 2010. We appealed to the Seoul High Court, and on June 19, 2013, the Seoul High Court affirmed the KFTC’s decision. On July 4, 2013, we filed an appeal with the Korea Supreme Court.
Japan Fair Trade Commission (JFTC) Complaint
: The JFTC received unspecified complaints alleging that our business practices are, in some way, a violation of Japanese law. On September 29, 2009, the JFTC issued a cease and desist order concluding that our Japanese licensees were forced to cross-license patents to us on a royalty-free basis and were forced to accept a provision under which they agreed not to assert their essential patents against our other licensees who made a
24
similar commitment in their license agreements with us. The cease and desist order seeks to require us to modify our existing license agreements with Japanese companies to eliminate these provisions while preserving the license of our patents to those companies. We disagree with the conclusions that we forced our Japanese licensees to agree to any provision in the parties’ agreements and that those provisions violate the Japanese Antimonopoly Act. We have invoked our right under Japanese law to an administrative hearing before the JFTC. In February 2010, the Tokyo High Court granted our motion and issued a stay of the cease and desist order pending the administrative hearing before the JFTC. The JFTC has held hearings on 19 different dates, with another hearing scheduled for January 22, 2014 and additional hearing dates yet to be scheduled.
Securities and Exchange Commission (SEC) Formal Order of Private Investigation and Department of Justice Investigation
: On September 8, 2010, we were notified by the SEC’s Los Angeles Regional office of a formal order of private investigation. We understand that the investigation arose from a “whistleblower’s” allegations made in December 2009 to the audit committee of our Board of Directors and to the SEC. In 2010, the audit committee completed an internal review of the allegations with the assistance of independent counsel and independent forensic accountants. This internal review into the whistleblower’s allegations and related accounting practices did not identify any errors in our financial statements. On January 27, 2012, we learned that the U.S. Attorney’s Office for the Southern District of California/Department of Justice (collectively, DOJ) had begun an investigation regarding our compliance with the Foreign Corrupt Practices Act (FCPA). FCPA compliance is also a focus of the SEC investigation. The audit committee continues to conduct an internal review into our compliance with the FCPA with the assistance of independent counsel and independent forensic accountants.
As previously disclosed, we have discovered, and as a part of our ongoing cooperation with these investigations have informed the SEC and the DOJ of, instances in which special hiring consideration, gifts or other benefits (collectively, benefits) were provided to several individuals associated with Chinese state-owned companies or agencies. Based on the facts currently known, we believe the aggregate monetary value of the benefits in question to be less than $250,000, excluding employment compensation. We are continuing to cooperate with the SEC and the DOJ, but are unable to predict the outcome of their investigations.
We will continue to vigorously defend ourselves in the foregoing matters. However, litigation and investigations are inherently uncertain. Accordingly, we cannot predict the outcome of these matters. Other than the amount recorded for the ParkerVision verdict, we have not recorded any accrual at
September 29, 2013
for contingent losses associated with these matters based on our belief that losses, while possible, are not probable. Further, any possible range of loss cannot be reasonably estimated at this time. Nonetheless, the unfavorable resolution of one or more of these matters could have a material adverse effect on our business, results of operations, financial condition or cash flows. We are engaged in numerous other legal actions not described above arising in the ordinary course of our business and, while there can be no assurance, we believe the ultimate outcome of these other legal actions will not have a material adverse effect on our business, results of operations, financial condition or cash flows.
Not applicable.
25
Market Information
Our common stock is traded on the NASDAQ Global Select Market under the symbol “QCOM.” The following table sets forth the range of high and low sales prices of our common stock for the fiscal periods indicated, as reported by NASDAQ. Such quotations represent inter-dealer prices without retail markup, markdown or commission and may not necessarily represent actual transactions.
|
High ($)
|
Low ($)
|
||
|
2012
|
|
|
|
|
First quarter
|
57.97
|
46.40
|
|
|
Second quarter
|
67.00
|
54.01
|
|
|
Third quarter
|
68.87
|
54.85
|
|
|
Fourth quarter
|
64.45
|
53.09
|
|
|
2013
|
|
|
|
|
First quarter
|
64.72
|
57.29
|
|
|
Second quarter
|
68.50
|
60.22
|
|
|
Third quarter
|
67.66
|
59.46
|
|
|
Fourth quarter
|
70.37
|
59.02
|
|
At
November 4, 2013
, there were 8,067 holders of record of our common stock. On
November 4, 2013
, the last sale price reported on the NASDAQ Global Select Market for our common stock was $69.57 per share.
Dividends
On March 6, 2012, we announced an increase in our quarterly dividend from $0.215 to $0.25 per share of common stock. On March 5, 2013, we announced an increase in our quarterly dividend from $0.25 to $0.35 per share of common stock. Cash dividends paid on outstanding common stock announced in fiscal
2012
and
2013
were as follows (in millions, except per share data):
|
Per Share
|
Total
|
Cumulative
by Fiscal Year
|
|||||||||
|
2012
|
|
|
|
||||||||
|
First quarter
|
$
|
0.215
|
|
$
|
362
|
|
$
|
362
|
|
||
|
Second quarter
|
0.215
|
|
366
|
|
728
|
|
|||||
|
Third quarter
|
0.250
|
|
429
|
|
1,157
|
|
|||||
|
Fourth quarter
|
0.250
|
|
426
|
|
1,583
|
|
|||||
|
|
$
|
0.930
|
|
$
|
1,583
|
|
|
||||
|
2013
|
|
|
|
||||||||
|
First quarter
|
$
|
0.250
|
|
$
|
428
|
|
$
|
428
|
|
||
|
Second quarter
|
0.250
|
|
431
|
|
859
|
|
|||||
|
Third quarter
|
0.350
|
|
604
|
|
1,463
|
|
|||||
|
Fourth quarter
|
0.350
|
|
592
|
|
2,055
|
|
|||||
|
|
$
|
1.200
|
|
$
|
2,055
|
|
|
||||
On
October 24, 2013
, we announced a cash dividend of
$0.35
per share of common stock, payable on
December 19, 2013
to stockholders of record as of
December 2, 2013
. We intend to continue to pay quarterly dividends subject to capital availability and our view that cash dividends are in the best interests of our stockholders. Future dividends may be affected by, among other items, our views on potential future capital requirements, including those relating to research and development, creation and expansion of sales distribution channels and investments and acquisitions, legal risks, stock repurchase programs, debt issuance, changes in federal and state income tax law and changes to our business model.
26
Share-Based Compensation
We primarily issue restricted stock units under our equity compensation plans, which are part of a broad-based, long-term retention program that is intended to attract and retain talented employees and directors and align stockholder and employee interests.
Our 2006 Long-Term Incentive Plan (2006 Plan) provides for the grant of both incentive and non-qualified stock options, restricted stock units, stock appreciation rights, restricted stock, performance units and shares and other stock-based awards. Restricted stock units generally vest over periods of three years from the date of grant. Stock options are granted at a price not less than the fair market value of the stock on the date of grant. Stock options vest over periods not exceeding five years and are exercisable for up to 10 years from the grant date. The Board of Directors may terminate the 2006 Plan at any time.
Additional information regarding our share-based compensation plans and plan activity for fiscal
2013
,
2012
and
2011
is provided in the notes to our consolidated financial statements in this Annual Report in “Notes to Consolidated Financial Statements, Note 6. Employee Benefit Plans” and in our
2014
Proxy Statement under the heading “Equity Compensation Plan Information.”
Issuer Purchases of Equity Securities
Issuer purchases of equity securities during the fourth quarter of fiscal
2013
were:
|
Total Number of
Shares Purchased
|
Average Price Paid Per Share (1)
|
Total Number of Shares Purchased as Part of Publicly Announced Plans or Programs (2)
|
Approximate Dollar Value of Shares that May Yet Be
Purchased Under the Plans or Programs (2)
|
||||||||||
|
(In thousands)
|
(In thousands)
|
(In millions)
|
|||||||||||
|
July 1, 2013, to July 28, 2013
|
8,655
|
|
$
|
60.92
|
|
8,655
|
|
$
|
3,435
|
|
|||
|
July 29, 2013 to August 25, 2013
|
22,572
|
|
65.64
|
|
22,572
|
|
1,954
|
|
|||||
|
August 26, 2013 to September 29, 2013
|
19,460
|
|
67.45
|
|
19,460
|
|
4,850
|
|
|||||
|
Total
|
50,687
|
|
65.53
|
|
50,687
|
|
$
|
4,850
|
|
||||
|
(1)
|
Average Price Paid Per Share excludes cash paid for commissions.
|
|
(2)
|
On September 11, 2013, we announced a new repurchase program authorizing us to repurchase up to $5.0 billion of our common stock. The stock repurchase program has no expiration date. This stock repurchase program replaced the previous $5.0 billion stock repurchase program announced on March 5, 2013. At
September 29, 2013
, $4.9 billion remained available for repurchase.
|
Performance Measurement Comparison of Stockholder Return
The following graph compares total stockholder return on our common stock since September 28, 2008 to two indices: the Standard & Poor’s 500 Stock Index (S&P 500) and the NASDAQ-100 Index (NASDAQ-100). The S&P 500 tracks the aggregate price performance of the equity securities of 500 United States companies selected by Standard & Poor’s Index Committee to include companies in leading industries and to reflect the United States stock market. The NASDAQ-100 tracks the aggregate price performance of the 100 largest domestic and international non-financial securities listed on the NASDAQ Stock Market based on market capitalization.
The total return for our stock and for each index assumes the reinvestment of gross dividends and is based on the returns of the component companies. We began paying dividends on our common stock on March 31, 2003. Our common stock is traded on the NASDAQ Global Select Market and is a component of each of the S&P 500 and the NASDAQ-100.
27
Comparison of Cumulative Total Return on Investment Since
September 28, 2008
(1)
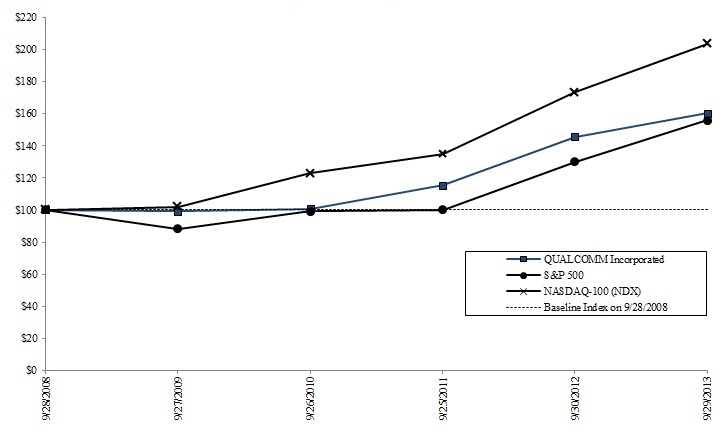
|
(1)
|
Shows the cumulative total return on investment assuming an investment of $100 (including reinvestment of dividends) in our common stock, the S&P 500 and the NASDAQ-100 on September 28, 2008. All returns are reported as of our fiscal year end, which is the last Sunday in September.
|
Our closing stock price on September 27, 2013, the last trading day of our
2013
fiscal year, was $67.38 per share.
28
The following data should be read in conjunction with the annual consolidated financial statements, related notes and other financial information appearing elsewhere herein.
|
|
Years Ended (1)
|
||||||||||||||||||
|
September 29, 2013
|
September 30, 2012
|
September 25, 2011
|
September 26, 2010
|
September 27, 2009
|
|||||||||||||||
|
|
(In millions, except per share data)
|
||||||||||||||||||
|
Statement of Operations Data:
|
|
|
|
|
|
||||||||||||||
|
Revenues
|
$
|
24,866
|
|
$
|
19,121
|
|
$
|
14,957
|
|
$
|
10,982
|
|
$
|
10,387
|
|
||||
|
Operating income
|
7,230
|
|
5,682
|
|
5,026
|
|
3,727
|
|
2,542
|
|
|||||||||
|
Income from continuing operations
|
6,845
|
|
5,283
|
|
4,555
|
|
3,520
|
|
1,792
|
|
|||||||||
|
Discontinued operations, net of income taxes
|
—
|
|
776
|
|
(313
|
)
|
(273
|
)
|
(200
|
)
|
|||||||||
|
Net income attributable to Qualcomm
|
6,853
|
|
6,109
|
|
4,260
|
|
3,247
|
|
1,592
|
|
|||||||||
|
Per Share Data:
|
|
|
|
|
|
||||||||||||||
|
Basic earnings (loss) per share attributable to Qualcomm:
|
|||||||||||||||||||
|
Continuing operations
|
$
|
3.99
|
|
$
|
3.14
|
|
$
|
2.76
|
|
$
|
2.15
|
|
$
|
1.08
|
|
||||
|
Discontinued operations
|
—
|
|
0.45
|
|
(0.19
|
)
|
(0.17
|
)
|
(0.12
|
)
|
|||||||||
|
Net income
|
3.99
|
|
3.59
|
|
2.57
|
|
1.98
|
|
0.96
|
|
|||||||||
|
Diluted earnings (loss) per share attributable to Qualcomm:
|
|||||||||||||||||||
|
Continuing operations
|
3.91
|
|
3.06
|
|
2.70
|
|
2.12
|
|
1.07
|
|
|||||||||
|
Discontinued operations
|
—
|
|
0.45
|
|
(0.18
|
)
|
(0.16
|
)
|
(0.12
|
)
|
|||||||||
|
Net income
|
3.91
|
|
3.51
|
|
2.52
|
|
1.96
|
|
0.95
|
|
|||||||||
|
Dividends per share announced
|
1.20
|
|
0.93
|
|
0.81
|
|
0.72
|
|
0.66
|
|
|||||||||
|
Balance Sheet Data:
|
|
|
|
|
|
||||||||||||||
|
Cash, cash equivalents and marketable securities
|
$
|
29,406
|
|
$
|
26,837
|
|
$
|
20,913
|
|
$
|
18,402
|
|
$
|
17,742
|
|
||||
|
Total assets
|
45,516
|
|
43,012
|
|
36,422
|
|
30,572
|
|
27,445
|
|
|||||||||
|
Loans and debentures (2)
|
—
|
|
1,064
|
|
994
|
|
1,086
|
|
—
|
|
|||||||||
|
Capital lease obligations
|
17
|
|
60
|
|
170
|
|
221
|
|
187
|
|
|||||||||
|
Other long-term liabilities (3)
|
533
|
|
366
|
|
450
|
|
540
|
|
665
|
|
|||||||||
|
Total stockholders’ equity
|
36,087
|
|
33,545
|
|
26,972
|
|
20,858
|
|
20,316
|
|
|||||||||
|
(1)
|
Our fiscal year ends on the last Sunday in September. The fiscal years ended September 29, 2013, September 25, 2011, September 26, 2010 and September 27, 2009 each included 52 weeks. The fiscal year ended September 30, 2012 included 53 weeks.
|
|
(2)
|
Loans and debentures were included in liabilities held for sale in the consolidated balance sheet as of September 30, 2012.
|
|
(3)
|
Other long-term liabilities in this balance sheet data exclude capital lease obligations and unearned revenues. Capital lease obligations are included in other liabilities in the consolidated balance sheets.
|
29
In addition to historical information, the following discussion contains forward-looking statements that are subject to risks and uncertainties. Actual results may differ materially from those referred to herein due to a number of factors, including but not limited to risks described in the section entitled Risk Factors and elsewhere in this Annual Report.
Overview
Recent Developments
Revenues for fiscal
2013
were
$24.9 billion
, with net income attributable to Qualcomm of
$6.9 billion
, which primarily resulted from the following key items:
|
•
|
We shipped approximately 716 million Mobile Station Modem (MSM) integrated circuits for CDMA- and OFDMA-based wireless devices, an increase of 21%, compared to approximately 590 million MSM integrated circuits in fiscal
2012
.
|
|
•
|
Total reported device sales were approximately $231.2 billion, an increase of approximately 23%, compared to approximately $187.3 billion in fiscal
2012
.
(1)
|
Against this backdrop, the following recent developments occurred during fiscal
2013
with respect to key elements of our business or our industry:
|
•
|
Worldwide cellular connections grew by approximately 6% to reach approximately 6.8 billion.
(2)
|
|
•
|
Worldwide 3G connections (all CDMA-based) grew by approximately 18% to approximately 2.2 billion, which was approximately 32% of total cellular subscriptions, including approximately 0.5 billion CDMA2000 1X/1xEV-DO subscriptions and approximately 1.7 billion WCDMA/HSPA/TD-SCDMA subscriptions.
(2)
|
|
(1)
|
Total reported device sales is the sum of all reported sales in U.S. dollars (as reported to us by our licensees) of all licensed CDMA-based, OFDMA-based and CDMA/OFDMA multimode subscriber devices (including handsets, modules, modem cards and other subscriber devices) by our licensees during a particular period (collectively, 3G/4G devices). Not all licensees report sales the same way (e.g., some licensees report sales net of permitted deductions, including transportation, insurance, packing costs and other items, while other licensees report sales and then identify the amount of permitted deductions in their reports), and the way in which licensees report such information may change from time to time. Total reported device sales for a particular period may include prior period activity that was not reported by the licensee until such particular period.
|
|
(2)
|
According to GSMA Intelligence estimates as of November 4, 2013, for the quarter ended September 30, 2013 (estimates excluded Wireless Local Loop).
|
Our Business and Operating Segments
We design, manufacture, have manufactured on our behalf and market digital communications products and services based on CDMA, OFDMA and other technologies. We derive revenues principally from sales of integrated circuit products, fixed license fees (payable in one or more installments) and ongoing royalties for use of our intellectual property, and fees for messaging and other services and related hardware sales, software development and licensing, and related services and software hosting services. Costs and expenses primarily consist of cost of equipment and services revenues and research and development and selling, general and administrative expenses.
We conduct business primarily through four reportable segments: QCT, QTL, QWI and QSI. Our reportable segments are operated by QUALCOMM Incorporated and its direct and indirect subsidiaries. At the beginning of fiscal 2013, we completed a corporate reorganization in which certain assets of QUALCOMM Incorporated, as well as the stock of certain of its direct and indirect subsidiaries, were contributed to its wholly-owned subsidiary Qualcomm Technologies, Inc. (QTI). QTL continues to be operated by QUALCOMM Incorporated, which continues to own the vast majority of our patent portfolio. Substantially all of our products and services businesses, including QCT, and substantially all of our engineering, research and development functions, are operated by QTI and its subsidiaries. Neither QTI nor any of its subsidiaries has any right, power or authority to grant any licenses or other rights under or to any patents owned by QUALCOMM Incorporated.
QCT (Qualcomm CDMA Technologies) is a leading developer and supplier of integrated circuits and system software based on CDMA, OFDMA and other technologies for use in voice and data communications, networking, application processing, multimedia and global positioning system products. QCT’s integrated circuit products and system software are sold to or licensed to manufacturers that use our products in wireless devices, particularly mobile phones, tablets, laptops, data modules, handheld wireless computers and gaming devices, access points and routers, data cards and infrastructure equipment, and in wired devices, particularly broadband gateway equipment, desktop computers, televisions, set-top boxes and Blu-ray players. The MSM integrated circuits, which include the Mobile Data Modem, Qualcomm Single Chip and Qualcomm
30
Snapdragon processor devices, perform the core baseband modem functionality in wireless devices providing voice and data communications, as well as multimedia applications and global positioning functions. In addition, our Snapdragon processors provide advanced application and graphics processing capabilities. QCT’s system software enables the other device components to interface with the integrated circuit products and is the foundation software enabling manufacturers to develop devices utilizing the functionality within the integrated circuits. QCT revenues comprised 67%, 63% and 59% of total consolidated revenues in fiscal
2013
,
2012
and
2011
, respectively.
QCT utilizes a fabless production business model, which means that we do not own or operate foundries for the production of silicon wafers from which our integrated circuits are made. Integrated circuits are die cut from silicon wafers that have been assembled into packages or modules and have completed the final test manufacturing processes. We rely on independent third-party suppliers to perform the manufacturing and assembly, and most of the testing, of our integrated circuits based primarily on our proprietary designs and test programs. Our suppliers are also responsible for the procurement of most of the raw materials used in the production of our integrated circuits. We employ both turnkey and two-stage manufacturing models to purchase our integrated circuits. Turnkey is when our foundry suppliers are responsible for delivering fully assembled and tested integrated circuits. Under the two-stage manufacturing model, we purchase wafers and die from semiconductor manufacturing foundries and contract with separate third-party suppliers for probe, assembly and test services.
QTL (Qualcomm Technology Licensing) grants licenses or otherwise provides rights to use portions of our intellectual property portfolio, which, among other rights, includes certain patent rights essential to and/or useful in the manufacture and sale of certain wireless products, including, without limitation, products implementing CDMA2000, WCDMA, CDMA TDD (including TD-SCDMA), GSM/GPRS/EDGE and/or OFDMA standards and their derivatives. QTL licensing revenues are comprised of license fees as well as royalties based on sales by licensees of products incorporating or using our intellectual property. License fees are fixed amounts paid in one or more installments. Royalties are generally based upon a percentage of the wholesale (i.e., licensee’s) selling price of complete licensed products, net of certain permissible deductions (e.g., certain shipping costs, packing costs, VAT, etc.). QTL recognizes royalty revenues based on royalties reported by licensees during the quarter and when other revenue recognition criteria are met. Licensees, however, do not report and pay royalties owed for sales in any given quarter until after the conclusion of that quarter. QTL revenues comprised 30%, 33% and 36% of total consolidated revenues in fiscal
2013
,
2012
and
2011
, respectively. The vast majority of such revenues were generated through our licensees’ sales of CDMA2000- and WCDMA-based products, such as feature phones and smartphones.
QWI (Qualcomm Wireless & Internet), which includes our Omnitracs, QIS, QGOV and QRS divisions, generates revenues primarily through sales of products, services (including software development) and software aimed at the support and delivery of wireless applications. Omnitracs sells integrated wireless systems and services to transportation and logistics companies to manage their assets and workforce. On August 21, 2013, we entered into a definitive agreement under which we agreed to sell the North and Latin American operations of Omnitracs to a U.S.-based private equity firm for $800 million in cash, subject to the terms and conditions of the definitive agreement. The transaction is subject to customary closing conditions, including receipt of regulatory approvals, and is expected to close in the first quarter of fiscal 2014.
We expect to record the gain on sale, net of income taxes, as a discontinued operation upon close. However, the revenues and operating results were not presented as a discontinued operation in any fiscal period because they were immaterial. QIS (Qualcomm Internet Services) provides content enablement services for the wireless industry, including its Brew, Plaza and other products and services. QIS also provides QChat push-to-talk and other software products and services for wireless operators. QGOV (Qualcomm Government Technologies) provides development and other services and related products involving wireless communications technologies to government agencies and their contractors. QRS (Qualcomm Retail Solutions) builds and manages software applications that enable certain mobile location-awareness and commerce services. QWI revenues comprised 2%, 3% and 4% of total consolidated revenues in fiscal
2013
,
2012
and
2011
, respectively.
QSI (Qualcomm Strategic Initiatives) makes strategic investments that we believe may open new or expand opportunities for our technologies, support the design and introduction of new products and services for voice and data communications or possess unique capabilities or technology. Many of these strategic investments are in early-stage companies. QSI also holds wireless spectrum. As part of our strategic investment activities, we intend to pursue various exit strategies from each of our QSI investments at some point in the future. During the third quarter of fiscal 2013, we deconsolidated subsidiaries that were established to operate a wireless network in India using broadband wireless access spectrum (the BWA subsidiaries) due to events that resulted in a change in control of these subsidiaries. The former BWA subsidiaries were merged into one entity on August 5, 2013, and on October 17, 2013, all of our interest in the remaining former subsidiary was sold.
Nonreportable segments are comprised of our QMT (Qualcomm MEMS Technologies) division and other display, wireless technology and service initiatives that include, but are not limited to: low power consumption, high optical performance flat display modules; medical device connectivity and related data management; augmented reality; and device-to-device communication. QMT continues to develop an interferometric modulator (IMOD) display technology based on micro-electro-mechanical-systems (MEMS) structure combined with thin film optics.
31
Discontinued Operations
On March 27, 2011, the FLO TV business and network were shut down. On December 27, 2011, we completed the sale of substantially all of our 700 MHz spectrum for $1.9 billion, and as a result, we recognized a gain in discontinued operations of $1.2 billion during fiscal 2012. The results of the discontinued FLO TV operations were as follows (in millions):
|
Year Ended
|
|||||||
|
September 30, 2012
|
September 25, 2011
|
||||||
|
Revenues
|
$
|
—
|
|
$
|
5
|
|
|
|
Income (loss) from discontinued operations
|
$
|
1,203
|
|
$
|
(507
|
)
|
|
|
Income tax (expense) benefit
|
(427
|
)
|
194
|
|
|||
|
Discontinued operations, net of income taxes
|
$
|
776
|
|
$
|
(313
|
)
|
|
Looking Forward
The deployment of 3G networks has enabled increased voice capacity and higher data rates than prior generation networks, thereby supporting more minutes of use and a wide range of mobile broadband data applications for handsets, 3G connected computing devices and other consumer electronics. According to the Global mobile Suppliers Association (GSA), as of October 2013, to complement their existing 3G networks, more than 220 wireless operators have deployed and more than 420 wireless operators are planning to deploy OFDMA-based technology, often called 4G, in new wireless spectrum to gain additional capacity for data services. As a result, we expect continued growth in the coming years in consumer demand for 3G and 3G/4G multimode products and services around the world.
As we look forward to the next several months, the following items are likely to have an impact on our business:
|
•
|
The worldwide transition from 2G to 3G and 3G/4G networks is expected to continue, including the further expansion of 3G in emerging regions, such as China. We expect that the growth of low-tier smartphone products will contribute to such expansion.
|
|
•
|
We expect consumer demand for advanced 3G and 3G/4G multimode devices, including smartphones and data-centric devices, to continue at a strong pace.
|
|
•
|
We expect that CDMA-based device prices will continue to vary broadly due to the increased penetration of smartphones combined with active competition throughout the world at all price tiers. Additionally, varying rates of economic growth by region and stronger growth of CDMA-based device shipments in emerging regions, as compared to developed regions, are expected to continue to impact the average and range of selling prices of CDMA-based devices.
|
|
•
|
We continue to invest significant resources toward advancements to 3G, 3G/4G and 4G LTE (an OFDMA-based standard) technologies, audio and video codecs, wireless baseband chips, our converged computing/communications (Snapdragon) chips, multimedia products, software and services. We are also investing across a broad spectrum of opportunities that leverage our existing technical and business expertise to deploy new business models and enter into new industry segments, such as our IMOD and other display technologies; 3G/LTE and Wi-Fi products designed for implementation of small cells and the 1000x data challenge; wireless charging; proximity-based communications; very high speed connectivity; mobile location awareness and commerce; mobile health; wearable technology; gaming; and products for the connected home, the digital 6th sense and the Internet of Everything.
|
In addition to the foregoing business and market-based matters, we continue to devote resources to working with and educating participants in the wireless value chain as to the benefits of our business model in promoting a highly competitive and innovative wireless industry. However, we expect that certain companies may continue to be dissatisfied with the need to pay reasonable royalties for the use of our technology and not welcome the success of our business model in enabling new, highly cost-effective competitors to their products. We expect that such companies will continue to challenge our business model in various forums throughout the world.
Further discussion of risks related to our business is presented in the Risk Factors included in this Annual Report.
Critical Accounting Estimates
Our discussion and analysis of our results of operations and liquidity and capital resources are based on our consolidated financial statements, which have been prepared in accordance with accounting principles generally accepted in the United States. The preparation of these financial statements requires us to make estimates and judgments that affect the reported amounts of assets, liabilities, revenues and expenses, and disclosure of contingent assets and liabilities. On an ongoing basis,
32
we evaluate our estimates and judgments, including those related to revenue recognition, valuation of intangible assets and investments, income taxes and litigation. We base our estimates on historical and anticipated results and trends and on various other assumptions that we believe are reasonable under the circumstances, including assumptions as to future events. These estimates form the basis for making judgments about the carrying values of assets and liabilities that are not readily apparent from other sources. By their nature, estimates are subject to an inherent degree of uncertainty. Although we believe that our estimates and the assumptions supporting our assessments are reasonable, actual results that differ from our estimates could have a significant adverse effect on our operating results and financial position. We believe that the following significant accounting estimates may involve a higher degree of judgment and complexity than others.
Revenue Recognition.
We derive revenue principally from sales of integrated circuit products and licensing of our intellectual property. The timing of revenue recognition and the amount of revenue actually recognized in each case depends upon a variety of factors, including the specific terms of each arrangement and the nature of our deliverables and obligations.
We license or otherwise provide rights to use portions of our intellectual property portfolio, which includes certain patent rights essential to and/or useful in the manufacture and sale of certain wireless products. Licensing revenues include license fees (payable in one or more installments) and ongoing royalties based on licensees’ sales of products incorporating or using our licensed intellectual property. License fees are recognized over the estimated period of benefit of the license to the licensee, typically
5 to 15 years
. From time to time, licensees will not report royalties timely due to legal disputes or other reasons, and when this occurs, the timing and comparability of royalty revenues could be affected.
Valuation of Intangible Assets and Investments.
Our business acquisitions typically result in the recording of goodwill and other intangible assets, and the recorded values of those assets may become impaired in the future. We also acquire intangible assets in other types of transactions. At
September 29, 2013
, our goodwill and other intangible assets, net of accumulated amortization, were
$4.0 billion
and
$2.6 billion
, respectively. The determination of the value of such intangible assets requires management to make estimates and assumptions that affect our consolidated financial statements. For intangible assets purchased in a business combination, the estimated fair values of the assets received are used to establish their recorded values. For intangible assets acquired in a non-monetary exchange, the estimated fair values of the assets transferred (or the estimated fair values of the assets received, if more clearly evident) are used to establish their recorded values, unless the values of neither the assets received nor the assets transferred are determinable within reasonable limits, in which case the assets received are measured based on the carrying values of the assets transferred. Valuation techniques consistent with the market approach, income approach and/or cost approach are used to measure fair value. An estimate of fair value can be affected by many assumptions that require significant judgment. For example, the income approach generally requires assumptions related to the appropriate business model to be used to estimate cash flows, total addressable market, pricing and share forecasts, competition, technology obsolescence, future tax rates and discount rates. Our estimate of the fair value of certain assets may differ materially from that determined by others who use different assumptions or utilize different business models. New information may arise in the future that affects our fair value estimates and could result in adjustments to our estimates in the future, which could have an adverse impact on our results of operations.
Goodwill and other indefinite-lived intangible assets are tested annually for impairment and in interim periods if certain events occur indicating that the carrying amounts may be impaired. Long-lived assets, such as property and equipment and intangible assets subject to amortization, are reviewed for impairment when there is evidence that events or changes in circumstances indicate that the carrying amount of an asset or asset group may not be recoverable. Our judgments regarding the existence of impairment indicators and future cash flows related to goodwill and other intangible assets are based on operational performance of our businesses, market conditions and other factors. Although there are inherent uncertainties in this assessment process, the estimates and assumptions we use, including estimates of future cash flows, volumes, market penetration and discount rates, are consistent with our internal planning. If these estimates or their related assumptions change in the future, we may be required to record an impairment charge on a portion or all of our goodwill and other intangible assets. Furthermore, we cannot predict the occurrence of future impairment-triggering events nor the impact such events might have on our reported asset values. Future events could cause us to conclude that impairment indicators exist and that goodwill or other intangible assets associated with our acquired businesses are impaired. Any resulting impairment loss could have an adverse impact on our financial position and results of operations. During fiscal 2013 and 2012, we recorded
$158 million
and
$54 million
, respectively, in impairment charges resulting from revisions to our estimates of expected cash flows for certain long-lived assets of our QMT division as we continue to pursue our licensing model.
We hold investments in marketable securities, including U.S. treasury and government-related securities, corporate bonds and notes, mortgage- and asset-backed securities, auction rate securities, common and preferred stock and equity and debt funds. The fair value of these investments totaled
$23.3 billion
at
September 29, 2013
, with increases and decreases in fair value generally recorded through stockholders’ equity as other comprehensive income or loss. We record impairment charges through the statement of operations when we believe an investment has experienced a decline that is other than temporary. The determination that a decline is other than temporary is subjective and influenced by many factors. In addition, the fair values of our strategic investments may be subject to substantial quarterly and annual fluctuations and to significant market volatility.
33
Adverse changes in market conditions or poor operating results of investees could result in losses or an inability to recover the carrying value of the investments, thereby requiring impairment charges. When assessing these investments for an other-than-temporary decline in value, we consider such factors as, among other things, how significant the decline in value is as a percentage of the original cost; how long the market value of the investment has been below its original cost; the extent of the general decline in prices or an increase in the default or recovery rates of securities in an asset class; negative events such as a bankruptcy filing or a need to raise capital or seek financial support from the government or others; the performance and pricing of the investee’s securities in relation to the securities of its competitors within the industry and the market in general; and analyst recommendations, as applicable. We also review the financial statements of the investee to determine if the investee is experiencing financial difficulties. If we determine that a security price decline is other than temporary, we record an impairment loss, which could have an adverse impact on our results of operations. During fiscal
2013
,
2012
and
2011
, we recorded
$72 million
, $71 million and $39 million, respectively, in net impairment losses on our investments in marketable securities.
Income Taxes.
Our income tax returns are based on calculations and assumptions that are subject to examination by the Internal Revenue Service (IRS) and other tax authorities. In addition, the calculation of our tax liabilities involves uncertainties in the application of complex tax regulations. We recognize liabilities for uncertain tax positions based on a two-step process. The first step is to evaluate the tax position for recognition by determining if the weight of available evidence indicates that it is more likely than not that the position will be sustained on audit, including resolution of related appeals or litigation processes, if any. The second step is to measure the tax benefit as the largest amount that is more than 50% likely of being realized upon settlement. While we believe we have appropriate support for the positions taken on our tax returns, we regularly assess the potential outcomes of these examinations and any future examinations for the current or prior years in determining the adequacy of our provision for income taxes. We continually assess the likelihood and amount of potential adjustments and adjust the income tax provision, income taxes payable and deferred taxes in the period in which the facts that give rise to a revision become known. We are participating in the IRS Compliance Assurance Process program whereby we endeavor to agree with the IRS on the treatment of all issues prior to filing our federal return. A benefit of participation in this program is that post-filing adjustments by the IRS are less likely to occur.
We regularly review our deferred tax assets for recoverability and establish a valuation allowance based on historical taxable income, projected future taxable income, the expected timing of the reversals of existing temporary differences and the implementation of tax-planning strategies. At
September 29, 2013
, net deferred tax assets were
$1.6 billion
, which included a valuation allowance of
$51 million
. If we are unable to generate sufficient future taxable income in certain tax jurisdictions, or if there is a material change in the time period within which the underlying temporary differences become taxable or deductible, we could be required to increase the valuation allowance against our deferred tax assets, which could result in an increase in our effective tax rate and an adverse impact on operating results.
We can only use net operating losses to offset taxable income of certain legal entities in certain tax jurisdictions. At
September 29, 2013
, we had unused federal, state and foreign net operating losses of
$131 million
,
$604 million
and
$75 million
, respectively. Based upon our assessments of projected future taxable income and losses and historical losses incurred by these entities, we expect that the future taxable income of the entities in these tax jurisdictions will not be sufficient to utilize the net operating losses we have incurred through fiscal
2013
. Therefore, we have provided a $32 million valuation allowance for these net operating losses. Significant judgment is required to forecast the timing and amount of future taxable income in certain jurisdictions. Adjustments to our valuation allowance based on changes to our forecast of taxable income are reflected in the period the change is made.
Our QCT segment’s non-United States headquarters is located in Singapore. We obtained tax incentives in Singapore, including a tax exemption for the first five years, provided that we meet specified employment and incentive criteria, and as a result of expiration of these incentives, our Singapore tax rate will increase in fiscal 2017 and again in fiscal 2027.
We consider the operating earnings of certain non-United States subsidiaries to be indefinitely invested outside the United States based on estimates that future domestic cash generation will be sufficient to meet future domestic cash needs. We have not recorded a deferred tax liability of approximately
$7.6 billion
related to the United States federal and state income taxes and foreign withholding taxes on approximately
$21.6 billion
of undistributed earnings of foreign subsidiaries indefinitely invested outside the United States. Should we decide to repatriate the foreign earnings, we would have to adjust the income tax provision in the period we determined that the earnings will no longer be indefinitely invested outside the United States.
Litigation.
We are currently involved in certain legal proceedings, and we intend to continue to vigorously defend ourselves. However, the unfavorable resolution of one or more of these proceedings could have a material adverse effect on our business, results of operations, financial condition or cash flows. We estimate the range of liability related to pending litigation where the amount and range of loss can be estimated. We record our best estimate of a loss when the loss is considered probable. Where a liability is probable and there is a range of estimated loss with no best estimate in the range, we record the minimum estimated liability related to the claim. As additional information becomes available, we assess the potential liability
34
related to our pending litigation and revise our estimates. Revisions in our estimates of the potential liability could materially impact our results of operations.
Results of Operations
|
Revenues (in millions)
|
Year Ended
|
||||||||||||||||||
|
September 29, 2013
|
September 30, 2012
|
September 25, 2011
|
2013 vs. 2012 Change
|
2012 vs. 2011 Change
|
|||||||||||||||
|
Equipment and services
|
$
|
16,988
|
|
$
|
12,465
|
|
$
|
9,223
|
|
$
|
4,523
|
|
$
|
3,242
|
|
||||
|
Licensing
|
7,878
|
|
6,656
|
|
5,734
|
|
1,222
|
|
922
|
|
|||||||||
|
$
|
24,866
|
|
$
|
19,121
|
|
$
|
14,957
|
|
$
|
5,745
|
|
$
|
4,164
|
|
|||||
The increases in equipment and services revenues in fiscal
2013
and
2012
were primarily due to increases in QCT revenues of $4.58 billion and $3.25 billion, respectively. The increases in licensing revenues in fiscal
2013
and
2012
were primarily due to increases in QTL revenues of $1.23 billion and $905 million, respectively.
QCT and QTL segment revenues related to the products of Samsung Electronics and Hon Hai Precision Industry Co., Ltd/Foxconn, its affiliates and other suppliers to Apple Inc. comprised 43% and 38% of total consolidated revenues in fiscal 2013 and 2012, respectively. QCT and QTL segment revenues from Samsung Electronics and HTC comprised 26% of total consolidated revenues in fiscal 2011.
Revenues from customers in China, South Korea and Taiwan comprised
49%
,
20%
and
11%
, respectively, of total consolidated revenues for fiscal
2013
, as compared to
42%
,
22%
, and
14%
, respectively, for fiscal
2012
, and
32%
,
19%
and
17%
, for fiscal
2011
. We distinguish revenues from external customers by geographic areas based on the location to which our products, software or services are delivered or, for QTL licensing revenues, the invoiced addresses of our licensees.
|
Costs and Expenses (in millions)
|
Year Ended
|
||||||||||||||||||
|
September 29, 2013
|
September 30, 2012
|
September 25, 2011
|
2013 vs. 2012 Change
|
2012 vs. 2011 Change
|
|||||||||||||||
|
Cost of equipment and services (E&S) revenues
|
$
|
9,820
|
|
|
$
|
7,096
|
|
|
$
|
4,877
|
|
$
|
2,724
|
|
$
|
2,219
|
|
||
|
Cost as % of E&S revenues
|
58
|
%
|
57
|
%
|
53
|
%
|
|
|
|||||||||||
The decreases in margin percentage in fiscal
2013
and
2012
were primarily attributable to decreases in QCT gross margin percentage. Our margin percentage may continue to fluctuate in future periods depending on the mix of products sold and services provided, competitive pricing, new product introduction costs and other factors.
|
Year Ended
|
|||||||||||||||||||
|
September 29, 2013
|
September 30, 2012
|
September 25, 2011
|
2013 vs. 2012 Change
|
2012 vs. 2011 Change
|
|||||||||||||||
|
Research and development
|
$
|
4,967
|
|
$
|
3,915
|
|
$
|
2,995
|
|
$
|
1,052
|
|
$
|
920
|
|
||||
|
% of revenues
|
20
|
%
|
20
|
%
|
20
|
%
|
|||||||||||||
|
Selling, general, and administrative
|
$
|
2,518
|
|
$
|
2,270
|
|
$
|
1,945
|
|
$
|
248
|
|
$
|
325
|
|
||||
|
% of revenues
|
10
|
%
|
12
|
%
|
13
|
%
|
|||||||||||||
|
Other
|
$
|
331
|
|
$
|
158
|
|
$
|
114
|
|
$
|
173
|
|
$
|
44
|
|
||||
The dollar increases in research and development expenses in fiscal
2013
and
2012
were primarily attributable to increases of $904 million and $741 million, respectively, in costs related to the development of CDMA-based 3G, OFDMA-based 4G LTE and other technologies for integrated circuit and related software products and to expand our intellectual property portfolio and increases of $97 million and $149 million, respectively, in share-based compensation. Remaining dollar increases were related to research and development of other new product and licensing initiatives.
The dollar increase in selling, general and administrative expenses in fiscal
2013
was primarily attributable to a $113 million increase in employee-related expenses, a $56 million increase in selling and marketing expenses, a $40 million increase in patent-related expenses and a $29 million increase in depreciation and amortization expense, partially offset by a decrease of $23 million in share-based compensation. The dollar increase in selling, general and administrative expenses in fiscal
2012
was primarily attributable to a $96 million increase in employee-related expenses, a $77 million increase in costs related to litigation and other legal matters, a $65 million increase in share-based compensation, a $45 million increase in selling and marketing expenses and a $28 million increase in patent-related expenses, partially offset by a $55 million decrease in charitable contributions (primarily related to the establishment and initial funding of the Qualcomm Charitable Foundation in fiscal 2011).
35
Other expenses in fiscal
2013
were comprised of a $173 million charge resulting from the ParkerVision verdict against us and a $158 million impairment charge resulting from revisions to our estimates of expected cash flows for certain long-lived assets of our QMT division as we continue to pursue our licensing model. Other expenses in fiscal
2012
were comprised of an $81 million charge related to a payment made to the Indian government concurrent with the issuance of the BWA spectrum license, a $54 million impairment charge related to certain long-lived assets of our QMT division and $23 million in goodwill impairment charges related to our QRS division. Other expenses in fiscal 2011 were comprised of a $114 million goodwill impairment charge related to our QRS division.
|
Net Investment Income (in millions)
|
Year Ended
|
|
|||||||||||||||||
|
September 29, 2013
|
September 30, 2012
|
September 25, 2011
|
2013 vs. 2012 Change
|
2012 vs. 2011 Change
|
|||||||||||||||
|
Interest and dividend income
|
$
|
697
|
|
$
|
609
|
|
$
|
500
|
|
$
|
88
|
|
$
|
109
|
|
||||
|
Interest expense
|
(23
|
)
|
(90
|
)
|
(114
|
)
|
67
|
|
24
|
|
|||||||||
|
Net realized gains on marketable securities
|
317
|
|
342
|
|
335
|
|
(25
|
)
|
7
|
|
|||||||||
|
Net realized gains on other investments
|
52
|
|
27
|
|
2
|
|
25
|
|
25
|
|
|||||||||
|
Impairment losses on marketable securities and other investments
|
(85
|
)
|
(83
|
)
|
(52
|
)
|
(2
|
)
|
(31
|
)
|
|||||||||
|
Net gains (losses) on derivative instruments
|
—
|
|
84
|
|
(3
|
)
|
(84
|
)
|
87
|
|
|||||||||
|
Net gains on deconsolidation of subsidiaries
|
12
|
|
—
|
|
—
|
|
12
|
|
—
|
|
|||||||||
|
Equity in net losses of investees
|
(6
|
)
|
(9
|
)
|
(7
|
)
|
3
|
|
(2
|
)
|
|||||||||
|
|
$
|
964
|
|
$
|
880
|
|
$
|
661
|
|
$
|
84
|
|
$
|
219
|
|
||||
The increases in interest and dividend income resulted from higher average balances of cash, cash equivalents and marketable securities in fiscal 2013 and 2012 and higher interest rates in fiscal 2012 compared to fiscal 2011. The decreases in interest expense resulted from capitalizing a portion of interest starting in fiscal 2012 related to the former BWA subsidiaries, which were deconsolidated in fiscal 2013. Net gains on derivative instruments in fiscal 2012 primarily resulted from changes in the fair value of put options sold in connection with our stock repurchase program that expired in fiscal 2012.
|
Income Tax Expense (in millions)
|
Year Ended
|
||||||||||||||||||
|
September 29, 2013
|
September 30, 2012
|
September 25, 2011
|
2013 vs. 2012 Change
|
2012 vs. 2011 Change
|
|||||||||||||||
|
Income tax expense
|
$
|
1,349
|
|
$
|
1,279
|
|
$
|
1,132
|
|
$
|
70
|
|
$
|
147
|
|
||||
|
Effective tax rate
|
16
|
%
|
19
|
%
|
20
|
%
|
(3
|
)%
|
(1
|
)%
|
|||||||||
The following table summarizes the primary factors that caused our annual effective tax rates to be less than the United States federal statutory rate:
|
Year Ended
|
||||||||
|
September 29, 2013
|
September 30, 2012
|
September 25, 2011
|
||||||
|
Expected income tax provision at federal statutory tax rate
|
35
|
%
|
35
|
%
|
35
|
%
|
||
|
State income tax provision, net of federal benefit
|
—
|
%
|
—
|
%
|
5
|
%
|
||
|
Benefits from foreign income taxed at other than U.S. rates
|
(17
|
%)
|
(16
|
%)
|
(19
|
%)
|
||
|
Benefits related to the research and development tax credit
|
(2
|
%)
|
(1
|
%)
|
(3
|
%)
|
||
|
Change in valuation allowance
|
—
|
%
|
1
|
%
|
1
|
%
|
||
|
Other
|
—
|
%
|
—
|
%
|
1
|
%
|
||
|
Effective tax rate
|
16
|
%
|
19
|
%
|
20
|
%
|
||
The effective tax rate for fiscal 2013 reflected a tax benefit of $64 million related to fiscal 2012 resulting from the retroactive extension of the United States research and development tax credit. Additionally, the effective tax rate for fiscal 2013 as compared to fiscal 2012 reflected increased foreign earnings taxed at less than the United States federal rate.
The effective tax rate for fiscal 2012 as compared to fiscal 2011 reflected a reduction in our effective state tax rate as a result of California tax legislation previously enacted, partially offset by increased earnings taxed at the United States tax rate. The annual effective tax rate for fiscal 2012 only reflected the United States federal research and development credit generated through December 31, 2011, the date on which the credit expired.
36
The effective tax rate for fiscal 2011 reflected tax benefits of $44 million related to an agreement reached on a component of our fiscal 2006 through fiscal 2010 state tax returns and $32 million related to fiscal 2010 resulting from the retroactive extension of the United States federal research and development tax credit.
Our Segment Results (in millions)
The following should be read in conjunction with the fiscal
2013
,
2012
and
2011
financial results for each reporting segment. See “Notes to Consolidated Financial Statements, Note 8. Segment Information.”
|
QCT
|
QTL
|
QWI
|
QSI
|
||||||||||||
|
2013
|
|
|
|
|
|||||||||||
|
Revenues
|
$
|
16,715
|
|
$
|
7,554
|
|
$
|
613
|
|
$
|
—
|
|
|||
|
EBT (1)
|
3,189
|
|
6,590
|
|
(8
|
)
|
56
|
|
|||||||
|
EBT as a % of revenues
|
19
|
%
|
87
|
%
|
(1
|
%)
|
|
|
|||||||
|
2012
|
|
|
|
|
|||||||||||
|
Revenues
|
$
|
12,141
|
|
$
|
6,327
|
|
$
|
633
|
|
$
|
—
|
|
|||
|
EBT (1)
|
2,296
|
|
5,585
|
|
(15
|
)
|
(170
|
)
|
|||||||
|
EBT as a % of revenues
|
19
|
%
|
88
|
%
|
(2
|
%)
|
|
|
|||||||
|
2011
|
|
|
|
|
|||||||||||
|
Revenues
|
$
|
8,859
|
|
$
|
5,422
|
|
$
|
656
|
|
$
|
—
|
|
|||
|
EBT (1)
|
2,056
|
|
4,753
|
|
(152
|
)
|
(132
|
)
|
|||||||
|
EBT as a % of revenues
|
23
|
%
|
88
|
%
|
(23
|
%)
|
|
|
|||||||
|
(1)
|
Earnings (loss) before taxes.
|
QCT Segment.
The increases in QCT revenues in fiscal 2013 and 2012 of $4.57 billion and $3.28 billion, respectively, were primarily due to increases in equipment and services revenues. Equipment and services revenues, mostly related to sales of MSM and accompanying RF and PM integrated circuits, were $16.49 billion, $11.91 billion and $8.65 billion in fiscal
2013
,
2012
and
2011
, respectively. The increases in equipment and services revenues in fiscal
2013
and
2012
resulted primarily from increases of $2.09 billion and $651 million, respectively, related to the net effects of changes in product mix and lower average selling prices of such products, increases of $2.05 billion and $1.71 billion, respectively, related to higher unit shipments and increases of $212 million and $803 million, respectively, related to sales of connectivity products. Approximately 716 million, 590 million and 483 million MSM integrated circuits were sold during fiscal
2013
,
2012
and
2011
, respectively.
QCT EBT as a percentage of revenues remained flat in fiscal 2013 as compared to fiscal 2012. During fiscal 2013, QCT revenues increased 38% relative to a combined increase of 26% in research and development expenses and selling, general and administrative expenses, partially offset by a decrease in gross margin percentage. The decrease in QCT EBT as a percentage of revenues in fiscal 2012 was primarily due to a decrease in gross margin percentage, partially offset by an increase of 37% in QCT revenues relative to a combined increase of 33% in research and development expenses and selling, general and administrative expenses. QCT gross margin percentage decreased in fiscal
2013
as a result of the net effects of lower average selling prices and unfavorable product mix, partially offset by a decrease in average unit costs. QCT gross margin percentage decreased in fiscal 2012 as a result of the net effects of lower average selling prices, unfavorable product mix and higher product support costs, partially offset by a decrease in average unit costs. The higher product support costs in fiscal
2012
primarily related to increased expenses incurred to facilitate additional supply of 28 nanometer integrated circuits.
QCT inventories increased by 34% in fiscal
2013
from $973 million to $1.30 billion primarily due to certain higher value MSM products and an increase in work-in-process and finished goods related to growth of the business.
QTL Segment.
The increases in QTL revenues in fiscal 2013 and 2012 of $1.23 billion and $905 million, respectively, were primarily due to increases in sales of CDMA-based devices by licensees. The net increase in QTL revenues in fiscal 2012 also included the effect of $401 million in revenues recorded in fiscal 2011 in connection with settlement agreements entered into with two licensees. The decrease in QTL EBT as a percentage of revenues during fiscal 2013 was attributable to an increase of 19% in revenues relative to an increase of 29% in costs and expenses primarily due to increased allocation of patent expenses in connection with the corporate reorganization and increased research and development expenses.
QWI Segment.
The decrease in QWI revenues in fiscal
2013
was primarily due to a decrease of $13 million in QIS revenues. The decrease in QWI revenues in fiscal 2012 was primarily due to a $25 million decrease in Omnitracs revenues. QWI costs and expenses in fiscal 2012 and 2011 included $23 million and $114 million respectively, of goodwill impairment charges related to our QRS division. The $16 million decrease in QWI EBT during fiscal 2013, excluding the impairment
37
charges, was primarily attributable to a $19 million increase in QRS operating loss (before the impairment charges). The $46 million increase in QWI EBT in fiscal 2012, excluding the impairment charges, was primarily attributable to a $26 million decrease in QRS operating loss (before the impairment charges) and a $25 million decrease in QIS operating loss.
QSI Segment
. QSI costs and expenses for fiscal 2012 included $81 million related to a payment made to the Indian government concurrent with the issuance of the BWA spectrum license. The increases in QSI EBT in fiscal 2013 and 2012 of $145 million and $43 million, respectively, excluding this expense, were primarily due to increases of $67 million and $40 million, respectively, in net realized gains on investments and decreases of $60 million and $20 million, respectively, in interest expense as a result of capitalizing interest starting in the third quarter of fiscal 2012 related to the BWA subsidiaries, which were deconsolidated in fiscal 2013.
Liquidity and Capital Resources
Our principal sources of liquidity are our existing cash, cash equivalents and marketable securities, cash generated from operations and proceeds from the issuance of common stock under our stock option and employee stock purchase plans. Cash, cash equivalents and marketable securities were
$29.4 billion
at
September 29, 2013
, an increase of
$2.6 billion
from
September 30, 2012
. This increase included
$1.5 billion
in proceeds from the issuance of common stock under our equity compensation plans. Our cash, cash equivalents and marketable securities at
September 29, 2013
consisted of $8.1 billion held by United States-based subsidiaries and $21.3 billion held by foreign subsidiaries. Of our cash, cash equivalents and marketable securities at
September 29, 2013
, $21.2 billion is indefinitely reinvested and would be subject to material tax effects if repatriated. Due to tax considerations, we derive liquidity for operations primarily from domestic cash flow and investments held domestically. Total cash provided by operating activities increased to
$8.8 billion
during fiscal
2013
, compared to
$6.0 billion
during fiscal
2012
.
During fiscal
2013
, we repurchased and retired
71,696,000
shares of common stock for
$4.6 billion
, before commissions. At
September 29, 2013
, approximately
$4.9 billion
remained available for repurchase under a new stock repurchase program announced in September, and we currently expect to complete a minimum of $4 billion of stock repurchases during fiscal 2014. The stock repurchase program has no expiration date. We continue to evaluate repurchases as a means of returning capital to stockholders, subject to our periodic determinations that repurchases are in the best interests of our stockholders.
We paid dividends totaling $2.1 billion and $1.6 billion, or
$1.20
and
$0.93
per common share, during fiscal
2013
and
2012
, respectively. On March 5, 2013, we announced an increase in our quarterly dividend from $0.25 to $0.35 per share of common stock. On
October 24, 2013
, we announced a cash dividend of
$0.35
per share of common stock, payable on
December 19, 2013
to stockholders of record as of
December 2, 2013
. We intend to continue to use cash dividends as a means of returning capital to stockholders, subject to capital availability and our view that cash dividends are in the best interests of our stockholders.
Accounts receivable increased 47% during fiscal
2013
. Days sales outstanding, on a consolidated basis, were 30 days at
September 29, 2013
compared to 29 days at
September 30, 2012
. The increase in accounts receivable and the related days sales outstanding were primarily due to growth of the business and the effects of timing of shipments and customer payments for receivables related to integrated circuits.
We believe our current cash, cash equivalents and marketable securities and our expected cash flow generated from operations will provide us with flexibility and satisfy our working and other capital requirements over the next fiscal year and beyond based on our current business plans.
|
•
|
Our research and development expenditures were
$5.0 billion
and
$3.9 billion
in fiscal
2013
and
2012
, respectively, and we expect to continue to invest heavily in research and development for new technologies, applications and services for voice and data communications, primarily in the wireless industry.
|
|
•
|
Cash outflows for capital expenditures were
$1.0 billion
and
$1.3 billion
in fiscal
2013
and
2012
, respectively, including approximately $480 million in fiscal 2012 related to the construction of a new manufacturing facility in Taiwan for our QMT division. We expect to continue to incur capital expenditures in the future to support our business, including research and development activities. Future capital expenditures may be impacted by transactions that are currently not forecasted.
|
|
•
|
Our purchase obligations for fiscal
2014
, some of which relate to research and development activities and capital expenditures, totaled
$3.3 billion
at
September 29, 2013
.
|
|
•
|
On August 21, 2013, we entered into a definitive agreement under which we agreed to sell the North and Latin American operations of our Omnitracs division for $800 million, subject to closing conditions, including receipt of regulatory approvals. We expect the transaction to close in the first quarter of fiscal 2014.
|
38
|
•
|
We expect to continue making strategic investments and acquisitions, the amounts of which could vary significantly, to open new opportunities for our technologies, obtain development resources, grow our patent portfolio or pursue new business.
|
Contractual Obligations / Off-Balance Sheet Arrangements
We have no significant contractual obligations not fully recorded on our consolidated balance sheets or fully disclosed in the notes to our consolidated financial statements. We have no material off-balance sheet arrangements as defined in S-K 303(a)(4)(ii).
At
September 29, 2013
, our outstanding contractual obligations included (in millions):
Contractual Obligations
Payments Due By Fiscal Period
|
Total
|
2014
|
2015-2016
|
2017-2018
|
Beyond
2018
|
No
Expiration
Date
|
||||||||||||||||||
|
Purchase obligations (1)
|
$
|
3,558
|
|
$
|
3,284
|
|
$
|
256
|
|
$
|
8
|
|
$
|
10
|
|
$
|
—
|
|
|||||
|
Operating lease obligations
|
343
|
|
89
|
|
135
|
|
72
|
|
47
|
|
—
|
|
|||||||||||
|
Capital lease obligations (2)
|
36
|
|
1
|
|
3
|
|
3
|
|
29
|
|
—
|
|
|||||||||||
|
Equity funding commitments (3)
|
2
|
|
—
|
|
—
|
|
—
|
|
—
|
|
2
|
|
|||||||||||
|
Other long-term liabilities (4)(5)
|
42
|
|
—
|
|
26
|
|
8
|
|
6
|
|
2
|
|
|||||||||||
|
Total contractual obligations
|
$
|
3,981
|
|
$
|
3,374
|
|
$
|
420
|
|
$
|
91
|
|
$
|
92
|
|
$
|
4
|
|
|||||
|
(1)
|
Total purchase obligations include $2.8 billion in commitments to purchase integrated circuit product inventories. Integrated circuit product inventory obligations represent purchase commitments for silicon wafers and assembly and test services. Under our manufacturing relationships with our foundry partners and assembly and test service providers, cancelation of outstanding purchase orders is generally allowed but requires payment of all costs incurred through the date of cancelation.
|
|
(2)
|
Amounts represent future minimum lease payments including interest payments. Capital lease obligations are included in other liabilities in the consolidated balance sheet at
September 29, 2013
.
|
|
(3)
|
These commitments do not have fixed funding dates and are subject to certain conditions. Commitments represent the maximum amounts to be financed or funded under these arrangements; actual financing or funding may be in lesser amounts or not at all.
|
|
(4)
|
Certain long-term liabilities reflected on our balance sheet, such as unearned revenues, are not presented in this table because they do not require cash settlement in the future. Other long-term liabilities as presented in this table include the related current portions.
|
|
(5)
|
Our consolidated balance sheet at
September 29, 2013
included a $208 million noncurrent liability for uncertain tax positions, all of which may result in cash payment. The future payments related to uncertain tax positions have not been presented in the table above due to the uncertainty of the amounts and timing of cash settlement with the taxing authorities.
|
Additional information regarding our financial commitments at
September 29, 2013
is provided in the notes to our consolidated financial statements. See “Notes to Consolidated Financial Statements, Note 7. Commitments and Contingencies.”
Recent Accounting Pronouncements
In February 2013, the Financial Accounting Standards Board (FASB) issued guidance on disclosure requirements for items reclassified out of accumulated other comprehensive income. This new guidance requires entities to present (either on the face of the statement of operations or in the notes to the financial statements) the effects on the line items in the statement of operations for amounts reclassified out of accumulated other comprehensive income. The new guidance will be effective for us beginning in the first quarter of fiscal 2014. The adoption of the guidance will impact our financial statement presentation and/or our disclosures but will not impact our financial position, results of operations or cash flows.
Interest Rate Risk.
We invest a portion of our cash in a number of diversified fixed and floating rate securities, consisting of cash equivalents, marketable debt securities, debt funds and derivative instruments, including interest rate swaps, that are subject to interest rate risk. Changes in the general level of interest rates can affect the fair value of our investment portfolio. If interest rates in the general economy were to rise, our holdings could lose value.
Historically, we presented a table that disclosed certain information (including principal or notional amounts, interest rates and maturities) regarding our interest-bearing instruments. However, given the increased size and diversity in our investment portfolio, we believe that providing a sensitivity analysis provides more meaningful disclosure regarding the impact to our holdings of potential changes in interest rates. As a result, in lieu of the tabular presentation, we are providing a sensitivity analysis that shows the effect of an assumed 100 basis point adverse movement in interest rates across the entire yield curve.
39
At
September 29, 2013
, a hypothetical increase in interest rates of 100 basis points on our holdings would have resulted in decreases of $9 million and $443 million in the fair values of our holdings classified as trading (including derivative instruments) and our remaining holdings, respectively. At September 30, 2012, the same hypothetical increase in interest rates would have resulted in decreases of $17 million and $430 million in the fair values of our holdings classified as trading (including derivative instruments) and our remaining holdings, respectively.
Equity Price Risk.
We hold a diversified marketable securities portfolio that includes equity securities and fund shares that are subject to equity price risk. We have made investments in marketable equity securities of companies of varying size, style, industry and geography, and changes in investment allocations may affect the price volatility of our investments. A 10% decrease in the market price of our marketable equity securities and fund shares at
September 29, 2013
would cause a decrease in the carrying amounts of these securities of $332 million. At
September 29, 2013
, gross unrealized losses of our marketable equity securities and fund shares were $44 million. Although we consider these unrealized losses to be temporary, there is a risk that we may incur other-than-temporary impairment charges or realized losses on the values of these securities if they do not recover in value within a reasonable period.
Foreign Exchange Risk.
We manage our exposure to foreign exchange market risks, when deemed appropriate, through the use of derivative financial instruments, including foreign currency forward and option contracts with financial counterparties. We utilize such derivative financial instruments for hedging or risk management purposes rather than for speculation purposes. Counterparties to our derivative contracts are all major banking institutions. In the event of the financial insolvency or distress of a counterparty to our derivative financial instruments, we may be unable to settle transactions if the counterparty does not provide us with sufficient collateral to secure its net settlement obligations to us, which could have a negative impact on our results. See “Notes to Consolidated Financial Statements, Note 1. The Company and Its Significant Accounting Policies” for a description of our foreign currency accounting policies.
At
September 29, 2013
, we had a net asset of $37 million related to foreign currency option contracts that were designated as hedges of foreign currency risk on royalties earned from certain licensees on their sales of CDMA-based devices. If our forecasted royalty revenues were to decline by 20% and foreign exchange rates were to change unfavorably by 20% in our hedged foreign currency, we would incur a loss of $1 million.
At
September 29, 2013
, we had a net liability of $8 million related to foreign currency forward contracts that were designated as hedges of foreign currency risk on intercompany payments of operating expenditures relating to a wholly-owned foreign subsidiary. If our forecasted operating expenditures were to decline by 20% and foreign exchange rates were to change unfavorably by 20% in each of our hedged foreign currencies, we would not incur a loss.
At
September 29, 2013
, we had a net liability of $14 million related to foreign currency forwards, futures, options and swaps that were not designated as hedging instruments related to our marketable securities portfolios classified as trading. If the foreign exchange rates relevant to these contracts were to change unfavorably by 10% and we do not have an offset foreign currency exposure relating to debt instruments held in our marketable securities portfolios classified as trading, we would incur a loss of $2 million.
Financial assets and liabilities held by consolidated subsidiaries that are not denominated in the functional currency of those entities are subject to the effects of currency fluctuations and may affect reported earnings. As a global company, we face exposure to adverse movements in foreign currency exchange rates. We may hedge currency exposures associated with certain assets and liabilities denominated in nonfunctional currencies and certain anticipated nonfunctional currency transactions. As a result, we could experience unanticipated gains or losses on anticipated foreign currency cash flows, as well as economic loss with respect to the recoverability of investments. While we may hedge certain transactions with non-United States customers, declines in currency values in certain regions may, if not reversed, adversely affect future product sales because our products may become more expensive to purchase in the countries of the affected currencies.
Our analysis methods used to assess and mitigate the risks discussed above should not be considered projections of future risks.
Our consolidated financial statements at
September 29, 2013
and
September 30, 2012
and the Report of PricewaterhouseCoopers LLP, Independent Registered Public Accounting Firm, are included in this Annual Report on Form 10-K on pages F-1 through F-36.
None.
40
Conclusion Regarding the Effectiveness of Disclosure Controls and Procedures
Under the supervision and with the participation of our management, including our principal executive officer and principal financial officer, we conducted an evaluation of our disclosure controls and procedures, as such terms are defined under Rule 13a-15(e) promulgated under the Securities Exchange Act of 1934, as amended (the Exchange Act). Based on this evaluation, our principal executive officer and our principal financial officer concluded that our disclosure controls and procedures were effective as of the end of the period covered by this Annual Report.
Management’s Report on Internal Control over Financial Reporting
Our management is responsible for establishing and maintaining adequate internal control over financial reporting, as such term is defined in Exchange Act Rule 13a-15(f). Under the supervision and with the participation of our management, including our principal executive officer and principal financial officer, we conducted an evaluation of the effectiveness of our internal control over financial reporting based on the framework in
Internal Control — Integrated Framework (1992)
issued by the Committee of Sponsoring Organizations of the Treadway Commission. Based on our evaluation under this framework, our management concluded that our internal control over financial reporting was effective as of
September 29, 2013
.
PricewaterhouseCoopers LLP, the independent registered public accounting firm that audited the consolidated financial statements included in this Annual Report on Form 10-K, has also audited the effectiveness of our internal control over financial reporting as of
September 29, 2013
, as stated in its report which appears on page F-1.
Inherent Limitations over Internal Controls
Our internal control over financial reporting is designed to provide reasonable assurance regarding the reliability of financial reporting and the preparation of consolidated financial statements for external purposes in accordance with generally accepted accounting principles. Our internal control over financial reporting includes those policies and procedures that:
|
i.
|
pertain to the maintenance of records that, in reasonable detail, accurately and fairly reflect the transactions and dispositions of our assets;
|
|
ii.
|
provide reasonable assurance that transactions are recorded as necessary to permit preparation of consolidated financial statements in accordance with generally accepted accounting principles, and that our receipts and expenditures are being made only in accordance with authorizations of our management and directors; and
|
|
iii.
|
provide reasonable assurance regarding prevention or timely detection of unauthorized acquisition, use or disposition of our assets that could have a material effect on the consolidated financial statements.
|
Internal control over financial reporting cannot provide absolute assurance of achieving financial reporting objectives because of its inherent limitations, including the possibility of human error and circumvention by collusion or overriding of controls. Accordingly, even an effective internal control system may not prevent or detect material misstatements on a timely basis. Also, projections of any evaluation of effectiveness to future periods are subject to the risk that controls may become inadequate because of changes in conditions or that the degree of compliance with the policies or procedures may deteriorate.
Changes in Internal Control over Financial Reporting
There were no changes in our internal control over financial reporting during the fourth quarter of fiscal
2013
that have materially affected, or are reasonably likely to materially affect, our internal control over financial reporting.
None.
The information required by this item regarding directors is incorporated by reference to our Definitive Proxy Statement to be filed with the Securities and Exchange Commission in connection with our Annual Meeting of Stockholders to be held in
2014
(the
2014
Proxy Statement) under the headings “Election of Directors” and “Section 16(a) Beneficial Ownership Reporting Compliance.” Certain information required by this item regarding executive officers is set forth in Item 1 of Part I of this Report under the caption “Executive Officers,” and certain information is incorporated by reference to the 2014 Proxy Statement under the heading “Section 16(a) Beneficial Ownership Reporting Compliance.” The information required by this item regarding corporate governance is incorporated by reference to the
2014
Proxy Statement under the headings “Code of
41
Ethics and Corporate Governance Principles and Practices,” “Director Nominations” and “Board Meetings, Committees and Attendance.”
The information required by this item is incorporated by reference to the
2014
Proxy Statement under the headings “Executive Compensation and Related Information,” “Director Compensation,” “Compensation Committee Interlocks and Insider Participation in Compensation Decisions” and “Compensation Committee Report.”
The information required by this item is incorporated by reference to the
2014
Proxy Statement under the headings “Equity Compensation Plan Information” and “Stock Ownership of Certain Beneficial Owners and Management.”
The information required by this item is incorporated by reference to the
2014
Proxy Statement under the headings “Certain Relationships and Related-Person Transactions” and “Director Independence.”
The information required by this item is incorporated by reference to the
2014
Proxy Statement under the heading “Fees for Professional Services.”
42
The following documents are filed as part of this report:
|
|
|
Page
|
|
|
|
|
|
Number
|
|
|
|
(a) Financial Statements:
|
|
|
|
|
|
(1) Report of Independent Registered Public Accounting Firm
|
|
F-1
|
|
|
|
Consolidated Balance Sheets at September 29, 2013 and September 30, 2012
|
|
F-2
|
|
|
|
Consolidated Statements of Operations for Fiscal 2013, 2012 and 2011
|
|
F-3
|
|
|
|
Consolidated Statements of Comprehensive Income for Fiscal 2013, 2012 and 2011
|
|
F-4
|
|
|
|
Consolidated Statements of Cash Flows for Fiscal 2013, 2012 and 2011
|
|
F-5
|
|
|
|
Consolidated Statements of Stockholders’ Equity for Fiscal 2013, 2012 and 2011
|
|
F-6
|
|
|
|
Notes to Consolidated Financial Statements
|
|
F-7
|
|
|
|
(2) Schedule II - Valuation and Qualifying Accounts
|
|
S-1
|
|
|
Financial statement schedules other than those listed above have been omitted because they are either not required, not applicable or the information is otherwise included in the notes to the consolidated financial statements.
(b) Exhibits
|
Exhibit
|
|
|
|
Number
|
|
Description
|
|
3.1
|
|
Restated Certificate of Incorporation, as amended. (1)
|
|
3.4
|
|
Amended and Restated Bylaws. (2)
|
|
4.1
|
Amended and Restated Rights Agreement dated as of September 26, 2005 between the Company and Computershare Trust Company, N.A., as successor Rights Agent to Computershare Investor Services LLC. (3)
|
|
|
4.2
|
Amendment dated as of December 7, 2006 to the Amended and Restated Rights Agreement dated as of September 26, 2005 between the Company and Computershare Trust Company, N.A., as successor Rights Agent to Computershare Investor Services LLC. (4)
|
|
|
10.1
|
|
Form of Indemnity Agreement between the Company, each director and certain officers. (5)(6)
|
|
10.40
|
|
Form of Stock Option Grant Notice and Agreement under the 2001 Stock Option Plan. (5)(7)
|
|
10.43
|
|
Form of Stock Option Grant Notice and Agreement under the 2001 Non-Employee Directors’ Stock Option Plan. (5)(8)
|
|
10.55
|
|
2001 Stock Option Plan, as amended. (5)(9)
|
|
10.66
|
|
2001 Non-Employee Directors’ Stock Option Plan, as amended. (5)(10)
|
|
10.84
|
|
Form of Grant Notice and Stock Option Agreement under the 2006 Long-Term Incentive Plan. (5)(11)
|
|
10.86
|
|
Form of Grant Notice and Market Stock Unit Agreement under the 2006 Long-Term Incentive Plan. (5)(12)
|
|
10.94
|
2006 Long-Term Incentive Plan, as amended and restated. (5)(13)
|
|
|
10.95
|
Amended and Restated QUALCOMM Incorporated 2001 Employee Stock Purchase Plan. (5)(13)
|
|
|
10.96
|
Atheros Communications, Inc. 2004 Stock Incentive Plan, as amended. (5)(14)
|
|
|
10.97
|
Atheros Communications, Inc. 2009 Inducement Grant Incentive Plan. (5)(14)
|
|
|
10.98
|
Atheros Communications, Inc. (formerly T-Span Corporation) 1998 Stock Incentive Plan, as amended. (5)(14)
|
|
|
10.99
|
Third Amended and Restated Intellon Corporation 2000 Employee Incentive Plan. (5)(14)
|
|
|
10.100
|
Intellon Corporation 2007 Equity Incentive Plan. (5)(14)
|
|
|
10.101
|
Resolutions Amending Atheros Communications, Inc. Equity Plans. (5)(14)
|
|
|
10.102
|
Executive Retirement Matching Contribution Plan, amended and restated generally effective January 1, 2011, as subsequently amended by Amendment Number 1 and Amendment Number 2. (5)(15)
|
|
|
10.103
|
Amendment to the 2006 Long-Term Incentive Plan, as amended and restated. (5)(15)
|
|
43
|
10.104
|
|
Form of Grant Notices and Global Employee Stock Option Agreement under the 2006 Long-Term Incentive Plan. (5)(15)
|
|
10.105
|
|
Form of Grant Notices and Global Employee Restricted Stock Unit Agreement under the 2006 Long-Term Incentive Plan. (5)(15)
|
|
10.106
|
Form of Grant Notice and Performance Stock Unit Agreement under the 2006 Long-Term Incentive Plan for the November 1, 2010 to October 31, 2013 performance periods. (5)(15)
|
|
|
10.107
|
Form of Grant Notices and Performance Stock Unit Agreements under the 2006 Long-Term Incentive Plan for the September 26, 2011 to September 26, 2014 performance periods, including variation of forms for employee in the United Kingdom. (5)(15)
|
|
|
10.108
|
Form of Performance Unit Agreements for the Annual Cash Incentive Plan under the 2006 Long-Term Incentive Plan for the fiscal 2012 performance period. (5)(15)
|
|
|
10.110
|
Executive Retirement Matching Contribution Plan amended and restated generally effective January 1, 2011, as subsequently amended by Amendment Number 1, Amendment Number 2 and Amendment Number 3. (5)(16)
|
|
|
10.111
|
Form of Performance Unit Agreements for the Annual Cash Incentive Plan under the 2006 Long-Term Incentive Plan for the fiscal 2013 performance period. (5)(16)
|
|
|
10.112
|
2006 Long-Term Incentive Plan, as amended and restated. (5)(17)
|
|
|
10.113
|
Amended and Restated QUALCOMM Incorporated 2001 Employee Stock Purchase Plan. (5)(17)
|
|
|
10.114
|
Form of Aircraft Time Sharing Agreement. (5)(18)
|
|
|
10.115
|
Form of Executive Grant Notices and Executive Performance Stock Unit Agreements under the 2006 Long-Term Incentive Plan for the September 30, 2013 to September 27, 2015 performance periods. (5)
|
|
|
10.116
|
Non-Qualified Deferred Compensation Plan (formerly known as Executive Retirement Matching Contribution Plan) amended and restated effective September 30, 2013. (5)
|
|
|
10.117
|
Form of Grant Notices and Non-Employee Director Restricted Stock Unit Agreements under the 2006 Long-Term Incentive Plan for non-employee directors residing in the United Kingdom and Hong Kong. (5)
|
|
|
10.118
|
Form of Executive Grant Notice and Executive Performance Stock Unit Agreement under the 2006 Long-Term Incentive Plan, which includes a September 30, 2013 to June 29, 2014 performance period. (5)
|
|
|
10.119
|
Form of Grant Notices and Non-Employee Director Deferred Stock Unit Agreements under the 2006 Long-Term Incentive Plan for non-employee directors residing in the United States and Spain. (5)
|
|
|
21
|
|
Subsidiaries of the Registrant.
|
|
23.1
|
|
Consent of Independent Registered Public Accounting Firm.
|
|
31.1
|
|
Certification pursuant to Section 302 of the Sarbanes-Oxley Act of 2002 for Paul E. Jacobs.
|
|
31.2
|
|
Certification pursuant to Section 302 of the Sarbanes-Oxley Act of 2002 for George S. Davis.
|
|
32.1
|
|
Certification pursuant to 18 U.S.C. Section 1350, as adopted pursuant to Section 906 of the Sarbanes-Oxley Act of 2002 for Paul E. Jacobs.
|
|
32.2
|
|
Certification pursuant to 18 U.S.C. Section 1350, as adopted pursuant to Section 906 of the Sarbanes-Oxley Act of 2002 for George S. Davis.
|
|
101.INS
|
|
XBRL Instance Document.
|
|
101.SCH
|
|
XBRL Taxonomy Extension Schema.
|
|
101.CAL
|
|
XBRL Taxonomy Extension Calculation Linkbase.
|
|
101.LAB
|
|
XBRL Taxonomy Extension Labels Linkbase.
|
|
101.PRE
|
|
XBRL Taxonomy Extension Presentation Linkbase.
|
|
101.DEF
|
|
XBRL Taxonomy Extension Definition Linkbase.
|
|
(1)
|
Filed as an exhibit to the Registrant’s Quarterly Report on Form 10-Q for the quarter ended March 25, 2012.
|
|
(2)
|
Filed as an exhibit to the Registrant’s Current Report on Form 8-K filed on July 11, 2012.
|
|
(3)
|
Filed as an exhibit to the Registrant’s Current Report on Form 8-K (File No. 000-19528) filed on September 30, 2005.
|
|
(4)
|
Filed as an Exhibit to the Registrant’s Current Report on Form 8-K (File No. 000-19528) filed on December 12, 2006.
|
|
(5)
|
Indicates management or compensatory plan or arrangement required to be identified pursuant to Item 15(a).
|
|
(6)
|
Filed as an exhibit to the Registrant’s Registration Statement on Form S-1 (No. 33-42782).
|
|
(7)
|
Filed as an exhibit to the Registrant’s Quarterly Report on Form 10-Q (File No. 000-19528) for the quarter ended June 27, 2004.
|
|
(8)
|
Filed as an exhibit to the Registrant’s Quarterly Report on Form 10-Q (File No. 000-19528) for the quarter ended April 1, 2001.
|
|
(9)
|
Filed as an exhibit to the Registrant’s Quarterly Report on Form 10-Q (File No. 000-19528) for the quarter ended March 28, 2004.
|
44
|
(10)
|
Filed as an exhibit to the Registrant’s Current Report on Form 8-K/A (File No. 000-19528) filed on May 6, 2005.
|
|
(11)
|
Filed as an exhibit to the Registrant’s Annual Report on Form 10-K for the year ended September 27, 2009.
|
|
(12)
|
Filed as an exhibit to the Registrant’s Quarterly Report on Form 10-Q for the quarter ended December 27, 2009.
|
|
(13)
|
Filed as an exhibit to the Registrant’s Quarterly Report on Form 10-Q for the quarter ended March 27, 2011.
|
|
(14)
|
Filed as an exhibit to the Registrant’s Registration Statement on Form S-8 filed on June 1, 2011.
|
|
(15)
|
Filed as an exhibit to the Registrant’s Annual Report on Form 10-K for the year ended September 30, 2012.
|
|
(16)
|
Filed as an exhibit to the Registrant’s Quarterly Report on Form 10-Q for the quarter ended December 30, 2012.
|
|
(17)
|
Filed as an exhibit to the Registrant’s Quarterly Report on Form 10-Q for the quarter ended March 31, 2013.
|
|
(18)
|
Filed as an exhibit to the Registrant’s Quarterly Report on Form 10-Q for the quarter ended June 30, 2013.
|
45
SIGNATURES
Pursuant to the requirements of Section 13 or 15(d) of the Securities Exchange Act of 1934, the registrant has duly caused this report to be signed on its behalf by the undersigned, thereunto duly authorized.
November 6, 2013
|
|
|
|
|
|
|
QUALCOMM Incorporated
|
||
|
|
By
|
/s/ Paul E. Jacobs
|
|
|
|
|
Paul E. Jacobs,
|
|
|
|
|
Chief Executive Officer and Chairman
|
|
46
Pursuant to the requirements of the Securities Exchange Act of 1934, this Report has been signed below by the following persons on behalf of the registrant and in the capacities and on the dates indicated:
|
|
|
|
|
|
|
Signature
|
|
Title
|
|
Date
|
|
|
||||
|
/s/ Paul E. Jacobs
|
|
Chief Executive Officer and Chairman
|
|
November 6, 2013
|
|
Paul E. Jacobs
|
(Principal Executive Officer)
|
|||
|
|
|
|
|
|
|
/s/ George S. Davis
|
|
Chief Financial Officer
|
|
November 6, 2013
|
|
George S. Davis
|
(Principal Financial and Accounting Officer)
|
|||
|
|
|
|
|
|
|
/s/ Barbara T. Alexander
|
|
Director
|
|
November 6, 2013
|
|
Barbara T. Alexander
|
|
|
|
|
|
|
|
|
|
|
|
/s/ Donald G. Cruickshank
|
|
Director
|
|
November 6, 2013
|
|
Donald G. Cruickshank
|
|
|
|
|
|
|
|
|
|
|
|
/s/ Raymond V. Dittamore
|
|
Director
|
|
November 6, 2013
|
|
Raymond V. Dittamore
|
|
|
|
|
|
|
|
|
|
|
|
/s/ Susan Hockfield
|
|
Director
|
|
November 6, 2013
|
|
Susan Hockfield
|
|
|
|
|
|
|
|
|
|
|
|
/s/ Thomas W. Horton
|
|
Director
|
|
November 6, 2013
|
|
Thomas W. Horton
|
|
|
|
|
|
|
|
|
|
|
|
/s/ Sherry L. Lansing
|
|
Director
|
|
November 6, 2013
|
|
Sherry L. Lansing
|
|
|
|
|
|
|
|
|
|
|
|
/s/ Duane A. Nelles
|
|
Director
|
|
November 6, 2013
|
|
Duane A. Nelles
|
|
|
|
|
|
|
|
|
|
|
|
/s/ Clark T. Randt, Jr.
|
Director
|
November 6, 2013
|
||
|
Clark T. Randt, Jr.
|
||||
|
|
|
|
|
|
|
/s/ Francisco Ros
|
Director
|
November 6, 2013
|
||
|
Francisco Ros
|
||||
|
/s/ Jonathan J. Rubinstein
|
|
Director
|
|
November 6, 2013
|
|
Jonathan J. Rubinstein
|
|
|
|
|
|
/s/ Brent Scowcroft
|
|
Director
|
|
November 6, 2013
|
|
Brent Scowcroft
|
|
|
|
|
|
|
|
|
|
|
|
/s/ Marc I. Stern
|
|
Director
|
|
November 6, 2013
|
|
Marc I. Stern
|
|
|
|
|
47
Report of Independent Registered Public Accounting Firm
To the Board of Directors and Stockholders of QUALCOMM Incorporated:
In our opinion, the accompanying consolidated financial statements listed in the index appearing under Item 15(a)(1) present fairly, in all material respects, the financial position of QUALCOMM Incorporated and its subsidiaries at
September 29, 2013
and
September 30, 2012
and the results of their operations and their cash flows for each of the three years in the period ended
September 29, 2013
in conformity with accounting principles generally accepted in the United States of America. In addition, in our opinion, the financial statement schedule listed in the index appearing under Item 15(a)(2) presents fairly, in all material respects, the information set forth therein when read in conjunction with the related consolidated financial statements. Also in our opinion, the Company maintained, in all material respects, effective internal control over financial reporting as of
September 29, 2013
, based on criteria established in
Internal Control - Integrated Framework (1992)
issued by the Committee of Sponsoring Organizations of the Treadway Commission (COSO). The Company’s management is responsible for these financial statements and financial statement schedule, for maintaining effective internal control over financial reporting and for its assessment of the effectiveness of internal control over financial reporting, included in the accompanying Management’s Report on Internal Control over Financial Reporting appearing under Item 9A. Our responsibility is to express opinions on these financial statements, on the financial statement schedule and on the Company’s internal control over financial reporting based on our integrated audits. We conducted our audits in accordance with the standards of the Public Company Accounting Oversight Board (United States). Those standards require that we plan and perform the audits to obtain reasonable assurance about whether the financial statements are free of material misstatement and whether effective internal control over financial reporting was maintained in all material respects. Our audits of the financial statements included examining, on a test basis, evidence supporting the amounts and disclosures in the financial statements, assessing the accounting principles used and significant estimates made by management, and evaluating the overall financial statement presentation. Our audit of internal control over financial reporting included obtaining an understanding of internal control over financial reporting, assessing the risk that a material weakness exists, and testing and evaluating the design and operating effectiveness of internal control based on the assessed risk. Our audits also included performing such other procedures as we considered necessary in the circumstances. We believe that our audits provide a reasonable basis for our opinions.
A company’s internal control over financial reporting is a process designed to provide reasonable assurance regarding the reliability of financial reporting and the preparation of financial statements for external purposes in accordance with generally accepted accounting principles. A company’s internal control over financial reporting includes those policies and procedures that (i) pertain to the maintenance of records that, in reasonable detail, accurately and fairly reflect the transactions and dispositions of the assets of the company; (ii) provide reasonable assurance that transactions are recorded as necessary to permit preparation of financial statements in accordance with generally accepted accounting principles, and that receipts and expenditures of the company are being made only in accordance with authorizations of management and directors of the company; and (iii) provide reasonable assurance regarding prevention or timely detection of unauthorized acquisition, use, or disposition of the company’s assets that could have a material effect on the financial statements.
Because of its inherent limitations, internal control over financial reporting may not prevent or detect misstatements. Also, projections of any evaluation of effectiveness to future periods are subject to the risk that controls may become inadequate because of changes in conditions, or that the degree of compliance with the policies or procedures may deteriorate.
/s/ PricewaterhouseCoopers LLP
San Diego, California
November 6, 2013
F-
1
QUALCOMM Incorporated
(In millions, except per share data)
|
September 29, 2013
|
September 30, 2012
|
||||||
|
ASSETS
|
|||||||
|
Current assets:
|
|
|
|||||
|
Cash and cash equivalents
|
$
|
6,142
|
|
$
|
3,807
|
|
|
|
Marketable securities
|
8,824
|
|
8,567
|
|
|||
|
Accounts receivable, net
|
2,142
|
|
1,459
|
|
|||
|
Inventories
|
1,302
|
|
1,030
|
|
|||
|
Deferred tax assets
|
573
|
|
309
|
|
|||
|
Other current assets
|
572
|
|
473
|
|
|||
|
Total current assets
|
19,555
|
|
15,645
|
|
|||
|
Marketable securities
|
14,440
|
|
14,463
|
|
|||
|
Deferred tax assets
|
1,059
|
|
1,412
|
|
|||
|
Assets held for sale
|
72
|
|
1,109
|
|
|||
|
Property, plant and equipment, net
|
2,995
|
|
2,851
|
|
|||
|
Goodwill
|
3,976
|
|
3,917
|
|
|||
|
Other intangible assets, net
|
2,553
|
|
2,938
|
|
|||
|
Other assets
|
866
|
|
677
|
|
|||
|
Total assets
|
$
|
45,516
|
|
$
|
43,012
|
|
|
|
LIABILITIES AND STOCKHOLDERS’ EQUITY
|
|||||||
|
Current liabilities:
|
|
|
|||||
|
Trade accounts payable
|
$
|
1,554
|
|
$
|
1,298
|
|
|
|
Payroll and other benefits related liabilities
|
839
|
|
664
|
|
|||
|
Unearned revenues
|
501
|
|
545
|
|
|||
|
Liabilities held for sale
|
43
|
|
1,072
|
|
|||
|
Other current liabilities
|
2,276
|
|
1,723
|
|
|||
|
Total current liabilities
|
5,213
|
|
5,302
|
|
|||
|
Unearned revenues
|
3,666
|
|
3,739
|
|
|||
|
Other liabilities
|
550
|
|
426
|
|
|||
|
Total liabilities
|
9,429
|
|
9,467
|
|
|||
|
Commitments and contingencies (Note 7)
|
|
|
|
|
|||
|
Stockholders’ equity:
|
|
|
|||||
|
Qualcomm stockholders’ equity:
|
|||||||
|
Preferred stock, $0.0001 par value; issuable in series; 8 shares authorized; none outstanding
|
—
|
|
—
|
|
|||
|
Common stock, $0.0001 par value; 6,000 shares authorized; 1,685 and 1,706 shares issued and outstanding, respectively
|
—
|
|
—
|
|
|||
|
Paid-in capital
|
9,874
|
|
11,956
|
|
|||
|
Retained earnings
|
25,461
|
|
20,701
|
|
|||
|
Accumulated other comprehensive income
|
753
|
|
866
|
|
|||
|
Total Qualcomm stockholders’ equity
|
36,088
|
|
33,523
|
|
|||
|
Noncontrolling interests
|
(1
|
)
|
22
|
|
|||
|
Total stockholders’ equity
|
36,087
|
|
33,545
|
|
|||
|
Total liabilities and stockholders’ equity
|
$
|
45,516
|
|
$
|
43,012
|
|
|
See accompanying notes.
F-
2
QUALCOMM Incorporated
(In millions, except per share data)
|
|
Year Ended
|
||||||||||
|
|
September 29, 2013
|
September 30, 2012
|
September 25, 2011
|
||||||||
|
Revenues:
|
|
|
|
||||||||
|
Equipment and services
|
$
|
16,988
|
|
$
|
12,465
|
|
$
|
9,223
|
|
||
|
Licensing
|
7,878
|
|
6,656
|
|
5,734
|
|
|||||
|
Total revenues
|
24,866
|
|
19,121
|
|
14,957
|
|
|||||
|
Costs and expenses:
|
|
|
|
||||||||
|
Cost of equipment and services revenues
|
9,820
|
|
7,096
|
|
4,877
|
|
|||||
|
Research and development
|
4,967
|
|
3,915
|
|
2,995
|
|
|||||
|
Selling, general and administrative
|
2,518
|
|
2,270
|
|
1,945
|
|
|||||
|
Other (Note 2 and 7)
|
331
|
|
158
|
|
114
|
|
|||||
|
Total costs and expenses
|
17,636
|
|
13,439
|
|
9,931
|
|
|||||
|
Operating income
|
7,230
|
|
5,682
|
|
5,026
|
|
|||||
|
Investment income, n
et (Note 3)
|
964
|
|
880
|
|
661
|
|
|||||
|
Income from continuing operations before income taxes
|
8,194
|
|
6,562
|
|
5,687
|
|
|||||
|
Income tax expense
|
(1,349
|
)
|
(1,279
|
)
|
(1,132
|
)
|
|||||
|
Income from continuing operations
|
6,845
|
|
5,283
|
|
4,555
|
|
|||||
|
Discontinued operations, net of income taxes (Note 11)
|
—
|
|
776
|
|
(313
|
)
|
|||||
|
Net income
|
6,845
|
|
6,059
|
|
4,242
|
|
|||||
|
Net loss attributable to noncontrolling interests
|
8
|
|
50
|
|
18
|
|
|||||
|
Net income attributable to Qualcomm
|
$
|
6,853
|
|
$
|
6,109
|
|
$
|
4,260
|
|
||
|
Basic earnings (loss) per share attributable to Qualcomm:
|
|||||||||||
|
Continuing operations
|
$
|
3.99
|
|
$
|
3.14
|
|
$
|
2.76
|
|
||
|
Discontinued operations
|
—
|
|
0.45
|
|
(0.19
|
)
|
|||||
|
Net income
|
$
|
3.99
|
|
$
|
3.59
|
|
$
|
2.57
|
|
||
|
Diluted earnings (loss) per share attributable to Qualcomm:
|
|||||||||||
|
Continuing operations
|
$
|
3.91
|
|
$
|
3.06
|
|
$
|
2.70
|
|
||
|
Discontinued operations
|
—
|
|
0.45
|
|
(0.18
|
)
|
|||||
|
Net income
|
$
|
3.91
|
|
$
|
3.51
|
|
$
|
2.52
|
|
||
|
Shares used in per share calculations:
|
|
|
|
||||||||
|
Basic
|
1,715
|
|
1,700
|
|
1,658
|
|
|||||
|
Diluted
|
1,754
|
|
1,741
|
|
1,691
|
|
|||||
|
Dividends per share announced
|
$
|
1.20
|
|
$
|
0.93
|
|
$
|
0.81
|
|
||
See accompanying notes.
F-
3
QUALCOMM Incorporated
CONSOLIDATED STATEMENTS OF COMPREHENSIVE INCOME
(In millions)
|
Year Ended
|
|||||||||||
|
September 29,
2013 |
September 30,
2012 |
September 25,
2011 |
|||||||||
|
Net income
|
$
|
6,845
|
|
$
|
6,059
|
|
$
|
4,242
|
|
||
|
Other comprehensive (loss) income, net of income taxes:
|
|
|
|
||||||||
|
Foreign currency translation
|
(20
|
)
|
(19
|
)
|
(9
|
)
|
|||||
|
Reclassification of foreign currency translation losses included in net income
|
11
|
|
—
|
|
—
|
|
|||||
|
Noncredit other-than-temporary impairment losses and subsequent changes in fair value related to certain available-for-sale debt securities, net of income taxes of $0, $1 and $10, respectively
|
(1
|
)
|
4
|
|
(19
|
)
|
|||||
|
Reclassification of net other-than-temporary losses on available-for-sale securities included in net income, net of income taxes of $26, $26 and $14, respectively
|
47
|
|
47
|
|
25
|
|
|||||
|
Net unrealized gains (losses) on other available-for-sale securities and derivative instruments, net of income taxes of $24, $357 and $80, respectively
|
44
|
|
652
|
|
(145
|
)
|
|||||
|
Reclassification of net realized gains on available-for-sale securities and derivative instruments included in net income, net of income taxes of $107, $93 and $112, respectively
|
(195
|
)
|
(169
|
)
|
(199
|
)
|
|||||
|
Total other comprehensive (loss) income
|
(114
|
)
|
515
|
|
(347
|
)
|
|||||
|
Total comprehensive income
|
6,731
|
|
6,574
|
|
3,895
|
|
|||||
|
Comprehensive loss attributable to noncontrolling interests
|
9
|
|
46
|
|
21
|
|
|||||
|
Comprehensive income attributable to Qualcomm
|
$
|
6,740
|
|
$
|
6,620
|
|
$
|
3,916
|
|
||
See accompanying notes.
F-
4
QUALCOMM Incorporated
(In millions)
|
|
Year Ended
|
||||||||||
|
|
September 29, 2013
|
September 30, 2012
|
September 25, 2011
|
||||||||
|
Operating Activities:
|
|
|
|
||||||||
|
Net income
|
$
|
6,845
|
|
$
|
6,059
|
|
$
|
4,242
|
|
||
|
Adjustments to reconcile net income to net cash provided by operating activities:
|
|
|
|
||||||||
|
Depreciation and amortization expense
|
1,017
|
|
897
|
|
1,061
|
|
|||||
|
Gain on sale of wireless spectrum
|
—
|
|
(1,179
|
)
|
—
|
|
|||||
|
Goodwill and long-lived asset impairment charges
|
192
|
|
84
|
|
128
|
|
|||||
|
Revenues related to non-monetary exchanges
|
(123
|
)
|
(122
|
)
|
(123
|
)
|
|||||
|
Income tax provision in excess of (less than) income tax payments
|
268
|
|
395
|
|
(1,204
|
)
|
|||||
|
Non-cash portion of share-based compensation expense
|
1,105
|
|
1,035
|
|
824
|
|
|||||
|
Incremental tax benefit from share-based compensation
|
(231
|
)
|
(168
|
)
|
(183
|
)
|
|||||
|
Net realized gains on marketable securities and other investments
|
(369
|
)
|
(369
|
)
|
(337
|
)
|
|||||
|
Net impairment losses on marketable securities and other investments
|
85
|
|
83
|
|
52
|
|
|||||
|
Other items, net
|
104
|
|
(52
|
)
|
(2
|
)
|
|||||
|
Changes in assets and liabilities, net of effects of acquisitions:
|
|
|
|
||||||||
|
Accounts receivable, net
|
(680
|
)
|
(456
|
)
|
(140
|
)
|
|||||
|
Inventories
|
(300
|
)
|
(252
|
)
|
(62
|
)
|
|||||
|
Other assets
|
(209
|
)
|
(240
|
)
|
(70
|
)
|
|||||
|
Trade accounts payable
|
307
|
|
371
|
|
(26
|
)
|
|||||
|
Payroll, benefits and other liabilities
|
752
|
|
(341
|
)
|
572
|
|
|||||
|
Unearned revenues
|
15
|
|
253
|
|
168
|
|
|||||
|
Net cash provided by operating activities
|
8,778
|
|
5,998
|
|
4,900
|
|
|||||
|
Investing Activities:
|
|
|
|
||||||||
|
Capital expenditures
|
(1,048
|
)
|
(1,284
|
)
|
(593
|
)
|
|||||
|
Purchases of available-for-sale securities
|
(13,951
|
)
|
(15,511
|
)
|
(10,948
|
)
|
|||||
|
Proceeds from sales and maturities of available-for-sale securities
|
13,494
|
|
9,858
|
|
10,661
|
|
|||||
|
Purchases of trading securities
|
(3,312
|
)
|
(4,009
|
)
|
—
|
|
|||||
|
Proceeds from sales and maturities of trading securities
|
3,367
|
|
3,060
|
|
—
|
|
|||||
|
Proceeds from sale of wireless spectrum
|
—
|
|
1,925
|
|
—
|
|
|||||
|
Acquisitions and other investments, net of cash acquired
|
(192
|
)
|
(833
|
)
|
(3,624
|
)
|
|||||
|
Other items, net
|
64
|
|
(83
|
)
|
15
|
|
|||||
|
Net cash used by investing activities
|
(1,578
|
)
|
(6,877
|
)
|
(4,489
|
)
|
|||||
|
Financing Activities:
|
|
|
|
||||||||
|
Borrowings under loans and debentures
|
534
|
|
710
|
|
1,555
|
|
|||||
|
Repayments of loans and debentures
|
(439
|
)
|
(591
|
)
|
(1,555
|
)
|
|||||
|
Proceeds from issuance of common stock
|
1,525
|
|
1,714
|
|
2,647
|
|
|||||
|
Incremental tax benefit from share-based compensation
|
231
|
|
168
|
|
183
|
|
|||||
|
Repurchases and retirements of common stock
|
(4,610
|
)
|
(1,313
|
)
|
(142
|
)
|
|||||
|
Dividends paid
|
(2,055
|
)
|
(1,583
|
)
|
(1,346
|
)
|
|||||
|
Other items, net
|
(31
|
)
|
138
|
|
176
|
|
|||||
|
Net cash (used) provided by financing activities
|
(4,845
|
)
|
(757
|
)
|
1,518
|
|
|||||
|
Changes in cash and cash equivalents held for sale
|
(15
|
)
|
—
|
|
—
|
|
|||||
|
Effect of exchange rate changes on cash
|
(5
|
)
|
(19
|
)
|
(14
|
)
|
|||||
|
Net increase (decrease) in cash and cash equivalents
|
2,335
|
|
(1,655
|
)
|
1,915
|
|
|||||
|
Cash and cash equivalents at beginning of year
|
3,807
|
|
5,462
|
|
3,547
|
|
|||||
|
Cash and cash equivalents at end of year
|
$
|
6,142
|
|
$
|
3,807
|
|
$
|
5,462
|
|
||
See accompanying notes.
F-
5
QUALCOMM Incorporated
CONSOLIDATED STATEMENTS OF STOCKHOLDERS’ EQUITY
(In millions)
|
Common
Stock
Shares
|
Paid-In
Capital
|
Retained
Earnings
|
Accumulated
Other
Comprehensive
Income
|
Total Qualcomm Stockholders’ Equity
|
Noncontrolling Interests
|
Total
Stockholders’
Equity
|
||||||||||||||||||||
|
Balance at September 26, 2010
|
1,612
|
|
$
|
6,856
|
|
$
|
13,305
|
|
$
|
697
|
|
$
|
20,858
|
|
$
|
—
|
|
$
|
20,858
|
|
||||||
|
Total comprehensive income (1)
|
—
|
|
—
|
|
4,260
|
|
(344
|
)
|
3,916
|
|
(21
|
)
|
3,895
|
|
||||||||||||
|
Common stock issued under employee benefit plans and the related tax benefits
|
72
|
|
2,720
|
|
—
|
|
—
|
|
2,720
|
|
—
|
|
2,720
|
|
||||||||||||
|
Repurchase and retirement of common stock
|
(3
|
)
|
(142
|
)
|
—
|
|
—
|
|
(142
|
)
|
—
|
|
(142
|
)
|
||||||||||||
|
Share-based compensation
|
—
|
|
848
|
|
—
|
|
—
|
|
848
|
|
—
|
|
848
|
|
||||||||||||
|
Dividends
|
—
|
|
—
|
|
(1,361
|
)
|
—
|
|
(1,361
|
)
|
—
|
|
(1,361
|
)
|
||||||||||||
|
Value of stock awards assumed in acquisition
|
—
|
|
106
|
|
—
|
|
—
|
|
106
|
|
—
|
|
106
|
|
||||||||||||
|
Issuance of subsidiary shares to noncontrolling interests
|
—
|
|
14
|
|
—
|
|
—
|
|
14
|
|
42
|
|
56
|
|
||||||||||||
|
Other
|
—
|
|
(8
|
)
|
—
|
|
—
|
|
(8
|
)
|
—
|
|
(8
|
)
|
||||||||||||
|
Balance at September 25, 2011
|
1,681
|
|
10,394
|
|
16,204
|
|
353
|
|
26,951
|
|
21
|
|
26,972
|
|
||||||||||||
|
Total comprehensive income (1)
|
—
|
|
—
|
|
6,109
|
|
511
|
|
6,620
|
|
(46
|
)
|
6,574
|
|
||||||||||||
|
Common stock issued under employee benefit plans and the related tax benefits, net of shares withheld for tax
|
49
|
|
1,772
|
|
—
|
|
—
|
|
1,772
|
|
—
|
|
1,772
|
|
||||||||||||
|
Repurchase and retirement of common stock
|
(24
|
)
|
(1,313
|
)
|
—
|
|
—
|
|
(1,313
|
)
|
—
|
|
(1,313
|
)
|
||||||||||||
|
Share-based compensation
|
—
|
|
1,062
|
|
—
|
|
—
|
|
1,062
|
|
—
|
|
1,062
|
|
||||||||||||
|
Dividends
|
—
|
|
—
|
|
(1,612
|
)
|
—
|
|
(1,612
|
)
|
—
|
|
(1,612
|
)
|
||||||||||||
|
Issuance of subsidiary shares to noncontrolling interests
|
—
|
|
44
|
|
—
|
|
2
|
|
46
|
|
40
|
|
86
|
|
||||||||||||
|
Other
|
—
|
|
(3
|
)
|
—
|
|
—
|
|
(3
|
)
|
7
|
|
4
|
|
||||||||||||
|
Balance at September 30, 2012
|
1,706
|
|
11,956
|
|
20,701
|
|
866
|
|
33,523
|
|
22
|
|
33,545
|
|
||||||||||||
|
Total comprehensive income
|
—
|
|
—
|
|
6,853
|
|
(113
|
)
|
6,740
|
|
(9
|
)
|
6,731
|
|
||||||||||||
|
Common stock issued under employee benefit plans and the related tax benefits, net of shares withheld for tax
|
51
|
|
1,385
|
|
—
|
|
—
|
|
1,385
|
|
—
|
|
1,385
|
|
||||||||||||
|
Repurchase and retirement of common stock
|
(72
|
)
|
(4,610
|
)
|
—
|
|
—
|
|
(4,610
|
)
|
—
|
|
(4,610
|
)
|
||||||||||||
|
Share-based compensation
|
—
|
|
1,142
|
|
—
|
|
—
|
|
1,142
|
|
—
|
|
1,142
|
|
||||||||||||
|
Dividends
|
—
|
|
—
|
|
(2,093
|
)
|
—
|
|
(2,093
|
)
|
—
|
|
(2,093
|
)
|
||||||||||||
|
Issuance of subsidiary shares to noncontrolling interests
|
—
|
|
2
|
|
—
|
|
—
|
|
2
|
|
9
|
|
11
|
|
||||||||||||
|
Deconsolidation of subsidiaries
|
—
|
|
—
|
|
—
|
|
—
|
|
—
|
|
(23
|
)
|
(23
|
)
|
||||||||||||
|
Other
|
—
|
|
(1
|
)
|
—
|
|
—
|
|
(1
|
)
|
—
|
|
(1
|
)
|
||||||||||||
|
Balance at September 29, 2013
|
1,685
|
|
$
|
9,874
|
|
$
|
25,461
|
|
$
|
753
|
|
$
|
36,088
|
|
$
|
(1
|
)
|
$
|
36,087
|
|
||||||
|
(1)
|
Income (loss) from discontinued operations, net of income taxes (Note 11), was attributable to Qualcomm.
|
See accompanying notes.
F-
6
QUALCOMM Incorporated
NOTES TO CONSOLIDATED FINANCIAL STATEMENTS
The Company.
QUALCOMM Incorporated, a Delaware corporation, and its subsidiaries (collectively the Company or Qualcomm), develop, design, manufacture and market digital communications products and services. The Company is a leading developer and supplier of integrated circuits and system software based on CDMA (Code Division Multiple Access), OFDMA (Orthogonal Frequency Division Multiple Access) and other technologies for use in voice and data communications, networking, application processing, multimedia and global positioning system products to device and infrastructure manufacturers. The Company grants licenses to use portions of its intellectual property portfolio, which includes certain patent rights essential to and/or useful in the manufacture and sale of certain wireless products, and receives fixed license fees (payable in one or more installments) as well as ongoing royalties based on sales by licensees of wireless telecommunications equipment products incorporating its patented technologies. The Company sells equipment, software and services to transportation and other companies to wirelessly connect their assets and workforce. The Company provides software products and services for content enablement across a wide variety of platforms and devices for the wireless industry. The Company also makes strategic investments to support the global adoption of its technologies and services.
Principles of Consolidation.
The Company’s consolidated financial statements include the assets, liabilities and operating results of majority-owned subsidiaries. In addition, the Company consolidates its investments in certain immaterial less than majority-owned variable interest entities as the Company is the primary beneficiary. The ownership of the other interest holders of consolidated subsidiaries and the variable interest entities is presented separately in the consolidated balance sheets and statements of operations. All significant intercompany accounts and transactions have been eliminated. Certain of the Company’s consolidated subsidiaries are included in the consolidated financial statements one month in arrears to facilitate the timely inclusion of such entities in the Company’s consolidated financial statements.
Financial Statement Preparation.
The preparation of financial statements in conformity with accounting principles generally accepted in the United States requires management to make estimates and assumptions that affect the reported amounts and the disclosure of contingent amounts in the Company’s consolidated financial statements and the accompanying notes. Actual results could differ from those estimates. Certain prior year amounts have been reclassified to conform to the current year presentation.
Fiscal Year.
The Company operates and reports using a 52-53 week fiscal year ending on the last Sunday in September. The fiscal years ended
September 29, 2013
and
September 25, 2011
included
52 weeks
. The fiscal year ended
September 30, 2012
included
53 weeks
.
Cash Equivalents.
The Company considers all highly liquid investments with original maturities of three months or less to be cash equivalents. Cash equivalents are comprised of money market funds, commercial paper, government agencies’ securities and certain bank time deposits. The carrying amounts approximate fair value due to the short maturities of these instruments.
Marketable Securities.
Marketable securities include trading securities, available-for-sale securities, securities for which the Company has elected the fair value option and certain bank time deposits. The classification of marketable securities within these categories is determined at the time of purchase and reevaluated at each balance sheet date. The Company classifies portfolios of debt securities that utilize derivative instruments to acquire or reduce foreign exchange and/or equity, prepayment and credit risk as trading. The Company classifies marketable securities as current or noncurrent based on the nature of the securities and their availability for use in current operations. Marketable securities are stated at fair value. The net unrealized gains or losses on available-for-sale securities are recorded as a component of accumulated other comprehensive income, net of income taxes. The unrealized gains or losses on trading securities and securities for which the Company has elected the fair value option are recognized in net investment income. The realized gains and losses on marketable securities are determined using the specific identification method.
At each balance sheet date, the Company assesses available-for-sale securities in an unrealized loss position to determine whether the unrealized loss is other than temporary. The Company considers factors including: the significance of the decline in value compared to the cost basis; underlying factors contributing to a decline in the prices of securities in a single asset class; how long the market value of the security has been less than its cost basis; the security’s relative performance versus its peers, sector or asset class; expected market volatility, the market and economy in general; analyst recommendations and price targets; views of external investment managers; news or financial information that has been released specific to the investee; and the outlook for the overall industry in which the investee operates.
If a debt security’s market value is below amortized cost and the Company either intends to sell the security or it is more likely than not that the Company will be required to sell the security before its anticipated recovery, the Company records an
F-
7
QUALCOMM Incorporated
NOTES TO CONSOLIDATED FINANCIAL STATEMENTS
other-than-temporary impairment charge to net investment income for the entire amount of the impairment. For the remaining debt securities, if an other-than-temporary impairment exists, the Company separates the other-than-temporary impairment into the portion of the loss related to credit factors, or the credit loss portion, and the portion of the loss that is not related to credit factors, or the noncredit loss portion. The credit loss portion is the difference between the amortized cost of the security and the Company’s best estimate of the present value of the cash flows expected to be collected from the debt security. The noncredit loss portion is the residual amount of the other-than-temporary impairment. The credit loss portion is recorded as a charge to net investment income, and the noncredit loss portion is recorded as a component of other accumulated comprehensive income, net of income taxes.
When calculating the present value of expected cash flows to determine the credit loss portion of the other-than-temporary impairment, the Company estimates the amount and timing of projected cash flows, the probability of default and the timing and amount of recoveries on a security-by-security basis. These calculations use inputs primarily based on observable market data, such as credit default swap spreads, historical default and recovery statistics, rating agency data, credit ratings and other data relevant to analyzing the collectibility of the security. The amortized cost basis of a debt security is adjusted for any credit loss portion of the impairment recorded to earnings. The difference between the new cost basis and cash flows expected to be collected is accreted to net investment income over the remaining expected life of the security.
Securities that are accounted for as equity securities include investments in common stock, certain preferred stock, equity mutual and exchange-traded funds and debt funds. For equity securities, the Company considers the loss relative to the expected volatility and the likelihood of recovery over a reasonable period of time. If events and circumstances indicate that a decline in the value of an equity security has occurred and is other than temporary, the Company records a charge to net investment income for the difference between fair value and cost at the balance sheet date. Additionally, if the Company has either the intent to sell the equity security or does not have both the intent and the ability to hold the equity security until its anticipated recovery, the Company records a charge to net investment income for the difference between fair value and cost at the balance sheet date.
Derivatives.
The Company’s primary objective for holding derivative instruments is to manage foreign exchange risk for certain foreign currency revenue and operating expenditure transactions. To a lesser extent, the Company also holds derivative instruments in its investment portfolios to manage risk by acquiring or reducing foreign exchange risk, interest rate risk and/or equity, prepayment and credit risk. The Company also uses derivative instruments as part of its stock repurchase program.
Foreign Currency Hedges:
The Company manages its exposure to foreign exchange market risks, when deemed appropriate, through the use of derivative instruments, including foreign currency forward and option contracts with financial counterparties. We utilize such derivative financial instruments for hedging or risk management purposes rather than for speculation purposes. Counterparties to the Company’s derivative instruments are all major institutions. The derivative instruments mature between
4
and
28 months
. Derivative instruments are recorded at fair value and are included in other current assets, noncurrent assets, other accrued liabilities or other noncurrent liabilities based on their maturity date. Gains and losses arising from the effective portion of foreign currency forward and option contracts that are designated as cash flow hedging instruments are recorded as a component of accumulated other comprehensive income as gains and losses on derivative instruments, net of income taxes. The hedging gains and losses in accumulated other comprehensive income are subsequently reclassified to revenues or costs and expenses, as applicable, in the consolidated statements of operations in the same period in which the underlying transactions affect the Company’s earnings. Gains and losses arising from the ineffective portion of foreign currency forward and option contracts are recorded in net investment income as gains and losses on derivative instruments. The cash flows associated with derivative instruments designated as cash flow or net investment hedging instruments are classified as cash flows from operating activities in the consolidated statements of cash flows, which is the same category as the hedged transaction. The cash flows associated with the ineffective portion of derivatives are classified as cash flows from investing activities in the consolidated statements of cash flows.
The aggregate fair value of the Company’s foreign currency option and forward contracts used to hedge foreign currency risk recorded in total assets was
$38 million
and
$11 million
at
September 29, 2013
and
September 30, 2012
, respectively, and the fair value recorded in total liabilities was
$9 million
and
$6 million
at
September 29, 2013
and
September 30, 2012
, respectively, all of which were designated as cash flow hedging instruments.
Investment Portfolio Derivatives:
The Company also utilizes currency forwards, futures, options and swaps that are not designated as hedging instruments to acquire or reduce foreign exchange risk, interest rate risk and/or equity, prepayment and credit risk in its marketable securities investment portfolios classified as trading. The derivative instruments mature over various periods up to
29 years
. Gains and losses arising from changes in the fair values of such contracts are recorded in net investment income as gains and losses on derivative instruments. The cash flows associated with such derivative instruments are classified as cash flows from investing activities in the consolidated statements of cash flows. At
September 29, 2013
, the
F-
8
QUALCOMM Incorporated
NOTES TO CONSOLIDATED FINANCIAL STATEMENTS
fair value of these derivative instruments recorded in total assets was negligible. At
September 30, 2012
, the fair value of these derivative instruments recorded in total assets was
$5 million
. At
September 29, 2013
and
September 30, 2012
, the fair value of these derivative instruments recorded in total liabilities was
$14 million
and
$5 million
, respectively.
Gross Notional Amounts.
The gross notional amounts of the Company's foreign currency and investment portfolio derivatives by instrument type were as follows (in millions):
|
September 29, 2013
|
September 30, 2012
|
||||||
|
Options
|
$
|
609
|
|
$
|
1,093
|
|
|
|
Currency forwards
|
544
|
|
468
|
|
|||
|
Futures
|
106
|
|
115
|
|
|||
|
Swaps
|
18
|
|
190
|
|
|||
|
Other
|
—
|
|
4
|
|
|||
|
|
$
|
1,277
|
|
$
|
1,870
|
|
|
The gross notional amounts by currency were as follows (in millions):
|
September 29, 2013
|
September 30, 2012
|
||||||
|
Japanese yen
|
$
|
617
|
|
$
|
687
|
|
|
|
Indian rupee
|
205
|
|
119
|
|
|||
|
Euro
|
161
|
|
312
|
|
|||
|
United States dollar
|
108
|
|
375
|
|
|||
|
Canadian dollar
|
62
|
|
105
|
|
|||
|
British pound sterling
|
46
|
|
110
|
|
|||
|
Australian dollar
|
11
|
|
126
|
|
|||
|
Other
|
67
|
|
36
|
|
|||
|
|
$
|
1,277
|
|
$
|
1,870
|
|
|
Stock Repurchase Program:
In connection with the Company’s stock repurchase program, the Company may sell put options that require it to repurchase shares of its common stock at fixed prices. These put options subject the Company to equity price risk. Changes in the fair value of these put options are recorded in net investment income as gains and losses on derivative instruments. The cash flows associated with the put options are classified as cash flows from investing activities in the consolidated statements of cash flows. There were no put options outstanding at
September 29, 2013
and
September 30, 2012
.
Allowances for Doubtful Accounts.
The Company maintains allowances for doubtful accounts for estimated losses resulting from the inability of the Company’s customers to make required payments. The Company considers the following factors when determining if collection of required payments is reasonably assured: customer credit-worthiness, past transaction history with the customer, current economic industry trends, changes in customer payment terms, and bank credit-worthiness for letters of credit. If the Company has no previous experience with the customer, the Company typically obtains reports from various credit organizations to determine that the customer has a history of paying its creditors. The Company may also request financial information, including financial statements or other documents to determine that the customer has the means of making payment. If these factors do not indicate collection is reasonably assured, revenue is deferred until collection becomes reasonably assured, which is generally upon receipt of cash. If the financial condition of the Company’s customers was to deteriorate, adversely affecting their ability to make payments, additional allowances would be required.
Inventories.
Inventories are valued at the lower of cost or market (replacement cost, not to exceed net realizable value) using the first-in, first-out method. Recoverability of inventories is assessed based on review of committed purchase orders from customers, as well as purchase commitment projections provided by customers, among other things.
Property, Plant and Equipment.
Property, plant and equipment are recorded at cost and depreciated or amortized using the straight-line method over their estimated useful lives. Upon the retirement or disposition of property, plant and equipment, the related cost and accumulated depreciation or amortization are removed, and a gain or loss is recorded. Buildings and building improvements on owned land are depreciated over
30
years and
15
years, respectively. Leasehold improvements and buildings
F-
9
QUALCOMM Incorporated
NOTES TO CONSOLIDATED FINANCIAL STATEMENTS
on leased land are amortized over the shorter of their estimated useful lives, not to exceed
15
and
30
years, respectively, or the remaining term of the related lease. Other property, plant and equipment have useful lives ranging from
2
to
25
years. Direct external and internal costs of developing software for internal use are capitalized subsequent to the preliminary stage of development. Leased property meeting certain capital lease criteria is capitalized, and the net present value of the related lease payments is recorded as a liability. Amortization of assets under capital leases is recorded using the straight-line method over the shorter of the estimated useful lives or the lease terms. Maintenance, repairs and minor renewals or betterments are charged to expense as incurred. Interest expense related to the broadband wireless access (BWA) spectrum and related construction of the network infrastructure assets in India by the Company’s former BWA subsidiaries was capitalized beginning in May 2012 through the third quarter of fiscal 2013 when the BWA subsidiaries were deconsolidated (Note 10). Interest capitalized by the former BWA subsidiaries totaled
$65 million
and
$29 million
in fiscal
2013
and 2012, respectively.
Goodwill and Other Intangible Assets.
Goodwill represents the excess of purchase price over the value assigned to the net tangible and identifiable intangible assets of businesses acquired. Acquired intangible assets other than goodwill are amortized over their useful lives unless the lives are determined to be indefinite. For intangible assets purchased in a business combination, the estimated fair values of the assets received are used to establish their recorded values. For intangible assets acquired in a non-monetary exchange, the estimated fair values of the assets transferred (or the estimated fair values of the assets received, if more clearly evident) are used to establish their recorded values, unless the values of neither the assets received nor the assets transferred are determinable within reasonable limits, in which case the assets received are measured based on the carrying values of the assets transferred. Valuation techniques consistent with the market approach, income approach and/or cost approach are used to measure fair value.
Weighted-average amortization periods for finite-lived intangible assets, by class, were as follows (in years):
|
|
September 29, 2013
|
September 30, 2012
|
|
|
Wireless spectrum
|
14
|
5
|
|
|
Marketing-related
|
9
|
9
|
|
|
Technology-based
|
11
|
11
|
|
|
Customer-related
|
2
|
6
|
|
|
Total finite-lived intangible assets
|
11
|
11
|
|
Impairment of Goodwill and Other Long-Lived Assets.
Goodwill and other indefinite-lived intangible assets are tested annually for impairment in the fourth fiscal quarter and in interim periods if certain events occur indicating that the carrying amounts may be impaired. If a qualitative assessment is used and the Company determines that the fair value of a reporting unit or indefinite-lived intangible asset is more likely than not (i.e., a likelihood of more than 50%) less than its carrying amount, a quantitative impairment test will be performed. If goodwill is quantitatively assessed for impairment, a two-step approach is applied. First, the Company compares the estimated fair value of the reporting unit in which the goodwill resides to its carrying value. The second step, if necessary, measures the amount of such impairment by comparing the implied fair value of goodwill to its carrying value. Other indefinite-lived intangible assets are quantitatively assessed for impairment, if necessary, by comparing their estimated fair values to their carrying values. If the carrying value exceeds the fair value, the difference is recorded as an impairment.
Long-lived assets, such as property, plant and equipment and intangible assets subject to amortization, are reviewed for impairment when there is evidence that events or changes in circumstances indicate that the carrying amount of an asset or asset group may not be recoverable. Recoverability of assets to be held and used is measured by comparing the carrying amount of an asset or asset group to estimated undiscounted future cash flows expected to be generated by the asset or asset group. If the carrying amount of an asset or asset group exceeds its estimated future cash flows, an impairment charge is recognized for the amount by which the carrying amount of the asset or asset group exceeds the estimated fair value of the asset or asset group. Long-lived assets to be disposed of by sale are reported at the lower of their carrying amounts or their estimated fair values less costs to sell and are not depreciated.
Revenue Recognition.
The Company derives revenues principally from sales of integrated circuit products, licensing of its intellectual property and software, and sales of messaging, software hosting, software development and other services and related hardware. The timing of revenue recognition and the amount of revenue actually recognized in each case depends upon a variety of factors, including the specific terms of each arrangement and the nature of the Company’s deliverables and obligations.
F-
10
QUALCOMM Incorporated
NOTES TO CONSOLIDATED FINANCIAL STATEMENTS
Revenues from sales of the Company’s products are recognized at the time of shipment, or when title and risk of loss pass to the customer and other criteria for revenue recognition are met, if later. Revenues from providing services, including software hosting services, are recognized when earned. Revenues from providing services were
less than 10%
of total revenues for all periods presented.
The Company licenses or otherwise provides rights to use portions of its intellectual property portfolio, which includes certain patent rights essential to and/or useful in the manufacture and sale of certain wireless products. Licensees typically pay a fixed license fee in one or more installments and royalties based on their sales of products incorporating or using the Company’s licensed intellectual property. License fees are recognized over the estimated period of benefit of the license to the licensee, typically
5 to 15 years
. The Company earns royalties on such licensed products sold worldwide by its licensees at the time that the licensees’ sales occur. The Company’s licensees, however, do not report and pay royalties owed for sales in any given quarter until after the conclusion of that quarter. The Company recognizes royalty revenues based on royalties reported by licensees during the quarter and when other revenue recognition criteria are met.
The Company records reductions to revenues for customer incentive arrangements, including volume-related and other pricing rebates and cost reimbursements for marketing and other activities involving certain of the Company’s products and technologies. The Company recognizes the maximum potential liability at the later of the date at which the Company records the related revenues or the date at which the Company offers the incentive or, if payment is contingent, when the contingency is resolved. In certain arrangements, the liabilities are based on customer forecasts. The Company reverses accruals for unclaimed incentive amounts to revenues when the unclaimed amounts are no longer subject to payment.
Unearned revenues consist primarily of license fees for intellectual property and software product sales with continuing performance obligations.
Concentrations.
A significant portion of the Company’s revenues is concentrated with a small number of customers/licensees of the Company
’
s QCT and QTL segments. Revenues related to the products of
two
companies comprised
24%
and
19%
of total consolidated revenues in fiscal
2013
and
20%
and
18%
of total consolidated revenues in fiscal 2012. Revenues from
two
companies each comprised
13%
of total consolidated revenues in fiscal
2011
. Aggregate accounts receivable from
two
customers/licensees comprised
43%
of gross accounts receivable at
September 29, 2013
. Aggregate accounts receivable from
three
customers/licensees comprised
48%
of gross accounts receivable at
September 30, 2012
.
Shipping and Handling Costs.
Costs incurred for shipping and handling are included in cost of equipment and services revenues at the time the related revenue is recognized. Amounts billed to a customer for shipping and handling are reported as revenue.
Share-Based Compensation.
Share-based compensation expense for equity-classified awards, principally related to restricted stock units (RSUs) and stock options, is measured at the grant date, or at the acquisition date for awards assumed in business combinations, based on the estimated fair value of the award and is recognized over the employee’s requisite service period. Share-based compensation expense is adjusted to exclude amounts related to share-based awards that are expected to be forfeited.
The fair values of RSUs are estimated based on the fair market values of the underlying stock on the dates of grant or dates the RSUs are assumed. If RSUs do not have the right to participate in dividends, the fair values are discounted by the dividend yield. The weighted-average estimated fair values of employee RSUs granted during fiscal
2013
,
2012
and
2011
were
$64.21
,
$58.57
and
$50.14
per share, respectively. For the majority of RSUs, shares are issued on the vesting dates net of the amount of shares needed to satisfy statutory tax withholding requirements to be paid by the Company on behalf of the employees. As a result, the actual number of shares issued will be fewer than the number of RSUs outstanding. The annual pre-vest forfeiture rate for RSUs granted in fiscal
2013
,
2012
and
2011
was estimated to be approximately
3%
based on historical experience.
The fair values of employee stock options granted are estimated using the lattice binomial option-pricing model, and the fair values of employee stock options assumed in business combinations are estimated using the Black-Scholes option-pricing model. No stock options were granted or assumed during fiscal 2013. The weighted-average estimated fair values of employee stock options granted during fiscal
2012
and
2011
were
$14.70
and
$13.17
per share, respectively. The following table presents the weighted-average assumptions (annualized) used to estimate the fair values of employee stock options granted or assumed in the periods presented:
F-
11
QUALCOMM Incorporated
NOTES TO CONSOLIDATED FINANCIAL STATEMENTS
|
2012
|
2011
|
||||
|
Volatility
|
31.5
|
%
|
30.8
|
%
|
|
|
Risk-free interest rate
|
1.0
|
%
|
2.1
|
%
|
|
|
Dividend yield
|
1.5
|
%
|
1.5
|
%
|
|
|
Post-vest forfeiture rate
|
9.0
|
%
|
9.8
|
%
|
|
|
Suboptimal exercise factor
|
1.7
|
|
1.8
|
|
|
The Company uses the implied volatility of market-traded options in the Company’s stock to determine the expected volatility. The term structure of volatility is used for approximately two years, and the Company uses the implied volatility of the option with the longest time to maturity for periods beyond
two years
. The risk-free interest rate is based on observed interest rates appropriate for the terms of the Company’s employee stock options. The Company does not target a specific dividend yield for its dividend payments but is required to assume a dividend yield as an input to the binomial model. The dividend yield is based on the Company’s history and expectation of future dividend payouts and may be subject to substantial change in the future. The post-vest forfeiture rate and suboptimal exercise factor are based on the Company’s historical option cancelation and employee exercise information, respectively.
The expected life of employee stock options is a derived output of the lattice binomial model and is impacted by all of the underlying assumptions used by the Company. The weighted-average expected life of employee stock options granted, as derived from the binomial model, was
5.3
years and
5.6
years during fiscal
2012
and
2011
, respectively.
Total share-based compensation expense, related to all of the Company’s share-based awards, was comprised as follows (in millions):
|
2013
|
2012
|
2011
|
|||||||||
|
Cost of equipment and services revenues
|
$
|
71
|
|
$
|
75
|
|
$
|
67
|
|
||
|
Research and development
|
643
|
|
546
|
|
397
|
|
|||||
|
Selling, general and administrative
|
391
|
|
414
|
|
349
|
|
|||||
|
Continuing operations
|
1,105
|
|
1,035
|
|
813
|
|
|||||
|
Related income tax benefit
|
(217
|
)
|
(225
|
)
|
(194
|
)
|
|||||
|
Continuing operations, net of income taxes
|
888
|
|
810
|
|
619
|
|
|||||
|
Discontinued operations
|
—
|
|
1
|
|
8
|
|
|||||
|
Related income tax benefit
|
—
|
|
—
|
|
(3
|
)
|
|||||
|
Discontinued operations, net of income taxes
|
—
|
|
1
|
|
5
|
|
|||||
|
$
|
888
|
|
$
|
811
|
|
$
|
624
|
|
|||
The Company recorded
$242 million
,
$270 million
and
$165 million
in share-based compensation expense during fiscal
2013
,
2012
and
2011
, respectively, related to share-based awards granted during those periods. The remaining share-based compensation expense was primarily related to share-based awards granted in earlier periods and share-based awards assumed. In addition, for fiscal
2013
,
2012
and
2011
,
$231 million
,
$168 million
and
$183 million
, respectively, were reclassified to reduce net cash provided by operating activities with an offset to net cash provided (used) by financing activities in the consolidated statements of cash flows to reflect the incremental tax benefits from stock options exercised and restricted stock units and other share-based awards that vested in those periods. The amount of compensation cost capitalized related to share-based awards was negligible for all periods presented.
Litigation.
The Company is currently involved in certain legal proceedings. The Company records its best estimate of a loss related to pending litigation when the loss is considered probable and the amount can be reasonably estimated. Where a range of loss can be reasonably estimated with no best estimate in the range, the Company records the minimum estimated liability related to the claim. As additional information becomes available, the Company assesses the potential liability related to the Company’s pending litigation and revises its estimates. The Company’s legal costs associated with defending itself are recorded to expense as incurred.
Foreign Currency.
Certain foreign subsidiaries use a local currency as the functional currency. Resulting translation gains or losses are recognized as a component of accumulated other comprehensive income.
F-
12
QUALCOMM Incorporated
NOTES TO CONSOLIDATED FINANCIAL STATEMENTS
Transaction gains or losses related to balances denominated in a currency other than the functional currency are recognized in the consolidated statements of operations. Net foreign currency transaction losses included in the Company’s consolidated statements of operations were
$4 million
,
$7 million
and
$8 million
for fiscal
2013
,
2012
and
2011
, respectively.
Income Taxes.
The asset and liability approach is used to recognize deferred tax assets and liabilities for the expected future tax consequences of temporary differences between the carrying amounts and the tax bases of assets and liabilities. Tax law and rate changes are reflected in income in the period such changes are enacted. The Company records a valuation allowance to reduce deferred tax assets to the amount that is more likely than not to be realized. The Company includes interest and penalties related to income taxes, including unrecognized tax benefits, within the income tax provision.
The Company’s income tax returns are based on calculations and assumptions that are subject to examination by the Internal Revenue Service and other tax authorities. In addition, the calculation of the Company’s tax liabilities involves dealing with uncertainties in the application of complex tax regulations. The Company recognizes liabilities for uncertain tax positions based on a two-step process. The first step is to evaluate the tax position for recognition by determining if the weight of available evidence indicates that it is more likely than not that the position will be sustained on audit, including resolution of related appeals or litigation processes, if any. The second step is to measure the tax benefit as the largest amount that is more than
50%
likely of being realized upon settlement. While the Company believes it has appropriate support for the positions taken on its tax returns, the Company regularly assesses the potential outcomes of examinations by tax authorities in determining the adequacy of its provision for income taxes. The Company continually assesses the likelihood and amount of potential adjustments and adjusts the income tax provision, income taxes payable and deferred taxes in the period in which the facts that give rise to a revision become known.
The Company recognizes windfall tax benefits associated with share-based awards directly to stockholders’ equity only when realized. A windfall tax benefit occurs when the actual tax benefit realized by the Company upon an employee’s disposition of a share-based award exceeds the deferred tax asset, if any, associated with the award that the Company had recorded. When assessing whether a tax benefit relating to share-based compensation has been realized, the Company follows the tax law ordering method, under which current year share-based compensation deductions are assumed to be utilized before net operating loss carryforwards and other tax attributes.
Earnings Per Common Share.
Basic earnings per common share are computed by dividing net income attributable to Qualcomm by the weighted-average number of common shares outstanding during the reporting period. Diluted earnings per common share are computed by dividing net income attributable to Qualcomm by the combination of dilutive common share equivalents, comprised of shares issuable under the Company’s share-based compensation plans and shares subject to written put options, and the weighted-average number of common shares outstanding during the reporting period. Dilutive common share equivalents include the dilutive effect of in-the-money share equivalents, which are calculated based on the average share price for each period using the treasury stock method. Under the treasury stock method, the exercise price of an award, if any, the amount of compensation cost for future service that the Company has not yet recognized, if any, and the estimated tax benefits that would be recorded in paid-in capital when an award is settled, if any, are assumed to be used to repurchase shares in the current period. The incremental dilutive common share equivalents, calculated using the treasury stock method, for fiscal
2013
,
2012
and
2011
were
38,670,000
,
40,978,000
and
32,908,000
, respectively.
Employee stock options to purchase
355,000
,
1,590,000
and
20,224,000
shares of common stock during fiscal
2013
,
2012
and
2011
, respectively, were outstanding but not included in the calculation of diluted earnings per common share because the effect would be anti-dilutive. Put options outstanding during fiscal 2012 and 2011 were not included in the earnings per common share computation because the put options’ exercise prices were less than the average market price of the common stock while they were outstanding, and therefore, the effect on diluted earnings per common share would be anti-dilutive. No put options were outstanding during fiscal 2013. In addition, other common stock equivalents of
152,000
,
1,947,000
and
1,963,000
shares outstanding during fiscal
2013
,
2012
and
2011
, respectively, were not included in the calculation of diluted earnings per common share because the effect would be anti-dilutive or certain performance conditions were not satisfied at the end of the period.
Comprehensive Income.
Comprehensive income is defined as the change in equity of a business enterprise during a period from transactions and other events and circumstances from non-owner sources, including foreign currency translation adjustments and unrealized gains and losses on marketable securities and derivative instruments. Other comprehensive income includes reclassification adjustments for: foreign currency translation gains and losses recognized in the statements of operations as a result of deconsolidation of subsidiaries; net realized gains and losses recognized in the statements of operations when marketable securities are sold or derivative instruments are settled; and unrealized losses on marketable securities recognized in the statements of operations when they are no longer viewed as temporary. The portion of other-than-temporary
F-
13
QUALCOMM Incorporated
NOTES TO CONSOLIDATED FINANCIAL STATEMENTS
impairment losses related to noncredit factors and subsequent changes in fair value included in comprehensive income are shown separately from other unrealized gains or losses on marketable securities.
The components of accumulated other comprehensive income in Qualcomm stockholders’ equity were as follows (in millions):
|
September 29, 2013
|
September 30, 2012
|
||||||
|
Foreign currency translation
|
$
|
(115
|
)
|
$
|
(107
|
)
|
|
|
Noncredit other-than-temporary impairment losses and subsequent changes in fair value related to certain available-for-sale debt securities, net of income taxes
|
25
|
|
29
|
|
|||
|
Net unrealized gains on other available-for-sale securities, net of income taxes
|
825
|
|
942
|
|
|||
|
Net unrealized gains on derivative instruments, net of income taxes
|
18
|
|
2
|
|
|||
|
|
$
|
753
|
|
$
|
866
|
|
|
At
September 29, 2013
and
September 30, 2012
, accumulated other comprehensive income included
$1 million
and $
7 million
, respectively, of other-than-temporary losses on marketable debt securities related to factors other than credit, net of income taxes.
Recent Accounting Pronouncements.
In February 2013, the Financial Accounting Standards Board (FASB) issued guidance on disclosure requirements for items reclassified out of accumulated other comprehensive income. This new guidance requires entities to present (either on the face of the statement of operations or in the notes to the financial statements) the effects on the line items in the statement of operations for amounts reclassified out of accumulated other comprehensive income. The new guidance will be effective for the Company beginning in the first quarter of fiscal 2014. The adoption of the guidance will impact the Company’s financial statement presentation and/or disclosure but will not impact its financial position, results of operations or cash flows.
|
Accounts Receivable (in millions)
|
September 29, 2013
|
September 30, 2012
|
|||||
|
Trade, net of allowances for doubtful accounts of $2 and $1, respectively
|
$
|
2,066
|
|
$
|
1,418
|
|
|
|
Long-term contracts
|
27
|
|
32
|
|
|||
|
Other
|
49
|
|
9
|
|
|||
|
|
$
|
2,142
|
|
$
|
1,459
|
|
|
|
Inventories (in millions)
|
September 29, 2013
|
September 30, 2012
|
|||||
|
Raw materials
|
$
|
2
|
|
$
|
19
|
|
|
|
Work-in-process
|
631
|
|
531
|
|
|||
|
Finished goods
|
669
|
|
480
|
|
|||
|
|
$
|
1,302
|
|
$
|
1,030
|
|
|
F-
14
QUALCOMM Incorporated
NOTES TO CONSOLIDATED FINANCIAL STATEMENTS
|
Property, Plant and Equipment (in millions)
|
September 29, 2013
|
September 30, 2012
|
|||||
|
Land
|
$
|
212
|
|
$
|
203
|
|
|
|
Buildings and improvements
|
1,733
|
|
1,392
|
|
|||
|
Computer equipment and software
|
1,425
|
|
1,409
|
|
|||
|
Machinery and equipment
|
2,013
|
|
1,828
|
|
|||
|
Furniture and office equipment
|
87
|
|
80
|
|
|||
|
Leasehold improvements
|
218
|
|
237
|
|
|||
|
Construction in progress
|
480
|
|
774
|
|
|||
|
|
6,168
|
|
5,923
|
|
|||
|
Less accumulated depreciation and amortization
|
(3,173
|
)
|
(3,072
|
)
|
|||
|
|
$
|
2,995
|
|
$
|
2,851
|
|
|
Depreciation and amortization expense related to property, plant and equipment for fiscal
2013
,
2012
and
2011
was
$515 million
,
$427 million
and
$704 million
, respectively. The gross book values of property under capital leases included in buildings and improvements were
$18 million
and
$64 million
at
September 29, 2013
and
September 30, 2012
, respectively. These capital leases principally related to base station towers and buildings.
At
September 29, 2013
, buildings and improvements and leasehold improvements that were leased to third parties or held for lease to third parties were negligible. Future minimum rental income on facilities leased to others is expected to be negligible. At
September 30, 2012
, buildings and improvements and leasehold improvements with a net book value of
$13 million
were leased to third parties or held for lease to third parties.
Goodwill and Other Intangible Assets.
The Company’s reportable segment assets do not include goodwill. The Company allocates goodwill to its reporting units for annual impairment testing purposes. Goodwill was allocable to reporting units included in the Company’s reportable and nonreportable segments, as described in Note 8, as follows (in millions):
|
September 29, 2013
|
September 30, 2012
|
||||||
|
QCT
|
$
|
2,875
|
|
$
|
2,816
|
|
|
|
QTL
|
706
|
|
707
|
|
|||
|
QWI
|
107
|
|
128
|
|
|||
|
Nonreportable segments
|
288
|
|
266
|
|
|||
|
|
$
|
3,976
|
|
$
|
3,917
|
|
|
During fiscal 2012, the Company’s QMT division (a nonreportable segment) updated its business plan to focus on licensing its next generation interferometric modulator (IMOD) display technology while directly commercializing certain IMOD products. In the course of pursuing its licensing model, the Company considered various alternatives for certain property, plant and equipment. The Company performed interim and subsequent annual goodwill impairment tests in fiscal 2013 and 2012 of the QMT division, which was determined to be a reporting unit for purposes of the goodwill impairment tests, and concluded each time that the fair value of the QMT reporting unit was greater than its carrying value. The Company also assessed the recoverability of QMT’s other long-lived assets. During fiscal
2013
and 2012, as a continuation of evaluating alternatives with respect to certain long-lived assets comprising QMT asset groups, the Company revised its estimates of expected cash flows and recorded impairment charges of
$158 million
and
$54 million
, respectively, in other expenses. At
September 29, 2013
, the carrying values of the QMT division’s goodwill and long-lived asset groups were
$133 million
and
$707 million
, respectively.
During fiscal
2012
and 2011, the Company recorded impairment charges of
$23 million
and
$114 million
, respectively, in other expenses to write down goodwill related to its QRS division (included in the QWI segment). At
September 29, 2013
,
$17 million
of goodwill remained for the QRS division.
F-
15
QUALCOMM Incorporated
NOTES TO CONSOLIDATED FINANCIAL STATEMENTS
The components of other intangible assets, net were as follows (in millions):
|
|
September 29, 2013
|
September 30, 2012
|
|||||||||||||
|
Gross Carrying
Amount
|
Accumulated
Amortization
|
Gross Carrying
Amount
|
Accumulated
Amortization
|
||||||||||||
|
Wireless spectrum
|
$
|
19
|
|
$
|
(8
|
)
|
$
|
20
|
|
$
|
(3
|
)
|
|||
|
Marketing-related
|
76
|
|
(37
|
)
|
79
|
|
(28
|
)
|
|||||||
|
Technology-based
|
3,964
|
|
(1,512
|
)
|
3,960
|
|
(1,158
|
)
|
|||||||
|
Customer-related
|
87
|
|
(36
|
)
|
101
|
|
(33
|
)
|
|||||||
|
|
$
|
4,146
|
|
$
|
(1,593
|
)
|
$
|
4,160
|
|
$
|
(1,222
|
)
|
|||
All of these intangible assets are subject to amortization, other than acquired in-process research and development with a carrying value of
$54 million
at
September 29, 2013
. Amortization expense related to these intangible assets for fiscal
2013
,
2012
and
2011
was
$499 million
,
$473 million
and
$357 million
, respectively. Amortization expense related to these intangible assets and acquired in-process research and development, beginning upon the expected completion of the underlying projects, is expected to be
$484 million
,
$444 million
,
$340 million
,
$226 million
and
$193 million
for fiscal
2014
to
2018
, respectively, and
$867 million
thereafter.
|
Other Current Liabilities (in millions)
|
September 29, 2013
|
September 30, 2012
|
|||||
|
Customer incentives and other customer-related liabilities
|
$
|
1,706
|
|
$
|
1,107
|
|
|
|
Other
|
570
|
|
616
|
|
|||
|
|
$
|
2,276
|
|
$
|
1,723
|
|
|
Assets and Liabilities Held for Sale.
On August 21, 2013, the Company entered into a definitive agreement under which it agreed to sell the North and Latin American operations of its Omnitracs division to a U.S.-based private equity firm for
$800 million
in cash, subject to the terms and conditions of the definitive agreement. The transaction is subject to customary closing conditions, including receipt of regulatory approvals, and is expected to close in the first quarter of fiscal 2014. As a result, assets (recorded as other current assets and noncurrent assets held for sale) and liabilities (recorded as current liabilities held for sale and other noncurrent liabilities) of
$139 million
and
$43 million
, respectively, were classified as held for sale at September 29, 2013. The Company expects to present the gain on the sale, net of income taxes, as a discontinued operation upon close. However, the revenues and operating results of the North and Latin American operations of the Omnitracs division, which comprise substantially all of the Omnitracs division, were not presented as discontinued operations in any fiscal period because they were immaterial. At September 30, 2012, assets and liabilities held for sale of
$1.1 billion
each were comprised of the assets and liabilities of the Company’s former BWA subsidiaries (Note 10).
F-
16
QUALCOMM Incorporated
NOTES TO CONSOLIDATED FINANCIAL STATEMENTS
Investment income, net was comprised as follows (in millions):
|
2013
|
2012
|
2011
|
|||||||||
|
Interest and dividend income
|
$
|
697
|
|
$
|
609
|
|
$
|
500
|
|
||
|
Interest expense
|
(23
|
)
|
(90
|
)
|
(114
|
)
|
|||||
|
Net realized gains on marketable securities
|
317
|
|
342
|
|
335
|
|
|||||
|
Net realized gains on other investments
|
52
|
|
27
|
|
2
|
|
|||||
|
Net impairment losses on marketable securities
|
(72
|
)
|
(71
|
)
|
(39
|
)
|
|||||
|
Impairment losses on other investments
|
(13
|
)
|
(12
|
)
|
(13
|
)
|
|||||
|
Net gains (losses) on derivative instruments
|
—
|
|
84
|
|
(3
|
)
|
|||||
|
Net gains on deconsolidation of subsidiaries
|
12
|
|
—
|
|
—
|
|
|||||
|
Equity in losses of investees
|
(6
|
)
|
(9
|
)
|
(7
|
)
|
|||||
|
|
$
|
964
|
|
$
|
880
|
|
$
|
661
|
|
||
Net impairment losses on marketable securities related to the noncredit portion of losses on debt securities recognized in other comprehensive income were negligible for all periods presented.
The components of the income tax provision were as follows (in millions):
|
2013
|
2012
|
2011
|
|||||||||
|
Current provision:
|
|
|
|
||||||||
|
Federal
|
$
|
324
|
|
$
|
140
|
|
$
|
179
|
|
||
|
State
|
15
|
|
1
|
|
57
|
|
|||||
|
Foreign
|
1,068
|
|
934
|
|
670
|
|
|||||
|
|
1,407
|
|
1,075
|
|
906
|
|
|||||
|
Deferred (benefit) provision:
|
|
|
|
||||||||
|
Federal
|
(32
|
)
|
208
|
|
170
|
|
|||||
|
State
|
6
|
|
(16
|
)
|
62
|
|
|||||
|
Foreign
|
(32
|
)
|
12
|
|
(6
|
)
|
|||||
|
|
(58
|
)
|
204
|
|
226
|
|
|||||
|
|
$
|
1,349
|
|
$
|
1,279
|
|
$
|
1,132
|
|
||
The foreign component of the income tax provision consists primarily of foreign withholding taxes on royalty fees included in United States earnings.
The components of income from continuing operations before income taxes by United States and foreign jurisdictions were as follows (in millions):
|
2013
|
2012
|
2011
|
|||||||||
|
United States
|
$
|
3,798
|
|
$
|
3,525
|
|
$
|
2,984
|
|
||
|
Foreign
|
4,396
|
|
3,037
|
|
2,703
|
|
|||||
|
|
$
|
8,194
|
|
$
|
6,562
|
|
$
|
5,687
|
|
||
The following is a reconciliation of the expected statutory federal income tax provision to the Company’s actual income tax provision for continuing operations (in millions):
F-
17
QUALCOMM Incorporated
NOTES TO CONSOLIDATED FINANCIAL STATEMENTS
|
2013
|
2012
|
2011
|
|||||||||
|
Expected income tax provision at federal statutory tax rate
|
$
|
2,868
|
|
$
|
2,297
|
|
$
|
1,991
|
|
||
|
State income tax provision, net of federal benefit
|
26
|
|
24
|
|
283
|
|
|||||
|
Foreign income taxed at other than U.S. rates
|
(1,362
|
)
|
(1,045
|
)
|
(1,074
|
)
|
|||||
|
Tax credits
|
(195
|
)
|
(36
|
)
|
(151
|
)
|
|||||
|
Valuation allowance
|
(3
|
)
|
55
|
|
42
|
|
|||||
|
Revaluation of deferred taxes
|
8
|
|
—
|
|
69
|
|
|||||
|
Other
|
7
|
|
(16
|
)
|
(28
|
)
|
|||||
|
$
|
1,349
|
|
$
|
1,279
|
|
$
|
1,132
|
|
|||
The Company’s QCT segment
’
s non-United States headquarters is located in Singapore. The Company has obtained tax incentives in Singapore, which are effective through March 2027, that result in a tax exemption for the first five years provided that the Company meets specified employment and investment criteria. The Company’s Singapore tax rate will increase in fiscal 2017 and again in fiscal 2027 as a result of expiration of these incentives. Had the Company established QCT’s non-United States headquarters in Singapore without these tax incentives, the Company’s income tax expense would have been higher and impacted earnings per share attributable to Qualcomm as follows (in millions, except per share amounts):
|
2013
|
2012
|
||||||
|
Additional income tax expense
|
$
|
758
|
|
$
|
193
|
|
|
|
Reduction to basic earnings per share
|
$
|
0.44
|
|
$
|
0.11
|
|
|
|
Reduction to diluted earnings per share
|
$
|
0.43
|
|
$
|
0.11
|
|
|
The revaluation of deferred taxes represents the impact of paying current taxes at a higher state effective tax rate than the effective tax rate that will be in effect when the resulting deferred tax asset or liability is scheduled to reverse. The Company has not recorded a deferred tax liability of approximately
$7.6 billion
related to the United States federal and state income taxes and foreign withholding taxes on approximately
$21.6 billion
of undistributed earnings of certain non-United States subsidiaries indefinitely invested outside the United States. Should the Company decide to repatriate the foreign earnings, the Company would have to adjust the income tax provision in the period management determined that the earnings will no longer be indefinitely invested outside the United States.
The Company files income tax returns in the United States federal jurisdiction and various state and foreign jurisdictions. The Company is currently a participant in the Internal Revenue Service (IRS) Compliance Assurance Process, whereby the IRS and the Company endeavor to agree on the treatment of all tax issues prior to the tax return being filed. The IRS completed its examination of the Company’s tax return for fiscal 2011 and issued a final revenue agent’s report during the third quarter of fiscal 2013, resulting in no change to the income tax provision. The Company is no longer subject to United States federal income tax examinations for years prior to fiscal 2012. The Company is subject to examination by the California Franchise Tax Board for fiscal years after 2008. The Company is also subject to income taxes in other taxing jurisdictions in the United States and around the world, many of which are open to tax examinations for periods after fiscal 2000. The Company does not expect the impact of any future state or foreign audits to be material.
F-
18
QUALCOMM Incorporated
NOTES TO CONSOLIDATED FINANCIAL STATEMENTS
The Company had deferred tax assets and deferred tax liabilities as follows (in millions):
|
September 29, 2013
|
September 30, 2012
|
||||||
|
Unearned revenues
|
$
|
1,305
|
|
$
|
1,340
|
|
|
|
Share-based compensation
|
497
|
|
623
|
|
|||
|
Unrealized losses on marketable securities
|
293
|
|
232
|
|
|||
|
Accrued liabilities and reserves
|
305
|
|
260
|
|
|||
|
Unused net operating losses
|
91
|
|
105
|
|
|||
|
Capitalized start-up and organizational costs
|
71
|
|
78
|
|
|||
|
Tax credits
|
29
|
|
50
|
|
|||
|
Other
|
49
|
|
102
|
|
|||
|
Total gross deferred assets
|
2,640
|
|
2,790
|
|
|||
|
Valuation allowance
|
(51
|
)
|
(142
|
)
|
|||
|
Total net deferred assets
|
2,589
|
|
2,648
|
|
|||
|
Unrealized gains on marketable securities
|
(536
|
)
|
(552
|
)
|
|||
|
Intangible assets
|
(265
|
)
|
(261
|
)
|
|||
|
Property, plant and equipment
|
(129
|
)
|
(115
|
)
|
|||
|
Other
|
(27
|
)
|
(7
|
)
|
|||
|
Total deferred liabilities
|
(957
|
)
|
(935
|
)
|
|||
|
Net deferred assets
|
$
|
1,632
|
|
$
|
1,713
|
|
|
|
Reported as:
|
|
|
|||||
|
Current deferred tax assets
|
$
|
573
|
|
$
|
309
|
|
|
|
Non-current deferred tax assets
|
1,059
|
|
1,412
|
|
|||
|
Non-current assets held for sale
|
2
|
|
—
|
|
|||
|
Current deferred tax liabilities (1)
|
—
|
|
(1
|
)
|
|||
|
Non-current deferred tax liabilities (1)
|
(2
|
)
|
(7
|
)
|
|||
|
|
$
|
1,632
|
|
$
|
1,713
|
|
|
|
(1)
|
Current deferred tax liabilities and non-current deferred tax liabilities were included in other current liabilities and other liabilities, respectively, in the consolidated balance sheets.
|
At
September 29, 2013
, the Company had unused federal net operating loss carryforwards of
$131 million
expiring from
2021
through
2031
, unused state net operating loss carryforwards of
$604 million
expiring from
2014
through
2033
, and unused foreign net operating loss carryforwards of
$75 million
, which expire from
2014
through
2021
. At
September 29, 2013
, the Company had unused tax credits of
$25 million
in foreign jurisdictions, which begin to expire in
2014
. The Company does not expect its federal net operating loss carryforwards and its state income tax credits to expire unused.
The Company believes, more likely than not, that it will have sufficient taxable income after deductions related to share-based awards to utilize the majority of its deferred tax assets. At
September 29, 2013
, the Company has provided a valuation allowance on certain foreign deferred tax assets, state net operating losses and net capital losses of
$21 million
,
$17 million
and
$13 million
, respectively. The valuation allowances reflect the uncertainties surrounding the Company’s ability to generate sufficient future taxable income in certain foreign and state tax jurisdictions to utilize its net operating losses and the Company’s ability to generate sufficient capital gains to utilize all capital losses.
A summary of the changes in the amount of unrecognized tax benefits for fiscal
2013
,
2012
and
2011
follows (in millions):
F-
19
QUALCOMM Incorporated
NOTES TO CONSOLIDATED FINANCIAL STATEMENTS
|
2013
|
2012
|
2011
|
|||||||||
|
Beginning balance of unrecognized tax benefits
|
$
|
86
|
|
$
|
96
|
|
$
|
353
|
|
||
|
Additions based on prior year tax positions
|
1
|
|
—
|
|
64
|
|
|||||
|
Reductions for prior year tax positions and lapse in statute of limitations
|
—
|
|
(18
|
)
|
(10
|
)
|
|||||
|
Additions for current year tax positions
|
145
|
|
10
|
|
12
|
|
|||||
|
Settlements with taxing authorities
|
(11
|
)
|
(2
|
)
|
(323
|
)
|
|||||
|
Ending balance of unrecognized tax benefits
|
$
|
221
|
|
$
|
86
|
|
$
|
96
|
|
||
The Company does not expect any unrecognized tax benefits recorded at
September 29, 2013
to result in cash payment in fiscal
2014
. Unrecognized tax benefits at
September 29, 2013
included
$218 million
for tax positions that, if recognized, would impact the effective tax rate. The unrecognized tax benefits differ from the amount that would affect the Company’s effective tax rate primarily because the unrecognized tax benefits were included on a gross basis and did not reflect secondary impacts such as the federal deduction for state taxes, adjustments to deferred tax assets and the valuation allowance that might be required if the Company’s tax positions are sustained. The increase in unrecognized tax benefits in fiscal
2013
was primarily due to tax positions related to transfer pricing. The decrease in unrecognized tax benefits in fiscal
2012
was primarily due to settlement of the Company’s California tax examination for fiscal 2005 through fiscal 2008, which was partially offset by an increase in unrecognized tax benefits generated in fiscal 2012. The Company does not believe that it is reasonably possible that the total amounts of unrecognized tax benefits at
September 29, 2013
will significantly increase or decrease in fiscal
2014
. Interest expense related to uncertain tax positions was negligible in fiscal
2013
,
2012
and
2011
. The amount of accrued interest and penalties was negligible at
September 29, 2013
and
September 30, 2012
.
Cash amounts paid for income taxes, net of refunds received, were
$1.1 billion
,
$1.3 billion
and
$2.1 billion
for fiscal
2013
,
2012
and
2011
, respectively.
Preferred Stock.
The Company has
8,000,000
shares of preferred stock authorized for issuance in
one or more
series, at a par value of
$0.0001
per share. In conjunction with the distribution of preferred share purchase rights,
4,000,000
shares of preferred stock are designated as Series A Junior Participating Preferred Stock, and such shares are reserved for issuance upon exercise of the preferred share purchase rights. At
September 29, 2013
and
September 30, 2012
,
no
shares of preferred stock were outstanding.
Preferred Share Purchase Rights Agreement.
The Company has a Preferred Share Purchase Rights Agreement (Rights Agreement) to protect stockholders’ interests in the event of a proposed takeover of the Company. Under the original Rights Agreement, adopted on September 26, 1995, the Company declared a dividend of one preferred share purchase right (a Right) for each share of the Company’s common stock outstanding. Pursuant to the Rights Agreement, as amended and restated on December 7, 2006, each Right entitles the registered holder to purchase from the Company a one one-thousandth share of Series A Junior Participating Preferred Stock,
$0.0001
par value per share, subject to adjustment for subsequent stock splits, at a purchase price of
$180
. The Rights are exercisable only if a person or group (an Acquiring Person) acquires beneficial ownership of
20%
or more of the Company’s outstanding shares of common stock without approval of the Board of Directors. Upon exercise, holders, other than an Acquiring Person, will have the right, subject to termination, to receive the Company’s common stock or other securities, cash or other assets having a market value, as defined, equal to twice such purchase price. The Rights, which expire on
September 25, 2015
, are redeemable in whole, but not in part, at the Company’s option prior to the time such Rights are triggered for a price of
$0.001
per Right.
Stock Repurchase Program.
On September 11, 2013, the Company announced a new repurchase program authorizing it to repurchase up to
$5.0 billion
of the Company’s common stock. The stock repurchase program has no expiration date. This
$5.0 billion
stock repurchase program replaced the previous
$5.0 billion
stock repurchase program, of which
$791 million
remained available for repurchase. Any shares repurchased are retired, and the amount paid in excess of par value is recorded to paid-in capital. During fiscal
2013
,
2012
and
2011
, the Company repurchased and retired
71,696,000
,
23,893,000
and
2,878,000
shares of common stock, respectively, for
$4.6 billion
,
$1.3 billion
and
$142 million
, respectively, before commissions. At
September 29, 2013
, approximately
$4.9 billion
remained authorized for repurchase under the Company’s stock repurchase program.
In connection with the Company’s prior stock repurchase programs, the Company sold three put options on its own stock during fiscal 2011, of which all expired unexercised during fiscal 2012. During fiscal 2012 and 2011, the Company recognized
F-
20
QUALCOMM Incorporated
NOTES TO CONSOLIDATED FINANCIAL STATEMENTS
gains of
$80 million
and losses of
$5 million
, respectively, in net investment income due to changes in the fair values of the put options. No put options were outstanding during fiscal
2013
.
Dividends.
The Company announced increases in its quarterly dividend per share of common stock from
$0.19
to
$0.215
on
March 8, 2011
, from
$0.215
to
$0.25
on
March 6, 2012
, and from
$0.25
to
$0.35
on
March 5, 2013
. Dividends charged to retained earnings in fiscal
2013
,
2012
and
2011
were as follows (in millions, except per share data):
|
|
2013
|
2012
|
2011
|
||||||||||||||||||||
|
|
Per Share
|
Total
|
Per Share
|
Total
|
Per Share
|
Total
|
|||||||||||||||||
|
First quarter
|
$
|
0.250
|
|
$
|
435
|
|
$
|
0.215
|
|
$
|
368
|
|
$
|
0.190
|
|
$
|
314
|
|
|||||
|
Second quarter
|
0.250
|
|
439
|
|
0.215
|
|
377
|
|
0.190
|
|
319
|
|
|||||||||||
|
Third quarter
|
0.350
|
|
615
|
|
0.250
|
|
429
|
|
0.215
|
|
360
|
|
|||||||||||
|
Fourth quarter
|
0.350
|
|
604
|
|
0.250
|
|
438
|
|
0.215
|
|
368
|
|
|||||||||||
|
|
$
|
1.200
|
|
$
|
2,093
|
|
$
|
0.930
|
|
$
|
1,612
|
|
$
|
0.810
|
|
$
|
1,361
|
|
|||||
On
October 24, 2013
, the Company announced a cash dividend of
$0.35
per share of common stock, payable on
December 19, 2013
to stockholders of record as of
December 2, 2013
, which will be reflected in the consolidated financial statements in the first quarter of fiscal
2014
.
Employee Savings and Retirement Plan.
The Company has a 401(k) plan that allows eligible employees to contribute up to
100%
of their eligible compensation, subject to annual limits. The Company matches a portion of the employee contributions and may, at its discretion, make additional contributions based upon earnings. The Company’s contribution expense was
$70 million
,
$60 million
and
$52 million
in fiscal
2013
,
2012
and
2011
, respectively.
Equity Compensation Plans.
The 2006 Long-Term Incentive Plan (the 2006 Plan) was adopted during the second quarter of fiscal 2006 and replaced the 2001 Stock Option Plan and the 2001 Non-Employee Directors’ Stock Option Plan and their predecessor plans (the Prior Plans). The 2006 Plan provides for the grant of incentive and non-qualified stock options, restricted stock units, stock appreciation rights, restricted stock, performance stock units and other share-based awards and is the source of shares issued under the Non-Qualified Deferred Compensation Plan (the NQDCP), formerly known as the Executive Retirement Matching Contribution Plan. The shares authorized under the 2006 Plan were approximately
573,284,000
at
September 29, 2013
, including
90,000,000
shares that were approved by the Company’s stockholders in March 2013. The share reserve remaining under the 2006 Plan was approximately
270,380,000
at
September 29, 2013
. Shares subject to any stock option under a Prior Plan that is terminated or canceled (but not a stock option under a Prior Plan that expires) following the date that the 2006 Plan was approved by stockholders, and shares that are subject to an award under the NQDCP and are returned to the Company because they fail to vest, will again become available for grant under the 2006 Plan. The Board of Directors of the Company may amend or terminate the 2006 Plan at any time. Certain amendments, including an increase in the share reserve, require stockholder approval.
During fiscal
2011
, the Company assumed a total of
9,564,000
outstanding stock awards under various stock-based incentive plans (the Assumed Plans) as a result of the acquisition of Atheros (Note 9). The Assumed Plans provided for the grant of incentive stock options, non-qualified stock options, restricted stock units and other stock-based awards. The Company can continue to grant stock awards under one of the Assumed Plans, the Atheros Communications, Inc. 2004 Stock Incentive Plan, as amended (the Atheros Plan) to certain employees. The share reserve under the Atheros Plan was
4,075,000
at
September 29, 2013
. All other remaining shares available under Assumed Plans were terminated on the date of the acquisition, and no additional shares may be granted under those plans.
Net share-based awards, after forfeitures and cancelations, granted during fiscal
2013
,
2012
and
2011
represented
0.8%
,
0.9%
and
0.7%
of outstanding shares as of the beginning of each fiscal year, respectively. Total share-based awards granted during fiscal
2013
,
2012
and
2011
represented
1.0%
,
1.0%
and
0.9%
, respectively, of outstanding shares as of the end of each fiscal year.
Restricted Stock Units:
RSUs are share awards that entitle the holder to receive shares of the Company’s common stock upon vesting. The RSUs generally include dividend-equivalent rights and vest over periods of
three years
from the date of grant. A summary of RSU transactions for all equity compensation plans follows:
F-
21
QUALCOMM Incorporated
NOTES TO CONSOLIDATED FINANCIAL STATEMENTS
|
Number of Shares
|
Weighted-Average
Grant Date Fair
Value
|
Aggregate Intrinsic
Value
|
||||||||
|
(In thousands)
|
(In billions)
|
|||||||||
|
RSUs outstanding at September 30, 2012
|
32,922
|
|
$
|
53.22
|
|
|
||||
|
RSUs granted
|
15,509
|
|
64.20
|
|
|
|||||
|
RSUs canceled/forfeited
|
(1,549
|
)
|
56.69
|
|
|
|||||
|
RSUs vested
|
(15,804
|
)
|
50.50
|
|
|
|||||
|
RSUs outstanding at September 29, 2013
|
31,078
|
|
$
|
59.91
|
|
$
|
2.1
|
|
||
At
September 29, 2013
, total unrecognized estimated compensation expense related to non-vested RSUs granted prior to that date was
$1.3 billion
, which is expected to be recognized over a weighted-average period of
1.8
years. The total vest-date fair value of RSUs that vested during fiscal
2013
,
2012
and
2011
was
$1.0 billion
,
$352 million
and
$43 million
, respectively. For the majority of RSUs, shares are issued on the vesting dates net of the amount of shares needed to satisfy statutory tax withholding requirements to be paid by the Company on behalf of the employees. The total shares withheld were approximately
5,805,000
,
1,965,000
and
243,000
in fiscal
2013
,
2012
and
2011
, respectively, and were based on the value of the RSUs on their vesting dates as determined by the Company’s closing stock price. Total payments for the employees’ tax obligations to the taxing authorities were
$374 million
,
$131 million
and
$14 million
in fiscal
2013
,
2012
and
2011
, respectively.
Stock Options:
The Board of Directors may grant stock options to selected employees, directors and consultants to the Company to purchase shares of the Company’s common stock at an exercise price not less than the fair market value of the stock at the date of grant. Stock options vest over periods not exceeding
five years
and are
exercisable for up to 10 years from the grant date
. A summary of stock option transactions for all equity compensation plans follows:
|
Number of Shares
|
Weighted- Average
Exercise
Price
|
Average Remaining
Contractual Term
|
Aggregate Intrinsic
Value
|
|||||||||
|
(In thousands)
|
(Years)
|
(In billions)
|
||||||||||
|
Stock options outstanding at September 30, 2012
|
106,601
|
|
$
|
39.96
|
|
|
|
|||||
|
Stock options canceled/forfeited/expired
|
(652
|
)
|
40.25
|
|
|
|
||||||
|
Stock options exercised
|
(34,923
|
)
|
37.51
|
|
|
|
||||||
|
Stock options outstanding at September 29, 2013
|
71,026
|
|
$
|
41.17
|
|
4.2
|
$
|
1.9
|
|
|||
|
Exercisable at September 29, 2013
|
65,243
|
|
$
|
41.09
|
|
4.0
|
$
|
1.7
|
|
|||
At
September 29, 2013
, total unrecognized estimated compensation expense related to non-vested stock options granted prior to that date was
$51 million
, which is expected to be recognized over a weighted-average period of
0.5
years. The total intrinsic value of stock options exercised during fiscal
2013
,
2012
and
2011
was
$949 million
,
$1.0 billion
and
$1.1 billion
, respectively. The Company recorded cash received from the exercise of stock options of
$1.3 billion
,
$1.5 billion
and
$2.5 billion
and related tax benefits of
$659 million
,
$438 million
and
$421 million
during fiscal
2013
,
2012
and
2011
, respectively. Upon option exercise, the Company issues new shares of stock.
Employee Stock Purchase Plan.
The Company has an employee stock purchase plan for eligible employees to purchase shares of common stock at
85%
of the lower of the fair market value on the first or the last day of each offering period, which is generally six months. Employees may authorize the Company to withhold up to
15%
of their compensation during any offering period, subject to certain limitations. The employee stock purchase plan includes a non-423(b) plan. The shares authorized under the employee stock purchase plan were approximately
46,709,000
at
September 29, 2013
. The shares reserved for future issuance were approximately
10,713,000
at
September 29, 2013
. During fiscal
2013
,
2012
and
2011
, approximately
4,044,000
,
3,654,000
and
3,778,000
shares, respectively, were issued under the plan at an average price of
$52.70
,
$48.31
and
$36.82
per share, respectively. At
September 29, 2013
, total unrecognized estimated compensation expense related to non-vested purchase rights granted prior to that date was
$21 million
. The Company recorded cash received from the exercise of purchase rights of
$213 million
,
$177 million
and
$139 million
during fiscal
2013
,
2012
and
2011
, respectively.
F-
22
QUALCOMM Incorporated
NOTES TO CONSOLIDATED FINANCIAL STATEMENTS
Legal Proceedings.
Tessera, Inc. v. QUALCOMM Incorporated
: On April 17, 2007, Tessera filed a patent infringement lawsuit in the United States District Court for the Eastern District of Texas and a complaint with the United States International Trade Commission (ITC) pursuant to Section 337 of the Tariff Act of 1930 against the Company and other companies, alleging infringement of two patents. The district court action was stayed pending resolution of the ITC proceeding, including all appeals. On May 20, 2009, the ITC issued a limited exclusion order and a cease and desist order, both of which were terminated when the patents expired on September 24, 2010. During the period of the exclusion order, the Company shifted supply of accused chips for customers who manufacture products that may be imported to the United States to a licensed supplier of Tessera, and the Company continued to supply those customers without interruption. The ITC’s orders were affirmed on appeal, and on November 28, 2011, the United States Supreme Court denied the Company’s petition for review. On January 18, 2012, pursuant to the parties’ stipulation, the District Court in the Eastern District of Texas lifted the stay and ordered that the case be moved to the United States District Court for the Northern District of California. On March 1, 2012, that court consolidated the case with an earlier-filed lawsuit filed by Tessera against multiple parties, including some of the Company’s semiconductor chip package suppliers. The court has set April 24, 2014 as the hearing date for claims construction and any summary judgment motions that may be filed. Trial is scheduled for August 25, 2014. Tessera may continue to seek alleged past damages in the district court, but it cannot obtain injunctive relief due to the expiration of the patents.
MOSAID Technologies Incorporated v. Dell, Inc. et al.
: On March 16, 2011, MOSAID filed a complaint against Atheros Communications, Inc. (Atheros Communications), which the Company acquired in May 2011 and renamed Qualcomm Atheros, Inc. (Qualcomm Atheros), and 32 other entities in the United States District Court for the Eastern District of Texas alleging that certain Wi-Fi products infringed six MOSAID patents and seeking damages for the relevant statutory period prior to May 2011. On July 17, 2013, MOSAID and the Company entered into an agreement pursuant to which MOSAID agreed to dismiss with prejudice all claims against the Company, licensed to the Company certain MOSAID patents and provided other considerations, and the Company paid to MOSAID an amount that was not material to the Company’s financial statements. The court dismissed the claims against the Company with prejudice on August 2, 2013.
ParkerVision, Inc. v. QUALCOMM Incorporated
: On July 20, 2011, ParkerVision filed a complaint against the Company in the United States District Court for the Middle District of Florida alleging that certain of the Company’s products infringe seven of its patents alleged to cover direct down-conversion receivers. ParkerVision’s complaint sought damages and injunctive and other relief. On February 28, 2012, ParkerVision filed an amended complaint dropping two patents from the case and adding one new patent. On January 22, 2013, the court granted in part ParkerVision’s motion to dismiss the Company’s counterclaim for inequitable conduct, and the Company subsequently withdrew the remainder of its inequitable conduct counterclaim. On February 20, 2013, the court issued its claim construction order. The Company filed its amended answer and counterclaims on April 11, 2013. Subsequently, ParkerVision narrowed its allegations to assert only four patents. The trial began on October 7, 2013. On October 17, 2013, the jury returned a verdict finding all asserted claims of the four at-issue patents to be infringed and finding that none of the asserted claims are invalid. On October 24, 2013, the jury returned a separate verdict assessing total past damages of approximately
$173 million
and finding that the Company’s infringement was not willful. The Company recorded a
$173 million
charge in other expenses in fiscal 2013 as a result of this verdict. The court will set a schedule for post-verdict proceedings, including the parties’ respective motions for judgment as a matter of law and ParkerVision’s request for ongoing equitable relief. The Company intends to appeal.
Icera Complaint to the European Commission
: On June 7, 2010, the European Commission (the Commission) notified and provided the Company with a redacted copy of a complaint filed with the Commission by Icera, Inc. alleging that the Company has engaged in anticompetitive activity. The Company was asked by the Commission to submit a preliminary response to the portions of the complaint disclosed to it, and the Company submitted its response in July 2010. On October 19, 2011, the Commission notified the Company that it should provide to the Commission additional documents and information. On January 16, 2012, the Company provided additional documents and information in response to that request. On July 10, 2013, the Commission ordered the Company to provide additional documents and information. The Company continues to cooperate fully with the Commission’s preliminary investigation.
Korea Fair Trade Commission (KFTC) Complaint
: On January 4, 2010, the KFTC issued a written decision finding that the Company had violated South Korean law by offering certain discounts and rebates for purchases of its CDMA chips and for including in certain agreements language requiring the continued payment of royalties after all licensed patents have expired. The KFTC levied a fine, which the Company paid in the second quarter of fiscal 2010. The Company appealed to the Seoul High Court, and on June 19, 2013, the Seoul High Court affirmed the KFTC’s decision. On July 4, 2013, the Company filed an appeal with the Korea Supreme Court.
F-
23
QUALCOMM Incorporated
NOTES TO CONSOLIDATED FINANCIAL STATEMENTS
Japan Fair Trade Commission (JFTC) Complaint
: The JFTC received unspecified complaints alleging that the Company’s business practices are, in some way, a violation of Japanese law. On September 29, 2009, the JFTC issued a cease and desist order concluding that the Company’s Japanese licensees were forced to cross-license patents to the Company on a royalty-free basis and were forced to accept a provision under which they agreed not to assert their essential patents against the Company’s other licensees who made a similar commitment in their license agreements with the Company. The cease and desist order seeks to require the Company to modify its existing license agreements with Japanese companies to eliminate these provisions while preserving the license of the Company’s patents to those companies. The Company disagrees with the conclusions that it forced its Japanese licensees to agree to any provision in the parties’ agreements and that those provisions violate the Japanese Antimonopoly Act. The Company has invoked its right under Japanese law to an administrative hearing before the JFTC. In February 2010, the Tokyo High Court granted the Company’s motion and issued a stay of the cease and desist order pending the administrative hearing before the JFTC. The JFTC has held hearings on 19 different dates, with another hearing scheduled for January 22, 2014 and additional hearing dates yet to be scheduled.
Securities and Exchange Commission (SEC) Formal Order of Private Investigation and Department of Justice Investigation
: On September 8, 2010, the Company was notified by the SEC’s Los Angeles Regional office of a formal order of private investigation. The Company understands that the investigation arose from a “whistleblower’s” allegations made in December 2009 to the audit committee of the Company’s Board of Directors and to the SEC. In 2010, the audit committee completed an internal review of the allegations with the assistance of independent counsel and independent forensic accountants. This internal review into the whistleblower’s allegations and related accounting practices did not identify any errors in the Company’s financial statements. On January 27, 2012, the Company learned that the U.S. Attorney’s Office for the Southern District of California/Department of Justice (collectively, DOJ) had begun an investigation regarding the Company’s compliance with the Foreign Corrupt Practices Act (FCPA). FCPA compliance is also a focus of the SEC investigation. The audit committee continues to conduct an internal review into the Company’s compliance with the FCPA with the assistance of independent counsel and independent forensic accountants.
As previously disclosed, the Company has discovered, and as a part of its ongoing cooperation with these investigations has informed the SEC and the DOJ of, instances in which special hiring consideration, gifts or other benefits (collectively, benefits) were provided to several individuals associated with Chinese state-owned companies or agencies. Based on the facts currently known, the Company believes the aggregate monetary value of the benefits in question to be less than $250,000, excluding employment compensation. The Company is continuing to cooperate with the SEC and the DOJ, but is unable to predict the outcome of their investigations.
The Company will continue to vigorously defend itself in the foregoing matters. However, litigation and investigations are inherently uncertain. Accordingly, the Company cannot predict the outcome of these matters. Other than the amount recorded for the ParkerVision verdict, the Company has not recorded any accrual at
September 29, 2013
for contingent losses associated with these matters based on its belief that losses, while possible, are not probable. Further, any possible range of loss cannot be reasonably estimated at this time. Nonetheless, the unfavorable resolution of one or more of these matters could have a material adverse effect on the Company’s business, results of operations, financial condition or cash flows. The Company is engaged in numerous other legal actions not described above arising in the ordinary course of its business and, while there can be no assurance, believes that the ultimate outcome of these other legal actions will not have a material adverse effect on its business, results of operations, financial condition or cash flows.
Loans and Debentures.
The Company’s former BWA subsidiaries (Note 10) had loan and debenture liabilities in connection with the BWA spectrum won in India in fiscal 2010. The subsidiaries were merged into one remaining former BWA subsidiary in August 2013, and that subsidiary had a loan from a bank related to payment of
$81 million
to the India Government’s Department of Telecommunications in March 2012 (the DoT loan), which was recorded by the Company as a charge to other expenses in the second quarter of fiscal 2012. On on June 25, 2013, all outstanding debentures (
$492 million
, including accrued interest) were redeemed, and on August 30, 2013, all outstanding loans, excluding the DoT loan, (
$368 million
) were repaid, in full using funding provided by Bharti, and the Company’s related guarantee and indemnification agreements were terminated. Prior to the deconsolidation of the BWA subsidiaries on June 25, 2013, cash paid for interest on the loans and debentures was
$92 million
,
$88 million
and
$94 million
for fiscal
2013
,
2012
and
2011
, respectively.
The DoT loan was guaranteed by QUALCOMM Incorporated and one of its wholly owned subsidiaries and was denominated in Indian rupees. The fair value of the guarantee was recorded as a liability when the Company deconsolidated the BWA subsidiaries (Note 10). The DoT loan was due and payable on
December 1, 2014
and bore interest at an annual rate that was reset quarterly, plus
0.25%
(
10.20%
at
September 29, 2013
) with interest payments due monthly. The DoT loan was repaid in full on October 15, 2013 (
$67 million
) using funding provided by Bharti as a condition to Bharti’s acquisition of all of the Company’s interest in the remaining former BWA subsidiary, which occurred on October 17, 2013.
F-
24
QUALCOMM Incorporated
NOTES TO CONSOLIDATED FINANCIAL STATEMENTS
Indemnifications.
With the exception of the practices of its Qualcomm Atheros subsidiary, the Company generally does not indemnify its customers and licensees for losses sustained from infringement of third-party intellectual property rights. However, the Company is contingently liable under certain product sales, services, license and other agreements to indemnify certain customers against certain types of liability and/or damages arising from qualifying claims of patent infringement by products or services sold or provided by the Company. The Company’s obligations under these agreements may be limited in terms of time and/or amount, and in some instances, the Company may have recourse against third parties for certain payments made by the Company. Under Qualcomm Atheros’ indemnification agreements, software license agreements and product sale agreements (including its standard software license agreements and standard terms and conditions of semiconductor sales), Qualcomm Atheros agrees, subject to restrictions and after certain conditions are met, to indemnify and defend its licensees and customers against third-party claims asserting infringement of certain intellectual property rights, which may include patents, copyrights, trademarks or trade secrets, and to pay any judgments entered on such claims against the licensees or customers. Through
September 29, 2013
, Qualcomm Atheros has received a number of claims from its direct and indirect customers and other third parties for indemnification under such agreements with respect to alleged infringement of third-party intellectual property rights by its products.
These indemnification arrangements are not initially measured and recognized at fair value because they are deemed to be similar to product warranties in that they relate to claims and/or other actions that could impair the ability of the Company’s direct or indirect customers to use the Company’s products or services. Accordingly, the Company records liabilities resulting from the arrangements when they are probable and can be reasonably estimated. Reimbursements under indemnification arrangements have not been material to the Company’s consolidated financial statements. The Company has not recorded any accrual for contingent liabilities at
September 29, 2013
associated with these indemnification arrangements, other than insignificant amounts, based on the Company’s belief that additional liabilities, while possible, are not probable. Further, any possible range of loss cannot be reasonably estimated at this time.
Purchase Obligations.
The Company has agreements with suppliers and other parties to purchase inventory, other goods and services and long-lived assets. Obligations, which generally have a remaining term of less than one year, under these agreements at
September 29, 2013
for each of the subsequent five years from fiscal
2014
through
2018
were approximately
$3.3 billion
,
$202 million
,
$54 million
,
$6 million
and
$3 million
, respectively, and
$10 million
thereafter. Of these amounts, for fiscal
2014
and
2015
, commitments to purchase integrated circuit product inventories comprised
$2.7 billion
and
$81 million
, respectively. Integrated circuit product inventory obligations represent purchase commitments for silicon wafers and assembly and test services. Under the Company’s manufacturing relationships with its foundry partners and assembly and test service providers, cancelation of outstanding purchase orders is generally allowed but requires payment of all costs incurred through the date of cancelation.
Leases.
The future minimum lease payments for all capital leases and operating leases at
September 29, 2013
were as follows (in millions):
|
Capital
Leases
|
Operating
Leases
|
Total
|
|||||||||
|
2014
|
$
|
2
|
|
$
|
89
|
|
$
|
91
|
|
||
|
2015
|
2
|
|
74
|
|
76
|
|
|||||
|
2016
|
1
|
|
62
|
|
63
|
|
|||||
|
2017
|
1
|
|
46
|
|
47
|
|
|||||
|
2018
|
1
|
|
25
|
|
26
|
|
|||||
|
Thereafter
|
29
|
|
47
|
|
76
|
|
|||||
|
Total minimum lease payments
|
36
|
|
$
|
343
|
|
$
|
379
|
|
|||
|
Deduct: Amounts representing interest
|
19
|
|
|
|
|||||||
|
Present value of minimum lease payments
|
17
|
|
|
|
|||||||
|
Deduct: Current portion of capital lease obligations
|
—
|
|
|
|
|||||||
|
Long-term portion of capital lease obligations
|
$
|
17
|
|
|
|
||||||
The Company leases certain of its land, facilities and equipment under noncancelable operating leases, with terms ranging from
less than one year
to
31 years
and with provisions in certain leases for cost-of-living increases. Rental expense for fiscal
2013
,
2012
and
2011
was
$90 million
,
$87 million
and
$87 million
, respectively. The Company leases certain property under capital lease agreements primarily related to site leases that have an initial term of
five
to
seven
years with renewal options of up to
five
additional renewal periods. Capital lease obligations are included in other liabilities.
F-
25
QUALCOMM Incorporated
NOTES TO CONSOLIDATED FINANCIAL STATEMENTS
The Company is organized on the basis of products and services. The Company aggregates
four
of its divisions into the QWI segment and
two
of its divisions into the QSI segment. Reportable segments are as follows:
|
•
|
QCT (Qualcomm CDMA Technologies) segment — develops and supplies integrated circuits and system software based on CDMA, OFDMA and other technologies for use in voice and data communications, networking, application processing, multimedia and global positioning system products.
|
|
•
|
QTL (Qualcomm Technology Licensing) segment — grants licenses or otherwise provides rights to use portions of the Company’s intellectual property portfolio, which, among other rights, includes certain patent rights essential to and/or useful in the manufacture and sale of certain wireless products, including, without limitation, products implementing CDMA2000, WCDMA, CDMA TDD (including TD-SCDMA), GSM/GPRS/EDGE and/or OFDMA (including LTE) standards and their derivatives, and QTL collects license fees as well as royalties based on sales by licensees of products incorporating or using the Company’s intellectual property.
|
|
•
|
QWI (Qualcomm Wireless & Internet) segment — comprised of:
|
|
•
|
Omnitracs division — provides fleet management, satellite- and terrestrial-based two-way wireless information and position reporting and other services, software and hardware to transportation and logistics companies. On August 21, 2013, the Company entered into a definitive agreement to sell the North and Latin American operations of Omnitracs (which comprise substantially all of the Omnitracs division) to a third party, subject to closing conditions (Note 2);
|
|
•
|
QIS (Qualcomm Internet Services) division — provides content enablement services for the wireless industry and push-to-talk and other software products and services for wireless network operators;
|
|
•
|
QGOV (Qualcomm Government Technologies) division — provides development and other services and related products involving wireless communications technologies to government agencies and their contractors; and
|
|
•
|
QRS (Qualcomm Retail Solutions) division — builds and manages software applications that enable certain mobile location-awareness and commerce services.
|
|
•
|
QSI (Qualcomm Strategic Initiatives) segment — comprised of the Company’s Qualcomm Ventures and Structured Finance & Strategic Investments divisions. QSI makes strategic investments that the Company believes may open new or expand opportunities for its technologies, support the design and introduction of new products or services for voice and data communications or possess unique capabilities or technology. Many of these strategic investments are in early-stage companies. QSI also holds wireless spectrum. Prior to fiscal 2013, QSI’s FLO TV division was presented as discontinued operations. All discontinued operations were attributable to Qualcomm.
|
The Company evaluates the performance of its segments based on earnings (loss) before income taxes (EBT) from continuing operations. Segment EBT includes the allocation of certain corporate expenses to the segments, including depreciation and amortization expense related to unallocated corporate assets. Certain income and charges are not allocated to segments in the Company’s management reports because they are not considered in evaluating the segments’ operating performance. Unallocated income and charges include certain net investment income; certain share-based compensation; and certain research and development expenses and selling and marketing expenses that were deemed to be not directly related to the businesses of the segments. Additionally, starting with acquisitions in the third quarter of fiscal 2011, unallocated charges include recognition of the step-up of inventories to fair value, amortization and impairment of certain intangible assets and certain other acquisition-related charges. Such charges related to acquisitions that were completed prior to the third quarter of fiscal 2011 are allocated to the respective segments. The table below presents revenues and EBT for reportable segments (in
F-
26
QUALCOMM Incorporated
NOTES TO CONSOLIDATED FINANCIAL STATEMENTS
millions):
|
QCT
|
QTL
|
QWI
|
QSI
|
Reconciling
Items
|
Total
|
||||||||||||||||||
|
2013
|
|
|
|
|
|
|
|||||||||||||||||
|
Revenues
|
$
|
16,715
|
|
$
|
7,554
|
|
$
|
613
|
|
$
|
—
|
|
$
|
(16
|
)
|
$
|
24,866
|
|
|||||
|
EBT
|
3,189
|
|
6,590
|
|
(8
|
)
|
56
|
|
(1,633
|
)
|
8,194
|
|
|||||||||||
|
Total assets
|
3,305
|
|
28
|
|
53
|
|
511
|
|
41,619
|
|
45,516
|
|
|||||||||||
|
2012
|
|
|
|
|
|
|
|||||||||||||||||
|
Revenues
|
$
|
12,141
|
|
$
|
6,327
|
|
$
|
633
|
|
$
|
—
|
|
$
|
20
|
|
$
|
19,121
|
|
|||||
|
EBT
|
2,296
|
|
5,585
|
|
(15
|
)
|
(170
|
)
|
(1,134
|
)
|
6,562
|
|
|||||||||||
|
Total assets
|
2,278
|
|
63
|
|
129
|
|
1,424
|
|
39,118
|
|
43,012
|
|
|||||||||||
|
2011
|
|
|
|
|
|
|
|||||||||||||||||
|
Revenues
|
$
|
8,859
|
|
$
|
5,422
|
|
$
|
656
|
|
$
|
—
|
|
$
|
20
|
|
$
|
14,957
|
|
|||||
|
EBT
|
2,056
|
|
4,753
|
|
(152
|
)
|
(132
|
)
|
(838
|
)
|
5,687
|
|
|||||||||||
|
Total assets
|
1,569
|
|
36
|
|
136
|
|
2,386
|
|
32,295
|
|
36,422
|
|
|||||||||||
Segment assets are comprised of accounts receivable and inventories for all reportable segments other than QSI. QSI segment assets include certain marketable securities, notes receivable, wireless spectrum, other investments and all assets of consolidated subsidiaries included in QSI. QSI segment assets related to the discontinued FLO TV business totaled
$59 million
and
$913 million
at September 30, 2012 and
September 25, 2011
, respectively. QSI assets at
September 29, 2013
,
September 30, 2012
and
September 25, 2011
included
$17 million
,
$11 million
and
$20 million
, respectively, related to investments in equity method investees. Reconciling items for total assets included
$892 million
,
$1.2 billion
and
$806 million
at
September 29, 2013
,
September 30, 2012
and
September 25, 2011
, respectively, of goodwill and other assets related to the Company’s QMT division, a nonreportable segment developing display technology for mobile devices and other applications. Total segment assets also differ from total assets on a consolidated basis as a result of unallocated corporate assets primarily comprised of certain cash, cash equivalents, marketable securities, property, plant and equipment, deferred tax assets, other intangible assets and assets of nonreportable segments. The net book values of long-lived tangible assets located outside of the United States were
$896 million
,
$1.1 billion
and
$629 million
at
September 29, 2013
,
September 30, 2012
and
September 25, 2011
, respectively. The net book values of long-lived tangible assets located in the United States were
$2.1 billion
,
$1.8 billion
and
$1.8 billion
at
September 29, 2013
,
September 30, 2012
and
September 25, 2011
, respectively.
Revenues from each of the Company’s divisions aggregated into the QWI reportable segment were as follows (in millions):
|
2013
|
2012
|
2011
|
|||||||||
|
Omnitracs
|
$
|
372
|
|
$
|
371
|
|
$
|
395
|
|
||
|
QIS
|
138
|
|
151
|
|
150
|
|
|||||
|
QGOV
|
102
|
|
109
|
|
100
|
|
|||||
|
QRS
|
1
|
|
2
|
|
11
|
|
|||||
|
$
|
613
|
|
$
|
633
|
|
$
|
656
|
|
|||
F-
27
QUALCOMM Incorporated
NOTES TO CONSOLIDATED FINANCIAL STATEMENTS
Other reconciling items were comprised as follows (in millions):
|
2013
|
2012
|
2011
|
|||||||||
|
Revenues
|
|
|
|
||||||||
|
Nonreportable segments
|
$
|
(12
|
)
|
$
|
24
|
|
$
|
23
|
|
||
|
Intersegment eliminations
|
(4
|
)
|
(4
|
)
|
(3
|
)
|
|||||
|
|
$
|
(16
|
)
|
$
|
20
|
|
$
|
20
|
|
||
|
EBT
|
|
|
|||||||||
|
Unallocated cost of equipment and services revenues
|
$
|
(335
|
)
|
$
|
(300
|
)
|
$
|
(210
|
)
|
||
|
Unallocated research and development expenses
|
(789
|
)
|
(702
|
)
|
(553
|
)
|
|||||
|
Unallocated selling, general and administrative expenses
|
(502
|
)
|
(549
|
)
|
(506
|
)
|
|||||
|
Unallocated other expense
|
(173
|
)
|
—
|
|
—
|
|
|||||
|
Unallocated investment income, net
|
877
|
|
928
|
|
756
|
|
|||||
|
Nonreportable segments
|
(711
|
)
|
(511
|
)
|
(324
|
)
|
|||||
|
Intersegment eliminations
|
—
|
|
—
|
|
(1
|
)
|
|||||
|
$
|
(1,633
|
)
|
$
|
(1,134
|
)
|
$
|
(838
|
)
|
|||
Nonreportable segments’ losses before taxes during fiscal
2013
,
2012
and
2011
were primarily attributable to the Company’s QMT division. Effectively all equity in earnings (losses) of investees was recorded in QSI in fiscal
2013
,
2012
and
2011
. Amounts included in unallocated expenses related to the amortization and impairment of certain intangible assets, contract terminations and the recognition of the step-up of inventories to fair value that resulted from acquisitions were as follows (in millions):
|
2013
|
2012
|
2011
|
|||||||||
|
Unallocated cost of equipment and services revenues
|
$
|
264
|
|
$
|
225
|
|
$
|
143
|
|
||
|
Unallocated research and development expenses
|
3
|
|
—
|
|
6
|
|
|||||
|
Unallocated selling, general and administrative expenses
|
26
|
|
43
|
|
59
|
|
|||||
In fiscal 2013, 2012 and 2011, interest income included in QSI EBT was
$8 million
,
$19 million
and
$20 million
, respectively, and interest expense included in QSI EBT was
$18 million
,
$79 million
and
$99 million
, respectively. Interest income and interest expense recorded by other segments were negligible in all periods presented.
Intersegment revenues are based on prevailing market rates for substantially similar products and services or an approximation thereof, but the purchasing segment may record the cost of revenues at the selling segment’s original cost. In that event, the elimination of the selling segment’s gross margin is included with other intersegment eliminations in reconciling items. QCT revenues for fiscal
2013
,
2012
and
2011
included
$3 million
,
$4 million
and
$3 million
of intersegment revenues, respectively. All other revenues for reportable segments were from external customers for all periods presented.
The Company distinguishes revenues from external customers by geographic areas based on the location to which its products, software or services are delivered or, for QTL licensing revenues, the invoiced addresses of its licensees. Sales information by geographic area was as follows (in millions):
|
2013
|
2012
|
2011
|
|||||||||
|
China
|
$
|
12,288
|
|
$
|
7,971
|
|
$
|
4,744
|
|
||
|
South Korea
|
4,983
|
|
4,203
|
|
2,887
|
|
|||||
|
Taiwan
|
2,683
|
|
2,648
|
|
2,550
|
|
|||||
|
United States
|
805
|
|
967
|
|
897
|
|
|||||
|
Other foreign
|
4,107
|
|
3,332
|
|
3,879
|
|
|||||
|
|
$
|
24,866
|
|
$
|
19,121
|
|
$
|
14,957
|
|
||
F-
28
QUALCOMM Incorporated
NOTES TO CONSOLIDATED FINANCIAL STATEMENTS
During fiscal 2013, the Company acquired
five
businesses for total cash consideration of
$115 million
. Technology-based intangible assets recognized in the amount of
$24 million
are being amortized on a straight-line basis over a weighted-average useful life of
six
years. Goodwill of
$82 million
was recognized in these transactions, of which
$21 million
is expected to be deductible for tax purposes.
During fiscal 2012, the Company acquired
eight
businesses for total cash consideration of
$774 million
. Technology-based intangible assets recognized in the amount of
$164 million
are being amortized on a straight-line basis over a weighted-average useful life of
six
years. The Company recorded
$62 million
related to
10
in-process research and development (IPR&D) projects. At September 29, 2013, the remaining IPR&D of
$51 million
consisted of
six
projects, which are expected to be completed within
two
years. Upon completion, the IPR&D projects will be amortized over their useful lives, which are expected to range between
three
to
nine
years. Goodwill of
$517 million
was recognized in these transactions, of which
$71 million
is expected to be deductible for tax purposes.
On May 24, 2011, the Company acquired Atheros Communications, Inc. (Atheros) for total cash consideration of
$3.1 billion
(net of
$233 million
of cash acquired) and the exchange of vested and earned unvested share-based awards with an estimated fair value of
$106 million
. The primary objective of the acquisition was to help accelerate the expansion of the Company’s technologies and platforms to new businesses beyond cellular, including home, enterprise and carrier networking. Atheros was integrated into the QCT segment. The
$3.5 billion
total purchase price was allocated as follows:
$1.8 billion
to goodwill,
$856 million
to amortizable intangible assets,
$150 million
to IPR&D and
$691 million
to other net assets.
Goodwill recognized in the Atheros acquisition is not deductible for tax purposes and was allocated to the QCT segment for annual impairment testing purposes. Goodwill largely consists of expected revenue synergies resulting from the combination of product portfolios, cost synergies related to reduction in headcount growth and lower manufacturing costs, assembled workforce and access to additional sales and distribution channels. The intangible assets acquired are being amortized on a straight-line basis over weighted-average useful lives of
four
years,
six
years and
three
years for technology-based, marketing-related and customer-related intangible assets, respectively. At September 29, 2013, the remaining IPR&D of
$3 million
consisted of
one
project, which is expected to be completed over the
next year
. The Company’s results of operations for fiscal 2011 included the operating results of Atheros since the date of acquisition, the amounts of which were not material.
Unaudited pro forma revenues and net income attributable to Qualcomm for fiscal 2011, presenting the results of operations of Qualcomm and Atheros as though the companies had been combined as of the beginning of fiscal 2010, were
$15.6 billion
and
$4.3 billion
, respectively. This unaudited pro forma information is provided for informational purposes only and is not indicative of the results of operations that would have been achieved if the acquisition had taken place as of the beginning of fiscal 2010.
During fiscal 2011, the Company acquired
nine
other businesses for total cash consideration of
$466 million
. Technology-based intangible assets recognized in the amount of
$150 million
are being amortized on a straight-line basis over a weighted-average useful life of
five
years. Goodwill of
$276 million
was recognized in these transactions, of which
$234 million
is expected to be deductible for tax purposes.
Goodwill recognized in these acquisitions was assigned to the Company’s reportable segments as follows (in millions):
|
2013
|
2012
|
2011
|
|||||||||
|
QCT
|
$
|
65
|
|
$
|
364
|
|
$
|
1,998
|
|
||
|
QWI
|
—
|
|
—
|
|
36
|
|
|||||
|
QTL
|
—
|
|
22
|
|
6
|
|
|||||
|
Nonreportable segments
|
17
|
|
131
|
|
8
|
|
|||||
|
$
|
82
|
|
$
|
517
|
|
$
|
2,048
|
|
|||
F-
29
QUALCOMM Incorporated
NOTES TO CONSOLIDATED FINANCIAL STATEMENTS
In fiscal 2010, the Company established subsidiaries in India to operate a wireless network using Broadband Wireless Access (BWA) spectrum (the BWA subsidiaries). In June 2012, Bharti Airtel Limited (Bharti), an Indian wireless network operator, purchased shares in the BWA subsidiaries that were held by two third-party Indian investors, and the BWA subsidiaries issued additional equity interests to Bharti for
$85 million
, reducing the Company’s ownership interest in each of the BWA subsidiaries to
51%
. On June 25, 2013, the BWA subsidiaries issued additional equity interests to Bharti for
$11 million
, further reducing the Company’s ownership interests to
49%
, and redeemed all of the outstanding debentures using funding provided by Bharti through subordinated debt (Note 7). Also, Bharti gained additional power over significant activities through certain leadership changes. These events resulted in a change in control of the BWA subsidiaries and therefore, the BWA subsidiaries were deconsolidated from the Company’s financial statements. Prior to the deconsolidation, the assets and liabilities of the BWA subsidiaries were classified as held for sale.
As a result of the deconsolidation, the Company recognized a gain in net investment income of
$6 million
measured as the difference between (a) the net fair values of the retained noncontrolling investment and the Company’s guarantee of the former BWA subsidiaries’ bank loans (Note 7) and (b) the carrying values of the former BWA subsidiaries’ net assets, including cumulative translation losses and noncontrolling interests. Total assets and total liabilities were reduced by
$1.0 billion
and
$999 million
, respectively. Such assets and liabilities consisted primarily of wireless spectrum, network-related assets and loan obligations. The deconsolidation of these amounts represented a noncash investing and noncash financing transaction and was not reflected in the statement of cash flows for the nine months ended June 30, 2013. The fair value of the Company’s retained noncontrolling investment of
$34 million
was determined by applying a discounted cash flow valuation model to the estimated cash proceeds that the Company expected to receive upon the sale of its interest to Bharti.
The former BWA subsidiaries were merged into one entity on August 5, 2013. On August 30, 2013, the remaining former BWA subsidiary repaid all of the outstanding loans, excluding the DoT loan, using funding provided by Bharti in the form of subordinated debt (Note 7). Also on August 30, 2013, Bharti converted the subordinated debt, and the former BWA subsidiary issued additional equity interests to Bharti, further reducing the Company’s ownership interest to
7%
. On October 15, 2013, the DoT loan was repaid using funding provided by Bharti (Note 7), and on October 17, 2013, Bharti acquired all of the Company’s interest in the remaining former subsidiary.
On March 27, 2011, the FLO TV business and network were shut down. On
December 27, 2011
, the Company completed the sale of substantially all of its 700 MHz spectrum for
$1.9 billion
, and as a result, the Company recognized a gain in discontinued operations of
$1.2 billion
during fiscal
2012
. Accordingly, the results of operations of the FLO TV business were presented as discontinued operations. Income (loss) from discontinued operations included share-based compensation and excluded certain general corporate expenses allocated to the FLO TV business during the periods presented. The results of the discontinued FLO TV operations were as follows (in millions):
|
2012
|
2011
|
||||||
|
Revenues
|
$
|
—
|
|
$
|
5
|
|
|
|
Income (loss) from discontinued operations
|
$
|
1,203
|
|
$
|
(507
|
)
|
|
|
Income tax (expense) benefit
|
(427
|
)
|
194
|
|
|||
|
Discontinued operations, net of income taxes
|
$
|
776
|
|
$
|
(313
|
)
|
|
Fair value is defined as the exchange price that would be received for an asset or paid to transfer a liability (an exit price) in the principal or most advantageous market for the asset or liability in an orderly transaction between market participants as of the measurement date. Applicable accounting guidance provides an established hierarchy for inputs used in measuring fair value that maximizes the use of observable inputs and minimizes the use of unobservable inputs by requiring that the most observable inputs be used when available. Observable inputs are inputs that market participants would use in valuing the asset or liability and are developed based on market data obtained from sources independent of the Company. Unobservable inputs are inputs that reflect the Company’s assumptions about the factors that market participants would use in valuing the asset or liability. There are three levels of inputs that may be used to measure fair value:
F-
30
QUALCOMM Incorporated
NOTES TO CONSOLIDATED FINANCIAL STATEMENTS
|
•
|
Level 1 includes financial instruments for which quoted market prices for identical instruments are available in active markets.
|
|
•
|
Level 2 includes financial instruments for which there are inputs other than quoted prices included within Level 1 that are observable for the instrument.
|
|
•
|
Level 3 includes financial instruments for which fair value is derived from valuation techniques in which one or more significant inputs are unobservable, including the Company’s own assumptions.
|
Assets and liabilities are classified based on the lowest level of input that is significant to the fair value measurements. The Company reviews the fair value hierarchy classification on a quarterly basis. Changes in the observability of valuation inputs may result in a reclassification of levels for certain securities within the fair value hierarchy.
The following table presents the Company’s fair value hierarchy for assets and liabilities measured at fair value on a recurring basis at
September 29, 2013
(in millions):
|
Level 1
|
Level 2
|
Level 3
|
Total
|
||||||||||||
|
Assets
|
|
|
|
|
|||||||||||
|
Cash equivalents
|
$
|
4,206
|
|
$
|
1,346
|
|
$
|
—
|
|
$
|
5,552
|
|
|||
|
Marketable securities
|
|
|
|
|
|||||||||||
|
U.S. Treasury securities and government-related securities
|
648
|
|
434
|
|
—
|
|
1,082
|
|
|||||||
|
Corporate bonds and notes
|
—
|
|
11,870
|
|
—
|
|
11,870
|
|
|||||||
|
Mortgage- and asset-backed securities
|
—
|
|
938
|
|
239
|
|
1,177
|
|
|||||||
|
Auction rate securities
|
—
|
|
—
|
|
83
|
|
83
|
|
|||||||
|
Common and preferred stock
|
1,541
|
|
818
|
|
—
|
|
2,359
|
|
|||||||
|
Equity funds
|
960
|
|
—
|
|
—
|
|
960
|
|
|||||||
|
Debt funds
|
2,157
|
|
3,576
|
|
—
|
|
5,733
|
|
|||||||
|
Total marketable securities
|
5,306
|
|
17,636
|
|
322
|
|
23,264
|
|
|||||||
|
Derivative instruments
|
—
|
|
40
|
|
—
|
|
40
|
|
|||||||
|
Other investments
|
243
|
|
—
|
|
—
|
|
243
|
|
|||||||
|
Total assets measured at fair value
|
$
|
9,755
|
|
$
|
19,022
|
|
$
|
322
|
|
$
|
29,099
|
|
|||
|
Liabilities
|
|
|
|
|
|||||||||||
|
Derivative instruments
|
$
|
2
|
|
$
|
21
|
|
$
|
—
|
|
$
|
23
|
|
|||
|
Other liabilities
|
244
|
|
—
|
|
—
|
|
244
|
|
|||||||
|
Total liabilities measured at fair value
|
$
|
246
|
|
$
|
21
|
|
$
|
—
|
|
$
|
267
|
|
|||
Cash Equivalents and Marketable Securities.
The Company considers all highly liquid investments, including repurchase agreements, with original maturities of three months or less to be cash equivalents. Cash equivalents are comprised of money market funds, certificates of deposit, commercial paper, government agencies’ securities and repurchase agreements fully collateralized by government agencies’ securities.
With the exception of auction rate securities, the Company obtains pricing information from quoted market prices, pricing vendors or quotes from brokers/dealers. The Company conducts reviews of its primary pricing vendors to determine whether the inputs used in the vendor’s pricing processes are deemed to be observable. The fair value for interest-bearing securities includes accrued interest.
The fair value of U.S. Treasury securities and government-related securities, corporate bonds and notes and common and preferred stock is generally determined using standard observable inputs, including reported trades, quoted market prices, matrix pricing, benchmark yields, broker/dealer quotes, issuer spreads, two-sided markets and/or benchmark securities.
The fair value of debt and equity funds is reported at published net asset values. The Company assesses the daily frequency and size of transactions at published net asset values and/or the funds’ underlying holdings to determine whether fair value is based on observable or unobservable inputs.
F-
31
QUALCOMM Incorporated
NOTES TO CONSOLIDATED FINANCIAL STATEMENTS
The fair value of highly rated mortgage- and asset-backed securities is derived from the use of matrix pricing (prices for similar securities) or, in some cases, cash flow pricing models with observable inputs such as contractual terms, maturity, credit rating and/or securitization structure to determine the timing and amount of future cash flows. Certain mortgage- and asset-backed securities, principally those rated below AAA, may require the use of significant unobservable inputs to estimate fair value, such as default likelihood, recovery rates and prepayment speed.
The fair value of auction rate securities is estimated by the Company using a discounted cash flow model that incorporates transaction details such as contractual terms, maturity and timing and amount of future cash flows, as well as assumptions related to liquidity, default likelihood and recovery, the future state of the auction rate market and credit valuation adjustments of market participants. Though certain of the securities held by the Company are pools of student loans guaranteed by the U.S. government, prepayment speeds and illiquidity discounts are considered significant unobservable inputs. These additional inputs are generally unobservable, and therefore, auction rate securities are included in Level 3.
Derivative Instruments.
Derivative instruments include foreign currency option and forward contracts to manage foreign exchange risk for certain foreign currency transactions and certain balances denominated in a foreign currency; option, forward and swap contracts to acquire or reduce foreign exchange risk and/or equity, prepayment and credit risks for portfolios of marketable securities classified as trading; and warrants to purchase common stock of other companies at fixed prices. Derivative instruments that are traded on an exchange are valued using quoted market prices and are included in Level 1. Derivative instruments that are not traded on an exchange are valued using conventional calculations/models that are primarily based on observable inputs, such as foreign currency exchange rates, the Company’s stock price, volatilities and interest rates, and therefore, such derivative instruments are included in Level 2.
Other Investments and Other Liabilities.
Other investments and other liabilities included in Level 1 are comprised of the Company’s deferred compensation plan liability and related assets, which consist of mutual funds classified as trading securities and included in other noncurrent assets. Other liabilities included in Level 3 in fiscal
2012
were comprised of put rights held by third parties representing interests in certain of the Company’s subsidiaries. These put rights were terminated during the third quarter of fiscal
2012
and were previously valued with a conventional option pricing model using significant unobservable inputs.
Activity between Levels of the Fair Value Hierarchy.
There were no significant transfers between Level 1 and Level 2 during fiscal
2013
or
2012
. When a determination is made to classify an asset or liability within Level 3, the determination is based upon the significance of the unobservable inputs to the overall fair value measurement. The following table includes the activity for marketable securities and other liabilities classified within Level 3 of the valuation hierarchy (in millions):
|
|
2013
|
2012
|
||||||||||||||||||
|
Auction Rate
Securities
|
Mortgage- and Asset-Backed
Securities
|
Auction Rate
Securities
|
Mortgage- and Asset-Backed
Securities
|
Other Liabilities
|
||||||||||||||||
|
Beginning balance of Level 3
|
$
|
118
|
|
$
|
203
|
|
$
|
124
|
|
$
|
27
|
|
$
|
7
|
|
|||||
|
Total realized and unrealized gains or losses:
|
|
|
|
|||||||||||||||||
|
Included in investment income, net
|
—
|
|
8
|
|
—
|
|
5
|
|
(7
|
)
|
||||||||||
|
Included in other comprehensive income
|
1
|
|
(6
|
)
|
—
|
|
7
|
|
—
|
|
||||||||||
|
Purchases
|
—
|
|
163
|
|
—
|
|
149
|
|
—
|
|
||||||||||
|
Sales
|
—
|
|
(70
|
)
|
—
|
|
—
|
|
—
|
|
||||||||||
|
Settlements
|
(36
|
)
|
(77
|
)
|
(6
|
)
|
(28
|
)
|
—
|
|
||||||||||
|
Transfers into Level 3
|
—
|
|
18
|
|
—
|
|
43
|
|
—
|
|
||||||||||
|
Ending balance of Level 3
|
$
|
83
|
|
$
|
239
|
|
$
|
118
|
|
$
|
203
|
|
$
|
—
|
|
|||||
The Company recognizes transfers into and out of levels within the fair value hierarchy at the end of the fiscal month in which the actual event or change in circumstances that caused the transfer occurs. Transfers into Level 3 in fiscal
2013
and
2012
primarily consisted of debt securities with significant inputs that became unobservable as a result of an increased likelihood of a shortfall in contractual cash flows or a significant downgrade in credit ratings.
Nonrecurring Fair Value Measurements.
The Company measures certain assets at fair value on a nonrecurring basis. These assets include cost and equity method investments when they are deemed to be other-than-temporarily impaired or retained upon deconsolidation of a subsidiary, assets acquired and liabilities assumed in an acquisition or in a nonmonetary exchange, and property, plant and equipment and intangible assets that are written down to fair value when they are held for sale or
F-
32
QUALCOMM Incorporated
NOTES TO CONSOLIDATED FINANCIAL STATEMENTS
determined to be impaired. During fiscal 2013 and 2012, certain property, plant and equipment related to the Company’s QMT division were written down to their estimated fair values resulting in impairment charges of
$158 million
and
$54 million
, respectively (Note 2). At
September 29, 2013
, the carrying value of the QMT division’s property, plant and equipment was
$724 million
. During fiscal 2013, the Company recorded its retained investment in the former BWA subsidiaries at its estimated fair value of
$34 million
(Note 10). During fiscal 2012 and 2011, goodwill related to the Company’s QRS division was written down to implied fair value resulting in impairment charges of
$23 million
and
$114 million
, respectively. The impairment charges were recorded in other expenses. At
September 29, 2013
, the carrying value of the QRS division’s goodwill was
$17 million
. The estimation of fair values and cash flows used in these fair value measurements required the use of significant unobservable inputs, and as a result, the fair value measurements were classified as Level 3. During fiscal
2013
,
2012
and
2011
, the Company did not have any other significant assets or liabilities that were measured at fair value on a nonrecurring basis in periods subsequent to initial recognition.
Marketable securities were comprised as follows (in millions):
|
|
Current
|
Noncurrent
|
|||||||||||||
|
September 29, 2013
|
September 30, 2012
|
September 29, 2013
|
September 30, 2012
|
||||||||||||
|
Trading:
|
|
|
|
|
|||||||||||
|
U.S. Treasury securities and government-related securities
|
$
|
241
|
|
$
|
196
|
|
$
|
49
|
|
$
|
254
|
|
|||
|
Corporate bonds and notes
|
269
|
|
283
|
|
256
|
|
176
|
|
|||||||
|
Mortgage- and asset-backed securities
|
—
|
|
—
|
|
104
|
|
120
|
|
|||||||
|
Total trading
|
$
|
510
|
|
479
|
|
409
|
|
550
|
|
||||||
|
Available-for-sale:
|
|
|
|
|
|||||||||||
|
U.S. Treasury securities and government-related securities
|
$
|
721
|
|
$
|
362
|
|
$
|
71
|
|
$
|
592
|
|
|||
|
Corporate bonds and notes
|
4,533
|
|
4,554
|
|
6,812
|
|
7,570
|
|
|||||||
|
Mortgage- and asset-backed securities
|
745
|
|
1,157
|
|
328
|
|
241
|
|
|||||||
|
Auction rate securities
|
—
|
|
—
|
|
83
|
|
118
|
|
|||||||
|
Common and preferred stock
|
8
|
|
57
|
|
2,351
|
|
2,030
|
|
|||||||
|
Equity funds
|
—
|
|
—
|
|
960
|
|
1,126
|
|
|||||||
|
Debt funds
|
2,307
|
|
1,958
|
|
2,889
|
|
1,716
|
|
|||||||
|
Total available-for-sale
|
8,314
|
|
8,088
|
|
13,494
|
|
13,393
|
|
|||||||
|
Fair value option:
|
|
|
|
|
|||||||||||
|
Debt fund
|
—
|
|
—
|
|
537
|
|
520
|
|
|||||||
|
Total marketable securities
|
$
|
8,824
|
|
$
|
8,567
|
|
$
|
14,440
|
|
$
|
14,463
|
|
|||
The Company holds an investment in a debt fund for which the Company elected the fair value option because the Company is able to redeem its shares at net asset value, which is determined daily. The investment would have otherwise been recorded using the equity method. The debt fund has no single maturity date. At
September 29, 2013
, the Company had an effective ownership interest in the debt fund of
21%
. Net increases in fair value associated with this investment of
$17 million
,
$45 million
and
$9 million
were recognized in net investment income in fiscal
2013
,
2012
and 2011, respectively.
The Company classifies certain portfolios of debt securities that utilize derivative instruments to acquire or reduce foreign exchange risk, interest rate risk and/or equity, prepayment and credit risk as trading. Net losses recognized on debt securities classified as trading still held at September 29, 2013 were
$20 million
. Net gains recognized on debt securities classified as trading still held at September 30, 2012 were
$22 million
. The Company did not hold any securities classified as trading during fiscal 2011.
At
September 29, 2013
, the contractual maturities of available-for-sale debt securities were as follows (in millions):
F-
33
QUALCOMM Incorporated
NOTES TO CONSOLIDATED FINANCIAL STATEMENTS
|
Years to Maturity
|
No Single
|
|
||||||||||||||||||||
|
Less Than
|
One to
|
Five to
|
Greater Than
|
Maturity
|
|
|||||||||||||||||
|
One Year
|
Five Years
|
Ten Years
|
Ten Years
|
Date
|
Total
|
|||||||||||||||||
|
$
|
1,695
|
|
$
|
6,842
|
|
$
|
2,303
|
|
$
|
1,296
|
|
$
|
6,353
|
|
$
|
18,489
|
|
|||||
Debt securities with no single maturity date included debt funds, mortgage- and asset-backed securities and auction rate securities.
The Company recorded realized gains and losses on sales of available-for-sale securities as follows (in millions):
|
Fiscal Year
|
Gross Realized Gains
|
Gross Realized Losses
|
Net Realized Gains
|
||||||||
|
2013
|
$
|
430
|
|
$
|
(142
|
)
|
$
|
288
|
|
||
|
2012
|
296
|
|
(25
|
)
|
271
|
|
|||||
|
2011
|
356
|
|
(30
|
)
|
326
|
|
|||||
Available-for-sale securities were comprised as follows (in millions):
|
Cost
|
Unrealized
Gains
|
Unrealized
Losses
|
Fair Value
|
||||||||||||
|
September 29, 2013
|
|
|
|
|
|||||||||||
|
Equity securities
|
$
|
2,570
|
|
$
|
793
|
|
$
|
(44
|
)
|
$
|
3,319
|
|
|||
|
Debt securities (including debt funds)
|
18,255
|
|
396
|
|
(162
|
)
|
18,489
|
|
|||||||
|
|
$
|
20,825
|
|
$
|
1,189
|
|
$
|
(206
|
)
|
$
|
21,808
|
|
|||
|
September 30, 2012
|
|
|
|
|
|||||||||||
|
Equity securities
|
$
|
2,599
|
|
$
|
628
|
|
$
|
(14
|
)
|
$
|
3,213
|
|
|||
|
Debt securities (including debt funds)
|
17,714
|
|
573
|
|
(19
|
)
|
18,268
|
|
|||||||
|
|
$
|
20,313
|
|
$
|
1,201
|
|
$
|
(33
|
)
|
$
|
21,481
|
|
|||
The following table shows the gross unrealized losses and fair values of the Company’s investments in individual securities that are classified as available-for-sale and have been in a continuous unrealized loss position deemed to be temporary for less than 12 months and for more than 12 months, aggregated by investment category (in millions):
|
|
September 29, 2013
|
||||||||||||||
|
|
Less than 12 months
|
More than 12 months
|
|||||||||||||
|
|
Fair Value
|
Unrealized
Losses
|
Fair Value
|
Unrealized
Losses
|
|||||||||||
|
U.S. Treasury securities and government-related securities
|
$
|
42
|
|
$
|
(1
|
)
|
$
|
—
|
|
$
|
—
|
|
|||
|
Corporate bonds and notes
|
2,084
|
|
(31
|
)
|
24
|
|
(1
|
)
|
|||||||
|
Mortgage- and asset-backed securities
|
367
|
|
(5
|
)
|
24
|
|
—
|
|
|||||||
|
Auction rate securities
|
—
|
|
—
|
|
83
|
|
(1
|
)
|
|||||||
|
Common and preferred stock
|
291
|
|
(41
|
)
|
—
|
|
—
|
|
|||||||
|
Debt funds
|
2,776
|
|
(123
|
)
|
4
|
|
—
|
|
|||||||
|
Equity funds
|
82
|
|
(3
|
)
|
—
|
|
—
|
|
|||||||
|
|
$
|
5,642
|
|
$
|
(204
|
)
|
$
|
135
|
|
$
|
(2
|
)
|
|||
F-
34
QUALCOMM Incorporated
NOTES TO CONSOLIDATED FINANCIAL STATEMENTS
|
|
September 30, 2012
|
||||||||||||||
|
|
Less than 12 months
|
More than 12 months
|
|||||||||||||
|
|
Fair Value
|
Unrealized
Losses
|
Fair Value
|
Unrealized
Losses
|
|||||||||||
|
Corporate bonds and notes
|
$
|
723
|
|
$
|
(8
|
)
|
$
|
256
|
|
$
|
(9
|
)
|
|||
|
Mortgage- and asset-backed securities
|
143
|
|
(1
|
)
|
7
|
|
—
|
|
|||||||
|
Auction rate securities
|
—
|
|
—
|
|
115
|
|
(1
|
)
|
|||||||
|
Common and preferred stock
|
105
|
|
(5
|
)
|
9
|
|
—
|
|
|||||||
|
Equity funds
|
64
|
|
(4
|
)
|
36
|
|
(5
|
)
|
|||||||
|
|
$
|
1,035
|
|
$
|
(18
|
)
|
$
|
423
|
|
$
|
(15
|
)
|
|||
At
September 29, 2013
, the Company concluded that the unrealized losses on its available-for-sale securities were temporary. Further, for common and certain preferred stock and for equity and debt funds with unrealized losses, the Company has the ability and the intent to hold such securities until they recover, which is expected to be within a reasonable period of time. For debt securities with unrealized losses, the Company does not have the intent to sell, nor is it more likely than not that the Company will be required to sell, such securities before recovery or maturity.
The following table shows the activity for the credit loss portion of other-than-temporary impairments on debt securities held by the Company (in millions):
|
2013
|
2012
|
2011
|
|||||||||
|
Beginning balance of credit losses
|
$
|
31
|
|
$
|
46
|
|
$
|
109
|
|
||
|
Reductions in credit losses related to securities the Company intends to sell
|
(7
|
)
|
(1
|
)
|
(40
|
)
|
|||||
|
Credit losses recognized on securities previously not impaired
|
1
|
|
5
|
|
2
|
|
|||||
|
Additional credit losses recognized on securities previously impaired
|
1
|
|
2
|
|
—
|
|
|||||
|
Reductions in credit losses related to securities sold
|
(21
|
)
|
(21
|
)
|
(20
|
)
|
|||||
|
Accretion of credit losses due to an increase in cash flows expected to be collected
|
(1
|
)
|
—
|
|
(5
|
)
|
|||||
|
Ending balance of credit losses
|
$
|
4
|
|
$
|
31
|
|
$
|
46
|
|
||
F-
35
QUALCOMM Incorporated
NOTES TO CONSOLIDATED FINANCIAL STATEMENTS
The following financial information reflects all normal recurring adjustments that are, in the opinion of management, necessary for a fair statement of the results of the interim periods.
The table below presents quarterly data for fiscal
2013
and
2012
(in millions, except per share data):
|
1st Quarter
|
2nd Quarter
|
3rd Quarter
|
4th Quarter
|
||||||||||||
|
2013 (1)
|
|
|
|
|
|||||||||||
|
Revenues
|
$
|
6,018
|
|
$
|
6,124
|
|
$
|
6,243
|
|
$
|
6,480
|
|
|||
|
Operating income
|
2,088
|
|
1,877
|
|
1,677
|
|
1,588
|
|
|||||||
|
Net income
|
1,903
|
|
1,863
|
|
1,578
|
|
1,501
|
|
|||||||
|
Net income attributable to Qualcomm
|
1,906
|
|
1,866
|
|
1,580
|
|
1,501
|
|
|||||||
|
Basic earnings per share attributable to Qualcomm (2)
|
$
|
1.12
|
|
$
|
1.08
|
|
$
|
0.91
|
|
$
|
0.88
|
|
|||
|
Diluted earnings per share attributable to Qualcomm (2)
|
$
|
1.09
|
|
$
|
1.06
|
|
$
|
0.90
|
|
$
|
0.86
|
|
|||
|
2012 (1)
|
|
|
|
|
|||||||||||
|
Revenues
|
$
|
4,681
|
|
$
|
4,943
|
|
$
|
4,626
|
|
$
|
4,871
|
|
|||
|
Operating income
|
1,551
|
|
1,514
|
|
1,382
|
|
1,235
|
|
|||||||
|
Income from continuing operations
|
1,400
|
|
1,438
|
|
1,206
|
|
1,240
|
|
|||||||
|
Discontinued operations, net of tax
|
(5
|
)
|
761
|
|
(3
|
)
|
23
|
|
|||||||
|
Net income
|
1,395
|
|
2,199
|
|
1,203
|
|
1,263
|
|
|||||||
|
Net income attributable to Qualcomm
|
1,401
|
|
2,230
|
|
1,207
|
|
1,271
|
|
|||||||
|
Basic earnings per share attributable to Qualcomm (2):
|
|||||||||||||||
|
Continuing operations
|
$
|
0.83
|
|
$
|
0.86
|
|
$
|
0.70
|
|
$
|
0.73
|
|
|||
|
Discontinued operations
|
—
|
|
0.45
|
|
—
|
|
0.02
|
|
|||||||
|
Net income
|
0.83
|
|
1.31
|
|
0.70
|
|
0.75
|
|
|||||||
|
Diluted earnings per share attributable to Qualcomm (2):
|
|||||||||||||||
|
Continuing operations
|
$
|
0.81
|
|
$
|
0.84
|
|
$
|
0.69
|
|
$
|
0.72
|
|
|||
|
Discontinued operations
|
—
|
|
0.44
|
|
—
|
|
0.01
|
|
|||||||
|
Net income
|
0.81
|
|
1.28
|
|
0.69
|
|
0.73
|
|
|||||||
|
(1)
|
Amounts, other than per share amounts, are rounded to millions each quarter. Therefore, the sum of the quarterly amounts may not equal the annual amounts reported.
|
|
(2)
|
Earnings per share attributable to Qualcomm are computed independently for each quarter and the full year based upon respective average shares outstanding. Therefore, the sum of the quarterly earnings per share amounts may not equal the annual amounts reported.
|
F-
36
SCHEDULE II
QUALCOMM INCORPORATED
VALUATION AND QUALIFYING ACCOUNTS
(In millions)
|
Balance at
Beginning of
Period
|
(Charged)
Credited to
Costs and
Expenses
|
Deductions
|
Other
|
Balance at
End of
Period
|
|||||||||||||||
|
Year ended September 29, 2013
|
|
|
|
|
|
|
|||||||||||||
|
Allowances:
|
|
|
|
|
|
|
|||||||||||||
|
— trade receivables
|
$
|
(1
|
)
|
$
|
(1
|
)
|
$
|
—
|
|
$
|
—
|
|
$
|
(2
|
)
|
||||
|
— notes receivables
|
(7
|
)
|
(5
|
)
|
—
|
|
2
|
|
(b)
|
(10
|
)
|
||||||||
|
Valuation allowance on deferred tax assets
|
(142
|
)
|
15
|
|
—
|
|
76
|
|
(c)
|
(51
|
)
|
||||||||
|
|
$
|
(150
|
)
|
$
|
9
|
|
$
|
—
|
|
$
|
78
|
|
$
|
(63
|
)
|
||||
|
Year ended September 30, 2012
|
|
|
|
|
|
|
|||||||||||||
|
Allowances:
|
|
|
|
|
|
|
|||||||||||||
|
— trade receivables
|
$
|
(2
|
)
|
$
|
—
|
|
$
|
1
|
|
$
|
—
|
|
|
$
|
(1
|
)
|
|||
|
— notes receivable
|
(3
|
)
|
(4
|
)
|
—
|
|
—
|
|
|
(7
|
)
|
||||||||
|
Valuation allowance on deferred tax assets
|
(98
|
)
|
(43
|
)
|
—
|
|
(1
|
)
|
(d)
|
(142
|
)
|
||||||||
|
|
$
|
(103
|
)
|
$
|
(47
|
)
|
$
|
1
|
|
$
|
(1
|
)
|
|
$
|
(150
|
)
|
|||
|
Year ended September 25, 2011
|
|
|
|
|
|
|
|||||||||||||
|
Allowances:
|
|
|
|
|
|
|
|||||||||||||
|
— trade receivables
|
$
|
(3
|
)
|
$
|
—
|
|
$
|
1
|
|
$
|
—
|
|
|
$
|
(2
|
)
|
|||
|
— notes receivable
|
(3
|
)
|
—
|
|
—
|
|
—
|
|
|
(3
|
)
|
||||||||
|
— investment receivables (a)
|
(9
|
)
|
6
|
|
3
|
|
—
|
|
—
|
|
|||||||||
|
Valuation allowance on deferred tax assets
|
(39
|
)
|
(42
|
)
|
—
|
|
(17
|
)
|
(e)
|
(98
|
)
|
||||||||
|
|
$
|
(54
|
)
|
$
|
(36
|
)
|
$
|
4
|
|
$
|
(17
|
)
|
$
|
(103
|
)
|
||||
|
(a)
|
This amount represents the allowance for investment receivables due for redemptions of money market investments.
|
|
(b)
|
This amount represents notes receivable on strategic investments that were converted to cost method investments.
|
|
(c)
|
This amount represents
$88 million
recorded as part of the gain on deconsolidation of certain subsidiaries, partially offset by
$12 million
recorded as a component of other comprehensive income.
|
|
(d)
|
This amount was recorded as a component of other comprehensive income.
|
|
(e)
|
This amount represents
$12 million
recorded as a result of an acquisition and
$5 million
recorded as a component of other comprehensive loss.
|
S-
1
TABLE OF CONTENTS
Part IItem 1. BusinessItem 1A. Risk FactorsItem 1B. Unresolved Staff CommentsItem 2. PropertiesItem 3. Legal ProceedingsItem 4. Mine Safety DisclosuresPart IIItem 5. Market For Registrant S Common Equity, Related Stockholder Matters and Issuer Purchases Of Equity SecuritiesItem 6. Selected Financial DataItem 7. Management S Discussion and Analysis Of Financial Condition and Results Of OperationsItem 7. ManagementItem 7A. Quantitative and Qualitative Disclosures About Market RiskItem 8. Financial Statements and Supplementary DataItem 9. Changes in and Disagreements with Accountants on Accounting and Financial DisclosureItem 9A. Controls and ProceduresItem 9B. Other InformationPart IIIItem 10. Directors, Executive Officers and Corporate GovernanceItem 11. Executive CompensationItem 12. Security Ownership Of Certain Beneficial Owners and Management and Related Stockholder MattersItem 13. Certain Relationships and Related Transactions, and Director IndependenceItem 14. Principal Accounting Fees and ServicesPart IVItem 15. Exhibits and Financial Statement SchedulesNote 1. The Company and Its Significant Accounting PoliciesNote 2. Composition Of Certain Financial Statement ItemsNote 3. Investment IncomeNote 4. Income TaxesNote 5. Capital StockNote 6. Employee Benefit PlansNote 7. Commitments and ContingenciesNote 8. Segment InformationNote 9. AcquisitionsNote 10. Deconsolidation Of and Retained Investment in The Bwa SubsidiariesNote 11. Discontinued OperationsNote 12. Fair Value MeasurementsNote 13. Marketable SecuritiesNote 14. Summarized Quarterly Data (unaudited)