QUAD/GRAPHICS, INC.
10-Ks and 10-Qs
|
|
|
|
|
|
|
|
|
|
|
|
|
|
|
|
|
|
|
|
|
|
|
|
|
|
|
|
|
|
|
|
|
|
|
|
|
|
|
|
|
|
|
|
|
|
|
|
|
|
|
|
|
UNITED STATES
SECURITIES AND EXCHANGE COMMISSION
Washington, D.C. 20549
FORM 10-K
|
T
|
ANNUAL REPORT PURSUANT TO SECTION 13 OR 15(d) OF THE SECURITIES EXCHANGE ACT OF 1934
|
For the fiscal year ended
December 31, 2018
or
|
¨
|
TRANSITION REPORT PURSUANT TO SECTION 13 OR 15(d) OF THE SECURITIES EXCHANGE ACT OF 1934
|
For the transition period from to
Commission File Number 001-34806
QUAD/GRAPHICS, INC.
(Exact name of registrant as specified in its charter)
|
Wisconsin
|
39-1152983
|
|
|
(State or other jurisdiction of incorporation or organization)
|
(I.R.S. Employer Identification No.)
|
|
|
N61 W23044 Harry’s Way, Sussex, Wisconsin 53089-3995
|
(414) 566-6000
|
|
|
(Address of principal executive offices) (Zip Code)
|
(Registrant’s telephone number, including area code)
|
|
Securities registered pursuant to Section 12(b) of the Act:
|
Title of Class
|
Name of Each Exchange on Which Registered
|
|
|
Class A Common Stock, par value $0.025 per share
|
The New York Stock Exchange, LLC
|
|
Securities registered pursuant to Section 12(g) of the Act:
None
Indicate by check mark if the registrant is a well-known seasoned issuer, as defined in Rule 405 of the Securities Act. Yes
¨
No
x
Indicate by check mark if the registrant is not required to file reports pursuant to Section 13 or Section 15(d) of the Act. Yes
¨
No
x
Indicate by check mark whether the registrant (1) has filed all reports required to be filed by Section 13 or 15(d) of the Securities Exchange Act of 1934 during the preceding 12 months (or for such shorter period that the registrant was required to file such reports), and (2) has been subject to such filing requirements for the past 90 days. Yes
x
No
¨
Indicate by check mark whether the registrant has submitted electronically every Interactive Data File required to be submitted pursuant to Rule 405 of Regulation S-T during the preceding 12 months (or for such shorter period that the registrant was required to submit such files). Yes
x
No
¨
Indicate by check mark if disclosure of delinquent filers pursuant to Item 405 of Regulation S-K is not contained herein, and will not be contained, to the best of registrant’s knowledge, in definitive proxy or information statements incorporated by reference in Part III of this Form 10-K or any amendment to this Form 10-K.
¨
Indicate by check mark whether the registrant is a large accelerated filer, an accelerated filer, a non-accelerated filer, smaller reporting company or an emerging growth company. See the definitions of “large accelerated filer,” “accelerated filer,” “smaller reporting company” and “emerging growth company” in Rule 12b-2 of the Exchange Act.
|
Large accelerated filer
x
|
Accelerated filer
o
|
|
|
Non-accelerated filer
o
|
Smaller reporting company
o
|
|
|
Emerging growth company
o
|
||
If an emerging growth company, indicate by check mark if the registrant has elected not to use the extended transition period for complying with any new or revised financial accounting standards provided pursuant to Section 13(a) of the Exchange Act.
¨
Indicate by check mark whether the registrant is a shell company (as defined in Rule 12b-2 of the Act). Yes
¨
No
x
The aggregate market value of the class A common stock (based on the closing price of
$20.83
per share on the New York Stock Exchange, LLC) on
June 29, 2018
, the last business day of the registrant’s most recently completed second fiscal quarter, held by non-affiliates was
$631,416,217
. The registrant’s class B common stock is not listed on a national securities exchange or traded in an organized over-the-counter market, but each share of the registrant’s class B common stock is convertible into one share of the registrant’s class A common stock.
Indicate the number of shares outstanding of each of the issuer’s classes of common stock as of the latest practicable date.
|
Class
|
|
Outstanding as of February 11, 2019
|
|
Class A Common Stock
|
|
38,374,368
|
|
Class B Common Stock
|
|
13,556,858
|
|
Class C Common Stock
|
|
—
|
DOCUMENTS INCORPORATED BY REFERENCE
Portions of the Proxy Statement for the registrant’s
2019
Annual Meeting of Shareholders are incorporated by reference into Part III of this Form 10-K.
QUAD/GRAPHICS, INC.
FORM 10-K INDEX
For the Year Ended
December 31, 2018
|
Page No.
|
|||
i
Forward-Looking Statements
To the extent any statements in this Annual Report on Form 10-K contain information that is not historical, these statements are forward-looking statements within the meaning of Section 21E of the Securities Exchange Act of 1934, as amended. These forward-looking statements relate to, among other things, the objectives, goals, strategies, beliefs, intentions, plans, estimates, prospects, projections and outlook of Quad/Graphics, Inc. (the “Company” or “Quad”), and can generally be identified by the use of words such as “may,” “will,” “expect,” “intend,” “estimate,” “anticipate,” “plan,” “foresee,” “believe” or “continue” or the negatives of these terms, variations on them and other similar expressions. In addition, any statements that refer to expectations, projections or other characterizations of future events or circumstances are forward-looking statements.
These forward-looking statements are not guarantees of future performance and are subject to risks, uncertainties and other factors, some of which are beyond the control of the Company. These risks, uncertainties and other factors could cause actual results to differ materially from those expressed or implied by those forward-looking statements. Among risks, uncertainties and other factors that may impact Quad are those described in Part I, Item 1A, “Risk Factors,” of this Annual Report on Form 10-K, as such may be amended or supplemented in Part II, Item 1A, “Risk Factors,” of the Company’s subsequently filed Quarterly Reports on Form 10-Q, and the following:
|
•
|
The impact of decreasing demand for printed materials and significant overcapacity in a highly competitive environment creates downward pricing pressures and potential under-utilization of assets;
|
|
•
|
The impact of digital media and similar technological changes, including digital substitution by consumers;
|
|
•
|
The impact of fluctuations in costs (including labor and labor-related costs, energy costs, freight rates and raw materials) and the impact of fluctuations in the availability of raw materials;
|
|
•
|
The failure to successfully identify, manage, complete and integrate acquisitions and investments, including the proposed acquisition of
LSC Communications, Inc.
(“
LSC
”);
|
|
•
|
The inability of the Company to reduce costs and improve operating efficiency rapidly enough to meet market conditions;
|
|
•
|
The impact of increased business complexity as a result of the Company’s transformation to a marketing solutions provider;
|
|
•
|
The impact of regulatory matters and legislative developments or changes in laws, including changes in cyber-security, privacy and environmental laws;
|
|
•
|
The impact of changing future economic conditions;
|
|
•
|
The failure of clients to perform under contracts or to renew contracts with clients on favorable terms or at all;
|
|
•
|
The failure to attract and retain qualified talent across the enterprise;
|
|
•
|
Significant capital expenditures may be needed to maintain the Company’s platforms and processes and to remain technologically and economically competitive;
|
|
•
|
The impact of changes in postal rates, service levels or regulations;
|
|
•
|
The fragility and decline in overall distribution channels, including newspaper distribution channels;
|
|
•
|
The impact of the various restrictive covenants in the Company’s debt facilities on the Company’s ability to operate its business;
|
|
•
|
The impact of risks associated with the operations outside of the United States (“U.S.”), including costs incurred or reputational damage suffered due to improper conduct of its employees, contractors or agents;
|
|
•
|
The impact on the holders of Quad’s class A common stock of a limited active market for such shares and the inability to independently elect directors or control decisions due to the voting power of the class B common stock;
|
|
•
|
The impact of an other than temporary decline in operating results and enterprise value that could lead to non-cash impairment charges due to the impairment of property, plant and equipment and other intangible
|
assets; and
|
•
|
The impacts that the proposed acquisition of LSC may have on the Company, both prior to and following consummation of that acquisition.
|
Quad cautions that the foregoing list of risks, uncertainties and other factors is not exhaustive and you should carefully consider the other factors detailed from time to time in Quad’s filings with the
United States Securities and Exchange Commission
(“
SEC
”) and other uncertainties and potential events when reviewing the Company’s forward-looking statements.
Because forward-looking statements are subject to assumptions and uncertainties, actual results may differ materially from those expressed or implied by such forward-looking statements. You are cautioned not to place undue reliance on such statements, which speak only as of the date of this Annual Report on Form 10-K. Except to the extent required by the federal securities laws, Quad undertakes no obligation to publicly update or revise any forward-looking statements, whether as a result of new information, future events or otherwise.
1
PART I
|
Item 1.
|
Business
|
Overview
As a worldwide marketing solutions partner dedicated to creating a better way, Quad uses its data-driven, integrated marketing solutions platform to help clients reduce complexity, increase efficiency and enhance marketing spend effectiveness. Quad provides its clients with unmatched scale for client on-site services and expanded subject expertise in marketing strategy, creative solutions, media deployment and marketing management services. With a client-centric approach, that drives its expanded offering, combined with leading-edge technology and single-source simplicity, the Company believes it has the resources and knowledge to help a wide variety of clients in multiple vertical industries, including retail, publishing and healthcare.
Quad was founded in Pewaukee, Wisconsin, as a Wisconsin corporation, in
1971
by the late Harry V. Quadracci. As of
February 11, 2019
, the Quadracci family, through the Quad Voting Trust, has voting control of approximately
72%
, which the Company believes provides it with continued stability and flexibility as Quad works to achieve its long-term strategic vision. As of
December 31, 2018
, the Company had approximately
20,600
full-time equivalent employees in North America, South America, Europe and Asia, and served a diverse base of approximately
6,100
clients. Quad locations span
15
countries, including
60
manufacturing and distribution facilities and more than
60
client-based marketing on-site locations, with additional investments in printing operations in Brazil and India.
The Company is on a transformative journey that it describes in evolutions. Each new evolution expands the Company’s offerings to create enhanced value for its clients. Quad 1.0 covered a period of tremendous organic growth that began with its founding in 1971. During this 40-year period, the Company grew rapidly through greenfield growth, built a premier manufacturing and distribution platform equipped with the latest technology, established its reputation as one of the printing industry’s foremost innovators and created a Company culture based on strong values that remains in place today.
Quad 2.0 began in 2010 and continues today with Quad’s ongoing role as a disciplined print industry consolidator. Quad saw an opportunity to participate in industry consolidation in response to economic and industry pressures following the great recession of 2008 and 2009, which severely impacted print volumes and accelerated the impact of media disruption. Through a series of consolidating acquisitions that included
World Color Press, Inc.
(“
World Color Press
”), Vertis Holdings Inc. and Brown Printing Company, the Company added experienced talent and was able to enhance and expand its product and service offerings, while removing inefficient and underutilized capacity, pulling out costs and transitioning work to more efficient facilities. This period of consolidation created the advanced, highly automated and efficient manufacturing and distribution platform the Company has today.
The Company believes it will continue to drive productivity improvements into the future through an engaged workforce and ongoing adoption of the latest manufacturing automation and technology. Through this strategy, the Company believes it can maintain the strongest, most efficient print manufacturing platform and remain the high-quality, low-cost producer. This strategy also allows Quad to generate the earnings and cash flow necessary to support future value-creating opportunities that fuel Quad 3.0.
Quad 3.0 evolved when significant media disruption created the opportunity for Quad to create greater value for its clients by extending its offering beyond print and content execution to include an integrated stack of marketing services. In Quad 3.0, the Company leverages its data-driven print expertise as part of an integrated marketing solutions platform that helps its clients not only plan and produce marketing programs, but also deploy, manage and measure them across all traditional and digital channels. In February 2019, the Company announced that it is evolving its brand from Quad/Graphics to Quad to reflect the role it now plays with clients as a marketing solutions partner.
2
More information regarding Quad is available on the Company’s website at
www.QUAD.com.
Quad is not including the information contained on or available through its website as part of, or incorporating such information by reference into, this Annual Report on Form 10-K. The Company’s Annual Report on Form 10-K, Quarterly Reports on Form 10-Q, Current Reports on Form 8-K and any amendments to those reports are made available to the public at no charge through a link appearing on the Investor Relations section of the Company’s website. Quad provides access to such materials through its website as soon as reasonably practicable after electronically filing such material with, or furnishing it to, the
SEC
.
Industry and Competition
According to a December 2018 Dun & Bradstreet First Research report, the U.S. advertising services industry is forecast to grow at an annual compounded rate of 4% between 2018 and 2022, as compared to the printing industry which is in secular decline. This opportunity for growth supports Quad’s 3.0 transformation and a review of both the marketing services and printing industries is set forth below.
The marketing services industry is highly fragmented. According to the December 2018 Dun & Bradstreet First Research report, the top 50 companies in the U.S. advertising and marketing services industry generate less than 40% of industry revenue. Services in this industry include advertising for print, broadcast and online media (about 25% of industry sales); public relations (12%); and direct marketing (10%). Other services include display advertising, media buying (reselling advertising time or space), and media representation (selling advertising time or space on behalf of media outlet owners). The U.S. advertising and marketing services industry includes about
38,000
establishments (single-location companies and units of multi-location companies), with combined annual revenue of about
$100 billion
.
The commercial print industry is also highly fragmented. According to the September 2018
Printing in the U.S.
IBISWorld industry report, the United States commercial printing industry, in the aggregate, generates an estimated $76 billion in annual revenue, employs over 430,000 people and is comprised of approximately
48,000
companies
.
The report also states that no printing company accounts for more than 5% of total commercial print industry annual revenue in the United States. Although there has been significant industry consolidation, particularly in the past decade, the largest 400 U.S. printers only represent approximately half of the total industry revenue in the U.S., according to the December 2018
Printing Impressions
PI400
rankings.
In addition to being highly fragmented, competition in the printing industry remains intense, and the Company believes that there are indicators of heightened competitive pressures. The industry has excess manufacturing capacity created by continued declines in industry volumes which, in turn, have created accelerated downward pricing pressures. The Company faces competition due to the increased accessibility and quality of digital alternatives to traditional delivery of printed documents through the online distribution and hosting of media content, and the digital distribution of documents and data. The Company faces competition from print management and marketing consulting firms that look to streamline processes and reduce the overall print spend of the Company’s clients.
The commercial print industry has moved toward a demand for shorter print runs, faster product turnaround and increased production efficiency of products with lower page counts and increased complexity. This, combined with increases in postage expenses and the increased use of digital marketing and communication channels, has led to excess manufacturing capacity in the print industry. This excess capacity has allowed certain larger printers, like Quad, with economies of scale, strong balance sheets and access to capital markets, the ability to invest in automation and more efficient equipment, take advantage of consolidating acquisition opportunities to remove excess, inefficient and/or underutilized capacity, and reduce overall costs.
3
Competition in both the marketing services and print industries is affected by real gross domestic product growth, as economic activity and advertising spending are key drivers of consumer demand. In times of economic prosperity, advertisers may increase spending to build brand awareness and to drive sales. Conversely, in times of global economic uncertainty and budget pressures, advertisers may reduce spending or shift their spending to other forms of media. For print specifically, magazine publishers that face diminished advertising pages reduce total page counts; catalog marketers reduce page counts, circulation and frequency of print campaigns; retailers curb investments in store inventory and cut back on retail insert newspaper circulation and advertising; and other advertisers reduce their direct mail volume, particularly in the banking, insurance, credit card, real estate and nonprofit industries. It is possible that these customers instead decide to move advertising spend to digital alternatives.
Marketing services providers face pressure to satisfy major clients’ needs, as the win or loss of a major client account can impact revenue significantly. Another challenge facing marketing service providers relates to public concern and general annoyance with advertising methods. For example, data collection of personal information for marketing purposes is an issue under scrutiny from federal legislation, and marketing service providers are facing future restrictions on certain types of data they collect. In Europe, the European Union already has been enforcing data protection through the General Data Protection Regulations.
The Company faces competition in the advertising and marketing services industry based on access to a skilled workforce, pricing, adapting quickly to new technology, creating unique and effective campaigns and offering superior customer service. Across Quad’s range of printed products, competition is based on total price of printing, materials and distribution; quality; distribution capabilities; customer service; access to a highly skilled workforce; availability to schedule work on appropriate equipment; on-time production and delivery; and state-of-the-art technology to meet a client’s business objectives, including the ability to adopt new technology quickly.
As consumer media consumption habits change, marketing services providers face increased demand to offer end-to-end marketing services, from strategy and creative through execution, across all channels, traditional and digital. As new marketing and advertising channels emerge, marketing services providers must expand their services beyond traditional channels, such as for television, newspapers, print publications and radio, to digital channels, such as mobile, internet search, internet display and video, to create effective multichannel campaigns for their clients.
Quad believes that business users of print and print-related services are focused on generating and tracking the highest returns on their marketing spend. Quad believes it is well positioned to help clients achieve greater process efficiencies and marketing spend effectiveness through data-driven integrated marketing solutions. The Company believes that its clients receive the greatest return on their marketing spend when they start with a strong marketing strategy that uses print in combination with other media channels, informed by customer data, to create targeted and relevant multichannel marketing campaigns.
Seasonality
Quad is subject to seasonality in its quarterly results as net sales and operating income are higher in the
third
and
fourth
quarters of the calendar year as compared to the
first
and
second
quarters. The fourth quarter is typically the highest seasonal quarter for cash flows from operating activities and Free Cash Flow due to the reduction of working capital requirements that reach peak levels during the third quarter. Seasonality is driven by increased magazine advertising page counts, retail inserts, catalogs and books primarily due to back-to-school and holiday-related advertising and promotions. The Company expects this seasonality impact to continue in future years.
Strategy
Quad believes employee pride, combined with a relentless quest to create a better way, builds the opportunity to invent the future as a preferred marketing solutions partner, helping its clients win every day. To accomplish this vision, Quad remains focused on its consistent strategic priorities as follows:
4
Walk in the Shoes of Clients
The Company encourages all employees, regardless of job title, to walk in the shoes of clients by putting a priority on listening to clients’ needs and challenges, doing what they can to make it easy to work with Quad, and making the client experience enjoyable at every touchpoint. In Quad 3.0, the Company is focused on evolving client print-production conversations to conversations encompassing consultative, enterprise-wide solutions that will create more value for clients. To accomplish this, a key component of Quad’s client-facing strategy is to strengthen relationships at higher levels within a client’s organization so the Company can better understand, anticipate and satisfy the organization’s needs. In Quad 3.0, Quad seeks to become an invaluable strategic marketing partner for its clients, helping them successfully navigate today’s constantly evolving media landscape through innovative data-driven solutions, produced and deployed across multiple media channels. The Company also believes its proactive thought leadership in the key issues facing its clients, including data-driven marketing and postal reform, will foster loyalty to the Quad brand.
Grow the Business Profitably
This strategy centers on Quad’s ability to grow its business at a time when significant media disruption and print industry headwinds continue. Key components of this strategy are as follows:
|
•
|
Quad 3.0,
in which the Company serves as a comprehensive marketing solution partner to its clients. The Company believes its integrated end-to-end marketing solutions platform will create more value than the traditional agency approach that operates in silos and is focused on profit by media channel. Quad’s integrated marketing solutions platform removes the complexity Quad’s clients’ face when working with multiple agency partners, providing a streamlined and simplified approach to help them achieve their marketing goals. In doing so, the Company believes it will increase client efficiencies through workflow re-engineering, content production and process optimization; and improve their client’s overall marketing spend effectiveness through customer insights and analytics, creative services and enhanced personalization leading to more real-time and actionable measurement.
|
|
•
|
Organic growth,
in which the Company leverages knowledge from existing client relationships in key growth vertical industries to develop complementary products and services that help brand owners market more efficiently and effectively across media channels. Quad is also focused on ensuring it has the right talent in the right positions to facilitate strategic marketing conversations with its clients that lead to a better understanding of their needs, developing tailored solutions and growing market share.
|
|
•
|
Disciplined acquisitions,
that take many different forms. For example, the Company intends to continue to pursue value-driven industry consolidating acquisitions as well as acquisitions and investments that help accelerate the Company’s transformation in Quad 3.0, such as the proposed acquisition of LSC.
|
Strengthen the Core
Quad uses a disciplined return on capital framework and historically has made significant investments in its print manufacturing platform and data management capabilities that have resulted in what it believes is the most integrated, automated, efficient, innovative and modern manufacturing platform and distribution network in the printing industry. The Company’s continued focus to strengthen its core manufacturing platform through investments that streamline, automate and improve efficiencies and throughput, while reducing labor costs, promotes sustainable cash flow and continued value creation. Further, Quad’s disciplined culture of holistic Continuous Improvement and commitment to Lean Manufacturing methodologies is a high priority throughout the Company and supports its goal of strengthening the production and distribution functions for core product lines so that Quad can remain the printing industry’s high-quality, low-cost producer.
5
Empower Employees
Quad’s strategy to empower employees throughout their career journey builds on key aspects of the Company’s distinct corporate culture, which the Company uses to fuel its ongoing Quad 3.0 transformation. These aspects include strong and lasting Company values and an organization-wide entrepreneurial spirit and opportunity-seeking mentality. Employees are encouraged to take pride and ownership in their work, take advantage of continuous learning programs to advance in their careers and improve leadership skills, share knowledge by mentoring others and innovate solutions to drive performance. With the encouragement to do things differently, to be something greater and to create a better way, the Company believes its employees are more fully engaged in producing better results for clients and advancing the Company’s strategic goals, while supporting community activities, initiatives and organizations that impact the quality of life near Quad’s facilities. As Quad continues to expand its integrated marketing platform in Quad 3.0, the Company believes this creates possibilities for each employee that are advantageously distinct from other employers.
Enhance Financial Strength and Create Shareholder Value
Quad follows a disciplined approach to maintaining and enhancing financial strength to create shareholder value, which is essential given ongoing media disruption and printing industry challenges. This strategy is centered on the Company’s ability to maximize net earnings, Free Cash Flow and operating margins; maintain consistent financial policies to ensure a strong balance sheet, liquidity level and access to capital; and retain the financial flexibility needed to strategically allocate and deploy capital as circumstances change. The priorities for capital allocation and deployment are adjusted based on prevailing circumstances and what the Company thinks is best for shareholder value creation at any particular point in time. Those priorities currently include the following: (1) deleveraging the Company’s balance sheet through debt and pension liability reductions; (2) making compelling investments that drive profitable organic growth and productivity in the Company’s print manufacturing and distribution operations, as well as executing on acquisitions through a disciplined approach that includes continued expansion into higher-growth marketing services that help accelerate the Company’s transformation in Quad 3.0, and pursuing value-driven industry consolidation; and (3) returning capital to shareholders through dividends and share repurchases.
To provide ongoing improvement in manufacturing productivity, the Company applies holistic Continuous Improvement and Lean Manufacturing methodologies to simplify and streamline processes and to ultimately maximize operating margins. These same methodologies are applied to its selling, general and administrative functions to create a truly Lean Enterprise. The Company has been working diligently to lower its cost structure by consolidating its manufacturing platform into its most efficient facilities, as well as realizing purchasing, mailing and logistics efficiencies by centralizing and consolidating print manufacturing volumes and eliminating redundancies in its administrative and corporate operations. Quad believes that its focused efforts to be the high-quality, low-cost producer generates increased Free Cash Flow and allows the Company to maintain a strong balance sheet through debt and pension liability reductions. The Company’s disciplined financial approach also allows it to maintain sufficient liquidity and to reduce refinancing risk, with the nearest significant debt maturity not occurring until January 2021.
Competitive Advantages
Quad’s strategic priorities are powered by three key competitive advantages that the Company believes distinguishes itself from its competitors: a commitment to ongoing innovation, a commitment to platform excellence, and a commitment to its people and lasting culture.
6
Commitment to Ongoing Innovation
At the forefront of innovation for more than 47 years, Quad believes its commitment to ongoing innovation drives its purpose to create a better way. To accomplish this, Quad takes a disciplined build-partner-acquire approach:
Build
From integrated marketing solutions and technology to productivity improvements and vertically integrated businesses like healthcare, Quad prides itself on strategically investing in and developing the appropriate expertise internally to increase revenue or reduce costs as follows:
In strategic marketing functions, Quad continues to hire business professionals with client-side marketing experience to help advance conversations with clients to be more consultative or solutions-based in Quad 3.0. To further support its marketing solutions thought leadership, Quad conducts annual quantitative research called
Customer Focus
®
™.
This extensive survey, conducted by a third party, provides consumer insight on singular and integrated media usage. The survey reveals the unique characteristics of special demographic, generational, gender and socio-economic groups and how they consume advertising and marketing messaging, and their attitudes and engagement preferences in several industry segments. According to survey data, print remains a strong driver across generations. This active response to print has influenced magazine publishers to increase usage of custom product covers to enhance reader engagement and retailers who primarily use digital channels, such as online-only retailers, to incorporate print into their marketing strategy. Further, Quad can combine the insights from
Customer Focus
®
™
and use its proprietary segmentation tool, called Accelerated Insights®, to leverage client data and create effective hyper-personalized campaigns in both traditional and digital channels. The ability to generate content that is relevant to the consumer is one way the Company believes it can help its clients influence consumer behavior, lift response and enhance return on investment.
The Company also remains committed to ongoing innovation throughout its print manufacturing and distribution processes to better serve its clients and remain the industry’s high-quality, low-cost producer. Over the last five years, Quad has invested an average of 2.5% of its annual net sales for capital expenditures in its core print manufacturing and distribution platform. This investment has resulted in what the Company believes is the most advanced and efficient print manufacturing and distribution platform in the industry and has allowed the Company to reduce the amount invested in recent years without impacting its leading technological excellence.
To improve internal processes, enhance client service levels and further drive efficiencies, the Company has consistently focused on the rapid adoption of technological innovations. In the early years, the Company integrated its imaging, manufacturing and distribution networks into a single platform using a networked information technology infrastructure. This platform, connected via Quad’s own
Smartools
® proprietary enterprise resource planning system, provides seamless, real-time information flow across sales and estimating, production planning, scheduling, manufacturing, warehousing, logistics, invoicing, reporting and customer service. In Quad 3.0, the Company has extended its spirit of innovation with business process management tools that further simplify and improve existing internal workflows. This includes pricing, job specifications and client acceptance to streamlining and automating the hand-offs between departments throughout the entire order workflow through invoicing. Quad also has applied robotic process automation to streamline data processing and report generation. This allows employees to focus on value-adding tasks, while the robotic process completes the transactional, repetitive functions. Where appropriate, Quad also leverages artificial intelligence in areas such as labor management, scheduling and predictive machine maintenance.
A commitment to innovation and creating a better way to do business has also helped to expand Quad’s vertically-integrated non-print capabilities, such as data management, imaging, logistics and distribution, ink manufacturing (Chemical Research\Technology), paper procurement, and equipment research and design. This approach to business gives the Company a competitive advantage in delivering lower costs for its clients, enhancing customer service levels and allowing substantial control over critical links in the overall print supply chain to help it control the quality, cost and availability of key inputs in the printing process. In addition,
QuadMed, LLC
(“
QuadMed
”), the Company’s health and wellness subsidiary, was founded in 1990 to create a better way to address the Company’s own employees’ needs for quality, cost-effective healthcare. Today, QuadMed provides employer-sponsored healthcare
7
solutions on a national level to employers of all sizes, including private and public sector companies. These solutions include, but are not limited to, on-site and near-site healthcare clinics, occupational health services, telemedicine, and health and wellness programs.
Partner
In addition to building capabilities internally, Quad fosters innovation by partnering with companies whose expertise helps fill a specific gap or amplify an existing offering. For example, to strengthen its integrated marketing solutions platform, Quad established a partnership with
Rise Interactive Media & Analytics, LLC
(“
Rise
”), a digital marketing agency specializing in media, analytics and customer experience, and as of March 2018, owns a controlling interest in this company. The partnership brings together Quad’s expertise in optimizing a client’s marketing spend in traditional channels with Rise’s expertise in digital channels. The Company believes this creates more integrated, multi-channel campaigns and, ultimately, advances data-driven marketing through the delivery of highly relevant, consistent messages, at scale, to consumers.
Acquire
When the Company wants to drive innovation by filling multiple gaps in its integrated marketing solutions platform to quickly scale, acquire talent and/or accelerate its transformation, the Company acquires the targeted company if the opportunity meets Quad’s disciplined acquisition criteria. For example, on
February 21, 2018
, the Company acquired
Ivie & Associates
(“
Ivie
”), a premier marketing services provider specializing in customized marketing and business process outsourcing to provide clients with unmatched scale for on-site marketing services, integrated execution, and expanded subject matter expertise in digital, media and creative.
On January 3, 2019, the Company acquired
Periscope, Inc.
(“
Periscope
”), one of the nation’s top five independent creative agencies by annual revenue, offering world-class capabilities in strategy, including media buying and analytics, creative and account management, as well as packaging design and premedia services. The acquisition supports and accelerates the Company’s ongoing Quad 3.0 transformation, creating a highly efficient global platform for creating marketing campaigns and programs — from strategy and creative through execution — across all media channels.
Additionally, on October 30, 2018, the Company and
LSC
entered into a definitive agreement, pursuant to which Quad will acquire LSC in an all-stock transaction valued at approximately
$1.3 billion
, including the refinancing of LSC’s debt and assumption of other obligations. The Company expects to complete the acquisition in mid-2019, following the completion of customary closing conditions including regulatory approval and approval by the shareholders of both companies. Together with LSC, the Company will enhance its highly efficient print platform with a compelling combination of talent, expertise and client technology. This will further fuel the Quad 3.0 transformation and strengthen the role of print in today’s multichannel world.
Commitment to Platform Excellence
Platform excellence pertains to Quad’s integrated Manufacturing, Mailing and Distribution, and Marketing platforms that support Quad 3.0 as follows:
8
Manufacturing Platform
Quad continues to invest in equipment and leading-edge technology to ensure its manufacturing platform remains the strongest and most sustainable in the printing industry and that it continues to support a vast range of traditional and digital print solutions, finishing techniques and distribution capabilities to create value for its clients in Quad 3.0. At the same time, the Company has continued to strengthen its platform by removing excess, under-utilized capacity and by consolidating work into facilities where it can achieve the greatest manufacturing and distribution efficiencies. Over the past eight years, the Company has closed
43
manufacturing plants representing nearly 13.4 million square feet of under-utilized production capacity. This commitment to consolidating work into fewer facilities to maximize capacity is one key way Quad maintains platform excellence and remains the industry’s high-quality, low-cost producer.
The Company has continuously invested in its print manufacturing platform through state-of-the-art equipment and automation that reduces labor costs, maximizes labor productivity and increases throughput. Within the last
5
years, these investments include multiple wide-web offset presses and digital presses; more than
50
automated guided vehicles or computer-controlled robotic forklifts; and more than
40
automated palletizers, which automatically configure bundles of finished magazines and catalogs on pallets at the end of a binding line.
The Company’s investment in its manufacturing platform has consistently been based on evaluating the economic useful life of the underlying equipment rather than focusing on the potential mechanical life of the equipment. This discipline is critical in an industry in which technological change can create obsolescence well before the end of the mechanical life of equipment. To remain the industry’s high-quality, low-cost producer, Quad makes a concerted effort to treat all costs as variable and maintains a stringent focus on achieving productivity improvements and sustainable cost reductions through a variety of holistic Continuous Improvement and Lean Enterprise programs in both manufacturing and administrative areas.
Another key aspect of the Company’s modern manufacturing platform is the combination of its footprint of mega plants (facilities greater than one million square feet) that produce several different products under one roof; mega zones where multiple facilities in close geographic proximity are managed as one large facility; and smaller strategically located facilities. The Company has continued to evolve its platform by equipping facilities to be product line agnostic, which enables the Company to maximize equipment utilization. Quad believes that the large plant size of certain of its key printing facilities allows the Company to drive savings in certain product lines (such as publications and catalogs) due to economies of scale and from investments in automation and technology.
The Company continues to transform its manufacturing platform from conventional web offset presses to modern digital presses that will give marketers and publishers a full range of options to produce and deliver relevant direct mail, books, packaging and other commercial products faster and more cost-effectively:
|
•
|
The Company has invested in its technology-enabled direct mail platform to provide innovative front-end toolsets and data workflows; industry-best back-end logistics and postal optimization; and a diverse production platform that is highly leveraged on personalization technologies serving the needs of today’s leading marketers. Personalization and targeting create the opportunity to reach the right recipients with a relevant message at the right time which, in turn, helps its clients increase consumer response rates, maximize their return on print spending and reduce overall costs. Built over many years, Quad’s data-driven, one-to-one direct marketing platform includes in-house capabilities to analyze mailing list data, demographic data, consumer transaction data and other consumer-specific data to help its clients create targeted and personalized printed materials.
|
|
•
|
The Company also continues to transform its book platform through the rapid implementation of digital press technology and integrated systems, and the creation of
On-Q™
, a proprietary demand-driven ordering system that helps clients better manage ordering and inventory. Quad is helping book publishers with increased customization and versioning capabilities; faster time-to-market; reduced waste, inventories and obsolescence; and lower fixed costs.
|
9
|
•
|
Recent investments in digital press technology in the Company’s high-end folding carton packaging business has enabled it to enter markets in which it previously was not as competitive, such as private label packaging. With its digital press platform, Quad is able to cost-competitively accommodate shorter runs with quicker turns.
|
Mailing and Distribution Platform
Quad is also able to leverage the volume of products running through its plants for further client distribution savings by coordinating and consolidating shipments from single mega plants or multiple plants that create a mega zone, and then routing those shipments directly to thousands of local newspapers,
United States Postal Service
(“
USPS
”) processing facilities or other distribution facilities. In addition, each major United States metropolitan area is within one day’s drive of at least one of the Company’s strategically located facilities, providing its clients the flexibility to print closest to their end consumers.
Postal rates are a significant component of many clients’ cost structures, and Quad believes that postal costs influence the number of pieces that its clients print and mail. Therefore, the Company has invested significantly in its mailing and distribution platform to mitigate increasing postage costs, and to help clients successfully navigate the ever-changing postal environment. The Company performs an analysis of mail list data as part of its logistics services, which allows it to reduce client freight costs for shipments to newsstands and postal centers, while providing a high level of dependability and rapid response times that are crucial to the delivery of time-sensitive materials. Further, the Company manages mail distribution of most of its clients’ products to maximize efficiency and reduce these costs, and its co-mail program is the largest in the print industry, based on information published by or otherwise made available from competitors. Quad’s co-mail program involves the sorting and bundling of printed products to be mailed to consumers, in order to facilitate better integration with the
USPS
. In return, the
USPS
offers significant work-sharing discounts for this sorting, bundling and drop-shipping. Quad co-mailed approximately 3.7 billion publications, catalogs and direct marketing pieces in 2018. Due to the continuously increasing costs of utilizing the USPS and to help control costs for its clients, Quad launched and is expanding a pilot project revolving around alternate delivery strategies for clients’ products that result in Quad managing delivery directly to the consumer and bypassing the USPS as a delivery method.
Marketing Platform
In Quad 3.0, the Company’s commitment to platform excellence extends to integrated marketing solutions, specifically as it relates to the services provided at client on-sites. With the acquisition of Ivie, Quad now has more 1,200 professionals dedicated to content creation and marketing execution at more than
60
client on-sites, including retail and publishing. For clients who engage the Company’s on-site marketing solutions model, Quad employees serve as a natural extension of a client’s internal marketing department and fulfill traditional agency executional roles while also providing production efficiencies at scale. The Company believes this model increases process efficiencies and enables clients to focus on what they do best: sell more products, services and content.
Commitment to People and Lasting Culture
Quad believes that its employees do not just make a difference—they
are
the difference. The Company believes this is a key competitive advantage that is not easily replicated by its competitors given its long-standing culture.
Quad believes that its distinct corporate culture, which evolved from a core set of values conceived by the late founder Harry V. Quadracci, drives thoughtful decision-making, especially with regard to its disciplined approach to managing operations, creating solutions that redefine print in a multichannel media marketplace, and better positioning the Company to prevail in the dynamic and competitive printing industry. The Company fosters an entrepreneurial environment by inspiring and empowering employees to own projects and enact solutions that advance the Company’s goals. Employees in the United States also may have a beneficial ownership interest in Quad through Company stock held in the
Quad/Graphics, Inc. Employee Stock Ownership Plan
(“
ESOP
”), enhancing their sense of ownership. The Company believes this sense of employee engagement and distinct corporate culture drives its disciplined approach to all aspects of its business.
10
The Company demonstrates its commitment to employee engagement in a variety of ways, including the following:
|
•
|
Offering employees a competitive compensation and benefits package;
|
|
•
|
Providing employees with a safe work environment with robust safety training and accountability programs;
|
|
•
|
Offering continuous learning and career advancement opportunities, such as through registered mechanical and electrical apprenticeship programs, youth apprenticeship programs, the Company’s own Accelerated Career Training program for production employees, digital media training, affinity groups and leadership development training;
|
|
•
|
Promoting employee health and wellness through a variety of personal improvement programs and facilities, including the Company’s own QuadMed primary care clinics;
|
|
•
|
Acting on employee feedback garnered through regular surveys and open forums at department and company-wide meetings;
|
|
•
|
Offering an employee referral program and investing in technology and improved processes to facilitate an easy hiring and on-boarding process; and
|
|
•
|
Fostering pride through employee recognition programs, employee and family events, community outreach activities and support, a history of environmental commitments, such as effective management of resources and reducing waste, and adhering to a published code of ethics.
|
Quad is led by an experienced management team with a proven track record in the printing industry that is committed to preserving the Company’s values-based culture. The senior management team includes entrepreneurially minded leaders with a long tenure at Quad mixed with strategic new hires or leaders from recent acquisitions, further supplemented by managers and employees committed to advancing print and marketing solutions in coordination with the ever-evolving multichannel media landscape. The Company believes the experience and stability of senior management, paired with next-generation talent, will contribute to its long-term success as it continues its path forward in Quad 3.0.
Quad also enjoys a competitive advantage in consistent, stable leadership that is focused on making decisions in the best long-term interest of the Company. It is able to do this because of the Quadracci family voting control, which enables the Company to manage its strategy and disciplined financial policy by being able to make decisions today that could benefit the Company years from now and avoid the pitfalls of short-term decision making that could potentially jeopardize the stability and longevity of the Company.
Environmental Stewardship
Quad strives to be the leader in the printing industry in adopting new technologies and processes to minimize the Company’s impact on the environment. The Company believes it has long been known for its environmental stewardship. Quad’s proactive approach to incorporate holistic practices has also positively impacted operating costs through the reduction of waste, energy use, and emissions, as well as through the implementation of water conservation solutions. The Company has also undertaken steps to reduce greenhouse gas emissions from its manufacturing processes and to improve fuel efficiency and reduce emissions in its fleet of Company-owned tractor trailers.
11
As the owner, lessee or operator of various real properties and facilities, Quad is subject to various federal, state and local environmental laws and regulations, including those relating to air emissions; waste generation, handling, management and disposal; sanitary and storm water discharge; and remediation of contaminated sites. Historically, compliance with these laws and regulations has not had a material adverse effect on the Company’s results of operations, financial position or cash flows. Compliance with existing or new environmental laws and regulations may require the Company to make future expenditures.
Clients
Quad enjoys long-standing relationships with a diverse base of clients, which includes both national and regional corporations in North America, South America, Europe and Asia. The Company’s clients include industry-leading blue chip companies that operate in a wide range of industries and serve both businesses and consumers, including retailers, publishers and direct marketers. The Company’s relationships with its largest clients average over
20
years in duration.
In
2018
, Quad served approximately
6,100
clients, and its ten largest clients accounted for approximately
15%
of consolidated sales, with none representing more than
5%
individually. The Company believes that its large and diverse client base, broad geographic coverage and extensive range of printing and print-related capabilities are competitive strengths.
Patents, Trademarks and Trade Names
Quad operates research and development facilities that support the development of new equipment, process improvements, raw materials and content management, and distribution technologies to better meet client needs and improve operating efficiencies. The Company continues to innovate within the printing and print-related industry and, as a result, has developed what it believes to be one of the most powerful patent portfolios in the print industry.
Quad currently holds or has rights to commercialize a wide variety of worldwide patents and applications relating to its business. The Company intends to continue to file patent applications that it believes will help ensure the continued strength of the Company and its portfolio. Additionally, the Company markets products, services and capabilities under a number of trademarks and trade names. Quad aggressively defends its intellectual property rights and intends to continue to do so in the future.
Raw Materials
The primary raw materials that Quad uses in its print business are paper, ink and energy. At this time, the Company’s supply of raw materials is readily available from numerous vendors; however, based on market conditions, that could change in the future. The Company generally buys these raw materials based upon market prices that are established with the vendor as part of the procurement process.
Approximately half of the paper used by the Company is supplied directly by its clients. For those clients that do not directly supply their own paper, the Company makes use of its purchasing efficiencies to supply paper by negotiating with leading paper vendors, uses a wide variety of paper grades, weights and sizes, and does not rely on any one vendor. In addition, the Company generally includes price adjustment clauses in sales contracts for paper and other critical raw materials in the printing process. Although these clauses generally mitigate paper price risk, higher paper prices and tight paper supplies may have an impact on client demand for printed products. The Company’s working capital requirements, including the impact of seasonality, are partially mitigated through the direct purchasing of paper by its clients.
The Company produces the majority of ink used in its print production, allowing it to control the quality, cost and supply of key inputs. Raw materials for the ink manufacturing process are purchased externally from a variety of vendors.
12
The Company generally cannot pass on to clients the impact of higher electric and natural gas energy prices on its manufacturing costs, and increases in energy prices result in higher manufacturing costs for certain of its operations. The Company mitigates its risk through natural gas hedges when appropriate. In its logistic operations, however, the Company is able to pass a substantial portion of any increase in fuel prices directly to its clients.
Employees
As of
December 31, 2018
, Quad had approximately
20,600
full-time equivalent employees in North America, South America, Europe and Asia. Within the United States, there were approximately
16,900
full-time equivalent employees, of which approximately
400
were covered by a collective bargaining agreement. Outside of the United States, there were approximately
3,700
full-time equivalent employees, of which approximately
1,200
were either governed by an industry-wide agreement, by a collective bargaining agreement or through a works council or similar arrangement. Quad believes that its employee relations are good and that the Company maintains an employee-centric culture.
Business Acquisitions and Strategic Investments
The Company completed the acquisition of
Ivie
on
February 21, 2018
, for a net purchase price of
$92 million
, excluding acquired cash.
Ivie
is headquartered in Flower Mound, Texas and provides a full array of marketing services, including creative and production services, studio services, sourcing, procurement, staff enhancement, media services, public relations, digital, technology solutions and project management for many leading brands throughout the world.
The Company increased its equity position in
Rise
from
19%
to
57%
on
March 14, 2018
, for
$9 million
cash paid and the conversion of previously provided loans to equity ownership.
Rise
is a digital marketing agency headquartered in Chicago, Illinois and specializes in media, analytics and customer experience, and helps enterprise marketers see, shape, and act on opportunities in digital media.
The Company completed the acquisition of
Periscope
on
January 3, 2019
, for a net preliminary purchase price of
$121 million
, excluding acquired cash.
Periscope
is a creative agency headquartered in Minneapolis, Minnesota and provides a comprehensive offering, including media buying and analytics, creative and account management. Periscope also has packaging design and premedia services that complement Quad’s print-production capabilities.
On
October 30, 2018
, the Company and LSC entered into a definitive agreement pursuant to which the Company will acquire LSC in an all-stock transaction valued at approximately
$1.3 billion
, including the refinancing of LSC’s debt and assumption of other obligations. The acquisition is subject to customary closing conditions, including regulatory approval and approval by the shareholders of both companies.
For additional information related to the Company’s acquisition activity, see
Note 3
, “
Acquisitions and Strategic Investments
,” to the consolidated financial statements in Part II, Item 8, “Financial Statements and Supplementary Data,” of this Annual Report on Form 10-K.
13
Executive Officers of Quad
The following table sets forth the names, ages (as of
February 11, 2019
) and positions of Quad’s executive officers.
|
Name
|
Age
|
Position
|
||
|
J. Joel Quadracci
|
50
|
Chairman, President and Chief Executive Officer
|
||
|
Eric N. Ashworth
|
53
|
Executive Vice President of Product Solutions and Market Strategy, and President of BlueSoHo
|
||
|
Renee B. Badura
|
55
|
Executive Vice President of Sales
|
||
|
Thomas J. Frankowski
|
58
|
Executive Vice President and Chief Operating Officer
|
||
|
David J. Honan
|
50
|
Executive Vice President and Chief Financial Officer
|
||
|
Jennifer J. Kent
|
47
|
Executive Vice President of Administration and General Counsel
|
||
|
Kelly A. Vanderboom
|
44
|
Executive Vice President, President of Logistics and Treasurer
|
||
|
Steven D. Jaeger
|
54
|
Vice President and Chief Information Officer
|
||
|
Anne M. Bauer
|
54
|
Executive Director and Chief Accounting Officer
|
||
Mr. Quadracci has served as the Chairman, President and Chief Executive Officer of Quad since January 2010. Since March, 2018, Mr. Quadracci also serves on the Board of Directors of
Rise Interactive Media & Analytics, LLC
. He previously served as President and Chief Executive Officer from July 2006 to January 2010, President from January 2005 to July 2006 and has served as a director of Quad since 2003. Mr. Quadracci joined Quad in 1991 and, prior to becoming President and Chief Executive Officer, served in various capacities, including Sales Manager, Regional Sales Strategy Director, Vice President of Print Sales, Senior Vice President of Sales & Administration, and President and Chief Operating Officer. Mr. Quadracci is the brother of Kathryn Quadracci Flores, a director of the Company, and the brother-in-law of Christopher B. Harned, a director of the Company.
Mr. Ashworth has served as Executive Vice President of Product Solutions and Market Strategy, and President of BlueSoHo since April 2016. Since March, 2018, Mr. Ashworth also serves on the Board of Directors of Rise Interactive and Analytics, LLC. He previously served as President of BlueSoHo and Media Solutions from August 2015 to April 2016. Prior to joining Quad, Mr. Ashworth was President of SGK, Inc. (formerly Schawk, Inc.) from July 2012 to July 2015, Chief Growth and Strategy Officer of SGK from September 2009 to July 2012 and
Global
Chief Growth Officer of Anthem Worldwide (a division of SGK) from November 2003 to September 2009. Prior thereto, Mr. Ashworth was Co-founder and President of BlueMint Associates from June 2002 through November 2003, after serving in various marketing related roles since 1992.
Ms. Badura has served as Executive Vice President of Sales since June 2015. She previously served as Vice President of Omnichannel Sales Strategy from February 2014 to June 2015, as Regional Vice President of Sales-Midwest for Marketing Solutions from January 2012 to February 2014, as Vice President of Sales - East Coast for Magazines and Catalogs from April 2007 to December 2011, as Vice President of Sales - West Coast from January 2004 to March 2007 and in various other capacities since she joined Quad in 1986.
Mr. Frankowski has served as Executive Vice President and Chief Operating Officer since March 2014. He previously served as Executive Vice President of Manufacturing Operations and President of Europe from July 2010 to March 2014. Prior thereto, Mr. Frankowski was Senior Vice President of Manufacturing from 2004 to July 2010, President of Quad Europe, Quad Polish subsidiary, from 2008 to July 2010, and he served in various other capacities since he joined Quad in 1979.
14
Mr. Honan has served as Executive Vice President and Chief Financial Officer since January 2015. He previously served as Vice President and Chief Financial Officer from March 2014 to January 2015, Vice President and Chief Accounting Officer from July 2010 to March 2014, Vice President and Corporate Controller from December 2009 to July 2010 and as the Company’s Corporate Controller from when he joined Quad in May 2009 until December 2009. Prior to joining Quad, Mr. Honan served as Vice President, General Manager and Chief Financial Officer of Journal Community Publishing Group, a subsidiary of media conglomerate Journal Communications Inc., for five years. Before joining Journal Community Publishing Group, Mr. Honan worked in executive-level roles in investor relations and corporate development at Newell Rubbermaid, a global marketer of consumer and commercial products. Prior thereto, Mr. Honan worked at the accounting firm Arthur Andersen LLP for 11 years.
Ms. Kent has served as Executive Vice President of Administration and General Counsel since June 2015. She previously served as Vice President and General Counsel from December 2013 to June 2015 and as the Company’s Assistant General Counsel from when she joined Quad in August 2010 until December 2013. Prior to joining Quad, Ms. Kent held various positions in the legal department at Harley-Davidson Motor Company from March 2003 to July 2010. Prior thereto, Ms. Kent served as an Assistant United States Attorney for the Eastern District of Wisconsin and practiced law at Foley & Lardner LLP, a Milwaukee-based law firm.
Mr. Vanderboom has served as Executive Vice President since 2018. Since March 2018, Mr. Vanderboom has also served on the Board of Directors of
Rise Interactive Media & Analytics, LLC
. He has also served as Treasurer and President of Logistics since March 2014. He previously served as Quad’s Vice President & Treasurer from 2008 to March 2014 and as its Treasurer from 2007 to 2008. Prior to becoming Quad’s Treasurer, Mr. Vanderboom served as Director of Treasury, Risk & Planning from 2006 until 2007, as Controller of Quad’s Distribution and Facilities departments from 2004 until 2006, and in various other capacities since he joined Quad in 1993.
Mr. Jaeger has served as Vice President and Chief Information Officer since November 2015. He previously served as Executive Vice President, President of Direct Marketing and Chief Information Officer from November 2014 to November 2015, as Executive Vice President, President of Direct Marketing and Media Solutions and Chief Information Officer from March 2014 to November 2014, as Corporate Vice President of Information and Technology for Quad since 2013, Vice President of Information Systems and Infrastructure from 2007 to 2012 and as President of Quad/Direct since August 2007. Prior thereto, Mr. Jaeger had been Quad Vice President of Information Systems from 1998 to 2006 and had worked in various other capacities since he joined the Company in 1994. Prior to joining Quad, Mr. Jaeger worked for Andersen Consulting for eight years.
Ms. Bauer has served as Executive Director and Chief Accounting Officer since March 2017. She previously served as Director - Corporate Controller of the Company from May 2016 until March 2017. She joined the Company in September 2011, serving as Director of Corporate Accounting until May 2016. Prior to joining Quad, Ms. Bauer held various accounting positions at Journal Communications, Inc. during her 18 years there, including Vice President and Controller from June 2000 until September 2011.
Executive officers of the Company are elected by and serve at the discretion of the Company’s Board of Directors. Other than described above, there are no family relationships between any directors or executive officers of Quad.
|
Item 1A.
|
Risk Factors
|
You should carefully consider each of the risks described below, together with all of the other information contained in this Annual Report on Form 10-K, before making an investment decision with respect to Quad’s securities. If any of the following risks develop into actual events, the Company’s business, financial condition or results of operations could be materially and adversely affected, and you may lose all or part of your investment.
15
Risks Relating to Quad
Quad operates in a highly competitive environment.
The advertising and marketing services industries are highly competitive and are expected to remain so. The U.S. advertising and marketing services industry includes about
38,000
establishments (single-location companies and units of multi-location companies), with combined annual revenue of about
$100 billion
. Any failure on the part of the Company to compete effectively in the markets it serves could have a material adverse effect on its results of operations, financial condition or cash flows and could require changes to the way it conducts its business or require it to reassess strategic alternatives involving its operations.
Quad operates primarily in the commercial print portion of the printing industry. The printing industry, with approximately
48,000
companies in the United States, is highly fragmented and competitive. Although there has been significant industry consolidation, particularly in the past decade, the largest 400 U.S. printers only represent approximately half of the total industry revenue in the U.S., according to the December 2018
Printing Impressions
PI400
rankings. As such, the Company competes for business not only with large and mid-sized printers, but also with smaller regional printers and the growing forms of digital alternatives to print. In certain circumstances, due primarily to factors such as freight rates and client preference for local services, printers with better access to certain regions of a given country may be preferred by clients in such regions.
The printing industry continues to experience a reduction in demand for printed materials and overcapacity due to various factors including the great recession of 2008 and 2009, which severely impacted print volumes and accelerated the impact of media disruption. Specifically, there is a sustained and increasing shift of digital substitution by marketers and advertisers, to both replace and augment campaigns that were historically focused on print. The impacts of overcapacity and intense competition have led to continued downward pricing pressures. Printing industry revenues may continue to decrease in the future. Some of the industries that the Company services have been subject to consolidation efforts, leading to a smaller number of potential clients. Furthermore, if the smaller clients of Quad are consolidated with larger companies using other printing companies, the Company could lose its clients to competing printing companies.
Significant downward pricing pressure and decreasing demand for printing services caused by factors outside of the Company’s control may adversely affect the Company.
The Company has experienced significant downward pricing pressures for printing services in the past, and pricing for printing services has declined significantly in recent years. Such pricing may continue to decline from current levels. In addition, demand for printing services has decreased in recent years and may continue to decrease. Any increases in the supply of printing services or decreases in demand could cause prices to continue to decline, and prolonged periods of low prices, weak demand and/or excess supply could have a material adverse effect on the Company’s business growth, results of operations and liquidity.
The impact of digital media and similar technological changes, including the substitution of printed products with digital content, may continue to adversely affect the results of the Company’s operations.
The media landscape is experiencing rapid change due to the impact of digital media and content on printed products. Improvements in the accessibility and quality of digital media through the online distribution and hosting of media content, mobile technologies, e-reader technologies, digital retailing and the digital distribution of documents and data has resulted and may continue to result in increased consumer substitution. Continued consumer acceptance of such digital media, as an alternative to print materials, is uncertain and difficult to predict and may decrease the demand for the Company’s printed products, result in reduced pricing for its printing services and additional excess capacity in the printing industry, and adversely affect the results of the Company’s operations.
16
As competition increases among retail-based customers, they may enter into business combinations or alliances and establish companies in other market segments to expand their businesses. In addition, new and enhanced technologies, including search, web and infrastructure computing services, digital content, and electronic devices, affect the customers’ reliance on the use of printed materials. The internet facilitates competitive entry and comparison shopping, and the reliance on digital retailing may reduce the Company’s sales and profits.
Quad may be adversely affected by increases in its operating costs, including the cost and availability of raw materials, labor-related costs, fuel and other energy costs and freight rates.
The primary raw materials that Quad uses in its print business are paper, ink and energy. The price of such raw materials has fluctuated over time and has caused fluctuations in the Company’s net sales and cost of sales. This volatility may continue and Quad may experience increases in the costs of its raw materials in the future as prices in the overall paper, ink and energy markets are expected to remain beyond its control.
Approximately half of the paper used by the Company is supplied directly by its clients. For those clients that do not directly supply their own paper, the Company generally includes price adjustment clauses in sales contracts for paper and other critical raw materials in the printing process. Although these clauses generally mitigate paper price risk, higher paper prices and tight paper supplies may have an impact on client demand for printed products. If Quad passes along increases in the cost of paper and the price of the Company’s products and services increases as a result, client demand could be adversely affected, and thereby, negatively impact Quad’s financial performance. If the Company is unable to continue to pass along increases in the cost of paper to its clients, future increases in paper costs would adversely affect its margins and profits.
Due to the significance of paper in the Company’s print business, it is dependent on the availability of paper. In periods of high demand, certain paper grades have been in short supply, including grades used in the Company’s business. In addition, during periods of tight supply, many paper producers allocate shipments of paper based upon historical purchase levels of customers. Additionally, the declining number of paper suppliers in the United States and Canada has resulted in a contraction in the overall paper manufacturing industry. This contraction of suppliers may cause overall supply issues, may cause certain paper grades to be in short supply or unavailable, and may cause paper prices to substantially increase.
The
United States Department of Commerce
(“
DOC
”) and the
International Trade Commission
(“
ITC
”) completed investigations in June and August 2018, respectively, to determine if manufacturers of uncoated groundwood paper based in the United States are being disadvantaged as compared to their Canadian competitors due to subsidies from the federal government of Canada. Additionally, the investigation looked into allegations that the Canadian paper manufacturers were improperly exporting less expensive paper into the United States.
The
DOC
issued a “preliminary” decision recommending a combined tariff, ranging from 0% to as much as 35%, depending on the company (each company was to have been assessed a duty specific to their own unique circumstances, which would have resulted in varying duty amounts). The
ITC
subsequently completed its own investigation and in August 2018 concluded that the Canadian paper producers were not benefiting from unfair subsidies from the Canadian government, nor was there any evidence the Canadian paper manufacturers were improperly exporting less expensive paper into the United States. As a result of these findings, the
ITC
rescinded the
DOC
’s proposed tariffs. The Company believes the
ITC
’s decision to rescind the proposed tariffs will allow printers and publishers to continue to have access to a supply of uncoated groundwood paper at reasonable prices.
Although historically Quad generally has not experienced significant difficulty in obtaining adequate quantities of paper, continued decline in suppliers, changes as noted above in United States import or trade regulations, or other unforeseen developments in the overall paper markets could result in a decrease in the supply of paper and could adversely affect the Company’s revenues or profits. In addition, the Company may not be able to resell waste paper and other by-products or the prices received for their sale may decline substantially.
17
Quad is dependent upon the vendors within the Company’s supply chain to maintain a steady supply of inventory, parts and materials. Many of the Company’s products are dependent upon a limited number of vendors, and significant disruptions could adversely affect operations. Under recent market conditions, it is possible that one or more of the Company’s vendors will be unable to fulfill their operating obligations due to financial hardships, liquidity issues or other reasons.
The Company generally cannot pass on to clients the impact of higher electric and natural gas energy prices on its manufacturing costs, and increases in energy prices result in higher manufacturing costs for certain of its operations. If the Company is unable to pass along increases in energy costs, future increases would adversely affect its margins and profits. Even if Quad could pass along increases in energy costs, the price of the Company’s products and services would increase as a result. Client demand could be adversely affected, and would thereby negatively impact Quad’s financial performance.
Labor represents a significant component of the cost structure of Quad. Increases in wages, salaries and benefits, such as medical, dental, pension and other post-retirement benefits, may impact the Company’s financial performance. Changes in interest rates, investment returns or the regulatory environment may impact the amounts the Company will be required to contribute to the pension plans that it sponsors and may affect the solvency of these pension plans. Quad may be unable to achieve labor productivity targets, to retain employees or labor may not be adequately available in locations in which the Company operates, which could negatively impact the Company’s financial performance.
Freight rates and fuel costs also represent a significant component of the Company’s cost structure. In general, the Company has been able to pass along increases in the cost of freight and fuel to many of its clients. If the Company is not able to pass along a substantial portion of increases in freight rates or in the price of fuel, future increases in these items would adversely impact the Company’s margin and profits. If Quad passes along increases in the cost of freight and fuel and the price of the Company’s products and services increases as a result, client demand could be adversely affected, and thereby, negatively impact Quad’s financial performance.
If Quad fails to identify, manage, complete and integrate acquisitions, investment opportunities or other significant transactions, it may adversely affect the Company’s future results.
As part of Quad’s growth strategy, the Company may pursue acquisitions of, investment opportunities in, or other significant transactions with, companies that are complementary to the Company’s business. In order to pursue this strategy successfully, the Company must identify attractive acquisition or investment opportunities, successfully complete the transaction, some of which may be large and complex, and manage post-closing issues such as integration of the acquired company or employees. Quad may not be able to identify or complete appealing acquisition or investment opportunities given the intense competition for these transactions. Even if the Company identifies and completes suitable corporate transactions, the Company may not be able to successfully address inherent risks in a timely manner, or at all. These inherent risks include, among other things: (1) failure to successfully integrate the purchased operations, technologies, products or services and maintain uniform standard controls, policies and procedures; (2) substantial unanticipated integration costs; (3) loss of key employees including those of the acquired business; (4) diversion of management’s attention from other operations; (5) failure to retain the clients of the acquired business; (6) failure to achieve any projected synergies and performance targets; (7) additional debt and/or assumption of known or unknown liabilities; (8) potential dilutive issuances of equity securities; and (9) a write-off of goodwill, client lists, other intangibles and amortization of expenses. If the Company fails to successfully integrate an acquisition, the Company
may not realize all or any of the anticipated benefits of the acquisition, and Quad future results of operations could be adversely affected. In addition, the diversion of management’s attention from the Company’s other operations due to these acquisitions and integration effort could adversely affect its business and have a negative financial impact.
See “Risks Relating to the Proposed Acquisition of LSC” below.
18
Quad may not be able to reduce costs and improve its operating efficiency rapidly enough to meet market conditions.
Because the markets in which the Company competes are highly competitive, Quad will need to continue to improve its operating efficiency in order to maintain or improve its profitability. There can be no assurance that the Company’s continuing cost reduction efforts will continue to be beneficial to the extent anticipated, or that the estimated productivity, cost savings or cash flow improvements will be realized as anticipated or at all. If the Company’s efforts are not successful, it could have an adverse effect on the Company’s operations and competitive position. In addition, the need to reduce ongoing operating costs have and, in the future, may continue to result in significant up-front costs to reduce workforce, close or consolidate facilities, or upgrade equipment and technology.
Quad’s transformation to a marketing solutions provider increases the complexity of the Company’s business, and if the Company is unable to successfully adapt its business processes as required by these new markets, the Company will be at a competitive disadvantage and its ability to grow will be adversely affected.
As the Company expands its integrated marketing platform, the overall complexity of the Company’s business increases at an accelerated rate and the Company becomes subject to different market dynamics. The new markets into which Quad is expanding, or may expand, may have different characteristics from the markets in which the Company historically competed. These different characteristics may include, among other things, demand volume requirements, demand seasonality, product generation development rates, client concentrations and performance and compatibility requirements. The Company’s failure to make the necessary adaptations to its business model to address these different characteristics, complexities and new market dynamics could adversely affect the Company’s operating results.
Quad may suffer a data-breach of sensitive information. If Quad’s efforts to protect the security of such information are unsuccessful, any such failure may result in costly government enforcement actions and/or private litigation, and the Company’s business and reputation could suffer.
Quad and its clients are subject to various United States and foreign cyber-security laws, which require the Company to maintain adequate protections for electronically held information. The Company may not be able to anticipate techniques used to gain access to Quad’s systems or facilities, the systems of the Company’s clients or vendors, or implement adequate prevention measures. Moreover, unauthorized parties may attempt to access Quad’s systems or facilities, or the systems of the Company’s clients or vendors, through fraud or deception. In the event and to the extent that a data breach occurs, such breach could have an adverse effect on the Company’s business and results of operations. Complying with these various laws could cause Quad to incur substantial costs or require changes to the Company’s business practices in a manner adverse to Quad’s business.
Future declines in economic conditions may adversely affect the Company’s results of operations.
In general, demand for the Company’s products and services is highly related to general economic conditions in the markets Quad’s clients serve. Declines in economic conditions in the United States or in other countries in which the Company operates may adversely impact the Company’s financial results, and these impacts may be material. Because such declines in demand are difficult to predict, the Company or the industry may have increased excess capacity as a result. An increase in excess capacity has resulted, and may continue to result, in declines in prices for the Company’s products and services. In addition, a prolonged decline in the global economy and an uncertain economic outlook has and could further reduce the demand in the printing industry. Economic weakness and constrained advertising spending have resulted, and may in the future result, in decreased revenue, operating margin, earnings and growth rates and difficulty in managing inventory levels and collecting accounts receivable. The Company has experienced, and expects to experience in the future, excess capacity and lower demand due to economic factors affecting consumers’ and businesses’ spending behavior. Uncertainty about future economic conditions makes it difficult for the Company to predict results of operations, financial position and cash flows and to make strategic decisions regarding the allocation and deployment of capital.
19
Quad’s business depends substantially on customer contract renewals and/or customer retention. Any contract non-renewals, renewals on different terms and conditions or decline in the Company’s customer retention or expansion could materially adversely affect Quad’s results of operations, financial condition and cash flows.
The Company has historically derived a significant portion of its revenue from long-term contracts with significant clients as the Company progresses through Quad 3.0. If the Company loses significant clients, is unable to renew such contracts on similar terms and conditions, or at all, or is not awarded new long-term contracts with important clients in the future, its results of operations, financial condition and cash flows may be adversely affected.
The Company is exposed to risks of loss in the event of nonperformance by its clients. Some of the Company’s clients are highly leveraged or otherwise subject to their own operating and regulatory risks. Even if the Company’s credit review and analysis mechanisms work properly, the Company may experience financial losses and loss of future business if its clients become bankrupt, insolvent or otherwise are unable to pay the Company for its work performed. Any increase in the nonpayment or nonperformance by clients could adversely affect the Company’s results of operations and financial condition.
Certain industries in which the Company’s clients operate are experiencing consolidation. When client consolidation occurs, it is possible that the volume of work performed by the Company for a client after the consolidation will be less than it was before the consolidation or that the client’s work will be completely moved to competitors. In addition, new and enhanced technologies, including search, web and infrastructure computing services, digital content, and electronic devices, may affect customers. The internet facilitates competitive entry and comparison shopping, and the reliance on digital retailing may reduce customers’ volume. Any such reduction or loss of work could adversely affect the Company’s results of operations and financial condition.
Failure to attract and retain qualified talent across the enterprise could materially adversely affect the Company’s business, competitive position, financial condition and results of operations.
Quad continues to be substantially dependent on its production personnel to print the Company’s products in a cost-effective and efficient manner that allows the Company to obtain new customers and to drive sales from the Company’s existing customers. Quad believes that there is significant competition for production personnel with the skills and technical knowledge that the Company requires. The Company’s ability to continue efficient operations, reduce production costs, and consolidate operations will depend, in large part, on the Company’s success in recruiting, training, integrating and retaining sufficient numbers of production personnel to support the Company’s production, cost savings and consolidation targets. New hires require significant training and it may take significant time before they achieve full productivity. In addition, an increase in the wages paid by competing employers could result in an increase in the wage rates that the Company must pay. As a result, Quad may incur significant costs to attract, train and retain employees, including significant expenditures related to salaries and benefits, and the Company may lose new
,
as well as existing, employees to competitors or other companies before the Company realizes the benefit of its investment in recruiting and training them. The Company’s recent hires and planned hires may not become productive as quickly as the Company expects, and the Company may be unable to hire or retain sufficient numbers of qualified individuals in the markets where the Company does business or plans to do business. In addition, due to turnover, a large percentage of employees will be new to the Company. If the Company is unable to hire and train sufficient numbers of personnel, the Company’s business would be adversely affected.
Quad may be required to make capital expenditures to sustain its platforms and processes and to remain technologically and economically competitive, which may increase its costs or disrupt its operations.
The Company may need to make significant capital expenditures as it develops and continues to maintain its platforms and processes. The Company also may be required to make capital expenditures to develop and integrate new technologies to remain technologically and economically competitive. In order to accomplish this effectively, the Company will need to deploy its resources efficiently, maintain effective cost controls and bear potentially significant market and raw material risks. If the Company’s revenues decline, it may impact the Company’s ability to expend the capital necessary to develop and implement new technology and be economically competitive. Debt or equity financing, or cash generated from operations, may not be available or sufficient for these requirements or for other corporate
20
purposes or, if debt or equity financing is available, it may not be on terms favorable to the Company. In addition, even if capital is available to the Company, there is risk that the Company’s vendors will have discontinued the production of parts needed for repairs, replacements or improvements to the Company’s existing platforms, leading the Company to expend more capital than expected to perform such repairs, replacements or improvements.
Changes in postal rates, postal regulations and postal services may adversely impact customers’ demand for print products and services.
Postal costs are a significant component of the cost structures of many of the Company’s clients and potential clients. Postal rate changes and
USPS
regulations that result in higher overall costs can influence the volume that these clients will be willing to print and ultimately send through the
USPS
.
Integrated distribution with the postal service is an important component of the Company’s business. Any material change in the current service levels provided by the postal service could impact the demand that clients have for print services. The
USPS
continues to experience financial problems. Without increased revenues or action by Congress to reform the
USPS
’ cost structure, these losses will continue into the future. As a result of these financial difficulties, the
USPS
has come under increased pressure to adjust its postal rates and service levels. Additional price increases may result in customers reducing mail volumes and exploring the use of alternative methods for delivering a larger portion of their products, such as continued diversion to the internet and other alternative media channels in order to ensure that they stay within their expected postage budgets.
The
USPS
does offer “work-share” discounts that provide incentives to co-mail and place product as far down the mail-stream as possible. Discounts are earned as a result of less handling of the mail, and therefore, lower costs for the
USPS
. As a result, Quad has made substantial investments in co-mailing technology and equipment to ensure customers benefit from these discounts. As the
USPS
reacts to its financial difficulties, it often revises design standards for mail entering its system. These design standards often increase costs for customers and, in turn, decrease the value of the cost reductions that the Company’s co-mailing services provide. If the incentives to co-mail are decreased by
USPS
regulations, the overall cost to mail printed products will increase and may result in print volumes declining.
Current federal law limits postal rate increases (outside of an “exigent circumstance”) to the increase in the
Consumer Price Index
(“
CPI
”). This cap works to ensure funding stability and predictability for mailers. However, that same federal statute requires the
Postal Regulatory Commission
(“
PRC
”) to conduct a review of the overall rate-making structure for the
USPS
.
T
he results of that study found that the current rate structure has been partially successful in meeting the USPS’ goals. The current system does result in predictable and stable rate making. However, the PRC also concluded that the current rate structure does not meet USPS’ revenue needs and lacks pricing efficiency. As a result, the PRC proposed a new rate-making structure that would provide the USPS with additional pricing flexibility over the current CPI cap, and which may result in a substantially altered rate structure for mailers. There is a great deal of uncertainty as to the outcome of this review as the PRC issued a Notice of Proposed Rulemaking with comments due on March 1, 2018. An additional round of comments was due on March 30, 2018. Any newly revised rates that would be effective as a result of new rules issued by the
PRC
may include a higher rate cap, or potentially the elimination of a rate cap altogether, which will result in no restrictions on the
USPS
’ ability to increase rates from year to year. This may lead to price spikes for mailers and may also reduce the incentive for the USPS to continue to take out costs and instead continue to rely on postage to cover the costs of an outdated postal service that does not reflect the industry’s ability or willingness to pay. The end result may be reduced demand for printed products as customers may move more aggressively into other delivery methods, such as the many digital and mobile options now available to consumers.
On April 12, 2018, an executive order was issued for a presidential task force to review the
USPS
with a provided time frame of 120 days. Other initiatives, such as postal reform legislation and PRC response, have been temporarily delayed, pending the outcome of this review. The recommendations stemming from the presidential task force were published on December 4, 2018, which were wide in scope and will require additional input from a multitude of stakeholders, including the United States Congress. The Company expects that with the publication of the report, both postal reform legislation as well as the PRC’s proposed rate structure changes will be further investigated within the next year.
21
The fragility of and decline in overall distribution channels, including newspaper distribution channels, may adversely impact customers’ access to cost effective distribution of their advertising materials, and therefore may adversely impact the Company’s business.
The distribution channels of print products and services, including the newspaper industry, face significant competition from other sources of news, information and entertainment content delivery. If overall distribution channels, including newspaper distribution channels, continue to decline, the Company’s customers may be adversely impacted by the lack of access to cost effective distribution of their advertising materials. In turn, this decline in cost effective distribution channels may force customers to use other avenues of distribution that may be at significantly higher cost, which may decrease customer demand for the Company’s products and services, and thus adversely affect Quad financial condition, results of operations and cash flows.
The Company is heavily dependent on its Executive Management team, including its Chief Executive Officer and other skilled personnel and, if the Company is unable to retain such personnel or hire qualified personnel, the Company may not be able to compete effectively.
The Company’s future success depends on its continuing ability to identify, hire, develop, and retain its Executive Management team, including its Chief Executive Officer, and other skilled personnel for all areas of the organization. The Company’s continued ability to compete effectively depends on its ability to attract new employees and retain its existing employees.
Quad’s debt facilities include various covenants imposing restrictions that may affect the Company’s ability to operate its business.
On September 1, 1995, and as last amended on
November 24, 2014
, Quad entered into a senior secured note agreement (the “
Master Note and Security Agreement
”) pursuant to which the Company has issued over time senior notes in an aggregate principal amount of $1.1 billion in various tranches. As of
December 31, 2018
, the borrowings outstanding under the
Master Note and Security Agreement
were
$96.2 million
. On
April 28, 2014
, and as last amended on
February 10, 2017
, the Company entered into a senior secured credit facility (the “
Senior Secured Credit Facility
,”) which includes three different loan facilities: a Term Loan A, a Term Loan B, and a revolving credit facility. The
$725.0 million
revolving credit facility and the
$375.0 million
Term Loan A mature on
January 4, 2021
. The
$300.0 million
Term Loan B matures on
April 27, 2021
. As of
December 31, 2018
, the borrowings outstanding under the
Senior Secured Credit Facility
were
$560.8 million
. On
April 28, 2014
, the Company also issued
$300.0 million
aggregate principal amount of its unsecured
7.0%
senior notes due
May 1, 2022
(“
Senior Unsecured Notes
,”), of which
$243.5 million
remained outstanding as of
December 31, 2018
.
On
January 31, 2019
, the Company completed the third amendment to the Senior Secured Credit Facility. See
Note 24
, “
Subsequent Events
,” to the consolidated financial statements in Part II, Item 8, “Financial Statements and Supplementary Data,” of this Annual Report on Form 10-K for further detail.
The Company’s various lending arrangements include certain financial covenants. In addition to the financial covenants, the debt facilities also include certain limitations on acquisitions, indebtedness, liens, dividends and repurchases of capital stock. As of
December 31, 2018
, the Company was in compliance with all financial covenants in its debt agreements. While the Company currently expects to be in compliance in future periods with all of the financial covenants, there can be no assurance that these covenants will continue to be met. The Company’s failure to maintain compliance with the covenants could prevent the Company from borrowing additional amounts and could result in a default under any of the debt agreements. Such default could cause the outstanding indebtedness to become immediately due and payable, by virtue of cross-acceleration or cross-default provisions.
22
Quad may be adversely affected by interest rates, particularly floating interest rates, and foreign exchange rates.
As of
December 31, 2018
,
34%
of the Company’s borrowings were subject to variable interest rates. As a result, the Company is exposed to market risks associated with fluctuations in interest rates, and increases in interest rates could adversely affect the Company.
The Company entered into a
$250.0 million
interest rate swap on February 7, 2017. The swap was designated as a cash flow hedge as its purpose is to reduce the variability of cash flows from interest payments related to a portion of Quad’s variable-rate debt. The swap effectively converts
$250.0 million
of the Company’s variable-rate debt based on one-month
London Interbank Offered Rate
(“
LIBOR
”) to a fixed rate of
3.89%
(including a
2.00%
spread on underlying debt at
December 31, 2018
). The variable interest rate resets monthly, and the swap is a
five
year arrangement, maturing on February 28, 2022.
Because a portion of the Company’s operations are outside of the United States, significant revenues and expenses are denominated in local currencies. Although operating in local currencies may limit the impact of currency rate fluctuations on the results of operations of the Company’s non-United States subsidiaries and business units, fluctuations in such rates may affect the translation of these results into the Company’s consolidated financial statements. To the extent revenues and expenses are not in the applicable local currency, the Company may enter into foreign exchange forward contracts to hedge the currency risk. There can be no assurance, however, that the Company’s efforts at hedging will be successful. There is always a possibility that attempts to hedge currency risks will lead to greater losses than predicted.
There are risks associated with the Company’s operations outside of the United States.
Although the substantial majority of the Company’s business activity takes place in the United States, a portion of Quad’s net sales are derived from operations in foreign countries. The Company’s products and services are sold primarily throughout North America, South America and Europe. In addition, the Company strategically sources packaging product manufacturing over multiple end markets in Central America and Asia. The Company’s printing operations located in Europe and Latin America include operations in England, France, Germany, Poland, Argentina, Colombia, Mexico and Peru, as well as investments in printing operations in Brazil and India. Net sales from the Company’s wholly-owned subsidiaries outside of the United States accounted for approximately
9%
of its consolidated net sales for the years ended
December 31, 2018
,
2017
and
2016
.
As a result, the Company is subject to the risks inherent in conducting business outside of the United States, including, but not limited to: the impact of economic and political instability; fluctuations in currency values, foreign-currency exchange rates, devaluation and conversion restrictions; exchange control regulations and other limits on the Company’s ability to import raw materials or finished product; tariffs and other trade barriers; trade restrictions and economic embargoes by the United States or other countries; social unrest, acts of terrorism, force majeure, war or other armed conflicts; inflation and fluctuations in interest rates; language barriers; difficulties in staffing, training, employee retention and managing international operations; logistical and communications challenges; differing local business practices and cultural consideration; restrictions on the ability to repatriate funds; foreign ownership restrictions and the potential for nationalization or expropriation of property or other resources; longer accounts receivable payment cycles; potential adverse tax consequences and being subject to different legal and regulatory regimes that may preclude or make more costly certain initiatives or the implementation of certain elements of its business strategy. Any international expansion or acquisition that the Company undertakes could amplify these risks related to operating outside of the United States.
Quad is exposed to the economic and political conditions in Argentina. The Argentine economy has experienced significant volatility in recent decades, characterized by periods of low or negative growth, high and variable levels of inflation and currency devaluation. As a consequence, the Company’s business and operations have been, and could be in the future, affected from time to time to varying degrees by economic and political developments and other material events affecting the Argentine economy. The majority of the Company’s employees in Argentina are covered by a collective bargaining agreement. A strike, work stoppage or other form of labor protest in Argentina in the future could disrupt the Company’s Argentina operations and result in a material adverse impact to the Company’s
23
Argentina operations’ financial condition, results of operations and cash flows, which could force the Company to reassess its strategic alternatives involving operations in Argentina. In addition, on March 25, 2015, due to deteriorating economic conditions, including inflation and currency devaluation, combined with uncertain political conditions, declining print volumes and labor challenges, the Company’s Argentina subsidiaries,
Anselmo L. Morvillo S.A.
(“
Morvillo
”) and World Color Argentina, S.A. (the “
Argentina Subsidiaries
”) commenced bankruptcy restructuring proceedings with a goal of consolidating operations. The Company completed such consolidation and emerged from bankruptcy; however, the Company’s Argentina operations’ repayment and other obligations resulting from such consolidation, if not successfully completed as and when due, may result in an adverse effect on the Company’s Argentina operations’ financial position and cash flows. As of
December 31, 2018
, the Company had
$18.6 million
of total assets in Argentina, representing
0.8%
of Quad consolidated total assets. For the year ended
December 31, 2018
, the Company recognized
$43.8 million
of net sales in Argentina, representing
1.0%
of Quad consolidated net sales.
Quad may incur costs or suffer reputational damage due to improper conduct of its employees, contractors or agents.
The Company could be adversely affected by engaging in business practices that are in violation of United States and foreign anti-corruption laws, including the United States Foreign Corrupt Practices Act. The Company operates in parts of the world with developing economies that have experienced governmental corruption to some degree, and in certain circumstances, strict compliance with anti-corruption laws may conflict with local customs and practices. In certain countries, the Company does substantial business with government entities or instrumentalities, which creates increased risk of a violation of the Foreign Corrupt Practices Act and international laws. There can be no assurance that all of the Company’s employees, contractors or agents, including those representing the Company in countries where practices which violate anti-corruption laws may be customary, will not take actions that violate Quad’s policies and procedures. The failure to comply with the laws governing international business practices may result in substantial penalties and fines. For additional information, see
Note 10
, “
Commitments and Contingencies
— Litigation,” to the consolidated financial statements in Part II, Item 8, “Financial Statements and Supplementary Data,” of this Annual Report on Form 10-K.
Quad and its facilities are subject to various consumer protection and privacy laws and regulations, and will become subject to additional laws and regulations in the future. If Quad’s efforts to comply with such laws or protect the security of information are unsuccessful, any failure may subject the Company to material liability, require it to incur material costs or otherwise adversely affect its results of operations as a result of compliance with such laws, costly enforcement actions and private litigation.
The nature of the Company’s business includes the receipt and storage of information about the Company’s clients, vendors and the end-users of Quad’s products and services. Quad and its clients are subject to various United States and foreign consumer protection, information security, data privacy and “do not mail” requirements at the federal, states, provincial and local levels. Quad is subject to many legislative and regulatory laws and regulations around the world concerning data protection and privacy. In addition, the interpretation and application of consumer and data protection laws in the United States and elsewhere are often fluid and uncertain. To the extent that the Company or its clients become subject to additional or more stringent requirements or that the Company is not successful in its efforts to comply with existing requirements or protect the security of information, demand for the Company’s services may decrease and the Company’s reputation may suffer, which could adversely affect the Company’s results of operations. In addition, such laws may be interpreted and applied in a manner inconsistent with Quad’s internal policies. If so, the Company could suffer costly enforcement actions (including an order requiring changes to Quad’s data practices) and private litigation, which could have an adverse effect on the Company’s business and results of operations. Complying with these various laws could cause Quad to incur substantial costs or require changes to the Company’s business practices in a manner adverse to Quad’s business.
24
Changes in the legal and regulatory environment could limit the Company’s business activities, increase its operating costs, reduce demand for its products or result in litigation.
The conduct of the Company’s businesses is subject to various laws and regulations administered by federal, state and local government agencies in the United States, as well as to foreign laws and regulations administered by government entities and agencies in markets in which the Company operates. These laws and regulations and interpretations thereof may change, sometimes dramatically, as a result of political, economic or social events, such as the election of the new administration. Such regulatory environment changes may include changes in taxation requirements, accounting and disclosure standards, immigration laws and policy, environmental laws, and requirements of United States and foreign occupational health and safety laws. Changes in laws, regulations or governmental policy and the related interpretations may alter the environment in which Quad does business, and therefore, may impact its results or increase its costs or liabilities.
In addition, the Company and its subsidiaries are party to a variety of legal and environmental remediation obligations arising in the normal course of business, as well as environmental remediation and related indemnification proceedings in connection with certain historical activities, former facilities and contractual obligations of acquired businesses. Permits are required for the operation of certain parts of the Company’s business, and these permits are subject to renewal, modification and, in some circumstances, revocation. Due to regulatory complexities, uncertainties inherent in litigation and the risk of unidentified contaminants on current and former properties, the potential exists for remediation, liability and indemnification costs to differ materially from the costs the Company has estimated. Quad cannot assure you that the Company’s costs in relation to these matters will not exceed its established liabilities or otherwise have an adverse effect on its results of operations.
Various laws and regulations addressing climate change are being considered at the federal and state levels. Proposals under consideration include limitations on the amount of greenhouse gas that can be emitted (so-called “caps”) together with systems of trading allowed emissions capacities. The impacts of such proposals could have a material adverse impact on the Company’s financial condition and results of operations.
If Quad is not able to take advantage of technological developments in the printing industry on a timely basis, the Company may experience a decline in the demand for its services, be unable to implement its business strategy and experience reduced profits.
The printing industry is experiencing rapid change as new digital technologies are developed that offer clients an array of choices for their marketing and publication needs. In order to grow and remain competitive, the Company will need to adapt to future changes, especially with regard to technology, to enhance the Company’s existing offerings and introduce new offerings to address the changing demands of clients. If Quad is unable to meet future challenges from competing technologies on a timely basis or at an acceptable cost, the Company could lose clients to competitors. In general, the development of new communication channels inside and outside the printing and media solutions industry requires the Company to anticipate and respond to the varied and continually changing demands of clients. The Company may not be able to accurately predict technological trends or the success of new services in the market.
Quad’s revenue, operating income and cash flows are subject to cyclical and seasonal variations.
The Company’s business is seasonal, with Quad recognizing the majority of its operating income in the
third
and
fourth
quarters of the financial year, primarily as a result of the increased magazine advertising page counts and retail inserts, catalogs and books from back-to-school and holiday-related advertising and promotions. The fourth quarter is typically the highest seasonal quarter for cash flows from operating activities and Free Cash Flow due to the reduction of working capital requirements that reach peak levels during the third quarter. If the Company does not successfully manage the increased workflow, necessary increases in paper and ink inventory, production capacity flows and other business elements during these high seasons of activity, this seasonality could adversely affect the Company’s cash flows and results of operations.
25
If
QuadMed
, a wholly-owned subsidiary of the Company, fails to comply with applicable healthcare laws and regulations, the Company could face substantial penalties, and its business, reputation, operations, prospects and financial condition of the Company’s subsidiary could be adversely affected.
QuadMed
provides employer-sponsored healthcare solutions on a national level to employers of all sizes, including the Company and other private and public-sector companies. These solutions include, but are not limited to, on-site and near-site healthcare clinics, occupational health services, telemedicine, and health and wellness programs. The healthcare industry is heavily regulated, constantly evolving and subject to significant change and fluctuation. The U.S. federal and state healthcare laws and regulations that impact the QuadMed subsidiary business include, among others:
|
•
|
the Health Insurance Portability and Accountability and the Health Information Technology for Economic and Clinical Health Acts, which, in general and among other things, establish comprehensive federal standards with respect to privacy, security and transmission of individually identifiable health information and impose requirements for the use of standardized electronic transactions with respect to transmission of such information;
|
|
•
|
the laws and regulations administered and enforced by the Food and Drug Administration, including the Federal Food Drug and Cosmetics Act, Controlled Substances Act and other federal statutes and regulations;
|
|
•
|
the federal Anti-Kickback Statute, which generally prohibits, among other things, soliciting, receiving or providing remuneration to induce the referral of an individual for an item or service or the purchasing or ordering of an item or service for which payment may be made under federal healthcare programs;
|
|
•
|
the federal false claims laws, which generally prohibit, among other things, knowingly presenting or causing to be presented claims for payment from third-party payors that are false or fraudulent;
|
|
•
|
state law equivalents of each of these federal laws, such as anti-kickback and false claims laws that may apply to items or services reimbursed by any third-party payor, including commercial insurers, and state laws governing the privacy and security of health information in certain circumstances, many of which differ from each other in significant ways and may not be preempted by applicable federal laws, thus complicating compliance efforts; and
|
|
•
|
state prohibitions on the Corporate Practice of Medicine (many of these state laws differ from one another in significant ways and are not preempted by federal law).
|
The Company has significant liabilities with respect to defined benefit pension plans that could grow in the future and cause the Company to incur additional costs.
As a result of the 2010 acquisition of
World Color Press
, the Company assumed frozen single employer defined benefit pension plans for certain of its employees in the United States. The majority of the plans’ assets are held in North American and global equity securities and debt securities. The asset allocation as of
December 31, 2018
, was approximately
30%
equity securities and
70%
debt securities.
As of
December 31, 2018
, the Company had underfunded pension liabilities of
$82.6 million
for single employer defined benefit plans in the United States. Under current United States pension law, pension funding deficits are generally required to be funded over a seven-year period. These pension deficits may increase or decrease depending on changes in the levels of interest rates, pension plan investment performance, pension legislation and other factors. Declines in global debt and equity markets would increase the Company’s potential pension funding obligations. Any significant increase in the Company’s required contributions could have a material adverse impact on its business, financial condition, results of operations and cash flows.
26
In addition to the single employer defined benefit plans described above, the Company has previously participated in multiemployer pension plans (“
MEPPs
”) in the United States, including the Graphic Communications International Union - Employer Retirement Fund (“
GCIU
”) and the Graphic Communications Conference of the International Brotherhood of Teamsters National Pension Fund (“
GCC
”). Prior to the acquisition of World Color Press by Quad, World Color Press received notice that certain plans in which it participated were in critical status, as defined in Section 432 of the Internal Revenue Code of 1986, as amended (the “
Internal Revenue Code
”). As a result, the Company could have been subject to increased contribution rates associated with these plans or other
MEPPs
suffering from declines in their funding levels. Due to the significantly underfunded status of the United States multiemployer plans and the potential increased contribution rates, the Company withdrew from participation in these multiemployer plans and has replaced these pension benefits with a Company-sponsored “pay as you go” defined contribution plan, which is historically the form of retirement benefit provided to the Company’s employees.
As of
December 31, 2018
, the Company estimates and has recorded in its financial statements a pre-tax withdrawal liability for all United States multiemployer plans of
$50.9 million
in the aggregate. During the fourth quarter of 2016, the Company and the
GCC
reached a settlement agreement for all claims, with scheduled payments until February 2024. The Company is currently in litigation with the
GCIU
trustees to determine the amount and duration of the withdrawal payments for the
GCIU
. Arbitration proceedings with the
GCIU
have been completed, both sides have appealed the arbitrator’s ruling, and litigation in Federal court has commenced. In April 2017, a Federal district court overturned the arbitration decision in one of the pending disputes in this matter. The Company appealed the district court’s ruling to a panel of the Ninth Circuit Court of Appeals, and in December 2018, the panel upheld the district court’s decision. The Company filed a motion for reconsideration with the panel, which was denied. Until litigation with the GCIU trustees is concluded, the exact amount of the withdrawal liability will not be known. As a result of these unfavorable rulings, the Company recorded a
$32.1 million
increase to the MEPPs withdrawal liability during the year ended December 31, 2018.
Holders of class A common stock are not able to independently elect directors of Quad or control any of the Company’s management policies or business decisions or its decisions to issue additional shares, declare and pay dividends or enter into corporate transactions because the holders of class A common stock have substantially less voting power than the holders of the Company’s class B common stock, all of which is owned by certain members of the Quadracci family, trusts for their benefit or other affiliates of Quad, whose interests may be different from the holders of class A common stock.
The Company’s outstanding stock is divided into two classes of common stock:
class A common stock
(“
class A stock
”) and
class B common stock
(“
class B stock
”). The class B stock has ten votes per share on all matters and the class A stock is entitled to one vote per share. As of
February 11, 2019
, the class B stock constitutes approximately
78%
of Quad’s total voting power. As a result, holders of class B stock are able to exercise a controlling influence over the Company’s business, have the power to elect its directors and indirectly control decisions such as whether to issue additional shares, declare and pay dividends or enter into corporate transactions. All of the class B stock is owned by certain members of the Quadracci family or trusts for their benefit, whose interests may differ from the interests of the holders of class A stock.
As of
February 11, 2019
, approximately
93%
of the outstanding class B stock was held of record by the Quad Voting Trust, and that constitutes approximately
72%
of the Company’s total voting power. The trustees of the Quad Voting Trust have the authority to vote the stock held by the Quad Voting Trust. Accordingly, the trustees of the Quad Voting Trust are able to exercise a controlling influence over the Company’s business, have the power to elect its directors and indirectly control decisions such as whether to issue additional shares, declare and pay dividends or enter into corporate transactions.
27
Quad is a controlled company within the meaning of the rules of
The New York Stock Exchange, LLC
(“
NYSE
”) and, as a result, it relies on exemptions from certain corporate governance requirements that provide protection to shareholders of other companies.
Since the Quad Voting Trust owns more than 50% of the total voting power of the Company’s stock, the Company is considered a controlled company under the corporate governance listing standards of the
NYSE
. As a controlled company, an exception under the NYSE listing standards exempts the Company from the obligation to comply with certain of the NYSE’s corporate governance requirements, including the requirements:
|
•
|
that a majority of the Company’s Board of Directors consist of independent directors, as defined under the rules of the NYSE;
|
|
•
|
that the Company have a corporate governance and nominating committee that is composed entirely of independent directors with a written charter addressing the committee’s purpose and responsibilities; and
|
|
•
|
that the Company have a compensation committee that is composed entirely of independent directors with a written charter addressing the committee’s purpose and responsibilities.
|
Accordingly, for so long as Quad is a controlled company, holders of
class A stock
will not have the same protections afforded to shareholders of companies that are subject to all of the corporate governance requirements of the NYSE.
Currently, there is a limited active market for Quad’s class A common stock and, as a result, shareholders may be unable to sell their class A common stock without losing a significant portion of their investment.
The Company’s class A stock has been traded on the
NYSE
under the symbol “QUAD” since
July 6, 2010
. However, there is currently a limited active market for the class A common shares. The Company cannot predict the extent to which investor interest in the Company will lead to the development of an active trading market for its class A common stock on the NYSE or how liquid that market will become. If a more active trading market does not develop, shareholders may have difficulty selling any class A stock without negatively affecting the stock price, and thereby, losing a significant portion of their investment.
Furthermore, in response to recent public focus on dual class capital structures, certain stock index providers are implementing limitations on the inclusion of dual class share structures in their indices. If these restrictions increase, they may impact who buys and holds the Company’s stock.
An other than temporary decline in operating results and enterprise value could lead to non-cash impairment charges due to the impairment of property, plant and equipment, goodwill and other intangible assets.
The Company has a material amount of property, plant, equipment, goodwill and other intangible assets on its balance sheet, due in part to acquisitions. As of
December 31, 2018
, the Company had the following long-lived assets on its consolidated balance sheet included in Part II, Item 8, “Financial Statements and Supplementary Data,” of this Annual Report on Form 10-K:
|
•
|
Property, plant and equipment of
$1,257.4 million
;
|
|
•
|
Goodwill of
$54.6 million
; and
|
|
•
|
Other intangible assets, primarily representing the value of customer relationships acquired, of
$112.6 million
.
|
28
As of
December 31, 2018
, these assets represented approximately
58%
of the Company’s total assets. The Company assesses impairment of property, plant and equipment and other intangible assets based upon the expected future cash flows of the respective assets. These valuations include management’s estimates of sales, profitability, cash flow generation, capital structure, cost of debt, interest rates, capital expenditures and other assumptions. A decline in expected profitability, significant negative industry or economic trends, inability to effectively integrate acquired businesses, unexpected significant changes or planned changes in use of the assets or in entity structure, and divestitures may adversely impact the assumptions used in the valuations. As a result, the recoverability of these assets could be called into question, and the Company could be required to write down or write off these assets. Such an occurrence could have a material adverse effect on the Company’s results of operations and financial position.
The Company may not be able to utilize deferred tax assets to offset future taxable income.
As of
December 31, 2018
, the Company had deferred tax assets, net of valuation allowances, of
$158.8 million
. The Company expects to utilize the deferred tax assets to reduce consolidated income tax liabilities in future taxable years. However, the Company may not be able to fully utilize the deferred tax assets if its future taxable income and related income tax liability is insufficient to permit their use. In addition, in the future, the Company may be required to record a valuation allowance against the deferred tax assets if the Company believes it is unable to utilize them, which would have an adverse effect on the Company’s results of operations and financial position.
Quad may be adversely affected by strikes and other labor protests.
As of
December 31, 2018
, Quad had a total of approximately
20,600
full-time equivalent employees, of which approximately
1,600
were covered by an industry wide agreement, a collective bargaining agreement or through a works council or similar arrangement. As of
December 31, 2018
, the Company had
five
collective bargaining agreements in the United States and
nine
agreements outside of the United States that are either industry-wide individual collective bargaining agreements or works councils or similar arrangements.
While the Company believes its employee relations are good and that the Company maintains an employee-centric culture, and there has not been any material disruption in operations resulting from labor disputes, the Company cannot be certain that it will be able to maintain a productive and efficient labor environment. The Company cannot predict the outcome of any future negotiations relating to the renewal of the collective bargaining agreements, nor can there be any assurance that work stoppages, strikes or other forms of labor protests pending the outcome of any future negotiations will not occur. A strike or other forms of labor protest affecting a series of major plants in the future could materially disrupt the Company’s operations and result in a material adverse impact on its financial condition, results of operations and cash flows, which could force the Company to reassess its strategic alternatives involving certain of its operations.
Risks Relating to the Proposed Acquisition of LSC
On October 30, 2018, the Company, LSC and QLC Merger Sub, Inc., a direct wholly owned subsidiary of Quad (“Merger Sub”), entered into an Agreement and Plan of Merger (the “Merger Agreement”), pursuant to which, subject to satisfaction or waiver of the conditions therein, Merger Sub will merge with and into LSC (the “Merger”), with LSC being the surviving company and becoming a wholly owned subsidiary of the Company.
The Merger Agreement may be terminated in accordance with its terms and the Merger may not be consummated.
The Merger Agreement is subject to a number of conditions that must be fulfilled in order to consummate the Merger. Those conditions include, among others: (i) the adoption of the Merger Agreement by LSC stockholders, (ii) the approval of the issuance of shares of the Company’s class A stock by Quad’s shareholders, (iii) the expiration of the applicable waiting period under the Hart-Scott-Rodino Antitrust Improvement Act of 1976, as amended (the “HSR Act”), and other required regulatory approvals, (iv) the absence of any governmental order or law that precludes, restrains, enjoins or otherwise prohibits, the consummation of the Merger or the other transactions contemplated by the Merger Agreement, and (v) the Company’s shares of class A stock issuable in the Merger having been approved for listing on the
29
NYSE. These conditions to the closing of the Merger may not be fulfilled in a timely manner or at all, and, accordingly the Merger may be delayed or may not be consummated.
In addition, the parties can mutually decide to terminate the Merger Agreement at any time, before or after obtaining shareholder approval, or, if the Merger is not consummated by October 30, 2019, either Quad or LSC may choose to terminate the Merger Agreement and not proceed with the Merger. Quad or LSC may also elect to terminate the Merger Agreement in certain other circumstances.
The regulatory approvals required for the consummation
of the Merger may not be obtained or may take longer than expected to be received. In addition, an adverse outcome of any antitrust or similar review undertaken by a governmental authority could prevent the Merger from being consummated
or have an adverse effect on Quad following the Merger.
Consummation of the Merger is conditional upon receipt of certain regulatory approvals, including, without limitation, the expiration or termination of the waiting period under the HSR Act in the United States and Mexico antitrust approval. Although Quad and LSC have agreed to use their reasonable best efforts to obtain the requisite regulatory approvals, there can be no assurance that these approvals will be obtained.
In addition, the regulatory authorities from which these approvals are required may impose conditions on the consummation of the Merger or require changes to the terms of the Merger. In attempting to obtain the requisite regulatory approvals, neither Quad nor any of its subsidiaries will be required to make any divestiture, sale or other disposition of its assets or businesses. However, although it is not required under the Merger Agreement to do so, if Quad agrees to such conditions in order to obtain any approvals required to consummate the Merger, then the business and results of operations of Quad following the Merger may be adversely affected.
Furthermore, if the Merger Agreement is terminated under certain circumstances due to failure to obtain regulatory approvals or the material breach of Quad of its obligations in respect of obtaining regulatory approvals, Quad will pay LSC a reverse termination fee of $45 million.
Failure to consummate
the Merger could negatively impact the stock price and the future business and financial results of the Company.
The Merger Agreement contains a number of conditions that must be satisfied or waived prior to the consummation of the Merger. There can be no assurance that all of the conditions to the consummation of the Merger will be so satisfied or waived. If the conditions to the Merger are not satisfied or waived, Quad and LSC will be unable to consummate the Merger and the Merger Agreement may be terminated.
If the Merger is not consummated for any reason, the ongoing businesses of Quad may be adversely affected and, without realizing any of the benefits of having consummated the Merger, the Company will be subject to a number of risks, including the following:
|
•
|
Quad may experience negative reactions from the financial markets, including negative impacts on the market price of shares of the Company’s class A stock;
|
|
•
|
the manner in which customers, vendors, business partners and other third parties perceive Quad may be negatively impacted, which in turn could affect Quad’s marketing operations and its ability to compete for new business or obtain renewals in the marketplace more broadly;
|
|
•
|
customers, suppliers and other third parties who have business relationships with Quad may decide not to renew such relationships or seek to terminate, change and/or renegotiate their relationships with the Company as a result of the transaction, whether pursuant to the terms of their existing agreements with Quad or otherwise;
|
|
•
|
Quad may experience negative reactions from employees;
|
30
|
•
|
Quad may be required to pay certain costs relating to the Merger, even if the Merger is not consummated;
|
|
•
|
under the Merger Agreement, Quad is subject to certain restrictions on the conduct of its business prior to consummating the Merger, which may affect its ability to execute certain of its business strategies; and
|
|
•
|
the attention of management may be directed towards the consummation of the Merger and Merger-related considerations and may be diverted from the day-to-day business operations of the Company, and matters related to the Merger may require commitments of time and resources that could otherwise have been devoted to other opportunities that might have been beneficial to Quad.
|
If the Merger is not consummated, the price of the Company’s class A stock may decline to the extent that the current market price reflects a market assumption that the Merger will be consummated and that the related benefits will be realized, or to the extent there is a market perception that the Merger was not consummated due to an adverse change in the business of Quad.
The synergies expected to be produced may not be realized or may require Quad after the consummation of the Merger to incur additional costs that may adversely affect the value of the Company’s class A stock.
The success of the Merger will depend, in part, on the Company’s ability to realize the synergies expected to be produced from integrating LSC’s businesses with Quad’s existing business through capacity rationalization, the elimination of duplicative functions, greater operational efficiencies and greater efficiencies in supply chain management, among other areas. The Company has identified approximately $135 million of annualized net synergies that are expected to be achieved in less than 24 months after the consummation of the Merger.
The Company’s management estimates that the total cost to the Company of achieving the annualized net synergies will be approximately $135 million in integration costs. Quad’s estimates are based on a number of assumptions, which may prove incorrect.
Following the Merger, the Company may also incur additional and/or unexpected costs in order to realize the anticipated synergies. While management believes that the annualized net synergies are achievable, it may be unable to realize all of the synergies within the time frame expected or at all.
The integration of LSC into Quad may not be as successful as anticipated.
The Merger involves numerous operational, strategic, financial, accounting, legal, tax and other risks, potential liabilities associated with the acquired business, and uncertainties related to design, operation and integration of LSC’s internal control over financial reporting. Difficulties in integrating LSC into Quad may result in LSC performing differently than expected, in operational challenges or in the failure to realize anticipated expense-related efficiencies. The Company’s existing business could also be negatively impacted by the Merger. Potential difficulties that may be encountered in the integration process include, among other factors:
|
•
|
the inability to successfully integrate the businesses of LSC into Quad in a manner that permits Quad to achieve the full revenue and cost savings anticipated from the Merger;
|
|
•
|
complexities associated with managing the larger, more complex, integrated business;
|
|
•
|
not realizing anticipated operating synergies;
|
|
•
|
integrating personnel from the two companies and the loss of key employees;
|
|
•
|
potential unknown liabilities and unforeseen expenses, delays or regulatory conditions associated with the Merger;
|
31
|
•
|
integrating relationships with customers, vendors and business partners;
|
|
•
|
performance shortfalls at one or both of the companies as a result of the diversion of management’s attention caused by consummating the Merger and integrating LSC’s operations into Quad; and
|
|
•
|
the disruption of, or the loss of momentum in, each company’s ongoing business or inconsistencies in standards, controls, procedures and policies.
|
The Company may not accomplish the integration of LSC’s businesses smoothly, successfully or within the anticipated cost range or timeframe. The diversion of the attention of Quad’s management from current operations to the integration effort and any difficulties encountered in combining operations could prevent Quad from realizing the full benefits anticipated to result from the Merger and could adversely affect its business.
Quad will incur significant transaction and Merger-related costs in connection with the Merger, which may be in excess of those anticipated.
The Company has incurred and expects to continue to incur a number of non-recurring costs associated with consummating the Merger, combining the operations of the two companies and achieving desired synergies. These fees and costs have been, and will continue to be, substantial. The substantial majority of the non-recurring expenses will consist of transaction costs related to the Merger and include, among others, financing costs, employee retention costs, fees paid to financial, legal, and public relations advisors, severance and benefit costs and filing fees.
Quad will also incur transaction fees and costs related to formulating and implementing integration plans. Additional unanticipated costs also may be incurred while the Merger is pending and for a period thereafter for the integration of the two companies’ businesses. Although Quad expects that the elimination of duplicative costs, as well as the realization of other efficiencies related to the integration of the businesses, should allow the Company to offset integration-related costs over time, this net benefit may not be achieved in the near-term, or at all. Certain of these costs will be borne by Quad even if the Merger is not consummated.
Uncertainties associated with the Merger may cause a loss of management personnel and other key employees, which could adversely affect the future business and operations of Quad following the Merger.
The Company is dependent on the experience and industry knowledge of its officers and other key employees to execute its business plan. Quad’s success after the Merger will depend in part upon the ability of Quad to retain key management personnel and other key employees. Current and prospective employees may experience uncertainty about their roles within Quad following the Merger, which may have an adverse effect on the ability of the Company to attract or retain key management and other key personnel. Accordingly, no assurance can be given that following the Merger, Quad will be able to attract or retain key management personnel and other key employees to the same extent that it has previously been able to attract or retain its own employees.
The market price of the Company’s class A stock may decline in the future as a result of the issuance of shares of the Company’s class A stock in the Merger or the sale of shares held by former LSC or current Quad shareholders.
The Company expects to issue up to approximately 21.6 million shares of its class A stock to LSC stockholders in the Merger. Following their receipt of shares of stock as Merger consideration, former LSC stockholders may seek to sell the shares delivered to them, and the Merger Agreement contains no restriction on the ability of former LSC stockholders to sell such shares of the Company’s class A stock following consummation of the Merger. Other shareholders of the Company’s class A stock may also seek to sell shares of stock held by them following, or in anticipation of, consummation of the Merger. These sales (or the perception that these sales may occur), coupled with the increase in the outstanding number of shares of the Company’s class A stock, may affect the market for, and the market price of, Quad’s class A stock in an adverse manner.
32
The Company’s debt following the Merger may limit its financial flexibility.
As of December 31, 2018, Quad had approximately
$0.93 billion
of outstanding indebtedness (including short-term debt and the current portion of long-term debt) and LSC had approximately
$0.77 billion
of outstanding indebtedness (including the current portion of long-term debt). The Company will use its amended credit facility to repay, refinance, repurchase, redeem, exchange or otherwise terminate LSC’s existing indebtedness prior to, in connection with or following the consummation of the Merger. In addition, under the Merger Agreement, all amounts outstanding under the LSC credit facility will be repaid upon the closing of the Merger and Quad is required to provide all necessary funds for such repayment. As a result, immediately following the consummation of the Merger, the Company is expected to have outstanding indebtedness of approximately
$1.69 billion
, based on the Company’s and LSC’s outstanding indebtedness as of December 31, 2018.
Lawsuits have been filed against Quad, Merger Sub, LSC and the LSC board of directors challenging the adequacy or completeness of the disclosures made in the initial version of Quad’s and LSC’s joint proxy statement/prospectus filed on December 11, 2018, and other lawsuits may be filed against Quad, LSC and/or their respective boards challenging the Merger. An adverse ruling in any such lawsuit may prevent the Merger from being consummated.
Three substantially similar actions were filed by an alleged LSC stockholder against some or all of Quad, Merger Sub, LSC and the directors of LSC in the U.S. District Court for the Northern District of Illinois, the U.S. District Court for the Southern District of New York and the U.S. District Court for the District of Delaware challenging the adequacy or completeness of the disclosures to LSC stockholders made in the initial version of Quad’s and LSC’s joint proxy statement/prospectus filed on December 11, 2018 regarding the Merger. Among other remedies, the plaintiffs seek to enjoin the Merger until additional information relating to the Merger is disclosed.
Additional lawsuits arising out of the Merger may be filed in the future. There can be no assurance that any of the defendants will be successful in the outcome of the pending or any potential future lawsuits. A preliminary injunction could delay or jeopardize the consummation of the Merger, and an adverse judgment granting permanent injunctive relief could indefinitely enjoin the consummation of the Merger.
|
Item 1B.
|
Unresolved Staff Comments
|
The Company has no unresolved staff comments to report pursuant to this item.
33
|
Item 2.
|
Properties
|
Quad’s corporate office is located in Sussex, Wisconsin. The Company owned or leased
145
facilities located in
15
countries including manufacturing operations, warehouses and office space totaling approximately
27,722,000
square feet, of which approximately
20,653,000
is owned space and approximately
7,069,000
is leased space as of
December 31, 2018
. In addition to these owned and leased facilities, the Company has more than
60
client-based marketing on-site locations, as well as investments in printing operations located in Brazil and India.
Within the United States Print and Related Services segment, the Company operated
52
owned or leased manufacturing facilities, encompassing approximately
20,658,000
square feet as of
December 31, 2018
. Within the International segment, the Company operated
eight
owned or leased manufacturing facilities, encompassing approximately
1,829,000
square feet as of
December 31, 2018
. The following table lists the Company’s operating locations with manufacturing facilities totaling over 500,000 square feet as of
December 31, 2018
:
|
Locations
|
Square Feet
|
Property Type
|
Segment
|
|
|
Lomira, Wisconsin, United States
|
2,174,000
|
|
Owned
|
United States Print and Related Services
|
|
Martinsburg, West Virginia, United States
|
2,123,000
|
|
Owned
|
United States Print and Related Services
|
|
Sussex, Wisconsin, United States
|
1,970,000
|
|
Owned
|
United States Print and Related Services
|
|
Hartford, Wisconsin, United States
|
1,682,000
|
|
Owned
|
United States Print and Related Services
|
|
Oklahoma City, Oklahoma, United States
|
1,128,000
|
|
Owned
|
United States Print and Related Services
|
|
Versailles, Kentucky, United States
|
1,065,000
|
|
Owned
|
United States Print and Related Services
|
|
Saratoga Springs, New York, United States
|
1,034,000
|
|
Owned
|
United States Print and Related Services
|
|
West Allis, Wisconsin, United States
|
913,000
|
|
Owned
|
United States Print and Related Services
|
|
The Rock, Georgia, United States
|
797,000
|
|
Owned
|
United States Print and Related Services
|
|
Wyszkow, Poland
|
709,000
|
|
Owned
|
International
|
|
Franklin, Kentucky, United States
(1)
|
617,000
|
|
Owned
|
United States Print and Related Services
|
|
Effingham, Illinois, United States
|
564,000
|
|
Owned
|
United States Print and Related Services
|
|
Merced, California, United States
|
539,000
|
|
Owned
|
United States Print and Related Services
|
______________________________
|
(1)
|
The Franklin, Kentucky facility was announced for closure on December 7, 2018, and ceased operations on February 2, 2019.
|
|
Item 3.
|
Legal Proceedings
|
Quad is subject to various legal actions, administrative proceedings and claims arising out of the ordinary course of business. Quad believes that such unresolved legal actions, proceedings and claims will not materially adversely affect its results of operations, financial condition or cash flows. For additional information, see
Note 10
, “
Commitments and Contingencies
— Litigation,” to the consolidated financial statements in Part II, Item 8, “Financial Statements and Supplementary Data,” of this Annual Report on Form 10-K.
|
Item 4.
|
Mine Safety Disclosures
|
Not applicable.
34
PART II
|
Item 5.
|
Market for the Registrant’s Common Equity, Related Stockholder Matters and Issuer Purchases of Equity Securities
|
Capital Stock and Dividends
Quad’s authorized capital stock consists of
80.0 million
shares of
class A stock
,
80.0 million
shares of
class B stock
,
20.0 million
shares of class C common stock and
0.5 million
shares of preferred stock. The Company’s outstanding capital stock as of
December 31, 2018
, consisted of
38.1 million
shares of
class A stock
,
13.5 million
shares of
class B stock
and
no
shares of class C common stock or preferred stock. As of
February 11, 2019
, there were
2,657
record holders of the
class A stock
and
22
record holders of the class B stock.
The Company’s
class A stock
is listed on the NYSE under the symbol “QUAD”. The
class A stock
is entitled to
one
vote per share. The Company’s
class B stock
is held by certain members of the Quadracci family or trusts for their benefit (and can only be voluntarily transferred to the Company or to a member of the Quadracci “family group” as defined in the Company’s amended and restated articles of incorporation; and any transfer in violation of the Company’s amended and restated articles of incorporation results in the automatic conversion of such
class B stock
into
class A stock
). The class B stock is entitled to
ten
votes per share. Each share of class B stock may, at the option of the holder, be converted at any time into one share of class A stock. There is no public trading market for the
class B stock
. The Company has paid quarterly dividends of $0.30 per share for each class of common stock then outstanding during the years ended December 31, 2018 and 2017.
Pursuant to the Company’s amended and restated articles of incorporation, each outstanding class of common stock has equal rights with respect to cash dividends. Pursuant to the Company’s debt facilities, the Company is subject to limitations on dividends and repurchases of capital stock. If the Company’s total leverage ratio is greater than
3.00 to 1.00
(as defined in the Company’s
Senior Secured Credit Facility
), the Company is prohibited from making greater than
$120.0 million
of annual dividend payments, capital stock repurchases and certain other payments. If the total leverage ratio is less than
3.00 to 1.00
, there are no such restrictions. For the twelve months ended
December 31, 2018
, the Company’s total leverage ratio was
2.19
to 1.00. Refer to
Note 24
, “
Subsequent Events
,” to the consolidated financial statements in Part II, Item 8, “Financial Statements and Supplementary Data,” of this Annual Report on Form 10-K for further information regarding changes to the Company’s limitations on dividends and repurchases of capital stock as a result of the completion of the third amendment to the Senior Secured Credit Facility.
Securities Authorized For Issuance Under Equity Compensation Plans
See Part III, Item 12, “Security Ownership of Certain Beneficial Owners and Management and Related Shareholder Matters,” of this Annual Report on Form 10-K for certain information regarding the Company’s equity compensation plans.
35
Issuer Purchases of Equity Securities
Information about the Company’s repurchases of its
class A stock
during the three months ended
December 31, 2018
, were as follows:
|
Issuer Purchases of Equity Securities
|
||||||||||||
|
Period
|
Total Number of Shares Purchased
(1)
|
Average Price Paid Per Share
|
Total Number of Shares Purchased as Part of Publicly Announced Plans or Programs
(1)
|
Approximate Dollar Value of Shares that May Yet Be Purchased Under the Plans or Programs
(2)
|
||||||||
|
October 1, 2018 to October 31, 2018
|
—
|
|
—
|
|
—
|
|
100,000,000
|
|
||||
|
November 1, 2018 to November 30, 2018
|
—
|
|
—
|
|
—
|
|
100,000,000
|
|
||||
|
December 1, 2018 to December 31, 2018
|
—
|
|
—
|
|
—
|
|
100,000,000
|
|
||||
|
Total
|
—
|
|
—
|
|
||||||||
______________________________
|
(1)
|
Represents shares of the Company’s
class A stock
.
|
|
(2)
|
On
September 6, 2011
, the Company’s Board of Directors authorized a share repurchase program of up to
$100.0 million
of the Company’s outstanding
class A stock
. On
July 30, 2018
, the Company’s Board of Directors discontinued the remainder of the
September 6, 2011
share repurchase program and authorized a new share repurchase program of up to
$100.0 million
of the Company’s outstanding
class A stock
. Under the authorization, share repurchases may be made at the Company’s discretion, from time to time, in the open market and/or in privately negotiated transactions as permitted by federal securities laws and other legal requirements. The timing, manner, price and amount of any repurchase will depend on economic and market conditions, share price, trading volume, applicable legal requirements and other factors. The program may be suspended or discontinued at any time.
|
During the year ended
December 31, 2018
, the Company repurchased
1,871,631
shares of its
class A stock
at a weighted average price of
$19.59
per share for a total purchase price of
$36.7 million
. During the year ended
December 31, 2017
, the Company repurchased
200,605
shares of its
class A stock
at a weighted average price of
$18.89
per share for a total purchase price of
$3.8 million
. During the year ended
December 31, 2016
, the Company repurchased
984,190
shares of its
class A stock
at a weighted average price of
$8.96
per share for a total purchase price of
$8.8 million
. As of
December 31, 2018
, there were
$100.0 million
of authorized repurchases remaining under the program.
36
Stock Performance Information
The following graph compares cumulative shareholder return on Quad’s
class A stock
since
December 31, 2013
, as compared to the Standard & Poor’s (“
S&P
”) MidCap 400 Index and a selected peer group of companies over the same period. Due to the diversity of its product and service offerings, the Company does not believe that any single published industry index is appropriate for comparing stockholder return. As such, the Company has compiled a peer group to use in the below performance graph, incorporating companies from different industries, including commercial printing, marketing services and publishing.
The graph assumes a $100.00 investment and that all dividends are reinvested. The returns of each peer group company have been weighted to reflect their relative market capitalizations. The comparison in the graph below is based upon historical stock performance and should not be considered indicative of future stockholder returns.
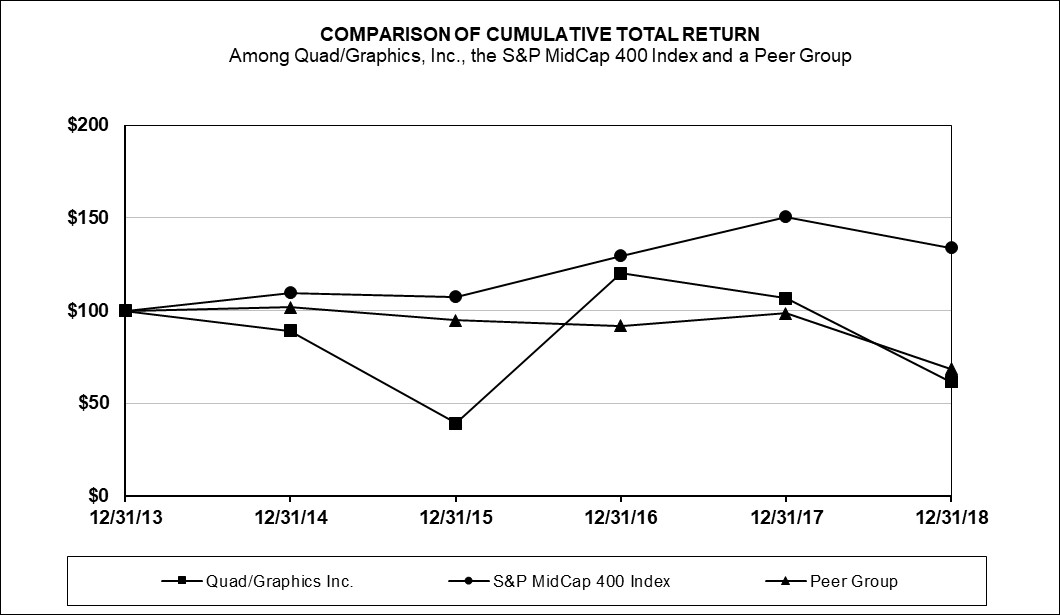
37
Indexed Returns
|
Base Period
|
|||||||||||||||||||||||
|
12/31/2013
|
12/31/2014
|
12/31/2015
|
12/31/2016
|
12/31/2017
|
12/31/2018
|
||||||||||||||||||
|
Quad/Graphics, Inc.
|
$
|
100.00
|
|
$
|
89.04
|
|
$
|
39.28
|
|
$
|
120.22
|
|
$
|
106.61
|
|
$
|
61.59
|
|
|||||
|
S&P MidCap 400 Index
|
100.00
|
|
109.77
|
|
107.38
|
|
129.65
|
|
150.71
|
|
134.01
|
|
|||||||||||
|
Peer Group
(1)
|
100.00
|
|
101.76
|
|
94.85
|
|
91.88
|
|
98.53
|
|
68.77
|
|
|||||||||||
______________________________
|
(1)
|
The following companies were included in the Peer Group:
|
|
LiveRamp Holdings Inc. (formerly Acxiom Corp.)
|
InnerWorkings, Inc.
|
|
Alliance Data Systems Corp.
|
LSC Communications, Inc.
(d)
|
|
Cenveo, Inc.
(a)
|
McClatchy Co.
|
|
Deluxe Corp.
|
Meredith Corp.
|
|
R.R. Donnelley & Sons Co.
(b)
|
Scholastic Corp.
|
|
Gannett Co., Inc.
(c)
|
John Wiley & Sons, Inc.
|
|
Harte Hanks, Inc.
|
|
______________________________
|
(a)
|
Included through September 7, 2018, when Cenveo ceased trading due to bankruptcy.
|
|
(b)
|
Adjusted for reverse split and spin offs of LSC Communications, Inc. and Donnelley Financial Solutions, Inc.
|
|
(c)
|
Included from June 23, 2015, when Gannett Co., Inc. spun off from its parent company
|
|
(d)
|
Included from October 1, 2016, when LSC Communications, Inc. spun off from R.R. Donnelley & Sons Co.
|
38
|
Item 6.
|
Selected Financial Data
|
The selected consolidated statements of operations data for the years ended
December 31, 2018
,
2017
and
2016
, and the selected consolidated balance sheets data at
December 31, 2018
and
2017
, are derived from the audited consolidated financial statements of the Company included in Item 8, “Financial Statements and Supplementary Data,” of this Annual Report on Form 10-K. The selected financial data includes the results of operations of acquired businesses prospectively from their respective acquisition dates. For additional information related to the Company’s acquisition activity, see
Note 3
, “
Acquisitions and Strategic Investments
,” to the consolidated financial statements in Part II, Item 8, “Financial Statements and Supplementary Data,” of this Annual Report on Form 10-K. The selected consolidated statements of operations data for the years ended
December 31, 2015
and
2014
, and the consolidated balance sheets data at
December 31, 2016
,
2015
and
2014
, are derived from audited consolidated financial statements not included herein.
|
SELECTED FINANCIAL DATA
|
|||||||||||||||||||
|
(In millions, except per share data)
|
|||||||||||||||||||
|
2018
|
2017
|
2016
|
2015
|
2014
|
|||||||||||||||
|
Consolidated Statements of Operations Data:
|
|||||||||||||||||||
|
Net sales
|
$
|
4,193.7
|
|
$
|
4,131.4
|
|
$
|
4,329.5
|
|
$
|
4,597.1
|
|
$
|
4,777.6
|
|
||||
|
Operating income (loss)
(1) (2)
|
58.0
|
|
155.3
|
|
117.3
|
|
(838.0
|
)
|
125.3
|
|
|||||||||
|
Net earnings (loss) attributable to Quad common shareholders
(2)
|
8.5
|
|
107.2
|
|
44.9
|
|
(641.9
|
)
|
18.6
|
|
|||||||||
|
Earnings (loss) per diluted share attributable to Quad common shareholders
(2)
|
0.16
|
|
2.07
|
|
0.90
|
|
(13.40
|
)
|
0.38
|
|
|||||||||
|
Consolidated Balance Sheets Data:
|
|||||||||||||||||||
|
Total assets
|
$
|
2,469.1
|
|
$
|
2,452.4
|
|
$
|
2,570.1
|
|
$
|
2,847.5
|
|
$
|
4,008.8
|
|
||||
|
Long-term debt and capital lease obligations (excluding current portion)
|
892.9
|
|
917.2
|
|
1,038.7
|
|
1,249.6
|
|
1,309.4
|
|
|||||||||
|
Other Financial Data:
|
|||||||||||||||||||
|
Dividends per share of common stock
|
$
|
1.20
|
|
$
|
1.20
|
|
$
|
1.20
|
|
$
|
1.20
|
|
$
|
1.20
|
|
||||
______________________________
|
(1)
|
Excludes pension and other postretirement benefits income. On January 1, 2018, Quad adopted
Accounting Standards Update 2017-07
“
Compensation—Retirement Benefits (Topic 715): Improving the Presentation of Net Periodic Pension Cost and Net Periodic Postretirement Benefit Cost
”
(“
ASU 2017-07
”), which provides revised guidance on how to present the components of net pension income in the statement of operations. Quad has adopted ASU 2017-07 retrospectively and has utilized the practical expedient that permits the use of the amounts disclosed in previous filings for net pension income as the estimation basis for the presentation of the prior comparative periods.
|
|
(2)
|
Includes restructuring, impairment and transaction-related charges of
$103.6 million
,
$60.4 million
,
$73.6 million
,
$164.9 million
and
$72.2 million
for the years ended
December 31, 2018
,
2017
,
2016
,
2015
and
2014
, respectively.
|
Includes goodwill impairment charges of $808.3 million ($542.4 million, net of tax) for the year ended December 31, 2015.
Includes a $28.8 million net income tax benefit recorded during the year ended December 31, 2017, as a result of the 2017
Tax Cuts and Jobs Act
(the “
Tax Act
”). See Part II, Item 7, “Management’s Discussion and Analysis of Financial Condition and Results of Operations,” and
Note 13
, “
Income Taxes
,” to the Company’s consolidated financial statements in Part II, Item 8, “Financial Statements and Supplementary Data,” of this Annual Report on Form 10-K for further discussion.
39
|
Item 7.
|
Management’s Discussion and Analysis of Financial Condition and Results of Operations
|
Following discussion of the financial condition and results of operations of Quad should be read together with Quad’s audited consolidated financial statements for each of the three years in the period ended
December 31, 2018
, including the notes thereto, included in Part II, Item 8, “Financial Statements and Supplementary Data,” of this Annual Report on Form 10-K. This discussion contains forward-looking statements that reflect the Company’s plans, estimates and beliefs. The Company’s actual results could differ materially from those discussed in these forward-looking statements. Factors that could cause or contribute to these differences include, but are not limited to, those discussed in “Forward-Looking Statements” and Part I, Item 1A, “Risk Factors,” included earlier within this Annual Report on Form 10-K.
Management’s discussion and analysis of financial condition and results of operations is provided as a supplement to the Company’s consolidated financial statements and accompanying notes to help provide an understanding of the Company’s financial condition, the changes in the Company’s financial condition and the Company’s results of operations. This discussion and analysis is organized as follows:
|
•
|
Overview.
This section includes a general description of the Company’s business and segments, an overview of key performance metrics the Company’s management measures and utilizes to evaluate business performance, and an overview of trends affecting the Company, including management’s actions related to the trends.
|
|
•
|
Results of Operations.
This section contains an analysis of the Company’s results of operations by comparing the results for (1) the year ended
December 31, 2018
, to the year ended
December 31, 2017
; and (2) the year ended
December 31, 2017
, to the year ended
December 31, 2016
. The comparability of the Company’s results of operations between periods was impacted by acquisitions and strategic investments, including the 2018 acquisition of Ivie and the strategic investment in Rise. The results of operations of the Ivie acquisition and the strategic investment of Rise are included in the Company’s consolidated results prospectively from their respective acquisition date for Ivie or the date Quad increased its equity position from 19% to 57% for Rise. Forward-looking statements providing a general description of recent and projected industry and Company developments that are important to understanding the Company’s results of operations are included in this section. This section also provides a discussion of EBITDA and EBITDA margin, financial measures that the Company uses to assess the performance of its business that are not prepared in accordance with
accounting principles generally accepted in the United States of America
(“
GAAP
”).
|
|
•
|
Liquidity and Capital Resources.
This section provides an analysis of the Company’s capitalization, cash flows, a statement about off-balance sheet arrangements and a discussion and table of outstanding debt and commitments. Forward-looking statements important to understanding the Company’s financial condition are included in this section. This section also provides a discussion of Free Cash Flow and Debt Leverage Ratio, non-GAAP financial measures that the Company uses to assess liquidity and capital allocation and deployment.
|
|
•
|
Critical Accounting Policies and Estimates.
This section contains a discussion of the accounting policies that the Company’s management believes are important to the Company’s financial condition and results of operations, as well as allowances and reserves that require significant judgment and estimates on the part of the Company’s management. In addition, all of the Company’s significant accounting policies, including critical accounting policies, are summarized in
Note 1
, “
Basis of Presentation and Summary of Significant Accounting Policies
,” to the consolidated financial statements in Part II, Item 8, “Financial Statements and Supplementary Data,” of this Annual Report on Form 10-K.
|
|
•
|
New Accounting Pronouncements.
|
40
Overview
Business Overview
As a worldwide marketing solutions partner dedicated to creating a better way, Quad uses its data-driven, integrated marketing solutions platform to help clients reduce complexity, increase efficiency and enhance marketing spend effectiveness.
For a full description of the Company’s business overview, product offerings and Quad 3.0 strategy, refer to Part I, Item 1, “Business,” of this Annual Report on Form 10-K.
The Company’s operating and reportable segments are aligned with how the chief operating decision maker of the Company currently manages the business. The Company’s operating and reportable segments, including their product and service offerings, and a “Corporate” category, are summarized below.
The United States Print and Related Services segment is predominantly comprised of the Company’s United States printing operations and is managed as one integrated platform. This includes retail inserts, publications, catalogs, special interest publications, journals, direct mail, books, directories, in-store marketing and promotion, packaging, newspapers, custom print products, other commercial and specialty printed products and global paper procurement, together with marketing and other complementary services, including consumer insights, audience targeting, personalization, media planning and placement, process optimization, campaign planning and creation, pre-media production, videography, photography, digital execution, print execution and logistics. This segment also includes the manufacture of ink. The United States Print and Related Services segment accounted for approximately
91%
of the Company’s consolidated net sales during the year ended
December 31, 2018
.
The International segment consists of the Company’s printing operations in Europe and Latin America, including operations in England, France, Germany, Poland, Argentina, Colombia, Mexico and Peru, as well as investments in printing operations in Brazil and India. This segment provides printed products and marketing and other complementary services consistent with the United States Print and Related Services segment. The International segment accounted for approximately
9%
of the Company’s consolidated net sales during the year ended
December 31, 2018
.
Corporate consists of unallocated general and administrative activities and associated expenses including, in part, executive, legal and finance, as well as certain expenses and income from frozen employee retirement plans, such as pension benefit plans.
Key Performance Metrics Overview
The Company’s management believes the ability to generate net sales growth, profit increases and positive cash flow, while maintaining the appropriate level of debt, are key indicators of the successful execution of the Company’s business strategy and will increase shareholder value. The Company uses period over period net sales growth, EBITDA, EBITDA margin, net cash provided by operating activities, Free Cash Flow and Debt Leverage Ratio as metrics to measure operating performance, financial condition and liquidity. EBITDA, EBITDA margin, Free Cash Flow and Debt Leverage Ratio are non-
GAAP
financial measures (see the definitions of EBITDA, EBITDA margin and the reconciliation of net earnings (loss) to EBITDA in the “Results of Operations” section below, and see the definitions of Free Cash Flow and Debt Leverage Ratio, the reconciliation of net cash provided by operating activities to Free Cash Flow, and the calculation of Debt Leverage Ratio in the “Liquidity and Capital Resources” section below).
Net sales growth.
The Company uses period over period net sales growth as a key performance metric. The Company’s management assesses net sales growth based on the ability to generate increased net sales through increased sales to existing clients, sales to new clients, sales of new or expanded solutions to existing and new clients and opportunities to expand sales through strategic investments, including acquisitions.
41
EBITDA and EBITDA margin.
The Company uses EBITDA and EBITDA margin as metrics to assess operating performance. The Company’s management assesses EBITDA and EBITDA margin based on the ability to increase revenues while controlling variable expense growth.
Net cash provided by operating activities.
The Company uses net cash provided by operating activities as a metric to assess liquidity. The Company’s management assesses net cash provided by operating activities based on the ability to meet recurring cash obligations while increasing available cash to fund cash restructuring requirements related to cost reduction activities, as well as to fund capital expenditures, debt service requirements,
World Color Press
single employer pension plan contributions,
World Color Press
MEPPs
withdrawal liabilities, acquisitions and other investments in future growth, shareholder dividends and share repurchases. Net cash provided by operating activities can be significantly impacted by the timing of non-recurring or infrequent receipts or expenditures.
Free Cash Flow.
The Company uses Free Cash Flow as a metric to assess liquidity and capital deployment. The Company’s management assesses Free Cash Flow as a measure to quantify cash available for strengthening the balance sheet (debt and pension liability reduction), for strategic capital allocation and deployment through investments in the business (acquisitions and strategic investments) and for returning capital to the shareholders (dividends and share repurchases). The priorities for capital allocation and deployment will change as circumstances dictate for the business, and Free Cash Flow can be significantly impacted by the Company’s restructuring activities and other unusual items.
Debt Leverage Ratio.
The Company uses the Debt Leverage Ratio as a metric to assess liquidity and the flexibility of its balance sheet. Consistent with other liquidity metrics, the Company monitors the Debt Leverage Ratio as a measure to determine the appropriate level of debt the Company believes is optimal to operate its business, and accordingly, to quantify debt capacity available for strategic capital allocation and deployment through investments in the business (capital expenditures, acquisitions and strategic investments), for strengthening the balance sheet (pension liability reduction), and for returning capital to the shareholders (dividends and share repurchases). The Company’s priorities for capital allocation and deployment will change as circumstances dictate for the business, and the Debt Leverage Ratio can be significantly impacted by the amount and timing of large expenditures requiring debt financing, as well as changes in profitability.
The Company remains disciplined with its debt leverage. The Company’s consolidated debt and capital leases
decreased
by
$24 million
during the year ended
December 31, 2018
, despite investing
$96 million
in capital expenditures,
$71 million
in acquisitions and strategic investments (primarily the 2018 Ivie acquisition),
$63 million
in the payment of cash dividends and
$37 million
in share repurchases. Since the Company completed the
World Color Press
acquisition in July 2010, the Company has
reduced
debt and capital leases by
$798 million
and has reduced the obligations for pension, postretirement and
MEPPs
by
$429 million
, for a total obligation reduction since July of 2010 of over $1.2 billion.
Overview of Trends Affecting Quad
As consumer media consumption habits change, marketing services providers face increased demand to offer end-to-end marketing services, from strategy and creative through execution, across all media channels. As new marketing and advertising channels emerge, marketing services providers must expand their services beyond traditional channels such as for television, newspapers, print publications and radio, to digital channels such as mobile, internet search, internet display and video, to create effective multichannel campaigns for their clients. This trend greatly influences Quad’s ongoing efforts to redefine the future of integrated marketing and create greater value for its clients who are looking for less complexity, greater transparency and accountability from their business partners.
In Quad 3.0, the Company leverages its data-driven print expertise as part of an integrated marketing solutions platform that helps its clients not only plan and produce marketing programs, but also deploy, manage and measure them across all media channels. Competition in the printing industry remains highly fragmented and intense, and the Company believes that there are indicators of heightened competitive pressures. The industry has excess manufacturing capacity created by continued declines in industry volumes which, in turn, has created accelerated downward pricing pressures. In addition, digital delivery of documents and data, including the online distribution and hosting of media content and mobile technologies, offer alternatives to traditional delivery of printed documents. Increasing consumer
42
acceptance of digital delivery of content has resulted in marketers and publishers allocating their marketing and advertising spend across the expanding selection of digital delivery options, which further reduces printing demand and contributes to industry overcapacity. The Company also faces competition from print management firms, which look to streamline processes and reduce the overall print spend of the Company’s clients, as well as from strategic marketing firms focused on helping businesses integrate multiple channels into their marketing campaigns.
For a full description of the Company’s industry and competition overview, refer to Part I, Item 1, “Business,” of this Annual Report on Form 10-K.
The Company believes that a disciplined approach for capital management and a strong balance sheet are critical to be able to invest in profitable growth opportunities and technological advances, thereby providing the highest return for shareholders. Management balances the use of cash between deleveraging the Company’s balance sheet (through reduction in debt and pension obligations), compelling investment opportunities (through capital expenditures, acquisitions and strategic investments) and returns to shareholders (through share repurchases and a quarterly dividend of
$0.30
per share).
The Company continues to make progress on integrating and streamlining all aspects of its business, thereby lowering its cost structure by consolidating its manufacturing platform into its most efficient facilities, as well as realizing purchasing, mailing and logistics efficiencies by centralizing and consolidating print manufacturing volumes and eliminating redundancies in its administrative and corporate operations. The Company has continued to evolve its manufacturing platform, equipping facilities to be product line agnostic, which enables the Company to maximize equipment utilization. Quad believes that the large plant size of certain of its key printing facilities allows the Company to drive savings in certain product lines (such as publications and catalogs) due to economies of scale and from investments in automation and technology. The Company continues to focus on proactively aligning its cost structure to the realities of the top-line pressures it faces in the printing industry through Lean Manufacturing and sustainable continuous improvement programs. Restructuring actions initiated by the Company beginning in
2010
have resulted in the announcement of
43
plant closures and have reduced headcount by approximately
13,000
employees through
December 31, 2018
.
The Company believes it will continue to drive productivity improvements and sustainable cost reduction initiatives into the future through an engaged workforce and ongoing adoption of the latest manufacturing automation and technology. Through this strategy, the Company believes it can maintain the strongest, most efficient print manufacturing platform to remain a high-quality, low-cost producer.
Integrated distribution with the postal service is an important component of the Company’s business. Any material change in the current service levels provided by the postal service could impact the demand that clients have for print services. The USPS continues to experience financial problems. Without increased revenues or action by Congress to reform the USPS’ cost structure, these losses will continue into the future. Because of these financial difficulties, the USPS has come under increased pressure to adjust its postal rates and service levels. Additional price increases may result in customers reducing mail volumes and exploring the use of alternative methods for delivering a larger portion of their products, such as continued diversion to the internet and other alternative media channels to ensure that they stay within their expected postage budgets.
Current federal law limits postal rate increases (outside of an “exigent circumstance”) to the increase in the CPI. This cap works to ensure funding stability and predictability for mailers. However, that same federal statute requires the PRC to conduct a review of the overall rate-making structure for the USPS. The results of that study found that the current rate structure has been partially successful in meeting the USPS’ goals. The current system does result in predictable and stable rate making. However, the PRC also concluded that the current rate structure does not meet USPS’ revenue needs and lacks pricing efficiency. As a result, the PRC proposed a new rate-making structure that would provide the USPS with additional pricing flexibility over the current CPI cap, and which may result in a substantially altered rate structure for mailers. There is a great deal of uncertainty as to the outcome of this review as the PRC issued a Notice of Proposed Rulemaking with comments due on March 1, 2018. An additional round of comments was due on March 30, 2018. Any newly revised rates that would be effective because of new rules issued by the PRC may include a higher rate cap, or potentially the elimination of a rate cap altogether, which will result in no restrictions on the USPS’
43
ability to increase rates from year to year. This may lead to price spikes for mailers and may also reduce the incentive for the USPS to continue to take out costs and instead continue to rely on postage to cover the costs of an outdated postal service that does not reflect the industry’s ability or willingness to pay. The result may be reduced demand for printed products as customers may move more aggressively into other delivery methods, such as the many digital and mobile options now available to consumers.
On April 12, 2018, an executive order was issued for a presidential task force to review the USPS with a provided time frame of 120 days. Other initiatives, such as postal reform legislation and PRC response, have been temporarily delayed, pending the outcome of this review. The recommendations stemming from the presidential task force were published on December 4, 2018, which were wide in scope and will require additional input from a variety of stakeholders, including the United States Congress. The Company expects that with the publication of the report, both postal reform legislation and the PRC’s proposed rate structure changes will be further investigated within the next year.
The Company has invested significantly in its mail preparation and distribution capabilities to mitigate the impact of increases in postage costs, and to help clients successfully navigate the ever-changing postal environment. Through its data analytics, unique software to merge mail streams on a large scale, advanced finishing capabilities and technology, and in-house transportation and logistics operations, the Company manages the mail preparation and distribution of most of its clients’ products to maximize efficiency, to enable on-time and consistent delivery and to partially reduce these costs; however, the net impact of increasing postal costs may create a decrease in client demand for print and mail products.
In 2018, the Company continued to fuel its Quad 3.0 transformation through a series of strategic investments and acquisitions focused on building out its integrated marketing solutions platform:
|
•
|
The Company acquired
Ivie
, a marketing services provider, on
February 21, 2018
, for a net purchase price of
$92 million
, excluding acquired cash. Headquartered in Flower Mound, Texas,
Ivie
provides Quad with scale for on-site marketing services at more than
60
client locations; integrated execution, including sourcing and procurement; and expanded subject matter expertise in digital, media and creative. The companies’ capabilities are highly complementary. Ivie is a leader in customized marketing and business process outsourcing, and Quad is a leader in content production and workflow process optimization.
|
|
•
|
The Company increased its equity position in
Rise
, a leading digital marketing agency headquartered in Chicago, Illinois, from
19%
to
57%
on
March 14, 2018
, for
$9 million
cash paid and the conversion of previously provided loans to equity ownership. Quad has long worked with
Rise
to orchestrate integrated, cross-media programs that give marketers improved predictability and control over the variables that drive consumer response. As part of Quad’s integrated marketing platform, Rise helps reduce the complexities of working with multiple agencies and improves clients’ process efficiencies and overall marketing spend effectiveness.
|
|
•
|
The Company announced its plans to acquire Minneapolis-based creative agency,
Periscope
, in November 2018, and completed the acquisition on
January 3, 2019
, for a net preliminary purchase price of
$121 million
, excluding acquired cash.
Periscope
’s comprehensive offering includes media buying and analytics, creative and account management, as well as packaging design and premedia services that complement Quad’s print-production capabilities. With Periscope, the Company now has a highly efficient global platform for creating marketing campaigns and programs, from strategy and creative through execution, across all media channels. This integrated, end-to-end marketing platform creates more value for clients than the traditional agency approach that operates in silos by reducing complexity and improving process efficiencies and marketing spend effectiveness.
|
44
|
•
|
On
October 30, 2018
, the Company entered into a definitive agreement to acquire Chicago-based LSC in an all-stock transaction valued at approximately
$1.3 billion
, including the refinancing of LSC’s debt and assumption of other obligations. The acquisition, which is subject to customary closing conditions, including regulatory approval and approval by the shareholders of both companies, is expected to close in mid-2019. The acquisition is expected to create more value for all stakeholders by leveraging a strong print foundation as part of a much larger, more robust integration marketing solutions offering, while broadening Quad’s client base and revenue-generating potential. The transaction presents a compelling opportunity for achieving significant net synergies through the elimination of duplicative functions, capacity rationalization, greater operational efficiencies and greater efficiencies in supply chain management. The Company believes the significant level of synergies will result in a more profitable combined company, and that the all-stock transaction structure is expected to allow Quad to maintain a strong balance sheet, which is expected to create future value for all shareholders.
|
Throughout 2018, the Company also continued to make strategic investments in its manufacturing platform as part of its ongoing commitment to maintaining the most efficient, automated and dependable manufacturing and distribution platform in the printing industry. These investments, which help fuel Quad’s 3.0 transformation and sustain its high-quality, low-cost producer position, include the following:
|
•
|
Direct Marketing Platform:
The Company continued to make investments that help its clients gain a competitive edge with data-driven, hyper-personalized print marketing that is impactful, cost-effective and delivers improved return on marketing investment. The Company also debuted Accelerated Insights
TM
, a groundbreaking predictive direct mail virtual technology that allows marketers to rapidly test direct mail creative and formats prior to mailing. The technology helps marketers predict what factors motivate someone to act on an offer prior to physical mailing.
|
|
•
|
Book Platform:
The Company continued to invest in its book platform to match clients’ portfolios of products and redefine the book supply chain through increased customization and versioning capabilities; faster time to market; reduced waste, inventories and obsolescence through innovative solutions, such as a proprietary demand-driven ordering system; and lower fixed costs. Investments throughout the book platform included, but not limited to, a new sheetfed press for printing paper covers, end sheets and cover mounts for hardcover books; a new perfect binder with automatic makeready features; and an overhead storage and conveyor system that will help with work in process, especially for small digital orders.
|
|
•
|
Magazine, Catalog and Retail Platform:
The Company continued to strengthen its Magazine, Catalog and Retail Platform and offering. To enhance productivity and offset labor shortages, the company continues to investment in automation, such as automated guided vehicles (driverless fork trucks) and automated palletizers at the end of finishing lines.
|
45
Results of Operations for the Year Ended
December 31, 2018
, Compared to the Year Ended
December 31, 2017
Summary Results
The Company’s operating income, operating margin, net earnings attributable to Quad common shareholders and diluted earnings per share attributable to Quad common shareholders for the year ended
December 31, 2018
, changed from the year ended
December 31, 2017
, as follows (dollars in millions, except per share data). The effects of the changes on net earnings attributable to Quad common shareholders were computed using a 25% normalized tax rate as adjusted for the Tax Act that was enacted in 2017 for all items subject to tax for the year ended
December 31, 2018
, and were computed using a 40% normalized tax rate for all items subject to tax for the year ended
December 31, 2017
, which was the normalized rate used by the Company prior to the enactment of the Tax Act:
|
Operating Income
|
Operating Margin
|
Net Earnings Attributable to Quad Common Shareholders
|
Diluted Earnings Per Share Attributable to Quad Common Shareholders
|
|||||||||||
|
For the year ended December 31, 2017
|
$
|
155.3
|
|
3.8
|
%
|
$
|
107.2
|
|
$
|
2.07
|
|
|||
|
2018 restructuring, impairment and transaction-related charges
(1)
|
(103.6
|
)
|
(2.5
|
)%
|
(77.7
|
)
|
(1.51
|
)
|
||||||
|
2017 restructuring, impairment and transaction-related charges
(2)
|
60.4
|
|
1.5
|
%
|
36.2
|
|
0.70
|
|
||||||
|
Interest expense
(3)
|
N/A
|
|
N/A
|
|
(12.3
|
)
|
(0.24
|
)
|
||||||
|
Net pension income
(4)
|
N/A
|
|
N/A
|
|
3.5
|
|
0.07
|
|
||||||
|
2017 loss on debt extinguishment
(5)
|
N/A
|
|
N/A
|
|
1.6
|
|
0.03
|
|
||||||
|
Income taxes
(6)
|
N/A
|
|
N/A
|
|
(43.4
|
)
|
(0.84
|
)
|
||||||
|
Investments in unconsolidated entity and noncontrolling interests, net of tax
(7)
|
N/A
|
|
N/A
|
|
1.6
|
|
0.03
|
|
||||||
|
Operating income
(8)
|
(54.1
|
)
|
(1.4
|
)%
|
(8.2
|
)
|
(0.15
|
)
|
||||||
|
For the year ended December 31, 2018
|
$
|
58.0
|
|
1.4
|
%
|
$
|
8.5
|
|
$
|
0.16
|
|
|||
______________________________
|
(1)
|
Restructuring, impairment and transaction-related charges of
$103.6 million
(
$77.7 million
, net of tax) incurred during the year ended
December 31, 2018
, included the following:
|
|
a.
|
$23.0 million
of employee termination charges related to workforce reductions through facility consolidations and voluntary and involuntary separation programs;
|
|
b.
|
$26.5 million
of impairment charges, including
$16.9 million
of impairment charges for machinery and equipment no longer being utilized in production as a result of facility consolidations, including Waseca, Minnesota; Hazleton, Pennsylvania; and Franklin, Kentucky; as well as other capacity and strategic reduction restructuring initiatives, including
$5.0 million
of impairment charges for machinery and equipment in Peru; and
$4.6 million
of land and building impairment charges, primarily related to the Franklin, Kentucky plant closure;
|
|
c.
|
$8.2 million
of transaction-related charges, consisting of professional service fees for business acquisition and divestiture activities, including
$6.4 million
related to the proposed acquisition of
LSC
;
|
|
d.
|
$44.6 million
of various other restructuring charges, consisting of a
$32.1 million
increase to the Company’s MEPPs withdrawal liability, $10.0 million in charges for certain legal matters and customer contract penalties related to the Company’s operations in Peru, and costs to maintain and exit closed facilities. These charges are presented net of
$17.3 million
in gains on the sale of facilities, including a
$7.5 million
gain from the sale of the Taunton, Massachusetts Book plant, a
$7.0 million
gain from the sale of the Dallas, Texas plant and a
$2.2 million
gain from the sale of the San Ixhuatepec, Mexico plant.
|
The Company expects to incur additional restructuring and integration costs in future reporting periods in connection with eliminating excess manufacturing capacity and properly aligning its cost structure in conjunction with the Company’s acquisitions and strategic investments, and other cost reduction programs.
46
|
(2)
|
Restructuring, impairment and transaction-related charges of
$60.4 million
(
$36.2 million
, net of tax) incurred during the year ended
December 31, 2017
, included the following:
|
|
a.
|
$26.9 million of employee termination charges related to workforce reductions through facility consolidations and separation programs;
|
|
b.
|
$12.0 million of impairment charges, including $6.7 million of impairment charges for machinery and equipment no longer being utilized in production as a result of facility consolidations, including Waseca, Minnesota; Columbus, Ohio; and Taunton, Massachusetts, as well as other capacity and strategic reduction restructuring activities; and $5.3 million of impairment charges for land and building related to the Waseca, Minnesota and Taunton, Massachusetts plant closures;
|
|
c.
|
$3.1 million of transaction-related charges, consisting of professional service fees for business acquisition and divestiture activities;
|
|
d.
|
$18.4 million
of various other restructuring charges, including costs to maintain and exit closed facilities, as well as lease exit charges, net of $7.1 million in gains from the sale of the Atglen, Pennsylvania; Dickson, Tennessee; East Greenville, Pennsylvania; Lenexa, Kansas; and Marengo, Iowa plants, and a $1.2 million gain from the Company’s Argentina Subsidiaries’ settlements with vendors through bankruptcy proceedings. Other restructuring charges also included a $6.7 million loss on the sale of a business.
|
|
(3)
|
Interest expense
increased
$2.2 million
(
$12.3 million
, net of tax impact due to the change in the normalized tax rate) during the year ended
December 31, 2018
, to
$73.3 million
. This change was due to a higher weighted average interest rate on borrowings and higher average debt levels during the year ended
December 31, 2018
, as compared to the year ended
December 31, 2017
.
|
|
(4)
|
Net pension income
increased
$2.8 million
(
$3.5 million
, net of tax impact due to the change in the normalized tax rate) during the year ended
December 31, 2018
, to
$12.4 million
. This change was due to a
$1.3 million
decrease
from the interest cost on pension plan liabilities, a
$0.8 million
decrease in settlement charges and a
$0.7 million
increase
from the expected return on pension plan assets.
|
|
(5)
|
A $2.6 million loss on debt extinguishment ($1.6 million, net of tax) was recognized during the year ended December 31, 2017, from the refinancing of the Senior Secured Credit Facility, completed on February 10, 2017.
|
|
(6)
|
The
$43.4 million
decrease in income tax benefit as calculated in the following table is primarily due to a $28.8 million tax benefit related to the reduced federal rate applied to net domestic deferred tax liabilities in accordance with the Tax Act and a $13.1 million decreased net tax benefit from the release of valuation allowances related to foreign operations. See
Note 13
, “
Income Taxes
,” to the consolidated financial statements in Part II, Item 8 of this Annual Report on Form 10-K for further information on income taxes.
|
|
Year Ended December 31,
|
|||||||||||
|
2018
|
2017
|
$ Change
|
|||||||||
|
Earnings (loss) before income taxes and equity in loss of unconsolidated entity
|
$
|
(2.9
|
)
|
$
|
91.2
|
|
$
|
(94.1
|
)
|
||
|
Normalized tax rate in 2017
|
40.0
|
%
|
40.0
|
%
|
40.0
|
%
|
|||||
|
Income tax (benefit) expense at normalized tax rate in 2017
|
(1.2
|
)
|
36.5
|
|
(37.7
|
)
|
|||||
|
Impact of change in normalized tax rate to 25% in 2018
|
0.5
|
|
—
|
|
0.5
|
|
|||||
|
Income tax (benefit) expense at normalized tax rate of 25% in 2018 and 40% in 2017
|
(0.7
|
)
|
36.5
|
|
(37.2
|
)
|
|||||
|
Less: Income tax benefit from the consolidated statements of operations
|
(9.8
|
)
|
(16.0
|
)
|
6.2
|
|
|||||
|
Impact of income taxes
|
$
|
9.1
|
|
$
|
52.5
|
|
$
|
(43.4
|
)
|
||
47
|
(7)
|
The increase from investments in unconsolidated entity and noncontrolling interests, net of tax, of
$1.6 million
during the year ended
December 31, 2018
, was primarily due to a
$1.0 million
increase in earnings at the Company’s investment in
Plural Industria Gráfica Ltda.
(“
Plural
”), the Company’s Brazilian joint venture, and the favorable impact from the adjustment of the
$0.6 million
net loss attributed to noncontrolling interests in the Company’s consolidated statements of operations related to the Company’s 57% ownership of Rise.
|
|
(8)
|
Operating income, excluding restructuring, impairment and transaction-related charges, decreased
$54.1 million
(
$8.2 million
, net of tax impact due to the change in the normalized tax rate) primarily due to the following: (1) lower print volume and pricing due to ongoing industry pressures; (2) a $22.3 million non-cash expense related to a special employee retirement contribution in 2018 resulting from the benefit of tax reform; and (3) a $10.7 million net benefit in 2017 from changes in employee vacation policies. These decreases were partially offset by the following: (1) a $13.3 million net benefit in 2018 in gain from property insurance claims; (2) earnings from the Ivie acquisition and the investment in Rise; (3) a $5.6 million gain from a sales tax litigation settlement in Peru; and (4) savings from cost reduction initiatives.
|
Operating Results
The following table sets forth certain information from the Company’s consolidated statements of operations on an absolute dollar basis and as a relative percentage of total net sales for each noted period, together with the relative percentage change in such information between the periods set forth below:
|
Year Ended December 31,
|
||||||||||||||||||||
|
2018
|
2017
|
|||||||||||||||||||
|
(dollars in millions)
|
||||||||||||||||||||
|
Amount
|
% of Net
Sales
|
Amount
|
% of Net
Sales
|
$ Change
|
%
Change
|
|||||||||||||||
|
Net sales:
|
||||||||||||||||||||
|
Products
|
$
|
3,392.3
|
|
80.9
|
%
|
$
|
3,529.0
|
|
85.4
|
%
|
$
|
(136.7
|
)
|
(3.9
|
)%
|
|||||
|
Services
|
801.4
|
|
19.1
|
%
|
602.4
|
|
14.6
|
%
|
199.0
|
|
33.0
|
%
|
||||||||
|
Total net sales
|
4,193.7
|
|
100.0
|
%
|
4,131.4
|
|
100.0
|
%
|
62.3
|
|
1.5
|
%
|
||||||||
|
Cost of sales:
|
||||||||||||||||||||
|
Products
|
2,829.0
|
|
67.5
|
%
|
2,827.3
|
|
68.4
|
%
|
1.7
|
|
0.1
|
%
|
||||||||
|
Services
|
600.3
|
|
14.3
|
%
|
432.1
|
|
10.5
|
%
|
168.2
|
|
38.9
|
%
|
||||||||
|
Total cost of sales
|
3,429.3
|
|
81.8
|
%
|
3,259.4
|
|
78.9
|
%
|
169.9
|
|
5.2
|
%
|
||||||||
|
Selling, general & administrative expenses
|
372.1
|
|
8.9
|
%
|
423.8
|
|
10.3
|
%
|
(51.7
|
)
|
(12.2
|
)%
|
||||||||
|
Depreciation and amortization
|
230.7
|
|
5.5
|
%
|
232.5
|
|
5.6
|
%
|
(1.8
|
)
|
(0.8
|
)%
|
||||||||
|
Restructuring, impairment and transaction-related charges
|
103.6
|
|
2.4
|
%
|
60.4
|
|
1.4
|
%
|
43.2
|
|
71.5
|
%
|
||||||||
|
Total operating expenses
|
4,135.7
|
|
98.6
|
%
|
3,976.1
|
|
96.2
|
%
|
159.6
|
|
4.0
|
%
|
||||||||
|
Operating income
|
$
|
58.0
|
|
1.4
|
%
|
$
|
155.3
|
|
3.8
|
%
|
$
|
(97.3
|
)
|
(62.7
|
)%
|
|||||
Net Sales
Product sales
decreased
$136.7 million
, or
3.9%
, for the year ended
December 31, 2018
, compared to the year ended
December 31, 2017
, primarily due to a $181.2 million decrease in product sales in the Company’s print product lines due to ongoing industry volume and pricing pressures and $14.7 million in unfavorable foreign exchange impacts, primarily in Argentina; partially offset by a $59.2 million increase from pass-through paper sales.
Service sales, which primarily consist of logistics, distribution, marketing services, imaging and medical services,
increased
$199.0 million
, or
33.0%
, for the year ended
December 31, 2018
, compared to the year ended
December 31, 2017
, primarily due to a $176.2 million increase in net sales from the Ivie acquisition and investment in Rise and a $29.5 million increase in logistics sales, partially offset by a $5.7 million decrease in sales of imaging services.
48
Cost of Sales
Cost of product sales
increased
$1.7 million
, or
0.1%
, for the year ended
December 31, 2018
, compared with the year ended
December 31, 2017
, primarily due to an increase in paper costs and a $14.0 million non-cash expense related to a special employee retirement contribution in 2018. These increases were partially offset by lower print volume and cost reduction initiatives.
Cost of product sales as a percentage of net sales decreased to
67.5%
for the year ended
December 31, 2018
, from
68.4%
for the year ended
December 31, 2017
, primarily due to the reasons provided above.
Cost of service sales
increased
$168.2 million
, or
38.9%
, for the year ended
December 31, 2018
, compared with the year ended
December 31, 2017
, primarily due to the Ivie acquisition and investment in Rise, increased logistics freight costs and a $2.6 million non-cash expense related to a special employee retirement contribution in 2018.
Cost of service sales as a percentage of net sales
increased
to
14.3%
for the year ended
December 31, 2018
, from
10.5%
for the year ended
December 31, 2017
, primarily due to the reasons provided above.
Selling, General and Administrative Expenses
Selling, general and administrative expenses
decreased
$51.7 million
, or
12.2%
, for the year ended
December 31, 2018
, compared with the year ended
December 31, 2017
, primarily due to the following: (1) savings from cost reduction initiatives, including employee-related costs; (2)
a $13.3 million net b
enefit in 2018 in gain from property insurance claims; and (3) a $5.6 million gain from a sales tax litigation settlement in Peru, partially offset by a $10.3 million benefit in 2017 from a change in the salaried employee vacation policy that did not repeat in 2018 and a $5.7 million non-cash expense related to a special employee retirement contribution in 2018. Selling, general and administrative expenses as a percentage of net sales decreased from
10.3%
for the year ended
December 31, 2017
, to
8.9%
for the year ended
December 31, 2018
, primarily due to the reasons stated above.
Depreciation and Amortization
Depreciation and amortization
decreased
$1.8 million
, or
0.8%
, for the year ended
December 31, 2018
, compared with the year ended
December 31, 2017
, due to a
$17.9 million
decrease
in depreciation expense from property, plant and equipment becoming fully depreciated over the past year, partially offset by a
$16.1 million
increase
in amortization expense, primarily related to amortization expense for intangible assets acquired in the Ivie acquisition and the investment in Rise.
Restructuring, Impairment and Transaction-Related Charges
Restructuring, impairment and transaction-related charges
increased
$43.2 million
, or
71.5%
, for the year ended
December 31, 2018
, compared with the year ended
December 31, 2017
, primarily due to the following: (1) a
$14.5 million
increase
in impairment charges; (2) a
$5.1 million
increase
in transaction-related charges; (3) a
$1.3 million
increase
in acquisition-related integration costs; and (4) a
$26.2 million
increase
in other restructuring charges. These decreases were partially offset by a
$3.9 million
decrease
in employee termination charges.
Restructuring, impairment and transaction-related charges of
$103.6 million
incurred in the year ended
December 31, 2018
, included the following: (1)
$23.0 million
of employee termination charges related to workforce reductions through facility consolidations and separation programs; (2)
$26.5 million
of impairment charges, including
$16.9 million
of impairment charges for machinery and equipment no longer being utilized in production as a result of facility consolidations, including Waseca, Minnesota; Hazleton, Pennsylvania; and Franklin, Kentucky; as well as other capacity and strategic reduction restructuring initiatives, including
$5.0 million
of impairment charges for machinery and equipment in Peru; and
$4.6 million
of land and building impairment charges, primarily related to the Franklin, Kentucky plant closure; (3)
$8.2 million
of transaction-related charges consisting of professional service fees related to business acquisition and divestiture activities, including
$6.4 million
related to the proposed acquisition of
LSC
; and (4)
$44.6 million
of various other restructuring charges, consisting of a
$32.1 million
increase to the Company’s MEPPs
49
withdrawal liability, $10.0 million in charges for certain legal matters and customer contract penalties related to the Company’s operations in Peru, and costs to maintain and exit closed facilities. These charges are presented net of
$17.3 million
in gains on the sale of facilities, including a
$7.5 million
gain from the sale of the Taunton, Massachusetts Book plant, a
$7.0 million
gain from the sale of the Dallas, Texas plant and a
$2.2 million
gain from the sale of the San Ixhuatepec, Mexico plant.
Restructuring, impairment and transaction-related charges of
$60.4 million
incurred in the year ended December 31, 2017, included the following: (1) $26.9 million of employee termination charges related to workforce reductions through facility consolidations and separation programs; (2) $12.0 million of impairment charges, including $6.7 million of impairment charges for machinery and equipment no longer being utilized in production as a result of facility consolidations, including Waseca, Minnesota; Columbus, Ohio; and Taunton, Massachusetts, as well as other capacity and strategic reduction restructuring activities; and $5.3 million of impairment charges for land and building related to the Waseca, Minnesota and Taunton, Massachusetts plant closures; (3) $3.1 million of transaction-related charges consisting of professional service fees related to business acquisition and divestiture activities; and (4)
$18.4 million
of various other restructuring charges, including costs to maintain and exit closed facilities, as well as lease exit charges, net of $7.1 million in gains from the sale of the Atglen, Pennsylvania; Dickson, Tennessee; East Greenville, Pennsylvania; Lenexa, Kansas; and Marengo, Iowa plants, and a $1.2 million gain from the Company’s Argentina Subsidiaries’ settlements with vendors through bankruptcy proceedings. Other restructuring charges also included a $6.7 million loss on the sale of a business.
EBITDA and EBITDA Margin—Consolidated
EBITDA is defined as net earnings (loss) attributable to Quad common shareholders, excluding (1) interest expense, (2) income tax expense (benefit) and (3) depreciation and amortization. EBITDA margin represents EBITDA as a percentage of net sales. EBITDA and EBITDA margin are presented to provide additional information regarding Quad’s performance. Both are important measures by which Quad gauges the profitability and assesses the performance of its business. EBITDA and EBITDA margin are non-GAAP financial measures and should not be considered alternatives to net earnings (loss) as a measure of operating performance, or to cash flows provided by operating activities as a measure of liquidity. Quad’s calculation of EBITDA and EBITDA margin may be different from the calculations used by other companies, and therefore, comparability may be limited.
EBITDA and EBITDA margin for the year ended
December 31, 2018
, compared to the year ended
December 31, 2017
, were as follows:
|
Year Ended December 31,
|
|||||||||||||
|
2018
|
2017
|
||||||||||||
|
Amount
|
% of Net Sales
|
Amount
|
% of Net Sales
|
||||||||||
|
(dollars in millions)
|
|||||||||||||
|
EBITDA and EBITDA margin (non-GAAP)
|
$
|
302.7
|
|
7.2
|
%
|
$
|
394.8
|
|
9.6
|
%
|
|||
EBITDA
decreased
$92.1 million
for the year ended
December 31, 2018
, compared to the year ended
December 31, 2017
, primarily due to the following: (1) lower print volume and pricing due to ongoing industry pressures; (2)
$43.2 million
of
increased
restructuring, impairment and transaction-related charges; (3) a $22.3 million non-cash expense related to a special employee retirement contribution in 2018; and (4) a $10.7 million net benefit in 2017 from changes in employee vacation policies. These impacts were partially offset by the following: (1) a $13.3 million net benefit in 2018 in gain from property insurance claims; (2) earnings from the Ivie acquisition and investment in Rise; (3) a $5.6 million gain from a sales tax litigation settlement in Peru; and (4) savings from cost reduction initiatives, including employee-related costs.
50
A reconciliation of EBITDA to net earnings attributable to Quad common shareholders for the years ended
December 31, 2018
and
2017
, was as follows:
|
Year Ended December 31,
|
|||||||
|
2018
|
2017
|
||||||
|
(dollars in millions)
|
|||||||
|
Net earnings attributable to Quad common shareholders
(1)
|
$
|
8.5
|
|
$
|
107.2
|
|
|
|
Interest expense
|
73.3
|
|
71.1
|
|
|||
|
Income tax benefit
|
(9.8
|
)
|
(16.0
|
)
|
|||
|
Depreciation and amortization
|
230.7
|
|
232.5
|
|
|||
|
EBITDA (non-GAAP)
|
$
|
302.7
|
|
$
|
394.8
|
|
|
______________________________
|
(1)
|
Net earnings attributable to Quad common shareholders included the following:
|
|
a.
|
Restructuring, impairment and transaction-related charges of
$103.6 million
and
$60.4 million
for the years ended
December 31, 2018
and
2017
, respectively;
|
|
b.
|
Employee stock ownership plan non-cash expense related to a special employee retirement contribution of $22.3 million for the year ended December 31, 2018;
|
|
c.
|
Net pension income of
$12.4 million
and
$9.6 million
for the years ended
December 31, 2018
and
2017
, respectively;
|
|
d.
|
Loss on debt extinguishment of $2.6 million for the year ended December 31, 2017;
|
|
e.
|
Equity in earnings of unconsolidated entity of
$1.0 million
for the year ended
December 31, 2018
; and
|
|
f.
|
Net loss attributable to noncontrolling interests of
$0.6 million
for the year ended
December 31, 2018
.
|
United States Print and Related Services
The following table summarizes net sales, operating income, operating margin and certain items impacting comparability within the United States Print and Related Services segment:
|
Year Ended December 31,
|
||||||||||||||
|
2018
|
2017
|
|||||||||||||
|
(dollars in millions)
|
||||||||||||||
|
Amount
|
Amount
|
$ Change
|
% Change
|
|||||||||||
|
Net sales:
|
||||||||||||||
|
Products
|
$
|
3,023.8
|
|
$
|
3,156.9
|
|
$
|
(133.1
|
)
|
(4.2
|
)%
|
|||
|
Services
|
782.8
|
|
583.2
|
|
199.6
|
|
34.2
|
%
|
||||||
|
Operating income (including restructuring, impairment and transaction-related charges)
|
154.0
|
|
194.3
|
|
(40.3
|
)
|
(20.7
|
)%
|
||||||
|
Operating margin
|
4.0
|
%
|
5.2
|
%
|
N/A
|
|
N/A
|
|
||||||
|
Restructuring, impairment and transaction-related charges
|
$
|
37.8
|
|
$
|
53.6
|
|
$
|
(15.8
|
)
|
(29.5
|
)%
|
|||
Net Sales
Product sales for the United States Print and Related Services segment
decreased
$133.1 million
, or
4.2%
, for the year ended
December 31, 2018
, compared to the year ended
December 31, 2017
, primarily due to a $184.7 million decrease in product sales in the Company’s print product lines (predominantly due to ongoing volume and pricing pressures from excess capacity in the printing industry), partially offset by a $51.6 million increase in pass-through paper sales.
Service sales for the United States Print and Related Services segment
increased
$199.6 million
, or
34.2%
, for the year ended
December 31, 2018
, compared to the year ended
December 31, 2017
, primarily due to a $176.2 million increase in net sales from the Ivie acquisition and investment in Rise and a $30.1 million increase in logistics sales, partially offset by a $5.7 million decrease in sales of imaging services.
Operating Income
Operating income for the United States Print and Related Services segment
decreased
$40.3 million
, or
20.7%
, for the year ended
December 31, 2018
, compared to the year ended
December 31, 2017
, primarily due to the following: (1) lower print volume and pricing due to ongoing industry pressures; (2) a $21.9 million non-cash expense related to a special employee retirement contribution in 2018; (3) a $10.7 million net benefit in 2017 from changes in employee vacation policies. These impacts were partially offset by the following: (1) a
$15.8 million
decrease
in restructuring, impairment and transaction-related charges; (2) a $13.3 million net benefit in 2018 in gain from property insurance claims; (3) earnings from the Ivie acquisition and the investment in Rise; and (4) savings from cost reduction initiatives, including employee-related costs.
The operating margin for the United States Print and Related Services segment decreased to
4.0%
for the year ended
December 31, 2018
, from
5.2%
for the year ended
December 31, 2017
, primarily due to the reasons provided above.
Restructuring, Impairment and Transaction-Related Charges
Restructuring, impairment and transaction-related charges for the United States Print and Related Services segment for the year ended
December 31, 2018
, were
$37.8 million
, consisting of the following: (1)
$16.1 million
of employee termination charges related to workforce reductions through facility consolidations and separation programs; (2)
$18.3 million
of impairment charges, including
$16.1 million
of impairment charges for machinery and equipment no longer being utilized in production as a result of facility consolidations, including Waseca, Minnesota; Hazleton, Pennsylvania; and Franklin, Kentucky; as well as other capacity and strategic reduction restructuring initiatives; and
$2.2 million
of impairment charges for land and building related to the Franklin, Kentucky plant closure; and (3)
$2.0 million
of various other restructuring charges, including costs to maintain and exit closed facilities, as well as lease exit charges. These charges are presented net of gains on the sale of facilities, including a
$7.5 million
gain from the sale of the Taunton, Massachusetts Book plant and a
$7.0 million
gain from the sale of the Dallas, Texas plant.
Restructuring, impairment and transaction-related charges for the United States Print and Related Services segment for the year ended December 31, 2017, were
$53.6 million
, consisting of the following: (1) $21.7 million of employee termination charges related to workforce reductions through facility consolidations and separation programs; (2) $11.5 million of impairment charges, including $6.2 million of impairment charges for machinery and equipment no longer being utilized in production as a result of facility consolidations, including Waseca, Minnesota; Columbus, Ohio; and Taunton, Massachusetts, as well as other capacity and strategic reduction restructuring activities; and $5.3 million of impairment charges for land and building related to the Waseca, Minnesota and Taunton, Massachusetts plant closures; and (3) $19.4 million of various other restructuring charges, including costs to maintain and exit closed facilities, as well as lease exit charges, net of $7.1 million in gains from the sale of the Atglen, Pennsylvania; Dickson, Tennessee; East Greenville, Pennsylvania; Lenexa, Kansas; and Marengo, Iowa plants. Other restructuring charges also included a $6.7 million loss on the sale of a business.
51
International
The following table summarizes net sales, operating income, operating margin, certain items impacting comparability and equity in loss of unconsolidated entities within the International segment:
|
Year Ended December 31,
|
||||||||||||||
|
2018
|
2017
|
|||||||||||||
|
(dollars in millions)
|
||||||||||||||
|
Amount
|
Amount
|
$ Change
|
% Change
|
|||||||||||
|
Net sales:
|
||||||||||||||
|
Products
|
$
|
368.5
|
|
$
|
372.1
|
|
$
|
(3.6
|
)
|
(1.0
|
)%
|
|||
|
Services
|
18.6
|
|
19.2
|
|
(0.6
|
)
|
(3.1
|
)%
|
||||||
|
Operating income (including restructuring, impairment and transaction-related charges)
|
1.5
|
|
19.6
|
|
(18.1
|
)
|
(92.3
|
)%
|
||||||
|
Operating margin
|
0.4
|
%
|
5.0
|
%
|
N/A
|
|
N/A
|
|
||||||
|
Restructuring, impairment and transaction-related charges
|
$
|
22.2
|
|
$
|
3.3
|
|
$
|
18.9
|
|
nm
|
|
|||
|
Equity in earnings of unconsolidated entity
|
(1.0
|
)
|
—
|
|
(1.0
|
)
|
100.0
|
%
|
||||||
Net Sales
Product sales for the International segment
decreased
$3.6 million
, or
1.0%
, for the year ended
December 31, 2018
, compared to the year ended
December 31, 2017
, primarily due to $14.7 million in unfavorable foreign exchange impacts, partially offset by a $7.6 million increase in pass-through paper sales and a $3.5 million increase in volume and pricing, primarily in Mexico.
Service sales for the International segment
decreased
$0.6 million
, or
3.1%
, for the year ended
December 31, 2018
, compared to the year ended
December 31, 2017
, primarily due to a decrease in logistics revenue in Europe.
Operating Income
Operating income for the International segment
decreased
$18.1 million
, or
92.3%
, for the year ended
December 31, 2018
, compared to the year ended
December 31, 2017
, primarily due to a
$18.9 million
increase
in restructuring and impairment expenses, partially offset by a $5.6 million gain from a sales tax litigation settlement in Peru and a $4.8 million increase in operating income, primarily in Mexico.
Restructuring, Impairment and Transaction-Related Charges
Restructuring, impairment and transaction-related charges for the International segment for the year ended
December 31, 2018
, were
$22.2 million
, consisting of the following: (1)
$3.7 million
of employee termination charges related to workforce reductions through facility consolidations and separation programs; (2)
$8.2 million
of impairment charges, including
$5.8 million
for machinery and equipment no longer being utilized in production as a result of facility consolidations, as well as other capacity and strategic reduction restructuring initiatives, including
$5.0 million
of impairment charges for machinery and equipment in Peru; and
$2.4 million
of impairment charges for land and building; (3)
$10.3 million
of various other restructuring charges, including $10.0 million in charges for certain legal matters and customer contract penalties related to the Company’s operations in Peru.
Restructuring, impairment and transaction-related charges for the International segment for the year ended December 31, 2017, were
$3.3 million
, consisting of the following: (1) $4.7 million of employee termination charges related to workforce reductions through facility consolidations and separation programs; (2) $0.5 million of impairment charges for machinery and equipment no longer being utilized in production as a result of facility consolidations; and (3) $1.9 million of various other restructuring income primarily related to the Company’s Argentina Subsidiaries’ gain from settlements with vendors through bankruptcy proceedings, partially offset by charges to maintain and exit closed facilities.
Equity in Earnings of Unconsolidated Entities
Investments in entities where Quad has the ability to exert significant influence, but not control, are accounted for using the equity method of accounting. The Company holds a
49%
ownership interest in
Plural
, a commercial printer based in São Paulo, Brazil. The equity in earnings of unconsolidated entity in the International segment increased
$1.0 million
for the year ended
December 31, 2018
, compared to the year ended
December 31, 2017
, due to an increase in earnings at the Company’s investment in Plural.
Unrestricted Subsidiaries
Unrestricted subsidiaries as defined in the Senior Unsecured Notes indenture represented less than
2.0%
of total consolidated net sales for the year ended
December 31, 2018
.
Corporate
The following table summarizes unallocated operating expenses presented as Corporate:
|
Year Ended December 31,
|
||||||||||||||
|
2018
|
2017
|
|||||||||||||
|
(dollars in millions)
|
||||||||||||||
|
Amount
|
Amount
|
$ Change
|
% Change
|
|||||||||||
|
Operating expenses (including restructuring, impairment and transaction-related charges)
|
$
|
97.5
|
|
$
|
58.6
|
|
$
|
38.9
|
|
66.4
|
%
|
|||
|
Restructuring, impairment and transaction-related charges
|
43.6
|
|
3.5
|
|
40.1
|
|
1,145.7
|
%
|
||||||
Operating Expenses
Corporate operating expenses
increased
$38.9 million
, or
66.4%
, for the year ended
December 31, 2018
, compared with the year ended
December 31, 2017
, primarily due to a
$40.1 million
increase
in restructuring, impairment and transaction-related charges and a $0.4 million non-cash expense related to a special employee retirement contribution in 2018.
Restructuring, Impairment and Transaction-Related Charges
Corporate restructuring, impairment and transaction-related charges for the year ended
December 31, 2018
, were
$43.6 million
, consisting of the following: (1)
$3.2 million
of employee termination charges related to workforce reductions through facility consolidations and separation programs; (2)
$8.1 million
of transaction-related charges, which primarily included professional service fees; and (3)
$32.3 million
of other restructuring charges, including a $32.1 million increase to its MEPPs withdrawal liability.
Corporate restructuring, impairment and transaction-related charges for the year ended December 31, 2017, were $3.5 million, consisting of the following: (1) $0.5 million of employee termination charges related to workforce reductions through facility consolidations and separation programs; (2) $2.1 million of transaction-related charges which primarily included professional service fees; and (3) $0.9 million of other restructuring charges.
52
Results of Operations for the Year Ended
December 31, 2017
, Compared to the Year Ended
December 31, 2016
Summary Results
The Company’s operating income, operating margin, net earnings attributable to Quad common shareholders (computed using a 40% normalized tax rate) and diluted earnings per share attributable to Quad common shareholders for the year ended
December 31, 2017
, changed from the year ended
December 31, 2016
, as follows (dollars in millions, except per share data):
|
Operating Income
|
Operating Margin
|
Net Earnings Attributable to Quad Common Shareholders
|
Diluted Earnings Per Share Attributable to Quad Common Shareholders
|
|||||||||||
|
For the year ended December 31, 2016
|
$
|
117.3
|
|
2.7
|
%
|
$
|
44.9
|
|
$
|
0.90
|
|
|||
|
2017 restructuring, impairment and transaction-related charges
(1)
|
(60.4
|
)
|
(1.5
|
)%
|
(36.2
|
)
|
(0.70
|
)
|
||||||
|
2016 restructuring, impairment and transaction-related charges
(2)
|
73.6
|
|
1.7
|
%
|
44.2
|
|
0.89
|
|
||||||
|
Interest expense
(3)
|
N/A
|
|
N/A
|
|
3.6
|
|
0.11
|
|
||||||
|
Net pension income
(4)
|
N/A
|
|
N/A
|
|
2.7
|
|
0.05
|
|
||||||
|
2017 loss on debt extinguishment
(5)
|
N/A
|
|
N/A
|
|
(1.6
|
)
|
(0.03
|
)
|
||||||
|
2016 gain on debt extinguishment
(6)
|
N/A
|
|
N/A
|
|
(8.5
|
)
|
(0.17
|
)
|
||||||
|
Income taxes
(7)
|
N/A
|
|
N/A
|
|
41.8
|
|
0.80
|
|
||||||
|
Investments in unconsolidated entity and noncontrolling interests, net of tax
(8)
|
N/A
|
|
N/A
|
|
1.4
|
|
0.03
|
|
||||||
|
Operating income
(9)
|
24.8
|
|
0.9
|
%
|
14.9
|
|
0.19
|
|
||||||
|
For the year ended December 31, 2017
|
$
|
155.3
|
|
3.8
|
%
|
$
|
107.2
|
|
$
|
2.07
|
|
|||
______________________________
|
(1)
|
Restructuring, impairment and transaction-related charges of
$60.4 million
(
$36.2 million
, net of tax) incurred during the year ended
December 31, 2017
, included the following:
|
|
a.
|
$26.9 million of employee termination charges related to workforce reductions through facility consolidations and separation programs;
|
|
b.
|
$12.0 million of impairment charges, including $6.7 million of impairment charges for machinery and equipment no longer being utilized in production as a result of facility consolidations, including Waseca, Minnesota; Columbus, Ohio; and Taunton, Massachusetts, as well as other capacity and strategic reduction restructuring activities; and $5.3 million of impairment charges for land and building related to the Waseca, Minnesota and Taunton, Massachusetts plant closures;
|
|
c.
|
$3.1 million of transaction-related charges, consisting of professional service fees for business acquisition and divestiture activities;
|
|
d.
|
$18.4 million
of various other restructuring charges, including costs to maintain and exit closed facilities, as well as lease exit charges, net of $7.1 million in gains from the sale of the Atglen, Pennsylvania; Dickson, Tennessee; East Greenville, Pennsylvania; Lenexa, Kansas; and Marengo, Iowa plants, and a $1.2 million gain from the Company’s Argentina Subsidiaries’ settlements with vendors through bankruptcy proceedings. Other restructuring charges also included a $6.7 million loss on the sale of a business.
|
The Company expects to incur additional restructuring and integration costs in future reporting periods in connection with eliminating excess manufacturing capacity and properly aligning its cost structure in conjunction with the Company’s acquisitions and strategic investments, and other cost reduction programs.
|
(2)
|
Restructuring, impairment and transaction-related charges of
$73.6 million
(
$44.2 million
, net of tax) incurred during the year ended December 31, 2016, included the following:
|
53
|
a.
|
$12.9 million of employee termination charges related to workforce reductions through facility consolidations and involuntary separation programs;
|
|
b.
|
$26.8 million of impairment charges, including $14.7 million of impairment charges for machinery and equipment no longer being utilized in production as a result of facility consolidations, including Atglen, Pennsylvania; Augusta, Georgia; East Greenville, Pennsylvania; Monroe, New Jersey; Woodstock, Illinois; and Queretaro, Mexico, as well as other capacity and strategic reduction restructuring activities; and $12.1 million of impairment charges for land and building related to the Atglen, Pennsylvania plant closure;
|
|
c.
|
$2.2 million of transaction-related charges, consisting of professional service fees for business acquisition and divestiture activities;
|
|
d.
|
$0.1 million of acquisition-related integration costs; and
|
|
e.
|
$31.6 million of various other restructuring charges, including costs to maintain and exit closed facilities, as well as lease exit charges. Other restructuring charges also included an $11.2 million increase to its MEPPs withdrawal liability.
|
|
(3)
|
Interest expense decreased $6.1 million ($3.7 million, net of tax) during the year ended December 31, 2017, to $71.1 million. This change was due to lower average debt levels in the year ended December 31, 2017, as compared to the year ended December 31, 2016.
|
|
(4)
|
Net pension income
increased
$4.5 million
(
$2.7 million
, net of tax impact due to the change in the normalized tax rate) during the year ended
December 31, 2017
, to
-$9.6 million
. This change was due to a
$0.8 million
decrease
from interest cost on pension plan liabilities and a
$6.2 million
decrease in settlement charges, offset by a
$2.5 million
decrease
from the expected return on pension plan assets.
|
|
(5)
|
A $2.6 million loss on debt extinguishment ($1.6 million, net of tax) was recognized during the year ended December 31, 2017, from the refinancing of the Senior Secured Credit Facility, completed on February 10, 2017.
|
|
(6)
|
A $14.1 million gain on debt extinguishment ($8.5 million, net of tax) was recognized during the year ended December 31, 2016, primarily from the repurchase of $56.5 million aggregate principal amount of Senior Unsecured Notes.
|
|
(7)
|
The $41.8 million decrease in income taxes as calculated in the following table is primarily due to a $28.8 million tax benefit related to the reduced federal rate applied to net domestic deferred tax liabilities in accordance with the Tax Act and a $21.0 million tax benefit from the release of valuation allowances primarily related to foreign credits, partially offset by a $7.1 million decreased tax benefit of domestic deductions. See
Note 13
, “
Income Taxes
,” to the consolidated financial statements in Part II, Item 8 of this Annual Report on Form 10-K for further information on income taxes.
|
|
Year Ended December 31,
|
|||||||||||
|
2017
|
2016
|
$ Change
|
|||||||||
|
Earnings before income taxes and equity in loss of unconsolidated entity
|
$
|
91.2
|
|
$
|
59.3
|
|
$
|
31.9
|
|
||
|
40% normalized tax rate
|
40.0
|
%
|
40.0
|
%
|
40.0
|
%
|
|||||
|
Income tax expense at 40% normalized tax rate
|
36.5
|
|
23.7
|
|
12.8
|
|
|||||
|
Less: Income tax (benefit) expense from the consolidated statements of operations
|
(16.0
|
)
|
13.0
|
|
(29.0
|
)
|
|||||
|
Impact of income taxes
|
$
|
52.5
|
|
$
|
10.7
|
|
$
|
41.8
|
|
||
|
(7)
|
The decrease in investments in unconsolidated entity and noncontrolling interests, net of tax, of $1.4 million during the year ended December 31, 2017, was related to a decrease in losses at the Company’s Brazilian joint venture investment in Plural.
|
54
|
(8)
|
Operating income, excluding restructuring, impairment and transaction-related charges, increased
$24.8 million
(
$14.9 million
, net of tax) primarily due to the following: (1) a $44.6 million decrease in depreciation and amortization expense; (2) a $19.4 million vacation reserve reduction from an employee vacation policy change; (3) $6.8 million in lower legal expenses; (4) a $5.0 million gain from a property insurance claim; and (5) savings from cost reduction initiatives, including employee-related costs. These impacts were partially offset by lower print volume and pricing due to ongoing industry pressures and a $10.4 million benefit in 2016 that did not repeat in 2017 related to the collection of a previously written-off vendor receivable.
|
Operating Results
The following table sets forth certain information from the Company’s consolidated statements of operations on an absolute dollar basis and as a relative percentage of total net sales for each noted period, together with the relative percentage change in such information between the periods set forth below:
|
Year Ended December 31,
|
||||||||||||||||||||
|
2017
|
2016
|
|||||||||||||||||||
|
(dollars in millions)
|
||||||||||||||||||||
|
Amount
|
% of Net
Sales
|
Amount
|
% of Net
Sales
|
$ Change
|
%
Change
|
|||||||||||||||
|
Net sales:
|
||||||||||||||||||||
|
Products
|
$
|
3,529.0
|
|
85.4
|
%
|
$
|
3,717.1
|
|
85.9
|
%
|
$
|
(188.1
|
)
|
(5.1
|
)%
|
|||||
|
Services
|
602.4
|
|
14.6
|
%
|
612.4
|
|
14.1
|
%
|
(10.0
|
)
|
(1.6
|
)%
|
||||||||
|
Total net sales
|
4,131.4
|
|
100.0
|
%
|
4,329.5
|
|
100.0
|
%
|
(198.1
|
)
|
(4.6
|
)%
|
||||||||
|
Cost of sales:
|
||||||||||||||||||||
|
Products
|
2,827.3
|
|
68.4
|
%
|
2,971.0
|
|
68.6
|
%
|
(143.7
|
)
|
(4.8
|
)%
|
||||||||
|
Services
|
432.1
|
|
10.5
|
%
|
423.8
|
|
9.8
|
%
|
8.3
|
|
2.0
|
%
|
||||||||
|
Total cost of sales
|
3,259.4
|
|
78.9
|
%
|
3,394.8
|
|
78.4
|
%
|
(135.4
|
)
|
(4.0
|
)%
|
||||||||
|
Selling, general & administrative expenses
|
423.8
|
|
10.3
|
%
|
466.7
|
|
10.8
|
%
|
(42.9
|
)
|
(9.2
|
)%
|
||||||||
|
Depreciation and amortization
|
232.5
|
|
5.6
|
%
|
277.1
|
|
6.4
|
%
|
(44.6
|
)
|
(16.1
|
)%
|
||||||||
|
Restructuring, impairment and transaction-related charges
|
60.4
|
|
1.4
|
%
|
73.6
|
|
1.7
|
%
|
(13.2
|
)
|
(17.9
|
)%
|
||||||||
|
Total operating expenses
|
3,976.1
|
|
96.2
|
%
|
4,212.2
|
|
97.3
|
%
|
(236.1
|
)
|
(5.6
|
)%
|
||||||||
|
Operating income
|
$
|
155.3
|
|
3.8
|
%
|
$
|
117.3
|
|
2.7
|
%
|
$
|
38.0
|
|
nm
|
|
|||||
Net Sales
Product sales
decreased
$188.1 million
, or
5.1%
, for the year ended
December 31, 2017
, compared to the year ended
December 31, 2016
, primarily due to a $141.6 million decrease in product sales in the Company’s print product lines due to ongoing industry volume and pricing pressures and a $47.1 million decrease from pass-through paper sales, partially offset by $0.6 million in positive foreign exchange impacts.
Service sales, which primarily consist of imaging, logistics, distribution and medical services,
decreased
$10.0 million
, or
1.6%
, for the year ended
December 31, 2017
, compared to the year ended
December 31, 2016
, primarily due to a $9.7 million decrease in logistics sales resulting from lower print shipment volume.
Cost of Sales
Cost of product sales
decreased
$143.7 million
, or
4.8%
, for the year ended
December 31, 2017
, compared with the year ended
December 31, 2016
, primarily due to the following: (1) lower print and paper volume; (2) an $8.5 million vacation reserve reduction from an employee vacation policy change; and (3) cost reduction initiatives. These reductions were partially offset by a $10.4 million benefit in 2016 that did not repeat in 2017 related to the collection of a previously written-off vendor receivable.
55
Cost of product sales as a percentage of net sales decreased to
68.4%
for the year ended
December 31, 2017
, from
68.6%
for the year ended
December 31, 2016
, primarily due to the reasons provided above.
Cost of service sales
increased
$8.3 million
, or
2.0%
, for the year ended
December 31, 2017
, compared with the year ended
December 31, 2016
, primarily due to increased shipment cost.
Cost of service sales as a percentage of net sales decreased to
10.5%
for the year ended
December 31, 2017
, from
9.8%
for the year ended
December 31, 2016
, primarily due to the reasons provided above.
Selling, General and Administrative Expenses
Selling, general and administrative expenses
decreased
$42.9 million
, or
9.2%
, for the year ended
December 31, 2017
, compared with the year ended
December 31, 2016
, primarily due to the following: (1) a $10.9 million vacation reserve reduction from an employee vacation policy change; (2) a $6.8 million decrease in legal expenses; (3) a $5.0 million gain from a property insurance claim; and (4) savings from cost reduction initiatives, including employee-related costs. Selling, general and administrative expenses as a percentage of net sales decreased from
10.8%
for the year ended
December 31, 2016
, to
10.3%
for the year ended
December 31, 2017
, primarily due to the reasons stated above.
Depreciation and Amortization
Depreciation and amortization
decreased
$44.6 million
, or
16.1%
, for the year ended
December 31, 2017
, compared with the year ended
December 31, 2016
, due to a
$32.4 million
decrease
in amortization expense, primarily related to customer relationship intangibles becoming fully amortized in the second quarter of 2016; and a
$12.2 million
decrease
in depreciation expense from property, plant and equipment becoming fully depreciated over the past year and a decrease in purchases of property, plant and equipment in 2017 compared to 2016.
Restructuring, Impairment and Transaction-Related Charges
Restructuring, impairment and transaction-related charges
decreased
$13.2 million
, or
17.9%
, for the year ended December 31, 2017, compared with the year ended December 31, 2016, primarily due to the following: (1) a
$14.8 million
decrease in impairment charges; (2) a
$0.1 million
decrease in acquisition-related integration costs; and (3) a
$13.2 million
decrease in other restructuring charges. These decreases were partially offset by a
$14.0 million
increase in employee termination charges and a
$0.9 million
increase in transaction-related charges.
Restructuring, impairment and transaction-related charges of
$60.4 million
incurred in the year ended December 31, 2017, included the following: (1) $26.9 million of employee termination charges related to workforce reductions through facility consolidations and voluntary and involuntary separation programs; (2) $12.0 million of impairment charges, including $6.7 million of impairment charges for machinery and equipment no longer being utilized in production as a result of facility consolidations, including Waseca, Minnesota; Columbus, Ohio; and Taunton, Massachusetts, as well as other capacity and strategic reduction restructuring activities; and $5.3 million of impairment charges for land and building related to the Waseca, Minnesota and Taunton, Massachusetts plant closures; (3) $3.1 million of transaction-related charges consisting of professional service fees related to business acquisition and divestiture activities; and (4)
$18.4 million
of various other restructuring charges, including costs to maintain and exit closed facilities, as well as lease exit charges, net of $7.1 million in gains from the sale of the Atglen, Pennsylvania; Dickson, Tennessee; East Greenville, Pennsylvania; Lenexa, Kansas; and Marengo, Iowa plants, and a $1.2 million gain from the Company’s Argentina Subsidiaries’ settlements with vendors through bankruptcy proceedings. Other restructuring charges also included a $6.7 million loss on the sale of a business.
56
Restructuring, impairment and transaction-related charges of
$73.6 million
incurred in the year ended December 31, 2016, included the following: (1) $12.9 million of employee termination charges related to workforce reductions through facility consolidations and involuntary separation programs; (2) $26.8 million of impairment charges, including $14.7 million of impairment charges for machinery and equipment no longer being utilized in production as a result of facility consolidations, including Atglen, Pennsylvania; Augusta, Georgia; East Greenville, Pennsylvania; Monroe, New Jersey; Woodstock, Illinois; and Queretaro, Mexico, as well as other capacity and strategic reduction restructuring activities; and $12.1 million of impairment charges for land and building related to the Atglen, Pennsylvania plant closure; (3) $2.2 million of transaction-related charges consisting of professional service fees related to business acquisition and divestiture activities; (4) $0.1 million of acquisition-related integration costs; and (5)
$31.6 million
of various other restructuring charges, including costs to maintain and exit closed facilities, lease exit charges, and an $11.2 million increase to its MEPPs withdrawal liability.
EBITDA and EBITDA Margin—Consolidated
EBITDA is defined as net earnings (loss) attributable to Quad common shareholders, excluding (1) interest expense, (2) income tax expense (benefit) and (3) depreciation and amortization. EBITDA margin represents EBITDA as a percentage of net sales. EBITDA and EBITDA margin are presented to provide additional information regarding Quad’s performance. Both are important measures by which Quad gauges the profitability and assesses the performance of its business. EBITDA and EBITDA margin are non-GAAP financial measures and should not be considered alternatives to net earnings (loss) as a measure of operating performance, or to cash flows provided by operating activities as a measure of liquidity. Quad’s calculation of EBITDA and EBITDA margin may be different from the calculations used by other companies, and therefore, comparability may be limited.
EBITDA and EBITDA margin for the year ended
December 31, 2017
, compared to the year ended
December 31, 2016
, were as follows:
|
Year Ended December 31,
|
|||||||||||||
|
2017
|
2016
|
||||||||||||
|
Amount
|
% of Net Sales
|
Amount
|
% of Net Sales
|
||||||||||
|
(dollars in millions)
|
|||||||||||||
|
EBITDA and EBITDA margin (non-GAAP)
|
$
|
394.8
|
|
9.6
|
%
|
$
|
412.2
|
|
9.5
|
%
|
|||
EBITDA
decreased
$17.4 million
for the year ended
December 31, 2017
, compared to the year ended
December 31, 2016
, primarily due to lower print volume and pricing due to ongoing industry pressures and a $10.4 million benefit in 2016 that did not repeat in 2017 related to the collection of a previously written-off vendor receivable. These impacts were partially offset by the following: (1)
$13.2 million
of
decreased
restructuring, impairment and transaction-related charges; (2) a $19.4 million vacation reserve reduction from an employee vacation policy change; (3) $6.8 million in lower legal expenses; (4) a $5.0 million gain from a property insurance claim; and (5) savings from cost reduction initiatives, including employee-related costs.
57
A reconciliation of EBITDA to net earnings attributable to Quad common shareholders for the years ended
December 31, 2017
and
2016
, was as follows:
|
Year Ended December 31,
|
|||||||
|
2017
|
2016
|
||||||
|
(dollars in millions)
|
|||||||
|
Net earnings attributable to Quad common shareholders
(1)
|
$
|
107.2
|
|
$
|
44.9
|
|
|
|
Interest expense
|
71.1
|
|
77.2
|
|
|||
|
Income tax (benefit) expense
|
(16.0
|
)
|
13.0
|
|
|||
|
Depreciation and amortization
|
232.5
|
|
277.1
|
|
|||
|
EBITDA (non-GAAP)
|
$
|
394.8
|
|
$
|
412.2
|
|
|
______________________________
|
(1)
|
Net earnings attributable to Quad common shareholders included the following:
|
|
a.
|
Restructuring, impairment and transaction-related charges of
$60.4 million
and
$73.6 million
for the years ended
December 31, 2017
and
2016
, respectively;
|
|
b.
|
Net pension income of
$9.6 million
and
$5.1 million
for the years ended
December 31, 2017
and
2016
, respectively;
|
|
c.
|
Loss on debt extinguishment of $2.6 million for the year ended December 31, 2017;
|
|
d.
|
Gain on debt extinguishment of $14.1 million for the year ended December 31, 2016; and
|
|
e.
|
Equity in loss of unconsolidated entity of
$1.4 million
for the year ended
December 31, 2016
.
|
United States Print and Related Services
The following table summarizes net sales, operating income, operating margin and certain items impacting comparability within the United States Print and Related Services segment:
|
Year Ended December 31,
|
||||||||||||||
|
2017
|
2016
|
|||||||||||||
|
(dollars in millions)
|
||||||||||||||
|
Amount
|
Amount
|
$ Change
|
% Change
|
|||||||||||
|
Net sales:
|
||||||||||||||
|
Products
|
$
|
3,156.9
|
|
$
|
3,335.1
|
|
$
|
(178.2
|
)
|
(5.3
|
)%
|
|||
|
Services
|
583.2
|
|
591.9
|
|
(8.7
|
)
|
(1.5
|
)%
|
||||||
|
Operating income (including restructuring, impairment and transaction-related charges)
|
194.3
|
|
186.1
|
|
8.2
|
|
nm
|
|
||||||
|
Operating margin
|
5.2
|
%
|
4.7
|
%
|
N/A
|
|
N/A
|
|
||||||
|
Restructuring, impairment and transaction-related charges
|
$
|
53.6
|
|
$
|
59.3
|
|
$
|
(5.7
|
)
|
(9.6
|
)%
|
|||
Net Sales
Product sales for the United States Print and Related Services segment
decreased
$178.2 million
, or
5.3%
, for the year ended
December 31, 2017
, compared to the year ended
December 31, 2016
primarily due to a $137.6 million decrease in product sales in the Company’s print product lines (predominantly due to ongoing volume and pricing pressures from excess capacity in the printing industry) and a $40.6 million decrease in pass-through paper sales.
Service sales for the United States Print and Related Services segment
decreased
$8.7 million
, or
1.5%
, for the year ended
December 31, 2017
, compared to the year ended
December 31, 2016
primarily due to an $8.4 million decrease in logistic sales resulting from lower print shipment volume.
58
Operating Income
Operating income for the United States Print and Related Services segment
increased
$8.2 million
for the year ended
December 31, 2017
, compared to the year ended
December 31, 2016
, primarily due to the following: (1) a $41.6 million decrease in depreciation and amortization; (2) a $19.4 million vacation reserve reduction due to an employee vacation policy change; (3) a
$5.7 million
in restructuring, impairment and transaction-related charges; (4) a $5.0 million gain from a property insurance claim; and (5) savings from cost reduction initiatives, including employee-related costs. These impacts were partially offset by lower print volume and pricing and a $10.4 million benefit in 2016 that did not repeat in 2017 related to the collection of a previously written-off vendor receivable.
The operating margin for the United States Print and Related Services segment increased to
5.2%
for the year ended
December 31, 2017
, from
4.7%
for the year ended
December 31, 2016
, primarily due to the reasons provided above.
Restructuring, Impairment and Transaction-Related Charges
Restructuring, impairment and transaction-related charges for the United States Print and Related Services segment for the year ended December 31, 2017, were
$53.6 million
, consisting of the following: (1) $21.7 million of employee termination charges related to workforce reductions through facility consolidations and separation programs; (2) $11.5 million of impairment charges, including $6.2 million of impairment charges for machinery and equipment no longer being utilized in production as a result of facility consolidations, including Waseca, Minnesota; Columbus, Ohio; and Taunton, Massachusetts, as well as other capacity and strategic reduction restructuring activities; and $5.3 million of impairment charges for land and building related to the Waseca, Minnesota and Taunton, Massachusetts plant closures; and (3) $19.4 million of various other restructuring charges, including costs to maintain and exit closed facilities, as well as lease exit charges, net of $7.1 million in gains from the sale of the Atglen, Pennsylvania; Dickson, Tennessee; East Greenville, Pennsylvania; Lenexa, Kansas; and Marengo, Iowa plants. Other restructuring charges also included a $6.7 million loss on the sale of a business.
Restructuring, impairment and transaction-related charges for the United States Print and Related Services segment for the year ended December 31, 2016, were $59.3 million, consisting of: (1) $10.5 million of employee termination charges related to workforce reductions through facility consolidations and involuntary separation programs; (2) $25.9 million of impairment charges, including $13.8 million for machinery and equipment no longer being utilized in production as a result of facility consolidations, including Atglen, Pennsylvania; Augusta, Georgia; East Greenville, Pennsylvania; Monroe, New Jersey; and Woodstock, Illinois, as well as other capacity and strategic reduction restructuring activities; and $12.1 million of land and building impairment related to the Atglen, Pennsylvania plant closure; (3) $0.1 million of acquisition-related integration costs; and (4) $22.8 million various other restructuring charges, including costs to maintain and exit closed facilities, as well as lease exit charges.
59
International
The following table summarizes net sales, operating income (loss), operating margin, certain items impacting comparability and equity in loss of unconsolidated entities within the International segment:
|
Year Ended December 31,
|
||||||||||||||
|
2017
|
2016
|
|||||||||||||
|
(dollars in millions)
|
||||||||||||||
|
Amount
|
Amount
|
$ Change
|
% Change
|
|||||||||||
|
Net sales:
|
||||||||||||||
|
Products
|
$
|
372.1
|
|
$
|
382.0
|
|
$
|
(9.9
|
)
|
(2.6
|
)%
|
|||
|
Services
|
19.2
|
|
20.5
|
|
(1.3
|
)
|
(6.3
|
)%
|
||||||
|
Operating income (including restructuring, impairment and transaction-related charges)
|
19.6
|
|
13.5
|
|
6.1
|
|
45.2
|
%
|
||||||
|
Operating margin
|
5.0
|
%
|
3.4
|
%
|
N/A
|
|
N/A
|
|
||||||
|
Restructuring, impairment and transaction-related charges (income)
|
$
|
3.3
|
|
$
|
(1.1
|
)
|
$
|
4.4
|
|
nm
|
|
|||
|
Equity in loss of unconsolidated entity
|
—
|
|
1.4
|
|
(1.4
|
)
|
(100.0
|
)%
|
||||||
Net Sales
Product sales for the International segment
decreased
$9.9 million
, or
2.6%
, for the year ended
December 31, 2017
, compared to the year ended
December 31, 2016
, primarily due to a $6.5 million decrease in pass-through paper sales and a $4.0 million decrease in volume and pricing, primarily in Peru, partially offset by $0.6 million in favorable foreign exchange impacts, primarily in Europe.
Service sales for the International segment decreased
$1.3 million
, or
6.3%
, for the year ended
December 31, 2017
, compared to the year ended
December 31, 2016
, primarily due to a decrease in logistics revenue in Europe.
Operating Income
Operating income for the International segment increased
$6.1 million
, or
45.2%
, for the year ended
December 31, 2017
, compared to the year ended
December 31, 2016
, primarily due to a $7.4 million increase in operating income, primarily in Europe and Mexico, and a $3.1 million decrease in depreciation and amortization expense, partially offset by a $4.4 million increase in restructuring and impairment expenses.
Restructuring, Impairment and Transaction-Related Charges (Income)
Restructuring, impairment and transaction-related charges for the International segment for the year ended December 31, 2017, were
$3.3 million
, consisting of the following: (1) $4.7 million of employee termination charges related to workforce reductions through facility consolidations and separation programs; (2) $0.5 million of impairment charges for machinery and equipment no longer being utilized in production as a result of facility consolidations; and (3) $1.9 million of various other restructuring income primarily related to the Company’s Argentina Subsidiaries’ gain from settlements with vendors through bankruptcy proceedings, partially offset by charges to maintain and exit closed facilities.
Restructuring, impairment and transaction-related income for the International segment for the year ended December 31, 2016, was $1.1 million, consisting of the following: (1) $1.4 million of employee termination charges related to workforce reductions through facility consolidations and involuntary separation programs; (2) $0.9 million of impairment charges for machinery and equipment no longer being utilized in production as a result of facility consolidations, including Queretaro, Mexico; (3) $0.1 million of transaction-related charges; (4) $3.5 million of other restructuring income primarily related to the Company’s Argentina Subsidiaries’ gain from settlements with vendors through bankruptcy proceedings and a gain on the sale of the Pilar, Argentina plant.
60
Equity in Loss of Unconsolidated Entity
Investments in entities where Quad/Graphics has the ability to exert significant influence, but not control, are accounted for using the equity method of accounting. The Company holds a 49% ownership interest in Plural, a commercial printer based in São Paulo, Brazil. The equity in loss of unconsolidated entities in the International segment decreased $1.4 million for the year ended December 31, 2017, compared to the year ended December 31, 2016, due to a decrease in losses from the Company’s investment in Plural.
Unrestricted Subsidiaries
Unrestricted subsidiaries as defined in the Senior Unsecured Notes indenture represented less than 2.0% of total consolidated net sales for the year ended
December 31, 2017
.
Corporate
The following table summarizes unallocated operating expenses presented as Corporate:
|
Year Ended December 31,
|
||||||||||||||
|
2017
|
2016
|
|||||||||||||
|
(dollars in millions)
|
||||||||||||||
|
Amount
|
Amount
|
$ Change
|
% Change
|
|||||||||||
|
Operating expenses (including restructuring, impairment and transaction-related charges)
|
$
|
58.6
|
|
$
|
82.3
|
|
$
|
(23.7
|
)
|
(28.8
|
)%
|
|||
|
Restructuring, impairment and transaction-related charges
|
3.5
|
|
15.4
|
|
(11.9
|
)
|
(77.3
|
)%
|
||||||
Operating Expenses
Corporate operating expenses
decreased
$23.7 million
, or
28.8%
, for the year ended
December 31, 2017
, compared with the year ended
December 31, 2016
, primarily due to an
$11.9 million
decrease
in restructuring, impairment and transaction-related charges, an $8.0 million decrease in legal expenses and a $4.6 million decrease in incentive compensation expense.
Restructuring, Impairment and Transaction-Related Charges
Corporate restructuring, impairment and transaction-related charges for the year ended December 31, 2017, were
$3.5 million
, consisting of the following: (1) $0.5 million of employee termination charges related to workforce reductions through facility consolidations and involuntary separation programs; (2) $2.1 million of transaction-related charges which primarily included professional service fees; and (3)
$0.9 million
of other restructuring charges.
Corporate restructuring, impairment and transaction-related charges for the year ended December 31, 2016, were
$15.4 million
, consisting of the following: (1) $1.0 million of employee termination charges related to workforce reductions through facility consolidations and involuntary separation programs; (2) $2.1 million of transaction-related charges which primarily included professional service fees; and (3)
$12.3 million
of other restructuring charges, including an $11.2 million increase to its MEPPs withdrawal liability.
61
Liquidity and Capital Resources
The Company utilizes cash flows from operating activities and borrowings under its credit facilities to satisfy its liquidity and capital requirements. At
December 31, 2018
, the Company had cash and cash equivalents of
$69.5 million
. In addition to cash and cash equivalents, the Company had
$690.9 million
of unused capacity under its revolving credit arrangement at
December 31, 2018
, which was net of
$34.1 million
of issued letters of credit. The Company believes its expected future cash flows from operating activities,
$690.9 million
of unused capacity under the revolving credit arrangement and available cash on hand provide sufficient resources to fund ongoing operating requirements and the integration and restructuring requirements related to acquired operations, as well as future capital expenditures, debt and pension service requirements, investments in future growth to create value for its shareholders, shareholder dividends and share repurchases. There were
no
borrowings under the
$725.0 million
revolving credit facility as of
December 31, 2018
, and peak borrowings were
$246.6 million
during the year ended
December 31, 2018
.
Net Cash Provided by Operating Activities
Year Ended
December 31, 2018
, Compared to Year Ended
December 31, 2017
Net cash provided by operating activities was
$260.6 million
for the year ended
December 31, 2018
, compared to
$344.0 million
for the year ended
December 31, 2017
, resulting in an
$83.4 million
decrease
in cash provided by operating activities. The
decrease
was primarily due to a
$93.4 million
decrease
in cash from earnings, partially offset by a
$10.0 million
increase
in cash flows from changes in operating assets and liabilities.
Year Ended
December 31, 2017
, Compared to Year Ended
December 31, 2016
Net cash provided by operating activities was
$344.0 million
for the year ended
December 31, 2017
, compared to
$353.6 million
for the year ended
December 31, 2016
, resulting in a
$9.6 million
decrease
in cash provided by operating activities. The decrease was primarily due to a
$31.0 million
decrease in cash flows from changes in operating assets and liabilities, partially offset by a
$21.4 million
increase in cash from earnings.
Net Cash Used in Investing Activities
Year Ended
December 31, 2018
, Compared to Year Ended
December 31, 2017
Net cash used in investing activities was
$120.5 million
for the year ended
December 31, 2018
, compared to
$47.2 million
for the year ended
December 31, 2017
, resulting in a
$73.3 million
increase
in cash used in investing activities. The
increase
was primarily due to the following: (1) a $71.4 million increase from the acquisition of businesses; (2) a $14.1 million decrease in proceeds from the sale of a business; and (3) a
$10.4 million
increase
in purchases of property, plant and equipment. These increases were partially offset by the following: (1) an $8.8 million increase in proceeds from the sale of property, plant and equipment; (2) a $7.3 million loan to an unconsolidated entity in 2017 that did not repeat in 2018; and (3) a $6.5 million increase in proceeds from property insurance claims.
Year Ended
December 31, 2017
, Compared to Year Ended
December 31, 2016
Net cash used in investing activities was
$47.2 million
for the year ended
December 31, 2017
, compared to
$88.8 million
for the year ended
December 31, 2016
, resulting in a
$41.6 million
decrease
in cash used in investing activities. The decrease was primarily due to the following: (1) a $20.2 million decrease in purchases of property, plant and equipment; (2) a $14.1 million increase in proceeds from the sale of a business; (3) a $9.9 million decrease in cost method investments; and (4) an $8.0 million increase in proceeds from property insurance claims. These decreases were partially offset by a $7.3 million increase in a loan to an unconsolidated entity.
62
Net Cash Used in Financing Activities
Year Ended
December 31, 2018
, Compared to Year Ended
December 31, 2017
Net cash used in financing activities was
$133.5 million
for the year ended
December 31, 2018
, compared to
$251.7 million
for the year ended
December 31, 2017
, resulting in a
$118.2 million
decrease
in cash used in financing activities. The
decrease
was primarily due to the following: (1) a
$143.9 million
decrease in net repayments of debt and lease obligations in
2018
as compared to
2017
; and (2) a
$4.7 million
decrease in payments of debt issuance costs and financing fees. These decreases were partially offset by the following: (1) a
$32.9 million
increase in purchases of treasury stock; and (2) a
$3.0 million
increase in equity awards redeemed to pay employees’ tax obligations.
Year Ended
December 31, 2017
, Compared to Year Ended
December 31, 2016
Net cash used in financing activities was
$251.7 million
for the year ended
December 31, 2017
, compared to
$269.3 million
for the year ended
December 31, 2016
, resulting in a
$17.6 million
decrease
in cash used in financing activities. The
decrease
was primarily due to a
$54.9 million
decrease in net repayments of debt and lease obligations in 2017 as compared to 2016, and a $5.0 million decrease in treasury stock purchases. These decreases were partially offset by the following: (1) $27.7 million of decreased proceeds from stock options exercised; (2) $4.6 million of increased payments of debt issuance costs and financing fees; and (3) $4.6 million of increased equity awards redeemed to pay employees’ tax obligations.
Free Cash Flow
Free Cash Flow is defined as net cash provided by operating activities less purchases of property, plant and equipment.
The Company’s management assesses Free Cash Flow as a measure to quantify cash available for (1) strengthening the balance sheet (debt reduction), (2) strategic capital allocation and deployment through investments in the business (acquisitions and strategic investments) and (3) returning capital to the shareholders (dividends and share repurchases). The priorities for capital allocation and deployment will change as circumstances dictate for the business, and Free Cash Flow can be significantly impacted by the Company’s restructuring activities and other unusual items.
Free Cash Flow is a non-GAAP financial measure and should not be considered an alternative to cash flows provided by operating activities as a measure of liquidity. Quad’s calculation of Free Cash Flow may be different from similar calculations used by other companies, and therefore, comparability may be limited.
Free Cash Flow for the years ended
December 31, 2018
,
2017
and
2016
, was as follows:
|
Year Ended December 31,
|
|||||||||||
|
2018
|
2017
|
2016
|
|||||||||
|
(dollars in millions)
|
|||||||||||
|
Net cash provided by operating activities
|
$
|
260.6
|
|
$
|
344.0
|
|
$
|
353.6
|
|
||
|
Less: purchases of property, plant and equipment
|
(96.3
|
)
|
(85.9
|
)
|
(106.1
|
)
|
|||||
|
Free Cash Flow (non-GAAP)
|
$
|
164.3
|
|
$
|
258.1
|
|
$
|
247.5
|
|
||
Free Cash Flow
decreased
$93.8 million
for the year ended
December 31, 2018
, compared to the year ended
December 31, 2017
, primarily due to an
$83.4 million
decrease
in net cash provided by operating activities primarily due to a decrease in cash from earnings and a
$10.4 million
increase
in capital expenditures.
Free Cash Flow increased $10.6 million for the year ended December 31, 2017, compared to the year ended December 31, 2016, due to a $20.2 million decrease in capital expenditures, offset by a $9.6 million decrease in net cash provided by operating activities primarily attributable to a decrease in cash flows from changes in operating assets and liabilities.
63
See the “Net Cash Provided by Operating Activities” section above for further explanations of the change in operating cash flows and the “Net Cash Used in Investing Activities” section above for further explanations of the changes in purchases of property, plant and equipment.
Debt Leverage Ratio
The Debt Leverage Ratio is defined as total debt and capital lease obligations divided by the trailing twelve months Adjusted EBITDA, comprised of the sum of the following: (1) the last twelve months of EBITDA (see the definition of EBITDA and the reconciliation of net earnings (loss) attributable to Quad common shareholders to EBITDA in the “Results of Operations” section above); (2) restructuring, impairment and transaction-related charges; (3) net pension income; (4) employee stock ownership plan contributions; (5) loss (gain) on debt extinguishment; (6) equity in (earnings) loss of unconsolidated entity; and (7) net earnings (loss) attributable to noncontrolling interests.
The Company uses the Debt Leverage Ratio as a metric to assess liquidity and the flexibility of its balance sheet. Consistent with other liquidity metrics, the Company monitors the Debt Leverage Ratio as a measure to determine the appropriate level of debt the Company believes is optimal to operate its business, and accordingly, to quantify debt capacity available for strategic capital allocation and deployment through investments in the business (capital expenditures, acquisitions and strategic investments), for strengthening the balance sheet (pension liability reduction), and for returning capital to the shareholders (dividends and share repurchases). The priorities for capital allocation and deployment will change as circumstances dictate for the business, and the Debt Leverage Ratio can be significantly impacted by the amount and timing of large expenditures requiring debt financing, as well as changes in profitability.
The Debt Leverage Ratio is a non-GAAP measure, and should not be considered an alternative to cash flows provided by operating activities as a measure of liquidity. Quad’s calculation of the Debt Leverage Ratio may be different from similar calculations used by other companies and, therefore, comparability may be limited.
The Debt Leverage Ratio calculated below differs from both the total leverage ratio and senior secured leverage ratio included in the Company’s debt covenant calculations (see
Note 11
, “
Debt
,” to the consolidated financial statements in Part II, Item 8, “Financial Statements and Supplementary Data,” of this Annual Report on Form 10-K for further information on debt covenants). The total leverage ratio included in the Company’s debt covenants includes letters of credit and surety bonds as debt, excludes non-cash stock-based compensation expense from EBITDA and includes the equity in (earnings) loss of unconsolidated entity and net income (loss) attributable to noncontrolling interests in EBITDA. Similarly, the senior secured leverage ratio included in the Company’s debt covenants includes and excludes the same adjustments as the total leverage ratio, in addition to the exclusion of the outstanding balance of the
Senior Unsecured Notes
and surety bonds.
64
The Debt Leverage Ratio as of
December 31, 2018
and
2017
, was as follows:
|
December 31, 2018
|
|
December 31, 2017
|
|||||
|
(dollars in millions)
|
|||||||
|
Total debt and capital lease obligations on the consolidated balance sheets
|
$
|
940.9
|
|
$
|
964.8
|
|
|
|
Divided by:
|
|||||||
|
Adjusted EBITDA for Quad for the year ended (non-GAAP)
|
414.6
|
|
448.2
|
|
|||
|
January 1, 2018 to February 20, 2018 pro forma Adjusted EBITDA for Ivie (non-GAAP)
(1)
|
2.9
|
|
—
|
|
|||
|
Adjusted EBITDA for the year ended (non-GAAP)
|
417.5
|
|
448.2
|
|
|||
|
Debt Leverage Ratio (non-GAAP)
|
2.25
|
x
|
2.15
|
x
|
|||
|
Debt Leverage Ratio—net of excess cash (non-GAAP)
(2)
|
2.11
|
x
|
2.03
|
x
|
|||
______________________________
|
(1)
|
As permitted by the Company’s senior secured credit facility, certain pro forma financial information related to the acquisition of Ivie was included in calculating the Debt Leverage Ratio as of December 31, 2018. As the acquisition of Ivie was completed on February 21, 2018, the
$2.9 million
pro forma Adjusted EBITDA represents the period from January 1, 2018, to February 20, 2018. Adjusted EBITDA for Ivie was calculated in a consistent manner with the calculation above for Quad. Ivie’s financial information has been consolidated within Quad’s financial results since the date of acquisition. If the two months of pro forma Adjusted EBITDA for Ivie was not included in the calculation, the Company’s Debt Leverage Ratio would have been 2.27x as of December 31, 2018.
|
|
(2)
|
The Company had
$70 million
and
$64 million
in cash and cash equivalents at
December 31, 2018
and
2017
, respectively. Based on the Company’s typical year-end cash balance of approximately $10 million, Quad had
$60 million
and
$54 million
of excess cash at
December 31, 2018
and
2017
, respectively. If the excess cash in each year was used to further pay down debt, the Debt Leverage Ratio would have been
2.11x
and
2.03x
as of
December 31, 2018
and
2017
, respectively.
|
The calculation of Adjusted EBITDA for the years ended
December 31, 2018
and
2017
, was as follows:
|
Year Ended December 31,
|
|||||||
|
2018
|
2017
|
||||||
|
(dollars in millions)
|
|||||||
|
Net earnings attributable to Quad common shareholders
|
$
|
8.5
|
|
$
|
107.2
|
|
|
|
Interest expense
|
73.3
|
|
71.1
|
|
|||
|
Income tax benefit
|
(9.8
|
)
|
(16.0
|
)
|
|||
|
Depreciation and amortization
|
230.7
|
|
232.5
|
|
|||
|
EBITDA (non-GAAP)
|
$
|
302.7
|
|
$
|
394.8
|
|
|
|
Restructuring, impairment and transaction-related charges
|
103.6
|
|
60.4
|
|
|||
|
Net pension income
(1)
|
(12.4
|
)
|
(9.6
|
)
|
|||
|
Employee stock ownership plan contribution
|
22.3
|
|
—
|
|
|||
|
Loss on debt extinguishment
|
—
|
|
2.6
|
|
|||
|
Equity in earnings of unconsolidated entity
|
(1.0
|
)
|
—
|
|
|||
|
Net loss attributable to noncontrolling interests
|
(0.6
|
)
|
—
|
|
|||
|
Adjusted EBITDA (non-GAAP)
|
$
|
414.6
|
|
$
|
448.2
|
|
|
______________________________
|
(1)
|
As a result of the adoption of
ASU 2017-07
, pension components other than service cost are required to be excluded from operating income. The Company has also excluded pension income from the calculation of Adjusted EBITDA, which is reflected in all periods presented.
|
65
The Debt Leverage Ratio
increased
0.10x
at
December 31, 2018
, compared to
December 31, 2017
, primarily due to a
$33.6 million
decrease in Adjusted EBITDA. The Debt Leverage Ratio at
December 31, 2018
, of
2.25x
is within management’s desired target Debt Leverage Ratio range of
2.0x
to
2.5x
; however, the Company operates at times above the Debt Leverage Ratio target range depending on the timing of compelling strategic investment opportunities and seasonal working capital needs.
Description of Significant Outstanding Debt Obligations as of
December 31, 2018
As of
December 31, 2018
, the Company utilized a combination of debt instruments to fund cash requirements, including the following:
|
•
|
Senior Secured Credit Facility:
|
|
◦
|
$725.0 million
revolving credit facility (
no
outstanding balance as of
December 31, 2018
);
|
|
◦
|
$375.0 million
Term Loan A (
$281.3 million
outstanding as of
December 31, 2018
); and
|
|
◦
|
$300.0 million
Term Loan B (
$279.5 million
outstanding as of
December 31, 2018
);
|
|
•
|
Senior Unsecured Notes (
$243.5 million
outstanding as of
December 31, 2018
); and
|
|
•
|
Master Note and Security Agreement (
$96.2 million
outstanding as of
December 31, 2018
).
|
Senior Secured Credit Facility
The Senior Secured Credit Facility consists of three different loan facilities. The first facility is a revolving credit facility in the amount of
$725.0 million
with a term of just under
four years
maturing on
January 4, 2021
. The second facility is a Term Loan A in the aggregate amount of
$375.0 million
with a term of just under
four years
maturing on
January 4, 2021
, subject to certain required amortization. The third facility is a Term Loan B in the amount of
$300.0 million
with a term of
seven years
maturing on
April 27, 2021
, subject to certain required amortization.
The Company completed the second amendment to the Company’s
Senior Secured Credit Facility
on
February 10, 2017
. This second amendment was completed to reduce the size of the revolving credit facility and Term Loan A and to extend the Company’s debt maturity profile while maintaining the Company’s current cost of borrowing and covenant structure. The revolving credit facility was lowered to a maximum borrowing amount of
$725.0 million
from
$850.0 million
, and the Term Loan A was lowered to an aggregate amount of
$375.0 million
from
$450.0 million
. This amendment to the
Senior Secured Credit Facility
did not have an impact on the Company’s quarterly financial covenant requirements.
Borrowings under the revolving credit facility and Term Loan A made under the Senior Secured Credit Facility at
December 31, 2018
, bear interest at
2.00%
in excess of reserve adjusted
LIBOR
, or
1.00%
in excess of an alternate base rate. The weighted average interest rate for the revolving credit facility was
3.91%
and the weighted average interest rate for the Term Loan A loans was
3.78%
at
December 31, 2018
, and interest is payable monthly. Borrowings under the Term Loan B at
December 31, 2018
, bear interest at
3.25%
in excess of reserve adjusted LIBOR, with a LIBOR floor of
1.00%
, or
2.25%
in excess of an alternative base rate at the Company’s option. The weighted average interest rate for the Term Loan B was
5.24%
at
December 31, 2018
, and interest is payable monthly.
The Senior Secured Credit Facility is secured by substantially all of the unencumbered assets of the Company. The Senior Secured Credit Facility also requires the Company to provide additional collateral to the lenders in certain limited circumstances.
On
January 31, 2019
, the company completed the third amendment to the Senior Secured Credit Facility. See
Note 24
, “
Subsequent Events
,” to the consolidated financial statements in Part II, Item 8, “Financial Statements and Supplementary Data,” of this Annual Report on Form 10-K for further detail.
66
Senior Unsecured Notes
The Company received
$294.8 million
in net proceeds from the sale of the
$300.0 million
Senior Unsecured Notes, after deducting the initial purchasers’ discounts and commissions. The Senior Unsecured Notes bear interest at
7.00%
, and interest is payable semi-annually. The Senior Unsecured Notes are due
May 1, 2022
.
The Company repurchased
$56.5 million
of its
Senior Unsecured Notes
in the open market, resulting in a net gain on debt extinguishment of
$14.3 million
, during the year ended December 31, 2016. All repurchased
Senior Unsecured Notes
were canceled. The Company used cash flows from operating activities and borrowings under its revolving credit facility to fund the repurchases. These repurchases were primarily completed to efficiently reduce debt balances and interest expense based on current
LIBOR
rates.
Each of the Company’s existing and future domestic subsidiaries that is a borrower or guarantees indebtedness under the Company’s Senior Secured Credit Facility or that guarantees certain of the Company’s other indebtedness or indebtedness of the Company’s restricted subsidiaries (other than intercompany indebtedness) fully and unconditionally guarantee or, in the case of future subsidiaries, will guarantee, on a joint and several basis, the Senior Unsecured Notes (the “
Guarantor Subsidiaries
”). All of the current Guarantor Subsidiaries are 100% owned by the Company. Guarantor Subsidiaries will be automatically released from these guarantees upon the occurrence of certain events, including the following: (1) the designation of any of the Guarantor Subsidiaries as an unrestricted subsidiary; (2) the release or discharge of any guarantee or indebtedness that resulted in the creation of the guarantee of the Senior Unsecured Notes by any of the Guarantor Subsidiaries; or (3) the sale or disposition, including the sale of substantially all the assets, of any of the Guarantor Subsidiaries.
Master Note and Security Agreement (sometimes referred to as senior notes)
On September 1, 1995, and as last amended on
November 24, 2014
, the Company entered into the Master Note and Security Agreement pursuant to which the Company issued over time senior notes in an aggregate principal amount of $1.1 billion in various tranches, of which
$96.2 million
was outstanding as of
December 31, 2018
. The weighted average interest rate for the senior notes was
7.36%
at
December 31, 2018
, which is fixed to maturity, and interest is payable semiannually. Principal payments commenced September 1997 and extend through
April 2031
in various tranches. The notes are collateralized by certain United States land, buildings and press and finishing equipment under the terms of the Master Note and Security Agreement.
The Company redeemed
$60.1 million
of its senior notes under the
Master Note and Security Agreement
, resulting in a net loss on debt extinguishment of
$0.2 million
, during the year ended December 31, 2016. All tendered senior notes under the
Master Note and Security Agreement
were canceled. The Company used cash flows from operating activities and borrowings under its revolving credit facility to fund the tender. The tender was primarily completed to reallocate debt to the lower interest rate revolving credit facility and thereby reduce interest expense based on current
LIBOR
rates.
Covenants and Compliance
The Company’s various lending arrangements include certain financial covenants (all financial terms, numbers and ratios are as defined in the Company’s debt agreements). Among these covenants, the Company was required to maintain the following as of
December 31, 2018
:
|
•
|
Total Leverage Ratio.
On a rolling twelve-month basis, the total leverage ratio, defined as total consolidated debt to consolidated EBITDA, shall not exceed
3.75
to 1.00 (for the twelve months ended
December 31, 2018
, the Company’s total leverage ratio was
2.19
to 1.00).
|
|
•
|
Senior Secured Leverage Ratio.
On a rolling twelve-month basis, the senior secured leverage ratio, defined as senior secured debt to consolidated EBITDA, shall not exceed
3.50
to 1.00 (for the twelve months ended
December 31, 2018
, the Company’s senior secured leverage ratio was
1.63
to 1.00).
|
67
|
•
|
Minimum Interest Coverage Ratio.
On a rolling twelve-month basis, the minimum interest coverage ratio, defined as consolidated EBITDA to consolidated cash interest expense, shall not be less than
3.50
to 1.00 (for the twelve months ended
December 31, 2018
, the Company’s minimum interest coverage ratio was
6.23
to 1.00).
|
The indenture underlying the Senior Unsecured Notes contains various covenants, including, but not limited to, covenants that, subject to certain exceptions, limit the Company’s and its restricted subsidiaries’ ability to incur and/or guarantee additional debt; pay dividends, repurchase stock or make certain other restricted payments; enter into agreements limiting dividends and certain other restricted payments; prepay, redeem or repurchase subordinated debt; grant liens on assets; enter into sale and leaseback transactions; merge, consolidate, transfer or dispose of substantially all of the Company’s consolidated assets; sell, transfer or otherwise dispose of property and assets; and engage in transactions with affiliates.
The Company was in compliance with all financial covenants in its debt agreements as of
December 31, 2018
. While the Company currently expects to be in compliance in future periods with all of the financial covenants, there can be no assurance that these covenants will continue to be met. The Company’s failure to maintain compliance with the covenants could prevent the Company from borrowing additional amounts and could result in a default under any of the debt agreements. Such default could cause the outstanding indebtedness to become immediately due and payable, by virtue of cross-acceleration or cross-default provisions.
In addition to those covenants, the Senior Secured Credit Facility also includes certain limitations on acquisitions, indebtedness, liens, dividends and repurchases of capital stock, including the following:
|
•
|
If the Company’s total leverage ratio is greater than
3.00
to 1.00 (as defined in the Senior Secured Credit Facility), the Company is prohibited from making greater than
$120.0 million
of annual dividend payments, capital stock repurchases and certain other payments. If the total leverage ratio is less than
3.00
to 1.00, there are no such restrictions.
|
|
•
|
If the Company’s senior secured leverage ratio is greater than
3.00
to 1.00 or the Company’s total leverage ratio is greater than
3.50
to 1.00 (these ratios as defined in the Senior Secured Credit Facility), the Company is prohibited from voluntarily prepaying any of the Senior Unsecured Notes and from voluntarily prepaying any other unsecured or subordinated indebtedness, with certain exceptions (including any mandatory prepayments on the Senior Unsecured Notes or any other unsecured or subordinated debt). If the senior secured leverage ratio is less than
3.00
to 1.00 and the total leverage ratio is less than
3.50
to 1.00, there are no such restrictions.
|
Net Pension Obligations
The net underfunded pension and MEPPs obligations
increased
by
$21.2 million
during the year ended
December 31, 2018
, from
$112.3 million
at
December 31, 2017
, to
$133.5 million
at
December 31, 2018
. This increase in overall pension obligations was primarily due to a
$32.1 million
increase to the MEPPs withdrawal liability recorded during the year ended December 31, 2018, following an unfavorable ruling from a panel of the Ninth Circuit Court of Appeals in December 2018; and also due to an actual return on plan assets of
(5.4)%
during the year ended
December 31, 2018
, which fell below the expected return on plan assets assumption of
6.5%
. The increase was partially offset by a
70
basis point
increase
in the pension discount rate from
3.52%
at
December 31, 2017
, to
4.22%
at
December 31, 2018
, and payments totaling
$13.1 million
made to the MEPPs during the year ended
December 31, 2018
.
The Company continues to focus on reducing pension obligations through cash contributions to the plans, lump-sum settlements and plan design changes.
68
Share Repurchase Program
On
September 6, 2011
, the Company’s Board of Directors authorized a share repurchase program of up to
$100.0 million
of the Company’s outstanding class A stock. On
July 30, 2018
, the Company’s Board of Directors discontinued the remainder of the
September 6, 2011
share repurchase program and authorized a new share repurchase program of up to
$100.0 million
of the Company’s outstanding class A common stock. Under the authorization, share repurchases may be made at the Company’s discretion, from time to time, in the open market and/or in privately negotiated transactions as permitted by federal securities laws and other legal requirements. The timing, manner, price and amount of any repurchase will depend on economic and market conditions, share price, trading volume, applicable legal requirements and other factors. The program may be suspended or discontinued at any time.
During the year ended
December 31, 2018
, the Company repurchased
1,871,631
shares of its class A common stock at a weighted average price of
$19.59
per share for a total purchase price of
$36.7 million
. During the year ended
December 31, 2017
, the Company repurchased
200,605
shares of its class A common stock at a weighted average price of
$18.89
per share for a total purchase price of
$3.8 million
. During the year ended
December 31, 2016
, the Company repurchased
984,190
shares of its class A common stock at a weighted average price of
$8.96
per share for a total purchase price of
$8.8 million
. As of
December 31, 2018
, there was
$100.0 million
of authorized repurchases remaining under the program.
Risk Management
For a discussion of the Company’s exposure to market risks and management of those market risks, see Item 7A, “Quantitative and Qualitative Disclosures About Market Risk,” of this Annual Report on Form 10-K.
Off-Balance Sheet Arrangements
Except as set forth below in the Contractual Obligations and Other Commitments table and in
Note 12
, “
Lease Obligations
,” to the consolidated financial statements in Part II, Item 8, “Financial Statements and Supplementary Data,” of this Annual Report on Form 10-K (including operating leases and future interest on debt and capital leases to be incurred), the Company has no off-balance sheet arrangements, financings or special purpose entities that the Company expects to have a material current or future effect on financial condition, changes in financial condition, results of operations, liquidity, capital expenditures, capital resources or significant components of sales or expenses.
69
Contractual Obligations and Other Commitments
The Company’s contractual cash obligations at
December 31, 2018
, were as follows (in millions):
|
Payments Due by Period
|
|||||||||||||||||||||||||||
|
Total
|
2019
|
2020
|
2021
|
2022
|
2023
|
Thereafter
|
|||||||||||||||||||||
|
Debt obligations
(1)
|
$
|
1,073.1
|
|
$
|
93.3
|
|
$
|
118.4
|
|
$
|
572.3
|
|
$
|
261.3
|
|
$
|
8.0
|
|
$
|
19.8
|
|
||||||
|
Operating lease obligations
|
158.1
|
|
38.2
|
|
33.4
|
|
23.9
|
|
17.8
|
|
13.7
|
|
31.1
|
|
|||||||||||||
|
MEPPs withdrawal obligations
(2)
|
73.0
|
|
12.0
|
|
9.8
|
|
6.2
|
|
6.2
|
|
6.1
|
|
32.7
|
|
|||||||||||||
|
Pension benefits
(3)
|
65.4
|
|
6.5
|
|
13.6
|
|
12.0
|
|
17.6
|
|
15.7
|
|
—
|
|
|||||||||||||
|
Capital lease obligations
(4)
|
17.1
|
|
5.9
|
|
4.9
|
|
4.1
|
|
2.0
|
|
0.2
|
|
—
|
|
|||||||||||||
|
Purchase obligations
(5)
|
61.1
|
|
61.1
|
|
—
|
|
—
|
|
—
|
|
—
|
|
—
|
|
|||||||||||||
|
Business acquisitions
(6)
|
15.4
|
|
5.3
|
|
5.1
|
|
5.0
|
|
—
|
|
—
|
|
—
|
|
|||||||||||||
|
Total
(7)(8)
|
$
|
1,463.2
|
|
$
|
222.3
|
|
$
|
185.2
|
|
$
|
623.5
|
|
$
|
304.9
|
|
$
|
43.7
|
|
$
|
83.6
|
|
||||||
______________________________
|
(1)
|
Debt obligations include
$139.4 million
for anticipated future interest payments, net of $4.3 million of estimated interest income from the interest rate swap, and excludes
$7.2 million
and
$1.0 million
for future amortization of debt issuance costs and original issue discount, respectively. During 2017, the Company paid in advance the full amount of required amortization payments on its Term Loan A, totaling $72.7 million for the years ended December 31, 2018 and 2019, and through the first quarter ended March 31, 2020. The Company also paid in advance the full amount of required amortization payments on its Term Loan B, totaling $9.0 million for the years ended December 31, 2018, 2019 and 2020. Amounts included in “Thereafter” include principal payments and estimated interest expense through
April 2031
. On
January 31, 2019
, the Company completed the third amendment to the Senior Secured Credit Facility. See
Note 24
, “
Subsequent Events
,” to the consolidated financial statements in Part II, Item 8, “Financial Statements and Supplementary Data,” of this Annual Report on Form 10-K for further detail.
|
|
(2)
|
MEPPs withdrawal obligations include
$22.1 million
for anticipated future interest payments. See
Note 15
, “
Employee Retirement Plans
,” to the consolidated financial statements in Part II, Item 8, “Financial Statements and Supplementary Data,” of this Annual Report on Form 10-K for further discussion of the MEPPs withdrawal liability.
|
|
(3)
|
For the pension benefits, contributions and benefit payments to be funded from Company assets included in the table have been actuarially estimated over a five year period. While benefit payments under these benefit plans are expected to continue beyond
2023
, the Company believes that an estimate beyond this period is unreasonable.
|
|
(4)
|
Capital lease obligations include
$1.7 million
for anticipated future interest payments.
|
|
(5)
|
Purchase obligations consist primarily of
$53.2 million
in firm commitments to purchase press and finishing equipment and
$7.9 million
of other purchase obligations.
|
|
(6)
|
Business acquisitions represents an estimated
$15.4 million
of future cash payments associated with the acquisition of Ivie. See
Note 3
, “
Acquisitions and Strategic Investments
,” to the consolidated financial statements in Item 8, “Financial Statements and Supplementary Data,” of this Annual Report on Form 10-K for further discussion.
|
|
(7)
|
The contractual obligations table above does not include reserves for uncertain tax positions recorded in accordance with the accounting guidance on uncertainties in income taxes. The Company has taken tax positions for which the ultimate amount and the year(s) any necessary payments will be made that pertain to those tax positions is uncertain. The reserve for uncertain tax positions prior to interest and penalties was
$14.4 million
as of
December 31, 2018
, of which
$7.9 million
was included in other long-term liabilities,
$6.2 million
was included in deferred income taxes and
$0.3 million
was included in accrued liabilities in the consolidated balance sheets. The Company has also recorded reserves for interest and penalties related to uncertain tax positions of
$0.5 million
and
$0.1 million
, respectively, as of
December 31, 2018
.
|
|
(8)
|
The contractual obligations table above does not include the share repurchase program as no repurchases are required under the program. See the “Share Repurchase Program” section above for further discussion, including the maximum potential cash payments under the program.
|
70
Critical Accounting Policies and Estimates
The Company’s consolidated financial statements are prepared in accordance with GAAP. The Company’s most critical accounting policies are those that are most important to the portrayal of its financial condition and results of operations, and which require the Company to make its most difficult and subjective estimates. Management is required to make judgments and estimates that affect the reported amounts of assets and liabilities, the disclosure of contingent assets and liabilities at the date of the statements, and the reported amounts of revenues and expenses during the reporting period. The Company bases its estimates on historical experience and on various other assumptions that are believed to be reasonable under the circumstances. The Company’s management believes that such judgments and estimates are made with consistent and appropriate methods based on information available at the time, and that any reasonable deviation from those judgments and estimates would not have a material impact on the Company’s consolidated financial position or results of operations. Actual results may differ from these estimates under different assumptions or conditions. To the extent that the estimates used differ from actual results, adjustments to the consolidated statements of operations and corresponding consolidated balance sheets would be necessary. These adjustments would be made in future statements.
The Company has identified the following as its critical accounting policies and estimates.
Revenue Recognition
Performance Obligations
At contract inception, the Company assesses the products and services promised in its contracts with customers and identifies performance obligations for each promise to transfer to the customer a product or service that is distinct. To identify the performance obligations, the Company considers the goods or services promised in the contract regardless of whether they are explicitly stated or are implied by customary business practices. The Company determined that the following distinct products and services represent separate performance obligations:
•
Pre-Press Services
•
Print
•
Other Services
For Pre-Press and Other Services, the Company recognizes revenue at point-in-time upon completion of the performed service and acceptance by the customer. The Company considers transfer of control to occur once the service is performed as the Company has right to payment and the customer has legal title and risk and reward of ownership.
The Company recognizes its Print revenues upon transfer of title and the passage of risk of loss, which is point-in-time upon shipment to the customer, and when there is a reasonable assurance as to collectability. Revenues related to the Company’s logistics operations, which includes the delivery of printed material, are included in the Print performance obligation and are also recognized at point-in-time as services are completed. Revenues related to the Company’s imaging operations, which include digital content management, photography, color services and page production, are recognized in accordance with the terms of the contract, typically upon completion of the performed service and acceptance by the customer. Under agreements with certain customers, products may be stored by the Company for future delivery. In these situations, the Company may receive warehouse management fees for the services it provides.
Certain revenues earned by the Company require judgment to determine if revenue should be recorded gross as principal or net of related costs as an agent. Billings for third-party shipping and handling costs, primarily in the Company’s logistics operations, and out-of-pocket expenses are recorded gross in net sales and cost of sales in the consolidated statements of operations in Item 8, “Financial Statements and Supplementary Data,” of this Annual Report on Form 10-K. Many of the Company’s operations process materials, primarily paper, that may be supplied directly by customers or may be purchased by the Company and sold to customers. No revenue is recognized for customer-supplied paper. Revenues for the Company-supplied paper are recognized on a gross basis. In some instances, the Company will
71
deliver print work for a customer and bill the customer for postage. In these cases, the Company is acting as an agent and billings are recorded on a net basis in net sales.
Significant Payment Terms
Payment terms and conditions for contracts with customers vary. The Company typically offers standard terms of net 30 days. It is not the Company’s standard business practice to offer extended payment terms longer than one year. The Company may offer cash discounts or prepayment and extended terms depending on certain facts and circumstances. As such, when the timing of the Company’s delivery of products and services differs from the timing of payment, the Company will record either a contract asset or a contract liability.
Variable Consideration
When evaluating the transaction price, the Company analyzes on a contract by contract basis all applicable variable considerations and non-cash consideration and also performs a constraint analysis. The nature of the Company’s contracts give rise to variable consideration, including, volume rebates, credits, discounts, and other similar items that generally decrease the transaction price. These variable amounts generally are credited to the customer, based on achieving certain levels of sales activity, when contracts are signed, or making payments within specific terms.
Product returns are not significant because the products are customized; however, the Company accrues for the estimated amount of customer allowances at the time of sale based on historical experience and known trends.
When the transaction price requires allocation to multiple performance obligations, the Company uses the estimated stand-alone selling prices using the adjusted market assessment approach.
Costs to Obtain Contracts
The Company capitalizes certain sales incentives of the sales compensation packages for costs that are directly attributed to being awarded a customer contract or renewal and would not have been incurred had the contract not been obtained. The Company also defers certain contract acquisition costs paid to the customer at contract inception. Costs to obtain contracts with a duration of less than one year are expensed as incurred. For all contract costs with contracts over one year, the Company amortizes the costs to obtain contracts on a straight-line basis over the estimated life of the contract and reviews quarterly for impairment.
The accounting policies and estimates related to revenue recognition have been updated effective January 1, 2018 with the adoption of the revised guidance on recognizing revenue from contracts with customers (see
Note 1
, “
Basis of Presentation and Summary of Significant Accounting Policies
,” and
Note 2
, “
Revenue Recognition
,” to the consolidated financial statements in Part II, Item 8, “Financial Statements and Supplementary Data,” of this Annual Report on Form 10-K for more information).
Impairment of Property, Plant and Equipment and Finite-lived Intangible Assets
The Company performs impairment evaluations of its long-lived assets whenever business conditions, events or circumstances indicate that those assets may be impaired, including whether the estimated useful life of such long-lived assets may warrant revision or whether the remaining balance of an asset may not be recoverable. The Company’s most significant long-lived assets are property, plant and equipment and customer relationship intangible assets recorded in conjunction with an acquisition. Assessing the impairment of long-lived assets requires the Company to make important estimates and assumptions, including, but not limited to, the expected future cash flows that the assets will generate, how the assets will be used based on the strategic direction of the Company, their remaining useful life and their residual value, if any. Considerable judgment is also applied in incorporating the potential impact of the current economic climate on customer demand and selling prices, the cost of production and the limited activity on secondary markets for the assets and on the cost of capital. When the estimated future undiscounted cash flows to be generated by the assets are less than the carrying value of the long-lived assets, the assets are written down to fair value and a charge is recorded to current operations. The Company uses internal discounted cash flow estimates, quoted market prices when available
72
and independent appraisals, as appropriate, to determine fair value. This fair value determination was categorized as Level 3 in the fair value hierarchy (see
Note 14
, “
Financial Instruments and Fair Value Measurements
,” to the consolidated financial statements in Part II, Item 8, “Financial Statements and Supplementary Data,” of this Annual Report on Form 10-K for the definition of Level 3 inputs). Based on the assessments completed during the years ended
December 31, 2018
,
2017
and
2016
, the Company recognized property, plant and equipment impairment charges of
$26.5 million
,
$12.0 million
and
$26.8 million
, respectively, primarily related to facility consolidations, as well as other capacity and strategic reduction restructuring initiatives. There were no finite-lived intangible asset impairment charges recorded during the years ended
December 31, 2018
,
2017
and
2016
.
The Company continues to monitor groups of assets to identify any new events or changes in circumstances that could indicate that their carrying values are not recoverable, particularly in light of potential declines in profitability that may result from the highly competitive industry landscape and continued uncertainty in the global economy. In the event that there are significant and unanticipated changes in circumstances, such as significant adverse changes in business climate, adverse actions by regulators, unanticipated competition, loss of key customers and/or changes in technology or markets, or that actual results differ from management’s estimates, a provision for impairment could be required in a future period.
Impairment of Goodwill
In accordance with accounting guidance, the Company performs an annual impairment test for goodwill as of October 31 or more frequently if events or changes in circumstances indicate that it is more likely than not that the fair value of a reporting unit is below its carrying value. Goodwill represents the excess of the purchase price over the fair value of identifiable net assets acquired in a business combination and is assigned to specific reporting units. Changes in management’s estimates or judgments, including changes based on actual results differing from the estimates and
judgments used in the purchase price allocation process, could result in an impairment charge, and such a charge could have a material adverse effect on the Company's results of operations.
Within the United States Print and Related Services Segment, the Company has identified three reporting units: (1) Core Print and Related Services; (2) Specialty Print and Related Services; and (3) Other United States Products and Services. As of December 31, 2018, goodwill totaled $54.6 million and was allocated to the Core Print and Related Services. The Specialty Print and Related Services reporting unit and the Other United States Products and Services reporting unit have no goodwill allocated to them. Additionally, there is no goodwill in the International segment on the consolidated balance sheets.
In determining the fair value of the Core Print and Related Services reporting unit, the Company used an equal weighting of both the income and market approaches. Significant assumptions used under the income approach included: estimated future cash flows including expected future revenue growth, profit margins, capital expenditures, working capital levels, terminal value multiples and a 11.2% after-tax weighted average cost of capital for the Core Print and Related Services. Estimated future cash flows were based on the Company's internal projection models, industry projections and other assumptions deemed reasonable by management. Significant assumptions used under the market approach included: a control premium based on similar transactions, selection of the guideline public companies and selected market multiples. This fair value determination was categorized as Level 3 in the fair value hierarchy (see
Note 14
, “
Financial Instruments and Fair Value Measurements
,” to the consolidated financial statements in Item 8, “Financial Statements and Supplementary Data,” of this Annual Report on Form 10-K for the definition of Level 3 inputs).
After completing the evaluation, the estimated fair value of the Core Print and Related Services reporting unit in the United States Print and Related Services segment was determined to exceed the carrying value of the reporting unit. In addition, the Company performed a sensitivity analysis as of October 31, 2018, on the material assumptions used in the discounted cash flow valuation models. In performing the annual goodwill impairment assessment, the percentage by which estimated fair value exceeded carrying value in the Core Print and Related Services reporting unit was more than 50%. As such, management concluded that no impairment existed as of October 31, 2018. No additional indications of impairment were identified between October 31, 2018 and December 31, 2018.
73
Pension Plans
As a result of the acquisition of World Color Press, the Company acquired multiple underfunded pension plans. Pension plan costs are determined using actuarial methods and are funded through contributions determined in accordance with the projected benefit method pro-rated based on service. The Company records amounts relating to its pension plans based on calculations which include various actuarial assumptions. The Company believes that the two most critical assumptions are the discount rate and assumed rate of return on assets. Changes in these assumptions are primarily influenced by factors outside of the Company’s control and can have a significant effect on the amounts reported in the financial statements. The Company reviews its actuarial assumptions on an annual basis and modifies the assumptions based on current rates and trends when it is appropriate to do so. The effects of modifications are recognized immediately on the consolidated balance sheets, but are generally amortized into operating income over future periods, with the deferred amount recorded in accumulated other comprehensive loss on the consolidated balance sheets included in Item 8, “Financial Statements and Supplementary Data,” of this Annual Report on Form 10-K. The Company believes that the assumptions utilized in recording its obligations under its plans are reasonable based on its experience, market conditions and input from its actuaries and investment advisors. When an event gives rise to both a curtailment and a settlement, the curtailment is accounted for prior to the settlement. The Company’s measurement date to measure the defined benefit plan assets and the projected benefit obligation is December 31. For the purposes of calculating the expected return on plan assets, those assets are valued at fair value.
The Company determines its assumption for the discount rate to be used for purposes of computing annual service and interest costs for each pension plan based on an index of high-quality corporate bond yields and matched-funding yield curve analysis as of that date. The Company measures interest costs for pension benefits by applying the specific spot rates along that yield curve to the plans’ liability cash flows.
The weighted average discount rate used to determine benefit obligations for the pension plans at
December 31, 2018
, was
4.22%
, a
70
basis point increase from the discount rate of
3.52%
at the
December 31, 2017
. A one-percentage point change in the discount rate would have the following impact on the projected benefit obligation as of
December 31, 2018
:
|
1.0%
Increase
|
1.0%
Decrease
|
||||||
|
(in millions)
|
|||||||
|
Projected benefit obligation
|
$
|
(39.4
|
)
|
$
|
47.1
|
|
|
The Company employs a total return on investment approach for its pension plans whereby a diversified mix of equity securities and debt securities are used to maximize the long-term pension plan assets. The intent of this strategy is to outperform the growth in plan liabilities over the long run, such that plan contributions can be decreased, balanced with maintaining a lower degree of investment risk. Risk tolerance is established through careful consideration of plan liabilities, plan funded status, and corporate financial condition. Equity securities are diversified across geography and market capitalization through investments in United States large-capitalization stocks, United States small-capitalization stocks and international securities. Investment risk is measured and monitored on an ongoing basis through annual liability measurements, periodic asset/liability studies and quarterly investment portfolio reviews. The expected long-term rate of return for plan assets is based upon many factors including expected asset allocations, historical asset returns, current and expected future market conditions and risk. The current target asset allocation for plan assets on a weighted average basis are
30%
equity securities and
70%
debt securities. The actual asset allocation as of
December 31, 2018
, was approximately
30%
equity securities and
70%
debt securities. The expected return on plan assets assumption at
December 31, 2018
and
2017
, was
6.5%
for the Company’s funded United States pension plans. Actual return on plan assets was (
5.4%
) and
14.3%
for the years ended
December 31, 2018
and
2017
, respectively. Certain pension plans are unfunded (those plans do not hold plan assets).
74
A 25 basis point change in the expected return on plan assets would have the following impact on net pension income for the year ended
December 31, 2018
:
|
0.25%
Increase
|
0.25%
Decrease
|
||||||
|
(in millions)
|
|||||||
|
Net pension income
|
$
|
0.9
|
|
$
|
(0.9
|
)
|
|
The Company also participated in
MEPPs
as a result of the acquisition of World Color Press. The Company has withdrawn from all significant
MEPPs
and replaced these union sponsored “promise to pay in the future” defined benefit plans with a Company sponsored “pay as you go” defined contribution plan. The two MEPPs, the
GCIU
and the
GCC
, are significantly underfunded, and require the Company to pay a withdrawal liability to fund its pro rata share of the underfunding as of the plan year the full withdrawal was completed. As a result of the decision to withdraw, the Company accrued the estimated withdrawal liability based on information provided by each plan’s trustee.
During the fourth quarter of 2016, the Company and the GCC reached a settlement agreement for all claims, with scheduled payments until February 2024.
The Company has received a notice of withdrawal and demand for payment letter from the
GCIU
. The Company is currently in litigation with the
GCIU
trustees to determine the amount and duration of the withdrawal payments for the
GCIU
. Arbitration proceedings with the
GCIU
have been completed, both sides have appealed the arbitrator’s ruling, and litigation in Federal court has commenced. During April 2017, a Federal district court overturned the arbitration decision in one of the pending disputes in this matter. The Company appealed the district court’s ruling to a panel of the Ninth Circuit Court of Appeals, and in December 2018, the panel upheld the district court’s decision. The Company filed a motion for reconsideration with the panel, which was denied. Until litigation with the GCIU trustees is concluded, the exact amount of the withdrawal liability will not be known. As a result of these unfavorable rulings, the Company recorded a
$32.1 million
increase to the MEPPs withdrawal liability during the year ended December 31, 2018, which was recorded in restructuring, impairment and transaction-related charges in the consolidated statements of operations.
New Accounting Pronouncements
See
Note 23
, “
New Accounting Pronouncements
,” to the consolidated financial statements in Part II, Item 8, “Financial Statements and Supplementary Data,” of this Annual Report on Form 10-K.
75
|
Item 7A.
|
Quantitative and Qualitative Disclosures About Market Risk
|
The Company is exposed to a variety of market risks which may adversely impact the Company’s results of operations and financial condition, including changes in interest and foreign currency exchange rates, changes in the economic environment that would impact credit positions and changes in the prices of certain commodities. The Company’s management takes an active role in the risk management process and has developed policies and procedures that require specific administrative and business functions to assist in the identification, assessment and control of various risks. These risk management strategies may not fully insulate the Company from adverse impacts due to market risks.
Interest Rate Risk
The Company is exposed to interest rate risk on variable rate debt obligations and price risk on fixed rate debt and capital leases. The variable rate debt outstanding at
December 31, 2018
is primarily comprised of
$281.3 million
outstanding on the Term Loan A and
$279.5 million
outstanding on the Term Loan B. As of
December 31, 2018
, there was no outstanding balance on the revolving credit facility. In order to reduce the variability of cash flows from interest payments related to a portion of Quad’s variable-rate debt, the Company entered into a $250.0 million interest rate swap during February 2017, and has classified $250.0 million of the Company’s variable rate debt as fixed rate debt. Including the impact of the
$250.0 million
interest rate swap of variable rate to fixed rate debt, Quad had variable rate debt outstanding of
$318.5 million
at a current weighted average interest rate of
5.1%
and fixed rate debt and capital leases outstanding of
$622.4 million
at a current weighted average interest rate of
5.6%
at
December 31, 2018
. The Term Loan B bears interest primarily based on LIBOR; however, it is subject to a 1.0% LIBOR minimum rate, and thus the interest rate on the Term Loan B will not begin to fluctuate until LIBOR exceeds that percentage. At
December 31, 2018
, LIBOR was over 1.0%, or at 2.5%, and as a result, the interest on the Term Loan B would fluctuate with a 10% increase in the market interest rate. Including the Term Loan B, a hypothetical 10% increase in the market interest rates impacting the Company’s current weighted average interest rate on variable rate debt obligations would not have a material impact on the Company’s interest expense. A hypothetical 10% change in market interest rates would change the fair value of fixed rate debt at
December 31, 2018
, by approximately
$8 million
.
Foreign Currency Risk and Translation Exposure
The Company is exposed to the impact of foreign currency fluctuations in certain countries in which it operates. The exposure to foreign currency movements is limited in most countries because the operating revenues and expenses of its various subsidiaries and business units are substantially in the local currency of the country in which they operate. To the extent revenues and expenses are not in the applicable local currency, the Company may enter into foreign exchange forward contracts to hedge the currency risk.
Although operating in local currencies may limit the impact of currency rate fluctuations on the results of operations of the Company’s non-United States subsidiaries and business units, rate fluctuations may impact the consolidated financial position as the assets and liabilities of its foreign operations are translated into U.S. dollars in preparing the Company’s consolidated balance sheets. As of
December 31, 2018
, the Company’s foreign subsidiaries (excluding Argentina due to the economy’s status as highly inflationary) had net current assets (defined as current assets less current liabilities) subject to foreign currency translation risk of $24.5 million. The potential decrease in net current assets as of
December 31, 2018
, from a hypothetical 10% adverse change in quoted foreign currency exchange rates would be approximately $2.5 million. This sensitivity analysis assumes a parallel shift in all major foreign currency exchange rates versus the U.S. dollar. Exchange rates rarely move in the same direction relative to the U.S. dollar due to positive and negative correlations of the various global currencies. This assumption may overstate or understate the impact of changing exchange rates on individual assets and liabilities denominated in a foreign currency.
The Company’s hedging operations have historically not been material, and gains or losses from these operations have not been material to the Company’s results of operations, financial position or cash flows. The Company does not use derivative financial instruments for trading or speculative purposes.
76
These international operations are subject to risks typical of international operations, including, but not limited to, differing economic conditions, changes in political climate, potential restrictions on the movement of funds, differing tax structures, and other regulations and restrictions. Accordingly, future results could be adversely impacted by changes in these or other factors.
The Company has considered the economy in Argentina to be highly inflationary, effective June 30, 2018. In accordance with Accounting Standards Codification 830 “Foreign Currency Matters”, a highly inflationary economy is one that has experienced cumulative inflation of approximately 100 percent or more over a three-year period. An entity is required to apply the revised accounting guidance in the reporting period following when the economy was deemed to be highly inflationary. As a result of this classification, the functional currency of the Company's Argentina Subsidiaries was changed from the local currency to the U.S. Dollar, beginning July 1, 2018, and impacts from the change in the value of the local currency for monetary assets and liabilities is now reflected in the consolidated statements of operations. The total impact from foreign currency losses was
$1.5 million
during the year ended
December 31, 2018
, and was recorded in restructuring, impairment and transaction-related charges in the consolidated statements of operations. The Company’s operations in Argentina represented less than 2.0% of total consolidated assets as of
December 31, 2018
, and less than 2.0% of total consolidated net sales for the year ended
December 31, 2018
.
Credit Risk
Credit risk is the possibility of loss from a customer’s failure to make payments according to contract terms. Prior to granting credit, each customer is evaluated in an underwriting process, taking into consideration the prospective customer’s financial condition, past payment experience, credit bureau information and other financial and qualitative factors that may affect the customer’s ability to pay. Specific credit reviews and standard industry credit scoring models are used in performing this evaluation. Customers’ financial condition is continuously monitored as part of the normal course of business. Some of the Company’s customers are highly leveraged or otherwise subject to their own operating and regulatory risks. Based on those customer account reviews and due to the continued uncertainty of the global economy, the Company has established an allowance for doubtful accounts of
$27.6 million
as of
December 31, 2018
.
The Company has a large, diverse customer base and does not have a high degree of concentration with any single customer account. During the year ended
December 31, 2018
, the Company’s largest customer accounted for less than 5% of the Company’s net sales. Even if the Company’s credit review and analysis mechanisms work properly, the Company may experience financial losses in its dealings with customers and other parties. Any increase in nonpayment or nonperformance by customers could adversely impact the Company’s results of operations and financial condition. Economic disruptions could result in significant future charges.
Commodity Risk
The primary raw materials that Quad uses in its print business are paper, ink and energy. At this time, the Company’s supply of raw materials is readily available from numerous vendors; however, based on market conditions, that could change in the future. The Company generally buys these raw materials based upon market prices that are established with the vendor as part of the procurement process.
Approximately half of the paper used in the printing process is supplied directly by its clients. For those clients that do not directly supply their own paper, the Company makes use of its purchasing efficiencies to supply paper by negotiating with leading paper vendors, uses a wide variety of paper grades, weights and sizes, and does not rely on any one vendor. In addition, the Company generally includes price adjustment clauses in sales contracts for paper and other critical raw materials in the printing process. Although these clauses generally mitigate paper price risk, higher paper prices and tight paper supplies, as well as changes in the United States import or trade regulations may have an impact on client demand for printed products. The Company’s working capital requirements, including the impact of seasonality, are partially mitigated through the direct purchasing of paper by its clients.
The Company produces the majority of ink used in its print production, allowing it to control the quality, cost and supply of key inputs. Raw materials for the ink manufacturing process are purchased externally from a variety of vendors.
77
The Company generally cannot pass on to clients the impact of higher electric and natural gas energy prices on its manufacturing costs, and increases in energy prices result in higher manufacturing costs for certain of its operations. The Company mitigates its risk through natural gas hedges when appropriate. In its logistic operations, however, the Company is able to pass a substantial portion of any increase in fuel prices directly to its clients.
As a result, management believes a hypothetical 10% change in the price of paper and other raw materials would not have a significant direct impact on the Company’s consolidated annual results of operations or cash flows; however, significant increases in commodity pricing or tight supply could influence future client demand for printed products. Inflation has not had a significant impact on the Company historically.
78
|
Item 8.
|
Financial Statements and Supplementary Data
|
Quarterly Financial Data (Unaudited)
The following table sets forth selected financial information for each of the eight quarters in the two-year period ended
December 31, 2018
. This unaudited information has been prepared by the Company on the same basis as the consolidated financial statements and includes all normal recurring adjustments necessary to present this information fairly when read in conjunction with the Company’s audited consolidated financial statements and the notes thereto.
|
UNAUDITED INTERIM FINANCIAL INFORMATION
|
|||||||||||||||||||
|
(In millions, except per share data)
|
|||||||||||||||||||
|
Year Ended December 31,
|
|||||||||||||||||||
|
First Quarter
|
Second Quarter
|
Third Quarter
|
Fourth Quarter
|
Full Year
|
|||||||||||||||
|
2018
|
|||||||||||||||||||
|
Net sales
|
$
|
967.5
|
|
$
|
1,015.5
|
|
$
|
1,029.1
|
|
$
|
1,181.6
|
|
$
|
4,193.7
|
|
||||
|
Operating income (loss)
(1)
|
7.1
|
|
20.9
|
|
40.6
|
|
(10.6
|
)
|
58.0
|
|
|||||||||
|
Net earnings (loss) attributable to Quad common shareholders
|
(3.5
|
)
|
9.4
|
|
23.4
|
|
(20.8
|
)
|
8.5
|
|
|||||||||
|
Earnings (loss) per diluted share attributable to Quad common shareholders
|
(0.07
|
)
|
0.18
|
|
0.46
|
|
(0.42
|
)
|
0.16
|
|
|||||||||
|
Closing stock price high
|
30.89
|
|
26.06
|
|
24.82
|
|
20.26
|
|
30.89
|
|
|||||||||
|
Closing stock price low
|
20.17
|
|
18.40
|
|
19.87
|
|
11.84
|
|
11.84
|
|
|||||||||
|
Closing stock price at quarter-end
|
25.35
|
|
20.83
|
|
20.84
|
|
12.32
|
|
12.32
|
|
|||||||||
|
2017
|
|||||||||||||||||||
|
Net sales
|
$
|
998.6
|
|
$
|
963.2
|
|
$
|
1,005.4
|
|
$
|
1,164.2
|
|
$
|
4,131.4
|
|
||||
|
Operating income
|
51.0
|
|
30.1
|
|
46.8
|
|
27.4
|
|
155.3
|
|
|||||||||
|
Net earnings attributable to Quad common shareholders
|
25.4
|
|
6.7
|
|
19.8
|
|
55.3
|
|
107.2
|
|
|||||||||
|
Earnings per diluted share attributable to Quad common shareholders
|
0.49
|
|
0.13
|
|
0.38
|
|
1.06
|
|
2.07
|
|
|||||||||
|
Closing stock price high
|
27.66
|
|
27.98
|
|
23.27
|
|
23.98
|
|
27.98
|
|
|||||||||
|
Closing stock price low
|
22.10
|
|
21.91
|
|
18.35
|
|
20.92
|
|
18.35
|
|
|||||||||
|
Closing stock price at quarter-end
|
25.24
|
|
22.92
|
|
22.61
|
|
22.60
|
|
22.60
|
|
|||||||||
______________________________
|
(1)
|
Operating income
decreased
$43.9 million
during the three months ended March 31, 2018, as compared to the three months ended March 31, 2017, primarily due to the following: (1)
$15.7 million
of
increased
restructuring, impairment and transaction related charges; (2) lower print volume and pricing due to ongoing industry pressures; (3) a $22.3 million non-cash expense related to a special employee retirement contribution in 2018 resulting from the benefit of tax reform; and (4) a $10.4 million net benefit in 2017 from changes in employee vacation policies. These impacts were partially offset by a $17.2 million gain from a property insurance claim in 2018 and savings from cost reduction initiatives, including employee-related costs.
|
Operating income
decreased
$9.2 million
during the three months ended June 30, 2018, as compared to the three months ended June 30, 2017, primarily due to the following: (1)
$5.1 million
of
increased
restructuring, impairment and transaction-related charges; (2) lower print volume and pricing due to ongoing industry pressures; and (3) a $3.9 million net benefit in 2017 in gain from insurance claims. These impacts were partially offset by savings from cost reduction initiatives, earnings from the Ivie acquisition and the investment in Rise and a $0.2 million decrease in depreciation and amortization expense.
Operating income
decreased
$6.2 million
during the three months ended September 30, 2018, as compared to the three months ended September 30, 2017, primarily due to lower print volume and pricing due to ongoing industry pressures and a $0.8 million increase in depreciation and amortization expense, partially offset by
$2.7 million
of
decreased
restructuring, impairment and transaction-related charges, savings from cost reduction initiatives and earnings from the Ivie acquisition and the investment in Rise.
Operating income
decreased
$38.0 million
for the three months ended December 31,
2018
, as compared to the three months ended December 31,
2017
, primarily due to
$25.1 million
of
increased
restructuring, impairment and transaction-related charges and lower print volume and pricing due to ongoing industry pressures, partially offset by savings from cost reduction initiatives and earnings from the Ivie acquisition and the investment in Rise.
79
REPORT OF INDEPENDENT REGISTERED PUBLIC ACCOUNTING FIRM
To the shareholders and the Board of Directors of Quad/Graphics, Inc.
Opinion on the Financial Statements
We have audited the accompanying consolidated balance sheets of Quad/Graphics, Inc. and subsidiaries (the “Company”) as of
December 31, 2018
and
2017
, the related consolidated statements of operations, comprehensive income (loss), shareholders’ equity and cash flows for each of the three years in the period ended
December 31, 2018
, and the related notes (collectively referred to as the “financial statements”). In our opinion, the financial statements present fairly, in all material respects, the financial position of the Company as of
December 31, 2018
and
2017
, and the results of its operations and its cash flows for each of the three years in the period ended
December 31, 2018
, in conformity with accounting principles generally accepted in the United States of America.
We have also audited, in accordance with the standards of the Public Company Accounting Oversight Board (United States) (PCAOB), the Company’s internal control over financial reporting as of
December 31, 2018
, based on criteria established in
Internal Control – Integrated Framework (2013)
issued by the Committee of Sponsoring Organizations of the Treadway Commission and our report dated
February 20, 2019
, expressed an unqualified opinion on the Company’s internal control over financial reporting.
Basis for Opinion
These financial statements are the responsibility of the Company’s management. Our responsibility is to express an opinion on the Company’s financial statements based on our audits. We are a public accounting firm registered with the PCAOB and are required to be independent with respect to the Company in accordance with the U.S. federal securities laws and the applicable rules and regulations of the Securities and Exchange Commission and the PCAOB.
We conducted our audits in accordance with the standards of the PCAOB. Those standards require that we plan and perform the audit to obtain reasonable assurance about whether the financial statements are free of material misstatement, whether due to error or fraud. Our audits included performing procedures to assess the risks of material misstatement of the financial statements, whether due to error or fraud, and performing procedures that respond to those risks. Such procedures included examining, on a test basis, evidence regarding the amounts and disclosures in the financial statements. Our audits also included evaluating the accounting principles used and significant estimates made by management, as well as evaluating the overall presentation of the financial statements. We believe that our audits provide a reasonable basis for our opinion.
/s/ Deloitte & Touche LLP
Milwaukee, Wisconsin
February 20, 2019
We have served as the Company’s auditor since 2002.
80
REPORT OF INDEPENDENT REGISTERED PUBLIC ACCOUNTING FIRM
To the shareholders and the Board of Directors of Quad/Graphics, Inc.
Opinion on Internal Control over Financial Reporting
We have audited the internal control over financial reporting of Quad/Graphics, Inc. and subsidiaries (the “Company”) as of
December 31, 2018
, based on criteria established in
Internal Control – Integrated Framework (2013)
issued by the Committee of Sponsoring Organizations of the Treadway Commission (COSO). In our opinion, the Company maintained, in all material respects, effective internal control over financial reporting as of
December 31, 2018
, based on criteria established in
Internal Control - Integrated Framework (2013)
issued by COSO.
We have also audited, in accordance with the standards of the Public Company Accounting Oversight Board (United States) (PCAOB), the consolidated financial statements as of and for the year ended
December 31, 2018
, of the Company and our report dated
February 20, 2019
, expressed an unqualified opinion on those financial statements.
As described in Management’s Report on Internal Control Over Financial Reporting, management excluded from its assessment the internal control over financial reporting at Ivie & Associates, LLC (“Ivie”), which was acquired on February 21, 2018, and Rise Interactive and Analytics, LLC (“Rise”), in which the Company acquired a controlling financial interest on March 14, 2018. The financial statements of Ivie and Rise collectively constitute approximately 5% of consolidated total current assets, approximately 4% of consolidated net sales and approximately 4% of consolidated cost of sales as of and for the year ended December 31, 2018. Accordingly, our audit did not include the internal control over financial reporting at Ivie or Rise.
Basis for Opinion
The Company’s management is responsible for maintaining effective internal control over financial reporting and for its assessment of the effectiveness of internal control over financial reporting, included in the accompanying Management’s Report on Internal Control Over Financial Reporting. Our responsibility is to express an opinion on the Company’s internal control over financial reporting based on our audit. We are a public accounting firm registered with the PCAOB and are required to be independent with respect to the Company in accordance with the U.S. federal securities laws and the applicable rules and regulations of the Securities and Exchange Commission and the PCAOB.
We conducted our audit in accordance with the standards of the PCAOB. Those standards require that we plan and perform the audit to obtain reasonable assurance about whether effective internal control over financial reporting was maintained in all material respects. Our audit included obtaining an understanding of internal control over financial reporting, assessing the risk that a material weakness exists, testing and evaluating the design and operating effectiveness of internal control based on the assessed risk, and performing such other procedures as we considered necessary in the circumstances. We believe that our audit provides a reasonable basis for our opinion.
Definition and Limitations of Internal Control over Financial Reporting
A company’s internal control over financial reporting is a process designed to provide reasonable assurance regarding the reliability of financial reporting and the preparation of financial statements for external purposes in accordance with generally accepted accounting principles. A company’s internal control over financial reporting includes those policies and procedures that (1) pertain to the maintenance of records that, in reasonable detail, accurately and fairly reflect the transactions and dispositions of the assets of the company; (2) provide reasonable assurance that transactions are recorded as necessary to permit preparation of financial statements in accordance with generally accepted accounting principles, and that receipts and expenditures of the company are being made only in accordance with authorizations of management and directors of the company; and (3) provide reasonable assurance regarding prevention or timely detection of unauthorized acquisition, use, or disposition of the company’s assets that could have a material effect on the financial statements.
Because of its inherent limitations, internal control over financial reporting may not prevent or detect misstatements. Also, projections of any evaluation of effectiveness to future periods are subject to the risk that controls may become inadequate because of changes in conditions, or that the degree of compliance with the policies or procedures may deteriorate.
/s/ Deloitte & Touche LLP
Milwaukee, Wisconsin
February 20, 2019
81
QUAD/GRAPHICS, INC.
CONSOLIDATED STATEMENTS OF OPERATIONS
(in millions, except per share data)
|
Year Ended December 31,
|
|||||||||||
|
2018
|
2017
|
2016
|
|||||||||
|
Net sales
|
|||||||||||
|
Products
|
$
|
3,392.3
|
|
$
|
3,529.0
|
|
$
|
3,717.1
|
|
||
|
Services
|
801.4
|
|
602.4
|
|
612.4
|
|
|||||
|
Total net sales
|
4,193.7
|
|
4,131.4
|
|
4,329.5
|
|
|||||
|
Cost of sales
|
|||||||||||
|
Products
|
2,829.0
|
|
2,827.3
|
|
2,971.0
|
|
|||||
|
Services
|
600.3
|
|
432.1
|
|
423.8
|
|
|||||
|
Total cost of sales
|
3,429.3
|
|
3,259.4
|
|
3,394.8
|
|
|||||
|
Operating expenses
|
|||||||||||
|
Selling, general and administrative expenses
|
372.1
|
|
423.8
|
|
466.7
|
|
|||||
|
Depreciation and amortization
|
230.7
|
|
232.5
|
|
277.1
|
|
|||||
|
Restructuring, impairment and transaction-related charges
|
103.6
|
|
60.4
|
|
73.6
|
|
|||||
|
Total operating expenses
|
4,135.7
|
|
3,976.1
|
|
4,212.2
|
|
|||||
|
Operating income
|
58.0
|
|
155.3
|
|
117.3
|
|
|||||
|
Interest expense
|
73.3
|
|
71.1
|
|
77.2
|
|
|||||
|
Net pension income
|
(12.4
|
)
|
(9.6
|
)
|
(5.1
|
)
|
|||||
|
Loss (gain) on debt extinguishment
|
—
|
|
2.6
|
|
(14.1
|
)
|
|||||
|
Earnings (loss) before income taxes and equity in (earnings) loss of unconsolidated entity
|
(2.9
|
)
|
91.2
|
|
59.3
|
|
|||||
|
Income tax (benefit) expense
|
(9.8
|
)
|
(16.0
|
)
|
13.0
|
|
|||||
|
Earnings before equity in (earnings) loss of unconsolidated entity
|
6.9
|
|
107.2
|
|
46.3
|
|
|||||
|
Equity in (earnings) loss of unconsolidated entity
|
(1.0
|
)
|
—
|
|
1.4
|
|
|||||
|
Net earnings
|
7.9
|
|
107.2
|
|
44.9
|
|
|||||
|
Less: net loss attributable to noncontrolling interests
|
(0.6
|
)
|
—
|
|
—
|
|
|||||
|
Net earnings attributable to Quad common shareholders
|
$
|
8.5
|
|
$
|
107.2
|
|
$
|
44.9
|
|
||
|
Earnings per share attributable to Quad common shareholders
|
|||||||||||
|
Basic
|
$
|
0.17
|
|
$
|
2.16
|
|
$
|
0.94
|
|
||
|
Diluted
|
$
|
0.16
|
|
$
|
2.07
|
|
$
|
0.90
|
|
||
|
Weighted average number of common shares outstanding
|
|||||||||||
|
Basic
|
49.8
|
|
49.6
|
|
47.9
|
|
|||||
|
Diluted
|
51.6
|
|
51.8
|
|
49.8
|
|
|||||
See accompanying Notes to Consolidated Financial Statements.
82
QUAD/GRAPHICS, INC.
CONSOLIDATED STATEMENTS OF COMPREHENSIVE INCOME (LOSS)
(in millions)
|
Year Ended December 31,
|
|||||||||||
|
2018
|
2017
|
2016
|
|||||||||
|
Net earnings
|
$
|
7.9
|
|
$
|
107.2
|
|
$
|
44.9
|
|
||
|
Other comprehensive income (loss)
|
|||||||||||
|
Translation adjustments
|
|||||||||||
|
Foreign currency translation adjustments
|
(13.3
|
)
|
14.8
|
|
(15.5
|
)
|
|||||
|
Translation of long-term loans to foreign subsidiaries
|
0.3
|
|
(2.0
|
)
|
11.6
|
|
|||||
|
Revaluation loss on the sale of a business
|
—
|
|
2.1
|
|
—
|
|
|||||
|
Total translation adjustments
|
(13.0
|
)
|
14.9
|
|
(3.9
|
)
|
|||||
|
Interest rate swap adjustments
|
2.2
|
|
2.1
|
|
—
|
|
|||||
|
Pension benefit plan adjustments
|
|||||||||||
|
Net gain (loss) arising during period
|
(18.1
|
)
|
18.7
|
|
(0.8
|
)
|
|||||
|
Settlement charge on pension benefit plans included in net earnings (loss)
|
—
|
|
0.8
|
|
7.0
|
|
|||||
|
Total pension benefit plan adjustments
|
(18.1
|
)
|
19.5
|
|
6.2
|
|
|||||
|
Other comprehensive income (loss), before tax
|
(28.9
|
)
|
36.5
|
|
2.3
|
|
|||||
|
Income tax impact related to items of other comprehensive income (loss)
|
4.0
|
|
(8.3
|
)
|
(2.4
|
)
|
|||||
|
Other comprehensive income (loss), net of tax
|
(24.9
|
)
|
28.2
|
|
(0.1
|
)
|
|||||
|
Total comprehensive income (loss)
|
(17.0
|
)
|
135.4
|
|
44.8
|
|
|||||
|
Less: comprehensive loss attributable to noncontrolling interests
|
(0.6
|
)
|
—
|
|
—
|
|
|||||
|
Comprehensive income (loss) attributable to Quad common shareholders
|
$
|
(16.4
|
)
|
$
|
135.4
|
|
$
|
44.8
|
|
||
See accompanying Notes to Consolidated Financial Statements.
83
QUAD/GRAPHICS, INC.
CONSOLIDATED BALANCE SHEETS
(in millions, except per share data)
|
December 31,
2018 |
December 31,
2017 |
|||||||
|
ASSETS
|
||||||||
|
Cash and cash equivalents
|
$
|
69.5
|
|
$
|
64.4
|
|
||
|
Receivables, less allowances for doubtful accounts of $27.6 million at December 31, 2018, and $28.9 million at December 31, 2017
|
528.7
|
|
552.5
|
|
||||
|
Inventories
|
300.6
|
|
246.5
|
|
||||
|
Prepaid expenses and other current assets
|
47.8
|
|
45.1
|
|
||||
|
Total current assets
|
946.6
|
|
908.5
|
|
||||
|
Property, plant and equipment—net
|
1,257.4
|
|
1,377.6
|
|
||||
|
Goodwill
|
54.6
|
|
—
|
|
||||
|
Other intangible assets—net
|
112.6
|
|
43.4
|
|
||||
|
Equity method investment in unconsolidated entity
|
4.0
|
|
3.6
|
|
||||
|
Other long-term assets
|
93.9
|
|
119.3
|
|
||||
|
Total assets
|
$
|
2,469.1
|
|
$
|
2,452.4
|
|
||
|
LIABILITIES AND SHAREHOLDERS
’
EQUITY
|
||||||||
|
Accounts payable
|
$
|
511.0
|
|
$
|
381.6
|
|
||
|
Accrued liabilities
|
292.3
|
|
316.7
|
|
||||
|
Short-term debt and current portion of long-term debt
|
42.9
|
|
42.0
|
|
||||
|
Current portion of capital lease obligations
|
5.1
|
|
5.6
|
|
||||
|
Total current liabilities
|
851.3
|
|
745.9
|
|
||||
|
Long-term debt
|
882.6
|
|
903.5
|
|
||||
|
Capital lease obligations
|
10.3
|
|
13.7
|
|
||||
|
Deferred income taxes
|
32.1
|
|
41.9
|
|
||||
|
Other long-term liabilities
|
232.6
|
|
225.0
|
|
||||
|
Total liabilities
|
2,008.9
|
|
1,930.0
|
|
||||
|
Commitments and contingencies (Note 10)
|
|
|
|
|
||||
|
Shareholders’ equity (Note 18)
|
||||||||
|
Preferred stock, $0.01 par value; Authorized: 0.5 million shares; Issued: None
|
—
|
|
—
|
|
||||
|
Common stock, Class A, $0.025 par value; Authorized: 80.0 million shares; Issued: 40.3 million shares at December 31, 2018, and 40.0 million shares at December 31, 2017
|
1.0
|
|
1.0
|
|
||||
|
Common stock, Class B, $0.025 par value; Authorized: 80.0 million shares; Issued: 13.5 million shares at December 31, 2018, and 13.8 million shares at December 31, 2017
|
0.4
|
|
0.4
|
|
||||
|
Common stock, Class C, $0.025 par value; Authorized: 20.0 million shares; Issued: 0.5 million shares at December 31, 2018 and 2017
|
—
|
|
—
|
|
||||
|
Additional paid-in capital
|
861.3
|
|
861.1
|
|
||||
|
Treasury stock, at cost, 2.7 million shares at December 31, 2018, and 2.3 million shares at December 31, 2017
|
(56.6
|
)
|
(52.8
|
)
|
||||
|
Accumulated deficit
|
(211.4
|
)
|
(162.9
|
)
|
||||
|
Accumulated other comprehensive loss
|
(152.2
|
)
|
(124.4
|
)
|
||||
|
Quad’s shareholders’ equity
|
442.5
|
|
522.4
|
|
||||
|
Noncontrolling interests
|
17.7
|
|
—
|
|
||||
|
Total shareholders’ equity and noncontrolling interests
|
460.2
|
|
522.4
|
|
||||
|
Total liabilities and shareholders’ equity
|
$
|
2,469.1
|
|
$
|
2,452.4
|
|
||
See accompanying Notes to Consolidated Financial Statements.
84
QUAD/GRAPHICS, INC.
CONSOLIDATED STATEMENTS OF CASH FLOWS
(in millions)
|
Year Ended December 31,
|
|||||||||||
|
2018
|
2017
|
2016
|
|||||||||
|
OPERATING ACTIVITIES
|
|||||||||||
|
Net earnings
|
$
|
7.9
|
|
$
|
107.2
|
|
$
|
44.9
|
|
||
|
Adjustments to reconcile net earnings to net cash provided by operating activities:
|
|||||||||||
|
Depreciation and amortization
|
230.7
|
|
232.5
|
|
277.1
|
|
|||||
|
Employee stock ownership plan contribution
|
22.3
|
|
—
|
|
—
|
|
|||||
|
Impairment charges
|
26.5
|
|
12.0
|
|
26.8
|
|
|||||
|
Amortization of debt issuance costs and original issue discount
|
3.5
|
|
3.5
|
|
4.2
|
|
|||||
|
Loss (gain) on debt extinguishment
|
—
|
|
2.6
|
|
(14.1
|
)
|
|||||
|
Stock-based compensation
|
15.6
|
|
16.4
|
|
15.2
|
|
|||||
|
Gain on the sale or disposal of property, plant and equipment
|
(17.8
|
)
|
(6.9
|
)
|
(9.0
|
)
|
|||||
|
Loss on the sale of a business
|
—
|
|
7.7
|
|
—
|
|
|||||
|
Gain from property insurance claims
|
(18.3
|
)
|
(5.0
|
)
|
—
|
|
|||||
|
Settlement loss on pension benefit plans
|
—
|
|
0.8
|
|
7.0
|
|
|||||
|
Deferred income taxes
|
(14.5
|
)
|
(22.5
|
)
|
(26.6
|
)
|
|||||
|
Equity in (earnings) loss of unconsolidated entity
|
(1.0
|
)
|
—
|
|
1.4
|
|
|||||
|
Changes in operating assets and liabilities—net of acquisitions:
|
|||||||||||
|
Receivables
|
49.4
|
|
8.7
|
|
84.8
|
|
|||||
|
Inventories
|
(54.3
|
)
|
13.1
|
|
12.7
|
|
|||||
|
Prepaid expenses and other current assets
|
1.7
|
|
3.8
|
|
(18.0
|
)
|
|||||
|
Accounts payable and accrued liabilities
|
23.2
|
|
9.9
|
|
(16.1
|
)
|
|||||
|
Other
|
(14.3
|
)
|
(39.8
|
)
|
(36.7
|
)
|
|||||
|
Net cash provided by operating activities
|
260.6
|
|
344.0
|
|
353.6
|
|
|||||
|
INVESTING ACTIVITIES
|
|||||||||||
|
Purchases of property, plant and equipment
|
(96.3
|
)
|
(85.9
|
)
|
(106.1
|
)
|
|||||
|
Cost investment in unconsolidated entities
|
—
|
|
—
|
|
(9.9
|
)
|
|||||
|
Proceeds from the sale of property, plant and equipment
|
32.7
|
|
23.9
|
|
25.9
|
|
|||||
|
Proceeds from the sale of a business
|
—
|
|
14.1
|
|
—
|
|
|||||
|
Proceeds from property insurance claims
|
14.5
|
|
8.0
|
|
—
|
|
|||||
|
Proceeds from the sale of investments
|
—
|
|
—
|
|
1.3
|
|
|||||
|
Loan to an unconsolidated entity
|
—
|
|
(7.3
|
)
|
—
|
|
|||||
|
Acquisition of businesses—net of cash acquired (Note 3)
|
(71.4
|
)
|
—
|
|
—
|
|
|||||
|
Net cash used in investing activities
|
(120.5
|
)
|
(47.2
|
)
|
(88.8
|
)
|
|||||
|
FINANCING ACTIVITIES
|
|||||||||||
|
Proceeds from issuance of long-term debt
|
7.8
|
|
375.0
|
|
19.7
|
|
|||||
|
Payments of long-term debt
|
(33.2
|
)
|
(522.9
|
)
|
(192.0
|
)
|
|||||
|
Payments of capital lease obligations
|
(6.3
|
)
|
(7.6
|
)
|
(9.5
|
)
|
|||||
|
Borrowings on revolving credit facilities
|
2,563.7
|
|
718.5
|
|
871.9
|
|
|||||
|
Payments on revolving credit facilities
|
(2,561.1
|
)
|
(736.0
|
)
|
(918.0
|
)
|
|||||
|
Payments of debt issuance costs and financing fees
|
—
|
|
(4.7
|
)
|
(0.1
|
)
|
|||||
|
Purchases of treasury stock
|
(36.7
|
)
|
(3.8
|
)
|
(8.8
|
)
|
|||||
|
Proceeds from stock options exercised
|
4.2
|
|
2.6
|
|
30.3
|
|
|||||
|
Equity awards redeemed to pay employees' tax obligations
|
(9.0
|
)
|
(6.0
|
)
|
(1.4
|
)
|
|||||
|
Payment of cash dividends
|
(62.9
|
)
|
(62.5
|
)
|
(61.1
|
)
|
|||||
|
Other financing activities
|
—
|
|
(4.3
|
)
|
(0.3
|
)
|
|||||
|
Net cash used in financing activities
|
(133.5
|
)
|
(251.7
|
)
|
(269.3
|
)
|
|||||
|
Effect of exchange rates on cash and cash equivalents
|
(1.5
|
)
|
0.1
|
|
(0.6
|
)
|
|||||
|
Net increase (decrease) in cash and cash equivalents
|
5.1
|
|
45.2
|
|
(5.1
|
)
|
|||||
|
Cash and cash equivalents at beginning of year
|
64.4
|
|
19.2
|
|
24.3
|
|
|||||
|
Cash and cash equivalents at end of year
|
$
|
69.5
|
|
$
|
64.4
|
|
$
|
19.2
|
|
||
See accompanying Notes to Consolidated Financial Statements.
85
QUAD/GRAPHICS, INC.
CONSOLIDATED STATEMENTS OF SHAREHOLDERS’ EQUITY
(in millions)
|
Common Stock
|
Additional
Paid-in
Capital
|
Treasury Stock
|
Accumulated
Deficit
|
Accumulated
Other
Comprehensive
Loss
|
Quad’s Shareholders’
Equity
|
Noncontrolling
Interests
|
|||||||||||||||||||||||||||
|
Shares
|
Amount
|
Shares
|
Amount
|
||||||||||||||||||||||||||||||
|
Balance at January 1, 2016
|
55.5
|
|
$
|
1.4
|
|
$
|
956.7
|
|
(5.9
|
)
|
$
|
(193.6
|
)
|
$
|
(188.1
|
)
|
$
|
(152.5
|
)
|
$
|
423.9
|
|
$
|
—
|
|
||||||||
|
Net earnings
|
—
|
|
—
|
|
—
|
|
—
|
|
—
|
|
44.9
|
|
—
|
|
44.9
|
|
—
|
|
|||||||||||||||
|
Foreign currency translation adjustments
|
—
|
|
—
|
|
—
|
|
—
|
|
—
|
|
—
|
|
(3.9
|
)
|
(3.9
|
)
|
—
|
|
|||||||||||||||
|
Pension benefit plan liability adjustments, net of tax
|
—
|
|
—
|
|
—
|
|
—
|
|
—
|
|
—
|
|
3.8
|
|
3.8
|
|
—
|
|
|||||||||||||||
|
Cash dividends declared ($1.20 per share)
|
—
|
|
—
|
|
—
|
|
—
|
|
—
|
|
(63.2
|
)
|
—
|
|
(63.2
|
)
|
—
|
|
|||||||||||||||
|
Stock-based compensation
|
—
|
|
—
|
|
15.2
|
|
—
|
|
—
|
|
—
|
|
—
|
|
15.2
|
|
—
|
|
|||||||||||||||
|
Purchases of treasury stock
|
—
|
|
—
|
|
—
|
|
(1.1
|
)
|
(8.8
|
)
|
—
|
|
—
|
|
(8.8
|
)
|
—
|
|
|||||||||||||||
|
Stock options exercised
|
—
|
|
—
|
|
(13.3
|
)
|
1.6
|
|
43.6
|
|
—
|
|
—
|
|
30.3
|
|
—
|
|
|||||||||||||||
|
Issuance of share-based awards, net of other activity
|
—
|
|
—
|
|
(46.2
|
)
|
1.4
|
|
46.2
|
|
—
|
|
—
|
|
—
|
|
—
|
|
|||||||||||||||
|
Issuance of shares for settlement of MEPPs liability
|
—
|
|
—
|
|
—
|
|
—
|
|
0.7
|
|
—
|
|
—
|
|
0.7
|
|
—
|
|
|||||||||||||||
|
Equity awards redeemed to pay employees’ tax obligations
|
—
|
|
—
|
|
—
|
|
(0.1
|
)
|
(1.4
|
)
|
—
|
|
—
|
|
(1.4
|
)
|
—
|
|
|||||||||||||||
|
Balance at December 31, 2016
|
55.5
|
|
$
|
1.4
|
|
$
|
912.4
|
|
(4.1
|
)
|
$
|
(113.3
|
)
|
$
|
(206.4
|
)
|
$
|
(152.6
|
)
|
$
|
441.5
|
|
$
|
—
|
|
||||||||
|
Net earnings
|
—
|
|
—
|
|
—
|
|
—
|
|
—
|
|
107.2
|
|
—
|
|
107.2
|
|
—
|
|
|||||||||||||||
|
Foreign currency translation adjustments
|
—
|
|
—
|
|
—
|
|
—
|
|
—
|
|
—
|
|
14.9
|
|
14.9
|
|
—
|
|
|||||||||||||||
|
Pension benefit plan liability adjustments, net of tax
|
—
|
|
—
|
|
—
|
|
—
|
|
—
|
|
—
|
|
12.0
|
|
12.0
|
|
—
|
|
|||||||||||||||
|
Interest rate swap adjustments, net of tax
|
—
|
|
—
|
|
—
|
|
—
|
|
—
|
|
—
|
|
1.3
|
|
1.3
|
|
—
|
|
|||||||||||||||
|
Cash dividends declared ($1.20 per share)
|
—
|
|
—
|
|
—
|
|
—
|
|
—
|
|
(63.7
|
)
|
—
|
|
(63.7
|
)
|
—
|
|
|||||||||||||||
|
Stock-based compensation
|
—
|
|
—
|
|
16.4
|
|
—
|
|
—
|
|
—
|
|
—
|
|
16.4
|
|
—
|
|
|||||||||||||||
|
Purchases of treasury stock
|
—
|
|
—
|
|
—
|
|
(0.2
|
)
|
(3.8
|
)
|
—
|
|
—
|
|
(3.8
|
)
|
—
|
|
|||||||||||||||
|
Stock options exercised
|
—
|
|
—
|
|
(1.7
|
)
|
0.2
|
|
4.3
|
|
—
|
|
—
|
|
2.6
|
|
—
|
|
|||||||||||||||
|
Issuance of share-based awards, net of other activity
|
—
|
|
—
|
|
(24.1
|
)
|
0.9
|
|
24.1
|
|
—
|
|
—
|
|
—
|
|
—
|
|
|||||||||||||||
|
Cancellation of class B treasury shares (Note 18)
|
(1.2
|
)
|
—
|
|
(41.9
|
)
|
1.2
|
|
41.9
|
|
—
|
|
—
|
|
—
|
|
—
|
|
|||||||||||||||
|
Equity awards redeemed to pay employees’ tax obligations
|
—
|
|
—
|
|
—
|
|
(0.3
|
)
|
(6.0
|
)
|
—
|
|
—
|
|
(6.0
|
)
|
—
|
|
|||||||||||||||
|
Balance at December 31, 2017
|
54.3
|
|
$
|
1.4
|
|
$
|
861.1
|
|
(2.3
|
)
|
$
|
(52.8
|
)
|
$
|
(162.9
|
)
|
$
|
(124.4
|
)
|
$
|
522.4
|
|
$
|
—
|
|
||||||||
|
Accumulated deficit transition adjustment for adoption of Topic 606 (Note 2)
|
—
|
|
—
|
|
—
|
|
—
|
|
—
|
|
3.2
|
|
—
|
|
3.2
|
|
—
|
|
|||||||||||||||
|
Accumulated deficit transition adjustment for adoption of ASU 2018-02 (see Note 19)
|
—
|
|
—
|
|
—
|
|
—
|
|
—
|
|
2.9
|
|
(2.9
|
)
|
—
|
|
—
|
|
|||||||||||||||
|
Balance at January 1, 2018
|
54.3
|
|
$
|
1.4
|
|
$
|
861.1
|
|
(2.3
|
)
|
$
|
(52.8
|
)
|
$
|
(156.8
|
)
|
$
|
(127.3
|
)
|
$
|
525.6
|
|
$
|
—
|
|
||||||||
|
Net earnings (loss)
|
—
|
|
—
|
|
—
|
|
—
|
|
—
|
|
8.5
|
|
—
|
|
8.5
|
|
(0.6
|
)
|
|||||||||||||||
|
Consolidation of Rise
|
—
|
|
—
|
|
—
|
|
—
|
|
—
|
|
—
|
|
—
|
|
—
|
|
18.3
|
|
|||||||||||||||
|
Foreign currency translation adjustments
|
—
|
|
—
|
|
—
|
|
—
|
|
—
|
|
—
|
|
(13.0
|
)
|
(13.0
|
)
|
—
|
|
|||||||||||||||
|
Pension benefit plan liability adjustments, net of tax
|
—
|
|
—
|
|
—
|
|
—
|
|
—
|
|
—
|
|
(13.6
|
)
|
(13.6
|
)
|
—
|
|
|||||||||||||||
|
Interest rate swap adjustments, net of tax
|
—
|
|
—
|
|
—
|
|
—
|
|
—
|
|
—
|
|
1.7
|
|
1.7
|
|
—
|
|
|||||||||||||||
|
Cash dividends declared ($1.20 per share)
|
—
|
|
—
|
|
—
|
|
—
|
|
—
|
|
(63.1
|
)
|
—
|
|
(63.1
|
)
|
—
|
|
|||||||||||||||
|
Stock-based compensation
|
—
|
|
—
|
|
15.6
|
|
—
|
|
—
|
|
—
|
|
—
|
|
15.6
|
|
—
|
|
|||||||||||||||
|
Employee stock ownership plan contribution
|
—
|
|
—
|
|
—
|
|
1.0
|
|
22.3
|
|
—
|
|
—
|
|
22.3
|
|
—
|
|
|||||||||||||||
|
Purchases of treasury stock
|
—
|
|
—
|
|
—
|
|
(1.9
|
)
|
(36.7
|
)
|
—
|
|
—
|
|
(36.7
|
)
|
—
|
|
|||||||||||||||
|
Stock options exercised
|
—
|
|
—
|
|
(3.3
|
)
|
0.3
|
|
7.5
|
|
—
|
|
—
|
|
4.2
|
|
—
|
|
|||||||||||||||
|
Issuance of share-based awards, net of other activity
|
—
|
|
—
|
|
(12.1
|
)
|
0.6
|
|
12.1
|
|
—
|
|
—
|
|
—
|
|
—
|
|
|||||||||||||||
|
Equity awards redeemed to pay employees’ tax obligations
|
—
|
|
—
|
|
—
|
|
(0.4
|
)
|
(9.0
|
)
|
—
|
|
—
|
|
(9.0
|
)
|
—
|
|
|||||||||||||||
|
Balance at December 31, 2018
|
54.3
|
|
$
|
1.4
|
|
$
|
861.3
|
|
(2.7
|
)
|
$
|
(56.6
|
)
|
$
|
(211.4
|
)
|
$
|
(152.2
|
)
|
$
|
442.5
|
|
$
|
17.7
|
|
||||||||
See accompanying Notes to Consolidated Financial Statements.
86
QUAD/GRAPHICS, INC.
NOTES TO CONSOLIDATED FINANCIAL STATEMENTS
(In millions, except share and per share data and unless otherwise indicated)
Note 1
.
Basis of Presentation and Summary of Significant Accounting Policies
Nature of Operations
—As a worldwide marketing solutions partner dedicated to creating a better way, Quad uses its data-driven, integrated marketing platform to help clients reduce complexity, increase efficiency and enhance marketing spend effectiveness. Quad provides its clients with unmatched scale for client on-site services and expanded subject expertise in marketing strategy, creative solutions, media solutions and marketing management services. With a client-centric approach, that drives its expanded offering, combined with leading-edge technology and single-source simplicity, the Company believes it has the resources and knowledge to help a wide variety of clients in multiple vertical industries, including retail, publishing and healthcare.
The Company operates primarily in the commercial print portion of the printing industry as a printer of retail inserts, publications, catalogs, special interest publications, journals, direct mail, books, directories, in-store marketing and promotion, packaging, newspapers, custom print products, other commercial and specialty printed products and global paper procurement. The Company’s products and services for a variety of industries are sold primarily throughout North America, South America and Europe. In addition, the Company strategically sources packaging product manufacturing over multiple end markets in Central America and Asia.
Principles of Consolidation and Basis of Presentation
—The accompanying consolidated financial statements include the accounts of the Company and its wholly-owned and majority-owned controlled subsidiaries and have been prepared in accordance with
GAAP
. The results of operations and accounts of businesses acquired are included in the consolidated financial statements from the dates of acquisition (see
Note 3
, “
Acquisitions and Strategic Investments
”).
Investments in entities where the Company has both the ability to exert significant influence but not control and an ownership interest of
50%
or less but more than
20%
are accounted for using the equity method of accounting. Investments in entities where the Company does not exert significant influence or control and has an ownership interest of less than
20%
are accounted for using the cost method of accounting. Intercompany transactions and balances have been eliminated in consolidation.
Foreign Operations
—Assets and liabilities denominated in foreign currencies are translated into United States dollars at the exchange rate existing at the respective balance sheet dates. Income and expense items are translated at the average rates during the respective periods. Translation adjustments resulting from fluctuations in exchange rates are recorded as a separate component of accumulated other comprehensive income (loss) on the consolidated statements of shareholders’ equity, while transaction gains and losses are recorded in selling, general and administrative expenses on the consolidated statements of operations. Foreign exchange transactions resulted in losses of
$1.6 million
during the year ended
December 31, 2018
, gains of
$1.5 million
during the year ended
December 31, 2017
, and losses of
$6.0 million
during the year ended
December 31, 2016
.
The Company had a
49%
interest in
Plural
, a commercial printer based in São Paulo, Brazil, as of
December 31, 2018
. The Company accounts for this entity using the equity method of accounting. The Company’s equity in the (earnings) loss of Plural’s operations was recorded in equity in (earnings) loss of unconsolidated entity in the Company’s consolidated statements of operations, and was included within the International segment. Distributions received from equity method investees follow the nature of the distribution approach, where each distribution is evaluated on the basis of the source of the payment and is classified as either operating cash inflows or investing cash inflows. The Company reviews its equity method investment regularly for indicators of other than temporary impairment. Quad had no other significant unconsolidated entities as of
December 31, 2018
.
87
QUAD/GRAPHICS, INC.
NOTES TO CONSOLIDATED FINANCIAL STATEMENTS
(In millions, except share and per share data and unless otherwise indicated)
Use of Estimates
—The preparation of consolidated financial statements requires the use of management’s estimates and assumptions that affect the reported assets and liabilities, disclosure of contingent assets and liabilities at the date of the consolidated financial statements and the reported amounts of revenue and expenses during the reporting periods. Actual results could differ from these estimates. Estimates are used when accounting for items and matters including, but not limited to: allowances for doubtful accounts, inventory obsolescence, asset valuations and useful lives, pension and postretirement benefits, self-insurance reserves, stock-based compensation, taxes, restructuring and other provisions and contingencies.
Revenue Recognition
—The Company recognizes its products and services revenue based on when the transfer of control passes to the customer or when the service is completed and accepted by the customer. Under agreements with certain customers, products may be stored by the Company for future delivery. In these situations, the Company may receive warehouse management fees for the services it provides. Product returns are not significant because the products are customized; however, the Company accrues for the estimated amount of customer allowances at the time of sale based on historical experience and known trends.
Revenue from services is recognized as services are performed. Revenues related to the Company’s imaging operations, which include digital content management, photography, color services and page production, are recognized in accordance with the terms of the contract, typically upon completion of the performed service and acceptance by the customer. Revenues related to the Company’s logistics operations, which includes the delivery of printed material, are recognized upon completion of services.
Certain revenues earned by the Company require judgment to determine if revenue should be recorded gross as a principal or net of related costs as an agent. Billings for third-party shipping and handling costs, primarily in the Company’s logistics operations, and out-of-pocket expenses are recorded gross in net sales and cost of sales in the consolidated statements of operations. Many of the Company’s operations process materials, primarily paper, that may be supplied directly by customers or may be purchased by the Company and sold to customers. No revenue is recognized for customer-supplied paper. Revenues for Company-supplied paper are recognized on a gross basis.
On January 1, 2018, the Company adopted
Accounting Standards Update 2014-09, “Revenue from Contracts with Customers”
(“
Topic 606
”), which provides revised guidance on recognizing revenue from contracts with customers. The Company adopted Topic 606 using the modified retrospective approach and applied the guidance to those contracts which were not completed as of January 1, 2018. This means that Topic 606 has been applied to the 2018 financial statements and disclosures going forward, but that prior period financial statements and disclosures reflect the revenue recognition standard of Topic 605, Revenue from Contracts with Customers. See
Note 2
, “
Revenue Recognition
,” for additional accounting policy and transition disclosures.
Byproduct Recoveries
—The Company presents byproduct recoveries as a reduction of cost of sales–products in the consolidated statements of operations. Classification of byproduct recoveries as a reduction of cost of sales aligns the proceeds from byproduct recoveries with the corresponding manufacturing costs.
Financial Instruments
—The Company uses derivative financial instruments for the purpose of hedging interest rate, commodity and foreign exchange exposures that exist as part of ongoing business operations, including interest rate swap agreements, natural gas forward purchase contracts and foreign exchange contracts. As a policy, the Company does not engage in speculative or leveraged transactions, nor does the Company hold or issue financial instruments for trading purposes.
88
QUAD/GRAPHICS, INC.
NOTES TO CONSOLIDATED FINANCIAL STATEMENTS
(In millions, except share and per share data and unless otherwise indicated)
Derivative instruments are recorded on the consolidated balance sheets as either assets or liabilities measured at their fair value. If the derivative is designated as a fair value hedge, the changes in the fair value of the derivative and of the hedged item attributable to the hedged risk are recognized in earnings. If the derivative is designated as a cash flow hedge, the effective portion of the changes in the fair value of the derivative are recorded as a component of accumulated other comprehensive income (loss) and recognized in the consolidated statements of operations when the hedged item affects earnings.
The ineffective portions of the changes in the fair value of hedges are insignificant and recognized in earnings. Cash flows from derivatives that are accounted for as cash flow or fair value hedges are included in the consolidated statements of cash flows in the same category as the item being hedged.
Fair Value Measurement
—The Company applies fair value accounting for all assets and liabilities that are recognized or disclosed at fair value in its consolidated financial statements on a recurring basis. Fair value represents the amount that would be received from selling an asset or paid to transfer a liability in an orderly transaction between market participants at the measurement date. When determining the fair value measurements for assets and liabilities that are required to be recorded at fair value, the Company considers the principal or most advantageous market and the market-based risk measurements or assumptions that market participants would use in pricing the asset or liability. See
Note 14
, “
Financial Instruments and Fair Value Measurements
,” for further discussion.
Research and Development
—Research and development costs related to the development of new products or the adaptation of existing products are expensed as incurred, included in cost of sales and totaled
$3.6 million
,
$9.0 million
and
$9.3 million
during the years ended
December 31, 2018
,
2017
and
2016
, respectively.
Cash and Cash Equivalents and Restricted Cash
—The Company considers all highly liquid investments with original maturities of
three
months or less to be cash equivalents.
Receivables
—Receivables are stated net of allowances for doubtful accounts.
No
single customer comprised more than
5%
of the Company’s consolidated net sales in
2018
,
2017
or
2016
, or
5%
of the Company’s consolidated receivables as of
December 31, 2018
or
2017
. Specific customer provisions are made when a review of significant outstanding amounts, utilizing information about customer creditworthiness and current economic trends, indicates that collection is doubtful. In addition, provisions are made at differing rates, based upon the age of the receivable and the Company’s historical collection experience. Accounts that are deemed uncollectible are written off when all reasonable collection efforts have been exhausted. See
Note 6
, “
Receivables
,” for further discussion on the transactions affecting the allowances for doubtful accounts.
Inventories
—Inventories include material, labor, and plant overhead and are stated at the lower of cost or net realizable value. At
December 31, 2018
and
2017
, all inventories were valued using the first-in, first-out (“
FIFO
”) method. See
Note 7
, “
Inventories
,” for the components of the Company’s inventories.
89
QUAD/GRAPHICS, INC.
NOTES TO CONSOLIDATED FINANCIAL STATEMENTS
(In millions, except share and per share data and unless otherwise indicated)
Property, Plant and Equipment
—Property, plant and equipment are recorded at cost, and are depreciated over the estimated useful lives of the assets using the straight-line method for financial reporting purposes. See
Note 8
, “
Property, Plant and Equipment
,” for the components of the Company’s property, plant and equipment. Major improvements that extend the useful lives of existing assets are capitalized and charged to the asset accounts. Repairs and maintenance, which do not significantly improve or extend the useful lives of the respective assets, are expensed as incurred. Leasehold improvements are depreciated over the shorter of the lease term or the estimated useful life of the respective asset. When an asset is retired or disposed, the associated costs and accumulated depreciation are eliminated, and the resulting gain or loss is recognized in the Company’s consolidated statements of operations.
|
Asset Category
|
Range of Useful Lives
|
|
|
Buildings
|
10 to 40 Years
|
|
|
Machinery and equipment
|
3 to 15 Years
|
|
|
Other
|
3 to 10 Years
|
|
Other Intangible Assets
—Identifiable intangible assets are recognized apart from goodwill and are amortized over their estimated useful lives.
Impairment of Long-Lived and Other Intangible Assets
—The Company evaluates long-lived assets and other intangible assets (of which the most significant are property, plant and equipment and customer relationship intangible assets) whenever events and circumstances have occurred that indicate the carrying value of an asset may not be recoverable. Determining whether impairment has occurred typically requires various estimates and assumptions, including determining which cash flows are directly related to the potentially impaired asset, the useful life over which cash flows will occur, their amount and the asset’s residual value, if any. In turn, assessing whether there is an impairment loss requires a determination of recoverability, which is generally estimated by the ability to recover the balance of the assets from expected future operating cash flows on an undiscounted basis. If impairment is determined to exist, any related impairment loss is calculated based on the difference in the fair value and carrying value of the asset.
Goodwill
—When applicable, goodwill is reviewed annually for impairment as of October 31, or more frequently if events or changes in circumstances indicate that it is more likely than not that the fair value of a reporting unit is below its carrying value. In performing this analysis, the Company compares each reporting unit’s fair value to its carrying value. The fair value is estimated based on comparable company market valuations and/or expected future discounted cash flows to be generated by the reporting unit. If the carrying value exceeds the reporting unit’s fair value, an impairment loss would be charged to operations in the period identified. See
Note 5
, “
Goodwill and Other Intangible Assets
,” for further discussion.
Income Taxes
—The Company accounts for income taxes under the asset and liability method, which requires the recognition of deferred tax assets and liabilities for the expected future tax consequences of items reported in the financial statements. Under this method, deferred tax assets and liabilities are measured based on the differences between the financial statement and tax basis of assets and liabilities using enacted tax rates in effect for the year in which the differences are expected to reverse. The effect of a change in tax rates on deferred tax assets and liabilities is recognized in income in the period that includes the effective date of enactment.
90
QUAD/GRAPHICS, INC.
NOTES TO CONSOLIDATED FINANCIAL STATEMENTS
(In millions, except share and per share data and unless otherwise indicated)
The Company records net deferred tax assets to the extent the Company believes these assets will more likely than not be realized. This determination is based upon all available positive and negative evidence, including future reversals of existing taxable temporary differences, projected future taxable income, tax planning strategies, and recent financial operations. If the Company determines that a deferred income tax asset will not be fully realized in the future, then a valuation allowance is established or increased to reflect the amount at which the asset will more likely than not be realized, which would increase the Company’s provision for income taxes. In a period after a valuation allowance has been established, if the Company determines the related deferred income tax assets will be realized in the future in excess of their net recorded amount, then an adjustment to reduce the related valuation allowance will be made, which would reduce the Company’s provision for income taxes.
The Company is regularly audited by foreign and domestic tax authorities. These audits occasionally result in proposed assessments where the ultimate resolution might result in the Company owing additional taxes, including in some cases, penalties and interest. The Company recognizes a tax position in its consolidated financial statements when it is more likely than not that the position would be sustained upon examination by tax authorities. This recognized tax position is then measured at the largest amount of benefit that is more likely than not of being recognized upon ultimate settlement. The Company recognizes interest and penalties related to unrecognized tax benefits in income tax expense.
The determination of the Company’s worldwide tax provision and related tax assets and liabilities requires the use of significant judgment in estimating the impact of uncertainties in the application of GAAP and the interpretation of complex tax laws. In the ordinary course of business, there are transactions and calculations where the final tax outcome is uncertain. Where fair market value is required to measure a tax asset or liability for GAAP purposes, the Company periodically obtains independent, third party assistance to validate that such value is determined in conformity with Internal Revenue Service fair market value guidelines. While the Company believes it has the appropriate support for the positions taken, certain positions may be successfully challenged by taxing authorities. Resolution of these uncertainties in a manner inconsistent with management’s expectations could have a material impact on the Company’s financial condition and operating results. The Company applies the provisions of the authoritative guidance on accounting for uncertain tax positions to determine the appropriate amount of tax benefits to be recognized with respect to uncertain tax positions. The determination of the Company’s worldwide tax provision includes the impact of any changes to the amount of tax benefits recognized with respect to uncertain tax positions. See
Note 13
, “
Income Taxes
,” for further discussion.
Pension Plans
—The Company assumed certain frozen underfunded defined benefit pension plans as part of the 2010 World Color Press acquisition. Pension plan costs are determined using actuarial methods and are funded through contributions. The Company records amounts relating to its pension plans based on calculations which include various actuarial assumptions including discount rates, assumed rates of return, and mortality. The Company reviews its actuarial assumptions on an annual basis and modifies the assumptions based on current rates and trends when it is appropriate to do so. The effects of modifications are recognized immediately on the consolidated balance sheets, but are generally amortized into operating income over future periods, with the deferred amount recorded in accumulated other comprehensive loss on the consolidated balance sheets. The Company believes that the assumptions utilized in recording its obligations under its plans are reasonable based on its experience, market conditions and input from its actuaries and investment advisors. For the purposes of calculating the expected return on plan assets, those assets are valued at fair value. When an event gives rise to both a curtailment and a settlement, the curtailment is accounted for prior to the settlement. The Company’s measurement date to measure the defined benefit plan assets and the projected benefit obligation is
December 31
.
On January 1, 2018, the Company adopted
ASU 2017-07
, which provides revised guidance on how to present the components of net pension income in the statement of operations. The Company has adopted
ASU 2017-07
retrospectively and has utilized the practical expedient that permits the use of the amounts disclosed in previous filings for net pension income as the estimation basis for the presentation of the prior comparative periods. There are
no
service costs associated with the Company's pension plans due to their frozen status.
91
QUAD/GRAPHICS, INC.
NOTES TO CONSOLIDATED FINANCIAL STATEMENTS
(In millions, except share and per share data and unless otherwise indicated)
The Company has previously participated in
MEPPs
as a result of the acquisition of World Color Press. Due to the significant underfunded status of the
MEPPs
, the Company has withdrawn from all significant
MEPPs
and replaced these union sponsored “promise to pay in the future” defined benefit plans with a Company sponsored “pay as you go” defined contribution plan, which is historically the form of retirement benefit provided to Quad’s employees. As a result of the decision to withdraw, the Company recorded an estimated withdrawal liability for the MEPPs as part of the World Color Press purchase price allocation process based on information received from the
MEPPs
’ trustees. The estimated withdrawal liability is updated based on significant events, such as potential new information from the litigation proceedings with the
MEPPs
, until the final withdrawal liability is determined. See
Note 15
, “
Employee Retirement Plans
,” for further discussion.
Stock-Based Compensation
—The Company recognizes stock-based compensation expense over the vesting period for all stock-based awards made to employees and directors based on the fair value of the instrument at the time of grant. See
Note 17
, “
Equity Incentive Programs
,” for further discussion.
Accumulated Other Comprehensive Income (Loss)
—Accumulated other comprehensive income (loss) consists primarily of unrecognized actuarial gains and losses and prior service costs for pension plans, foreign currency translation adjustments and interest rate swap adjustments, and is presented in the consolidated statements of shareholders’ equity. See
Note 19
, “
Accumulated Other Comprehensive Loss
,” for further discussion.
Supplemental Cash Flow Information
—The following table summarizes certain supplemental cash flow information for the years ended
December 31, 2018
,
2017
and
2016
:
|
2018
|
2017
|
2016
|
|||||||||
|
Interest paid, net of amounts capitalized
|
$
|
60.5
|
|
$
|
57.8
|
|
$
|
65.9
|
|
||
|
Income taxes paid
|
12.5
|
|
6.5
|
|
34.0
|
|
|||||
|
Non-cash capital lease additions (see Note 12)
|
2.4
|
|
0.5
|
|
21.0
|
|
|||||
|
Acquisitions of businesses (see Note 3):
|
|||||||||||
|
Fair value of assets acquired, net of cash
|
124.9
|
|
—
|
|
—
|
|
|||||
|
Liabilities assumed
|
(89.8
|
)
|
—
|
|
—
|
|
|||||
|
Goodwill
|
54.6
|
|
—
|
|
—
|
|
|||||
|
Noncontrolling interests
|
(18.3
|
)
|
—
|
|
—
|
|
|||||
|
Acquisition of businesses—net of cash acquired
|
$
|
71.4
|
|
$
|
—
|
|
$
|
—
|
|
||
92
QUAD/GRAPHICS, INC.
NOTES TO CONSOLIDATED FINANCIAL STATEMENTS
(In millions, except share and per share data and unless otherwise indicated)
Note 2
.
Revenue Recognition
The Company recognizes its products and services revenue based on when the transfer of control passes to the customer or when the service is completed and accepted by the customer.
The effects of the adjustments to the consolidated balance sheet as of December 31, 2017, for the modified retrospective adoption of Topic 606, were as follows:
|
December 31, 2017
As Reported |
Topic 606 Adjustments
|
Opening Balance at
January 1, 2018
|
|||||||||
|
Prepaid expenses and other current assets
|
$
|
45.1
|
|
$
|
2.3
|
|
$
|
47.4
|
|
||
|
Other long-term assets
|
119.3
|
|
2.0
|
|
121.3
|
|
|||||
|
Deferred income taxes
|
41.9
|
|
1.1
|
|
43.0
|
|
|||||
|
Accumulated deficit
|
(162.9
|
)
|
3.2
|
|
(159.7
|
)
|
|||||
The adoption of Topic 606 did not have a material effect on the consolidated financial statements. In adopting Topic 606, the timing of recognition changed for certain variable consideration paid to customers and costs to obtain contracts with customers.
93
QUAD/GRAPHICS, INC.
NOTES TO CONSOLIDATED FINANCIAL STATEMENTS
(In millions, except share and per share data and unless otherwise indicated)
Revenue Disaggregation
The following table provides information about disaggregated revenue by the Company’s operating segments and major products and services offerings for the years ended
December 31, 2018
,
2017
and
2016
:
|
United States Print
and Related Services |
International
|
Total
|
|||||||||
|
Year ended December 31, 2018
|
|||||||||||
|
Catalog, publications, retail inserts, books and directories
|
$
|
2,391.1
|
|
$
|
337.6
|
|
$
|
2,728.7
|
|
||
|
Direct mail and other printed products
|
605.3
|
|
30.5
|
|
635.8
|
|
|||||
|
Other
|
27.4
|
|
0.4
|
|
27.8
|
|
|||||
|
Total Products
|
3,023.8
|
|
368.5
|
|
3,392.3
|
|
|||||
|
Logistics services
|
429.0
|
|
18.6
|
|
447.6
|
|
|||||
|
Imaging, marketing services and other services
|
353.8
|
|
—
|
|
353.8
|
|
|||||
|
Total Services
|
782.8
|
|
18.6
|
|
801.4
|
|
|||||
|
Total Net Sales
|
$
|
3,806.6
|
|
$
|
387.1
|
|
$
|
4,193.7
|
|
||
|
Year ended December 31, 2017
|
|||||||||||
|
Catalog, publications, retail inserts, books and directories
|
$
|
2,485.9
|
|
$
|
338.8
|
|
$
|
2,824.7
|
|
||
|
Direct mail and other printed products
|
614.4
|
|
32.4
|
|
646.8
|
|
|||||
|
Other
|
56.6
|
|
0.9
|
|
57.5
|
|
|||||
|
Total Products
|
3,156.9
|
|
372.1
|
|
3,529.0
|
|
|||||
|
Logistics services
|
398.9
|
|
19.2
|
|
418.1
|
|
|||||
|
Imaging, marketing services and other services
|
184.3
|
|
—
|
|
184.3
|
|
|||||
|
Total Services
|
583.2
|
|
19.2
|
|
602.4
|
|
|||||
|
Total Net Sales
|
$
|
3,740.1
|
|
$
|
391.3
|
|
$
|
4,131.4
|
|
||
|
Year ended December 31, 2016
|
|||||||||||
|
Catalog, publications, retail inserts, books and directories
|
$
|
2,662.6
|
|
$
|
351.7
|
|
$
|
3,014.3
|
|
||
|
Direct mail and other printed products
|
616.6
|
|
29.6
|
|
646.2
|
|
|||||
|
Other
|
55.9
|
|
0.7
|
|
56.6
|
|
|||||
|
Total Products
|
3,335.1
|
|
382.0
|
|
3,717.1
|
|
|||||
|
Logistics services
|
406.8
|
|
20.5
|
|
427.3
|
|
|||||
|
Imaging, marketing services and other services
|
185.1
|
|
—
|
|
185.1
|
|
|||||
|
Total Services
|
591.9
|
|
20.5
|
|
612.4
|
|
|||||
|
Total Net Sales
|
$
|
3,927.0
|
|
$
|
402.5
|
|
$
|
4,329.5
|
|
||
Nature of Products and Services
The products offering is predominantly comprised of the Company’s print operations which includes retail inserts, publications, catalogs, special interest publications, journals, direct mail, books, directories, in-store marketing and promotion, packaging, newspapers, custom print products, other commercial and specialty printed products and global paper procurement.
94
QUAD/GRAPHICS, INC.
NOTES TO CONSOLIDATED FINANCIAL STATEMENTS
(In millions, except share and per share data and unless otherwise indicated)
The Company considers its logistic operations as services, which include the delivery of printed material. The Services offering also includes revenues related to the Company’s imaging operations, which include digital content management, photography, color services, page production, marketing services, media planning and placement, facilities management and medical services.
Performance Obligations
At contract inception, the Company assesses the products and services promised in its contracts with customers and identifies performance obligations for each promise to transfer to the customer a product or service that is distinct. To identify the performance obligations, the Company considers the goods or services promised in the contract regardless of whether they are explicitly stated or are implied by customary business practices. The Company determined that the following distinct products and services represent separate performance obligations:
•
Pre-Press Services
•
Print
•
Other Services
For Pre-Press and Other Services, the Company recognizes revenue at point-in-time upon completion of the performed service and acceptance by the customer. The Company considers transfer of control to occur once the service is performed as the Company has right to payment and the customer has legal title and risk and reward of ownership.
The Company recognizes its Print revenues upon transfer of title and the passage of risk of loss, which is point-in-time upon shipment to the customer, and when there is a reasonable assurance as to collectability. Revenues related to the Company’s logistics operations, which includes the delivery of printed material, are included in the Print performance obligation and are also recognized at point-in-time as services are completed. Under agreements with certain customers, products may be stored by the Company for future delivery. In these situations, the Company may receive warehouse management fees for the services it provides. Revenue from warehouse management fees was immaterial for the
years ended
December 31, 2018
,
2017
and
2016
.
Certain revenues earned by the Company require judgment to determine if revenue should be recorded gross as principal or net of related costs as an agent. Billings for third-party shipping and handling costs, primarily in the Company’s logistics operations, and out-of-pocket expenses are recorded gross in net sales and cost of sales in the consolidated statements of operations. Many of the Company’s operations process materials, primarily paper, that may be supplied directly by customers or may be purchased by the Company and sold to customers. No revenue is recognized for customer-supplied paper. Revenues for the Company-supplied paper are recognized on a gross basis. In some cases, the Company will print items that are mailed to consumers and bill the customer for postage. In these cases, the Company is acting as an agent and billings are recorded on a net basis in net sales.
Significant Payment Terms
Payment terms and conditions for contracts with customers vary. The Company typically offers standard terms of net 30 days. It is not the Company’s standard business practice to offer extended payment terms longer than one year. The Company may offer cash discounts or prepayment and extended terms depending on certain facts and circumstances. As such, when the timing of the Company’s delivery of products and services differs from the timing of payment, the Company will record either a contract asset or a contract liability.
95
QUAD/GRAPHICS, INC.
NOTES TO CONSOLIDATED FINANCIAL STATEMENTS
(In millions, except share and per share data and unless otherwise indicated)
Variable Consideration
When evaluating the transaction price, the Company analyzes on a contract by contract basis all applicable variable considerations and non-cash consideration and also performs a constraint analysis. The nature of the Company’s contracts give rise to variable consideration, including, volume rebates, credits, discounts, and other similar items that generally decrease the transaction price. These variable amounts generally are credited to the customer, based on achieving certain levels of sales activity, when contracts are signed, or making payments within specific terms.
Product returns are not significant because the products are customized; however, the Company accrues for the estimated amount of customer allowances at the time of sale based on historical experience and known trends.
When the transaction price requires allocation to multiple performance obligations, the Company uses the estimated stand-alone selling prices using the adjusted market assessment approach.
Costs to Obtain Contracts
In accordance with Topic 606, the Company capitalizes certain sales incentives of the sales compensation packages for costs that are directly attributed to being awarded a customer contract or renewal and would not have been incurred had the contract not been obtained. The Company also defers certain contract acquisition costs paid to the customer at contract inception. Costs to obtain contracts with a duration of less than one year are expensed as incurred. For all contract costs with contracts over one year, the Company amortizes the costs to obtain contracts on a straight-line basis over the estimated life of the contract and reviews quarterly for impairment. At
January 1, 2018
, the Company had
$23.5 million
in contract costs for contracts that were not completed as of that date. For the
year ended
December 31, 2018
, the Company incurred additional contract costs of
$7.5 million
, amortized
$9.3 million
, and consequently, the balance of contract costs were
$21.7 million
as of
December 31, 2018
.
Practical Expedients
The Company has elected to apply the following practical expedients allowed under Topic 606:
|
•
|
For certain performance obligations related to print contracts, the Company has elected not to disclose the value of unsatisfied performance obligations for the following: (1) contracts that have an original expected length of one year or less; (2) contracts where revenue is recognized as invoiced; or (3) contracts with variable consideration related to unsatisfied performance obligations. The Company had approximately
$469.7 million
in volume commitments in contracts that extend beyond one year as of
December 31, 2018
. The Company expects to recognize approximately
38%
of these volume commitments in contracts as revenue by the end of 2019, an additional
32%
by the end of 2021, and the balance thereafter.
|
|
•
|
The Company expenses costs to obtain contracts as incurred when the contract duration is less than one year.
|
|
•
|
The transaction amount is not adjusted for a significant financing component as the period between transfer of the products or services and payment is less than one year.
|
|
•
|
The Company accounts for shipping and handling activities, which includes postage, that occur after control of the related products or services transfers to the customer as fulfillment activities and are therefore recognized at time of shipping.
|
|
•
|
The Company excludes from its transaction price any amounts collected from customers for sales taxes.
|
96
QUAD/GRAPHICS, INC.
NOTES TO CONSOLIDATED FINANCIAL STATEMENTS
(In millions, except share and per share data and unless otherwise indicated)
Note 3
.
Acquisitions and Strategic Investments
2018 Ivie & Associates, LLC Acquisition
The Company completed the acquisition of
Ivie
on February 21, 2018, for
$90.0 million
cash paid, which is subject to a potential earn-out of up to an additional
$16.0 million
, to the extent that certain financial metrics are achieved post-integration. Ivie is headquartered in Flower Mound, Texas and provides a full array of marketing services, including creative and production services, studio services, sourcing, procurement, staff enhancement, media services, public relations, digital services, technology solutions and project management for many leading brands throughout the world. The purchase price of
$105.4 million
includes
$13.6 million
of acquired cash and an estimated
$15.4 million
of future cash payments related to the acquisition. Included in the purchase price allocation are
$79.6 million
of identifiable other intangible assets, which are amortized over their estimated useful lives, ranging from
three
to
eight years
, and
$28.3 million
of goodwill, of which
$26.4 million
is deductible for tax purposes. The final allocation of the purchase price was based on valuations performed to determine the fair value of the net assets as of the acquisition date. The net assets acquired, excluding acquired cash, were classified as Level 3 in the valuation hierarchy (see
Note 14
, “
Financial Instruments and Fair Value Measurements
,” for the definition of Level 3 inputs). Ivie’s operations are included in the United States Print and Related Services segment.
2018 Investment in Rise Interactive and Analytics, LLC
On
March 14, 2018
, the Company increased its equity position in
Rise
from
19%
to
57%
for the conversion of
$9.3 million
of loans to equity ownership and
$8.7 million
cash paid. The Company had historically accounted for Rise as a cost method investment.
Rise
is a digital marketing agency headquartered in Chicago, Illinois, that specializes in digital media, analytics and customer experience, and helps enterprise marketers see, shape, and act on opportunities in digital media. The Company has consolidated the results of
Rise
as of the date the Company obtained controlling financial interest in
Rise
and accounts for the
43%
portion of
Rise
’s results not owned by the Company as noncontrolling interest in the consolidated financial statements. The fair value of the assets and liabilities of, and noncontrolling interest in,
Rise
is estimated to be
$48.5 million
, including
$13.7 million
of acquired cash. Also included in the fair value allocation are
$23.1 million
of identifiable other intangible assets, which are amortized over their estimated useful lives, ranging from
five
to
six years
, and
$26.3 million
of goodwill, which is not deductible for tax purposes. The final allocation of the purchase price was based on valuations performed to determine the fair value of the net assets as of the acquisition date. The net assets acquired, excluding acquired cash, were classified as Level 3 in the valuation hierarchy (see
Note 14
, “
Financial Instruments and Fair Value Measurements
,” for the definition of Level 3 inputs).
Rise
’s operations are included in the United States Print and Related Services segment.
Note 4
.
Restructuring, Impairment and Transaction-Related Charges
The Company recorded restructuring, impairment and transaction-related charges for the years ended
December 31, 2018
,
2017
and
2016
, as follows:
|
2018
|
2017
|
2016
|
|||||||||
|
Employee termination charges
|
$
|
23.0
|
|
$
|
26.9
|
|
$
|
12.9
|
|
||
|
Impairment charges
|
26.5
|
|
12.0
|
|
26.8
|
|
|||||
|
Transaction-related charges
|
8.2
|
|
3.1
|
|
2.2
|
|
|||||
|
Integration costs
|
1.3
|
|
—
|
|
0.1
|
|
|||||
|
Other restructuring charges
|
44.6
|
|
18.4
|
|
31.6
|
|
|||||
|
Total
|
$
|
103.6
|
|
$
|
60.4
|
|
$
|
73.6
|
|
||
97
QUAD/GRAPHICS, INC.
NOTES TO CONSOLIDATED FINANCIAL STATEMENTS
(In millions, except share and per share data and unless otherwise indicated)
The costs related to these activities have been recorded on the consolidated statements of operations as restructuring, impairment and transaction-related charges. See
Note 20
, “
Segment Information
,” for restructuring, impairment and transaction-related charges by segment.
Restructuring Charges
The Company began a restructuring program in 2010 related to eliminating excess manufacturing capacity and properly aligning its cost structure. The Company has announced a total of
43
plant closures and has reduced headcount by approximately
13,000
employees since 2010.
The Company announced the closures of the Hazleton, Pennsylvania and Franklin, Kentucky plants during the year ended
December 31, 2018
. The Company recorded the following charges as a result of plant closures and other restructuring programs for the year ended
December 31, 2018
:
|
•
|
Employee termination charges of
$23.0 million
were recorded as a result of workforce reductions through facility consolidations and separation programs.
|
|
•
|
Integration costs of
$1.3 million
were recorded, primarily related to the integration of acquired companies.
|
|
•
|
Other restructuring charges of
$44.6 million
were recorded, which consisted of the following: (1) a
$32.1 million
increase to the Company’s MEPPs withdrawal liability; (2)
$12.9 million
of vacant facility carrying costs, (3)
$10.0 million
in charges for certain legal matters and customer contract penalties related to the Company’s operations in Peru; (4)
$4.0 million
of lease exit charges, (5)
$1.5 million
in charges from foreign currency losses as a result of the economy in Argentina being classified as highly inflationary; and (6)
$1.4 million
of equipment and infrastructure removal costs from closed plants. Other restructuring charges were presented net of
$17.3 million
in gains on the sale of facilities, including a
$7.5 million
gain from the sale of the Taunton, Massachusetts Book plant, a
$7.0 million
gain from the sale of the Dallas, Texas plant and a
$2.2 million
gain from the sale of the San Ixhuatepec, Mexico plant.
|
The Company announced the closures of the Waseca, Minnesota; Columbus, Ohio; Taunton, Massachusetts; and Dallas, Texas plants during the year ended
December 31, 2017
. The Company recorded the following charges as a result of plant closures and other restructuring programs for the year ended
December 31, 2017
:
|
•
|
Employee termination charges of
$26.9 million
were recorded as a result of workforce reductions through facility consolidations and separation programs.
|
|
•
|
Other restructuring charges of
$18.4 million
were recorded, which consisted of the following: (1)
$14.2 million
of vacant facility carrying costs, (2) a
$6.7 million
loss on the sale of a business; (3)
$3.9 million
of lease exit charges, including the lease termination of the Huntington Beach, California and Manassas, Virginia plants; and (4)
$1.9 million
of equipment and infrastructure removal costs from closed plants. Other restructuring charges were presented net of
$7.1 million
in gains from the sale of the Atglen, Pennsylvania; Dickson, Tennessee; Lenexa, Kansas; East Greenville, Pennsylvania and Marengo, Iowa facilities; and a
$1.2 million
gain from settlements with vendors through bankruptcy proceedings for the Company's
Argentina Subsidiaries
.
|
98
QUAD/GRAPHICS, INC.
NOTES TO CONSOLIDATED FINANCIAL STATEMENTS
(In millions, except share and per share data and unless otherwise indicated)
The Company announced the closures of the Atglen, Pennsylvania; Huntington Beach, California; Lenexa, Kansas; Manassas, Virginia; Monroe, New Jersey; and York, Pennsylvania plants during the year ended
December 31, 2016
. The Company recorded the following charges as a result of plant closures and other restructuring programs for the year ended
December 31, 2016
:
|
•
|
Employee termination charges of
$12.9 million
were recorded as a result of workforce reductions through facility consolidations and separation programs.
|
|
•
|
Integration costs of
$0.1 million
were recorded, primarily related to preparing existing facilities to meet new production requirements resulting from work transferring from closed plants, as well as other costs related to the integration of acquired companies.
|
|
•
|
Other restructuring charges of
$31.6 million
were recorded, which consisted of the following: (1)
$13.6 million
of vacant facility carrying costs; (2) an
$11.2 million
increase to the Company’s MEPPs withdrawal liability; (3)
$4.9 million
of equipment and infrastructure removal costs from closed plants; and (4)
$4.5 million
of lease exit charges, including the lease termination of the Pittsburg, California facility. Other restructuring charges were presented net of the following: (1) a
$1.3 million
gain from settlements with vendors due to the Company's Argentina Subsidiaries emerging from bankruptcy during the fourth quarter of 2016 and (2) a
$1.3 million
gain on the sale of the Pilar, Argentina building.
|
The restructuring charges recorded were based on plans that have been committed to by management and were, in part, based upon management’s best estimates of future events. Changes to the estimates may require future restructuring charges and adjustments to the restructuring liabilities. The Company expects to incur additional restructuring charges related to these and other initiatives.
Impairment Charges
The Company recognized impairment charges of
$26.5 million
during the year ended
December 31, 2018
, consisting of the following: (1)
$16.9 million
of impairment charges primarily for machinery and equipment no longer being utilized in production as a result of facility consolidations, including Waseca, Minnesota; Hazleton, Pennsylvania; and Franklin, Kentucky; as well as other capacity and strategic reduction restructuring initiatives, including
$5.0 million
of impairment charges for machinery and equipment in Peru; and (2)
$4.6 million
of land and building impairment charges, primarily related to the Franklin, Kentucky plant closure.
The Company recognized impairment charges of
$12.0 million
during the year ended
December 31, 2017
, consisting of the following: (1)
$6.7 million
of impairment charges primarily for machinery and equipment no longer being utilized in production as a result of facility consolidations, including Waseca, Minnesota; Columbus, Ohio; and Taunton, Massachusetts, as well as other capacity and strategic reduction restructuring initiatives; and (2)
$5.3 million
of land and building impairment charges related to the Waseca, Minnesota and Taunton, Massachusetts plant closures.
The Company recognized impairment charges of
$26.8 million
during the year ended
December 31, 2016
, consisting of the following: (1)
$12.1 million
of land and building impairment charges related to the Atglen, Pennsylvania plant closure; and (2)
$14.7 million
of impairment charges primarily for machinery and equipment no longer being utilized in production as a result of facility consolidations, including Atglen, Pennsylvania; Augusta, Georgia; East Greenville, Pennsylvania; Monroe, New Jersey; Woodstock, Illinois; and Queretaro, Mexico, as well as other capacity and strategic reduction restructuring activities.
99
QUAD/GRAPHICS, INC.
NOTES TO CONSOLIDATED FINANCIAL STATEMENTS
(In millions, except share and per share data and unless otherwise indicated)
The fair values of the impaired assets were determined by the Company to be Level 3 under the fair value hierarchy (see
Note 14
, “
Financial Instruments and Fair Value Measurements
,” for the definition of Level 3 inputs) and were estimated based on broker quotes, internal expertise related to current marketplace conditions and estimated future discounted cash flows. These assets were adjusted to their estimated fair values at the time of impairment. If estimated fair values subsequently decline, the carrying values of the assets are adjusted accordingly.
Transaction-Related Charges
The Company incurs transaction-related charges primarily consisting of professional service fees related to business acquisition and divestiture activities. The Company recognized transaction-related charges of
$8.2 million
,
$3.1 million
and
$2.2 million
during the years ended
December 31, 2018
,
2017
and
2016
, respectively, which includes
$6.4 million
related to the proposed acquisition of
LSC
during the year ended
December 31, 2018
, and
$1.0 million
related to the sale of a business during the year ended
December 31, 2017
. The transaction-related charges were expensed as incurred in accordance with the applicable accounting guidance on business combinations.
Restructuring Reserves
Activity impacting the Company’s restructuring reserves for the years ended
December 31, 2018
and
2017
, was as follows:
|
Employee
Termination
Charges
|
Impairment
Charges
|
Transaction-Related
Charges (Income)
|
Integration
Costs
|
Other
Restructuring
Charges
|
Total
|
||||||||||||||||||
|
Balance at January 1, 2017
|
$
|
7.6
|
|
$
|
—
|
|
$
|
0.1
|
|
$
|
1.1
|
|
$
|
10.4
|
|
$
|
19.2
|
|
|||||
|
Expense, net
|
26.9
|
|
12.0
|
|
3.1
|
|
—
|
|
18.4
|
|
60.4
|
|
|||||||||||
|
Cash payments, net
|
(19.0
|
)
|
—
|
|
(2.8
|
)
|
(0.1
|
)
|
(14.5
|
)
|
(36.4
|
)
|
|||||||||||
|
Non-cash adjustments/reclassifications
|
2.1
|
|
(12.0
|
)
|
—
|
|
(0.8
|
)
|
(3.0
|
)
|
(13.7
|
)
|
|||||||||||
|
Balance at December 31, 2017
|
$
|
17.6
|
|
$
|
—
|
|
$
|
0.4
|
|
$
|
0.2
|
|
$
|
11.3
|
|
$
|
29.5
|
|
|||||
|
Expense, net
|
23.0
|
|
26.5
|
|
8.2
|
|
1.3
|
|
44.6
|
|
103.6
|
|
|||||||||||
|
Cash payments, net
|
(28.7
|
)
|
—
|
|
(7.4
|
)
|
(1.1
|
)
|
(6.6
|
)
|
(43.8
|
)
|
|||||||||||
|
Non-cash adjustments/reclassifications
|
(2.6
|
)
|
(26.5
|
)
|
—
|
|
(0.2
|
)
|
(32.2
|
)
|
(61.5
|
)
|
|||||||||||
|
Balance at December 31, 2018
|
$
|
9.3
|
|
$
|
—
|
|
$
|
1.2
|
|
$
|
0.2
|
|
$
|
17.1
|
|
$
|
27.8
|
|
|||||
The Company’s restructuring reserves at
December 31, 2018
, included a short-term and a long-term component. The short-term portion included
$23.1 million
in accrued liabilities (see
Note 9
, “
Accrued Liabilities and Other Long-Term Liabilities
”) and
$1.8 million
in accounts payable in the consolidated balance sheets as the Company expects these reserves to be paid within the next twelve months. The long-term portion of
$2.9 million
was included in other long-term liabilities (see
Note 9
, “
Accrued Liabilities and Other Long-Term Liabilities
”) in the consolidated balance sheets.
Note 5
.
Goodwill and Other Intangible Assets
Goodwill
Goodwill represents the excess of the purchase price over the fair value of identifiable net assets acquired in a business combination. Goodwill is assigned to specific reporting units and is tested annually for impairment as of October 31, or more frequently if events or changes in circumstances indicate that it is more likely than not that the fair value of a reporting unit is below its carrying value.
100
QUAD/GRAPHICS, INC.
NOTES TO CONSOLIDATED FINANCIAL STATEMENTS
(In millions, except share and per share data and unless otherwise indicated)
No
goodwill impairment charges were recorded during the years ended
December 31, 2018
,
2017
or
2016
. The accumulated goodwill impairment losses and the carrying value of goodwill at
December 31, 2018
and
2017
, were as follows:
|
December 31, 2018
|
December 31, 2017
|
||||||||||||||||||||||
|
United States Print and Related Services
|
International
|
Total
|
United States Print and Related Services
|
International
|
Total
|
||||||||||||||||||
|
Goodwill
|
$
|
832.9
|
|
$
|
30.0
|
|
$
|
862.9
|
|
$
|
778.3
|
|
$
|
30.0
|
|
$
|
808.3
|
|
|||||
|
Accumulated goodwill impairment loss
|
(778.3
|
)
|
(30.0
|
)
|
(808.3
|
)
|
(778.3
|
)
|
(30.0
|
)
|
(808.3
|
)
|
|||||||||||
|
Goodwill, net of accumulated goodwill impairment loss
|
$
|
54.6
|
|
$
|
—
|
|
$
|
54.6
|
|
$
|
—
|
|
$
|
—
|
|
$
|
—
|
|
|||||
The Company recorded goodwill within the United States Print and Related Services segment related to acquisitions completed during the year ended December 31, 2018. Activity impacting goodwill for the year ended
December 31, 2018
, was as follows:
|
United States Print and Related
Services
|
International
|
Total
|
|||||||||
|
Balance at January 1, 2018
|
$
|
—
|
|
$
|
—
|
|
$
|
—
|
|
||
|
Ivie acquisition (see Note 3)
|
28.3
|
|
—
|
|
28.3
|
|
|||||
|
Investment in Rise (see Note 3)
|
26.3
|
|
—
|
|
26.3
|
|
|||||
|
Balance at December 31, 2018
|
$
|
54.6
|
|
$
|
—
|
|
$
|
54.6
|
|
||
Other Intangible Assets
The components of other intangible assets at
December 31, 2018
and
2017
, were as follows:
|
December 31, 2018
|
December 31, 2017
|
||||||||||||||||||||||||||
|
Weighted
Average
Amortization
Period (Years)
|
Gross
Carrying
Amount
|
Accumulated Amortization
|
Net Book
Value
|
Weighted
Average
Amortization
Period (Years)
|
Gross
Carrying
Amount
|
Accumulated
Amortization
|
Net Book
Value
|
||||||||||||||||||||
|
Finite-lived intangible assets:
|
|||||||||||||||||||||||||||
|
Trademarks, patents, licenses and agreements
|
7
|
$
|
59.8
|
|
$
|
(22.4
|
)
|
$
|
37.4
|
|
7
|
$
|
24.0
|
|
$
|
(13.5
|
)
|
$
|
10.5
|
|
|||||||
|
Capitalized software
|
5
|
15.3
|
|
(5.1
|
)
|
10.2
|
|
5
|
4.8
|
|
(4.3
|
)
|
0.5
|
|
|||||||||||||
|
Customer relationships
|
6
|
514.7
|
|
(449.7
|
)
|
65.0
|
|
6
|
460.8
|
|
(428.4
|
)
|
32.4
|
|
|||||||||||||
|
Total finite-lived intangible assets
|
$
|
589.8
|
|
$
|
(477.2
|
)
|
$
|
112.6
|
|
$
|
489.6
|
|
$
|
(446.2
|
)
|
$
|
43.4
|
|
|||||||||
101
QUAD/GRAPHICS, INC.
NOTES TO CONSOLIDATED FINANCIAL STATEMENTS
(In millions, except share and per share data and unless otherwise indicated)
During the year ended
December 31, 2018
, the gross carrying amount of other intangible assets increased primarily due to
$102.7 million
of acquired identifiable finite-lived intangible assets as discussed in
Note 3
, “
Acquisitions and Strategic Investments
.” The gross carrying amount and accumulated amortization within other intangible assets—net in the consolidated balance sheets at
December 31, 2018
, and
December 31, 2017
, differs from the value originally recorded at acquisition due to impairment charges recorded in prior years and the effects of currency fluctuations since the purchase date. Other intangible assets are evaluated for potential impairment whenever events or circumstances indicate that the carrying value may not be recoverable. There were
no
impairment charges recorded on finite-lived intangible assets for the years ended
December 31, 2018
,
2017
and
2016
.
Amortization expense for other intangible assets was
$34.4 million
,
$18.3 million
and
$50.7 million
for the years ended
December 31, 2018
,
2017
and
2016
, respectively. The following table outlines the estimated future amortization expense related to other intangible assets as of
December 31, 2018
:
|
Amortization Expense
|
|||
|
2019
|
$
|
32.5
|
|
|
2020
|
27.1
|
|
|
|
2021
|
18.8
|
|
|
|
2022
|
16.3
|
|
|
|
2023
|
12.1
|
|
|
|
2024 and thereafter
|
5.8
|
|
|
|
Total
|
$
|
112.6
|
|
Note 6
.
Receivables
Activity impacting the allowances for doubtful accounts for the years ended
December 31, 2018
,
2017
and
2016
, was as follows:
|
2018
|
2017
|
2016
|
|||||||||
|
Balance at beginning of year
|
$
|
28.9
|
|
$
|
53.5
|
|
$
|
50.1
|
|
||
|
Provisions
|
3.1
|
|
2.6
|
|
8.0
|
|
|||||
|
Write-offs
(1)
|
(4.7
|
)
|
(26.3
|
)
|
(4.0
|
)
|
|||||
|
Translation and other
|
0.3
|
|
(0.9
|
)
|
(0.6
|
)
|
|||||
|
Balance at end of year
|
$
|
27.6
|
|
$
|
28.9
|
|
$
|
53.5
|
|
||
______________________________
|
(1)
|
Write-offs primarily consisted of fully reserved receivables for the years ended
December 31, 2018
,
2017
and
2016
.
|
102
QUAD/GRAPHICS, INC.
NOTES TO CONSOLIDATED FINANCIAL STATEMENTS
(In millions, except share and per share data and unless otherwise indicated)
Note 7
.
Inventories
The components of inventories at
December 31, 2018
and
2017
, were as follows:
|
2018
|
2017
|
||||||
|
Raw materials and manufacturing supplies
|
$
|
170.8
|
|
$
|
128.7
|
|
|
|
Work in process
|
48.9
|
|
43.6
|
|
|||
|
Finished goods
|
80.9
|
|
74.2
|
|
|||
|
Total
|
$
|
300.6
|
|
$
|
246.5
|
|
|
Note 8
.
Property, Plant and Equipment
The components of property, plant and equipment at
December 31, 2018
and
2017
, were as follows:
|
2018
|
2017
|
||||||
|
Land
|
$
|
115.3
|
|
$
|
122.5
|
|
|
|
Buildings
|
908.5
|
|
924.5
|
|
|||
|
Machinery and equipment
|
3,549.1
|
|
3,617.1
|
|
|||
|
Other
(1)
|
178.6
|
|
197.5
|
|
|||
|
Construction in progress
|
42.0
|
|
33.0
|
|
|||
|
Property, plant and equipment—gross
|
4,793.5
|
|
4,894.6
|
|
|||
|
Less: accumulated depreciation
|
(3,536.1
|
)
|
(3,517.0
|
)
|
|||
|
Property, plant and equipment—net
|
$
|
1,257.4
|
|
$
|
1,377.6
|
|
|
______________________________
|
(1)
|
Other consists of computer equipment, vehicles, furniture and fixtures, leasehold improvements and communication related equipment.
|
The Company recorded impairment charges of
$26.5 million
,
$12.0 million
and
$26.8 million
during the years ended
December 31, 2018
,
2017
and
2016
, respectively, to reduce the carrying amounts of certain property, plant and equipment no longer utilized in production, or due to other capacity and strategic reduction restructuring initiatives, to fair value (see
Note 4
, “
Restructuring, Impairment and Transaction-Related Charges
,” for further discussion on impairment charges).
The Company recognized depreciation expense of
$196.3 million
,
$214.2 million
and
$226.4 million
for the years ended
December 31, 2018
,
2017
and
2016
, respectively.
Assets Held for Sale
The Company considered certain closed facilities for held for sale classification in the consolidated balance sheets. Assets held for sale are carried at the lesser of original cost or fair value, less the estimated costs to sell. There were
no
assets held for sale as of
December 31, 2018
, or as of
December 31, 2017
.
103
QUAD/GRAPHICS, INC.
NOTES TO CONSOLIDATED FINANCIAL STATEMENTS
(In millions, except share and per share data and unless otherwise indicated)
Note 9
.
Accrued Liabilities and Other Long-Term Liabilities
The components of accrued and other long-term liabilities at
December 31, 2018
and
2017
, were as follows:
|
December 31, 2018
|
December 31, 2017
|
||||||||||||||||||||||
|
Accrued Liabilities
|
Other
Long-Term Liabilities
|
Total
|
Accrued Liabilities
|
Other
Long-Term Liabilities
|
Total
|
||||||||||||||||||
|
Employee-related liabilities
(1)
|
$
|
126.4
|
|
$
|
62.8
|
|
$
|
189.2
|
|
$
|
152.1
|
|
$
|
67.4
|
|
$
|
219.5
|
|
|||||
|
Single employer pension plan obligations
|
1.7
|
|
80.9
|
|
82.6
|
|
1.7
|
|
82.4
|
|
84.1
|
|
|||||||||||
|
Multiemployer pension plans – withdrawal liability
|
8.4
|
|
42.5
|
|
50.9
|
|
8.8
|
|
19.4
|
|
28.2
|
|
|||||||||||
|
Tax-related liabilities
|
29.6
|
|
8.1
|
|
37.7
|
|
29.0
|
|
18.2
|
|
47.2
|
|
|||||||||||
|
Restructuring liabilities
|
23.1
|
|
2.9
|
|
26.0
|
|
24.6
|
|
4.2
|
|
28.8
|
|
|||||||||||
|
Interest and rent liabilities
|
6.0
|
|
1.4
|
|
7.4
|
|
6.7
|
|
1.9
|
|
8.6
|
|
|||||||||||
|
Other
|
97.1
|
|
34.0
|
|
131.1
|
|
93.8
|
|
31.5
|
|
125.3
|
|
|||||||||||
|
Total
|
$
|
292.3
|
|
$
|
232.6
|
|
$
|
524.9
|
|
$
|
316.7
|
|
$
|
225.0
|
|
$
|
541.7
|
|
|||||
______________________________
|
(1)
|
Employee-related liabilities consist primarily of payroll, bonus, vacation, health and workers’ compensation.
|
Note 10
.
Commitments and Contingencies
Commitments
The Company had firm commitments of
$53.2 million
as of
December 31, 2018
, to purchase press and finishing equipment.
Litigation
The Company is named as a defendant in various lawsuits in which claims are asserted against the Company in the normal course of business. The liabilities, if any, which ultimately result from such lawsuits are not expected by management to have a material impact on the consolidated financial statements of the Company.
In April 2016, the Company self-reported to the SEC and the Department of Justice (“DOJ”) certain Foreign Corrupt Practices Act (“FCPA”) issues, and a resulting internal investigation, related to its operations managed from Peru. These operations had approximate annual sales ranging from
$95.0 million
to
$135.0 million
from the date that the Company acquired those operations in July 2010 until the date the issues were discovered. The self-reported issues were identified by the Company’s financial internal controls. The Company, under the oversight of its Audit Committee and Board of Directors, proactively initiated an investigation into this matter with the assistance of external legal counsel and external forensic accountants. Additional compliance issues arising out of the Peru subsidiary have been identified during the course of the investigation and are known to the SEC and DOJ. During the course of its internal investigation, the Company has also identified, and self-reported to the DOJ and SEC, transactions raising similar issues involving certain sales made in its Quad/Tech China operations. For the period 2011 through 2015, the approximate annual sales of these China operations ranged from
$2.0 million
to
$3.0 million
. During the course of its internal investigation, the Company has also identified and informed the Office of Foreign Assets Control (“OFAC”), the DOJ and the SEC, of certain transactions involving Cuba, and continues to investigate the propriety of such transactions under United States trade sanctions. The Peruvian antitrust authority (“INDECOPI”) currently is conducting an investigation into certain alleged past collusive activities among printers in Peru, including Quad/Graphics Peru. In connection with these matters,
104
QUAD/GRAPHICS, INC.
NOTES TO CONSOLIDATED FINANCIAL STATEMENTS
(In millions, except share and per share data and unless otherwise indicated)
the Company has made, and continues to evaluate, certain enhancements to its compliance program. The Company is fully cooperating with the OFAC, the SEC, the DOJ and INDECOPI. At this time, the Company does not anticipate any material adverse effect on its business or financial condition as a result of these matters.
Environmental Reserves
The Company is subject to various laws, regulations and government policies relating to health and safety, to the generation, storage, transportation, and disposal of hazardous substances, and to environment protection in general. The Company provides for expenses associated with environmental remediation obligations when such amounts are probable and can be reasonably estimated. Such reserves are adjusted as new information develops or as circumstances change. The environmental reserves are not discounted. The Company believes it is in compliance with such laws, regulations and government policies in all material respects. Furthermore, the Company does not anticipate that maintaining compliance with such environmental statutes will have a material impact upon the Company’s consolidated financial position.
Note 11
.
Debt
The components of long-term debt at
December 31, 2018
and
2017
, were as follows:
|
Weighted Average Interest Rate
|
2018
|
2017
|
||||||||
|
Master note and security agreement
|
7.36
|
%
|
$
|
96.2
|
|
$
|
123.6
|
|
||
|
Term loan A—$375.0 million maturing January 2021
|
3.78
|
%
|
281.3
|
|
281.3
|
|
||||
|
Term loan B—$300.0 million maturing April 2021
|
5.24
|
%
|
279.5
|
|
279.1
|
|
||||
|
Revolving credit facility—$725.0 million maturing January 2021
|
3.91
|
%
|
—
|
|
—
|
|
||||
|
Senior unsecured notes—$300.0 million maturing May 2022
|
7.00
|
%
|
243.5
|
|
243.5
|
|
||||
|
International term loans—$28.0 million
|
1.82
|
%
|
17.8
|
|
14.9
|
|
||||
|
International revolving credit facilities—$16.0 million
|
2.25
|
%
|
11.8
|
|
9.8
|
|
||||
|
Other
|
10.24
|
%
|
2.6
|
|
3.6
|
|
||||
|
Debt issuance costs
|
(7.2
|
)
|
(10.3
|
)
|
||||||
|
Total debt
|
$
|
925.5
|
|
$
|
945.5
|
|
||||
|
Less: short-term debt and current portion of long-term debt
|
(42.9
|
)
|
(42.0
|
)
|
||||||
|
Long-term debt
|
$
|
882.6
|
|
$
|
903.5
|
|
||||
Description of Debt Obligations
Master Note and Security Agreement
On September 1, 1995, and as last amended on
November 24, 2014
, Quad entered into its
Master Note and Security Agreement
. As of
December 31, 2018
, the borrowings outstanding under the
Master Note and Security Agreement
were
$96.2 million
. The senior notes under the
Master Note and Security Agreement
had a weighted average interest rate of
7.36%
at
December 31, 2018
, which is fixed to maturity, with interest payable semiannually. Principal payments commenced September 1997 and extend through
April 2031
in various tranches. The notes are collateralized by certain United States land, buildings and press and finishing equipment under the terms of the
Master Note and Security Agreement
.
105
QUAD/GRAPHICS, INC.
NOTES TO CONSOLIDATED FINANCIAL STATEMENTS
(In millions, except share and per share data and unless otherwise indicated)
The Company redeemed
$60.1 million
of its senior notes under the
Master Note and Security Agreement
, resulting in a net loss on debt extinguishment of
$0.2 million
, during the year ended December 31, 2016. All tendered senior notes under the
Master Note and Security Agreement
were canceled. The Company used cash flows from operating activities and borrowings under its revolving credit facility to fund the tender. The tender was primarily completed to reallocate debt to the lower interest rate revolving credit facility and thereby reduce interest expense based on current
LIBOR
rates.
Senior Secured Credit Facility
On
April 28, 2014
the Company entered into its
Senior Secured Credit Facility
, which includes a revolving credit facility, Term Loan A and Term Loan B. The
Senior Secured Credit Facility
was originally entered into to extend and stagger the Company’s debt maturity profile, to further diversify its capital structure and to provide more borrowing capacity to better position the Company to execute on its strategic goals. The proceeds from the
Senior Secured Credit Facility
were used to repay the Company’s previous debt financing arrangements and to fund acquisitions, as well as other general corporate purposes.
The Company completed the second amendment to the Company’s
Senior Secured Credit Facility
on
February 10, 2017
. This second amendment was completed to reduce the size of the revolving credit facility and Term Loan A and to extend the Company’s debt maturity profile while maintaining the Company’s current cost of borrowing and covenant structure. The revolving credit facility was lowered to a maximum borrowing amount of
$725.0 million
from
$850.0 million
, and the Term Loan A was lowered to an aggregate amount of
$375.0 million
from
$450.0 million
. This amendment to the
Senior Secured Credit Facility
did not have an impact on the Company’s quarterly financial covenant requirements and resulted in a loss on debt extinguishment of
$2.6 million
during the year ended December 31, 2017.
The
Senior Secured Credit Facility
consists of
three
different loan facilities. The first facility is a revolving credit facility in the amount of
$725.0 million
with a term of just under
four years
, maturing on
January 4, 2021
. The second facility is a Term Loan A in the aggregate amount of
$375.0 million
with a term of just under
four years
, maturing on
January 4, 2021
, subject to certain required amortization. The third facility is a Term Loan B in the amount of
$300.0 million
with a term of
seven years
, maturing on
April 27, 2021
, subject to certain required amortization. At
December 31, 2018
, the Company had
no
outstanding borrowings on the revolving credit facility, and had
$34.1 million
of issued letters of credit, leaving
$690.9 million
available for future borrowings.
Borrowings under the revolving credit facility and Term Loan A made under the
Senior Secured Credit Facility
at
December 31, 2018
, bear interest at
2.00%
in excess of reserve adjusted LIBOR, or
1.00%
in excess of an alternate base rate, and borrowings under the Term Loan B at
December 31, 2018
, bear interest at
3.25%
in excess of reserve adjusted LIBOR, with a LIBOR floor of
1.00%
, or
2.25%
in excess of an alternative base rate at the Company’s option. The
Senior Secured Credit Facility
is secured by substantially all of the unencumbered assets of the Company. The
Senior Secured Credit Facility
also requires the Company to provide additional collateral to the lenders in certain limited circumstances.
On
January 31, 2019
, the Company completed the third amendment to the Senior Secured Credit Facility. See
Note 24
, “
Subsequent Events
,” for further detail on this item.
106
QUAD/GRAPHICS, INC.
NOTES TO CONSOLIDATED FINANCIAL STATEMENTS
(In millions, except share and per share data and unless otherwise indicated)
Senior Unsecured Notes
The Company completed the issuance of
$300.0 million
aggregate principal amount of its
Senior Unsecured Notes
due
May 1, 2022
, on
April 28, 2014
. The Senior Unsecured Notes bear interest at
7.00%
, and interest is payable semi-annually. The
Senior Unsecured Notes
were issued to extend and stagger the Company’s debt maturity profile, further diversify its capital structure and provide more borrowing capacity to better position the Company to execute on its strategic goals. The Company received
$294.8 million
in net proceeds from the sale of the
Senior Unsecured Notes
, after deducting the initial purchasers’ discounts and commissions. The proceeds from the
Senior Unsecured Notes
were used for the same purposes detailed in the April 28, 2014 Senior Secured Credit Facility above.
The Company repurchased
$56.5 million
of its
Senior Unsecured Notes
in the open market, resulting in a net gain on debt extinguishment of
$14.3 million
, during the year ended December 31, 2016. All repurchased
Senior Unsecured Notes
were canceled. The Company used cash flows from operating activities and borrowings under its revolving credit facility to fund the repurchases. These repurchases were primarily completed to efficiently reduce debt balances and interest expense based on current
LIBOR
rates.
Each of the Company’s existing and future domestic subsidiaries that is a borrower or guarantees indebtedness under the Company’s
Senior Secured Credit Facility
or that guarantees certain of the Company’s other indebtedness or indebtedness of the Company’s restricted subsidiaries (other than intercompany indebtedness) fully and unconditionally guarantee or, in the case of future subsidiaries, will guarantee, on a joint and several basis, the
Senior Unsecured Notes
(the “
Guarantor Subsidiaries
”). All of the
Guarantor Subsidiaries
are
100%
owned by the Company.
Guarantor Subsidiaries
will be automatically released from these guarantees upon the occurrence of certain events. See
Note 22
, “
Separate Financial Information of Subsidiary Guarantors of Indebtedness
,” for further details on the
Guarantor Subsidiaries
.
International Debt Obligations
The Company has two fixed rate, Euro denominated, international term loans for purposes of financing certain capital expenditures and general business needs. The first international term loan in the amount of
$20.4 million
was entered into on
December 28, 2015
, was fully funded during 2016 and has a term of
six years
, maturing
December 28, 2021
. As of
December 31, 2018
,
$10.2 million
remained outstanding on the first international term loan at a weighted average interest rate of
1.72%
. The second international term loan in the amount of
$7.6 million
was entered into on
December 21, 2018
, bears interest at
1.96%
and has a term of
five years
, maturing on
December 31, 2023
.
The Company has
two
multicurrency international revolving credit facilities that are used for financing working capital and general business needs. The Company had
$11.8 million
of borrowings outstanding at a weighted average interest rate of
2.25%
on the international revolving credit facilities as of
December 31, 2018
, leaving
$4.2 million
available for future borrowing. The terms of the international revolving credit facilities includes certain financial covenants, a guarantee of the international revolving credit facilities by the Company and a security agreement that includes collateralizing substantially all of the Quad Europe Sp. z.o.o. assets. The first multicurrency international revolving credit facility expires on
October 31, 2019
, and bears interest at the aggregate of the Warsaw Interbank Offered Rate (“WIBOR”) plus
0.90%
for any Polish Zloty denominated borrowings, the aggregate of Euro Interbank Offered Rate (“EURIBOR”) plus
0.95%
for any Euro denominated borrowings or the aggregate of British pound sterling LIBOR plus
0.95%
for any British pound sterling denominate borrowings. The second multicurrency international revolving credit facility expires on
November 20, 2020
, and bears interest at the aggregate of WIBOR plus
0.70%
for any Polish Zloty denominated borrowings or the aggregate of EURIBOR plus
0.70%
for any Euro denominated borrowings.
107
QUAD/GRAPHICS, INC.
NOTES TO CONSOLIDATED FINANCIAL STATEMENTS
(In millions, except share and per share data and unless otherwise indicated)
Fair Value of Debt
Based upon the interest rates available to the Company for borrowings with similar terms and maturities, the fair value of the Company’s total debt was approximately
$0.9 billion
and
$1.0 billion
at
December 31, 2018
and
2017
, respectively. The fair value determination of the Company’s total debt was categorized as Level 2 in the fair value hierarchy (see
Note 14
, “
Financial Instruments and Fair Value Measurements
,” for the definition of Level 2 inputs). As of
December 31, 2018
, approximately
$2.2 billion
of the Company’s assets were pledged as security under various loans and other agreements.
Debt Issuance Costs and Original Issue Discount
Activity impacting the Company’s capitalized debt issuance costs for the
years ended
December 31, 2018
and
2017
, was as follows:
|
Capitalized Debt
Issuance Costs
|
|||
|
Balance at January 1, 2017
|
$
|
11.3
|
|
|
Debt issuance costs from February 10, 2017 debt financing amendment
|
3.2
|
|
|
|
Write off of debt issuance costs from April 28, 2014 debt financing agreement
|
(1.1
|
)
|
|
|
Amortization of debt issuance costs
|
(3.1
|
)
|
|
|
Balance at December 31, 2017
|
10.3
|
|
|
|
Amortization of debt issuance costs
|
(3.1
|
)
|
|
|
Balance at December 31, 2018
|
$
|
7.2
|
|
Activity impacting the Company’s original issue discount for the
years ended
December 31, 2018
and
2017
, was as follows:
|
Original Issue Discount
|
|||
|
Balance at January 1, 2017
|
$
|
1.8
|
|
|
Amortization of original issue discount
|
(0.4
|
)
|
|
|
Balance at December 31, 2017
|
1.4
|
|
|
|
Amortization of original issue discount
|
(0.4
|
)
|
|
|
Balance at December 31, 2018
|
$
|
1.0
|
|
Amortization expense for debt issuance costs was
$3.1 million
,
$3.1 million
and
$3.8 million
for the years ended
December 31, 2018
,
2017
and
2016
, respectively. Amortization expense for original issue discount was
$0.4 million
for the each of the years ended
December 31, 2018
,
2017
and
2016
. The debt issuance costs and original issue discount are being amortized on a straight-line basis over the
four
,
seven
and
eight
year lives of the related debt instruments.
108
QUAD/GRAPHICS, INC.
NOTES TO CONSOLIDATED FINANCIAL STATEMENTS
(In millions, except share and per share data and unless otherwise indicated)
Loss (Gain) on Debt Extinguishment
2017 Loss on Debt Extinguishment
The Company incurred
$4.7 million
in debt issuance costs in conjunction with the second amendment to the Company’s Senior Secured Credit Facility. In accordance with the accounting guidance for the treatment of debt issuance costs in a debt extinguishment, of the
$4.7 million
in new debt issuance costs,
$3.2 million
is classified as a reduction of long-term debt in the consolidated balance sheets and
$1.5 million
was expensed and is classified as loss on debt extinguishment in the consolidated statements of operations.
The loss on debt extinguishment recorded in the consolidated statements of operations for the
year ended
December 31, 2017, was comprised of the following:
|
Loss on Debt Extinguishment
|
|||
|
Debt issuance costs from April 28, 2014 debt financing arrangement
|
$
|
1.1
|
|
|
Debt issuance costs from February 10, 2017 debt financing arrangement
|
1.5
|
|
|
|
Total
|
$
|
2.6
|
|
2016 Gain on Debt Extinguishment
The Company recorded a net gain on debt extinguishment of
$14.1 million
during the year ended December 31, 2016. The
$14.1 million
was comprised of a
$14.3 million
gain incurred in conjunction with the repurchase of
$56.5 million
of the Company’s
Senior Unsecured Notes
, offset by a net loss on debt extinguishment of
$0.2 million
resulting from the redemption of
$60.1 million
of the Company’s senior notes under the Master Note and Security Agreement.
The gain on debt extinguishment recorded in the consolidated statements of operations for the
year ended
December 31, 2016, was comprised of the following:
|
Master Note and Security Agreement
|
Senior Unsecured Notes
|
Total
|
|||||||||
|
Principal amount repurchased
|
$
|
60.1
|
|
$
|
56.5
|
|
$
|
116.6
|
|
||
|
Repurchase price
|
61.2
|
|
42.5
|
|
103.7
|
|
|||||
|
Less: accrued interest paid
|
(1.2
|
)
|
(1.1
|
)
|
(2.3
|
)
|
|||||
|
Net repurchase price
|
60.0
|
|
41.4
|
|
101.4
|
|
|||||
|
Debt financing fees expensed
|
(0.1
|
)
|
—
|
|
(0.1
|
)
|
|||||
|
Debt issuance costs expensed
|
(0.2
|
)
|
(0.8
|
)
|
(1.0
|
)
|
|||||
|
Gain (loss) on debt extinguishment
|
$
|
(0.2
|
)
|
$
|
14.3
|
|
$
|
14.1
|
|
||
109
QUAD/GRAPHICS, INC.
NOTES TO CONSOLIDATED FINANCIAL STATEMENTS
(In millions, except share and per share data and unless otherwise indicated)
Covenants and Compliance
The Company’s various lending arrangements include certain financial covenants (all financial terms, numbers and ratios are as defined in the Company’s debt agreements). Among these covenants, the Company was required to maintain the following as of
December 31, 2018
:
|
•
|
Total Leverage Ratio.
On a rolling twelve-month basis, the total leverage ratio, defined as total consolidated debt to consolidated EBITDA, shall not exceed
3.75
to 1.00 (for the twelve months ended
December 31, 2018
, the Company’s total leverage ratio was
2.19
to 1.00).
|
|
•
|
Senior Secured Leverage Ratio.
On a rolling twelve-month basis, the senior secured leverage ratio, defined as senior secured debt to consolidated EBITDA, shall not exceed
3.50
to 1.00 (for the twelve months ended
December 31, 2018
, the Company’s senior secured leverage ratio was
1.63
to 1.00).
|
|
•
|
Minimum Interest Coverage Ratio.
On a rolling twelve-month basis, the minimum interest coverage ratio, defined as consolidated EBITDA to consolidated cash interest expense, shall not be less than
3.50
to 1.00 (for the twelve months ended
December 31, 2018
, the Company’s minimum interest coverage ratio was
6.23
to 1.00).
|
The indenture underlying the
Senior Unsecured Notes
contains various covenants, including, but not limited to, covenants that, subject to certain exceptions, limit the Company’s and its restricted subsidiaries’ ability to incur and/or guarantee additional debt; pay dividends, repurchase stock or make certain other restricted payments; enter into agreements limiting dividends and certain other restricted payments; prepay, redeem or repurchase subordinated debt; grant liens on assets; enter into sale and leaseback transactions; merge, consolidate, transfer or dispose of substantially all of the Company’s consolidated assets; sell, transfer or otherwise dispose of property and assets; and engage in transactions with affiliates.
In addition to those covenants, the
Senior Secured Credit Facility
also includes certain limitations on acquisitions, indebtedness, liens, dividends and repurchases of capital stock, including the following:
|
•
|
If the Company’s total leverage ratio is greater than
3.00
to 1.00 (as defined in the
Senior Secured Credit Facility
), the Company is prohibited from making greater than
$120.0 million
of annual dividend payments, capital stock repurchases and certain other payments. If the total leverage ratio is less than
3.00
to 1.00, there are no such restrictions.
|
|
•
|
If the Company’s senior secured leverage ratio is greater than
3.00
to 1.00 or the Company’s total leverage ratio is greater than
3.50
to 1.00 (these ratios as defined in the
Senior Secured Credit Facility
), the Company is prohibited from voluntarily prepaying any of the
Senior Unsecured Notes
and from voluntarily prepaying any other unsecured or subordinated indebtedness, with certain exceptions (including any mandatory prepayments on the
Senior Unsecured Notes
or any other unsecured or subordinated debt). If the senior secured leverage ratio is less than
3.00
to 1.00 and the total leverage ratio is less than
3.50
to 1.00, there are no such restrictions.
|
110
QUAD/GRAPHICS, INC.
NOTES TO CONSOLIDATED FINANCIAL STATEMENTS
(In millions, except share and per share data and unless otherwise indicated)
Estimated Principal Payments
The approximate annual principal amounts due on long-term debt, excluding
$7.2 million
for future amortization of debt issuance costs and
$1.0 million
for future amortization of original issue discount, at
December 31, 2018
, were as follows:
|
Principal Payments
|
|||
|
2019
|
$
|
41.3
|
|
|
2020
|
69.2
|
|
|
|
2021
|
548.2
|
|
|
|
2022
|
251.4
|
|
|
|
2023
|
6.7
|
|
|
|
2024 – 2028
|
13.9
|
|
|
|
2029 – 2031
|
3.0
|
|
|
|
Total
|
$
|
933.7
|
|
Note 12
.
Lease Obligations
The Company enters into various master lease agreements for press, finishing and transportation equipment. These leases provide the Company with options to purchase the related equipment at the termination value, as defined, and at various early buyout dates during the term of the lease. These leases are accounted for as capital leases on the consolidated balance sheets.
The components of capital lease assets at
December 31, 2018
and
2017
, were as follows:
|
2018
|
2017
|
||||||
|
Leased equipment—gross
|
$
|
33.4
|
|
$
|
38.0
|
|
|
|
Less: accumulated depreciation
|
(18.9
|
)
|
(19.3
|
)
|
|||
|
Leased equipment—net
|
$
|
14.5
|
|
$
|
18.7
|
|
|
The future maturities of capitalized leases at
December 31, 2018
, were as follows:
|
Future Maturities of Capitalized Leases
|
|||
|
2019
|
$
|
5.9
|
|
|
2020
|
4.9
|
|
|
|
2021
|
4.1
|
|
|
|
2022
|
2.0
|
|
|
|
2023
|
0.2
|
|
|
|
2024 and thereafter
|
—
|
|
|
|
Total minimum payments
|
17.1
|
|
|
|
Less: amounts representing interest
|
(1.7
|
)
|
|
|
Present value of minimum payments
|
15.4
|
|
|
|
Less: current portion
|
(5.1
|
)
|
|
|
Long-term capital lease obligations
|
$
|
10.3
|
|
111
QUAD/GRAPHICS, INC.
NOTES TO CONSOLIDATED FINANCIAL STATEMENTS
(In millions, except share and per share data and unless otherwise indicated)
The Company has various operating lease agreements. Future minimum rental commitments under non-cancelable leases at
December 31, 2018
, were as follows:
|
Future Minimum Rental Commitments
|
|||
|
2019
|
$
|
38.2
|
|
|
2020
|
33.4
|
|
|
|
2021
|
23.9
|
|
|
|
2022
|
17.8
|
|
|
|
2023
|
13.7
|
|
|
|
2024 and thereafter
|
31.1
|
|
|
|
Total
|
$
|
158.1
|
|
Rent expense under these operating lease agreements totaled
$38.5 million
,
$37.3 million
and
$43.7 million
during the years ended
December 31, 2018
,
2017
and
2016
, respectively.
Note 13
.
Income Taxes
Income taxes have been based on the following components of earnings (loss) before income taxes and equity in (earnings) loss of unconsolidated entity for the years ended
December 31, 2018
,
2017
and
2016
:
|
2018
|
2017
|
2016
|
|||||||||
|
United States
|
$
|
(5.8
|
)
|
$
|
65.6
|
|
$
|
48.4
|
|
||
|
Foreign
|
2.9
|
|
25.6
|
|
10.9
|
|
|||||
|
Total
|
$
|
(2.9
|
)
|
$
|
91.2
|
|
$
|
59.3
|
|
||
The components of income tax (benefit) expense for the years ended
December 31, 2018
,
2017
and
2016
, were as follows:
|
2018
|
2017
|
2016
|
|||||||||
|
Federal:
|
|||||||||||
|
Current
|
$
|
4.8
|
|
$
|
1.4
|
|
$
|
32.0
|
|
||
|
Deferred
|
(7.3
|
)
|
(5.5
|
)
|
(20.0
|
)
|
|||||
|
State:
|
|||||||||||
|
Current
|
(2.1
|
)
|
2.7
|
|
3.9
|
|
|||||
|
Deferred
|
0.4
|
|
(0.5
|
)
|
(5.3
|
)
|
|||||
|
Foreign:
|
|||||||||||
|
Current
|
2.0
|
|
2.4
|
|
3.7
|
|
|||||
|
Deferred
|
(7.6
|
)
|
(16.5
|
)
|
(1.3
|
)
|
|||||
|
Total income tax (benefit) expense
|
$
|
(9.8
|
)
|
$
|
(16.0
|
)
|
$
|
13.0
|
|
||
112
QUAD/GRAPHICS, INC.
NOTES TO CONSOLIDATED FINANCIAL STATEMENTS
(In millions, except share and per share data and unless otherwise indicated)
The following table outlines the reconciliation of differences between the Federal statutory tax rate and the Company’s income tax (benefit) expense for the years ended
December 31, 2018
,
2017
and
2016
:
|
2018
|
2017
|
2016
|
|||||||||
|
Federal statutory rate
|
$
|
(0.6
|
)
|
$
|
31.9
|
|
$
|
20.8
|
|
||
|
Adjustment to valuation allowances
|
(6.9
|
)
|
(20.0
|
)
|
1.0
|
|
|||||
|
Adjustment of uncertain tax positions
|
(3.7
|
)
|
(2.6
|
)
|
0.9
|
|
|||||
|
State taxes, net of federal benefit
|
(2.0
|
)
|
2.0
|
|
(2.1
|
)
|
|||||
|
Foreign rate differential
|
(0.8
|
)
|
(2.9
|
)
|
(4.8
|
)
|
|||||
|
Impact from foreign branches
|
2.6
|
|
7.1
|
|
3.6
|
|
|||||
|
Adjustment of deferred tax liabilities
|
1.4
|
|
(1.7
|
)
|
2.2
|
|
|||||
|
Federal rate change
|
(0.8
|
)
|
(28.8
|
)
|
—
|
|
|||||
|
Domestic production activity deduction
|
—
|
|
(0.9
|
)
|
(3.3
|
)
|
|||||
|
Loss on foreign investment
|
—
|
|
—
|
|
(4.7
|
)
|
|||||
|
Other
|
1.0
|
|
(0.1
|
)
|
(0.6
|
)
|
|||||
|
Income tax (benefit) expense
|
$
|
(9.8
|
)
|
$
|
(16.0
|
)
|
$
|
13.0
|
|
||
The
$6.9 million
adjustment to valuation allowance in 2018 primarily relates to net operating losses and deferred tax assets related to property, plant and equipment expected to be realized in the future by one of the Company’s Mexican subsidiaries based on current and projected future profitability. The
$20.0 million
adjustment to valuation allowance in 2017 primarily relates to an income tax credit utilized by the Company’s Polish subsidiaries due to sustainable profitability. The Company determined the utilization of the credit is sufficient to record a reduction in the valuation allowance in order to reflect the current net realizable value of related deferred tax assets based on estimated credit utilization through 2026, the year the credit expires.
113
QUAD/GRAPHICS, INC.
NOTES TO CONSOLIDATED FINANCIAL STATEMENTS
(In millions, except share and per share data and unless otherwise indicated)
Deferred Income Taxes
The significant deferred tax assets and liabilities as of
December 31, 2018
and
2017
, were as follows:
|
2018
|
2017
|
||||||
|
Deferred tax assets:
|
|||||||
|
Net operating loss and other tax carryforwards
|
$
|
125.1
|
|
$
|
129.6
|
|
|
|
Interest limitation
|
47.1
|
|
43.7
|
|
|||
|
Pension and workers compensation benefits
|
46.0
|
|
42.7
|
|
|||
|
Accrued compensation
|
16.6
|
|
20.2
|
|
|||
|
Accrued liabilities
|
14.1
|
|
19.3
|
|
|||
|
Goodwill and intangible assets
|
11.4
|
|
7.5
|
|
|||
|
Allowance for doubtful accounts
|
6.4
|
|
7.3
|
|
|||
|
Other
|
7.3
|
|
9.4
|
|
|||
|
Total deferred tax assets
|
274.0
|
|
279.7
|
|
|||
|
Valuation allowance
|
(115.2
|
)
|
(126.9
|
)
|
|||
|
Net deferred tax assets
|
$
|
158.8
|
|
$
|
152.8
|
|
|
|
Deferred tax liabilities:
|
|||||||
|
Property, plant and equipment
|
$
|
(153.8
|
)
|
$
|
(165.0
|
)
|
|
|
Other
|
(9.7
|
)
|
(8.5
|
)
|
|||
|
Total deferred tax liabilities
|
(163.5
|
)
|
(173.5
|
)
|
|||
|
Net deferred tax liabilities
|
$
|
(4.7
|
)
|
$
|
(20.7
|
)
|
|
The Company has recorded deferred income tax liabilities of
$32.1 million
and
$41.9 million
as of
December 31, 2018
and
2017
, respectively, which were included in deferred income taxes in the consolidated balance sheets. The Company has also recorded deferred income tax assets of
$27.4 million
and
$21.2 million
as of
December 31, 2018
and
2017
, respectively, which were included in other long-term assets in the consolidated balance sheets.
At
December 31, 2018
, the Company had the following gross amounts of tax-related carryforwards:
|
•
|
Net operating loss carryforwards of
$99.1 million
and
$501.5 million
for foreign and state, respectively. Of the foreign net operating loss carryforwards,
$30.2 million
is available without expiration, while the remainder expires through
2038
. The state net operating loss carryforwards expire in varying amounts through
2038
.
|
|
•
|
Capital loss carryforwards of
$24.6 million
and
$13.6 million
for federal and state, respectively. Of the federal capital loss carryforwards,
$6.2 million
expires in
2019
,
$1.1 million
expires in
2021
and
$17.3 million
expires in
2022
; and of the state capital loss carryforwards,
$4.6 million
expires in
2019
,
$0.5 million
expires in
2021
and
$8.5 million
expires in
2022
.
|
114
QUAD/GRAPHICS, INC.
NOTES TO CONSOLIDATED FINANCIAL STATEMENTS
(In millions, except share and per share data and unless otherwise indicated)
|
•
|
Various credit carryforwards of
$30.1 million
and
$44.1 million
for foreign and state, respectively. The foreign credit carryforward expires in
2026
. The state credit carryforwards include
$32.0 million
that is available without expiration, while the remainder expires through
2033
.
|
As of
December 31, 2018
, the Company has recorded a valuation allowance of
$115.2 million
on its consolidated balance sheet primarily related to the tax-affected amounts of the above carryforwards. The valuation allowance includes
$5.9 million
,
$53.6 million
and
$55.7 million
of federal, foreign and state deferred tax assets, respectively, that are not expected to be realized.
Uncertain Tax Positions
The following table summarizes the activity of the Company’s liability for unrecognized tax benefits at
December 31, 2018
,
2017
and
2016
:
|
2018
|
2017
|
2016
|
|||||||||
|
Balance at beginning of period
|
$
|
21.6
|
|
$
|
29.6
|
|
$
|
29.8
|
|
||
|
Additions for tax positions of the current year
|
—
|
|
2.3
|
|
0.3
|
|
|||||
|
Additions for tax positions of prior years
|
0.5
|
|
1.3
|
|
1.0
|
|
|||||
|
Reductions for tax positions of prior years
|
(0.8
|
)
|
(11.3
|
)
|
(0.7
|
)
|
|||||
|
Lapses of applicable statutes of limitations
|
(6.1
|
)
|
(0.3
|
)
|
(0.8
|
)
|
|||||
|
Settlements during the period
|
(0.8
|
)
|
—
|
|
—
|
|
|||||
|
Balance at end of period
|
$
|
14.4
|
|
$
|
21.6
|
|
$
|
29.6
|
|
||
As of
December 31, 2018
,
$14.4 million
of unrecognized tax benefits would impact the Company’s effective tax rate, if recognized. Of that amount, it is reasonably possible that
$4.6 million
of the total amount of unrecognized tax benefits will decrease within the next twelve months due to resolution of income tax audits or statute expirations.
The Company classified interest (income) expense and any related penalties (refunds) related to income tax uncertainties as a component of income tax (benefit) expense. The following table summarizes the Company’s interest (income) expense related to tax uncertainties and penalties recognized during the years ended
December 31, 2018
,
2017
and
2016
:
|
2018
|
2017
|
2016
|
|||||||||
|
Interest (income) expense
|
$
|
(2.8
|
)
|
$
|
(2.5
|
)
|
$
|
1.0
|
|
||
|
Penalties (refunds)
|
(0.4
|
)
|
0.1
|
|
—
|
|
|||||
Accrued interest and penalties related to income tax uncertainties are reported as components of other current liabilities and other long-term liabilities in the consolidated balance sheets. The following table summarizes the Company’s liabilities for accrued interest and penalties related to income tax uncertainties at
December 31, 2018
and
2017
:
|
December 31, 2018
|
December 31, 2017
|
||||||||||||||
|
Accrued interest
|
Accrued penalties
|
Accrued interest
|
Accrued penalties
|
||||||||||||
|
Other current liabilities
|
$
|
0.2
|
|
$
|
0.1
|
|
$
|
0.1
|
|
$
|
0.2
|
|
|||
|
Other long-term liabilities
|
0.3
|
|
—
|
|
3.2
|
|
0.3
|
|
|||||||
|
Total liabilities
|
$
|
0.5
|
|
$
|
0.1
|
|
$
|
3.3
|
|
$
|
0.5
|
|
|||
115
QUAD/GRAPHICS, INC.
NOTES TO CONSOLIDATED FINANCIAL STATEMENTS
(In millions, except share and per share data and unless otherwise indicated)
The Company has tax years from
2014
through
2018
that remain open and subject to examination by the Internal Revenue Service. Tax years from
2013
through
2018
remain open and subject to examination in the Company’s various major state jurisdictions within the United States.
On December 22, 2017, the U.S. government enacted comprehensive tax legislation commonly referred to as the
Tax Act
. The Tax Act makes broad and complex changes to the U.S. tax code, including, but not limited to, (1) reducing the U.S. federal corporate tax rate from 35 percent to 21 percent; (2) requiring companies to pay a one-time transition tax on certain unrepatriated earnings of foreign subsidiaries; (3) generally eliminating U.S. federal income taxes on dividends from foreign subsidiaries; (4) requiring a current inclusion in U.S. federal taxable income of certain earnings of controlled foreign corporations; (5) creating a new limitation on deductible interest expense; (6) creating the base erosion anti-abuse tax, a new minimum tax; (7) the repeal of the domestic production activity deduction; and (8) bonus depreciation that will allow for full expensing of qualified property.
The SEC staff issued Staff Accounting Bulletin No. 118 (“SAB 118”), which provides guidance on accounting for the tax effects of the Tax Act. SAB 118 provides a measurement period that should not extend beyond one year from the Tax Act enactment date for companies to complete the accounting under ASC 740. In accordance with SAB 118, a company must reflect the income tax effects of those aspects of the Tax Act for which the accounting under ASC 740 is complete. To the extent that a company’s accounting for certain income tax effects of the Tax Act is incomplete, but it is able to determine a reasonable estimate, it must record a provisional estimate in the financial statements. If a company cannot determine a provisional estimate to be included in the financial statements, it should continue to apply ASC 740 on the basis of the provisions of the tax laws that were in effect immediately before the enactment of the Tax Act.
The Company applied the guidance in SAB 118 when accounting for the enactment-date effects of the Tax Act in 2017 and throughout 2018. As of
December 31, 2017
, the Company had not completed the accounting for all of the enactment-date income tax effects of the Tax Act for the following aspects: (1) remeasurement of deferred tax assets and liabilities due to the reduced U.S. federal corporate rate; (2) deemed repatriation transition tax; and (3) global intangible low-tax income (“GILTI”). As of
December 31, 2018
, the Company has completed the accounting for all the enactment-date income tax effects of the Tax Act. As discussed further below, during the year ended
December 31, 2018
, the Company recognized adjustments of
$0.8 million
to the preliminary provisional amount recorded at
December 31, 2017
, and included these adjustments as a component of income tax expense.
Reduction of U.S. federal corporate rate
: The Tax Act reduced the corporate tax rate to 21 percent, effective
January 1, 2018
. The Company had recorded a provisional decrease of
$23.7 million
to its deferred tax liabilities, with a corresponding net adjustment to deferred income tax expense. Upon refinement of the calculation during the year ended
December 31, 2018
, the Company increased the provisional adjustment by
$0.8 million
to
$24.5 million
, which was included as a component of income tax expense.
Deemed Repatriation Transition Tax
: The Deemed Repatriation Transition Tax (“Transition Tax”) is a tax on previously untaxed accumulated and current earnings and profits (“E&P”) of certain foreign subsidiaries. To determine the amount of the Transition Tax, the Company must determine, in addition to other factors, the amount of post-1986 E&P of the relevant subsidiaries, as well as the amount of non-U.S. income taxes paid on such earnings. After further analysis, the Company concluded that its Transition Tax was zero based on the aggregate post-1986 foreign earnings and profits deficit of the relevant subsidiaries. Therefore, there was no change from the initial estimate as of December 31, 2017.
Global intangible low taxed income:
The Tax Act creates a new requirement that certain income (
i.e.
GILTI) earned by controlled foreign corporations (“CFCs”) must be included currently in the gross income of the CFCs’ U.S. shareholder. GILTI is the excess of the shareholder’s “net CFC tested income” over the net deemed tangible income return, which is currently defined as the excess of (1) ten percent of the aggregate of the U.S. shareholder’s pro rata share
116
QUAD/GRAPHICS, INC.
NOTES TO CONSOLIDATED FINANCIAL STATEMENTS
(In millions, except share and per share data and unless otherwise indicated)
of the qualified business asset investment of each CFC with respect to which it is a U.S. shareholder over (2) the amount of certain interest expense taken into account in the determination of net CFC-tested income.
Under
GAAP
, the Company is allowed to make an accounting policy choice of either (1) treating taxes due on future U.S. inclusions in taxable income related to GILTI as current-period expense when incurred (the “period cost method”) or (2) factoring such amounts into a company’s measurement of its deferred taxes (the “deferred method”). The Company has elected to account for GILTI as a period cost. Accordingly, this income has been included as a component of current income tax expense for the year ended
December 31, 2018
.
As a result of the Tax Act, historical earnings in certain foreign subsidiaries became subject to the U.S. Transition Tax, as described above. However, an actual repatriation from these subsidiaries could be subject to additional foreign and U.S. state income taxes. The Company considers its foreign earnings to be indefinitely invested. Accordingly, the Company does not provide for, nor expect to incur, any significant, additional taxes which could become payable upon repatriation of such amounts.
Note 14
.
Financial Instruments and Fair Value Measurements
Certain assets and liabilities are required to be recorded at fair value on a recurring basis, while other assets and liabilities are recorded at fair value on a nonrecurring basis, generally as a result of acquisitions or impairment charges. Fair value is determined based on the exchange price that would be received for an asset or paid to transfer a liability (an exit price) in the principal or most advantageous market for the asset or liability in an orderly transaction between market participants. GAAP also classifies the inputs used to measure fair value into the following hierarchy:
|
Level 1:
|
Quoted prices in active markets for identical assets or liabilities.
|
|
Level 2:
|
Quoted prices in active markets for similar assets or liabilities, quoted prices for identical or similar assets or liabilities in markets that are not active, or inputs other than quoted prices that are observable for the asset or liability.
|
|
Level 3:
|
Unobservable inputs for the asset or liability. There were no Level 3 recurring measurements of assets or liabilities as of
December 31, 2018
.
|
Interest Rate Swap
The Company entered into a
$250.0 million
interest rate swap on February 7, 2017. The swap was designated as a cash flow hedge as its purpose is to reduce the variability of cash flows from interest payments related to a portion of the Company’s variable-rate debt. The swap effectively converts
$250.0 million
of the Company’s variable-rate debt based on one-month LIBOR to a fixed rate of
3.89%
(including a
2.00%
spread on underlying debt at
December 31, 2018
). The variable interest rate resets monthly and the swap is a
five
year arrangement, maturing on February 28, 2022.
The Company classifies the interest rate swap as Level 2 because the inputs into the valuation model are observable or can be derived or corroborated utilizing observable market data at commonly quoted intervals. The interest rate swap was highly effective as of
December 31, 2018
; therefore, the increase in fair value of
$2.2 million
during the year ended
December 31, 2018
is included in accumulated other comprehensive loss in the consolidated balance sheets and is shown as a change in other comprehensive income in the consolidated statements of comprehensive income (loss).
No
amount of ineffectiveness has been recorded into earnings related to this cash flow hedge. The interest rate swap was classified as an asset, with fair values of
$4.3 million
and
$2.1 million
as of
December 31, 2018
and
2017
, respectively, and was recorded in prepaid expenses and other current assets in the consolidated balance sheets.
117
QUAD/GRAPHICS, INC.
NOTES TO CONSOLIDATED FINANCIAL STATEMENTS
(In millions, except share and per share data and unless otherwise indicated)
The company received a net interest payment totaling
$0.2 million
of interest income during the year ended
December 31, 2018
, and made a net interest payment totaling
$1.6 million
of interest expense during the year ended
December 31, 2017
. The net interest payments have been recognized as an adjustment to interest expense in the consolidated statements of operations.
Foreign Exchange Contracts
The Company has operations in countries that have transactions outside their functional currencies and periodically enters into foreign exchange contracts. These contracts are used to hedge the net exposures of changes in foreign currency exchange rates and are designated as either cash flow hedges or fair value hedges. Gains or losses on net foreign currency hedges are intended to offset losses or gains on the underlying net exposures in an effort to reduce the earnings volatility resulting from fluctuating foreign currency exchange rates. There were
no
open foreign currency exchange contracts as of
December 31, 2018
.
Natural Gas Forward Contracts
The Company periodically enters into natural gas forward purchase contracts to hedge against increases in commodity costs. The Company’s commodity contracts qualified for the exception related to normal purchases and sales during the years ended
December 31, 2018
and
2017
, as the Company takes delivery in the normal course of business.
Debt
The Company measures fair value on its debt instruments using interest rates available to the Company for borrowings with similar terms and maturities and is categorized as Level 2. See
Note 11
, “
Debt
,” for the fair value of the Company’s debt as of
December 31, 2018
.
Nonrecurring Fair Value Measurements
In addition to assets and liabilities that are recorded at fair value on a recurring basis, the Company is required to record certain assets and liabilities at fair value on a nonrecurring basis, generally as a result of acquisitions or the remeasurement of assets resulting in impairment charges. See
Note 3
, “
Acquisitions and Strategic Investments
,” for further discussion on acquisitions. See
Note 4
, “
Restructuring, Impairment and Transaction-Related Charges
,” and
Note 8
, “
Property, Plant and Equipment
,” for further discussion on impairment charges recorded as a result of the remeasurement of certain long-lived assets.
Other Estimated Fair Value Measurements
The Company records the fair value of its forward contracts and pension plan assets on a recurring basis. The fair value of cash and cash equivalents, receivables, inventories, restricted cash, accounts payable and accrued liabilities approximate their carrying values as of
December 31, 2018
and
2017
. See
Note 15
, “
Employee Retirement Plans
,” for the details of Level 1 and Level 2 inputs related to employee retirement plans.
118
QUAD/GRAPHICS, INC.
NOTES TO CONSOLIDATED FINANCIAL STATEMENTS
(In millions, except share and per share data and unless otherwise indicated)
Note 15
.
Employee Retirement Plans
Defined Contribution Plans
The Quad/Graphics, Inc. Diversified Plan is comprised of participant-directed 401(k) contributions, Company match and profit sharing contributions, with total participant assets of
$1.8 billion
as of
December 31, 2018
. Company 401(k) matching contributions were
$8.5 million
,
$7.2 million
and
$13.3 million
for the years ended
December 31, 2018
,
2017
and
2016
, respectively. The
ESOP
holds profit sharing contributions of Company stock, which are made at the discretion of the Company’s Board of Directors. On
February 16, 2018
, the Company’s Board of Directors authorized the issuance of
1,006,061
shares of Company class A common stock from treasury to the Company’s
ESOP
, at a stock price of
$22.18
per share for a total value of
$22.3 million
. There were
no
profit sharing contributions for the years ended
December 31, 2017
and
2016
.
Defined Benefit Plans
The Company assumed various funded and unfunded frozen pension plans for a portion of its full-time employees in the United States as part of the acquisition of World Color Press in 2010. Benefits are generally based upon years of service and compensation. These plans are funded in conformity with the applicable government regulations. The Company funds at least the minimum amount required for all qualified plans using actuarial cost methods and assumptions acceptable under government regulations.
The components of net pension income for the years ended
December 31, 2018
,
2017
and
2016
, were as follows:
|
Pension Benefits
|
|||||||||||
|
2018
|
2017
|
2016
|
|||||||||
|
Interest cost
|
$
|
(16.0
|
)
|
$
|
(17.3
|
)
|
$
|
(18.1
|
)
|
||
|
Expected return on plan assets
|
28.4
|
|
27.7
|
|
30.2
|
|
|||||
|
Net periodic benefit income
|
12.4
|
|
10.4
|
|
12.1
|
|
|||||
|
Settlement charge
|
—
|
|
(0.8
|
)
|
(7.0
|
)
|
|||||
|
Net pension income
|
$
|
12.4
|
|
$
|
9.6
|
|
$
|
5.1
|
|
||
119
QUAD/GRAPHICS, INC.
NOTES TO CONSOLIDATED FINANCIAL STATEMENTS
(In millions, except share and per share data and unless otherwise indicated)
The underfunded pension obligations are calculated using generally accepted actuarial methods and are measured annually as of December 31. The following table provides a reconciliation of the projected benefit obligation, fair value of plan assets and the funded status of the pension plans as of
December 31, 2018
and
2017
:
|
Pension Benefits
|
|||||||
|
2018
|
2017
|
||||||
|
Changes in benefit obligation
|
|||||||
|
Projected benefit obligation, beginning of year
|
$
|
(538.9
|
)
|
$
|
(560.6
|
)
|
|
|
Interest cost
|
(16.0
|
)
|
(17.3
|
)
|
|||
|
Actuarial gain (loss)
|
34.2
|
|
(17.2
|
)
|
|||
|
Benefits paid
|
44.3
|
|
54.3
|
|
|||
|
Liability benefit from lump-sum settlement
|
—
|
|
1.9
|
|
|||
|
Projected benefit obligation, end of year
|
(476.4
|
)
|
(538.9
|
)
|
|||
|
Changes in plan assets
|
|||||||
|
Fair value of plan assets, beginning of year
|
454.8
|
|
446.4
|
|
|||
|
Actual return (loss) on plan assets
|
(23.7
|
)
|
61.7
|
|
|||
|
Employer contributions
|
7.0
|
|
1.0
|
|
|||
|
Benefits paid
|
(44.3
|
)
|
(54.3
|
)
|
|||
|
Fair value of plan assets, end of year
|
393.8
|
|
454.8
|
|
|||
|
Funded status
|
$
|
(82.6
|
)
|
$
|
(84.1
|
)
|
|
Amounts recognized on the consolidated balance sheets as of
December 31, 2018
and
2017
, were as follows:
|
Pension Benefits
|
|||||||
|
2018
|
2017
|
||||||
|
Current liabilities
|
$
|
(1.7
|
)
|
$
|
(1.7
|
)
|
|
|
Noncurrent liabilities
|
(80.9
|
)
|
(82.4
|
)
|
|||
|
Total amount recognized
|
$
|
(82.6
|
)
|
$
|
(84.1
|
)
|
|
The following table provides a reconciliation of the Company’s accumulated other comprehensive loss prior to any deferred tax effects at
December 31, 2018
and
2017
:
|
Pension Benefits
|
|||
|
Actuarial Gain / (Loss), net
|
|||
|
Balance at January 1, 2017
|
$
|
(34.7
|
)
|
|
Amount arising during the period
|
18.7
|
|
|
|
Impact of pension plan settlement charge included in net earnings (loss)
|
0.8
|
|
|
|
Balance at December 31, 2017
|
(15.2
|
)
|
|
|
Amount arising during the period
|
(18.1
|
)
|
|
|
Balance at December 31, 2018
|
$
|
(33.3
|
)
|
120
QUAD/GRAPHICS, INC.
NOTES TO CONSOLIDATED FINANCIAL STATEMENTS
(In millions, except share and per share data and unless otherwise indicated)
On July 1, 2017, the Company provided the option to receive a lump-sum pension payment to a select group of terminated vested participants. Total lump sum payments of
$21.4 million
were paid during 2017, of which
$8.4 million
was paid in October 2017 under the lump-sum program. During 2017, the Company settled
$23.3 million
of pension liabilities for
$21.4 million
of pension payments.
On April 1, 2016, the Company provided the option to receive a lump-sum pension payment to a select group of terminated vested participants. Total lump-sum payments of
$74.8 million
were paid during 2016, of which
$56.4 million
was paid in July 2016 under the lump-sum program. During 2016, the Company settled
$92.6 million
of pension liabilities for
$74.8 million
of pension payouts.
Payments to eligible participants who elected to receive a lump-sum pension payment were funded from existing pension plan assets and constituted a settlement of the Company’s pension liabilities with respect to these participants. As a result of the lump-sums paid to participants, non-cash settlement charges of
$0.8 million
and
$7.0 million
were recognized during the years ended December 31, 2017 and 2016, respectively. The settlement charges were classified as restructuring, impairment and transaction-related charges in the consolidated statement of operations. These charges resulted from the recognition in earnings of a portion of the actuarial losses recorded in accumulated other comprehensive loss based on the proportion of the obligation settled.
Actuarial gains and losses in excess of 10% of the greater of the projected benefit obligation or the market-related value of plan assets are recognized as a component of net periodic benefit costs over the average remaining service period of a plan’s active employees. Unrecognized prior service costs or credits are also recognized as a component of net periodic benefit cost over the average remaining service period of a plan’s active employees.
No
amortization of amounts in accumulated other comprehensive loss is expected to be recognized as a component of net periodic pension income in 2019.
The weighted average assumptions used to determine net periodic benefit costs for the years ended
December 31, 2018
,
2017
and
2016
, were as follows:
|
Pension Benefits
|
||||||||
|
2018
|
2017
|
2016
|
||||||
|
Discount rate
|
3.52
|
%
|
3.91
|
%
|
3.32
|
%
|
||
|
Expected long-term return on plan assets
|
6.50
|
%
|
6.50
|
%
|
6.50
|
%
|
||
The weighted average assumptions used to determine pension benefit obligations at
December 31, 2018
and
2017
, were as follows:
|
Pension Benefits
|
|||||
|
2018
|
2017
|
||||
|
Discount rate (end of year rate)
|
4.22
|
%
|
3.52
|
%
|
|
The Company determines its assumed discount rate based on an index of high-quality corporate bond yields and matched-funding yield curve analysis as of the measurement date.
121
QUAD/GRAPHICS, INC.
NOTES TO CONSOLIDATED FINANCIAL STATEMENTS
(In millions, except share and per share data and unless otherwise indicated)
Estimated Company Contributions and Benefit Payments
In
2019
, the Company expects to make cash contributions of
$4.7 million
to its qualified defined benefit pension plans and expects to make estimated benefit payments of
$1.8 million
to its non-qualified defined benefit pension plans. The actual pension contributions may differ based on the funding calculations, and the Company may choose to make additional discretionary contributions. The estimated benefit payments may differ based on actual experience.
Estimated Future Benefit Payments by the Plans to or on Behalf of Plan Participants
An estimate of the Plans’ present value of future benefit payments to be made from funded qualified plans and unfunded non-qualified plans to plan participants at
December 31, 2018
, were as follows:
|
Future Pension
Benefit Payments
|
|||
|
2019
|
$
|
40.4
|
|
|
2020
|
38.8
|
|
|
|
2021
|
38.0
|
|
|
|
2022
|
36.8
|
|
|
|
2023
|
35.3
|
|
|
|
2024 – 2028
|
160.7
|
|
|
|
Thereafter
|
126.4
|
|
|
|
Total
|
$
|
476.4
|
|
Plan Assets and Investment Strategy
The Company follows a disciplined investment strategy, which provides diversification of investments by asset class, foreign currency, sector and company. The Pension Committee has an approved investment policy for the pension plan that establishes long-term asset mix targets based on several factors including the following: the funded status, historical returns achieved by worldwide investment markets, the time horizon of the pension plan’s obligations, and the investment risk. An allocation range by asset class is developed whereby a mix of equity securities and debt securities are used to provide an appropriate risk-adjusted long-term return on plan assets. Third-party investment managers are employed to invest assets in both passively-indexed and actively-managed strategies and investment returns and risks are monitored on an ongoing basis. Derivatives are used at certain times to hedge foreign currency exposure. Gains or losses on the derivatives are offset by a corresponding change in the value of the hedged assets. Derivatives are strictly used for hedging purposes and not speculative purposes.
The current target allocations for plan assets on a weighted average basis are
30%
equity securities and
70%
debt securities, including cash and cash equivalents. The actual asset allocation as of
December 31, 2018
, was approximately
30%
equity securities and
70%
debt securities. The actual asset allocation as of
December 31, 2017
, was approximately
41%
equity securities and
59%
debt securities. Equity investments are diversified by country, issuer and industry sector. Debt securities primarily consist of government bonds and corporate bonds from diversified industries.
The expected long-term rate of return on assets assumption is selected by first identifying the expected range of long-term rates of return for each major asset class. Expected long-term rates of return are developed based on long-term historical averages, current expectations of future returns and anticipated inflation rates. The expected long-term rate of return on plan assets is then calculated by weighting each asset class.
122
QUAD/GRAPHICS, INC.
NOTES TO CONSOLIDATED FINANCIAL STATEMENTS
(In millions, except share and per share data and unless otherwise indicated)
The fair values of the Company’s pension plan assets at
December 31, 2018
and
2017
, by asset category were as follows:
|
December 31, 2018
|
December 31, 2017
|
|||||||||||||||||||||||||||||||
|
Asset Category
|
Total
|
Level 1
|
Level 2
|
Level 3
|
Total
|
Level 1
|
Level 2
|
Level 3
|
||||||||||||||||||||||||
|
Cash and cash equivalents
|
$
|
2.7
|
|
$
|
2.7
|
|
$
|
—
|
|
$
|
—
|
|
$
|
2.6
|
|
$
|
2.6
|
|
$
|
—
|
|
$
|
—
|
|
||||||||
|
Debt securities
|
113.9
|
|
—
|
|
113.9
|
|
—
|
|
118.4
|
|
—
|
|
118.4
|
|
—
|
|
||||||||||||||||
|
Equity securities
|
26.4
|
|
—
|
|
26.4
|
|
—
|
|
40.0
|
|
—
|
|
40.0
|
|
—
|
|
||||||||||||||||
|
143.0
|
|
$
|
2.7
|
|
$
|
140.3
|
|
$
|
—
|
|
161.0
|
|
$
|
2.6
|
|
$
|
158.4
|
|
$
|
—
|
|
|||||||||||
|
Investments measured at net asset value (“NAV”)
(1)
|
250.8
|
|
293.8
|
|
||||||||||||||||||||||||||||
|
$
|
393.8
|
|
$
|
454.8
|
|
|||||||||||||||||||||||||||
______________________________
|
(1)
|
These investments consist of privately placed funds that are valued based on NAV. NAV of the funds is based on the fair value of each fund’s underlying investments. In accordance with ASC Subtopic 820-10, certain investments that are measured at fair value using the NAV per share (or its equivalent) practical expedient have not been classified in the fair value hierarchy.
|
There are no Level 3 assets as of
December 31, 2018
and
2017
. See
Note 14
, “
Financial Instruments and Fair Value Measurements
,” for definitions of fair value levels.
The Company segregated its plan assets by the following major categories and levels for determining their fair value as of
December 31, 2018
:
Cash and cash equivalents.
Carrying value approximates fair value and these assets are classified as Level 1.
Debt Securities.
This category consists of bonds, short-term fixed income securities and fixed income pooled funds fair valued based on a compilation of primarily observable market information or broker quotes in over-the-counter markets and are classified as Level 2.
Equity Securities.
This category consists of equity pooled funds that are classified as Level 2 in the fair value hierarchy. Level 2 assets are valued using quoted prices in markets that are not active, broker dealer quotations, and other methods by which all significant input was observable at the measurement date.
The valuation methodologies described above may generate a fair value calculation that may not be indicative of net realizable value or future fair values. While the Company believes the valuation methodologies used are appropriate, the use of different methodologies or assumptions in calculating fair value could result in different amounts. The Company invests in various assets in which valuation is determined by NAV. The Company believes that NAV is representative of fair value at the reporting date, as there are no significant restrictions on redemption on these investments or other reasons to indicate that the investment would be redeemed at an amount different than NAV.
123
QUAD/GRAPHICS, INC.
NOTES TO CONSOLIDATED FINANCIAL STATEMENTS
(In millions, except share and per share data and unless otherwise indicated)
The fair value measurements in common/collective trusts, calculated using a NAV and their redemption restrictions, for the years ended
December 31, 2018
and
2017
, are as follows:
|
Fair Value
|
Redemption Frequency (If Currently Eligible)
|
Redemption Notice Period
|
|||||||||
|
2018
|
2017
|
||||||||||
|
JP Morgan Chase Bank Strategic Property Fund
|
$
|
18.0
|
|
$
|
23.3
|
|
Quarterly
|
30 days
|
|||
|
Pyramis Long Corporate A or Better
|
78.6
|
|
73.9
|
|
Daily
|
15 days
|
|||||
|
Pyramis Long Duration
|
79.2
|
|
73.5
|
|
Daily
|
15 days
|
|||||
|
Russell 3000 Index NL
|
75.0
|
|
123.1
|
|
Daily
|
1 day
|
|||||
|
Total value of investments measured at NAV
|
$
|
250.8
|
|
$
|
293.8
|
|
|||||
Risk Management
For all directly invested funds, the concentration risk is monitored through specific guidelines in the investment manager mandates. The investment manager mandates were developed by the Company’s external investment advisor, and specify diversification standards such as the maximum exposure per issuer, and concentration limits per type of security, industry and country when applicable.
For the investments made through pooled funds, the investment mandates of the funds were again reviewed by the Company’s external investment advisor, to determine that the investment objectives and guidelines were consistent with the Company’s overall pension plan risk management objectives. In managing the plan assets, management reviews and manages risk associated with funded status risk, interest rate risk, market risk, counterparty risk, liquidity risk and operational risk. Liability management and asset class diversification are central to the Company’s risk management approach and are integral to the overall investment strategy.
Given the process in place to ensure a proper diversification of the portfolio, management believes that the Company pension plan assets are not exposed to significant concentration risk.
Multiemployer Pension Plans
The Company has previously participated in a number of MEPPs under terms of collective bargaining agreements that cover a number of its employees. The risks of participating in these MEPPs are different from single employer plans in the following aspects:
|
•
|
Assets contributed to the MEPPs by one company may be used to provide benefits to employees of other participating companies.
|
|
•
|
If a participating company stops contributing to the plan, the unfunded obligations of the plan may be borne by the remaining participating companies.
|
|
•
|
If the Company stops participating in some or all of its MEPPs, and continues in business, the Company would be required to pay an amount, referred to as a withdrawal liability, based on the unfunded status of the plan.
|
124
QUAD/GRAPHICS, INC.
NOTES TO CONSOLIDATED FINANCIAL STATEMENTS
(In millions, except share and per share data and unless otherwise indicated)
The Company has withdrawn from all significant MEPPs and replaced these union sponsored “promise to pay in the future” defined benefit plans with a Company sponsored “pay as you go” defined contribution plan. The two MEPPs, the
GCIU
and
GCC
, are significantly underfunded, and will require the Company to pay a withdrawal liability to fund its pro rata share of the underfunding as of the plan year the full withdrawal was completed. As a result of the decision to withdraw, the Company accrued the estimated withdrawal liability based on information provided by each plan’s trustee, as part of the purchase price allocation for World Color Press.
The GCIU Plan is a defined benefit plan that provides retirement benefits, total and permanent disability benefits, and pre-retirement death benefits for the participating union employees of the Company. The funded status of the
GCIU
Plan is classified as critical and declining based on the
GCIU
Plan’s 2018 certification to the United States Department of Labor, as the funded percentage for the plan is less than
65%
, and the plan is projected to become insolvent in 2030. As a result, the
GCIU
Plan implemented a rehabilitation plan to improve the plan’s funded status.
The Company has received a notice of withdrawal and demand for payment letter from the
GCIU
and is currently in litigation with the
GCIU
trustees to determine the amount and duration of the withdrawal payments for the
GCIU
. Arbitration proceedings with the
GCIU
have been completed, both sides have appealed the arbitrator’s ruling, and litigation in Federal court has commenced. During April 2017, a Federal district court overturned the arbitration decision in one of the pending disputes in this matter. The Company appealed the district court’s ruling to a panel of the Ninth Circuit Court of Appeals, and in December 2018, the panel upheld the district court’s decision. The Company filed a motion for reconsideration with the panel, which was denied. Until litigation with the GCIU trustees is concluded, the exact amount of the withdrawal liability will not be known. As a result of these unfavorable rulings, the Company recorded a
$32.1 million
increase to the MEPPs withdrawal liability during the year ended December 31, 2018, which was recorded in restructuring, impairment and transaction-related charges in the consolidated statements of operations.
The
GCC
Plan is a defined benefit plan that provides retirement benefits, disability benefits, and early retirement benefits for the participating union employees of the Company. The funded status of the
GCC
Plan is classified as critical and declining based on the
GCC
Plan’s 2018 certification to the United States Department of Labor, as the funded percentage for the plan is less than
65%
, and the plan is projected to become insolvent by 2023. As a result, the GCC Plan implemented a rehabilitation plan to improve the plan’s funded status.
During the fourth quarter of 2016, the Company and the
GCC
reached a settlement agreement for all claims, with scheduled payments until February 2024.
The Company made payments totaling
$13.1 million
,
$24.0 million
and
$11.8 million
for the years ended
December 31, 2018
,
2017
and
2016
, respectively. The Company has reserved
$50.9 million
as its estimate of the total MEPPs withdrawal liability as of
December 31, 2018
, of which
$42.5 million
was recorded in other long-term liabilities and
$8.4 million
was recorded in accrued liabilities in the consolidated balance sheets.
Note 16
.
Earnings Per Share Attributable to Quad Common Shareholders
Basic earnings per share attributable to Quad common shareholders is computed as net earnings attributable to Quad common shareholders, divided by the basic weighted average common shares outstanding. The calculation of diluted earnings per share attributable to Quad common shareholders includes the effect of any dilutive equity incentive instruments. The Company uses the treasury stock method to calculate the effect of outstanding dilutive equity incentive instruments, which requires the Company to compute total proceeds as the sum of the amount the employee must pay upon exercise of the award and the amount of unearned stock-based compensation costs attributed to future services.
125
QUAD/GRAPHICS, INC.
NOTES TO CONSOLIDATED FINANCIAL STATEMENTS
(In millions, except share and per share data and unless otherwise indicated)
Equity incentive instruments for which the total employee proceeds from exercise exceed the average fair value of the same equity incentive instrument over the period have an anti-dilutive effect on earnings per share during periods with net earnings, and accordingly, the Company excludes them from the calculation. Anti-dilutive equity incentive instruments of
0.5 million
,
0.7 million
and
1.9 million
of class A common shares were excluded from the computations of diluted net earnings per share for the years ended
December 31, 2018
,
2017
and
2016
, respectively. In periods of net loss, the assumed exercise of all equity incentive instruments is anti-dilutive and therefore, not included in the diluted loss per share calculation for that period.
Reconciliations of the numerator and the denominator of the basic and diluted per share computations for the Company’s common stock for the years ended
December 31, 2018
,
2017
and
2016
, are summarized as follows:
|
2018
|
2017
|
2016
|
|||||||||
|
Numerator:
|
|||||||||||
|
Net earnings attributable to Quad common shareholders
|
$
|
8.5
|
|
$
|
107.2
|
|
$
|
44.9
|
|
||
|
Denominator:
|
|||||||||||
|
Basic weighted average number of common shares outstanding for all classes of common shares
|
49.8
|
|
49.6
|
|
47.9
|
|
|||||
|
Plus: effect of dilutive equity incentive instruments
|
1.8
|
|
2.2
|
|
1.9
|
|
|||||
|
Diluted weighted average number of common shares outstanding for all classes of common shares
|
51.6
|
|
51.8
|
|
49.8
|
|
|||||
|
Earnings per share attributable to Quad common shareholders:
|
|||||||||||
|
Basic
|
$
|
0.17
|
|
$
|
2.16
|
|
$
|
0.94
|
|
||
|
Diluted
|
$
|
0.16
|
|
$
|
2.07
|
|
$
|
0.90
|
|
||
|
Cash dividends paid per common share for all classes of common shares
|
$
|
1.20
|
|
$
|
1.20
|
|
$
|
1.20
|
|
||
Note 17
.
Equity Incentive Programs
The shareholders of the Company approved the
Quad/Graphics, Inc. 2010 Omnibus Incentive Plan
(“
Omnibus Plan
”) for two complementary purposes: (1) to attract and retain outstanding individuals to serve as directors, officers and employees; and (2) to increase shareholder value. The
Omnibus Plan
provides for an aggregate
10,871,652
shares of
class A stock
reserved for issuance under the Omnibus Plan. Awards under the Omnibus Plan may consist of incentive awards, stock options, stock appreciation rights, performance shares, performance share units, shares of class A stock, restricted stock (“RS”), restricted stock units (“RSU”), deferred stock units (“DSU”) or other stock-based awards as determined by the Company’s Board of Directors. Each stock option granted has an exercise price of no less than
100%
of the fair market value of the
class A stock
on the date of grant. As of
December 31, 2018
, there were
1,571,841
shares available for issuance under the Omnibus Plan. Authorized but unissued shares of the Company’s class A stock or treasury shares may be used for issuance under the Company’s equity incentive programs.
The Company recognizes compensation expense based on estimated grant date fair values for all share-based awards issued to employees and non-employee directors, including stock options, performance shares, performance share units, restricted stock, restricted stock units and deferred stock units. The Company recognizes these compensation costs for only those awards expected to vest, on a straight-line basis over the requisite
three
to
four
year service period of the awards, except DSU awards, which are fully vested and expensed on the grant date. The Company estimated the number of awards expected to vest based, in part, on historical forfeiture rates and also based on management’s expectations of employee turnover within the specific employee groups receiving each type of award. Forfeitures are estimated at the time of grant and revised, if necessary, in subsequent periods, if actual forfeitures differ from those estimates.
126
QUAD/GRAPHICS, INC.
NOTES TO CONSOLIDATED FINANCIAL STATEMENTS
(In millions, except share and per share data and unless otherwise indicated)
Equity Incentive Compensation Expense
The total compensation expense recognized related to all equity incentive programs was
$15.6 million
,
$16.4 million
and
$15.2 million
for the years ended
December 31, 2018
,
2017
and
2016
, respectively, and was recorded primarily in selling, general and administrative expenses in the consolidated statements of operations. Total future compensation expense related to all equity incentive programs granted as of
December 31, 2018
, is estimated to be
$15.9 million
, which consists entirely of expense for RS and RSU awards. Estimated future compensation expense is
$10.0 million
for
2019
,
$5.2 million
for
2020
and
$0.7 million
for
2021
.
Stock Options
Options vest over
four
years, with
no
vesting in the first year and
one-third
vesting upon the second, third and fourth anniversary dates. As defined in the individual grant agreements, acceleration of vesting may occur under a change in control, death, disability or normal retirement of the grantee. Options expire no later than the
tenth
anniversary of the grant date,
24
months after termination for death,
36
months after termination for normal retirement or disability and
90
days after termination of employment for any other reason. Options are not credited with dividend declarations, except for the
November 18, 2011
grants. Stock options are only to be granted to employees.
There were
no
stock options granted during the years ended
December 31, 2018
,
2017
and
2016
. There was
no
compensation expense recognized related to stock options for the years ended
December 31, 2018
,
2017
and
2016
. There is
no
future compensation expense for stock options granted as of
December 31, 2018
. The following table is a summary of the stock option activity for the year ended
December 31, 2018
:
|
Shares
Under
Option
|
Weighted
Average
Exercise
Price
|
Weighted
Average
Remaining
Contractual
Term
(years)
|
Aggregate
Intrinsic
Value
(millions)
|
|||||||||
|
Outstanding and exercisable at December 31, 2017
|
1,532,033
|
|
$
|
23.60
|
|
2.3
|
$
|
6.8
|
|
|||
|
Granted
|
—
|
|
—
|
|
|
|
|
|||||
|
Exercised
|
(282,661
|
)
|
14.78
|
|
|
|
||||||
|
Canceled/forfeited/expired
|
(307,057
|
)
|
29.54
|
|
|
|
||||||
|
Outstanding and exercisable at December 31, 2018
|
942,315
|
|
$
|
24.31
|
|
1.8
|
$
|
—
|
|
|||
The intrinsic value of options outstanding and exercisable as of
December 31, 2018
and
2017
, was based on the fair value of the stock price. All outstanding options are vested as of
December 31, 2018
. The following table is a summary of the stock option exercises and vesting activity for the years ended
December 31, 2018
,
2017
and
2016
:
|
2018
|
2017
|
2016
|
|||||||||
|
Total intrinsic value of stock options exercised
|
$
|
3.7
|
|
$
|
1.7
|
|
$
|
12.4
|
|
||
|
Proceeds from stock options exercised
|
4.2
|
|
2.6
|
|
30.3
|
|
|||||
|
Total grant date fair value of stock options vested
|
—
|
|
—
|
|
0.3
|
|
|||||
127
QUAD/GRAPHICS, INC.
NOTES TO CONSOLIDATED FINANCIAL STATEMENTS
(In millions, except share and per share data and unless otherwise indicated)
Restricted Stock and Restricted Stock Units
Restricted stock and restricted stock unit awards consist of shares or the rights to shares of the Company’s
class A stock
which are awarded to employees of the Company. The awards are restricted such that they are subject to substantial risk of forfeiture and to restrictions on their sale or other transfer by the employee. RSU awards are typically granted to eligible employees outside of the United States. As defined in the individual grant agreements, acceleration of vesting may occur under a change in control, death, disability or normal retirement of the grantee. Grantees receiving RS grants are able to exercise full voting rights and receive full credit for dividends during the vesting period. All such dividends will be paid to the RS grantee within
45
days of full vesting. Grantees receiving RSUs are not entitled to vote but do earn dividends. Upon vesting, RSUs will be settled either through cash payment equal to the fair market value of the RSUs on the vesting date or through issuance of Company
class A stock
.
The following table is a summary of RS and RSU award activity for the year ended
December 31, 2018
:
|
Restricted Stock
|
Restricted Stock Units
|
||||||||||||||||
|
Shares
|
Weighted-
Average
Grant Date
Fair Value
Per Share
|
Weighted-
Average
Remaining
Contractual
Term (Years)
|
Units
|
Weighted-
Average
Grant Date
Fair Value
Per Share
|
Weighted-
Average
Remaining
Contractual
Term (Years)
|
||||||||||||
|
Nonvested at December 31, 2017
|
2,470,158
|
|
$
|
16.95
|
|
1.2
|
114,942
|
|
$
|
16.68
|
|
1.3
|
|||||
|
Granted
|
668,359
|
|
22.54
|
|
|
18,586
|
|
22.60
|
|
|
|||||||
|
Vested
|
(650,320
|
)
|
21.26
|
|
|
(19,510
|
)
|
23.11
|
|
|
|||||||
|
Forfeited
|
(152,281
|
)
|
16.84
|
|
|
(6,926
|
)
|
14.19
|
|
|
|||||||
|
Nonvested at December 31, 2018
|
2,335,916
|
|
$
|
17.36
|
|
1.0
|
107,092
|
|
$
|
16.70
|
|
0.8
|
|||||
In general, RS and RSU awards will vest on the
third
anniversary of the grant date, provided the holder of the share is continuously employed by the Company until the vesting date. Compensation expense recognized for RS and RSUs was
$14.7 million
,
$15.5 million
and
$14.4 million
for the years ended
December 31, 2018
,
2017
and
2016
, respectively.
Deferred Stock Units
Deferred stock units are awards of rights to shares of the Company’s
class A stock
and are awarded to non-employee directors of the Company. The following table is a summary of DSU award activity for the year ended
December 31, 2018
:
|
|
Deferred Stock Units
|
|||||
|
|
Units
|
|
Weighted Average Grant Date Fair Value Per Share
|
|||
|
Outstanding at December 31, 2017
|
195,913
|
|
|
$
|
18.18
|
|
|
Granted
|
39,360
|
|
|
22.60
|
|
|
|
Dividend equivalents granted
|
13,875
|
|
|
19.55
|
|
|
|
Settled
|
(12,587
|
)
|
|
10.56
|
|
|
|
Outstanding at December 31, 2018
|
236,561
|
|
|
$
|
19.40
|
|
128
QUAD/GRAPHICS, INC.
NOTES TO CONSOLIDATED FINANCIAL STATEMENTS
(In millions, except share and per share data and unless otherwise indicated)
Each DSU award entitles the grantee to receive
one
share of
class A stock
upon the earlier of the separation date of the grantee or the second anniversary of the grant date, but could be subject to acceleration for a change in control, death or disability as defined in the individual DSU grant agreement. Grantees of DSU awards may not exercise voting rights, but are credited with dividend equivalents and those dividend equivalents will be converted into additional DSU awards based on the closing price of the
class A stock
. Compensation expense recognized for DSUs was
$0.9 million
for the years ended
December 31, 2018
and
2017
, and
$0.8 million
for the year ended
December 31, 2016
. As DSU awards are fully vested on the grant date, all compensation expense was recognized at the date of grant.
Note 18
.
Shareholders’ Equity
The Company has
three
classes of common stock as follows (share data in millions):
|
Issued Common Stock
|
|||||||||||
|
Authorized Shares
|
Outstanding
|
Treasury
|
Total Issued Shares
|
||||||||
|
Class A stock ($0.025 par value)
|
80.0
|
|
|||||||||
|
December 31, 2018
|
38.1
|
|
2.2
|
|
40.3
|
|
|||||
|
December 31, 2017
|
38.2
|
|
1.8
|
|
40.0
|
|
|||||
|
December 31, 2016
|
37.2
|
|
2.8
|
|
40.0
|
|
|||||
|
Class B stock ($0.025 par value)
|
80.0
|
|
|||||||||
|
December 31, 2018
|
13.5
|
|
—
|
|
13.5
|
|
|||||
|
December 31, 2017
|
13.8
|
|
—
|
|
13.8
|
|
|||||
|
December 31, 2016
|
14.2
|
|
0.8
|
|
15.0
|
|
|||||
|
Class C stock ($0.025 par value)
|
20.0
|
|
|||||||||
|
December 31, 2018
|
—
|
|
0.5
|
|
0.5
|
|
|||||
|
December 31, 2017
|
—
|
|
0.5
|
|
0.5
|
|
|||||
|
December 31, 2016
|
—
|
|
0.5
|
|
0.5
|
|
|||||
In accordance with the Articles of Incorporation, each class A common share has
one
vote per share and each class B and class C common share has
ten
votes per share on all matters voted upon by the Company’s shareholders. Liquidation rights are the same for all
three
classes of stock.
The Company also has
0.5 million
shares of
$0.01
par value preferred stock authorized, of which none were issued at
December 31, 2018
,
2017
and
2016
. The Company has no present plans to issue any preferred stock.
On
September 6, 2011
, the Company’s Board of Directors authorized a share repurchase program of up to
$100.0 million
of the Company’s outstanding class A stock. On
July 30, 2018
, the Company’s Board of Directors discontinued the remainder of the
September 6, 2011
share repurchase program and authorized a new share repurchase program of up to
$100.0 million
of the Company’s outstanding class A common stock. During the year ended
December 31, 2018
, the Company repurchased
1,871,631
shares of its class A common stock at a weighted average price of
$19.59
per share for a total purchase price of
$36.7 million
. During the year ended
December 31, 2017
, the Company repurchased
200,605
shares of its class A common stock at a weighted average price of
$18.89
per share for a total purchase price of
$3.8 million
. During the year ended
December 31, 2016
, the Company repurchased
984,190
shares of its class A common stock at a weighted average price of
$8.96
per share for a total purchase price of
$8.8 million
. As of
December 31, 2018
, there were
$100.0 million
of authorized repurchases remaining under the program.
129
QUAD/GRAPHICS, INC.
NOTES TO CONSOLIDATED FINANCIAL STATEMENTS
(In millions, except share and per share data and unless otherwise indicated)
On
February 16, 2018
, the Company’s Board of Directors authorized the issuance of
1,006,061
shares of Company class A common stock from treasury to the Company’s
ESOP
, at a stock price of
$22.18
per share for a total value of
$22.3 million
.
On
October 13, 2017
, the Company’s Board of Directors authorized the cancellation of
1,027,907
shares of the Company’s class B common stock held in the Company’s treasury and returned the shares to the status of authorized, but unissued shares. In addition, all future acquired shares of the Company’s class B common stock will be immediately canceled and returned to the status of authorized but unissued shares. During the years ended
December 31, 2018
and
2017
,
284,845
and
136,654
shares of class B common stock, respectively, were converted to class A common stock. The shares of class B common stock were canceled and returned to the status of authorized but unissued shares.
In accordance with the Articles of Incorporation, dividends are paid equally for all three classes of common shares. The following table details the dividend activity related to the then outstanding shares of common stock for the years ended
December 31, 2018
,
2017
and
2016
:
|
Declaration Date
|
Record Date
|
Payment Date
|
Dividend Amount per Share
|
||||||
|
2018
|
|||||||||
|
Q4 Dividend
|
October 30, 2018
|
November 19, 2018
|
December 7, 2018
|
$
|
0.30
|
|
|||
|
Q3 Dividend
|
July 31, 2018
|
August 20, 2018
|
September 7, 2018
|
0.30
|
|
||||
|
Q2 Dividend
|
May 1, 2018
|
May 21, 2018
|
June 8, 2018
|
0.30
|
|
||||
|
Q1 Dividend
|
February 21, 2018
|
March 19, 2018
|
March 30, 2018
|
0.30
|
|
||||
|
2017
|
|||||||||
|
Q4 Dividend
|
October 31, 2017
|
November 20, 2017
|
December 1, 2017
|
$
|
0.30
|
|
|||
|
Q3 Dividend
|
August 1, 2017
|
August 21, 2017
|
September 1, 2017
|
0.30
|
|
||||
|
Q2 Dividend
|
May 1, 2017
|
May 22, 2017
|
June 2, 2017
|
0.30
|
|
||||
|
Q1 Dividend
|
February 17, 2017
|
February 27, 2017
|
March 10, 2017
|
0.30
|
|
||||
|
2016
|
|||||||||
|
Q4 Dividend
|
October 31, 2016
|
November 28, 2016
|
December 9, 2016
|
$
|
0.30
|
|
|||
|
Q3 Dividend
|
August 1, 2016
|
August 29, 2016
|
September 9, 2016
|
0.30
|
|
||||
|
Q2 Dividend
|
May 3, 2016
|
June 6, 2016
|
June 17, 2016
|
0.30
|
|
||||
|
Q1 Dividend
|
February 19, 2016
|
March 7, 2016
|
March 18, 2016
|
0.30
|
|
||||
130
QUAD/GRAPHICS, INC.
NOTES TO CONSOLIDATED FINANCIAL STATEMENTS
(In millions, except share and per share data and unless otherwise indicated)
Note 19
.
Accumulated Other Comprehensive Loss
The changes in accumulated other comprehensive loss by component, net of tax, for the years ended
December 31, 2018
and
2017
, were as follows:
|
Translation Adjustments
|
Interest Rate Swap Adjustments
|
Pension Benefit Plan Adjustments
|
Total
|
||||||||||||
|
Balance at January 1, 2017
|
$
|
(130.8
|
)
|
$
|
—
|
|
$
|
(21.8
|
)
|
$
|
(152.6
|
)
|
|||
|
Other comprehensive income before reclassifications
|
12.8
|
|
1.3
|
|
11.5
|
|
25.6
|
|
|||||||
|
Amounts reclassified from accumulated other comprehensive loss to net earnings (loss)
|
2.1
|
|
—
|
|
0.5
|
|
2.6
|
|
|||||||
|
Net other comprehensive income
|
14.9
|
|
1.3
|
|
12.0
|
|
28.2
|
|
|||||||
|
Balance at December 31, 2017
|
(115.9
|
)
|
1.3
|
|
(9.8
|
)
|
(124.4
|
)
|
|||||||
|
Amounts reclassified from accumulated other comprehensive loss to accumulated deficit
(1)
|
(1.1
|
)
|
0.3
|
|
(2.1
|
)
|
(2.9
|
)
|
|||||||
|
Balance at January 1, 2018
|
(117.0
|
)
|
1.6
|
|
(11.9
|
)
|
(127.3
|
)
|
|||||||
|
Other comprehensive income (loss) before reclassifications
|
(13.0
|
)
|
1.7
|
|
(13.6
|
)
|
(24.9
|
)
|
|||||||
|
Amounts reclassified from accumulated other comprehensive loss to net earnings (loss)
|
—
|
|
—
|
|
—
|
|
—
|
|
|||||||
|
Net other comprehensive income (loss)
|
(13.0
|
)
|
1.7
|
|
(13.6
|
)
|
(24.9
|
)
|
|||||||
|
Balance at December 31, 2018
|
$
|
(130.0
|
)
|
$
|
3.3
|
|
$
|
(25.5
|
)
|
$
|
(152.2
|
)
|
|||
______________________________
|
(1)
|
Includes adjustments for the adoption of
Accounting Standards Update 2018-02 “Income Statement—Reporting Comprehensive Income (Topic 220): Reclassification of Certain Tax Effects from Accumulated Other Comprehensive Income”
(“
ASU 2018-02
”).
|
There were
no
reclassifications from accumulated other comprehensive loss to net earnings for the year ended
December 31, 2018
. The details about the reclassifications from accumulated other comprehensive loss to net earnings for the years ended
December 31, 2017
and
2016
, were as follows:
|
Details about Accumulated Other
Comprehensive Loss Components
|
Year Ended December 31,
|
Consolidated Statements of Operations Presentation
|
||||||||
|
2017
|
2016
|
|||||||||
|
Revaluation loss on the sale of a business
|
$
|
2.1
|
|
$
|
—
|
|
Restructuring, impairment and transaction-related charges
|
|||
|
Settlement charge on pension benefit plans
|
0.8
|
|
7.0
|
|
Net pension income
|
|||||
|
Impact of income taxes
|
(0.3
|
)
|
(2.7
|
)
|
Income tax (benefit) expense
|
|||||
|
Settlement charge on pension benefit plans, net of tax
|
0.5
|
|
4.3
|
|
||||||
|
Total reclassifications for the period
|
2.9
|
|
7.0
|
|
||||||
|
Impact of income taxes
|
(0.3
|
)
|
(2.7
|
)
|
||||||
|
Total reclassifications for the period, net of tax
|
$
|
2.6
|
|
$
|
4.3
|
|
||||
131
QUAD/GRAPHICS, INC.
NOTES TO CONSOLIDATED FINANCIAL STATEMENTS
(In millions, except share and per share data and unless otherwise indicated)
Note 20
.
Segment Information
The Company is a leading marketing solutions provider.
T
he Company leverages its strong print foundation as part of a much larger, robust integrated marketing platform that helps marketers and content creators improve the efficiency and effectiveness of their marketing spend across offline and online media channels. The Company’s operating and reportable segments are aligned with how the chief operating decision maker of the Company currently manages the business. The Company’s operating and reportable segments, including their product and service offerings, and a “Corporate” category are as follows:
•
United States Print and Related Services
•
International
•
Corporate
United States Print and Related Services
The United States Print and Related Services segment is predominantly comprised of the Company’s United States printing operations and is managed as one integrated platform. This includes retail inserts, publications, catalogs, special interest publications, journals, direct mail, books, directories, in-store marketing and promotion, packaging, newspapers, custom print products, other commercial and specialty printed products and global paper procurement, together with marketing and other complementary services, including consumer insights, audience targeting, personalization, media planning and placement, process optimization, campaign planning and creation, pre-media production, videography, photography, digital execution, print execution and logistics. This segment also includes the manufacture of ink.
International
The International segment consists of the Company’s printing operations in Europe and Latin America, including operations in England, France, Germany, Poland, Argentina, Colombia, Mexico and Peru, as well as investments in printing operations in Brazil and India. This segment provides printed products and marketing and other complementary services consistent with the United States Print and Related Services segment. Unrestricted subsidiaries as defined in the
Senior Unsecured Notes
indenture represent less than
2.0%
of total consolidated assets as of
December 31, 2018
, and less than
2.0%
of total consolidated net sales for the year ended
December 31, 2018
.
Corporate
Corporate consists of unallocated general and administrative activities and associated expenses including, in part, executive, legal and finance, as well as certain expenses and income from frozen employee retirement plans, such as pension benefit plans.
132
QUAD/GRAPHICS, INC.
NOTES TO CONSOLIDATED FINANCIAL STATEMENTS
(In millions, except share and per share data and unless otherwise indicated)
The following is a summary of segment information for the years ended
December 31, 2018
,
2017
and
2016
:
|
Restructuring, Impairment and Transaction-Related Charges
|
|||||||||||||||||||||||
|
Net Sales
|
Operating Income (Loss)
|
Depreciation and Amortization
|
Capital Expenditures
|
||||||||||||||||||||
|
Products
|
Services
|
||||||||||||||||||||||
|
Year ended December 31, 2018
|
|||||||||||||||||||||||
|
United States Print and Related Services
|
$
|
3,023.8
|
|
$
|
782.8
|
|
$
|
154.0
|
|
$
|
209.0
|
|
$
|
69.3
|
|
$
|
37.8
|
|
|||||
|
International
|
368.5
|
|
18.6
|
|
1.5
|
|
20.8
|
|
27.0
|
|
22.2
|
|
|||||||||||
|
Total operating segments
|
3,392.3
|
|
801.4
|
|
155.5
|
|
229.8
|
|
96.3
|
|
60.0
|
|
|||||||||||
|
Corporate
|
—
|
|
—
|
|
(97.5
|
)
|
0.9
|
|
—
|
|
43.6
|
|
|||||||||||
|
Total
|
$
|
3,392.3
|
|
$
|
801.4
|
|
$
|
58.0
|
|
$
|
230.7
|
|
$
|
96.3
|
|
$
|
103.6
|
|
|||||
|
Year ended December 31, 2017
|
|||||||||||||||||||||||
|
United States Print and Related Services
|
$
|
3,156.9
|
|
$
|
583.2
|
|
$
|
194.3
|
|
$
|
210.8
|
|
$
|
73.3
|
|
$
|
53.6
|
|
|||||
|
International
|
372.1
|
|
19.2
|
|
19.6
|
|
21.0
|
|
12.6
|
|
3.3
|
|
|||||||||||
|
Total operating segments
|
3,529.0
|
|
602.4
|
|
213.9
|
|
231.8
|
|
85.9
|
|
56.9
|
|
|||||||||||
|
Corporate
|
—
|
|
—
|
|
(58.6
|
)
|
0.7
|
|
—
|
|
3.5
|
|
|||||||||||
|
Total
|
$
|
3,529.0
|
|
$
|
602.4
|
|
$
|
155.3
|
|
$
|
232.5
|
|
$
|
85.9
|
|
$
|
60.4
|
|
|||||
|
Year ended December 31, 2016
|
|||||||||||||||||||||||
|
United States Print and Related Services
|
$
|
3,335.1
|
|
$
|
591.9
|
|
$
|
186.1
|
|
$
|
252.4
|
|
$
|
88.1
|
|
$
|
59.3
|
|
|||||
|
International
|
382.0
|
|
20.5
|
|
13.5
|
|
24.1
|
|
18.0
|
|
(1.1
|
)
|
|||||||||||
|
Total operating segments
|
3,717.1
|
|
612.4
|
|
199.6
|
|
276.5
|
|
106.1
|
|
58.2
|
|
|||||||||||
|
Corporate
|
—
|
|
—
|
|
(82.3
|
)
|
0.6
|
|
—
|
|
15.4
|
|
|||||||||||
|
Total
|
$
|
3,717.1
|
|
$
|
612.4
|
|
$
|
117.3
|
|
$
|
277.1
|
|
$
|
106.1
|
|
$
|
73.6
|
|
|||||
Restructuring, impairment and transaction-related charges for the years ended
December 31, 2018
,
2017
and
2016
, are further described in
Note 4
, “
Restructuring, Impairment and Transaction-Related Charges
,” and are included in the operating income (loss) results by segment above.
A reconciliation of operating income (loss) to earnings (loss) before income taxes and equity in loss of unconsolidated entity as reported in the consolidated statements of operations for the years ended
December 31, 2018
,
2017
and
2016
, was as follows:
|
2018
|
2017
|
2016
|
|||||||||
|
Operating income
|
$
|
58.0
|
|
$
|
155.3
|
|
$
|
117.3
|
|
||
|
Less: interest expense
|
73.3
|
|
71.1
|
|
77.2
|
|
|||||
|
Less: net pension income
|
(12.4
|
)
|
(9.6
|
)
|
(5.1
|
)
|
|||||
|
Less: loss (gain) on debt extinguishment
|
—
|
|
2.6
|
|
(14.1
|
)
|
|||||
|
Earnings (loss) before income taxes and equity in (earnings) loss of unconsolidated entity
|
$
|
(2.9
|
)
|
$
|
91.2
|
|
$
|
59.3
|
|
||
133
QUAD/GRAPHICS, INC.
NOTES TO CONSOLIDATED FINANCIAL STATEMENTS
(In millions, except share and per share data and unless otherwise indicated)
Total assets by segment at
December 31, 2018
,
2017
and
2016
, were as follows:
|
2018
|
2017
|
2016
|
|||||||||
|
United States Print and Related Services
|
$
|
2,057.8
|
|
$
|
2,060.9
|
|
$
|
2,241.3
|
|
||
|
International
|
341.5
|
|
329.5
|
|
312.7
|
|
|||||
|
Total operating segments
|
2,399.3
|
|
2,390.4
|
|
2,554.0
|
|
|||||
|
Corporate
|
69.8
|
|
62.0
|
|
16.1
|
|
|||||
|
Total
|
$
|
2,469.1
|
|
$
|
2,452.4
|
|
$
|
2,570.1
|
|
||
Note 21
.
Geographic Area Information
The table below presents the Company’s net sales and long-lived assets as of and for the years ended
December 31, 2018
,
2017
and
2016
, by geographic region. The amounts in this table differ from the segment data presented in
Note 20
, “
Segment Information
,” because each operating segment includes operations in multiple geographic regions, based on the Company’s management reporting structure.
|
United States
|
Europe
|
Latin America
|
Other
|
Combined
|
|||||||||||||||
|
2018
|
|||||||||||||||||||
|
Net sales
|
|||||||||||||||||||
|
Products
|
$
|
2,987.8
|
|
$
|
162.2
|
|
$
|
234.3
|
|
$
|
8.0
|
|
$
|
3,392.3
|
|
||||
|
Services
|
782.8
|
|
18.6
|
|
—
|
|
—
|
|
801.4
|
|
|||||||||
|
Property, plant and equipment—net
|
1,099.7
|
|
83.4
|
|
66.6
|
|
7.7
|
|
1,257.4
|
|
|||||||||
|
Other intangible assets—net
|
104.2
|
|
8.2
|
|
0.2
|
|
—
|
|
112.6
|
|
|||||||||
|
Other long-term assets
|
71.1
|
|
11.8
|
|
10.7
|
|
0.3
|
|
93.9
|
|
|||||||||
|
2017
|
|||||||||||||||||||
|
Net sales
|
|||||||||||||||||||
|
Products
|
$
|
3,121.2
|
|
$
|
167.6
|
|
$
|
209.3
|
|
$
|
30.9
|
|
$
|
3,529.0
|
|
||||
|
Services
|
583.2
|
|
19.2
|
|
—
|
|
—
|
|
602.4
|
|
|||||||||
|
Property, plant and equipment—net
|
1,215.1
|
|
85.5
|
|
68.3
|
|
8.7
|
|
1,377.6
|
|
|||||||||
|
Other intangible assets—net
|
32.3
|
|
11.1
|
|
—
|
|
—
|
|
43.4
|
|
|||||||||
|
Other long-term assets
|
92.0
|
|
16.2
|
|
10.7
|
|
0.4
|
|
119.3
|
|
|||||||||
|
2016
|
|||||||||||||||||||
|
Net sales
|
|||||||||||||||||||
|
Products
|
$
|
3,299.1
|
|
$
|
169.8
|
|
$
|
217.4
|
|
$
|
30.8
|
|
$
|
3,717.1
|
|
||||
|
Services
|
591.9
|
|
20.5
|
|
—
|
|
—
|
|
612.4
|
|
|||||||||
|
Property, plant and equipment—net
|
1,362.8
|
|
79.7
|
|
67.7
|
|
9.7
|
|
1,519.9
|
|
|||||||||
|
Other intangible assets—net
|
47.6
|
|
12.1
|
|
—
|
|
—
|
|
59.7
|
|
|||||||||
|
Other long-term assets
|
71.6
|
|
0.3
|
|
12.2
|
|
0.2
|
|
84.3
|
|
|||||||||
134
QUAD/GRAPHICS, INC.
NOTES TO CONSOLIDATED FINANCIAL STATEMENTS
(In millions, except share and per share data and unless otherwise indicated)
Note 22
.
Separate Financial Information of Subsidiary Guarantors of Indebtedness
On
April 28, 2014
, Quad completed an offering of the
Senior Unsecured Notes
(see
Note 11
, “
Debt
,” for further details on the
Senior Unsecured Notes
). Each of the Company’s
Guarantor Subsidiaries
fully and unconditionally guarantee or, in the case of future subsidiaries, will guarantee, on a joint and several basis, the
Senior Unsecured Notes
. All of the current
Guarantor Subsidiaries
are
100%
owned by the Company.
Guarantor Subsidiaries
will be automatically released from these guarantees upon the occurrence of certain events, including the following:
|
•
|
the designation of any of the
Guarantor Subsidiaries
as an unrestricted subsidiary;
|
|
•
|
the release or discharge of any guarantee or indebtedness that resulted in the creation of the guarantee of the
Senior Unsecured Notes
by any of the
Guarantor Subsidiaries
; or
|
|
•
|
the sale or disposition, including the sale of substantially all the assets, of any of the
Guarantor Subsidiaries
.
|
The following condensed consolidating financial information reflects the summarized financial information of Quad, the Company’s
Guarantor Subsidiaries
on a combined basis and the Company’s non-guarantor subsidiaries on a combined basis.
135
QUAD/GRAPHICS, INC.
NOTES TO CONSOLIDATED FINANCIAL STATEMENTS
(In millions, except share and per share data and unless otherwise indicated)
Condensed Consolidating Statement of Operations
For the Year Ended
December 31, 2018
|
Quad/Graphics,
Inc. |
Guarantor Subsidiaries
|
Non-Guarantor Subsidiaries
|
Eliminations
|
Total
|
|||||||||||||||
|
Net sales
|
$
|
1,748.7
|
|
$
|
2,457.6
|
|
$
|
463.9
|
|
$
|
(476.5
|
)
|
$
|
4,193.7
|
|
||||
|
Cost of sales
|
1,378.2
|
|
2,156.2
|
|
361.2
|
|
(466.3
|
)
|
3,429.3
|
|
|||||||||
|
Selling, general and administrative expenses
|
232.3
|
|
101.9
|
|
48.1
|
|
(10.2
|
)
|
372.1
|
|
|||||||||
|
Depreciation and amortization
|
99.5
|
|
104.7
|
|
26.5
|
|
—
|
|
230.7
|
|
|||||||||
|
Restructuring, impairment and transaction-related charges
|
9.1
|
|
72.3
|
|
22.2
|
|
—
|
|
103.6
|
|
|||||||||
|
Total operating expenses
|
1,719.1
|
|
2,435.1
|
|
458.0
|
|
(476.5
|
)
|
4,135.7
|
|
|||||||||
|
Operating income (loss)
|
29.6
|
|
22.5
|
|
5.9
|
|
—
|
|
58.0
|
|
|||||||||
|
Interest expense (income)
|
64.9
|
|
3.1
|
|
5.3
|
|
—
|
|
73.3
|
|
|||||||||
|
Net pension income
|
—
|
|
(12.4
|
)
|
—
|
|
—
|
|
(12.4
|
)
|
|||||||||
|
Loss (gain) on debt extinguishment
|
—
|
|
—
|
|
—
|
|
—
|
|
—
|
|
|||||||||
|
Earnings (loss) before income taxes and equity in (earnings) loss of consolidated and unconsolidated entities
|
(35.3
|
)
|
|
31.8
|
|
|
0.6
|
|
|
—
|
|
(2.9
|
)
|
||||||
|
Income tax expense (benefit)
|
13.9
|
|
(18.7
|
)
|
(5.0
|
)
|
—
|
|
(9.8
|
)
|
|||||||||
|
Earnings (loss) before equity in (earnings) loss of consolidated and unconsolidated entities
|
(49.2
|
)
|
|
50.5
|
|
|
5.6
|
|
|
—
|
|
6.9
|
|
||||||
|
Equity in (earnings) loss of consolidated entities
|
(57.7
|
)
|
(5.7
|
)
|
—
|
|
63.4
|
|
—
|
|
|||||||||
|
Equity in (earnings) loss of unconsolidated entity
|
—
|
|
—
|
|
(1.0
|
)
|
—
|
|
(1.0
|
)
|
|||||||||
|
Net earnings (loss)
|
8.5
|
|
|
56.2
|
|
|
6.6
|
|
|
(63.4
|
)
|
|
7.9
|
|
|||||
|
Less: net earnings (loss) attributable to noncontrolling interests
|
—
|
|
—
|
|
(0.6
|
)
|
—
|
|
(0.6
|
)
|
|||||||||
|
Net earnings (loss) attributable to Quad common shareholders
|
$
|
8.5
|
|
|
$
|
56.2
|
|
|
$
|
7.2
|
|
|
$
|
(63.4
|
)
|
|
$
|
8.5
|
|
Condensed Consolidating Statement of Comprehensive Income (Loss)
For the Year Ended
December 31, 2018
|
Quad/Graphics,
Inc. |
Guarantor Subsidiaries
|
Non-Guarantor Subsidiaries
|
Eliminations
|
Total
|
|||||||||||||||
|
Net earnings (loss)
|
$
|
8.5
|
|
$
|
56.2
|
|
$
|
6.6
|
|
$
|
(63.4
|
)
|
$
|
7.9
|
|
||||
|
Other comprehensive income (loss), net of tax
|
(24.9
|
)
|
(17.8
|
)
|
(12.7
|
)
|
30.5
|
|
(24.9
|
)
|
|||||||||
|
Total comprehensive income (loss)
|
(16.4
|
)
|
38.4
|
|
(6.1
|
)
|
(32.9
|
)
|
(17.0
|
)
|
|||||||||
|
Less: comprehensive income (loss) attributable to noncontrolling interests
|
—
|
|
—
|
|
(0.6
|
)
|
—
|
|
(0.6
|
)
|
|||||||||
|
Comprehensive income (loss) attributable to Quad common shareholders
|
$
|
(16.4
|
)
|
$
|
38.4
|
|
$
|
(5.5
|
)
|
$
|
(32.9
|
)
|
$
|
(16.4
|
)
|
||||
136
QUAD/GRAPHICS, INC.
NOTES TO CONSOLIDATED FINANCIAL STATEMENTS
(In millions, except share and per share data and unless otherwise indicated)
Condensed Consolidating Statement of Operations
For the Year Ended
December 31, 2017
|
Quad/Graphics,
Inc. |
Guarantor Subsidiaries
|
Non-Guarantor Subsidiaries
|
Eliminations
|
Total
|
|||||||||||||||
|
Net sales
|
$
|
1,759.7
|
|
$
|
2,342.5
|
|
$
|
424.2
|
|
$
|
(395.0
|
)
|
$
|
4,131.4
|
|
||||
|
Cost of sales
|
1,292.2
|
|
2,018.9
|
|
336.1
|
|
(387.8
|
)
|
3,259.4
|
|
|||||||||
|
Selling, general and administrative expenses
|
264.7
|
|
127.0
|
|
39.3
|
|
(7.2
|
)
|
423.8
|
|
|||||||||
|
Depreciation and amortization
|
107.0
|
|
103.4
|
|
22.1
|
|
—
|
|
232.5
|
|
|||||||||
|
Restructuring, impairment and transaction-related charges
|
44.3
|
|
13.0
|
|
3.1
|
|
—
|
|
60.4
|
|
|||||||||
|
Total operating expenses
|
1,708.2
|
|
2,262.3
|
|
400.6
|
|
(395.0
|
)
|
3,976.1
|
|
|||||||||
|
Operating income (loss)
|
51.5
|
|
80.2
|
|
23.6
|
|
—
|
|
155.3
|
|
|||||||||
|
Interest expense (income)
|
70.4
|
|
(3.1
|
)
|
3.8
|
|
—
|
|
71.1
|
|
|||||||||
|
Net pension income
|
—
|
|
(9.6
|
)
|
—
|
|
—
|
|
(9.6
|
)
|
|||||||||
|
Loss (gain) on debt extinguishment
|
2.6
|
|
—
|
|
—
|
|
—
|
|
2.6
|
|
|||||||||
|
Earnings (loss) before income taxes and equity in (earnings) loss of consolidated and unconsolidated entities
|
(21.5
|
)
|
92.9
|
|
19.8
|
|
—
|
|
91.2
|
|
|||||||||
|
Income tax expense (benefit)
|
(32.6
|
)
|
30.7
|
|
(14.1
|
)
|
—
|
|
(16.0
|
)
|
|||||||||
|
Earnings (loss) before equity in (earnings) loss of consolidated and unconsolidated entities
|
11.1
|
|
62.2
|
|
33.9
|
|
—
|
|
107.2
|
|
|||||||||
|
Equity in (earnings) loss of consolidated entities
|
(96.1
|
)
|
(2.9
|
)
|
—
|
|
99.0
|
|
—
|
|
|||||||||
|
Equity in (earnings) loss of unconsolidated entity
|
—
|
|
—
|
|
—
|
|
—
|
|
—
|
|
|||||||||
|
Net earnings (loss)
|
107.2
|
|
65.1
|
|
33.9
|
|
(99.0
|
)
|
107.2
|
|
|||||||||
|
Less: net earnings (loss) attributable to noncontrolling interests
|
—
|
|
—
|
|
—
|
|
—
|
|
—
|
|
|||||||||
|
Net earnings (loss) attributable to Quad common shareholders
|
$
|
107.2
|
|
$
|
65.1
|
|
$
|
33.9
|
|
$
|
(99.0
|
)
|
$
|
107.2
|
|
||||
Condensed Consolidating Statement of Comprehensive Income (Loss)
For the Year Ended
December 31, 2017
|
Quad/Graphics,
Inc. |
Guarantor Subsidiaries
|
Non-Guarantor Subsidiaries
|
Eliminations
|
Total
|
|||||||||||||||
|
Net earnings (loss)
|
$
|
107.2
|
|
$
|
65.1
|
|
$
|
33.9
|
|
$
|
(99.0
|
)
|
$
|
107.2
|
|
||||
|
Other comprehensive income (loss), net of tax
|
28.2
|
|
13.0
|
|
12.0
|
|
(25.0
|
)
|
28.2
|
|
|||||||||
|
Total comprehensive income (loss)
|
135.4
|
|
78.1
|
|
45.9
|
|
(124.0
|
)
|
135.4
|
|
|||||||||
|
Less: comprehensive income (loss) attributable to noncontrolling interests
|
—
|
|
—
|
|
—
|
|
—
|
|
—
|
|
|||||||||
|
Comprehensive income (loss) attributable to Quad common shareholders
|
$
|
135.4
|
|
$
|
78.1
|
|
$
|
45.9
|
|
$
|
(124.0
|
)
|
$
|
135.4
|
|
||||
137
QUAD/GRAPHICS, INC.
NOTES TO CONSOLIDATED FINANCIAL STATEMENTS
(In millions, except share and per share data and unless otherwise indicated)
Condensed Consolidating Statement of Operations
For the Year Ended
December 31, 2016
|
Quad/Graphics,
Inc. |
Guarantor Subsidiaries
|
Non-Guarantor Subsidiaries
|
Eliminations
|
Total
|
|||||||||||||||
|
Net sales
|
$
|
1,863.6
|
|
$
|
2,429.0
|
|
$
|
454.6
|
|
$
|
(417.7
|
)
|
$
|
4,329.5
|
|
||||
|
Cost of sales
|
1,381.1
|
|
2,067.3
|
|
364.1
|
|
(417.7
|
)
|
3,394.8
|
|
|||||||||
|
Selling, general and administrative expenses
|
257.8
|
|
164.6
|
|
44.3
|
|
—
|
|
466.7
|
|
|||||||||
|
Depreciation and amortization
|
146.8
|
|
100.1
|
|
30.2
|
|
—
|
|
277.1
|
|
|||||||||
|
Restructuring, impairment and transaction-related charges
|
56.8
|
|
18.2
|
|
(1.4
|
)
|
—
|
|
73.6
|
|
|||||||||
|
Goodwill impairment
|
—
|
|
—
|
|
—
|
|
—
|
|
—
|
|
|||||||||
|
Total operating expenses
|
1,842.5
|
|
2,350.2
|
|
437.2
|
|
(417.7
|
)
|
4,212.2
|
|
|||||||||
|
Operating income (loss)
|
21.1
|
|
78.8
|
|
17.4
|
|
—
|
|
117.3
|
|
|||||||||
|
Interest expense (income)
|
76.0
|
|
(4.1
|
)
|
5.3
|
|
—
|
|
77.2
|
|
|||||||||
|
Net pension income
|
—
|
|
(5.1
|
)
|
—
|
|
—
|
|
(5.1
|
)
|
|||||||||
|
Loss (gain) on debt extinguishment
|
(14.1
|
)
|
—
|
|
—
|
|
—
|
|
(14.1
|
)
|
|||||||||
|
Earnings (loss) before income taxes and equity in (earnings) loss of consolidated and unconsolidated entities
|
(40.8
|
)
|
88.0
|
|
12.1
|
|
—
|
|
59.3
|
|
|||||||||
|
Income tax expense (benefit)
|
15.2
|
|
(4.8
|
)
|
2.6
|
|
—
|
|
13.0
|
|
|||||||||
|
Earnings (loss) before equity in (earnings) loss of consolidated and unconsolidated entities
|
(56.0
|
)
|
92.8
|
|
9.5
|
|
—
|
|
46.3
|
|
|||||||||
|
Equity in (earnings) loss of consolidated entities
|
(100.9
|
)
|
(6.0
|
)
|
—
|
|
106.9
|
|
—
|
|
|||||||||
|
Equity in (earnings) loss of unconsolidated entity
|
—
|
|
—
|
|
1.4
|
|
—
|
|
1.4
|
|
|||||||||
|
Net earnings (loss)
|
44.9
|
|
98.8
|
|
8.1
|
|
(106.9
|
)
|
44.9
|
|
|||||||||
|
Less: net earnings (loss) attributable to noncontrolling interests
|
—
|
|
—
|
|
—
|
|
—
|
|
—
|
|
|||||||||
|
Net earnings (loss) attributable to Quad common shareholders
|
$
|
44.9
|
|
$
|
98.8
|
|
$
|
8.1
|
|
$
|
(106.9
|
)
|
$
|
44.9
|
|
||||
Condensed Consolidating Statement of Comprehensive Income (Loss)
For the Year Ended
December 31, 2016
|
Quad/Graphics,
Inc. |
Guarantor Subsidiaries
|
Non-Guarantor Subsidiaries
|
Eliminations
|
Total
|
|||||||||||||||
|
Net earnings (loss)
|
$
|
44.9
|
|
$
|
98.8
|
|
$
|
8.1
|
|
$
|
(106.9
|
)
|
$
|
44.9
|
|
||||
|
Other comprehensive income (loss), net of tax
|
(0.1
|
)
|
1.7
|
|
(4.7
|
)
|
3.0
|
|
(0.1
|
)
|
|||||||||
|
Total comprehensive income (loss)
|
44.8
|
|
100.5
|
|
3.4
|
|
(103.9
|
)
|
44.8
|
|
|||||||||
|
Less: comprehensive income (loss) attributable to noncontrolling interests
|
—
|
|
—
|
|
—
|
|
—
|
|
—
|
|
|||||||||
|
Comprehensive income (loss) attributable to Quad common shareholders
|
$
|
44.8
|
|
$
|
100.5
|
|
$
|
3.4
|
|
$
|
(103.9
|
)
|
$
|
44.8
|
|
||||
138
QUAD/GRAPHICS, INC.
NOTES TO CONSOLIDATED FINANCIAL STATEMENTS
(In millions, except share and per share data and unless otherwise indicated)
Condensed Consolidating Balance Sheet
As of
December 31, 2018
|
Quad/Graphics,
Inc. |
Guarantor Subsidiaries
|
Non-Guarantor Subsidiaries
|
Eliminations
|
Total
|
|||||||||||||||
|
ASSETS
|
|||||||||||||||||||
|
Cash and cash equivalents
|
$
|
60.3
|
|
$
|
2.9
|
|
$
|
6.3
|
|
$
|
—
|
|
$
|
69.5
|
|
||||
|
Receivables, less allowances for doubtful accounts
|
378.0
|
|
63.3
|
|
87.4
|
|
—
|
|
528.7
|
|
|||||||||
|
Intercompany receivables
|
—
|
|
153.9
|
|
28.8
|
|
(182.7
|
)
|
—
|
|
|||||||||
|
Inventories
|
108.6
|
|
121.0
|
|
71.0
|
|
—
|
|
300.6
|
|
|||||||||
|
Other current assets
|
34.3
|
|
4.3
|
|
9.2
|
|
—
|
|
47.8
|
|
|||||||||
|
Total current assets
|
581.2
|
|
345.4
|
|
202.7
|
|
(182.7
|
)
|
946.6
|
|
|||||||||
|
Property, plant and equipment—net
|
647.7
|
|
451.6
|
|
158.1
|
|
—
|
|
1,257.4
|
|
|||||||||
|
Investment in consolidated entities
|
757.0
|
|
16.7
|
|
—
|
|
(773.7
|
)
|
—
|
|
|||||||||
|
Goodwill and intangible assets—net
|
1.7
|
|
111.3
|
|
54.2
|
|
—
|
|
167.2
|
|
|||||||||
|
Intercompany loan receivable
|
109.7
|
|
—
|
|
—
|
|
(109.7
|
)
|
—
|
|
|||||||||
|
Other long-term assets
|
42.5
|
|
10.4
|
|
45.0
|
|
—
|
|
97.9
|
|
|||||||||
|
Total assets
|
$
|
2,139.8
|
|
$
|
935.4
|
|
$
|
460.0
|
|
$
|
(1,066.1
|
)
|
$
|
2,469.1
|
|
||||
|
LIABILITIES AND SHAREHOLDERS' EQUITY
|
|||||||||||||||||||
|
Accounts payable
|
$
|
265.5
|
|
$
|
137.8
|
|
$
|
107.7
|
|
$
|
—
|
|
$
|
511.0
|
|
||||
|
Intercompany accounts payable
|
182.7
|
|
—
|
|
—
|
|
(182.7
|
)
|
—
|
|
|||||||||
|
Short-term debt and current portion of long-term debt and capital lease obligations
|
29.7
|
|
0.7
|
|
17.6
|
|
—
|
|
48.0
|
|
|||||||||
|
Other current liabilities
|
182.6
|
|
64.7
|
|
45.0
|
|
—
|
|
292.3
|
|
|||||||||
|
Total current liabilities
|
660.5
|
|
203.2
|
|
170.3
|
|
(182.7
|
)
|
851.3
|
|
|||||||||
|
Long-term debt and capital lease obligations
|
878.8
|
|
1.0
|
|
13.1
|
|
—
|
|
892.9
|
|
|||||||||
|
Intercompany loan payable
|
—
|
|
42.0
|
|
67.7
|
|
(109.7
|
)
|
—
|
|
|||||||||
|
Other long-term liabilities
|
140.3
|
|
115.4
|
|
9.0
|
|
—
|
|
264.7
|
|
|||||||||
|
Total liabilities
|
1,679.6
|
|
361.6
|
|
260.1
|
|
(292.4
|
)
|
2,008.9
|
|
|||||||||
|
Total shareholders' equity and noncontrolling interests
|
460.2
|
|
573.8
|
|
199.9
|
|
(773.7
|
)
|
460.2
|
|
|||||||||
|
Total liabilities and shareholders' equity
|
$
|
2,139.8
|
|
$
|
935.4
|
|
$
|
460.0
|
|
$
|
(1,066.1
|
)
|
$
|
2,469.1
|
|
||||
139
QUAD/GRAPHICS, INC.
NOTES TO CONSOLIDATED FINANCIAL STATEMENTS
(In millions, except share and per share data and unless otherwise indicated)
Condensed Consolidating Balance Sheet
As of
December 31, 2017
|
Quad/Graphics,
Inc. |
Guarantor Subsidiaries
|
Non-Guarantor Subsidiaries
|
Eliminations
|
Total
|
|||||||||||||||
|
ASSETS
|
|||||||||||||||||||
|
Cash and cash equivalents
|
$
|
51.7
|
|
$
|
2.0
|
|
$
|
10.7
|
|
$
|
—
|
|
$
|
64.4
|
|
||||
|
Receivables, less allowances for doubtful accounts
|
427.9
|
|
40.6
|
|
84.0
|
|
—
|
|
552.5
|
|
|||||||||
|
Intercompany receivables
|
—
|
|
85.3
|
|
—
|
|
(85.3
|
)
|
—
|
|
|||||||||
|
Inventories
|
97.0
|
|
108.6
|
|
40.9
|
|
—
|
|
246.5
|
|
|||||||||
|
Other current assets
|
35.2
|
|
2.6
|
|
7.3
|
|
—
|
|
45.1
|
|
|||||||||
|
Total current assets
|
611.8
|
|
239.1
|
|
142.9
|
|
(85.3
|
)
|
908.5
|
|
|||||||||
|
Property, plant and equipment—net
|
706.5
|
|
508.6
|
|
162.5
|
|
—
|
|
1,377.6
|
|
|||||||||
|
Investment in consolidated entities
|
578.3
|
|
12.1
|
|
—
|
|
(590.4
|
)
|
—
|
|
|||||||||
|
Goodwill and intangible assets—net
|
6.9
|
|
25.5
|
|
11.0
|
|
—
|
|
43.4
|
|
|||||||||
|
Intercompany loan receivable
|
106.3
|
|
—
|
|
1.7
|
|
(108.0
|
)
|
—
|
|
|||||||||
|
Other long-term assets
|
60.5
|
|
13.5
|
|
48.9
|
|
—
|
|
122.9
|
|
|||||||||
|
Total assets
|
$
|
2,070.3
|
|
$
|
798.8
|
|
$
|
367.0
|
|
$
|
(783.7
|
)
|
$
|
2,452.4
|
|
||||
|
LIABILITIES AND SHAREHOLDERS' EQUITY
|
|||||||||||||||||||
|
Accounts payable
|
$
|
201.6
|
|
$
|
115.9
|
|
$
|
64.1
|
|
$
|
—
|
|
$
|
381.6
|
|
||||
|
Intercompany accounts payable
|
75.1
|
|
—
|
|
10.2
|
|
(85.3
|
)
|
—
|
|
|||||||||
|
Short-term debt and current portion of long-term debt and capital lease obligations
|
31.9
|
|
1.0
|
|
14.7
|
|
—
|
|
47.6
|
|
|||||||||
|
Other current liabilities
|
213.9
|
|
74.9
|
|
27.9
|
|
—
|
|
316.7
|
|
|||||||||
|
Total current liabilities
|
522.5
|
|
191.8
|
|
116.9
|
|
(85.3
|
)
|
745.9
|
|
|||||||||
|
Long-term debt and capital lease obligations
|
904.3
|
|
1.4
|
|
11.5
|
|
—
|
|
917.2
|
|
|||||||||
|
Intercompany loan payable
|
—
|
|
40.9
|
|
67.1
|
|
(108.0
|
)
|
—
|
|
|||||||||
|
Other long-term liabilities
|
121.1
|
|
133.4
|
|
12.4
|
|
—
|
|
266.9
|
|
|||||||||
|
Total liabilities
|
1,547.9
|
|
367.5
|
|
207.9
|
|
(193.3
|
)
|
1,930.0
|
|
|||||||||
|
Total shareholders' equity and noncontrolling interests
|
522.4
|
|
431.3
|
|
159.1
|
|
(590.4
|
)
|
522.4
|
|
|||||||||
|
Total liabilities and shareholders' equity
|
$
|
2,070.3
|
|
$
|
798.8
|
|
$
|
367.0
|
|
$
|
(783.7
|
)
|
$
|
2,452.4
|
|
||||
140
QUAD/GRAPHICS, INC.
NOTES TO CONSOLIDATED FINANCIAL STATEMENTS
(In millions, except share and per share data and unless otherwise indicated)
Condensed Consolidating Statement of Cash Flows
For the Year Ended
December 31, 2018
|
Quad/Graphics,
Inc. |
Guarantor Subsidiaries
|
Non-Guarantor Subsidiaries
|
Eliminations
|
Total
|
|||||||||||||||
|
OPERATING ACTIVITIES
|
|||||||||||||||||||
|
Net cash from (used in) operating activities
|
$
|
145.1
|
|
$
|
65.6
|
|
$
|
49.9
|
|
$
|
—
|
|
$
|
260.6
|
|
||||
|
INVESTING ACTIVITIES
|
|||||||||||||||||||
|
Purchases of property, plant and equipment
|
(23.7
|
)
|
(45.3
|
)
|
(27.3
|
)
|
—
|
|
(96.3
|
)
|
|||||||||
|
Acquisition related investing activities—net of cash acquired
|
—
|
|
(76.4
|
)
|
5.0
|
|
—
|
|
(71.4
|
)
|
|||||||||
|
Intercompany investing activities
|
(151.0
|
)
|
(81.2
|
)
|
(0.6
|
)
|
232.8
|
|
—
|
|
|||||||||
|
Other investing activities
|
29.4
|
|
13.3
|
|
4.5
|
|
—
|
|
47.2
|
|
|||||||||
|
Net cash from (used in) investing activities
|
(145.3
|
)
|
(189.6
|
)
|
(18.4
|
)
|
232.8
|
|
(120.5
|
)
|
|||||||||
|
FINANCING ACTIVITIES
|
|||||||||||||||||||
|
Proceeds from issuance of long-term debt
|
—
|
|
—
|
|
7.8
|
|
—
|
|
7.8
|
|
|||||||||
|
Payments of long-term debt and capital lease obligations
|
(31.7
|
)
|
(2.1
|
)
|
(5.7
|
)
|
—
|
|
(39.5
|
)
|
|||||||||
|
Borrowings on revolving credit facilities
|
2,536.3
|
|
—
|
|
27.4
|
|
—
|
|
2,563.7
|
|
|||||||||
|
Payments on revolving credit facilities
|
(2,536.3
|
)
|
—
|
|
(24.8
|
)
|
—
|
|
(2,561.1
|
)
|
|||||||||
|
Purchases of treasury stock
|
(36.7
|
)
|
—
|
|
—
|
|
—
|
|
(36.7
|
)
|
|||||||||
|
Payment of cash dividends
|
(62.9
|
)
|
—
|
|
—
|
|
—
|
|
(62.9
|
)
|
|||||||||
|
Intercompany financing activities
|
144.9
|
|
127.0
|
|
(39.1
|
)
|
(232.8
|
)
|
—
|
|
|||||||||
|
Other financing activities
|
(4.8
|
)
|
—
|
|
—
|
|
—
|
|
(4.8
|
)
|
|||||||||
|
Net cash from (used in) financing activities
|
8.8
|
|
124.9
|
|
(34.4
|
)
|
(232.8
|
)
|
(133.5
|
)
|
|||||||||
|
Effect of exchange rates on cash and cash equivalents
|
—
|
|
—
|
|
(1.5
|
)
|
—
|
|
(1.5
|
)
|
|||||||||
|
Net increase (decrease) in cash and cash equivalents
|
8.6
|
|
0.9
|
|
(4.4
|
)
|
—
|
|
5.1
|
|
|||||||||
|
Cash and cash equivalents at beginning of year
|
51.7
|
|
2.0
|
|
10.7
|
|
—
|
|
64.4
|
|
|||||||||
|
Cash and cash equivalents at end of year
|
$
|
60.3
|
|
$
|
2.9
|
|
$
|
6.3
|
|
$
|
—
|
|
$
|
69.5
|
|
||||
141
QUAD/GRAPHICS, INC.
NOTES TO CONSOLIDATED FINANCIAL STATEMENTS
(In millions, except share and per share data and unless otherwise indicated)
Condensed Consolidating Statement of Cash Flows
For the Year Ended
December 31, 2017
|
Quad/Graphics,
Inc. |
Guarantor Subsidiaries
|
Non-Guarantor Subsidiaries
|
Eliminations
|
Total
|
|||||||||||||||
|
OPERATING ACTIVITIES
|
|||||||||||||||||||
|
Net cash from (used in) operating activities
|
$
|
974.5
|
|
$
|
(647.3
|
)
|
$
|
16.8
|
|
$
|
—
|
|
$
|
344.0
|
|
||||
|
INVESTING ACTIVITIES
|
|||||||||||||||||||
|
Purchases of property, plant and equipment
|
(27.5
|
)
|
(43.9
|
)
|
(14.5
|
)
|
—
|
|
(85.9
|
)
|
|||||||||
|
Divestiture related investing activities
|
8.4
|
|
5.7
|
|
—
|
|
—
|
|
14.1
|
|
|||||||||
|
Acquisition related investing activities—net of cash acquired
|
—
|
|
—
|
|
—
|
|
—
|
|
—
|
|
|||||||||
|
Intercompany investing activities
|
(18.1
|
)
|
632.7
|
|
(0.3
|
)
|
(614.3
|
)
|
—
|
|
|||||||||
|
Other investing activities
|
0.9
|
|
21.6
|
|
2.1
|
|
—
|
|
24.6
|
|
|||||||||
|
Net cash from (used in) investing activities
|
(36.3
|
)
|
616.1
|
|
(12.7
|
)
|
(614.3
|
)
|
(47.2
|
)
|
|||||||||
|
FINANCING ACTIVITIES
|
|||||||||||||||||||
|
Proceeds from issuance of long-term debt
|
375.0
|
|
—
|
|
—
|
|
—
|
|
375.0
|
|
|||||||||
|
Payments of long-term debt and capital lease obligations
|
(523.3
|
)
|
(2.9
|
)
|
(4.3
|
)
|
—
|
|
(530.5
|
)
|
|||||||||
|
Borrowings on revolving credit facilities
|
706.7
|
|
—
|
|
11.8
|
|
—
|
|
718.5
|
|
|||||||||
|
Payments on revolving credit facilities
|
(725.7
|
)
|
—
|
|
(10.3
|
)
|
—
|
|
(736.0
|
)
|
|||||||||
|
Purchases of treasury stock
|
(3.8
|
)
|
—
|
|
—
|
|
—
|
|
(3.8
|
)
|
|||||||||
|
Payment of cash dividends
|
(62.5
|
)
|
—
|
|
—
|
|
—
|
|
(62.5
|
)
|
|||||||||
|
Intercompany financing activities
|
(645.1
|
)
|
30.2
|
|
0.6
|
|
614.3
|
|
—
|
|
|||||||||
|
Other financing activities
|
(8.1
|
)
|
(4.3
|
)
|
—
|
|
—
|
|
(12.4
|
)
|
|||||||||
|
Net cash from (used in) financing activities
|
(886.8
|
)
|
23.0
|
|
(2.2
|
)
|
614.3
|
|
(251.7
|
)
|
|||||||||
|
Effect of exchange rates on cash and cash equivalents
|
—
|
|
—
|
|
0.1
|
|
—
|
|
0.1
|
|
|||||||||
|
Net increase (decrease) in cash and cash equivalents
|
51.4
|
|
(8.2
|
)
|
2.0
|
|
—
|
|
45.2
|
|
|||||||||
|
Cash and cash equivalents at beginning of year
|
0.3
|
|
10.2
|
|
8.7
|
|
—
|
|
19.2
|
|
|||||||||
|
Cash and cash equivalents at end of year
|
$
|
51.7
|
|
$
|
2.0
|
|
$
|
10.7
|
|
$
|
—
|
|
$
|
64.4
|
|
||||
142
QUAD/GRAPHICS, INC.
NOTES TO CONSOLIDATED FINANCIAL STATEMENTS
(In millions, except share and per share data and unless otherwise indicated)
Condensed Consolidating Statement of Cash Flows
For the Year Ended
December 31, 2016
|
Quad/Graphics,
Inc. |
Guarantor Subsidiaries
|
Non-Guarantor Subsidiaries
|
Eliminations
|
Total
|
|||||||||||||||
|
OPERATING ACTIVITIES
|
|||||||||||||||||||
|
Net cash from (used in) operating activities
|
$
|
676.2
|
|
$
|
(340.8
|
)
|
$
|
18.2
|
|
$
|
—
|
|
$
|
353.6
|
|
||||
|
INVESTING ACTIVITIES
|
|||||||||||||||||||
|
Purchases of property, plant and equipment
|
(35.9
|
)
|
(46.8
|
)
|
(23.4
|
)
|
—
|
|
(106.1
|
)
|
|||||||||
|
Acquisition related investing activities—net of cash acquired
|
(0.9
|
)
|
0.9
|
|
—
|
|
—
|
|
—
|
|
|||||||||
|
Intercompany investing activities
|
(62.4
|
)
|
368.1
|
|
3.8
|
|
(309.5
|
)
|
—
|
|
|||||||||
|
Other investing activities
|
(4.5
|
)
|
18.1
|
|
3.7
|
|
—
|
|
17.3
|
|
|||||||||
|
Net cash from (used in) investing activities
|
(103.7
|
)
|
340.3
|
|
(15.9
|
)
|
(309.5
|
)
|
(88.8
|
)
|
|||||||||
|
FINANCING ACTIVITIES
|
|||||||||||||||||||
|
Proceeds from issuance of long-term debt
|
—
|
|
—
|
|
19.7
|
|
—
|
|
19.7
|
|
|||||||||
|
Payments of long-term debt and capital lease obligations
|
(195.7
|
)
|
(3.5
|
)
|
(2.3
|
)
|
—
|
|
(201.5
|
)
|
|||||||||
|
Borrowings on revolving credit facilities
|
806.1
|
|
—
|
|
65.8
|
|
—
|
|
871.9
|
|
|||||||||
|
Payments on revolving credit facilities
|
(857.9
|
)
|
—
|
|
(60.1
|
)
|
—
|
|
(918.0
|
)
|
|||||||||
|
Purchases of treasury stock
|
(8.8
|
)
|
—
|
|
—
|
|
—
|
|
(8.8
|
)
|
|||||||||
|
Payment of cash dividends
|
(61.1
|
)
|
—
|
|
—
|
|
—
|
|
(61.1
|
)
|
|||||||||
|
Intercompany financing activities
|
(285.9
|
)
|
0.2
|
|
(23.8
|
)
|
309.5
|
|
—
|
|
|||||||||
|
Other financing activities
|
28.8
|
|
(0.3
|
)
|
—
|
|
—
|
|
28.5
|
|
|||||||||
|
Net cash from (used in) financing activities
|
(574.5
|
)
|
(3.6
|
)
|
(0.7
|
)
|
309.5
|
|
(269.3
|
)
|
|||||||||
|
Effect of exchange rates on cash and cash equivalents
|
—
|
|
—
|
|
(0.6
|
)
|
—
|
|
(0.6
|
)
|
|||||||||
|
Net increase (decrease) in cash and cash equivalents
|
(2.0
|
)
|
(4.1
|
)
|
1.0
|
|
—
|
|
(5.1
|
)
|
|||||||||
|
Cash and cash equivalents at beginning of year
|
2.3
|
|
14.3
|
|
7.7
|
|
—
|
|
24.3
|
|
|||||||||
|
Cash and cash equivalents at end of year
|
$
|
0.3
|
|
$
|
10.2
|
|
$
|
8.7
|
|
$
|
—
|
|
$
|
19.2
|
|
||||
143
QUAD/GRAPHICS, INC.
NOTES TO CONSOLIDATED FINANCIAL STATEMENTS
(In millions, except share and per share data and unless otherwise indicated)
Note 23
.
New Accounting Pronouncements
In August 2018, the Financial Accounting Standards Board (“FASB”) issued Accounting Standards Update 2018-15 “Intangibles—Goodwill and Other—Internal-Use Software (Subtopic 350-40): Customer's Accounting for Implementation Costs Incurred in a Cloud Computing Arrangement That Is a Service Contract” (“ASU 2018-15”), which aligns the requirements for capitalizing implementation costs incurred in a cloud computing arrangement that is a service contract with the requirements for capitalizing implementation costs incurred to develop or obtain internal-use software. This guidance is effective for interim and annual periods beginning after December 15, 2019, with early adoption permitted. Entities are allowed to apply either a retrospective or prospective transition approach to adopt the guidance. The Company is evaluating the impact of the adoption of ASU 2018-15 on the consolidated financial statements.
In August 2018, the FASB issued Accounting Standards Update 2018-14 “Compensation—Retirement Benefits—Defined Benefit Plans—General (Subtopic 715-20): Disclosure Framework—Changes to the Disclosure Requirements for Defined Benefit Plans” (“ASU 2018-14”), which adds, removes and clarifies year-end disclosure requirements related to defined benefit pension and other postretirement plans. This guidance is effective for annual periods ending after December 15, 2020, with early adoption permitted. This new guidance will require a retrospective adoption approach. The Company is evaluating the impact of the adoption of ASU 2018-14 on the notes to the consolidated financial statements.
In August 2018, the FASB issued Accounting Standards Update 2018-13 “Fair Value Measurement (Topic 820): Disclosure Framework—Changes to the Disclosure Requirements for Fair Value Measurement” (“ASU 2018-13”), which changes the requirements on fair value measurements by removing, modifying or adding certain disclosures. This guidance is effective for interim and annual periods beginning after December 15, 2019, with early adoption permitted. Entities electing to early adopt are permitted to early adopt the eliminated or modified disclosure requirements and delay the adoption of all the new disclosure requirements until their effective date. The adoption of ASU 2018-13 requires the application of a combination of the prospective and retrospective methods of transition, depending on the topic of disclosure. The Company is evaluating the impact of the adoption of ASU 2018-13 on the notes to the consolidated financial statements.
In February 2018, the FASB issued Accounting Standards Update 2018-02 “Income Statement—Reporting Comprehensive Income (Topic 220): Reclassification of Certain Tax Effects from Accumulated Other Comprehensive Income” (“ASU 2018-02”), which will give entities the option to reclassify tax effects stranded in accumulated other comprehensive loss as a result of tax reform into accumulated deficit. The guidance requires the entity to disclose whether or not it has elected to reclassify the tax effects related to the Tax Act, as well as the entity's policy for releasing income tax effects from accumulated other comprehensive loss. The guidance is effective for interim and annual periods beginning after December 15, 2018, with early adoption permitted in periods for which financial statements have not yet been issued or made available for issuance, including in the period the Tax Act was enacted. Entities that choose to adopt ASU 2018-02 in an annual or interim period after the period of enactment will be able to choose whether to apply the amendments retrospectively to each period in which the effect of the Tax Act is recognized, or to apply the amendments in the period of adoption. The Company has adopted this standard as of January 1, 2018, applying the amendments in the period of adoption. The Company has elected to reclassify the stranded tax effects related to the change in federal tax rate due to enactment of the Tax Act for all items in accumulated other comprehensive loss. As a result of the adoption of ASU 2018-02, the Company has reclassified
$2.9 million
from accumulated other comprehensive loss to decrease accumulated deficit. See
Note 19
, “
Accumulated Other Comprehensive Loss
,” for the breakout of the impact by component.
144
QUAD/GRAPHICS, INC.
NOTES TO CONSOLIDATED FINANCIAL STATEMENTS
(In millions, except share and per share data and unless otherwise indicated)
In August 2017, the FASB issued Accounting Standards Update 2017-12 “Derivatives and Hedging (Topic 815): Targeted Improvements to Accounting for Hedging Activities” (“ASU 2017-12”), which simplifies and reduces the complexity of the hedge accounting requirements and better aligns an entity's financial reporting for hedging relationships with its risk management activities. The guidance is effective for interim and annual periods beginning after December 15, 2018, with early adoption permitted. This new guidance will require a modified retrospective adoption approach to existing hedging relationships as of the adoption date. The Company has adopted this standard as of January 1, 2018, and the adoption of ASU 2017-12 did not have a material impact on the consolidated financial statements.
In March 2017, the FASB issued
ASU 2017-07
, which requires that an employer disaggregate the service cost component from net benefit cost and provides guidance on how to present the service costs and other components of net benefit costs in the statement of operations. Under the new standard, an entity must report the service cost component in the same line item as other compensation costs. The other components of net benefit cost are required to be presented in the statement of operations separately from the service cost component and outside the subtotal of operating income. The guidance is effective for interim and annual periods beginning after December 15, 2017, and requires a retrospective adoption approach for the classification of components of net periodic benefit cost in the statement of operations. The Company has adopted this standard as of January 1, 2018, applying a retrospective adoption approach and utilizing the practical expedient that permits the use of the amounts disclosed in previous filings for net pension income as the estimation basis for the presentation of the prior comparative periods. See
Note 1
, “
Basis of Presentation and Summary of Significant Accounting Policies
,” for additional accounting policy and transition disclosures and
Note 15
, “
Employee Retirement Plans
,” for the components of net pension income.
In January 2017, the FASB issued Accounting Standards Update 2017-04 “Intangibles—Goodwill and Other (Topic 350): Simplifying the Test for Goodwill Impairment” (“ASU 2017-04”), which eliminates Step 2 as part of the goodwill impairment test. The amount of the impairment charge to be recognized would now be the amount by which the carrying value exceeds the reporting unit's fair value. The loss to be recognized cannot exceed the amount of goodwill allocated to that reporting unit. The amendments in ASU 2017-04 are effective for annual or interim goodwill impairment tests in fiscal years beginning after December 15, 2019. Early adoption is permitted for interim and annual goodwill impairment tests performed on testing dates after January 1, 2017. The Company elected to early adopt this standard and has applied this guidance to all goodwill impairment analyses performed after January 1, 2018.
In November 2016, the FASB issued Accounting Standards Update 2016-18 “Statement of Cash Flows (Topic 230): Restricted Cash” (“ASU 2016-18”), which clarifies guidance on the classification and presentation of restricted cash in the statement of cash flows. The guidance is effective for interim and annual periods beginning after December 15, 2017, and requires a retrospective adoption approach. The Company has adopted this standard as of January 1, 2018, and as a result, the Company has condensed the line items “cash and cash equivalents” and “restricted cash” into one line on the consolidated balance sheets. The Company has also made adjustments to the consolidated statements of cash flows, which included removing certain line items related to the transfer of restricted cash, and adjusting beginning and ending cash balances to reflect the newly condensed “cash and cash equivalents” line item within the consolidated balance sheets. The adoption of ASU 2016-18 did not have a material impact on the consolidated financial statements.
145
QUAD/GRAPHICS, INC.
NOTES TO CONSOLIDATED FINANCIAL STATEMENTS
(In millions, except share and per share data and unless otherwise indicated)
In June 2016, the FASB issued Accounting Standards Update 2016-13 “Financial Instruments—Credit Losses (Topic 326): Measurement of Credit Losses on Financial Instruments” (“ASU 2016-13”), which changes the impairment model for most financial assets and certain other instruments. Under the new guidance, entities will be required to measure expected credit losses for financial instruments, including trade receivables, based on historical experience, current conditions and reasonable forecasts. This guidance is effective for interim and annual periods beginning after December 15, 2019, with early adoption permitted for interim and annual periods beginning after December 15, 2018. This new guidance will require a modified retrospective transition approach, where the entity will need to apply a cumulative-effect adjustment to retained earnings (accumulated deficit) as of the beginning of the first reporting period in which the guidance is adopted. The Company is evaluating the impact of the adoption of ASU 2016-13 on the consolidated financial statements.
In February 2016, the FASB issued Accounting Standards Update 2016-02 “Leases (Topic 842)” (“ASU 2016-02”), which establishes a right-of-use model requiring a lessee to record a right-of-use asset and a lease liability on the balance sheet for all leases with terms longer than twelve months. Leases will be classified as either finance or operating, with classification affecting the pattern of expense recognition. The guidance also requires additional disclosures to enable users of financial statements to understand the amount, timing and uncertainty of cash flows arising from leases. This guidance is effective for interim and annual periods beginning after December 15, 2018, with early adoption permitted. The FASB approved a proposal to allow a prospective transition approach, in which only the current year financial statements would need to be reported under the new accounting model. The Company elected that option and will present the current year financial statements in accordance with Topic 842, while prior year comparative periods will be presented under Topic 840.
The Company developed a comprehensive project plan and established a cross-functional implementation team to evaluate the impact of the standard. The project plan included evaluating the Company's lease portfolio, analyzing the standard’s impact on the Company’s various types of lease contracts and identifying the reporting requirements of the new standard. The Company completed the analysis and implementation of a system and performing data validation that will assist in meeting the standard’s reporting and disclosure requirements. The Company elected the available practical expedients and implemented changes to its processes and internal controls to enable the preparation of financial information upon adoption.
The Company has adopted the standard as of January 1, 2019, applying the modified retrospective transition approach for all leases existing at, or entered into after, January 1, 2019. The Company is in the final stages of calculating the transition adjustment, which requires companies to record a right-of-use asset and lease liability for all operating leases valued at the present value of the remaining leases payments, discounted using the discount rate for the lease at the transition date. The impact of the transition adjustment is estimated to be
$130.0 million
to
$140.0 million
to the consolidated balance sheets, with no impact to the consolidated statements of operations.
Note 24
.
Subsequent Events
Acquisition of Periscope
On
January 3, 2019
, the Company completed the acquisition of
Periscope
, a creative agency headquartered in Minneapolis, Minnesota, for a net preliminary purchase price of
$121.1 million
, excluding acquired cash.
Periscope
provides a comprehensive service offering, including media buying and analytics, creative and account management. Periscope also has packaging design and premedia services that complement Quad’s print-production capabilities.
146
QUAD/GRAPHICS, INC.
NOTES TO CONSOLIDATED FINANCIAL STATEMENTS
(In millions, except share and per share data and unless otherwise indicated)
Senior Secured Credit Facility Amendment
The Company completed the third amendment to the April 28, 2014 Senior Secured Credit Facility on
January 31, 2019
. This third amendment was completed to provide Quad with the liquidity and structural flexibility to consummate the proposed acquisition of LSC and to extend existing maturities by (a) increasing the aggregate amount of the existing revolving credit facility from
$725.0 million
to
$800.0 million
in two tranches, with the first tranche of approximately
$82.8 million
maturing on January 4, 2021 and the second tranche of approximately
$717.2 million
with a delayed draw feature and term of five years, maturing on January 31, 2024; (b) increasing the aggregate amount of the existing Term Loan A from
$375.0 million
to
$825.0 million
in two tranches, with the first tranche of approximately
$32.4 million
maturing on January 4, 2021 and the second tranche of approximately
$792.6 million
with a term of five years, maturing on January 31, 2024; and (c) increasing the aggregate amount of the existing Term Loan B from
$300.0 million
to
$500.0 million
with a term of
seven
years, maturing on January 31, 2026. The Company intends that the loans available under the amended revolving credit facility will be used to repay, refinance, repurchase, redeem, exchange or otherwise terminate LSC’s existing indebtedness prior to, in connection with or following the consummation of the merger, and to pay transaction expenses.
Borrowings under the revolving credit facility and delayed draw Term Loan A made under the Senior Secured Credit Facility will initially bear interest at
2.50%
in excess of reserve adjusted LIBOR, or
1.50%
in excess of an alternate base rate, and borrowing under the Term Loan B will initially bear interest at
5.00%
in excess of reserve adjusted LIBOR, or
4.00%
in excess of an alternative base rate at the Company’s option.
The following amendments were made to the quarterly financial covenants to which the Company is subject (all
financial terms, numbers and ratios are as defined in the Senior Secured Credit Facility, as amended by the third amendment):
|
•
|
On a rolling twelve-month basis, the minimum interest coverage ratio, defined as consolidated EBITDA to consolidated cash interest expense, cannot be less than
3.00
to 1.00.
|
|
•
|
A new financial covenant was added to the Senior Secured Credit Facility that requires the Company to maintain liquidity, defined as unrestricted cash and permitted investments of the Company and its subsidiaries (subject to certain conditions) plus the aggregate amount of the unused revolving credit facility commitments, of not less than
$300.0 million
at any time during the period from six months prior to the maturity date of the Company’s Senior Unsecured Notes until the earlier of the date on which (a) such Senior Unsecured Notes are repaid in full or (b) the maturity date of such Senior Unsecured Notes is extended to a date that is at least 91 days later than the latest maturity date under the Senior Secured Credit Facility. The maturity date of the Company’s Senior Unsecured Notes is currently May 1, 2022.
|
In addition to those covenants, the following amendment was made to certain limitations on acquisitions, indebtedness, liens, dividends and repurchases of capital stock set forth in the Senior Secured Credit Facility:
|
•
|
If the Company’s total net leverage ratio is equal to or greater than
2.75
to 1.00 (as defined in the
Senior Secured Credit Facility
), the Company is prohibited from making greater than
$120.0 million
of annual dividend payments, capital stock repurchases and certain other payments. If the total net leverage ratio is less than
2.75
to 1.00, there are no such restrictions.
|
The Senior Secured Credit Facility remains secured by substantially all of the unencumbered assets of the Company. The Senior Secured Credit Facility also requires the Company to provide additional collateral to the lenders in certain limited circumstances. See Note 11, “Debt,” for the Company’s covenant requirements as of December 31, 2018.
147
QUAD/GRAPHICS, INC.
NOTES TO CONSOLIDATED FINANCIAL STATEMENTS
(In millions, except share and per share data and unless otherwise indicated)
Definitive Agreement to Acquire LSC Communications, Inc. and Joint Proxy Statement/Prospectus
As previously disclosed, on October 30, 2018, the Company and LSC entered into a definitive agreement, pursuant to which Quad will acquire LSC in an all-stock transaction valued at approximately
$1.3 billion
, including the refinancing of LSC’s debt and assumption of other obligations. The acquisition is subject to customary closing conditions including regulatory approval and approval by the shareholders of both companies.
On December 13, 2018, Quad and LSC each received a request for additional information and documentary material (the “Second Request”) from the U. S. Department of Justice (the “DOJ”) in connection with the DOJ’s review of the transactions contemplated by the definitive agreement. Issuance of the Second Request extends the waiting period under the HSR Act until 30 days after both Quad and LSC have substantially complied with the Second Request or such later time as the parties may agree with the DOJ, unless the waiting period is terminated earlier by the DOJ.
The Company’s Registration Statement on Form S-4, including as a part thereof the joint proxy statement/prospectus of Quad and LSC, was effective on February 4, 2019. Quad shareholders as of the close of business on January 16, 2019, the record date, are entitled to vote on a proposal to approve the issuance of shares of Quad class A common stock in connection with the acquisition of LSC at the Quad special meeting on February 22, 2019. LSC stockholders as of the close of business on the record date are entitled to vote upon, among other things, a proposal to adopt the definitive agreement for Quad to acquire LSC at the LSC special meeting on February 22, 2019.
If the acquisition is consummated, LSC’s stockholders will be entitled to receive, for each issued and outstanding share of LSC common stock owned immediately prior to the effective time of the acquisition, 0.625 shares of Quad class A common stock.
Quad and LSC cannot consummate the acquisition unless, among other things, Quad shareholders approve the issuance of shares of Quad class A common stock in connection with the acquisition and LSC stockholders adopt the acquisition agreement, the expiration of the waiting period under the HSR Act and other required regulatory approvals, and the satisfaction or waiver of the other closing conditions specified in the agreement.
Quad continues to expect the acquisition to be consummated in mid-2019.
Declaration of Quarterly Dividend
On
February 19, 2019
, the Company declared a quarterly dividend of
$0.30
per share, which will be paid on
March 8, 2019
.
148
|
Item 9.
|
Changes in and Disagreements with Accountants on Accounting and Financial Disclosure
|
Not applicable.
|
Item 9A.
|
Controls and Procedures
|
Disclosure Controls and Procedures
The Company’s management, with the participation of the Company’s principal executive officer and principal financial officer, has evaluated the effectiveness of the design and operation of the Company’s disclosure controls and procedures (as such term is defined in Rules 13a-15(e) and 15d-15(e) under the Securities Exchange Act of 1934) as of the end of the period covered by this report and has concluded that, as of the end of such period, the Company’s disclosure controls and procedures were effective.
Changes in Internal Control Over Financial Reporting
During the year ended December 31, 2018, the Company implemented new controls as part of its efforts to adopt the new leasing standard (ASU 2016-02). In particular, new controls were implemented related to monitoring the adoption process and evaluating the analysis used in the development of disclosures required before the standard’s effective date. The Company evaluated the design of these new controls before adoption during the year ended December 31, 2018. As the implementation process continues, the Company expects there will be additional changes in internal control over financial reporting. Other than the foregoing, there were no changes in the Company’s internal control over financial reporting (as defined in Rules 13a-15(f) and 15d-15(f) under the Securities Exchange Act of 1934) that occurred during the fiscal quarter ended
December 31, 2018
, that have materially affected, or are reasonably likely to materially affect, the Company’s internal control over financial reporting.
Management’s Report on Internal Control Over Financial Reporting
The Company’s management, including the Company’s Chairman, President and Chief Executive Officer and Executive Vice President and Chief Financial Officer, is responsible for establishing and maintaining adequate internal control over financial reporting, as such term is defined in Rules 13a-15(f) and 15d-15(f) of the Securities Exchange Act of 1934. The Company’s internal control over financial reporting is designed to provide reasonable assurance regarding the reliability of financial reporting and the preparation of published financial statements in accordance with generally accepted accounting principles.
The Company’s management, including the Company’s Chairman, President and Chief Executive Officer and Executive Vice President and Chief Financial Officer, has assessed the effectiveness of the Company’s internal control over financial reporting based on the framework in
Internal Control—Integrated Framework (2013)
issued by the Committee of Sponsoring Organizations of the Treadway Commission. As allowed by SEC guidance, management excluded from its assessment the internal control over financial reporting at Ivie, which was acquired on February 21, 2018, and Rise, in which the Company acquired a controlling financial interest on March 14, 2018. The operations that were excluded from the assessment constitute approximately 5% of consolidated total current assets, approximately 4% of consolidated net sales and approximately 4% of consolidated cost of sales as of and for the year ended December 31, 2018. Based on this assessment, the Company’s management has concluded that, as of
December 31, 2018
, the Company’s internal control over financial reporting was effective based on that framework.
Because of its inherent limitations, internal control over financial reporting may not prevent or detect misstatements. Also, projections of any evaluation of the effectiveness to future periods are subject to the risk that the controls may become inadequate because of changes in conditions, or that the degree of compliance with the policies or procedures may deteriorate.
Deloitte & Touche LLP, the Company’s independent registered public accounting firm, issued an audit report on the effectiveness of the Company’s internal control over financial reporting as of
December 31, 2018
, which is included herein.
149
Audit Report of Independent Registered Public Accounting Firm
The audit report required under this Item 9A, “Controls and Procedures,” is contained in Item 8, “Financial Statements and Supplementary Data,” of Part II of this Annual Report on Form 10-K under the heading “Report of Independent Registered Public Accounting Firm.”
|
Item 9B.
|
Other Information
|
The Company has no other information to report pursuant to this item.
150
PART III
|
Item 10.
|
Directors, Executive Officers and Corporate Governance
|
The information required by this Item with respect to directors and Section 16 compliance is included under the captions “Election of Directors” and “Miscellaneous—Section 16(a) Beneficial Ownership Reporting Compliance,” respectively, in the Company’s definitive Proxy Statement for its
2019
Annual Meeting of Shareholders (“Proxy Statement”) and is hereby incorporated herein by reference. Information with respect to the executive officers of the Company appears in Part I, Item 1, “Business,” of this Annual Report on Form 10-K. The information required by this Item with respect to audit committees and audit committee financial experts is included under the caption “Corporate Governance—Board Committees—Audit Committee” in the Proxy Statement and is incorporated herein by reference.
The Company has adopted a Code of Business Conduct that applies to all of the Company’s employees, including the Company’s Chief Executive Officer, Chief Financial Officer, Controller and other persons performing similar functions. The Company has posted a copy of the Code of Business Conduct on its website at www.QUAD.com, and such Code of Business Conduct is available in print, without charge, to any shareholder who requests it from the Company’s Secretary. The Company intends to satisfy the disclosure requirements under Item 5.05 of Form 8-K regarding amendments to, or waivers from, the Code of Business Conduct by posting such information on its website at www.QUAD.com. The Company is not including the information contained on its website as part of, or incorporating it by reference into, this Annual Report on Form 10-K.
|
Item 11.
|
Executive Compensation
|
The information required by this Item is included under the captions “Compensation of Executive Officers,” “Director Compensation,” “Compensation Committee Report,” “Corporate Governance—Board Committees—Compensation Committee Interlocks and Insider Participation,” “Miscellaneous—Assessment of Compensation-Related Risk,” and “CEO Pay Ratio” in the Proxy Statement and is hereby incorporated herein by reference.
|
Item 12.
|
Security Ownership of Certain Beneficial Owners and Management and Related Stockholder Matters
|
The information required by this Item with respect to security ownership of certain beneficial owners and management is included under the caption “Stock Ownership of Management and Others” in the Proxy Statement and is hereby incorporated by reference.
151
Equity Compensation Plan Information
The following table sets forth information with respect to compensation plans under which equity securities of the Company are authorized for issuance as of
December 31, 2018
. The table does not include employee benefit plans intended to meet the qualification requirements of Section 401(a) of the
Internal Revenue Code
. All equity compensation plans are described more fully in
Note 17
, “
Equity Incentive Programs
,” to the consolidated financial statements in Part II, Item 8, “Financial Statements and Supplementary Data,” of this Annual Report on Form 10-K.
|
Plan Category
|
Number of securities to be issued upon the exercise of outstanding options, warrants and rights
|
Weighted average exercise price of outstanding options, warrants and rights
(2)
|
Number of securities remaining available for future issuance under equity compensation plans (excluding securities reflected in the first column)
|
|||||||
|
Equity compensation plans approved by security holders
(1)
|
3,621,884
|
|
$
|
24.31
|
|
1,571,841
|
|
|||
|
Equity compensation plans not approved by security holders
|
—
|
|
—
|
|
—
|
|
||||
|
Total
|
3,621,884
|
|
$
|
24.31
|
|
1,571,841
|
|
|||
______________________________
|
(1)
|
Consists of the Company’s 2010 Omnibus Incentive Plan. Awards under the Omnibus Plan may consist of incentive awards, stock options, stock appreciation rights, performance shares, performance share units, shares of class A stock, restricted stock, restricted stock units, deferred stock units or other stock-based awards as determined by the Company’s Board of Directors.
|
|
(2)
|
The weighted average exercise price of outstanding options, warrants and rights only includes stock options.
|
|
Item 13.
|
Certain Relationships and Related Transactions, and Director Independence
|
The information required by this Item is included under the caption “Corporate Governance” in the Proxy Statement and is hereby incorporated by reference.
|
Item 14.
|
Principal Accountant Fees and Services
|
The information required by this Item is included under the caption “Miscellaneous—Independent Registered Public Accounting Firm” in the Proxy Statement and is hereby incorporated by reference.
152
PART IV
|
Item 15.
|
Exhibit Index and Financial Statement Schedules
|
|
1.
|
Consolidated financial statements—The consolidated financial statements listed in the accompanying index to consolidated financial statements are filed as part of this Annual Report on Form 10-K.
|
|
2.
|
Financial statement schedule—All financial statement schedules are omitted since the required information is not present or is not present in amounts sufficient to require submission of the schedules, or because the information required is included in the consolidated financial statements and notes thereto.
|
|
3.
|
Exhibits—The exhibits listed in the accompanying “Exhibit Index” are filed as part of this Annual Report on Form 10-K.
|
153
INDEX TO CONSOLIDATED FINANCIAL STATEMENTS
|
Page in this Form 10-K
|
||
154
EXHIBIT INDEX
The exhibits listed in the exhibit index below are filed as part of this Annual Report on Form 10-K.
|
Exhibit Number
|
Exhibit Description
|
|
|
|
||
155
|
Exhibit Number
|
Exhibit Description
|
|
|
Certain other instruments, which would otherwise be required to be listed above, have not been so listed as such instruments do not authorize long-term debt securities in an amount that exceeds 10% of the total assets of Quad/Graphics, Inc. and its subsidiaries on a consolidated basis. Quad/Graphics, Inc. agrees to furnish a copy of any such instrument to the Securities and Exchange Commission upon request.
|
||
156
|
Exhibit Number
|
Exhibit Description
|
|
157
|
Exhibit Number
|
Exhibit Description
|
|
|
(99)
|
Proxy Statement for the 2019 Annual Meeting of Shareholders. [To be filed with the Securities and Exchange Commission under Regulation 14A within 120 days after December 31, 2018; except to the extent specifically incorporated by reference, the Proxy Statement for the 2019 Annual Meeting of Shareholders shall not be deemed to be filed with the Securities and Exchange Commission as part of this Annual Report on Form 10‑K.]
|
|
|
(101)
|
Financial statements from the Annual Report on Form 10-K of Quad/Graphics, Inc. for the year ended December 31, 2018 formatted in eXtensible Business Reporting Language (XBRL): (i) the Consolidated Statements of Operations, (ii) the Consolidated Statements of Comprehensive Income (Loss), (iii) the Consolidated Balance Sheets, (iv) the Consolidated Statements of Cash Flows, (v) the Consolidated Statements of Shareholders' Equity, (vi) the Notes to Consolidated Financial Statements, and (vii) document and entity information.
|
|
______________________________
|
*
|
The disclosure schedules and similar attachments to this agreement are not being filed herewith. The registrant agrees to furnish supplementally a copy of any such schedules or attachments to the Securities and Exchange Commission upon request.
|
|
++
|
A management contract or compensatory plan or arrangement.
|
|
Item 16.
|
Form 10-K Summary
|
None.
158
SIGNATURES
Pursuant to the requirements of Section 13 or 15(d) of the Securities Exchange Act of 1934, the Registrant has duly caused this report to be signed on its behalf by the undersigned, thereunto duly authorized, on this
20th
day of
February 2019
.
|
QUAD/GRAPHICS, INC.
|
||||
|
By:
|
/s/ J. Joel Quadracci
|
|||
|
J. Joel Quadracci
|
||||
|
Chairman, President and Chief Executive Officer
|
||||
Pursuant to the requirements of the Securities Exchange Act of 1934, this report has been signed below by the following persons on behalf of the Registrant and in the capacities and on the dates indicated.
|
Signature
|
Title
|
Date
|
||
|
/s/ J. Joel Quadracci
|
Chairman, President and Chief Executive Officer
|
February 20, 2019
|
||
|
J. Joel Quadracci
|
(Principal Executive Officer)
|
|||
|
/s/ David J. Honan
|
Executive Vice President and Chief Financial Officer
|
February 20, 2019
|
||
|
David J. Honan
|
(Principal Financial Officer)
|
|||
|
/s/ Anne M. Bauer
|
Executive Director and Chief Accounting Officer
|
February 20, 2019
|
||
|
Anne M. Bauer
|
(Principal Accounting Officer)
|
|||
|
/s/ Mark A. Angelson
|
Director
|
February 20, 2019
|
||
|
Mark A. Angelson
|
||||
|
/s/ Douglas P. Buth
|
Director
|
February 20, 2019
|
||
|
Douglas P. Buth
|
||||
|
/s/ Kathryn Quadracci Flores
|
Director
|
February 20, 2019
|
||
|
Kathryn Quadracci Flores
|
||||
|
/s/ John C. Fowler
|
Director
|
February 20, 2019
|
||
|
John C. Fowler
|
||||
|
/s/ Stephen M. Fuller
|
Director
|
February 20, 2019
|
||
|
Stephen M. Fuller
|
||||
|
/s/ Christopher B. Harned
|
Director
|
February 20, 2019
|
||
|
Christopher B. Harned
|
||||
|
/s/ Jay O. Rothman
|
Director
|
February 20, 2019
|
||
|
Jay O. Rothman
|
||||
|
/s/ John S. Shiely
|
Director
|
February 20, 2019
|
||
|
John S. Shiely
|
||||
159
TABLE OF CONTENTS
Part IItem 1. BusinessItem 1A. Risk FactorsItem 1B. Unresolved Staff CommentsItem 2. PropertiesItem 3. Legal ProceedingsItem 4. Mine Safety DisclosuresPart IIItem 5. Market For The Registrant S Common Equity, Related Stockholder Matters and Issuer Purchases Of Equity SecuritiesItem 6. Selected Financial DataItem 7. Management S Discussion and Analysis Of Financial Condition and Results Of OperationsItem 7A. Quantitative and Qualitative Disclosures About Market RiskItem 8. Financial Statements and Supplementary DataNote 1. Basis Of Presentation and Summary Of Significant Accounting PoliciesNote 2. Revenue RecognitionNote 3. Acquisitions and Strategic InvestmentsNote 4. Restructuring, Impairment and Transaction-related ChargesNote 5. Goodwill and Other Intangible AssetsNote 6. ReceivablesNote 7. InventoriesNote 8. Property, Plant and EquipmentNote 9. Accrued Liabilities and Other Long-term LiabilitiesNote 10. Commitments and ContingenciesNote 11. DebtNote 12. Lease ObligationsNote 13. Income TaxesNote 14. Financial Instruments and Fair Value MeasurementsNote 15. Employee Retirement PlansNote 16. Earnings Per Share Attributable To Quad Common ShareholdersNote 17. Equity Incentive ProgramsNote 18. Shareholders EquityNote 19. Accumulated Other Comprehensive LossNote 20. Segment InformationNote 21. Geographic Area InformationNote 22. Separate Financial Information Of Subsidiary Guarantors Of IndebtednessNote 23. New Accounting PronouncementsNote 24. Subsequent EventsItem 9. Changes in and Disagreements with Accountants on Accounting and Financial DisclosureItem 9A. Controls and ProceduresItem 9B. Other InformationPart IIIItem 10. Directors, Executive Officers and Corporate GovernanceItem 11. Executive CompensationItem 12. Security Ownership Of Certain Beneficial Owners and Management and Related Stockholder MattersItem 13. Certain Relationships and Related Transactions, and Director IndependenceItem 14. Principal Accountant Fees and ServicesPart IVItem 15. Exhibit Index and Financial Statement SchedulesItem 16. Form 10-k Summary