RYDER SYSTEM INC
10-Ks and 10-Qs
|
|
|
|
|
|
|
|
|
|
|
|
|
|
|
|
|
|
|
|
|
|
|
|
|
|
|
|
|
|
|
|
|
|
|
|
|
|
|
|
|
|
|
|
|
|
||
UNITED STATES
SECURITIES AND EXCHANGE COMMISSION
Washington, D.C. 20549
FORM 10-K
|
þ
|
ANNUAL REPORT PURSUANT TO SECTION 13 OR 15(d)
OF THE SECURITIES EXCHANGE ACT OF 1934
|
For the fiscal year ended
December 31, 2017
OR
|
¨
|
TRANSITION REPORT PURSUANT TO SECTION 13 OR 15(d)
OF THE SECURITIES EXCHANGE ACT OF 1934
|
For the transition period from to
Commission File Number: 1-4364

RYDER SYSTEM, INC.
(Exact name of registrant as specified in its charter)
|
Florida
|
|
59-0739250
|
|
(State or other jurisdiction of incorporation or organization)
|
|
(I.R.S. Employer Identification No.)
|
|
11690 N.W. 105
th
Street,
Miami, Florida 33178
|
|
(305) 500-3726
|
|
(Address of principal executive offices, including zip code)
|
|
(Telephone number, including area code)
|
|
Securities registered pursuant to Section 12(b) of the Act:
|
||
|
Title of each class
|
|
Name of exchange on which registered
|
|
Ryder System, Inc. Common Stock ($0.50 par value)
|
|
New York Stock Exchange
|
Securities registered pursuant to Section 12(g) of the Act:
None
Indicate by check mark if the registrant is a well-known seasoned issuer, as defined in Rule 405 of the Securities Act. YES
þ
NO
¨
Indicate by check mark if the registrant is not required to file reports pursuant to Section 13 or Section 15(d) of the Act. YES
¨
NO
þ
Indicate by check mark whether the registrant (1) has filed all reports required to be filed by Section 13 or 15(d) of the Securities Exchange Act of 1934 during the preceding 12 months (or for such shorter period that the registrant was required to file such reports), and (2) has been subject to such filing requirements for the past 90 days. YES
þ
NO
¨
Indicate by check mark whether the registrant has submitted electronically and posted on its corporate Web site, if any, every Interactive Data File required to be submitted and posted pursuant to Rule 405 of Regulation S-T (§ 232.405 of this chapter) during the preceding 12 months (or for such shorter period that the registrant was required to submit and post such files). YES
þ
NO
¨
Indicate by check mark if disclosure of delinquent filers pursuant to Item 405 of Regulation S-K is not contained herein, and will not be contained, to the best of the registrant’s knowledge, in definitive proxy or information statements incorporated by reference in Part III of this Form 10-K or any amendment to this Form 10-K
þ
Indicate by check mark whether the registrant is a large accelerated filer, an accelerated filer, a non-accelerated filer, or smaller reporting company. See the definitions of “large accelerated filer,” “accelerated filer” and “smaller reporting company” in Rule 12b-2 of the Exchange Act.
|
Large accelerated filer
þ
|
|
Accelerated filer
¨
|
|
Non-accelerated filer
¨
|
|
Smaller reporting company
¨
|
Indicate by check mark whether the registrant is a shell company (as defined in Rule 12b-2 of the Act). YES
¨
NO
þ
The aggregate market value of the voting and non-voting common equity held by non-affiliates of the registrant computed by reference to the price at which the common equity was sold at June 30,
2017
was $
3,774,013,558
. The number of shares of Ryder System, Inc. Common Stock ($0.50 par value per share) outstanding at January 31,
2018
was
52,977,548
.
|
Documents Incorporated by Reference into this Report
|
|
Part of Form 10-K into which Document is Incorporated
|
|
Ryder System, Inc. 2018 Proxy Statement
|
|
Part III
|
|
|
|
|
RYDER SYSTEM, INC.
FORM 10-K ANNUAL REPORT
TABLE OF CONTENTS
|
|
|
Page No.
|
i
OVERVIEW
Ryder System, Inc. (Ryder) is a global leader in transportation and supply chain management solutions. Our operating segments are aggregated into reportable business segments based upon similar economic characteristics, products, services, customers and delivery methods. We are reporting our financial performance based on three business segments: (1) Fleet Management Solutions (FMS), which provides full service leasing and leasing with flexible maintenance options, commercial rental, and contract or transactional maintenance services of trucks, tractors and trailers to customers principally in the U.S., Canada and the U.K.; (2) Dedicated Transportation Solutions (DTS), which provides vehicles and drivers as part of a dedicated transportation solution in the U.S.; and (3) Supply Chain Solutions (SCS), which provides comprehensive supply chain solutions including distribution and transportation services in North America and Singapore. Dedicated transportation services provided as part of an integrated, multi-service, supply chain solution to SCS customers are reported in the SCS business segment.
For financial information and other information relating to each of our business segments and about our geographic areas, see Item 7, “Management’s Discussion and Analysis of Financial Condition and Results of Operations,” of this report and
Note 28
, "
Segment Reporting
," in the Notes to Consolidated Financial Statements.
MISSION AND STRATEGY
Ryder's mission is to provide innovative fleet management and supply chain solutions that are reliable, safe and efficient, enabling our customers to deliver on their promises. We seek to deliver valuable solutions that will compel customers to outsource their fleet management and supply chain needs to us. Our primary strategy is to grow our fleet management and supply chain outsourcing services by targeting private fleets not currently outsourcing their fleet-related services (FMS and DTS), as well as companies who have outsourced to other providers, and key industries (SCS) with innovative solutions, operational excellence, best in class talent and information technology. This strategy is supported by:
•
offering innovative products, solutions and support services that will create and strengthen customer relationships;
|
•
|
delivering operational excellence through continuous productivity and process improvements;
|
|
•
|
attracting, developing and retaining the best talent; and
|
|
•
|
deploying technology that will enable growth while improving operational efficiencies.
|
1
INDUSTRY AND OPERATIONS
|
Fleet Management Solutions
|
||||
Value Proposition
Through our FMS business, we provide our customers with a variety of fleet solutions that are designed to improve their competitive position. By outsourcing these services to us, our customers can focus on their core business, improve their efficiency and productivity, and lower their costs. Our FMS product offering is comprised of longer-term full service leasing as well as leasing with flexible maintenance options; shorter-term commercial truck rental; contract or transactional maintenance services; and value-added fleet support services such as insurance, vehicle administration and fuel services. In addition, we provide our customers the ability to purchase a large selection of used trucks, tractors and trailers through our used vehicle sales program. FMS also provides maintenance, fuel and other services for all vehicles used in DTS and SCS solutions.
Market Trends
The U.S. commercial fleet market is estimated to include
8.3 million
vehicles
,
of which
4.3 million
vehicles are with privately held companies,
1.5 million
vehicles are with for-hire carriers,
0.5 million
vehicles are leased from banks or other financial institutions, and
0.8 million
vehicles are in the lease and rental market
(1)
. The
4.3 million
vehicles privately owned by companies provide all or a portion of the transportation services for themselves rather than outsourcing those services to third parties such as Ryder. Several trends have been increasing the need for outsourcing: increased demand for efficiency and reliability; increased complexity and cost of buying and maintaining vehicles including technology, diagnostics, and training; labor issues including a shortage of qualified truck drivers and mechanics; as well as increased regulation and enforcement of safety requirements. Because of these trends, we believe the privately held fleets and the for-hire carriers will increasingly decide to outsource. Ryder also targets customers who are already outsourcing with other providers.
Similar trends apply to outsourcing in Canada, and the Canadian commercial fleet is estimated at
500,000
vehicles, of which approximately
17,000
vehicles are in the lease and rental market
(2)
. In the U.K., the commercial rental and lease market is estimated at
229,000
units
(3)
. The total lease and rental market in Ryder’s major markets totals over 1 million units. However, due to the trends described above, combined with our success in converting owners to outsourcing, the total market potential for Ryder is significantly higher.
Over the last several years, many key trends have been reshaping the transportation industry. We strongly believe these trends increase the value of our product offering. Companies that own and manage their own fleet of vehicles have put greater emphasis on the quality of their preventive maintenance and safety programs because of increased demand for efficiency and reliability. The maintenance and operation of commercial vehicles has become more complicated and expensive, requiring companies to spend a significant amount of time and money to keep up with new technology, diagnostics, retooling and training. Increased regulation and active enforcement efforts by federal and state governments require more stringent and costly operational processes and oversight. Fluctuating energy prices and alternative fuel technologies make it difficult for businesses to predict and manage fleet costs.
Operations
For the year ended December 31,
2017
, our global FMS business accounted for
58%
of our consolidated revenue.
U.S.
Ryder was founded in the U.S. in 1933. Our FMS customers in the U.S. range from small businesses to large national enterprises operating in a wide variety of industries, the most significant of which are transportation and warehousing, food and beverage, housing, business and personal services, and industrial. At December 31,
2017
, we had
533
operating locations, excluding ancillary storage locations, in
50
states and Puerto Rico. A location consists of a maintenance facility or “shop”. Our maintenance facilities typically include a shop for preventive maintenance and repairs, a service island for fueling, safety inspections and preliminary maintenance ch
ecks,
offices for sales and other personnel, and in many cases, a commercial rental vehicle counter. We also operate on-site at
172
customer locations, which primarily provide vehicle maintenance.
Canada
. We have been operating in Canada for over 50 years. At December 31,
2017
, we had
36
operating locations throughout 9 Canadian provinces. We also operated
14
maintenance facilities on-site at customer properties in Canada.
Europe.
We began operating in the U.K. in 1971. At December 31,
2017
, we had
60
operating locations primarily throughout the U.K. We also managed a network of
426
independent maintenance facilities in the U.K. to serve our customers when it is more effective than providing the service in a Ryder location. In addition to our typical FMS operations, we supply and manage vehicles, equipment and personnel for military organizations in the U.K. and Germany.
|
(1)
|
U.S. Fleet as of June
2017
, Class 3-8, IHS Markit Ltd. (formerly RL Polk)
|
|
(2)
|
Canada Outsourced Fleet Market as of September
2017
, Class 3-8, IHS Markit Ltd. (formerly RL Polk)
|
|
(3)
|
U.K. Lease and Rental HGV Market, Projection for December
2017
, Source: The Society of Motor Manufacturers & Traders (SMMT) 2010 & Ryder Internal Estimates
|
2
FMS Product Offerings
ChoiceLease
. Our lease offering, ChoiceLease, provides customers with vehicles, maintenance services, supplies, and related equipment necessary for operation of the vehicles while our customers furnish and supervise their own drivers and dispatch and exercise control over the vehicles. The ChoiceLease offering allows customers to select the terms of their lease alongside the level of maintenance they prefer, from full service or total bumper-to-bumper coverage to on-demand or pay-as-you-go maintenance. Our ChoiceLease customers receive the following benefits:
|
•
|
We are able to leverage our vehicle buying power for the benefit of our customers because we purchase a large number of vehicles from a limited number of manufacturers. Once we have signed an agreement with the customer, we acquire vehicles and components that are custom engineered to the customer’s requirements and lease the vehicles to the customer for periods generally ranging from three to seven years for trucks and tractors and typically ten years for trailers.
|
|
•
|
We offer ChoiceLease customers a complete maintenance program designed to reduce vehicle downtime through a preventive maintenance plan that is based on vehicle type and time or mileage intervals. Alternatively, we offer flexible maintenance options to our customers designed to provide them with choices on their preferred level of maintenance. Given our continued focus on improving the efficiency and effectiveness of our maintenance services, particularly in light of changing technology and increased regulation, we provide our ChoiceLease customers with a cost effective alternative to maintaining their own fleet of vehicles and the flexibility to choose the maintenance program that works for them.
|
|
•
|
Our customers have access to our extensive network of maintenance facilities and trained technicians for maintenance, vehicle repairs, 24-hour emergency roadside service, and replacement vehicles for vehicles that are temporarily out of service.
|
|
•
|
We typically retain vehicle residual risk exposure.
|
|
•
|
Customers have an opportunity to enhance their standard lease with additional fleet support services including our fuel and related services as described below; liability insurance coverage under our existing insurance policies and related insurance services; safety services including safety training, driver certification and loss prevention consulting; vehicle use and other tax reporting, permitting and licensing, and regulatory compliance (including hours of service administration); environmental services; and access to
RydeSmart
®
, a full-featured GPS fleet location, tracking, and vehicle performance management system and to our web-based fleet tool that provides customers with 24/7 access to key operational and maintenance management information about their fleets.
|
For the year ended December 31,
2017
, ChoiceLease revenue accounted for
57%
of our FMS total revenue. Prior to 2017, FMS reported this product as “full service lease.”
Commercial Rental
. We target rental customers that have a need to supplement their private fleet of vehicles on a short-term basis (one day up to one year in length), either because of seasonal increases in their business or discrete projects that require additional transportation resources. ChoiceLease customers also utilize our commercial rental fleet to handle their peak or seasonal business needs, as substitute vehicles while their lease vehicles are undergoing maintenance, and while they are awaiting delivery of new lease vehicles. Although a portion of our commercial rental business is purely occasional in nature, we focus on building long-term relationships with customers so that we become their preferred source for commercial vehicle rentals. Our rental representatives assist in selecting a vehicle that satisfies a customer’s needs and supervise the rental process, which includes execution of a rental agreement and a vehicle inspection. In addition to vehicle rental, we may extend liability insurance coverage under our existing policies to our rental customers as well as the benefits of cost savings and convenience of our comprehensive fuel services program. For the year ended December 31,
2017
, commercial rental revenue accounted for
17%
of our FMS total revenue.
SelectCare
. Through our SelectCare product line, we provide maintenance services to customers who do not choose to lease vehicles from us. Our SelectCare customers commit to utilizing our extensive network of maintenance facilities and trained technicians to maintain the vehicles they own or lease from third parties. There are several bundles of services available to SelectCare customers including full service contract maintenance and preventive only maintenance. We can also customize the services to include ancillary maintenance and/or fleet support services. Vehicles covered under this offering are typically serviced at our own facilities. However, based on the size and complexity of a customer’s fleet, we may operate an on-site maintenance facility at the customer’s location.
Additionally, our lease and contract maintenance customers periodically require additional maintenance and repair services that are not included in their lease or contract maintenance agreements. For example, additional maintenance and repair services may arise when a customer damages a leased vehicle. In addition, because of our existing relationships with the customer, we may provide service on their owned vehicles and charge the customer on an hourly basis for work performed. By servicing all of our customers’ maintenance needs, we create stronger, long-term relationships and have greater opportunity to
3
provide customers with a wide range of outsourcing solutions. For the year ended December 31,
2017
, SelectCare revenue accounted for
10%
of our FMS total revenue. Prior to 2017, FMS reported this product as “contract maintenance” and “contract-related maintenance.”
The following table provides information regarding the number of vehicles and customers by FMS product offering at December 31,
2017
:
|
|
U.S.
|
Foreign
|
Total
|
|||||||||
|
|
Vehicles
|
Customers
|
Vehicles
|
Customers
|
Vehicles
|
Customers
|
||||||
|
ChoiceLease
|
115,200
|
11,500
|
23,900
|
2,400
|
139,100
|
13,900
|
||||||
|
Commercial rental
(1)
|
31,000
|
30,700
|
6,800
|
5,700
|
37,800
|
36,400
|
||||||
|
SelectCare
(2)
|
48,400
|
1,700
|
6,000
|
400
|
54,400
|
2,100
|
||||||
______________
|
(1)
|
Commercial rental customers include customers who rented a vehicle for more than 3 days during the year and includes approximately
7,400
ChoiceLease customers
|
|
(2)
|
SelectCare customers include approximately
1,020
ChoiceLease customers
|
More recently, we have contracted with large private fleet operators and for-hire carriers to provide maintenance on demand, particularly in geographic areas where these customers do not have their own maintenance operations. The contract for on-demand maintenance services is based on a maintenance program that is designed to meet the customers' specific needs and all maintenance is performed only when and as requested by the customer. This product allows us to expand our customer base to include customers that have traditionally chosen to own and maintain their fleet of vehicles.
Fuel Services.
We provide our FMS customers with access to diesel fuel at competitive prices at approximately
450
of our maintenance facilities across the United States and Canada. We also provide fuel services such as fuel planning, fuel tax reporting, centralized billing, fuel cards and fuel monitoring. Although fuel sales do not have a significant impact on our FMS earnings, as it is largely a pass-through cost to customers, we believe allowing customers to leverage our fuel buying power is a significant and valuable benefit to our customers. For the year ended December 31,
2017
, fuel services revenue accounted for
15%
of our FMS total revenue.
Used Vehicles.
We primarily sell our used vehicles at one of our
53
retail sales centers throughout North America (
14
of which are co-located at an FMS shop), at our branch locations or through our website at
www.Usedtrucks.Ryder.com
. Typically, before we offer used vehicles for sale, our technicians ensure that the vehicles are
Road Ready
®
, which means that they have passed a comprehensive, multi-point performance inspection based on specifications formulated through our maintenance program. Our retail sales centers throughout North America allow us to leverage our maintenance expertise and strong brand reputation to realize higher sales proceeds than in the wholesale market. Given our focus on maximizing sales proceeds, we generally sell our used vehicles through retail centers for prices in excess of book value. However, the extent to which we are able to realize a gain on the sale of used vehicles is dependent upon various other factors, including the general state of the used vehicle market, the supply and demand for used commercial vehicles in retail and wholesale markets, the age and condition of the vehicle at the time of its disposal and vehicle depreciation estimates.
FMS Business Strategy
Our FMS business strategy is to be the leading provider of fleet management outsourcing services for light, medium and heavy duty commercial highway vehicles. This strategy revolves around the following interrelated goals and priorities:
|
•
|
Drive profitable fleet growth by (1) successfully implementing sales and marketing initiatives designed to compel private fleet operators and for-hire carriers to outsource all or some portion of their fleet management needs to us; (2) offering innovative products, solutions and support services that will create and strengthen new and existing customer relationships; and (3) completing targeted acquisitions;
|
|
•
|
Deliver a consistent, industry-leading and cost-effective maintenance program to our customers through continued process improvement and re-design, productivity initiatives and technology improvements; and
|
|
•
|
Optimize asset utilization and management, particularly with respect to our rental fleet, used vehicle operations and maintenance facility infrastructure.
|
Successfully driving our fleet growth strategy will require significant capital investments in lease and commercial rental vehicles. As a result, during periods of significant growth, our free cash flow may be negative due to capital outlay upfront to purchase vehicles which are leased over 3 to 10 year periods.
4
Competition
As an alternative to using our fleet management services, companies choose to provide these services for themselves or to obtain similar or alternative services from other third-party vendors.
Our FMS business segment competes with companies providing similar services on a national, regional and local level. Many regional and local competitors provide services on a national level through their participation in various cooperative programs. Competitive factors include price, equipment, maintenance, service and geographic coverage. We compete with finance lessors, truck and trailer manufacturers and independent dealers who provide full service lease products, finance leases, extended warranty maintenance, rental and other transportation services. With the growth of our on-demand maintenance product, we also face competition from managed maintenance providers who are hired to coordinate and manage the maintenance of large fleets of vehicles through a network of third-party maintenance providers. Value-added differentiation of the ChoiceLease, SelectCare and commercial rental services, as well as continued commitment to offer innovative products and solutions, such as natural gas and electric vehicles, have been and will continue to be our emphasis.
|
Dedicated Transportation Solutions
|
||||
Value Proposition
Through our DTS business segment, we combine equipment, maintenance, drivers, administrative services and additional services to provide customers with a dedicated transportation solution that is designed to increase their competitive position, improve risk management and integrate their transportation needs with their overall supply chain. Such additional services include routing and scheduling, fleet sizing, safety, regulatory compliance, risk management, technology and communication systems support, including on-board computers and other technical support. These additional services allow us to address, on behalf of our customers, labor challenges associated with maintaining a private fleet of vehicles, such as driver recruitment and retention, government regulation, including electronic logging devices and hours of service regulations, Department of Transportation (DOT) audits and workers’ compensation. Our DTS solution offers a high degree of specialization to meet the needs of customers with sophisticated service requirements such as tight delivery windows, high-value or time-sensitive freight, closed-loop distribution, multi-stop shipments, specialized equipment and integrated transportation needs.
Market Trends
The U.S. dedicated contract carriage market is estimated to be $14 billion
(1)
. This market is affected by many of the same trends that impact our FMS business, including the tightening of capacity in the current U.S. trucking market. The administrative requirements relating to regulations issued by the DOT regarding driver screening, training and testing, as well as record keeping and other costs associated with the hours of service requirements, make our DTS product an attractive alternative to private fleet and driver management. With the changes in the regulatory environment, including the electronic logging device mandate that became effective in late 2017, there continues to be increased pressure on the availability of qualified truck drivers, whose supply continues to tighten, and shippers are seeking dedicated capacity from quality transportation and logistics providers. In addition, market demand for just-in-time delivery creates a need for well-defined routing and scheduling plans that are based on comprehensive asset utilization analysis and fleet rationalization studies offered as part of our DTS services.
Operations/Product Offerings
For the year ended December 31,
2017
, our global DTS business accounted for
15%
of our consolidated revenue. At December 31,
2017
, we had
184
DTS customer accounts in the U.S. Because it is highly customized, our DTS product is particularly attractive to companies that operate in industries that have time-sensitive deliveries or special handling requirements, as well as companies who require specialized equipment. Because DTS accounts typically operate in a limited geographic area, most of the drivers assigned to these accounts are short haul drivers, meaning they return home at the end of each work day. Although a significant portion of our DTS operations are located at customer facilities, our DTS business also utilizes and benefits from our extensive network of FMS facilities, including the FMS maintenance network which services all vehicles used in DTS solutions.
In order to customize an appropriate DTS transportation solution for our customers, our DTS logistics specialists perform a transportation analysis using advanced logistics planning and operating tools. Based on this analysis, they formulate a logistics design that includes the routing and scheduling of vehicles, the efficient use of vehicle capacity and overall asset utilization. The goal of each customized plan is to create a distribution system that optimizes freight flow while meeting a customer’s service goals. A team of DTS transportation specialists can then implement the plan by leveraging the resources, expertise and technological capabilities of both our FMS and SCS businesses.
(1)
Armstrong & Associates - Third-Party Logistics Market Results and Trends for 2017, June 2017
5
To the extent a distribution plan includes multiple modes of transportation (air, rail, sea and highway), our DTS team, in conjunction with our SCS transportation specialists, selects appropriate transportation modes and carriers, places the freight, monitors carrier performance and audits billing. In addition, through our SCS business, we can reduce costs and add value to a DTS customer’s distribution system by aggregating orders into loads, looking for shipment consolidation opportunities and organizing loads for vehicles that are returning from their destination point back to their point of origin (backhaul).
DTS Business Strategy
Our DTS business strategy is to focus on customers who need specialized equipment, specialized handling or integrated services. This strategy revolves around the following interrelated goals and priorities:
•
Increase market share with customers in the energy and utility, metals and mining, retail, construction, healthcare, and food and beverage industries;
•
Leverage the support and talent of the FMS sales team to compel private fleet operators to outsource all or some of their transportation needs to us;
•
Align the DTS business with other SCS product lines to create revenue opportunities and improve operating efficiencies in both segments; and
•
Improve competitiveness in the non-specialized and non-integrated customer segments.
Competition
Our DTS business segment competes with truckload carriers and other dedicated providers servicing on a national, regional and local level. Competitive factors include price, equipment, maintenance, service and geographic coverage, driver availability and operations expertise. We are able to differentiate the DTS product offering by leveraging FMS and integrating the DTS services with those of SCS to create a more comprehensive transportation solution for our customers. Our strong safety record and focus on customer service enable us to uniquely meet the needs of customers with high-value products that require specialized handling in a manner that differentiates us from truckload carriers.
|
Supply Chain Solutions
|
||||
Value Proposition
Through our SCS business, we offer a broad range of innovative logistics management services that are designed to optimize customers' supply chain and address customers' key business requirements. The organization is aligned by industry verticals (Automotive, Technology and Healthcare, Consumer Packaged Goods and Retail, and Industrial) to enable our teams to focus on the specific needs of their customers. Our SCS product offerings are organized into four categories: dedicated services, distribution management, transportation management and professional services. These offerings are supported by a variety of information technology and engineering solutions that are an integral part of our SCS services. These product offerings can be provided independently or as an integrated solution to optimize supply chain effectiveness. A key aspect of our value proposition is our operational execution, which is an important differentiator in the marketplace.
Market Trends
Global logistics is an approximately
$8.5 trillion
market, of which approximately
$826 billion
is outsourced. Logistics spending in the markets we are targeting in North America and Singapore equates to approximately
$2.0 trillion
, of which
$209 billion
is outsourced
(1)
. Outsourced logistics is a market with significant growth opportunity. More sophisticated supply chain practices are required as supply chains expand and become more complex, product needs continue to proliferate and companies look for lower cost supply chain alternatives. In addition, disruptions from unexpected events such as natural disasters have caused companies to focus on risk management of their supply chains. The more complicated the supply chain or the product requirements, the greater the need for companies to utilize the expertise of supply chain solution providers.
(1)
Armstrong & Associates - Third-Party Logistics Market Results and Trends for 2017, June 2017
6
Operations
For the year ended December 31,
2017
, our global SCS business accounted for
27%
of our consolidated revenue.
U.S.
At December 31,
2017
, we had
294
SCS customer accounts in the U.S., most of which are large enterprises that maintain large, complex supply chains. Most of our core SCS business operations are geographically located to maximize efficiencies and reduce costs. At December 31,
2017
, managed warehouse space totaled approximately
44
million square feet for the U.S. We also concentrate certain logistics expertise in locations not associated with specific customer sites. For example, our carrier procurement, contract management, freight bill audit and payment services, and transportation optimization and execution groups operate out of our logistics centers in Novi, Michigan and Fort Worth, Texas.
Mexico
. At December 31,
2017
, we had
120
SCS customer accounts and managed warehouse space totaling approximately
4.7
million square feet. Our Mexico operations offer a full range of SCS services and manage approximately
17,900
border crossings each month between Mexico and the U.S. and Canada, often highly integrated with our distribution and transportation operations.
Canada.
At December 31,
2017
, we had
43
SCS customer accounts and managed warehouse space totaling approximately
1.2 million
square feet. Given the proximity of this market to our U.S. and Mexico operations, the Canadian operations are highly coordinated with their U.S. and Mexico counterparts, managing cross-border transportation and freight movements.
Singapore.
At December 31,
2017
, we had
82
SCS customer accounts and managed warehouse space totaling approximately
363,000
square feet.
SCS Product Offerings
Distribution Management
. Our SCS business offers a wide range of services relating to a customer’s distribution operations, from designing a customer’s distribution network to managing distribution facilities. Services within the facilities generally include managing the flow of goods from the receiving function to the shipping function, coordinating warehousing and transportation for inbound and outbound material flows, handling import and export for international shipments, coordinating just-in-time replenishment of component parts to manufacturing and final assembly, and providing shipments to customer distribution centers or end customer delivery points, including support for e-commerce networks. Additional value-added services such as light assembly of components into defined units (kitting), packaging and refurbishment are also provided. For the year ended December 31,
2017
, distribution management solutions accounted for
47%
of our SCS revenue.
Dedicated Services.
Dedicated services are offered as part of an integrated supply chain solution to our customers. We fulfill transportation needs for our customers with a combination of outside carriers and dedicated services. The dedicated services offering combines the equipment, maintenance, drivers and additional services to provide a customer with a dedicated transportation solution, which combined with outside transportation, is designed to increase their competitive position, improve risk management and integrate their transportation needs with their overall supply chain. Such additional services include routing and scheduling, fleet sizing, safety, regulatory compliance, risk management, technology and communication systems support including on-board computer, and other technical support. These additional services allow us to address, on behalf of our customers, labor challenges associated with maintaining a private fleet of vehicles, such as driver recruitment and turnover, government regulation (including hours of service regulations), DOT audits and workers' compensation. Our dedicated services solution offers a high degree of specialization to meet the needs of customers with sophisticated service requirements such as tight delivery windows, high value or time-sensitive freight, closed-loop distribution, multi-stop shipments, specialized equipment and integrated transportation needs. Dedicated services operations are located at our customer facilities, and our dedicated offering utilizes and benefits from our extensive network of FMS facilities, which provides maintenance for all Ryder vehicles used in SCS solutions. For the year ended December 31,
2017
, approximately
34%
of our SCS revenue was related to dedicated services.
Transportation Management
. Our SCS business offers services relating to all aspects of a customer’s transportation network. Our team of transportation specialists provides shipment planning and execution, which includes shipment optimization, load scheduling and delivery confirmation through a series of technological and web-based solutions. Our transportation consultants, including our freight brokerage department, focus on carrier procurement of all modes of transportation with an emphasis on truck-based transportation, rate negotiation, and freight bill audit and payment services. In addition, our SCS business provides customers with capacity management services that are designed to meet backhaul opportunities and minimize excess miles. For the year ended December 31,
2017
, we purchased and/or executed
$5.2 billion
in freight moves on our customers' behalf. For the year ended December 31,
2017
, transportation management solutions accounted for
14%
of our SCS revenue.
7
Professional Services
. In conjunction with providing the SCS core services described previously, our SCS business offers a variety of knowledge-based services that support every aspect of a customer’s supply chain. Our SCS professionals are available to evaluate a customer’s existing supply chain to identify inefficiencies as well as opportunities for integration and improvement. Once the assessment is complete, we work with the customer to develop a supply chain strategy that will create the most value for the customer and their target clients. Once a customer has adopted a supply chain strategy, our SCS logistics team, supported by functional experts and representatives from our information technology, real estate and finance groups, work together to design a strategically focused supply chain solution. The solution may include both a network design that sets forth the number, location and function of key components of the network and a transportation solution that optimizes the mode or modes of transportation and route selection. In addition to providing the distribution and transportation expertise necessary to implement the supply chain solution, our SCS representatives can coordinate and manage all aspects of the customer’s supply chain provider network to assure consistency, efficiency and flexibility. For the year ended December 31,
2017
, knowledge-based professional services accounted for
5%
of our SCS revenue.
SCS Business Strategy
Our SCS business strategy is to offer our customers differentiated functional execution and proactive solutions from deep expertise in key industry verticals. The strategy revolves around the following interrelated goals and priorities:
|
•
|
Provide customers with best in class execution and quality through reliable and flexible supply chain solutions;
|
|
•
|
Develop innovative solutions and capabilities that drive value for our customer within our targeted industry verticals;
|
|
•
|
Create a culture of innovation and collaboration to share capabilities and solutions to meet our client’s needs;
|
|
•
|
Consistent focus on network optimization and continuous improvement; and
|
|
•
|
Successfully execute targeted sales and marketing growth strategies.
|
Competition
As an alternative to using our services, most companies choose to internally manage their own supply chains and logistics operations, although some choose to obtain similar or alternative services from other third-party vendors.
In the SCS business segment, we compete with a large number of companies providing similar services, each of which has a different set of core competencies. We compete with a handful of large, multi-service companies across all of our service offerings and industries. We also compete against other companies on specific service offerings (for example, in transportation management, distribution management or dedicated services) or in a specific industry. We face different competitors in each country or region where they may have a greater operational presence. Competitive factors include price, service, market knowledge, expertise in logistics-related technology and overall performance (e.g. timeliness, accuracy, and flexibility).
ACQUISITIONS
In addition to our continued focus on organic growth, acquisitions play an important role in enhancing our growth strategy. In assessing potential acquisition targets in our FMS business segment, we look for companies that would create value through operating synergies, leveraging our existing facility infrastructure, improving our geographic coverage and diversifying our customer base. In our DTS business segment, we are focusing on strategies for growth, including acquisitions that expand our capabilities and vertical market sector. In our SCS business segment, we focus on adding capabilities and product offerings, potentially expanding into new industries, diversifying our customer base within our current industries, and improving our competitive position.
CYCLICALITY
Ryder's business is impacted by economic and market conditions. In a strong economic cycle, there is generally more demand for our fleet management, dedicated and supply chain services. In a weak or volatile economy, demand for our services decreases and is inconsistent and considerably more unpredictable. Because of these factors, we have continued to focus on increasing the diversity of our customer base and strengthening our long-term business partnerships with our customers. Although we believe these efforts help mitigate the immediate impact of an economic downturn, during a protracted or severe economic downturn, customers are often unwilling to commit to a full-service lease or long-term supply chain contract. Because commercial rental and used vehicle sales are transactional, they are more cyclical in nature, and results can vary significantly in both the short- and long-term. We mitigate some of the potential impact of an economic downturn through a disciplined and centralized approach to asset management. This approach allows us to manage the size, mix and location of our operating fleet and used vehicle inventories to try and maximize asset utilization and used vehicle proceeds in both strong and weak market conditions.
8
ADMINISTRATION
Our financial administrative functions for the U.S. and Canada, including credit, billing and collections are consolidated into our Shared Services Center, a centralized processing center located in Alpharetta, Georgia. Our Shared Services Center also manages contracted third parties providing administrative finance and support services outside of the U.S. in order to reduce ongoing operating expenses and maximize our technology resources. This centralization results in more efficient and consistent centralized processing of selected administrative operations. Certain administrative functions are also performed at the Shared Services Center for our customers. The Shared Services Center’s main objectives are to enhance customer service through process standardization, create an organizational structure that will improve market flexibility and allow future reengineering efforts to be attained more easily at lower implementation costs.
REGULATION
Our business is subject to regulation by various federal, state, local and foreign governmental entities. The DOT and various federal and state agencies exercise broad powers over certain aspects of our business, generally governing such activities as authorization to engage in motor carrier operations, safety and financial reporting. The Federal Motor Carrier Safety Administration (FMCSA), under the DOT, manages a compliance and enforcement initiative partnering with state agencies designed to monitor and improve commercial vehicle motor safety, which uses roadside inspections and violations to measure motor carriers and drivers. In 2017, the FMCSA regulations mandating electronic logging devices in commercial motor vehicles went into effect for various aspects of our dedicated, supply chain and rental businesses.
We are also subject to a variety of requirements of national, state, provincial and local governments, including the U.S. Environmental Protection Agency and the Occupational Safety and Health Administration, which regulate safety, the management of hazardous materials, water discharges and air emissions, solid waste disposal and the release and cleanup of regulated substances. We must comply with licensing and other requirements imposed by the U.S. Department of Homeland Security and U.S. Customs Service as a result of increased focus on homeland security and our Customs-Trade Partnership Against Terrorism certification. We may also become subject to new or more restrictive regulations imposed by these agencies or other authorities relating to carbon controls and reporting, engine exhaust emissions, drivers’ hours of service, wage and hour requirements, security including data privacy and cyber security and ergonomics.
ENVIRONMENTAL
We have a long-standing commitment to sound environmental practices that reduce risk and build value for us and our customers. We have a history of adopting “green” designs and processes because they are efficient, cost-effective transportation solutions that improve our bottom line and bring value to our customers. We have maintained an environmental policy since 1991 and have updated it periodically as regulatory and customer needs have changed. Our environmental policy reflects our commitment to supporting the goals of sustainable development, environmental protection and pollution prevention in our business. We have adopted proactive environmental strategies that have advanced business growth and continued to improve our performance in ways that reduce emission outputs and environmental impact. Our environmental team works with operating employees to develop and administer programs in support of our environmental policy and to help ensure that environmental considerations are integrated into all business processes and decisions.
In establishing appropriate environmental objectives and targets for our wide range of business activities around the world, we focus on (1) the needs of our customers; (2) the communities in which we provide services; and (3) relevant laws and regulations. We regularly review and update our environmental management procedures, and information regarding our environmental activities is routinely disseminated throughout Ryder. In 2016, we published our 2014/2015 Corporate Sustainability Report Supplement, which includes new metrics related to our environmental and safety performance for the years 2014 and 2015. The report is publicly available on the company website at
www.ryder.com
by clicking on About Us and then selecting Sustainability. In addition, we have voluntarily responded to the Carbon Disclosure Project (CDP) since 2008, disclosing direct and indirect emissions resulting from our operations, and earned leadership status for the quality of our disclosure report submitted in 2017 for the 2016 performance year.
9
SAFETY
Our safety culture is founded upon a core commitment to the safety, health and well-being of our employees, customers and the community, a commitment that has made us a long-standing industry leader in safety. Safety is an integral part of our business strategy because preventing injuries and collisions improves employee quality of life, eliminates service disruptions to our customers, increases efficiency and improves customer satisfaction. As a core value, our focus on safety is embedded in our day-to-day operations, reinforced by many safety programs and continuous operational improvement and supported by a talented and dedicated safety organization.
We deploy relevant vehicle safety systems in the vehicles we operate, including active brake assistance, lane departure warning systems, stability control, and others, to enhance safety performance. We also install aftermarket safety monitoring systems that provide effective means for our operations teams to measure and improve driver performance. Training is also a key component of our safety program. Monthly safety training delivered by location safety committees cover specific and relevant safety topics and managers receive annual safety leadership training. In driving operations, we use certified driver trainers to on-board and train our drivers using first hand experienced certified driver trainers. Quarterly and remedial training is also delivered online to each driver through our highly interactive Ryder Pro-TREAD comprehensive lesson platform. Regular safety behavioral observations are conducted by managers throughout the organization everyday and remedial training and coaching takes place on the spot. Our safety policies require that all managers, supervisors and employees incorporate safe processes in all aspects of our business. Monthly safety scorecards are tracked and reviewed by management for progress toward key safety objectives. Our proprietary web-based safety tracking system, RyderSafetyNet
SM
, delivers proactive safety programs tailored to every location and helps measure safety activity effectiveness across the organization.
EMPLOYEES
At December 31,
2017
, we had approximately
36,100
full-time employees worldwide, of which
34,300
were employed in North America,
1,400
in Europe and
400
in Singapore. Currently we employ approximately
8,100
drivers and
5,900
technicians. We have approximately
23,200
hourly employees in the U.S., approximately
4,100
of which are organized by labor unions. Those employees organized by labor unions are principally represented by the International Brotherhood of Teamsters, the International Association of Machinists and Aerospace Workers and the United Auto Workers, and their wages and benefits are governed by
101
separate labor agreements which are renegotiated periodically. Although we have not experienced a material work stoppage or strike, these events can potentially occur given the types of businesses in which we currently engage. We consider the relationship with our employees to be good.
EXECUTIVE OFFICERS OF THE REGISTRANT
|
Name
|
Age
|
Position
|
||
|
Robert E. Sanchez
|
52
|
Chair and Chief Executive Officer
|
||
|
Art A. Garcia
|
56
|
Executive Vice President and Chief Financial Officer
|
||
|
Dennis C. Cooke
|
53
|
President, Global Fleet Management Solutions
|
||
|
John J. Diez
|
46
|
President, Dedicated Transportation Solutions
|
||
|
J. Steven Sensing
|
50
|
President, Global Supply Chain Solutions
|
||
|
Robert D. Fatovic
|
52
|
Executive Vice President, Chief Legal Officer and Corporate Secretary
|
||
|
Frank Lopez
|
43
|
Senior Vice President and Chief Human Resources Officer
|
||
|
Karen M. Jones
|
55
|
Executive Vice President and Chief Marketing Officer
|
||
|
John Gleason
|
61
|
Executive Vice President and Chief Sales Officer
|
||
|
Rajeev Ravindran
|
52
|
Senior Vice President and Chief Information Officer
|
||
|
Frank Mullen
|
48
|
Vice President and Controller
|
||
Robert E. Sanchez was appointed Chair of Ryder's Board in May 2013 and promoted to Chief Executive Officer and became a Board member in January 2013. Previously, Mr. Sanchez served as President and Chief Operating Officer from February 2012 to December 2012. He served as President, Global Fleet Management Solutions from September 2010 to February 2012 and as Executive Vice President and Chief Financial Officer from October 2007 to September 2010. He also previously served as Executive Vice President of Operations, U.S. Fleet Management Solutions from October 2005 to October 2007 and as Senior Vice President and Chief Information Officer from January 2003 to October 2005. Mr. Sanchez joined Ryder in 1993 and has held various other positions of increasing responsibility, including leadership positions in all three of Ryder's business segments.
10
Art A. Garcia has served as Executive Vice President and Chief Financial Officer since September 2010. Previously, Mr. Garcia served as Senior Vice President and Controller from October 2005 to August 2010, and as Vice President and Controller from February 2002 to September 2005. Mr. Garcia joined Ryder in 1997 and has held various other positions within Corporate Accounting.
Dennis C. Cooke has served as President, Global Fleet Management Solutions since February 2012. Previously, Mr. Cooke served as Senior Vice President and Chief of Operations, U.S. and Canada Fleet Management Solutions from July 2011 to February 2012. Prior to joining Ryder in July 2011, Mr. Cooke held various positions with General Electric (GE) and related companies, including Vice President and General Manager of GE Healthcare’s Global MRI business from 2000 to 2005. He then served as President and Chief Executive Officer of GE Security’s Homeland Protection business from 2005 to 2009, and continued serving in those roles from 2009 to 2011 after the business was acquired by the Safran Group and became Morpho Detection, Inc.
John J. Diez has served as President of Dedicated Transportation Solutions since March 2015. Previously, Mr. Diez served as Senior Vice President of Ryder Dedicated from March 2014 to February 2015, and as Senior Vice President of Asset Management from January 2011 to February 2014. Mr. Diez joined Ryder's Finance department in 2002 and has since held various positions within Finance including Senior Vice President Global Field Finance and Vice President and Chief Financial Officer of Fleet Management Solutions.
J. Steven Sensing has served as President of Global Supply Chain Solutions since March 2015. Previously, Mr. Sensing served as Vice President and General Manager of the Technology industry group from February 2007 to February 2015. In July 2014, he also added the Retail industry group under his leadership. Mr. Sensing joined Ryder in 1992 and has since held various positions within Dedicated Services, Transportation Management and Distribution Management.
Robert D. Fatovic has served as Executive Vice President, Chief Legal Officer and Corporate Secretary since May 2004. He previously served as Senior Vice President, U.S. Supply Chain Operations, Hi-Tech and Consumer Industries from December 2002 to May 2004. Mr. Fatovic joined Ryder’s Law department in 1994 as Assistant Division Counsel and has held various other positions within the Law department including Vice President and Deputy General Counsel.
Frank Lopez was appointed to Chief Human Resources Officer in February 2016. Previously, Mr. Lopez held the position of Senior Vice President, Global Human Resources Operations since July 2013. Mr. Lopez joined Ryder in 2002 and has since held various positions within the Human Resources, Labor Relations and Legal functions.
Karen M. Jones has served as Executive Vice President and Chief Marketing Officer since October 2014. She joined Ryder in September 2013 as Senior Vice President and Chief Marketing Officer. Prior to joining Ryder, Ms. Jones was Chief Marketing Officer for NRG/Reliant Energy, Inc from 2010 to 2013. Previously, Ms. Jones served as Senior Vice President of Marketing and Corporate Communications for DHL Express U.S. from 2006 to 2009 and as Vice President of Advertising, Brand Management and Promotion from 2004 to 2006. In addition, Ms. Jones has served in key positions responsible for worldwide brand advertising, sponsorship, and strategic alliances for Hewlett Packard.
John Gleason was appointed Executive Vice President and Chief Sales Officer in November 2015. Previously, Mr. Gleason served as Senior Vice President of Global Fleet Management Solutions from October 2009, when he joined Ryder, to October 2015. Prior to joining Ryder, Mr. Gleason served as Chief Sales Officer for Automatic Data Processing (ADP) from April 2005 to September 2009 and as Senior Vice President of Sales from July 1998 to April 2005.
Rajeev Ravindran joined Ryder and was appointed Senior Vice President and Chief Information Officer in January 2018. Mr. Ravindran has over 20 years of IT leadership experience and was previously the CIO and Group Vice President at JM Enterprises. Prior to JM, Rajeev worked in IT leadership roles at various companies including Interactive Metronome, Asista.com, and AutoNation. Rajeev has a degree in Electrical & Computer Engineering from the University of Miami.
Frank Mullen was appointed Vice President and Controller in September 2017. Mr. Mullen joined Ryder from Global Eagle Entertainment, a global provider of media, content, connectivity and data analytics, where he held the position of Senior Vice President and Chief Accounting Officer since 2016. From 2015 to 2016, he served as Vice President and Controller of Pinnacle Foods Inc., a manufacturer, marketer and distributor of branded food products. Prior to joining Pinnacle, Mr. Mullen held roles of increasing responsibility at Aramark, a provider of food service, facilities and uniform services, from 2000 through 2015, including Vice President and Assistant Controller from 2014 to 2015 and Associate Vice President – Corporate Accounting from 2006 to 2014. Mr. Mullen began his career in the Audit & Assurance practice of Arthur Andersen LLP. He holds a Bachelor of Science degree in accounting from Villanova University and is a Certified Public Accountant.
11
FURTHER INFORMATION
For further discussion concerning our business, see the information included in Items 7 and 8 of this report. Industry and market data used throughout Item 1 was obtained through a compilation of surveys and studies conducted by industry sources, consultants and analysts.
We make available free of charge through the Investor Relations page on our website at
www.ryder.com
our Annual Report on Form 10-K, quarterly reports on Form 10-Q, current reports on Form 8-K and all amendments to those reports as soon as reasonably practicable after such material is electronically filed with or furnished to the Securities and Exchange Commission. The SEC maintains an Internet site that contains our reports, proxy and information statements, and our other SEC filings. The address of the SEC's website is
www.sec.gov
.
In addition, our Corporate Governance Guidelines, Principles of Business Conduct and Board committee charters are posted on the Corporate Governance page of our website at
www.ryder.com
. Upon request to our Investor Relations page on our website at
www.ryder.com,
we will provide a copy of these documents to anyone, free of charge.
12
The following contains all known material risks that could affect our business.
Uncertain or unfavorable economic and industry conditions could adversely impact our business and operating results
.
Although macro-economic risk affects most industries, the transportation industry is particularly susceptible to changes in economic and market conditions as our business relies on the strength of our customers’ businesses and the level of confidence our customers have about future market conditions. Because of this, our business may begin to slow before market slowdowns, at the point of customer uncertainty, and may recover later than market recoveries, as our customers may continue to feel uncertain about future market conditions. The long-term ChoiceLease product offering and short-term rental of commercial vehicles comprise a large portion of our business. Our vehicles are leased or rented to customers that transport goods commercially so the demand for our products is directly tied to the production and sale of goods by our customers. As a result, when fewer goods are sold by our customers, demand for our services may decrease. Also, sudden changes in fuel prices and fuel shortages may adversely impact the total vehicle miles driven by our customers. If uncertainty and lack of customer confidence around macroeconomic and transportation industry conditions increase, they may impact our future growth prospects and our business and results of operations could be materially adversely affected.
In a weak or volatile economy, demand for our longer-term contractual services may decrease, waver or become less predictable as customers are often unwilling to commit to long-term lease, maintenance, dedicated services or supply chain contracts. Contractual-based services include ChoiceLease and SelectCare contracts in our FMS business segment, dedicated services in our DTS business segment and supply chain contracts in our SCS business segment. Accordingly, any sustained weakness in demand or a protracted economic downturn can negatively impact performance and operating results in our contractual-based service offerings. Although we experienced continued growth in ChoiceLease during
2017
, our customers still remain cautious about entering into long-term leases.
Customer uncertainty may serve to increase demand for our transactional services because they do not require a long-term commitment. Transactional-based services include commercial rental and used vehicle sales in our FMS business segment. Although commercial rental demand began to stabilize in the second half of
2017
, following a period of soft demand and uncertainty in the latter part of 2015 through the first half of 2017, rental demand may decline again or face more unexpected volatility in the future.
Our capital intensive business requires us to make capital decisions based upon projected customer activity levels
.
We make significant investments in rental vehicles to support our rental business based on anticipated customer demand. We make commitments to purchase the vehicles months in advance. We must predict fleet requirements and make commitments based on demand projections and various other factors. Missing our projections could result in too much or too little capacity in our rental fleet. Overcapacity could require us to dispose of vehicles at lower than anticipated pricing levels or result in asset write-downs and undercapacity could negatively impact our ability to reliably provide rental vehicles to our customers.
We bear the residual risk on the value of our vehicles
.
Impact on Used Vehicle Sales.
We generally bear the residual risk on the value of our vehicles. Beginning in the latter part of 2015 and continuing through 2017, we saw a weakening of conditions in the used vehicle sales market, which adversely affected used vehicle sales volume and pricing, especially for tractors. If the market for used vehicles further declines, or there is a concern regarding the quality, maintenance or condition of our vehicles, we may obtain lower sales proceeds upon the sale of used vehicles, which may impact the residual value estimates of our operating fleet.We sell our used vehicles through various channels, including retail sales centers, at our branch locations, through our website at
www.UsedTrucks.Ryder.com
, as well as through the wholesale market. Pricing and demand for used vehicles varies among selling channels, particularly between the retail and wholesale markets, as we generally obtain lower proceeds on vehicles sold through wholesale channels. If we are unable to meet our targeted fleet counts through our projected mix of retail versus wholesale sales, we may be required to sell more vehicles than planned through the wholesale market, which will impact our sales proceeds. In the latter part of 2016, we increased wholesaling activity which contributed to lower used vehicle sales results in 2016 and 2017.
13
Impact on our ChoiceLease Product Line
. Changes in residual values also impact the overall competitiveness of our ChoiceLease product line, as estimated sales proceeds are a significant component of the overall price of the lease. Additionally, technology changes and sudden changes in supply and demand, together with other market factors beyond our control, vary from year to year and from vehicle to vehicle, making it difficult to accurately predict residual values used in calculating our depreciation expense. Although we have developed disciplines related to the management and maintenance of our vehicles designed to maintain the value of our used vehicles, there is no assurance that these practices will sufficiently reduce the residual risk. For a detailed discussion on our accounting policies and assumptions relating to depreciation and residual values, please see the “Critical Accounting Estimates - Depreciation and Residual Value Guarantees” section in Management's Discussion and Analysis of Financial Condition and Results of Operations.
Our inability to maintain appropriate commercial rental fleet utilization rates could adversely impact our profitability
.
In our commercial rental product line, we purchase vehicles and optimize the size and mix of the commercial rental fleet based upon our expectations of overall market demand. As a result, we bear the risk for ensuring that we have the proper vehicles in the right condition and location to effectively capitalize on market demand in order to drive the highest levels of utilization and revenue per unit. We employ a sales force and operations team on a full-time basis to manage and optimize this product line; however, their efforts may not be sufficient to overcome a significant change in market demand in the rental business. In contrast, in our ChoiceLease product line, we typically do not purchase vehicles until we have an executed contract with a customer.
Failure to execute our growth strategy and develop, market and consistently deliver high-quality services that meet customer expectations, may cause our revenue and earnings to suffer
.
Our long-term strategy includes growing our outsourcing services by targeting private fleets new to outsourcing and key industries with innovative solutions, operational excellence, and best-in-class talent and information technology. To successfully execute on this strategy, we must continue to focus on developing effective solutions that meet our existing and target customers’ evolving needs. This requires the skills, experience and efforts of our management team and continued investment in new technology, sales and marketing. Expanding our service offerings may also require us to enter into new markets and encounter new competitive challenges, which may strain our management, capital resources, information systems and customer service.
Notwithstanding our efforts, these new or changed service offerings may not meet customer demands, prove to be profitable or succeed in the long term. If we do not make the right strategic investments to respond to current customer needs and establish and develop new customer relationships, our ability to develop and maintain a competitive advantage and continue to grow could be negatively affected.
Even with the right solutions, our growth strategy depends on delivering consistent operational excellence and strong customer service. Our inability to deliver our services and solutions as promised on a consistent basis, or our customers having a negative experience or otherwise becoming dissatisfied, can impair our relationships with new or existing customers and adversely affect our brand and reputation, which could, in turn, adversely affect revenue and earnings growth.
We may fail to respond adequately or in a timely manner to innovative changes in new technology in our industry
.
In recent years, our industry has been characterized by rapid changes in technology, leading to innovative transportation and logistics concepts that could change the way our industry does business. For example, new concepts are currently under development for more advanced electric vehicles, automatic or semi-automatic self-driving vehicles and drones. There may be additional innovations impacting the transportation, trucking and supply chain/logistics industries that we cannot yet foresee. Our inability to quickly adapt to and adopt new innovations in products and processes desired by our customers may result in a significant loss of demand for our service offerings. In addition, advances in technology may require us to increase investments in order to remain competitive, and our customers may not be willing to accept higher prices to cover the cost of these investments. Our lease and rental fleets could become unfavorable with our customers or obsolete within a relatively short period of time, and we may no longer be able to find buyers for our used vehicles. An increase in customer use of electric vehicles could reduce the need for our vehicle maintenance services, diesel vehicles and related offerings. Likewise, self-driving vehicles may reduce the need for our dedicated service offerings, where, in addition to a vehicle, Ryder provides a driver as part of an integrated, full service customer solution.
14
Failure to maintain, upgrade and consolidate our information technology networks could adversely affect us
.
The success of our strategic initiatives designed to increase our sales and capture a greater percentage of the outsourced transportation and supply chain markets is dependent in varying degrees on the timely delivery and the functionality of information technology systems to support them. Extended delays or cost overruns in securing, developing and otherwise implementing technology solutions to support the new business initiatives we are developing now, and will be developing in the future, would delay and possibly even prevent us from realizing the projected benefits of these initiatives. Advances in technology require increased investments to remain competitive, and our customers may not be willing to accept higher prices to cover the cost of these investments. In addition, our reputation with our customers may suffer if outages, system failures or delays in timely access to data occur in legacy information technology systems that support key business processes.
We are continuously upgrading and consolidating our systems, including enhancing legacy systems, replacing legacy systems with successor systems and acquiring new systems with newer functionality. These types of activities subject us to additional costs and inherent risks associated with replacing and modifying these systems, including impairment of our ability to provide our services, potential disruption of our internal control structure, substantial capital expenditures, additional administration and operating expenses, retention of sufficiently skilled personnel to implement and operate the new systems, demands on management time, and other risks and costs of delays or difficulties in transitioning to new systems or integrating new systems into our current systems. Our system implementations may not result in productivity improvements at a level that outweighs the costs of implementation, or at all. In addition, the implementation of new technology systems may cause disruptions in our business operations and have an adverse effect on our business and operations, if not anticipated and appropriately mitigated.
We may be subject to cybersecurity risks, some of which are beyond our control
.
We depend on the proper functioning and availability of our information systems in operating our business, including communications and data processing systems. It is important that the data processed by these systems remains confidential, as it often includes competitive customer information, confidential customer transaction data, employee records, and key financial and operational results and statistics. Failure to prevent or mitigate data loss or system intrusions from cybersecurity attacks or other security breaches could expose us or our vendors or customers to a risk of loss or misuse of such information, adversely affect our operating results, result in litigation or potential liability for us and otherwise harm our business. Likewise, data privacy breaches by employees and others who access our systems may pose a risk that sensitive customer or vendor data may be exposed to unauthorized persons or to the public, adversely impacting our customer service, employee relationships and our reputation.
In addition, portions of our business utilize information systems that provide critical services to both our employees and our customers. Cyber incidents that impact the availability, reliability, speed, accuracy, or other proper functioning of these information systems could have a significant impact on our operations. Some of our software applications are utilized by third parties who provide outsourced administrative functions, which may increase the risk of a cybersecurity incident. Our information systems are protected through physical and software safeguards as well as backup systems considered appropriate by management. However, we may be unable to fully protect against the possibility of damage or breach created by natural disasters, power loss, telecommunications failures, cybersecurity or other security attacks in every potential circumstance that may arise.
We and the vehicle and equipment manufacturers in our FMS business rely on a small number of suppliers
.
We buy vehicles and related equipment from a relatively small number of original equipment manufacturers (OEMs) in our FMS business. Some of our vehicle manufacturers rely on a small concentration of suppliers for certain vehicle parts, components and equipment. A discrete event in a particular OEM's or supplier's industry or location, or adverse regional economic conditions impacting an OEM or supplier's ability to provide vehicles or a particular component, could adversely impact our FMS business and profitability. In addition, our business and reputation could also be negatively impacted if any parts, components or equipment from one of our suppliers suffer from broad-based quality control issues or become the subject of a product recall and we are unable to obtain replacement parts from another supplier in a timely manner.
15
We derive a significant portion of our SCS and DTS segment revenue from a relatively small number of customers
.
During
2017
, sales to our top ten SCS customers representing all of the industry groups we service accounted for
53%
of our SCS total revenue and
48%
of our SCS operating revenue (total revenue less fuel and subcontracted transportation). Additionally, approximately
40%
of our global SCS revenue is from the automotive industry and is directly impacted by automotive vehicle production. Our top ten DTS customers accounted for
46%
of DTS total revenue and
39%
of DTS operating revenue. The loss of any of these customers or a significant reduction in the services provided to any of these customers could impact our operations and adversely affect our SCS or DTS segment financial results. While we continue to focus our efforts on diversifying our customer base, we may not be successful in doing so in the short-term.
We are also subject to credit risk associated with the concentration of our accounts receivable from our SCS and DTS customers. If one or more of these customers were to become bankrupt, insolvent or otherwise were unable to pay for the services provided by us, we may incur significant write-offs of accounts receivable or incur lease or asset impairment charges that could adversely affect our operating results and financial condition.
In addition, many of our customers operate in cyclical or seasonal industries, or operate in industries, including the food and beverage industry, that may be impacted by unanticipated weather, growing conditions (such as drought, insects or disease), natural disasters and other conditions over which we have no control. A downturn in our customers' businesses or unanticipated events impacting their businesses could cause a reduction in freight volume shipped by those customers or a reduction in their need for our SCS or DTS services.
We operate in a highly competitive industry and our business may suffer if we are unable to adequately address potential downward pricing pressures and other competitive factors
.
Numerous competitive factors could impair our ability to maintain our current profitability. These factors include the following:
|
•
|
our inability to obtain expected customer retention levels or sales growth targets;
|
|
•
|
we compete with many other transportation and logistics service providers, some of which have greater capital resources than we do;
|
|
•
|
customers may choose to provide the services we provide for themselves;
|
|
•
|
some of our competitors periodically reduce their prices to gain business, and some of our smaller competitors may have lower cost structures than we do, which may limit our ability to maintain or increase prices; and
|
|
•
|
because cost of capital is a significant competitive factor, any increase in either the cost of our debt or equity as a result of reductions in our debt rating or stock price volatility could have a significant impact on our competitive position.
|
Our profitability could be negatively impacted if the key operational assumptions and pricing structure prove to be invalid
.
Substantially all of our ChoiceLease, SelectCare, DTS and SCS services are provided under contractual arrangements with our customers. The pricing structure for our ChoiceLease and SelectCare business is based on certain assumptions regarding capital costs, our ability to acquire equipment at competitive rates from our suppliers, maintenance expense over the life of the contract, particularly in light of new engine technologies, residual values, productivity, and the mix of fixed and variable costs, many of which are derived from historical data and trends. Under most of our SCS contracts, all or a portion of our pricing is based on certain assumptions regarding the scope of services, production volumes, operational efficiencies, the mix of fixed versus variable costs, productivity and other factors.
If we are incorrect in our assumptions, or as a result of subsequent changes in our customers' business needs or operations, or market forces that are outside of our control, these assumptions prove to be invalid, we could have lower margins than anticipated or be unable to offer competitive products and services. Although some of our SCS contracts provide for renegotiation upon a material change, there is no assurance that we will be successful in obtaining the necessary price adjustments.
16
We may face difficulties in attracting and retaining drivers and technicians
.
Drivers.
We hire drivers primarily for our DTS business segment. There is significant competition for qualified drivers in the transportation industry. Additionally, interventions and enforcement under the Federal Motor Carrier Safety Administration (FMCSA) Compliance, Safety, Accountability program may shrink the industry's pool of drivers as those drivers with unfavorable scores may no longer be eligible to drive for us. As a result of driver shortages, we could be required to increase driver compensation, let trucks sit idle, utilize lower quality drivers or face difficulty meeting customer demands, all of which could adversely affect our growth and profitability.
Technicians.
Similarly, we hire technicians in our FMS business segment to perform vehicle maintenance services on our ChoiceLease, SelectCare and rental fleets. In recent years, there has been a decrease in the overall supply of skilled maintenance technicians, particularly new technicians with qualifications from technical programs and schools, which could make it more difficult to attract and retain skilled technicians.
We may face issues with our union employees
.
We have approximately
4,100
employees that are organized by labor unions whose wages and benefits are governed by
101
labor agreements that are renegotiated periodically. Some of the industries in which we currently engage have experienced a material work stoppage, slowdown or strike. Our business and operations could be impacted in the event of labor strikes or work stoppages involving our employees organized by labor unions in our FMS, DTS or SCS business segments.
We operate in a highly regulated industry, and costs of compliance with, or liability for violation of, existing or future regulations could significantly increase our costs of doing business
.
Our business is subject to regulation by various federal, state, local and foreign governmental agencies. These agencies could institute new laws, rules or regulations or issue interpretation changes to existing regulations at any time. We have also seen an increase in proactive enforcement of existing regulations by some entities. Compliance with new laws, rules or regulations could substantially impair labor and equipment productivity, increase our costs or impact our ability to offer certain services. Conversely, our failure to comply with any applicable laws, rules or regulations to which we are subject, whether actual or alleged, could expose us to fines, penalties or potential litigation liabilities, including costs, settlements and judgments. We are also subject to reputational risk and other detrimental business consequences associated with noncompliance by other parties with whom we engage with, such as employees, customers, agents, suppliers or other persons using our supply chain or assets to commit illegal acts, including the use of company assets for terrorist activities, or a breach of data privacy laws.
U.S. Department of Transportation Regulations
.
The DOT and various local, state and federal agencies exercise broad powers over our motor carrier operations, safety and the generation, handling, storage, treatment and disposal of waste materials. Any regulatory initiatives could increase costs or operating complexity in the various states in which we operate.
Federal Motor Carrier Safety Administration (FMCSA) Compliance, Safety, Accountability Program
. The FMCSA's Compliance, Safety, Accountability program may increase the cost for our customers given the potential impact to the driver pool, the additional hours of service requirements and additional investment in vehicle equipment. In addition, although
Ryder's scores are below the thresholds that would trigger concern, if performance worsens, we could risk intervention that may create risk to our operating authority.
Labor and Employment Laws and Regulations
.
We maintain operations and employees in numerous states throughout the United Sates, which are governed by federal and state labor and employment laws and regulations relating to compensation, benefits, healthcare and various workplace issues, all of which are applicable to our employees, and in some cases, independent contractors. State labor and employment rules vary from state to state and in some states, require us to meet much stricter standards than required in other states. Also, we are parties to various class-action lawsuits related to wage and hour violations and improper pay in certain states and may become exposed to similar litigation in the future. Unfavorable or unanticipated outcomes in any of such lawsuits could subject us to increased costs and impact our profitability.
17
International Laws Governing Countries Where We Have Operations
.
We currently operate in Canada, Europe, Mexico and Singapore, where we are subject to compliance with local laws and regulatory requirements of foreign jurisdictions, including local tax laws, and compliance with the Foreign Corrupt Practices Act and similar anti-bribery laws. Local laws and regulatory requirements may vary significantly from country to country. Customary levels of compliance with local regulations and the tolerance for noncompliance by regulatory authorities may also vary in different countries and geographical locations, and impact our ability to successfully implement our compliance and business initiatives in certain jurisdictions. Also, adherence to rigorous local laws and regulatory requirements may limit our ability to expand into certain international markets and result in residual liability for legal claims and tax disputes arising out of previously discontinued operations. In addition, continued uncertainty resulting from the U.K.'s withdrawal from the European Union (Brexit) could adversely impact our (or our customers) business, financial condition and results of operations.
Laws Governing the Operations of our Customers.
The U.S. government or governments of other nations that regulate the operations of our customers or any instituted laws relating to cross-border tariffs or other penalties could disrupt international or domestic supply chain operations. The laws could adversely affect the ability for customers to continue their international operations, which would have a negative impact on the demand for our services.
Environmental Regulations Regarding Vehicle Exhaust Emissions, Carbon Emissions and Climate Change May Negatively Impact our Business.
Current and future regulations governing vehicle exhaust emissions could adversely impact our business. The Environmental Protection Agency (EPA) issued regulations that required progressive reductions in exhaust emissions from certain diesel engines. The EPA Phase 2 vehicle emission requirements for medium and heavy-duty vehicles will include technology-advancing standards that substantially reduce greenhouse gas emissions and fuel consumption, allowing vehicle manufacturers to meet standards over time through a mix of different technologies. Rules impacting 2017 - 2027 model years require reductions in carbon dioxide, which can only be reduced by improving fuel economy, and which require compliance with different emissions standards for both engines and chassis, based on vocation. OEMs may be required to install additional engine componentry, additional aerodynamics on chassis and low-rolling resistance tires to comply with the regulations, which may result in higher operating costs associated with the more complex componentry and a shorter useful tread life for tires and increased operating costs for customers and us.
Although customers may see reduced fuel consumption under new vehicle emission standards, this could be offset by higher maintenance costs per mile. Each of these requirements could also result in higher prices for vehicles, diesel engine fuel and vehicle maintenance, which are passed on to our customers, as well as higher maintenance costs and uncertainty as to reliability of the new engines, all of which could, over time, increase our costs and adversely affect our business and results of operations. New engine technologies may also impact the residual values of these vehicles when sold in the future.
Future regulation of other environmental matters, including potential limits on carbon emissions under climate-change legislation, could also impact our business and profitability if enacted.
Other Regulations.
We may also become subject to new or more restrictive regulations imposed by the Occupational Safety and Health Administration, the Department of Homeland Security, U.S. Customs Service or other authorities.
New lease accounting rules may negatively impact customer demand for our ChoiceLease product
.
Demand for our ChoiceLease product line is based in part on customers' decisions to lease rather than buy vehicles. A number of factors can impact whether customers decide to lease or buy vehicles, including economic benefits, accounting considerations, tax treatment, interest rates and operational flexibility. In February 2016, the Financial Accounting Standards Board issued a new standard on lease accounting that differs from current practice. Most notably, the new approach eliminates off-balance sheet treatment of leases and require lessees to recognize a right-of-use asset and a lease liability on their balance sheets for all leases with a term of greater than 12 months. This new accounting standard must be implemented by public companies beginning with fiscal years that start after December 15, 2018, although companies may opt to adopt the standard before this date. Implementation of the new standard could be perceived to make leasing a less attractive option for some of our ChoiceLease customers.
18
Changes in income tax regulations for U.S. and multinational companies may increase our tax liability.
On December 22, 2017, President Trump signed into law U.S. federal tax legislation (the “2017 Tax Cuts and Jobs Act”), which includes a broad range of tax reform measures affecting businesses, including the lowering of corporate income tax rates, limits on interest deductibility, incentives for capital spending by permitting full expensing of the purchase of qualifying assets, the loss of certain business deductions, the loss of like-kind exchange programs for our assets and modifications of international tax provisions. These changes will not only impact our company, but will impact our customers’ businesses as well as the economy in general. While we currently believe these changes in the aggregate will have a positive effect on the Company and the overall economy, we cannot predict this with certainty. Further, the U.S. Congress, the Organization for Economic Co-operation and Development (OECD), the European Union, and other government agencies in jurisdictions in which we and our affiliates invest or do business have maintained a focus on the taxation of multinational companies. The OECD, which represents a coalition of member countries, is supporting changes to numerous long-standing tax principles through its base erosion and profit shifting (BEPS) project, which is focused on a number of issues, including the shifting of profits between affiliated entities in different tax jurisdictions. The European Union has a number of on-going tax initiatives. Certain of the proposals for further tax reform, if enacted by the United States or any state thereof or by other jurisdictions in which we or our affiliates invest or do business, could adversely affect us. It is unclear what any actual legislation would provide or what its prospects for enactment would be.
Volatility in assumptions and asset values related to our pension plans may reduce our profitability and adversely impact current funding levels
.
We historically sponsored a number of defined benefit plans for employees not covered by union-administered plans, including certain employees in foreign countries. The retirement benefits under the defined benefit plans are frozen for non-grandfathered and certain non-union employees. Our major defined benefit plans are funded through qualified pension trusts, with trust assets invested in a diversified portfolio. The cash contributions made to our defined benefit trusts are required to comply with minimum funding requirements imposed by employee benefit and tax laws. The aggregate projected benefit obligations and plan assets of our global defined benefit pension plans as of December 31,
2017
, were
$2.3 billion
and
$1.9 billion
, respectively. The difference between plan obligations and assets, or the funded status of the plans, is a significant factor in determining pension expense and the ongoing funding requirements of those plans. Macroeconomic factors, as well as changes in investment returns and discount rates used to calculate pension expense and related assets and liabilities can be volatile and may have an unfavorable impact on our costs and funding requirements. Although we have actively sought to control increases in these costs and funding requirements through investment policies and plan contributions, as well as through a lump-sum buyout offer in 2015, there can be no assurance that we will succeed, and continued cost pressure could reduce the profitability of our business and negatively impact our cash flows.
We are subject to risk of multi-employer pension plan withdrawal
.
We participate in certain U.S. multi-employer pension (MEP) plans that provide defined benefits to employees covered by collective bargaining agreements. In the event that we withdraw from participation in one of these plans, then applicable law could require us to make an additional lump-sum contribution to the plan. Our withdrawal liability for any MEP plan would depend on the extent of the plan's funding of vested benefits. Economic conditions have caused MEP plans to be significantly underfunded. As a result, although we have taken steps in recent years to withdraw from these MEP plans, we may still have liability for at least a period of time following our withdrawal. If the financial condition of the MEP plans were to continue to deteriorate, we could be subject to additional assessments.
We establish self-insurance reserves based on historical loss development factors, which could lead to adjustments in the future based on actual development experience
.
We retain a portion of the accident risk under vehicle liability and workers' compensation insurance programs. Our self-insurance accruals are based on actuarially estimated, undiscounted cost of claims, which includes claims incurred but not reported. While we believe that our estimation processes are well designed, every estimation process is inherently subject to limitations. Fluctuations in the frequency or severity of accidents make it difficult to precisely predict the ultimate cost of claims. The actual cost of claims can be different than the historical selected loss development factors because of safety performance, payment patterns and settlement patterns. For a detailed discussion on our accounting policies and assumptions relating to our self-insurance reserves, please see the “Critical Accounting Estimates - Self-Insurance Accruals” section in Management's Discussion and Analysis of Financial Condition and Results of Operations.
19
Severe weather or other natural occurrences could result in significant business interruptions and expenditures in excess of available insurance coverage
.
Our operations may be affected by external factors such as severe weather and other natural occurrences, including floods, fires, hurricanes and earthquakes at operating locations where we have vehicles, warehouses and other facilities. As a result, our vehicles and facilities may be damaged, our workforce may be unavailable, fuel costs may rise and significant business interruptions could occur. In addition, the performance of our vehicles could be adversely affected by extreme weather conditions. Insurance to protect against loss of business and other related consequences resulting from these natural occurrences is subject to coverage limitations, depending on the nature of the risk insured. This insurance may not be sufficient to cover all of our damages or damages to others and this insurance may not continue to be available at commercially reasonable rates. Even with insurance, if any natural occurrence leads to a catastrophic interruption of service, we may not be able to mitigate a significant interruption in operations.
Our international operations subject us to operational and financial risks
.
We provide services outside of the U.S., which subjects our business to various risks, including changes in tariffs, trade restrictions, trade agreements and taxes; difficulties in managing or overseeing foreign operations and agents; foreign currency fluctuations and limitations on the repatriation of funds due to foreign currency controls; different liability standards; and intellectual property laws of countries that do not protect our rights in intellectual property to the same extent as the laws of the U.S. The occurrence or consequences of any of these factors may restrict our ability to operate in the affected region and/or decrease the profitability of our operations in that region. Also, if we do not correctly anticipate changes in international economic and political conditions, we may not alter our business practices in time to avoid adverse effects.
We may be negatively impacted by adverse events in the global credit and financial markets
.
In general, we rely in large part upon global credit and financial markets to fund our operations and contractual commitments and refinance existing debt. These markets can experience high levels of volatility and access to capital can be constrained for extended periods of time. Significant uncertainty, volatility, disruptions or downturns in the global credit and financial markets may result in:
|
•
|
unanticipated interest rate and currency exchange rate fluctuations;
|
|
•
|
increased risk of default by counterparties under derivative instruments and hedging agreements;
|
|
•
|
diminished liquidity and credit availability resulting in higher short-term borrowing costs and more stringent borrowing terms; and
|
|
•
|
restricted access to capital and increased cost of capital and financing sources.
|
20
None.
Our properties consist primarily of vehicle maintenance and repair facilities, warehouses and other real estate and improvements.
We maintain
608
FMS properties in the U.S., Puerto Rico and Canada; we own
408
of these and lease the remaining
200
. Our FMS properties are primarily comprised of maintenance facilities generally including a repair shop, rental counter, fuel service island, administrative offices, and used vehicle retail sales centers.
Additionally, we manage
186
on-site maintenance facilities, located at customer locations.
We also maintain
207
locations in the U.S. and Canada in connection with our domestic SCS business. Almost all of our SCS locations are leased and generally include a warehouse and administrative offices.
We maintain
123
international locations (locations outside of the U.S. and Canada) for our international businesses. There are
60
locations in the U.K. and Germany,
59
locations in Mexico and
4
locations in Singapore. The majority of these locations are leased and may be a repair shop, warehouse or administrative office.
Additionally, we maintain
10
U.S. locations primarily used for Central Support Services. These facilities are generally administrative offices, of which we own
three
and lease the remaining
seven
.
We are involved in various claims, lawsuits and administrative actions arising in the normal course of our businesses. Some involve claims for substantial amounts of money and/or claims for punitive damages. While any proceeding or litigation has an element of uncertainty, management believes that the disposition of such matters, in the aggregate, will not have a material impact on our consolidated financial condition or liquidity.
Not applicable.
21
STOCKHOLDER MATTERS AND ISSUER PURCHASES OF EQUITY SECURITIES
Ryder Common Stock Prices
|
|
Stock Price
|
Dividends per
Common Share
|
|||||||
|
|
High
|
Low
|
|||||||
|
2017
|
|||||||||
|
First quarter
|
$
|
79.26
|
|
70.89
|
|
0.44
|
|||
|
Second quarter
|
79.63
|
|
62.52
|
|
0.44
|
||||
|
Third quarter
|
84.99
|
|
70.24
|
|
0.46
|
||||
|
Fourth quarter
|
85.77
|
|
76.11
|
|
0.46
|
||||
|
2016
|
|||||||||
|
First quarter
|
$
|
66.36
|
|
45.12
|
|
0.41
|
|||
|
Second quarter
|
71.90
|
|
56.98
|
|
0.41
|
||||
|
Third quarter
|
69.78
|
|
59.57
|
|
0.44
|
||||
|
Fourth quarter
|
85.42
|
|
62.03
|
|
0.44
|
||||
Our common shares are listed on the New York Stock Exchange under the trading symbol “R.” At
January 31, 2018
, there were
6,960
common stockholders of record and our stock price on the New York Stock Exchange was
$87.03
.
22
Performance Graph
The following graph compares the performance of our common stock with the performance of the Standard & Poor’s 500 Composite Stock Index and the Dow Jones Transportation 20 Index for a five year period by measuring the changes in common stock prices from
December 31, 2012
to
December 31, 2017
.
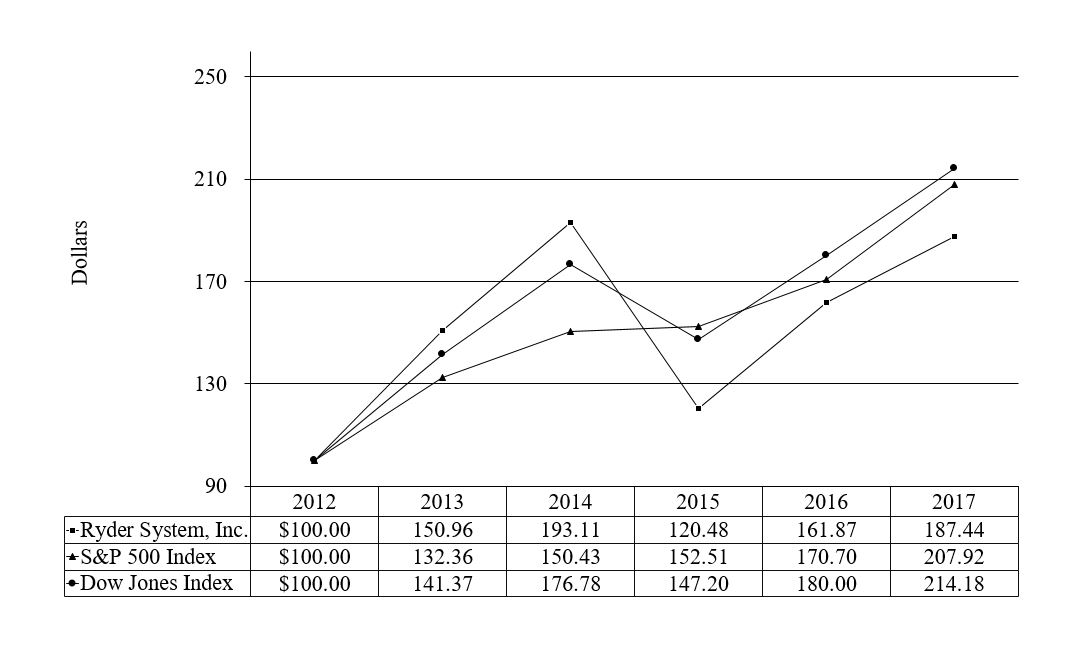
The stock performance graph assumes for comparison that the value of the Company’s Common Stock and of each index was $100 on
December 31, 2012
, and that all dividends were reinvested. Past performance is not necessarily an indicator of future results.
23
Purchases of Equity Securities
The following table provides information with respect to purchases we made of our common stock during the quarter ended
December 31, 2017
:
|
Total Number
of Shares
Purchased
(1)
|
Average Price
Paid per
Share
|
Total Number of
Shares Purchased as
Part of Publicly Announced Program
(2)
|
Maximum Number
of Shares That May
Yet Be Purchased
Under the Anti-Dilutive
Program
(2)
|
||||||||||
|
October 1 through October 31, 2017
|
250
|
|
$
|
81.92
|
|
—
|
|
530,734
|
|
||||
|
November 1 through November 30, 2017
|
99,924
|
|
80.57
|
|
99,818
|
|
430,916
|
|
|||||
|
December 1 through December 31, 2017
|
54,530
|
|
81.60
|
|
54,115
|
|
376,801
|
|
|||||
|
Total
|
154,704
|
|
$
|
80.94
|
|
153,933
|
|
||||||
______________
|
(1)
|
During the three months ended
December 31, 2017
, we purchased an aggregate of
771
shares of our common stock in employee-related transactions. Employee-related transactions may include: (i) shares of common stock delivered as payment for the exercise price of options exercised or to satisfy the option holders’ tax withholding liability associated with our share-based compensation programs and (ii) open-market purchases by the trustee of Ryder’s deferred compensation plans relating to investments by employees in our stock, one of the investment options available under the plans.
|
|
(2)
|
In December 2017, our Board of Directors authorized a new share repurchase program intended to mitigate the dilutive impact of shares issued under our employee stock plans. Under the December 2017 program, management is authorized to repurchase up to 1.5 million shares of common stock issued to employees under the Company’s employee stock plans from December 1, 2017 through December 13, 2019. Share repurchases will be made periodically in open-market transactions using the Company's working capital, and are subject to market conditions, legal requirements, and other factors. In addition, management has been granted the authority to establish prearranged written trading plans under Rule 10b5-1 of the Securities Exchange Act of 1934 as part of the repurchase program.
|
24
The following selected consolidated financial information should be read in conjunction with Items 7 and 8 of this report. During 2017, we adopted ASU No. 2017-07,
Compensation-Retirement Benefits (Topic 715), Improving the Presentation of Net Periodic Pension Cost and Net Periodic Postretirement Benefit Cost
, and are reporting all components of net benefit cost other than the service cost component within "Non-operating pension costs" in the Consolidated Statements of Earnings for both the current and prior year periods. We also updated our current and historical comparable earnings measures to exclude the amortization of prior service cost, in order to conform the presentation of "Non-operating pension costs" with the ASU.
|
|
Years ended December 31
|
|||||||||||||||
|
|
2017
|
2016
|
2015
|
2014
|
2013
|
|||||||||||
|
|
(Dollars and shares in thousands, except per share amounts)
|
|||||||||||||||
|
Operating Data:
|
||||||||||||||||
|
Total Revenue
|
$
|
7,329,599
|
|
6,786,984
|
|
6,571,893
|
|
6,638,285
|
|
6,419,285
|
|
|||||
|
Operating Revenue
(1)
|
$
|
6,040,380
|
|
5,790,897
|
|
5,561,077
|
|
5,252,217
|
|
4,965,818
|
|
|||||
|
Earnings from continuing operations
(2)
|
$
|
791,015
|
|
264,640
|
|
305,989
|
|
220,225
|
|
243,275
|
|
|||||
|
Comparable earnings from continuing operations
(3)
|
$
|
240,809
|
|
290,488
|
|
326,485
|
|
294,279
|
|
255,394
|
|
|||||
|
Net earnings
(2), (4)
|
$
|
790,558
|
|
262,477
|
|
304,768
|
|
218,341
|
|
237,871
|
|
|||||
|
Per Share Data:
|
||||||||||||||||
|
Earnings from continuing operations -Diluted
(2)
|
$
|
14.87
|
|
4.94
|
|
5.73
|
|
4.14
|
|
4.63
|
|
|||||
|
Comparable earnings from continuing operations -Diluted
(3)
|
$
|
4.53
|
|
5.42
|
|
6.10
|
|
5.53
|
|
4.85
|
|
|||||
|
Net earnings -Diluted
(2), (4)
|
$
|
14.87
|
|
4.90
|
|
5.71
|
|
4.11
|
|
4.53
|
|
|||||
|
Cash dividends
|
$
|
1.80
|
|
1.70
|
|
1.56
|
|
1.42
|
|
1.30
|
|
|||||
|
Book value
(5)
|
$
|
53.54
|
|
38.39
|
|
37.15
|
|
34.30
|
|
35.56
|
|
|||||
|
Financial Data:
|
||||||||||||||||
|
Total assets
|
$
|
11,452,231
|
|
10,902,454
|
|
10,952,580
|
|
9,837,776
|
|
9,156,175
|
|
|||||
|
Average assets
(6)
|
$
|
11,133,727
|
|
11,056,740
|
|
10,464,001
|
|
9,594,878
|
|
8,692,120
|
|
|||||
|
Return on average assets (%)
(6)
|
7.1
|
|
2.4
|
|
2.9
|
|
2.3
|
|
2.7
|
|
||||||
|
Long-term debt
|
$
|
4,583,582
|
|
4,599,864
|
|
4,868,097
|
|
4,681,240
|
|
4,010,810
|
|
|||||
|
Total debt
|
$
|
5,409,651
|
|
5,391,274
|
|
5,502,627
|
|
4,717,524
|
|
4,283,013
|
|
|||||
|
Shareholders’ equity
(5)
|
$
|
2,835,016
|
|
2,052,275
|
|
1,987,111
|
|
1,819,087
|
|
1,896,561
|
|
|||||
|
Debt to equity (%)
(5)
|
191
|
|
263
|
|
277
|
|
259
|
|
226
|
|
||||||
|
Average shareholders’ equity
(5), (6)
|
$
|
2,201,219
|
|
2,052,371
|
|
1,894,917
|
|
1,925,824
|
|
1,593,942
|
|
|||||
|
Return on average shareholders’ equity (%)
(5), (6)
|
35.9
|
|
12.8
|
|
16.1
|
|
11.3
|
|
14.9
|
|
||||||
|
Adjusted return on average capital (%)
(6), (7)
|
4.2
|
|
4.8
|
|
5.8
|
|
5.8
|
|
5.8
|
|
||||||
|
Net cash provided by operating activities from continuing operations
|
$
|
1,547,986
|
|
1,601,022
|
|
1,441,788
|
|
1,382,818
|
|
1,251,811
|
|
|||||
|
Net cash (used in) provided by financing activities from continuing operations
|
$
|
(155,115
|
)
|
(185,922
|
)
|
731,485
|
|
311,650
|
|
347,070
|
|
|||||
|
Net cash used in investing activities from continuing operations
|
$
|
(1,366,340
|
)
|
(1,405,833
|
)
|
(2,161,355
|
)
|
(1,704,510
|
)
|
(1,603,818
|
)
|
|||||
|
Free cash flow
(8)
|
$
|
189,722
|
|
193,675
|
|
(727,714
|
)
|
(315,116
|
)
|
(339,596
|
)
|
|||||
|
Capital expenditures paid
|
$
|
1,860,436
|
|
1,905,157
|
|
2,667,978
|
|
2,259,164
|
|
2,122,628
|
|
|||||
|
Other Data:
|
||||||||||||||||
|
Average common shares — Diluted
|
52,988
|
|
53,361
|
|
53,260
|
|
53,036
|
|
52,071
|
|
||||||
|
Number of vehicles — Owned and leased
|
186,200
|
|
185,100
|
|
185,200
|
|
174,100
|
|
172,100
|
|
||||||
|
Average number of vehicles — Owned and leased
|
185,200
|
|
185,400
|
|
180,500
|
|
172,800
|
|
171,200
|
|
||||||
|
Number of employees
|
36,100
|
|
34,500
|
|
33,100
|
|
30,600
|
|
28,900
|
|
||||||
____________________
|
(1)
|
Non-GAAP financial measure. Refer to the “Non-GAAP Financial Measures” section in Item 7 for a reconciliation of total revenue to operating revenue, as well as the reasons management believes these measures are important to investors.
|
|
(2)
|
2017 amounts reflect tax benefit as a result of the 2017 Tax Cuts and Jobs Act. Refer to
Note 13
, "
Income Taxes
," for additional information.
|
|
(3)
|
Non-GAAP financial measures. Refer to the “Non-GAAP Financial Measures” section in Item 7 of this report for a reconciliation of net earnings from continuing operations to comparable earnings from continuing operations and net earnings from continuing operations per diluted common share to comparable earnings per diluted common share, as well as the reasons management believes these measures are important to investors.
|
|
(4)
|
Net earnings in
2017
,
2016
,
2015
,
2014
and
2013
, included losses from discontinued operations of $
(0.5) million
, or
$(0.01)
per diluted common share,
$(2) million
, or
$(0.04)
per diluted common share,
$(1) million
, or
$(0.02)
per diluted common share,
$(2) million
, or
$(0.03)
per diluted common share, and
$(5) million
, or
$(0.10)
per diluted common share, respectively.
|
|
(5)
|
Shareholders’ equity at
December 31, 2017
,
2016
,
2015
,
2014
and
2013
, reflected cumulative after-tax equity charges of
$567 million
,
$627 million
,
$577 million
,
$584 million
, and
$474 million
, respectively, related to our pension and postretirement plans.
|
|
(6)
|
Amounts were computed using an 8-point average based on quarterly information.
|
|
(7)
|
Non-GAAP financial measure. Refer to the “Non-GAAP Financial Measures” section in Item 7 of this report for a reconciliation of the non-GAAP elements of this calculation and a numerical reconciliation of net earnings to adjusted net earnings and average total debt and average shareholders' equity to adjusted average total capital used to calculate adjusted return on average capital, as well as the reasons management believes these measures are important to investors.
|
|
(8)
|
Non-GAAP financial measure. Refer to the “Non-GAAP financial measures” section in Item 7 of this report for a reconciliation of net cash provided by operating activities to free cash flow, as well as the reasons why management believes this measure is important to investors.
|
25
ITEM 7. MANAGEMENT'S DISCUSSION AND ANALYSIS OF
FINANCIAL CONDITION AND RESULTS OF OPERATIONS
The following Management’s Discussion and Analysis of Financial Condition and Results of Operations (MD&A) should be read in conjunction with our consolidated financial statements and related notes contained in Item 8 of this report on Form 10-K. The following MD&A describes the principal factors affecting results of operations, financial resources, liquidity, contractual cash obligations, and critical accounting estimates. The information presented in the MD&A is for the years ended
December 31, 2017
,
2016
and
2015
unless otherwise noted.
OVERVIEW
Ryder System, Inc. (Ryder) is a global leader in transportation and supply chain management solutions. Our operating segments are aggregated into reportable business segments based upon similar economic characteristics, products, services, customers and delivery methods. We report our financial performance based on three business segments: (1) FMS, which provides leasing, commercial rental and maintenance services for trucks, tractors and trailers to customers principally in the U.S., Canada and the U.K.; (2) DTS, which provides vehicles and drivers as part of a dedicated transportation solution in the U.S.; and (3) SCS, which provides comprehensive supply chain solutions including distribution and transportation services in North America and Singapore. Dedicated transportation services provided as part of an integrated, multi-service, supply chain solution to SCS customers are reported in the SCS business segment.
The FMS business, our largest segment, had total revenue (net of intercompany eliminations) and assets in
2017
of
$4.26 billion
and
$10.39 billion
, respectively, representing
58%
of our consolidated revenue and
91%
of consolidated assets. DTS total revenue and assets in
2017
were
$1.10 billion
and
$277 million
, respectively, representing
15%
of our consolidated revenue and
2%
of consolidated assets. SCS total revenue and assets in
2017
were
$1.97 billion
and
$864 million
, respectively, representing
27%
of our consolidated revenue and
8%
of consolidated assets.
We operate in highly competitive markets. Our customers select us based on numerous factors including service quality, price, technology and service offerings. As an alternative to using our services, customers may choose to provide these services for themselves, or may choose to obtain similar or alternative services from other third-party vendors. Our customer base includes enterprises operating in a variety of industries including food and beverage service (22%), transportation and warehousing (20%), automotive (11%), retail and consumer goods (10%), industrial (8%), housing (8%), technology (7%), business and personal services (5%) and other (9%).
This MD&A includes certain non-GAAP financial measures. Please refer to the “Non-GAAP Financial Measures” section of this MD&A for information on the non-GAAP measures included in the MD&A, reconciliations to the most comparable GAAP financial measure and the reasons why we believe each measure is useful to investors.
26
ITEM 7. MANAGEMENT'S DISCUSSION AND ANALYSIS OF
FINANCIAL CONDITION AND RESULTS OF OPERATIONS - (Continued)
The following discussion provides a summary of financial highlights that are discussed in more detail throughout our MD&A and within the Notes to Consolidated Financial Statements:
|
|
|
Change
|
||||||||||||
|
|
2017
|
2016
|
2015
|
2017/2016
|
2016/2015
|
|||||||||
|
|
(Dollars in thousands, except per share amounts)
|
|
|
|||||||||||
|
Total revenue
|
$
|
7,329,599
|
|
6,786,984
|
|
6,571,893
|
|
8%
|
3%
|
|||||
|
Operating revenue
(1)
|
6,040,380
|
|
5,790,897
|
|
5,561,077
|
|
4%
|
4%
|
||||||
|
Earnings before income taxes (EBT)
|
$
|
313,786
|
|
406,381
|
|
469,215
|
|
(23)%
|
(13)%
|
|||||
|
Comparable EBT
(2)
|
369,747
|
|
449,048
|
|
504,571
|
|
(18)%
|
(11)%
|
||||||
|
Earnings from continuing operations
(3)
|
791,015
|
|
264,640
|
|
305,989
|
|
199%
|
(14)%
|
||||||
|
Comparable earnings from continuing operations
(2)
|
240,809
|
|
290,488
|
|
326,485
|
|
(17)%
|
(11)%
|
||||||
|
Net earnings
(3)
|
790,558
|
|
262,477
|
|
304,768
|
|
201%
|
(14)%
|
||||||
|
Earnings per common share — Diluted
|
||||||||||||||
|
Continuing operations
(3)
|
$
|
14.87
|
|
4.94
|
|
5.73
|
|
201%
|
(14)%
|
|||||
|
Comparable
(2)
|
4.53
|
|
5.42
|
|
6.10
|
|
(16)%
|
(11)%
|
||||||
|
Net earnings
(3)
|
14.87
|
|
4.90
|
|
5.71
|
|
203%
|
(14)%
|
||||||
_________________
|
(1)
|
Non-GAAP financial measure. Refer to the“Non-GAAP Financial Measures” section of this MD&A for a reconciliation of total revenue to operating revenue and the reasons why management believes this measure is important to investors
.
|
|
(2)
|
Non-GAAP financial measures. Refer to the “Non-GAAP Financial Measures” section for a reconciliation of EBT, net earnings from continuing operations and earnings per diluted common share to the comparable measures and the reasons why management believes these measures are important to investors.
|
|
(3)
|
2017 amounts reflect tax benefit as a result of the 2017 Tax Cuts and Jobs Act.
Refer to
Note 13
, "
Income Taxes
," in the Notes to Consolidated Financial Statements for additional information.
|
In
2017
, total revenue
increased
8%
to
$7.33 billion
and operating revenue (a non-GAAP measure excluding fuel and subcontracted transportation) increased
4%
to
$6.04 billion
. Total revenue increased due to higher operating revenue and increased subcontracted transportation passed through to customers, reflecting new business and higher volumes, as well as higher fuel costs passed through to customers. Operating revenue increased due to higher revenue in the SCS business and higher contractual ChoiceLease revenue, partially offset by lower commercial rental revenue. EBT decreased
23%
in
2017
, primarily reflecting increased accelerated depreciation of
$21 million
, lower used vehicle sales results and increased maintenance costs as maintenance spending associated with vehicles being prepared for sale returned to more normal levels.
Cash provided by operating activities from continuing operations decreased
3%
to
$1.55 billion
in
2017
compared with
$1.60 billion
in
2016
, primarily reflecting the impact of lower comparable earnings. Free cash flow from continuing operations (a non-GAAP financial measure) decreased
2%
to
$190 million
in
2017
from
$194 million
in
2016
, primarily due to lower cash flows from operations, partially offset by lower cash paid for purchases of property and revenue earning equipment reflecting lower capital expenditures.
Capital expenditures increased
10%
to
$1.94 billion
in
2017
, reflecting higher planned investments to refresh our commercial rental fleet, partially offset by lower ChoiceLease capital spending. Our debt balance of
$5.41 billion
at
December 31, 2017
, was substantially unchanged from the prior year. Our debt to equity ratio decreased to
191%
from
263%
in
2016
, largely driven by the impact of the
2017
Tax Cuts & Jobs Act on our equity balance.
We increased our annualized dividend rate by
5%
to
$1.84
per share of common stock during
2017
.
27
ITEM 7. MANAGEMENT'S DISCUSSION AND ANALYSIS OF
FINANCIAL CONDITION AND RESULTS OF OPERATIONS - (Continued)
2018
Outlook
In
2018
, we expect solid earnings growth across all business segments driven by robust contractual revenue growth from record sales results in
2017
, as well as the strength of our sales pipeline. We forecast a significant increase in ChoiceLease fleet growth of
6,500
vehicles, driven by a continued trend toward outsourcing, our ongoing sales and marketing initiatives, and a strengthening freight environment. We are also anticipating strong commercial rental revenue growth in this accelerating freight environment. We plan to grow the commercial rental fleet by
6%
, as well as increase pricing. In DTS and SCS, we are also expecting revenue growth and margin expansion due to improved operating performance. Additionally, we instituted a zero-based budgeting process, significantly lowering overhead costs. We also anticipate
2018
earnings to benefit from the 2017 Tax Cut & Jobs Act, primarily due to a lower effective income tax rate. These expected overhead reductions and tax benefits will improve earnings and fund
2018
strategic investments in sales and marketing, new product development, and technology, which are focused on driving long term revenue and earnings growth.
These benefits are expected to be partially offset by impacts from the extended downturn in the used vehicle market as well as higher maintenance costs on certain older model year vehicles that will largely exit the fleet over the next 18 months. We anticipate a modestly improved outlook for used vehicle pricing in
2018
that will benefit year over year results; however, we still expect used vehicle sales to incur a loss for the year. We are also reducing our long term residual value estimates on vehicles in operation to reflect used vehicle market trends. Additionally, we are further accelerating depreciation on vehicles, which we expect to make available for sale through mid-2019.
We expect cash provided by operating activities from continuing operations to increase approximately $270 million to $1.8 billion in
2018
, due to growth in pre-tax earnings adjusted for non-cash items, primarily depreciation. We expect free cash flow to decrease to negative
$600 million
in 2018, reflecting higher capital spending, partially offset by higher cash from operations. With expected negative free cash flow, we expect our leverage to increase to just below the bottom end of our target range of
200% - 250%
.
We forecast
2018
earnings from continuing operations of
$5.34 to $5.64
per diluted share, compared with
$14.87
per diluted share in
2017
, which included a
$10.75
one-time net benefit from the 2017 Tax Cut & Jobs Act, and comparable earnings from continuing operations of
$5.40 to $5.70
per diluted share, compared with
$4.53
per diluted share in
2017
. Comparable earnings exclude non-operating pension costs of
$0.06
per diluted share in
2018
, as well as non-operating pension, restructuring and other net benefit of
$10.34
in
2017
. Total revenue for
2018
is expected to be up
6%
to approximately
$8 billion
. Operating revenue for
2018
is forecast to be up
8%
to approximately
$7 billion
.
28
ITEM 7. MANAGEMENT'S DISCUSSION AND ANALYSIS OF
FINANCIAL CONDITION AND RESULTS OF OPERATIONS - (Continued)
FULL YEAR CONSOLIDATED RESULTS
Revenue and cost of revenue by source
Total revenue increased
8%
in
2017
to
$7.33 billion
and increased
3%
in
2016
to
$6.79 billion
. Operating revenue (a non-GAAP measure excluding fuel and subcontracted transportation) increased
4%
in
2017
to
$6.04 billion
and increased
4%
in
2016
to
$5.79 billion
. The following table summarizes the components of the change in revenue on a percentage basis versus the prior year:
|
|
2017
|
2016
|
||||||
|
|
Total
|
Operating
|
Total
|
Operating
|
||||
|
Organic, including price and volume
|
7%
|
4%
|
6%
|
5%
|
||||
|
Fuel
|
1
|
—
|
(2)
|
—
|
||||
|
Foreign exchange
|
—
|
—
|
(1)
|
(1)
|
||||
|
Total increase
|
8%
|
4%
|
3%
|
4%
|
||||
Lease and Rental
|
|
|
Change
|
||||||||||||
|
|
2017
|
2016
|
2015
|
2017/2016
|
|
2016/2015
|
||||||||
|
|
(Dollars in thousands)
|
|
|
|||||||||||
|
Lease and rental revenues
|
$
|
3,237,685
|
|
3,170,952
|
|
3,121,553
|
|
2%
|
2%
|
|||||
|
Cost of lease and rental
|
2,355,043
|
|
2,234,284
|
|
2,153,450
|
|
5%
|
4%
|
||||||
|
Gross margin
|
882,642
|
|
936,668
|
|
968,103
|
|
(6)%
|
(3)%
|
||||||
|
Gross margin %
|
27
|
%
|
30
|
%
|
31
|
%
|
||||||||
Lease and rental revenues represent ChoiceLease and commercial rental product offerings within our FMS business segment. Revenues increased
2%
in both
2017
and
2016
, from higher ChoiceLease revenue, driven by growth in the average ChoiceLease fleet (up
2%
in
2017
and
4%
in
2016
) and higher prices on replacement vehicles. ChoiceLease revenue growth was partially offset by lower commercial rental revenue reflecting weaker demand. Foreign exchange did not have a significant impact on revenue in
2017
, but negatively impacted revenue growth by
100
basis points in
2016
.
Cost of lease and rental represents the direct costs related to lease and rental revenues. These costs are comprised of depreciation of revenue earning equipment, maintenance costs (primarily repair parts and labor), and other fixed costs such as licenses, insurance and operating taxes. Cost of lease and rental excludes interest costs from vehicle financing. Cost of lease and rental increased
5%
in
2017
and
4%
in
2016
. In both years, cost of lease and rental reflected higher depreciation and maintenance costs from a larger average lease fleet and accelerated depreciation of
$30 million
in
2017
and
$10 million
in
2016
, offset by lower depreciation and maintenance on a smaller average rental fleet. In
2017
, maintenance spending also increased as the number of vehicles being prepared for sale returned to more normal levels and due to an increase in the age of the fleet. Changes in estimated residual values and useful lives of revenue earning equipment effective January 1 of each respective year negatively impacted cost of lease and rental by
$4 million
in
2017
and benefited cost of lease and rental by
$35 million
in
2016
.
Lease and rental gross margin decreased
6%
and gross margin as a percentage of revenue decreased to
27%
in
2017
. The decrease in gross margin dollars and gross margin as a percentage of revenue was due to increased maintenance costs, accelerated depreciation and lower commercial rental demand. Lease and rental gross margin decreased
3%
and gross margin as a percentage of revenue decreased to
30%
in
2016
, due to lower commercial rental demand, partially offset by lease fleet growth, as well as benefits from improved residual values.
29
ITEM 7. MANAGEMENT'S DISCUSSION AND ANALYSIS OF
FINANCIAL CONDITION AND RESULTS OF OPERATIONS - (Continued)
Services
|
|
|
Change
|
||||||||||||
|
|
2017
|
2016
|
2015
|
2017/2016
|
2016/2015
|
|||||||||
|
|
(Dollars in thousands)
|
|
|
|||||||||||
|
Services revenue
|
$
|
3,571,414
|
|
3,152,294
|
|
2,912,063
|
|
13%
|
8%
|
|||||
|
Cost of services
|
3,003,348
|
|
2,602,978
|
|
2,413,156
|
|
15%
|
8%
|
||||||
|
Gross margin
|
568,066
|
|
549,316
|
|
498,907
|
|
3%
|
10%
|
||||||
|
Gross margin %
|
16
|
%
|
17
|
%
|
17
|
%
|
||||||||
Services revenue represents all the revenues associated with our DTS and SCS business segments as well as SelectCare and fleet support services associated with our FMS business segment. Services revenue increased
13%
in
2017
due to new business, increased volumes and higher pricing in the SCS and DTS segments. In 2017, services revenue also benefited from higher fuel costs passed through to our DTS and SCS customers. Services revenue increased
8%
in
2016
due to new business, increased volumes and higher pricing in the DTS and SCS segments. In
2016
, the SelectCare product line in FMS benefited from growth in fleet size and increased volumes, which were partially offset by lower fuel prices passed through to our DTS and SCS customers. Foreign exchange did not have a significant impact on revenue in
2017
, but negatively impacted revenue growth by
200
basis points in
2016
.
Cost of services represents the direct costs related to services revenue and is primarily comprised of salaries and employee-related costs, subcontracted transportation (purchased transportation from third parties), maintenance costs and fuel. Cost of services increased
15%
in
2017
due to higher volumes and higher fuel costs. Cost of services increased
8%
in
2016
due to higher volumes, partially offset by lower fuel and insurance costs. Foreign exchange did not have a significant impact on cost of services in
2017
, but reduced cost of services by
100
basis points in
2016
.
Services gross margin increased
3
% in
2017
, reflecting benefits from revenue growth in our DTS and SCS segments, partially offset by lower operating performance on certain SCS contracts and increased maintenance costs on certain older model year vehicles in DTS. Services gross margin as a percentage of revenue decreased to
16%
, reflecting lower operating performance on certain SCS contracts and higher maintenance costs in DTS. Services gross margin increased
10%
in
2016
due to higher revenue. Services gross margin as a percentage of revenue remained at
17%
in
2016
, reflecting no change from the prior year.
Fuel
|
|
|
Change
|
||||||||||||
|
|
2017
|
2016
|
2015
|
2017/2016
|
2016/2015
|
|||||||||
|
|
(Dollars in thousands)
|
|
|
|||||||||||
|
Fuel services revenue
|
$
|
520,500
|
|
463,738
|
|
538,277
|
|
12%
|
(14)%
|
|||||
|
Cost of fuel services
|
507,440
|
|
448,306
|
|
519,843
|
|
13%
|
(14)%
|
||||||
|
Gross margin
|
13,060
|
|
15,432
|
|
18,434
|
|
(15)%
|
(16)%
|
||||||
|
Gross margin %
|
3
|
%
|
3
|
%
|
3
|
%
|
||||||||
Fuel services revenue represents fuel services provided to our FMS customers. Fuel services revenue increased
12%
in
2017
and decreased
14%
in
2016
. In
2017
, the revenue increase was due to higher fuel costs passed through to customers. In
2016
, the revenue decrease was due to lower fuel costs passed through to customers.
Cost of fuel services includes the direct costs associated with providing our customers with fuel. These costs include fuel, salaries and employee-related costs of fuel island attendants and depreciation of our fueling facilities and equipment. Cost of fuel services increased
13%
in
2017
due to higher fuel costs and decreased
14%
in
2016
due to lower fuel costs.
Fuel services gross margin decreased
15%
in
2017
and
16%
in
2016
. Fuel services gross margin as a percentage of revenue remained at
3%
in
2017
and
2016
. Fuel is largely a pass-through to customers for which we realize minimal changes in margin during periods of steady market fuel prices. However, fuel services margin is impacted by sudden increases or decreases in market fuel prices during a short period of time as customer pricing for fuel is established based on trailing market fuel costs.
30
ITEM 7. MANAGEMENT'S DISCUSSION AND ANALYSIS OF
FINANCIAL CONDITION AND RESULTS OF OPERATIONS - (Continued)
|
|
Change
|
|||||||||||||
|
|
2017
|
2016
|
2015
|
2017/2016
|
2016/2015
|
|||||||||
|
|
(In thousands)
|
|
|
|||||||||||
|
Other operating expenses
|
$
|
115,507
|
|
113,461
|
|
117,082
|
|
2%
|
(3)%
|
|||||
Other operating expenses include costs related to our owned and leased facilities within the FMS business segment such as depreciation, rent, insurance, utilities and taxes. These facilities are utilized to provide maintenance to our ChoiceLease, rental, SelectCare and fleet support services customers.
|
|
|
|
|
Change
|
||||||||||
|
|
2017
|
2016
|
2015
|
2017/2016
|
2016/2015
|
|||||||||
|
|
(Dollars in thousands)
|
|
|
|||||||||||
|
Selling, general and administrative expenses (SG&A)
|
$
|
871,983
|
|
805,104
|
|
822,857
|
|
8%
|
(2)%
|
|||||
|
Percentage of total revenue
|
12
|
%
|
12
|
%
|
13
|
%
|
||||||||
SG&A expenses increased
8%
in
2017
and decreased
2%
in
2016
. SG&A expenses as a percent of total revenue remained at
12%
in
2017
after decreasing to
12%
in
2016
. The
2017
increase was primarily due to higher compensation-related costs and professional fees, as well as a
$5 million
estimated pension settlement charge for the exit from a U.S. multi-employer pension plan. The decrease in
2016
was due to lower compensation-related and marketing-related costs, professional fees and the effects from foreign exchange in SG&A expenses, partially offset by increased information technology costs. Foreign exchange did not significantly impact SG&A expenses in
2017
, but reduced growth in SG&A expenses by
100
basis points in
2016
.
|
|
|
|
|
Change
|
||||||||||
|
|
2017
|
2016
|
2015
|
2017/2016
|
2016/2015
|
|||||||||
|
|
(In thousands)
|
|
|
|||||||||||
|
Non-operating pension costs
|
$
|
27,741
|
|
37,593
|
|
17,797
|
|
(26)%
|
111%
|
|||||
Non-operating pension costs includes the components of our net periodic benefit cost other than service cost. These components include interest cost, expected return on plan assets, amortization of actuarial loss and prior service cost. Non-operating pension costs decreased
26%
in
2017
, primarily due to a one-time charge of
$8 million
in 2016 to fully reflect pension benefit improvements made in 2009 in our pension benefit obligation that were not fully reflected in prior years. Non-operating pension costs increased by
$20 million
in
2016
, due to the impact of a lower asset return assumption and a higher discount rate, as well as the
$8 million
one-time charge.
|
|
|
Change
|
||||||||||||
|
|
2017
|
2016
|
2015
|
2017/2016
|
2016/2015
|
|||||||||
|
|
(In thousands)
|
|
|
|||||||||||
|
Used vehicle sales, net
|
$
|
(17,241
|
)
|
972
|
|
99,853
|
|
NM
|
(99)%
|
|||||
Used vehicle sales, net includes gains from sales of used vehicles, selling costs associated with used vehicles and write-downs of vehicles to fair market value. Used vehicle sales, net decreased to a loss of
$17 million
in
2017
, due to a drop in the market value of tractors and trucks, which resulted in lower gains on sales. We anticipate a modestly improved outlook for used vehicle pricing in
2018
that will benefit year over year results; however, we still expect used vehicle sales to incur a loss for the year. Used vehicle sales, net decreased to a gain of
$1 million
in
2016
, due to a drop in the market value of trucks and tractors, which resulted in lower gains on sales of used vehicles and higher fair market value write-downs.
The following table presents the used vehicle pricing changes for
2017
and
2016
compared with the respective prior years:
|
Proceeds per unit change
|
|||||
|
2017/2016
|
2016/2015
|
||||
|
Tractors
|
(12
|
)%
|
(14
|
)%
|
|
|
Trucks
|
(12
|
)%
|
(1
|
)%
|
|
31
ITEM 7. MANAGEMENT'S DISCUSSION AND ANALYSIS OF
FINANCIAL CONDITION AND RESULTS OF OPERATIONS - (Continued)
|
|
|
|
|
Change
|
||||||||||
|
|
2017
|
2016
|
2015
|
2017/2016
|
2016/2015
|
|||||||||
|
|
(Dollars in thousands)
|
|
|
|||||||||||
|
Interest expense
|
$
|
140,350
|
|
147,843
|
|
150,434
|
|
(5)%
|
(2)%
|
|||||
|
Effective interest rate
|
2.6
|
%
|
2.7
|
%
|
2.9
|
%
|
||||||||
Interest expense decreased
5%
to
$140 million
in
2017
, reflecting a lower average outstanding debt and a lower effective interest rate. Interest expense decreased
2%
to
$148 million
in
2016
, reflecting a lower effective interest rate, partially offset by a higher average outstanding debt. The lower effective interest rate in both years reflects the replacement of higher interest rate debt with debt issuances at lower rates.
|
2017
|
2016
|
2015
|
||||||||
|
|
(In thousands)
|
|||||||||
|
Miscellaneous income, net
|
$
|
44,245
|
|
13,068
|
|
10,156
|
|
|||
Refer to
Note 27
,
Miscellaneous Income, Net
in the Notes to Consolidated Financial Statements for a discussion of the changes in miscellaneous income, net.
|
2017
|
2016
|
2015
|
||||||||
|
|
(In thousands)
|
|||||||||
|
Restructuring charges and fees, net
|
$
|
21,405
|
|
5,074
|
|
18,068
|
|
|||
During the fourth quarters of
2017
,
2016
and
2015
, we approved plans to reduce our workforce in multiple locations as a result of cost containment actions. These actions resulted in pre-tax charges of
$13 million
in
2017
,
$5 million
in
2016
and
$9 million
in
2015
. The workforce reduction approved in
2017
will be completed during 2018 and is expected to result in annual cost savings of approximately
$30 million
. The workforce reduction approved in
2016
was completed during 2017, and the workforce reduction in
2015
was completed during
2016
. During the fourth quarter of
2015
, we also committed to a plan to divest our Ryder Canadian Retail Shippers Association Logistics operations and shutdown our Ryder Container Terminals business in Canada. The sale and shutdown were completed in
2016
. We recognized charges in
2015
for this action of
$3 million
for employee termination costs and
$2 million
for asset impairment to adjust assets held for sale to fair value. Refer to
Note 4
, “
Restructuring Charges and Fees, Net
” in the Notes to Consolidated Financial Statements for further discussion.
|
|
|
Change
|
||||||||||||
|
|
2017
|
2016
|
2015
|
2017/2016
|
2016/2015
|
|||||||||
|
|
(Dollars in thousands)
|
|
|
|||||||||||
|
(Benefit from) provision for income taxes
|
$
|
(477,229
|
)
|
141,741
|
|
163,226
|
|
NM
|
(13)%
|
|||||
|
Effective tax rate from continuing operations
|
(152.1
|
)%
|
34.9
|
%
|
34.8
|
%
|
||||||||
Our provision for income taxes and effective income tax rates from continuing operations are impacted by discrete items such as enacted tax law changes, settlement of tax audits and the reversal of reserves for uncertain tax positions due to the expiration of statutes of limitation. In the aggregate, these items reduced the effective rate by
188.2%
in
2017
,
0.8%
in
2016
and
2.2%
in
2015
. The other components of the effective tax rate in
2017
and
2016
remained consistent with the prior year.
On December 22, 2017, the Tax Cuts and Jobs Act was signed into law. We recognized a benefit of
$586 million
in the fourth quarter of 2017 associated with the adoption of tax reform. Refer to
Note 13
, “
Income Taxes
” in the Notes to Consolidated Financial Statements for further discussion.
32
ITEM 7. MANAGEMENT'S DISCUSSION AND ANALYSIS OF
FINANCIAL CONDITION AND RESULTS OF OPERATIONS - (Continued)
FULL YEAR OPERATING RESULTS BY BUSINESS SEGMENT
|
|
|
Change
|
||||||||||||||
|
|
2017
|
2016
|
2015
|
2017/2016
|
2016/2015
|
|||||||||||
|
|
(In thousands)
|
|
|
|||||||||||||
|
Revenue:
|
||||||||||||||||
|
Fleet Management Solutions
|
$
|
4,733,571
|
|
4,556,194
|
|
4,545,692
|
|
4
|
%
|
—
|
%
|
|||||
|
Dedicated Transportation Solutions
|
1,096,042
|
|
1,020,895
|
|
895,538
|
|
7
|
|
14
|
|
||||||
|
Supply Chain Solutions
|
1,969,500
|
|
1,637,850
|
|
1,547,763
|
|
20
|
|
6
|
|
||||||
|
Eliminations
|
(469,514
|
)
|
(427,955
|
)
|
(417,100
|
)
|
(10
|
)
|
(3
|
)
|
||||||
|
Total
|
$
|
7,329,599
|
|
6,786,984
|
|
6,571,893
|
|
8
|
%
|
3
|
%
|
|||||
|
Operating Revenue:
(1)
|
||||||||||||||||
|
Fleet Management Solutions
|
$
|
4,043,762
|
|
3,947,740
|
|
3,846,046
|
|
2
|
%
|
3
|
%
|
|||||
|
Dedicated Transportation Solutions
|
789,294
|
|
774,319
|
|
714,453
|
|
2
|
|
8
|
|
||||||
|
Supply Chain Solutions
|
1,507,548
|
|
1,352,077
|
|
1,256,309
|
|
11
|
|
8
|
|
||||||
|
Eliminations
|
(300,224
|
)
|
(283,239
|
)
|
(255,731
|
)
|
(6
|
)
|
(11
|
)
|
||||||
|
Total
|
$
|
6,040,380
|
|
5,790,897
|
|
5,561,077
|
|
4
|
%
|
4
|
%
|
|||||
|
EBT:
|
||||||||||||||||
|
Fleet Management Solutions
|
$
|
312,720
|
|
370,829
|
|
461,314
|
|
(16
|
)%
|
(20
|
)%
|
|||||
|
Dedicated Transportation Solutions
|
55,328
|
|
63,571
|
|
45,575
|
|
(13
|
)
|
39
|
|
||||||
|
Supply Chain Solutions
|
103,102
|
|
105,532
|
|
93,575
|
|
(2
|
)
|
13
|
|
||||||
|
Eliminations
|
(53,275
|
)
|
(50,148
|
)
|
(47,193
|
)
|
(6
|
)
|
(6
|
)
|
||||||
|
417,875
|
|
489,784
|
|
553,271
|
|
(15
|
)
|
(11
|
)
|
|||||||
|
Unallocated Central Support Services
|
(48,128
|
)
|
(40,736
|
)
|
(48,700
|
)
|
(18
|
)
|
16
|
|
||||||
|
Non-operating pension costs
|
(27,741
|
)
|
(29,943
|
)
|
(17,797
|
)
|
7
|
|
(68
|
)
|
||||||
|
Restructuring charges and fees, net and other items
|
(28,220
|
)
|
(12,724
|
)
|
(17,559
|
)
|
NM
|
|
NM
|
|
||||||
|
Earnings from continuing operations before income taxes
|
$
|
313,786
|
|
406,381
|
|
469,215
|
|
(23
|
)%
|
(13
|
)%
|
|||||
————————————
|
(1)
|
Non-GAAP financial measures. Refer to the “Non-GAAP Financial Measures” section of this MD&A for a reconciliation of total revenue to operating revenue, and segment total revenue to segment operating revenue for FMS, DTS and SCS, as well as the reasons why management believes these measures are important to investors.
|
As part of management’s evaluation of segment operating performance, we define the primary measurement of our segment financial performance as EBT from continuing operations, which includes an allocation of Central Support Services (CSS), and excludes non-operating pension costs, restructuring and other charges, net, as described in
Note 4
, “
Restructuring Charges and Fees, Net
,” and the items discussed in
Note 24
, “
Other Items Impacting Comparability
,” in the Notes to Consolidated Financial Statements. CSS represents those costs incurred to support all business segments, including human resources, finance, corporate services and public affairs, information technology, health and safety, legal, marketing and corporate communications.
The objective of the EBT measurement is to provide clarity on the profitability of each business segment and, ultimately, to hold leadership of each business segment accountable for their allocated share of CSS costs. Segment results are not necessarily indicative of the results of operations that would have occurred had each segment been an independent, stand-alone entity during the periods presented. Certain costs are not attributable to any segment and remain unallocated in CSS, including costs for investor relations, public affairs and certain executive compensation. See
Note 28
, “
Segment Reporting
,” in the Notes to Consolidated Financial Statements for a description of the methodology for allocating the remainder of CSS costs to the business segments.
33
ITEM 7. MANAGEMENT'S DISCUSSION AND ANALYSIS OF
FINANCIAL CONDITION AND RESULTS OF OPERATIONS - (Continued)
Inter-segment revenue and EBT are accounted for at rates similar to those executed with third parties. EBT related to inter-segment equipment and services billed to DTS and SCS customers (equipment contribution) are included in both FMS and the segment that served the customer and then eliminated (presented as “Eliminations” in the table above). Refer to
Note 28
, "
Segment Reporting
" in the Notes to Consolidated Financial Statements for additional information. Prior year amounts have been reclassified to conform to the current period presentation.
The following table sets forth equipment contribution included in EBT for our DTS and SCS business segments:
|
Change
|
|||||||||||||
|
2017
|
2016
|
2015
|
2017/2016
|
2016/2015
|
|||||||||
|
(In thousands)
|
|||||||||||||
|
Equipment Contribution:
|
|||||||||||||
|
Dedicated Transportation Solutions
|
$
|
31,029
|
|
32,731
|
|
32,471
|
|
(5)%
|
1%
|
||||
|
Supply Chain Solutions
|
22,246
|
|
17,417
|
|
14,722
|
|
28
|
18
|
|||||
|
Total
|
$
|
53,275
|
|
50,148
|
|
47,193
|
|
6%
|
6%
|
||||
|
(1)
|
Total amount is included in FMS EBT
|
DTS equipment contribution decreased
5%
in
2017
, primarily due to higher maintenance costs on an older vehicle fleet used in DTS operations. SCS equipment contribution increased
28%
in
2017
, primarily driven by new business and increased volumes. DTS equipment contribution increased slightly in
2016
. SCS equipment contribution increased
18%
in
2016
, primarily driven by new business and increased volumes.
The following table provides items excluded from our segment EBT measure and their classification within our Consolidated Statements of Earnings:
|
|
|
|||||||||||
|
Description
|
Consolidated
Statements of Earnings Line Item
|
2017
|
2016
|
2015
|
||||||||
|
|
|
(In thousands)
|
||||||||||
|
Restructuring
(1)
|
Restructuring charges and fees, net
|
$
|
(10,500
|
)
|
(5,074
|
)
|
(14,225
|
)
|
||||
|
Fees related to cost-savings program
(2)
|
Restructuring charges and fees, net
|
(10,905
|
)
|
—
|
|
(3,843
|
)
|
|||||
|
Restructuring charges and fees, net
|
(21,405
|
)
|
(5,074
|
)
|
(18,068
|
)
|
||||||
|
Non-operating pension costs
(3)
|
Non-operating pension costs
|
(27,741
|
)
|
(29,943
|
)
|
(17,797
|
)
|
|||||
|
Tax reform related bonus
(2)
|
SG&A
|
(23,278
|
)
|
—
|
|
—
|
|
|||||
|
Operating tax adjustment
(2)
|
SG&A
|
(2,205
|
)
|
—
|
|
—
|
|
|||||
|
Gain on sale of property
(2)
|
Miscellaneous income
|
24,122
|
|
—
|
|
—
|
|
|||||
|
Pension related adjustment
(4)
|
SG&A
|
(5,454
|
)
|
509
|
|
|||||||
|
Pension related adjustment
(4)
|
Non-operating pension costs
|
—
|
|
(7,650
|
)
|
—
|
|
|||||
|
$
|
(55,961
|
)
|
(42,667
|
)
|
(35,356
|
)
|
||||||
________________
|
(1)
|
See
Note 4
, "
Restructuring Charges and Fees, Net
," in the Notes to Consolidated Financial Statements for additional information.
|
|
(2)
|
See
Note 24
, “
Other Items Impacting Comparability
,” in the Notes to Consolidated Financial Statements for additional information.
|
|
(3)
|
See
Note 28
“
Segment Reporting
,” in the Notes to Consolidated Financial Statements for additional information.
|
|
(4)
|
See
Note 22
, “
Employee Benefit Plans
,” in the Notes to Consolidated Financial Statements for additional information.
|
34
ITEM 7. MANAGEMENT'S DISCUSSION AND ANALYSIS OF
FINANCIAL CONDITION AND RESULTS OF OPERATIONS - (Continued)
Fleet Management Solutions
|
|
Change
|
|||||||||||||
|
|
2017
|
2016
|
2015
|
2017/2016
|
|
2016/2015
|
||||||||
|
|
(Dollars in thousands)
|
|
||||||||||||
|
ChoiceLease
|
$
|
2,688,717
|
|
2,573,638
|
|
2,406,711
|
|
4%
|
7%
|
|||||
|
SelectCare
|
464,056
|
|
449,729
|
|
421,665
|
|
3
|
7
|
||||||
|
Commercial rental
|
813,539
|
|
846,331
|
|
940,045
|
|
(4)
|
(10)
|
||||||
|
Other
|
77,450
|
|
78,042
|
|
77,625
|
|
(1)
|
1
|
||||||
|
Fuel services revenue
|
689,809
|
|
608,454
|
|
699,646
|
|
13
|
(13)
|
||||||
|
FMS total revenue
(1)
|
$
|
4,733,571
|
|
4,556,194
|
|
4,545,692
|
|
4%
|
—%
|
|||||
|
FMS operating revenue
(2)
|
$
|
4,043,762
|
|
3,947,740
|
|
3,846,046
|
|
2
|
3
|
|||||
|
FMS EBT
|
$
|
312,720
|
|
370,829
|
|
461,314
|
|
(16)%
|
(20)%
|
|||||
|
FMS EBT as a % of FMS total revenue
|
6.6
|
%
|
8.1
|
%
|
10.1
|
%
|
(150) bps
|
(200) bps
|
||||||
|
FMS EBT as a % of FMS operating revenue
(1)
|
7.7
|
%
|
9.4
|
%
|
12.0
|
%
|
(170) bps
|
(260) bps
|
||||||
____________________
|
(1)
|
Includes intercompany fuel sales from FMS to DTS and SCS.
|
|
(2)
|
Non-GAAP financial measures. Reconciliations of FMS total revenue to FMS operating revenue and FMS EBT as a % of FMS total revenue to FMS EBT as a % of FMS operating revenue, as well as the reasons why management believes these measures are important to investors are included in the “Non-GAAP Financial Measures” section of this MD&A.
|
FMS total revenue increased
4%
to
$4.73 billion
in
2017
and increased slightly in
2016
to
$4.56 billion
. FMS operating revenue (a non-GAAP measure excluding fuel) increased
2%
in
2017
to
$4.04 billion
and
3%
in
2016
to
$3.95 billion
. The following table summarizes the components of the change in revenue on a percentage basis versus the prior year:
|
|
2017
|
2016
|
||||||
|
|
Total
|
Operating
(1)
|
Total
|
Operating
(1)
|
||||
|
Organic, including price and volume
|
2%
|
2%
|
3%
|
4%
|
||||
|
Fuel
|
2
|
—
|
(2)
|
—
|
||||
|
Foreign exchange
|
—
|
—
|
(1)
|
(1)
|
||||
|
Total increase
|
4%
|
2%
|
—%
|
3%
|
||||
————————————
|
(1)
|
Non-GAAP financial measure. A reconciliation of FMS total revenue to FMS operating revenue as well as the reasons why management believes this measure is important to investors is included in the "Non-GAAP Financial Measures" section of this MD&A.
|
2017
versus
2016
ChoiceLease revenue increased
4%
in
2017
, reflecting a larger average fleet size and higher prices on replacement vehicles. The average number of ChoiceLease vehicles increased
2%
from the prior year, reflecting continued solid sales activity. We expect favorable ChoiceLease comparisons to continue next year due to strong
2017
sales activity, as well as expected sales in 2018. Commercial rental revenue decreased
4%
in
2017
due to lower demand. However, we expect favorable commercial rental comparisons next year based on a stronger demand environment experienced in the latter half of 2017. SelectCare revenue increased
3%
in
2017
, due to new business and higher volumes. Fuel services revenue increased
13%
in
2017
due to higher fuel costs passed through to customers.
35
ITEM 7. MANAGEMENT'S DISCUSSION AND ANALYSIS OF
FINANCIAL CONDITION AND RESULTS OF OPERATIONS - (Continued)
FMS EBT decreased
16%
in
2017
, due to increased accelerated depreciation of
$21 million
, lower used vehicle sales and commercial rental results. These decreases were partially offset by improved SelectCare and ChoiceLease performance. The increase in accelerated depreciation reflects a full year of accelerated depreciation and the expansion of acceleration to vehicles expected to be made available for sale through June 2019. Used vehicle sales results declined primarily due to lower pricing. Commercial rental performance declined
4%
in
2017
, reflecting lower demand. However, rental power fleet utilization was
75.6%
in
2017
, up from
74.7%
in
2016
, on a
6%
smaller average rental power fleet, reflecting fleet right-sizing actions taken during the year. SelectCare performance was driven by new business and increased volumes. ChoiceLease comparisons benefited from growth in fleet size and higher per vehicle pricing.
2016
versus
2015
ChoiceLease revenue increased
7%
in
2016
, reflecting a larger average fleet size and higher prices on replacement vehicles. Foreign exchange negatively impacted ChoiceLease revenue growth by 100 basis points. The average number of ChoiceLease vehicles increased
4%
from the prior year, reflecting strong sales activity. Commercial rental revenue decreased
10%
in
2016
, due to lower demand. Foreign exchange negatively impacted commercial rental revenue growth by 100 basis points. SelectCare revenue increased
7%
, primarily due to higher volumes and new business. Fuel services revenue declined
13%
due to lower fuel costs passed through to customers.
FMS EBT decreased
20%
in
2016
, reflecting lower used vehicle sales results, decreased commercial rental performance and accelerated depreciation on vehicles expected to be made available for sale through June 2018 of $10 million, partially offset by higher ChoiceLease performance and lower overhead costs. Used vehicle sales results declined due to lower pricing, primarily on tractors and higher fair market value write-downs on vehicles held for sale. Commercial rental performance declined
10%
in
2016
, reflecting decreased demand. Rental power fleet utilization was
74.7%
in
2016
, down from
76.5%
in
2015
on a
7%
smaller average rental power fleet. ChoiceLease comparisons benefited from growth in fleet size and higher per vehicle pricing. ChoiceLease and commercial rental results benefited from lower depreciation of
$35 million
due to residual value changes implemented on January 1,
2016
.
The following table provides commercial rental statistics on our global fleet:
|
|
Change
|
|||||||||||||
|
|
2017
|
2016
|
2015
|
2017/2016
|
2016/2015
|
|||||||||
|
|
(Dollars in thousands)
|
|
|
|||||||||||
|
Rental revenue from non-lease customers
|
$
|
517,874
|
|
528,892
|
|
571,985
|
|
(2)%
|
(8)%
|
|||||
|
Rental revenue from lease customers
(1)
|
$
|
295,665
|
|
317,439
|
|
368,060
|
|
(7)%
|
(14)%
|
|||||
|
Average commercial rental power fleet size – in service
(2), (3)
|
29,700
|
|
31,500
|
|
33,800
|
|
(6)%
|
(7)%
|
||||||
|
Commercial rental utilization – power fleet
(2)
|
75.6
|
%
|
74.7
|
%
|
76.5
|
%
|
90 bps
|
(180) bps
|
||||||
______________
|
(1)
|
Represents revenue from rental vehicles provided to our existing ChoiceLease customers, generally in place of a lease vehicle.
|
|
(2)
|
Number of units rounded to nearest hundred and calculated using quarterly average unit counts.
|
|
(3)
|
Excluding trailers.
|
36
ITEM 7. MANAGEMENT'S DISCUSSION AND ANALYSIS OF
FINANCIAL CONDITION AND RESULTS OF OPERATIONS - (Continued)
|
Our global fleet of owned and leased revenue earning equipment and SelectCare vehicles, including vehicles under on-demand maintenance, is summarized as follows (number of units rounded to the nearest hundred):
|
|||||||||||||
|
|
|
|
|
Change
|
|||||||||
|
|
2017
|
2016
|
2015
|
2017/2016
|
2016/2015
|
||||||||
|
End of period vehicle count
|
|||||||||||||
|
By type:
|
|||||||||||||
|
Trucks
(1)
|
76,400
|
|
73,300
|
|
72,800
|
|
4%
|
1%
|
|||||
|
Tractors
(2)
|
66,000
|
|
67,900
|
|
68,700
|
|
(3)
|
(1)
|
|||||
|
Trailers
(3), (4)
|
42,600
|
|
42,800
|
|
42,400
|
|
—
|
1
|
|||||
|
Other
|
1,200
|
|
1,100
|
|
1,300
|
|
9
|
(15)
|
|||||
|
Total
|
186,200
|
|
185,100
|
|
185,200
|
|
1%
|
—%
|
|||||
|
By ownership:
|
|
|
|||||||||||
|
Owned
|
184,900
|
|
183,700
|
|
184,700
|
|
1%
|
(1)%
|
|||||
|
Leased
|
1,300
|
|
1,400
|
|
500
|
|
(7)
|
180
|
|||||
|
Total
|
186,200
|
|
185,100
|
|
185,200
|
|
1%
|
—%
|
|||||
|
By product line:
(4)
|
|
|
|||||||||||
|
ChoiceLease
|
139,100
|
|
136,500
|
|
131,800
|
|
2%
|
4%
|
|||||
|
Commercial rental
|
37,800
|
|
37,800
|
|
42,100
|
|
—
|
(10)
|
|||||
|
Service vehicles and other
|
3,300
|
|
3,300
|
|
3,300
|
|
—
|
—
|
|||||
|
Active units
|
180,200
|
|
177,600
|
|
177,200
|
|
1
|
—
|
|||||
|
Held for sale
|
6,000
|
|
7,500
|
|
8,000
|
|
(20)
|
(6)
|
|||||
|
Total
|
186,200
|
|
185,100
|
|
|
185,200
|
|
|
1
|
—
|
|||
|
Customer vehicles under SelectCare contracts
|
54,400
|
|
49,000
|
|
46,700
|
|
11
|
5
|
|||||
|
Average vehicle count
|
|
|
|||||||||||
|
By product line:
|
|
|
|||||||||||
|
ChoiceLease
|
137,600
|
|
134,400
|
|
128,800
|
|
2%
|
4%
|
|||||
|
Commercial rental
|
37,500
|
|
39,200
|
|
42,400
|
|
(4)
|
(8)
|
|||||
|
Service vehicles and other
|
3,400
|
|
3,400
|
|
3,200
|
|
—
|
6
|
|||||
|
Active units
|
178,500
|
|
177,000
|
|
174,400
|
|
|
1
|
1
|
||||
|
Held for sale
|
6,700
|
|
8,400
|
|
6,100
|
|
(20)
|
38
|
|||||
|
Total
|
185,200
|
|
185,400
|
|
180,500
|
|
—
|
3
|
|||||
|
Customer vehicles under SelectCare contracts
|
52,100
|
|
49,200
|
|
43,300
|
|
6%
|
14%
|
|||||
|
Customer vehicles under SelectCare on-demand
(5)
|
24,500
|
|
21,000
|
|
20,000
|
|
17%
|
5%
|
|||||
|
Total vehicles serviced
|
261,800
|
|
255,600
|
|
243,800
|
|
2%
|
5%
|
|||||
__________________
|
(1)
|
Generally comprised of Class 1 through Class 7 type vehicles with a Gross Vehicle Weight (GVW) up to 33,000 pounds.
|
|
(2)
|
Generally comprised of over the road on highway tractors and are primarily comprised of Class 8 type vehicles with a GVW of over 33,000 pounds.
|
|
(3)
|
Generally comprised of dry, flatbed and refrigerated type trailers.
|
|
(4)
|
Includes
4,900
UK trailers (
3,100
ChoiceLease and
1,800
commercial rental),
5,300
UK trailers (
3,300
ChoiceLease and
2,000
commercial rental) and
6,100
UK trailers (
3,900
ChoiceLease and
2,200
commercial rental) as of December 31,
2017
,
2016
and
2015
, respectively.
|
|
(5)
|
Comprised of the number of unique vehicles serviced under on-demand maintenance agreements. This does not represent averages for the periods. Vehicles included in the end of period count may have been serviced more than one time during the respective annual period.
|
|
Note:
|
Average vehicle counts were computed using a 24-point average based on monthly information.
|
37
ITEM 7. MANAGEMENT'S DISCUSSION AND ANALYSIS OF
FINANCIAL CONDITION AND RESULTS OF OPERATIONS - (Continued)
The totals in the previous table include the following non-revenue earning equipment for the global fleet (number of units rounded to the nearest hundred):
|
|
|
Change
|
|||||||||||
|
Number of Units
|
2017
|
2016
|
2015
|
2017/2016
|
2016/2015
|
||||||||
|
Not yet earning revenue (NYE)
|
2,900
|
|
1,700
|
|
2,800
|
|
71%
|
(39)%
|
|||||
|
No longer earning revenue (NLE):
|
|||||||||||||
|
Units held for sale
|
6,000
|
|
7,500
|
|
8,000
|
|
(20)
|
(6)
|
|||||
|
Other NLE units
|
3,400
|
|
4,400
|
|
3,300
|
|
(23)
|
33
|
|||||
|
Total
|
12,300
|
|
13,600
|
|
14,100
|
|
(10)%
|
(4)%
|
|||||
NYE units represent new vehicles on hand that are being prepared for deployment to a lease customer or into the rental fleet. Preparations include activities such as adding lift gates, paint, decals, cargo area and refrigeration equipment. For
2017
, the number of NYE units increased
71%
compared with
December 31, 2016
, reflecting lease fleet growth. NLE units represent all vehicles held for sale and vehicles for which no revenue has been earned in the previous 30 days. Accordingly, these vehicles may be temporarily out of service, being prepared for sale or awaiting redeployment. For
2017
, the number of NLE units decreased
21%
, reflecting lower used vehicle inventories and a lower number of vehicles being prepared for sale at the end of the year. We expect NLE units to increase slightly in
2018
, as a result of higher expected used vehicle inventories driven by the lease replacement cycle.
Dedicated Transportation Solutions
|
|
Change
|
|||||||||||||
|
|
2017
|
2016
|
2015
|
2017/2016
|
2016/2015
|
|||||||||
|
|
(Dollars in thousands)
|
|
|
|||||||||||
|
DTS total revenue
|
$
|
1,096,042
|
|
1,020,895
|
|
895,538
|
|
7%
|
14%
|
|||||
|
|
|
|
|
|||||||||||
|
DTS operating revenue
(1)
|
$
|
789,294
|
|
774,319
|
|
714,453
|
|
2%
|
8%
|
|||||
|
DTS EBT
|
$
|
55,328
|
|
63,571
|
|
45,575
|
|
(13)%
|
39%
|
|||||
|
DTS EBT as a % of DTS total revenue
|
5.0
|
%
|
6.2
|
%
|
5.1
|
%
|
(120) bps
|
110 bps
|
||||||
|
DTS EBT as a % of DTS operating revenue
(1)
|
7.0
|
%
|
8.2
|
%
|
6.4
|
%
|
(120) bps
|
180 bps
|
||||||
|
Memo:
|
||||||||||||||
|
Average fleet
|
8,200
|
|
8,200
|
|
7,700
|
|
—%
|
6%
|
||||||
__________________
|
(1)
|
Non-GAAP financial measures. Reconciliations of DTS total revenue to DTS operating revenue and DTS EBT as a % of DTS total revenue to DTS EBT as a % of DTS operating revenue, as well as the reasons why management believes these measures are important to investors are included in the “Non-GAAP Financial Measures” section of this MD&A.
|
DTS total revenue increased
7%
in
2017
to
$1.10 billion
and increased
14%
in
2016
to $
1.02 billion
. DTS operating revenue (a non-GAAP measure excluding fuel and subcontracted transportation) increased
2%
in
2017
to
$789 million
and
8%
in
2016
to
$774 million
. We expect improved operating revenue growth next year based on strong sales activity as well as expected 2018 activity.
38
ITEM 7. MANAGEMENT'S DISCUSSION AND ANALYSIS OF
FINANCIAL CONDITION AND RESULTS OF OPERATIONS - (Continued)
The following table summarizes the components of the change in revenue on a percentage basis versus the prior year:
|
|
2017
|
2016
|
||||||
|
|
Total
|
Operating
(1)
|
Total
|
Operating
(1)
|
||||
|
Organic, including price and volume
|
6%
|
2%
|
16%
|
8%
|
||||
|
Fuel
|
1
|
—
|
(2)
|
—
|
||||
|
Total increase
|
7%
|
2%
|
14%
|
8%
|
||||
————————————
|
(1)
|
Non-GAAP financial measure. A reconciliation of DTS total revenue to DTS operating revenue, as well as the reasons why management believes this measure is important to investors is included in the "Non-GAAP Financial Measures" section of this MD&A.
|
2017
versus
2016
In
2017
, DTS total revenue increased
7%
reflecting organic growth and, to a lesser extent, higher fuel costs passed through to our customers. DTS operating revenue increased
2%
due to new business, increased volumes and higher pricing. DTS EBT decreased
13%
due to higher insurance premiums, increased maintenance costs on certain older model year vehicles and higher labor costs from increased driver turnover. These items were partially offset by favorable developments of self-insurance claims from prior years.
2016
versus
2015
In
2016
, DTS total revenue increased
14%
reflecting organic growth, partially offset by lower fuel prices passed through to our customers. DTS operating revenue increased
8%
due to new business, increased volumes and higher pricing. DTS EBT increased
39%
due to increased revenue and, to a lesser extent, lower insurance costs.
Supply Chain Solutions
|
|
|
Change
|
||||||||||||||
|
|
2017
|
2016
|
2015
|
2017/2016
|
2016/2015
|
|||||||||||
|
|
(Dollars in thousands)
|
|
|
|||||||||||||
|
Automotive
|
$
|
566,302
|
|
548,659
|
|
469,178
|
|
3%
|
17%
|
|||||||
|
Technology and healthcare
|
271,551
|
|
242,474
|
|
251,188
|
|
12
|
(3)
|
||||||||
|
CPG and retail
|
511,793
|
|
436,368
|
|
431,571
|
|
17
|
1
|
||||||||
|
Industrial and other
|
157,902
|
|
124,576
|
|
104,372
|
|
27
|
19
|
||||||||
|
Subcontracted transportation
|
386,792
|
|
224,060
|
|
226,880
|
|
73
|
(1)
|
||||||||
|
Fuel
|
75,160
|
|
61,713
|
|
64,574
|
|
22
|
(4)
|
||||||||
|
SCS total revenue
|
$
|
1,969,500
|
|
$
|
1,637,850
|
|
$
|
1,547,763
|
|
20%
|
6%
|
|||||
|
SCS operating revenue
(1)
|
$
|
1,507,548
|
|
1,352,077
|
|
1,256,309
|
|
11%
|
8%
|
|||||||
|
SCS EBT
|
$
|
103,102
|
|
105,532
|
|
93,575
|
|
(2)%
|
13%
|
|||||||
|
SCS EBT as a % of SCS total revenue
|
5.2
|
%
|
6.4
|
%
|
|
6.0
|
%
|
(120) bps
|
40 bps
|
|||||||
|
SCS EBT as a % of SCS operating revenue
(1)
|
6.8
|
%
|
7.8
|
%
|
|
7.4
|
%
|
(100) bps
|
40 bps
|
|||||||
|
Memo:
|
||||||||||||||||
|
Average fleet
|
7,900
|
|
7,200
|
|
6,300
|
|
10%
|
14%
|
||||||||
————————————
|
(1)
|
Non-GAAP financial measures. Reconciliations of SCS total revenue to SCS operating revenue and SCS EBT as a % of SCS total revenue to SCS EBT as a % of SCS operating revenue, as well as the reasons why management believes these measures are important to investors are included in the “Non-GAAP Financial Measures” section of this MD&A.
|
39
ITEM 7. MANAGEMENT'S DISCUSSION AND ANALYSIS OF
FINANCIAL CONDITION AND RESULTS OF OPERATIONS - (Continued)
SCS total revenue increased
20%
in
2017
to
$1.97 billion
and
6%
in
2016
to
$1.64 billion
. SCS operating revenue (a non-GAAP measure excluding fuel and subcontracted transportation) increased
11%
in
2017
to
$1.51 billion
and
8%
in
2016
to
$1.35 billion
. We expect favorable operating revenue comparisons to continue next year, although at a lower level than realized in 2017.
The following table summarizes the components of the change in revenue on a percentage basis versus the prior year:
|
|
2017
|
2016
|
||||||
|
|
Total
|
Operating
(1)
|
Total
|
Operating
(1)
|
||||
|
Organic, including price and volume
|
19%
|
11%
|
8%
|
9%
|
||||
|
Foreign exchange
|
—
|
—
|
(2)
|
(1)
|
||||
|
Fuel
|
1
|
—
|
—
|
—
|
||||
|
Total increase
|
20%
|
|
11%
|
6%
|
8%
|
|||
————————————
|
(1)
|
Non-GAAP financial measure. A reconciliation of SCS total revenue to SCS operating revenue, as well as the reasons why management believes this measure is important to investors is included in the "Non-GAAP Financial Measures" section of this MD&A.
|
2017
versus
2016
SCS total revenue increased
20%
in
2017
due to organic growth and, to a lesser extent, higher fuel costs passed through to our customers. SCS operating revenue increased
11%
due to new business, increased volumes and higher pricing. SCS EBT decreased
2%
in
2017
as benefits from increased revenue were offset by the performance of two customer accounts, higher compensation-related costs and higher overhead spending due to planned investments in information technology and sales.
2016
versus
2015
SCS total revenue increased
6%
in
2016
as increased operating revenue was partially offset by a negative impact from foreign exchange. SCS operating revenue increased
8%
due to new business, increased volumes and higher pricing, partially offset by a negative impact from foreign exchange. SCS EBT increased
13%
in
2016
due to increased revenue.
40
ITEM 7. MANAGEMENT'S DISCUSSION AND ANALYSIS OF
FINANCIAL CONDITION AND RESULTS OF OPERATIONS - (Continued)
Central Support Services
|
|
|
Change
|
||||||||||||
|
|
2017
|
2016
|
2015
|
2017/2016
|
2016/2015
|
|||||||||
|
|
(In thousands)
|
|
|
|||||||||||
|
Human resources
|
$
|
16,820
|
|
17,501
|
|
20,150
|
|
(4)%
|
(13)%
|
|||||
|
Finance
|
58,597
|
|
59,445
|
|
60,998
|
|
(1)
|
(3)
|
||||||
|
Corporate services and public affairs
|
12,561
|
|
11,682
|
|
12,303
|
|
8
|
(5)
|
||||||
|
Information technology
|
89,453
|
|
82,087
|
|
84,729
|
|
9
|
(3)
|
||||||
|
Legal and safety
|
25,382
|
|
23,977
|
|
24,522
|
|
6
|
(2)
|
||||||
|
Marketing
|
18,306
|
|
18,029
|
|
22,206
|
|
2
|
(19)
|
||||||
|
Other
|
34,284
|
|
24,144
|
|
33,888
|
|
42
|
(29)
|
||||||
|
Total CSS
|
255,403
|
|
236,865
|
|
258,796
|
|
8
|
(8)
|
||||||
|
Allocation of CSS to business segments
|
(207,275
|
)
|
(196,129
|
)
|
(210,096
|
)
|
6
|
(7)
|
||||||
|
Unallocated CSS
|
$
|
48,128
|
|
40,736
|
|
48,700
|
|
18%
|
(16)%
|
|||||
2017
versus
2016
Total CSS costs increased
8%
in
2017
to
$255 million
, due to higher information technology and compensation-related costs, as well as, higher professional services costs associated with strategic initiatives. Unallocated CSS costs increased
18%
in
2017
to
$48 million
, primarily due to higher professional services costs associated with strategic initiatives.
2016
versus
2015
Total CSS costs decreased
8%
in
2016
to
$237 million
, due to lower compensation-related expenses and lower marketing-related and information technology costs. Unallocated CSS costs decreased
16%
in
2016
to
$41 million
, primarily due to the
2015
settlement of a customer-extended insurance claim that adversely impacted costs in the prior year and lower compensation-related expenses.
41
ITEM 7. MANAGEMENT'S DISCUSSION AND ANALYSIS OF
FINANCIAL CONDITION AND RESULTS OF OPERATIONS - (Continued)
FOURTH QUARTER CONSOLIDATED RESULTS
|
|
Three months ended December 31,
|
Change
|
|||||||
|
|
2017
|
2016
|
2017/2016
|
||||||
|
|
(Dollars in thousands, except
per share amounts)
|
|
|||||||
|
Total revenue
|
$
|
1,939,693
|
|
1,729,150
|
|
12%
|
|||
|
Operating revenue
(1)
|
1,586,612
|
|
1,466,878
|
|
8
|
||||
|
EBT
|
$
|
78,795
|
|
69,196
|
|
14%
|
|||
|
Comparable EBT
(2)
|
104,540
|
|
82,165
|
|
27
|
||||
|
Earnings from continuing operations
(3)
|
642,480
|
|
49,275
|
|
1,204
|
||||
|
Comparable earnings from continuing operations
(2)
|
72,730
|
|
57,435
|
|
27
|
||||
|
Net earnings
(3)
|
642,970
|
|
48,181
|
|
1,234
|
||||
|
Earnings per common share (EPS) — Diluted
|
|||||||||
|
Continuing operations
(3)
|
$
|
12.10
|
|
0.92
|
|
1,215%
|
|||
|
Comparable
(2)
|
1.37
|
|
1.07
|
|
28
|
||||
|
Net earnings
(3)
|
$
|
12.11
|
|
0.91
|
|
1,231
|
|||
————————————
|
(1)
|
Non-GAAP financial measure. Refer to the“Non-GAAP Financial Measures” section of this MD&A for a reconciliation of total revenue to operating revenue and the reasons why management believes this measure is important to investors.
|
|
(2)
|
Non-GAAP financial measures. Refer to the “Non-GAAP Financial Measures” section for a reconciliation of EBT, net earnings from continuing operations and earnings per diluted common share to their respective comparable measures and the reasons why management believes these measures are important to investors.
|
|
(3)
|
2017 amounts reflect tax benefit as a result of the 2017 Tax Cuts and Jobs Act. Refer to Note 13 , "Income Taxes ," in the Notes to Consolidated Financial Statements for additional information.
|
Total revenue increased
12%
in the fourth quarter of
2017
to
$1.94 billion
. Operating revenue (a non-GAAP measure excluding fuel and subcontracted transportation) increased
8%
in the fourth quarter of
2017
to
$1.59 billion
. The following table summarizes the components of the change in revenue on a percentage basis versus the prior year:
|
|
Three months ended December 31, 2017
|
|||
|
|
Total
|
Operating
(1)
|
||
|
Organic, including price and volume
|
9%
|
7%
|
||
|
Foreign exchange
|
1
|
1
|
||
|
Fuel
|
2
|
—
|
||
|
Total increase
|
12%
|
8%
|
||
————————————
|
(1)
|
Non-GAAP financial measure. Refer to the“Non-GAAP Financial Measures” section of this MD&A for a reconciliation of total revenue to operating revenue and the reasons why management believes this measure is important to investors.
|
Total revenue and operating revenue grew across all three business segments reflecting new business and higher volumes. Total revenue also grew due to higher fuel costs passed through to customers. EBT increased
14%
in the fourth quarter of
2017
to
$79 million
. The increase in EBT primarily reflects improved used vehicle sales results and higher commercial rental and lease performance, partially offset by higher restructuring and other charges. See “Fourth Quarter Operating Results by Business Segment” for further discussion of segment operating results.
42
ITEM 7. MANAGEMENT'S DISCUSSION AND ANALYSIS OF
FINANCIAL CONDITION AND RESULTS OF OPERATIONS - (Continued)
FOURTH QUARTER OPERATING RESULTS BY BUSINESS SEGMENT
|
|
Three months ended December 31,
|
Change
|
|||||||
|
|
2017
|
2016
|
2017/2016
|
||||||
|
|
(In thousands)
|
|
|||||||
|
Revenue:
|
|||||||||
|
Fleet Management Solutions
|
$
|
1,241,724
|
|
1,151,742
|
|
8%
|
|||
|
Dedicated Transportation Solutions
|
284,422
|
|
256,870
|
|
11
|
||||
|
Supply Chain Solutions
|
540,023
|
|
430,185
|
|
26
|
||||
|
Eliminations
|
(126,476
|
)
|
(109,647
|
)
|
(15)
|
||||
|
Total
|
$
|
1,939,693
|
|
1,729,150
|
|
12%
|
|||
|
Operating Revenue:
(1)
|
|||||||||
|
Fleet Management Solutions
|
$
|
1,056,970
|
|
992,274
|
|
7%
|
|||
|
Dedicated Transportation Solutions
|
198,249
|
|
193,106
|
|
3
|
||||
|
Supply Chain Solutions
|
410,649
|
|
352,650
|
|
16
|
||||
|
Eliminations
|
(79,256
|
)
|
(71,152
|
)
|
(11)
|
||||
|
Total
|
$
|
1,586,612
|
|
1,466,878
|
|
8%
|
|||
|
EBT:
|
|||||||||
|
Fleet Management Solutions
|
$
|
91,747
|
|
64,275
|
|
43%
|
|||
|
Dedicated Transportation Solutions
|
15,436
|
|
15,271
|
|
1
|
||||
|
Supply Chain Solutions
|
27,743
|
|
26,427
|
|
5
|
||||
|
Eliminations
|
(15,222
|
)
|
(13,032
|
)
|
(17)
|
||||
|
119,704
|
|
92,941
|
|
29
|
|||||
|
Unallocated Central Support Services
|
(15,163
|
)
|
(10,775
|
)
|
(41)
|
||||
|
Non-operating pension costs
|
(6,866
|
)
|
(7,895
|
)
|
13
|
||||
|
Restructuring and other charges, net and other items
|
(18,880
|
)
|
(5,074
|
)
|
NM
|
||||
|
Earnings from continuing operations before income taxes
|
$
|
78,795
|
|
69,196
|
|
14%
|
|||
————————————
|
(1)
|
Non-GAAP financial measure. Refer to the “Non-GAAP Financial Measures” section of this MD&A for a reconciliation of total revenue to operating revenue, and segment total revenue to segment operating revenue, as well as the reasons why management believes these measures are important to investors.
|
Fleet Management Solutions
FMS total revenue increased
8%
to
$1.24 billion
in the fourth quarter of
2017
. FMS operating revenue (a non-GAAP measure excluding fuel) increased
7%
in the fourth quarter of
2017
to
$1.06 billion
. The following table summarizes the components of the change in revenue on a percentage basis versus the prior year.
|
|
Three months ended December 31, 2017
|
|||
|
|
Total
|
Operating
(1)
|
||
|
Organic, including price and volume
|
5%
|
6%
|
||
|
Fuel
|
2
|
—
|
||
|
Foreign exchange
|
1
|
1
|
||
|
Total increase
|
8%
|
7%
|
||
————————————
|
(1)
|
Non-GAAP financial measure. A reconciliation of FMS total revenue to FMS operating revenue as well as the reasons why management believes this measure is important to investors is included in the "Non-GAAP Financial Measures" section of this MD&A.
|
ChoiceLease revenue increased
6%
to
$696 million
in the fourth quarter of
2017
, reflecting a larger average lease fleet size and higher prices on replacement vehicles. Commercial rental revenue grew
7%
in the fourth quarter of
2017
due to increased demand and higher pricing. Fuel services revenue increased
16%
to
$185 million
in the fourth quarter of
2017
due to higher fuel costs passed through to customers.
43
ITEM 7. MANAGEMENT'S DISCUSSION AND ANALYSIS OF
FINANCIAL CONDITION AND RESULTS OF OPERATIONS - (Continued)
FMS EBT increased
43%
in the fourth quarter of
2017
to
$92 million
, reflecting improved used vehicle sales results and higher commercial rental and ChoiceLease performance. Used vehicle sales comparisons primarily reflect prior year inventory valuation adjustments of $21 million. Commercial rental performance improved due to higher pricing and increased utilization, reflecting stronger demand on a smaller fleet due to the fleet right-sizing actions taken earlier in the year. Rental power fleet utilization increased to
81.2%
in the fourth quarter of
2017
from
77.3%
in the year-earlier period. ChoiceLease results benefited from fleet growth. These items were partially offset by higher compensation-related costs. Additionally, FMS results in the fourth quarter included accelerated depreciation of
$9 million
in 2017 and
$10 million
in 2016 to reflect a challenging used vehicle market outlook.
Dedicated Transportation Solutions
DTS total revenue increased
11%
in the fourth quarter of
2017
to
$284 million
and DTS operating revenue (a non-GAAP measure excluding fuel and subcontracted transportation) increased
3%
in the fourth quarter of
2017
to
$198 million
. The following table summarizes the components of the change in revenue on a percentage basis versus the prior year:
|
|
Three months ended December 31, 2017
|
|||
|
|
Total
|
Operating
(1)
|
||
|
Organic, including price and volume
|
9%
|
3%
|
||
|
Fuel
|
2
|
—
|
||
|
Total increase
|
11%
|
3%
|
||
The growth in DTS total revenue and DTS operating revenue primarily reflects increased volumes. DTS EBT increased
1%
from the fourth quarter of the prior year as favorable developments of self-insurance claims from prior years largely offset by higher driver costs due to increased turnover and seasonal volumes at select customer accounts, as well as elevated maintenance costs on certain older model year vehicles.
Supply Chain Solutions
SCS total revenue increased
26%
in the fourth quarter of
2017
to
$540 million
. SCS operating revenue (a non-GAAP measure excluding fuel and subcontracted transportation) increased
16%
in the fourth quarter of
2017
to
$411 million
. The following table summarizes the components of the change in revenue on a percentage basis versus the prior year:
|
|
Three months ended December 31, 2017
|
|||
|
|
Total
|
Operating
(1)
|
||
|
Organic, including price and volume
|
24%
|
15%
|
||
|
Fuel
|
1
|
—
|
||
|
Foreign exchange
|
1
|
1
|
||
|
Total increase
|
26%
|
16%
|
||
————————————
|
(1)
|
Non-GAAP financial measure. A reconciliation of SCS total revenue to SCS operating revenue, as well as the reasons why management believes this measure is important to investors is included in the "Non-GAAP Financial Measures" section of this MD&A.
|
SCS total revenue and SCS operating revenue grew primarily as a result of new business. SCS EBT increased
5%
in the fourth quarter of
2017
to
$28 million
reflecting the impact of revenue growth, partially offset by lower performance in two customer accounts, although to a lesser extent than in the third quarter of 2017. Additionally, results were negatively impacted by higher overhead spending due to planned investments in information technology and sales.
Central Support Services
Unallocated CSS costs increased
41%
in the fourth quarter of
2017
to
$15 million
primarily due to higher compensation-related costs and professional fees in
2017
.
44
ITEM 7. MANAGEMENT'S DISCUSSION AND ANALYSIS OF
FINANCIAL CONDITION AND RESULTS OF OPERATIONS - (Continued)
FINANCIAL RESOURCES AND LIQUIDITY
Cash Flows
The following is a summary of our cash flows from continuing operations:
|
2017
|
2016
|
2015
|
||||||||
|
|
(In thousands)
|
|||||||||
|
Net cash provided by (used in):
|
||||||||||
|
Operating activities
|
$
|
1,547,986
|
|
1,601,022
|
|
1,441,788
|
|
|||
|
Financing activities
|
(155,115
|
)
|
(185,922
|
)
|
731,485
|
|
||||
|
Investing activities
|
(1,366,340
|
)
|
(1,405,833
|
)
|
(2,161,355
|
)
|
||||
|
Effect of exchange rates on cash
|
(5,539
|
)
|
(9,482
|
)
|
37
|
|
||||
|
Net change in cash and cash equivalents
|
$
|
20,992
|
|
(215
|
)
|
11,955
|
|
|||
Cash provided by operating activities from continuing operations decreased to
$1.55 billion
in
2017
, compared with
$1.60 billion
in
2016
, primarily reflecting the impact of lower comparable earnings. Cash used in financing activities totaled
$155 million
in
2017
, compared with
$186 million
in
2016
, driven by share repurchases and common stock dividends. Cash used in investing activities decreased to
$1.37 billion
in
2017
, compared with
$1.41 billion
in
2016
, primarily due to lower payments for capital expenditures and higher proceeds from operating property and equipment sales, partially offset by lower proceeds from revenue earning equipment sales.
Cash provided by operating activities from continuing operations increased to
$1.60 billion
in
2016
, compared with
$1.44 billion
in
2015
, reflecting higher earnings adjusted for non-cash items, primarily depreciation, and working capital improvements, partially offset by higher pension contributions. The working capital improvements were primarily driven by the timing of trade account payments to vendors. Cash used in financing activities was
$186 million
in
2016
, compared to cash provided from financing activities of
$731 million
in
2015
due to lower borrowing needs. Cash used in investing activities decreased to
$1.41 billion
in
2016
, compared with
$2.16 billion
in
2015
, primarily due to lower payments for capital expenditures.
The following table shows the components of our free cash flow:
|
2017
|
2016
|
2015
|
||||||||
|
|
(In thousands)
|
|||||||||
|
Net cash provided by operating activities
|
$
|
1,547,986
|
|
1,601,022
|
|
1,441,788
|
|
|||
|
Sales of revenue earning equipment
(1)
|
376,743
|
|
414,249
|
|
423,605
|
|
||||
|
Sales of operating property and equipment
(1)
|
52,257
|
|
7,051
|
|
3,891
|
|
||||
|
Collections on direct finance leases and other
(1)
|
73,172
|
|
76,510
|
|
70,980
|
|
||||
|
Total cash generated
(2)
|
2,050,158
|
|
2,098,832
|
|
1,940,264
|
|
||||
|
Purchases of property and revenue earning equipment
(1)
|
(1,860,436
|
)
|
(1,905,157
|
)
|
(2,667,978
|
)
|
||||
|
Free cash flow
(2)
|
$
|
189,722
|
|
193,675
|
|
(727,714
|
)
|
|||
|
Memo:
|
||||||||||
|
Net cash (used in) provided by financing activities
|
$
|
(155,115
|
)
|
(185,922
|
)
|
731,485
|
|
|||
|
Net cash used in investing activities
|
$
|
(1,366,340
|
)
|
(1,405,833
|
)
|
(2,161,355
|
)
|
|||
———————————
|
(1)
|
Included in cash flows from investing activities.
|
|
(2)
|
Non-GAAP financial measures. Reconciliations of net cash provided by operating activities to total cash generated and to free cash flow are set forth in this table. Refer to the “Non-GAAP Financial Measures” section of this MD&A for the reasons why management believes these measures are important to investors.
|
Free cash flow of
$190 million
in
2017
was level with
$194 million
in
2016
, primarily due to lower cash flows from operations, partially offset by lower cash paid for purchases of property and revenue earning equipment in
2017
. Free cash flow increased to
$194 million
in
2016
from
$(728) million
in
2015
due to lower capital expenditures in
2016
.
45
ITEM 7. MANAGEMENT'S DISCUSSION AND ANALYSIS OF
FINANCIAL CONDITION AND RESULTS OF OPERATIONS - (Continued)
We expect cash provided by operating activities from continuing operations to increase approximately $270 million to $1.8 billion in
2018
, due to pre-tax earnings growth adjusted for non-cash items, primarily depreciation. We expect
2018
free cash flow to decrease to negative
$600 million
, reflecting capital spending to fund higher growth and replacement in the lease and rental vehicle fleets.
Capital expenditures are generally used to purchase revenue earning equipment (trucks, tractors and trailers) within our FMS segment. These expenditures primarily support the ChoiceLease and commercial rental product lines. The level of capital required to support the ChoiceLease product line varies based on customer contract signings for replacement vehicles and growth. These contracts are long-term agreements that result in predictable cash flows typically over a three to seven year term for trucks and tractors and ten years for trailers. We utilize capital for the purchase of vehicles in our commercial rental product line to replenish and expand the fleet available for shorter-term use by contractual or occasional customers. Operating property and equipment expenditures primarily relate to spending on items such as vehicle maintenance facilities and equipment, computer and telecommunications equipment, investments in technologies, and warehouse facilities and equipment.
The following is a summary of capital expenditures:
|
2017
|
2016
|
2015
|
||||||||
|
|
(In thousands)
|
|||||||||
|
Revenue earning equipment:
|
||||||||||
|
ChoiceLease
|
$
|
1,456,758
|
|
1,547,717
|
|
2,060,254
|
|
|||
|
Commercial rental
|
351,707
|
|
82,580
|
|
522,940
|
|
||||
|
1,808,465
|
|
1,630,297
|
|
2,583,194
|
|
|||||
|
Operating property and equipment
|
132,752
|
|
132,603
|
|
112,918
|
|
||||
|
Total capital expenditures
(1)
|
1,941,217
|
|
1,762,900
|
|
2,696,112
|
|
||||
|
Changes in accounts payable related to purchases of revenue earning equipment
|
(80,781
|
)
|
142,257
|
|
(28,134
|
)
|
||||
|
Cash paid for purchases of property and revenue earning equipment
|
$
|
1,860,436
|
|
1,905,157
|
|
2,667,978
|
|
|||
_____________
|
(1)
|
Non-cash additions exclude approximately
$7 million
,
$1 million
and
$6 million
in
2017
,
2016
and
2015
, respectively, in assets held under capital leases resulting from the extension of existing operating leases and other additions.
|
Capital expenditures
increased
to
$1.94 billion
in
2017
, reflecting higher planned investments to refresh our commercial rental fleet, partially offset by lower ChoiceLease spending. Capital expenditures
decreased
in
2016
to
$1.76 billion
, reflecting lower planned investments in the ChoiceLease and commercial rental fleets. We expect capital expenditures to increase to approximately
$2.9 billion
in
2018
, primarily due to increased investments to grow our ChoiceLease fleet, and to refresh and expand our commercial rental fleet. We expect to fund
2018
capital expenditures primarily with additional debt financing.
Working Capital
|
2017
|
2016
|
|||||||
|
|
(In thousands)
|
|||||||
|
Current assets
|
$
|
1,322,282
|
|
$
|
1,101,557
|
|
||
|
Current liabilities
|
2,012,778
|
|
1,744,069
|
|
||||
|
Working capital
|
$
|
(690,496
|
)
|
$
|
(642,512
|
)
|
||
Our net working capital was negative
$690 million
at
December 31, 2017
, compared with negative
$643 million
at
December 31, 2016
. Approximately $826 million of our negative working capital is associated with debt due in the next year. Our global revolving credit facility is used primarily to finance working capital needs. See "Financing and Other Funding Transactions" for further discussion on the adequacy of our funding sources to meet our operating, investing and financing needs.
46
ITEM 7. MANAGEMENT'S DISCUSSION AND ANALYSIS OF
FINANCIAL CONDITION AND RESULTS OF OPERATIONS - (Continued)
Financing and Other Funding Transactions
We utilize external capital primarily to support working capital needs and growth in our asset-based product lines. The variety of financing alternatives typically available to fund our capital needs include commercial paper, long-term and medium-term public and private debt, asset-backed securities, bank term loans, leasing arrangements and bank credit facilities. Our principal sources of financing are issuances of commercial paper and medium-term notes.
Our ability to access unsecured debt in the capital markets is impacted by both our short-term and long-term debt ratings. These ratings are intended to provide guidance to fixed income investors in determining the credit risk associated with particular Ryder securities based on current information obtained by the rating agencies from us or from other sources. Lower ratings generally result in higher borrowing costs, as well as reduced access to unsecured capital markets. A significant downgrade of our short-term debt ratings would impair our ability to issue commercial paper and likely require us to rely on alternative funding sources. A significant downgrade would not affect our ability to borrow amounts under our revolving credit facility described below, assuming ongoing compliance with the terms and conditions of the credit facility.
Our debt ratings and rating outlooks at
December 31, 2017
were as follows:
|
Short-term
|
Long-term
|
|||||||
|
Rating
|
Outlook
|
Rating
|
Outlook
|
|||||
|
Moody’s Investors Service
|
P2
|
|
Stable
|
|
Baa1
|
|
Stable (affirmed May 2017)
|
|
|
Standard & Poor’s Ratings Services
|
A2
|
|
Stable
|
|
BBB+
|
|
Stable (affirmed October 2017)
|
|
|
Fitch Ratings
|
F2
|
|
Stable
|
|
A-
|
|
Stable (affirmed October 2017)
|
|
Cash and equivalents totaled
$78 million
as of
December 31, 2017
. Approximately
$23 million
was held outside the U.S. as of
December 31, 2017
, and is available to fund operations and other growth of our non-U.S. subsidiaries. We have historically reinvested such earnings overseas indefinitely and may continue to reinvest future foreign earnings overseas
indefinitely. Since the 2017 Tax Cut and Jobs Act implements a territorial tax system, whereby certain foreign subsidiary earnings can be repatriated to the U.S. with no federal tax, we are reassessing whether to indefinitely reinvest our overseas earnings. If we decide to repatriate cash and equivalents held outside the U.S., we may be subject to additional U.S. income taxes and foreign withholding taxes. Refer to
Note 13
, “
Income Taxes
,” in the Notes to Consolidated Financial Statements for an additional discussion.
We believe that our operating cash flows, together with our access to the public unsecured bond market, commercial paper market and other available debt financing, will be adequate to meet our operating, investing and financing needs in the foreseeable future. However, there can be no assurance that unanticipated volatility and disruption in the public unsecured debt market or the commercial paper market would not impair our ability to access these markets on terms commercially acceptable to us or at all. If we cease to have access to public bonds, commercial paper and other sources of unsecured borrowings, we would meet our liquidity needs by drawing upon contractually committed lending agreements as described below and/or by seeking other funding sources.
At
December 31, 2017
, we had the following amounts available to fund operations:
|
|
(In millions)
|
|
Global revolving credit facility
|
$577
|
|
Trade receivables program
|
$175
|
47
ITEM 7. MANAGEMENT'S DISCUSSION AND ANALYSIS OF
FINANCIAL CONDITION AND RESULTS OF OPERATIONS - (Continued)
Refer to
Note 15
, “
Debt
,” in the Notes to Consolidated Financial Statements for a discussion of these debt facilities.The following table shows the movements in our debt balance:
|
2017
|
2016
|
||||||
|
|
(In thousands)
|
||||||
|
Debt balance at January 1
|
$
|
5,391,274
|
|
5,502,627
|
|
||
|
Cash-related changes in debt:
|
|||||||
|
Net change in commercial paper borrowings and revolving credit facilities
|
89,519
|
|
(77,798
|
)
|
|||
|
Proceeds from issuance of medium-term notes
|
595,785
|
|
596,283
|
|
|||
|
Proceeds from issuance of other debt instruments
|
277,517
|
|
78,645
|
|
|||
|
Retirement of medium-term notes
|
(700,000
|
)
|
(600,000
|
)
|
|||
|
Other debt repaid
|
(262,577
|
)
|
(69,047
|
)
|
|||
|
Debt issuance costs paid
|
(1,738
|
)
|
(1,776
|
)
|
|||
|
(1,494
|
)
|
(73,693
|
)
|
||||
|
Non-cash changes in debt:
|
|||||||
|
Fair market value adjustment on notes subject to hedging
|
(8,302
|
)
|
(4,143
|
)
|
|||
|
Addition of capital lease obligations
|
7,057
|
|
1,231
|
|
|||
|
Changes in foreign currency exchange rates and other non-cash items
|
21,116
|
|
(34,748
|
)
|
|||
|
Total changes in debt
|
18,377
|
|
(111,353
|
)
|
|||
|
Debt balance at December 31
|
$
|
5,409,651
|
|
5,391,274
|
|
||
In accordance with our funding philosophy, we attempt to align the aggregate average remaining re-pricing life of our vehicle-related debt with the aggregate average remaining re-pricing life of our vehicle assets. We utilize both fixed-rate and variable-rate debt to achieve this alignment and generally target a mix of
20% - 40%
variable-rate debt as a percentage of total debt outstanding. The variable-rate portion of our total debt (including notional value of swap agreements) was
31%
and
30%
at
December 31, 2017
and
2016
, respectively.
Ryder's debt to equity ratios were
191%
and
263%
at
December 31, 2017
and
2016
, respectively. The debt to equity ratio represents total debt divided by total equity. Our debt to equity ratio decreased as of
December 31, 2017
, primarily due to a one-time net tax benefit of
$586 million
related to the 2017 Tax Cut and Jobs Act for the estimated impact of the change in the future tax rates on our deferred tax liabilities as of
December 31, 2017
.
Off-Balance Sheet Arrangements
Guarantees.
Refer to
Note 17
, “
Guarantees
,” in the Notes to Consolidated Financial Statements for a discussion of our agreements involving guarantees.
48
ITEM 7. MANAGEMENT'S DISCUSSION AND ANALYSIS OF
FINANCIAL CONDITION AND RESULTS OF OPERATIONS - (Continued)
Contractual Obligations and Commitments
As part of our ongoing operations, we enter into arrangements that obligate us to make future payments under contracts such as debt agreements, lease agreements and unconditional purchase obligations. The following table summarizes our expected future contractual cash obligations and commitments at
December 31, 2017
:
|
2018
|
2019-2020
|
2021-2022
|
Thereafter
|
Total
|
||||||||||||
|
|
(In thousands)
|
|||||||||||||||
|
Debt
|
$
|
818,510
|
|
2,970,078
|
|
1,416,874
|
|
190,510
|
|
5,395,972
|
|
|||||
|
Capital lease obligations
|
7,559
|
|
9,502
|
|
3,810
|
|
—
|
|
20,871
|
|
||||||
|
Total debt, including capital leases
(1)
|
826,069
|
|
2,979,580
|
|
1,420,684
|
|
190,510
|
|
5,416,843
|
|
||||||
|
Interest on debt
(2)
|
148,150
|
|
201,785
|
|
71,900
|
|
32,570
|
|
454,405
|
|
||||||
|
Operating leases
(3)
|
84,824
|
|
104,469
|
|
43,443
|
|
38,288
|
|
271,024
|
|
||||||
|
Purchase obligations
(4)
|
26,417
|
|
29,668
|
|
6,641
|
|
259
|
|
62,985
|
|
||||||
|
Total contractual cash obligations
|
259,391
|
|
335,922
|
|
121,984
|
|
71,117
|
|
788,414
|
|
||||||
|
Insurance obligations (primarily self-insurance)
|
110,632
|
|
114,543
|
|
49,590
|
|
78,341
|
|
353,106
|
|
||||||
|
Other long-term liabilities
(5), (6), (7)
|
6,771
|
|
6,957
|
|
4,547
|
|
71,308
|
|
89,583
|
|
||||||
|
Total
|
$
|
1,202,863
|
|
3,437,002
|
|
1,596,805
|
|
411,276
|
|
6,647,946
|
|
|||||
____________
|
(1)
|
Net of unamortized discount and excludes the fair market value adjustment on notes subject to hedging.
|
|
(2)
|
Total debt matures at various dates through fiscal year
2025
and bears interest principally at fixed rates. Interest on variable-rate debt is calculated based on the applicable rate at
December 31, 2017
. Amounts are based on existing debt obligations, including capital leases, and do not consider potential refinancing of expiring debt obligations.
|
|
(3)
|
Represents future lease payments associated with vehicles, equipment and properties under operating leases. Amounts are based upon the general assumption that the leased asset will remain on lease for the length of time specified by the respective lease agreements. No effect has been given to renewals, cancellations, contingent rentals or future rate changes.
|
|
(4)
|
The majority of our purchase obligations are pay-as-you-go transactions made in the ordinary course of business. Purchase obligations include agreements to purchase goods or services that are legally binding and that specify all significant terms, including: fixed or minimum quantities to be purchased; fixed minimum or variable price provisions; and the approximate timing of the transaction. The most significant item included in the above table are purchase obligations related to vehicles. Purchase orders made in the ordinary course of business that are cancelable are excluded from the above table. Any amounts for which we are liable under purchase orders for goods received are reflected in our Consolidated Balance Sheets as “Accounts payable” and “Accrued expenses and other current liabilities” and are excluded from the above table.
|
|
(5)
|
Represents other long-term liability amounts reflected in our Consolidated Balance Sheets that have known payment streams. The most significant items included were asset retirement obligations and deferred compensation obligations.
|
|
(6)
|
The amounts exclude our estimated pension contributions. For
2018
, our pension contributions, including our minimum funding requirements as set forth by U.S. and international regulations and legislation (including ERISA), are expected to be
$34 million
. Our minimum funding requirements after
2018
are dependent on several factors. However, we estimate that the undiscounted required global contributions over the next five years are approximately
$296 million
(pre-tax) (assuming expected long-term rate of return realized and other assumptions remain unchanged). We also have payments due under our other postretirement benefit (OPEB) plans. These plans are not required to be funded in advance, but are pay-as-you-go. See
Note 22
,“
Employee Benefit Plans
,” in the Notes to Consolidated Financial Statements for further discussion.
|
|
(7)
|
The amounts exclude
$68 million
of liabilities associated with uncertain tax positions as we are unable to reasonably estimate the ultimate amount or timing of settlement. See
Note 13
, “
Income Taxes
,” in the Notes to Consolidated Financial Statements for further discussion.
|
49
ITEM 7. MANAGEMENT'S DISCUSSION AND ANALYSIS OF
FINANCIAL CONDITION AND RESULTS OF OPERATIONS - (Continued)
Pension Information
We have defined benefit retirement plans which are frozen for non-grandfathered and certain non-union employees in the U.S., Canada and the United Kingdom. The funded status of our pension plans is dependent upon many factors, including returns on invested assets and the level of certain market interest rates. We review pension assumptions regularly and we may from time to time make voluntary contributions to our pension plans, which exceed the amounts required by statute. During
2017
, total global pension contributions were
$41 million
compared with
$128 million
in
2016
. We estimate
2018
required pension contributions will be
$34 million
. The present value of estimated global pension contributions that would be required over the next 5 years totals approximately
$266 million
(pre-tax). Changes in interest rates and the market value of the securities held by the plans could materially change, positively or negatively, the funded status of the plans and affect the level of pension expense and required contributions in future years. The ultimate amount of contributions is also dependent upon the requirements of applicable laws and regulations. See
Note 22
, “
Employee Benefit Plans
,” in the Notes to Consolidated Financial Statements for additional information.
Due to the underfunded status of our defined benefit plans, we had an accumulated net pension equity charge (after-tax) of
$567 million
and
$627 million
at
December 31, 2017
and
2016
, respectively. The improvement in funded status reflects the benefit of asset returns of
15%
in
2017
.
Pension expense totaled
$57 million
in
2017
compared to
$61 million
in
2016
. The increase in pension expense is primarily due to higher expense for union-administered multi-employer plans. We expect
2018
pension expense to decrease approximately
$22 million
primarily due to the benefit of favorable asset returns in 2017. Our
2018
pension expense estimates are subject to change based upon the completion of the actuarial analysis for all pension plans. See the “Critical Accounting Estimates — Pension Plans” section for further discussion on pension accounting estimates.
During 2017, we completed a transfer of future retiree benefits in our U.S. defined benefit plan to a third-party annuity company. We paid
$71 million
in connection with this transfer, which included a
$66 million
reduction in our projected benefit obligation and an annuity premium. We did not record a gain or loss on this transaction as the cost of all settlements during the year, including this transaction, were less than our combined service and interest costs for the year.
We participate in certain U.S. multi-employer pension (MEP) plans that provide defined benefits to employees covered by collective bargaining agreements. At
December 31, 2017
, approximately
1,100
employees (approximately
3%
of total employees) participated in these MEP plans. The annual net pension cost of the MEP plans is equal to the annual contribution determined in accordance with the provisions of negotiated labor contracts. Our current year MEP plan contributions total approximately
$10 million
. Pursuant to current U.S. pension laws, if any MEP plans fail to meet certain minimum funding thresholds, we could be required to make additional MEP plan contributions, until the respective labor agreement expires, of up to 10% of current contractual requirements. Several factors could cause MEP plans not to meet these minimum funding thresholds, including unfavorable investment performance, changes in participant demographics, and increased benefits to participants. The plan administrators and trustees of the MEP plans provide us with the annual funding notice as required by law. This notice sets forth the funded status of the plan as of the beginning of the prior year but does not provide any company-specific information.
Employers participating in MEP plans can elect to withdraw from the plans, contingent upon certain requirements, and be subject to a withdrawal obligation based on, among other factors, the MEP plan’s unfunded vested benefits. U.S. pension regulations provide that an employer can fund its withdrawal obligation in a lump sum or over a time period of up to 20 years based on previous contribution rates. During 2017, we recorded estimated pension settlement charges of $5 million related to our exit from a U.S. multi-employer pension plan. These charges were recorded within "Selling, general and administrative expenses" in our Consolidated Statement of Earnings and are included in the Union-administered plans expense. See
Note 22
, “
Employee Benefit Plans
,” in the Notes to Consolidated Financial Statements for additional information.
Share Repurchase Programs and Cash Dividends
Refer to
Note 18
, “
Share Repurchase Programs
,” in the Notes to Consolidated Financial Statements for a discussion on our share repurchase programs.
Cash dividend payments to shareholders of common stock were
$96 million
in
2017
,
$91 million
in
2016
, and
$83 million
in
2015
. During
2017
, we increased our annualized dividend rate
5%
to
$1.84
per share of common stock.
50
ITEM 7. MANAGEMENT'S DISCUSSION AND ANALYSIS OF
FINANCIAL CONDITION AND RESULTS OF OPERATIONS - (Continued)
Market Risk
In the normal course of business, we are exposed to fluctuations in interest rates, foreign currency exchange rates and fuel prices. We manage these exposures in several ways, including, in certain circumstances, the use of a variety of derivative financial instruments when deemed prudent. We do not enter into leveraged derivative financial transactions or use derivative financial instruments for trading purposes.
Exposure to market risk for changes in interest rates exists for our debt obligations. Our interest rate risk management program objectives are to limit the impact of interest rate changes on earnings and cash flows and to lower overall borrowing costs. A hypothetical
100 basis point
change in short-term market interest rates would change annual pre-tax earnings by
$13 million
. We manage our exposure to interest rate risk primarily through the proportion of fixed-rate and variable-rate debt we hold in the total debt portfolio. From time to time, we also use interest rate swap agreements to manage our fixed-rate and variable-rate exposure and to better match the repricing of debt instruments to that of our portfolio of assets. See
Note 16
,
“
Derivatives
,” in the Notes to Consolidated Financial Statements for further discussion on interest rate swap agreements.
At
December 31, 2017
, we had
$3.22 billion
of fixed-rate debt outstanding (excluding capital leases and U.S. asset- backed securities) with a weighted-average interest rate of
3%
and a fair value of
$3.26 billion
. A hypothetical 10% decrease or increase in the
December 31, 2017
market interest rates would impact the fair value of our fixed-rate debt by approximately
$28 million
at
December 31, 2017
. Changes in the relative sensitivity of the fair value of our financial instrument portfolio for these theoretical changes in the level of interest rates are primarily driven by changes in our debt maturities, interest rate profile and amount.
At
December 31, 2017
, we had
$1.69 billion
of variable-rate debt, including
$825 million
of fixed-rate debt instruments swapped to LIBOR-based floating-rate debt. Changes in the fair value of the interest rate swaps were offset by changes in the fair value of the debt instruments and no net gain or loss was recognized in earnings. The fair value of our interest rate swap agreements at
December 31, 2017
was a net liability of
$7 million
. The fair value of our variable-rate debt at
December 31, 2017
was
$1.69 billion
. A hypothetical 10% increase in market interest rates would have impacted
2017
pre-tax earnings from continuing operations by approximately
$3 million
.
We are also subject to interest rate risk with respect to our pension and postretirement benefit obligations, as changes in interest rates will effectively increase or decrease our liabilities associated with these benefit plans, which also results in changes to the amount of pension and postretirement benefit expense recognized each period.
Exposure to market risk for changes in foreign currency exchange rates relates primarily to our foreign operations’ buying, selling and financing in currencies other than local currencies and to the carrying value of net investments in foreign subsidiaries. The majority of our transactions are denominated in U.S. dollars. The principal foreign currency exchange rate risks to which we are exposed include the Canadian dollar, British pound sterling and Mexican peso. We manage our exposure to foreign currency exchange rate risk related to our foreign operations’ buying, selling and financing in currencies other than local currencies by naturally offsetting assets and liabilities not denominated in local currencies to the extent possible. A hypothetical uniform 10% strengthening in the value of the dollar relative to all the currencies in which our transactions are denominated would result in a decrease to pre-tax earnings from continuing operations of approximately
$0.1 million
. We also use foreign currency option contracts and forward agreements from time to time to hedge foreign currency transactional exposure. We generally do not hedge the foreign currency exposure related to our net investment in foreign subsidiaries, since we have no near-term intent to repatriate funds from such subsidiaries.
Exposure to market risk for fluctuations in fuel prices relates to a small portion of our service contracts for which the cost of fuel is integral to service delivery and the service contract does not have a mechanism to adjust for increases in fuel prices. At
December 31, 2017
, we also had various fuel purchase arrangements in place to ensure delivery of fuel at market rates in the event of fuel shortages. We are exposed to fluctuations in fuel prices in these arrangements since none of the arrangements fix the price of fuel to be purchased. Increases and decreases in the price of fuel are generally passed on to our customers for which we realize minimal changes in profitability during periods of steady market fuel prices. However, profitability may be positively or negatively impacted by sudden increases or decreases in market fuel prices during a short period of time as customer pricing for fuel services is established based on trailing market fuel costs. We believe the exposure to fuel price fluctuations would not materially impact our results of operations, cash flows or financial position.
ENVIRONMENTAL MATTERS
Refer to
Note 23
, “
Environmental Matters
,” in the Notes to Consolidated Financial Statements for a discussion surrounding environmental matters.
51
ITEM 7. MANAGEMENT'S DISCUSSION AND ANALYSIS OF
FINANCIAL CONDITION AND RESULTS OF OPERATIONS - (Continued)
CRITICAL ACCOUNTING ESTIMATES
The preparation of financial statements in conformity with U.S. GAAP requires us to make estimates and assumptions. Our significant accounting policies are described in the Notes to Consolidated Financial Statements. Certain of these policies require the application of subjective or complex judgments, often as a result of the need to make estimates about the effect of matters that are inherently uncertain. These estimates and assumptions are based on historical experience, changes in the business environment and other factors that we believe to be reasonable under the circumstances. Different estimates that could have been applied in the current period or changes in the accounting estimates that are reasonably likely can result in a material impact on our financial condition and operating results in the current and future periods. We review the development, selection and disclosure of these critical accounting estimates with Ryder’s Audit Committee on an annual basis.
The following discussion, which should be read in conjunction with the descriptions in the Notes to Consolidated Financial Statements, is furnished for additional insight into certain accounting estimates that we consider to be critical.
Depreciation and Residual Value Guarantees.
We periodically review and adjust the residual values and useful lives of revenue earning equipment of our FMS business segment as described in
Note 1
, “
Summary of Significant Accounting Policies
— Revenue Earning Equipment, Operating Property and Equipment, and Depreciation” in the Notes to Consolidated Financial Statements. Reductions in residual values (i.e., the price at which we ultimately expect to dispose of revenue earning equipment) or useful lives will result in an increase in depreciation expense over the life of the equipment. Based on the mix of revenue earning equipment at
December 31, 2017
, a
10%
decline in expected vehicle residual values would increase depreciation expense in
2018
by approximately
$126 million
.
We review residual values and useful lives of revenue earning equipment on an annual basis or more often if deemed necessary for specific groups of our revenue earning equipment. Reviews are performed based on vehicle class, generally subcategories of trucks, tractors and trailers by weight and usage. Our annual review is established with a long-term view considering historical market price changes, current and expected future market price trends, expected life of vehicles included in the fleet and extent of alternative uses for leased vehicles (e.g., rental fleet, and DTS and SCS applications). As a result, future depreciation expense rates are subject to change based upon changes in these factors. While we believe that the carrying values and estimated sales proceeds for revenue earning equipment are appropriate, there can be no assurance that deterioration in economic conditions or adverse changes to expectations of future sales proceeds will not occur, resulting in lower gains or losses on sales.
At the end of each year, we complete our annual review of the residual values and useful lives of revenue earning equipment. Based on the results of our analysis, we adjust the residual values and useful lives of certain classes of our revenue earning equipment effective January 1 of each year. The approximate (unfavorable) / favorable impact on the annual depreciation expense resulting from the residual value and useful life reviews is as follows:
|
2018
|
2017
|
2016
|
||
|
($40 million)
|
($4 million)
|
$35 million
|
||
In addition, we also monitor market trends throughout the year and assess residual values of vehicles expected to be sold in the near term and may adjust residual values for the vehicles.
Factors that could cause actual results to materially differ from the estimated results include significant changes in the used equipment market brought on by unforeseen changes in technology innovations and any resulting changes in the useful lives of used equipment.
Depreciation expense was
$1.26 billion
,
$1.19 billion
and
$1.12 billion
in
2017
,
2016
and
2015
, respectively. Depreciation expense relates primarily to FMS revenue earning equipment. Depreciation expense increased
6%
in
2017
, driven by a larger average full service lease fleet and accelerated depreciation on vehicles expected to be made available for sale through June 2019 of
$21 million
, partially offset by a smaller average commercial rental fleet. Depreciation expense increased
6%
in
2016
, driven by a larger average full service lease fleet and accelerated depreciation of
$10 million
. The increase in
2016
was partially offset by
$35 million
from increases in residual values.
52
ITEM 7. MANAGEMENT'S DISCUSSION AND ANALYSIS OF
FINANCIAL CONDITION AND RESULTS OF OPERATIONS - (Continued)
Pension Plans.
We apply actuarial methods to determine the annual net periodic pension expense and pension plan liabilities on an annual basis, or on an interim basis if there is an event requiring remeasurement. Each December, we review actual experience compared with the assumptions used and make adjustments to our assumptions, if warranted. In determining our annual estimate of periodic pension cost, we are required to make an evaluation of critical factors such as discount rate, expected long-term rate of return on assets, expected increase in compensation levels, retirement rate and mortality. Discount rates are based upon a duration analysis of expected benefit payments and the equivalent average yield for high quality corporate fixed income investments as of our December 31 annual measurement date. In order to estimate the discount rate relevant to our plan, we use models that match projected benefits payments of our primary U.S. plan to coupons and maturities from a hypothetical portfolio of high quality corporate bonds. Long-term rate of return assumptions are based on actuarial review of our asset allocation strategy and long-term expected asset returns. Investment management and other fees paid using plan assets are factored into the determination of asset return assumptions.
Assumptions as to mortality of the participants in our pension plan is a key estimate in measuring the expected payments participants may receive over their lifetime, and therefore the amount of expense we will recognize. We update our mortality assumptions as deemed necessary by taking into consideration relevant actuarial studies as they become available as well as reassessing our own historical experience.
As part of our strategy to manage future pension costs and net funded status volatility, we regularly assess our pension investment strategy. Our U.S. pension investment policy and strategy seek to reduce the effects of future volatility on the fair value of our pension assets relative to our pension liabilities by increasing our allocation of high quality, longer-term fixed income securities and reducing our allocation of equity investments as the funded status of the plan improves. The composition of our pension assets was
52%
equity securities and alternative assets and
48%
debt securities and other investments at
December 31, 2017
. We continually evaluate our mix of investments between equity and fixed income securities and adjust the composition of our pension assets when appropriate. In
2017
, we adjusted our long-term expected rate of return assumption for our primary U.S. plan to
5.40%
from
5.85%
based on our expected asset mix. The expected rate of return assumption for the fixed income portion of our portfolio mirrors the discount rate in order to align the expected return on fixed income securities with the movement in the pension liability under our strategy.
Accounting guidance applicable to pension plans does not require immediate recognition of the effects of a deviation between these assumptions and actual experience or the revision of an estimate. This approach allows the favorable and unfavorable effects that fall within an acceptable range to be netted and included in “Accumulated other comprehensive loss.” We had a pre-tax accumulated actuarial loss of
$878 million
and
$961 million
at the end of
2017
and
2016
, respectively. To the extent the amount of cumulative actuarial gains and losses exceed 10% of the greater of the benefit obligation or plan assets, the excess amount is amortized over the average remaining life expectancy of active participants or the remaining life expectancy of inactive participants if all or almost all of a plan’s participants are inactive. The amount of the actuarial loss subject to amortization in
2018
and future years will be
$649 million
. We expect to recognize approximately
$29 million
of the net actuarial loss as a component of pension expense in
2018
. The effect on years beyond
2018
will depend substantially upon the actual experience of our plans.
Disclosure of the significant assumptions used in arriving at the
2017
net pension expense is presented in
Note 22
, “
Employee Benefit Plans
,” in the Notes to Consolidated Financial Statements. A sensitivity analysis of
2017
net pension expense to changes in key underlying assumptions for our primary plan, the U.S. pension plan, is presented below.
|
Assumed Rate
|
Change
|
Impact on 2018 Net
Pension Expense |
Effect on
December 31, 2017 Projected Benefit Obligation |
||||||
|
Expected long-term rate of return on assets
|
5.40
|
%
|
+/- 0.25
|
+/- $3.0 million
|
N/A
|
||||
|
Discount rate increase
|
3.70
|
%
|
+ 0.25
|
+ $4.0 million
|
- $52 million
|
||||
|
Discount rate decrease
|
3.70
|
%
|
- 0.25
|
- $4.0 million
|
+ $52 million
|
||||
53
ITEM 7. MANAGEMENT'S DISCUSSION AND ANALYSIS OF
FINANCIAL CONDITION AND RESULTS OF OPERATIONS - (Continued)
Self-Insurance Accruals.
Self-insurance accruals were
$349 million
and
$337 million
as of
December 31, 2017
and
2016
, respectively. The majority of our self-insurance relates to vehicle liability and workers’ compensation. We use a variety of statistical and actuarial methods that are widely used and accepted in the insurance industry to estimate amounts for claims that have been reported but not paid and claims incurred but not reported. In applying these methods and assessing their results, we consider such factors as frequency and severity of claims, claim development and payment patterns and changes in the nature of our business, among other factors. Such factors are analyzed for each of our business segments. Our estimates may be impacted by such factors as increases in the market price for medical services, unpredictability of the size of jury awards and limitations inherent in the estimation process. During
2017
, we recognized a
$9 million
benefit from the development of estimated prior years’ self-insured loss reserves. For
2016
and
2015
, we recognized a charge of
$9 million
and
$4 million
, respectively, from the development of estimated prior years’ self-insured loss reserves. Based on self-insurance accruals at
December 31, 2017
, a
5%
adverse change in actuarial claim loss estimates would increase operating expense in
2018
by approximately
$16 million
.
Goodwill Impairment.
We assess goodwill for impairment, as described in
Note 1
, “
Summary of Significant Accounting Policies
— Goodwill and Other Intangible Assets,” in the Notes to Consolidated Financial Statements, on an annual basis or more often if deemed necessary. At
December 31, 2017
, goodwill totaled
$396 million
. To determine whether goodwill impairment indicators exist, we are required to assess the fair value of the reporting unit and compare it to the carrying value. A reporting unit is a component of an operating segment for which discrete financial information is available and management regularly reviews its operating performance. In evaluating goodwill for impairment, we have the option to first assess qualitative factors to determine whether further impairment testing is necessary.
We have historically performed the annual impairment test as of April 1 for all of our reporting units. However, during the three months ended December 31, 2017, we elected to change our annual impairment assessment date from April 1 to October 1 for all of our reporting units. We believe this change, which represents a change in method of applying an accounting principle, is preferable under our circumstances. The change was made to align the annual goodwill impairment test date with our strategic and business plan time lines and to reduce the risk that an interim impairment triggering event might occur between the annual goodwill impairment test date and the year-end balance sheet date. This change in assessment date required us to perform another impairment review. The following summarized the nature of our reviews:
|
|
December 31, 2017
|
|
April 1, 2017
|
October 1, 2017
|
||||||||
|
Reporting unit:
|
Goodwill
|
Quantitative
|
Qualitative
|
Quantitative
|
Qualitative
|
|||||||
|
(In millions)
|
||||||||||||
|
FMS North America
|
$
|
211.7
|
|
X
|
X
|
|||||||
|
FMS Europe
|
15.1
|
|
X
|
X
|
||||||||
|
DTS
|
40.8
|
|
X
|
X
|
||||||||
|
SCS U.S.
|
121.8
|
|
X
|
X
|
||||||||
|
SCS Canada
|
6.1
|
|
X
|
X
|
||||||||
|
Total
|
$
|
395.5
|
|
|||||||||
For quantitative tests, we estimated the fair value of the reporting units using a discounted cash flow model. The principal assumptions used in the discounted cash flow model were projected operating results, weighted-average cost of capital, and terminal value. Based on our quantitative analysis, we determined the fair value of the reporting units exceeded their carrying values resulting in no impairment to goodwill at both test dates. We estimated the fair value of the FMS Europe reporting unit exceeded its carrying value by approximately
25%
. Given this level of excess fair value, in the event the financial performance of FMS Europe does not meet our expectations during 2018, we may be required to perform an interim impairment analysis prior to our next annual test, and based on the outcome of that analysis, could be required to take a non-cash impairment charge. As of October 1, 2017, there was $15 million of goodwill recorded related to FMS Europe.
For qualitative tests, we considered individual factors such as macroeconomic conditions, changes in our industry, and the markets in which we operate, as well as our historical and expected future financial performance. Examples of factors we considered included the results of our most recent impairment tests, declines in our financial performance, a lack of significant changes in our competitive landscape, changes in our stock price as compared to a relatively stable carrying value since our most recent impairment tests and improvements in macroeconomic conditions since our most recent impairment test. After performing the qualitative assessments, we concluded it is more likely than not that fair values are greater than carrying values and no additional testing was performed.
As of
December 31, 2017
, there have been no events or changes in circumstances that indicate that it is more likely than not that a goodwill impairment has occurred since the October 1, 2017 assessment date.
54
ITEM 7. MANAGEMENT'S DISCUSSION AND ANALYSIS OF
FINANCIAL CONDITION AND RESULTS OF OPERATIONS - (Continued)
Income Taxes.
Our overall tax position is complex and requires careful analysis by management to estimate the expected realization of income tax assets and liabilities.
Tax regulations require items to be included in the tax return at different times than the items are reflected in the financial statements. As a result, the effective tax rate reflected in the financial statements is different than that reported in the tax return. Some of these differences are permanent, such as expenses that are not deductible on the tax return, and some are timing differences, such as depreciation expense. Timing differences create deferred tax assets and liabilities. Deferred tax assets generally represent items that can be used as a tax deduction or credit in the tax return in future years, for which we have already recognized the tax benefit in the financial statements. Deferred tax assets were
$448 million
and
$809 million
at
December 31, 2017
and
2016
, respectively. The reduction in deferred tax assets is primarily due to the revaluation required as part of the adoption of tax reform in the fourth quarter of 2017. We recognize a valuation allowance for deferred tax assets to reduce such assets to amounts expected to be realized. At
December 31, 2017
and
2016
, the deferred tax valuation allowance, principally attributed to foreign tax loss carryforwards in the SCS business segment, was
$19 million
and
$16 million
, respectively. In determining the required level of valuation allowance, we consider whether it is more likely than not that all or some portion of deferred tax assets will not be realized. This assessment is based on management’s expectations as to whether sufficient taxable income of an appropriate character will be realized within tax carryback and carryforward periods. Our assessment involves estimates and assumptions about matters that are inherently uncertain, and unanticipated events or circumstances could cause actual results to differ from these estimates. Should we change our estimate of the amount of deferred tax assets that we would be able to realize, an adjustment to the valuation allowance would result in an increase or decrease to the provision for income taxes in the period such a change in estimate was made.
As part of our calculation of the provision for income taxes, we determine whether the benefits of our tax positions are at least more likely than not of being sustained upon audit based on the technical merits of the tax position. We accrue the largest amount of the benefit that has a cumulative probability of greater than 50% of being sustained. These accruals require management to make estimates and judgments with respect to the ultimate outcome of a tax audit. Actual results could vary materially from these estimates. We adjust these reserves, including any impact on the related interest and penalties, in light of changing facts and circumstances, such as the progress of a tax audit.
A number of years may elapse before a particular matter for which we have established a reserve is audited and finally resolved. The number of years with open tax audits varies depending on the tax jurisdiction. The tax benefit that has been previously reserved because of a failure to meet the “more likely than not” recognition threshold would be recognized in our income tax expense in the first interim period when the uncertainty is resolved under any one of the following conditions: (1) the tax position has been determined to be “more likely than not” sustained, (2) the tax position, amount and/or timing is ultimately settled through negotiation or litigation, or (3) the statute of limitations for the tax position has expired. Settlement of any particular issue would usually require the use of cash. See
Note 13
, “
Income Taxes
,” in the Notes to Consolidated Financial Statements for further discussion of the status of tax audits and uncertain tax positions.
RECENT ACCOUNTING PRONOUNCEMENTS
See
Note 2
, “
Recent Accounting Pronouncements
,” in the Notes to Consolidated Financial Statements for a discussion of recent accounting pronouncements.
55
ITEM 7. MANAGEMENT'S DISCUSSION AND ANALYSIS OF
FINANCIAL CONDITION AND RESULTS OF OPERATIONS - (Continued)
NON-GAAP AND SEGMENT FINANCIAL MEASURES
Non-GAAP Financial Measures.
This Annual Report on Form 10-K includes information extracted from consolidated financial information that is not required by generally accepted accounting principles in the United States of America (GAAP) to be presented in the financial statements. Certain elements of this information are considered “non-GAAP financial measures” as defined by SEC rules. Non-GAAP financial measures should be considered in addition to, but not as a substitute for or superior to, other measures of financial performance or liquidity prepared in accordance with GAAP. Also, our non-GAAP financial measures may not be comparable to financial measures used by other companies. We provide a reconciliation of each of these non-GAAP financial measures to the most comparable GAAP measure in this non-GAAP financial measures section. We also provide the reasons why management believes each non-GAAP financial measure is useful to investors in this section.
Specifically, we refer to the following non-GAAP financial measures in this Form 10-K:
|
Non-GAAP Financial Measure
|
Comparable GAAP Measure
|
|
Operating Revenue Measures:
|
|
|
Operating Revenue
|
Total Revenue
|
|
FMS Operating Revenue
|
FMS Total Revenue
|
|
DTS Operating Revenue
|
DTS Total Revenue
|
|
SCS Operating Revenue
|
SCS Total Revenue
|
|
FMS EBT as a % of FMS Operating Revenue
|
FMS EBT as a % of FMS Total Revenue
|
|
DTS EBT as a % of DTS Operating Revenue
|
DTS EBT as a % of DTS Total Revenue
|
|
SCS EBT as a % of SCS Operating Revenue
|
SCS EBT as a % of SCS Total Revenue
|
|
Comparable Earnings Measures:
|
|
|
Comparable Earnings Before Income Tax
|
Earnings Before Income Tax
|
|
Comparable Earnings
|
Earnings from Continuing Operations
|
|
Comparable EPS
|
EPS from Continuing Operations
|
|
Adjusted Return on Average Capital (ROC)
|
Not Applicable. However, the non-GAAP elements of the calculation have been reconciled to the corresponding GAAP measures. A numerical reconciliation of net earnings to adjusted net earnings and average total debt and average shareholder's equity to adjusted average total capital is provided on page 63.
|
|
Cash Flow Measures:
|
|
|
Total Cash Generated and Free Cash Flow
|
Cash Provided by Operating Activities
|
56
ITEM 7. MANAGEMENT'S DISCUSSION AND ANALYSIS OF
FINANCIAL CONDITION AND RESULTS OF OPERATIONS - (Continued)
Set forth in the table below is an overview of each non-GAAP financial measure and why management believes that presentation of each non-GAAP financial measure provides useful information to investors. See reconciliations for each of these measures following this table.
|
Operating Revenue Measures:
|
||||
|
Operating Revenue
FMS Operating Revenue
DTS Operating Revenue SCS Operating Revenue FMS EBT as a % of FMS Operating Revenue DTS EBT as a % of DTS Operating Revenue SCS EBT as a % of SCS Operating Revenue |
Operating revenue is defined as total revenue for Ryder System, Inc. or each business segment (FMS, DTS and SCS), respectively, excluding any (1) fuel and (2) subcontracted transportation. We believe operating revenue provides useful information to investors as we use it to evaluate the operating performance of our core businesses and as a measure of sales activity at the consolidated level for Ryder System, Inc., as well as for each of our business segments. We also use segment EBT as a percentage of segment operating revenue for each business segment for the same reason. Note: FMS EBT, DTS EBT and SCS EBT, our primary measures of segment performance, are not non-GAAP measures.
Fuel : We exclude FMS, DTS and SCS fuel from the calculation of our operating revenue measures, as fuel is an ancillary service that we provide our customers, which is impacted by fluctuations in market fuel prices, and the costs are largely a pass-through to our customers, resulting in minimal changes in our profitability during periods of steady market fuel prices. However, profitability may be positively or negatively impacted by rapid changes in market fuel prices during a short period of time, as customer pricing for fuel services is established based on trailing market fuel costs. Subcontracted transportation : We also exclude subcontracted transportation from the calculation of our operating revenue measures, as these services are also typically a pass-through to our customers and, therefore, fluctuations result in minimal changes to our profitability. While our DTS and SCS business segments subcontract certain transportation services to third party providers, our FMS business segment does not engage in subcontracted transportation and, therefore, this item is not applicable to FMS. |
|||
|
Comparable Earnings Measures:
|
||||
|
Comparable earnings before income tax (EBT)
Comparable Earnings Comparable earnings per diluted common share (EPS)Comparable Earnings Adjusted Return on Average Capital (ROC) |
Comparable EBT, comparable earnings and comparable EPS are defined, respectively, as GAAP EBT, earnings and EPS, all from continuing operations, excluding (1) non-operating pension costs and (2) any other significant items that are not representative of our business operations. We believe these comparable earnings measures provide useful information to investors and allow for better year-over-year comparison of operating performance.
Non-Operating Pension Costs : Our comparable earnings measures exclude non-operating pension costs, which include the amortization of net actuarial loss and prior service cost, interest cost and expected return on plan assets components of pension and postretirement benefit costs. We exclude non-operating pension costs because we consider these to be impacted by financial market performance and outside the operational performance of our business. Other Significant Items : Our comparable earnings measures also exclude other significant items that are not representative of our business operations as detailed in the reconciliation table below page 59. These other significant items vary from period to period and, in some periods, there may be no such significant items. Calculation of comparable tax rate : The comparable provision for income taxes is computed using the same methodology as the GAAP provision for income taxes. Income tax effects of non-GAAP adjustments are calculated based on the statutory tax rates of the jurisdictions to which the non-GAAP adjustments relate. Adjusted ROC: Adjusted ROC is defined as adjusted net earnings divided by average total capital and represents the rate of return generated by the capital deployed in our business. The adjustments represent the comparable items described above, which are excluded, as applicable, from the calculation of net earnings and average shareholders' equity (a component of average total capital).
We use adjusted ROC as an internal measure of how effectively we use the capital invested (borrowed or owned) in our operations.
|
|||
57
ITEM 7. MANAGEMENT'S DISCUSSION AND ANALYSIS OF
FINANCIAL CONDITION AND RESULTS OF OPERATIONS - (Continued)
|
Cash Flow Measures:
|
|||
|
Total Cash Generated
Free Cash Flow
|
We consider total cash generated and free cash flow to be important measures of comparative operating performance, as our principal sources of operating liquidity are cash from operations and proceeds from the sale of revenue earning equipment.
Total Cash Generated : Total cash generated is defined as the sum of (1) net cash provided by operating activities, (2) net cash provided by the sale of revenue earning equipment and (3) net cash provided by the sale of operating property and equipment, (4) collections on direct finance leases and (5) other cash inflows from investing activities. We believe total cash generated is an important measure of total cash flows generated from our ongoing business activities. Free Cash Flow : We refer to the net amount of cash generated from operating activities and investing activities (excluding changes in restricted cash and acquisitions) from continuing operations as “free cash flow”. We calculate free cash flow as the sum of (1) net cash provided by operating activities, (2) net cash provided by the sale of revenue earning equipment and (3) net cash provided by the sale of operating property and equipment, (4) collections on direct finance leases and (5) other cash inflows from investing activities, less (6) purchases of property and revenue earning equipment. We believe free cash flow provides investors with an important perspective on the cash available for debt service and for shareholders, after making capital investments required to support ongoing business operations. Our calculation of free cash flow may be different from the calculation used by other companies and, therefore, comparability may be limited. |
||
58
ITEM 7. MANAGEMENT'S DISCUSSION AND ANALYSIS OF
FINANCIAL CONDITION AND RESULTS OF OPERATIONS - (Continued)
The following table provides a reconciliation of GAAP earnings before taxes (EBT), earnings, and earnings per diluted share (EPS) from continuing operations to comparable EBT, comparable earnings and comparable EPS from continuing
operations for the years ended
December 31, 2017
,
2016
,
2015
,
2014
and
2013
. Certain items included in EBT, earnings and diluted EPS from continuing operations have been excluded from our comparable EBT, comparable earnings and comparable diluted EPS measures. The following table lists a summary of these items, which are discussed in more detail throughout our MD&A and within the Notes to Consolidated Condensed Financial Statements:
|
Continuing Operations
|
||||||||||||||||
|
2017
|
2016
|
2015
|
2014
|
2013
|
||||||||||||
|
|
(Dollars in thousands, except per share amounts)
|
|||||||||||||||
|
EBT
|
$
|
313,786
|
|
406,381
|
|
469,215
|
|
338,267
|
|
369,015
|
|
|||||
|
Non-operating pension costs
|
27,741
|
|
29,943
|
|
17,797
|
|
5,521
|
|
22,236
|
|
||||||
|
Tax reform related adjustments, net
(1)
|
23,278
|
|
—
|
|
—
|
|
—
|
|
—
|
|
||||||
|
Restructuring charges and fees, net
(2)
|
21,405
|
|
5,074
|
|
18,068
|
|
2,787
|
|
(469
|
)
|
||||||
|
Pension lump sum settlement expense
|
—
|
|
—
|
|
—
|
|
97,231
|
|
—
|
|
||||||
|
Pension-related adjustments
(3)
|
5,454
|
|
7,650
|
|
(509
|
)
|
12,564
|
|
2,820
|
|
||||||
|
Operating tax adjustment
(1)
|
2,205
|
|
—
|
|
—
|
|
—
|
|
—
|
|
||||||
|
Gain on sale of property
(1)
|
(24,122
|
)
|
—
|
|
—
|
|
—
|
|
—
|
|
||||||
|
Acquisition-related tax adjustment
|
—
|
|
—
|
|
—
|
|
1,808
|
|
—
|
|
||||||
|
Acquisition transaction costs
|
—
|
|
—
|
|
—
|
|
566
|
|
—
|
|
||||||
|
Superstorm Sandy vehicle-related recoveries
|
—
|
|
—
|
|
—
|
|
—
|
|
(600
|
)
|
||||||
|
Foreign currency translation benefit
|
—
|
|
—
|
|
—
|
|
—
|
|
(1,904
|
)
|
||||||
|
Comparable EBT
|
$
|
369,747
|
|
449,048
|
|
504,571
|
|
458,744
|
|
391,098
|
|
|||||
|
Earnings
|
$
|
791,015
|
|
264,640
|
|
305,989
|
|
220,225
|
|
243,275
|
|
|||||
|
Non-operating pension costs
|
16,034
|
|
17,518
|
|
10,136
|
|
2,822
|
|
13,046
|
|
||||||
|
Tax reform related adjustments, net
(1), (4)
|
(571,666
|
)
|
—
|
|
—
|
|
—
|
|
—
|
|
||||||
|
Restructuring charges and fees, net
(2)
|
13,371
|
|
3,513
|
|
12,782
|
|
1,800
|
|
(360
|
)
|
||||||
|
Pension lump sum settlement expense
|
—
|
|
—
|
|
—
|
|
61,333
|
|
—
|
|
||||||
|
Pension-related adjustments
(3)
|
3,303
|
|
4,817
|
|
(309
|
)
|
7,623
|
|
1,711
|
|
||||||
|
Operating tax adjustment
(1)
|
1,677
|
|
—
|
|
—
|
|
—
|
|
—
|
|
||||||
|
Gain on sale of property
(1)
|
(14,769
|
)
|
—
|
|
—
|
|
—
|
|
—
|
|
||||||
|
Acquisition-related tax adjustment
|
—
|
|
—
|
|
—
|
|
1,808
|
|
—
|
|
||||||
|
Acquisition transaction costs
|
—
|
|
—
|
|
—
|
|
444
|
|
—
|
|
||||||
|
Tax law changes
(4)
|
1,844
|
|
—
|
|
(2,113
|
)
|
(1,776
|
)
|
—
|
|
||||||
|
Superstorm Sandy vehicle-related recoveries
|
—
|
|
—
|
|
—
|
|
—
|
|
(374
|
)
|
||||||
|
Foreign currency translation benefit
|
—
|
|
—
|
|
—
|
|
—
|
|
(1,904
|
)
|
||||||
|
Comparable Earnings
(5)
|
$
|
240,809
|
|
290,488
|
|
326,485
|
|
294,279
|
|
255,394
|
|
|||||
|
Diluted EPS
|
$
|
14.87
|
|
4.94
|
|
5.73
|
|
4.14
|
|
4.63
|
|
|||||
|
Non-operating pension costs
|
0.31
|
|
0.33
|
|
0.19
|
|
0.05
|
|
0.25
|
|
||||||
|
Tax reform related adjustments, net
(1), (4)
|
(10.75
|
)
|
—
|
|
—
|
|
—
|
|
—
|
|
||||||
|
Restructuring charges and fees, net
(2)
|
0.25
|
|
0.06
|
|
0.23
|
|
0.03
|
|
(0.01
|
)
|
||||||
|
Pension lump sum settlement expense
|
—
|
|
—
|
|
—
|
|
1.16
|
|
—
|
|
||||||
|
Pension-related adjustments
(3)
|
0.06
|
|
0.09
|
|
(0.01
|
)
|
0.14
|
|
0.03
|
|
||||||
|
Operating tax adjustment
(1)
|
0.03
|
|
—
|
|
—
|
|
—
|
|
—
|
|
||||||
|
Gain on sale of property
(1)
|
(0.27
|
)
|
—
|
|
—
|
|
—
|
|
—
|
|
||||||
|
Acquisition-related tax adjustment
|
—
|
|
—
|
|
—
|
|
0.03
|
|
—
|
|
||||||
|
Acquisition transaction costs
|
—
|
|
—
|
|
—
|
|
0.01
|
|
—
|
|
||||||
|
Tax law changes
(4)
|
0.03
|
|
—
|
|
(0.04
|
)
|
(0.03
|
)
|
—
|
|
||||||
|
Superstorm Sandy vehicle-related recoveries
|
—
|
|
—
|
|
—
|
|
—
|
|
(0.01
|
)
|
||||||
|
Foreign currency translation benefit
|
—
|
|
—
|
|
—
|
|
—
|
|
(0.04
|
)
|
||||||
|
Comparable EPS
(5)
|
$
|
4.53
|
|
5.42
|
|
6.10
|
|
5.53
|
|
4.85
|
|
|||||
____________________
|
(1)
|
Refer to
Note 24
, “
Other Items Impacting Comparability
,” in the Notes to Consolidated Financial Statements for further discussion.
|
|
(2)
|
Refer to
Note 4
, “
Restructuring Charges and Fees, Net
,” in the Notes to Consolidated Financial Statements for additional information.
|
|
(3)
|
Refer to
Note 22
, “
Employee Benefit Plans
,” in the Notes to Consolidated Financial Statements for further discussion
|
|
(4)
|
Refer to
Note 13
, “
Income Taxes
,” in the Notes to Consolidated Financial Statements for further discussion.
|
|
(5)
|
Refer to page 60 for information on the tax impact on our comparable earnings measures.
|
59
ITEM 7. MANAGEMENT'S DISCUSSION AND ANALYSIS OF
FINANCIAL CONDITION AND RESULTS OF OPERATIONS - (Continued)
The following table provides a reconciliation of GAAP earnings before taxes (EBT), earnings, and earnings per diluted share (EPS) from continuing operations to comparable EBT, comparable earnings and comparable EPS from continuing operations.
Certain items included in EBT, earnings and diluted EPS from continuing operations in the three and twelve months ended
December 31, 2017
and
2016
, respectively, included certain items we do not consider indicative of our business operations and have been excluded from our comparable EBT, comparable earnings and comparable diluted EPS measures. The following table lists a summary of these items, which are discussed in more detail throughout our MD&A and within the Notes to Consolidated Financial Statements. EPS amounts may not be additive due to rounding.
|
Continuing Operations
|
|||||||||||||||||||||
|
EBT
|
Earnings
|
Diluted EPS
|
|||||||||||||||||||
|
2017
|
2016
|
2017
|
2016
|
2017
|
2016
|
||||||||||||||||
|
(Dollars in thousands except per share amounts)
|
|||||||||||||||||||||
|
Three months ended December 31
|
|||||||||||||||||||||
|
EBT/Earnings/EPS
(1)
|
$
|
78,795
|
|
69,196
|
|
$
|
642,480
|
|
49,275
|
|
$
|
12.10
|
|
0.92
|
|
||||||
|
Non-operating pension costs
(2)
|
6,865
|
|
7,895
|
|
3,969
|
|
4,647
|
|
0.07
|
|
0.09
|
|
|||||||||
|
Restructuring charges and fees, net
(3)
|
19,724
|
|
5,074
|
|
12,716
|
|
3,513
|
|
0.24
|
|
0.06
|
|
|||||||||
|
Tax reform related adjustments, net
(4)
|
23,278
|
|
—
|
|
(571,666
|
)
|
—
|
|
(10.77
|
)
|
—
|
|
|||||||||
|
Gain on sale of property
|
(24,122
|
)
|
—
|
|
(14,769
|
)
|
—
|
|
(0.27
|
)
|
—
|
|
|||||||||
|
Comparable
|
$
|
104,540
|
|
82,165
|
|
$
|
72,730
|
|
57,435
|
|
$
|
1.37
|
|
1.07
|
|
||||||
|
(1)
|
2017 amounts reflect tax benefit as a result of the 2017 Tax Cuts and Jobs Act. Refer to
Note 13
, "
Income Taxes
," in the Notes to Consolidated Financial Statements for additional information.
|
|
(2)
|
Includes the amortization of actuarial loss, interest cost and expected return on plan assets components of pension and post-retirement costs, which are tied to financial market performance.
|
|
(3)
|
Refer to
Note 4
, "
Restructuring Charges and Fees, Net
,” in the Notes to Consolidated Financial Statements for additional information.
|
|
(4)
|
Refer to the table below for the information on the tax impact on our comparable earnings measures.
|
The following table provides a reconciliation of the provision for income taxes to the comparable provision for income taxes:
|
Three months ended December 31,
|
Twelve months ended December 31,
|
|||||||||||||||||||||
|
2017
|
2016
|
2017
|
2016
|
2015
|
2014
|
2013
|
||||||||||||||||
|
(In thousands)
|
||||||||||||||||||||||
|
Provision for income taxes
(1), (2)
|
$
|
563,685
|
|
(19,921
|
)
|
$
|
477,229
|
|
(141,741
|
)
|
(163,226
|
)
|
(118,042
|
)
|
(125,740
|
)
|
||||||
|
Income tax effects of non-GAAP adjustments
(1)
|
(551
|
)
|
(4,809
|
)
|
(11,223
|
)
|
(16,819
|
)
|
(14,860
|
)
|
(46,423
|
)
|
(9,964
|
)
|
||||||||
|
Tax reform related adjustments, net
(1), (2)
|
(594,944
|
)
|
—
|
|
(594,944
|
)
|
—
|
|
—
|
|
—
|
|
—
|
|
||||||||
|
Comparable provision for income taxes
(1)
|
$
|
(31,810
|
)
|
(24,730
|
)
|
$
|
(128,938
|
)
|
(158,560
|
)
|
(178,086
|
)
|
(164,465
|
)
|
(135,704
|
)
|
||||||
_________________
|
(1)
|
The comparable provision for income taxes is computed using the same methodology as the GAAP provision of income taxes. Income tax effects of non-GAAP adjustments are calculated based on statutory tax rates of the jurisdictions to which the non-GAAP adjustments related.
|
|
(2)
|
2017 amounts reflect tax benefit as a result of the 2017 Tax Cuts and Jobs Act. Refer to
Note 13
, "
Income Taxes
," in the Notes to Consolidated Financial Statements for additional information.
|
60
ITEM 7. MANAGEMENT'S DISCUSSION AND ANALYSIS OF
FINANCIAL CONDITION AND RESULTS OF OPERATIONS - (Continued)
The following table provides a numerical reconciliation of net cash provided by operating activities to total cash generated and to free cash flow for the years ended December 31, 2017, 2016, 2015, 2014 and
2013
:
|
2017
|
2016
|
2015
|
2014
|
2013
|
|||||||||||
|
|
(In thousands)
|
||||||||||||||
|
Net cash provided by operating activities
|
$
|
1,547,986
|
|
1,601,022
|
|
1,441,788
|
|
1,382,818
|
|
1,251,811
|
|
||||
|
Sales of revenue earning equipment
(1)
|
376,743
|
|
414,249
|
|
423,605
|
|
493,477
|
|
445,589
|
|
|||||
|
Sales of operating property and equipment
(1)
|
52,257
|
|
7,051
|
|
3,891
|
|
3,486
|
|
6,782
|
|
|||||
|
Collections on direct finance leases
(1)
|
73,172
|
|
76,510
|
|
70,980
|
|
65,517
|
|
70,677
|
|
|||||
|
Other, net
(1)
|
—
|
|
—
|
|
—
|
|
(1,250
|
)
|
8,173
|
|
|||||
|
Total cash generated
|
2,050,158
|
|
2,098,832
|
|
1,940,264
|
|
1,944,048
|
|
1,783,032
|
|
|||||
|
Purchases of property and revenue earning equipment
|
(1,860,436
|
)
|
(1,905,157
|
)
|
(2,667,978
|
)
|
(2,259,164
|
)
|
(2,122,628
|
)
|
|||||
|
Free cash flow
|
$
|
189,722
|
|
193,675
|
|
|
(727,714
|
)
|
(315,116
|
)
|
(339,596
|
)
|
|||
|
Memo:
|
|||||||||||||||
|
Net cash (used in) provided by financing activities
|
$
|
(155,115
|
)
|
(185,922
|
)
|
731,485
|
|
311,650
|
|
347,070
|
|
||||
|
Net cash used in investing activities
|
$
|
(1,366,340
|
)
|
(1,405,833
|
)
|
(2,161,355
|
)
|
(1,704,510
|
)
|
(1,603,818
|
)
|
||||
_________________
|
(1)
|
Included in cash flows from investing activities.
|
The following table provides a numerical reconciliation of total revenue to operating revenue for the years ended
December 31, 2017
,
2016
,
2015
, 2014 and 2013:
|
2017
|
2016
|
2015
|
2014
|
2013
|
||||||||||||
|
|
(In thousands)
|
|||||||||||||||
|
Total revenue
|
$
|
7,329,599
|
|
6,786,984
|
|
6,571,893
|
|
6,638,285
|
|
6,419,285
|
|
|||||
|
Fuel
|
(710,305
|
)
|
(628,525
|
)
|
(722,734
|
)
|
(1,049,646
|
)
|
(1,098,843
|
)
|
||||||
|
Subcontracted transportation
|
(578,914
|
)
|
(367,562
|
)
|
(288,082
|
)
|
(336,422
|
)
|
(354,624
|
)
|
||||||
|
Operating revenue
|
$
|
6,040,380
|
|
5,790,897
|
|
5,561,077
|
|
5,252,217
|
|
4,965,818
|
|
|||||
The following table provides a numerical reconciliation of total revenue to operating revenue for the three months ended
December 31, 2017
and
2016
:
|
|
Three months ended December 31,
|
||||||
|
|
2017
|
2016
|
|||||
|
|
(In thousands)
|
||||||
|
Total revenue
|
$
|
1,939,693
|
|
1,729,150
|
|
||
|
Fuel
|
(190,326
|
)
|
(164,349
|
)
|
|||
|
Subcontracted transportation
|
(162,755
|
)
|
(97,923
|
)
|
|||
|
Operating revenue
|
$
|
1,586,612
|
|
1,466,878
|
|
||
61
ITEM 7. MANAGEMENT'S DISCUSSION AND ANALYSIS OF
FINANCIAL CONDITION AND RESULTS OF OPERATIONS - (Continued)
The following table provides a reconciliation of FMS total revenue to FMS operating revenue, for the three months ended December 31, 2017 and 2016 and for the years ended December 31, 2017, 2016 and 2015:
|
|
Three months ended December 31,
|
Twelve months ended December 31,
|
||||||||||||||
|
|
2017
|
2016
|
2017
|
2016
|
2015
|
|||||||||||
|
|
(Dollars in thousands)
|
|||||||||||||||
|
FMS total revenue
|
$
|
1,241,724
|
|
1,151,742
|
|
$
|
4,733,571
|
|
4,556,194
|
|
4,545,692
|
|
||||
|
Fuel
(1)
|
(184,754
|
)
|
(159,468
|
)
|
(689,809
|
)
|
(608,454
|
)
|
(699,646
|
)
|
||||||
|
FMS operating revenue
|
$
|
1,056,970
|
|
992,274
|
|
$
|
4,043,762
|
|
3,947,740
|
|
3,846,046
|
|
||||
|
FMS EBT
|
$
|
91,747
|
|
64,275
|
|
$
|
312,720
|
|
370,829
|
|
461,314
|
|
||||
|
FMS EBT as a % of FMS total revenue
|
7.4
|
%
|
5.6
|
%
|
6.6
|
%
|
8.1
|
%
|
10.1
|
%
|
||||||
|
FMS EBT as a % of FMS operating revenue
|
8.7
|
%
|
6.5
|
%
|
7.7
|
%
|
9.4
|
%
|
12.0
|
%
|
||||||
————————————
|
(1)
|
Includes intercompany fuel sales from FMS to DTS and SCS.
|
The following table provides a reconciliation of DTS total revenue to DTS operating revenue, for the three months ended December 31, 2017 and 2016 and for the years ended December 31, 2017, 2016 and 2015:
|
|
Three months ended December 31,
|
Twelve months ended December 31,
|
||||||||||||||
|
|
2017
|
2016
|
2017
|
2016
|
2015
|
|||||||||||
|
|
(Dollars in thousands)
|
|||||||||||||||
|
DTS total revenue
|
$
|
284,422
|
|
256,870
|
|
$
|
1,096,042
|
|
1,020,895
|
|
895,538
|
|
||||
|
Subcontracted transportation
|
(55,289
|
)
|
(36,606
|
)
|
(192,122
|
)
|
(143,502
|
)
|
(61,202
|
)
|
||||||
|
Fuel
|
(30,884
|
)
|
(27,158
|
)
|
(114,626
|
)
|
(103,074
|
)
|
(119,883
|
)
|
||||||
|
DTS operating revenue
|
$
|
198,249
|
|
193,106
|
|
$
|
789,294
|
|
774,319
|
|
714,453
|
|
||||
|
DTS EBT
|
$
|
15,436
|
|
15,271
|
|
$
|
55,328
|
|
63,571
|
|
45,575
|
|
||||
|
DTS EBT as a % of DTS total revenue
|
5.4
|
%
|
5.9
|
%
|
5.0
|
%
|
6.2
|
%
|
5.1
|
%
|
||||||
|
DTS EBT as a % of DTS operating revenue
|
7.8
|
%
|
7.9
|
%
|
7.0
|
%
|
8.2
|
%
|
6.4
|
%
|
||||||
The following table provides a reconciliation of SCS total revenue to SCS operating revenue for the three months ended December 31, 2017 and 2016 and for the years ended December 31, 2017, 2016 and 2015:
|
|
Three months ended December 31,
|
Twelve months ended December 31,
|
||||||||||||||
|
|
2017
|
2016
|
2017
|
2016
|
2015
|
|||||||||||
|
|
(Dollars in thousands)
|
|||||||||||||||
|
SCS total revenue
|
$
|
540,023
|
|
430,185
|
|
$
|
1,969,500
|
|
1,637,850
|
|
1,547,763
|
|
||||
|
Subcontracted transportation
|
(107,466
|
)
|
(61,317
|
)
|
(386,792
|
)
|
(224,060
|
)
|
(226,880
|
)
|
||||||
|
Fuel
|
(21,908
|
)
|
(16,218
|
)
|
(75,160
|
)
|
(61,713
|
)
|
(64,574
|
)
|
||||||
|
SCS operating revenue
|
$
|
410,649
|
|
352,650
|
|
$
|
1,507,548
|
|
1,352,077
|
|
1,256,309
|
|
||||
|
SCS EBT
|
$
|
27,743
|
|
26,427
|
|
$
|
103,102
|
|
105,532
|
|
93,575
|
|
||||
|
SCS EBT as a % of SCS total revenue
|
5.1
|
%
|
6.1
|
%
|
5.2
|
%
|
6.4
|
%
|
6.0
|
%
|
||||||
|
SCS EBT as a % of SCS operating revenue
|
6.8
|
%
|
7.5
|
%
|
6.8
|
%
|
7.8
|
%
|
7.4
|
%
|
||||||
62
ITEM 7. MANAGEMENT'S DISCUSSION AND ANALYSIS OF
FINANCIAL CONDITION AND RESULTS OF OPERATIONS - (Continued)
The following table provides numerical reconciliations of net earnings to adjusted net earnings and average total debt and average shareholders' equity to adjusted average total capital and of the non-GAAP elements used to calculate the adjusted return on average capital to the corresponding GAAP measures for the years ended
December 31, 2017
,
2016
,
2015
,
2014
and
2013
:
|
2017
|
2016
|
2015
|
2014
|
2013
|
||||||||||||
|
|
(Dollars in thousands)
|
|||||||||||||||
|
Net earnings
(1)
|
$
|
790,558
|
|
262,477
|
|
304,768
|
|
218,341
|
|
237,871
|
|
|||||
|
Restructuring and other charges (recoveries), net and other items
(2)
|
28,221
|
|
12,585
|
|
17,559
|
|
114,956
|
|
(154
|
)
|
||||||
|
Income taxes
|
(476,707
|
)
|
141,623
|
|
163,649
|
|
118,120
|
|
125,693
|
|
||||||
|
Adjusted earnings before income taxes
|
342,072
|
|
416,685
|
|
485,976
|
|
451,417
|
|
363,410
|
|
||||||
|
Adjusted interest expense
(3)
|
140,584
|
|
148,043
|
|
150,640
|
|
144,991
|
|
140,738
|
|
||||||
|
Adjusted income taxes
(4)
|
(166,773
|
)
|
(198,248
|
)
|
(224,033
|
)
|
(213,738
|
)
|
(177,308
|
)
|
||||||
|
Adjusted net earnings for adjusted return on average capital
[A]
|
$
|
315,883
|
|
366,480
|
|
412,583
|
|
382,670
|
|
326,840
|
|
|||||
|
Average total debt
|
$
|
5,360,257
|
|
5,549,458
|
|
5,177,012
|
|
4,653,476
|
|
4,015,178
|
|
|||||
|
Average off-balance sheet debt
|
1,758
|
|
1,472
|
|
1,467
|
|
1,919
|
|
961
|
|
||||||
|
Average shareholders’ equity
|
2,201,219
|
|
2,052,371
|
|
1,894,917
|
|
1,925,824
|
|
1,593,942
|
|
||||||
|
Average adjustments to shareholders’ equity
(5)
|
(69,443
|
)
|
1,728
|
|
10,843
|
|
7,758
|
|
(2,088
|
)
|
||||||
|
Adjusted average total capital
[B]
|
$
|
7,493,791
|
|
7,605,029
|
|
7,084,239
|
|
6,588,977
|
|
5,607,993
|
|
|||||
|
Adjusted return on average capital
[A]/[B]
|
4.2
|
%
|
4.8
|
%
|
5.8
|
%
|
5.8
|
%
|
5.8
|
%
|
||||||
________________
|
(1)
|
2017 amounts reflect tax benefit as a result of the 2017 Tax Cuts and Jobs Act. Refer to
Note 13
, "
Income Taxes
," in the Notes to Consolidated Financial Statements for additional information.
|
|
(2)
|
For
2017
,
2016
and
2015
, see
Note 4
, “
Restructuring Charges and Fees, Net
” and
Note 24
, “
Other Items Impacting Comparability
,” in the Notes to Consolidated Financial Statements;
2014
includes
$97 million
related to a pension lump sum settlement expense for unrecognized actuarial losses as a result of the partial settlement of our pension plan liability.
|
|
(3)
|
Represents reported interest expense plus imputed interest on off-balance sheet obligations.
|
|
(4)
|
Represents provision for income taxes plus income taxes on restructuring and other items and adjusted interest expense.
|
|
(5)
|
Represents the impact to equity of items to arrive at comparable earnings.
|
The following table provides a numerical reconciliation of forecasted earnings per diluted common share from continuing operations to forecasted comparable earnings per diluted common share from continuing operations for
2018
:
|
2018
|
|||
|
EPS from continuing operations forecast
|
$5.34 - 5.64
|
|
|
|
Non-operating pension costs
|
0.06
|
|
|
|
Comparable EPS from continuing operations forecast
|
$5.40 - 5.70
|
|
|
The following table provides a numerical reconciliation of total revenue to operating revenue for
2018
:
|
|
2018
|
|||
|
|
(In thousands)
|
|||
|
Total revenue
|
$
|
7,800,000
|
|
|
|
Fuel
|
(700,000
|
)
|
||
|
Subcontracted transportation
|
(600,000
|
)
|
||
|
Operating revenue
|
$
|
6,500,000
|
|
|
63
ITEM 7. MANAGEMENT'S DISCUSSION AND ANALYSIS OF
FINANCIAL CONDITION AND RESULTS OF OPERATIONS - (Continued)
Segment Financial Measures.
The following table reconciles FMS segment revenue to revenue from external customers for the years ended
December 31, 2017
,
2016
and
2015
:
|
2017
|
2016
|
2015
|
||||||||
|
|
(In thousands)
|
|||||||||
|
ChoiceLease revenue
|
$
|
2,688,717
|
|
2,573,638
|
|
2,406,711
|
|
|||
|
Commercial rental revenue
|
813,539
|
|
846,331
|
|
940,045
|
|
||||
|
ChoiceLease and commercial rental revenue
|
3,502,256
|
|
3,419,969
|
|
3,346,756
|
|
||||
|
Intercompany revenue
|
(264,571
|
)
|
(249,017
|
)
|
(225,203
|
)
|
||||
|
ChoiceLease and commercial rental revenue from external customers
|
$
|
3,237,685
|
|
3,170,952
|
|
3,121,553
|
|
|||
|
FMS services revenue
|
$
|
541,506
|
|
527,771
|
|
499,290
|
|
|||
|
Intercompany revenue
|
(35,634
|
)
|
(34,222
|
)
|
(30,528
|
)
|
||||
|
FMS services revenue from external customers
|
$
|
505,872
|
|
493,549
|
|
468,762
|
|
|||
|
FMS fuel services revenue
|
$
|
689,809
|
|
608,454
|
|
699,646
|
|
|||
|
Intercompany revenue
|
(169,309
|
)
|
(144,716
|
)
|
(161,369
|
)
|
||||
|
FMS fuel services revenue from external customers
|
$
|
520,500
|
|
463,738
|
|
538,277
|
|
|||
64
FINANCIAL CONDITION AND RESULTS OF OPERATIONS - (Continued)
SPECIAL NOTE REGARDING FORWARD-LOOKING STATEMENTS
Forward-looking statements (within the meaning of the Federal Private Securities Litigation Reform Act of 1995) are statements that relate to expectations, beliefs, projections, future plans and strategies, anticipated events or trends concerning matters that are not historical facts. These statements are often preceded by or include the words “believe,” “expect,” “intend,” “estimate,” “anticipate,” “will,” “may,” “could,” “should” or similar expressions. This Annual Report contains forward-looking statements including, but not limited to, statements regarding:
|
•
|
our expectations as to anticipated revenue and earnings growth specifically, total revenue, operating revenue and product line revenues, used vehicle sales, demand, pricing, inventory and volumes, contract revenues, ChoiceLease growth, SelectCare growth, commercial rental pricing and demand, and actual and planned new sales activity in lease, DTS and SCS;
|
|
•
|
our expectations relating to further deterioration in the used vehicle sales market and residual values of used vehicles;
|
|
•
|
the size and impact of strategic investments;
|
|
•
|
our expected cost savings from workforce reductions and restructuring actions;
|
|
•
|
the continuing benefits of our maintenance initiatives and a newer fleet;
|
|
•
|
our ability to successfully achieve the operational goals that are the basis of our business strategies, including driving fleet growth, delivering a consistent, industry-leading and cost-effective maintenance program, optimizing asset utilization and management, providing differentiated quality of service and best execution, developing broad-based capabilities, creating a culture of innovation, focusing on continuous improvement and standardization and successfully implementing sales and marketing strategies;
|
|
•
|
impact of losses from conditional obligations arising from guarantees;
|
|
•
|
number of NLE and used vehicles in inventory and the appropriate size of our commercial rental fleet given commercial rental market expectations;
|
|
•
|
estimates of cash flows from operations, free cash flow and capital expenditures for
2018
;
|
|
•
|
the adequacy of our accounting estimates and reserves for pension expense, compensation-related expense, postretirement benefit expense, depreciation and residual value guarantees, rent expense under operating leases, self-insurance reserves, goodwill impairment, accounting changes and income taxes;
|
|
•
|
our ability to meet our operating, investing and financing needs in the foreseeable future through internally generated funds and outside funding sources;
|
|
•
|
our expected level of use of outside funding sources, anticipated future payments under debt, lease and purchase agreements, and risk of losses resulting from counterparty default under hedging and derivative agreements;
|
|
•
|
anticipated impact of exchange rate fluctuations;
|
|
•
|
the anticipated impact of fuel price fluctuations on our operations, cash flows and financial position;
|
|
•
|
our expectations as to future pension expense and contributions, as well as the continued effect of the freeze of our pension plans on our benefit funding requirements;
|
|
•
|
the anticipated deferral of tax gains on disposal of eligible revenue earning equipment under our vehicle like-kind exchange program;
|
|
•
|
our expectations relating to withdrawal liabilities and funding levels of multi-employer plans;
|
|
•
|
the status of our unrecognized tax benefits related to the U.S. federal, state and foreign tax positions;
|
|
•
|
our expectations regarding the completion and ultimate outcome of certain tax audits;
|
|
•
|
the ultimate disposition of legal proceedings and estimated environmental liabilities;
|
|
•
|
our expectations relating to compliance with new regulatory requirements;
|
|
•
|
our expectations regarding the effects of the adoption of recent accounting pronouncements; and
|
|
•
|
the impact of tax reform legislation.
|
These statements, as well as other forward-looking statements contained in this Annual Report, are based on our current plans and expectations and are subject to risks, uncertainties and assumptions. We caution readers that certain important factors could cause actual results and events to differ significantly from those expressed in any forward-looking statements. For a detailed description of certain of these risk factors, please see “Item 1A—Risk Factors” of this Annual Report.
The risks included in the Annual Report are not exhaustive. New risk factors emerge from time to time and it is not possible for management to predict all such risk factors or to assess the impact of such risk factors on our business. As a result, no assurance can be given as to our future results or achievements. You should not place undue reliance on the forward-looking statements contained herein, which speak only as of the date of this Annual Report. We do not intend, or assume any obligation, to update or revise any forward-looking statements contained in this Annual Report, whether as a result of new information, future events or otherwise.
65
The information required by ITEM 7A is included in ITEM 7 of PART II of this report.
66
FINANCIAL STATEMENTS
|
|
|
Page No.
|
|
|
||
|
|
||
|
|
||
|
|
||
|
|
||
|
|
||
|
Notes to Consolidated Financial Statements:
|
|
|
|
|
||
|
|
||
|
|
||
|
Note 4. Restructuring
Charges and Fees, Net
|
|
|
|
|
||
|
|
||
|
|
||
|
|
||
|
|
||
|
|
||
|
|
||
|
|
||
|
|
||
|
|
||
|
|
||
|
|
||
|
|
||
|
|
||
|
|
||
|
|
||
|
|
||
|
|
||
|
|
||
|
|
||
|
|
||
|
|
||
|
|
|
|
|
|
||
|
Consolidated Financial Statement Schedule for the Years Ended December 31, 2017, 2016 and 2015:
|
|
|
|
|
||
All other schedules are omitted because they are not applicable or the required information is shown in the consolidated financial statements or notes thereto.
67
MANAGEMENT’S REPORT ON INTERNAL CONTROL OVER FINANCIAL REPORTING
TO THE SHAREHOLDERS OF RYDER SYSTEM, INC.:
Management of Ryder System, Inc., together with its consolidated subsidiaries (Ryder), is responsible for establishing and maintaining adequate internal control over financial reporting as defined in Rules 13a- 15(f) and 15d-15(f) under the Securities Exchange Act of 1934. Ryder’s internal control over financial reporting is designed to provide reasonable assurance regarding the reliability of financial reporting and the preparation of the consolidated financial statements for external purposes in accordance with accounting principles generally accepted in the United States of America.
Ryder’s internal control over financial reporting includes those policies and procedures that (1) pertain to the maintenance of records that, in reasonable detail, accurately and fairly reflect the transactions and dispositions of the assets of Ryder; (2) provide reasonable assurance that transactions are recorded as necessary to permit preparation of financial statements in accordance with generally accepted accounting principles, and that our receipts and expenditures are being made only in accordance with authorizations of Ryder’s management and directors; and (3) provide reasonable assurance regarding prevention or timely detection of unauthorized acquisition, use or disposition of Ryder’s assets that could have a material effect on the consolidated financial statements.
Because of its inherent limitations, internal control over financial reporting may not prevent or detect misstatements. Also, projections of any evaluation of effectiveness to future periods are subject to the risk that controls may become inadequate because of changes in conditions, or that the degree of compliance with the policies or procedures may deteriorate.
Management assessed the effectiveness of Ryder’s internal control over financial reporting as of
December 31, 2017
. In making this assessment, management used the criteria set forth by the Committee of Sponsoring Organizations of the Treadway Commission in “Internal Control — Integrated Framework (2013).” Based on our assessment and those criteria, management determined that Ryder maintained effective internal control over financial reporting as of
December 31, 2017
.
Ryder’s independent registered certified public accounting firm has audited the effectiveness of Ryder’s internal control over financial reporting. Their report appears on the subsequent page.
68
Report of Independent Registered Public Accounting Firm
To the Board of Directors and Shareholders
of Ryder System, Inc.
Opinions on the Financial Statements and Internal Control over Financial Reporting
We have audited the accompanying consolidated balance sheets of Ryder System, Inc. and its subsidiaries
as of
December 31, 2017
and
2016
, and the related consolidated statements of earnings, comprehensive income, shareholders’ equity and cash flows for each of the three years in the period ended
December 31, 2017
, including the related notes and financial statement schedule listed in the accompanying index (collectively referred to as the “consolidated financial statements”).
We also have audited the Company's internal control over financial reporting as of
December 31, 2017
, based on criteria established in
Internal Control - Integrated Framework
(2013)
issued by the Committee of Sponsoring Organizations of the Treadway Commission (COSO).
In our opinion, the consolidated
financial statements referred to above present fairly, in all material respects, the financial position of the Company as of
December 31, 2017
and
2016
,
and the results of their
operations and their
cash flows for each of the three years in the period ended
December 31, 2017
in conformity with accounting principles generally accepted in the United States of America. Also in our opinion, the Company maintained, in all material respects, effective internal control over financial reporting as of
December 31, 2017
, based on criteria established in
Internal Control - Integrated Framework
(2013)
issued by the COSO.
Basis for Opinions
The Company's management is responsible for these consolidated financial statements, for maintaining effective internal control over financial reporting, and for its assessment of the effectiveness of internal control over financial reporting, included in the accompanying
Management’s Report on Internal Control over Financial Reporting. Our responsibility is to express opinions on the Company’s consolidated
financial statements and on the Company's internal control over financial reporting based on our audits. We are a public accounting firm registered with the Public Company Accounting Oversight Board (United States) ("PCAOB") and are required to be independent with respect to the Company in accordance with the U.S. federal securities laws and the applicable rules and regulations of the Securities and Exchange Commission and the PCAOB.
We conducted our audits in accordance with the standards of the PCAOB. Those standards require that we plan and perform the audits to obtain reasonable assurance about whether the consolidated
financial statements are free of material misstatement, whether due to error or fraud, and whether effective internal control over financial reporting was maintained in all material respects.
Our audits of the consolidated
financial statements included performing procedures to assess the risks of material misstatement of the consolidated
financial statements, whether due to error or fraud, and performing procedures that respond to those risks. Such procedures included examining, on a test basis, evidence regarding the amounts and disclosures in the consolidated
financial statements. Our audits also included evaluating the accounting principles used and significant estimates made by management, as well as evaluating the overall presentation of the consolidated
financial statements. Our audit of internal control over financial reporting included obtaining an understanding of internal control over financial reporting, assessing the risk that a material weakness exists, and testing and evaluating the design and operating effectiveness of internal control based on the assessed risk. Our audits also included performing such other procedures as we considered necessary in the circumstances. We believe that our audits provide a reasonable basis for our opinions.
Definition and Limitations of Internal Control over Financial Reporting
A company’s internal control over financial reporting is a process designed to provide reasonable assurance regarding the reliability of financial reporting and the preparation of financial statements for external purposes in accordance with generally accepted accounting principles. A company’s internal control over financial reporting includes those policies and procedures that (i) pertain to the maintenance of records that, in reasonable detail, accurately and fairly reflect the transactions and dispositions of the assets of the company; (ii) provide reasonable assurance that transactions are recorded as necessary to permit preparation of financial statements in accordance with generally accepted accounting principles, and that receipts and expenditures of the company are being made only in accordance with authorizations of management and directors of the company; and (iii) provide reasonable assurance regarding prevention or timely detection of unauthorized acquisition, use, or disposition of the company’s assets that could have a material effect on the financial statements.
69
Because of its inherent limitations, internal control over financial reporting may not prevent or detect misstatements. Also, projections of any evaluation of effectiveness to future periods are subject to the risk that controls may become inadequate because of changes in conditions, or that the degree of compliance with the policies or procedures may deteriorate.
/s/ PricewaterhouseCoopers LLP
____________________________________________________________________
PricewaterhouseCoopers LLP
Certified Public Accountants
Miami, Florida
February 16, 2018
We have served as the Company’s auditor since 2006.
70
RYDER SYSTEM, INC. AND SUBSIDIARIES
CONSOLIDATED STATEMENTS OF EARNINGS
|
|
Years ended December 31,
|
|||||||||
|
|
2017
|
2016
|
2015
|
|||||||
|
|
(In thousands, except per share amounts)
|
|||||||||
|
Lease and rental revenues
|
$
|
3,237,685
|
|
3,170,952
|
|
3,121,553
|
|
|||
|
Services revenue
|
3,571,414
|
|
3,152,294
|
|
2,912,063
|
|
||||
|
Fuel services revenue
|
520,500
|
|
463,738
|
|
538,277
|
|
||||
|
Total revenues
|
7,329,599
|
|
6,786,984
|
|
6,571,893
|
|
||||
|
Cost of lease and rental
|
2,355,043
|
|
2,234,284
|
|
2,153,450
|
|
||||
|
Cost of services
|
3,003,348
|
|
2,602,978
|
|
2,413,156
|
|
||||
|
Cost of fuel services
|
507,440
|
|
448,306
|
|
519,843
|
|
||||
|
Other operating expenses
|
115,507
|
|
113,461
|
|
117,082
|
|
||||
|
Selling, general and administrative expenses
|
871,983
|
|
805,104
|
|
822,857
|
|
||||
|
Non-operating pension costs
|
27,741
|
|
37,593
|
|
17,797
|
|
||||
|
Used vehicle sales, net
|
17,241
|
|
(972
|
)
|
(99,853
|
)
|
||||
|
Interest expense
|
140,350
|
|
147,843
|
|
150,434
|
|
||||
|
Miscellaneous income, net
|
(44,245
|
)
|
(13,068
|
)
|
(10,156
|
)
|
||||
|
Restructuring charges and fees, net
|
21,405
|
|
5,074
|
|
18,068
|
|
||||
|
7,015,813
|
|
6,380,603
|
|
6,102,678
|
|
|||||
|
Earnings from continuing operations before income taxes
|
313,786
|
|
406,381
|
|
469,215
|
|
||||
|
(Benefit from) provision for income taxes
|
(477,229
|
)
|
141,741
|
|
163,226
|
|
||||
|
Earnings from continuing operations
|
791,015
|
|
264,640
|
|
305,989
|
|
||||
|
Loss from discontinued operations, net of tax
|
(457
|
)
|
(2,163
|
)
|
(1,221
|
)
|
||||
|
Net earnings
|
$
|
790,558
|
|
262,477
|
|
304,768
|
|
|||
|
Earnings (loss) per common share — Basic
|
||||||||||
|
Continuing operations
|
$
|
14.98
|
|
4.98
|
|
5.78
|
|
|||
|
Discontinued operations
|
(0.01
|
)
|
(0.04
|
)
|
(0.02
|
)
|
||||
|
Net earnings
|
$
|
14.97
|
|
4.94
|
|
5.75
|
|
|||
|
Earnings (loss) per common share — Diluted
|
||||||||||
|
Continuing operations
|
$
|
14.87
|
|
4.94
|
|
5.73
|
|
|||
|
Discontinued operations
|
(0.01
|
)
|
(0.04
|
)
|
(0.02
|
)
|
||||
|
Net earnings
|
$
|
14.87
|
|
4.90
|
|
5.71
|
|
|||
See accompanying notes to consolidated financial statements.
Note: EPS amounts may not be additive due to rounding.
71
RYDER SYSTEM, INC. AND SUBSIDIARIES
|
Years ended December 31,
|
||||||||||
|
2017
|
2016
|
2015
|
||||||||
|
(In thousands)
|
||||||||||
|
Net earnings
|
$
|
790,558
|
|
262,477
|
|
304,768
|
|
|||
|
Other comprehensive income (loss):
|
||||||||||
|
Changes in cumulative translation adjustment and other
|
66,172
|
|
(70,590
|
)
|
(99,933
|
)
|
||||
|
Amortization of pension and postretirement items
|
31,520
|
|
29,493
|
|
27,731
|
|
||||
|
Income tax expense related to amortization of pension and postretirement items
|
(11,034
|
)
|
(10,452
|
)
|
(9,637
|
)
|
||||
|
Amortization of pension and postretirement items, net of tax
|
20,486
|
|
19,041
|
|
18,094
|
|
||||
|
|
|
|
||||||||
|
Change in net actuarial loss and prior service credit
|
49,680
|
|
(98,092
|
)
|
(23,979
|
)
|
||||
|
Income tax (expense) benefit related to change in net actuarial loss and prior service credit
|
(9,807
|
)
|
28,344
|
|
13,353
|
|
||||
|
Change in net actuarial loss and prior service credit, net of taxes
|
39,873
|
|
(69,748
|
)
|
(10,626
|
)
|
||||
|
Other comprehensive income (loss), net of taxes
|
126,531
|
|
(121,297
|
)
|
(92,465
|
)
|
||||
|
Comprehensive income
|
$
|
917,089
|
|
141,180
|
|
212,303
|
|
|||
See accompanying notes to consolidated financial statements.
72
RYDER SYSTEM, INC. AND SUBSIDIARIES
|
|
December 31,
|
||||||
|
|
2017
|
2016
|
|||||
|
|
(Dollars in thousands, except
share amounts)
|
||||||
|
Assets:
|
|||||||
|
Current assets:
|
|||||||
|
Cash and cash equivalents
|
$
|
78,348
|
|
58,801
|
|
||
|
Receivables, net
|
1,010,908
|
|
831,947
|
|
|||
|
Inventories
|
73,543
|
|
69,529
|
|
|||
|
Prepaid expenses and other current assets
|
159,483
|
|
141,280
|
|
|||
|
Total current assets
|
1,322,282
|
|
1,101,557
|
|
|||
|
Revenue earning equipment, net
|
8,355,262
|
|
8,147,722
|
|
|||
|
Operating property and equipment, net
|
776,704
|
|
745,870
|
|
|||
|
Goodwill
|
395,504
|
|
386,772
|
|
|||
|
Intangible assets
|
42,930
|
|
48,249
|
|
|||
|
Direct financing leases and other assets
|
559,549
|
|
472,284
|
|
|||
|
Total assets
|
$
|
11,452,231
|
|
10,902,454
|
|
||
|
Liabilities and shareholders’ equity:
|
|||||||
|
Current liabilities:
|
|||||||
|
Short-term debt and current portion of long-term debt
|
$
|
826,069
|
|
791,410
|
|
||
|
Accounts payable
|
599,303
|
|
445,470
|
|
|||
|
Accrued expenses and other current liabilities
|
587,406
|
|
507,189
|
|
|||
|
Total current liabilities
|
2,012,778
|
|
1,744,069
|
|
|||
|
Long-term debt
|
4,583,582
|
|
4,599,864
|
|
|||
|
Other non-current liabilities
|
812,089
|
|
817,565
|
|
|||
|
Deferred income taxes
|
1,208,766
|
|
1,688,681
|
|
|||
|
Total liabilities
|
8,617,215
|
|
8,850,179
|
|
|||
|
Shareholders’ equity:
|
|||||||
|
Preferred stock, no par value per share — authorized, 3,800,917; none outstanding, December 31, 2017 or 2016
|
—
|
|
—
|
|
|||
|
Common stock, $0.50 par value per share — authorized, 400,000,000; outstanding, December 31, 2017 — 52,955,314; December 31, 2016 — 53,463,118
|
26,478
|
|
26,732
|
|
|||
|
Additional paid-in capital
|
1,051,017
|
|
1,032,549
|
|
|||
|
Retained earnings
|
2,465,022
|
|
1,827,026
|
|
|||
|
Accumulated other comprehensive loss
|
(707,501
|
)
|
(834,032
|
)
|
|||
|
Total shareholders’ equity
|
2,835,016
|
|
2,052,275
|
|
|||
|
Total liabilities and shareholders’ equity
|
$
|
11,452,231
|
|
10,902,454
|
|
||
See accompanying notes to consolidated financial statements.
73
RYDER SYSTEM, INC. AND SUBSIDIARIES
|
|
Years ended December 31,
|
|||||||||
|
|
2017
|
2016
|
2015
|
|||||||
|
|
(In thousands)
|
|||||||||
|
Net earnings
|
$
|
790,558
|
|
262,477
|
|
304,768
|
|
|||
|
Less: Loss from discontinued operations, net of tax
|
(457
|
)
|
(2,163
|
)
|
(1,221
|
)
|
||||
|
Earnings from continuing operations
|
791,015
|
|
264,640
|
|
305,989
|
|
||||
|
Depreciation expense
|
1,255,175
|
|
1,187,050
|
|
1,121,966
|
|
||||
|
Used vehicle sales, net
|
17,241
|
|
(972
|
)
|
(99,853
|
)
|
||||
|
Amortization expense and other non-cash charges, net
|
12,114
|
|
30,667
|
|
52,965
|
|
||||
|
Non-operating pension costs and share-based compensation expense
|
46,708
|
|
56,257
|
|
38,978
|
|
||||
|
Deferred income tax (benefit) expense
|
(499,783
|
)
|
124,886
|
|
154,042
|
|
||||
|
Changes in operating assets and liabilities, net of acquisitions:
|
||||||||||
|
Receivables
|
(173,840
|
)
|
(51,754
|
)
|
(40,323
|
)
|
||||
|
Inventories
|
(3,296
|
)
|
(5,906
|
)
|
1,448
|
|
||||
|
Prepaid expenses and other assets
|
(38,878
|
)
|
(14,211
|
)
|
(292
|
)
|
||||
|
Accounts payable
|
66,149
|
|
94,320
|
|
(74,381
|
)
|
||||
|
Accrued expenses and other non-current liabilities
|
75,381
|
|
(83,955
|
)
|
(18,751
|
)
|
||||
|
Net cash provided by operating activities from continuing operations
|
1,547,986
|
|
1,601,022
|
|
1,441,788
|
|
||||
|
Cash flows from financing activities from continuing operations:
|
||||||||||
|
Net change in commercial paper borrowings and revolving credit facilities
|
89,519
|
|
(77,798
|
)
|
323,359
|
|
||||
|
Debt proceeds
|
873,302
|
|
674,928
|
|
1,283,223
|
|
||||
|
Debt repaid
|
(962,577
|
)
|
(669,047
|
)
|
(798,311
|
)
|
||||
|
Dividends on common stock
|
(95,813
|
)
|
(91,043
|
)
|
(83,201
|
)
|
||||
|
Common stock issued
|
20,508
|
|
18,087
|
|
23,635
|
|
||||
|
Common stock repurchased
|
(78,316
|
)
|
(37,274
|
)
|
(6,141
|
)
|
||||
|
Debt issuance costs and other items
|
(1,738
|
)
|
(3,775
|
)
|
(11,079
|
)
|
||||
|
Net cash (used in) provided by financing activities from continuing operations
|
(155,115
|
)
|
(185,922
|
)
|
731,485
|
|
||||
|
Cash flows from investing activities from continuing operations:
|
||||||||||
|
Purchases of property and revenue earning equipment
|
(1,860,436
|
)
|
(1,905,157
|
)
|
(2,667,978
|
)
|
||||
|
Sales of revenue earning equipment
|
376,743
|
|
414,249
|
|
423,605
|
|
||||
|
Sales of operating property and equipment
|
52,257
|
|
7,051
|
|
3,891
|
|
||||
|
Acquisitions
|
(7,240
|
)
|
—
|
|
—
|
|
||||
|
Collections on direct finance leases and other items
|
73,172
|
|
76,510
|
|
70,980
|
|
||||
|
Changes in restricted cash
|
(836
|
)
|
1,514
|
|
8,147
|
|
||||
|
Net cash used in investing activities from continuing operations
|
(1,366,340
|
)
|
(1,405,833
|
)
|
(2,161,355
|
)
|
||||
|
Effect of exchange rates on cash
|
(5,539
|
)
|
(9,482
|
)
|
37
|
|
||||
|
Increase (decrease) in cash and cash equivalents from continuing operations
|
20,992
|
|
(215
|
)
|
11,955
|
|
||||
|
Decrease in cash and cash equivalents from discontinued operations
|
(1,445
|
)
|
(1,929
|
)
|
(1,102
|
)
|
||||
|
Increase (decrease) increase in cash and cash equivalents
|
19,547
|
|
(2,144
|
)
|
10,853
|
|
||||
|
Cash and cash equivalents at January 1
|
58,801
|
|
60,945
|
|
50,092
|
|
||||
|
Cash and cash equivalents at December 31
|
$
|
78,348
|
|
58,801
|
|
60,945
|
|
|||
See accompanying notes to consolidated financial statements.
74
RYDER SYSTEM, INC. AND SUBSIDIARIES
CONSOLIDATED STATEMENTS OF SHAREHOLDERS' EQUITY
|
|
Preferred
Stock
|
Common Stock
|
Additional
Paid-In Capital
|
Retained Earnings
|
Accumulated
Other
Comprehensive Loss
|
|
|||||||||||||||||
|
|
Amount
|
Shares
|
Par
|
Total
|
|||||||||||||||||||
|
|
(Dollars in thousands, except share amounts)
|
||||||||||||||||||||||
|
Balance at January 1, 2015
|
$
|
—
|
|
53,039,688
|
|
$
|
26,520
|
|
962,328
|
|
1,450,509
|
|
(620,270
|
)
|
1,819,087
|
|
|||||||
|
Comprehensive income
|
—
|
|
—
|
|
—
|
|
—
|
|
304,768
|
|
(92,465
|
)
|
212,303
|
|
|||||||||
|
Common stock dividends declared and paid—$1.56 per share
|
—
|
|
—
|
|
—
|
|
—
|
|
(83,306
|
)
|
—
|
|
(83,306
|
)
|
|||||||||
|
Common stock issued under employee stock option and stock purchase plans
(1)
|
—
|
|
519,271
|
|
260
|
|
23,292
|
|
—
|
|
—
|
|
23,552
|
|
|||||||||
|
Benefit plan stock purchases
(2)
|
—
|
|
751
|
|
—
|
|
83
|
|
—
|
|
—
|
|
83
|
|
|||||||||
|
Common stock repurchases
|
—
|
|
(69,107
|
)
|
(35
|
)
|
(1,215
|
)
|
(4,891
|
)
|
—
|
|
(6,141
|
)
|
|||||||||
|
Share-based compensation
|
—
|
|
—
|
|
—
|
|
21,181
|
|
—
|
|
—
|
|
21,181
|
|
|||||||||
|
Tax benefits from share-based compensation
|
—
|
|
—
|
|
—
|
|
352
|
|
—
|
|
—
|
|
352
|
|
|||||||||
|
Balance at December 31, 2015
|
—
|
|
53,490,603
|
|
26,745
|
|
1,006,021
|
|
1,667,080
|
|
(712,735
|
)
|
1,987,111
|
|
|||||||||
|
Comprehensive income
|
—
|
|
—
|
|
—
|
|
—
|
|
262,477
|
|
(121,297
|
)
|
141,180
|
|
|||||||||
|
Common stock dividends declared and paid—$1.70 per share
|
—
|
|
—
|
|
—
|
|
—
|
|
(91,100
|
)
|
—
|
|
(91,100
|
)
|
|||||||||
|
Common stock issued under employee stock option and stock purchase plans
(1)
|
—
|
|
507,104
|
|
254
|
|
17,752
|
|
—
|
|
—
|
|
18,006
|
|
|||||||||
|
Benefit plan stock sales
(2)
|
—
|
|
1,709
|
|
1
|
|
80
|
|
—
|
|
—
|
|
81
|
|
|||||||||
|
Common stock repurchases
|
—
|
|
(536,298
|
)
|
(268
|
)
|
(9,968
|
)
|
(27,038
|
)
|
—
|
|
(37,274
|
)
|
|||||||||
|
Share-based compensation
|
—
|
|
—
|
|
—
|
|
18,664
|
|
—
|
|
—
|
|
18,664
|
|
|||||||||
|
Adoption of new accounting standard
|
—
|
|
—
|
|
—
|
|
—
|
|
15,607
|
|
15,607
|
|
|||||||||||
|
Balance at December 31, 2016
|
—
|
|
53,463,118
|
|
26,732
|
|
1,032,549
|
|
1,827,026
|
|
(834,032
|
)
|
2,052,275
|
|
|||||||||
|
Comprehensive income
|
—
|
|
—
|
|
—
|
|
—
|
|
790,558
|
|
126,531
|
|
917,089
|
|
|||||||||
|
Common stock dividends declared and paid—$1.80 per share
|
—
|
|
—
|
|
—
|
|
—
|
|
(95,507
|
)
|
—
|
|
(95,507
|
)
|
|||||||||
|
Common stock issued under employee stock option and stock purchase plans
(1)
|
—
|
|
578,847
|
|
289
|
|
20,200
|
|
—
|
|
—
|
|
20,489
|
|
|||||||||
|
Benefit plan stock sales
(2)
|
—
|
|
250
|
|
—
|
|
19
|
|
—
|
|
—
|
|
19
|
|
|||||||||
|
Common stock repurchases
|
—
|
|
(1,086,901
|
)
|
(543
|
)
|
(20,718
|
)
|
(57,055
|
)
|
—
|
|
(78,316
|
)
|
|||||||||
|
Share-based compensation
|
—
|
|
—
|
|
—
|
|
18,967
|
|
—
|
|
—
|
|
18,967
|
|
|||||||||
|
Balance at December 31, 2017
|
$
|
—
|
|
52,955,314
|
|
$
|
26,478
|
|
1,051,017
|
|
2,465,022
|
|
(707,501
|
)
|
2,835,016
|
|
|||||||
__________________
|
(1)
|
Net of common shares delivered as payment for the exercise price or to satisfy the holders’ withholding tax liability upon exercise of options.
|
|
(2)
|
Represents open-market transactions of common shares by the trustee of Ryder’s deferred compensation plans.
|
See accompanying notes to consolidated financial statements.
75
RYDER SYSTEM, INC. AND SUBSIDIARIES
NOTES TO CONSOLIDATED FINANCIAL STATEMENTS
1.
SUMMARY OF SIGNIFICANT ACCOUNTING POLICIES
Basis of Consolidation and Presentation
The consolidated financial statements include the accounts of Ryder System, Inc. (Ryder) and all entities in which Ryder has a controlling voting interest (“subsidiaries”) and variable interest entities (“VIEs”) where Ryder is determined to be the primary beneficiary. Ryder is deemed to be the primary beneficiary if we have the power to direct the activities that most significantly impact the entity’s economic performance and we share in the significant risks and rewards of the entity. All significant intercompany accounts and transactions have been eliminated in consolidation. Prior year amounts related to consulting fees associated with cost-savings programs have been reclassified to conform to the current period presentation.
Use of Estimates
The preparation of our consolidated financial statements requires management to make estimates and assumptions that affect the amounts reported in the consolidated financial statements and accompanying notes. These estimates are based on management’s best knowledge of historical trends, actions that we may take in the future, and other information available when the consolidated financial statements are prepared. Changes in estimates are recognized in accordance with the accounting rules for the estimate, which is typically in the period when new information becomes available. Areas where the nature of the estimate make it reasonably possible that actual results could materially differ from the amounts estimated include: depreciation and residual value guarantees, employee benefit plan obligations, self-insurance accruals, impairment assessments on long-lived assets (including goodwill and indefinite-lived intangible assets), allowance for accounts receivable, income tax liabilities and contingent liabilities.
Cash Equivalents
Cash equivalents represent cash in excess of current operating requirements invested in short-term, interest-bearing instruments with maturities of three months or less at the date of purchase and are stated at cost.
Revenue Recognition
We recognize revenue when persuasive evidence of an arrangement exists, the services have been rendered to customers or delivery has occurred, the pricing is fixed or determinable, and collectibility is reasonably assured. In our evaluation of whether the price is fixed or determinable, we determine whether the total contract consideration in the arrangement could change based on one or more factors. These factors, which vary among each of our segments, are further discussed below. Generally, the judgments made for these purposes do not materially impact the revenue recognized in any period. Sales tax collected from customers and remitted to the applicable taxing authorities is accounted for on a net basis, with no impact on revenue.
Our judgments on collectibility are initially established when a business relationship with a customer is initiated and is continuously monitored as services are provided. We have a credit rating system based on internally developed standards and ratings provided by third parties. Our credit rating system, along with monitoring for delinquent payments, allows us to make decisions as to whether collectibility may not be reasonably assured. Factors considered during this process include historical payment trends, industry risks, liquidity of the customer, years in business, and judgments, liens or bankruptcies. When collectibility is not considered reasonably assured (typically when a customer is 120 days past due), revenue is not recognized until cash is collected from the customer.
We generate revenue primarily through the lease, rental and maintenance of revenue earning equipment and by providing logistics management and dedicated services. We classify our revenues in one of the following categories:
Lease and rental
Lease and rental includes ChoiceLease and commercial rental revenues from our FMS business segment. We offer a full service lease as well as a lease with more flexible maintenance options under our ChoiceLease product line which are marketed, priced and managed as bundled lease arrangements, and include equipment, service and financing components. We do not offer a stand-alone unbundled finance lease of vehicles. For these reasons, both the lease and service components of our leases are included within lease and rental revenues.
76
RYDER SYSTEM, INC. AND SUBSIDIARIES
NOTES TO CONSOLIDATED FINANCIAL STATEMENTS - (Continued)
Our ChoiceLease arrangements include lease deliverables such as the lease of a vehicle and the executory agreement for the maintenance, insurance, taxes and other services related to the leased vehicles during the lease term. Arrangement consideration is allocated between lease deliverables and non-lease deliverables based on management’s best estimate of the relative fair value of each deliverable. The arrangement consideration allocated to lease deliverables is accounted for pursuant to accounting guidance on leases. Our ChoiceLease arrangements provide for a fixed charge billing and a variable charge billing based on mileage or time usage. Fixed charges are typically billed at the beginning of the month for the services to be provided that month. Variable charges are typically billed a month in arrears. Costs associated with the activities performed under our leasing arrangements are primarily comprised of labor, parts, outside work, depreciation, licenses, insurance, operating taxes and vehicle financing. These costs are expensed as incurred except for depreciation. Refer to “Summary of Significant Accounting Policies – Revenue Earning Equipment, Operating Property and Equipment, and Depreciation” for information regarding our depreciation policies. Non-chargeable maintenance costs have been allocated and reflected within “Cost of lease and rental” based on the maintenance-related labor costs relative to all product lines.
Revenue from ChoiceLease and rental agreements is recognized based on the classification of the arrangement, typically as either an operating or direct financing lease (DFL).
|
•
|
The majority of our leases and all of our rental arrangements are classified as operating leases and, therefore, we recognize lease and commercial rental revenue on a straight-line basis as it becomes receivable over the term of the lease or rental arrangement. Lease and rental agreements do not usually provide for scheduled rent increases or escalations. However, most lease agreements allow for rate changes based upon changes in the Consumer Price Index (CPI). ChoiceLease and rental agreements also provide for vehicle usage charges based on a time charge and/or a fixed per-mile charge. The fixed time charge, the fixed per-mile charge and the changes in rates attributed to changes in the CPI are considered contingent rentals and are not considered fixed or determinable until the effect of CPI changes is implemented or the equipment usage occurs.
|
|
•
|
The non-lease deliverables of our ChoiceLease arrangements are comprised of access to substitute vehicles, emergency road service, and safety services. These services are available to our customers throughout the lease term. Accordingly, revenue is recognized on a straight-line basis over the lease term.
|
|
•
|
Leases not classified as operating leases are generally considered direct financing leases. We recognize revenue for direct financing leases using the effective interest method, which provides a constant periodic rate of return on the outstanding investment on the lease. Cash receipts on impaired direct financing lease receivables are first applied to the direct financing lease receivable and then to any unrecognized income. A direct financing lease receivable is considered impaired, based on current information and events, if it is probable that we will be unable to collect all amounts due according to the contractual terms of the lease.
|
Services
Services include SelectCare and other revenues from our FMS business segment and all DTS and SCS revenues.
Under our SelectCare arrangements, we provide maintenance and repairs required to keep a vehicle in good operating condition, schedule preventive maintenance inspections and provide access to emergency road service and substitute vehicles. The vast majority of our services are routine services performed on a recurring basis throughout the term of the arrangement. From time to time, we provide non-routine major repair services in order to place a vehicle back in service. Revenue from SelectCare contracts is recognized on a straight-line basis as maintenance services are rendered over the terms of the related arrangements.
Through our SelectCare product line, we provide maintenance services to customers who do not choose to lease vehicles from us. SelectCare maintenance arrangements are generally cancelable, without penalty, after one year with 60 days prior written notice. Our maintenance service arrangement provides for a monthly fixed charge and a monthly variable charge based on mileage or time usage. Fixed charges are typically billed at the beginning of the month for the services to be provided that month. Variable charges are typically billed a month in arrears. Most maintenance agreements allow for rate changes based upon changes in the CPI. The fixed per-mile charge and the changes in rates attributed to changes in the CPI are recognized as earned. Costs associated with the activities performed under our maintenance arrangements are primarily comprised of labor, parts and outside work. These costs are expensed as incurred. Non-chargeable maintenance costs have been allocated and reflected within “Cost of services” based on the proportionate maintenance-related labor costs relative to all product lines.
77
RYDER SYSTEM, INC. AND SUBSIDIARIES
NOTES TO CONSOLIDATED FINANCIAL STATEMENTS - (Continued)
Revenue from DTS and SCS service contracts is recognized as services are rendered in accordance with contract terms, which typically include discrete billing rates for the services. In certain contracts, a portion of the contract consideration may be contingent upon the satisfaction of performance criteria, attainment of pain/gain share thresholds or volume thresholds. The contingent portion of the revenue in these arrangements is not considered fixed or determinable until the performance criteria or thresholds have been met. In transportation management arrangements where we act as principal, revenue is reported on a gross basis, without deducting third-party purchased transportation costs. To the extent that we are acting as an agent in the arrangement, revenue is reported on a net basis, after deducting purchased transportation costs.
Fuel
Fuel services include fuel services revenue from our FMS business segment. Revenue from fuel services is recognized when fuel is delivered to customers. Fuel is largely a pass-through to our customers for which we realize minimal changes in profitability during periods of steady market fuel prices. However, profitability may be positively or negatively impacted by sudden increases or decreases in market fuel prices during a short period of time as customer pricing for fuel services is established based on trailing market fuel costs.
Accounts Receivable Allowance
We maintain an allowance for uncollectible customer receivables and an allowance for billing adjustments related to certain discounts and billing corrections. Estimates are updated regularly based on historical experience of bad debts and billing adjustments processed, current collection trends and aging analysis. Accounts are charged against the allowance when determined to be uncollectible.
Inventories
Inventories, which consist primarily of fuel, tires and vehicle parts, are valued using the lower of cost and net realizable value.
Revenue Earning Equipment, Operating Property and Equipment, and Depreciation
Revenue earning equipment, comprised of vehicles and operating property and equipment are initially recorded at cost inclusive of vendor rebates. Revenue earning equipment and operating property and equipment under capital lease are initially recorded at the lower of the present value of minimum lease payments or fair value. Vehicle repairs and maintenance that extend the life or increase the value of a vehicle are capitalized, whereas ordinary maintenance and repairs (including tire replacement or repair) are expensed as incurred. Direct costs incurred in connection with developing or obtaining internal-use software are capitalized. Costs incurred during the preliminary software development project stage, as well as maintenance and training costs, are expensed as incurred.
Leasehold improvements are depreciated over the shorter of their estimated useful lives or the term of the related lease, which may include one or more option renewal periods where failure to exercise such options would result in an economic penalty in such amount that renewal appears, at the inception of the lease, to be reasonably assured. If a substantial additional investment is made in a leased property during the term of the lease, we re-evaluate the lease term to determine whether the investment, together with any penalties related to non-renewal, would constitute an economic penalty in such amount that renewal appears to be reasonably assured.
Provision for depreciation is computed using the straight-line method on all depreciable assets. Depreciation expense has been recognized throughout the Consolidated Statement of Earnings depending on the nature of the related asset. We periodically review and adjust, as appropriate, the residual values and useful lives of revenue earning equipment. Our review of the residual values and useful lives of revenue earning equipment is established with a long-term view considering historical market price changes, current and expected future market price trends, expected lives of vehicles and extent of alternative uses. Factors that could cause actual results to materially differ from estimates include, but are not limited to, unforeseen changes in technology innovations. In addition, we also monitor market trends throughout the year and assess residual values of vehicles expected to be sold in the near term and may adjust residual values for these vehicles.
We routinely dispose of used revenue earning equipment as part of our FMS business. Revenue earning equipment held for sale is stated at the lower of carrying amount or fair value less costs to sell. For revenue earning equipment held for sale, we stratify our fleet by vehicle type (trucks, tractors and trailers), weight class, age and other relevant characteristics and create classes of similar assets for analysis purposes. Fair value is determined based upon recent market prices obtained from our own sales experience for sales of each class of similar assets and vehicle condition, as well as anticipated market price changes. Losses on vehicles held for sale for which carrying values exceeded fair value are recognized at the time they arrive at our used truck centers and are presented within "Used vehicle sales, net" in the Consolidated Statements of Earnings.
Gains and losses on sales of operating property and equipment are reflected in “Miscellaneous income, net.”
78
RYDER SYSTEM, INC. AND SUBSIDIARIES
NOTES TO CONSOLIDATED FINANCIAL STATEMENTS - (Continued)
Goodwill and Other Intangible Assets
Goodwill on acquisitions represents the excess of the purchase price over the fair value of the underlying acquired net tangible and intangible assets. Factors that contribute to the recognition of goodwill in our acquisitions include (i) expected growth rates and profitability of the acquired companies, (ii) securing buyer-specific synergies that increase revenue and profits and are not otherwise available to market participants, (iii) significant cost savings opportunities, (iv) experienced workforce and (v) our strategies for growth in sales, income and cash flows.
Goodwill and other intangible assets with indefinite useful lives are not amortized, but rather, are tested for impairment at least annually. We have historically performed the annual impairment test as of April 1 for all of our reporting units. During the three months ended December 31, 2017, we elected to change our annual impairment assessment date from April 1 to October 1 for all of our reporting units. We believe this change, which represents a change in method of applying an accounting principle, is preferable under our circumstances. The change was made to align the annual goodwill impairment test date with our strategic and business plan time lines and to reduce the risk that an interim impairment triggering event might occur between the annual goodwill impairment test date and the year-end balance sheet date.
In evaluating goodwill for impairment, we have the option to first assess qualitative factors to determine whether further impairment testing is necessary. Among other relevant events and circumstances that affect the fair value of reporting units, we consider individual factors such as macroeconomic conditions, changes in our industry and the markets in which we operate, as well as our reporting units' historical and expected future financial performance. Prior to January 1, 2017, if we concluded that it is more likely than not that a reporting unit's fair value is less than its carrying value, recoverability of goodwill was evaluated using a two-step process. The first step involved a comparison of the fair value of each of our reporting units with its carrying amount. If a reporting unit’s carrying amount exceeded its fair value, the second step was performed. The second step involved a comparison of the implied fair value and carrying value of that reporting unit’s goodwill. To the extent that a reporting unit’s carrying amount exceeded the implied fair value of its goodwill, an impairment loss was recognized.
Effective January 1, 2017, we prospectively adopted the provisions of ASU 2017-04,
Simplifying the Test for Goodwill Impairment (Topic 350),
which
eliminates the second step of the goodwill impairment test. Therefore, for goodwill impairment tests occurring after January 1, 2017, if the carrying value of a reporting unit exceeds its fair value, we will measure any goodwill impairment losses as the amount by which the carrying amount of a reporting unit exceeds its fair value, not to exceed the total amount of goodwill allocated to that reporting unit.
Our valuation of fair value for certain reporting units is determined based on a discounted future cash flow model that uses five years of projected cash flows and a terminal value based on growth assumptions. For certain reporting units, fair value is determined based on the application of current trading multiples for comparable publicly-traded companies and the historical pricing multiples for comparable merger and acquisition transactions that have occurred in our industry. Rates used to discount cash flows are dependent upon interest rates and the cost of capital based on our industry and capital structure, adjusted for equity and size risk premiums based on market capitalization. Estimates of future cash flows are dependent on our knowledge and experience about past and current events and assumptions about conditions we expect to exist, including long-term growth rates, capital requirements and useful lives. Our estimates of cash flows are also based on historical and future operating performance, economic conditions and actions we expect to take. In addition to these factors, our DTS and SCS reporting units are dependent on several key customers or industry sectors. The loss of a key customer may have a significant impact to our DTS or SCS reporting units, causing us to assess whether or not the event resulted in a goodwill impairment loss.
In making our assessments of fair value, we rely on our knowledge and experience about past and current events and assumptions about conditions we expect to exist in the future. These assumptions are based on a number of factors, including future operating performance, economic conditions, actions we expect to take and present value techniques. There are inherent uncertainties related to these factors and management’s judgment in applying them to the analysis of goodwill impairment. It is possible that assumptions underlying the impairment analysis will change in such a manner that impairment in value may occur in the future.
Identifiable intangible assets not subject to amortization are assessed for impairment using a similar process used to evaluate goodwill as described above. Intangible assets with finite lives are amortized over their respective estimated useful lives. Identifiable intangible assets that are subject to amortization are evaluated for impairment using a similar process used to evaluate long-lived assets described below.
79
RYDER SYSTEM, INC. AND SUBSIDIARIES
NOTES TO CONSOLIDATED FINANCIAL STATEMENTS - (Continued)
Impairment of Long-Lived Assets Other than Goodwill
Long-lived assets held and used, including revenue earning equipment, operating property and equipment and intangible assets with finite lives, are tested for recoverability when circumstances indicate that the carrying amount of assets may not be recoverable. Recoverability of long-lived assets is evaluated by comparing the carrying value of an asset or asset group to management’s best estimate of the undiscounted future operating cash flows (excluding interest charges) expected to be generated by the asset or asset group. If these comparisons indicate that the carrying value of the asset or asset group is not recoverable, an impairment loss is recognized for the amount by which the carrying value of the asset or asset group exceeds fair value. Fair value is determined by a quoted market price, if available, or an estimate of projected future operating cash flows, discounted using a rate that reflects the related operating segment’s average cost of funds. Long-lived assets to be disposed of, including revenue earning equipment, operating property and equipment and indefinite-lived intangible assets, are reported at the lower of carrying amount or fair value less costs to sell.
Self-Insurance Accruals
We retain a portion of the accident risk under auto liability, workers’ compensation and other insurance programs. Under our insurance programs, we retain the risk of loss in various amounts, generally up to
$3 million
on a per occurrence basis. Self-insurance accruals are based primarily on an actuarially estimated, undiscounted cost of claims, which includes claims incurred but not reported. Such liabilities are based on estimates. Historical loss development factors are utilized to project the future development of incurred losses, and these amounts are adjusted based upon actual claim experience and settlements. While we believe that the amounts are adequate, there can be no assurance that changes to our actuarial estimates may not occur due to limitations inherent in the estimation process. Changes in the actuarial estimates of these accruals are charged or credited to earnings in the period determined. Amounts estimated to be paid within the next year have been classified as “Accrued expenses and other current liabilities” with the remainder included in “Other non-current liabilities” in our Consolidated Balance Sheets.
We also maintain additional insurance at certain amounts in excess of our respective underlying retention. Amounts recoverable from insurance companies are not offset against the related accrual as our insurance policies do not extinguish or provide legal release from the obligation to make payments related to such risk-related losses. Amounts expected to be received within the next year from insurance companies have been included within “Receivables, net” with the remainder included in “Direct financing leases and other assets” and are recognized only when realization of the claim for recovery is considered probable. The accrual for the related claim has been classified within “Accrued expenses and other current liabilities” if it is estimated to be paid within the next year, otherwise it has been classified in “Other non-current liabilities” in our Consolidated Balance Sheets.
Income Taxes
Our provision for income taxes is based on reported earnings before income taxes. Deferred taxes are recognized for the future tax effects of temporary differences between the financial statement carrying amounts of existing assets and liabilities and their respective tax bases, using tax rates in effect for the years in which the differences are expected to reverse.
The effects of changes in tax laws on deferred tax balances are recognized in the period the new legislation is enacted. Valuation allowances are recognized to reduce deferred tax assets to the amount that is more likely than not to be realized. In assessing the likelihood of realization, management considers estimates of future taxable income. We calculate our current and deferred tax position based on estimates and assumptions that could differ from the actual results reflected in income tax returns filed in subsequent years. Adjustments based on filed returns are recorded when identified.
We are subject to tax audits in numerous jurisdictions in the U.S. and around the world. Tax audits by their very nature are often complex and can require several years to complete. In the normal course of business, we are subject to challenges from the Internal Revenue Service (IRS) and other tax authorities regarding amounts of taxes due. These challenges may alter the timing or amount of taxable income or deductions, or the allocation of income among tax jurisdictions. As part of our calculation of the provision for income taxes on earnings, we determine whether the benefits of our tax positions are at least more likely than not of being sustained upon audit based on the technical merits of the tax position. The tax benefit to be recognized is measured as the largest amount of benefit that is greater than fifty percent likely of being realized upon ultimate settlement. Such accruals require management to make estimates and judgments with respect to the ultimate outcome of a tax audit. Actual results could vary materially from these estimates. We adjust these reserves as well as the impact of any related interest and penalties in light of changing facts and circumstances, such as the progress of a tax audit.
80
RYDER SYSTEM, INC. AND SUBSIDIARIES
NOTES TO CONSOLIDATED FINANCIAL STATEMENTS - (Continued)
Interest and penalties related to income tax exposures are recognized as incurred and included in “(Benefits from) provision for income taxes” in our Consolidated Statements of Earnings. Accruals for income tax exposures, including penalties and interest, expected to be settled within the next year are included in “Accrued expenses and other current liabilities” with the remainder included in “Other non-current liabilities” in our Consolidated Balance Sheets. The federal benefit from state income tax exposures is included in “Deferred income taxes” in our Consolidated Balance Sheets.
Severance and Contract Termination Costs
We recognize liabilities for severance and contract termination costs based upon the nature of the cost to be incurred. For involuntary separation plans that are completed within the guidelines of our written involuntary separation plan, we recognize the liability when it is probable and reasonably estimable. For one-time termination benefits, such as additional severance pay or benefit payouts, and other exit costs, such as contract termination costs, the liability is measured and recognized initially at fair value in the period in which the liability is incurred, with subsequent changes to the liability recognized as adjustments in the period of change. Severance related to position eliminations that are part of a restructuring plan is included in "Restructuring charges and fees, net” in the Consolidated Statements of Earnings. Severance costs that are not part of a restructuring plan are recognized in the period incurred as a direct cost of revenue or within “Selling, general and administrative expenses,” in the Consolidated Statements of Earnings depending upon the nature of the eliminated position.
Environmental Expenditures
We recognize liabilities for environmental assessments and/or cleanup when it is probable a loss has been incurred and the costs can be reasonably estimated. Environmental liability estimates may include costs such as anticipated site testing, consulting, remediation, disposal, post-remediation monitoring and legal fees, as appropriate. The liability does not reflect possible recoveries from insurance companies or reimbursement of remediation costs by state agencies, but does include estimates of cost sharing with other potentially responsible parties. Estimates are not discounted, as the timing of the anticipated cash payments is not fixed or readily determinable. Subsequent adjustments to initial estimates are recognized as necessary based upon additional information developed in subsequent periods. In future periods, new laws or regulations, advances in remediation technology and additional information about the ultimate remediation methodology to be used could significantly change our estimates. Claims for reimbursement of remediation costs are recognized when recovery is deemed probable.
Derivative Instruments and Hedging Activities
We use financial instruments, including forward exchange contracts and swaps to manage our exposures to movements in interest rates and foreign currency exchange rates. The use of these financial instruments modifies the exposure of these risks with the intent to reduce the risk or cost to us. We do not enter into derivative financial instruments for trading purposes. We limit our risk that counterparties to the derivative contracts will default and not make payments by entering into derivative contracts only with counterparties comprised of large banks and financial institutions that meet established credit criteria. We do not expect to incur any losses as a result of counterparty default.
On the date a derivative contract is executed, we formally document, among other items, the intended hedging designation and relationship, along with the risk management objectives and strategies for entering into the derivative contract. We also formally assess, both at inception and on an ongoing basis, whether the derivatives we used in hedging transactions are highly effective in offsetting changes in fair values or cash flows of hedged items. Cash flows from derivatives that are accounted for as hedges are classified in the Consolidated Statements of Cash Flows in the same category as the items being hedged. When it is determined that a derivative is not highly effective as a hedge or that it has ceased to be a highly effective hedge, we discontinue hedge accounting prospectively.
The hedging designation may be classified as one of the following:
No Hedging Designation.
The unrealized gain or loss on a derivative instrument not designated as an accounting hedging instrument is recognized immediately in earnings.
Fair Value Hedge.
A hedge of a recognized asset or liability or an unrecognized firm commitment is considered a fair value hedge. For fair value hedges, both the effective and ineffective portions of the changes in the fair value of the derivative, along with the gain or loss on the hedged item that is attributable to the hedged risk, are both recognized in earnings.
Cash Flow Hedge.
A hedge of a forecasted transaction or of the variability of cash flows to be received or paid related to a recognized asset or liability is considered a cash flow hedge. The effective portion of the change in the fair value of a derivative that is declared as a cash flow hedge is recognized net of tax in “Accumulated other comprehensive loss” until earnings are affected by the variability in cash flows of the designated hedged item.
81
RYDER SYSTEM, INC. AND SUBSIDIARIES
NOTES TO CONSOLIDATED FINANCIAL STATEMENTS - (Continued)
Net Investment Hedge
. A hedge of a net investment in a foreign operation is considered a net investment hedge. The effective portion of the change in the fair value of the derivative used as a net investment hedge of a foreign operation is recognized in the currency translation adjustment account within “Accumulated other comprehensive loss.” The ineffective portion, if any, on the hedged item that is attributable to the hedged risk is recognized in earnings and reported in “Miscellaneous income, net” in the Consolidated Statements of Earnings.
Foreign Currency Translation
Our foreign operations generally use local currency as their functional currency. Assets and liabilities of these operations are translated at the exchange rates in effect on the balance sheet date. Items in the Consolidated Statements of Earnings are translated at the average exchange rates for the year. The impact of currency fluctuations is presented in “Changes in cumulative translation adjustment and other” in the Consolidated Statements of Comprehensive Income. Upon sale or upon complete or substantially complete liquidation of an investment in a foreign operation, the currency translation adjustment attributable to that operation is removed from accumulated other comprehensive loss and is reported as part of the gain or loss on sale or liquidation of the investment for the period during which the sale or liquidation occurs. Gains and losses resulting from foreign currency transactions are recognized in “Miscellaneous income, net” in the Consolidated Statements of Earnings.
Share-Based Compensation
The fair value of stock option awards and nonvested stock awards other than restricted stock units (RSUs), is expensed on a straight-line basis over the vesting period of the awards. RSUs are expensed in the year they are granted. Windfall tax benefits and tax shortfalls are charged directly to income tax expense.
Earnings Per Share
Earnings per share is computed using the two-class method. The two-class method of computing earnings per share is an earnings allocation formula that determines earnings per share for common stock and any participating securities according to dividends declared (whether paid or unpaid) and participation rights in undistributed earnings. Restricted stock units are considered participating securities since the share-based awards contain a non-forfeitable right to dividend equivalents irrespective of whether the awards ultimately vest. Under the two-class method, earnings per common share are computed by dividing the sum of distributed earnings to common shareholders and undistributed earnings allocated to common shareholders by the weighted average number of common shares outstanding for the period. In applying the two-class method, undistributed earnings are allocated to both common shares and participating securities based on the weighted average shares outstanding during the period.
Diluted earnings per common share reflect the dilutive effect of potential common shares from stock options and other nonparticipating nonvested stock. The dilutive effect of stock options is computed using the treasury stock method, which assumes any proceeds that could be obtained upon the exercise of stock options would be used to purchase common shares at the average market price for the period. The assumed proceeds include the purchase price the grantee pays and the unrecognized compensation expense at the end of each period.
Share Repurchases
Repurchases of shares of common stock are made periodically in open-market transactions and are subject to market conditions, legal requirements and other factors. The cost of share repurchases is allocated between common stock and retained earnings based on the amount of additional paid-in capital at the time of the share repurchase.
Defined Benefit Pension and Postretirement Benefit Plans
The funded status of our defined benefit pension plans and postretirement benefit plans are recognized in the Consolidated Balance Sheets. The funded status is measured as the difference between the fair value of plan assets and the benefit obligation at December 31, the measurement date. The fair value of plan assets represents the current market value of contributions made to irrevocable trusts, held for the sole benefit of participants, which are invested by the trusts. For defined benefit pension plans, the benefit obligation represents the actuarial present value of benefits expected to be paid upon retirement based on estimated future compensation levels. For postretirement benefit plans, the benefit obligation represents the actuarial present value of postretirement benefits attributed to employee services already rendered. Overfunded plans, with the fair value of plan assets exceeding the benefit obligation, are aggregated and reported as a prepaid pension asset. Underfunded plans, with the benefit obligation exceeding the fair value of plan assets, are aggregated and reported as a pension and postretirement benefit liability.
82
RYDER SYSTEM, INC. AND SUBSIDIARIES
NOTES TO CONSOLIDATED FINANCIAL STATEMENTS - (Continued)
The current portion of pension and postretirement benefit liabilities represents the actuarial present value of benefits payable within the next year exceeding the fair value of plan assets (if funded), measured on a plan-by-plan basis. These liabilities are recognized in “Accrued expenses and other current liabilities” in the Consolidated Balance Sheets.
Pension and postretirement benefit expense includes service cost, interest cost, expected return on plan assets (if funded). Pension costs include amortization of net prior service costs loss and net actuarial loss. Postretirement costs include amortization of net prior service credit and net actuarial gain. Service cost represents the actuarial present value of participant benefits earned in the current year. The expected return on plan assets represents the average rate of earnings expected on the funds invested or to be invested to provide for the benefits included in the obligation. Prior service credit represents the impact of negative plan amendments. Net actuarial losses arise as a result of differences between actual experience and assumptions or as a result of changes in actuarial assumptions. Net actuarial loss and prior service credit not recognized as a component of pension and postretirement benefit expense as they arise are recognized as "Change in net actuarial loss and prior service credit, net of tax" in the Consolidated Statements of Comprehensive Income. These pension and postretirement items are subsequently amortized as a component of pension and postretirement benefit expense over the remaining service period, if the majority of the employees are active, otherwise over the remaining life expectancy, provided such amounts exceed thresholds based upon the benefit obligation or the value of plan assets.
The measurement of benefit obligations and pension and postretirement benefit expense is based on estimates and assumptions approved by management. These valuations reflect the terms of the plans and use participant-specific information such as compensation, age and years of service, as well as certain assumptions, including estimates of discount rates, expected return on plan assets, rate of compensation increases, interest rates and mortality rates.
Fair Value Measurements
We carry various assets and liabilities at fair value in the Consolidated Balance Sheets. The most significant assets and liabilities are vehicles held for sale, which are stated at the lower of carrying amount or fair value less costs to sell, investments held in Rabbi Trusts and derivatives.
Fair value is defined as the exchange price that would be received for an asset or paid to transfer a liability (an exit price) in the principal or most advantageous market for the asset or liability in an orderly transaction between market participants on the measurement date. Fair value measurements are classified based on the following fair value hierarchy:
|
Level 1
|
Quoted prices (unadjusted) in active markets for identical assets or liabilities that we have the ability to access at the measurement date. An active market for the asset or liability is a market in which transactions for the asset or liability occur with sufficient frequency and volume to provide pricing information on an ongoing basis.
|
|
Level 2
|
Observable inputs other than Level 1 prices such as quoted prices for similar assets or liabilities; quoted prices in markets that are not active; or model-derived valuations or other inputs that are observable or can be corroborated by observable market data for substantially the full term of the assets or liabilities.
|
|
Level 3
|
Unobservable inputs for the asset or liability. These inputs reflect our own assumptions about the assumptions a market participant would use in pricing the asset or liability.
|
When available, we use unadjusted quoted market prices to measure fair value and classify such measurements within Level 1. If quoted prices are not available, fair value is based upon model-driven valuations that use current market-based or independently sourced market parameters such as interest rates and currency rates. Items valued using these models are classified according to the lowest level input or value driver that is significant to the valuation.
The carrying amounts reported in the Consolidated Balance Sheets for cash and cash equivalents, accounts receivable and accounts payable approximate fair value due to the immediate or short-term maturities of these financial instruments. Revenue earning equipment held for sale is measured at fair value on a nonrecurring basis and is stated at the lower of carrying amount or fair value less costs to sell. Investments held in Rabbi Trusts and derivatives are carried at fair value on a recurring basis. Investments held in Rabbi Trusts include exchange-traded equity securities and mutual funds. Fair values for these investments are based on quoted prices in active markets. For derivatives, fair value is based on model-driven valuations using the LIBOR rate or observable forward foreign exchange rates, which are observable at commonly quoted intervals for the full term of the financial instrument.
83
RYDER SYSTEM, INC. AND SUBSIDIARIES
NOTES TO CONSOLIDATED FINANCIAL STATEMENTS - (Continued)
2.
RECENT ACCOUNTING PRONOUNCEMENTS
Derivatives and Hedging
In August 2017, the Financial Accounting Standards Board (FASB) issued Accounting Standards Update (ASU) No. 2017-12,
Derivatives and Hedging (Topic 815)
, which simplifies and clarifies the accounting and disclosure for hedging activities by more closely aligning the results of cash flow and fair value hedge accounting with the risk management activities of an entity. The amendments in this update are effective for annual periods, and interim periods within those annual periods, beginning after December 15, 2018, with early adoption permitted. We do not expect this standard to have an impact on our consolidated financial position, results of operations or cash flows.
Share-Based Compensation
In May 2017, the FASB issued ASU No. 2017-09,
Compensation - Stock Compensation (Topic 718): Scope of Modification Accounting
, which clarifies when changes to the terms or conditions of a share-based payment award must be accounted for as modifications. The amendments in this update are effective for annual periods, and interim periods within those annual periods, beginning after December 15, 2017, with early adoption permitted. We will adopt the standard as of January 1, 2018, on a prospective basis. We do not expect this standard to have an impact on our consolidated financial position, results of operations or cash flows.
Employee Benefits Plans
In March 2017, the FASB issued ASU No. 2017-07,
Compensation-Retirement Benefits (Topic 715), Improving the Presentation of Net Periodic Pension Cost and Net Periodic Postretirement Benefit Cost
, which requires an employer to report the service cost component in the same line item or items as other compensation costs arising from services rendered by the pertinent employees during the period. The other components of net benefit cost are required to be presented in the income statement separately from the service cost component and outside a subtotal of income from operations. The standard is effective January 1, 2018, with early adoption as of January 1, 2017 permitted. We adopted the standard during the first quarter of 2017 and recorded the other components of net benefit cost within "Non-operating pension costs" in the Consolidated Statements of Earnings for both the current and prior year periods.
Intangibles - Goodwill and Other
In January 2017, the FASB issued ASU No. 2017-04,
Simplifying the Test for Goodwill Impairment (Topic 350)
, which requires an entity to perform a one-step quantitative impairment test, whereby a goodwill impairment loss will be measured as the excess of a reporting unit’s carrying amount over its fair value (not to exceed the total goodwill allocated to that reporting unit). It eliminates the current two-step goodwill impairment test, under which a goodwill impairment loss is measured by comparing the implied fair value of a reporting unit’s goodwill with the carrying amount of that goodwill. The standard is effective January 1, 2020, with early adoption as of January 1, 2017 permitted. We adopted the standard during the first quarter of 2017 and it did not have an impact on our consolidated financial position, results of operations or cash flows.
Statement of Cash Flows
In August 2016, the FASB issued ASU No. 2016-15,
Statement of Cash Flows (Topic 230),
which clarifies how companies present and classify certain cash receipts and cash payments in the statement of cash flows. In November 2016, the FASB issued additional guidance related to the statement of cash flows, which requires companies to explain the change during the period in the total of cash, cash equivalents, and restricted cash or restricted cash equivalents. The standard is effective January 1, 2018, with early adoption permitted. We will adopt the standard as of January 1, 2018, on a retrospective basis. We do not expect this standard to have a material impact on the presentation of our consolidated cash flows.
84
RYDER SYSTEM, INC. AND SUBSIDIARIES
NOTES TO CONSOLIDATED FINANCIAL STATEMENTS - (Continued)
Leases
In February 2016, the FASB issued ASU No. 2016-02,
Leases (Topic 842),
which sets out the principles for the recognition, measurement, presentation and disclosure of leases. The standard requires lessees to classify leases as either finance or operating leases. This classification will determine whether the related expense will be recognized based on asset amortization and interest on the obligation or on a straight-line basis over the term of the lease. A lessee is also required to record a right-of-use asset and a lease liability for all leases with a term of greater than 12 months regardless of their classification. Leases with a term of 12 months or less will be accounted for similar to existing guidance for operating leases. We do not expect the lessee requirements to have a material impact on our consolidated financial position, results of operations or cash flows.
The new standard continues to require lessors to separate the lease component from the non-lease component; however, it provides clarification on the scope of non-lease components (e.g., maintenance services). The new standard also provides more guidance on how to identify and separate the components. The lease component will be accounted for using an approach that is substantially equivalent to existing guidance for sales-type leases, direct financing leases and operating leases. The non-lease component will be accounted for in accordance with the revenue recognition guidance, see below section "Revenue Recognition." The adoption of the new lease standard will primarily impact our ChoiceLease product line, which includes a vehicle lease as well as maintenance and other services related to the vehicle. We will generally continue to recognize revenue for the lease portion of the product line on a straight-line basis. Revenue from maintenance services will be recognized at the time the maintenance services are performed, which will generally require the deferral of some portion of the customer's lease payments when received, as maintenance services are not performed evenly over the life of a ChoiceLease contract.
We will adopt the standard effective January 1, 2019, using the modified retrospective transition method. Upon adoption, we will record a cumulative-effect adjustment to recognize deferred revenue related to the maintenance services on the opening balance sheet for 2017 and restate all prior periods presented (2017 and 2018). We expect the cumulative-effect adjustment will have a significant impact on our consolidated financial position. We continue to evaluate the impact of adoption of this standard on our results of operations. We do not expect the adoption of this standard to have an impact on our cash flows.
Revenue Recognition
In May 2014, the FASB issued ASU No. 2014-09,
Revenue from Contracts with Customers (Topic 606)
, which together with related, subsequently issued guidance, requires an entity to recognize the amount of revenue to which it expects to be entitled for the transfer of promised goods or services to customers. We will adopt the revenue standard on January 1, 2018, using the full retrospective transition method.
This standard will primarily impact lease revenue from our ChoiceLease product line, specifically the non-lease component (primarily maintenance services). However, we will continue to apply the existing lease accounting guidance to our lease revenue, which includes maintenance revenue as a part of the lease, until the adoption of the lease standard on January 1, 2019.
With respect to other revenue sources, we completed our final assessment of the impact, including the timing of recognition of variable consideration, principal versus agent considerations and accounting for costs to obtain and fulfill contracts. The adoption of this standard on these items and as it relates to revenue sources other than the maintenance component of our ChoiceLease product line will not have a material impact on our consolidated financial position or results of operations. The adoption of this standard will have no effect on our cash flows.
3.
ACQUISITIONS
On September 29, 2017, we completed the acquisition of Dallas Service Center, Inc., an independent truck repair facility, for a purchase price of approximately $
8 million
, net of cash acquired, which includes $
0.8 million
in contingent consideration to be paid to the seller provided certain conditions are met.
85
RYDER SYSTEM, INC. AND SUBSIDIARIES
NOTES TO CONSOLIDATED FINANCIAL STATEMENTS - (Continued)
4.
RESTRUCTURING CHARGES AND FEES, NET
In the fourth quarters of
2017
,
2016
and
2015
, we approved plans to reduce our workforce in multiple locations as a result of cost containment actions, resulting in charges of
$13 million
,
$5 million
and
$9 million
in each of the respective years. In addition, in the fourth quarter of
2015
, we committed to a plan to divest our Ryder Canadian Retail Shippers Association Logistics (CRSAL) operations and shutdown our Ryder Container Terminals (RCT) business in Canada. We recognized charges for employee termination costs of
$3 million
and asset impairment of
$2 million
to adjust assets held for sale, including goodwill and intangible assets, to fair value less costs to sell. We sold CRSAL to a third party for approximately
$2 million
during
2016
.
The following table summarizes the activities within, and components of, restructuring liabilities for
2017
,
2016
and
2015
(in thousands):
|
|
Employee Termination Costs
|
|||
|
Balance as of December 31, 2014
|
$
|
2,486
|
|
|
|
Workforce reduction charges
|
8,830
|
|
||
|
CRSAL divestiture and RCT shut-down
|
3,225
|
|
||
|
Utilization
(1)
|
(2,208
|
)
|
||
|
Balance as of December 31, 2015
|
12,333
|
|
||
|
Workforce reduction charges
|
5,074
|
|
||
|
Utilization
(1)
|
(10,129
|
)
|
||
|
Balance as of December 31, 2016
|
7,278
|
|
||
|
Workforce reduction charges
|
13,320
|
|
||
|
Utilization
(1)
|
(7,524
|
)
|
||
|
Balance as of December 31, 2017
(2)
|
$
|
13,074
|
|
|
_________________
Note: The restructuring liabilities shown above are included in "Accrued expenses and other current liabilities" in the Consolidated Balance Sheets.
(1) Principally represents cash payments.
(2) The majority of the balance remaining for employee termination costs is expected to be paid by the end of 2018.
As discussed in
Note 28
, “
Segment Reporting
,” our primary measure of segment financial performance excludes, among other items, restructuring charges and fees, net. However, the applicable portion of the restructuring charges and fees, net that related to each segment in
2017
,
2016
and
2015
were as follows:
|
|
Years ended December 31,
|
|||||||||
|
|
2017
|
2016
|
2015
|
|||||||
|
|
(In thousands)
|
|||||||||
|
Fleet Management Solutions
|
$
|
2,995
|
|
3,550
|
|
4,817
|
|
|||
|
Dedicated Transportation Solutions
|
771
|
|
22
|
|
250
|
|
||||
|
Supply Chain Solutions
|
2,278
|
|
278
|
|
7,033
|
|
||||
|
Central Support Services
|
15,361
|
|
1,224
|
|
5,968
|
|
||||
|
Total
|
$
|
21,405
|
|
5,074
|
|
18,068
|
|
|||
During
2017
and
2015
, we also incurred charges of
$11 million
and
$4 million
, respectively, related to consulting fees associated with cost-savings programs and during
2017
we recognized restructuring credits of
$3 million
related to the gains on sales of certain UK facilities that were closed as part of prior year restructuring activities. All of these items were included within "Restructuring charges and fees, net" in our Consolidated Statement of Earnings.
86
RYDER SYSTEM, INC. AND SUBSIDIARIES
NOTES TO CONSOLIDATED FINANCIAL STATEMENTS - (Continued)
5.
RECEIVABLES
|
|
December 31,
|
||||||
|
|
2017
|
2016
|
|||||
|
|
(In thousands)
|
||||||
|
Trade
|
$
|
898,876
|
|
739,743
|
|
||
|
Direct financing leases
|
81,996
|
|
76,322
|
|
|||
|
Other, primarily warranty and insurance
|
43,883
|
|
30,797
|
|
|||
|
1,024,755
|
|
846,862
|
|
||||
|
Allowance
|
(13,847
|
)
|
(14,915
|
)
|
|||
|
Total
|
$
|
1,010,908
|
|
831,947
|
|
||
6.
PREPAID EXPENSES AND OTHER CURRENT ASSETS
|
|
December 31,
|
||||||
|
|
2017
|
2016
|
|||||
|
|
(In thousands)
|
||||||
|
Restricted cash
|
$
|
4,674
|
|
3,838
|
|
||
|
Prepaid vehicle licenses
|
62,772
|
|
50,343
|
|
|||
|
Prepaid operating taxes
|
14,320
|
|
20,242
|
|
|||
|
Prepaid sales commission
|
12,988
|
|
9,731
|
|
|||
|
Prepaid insurance
|
15,688
|
|
12,074
|
|
|||
|
Start-up costs
|
8,001
|
|
5,284
|
|
|||
|
Other
|
41,040
|
|
39,768
|
|
|||
|
Total
|
$
|
159,483
|
|
141,280
|
|
||
7.
REVENUE EARNING EQUIPMENT
|
|
Estimated
Useful
Lives
|
December 31, 2017
|
December 31, 2016
|
||||||||||||||||||
|
Cost
|
Accumulated
Depreciation
|
Net
(1)
|
Cost
|
Accumulated
Depreciation
|
Net
(1)
|
||||||||||||||||
|
(In years)
|
(In thousands)
|
||||||||||||||||||||
|
Held for use:
|
|||||||||||||||||||||
|
ChoiceLease
|
3 — 12
|
$
|
10,002,981
|
|
(3,367,431
|
)
|
6,635,550
|
|
9,486,977
|
|
(3,031,937
|
)
|
6,455,040
|
|
|||||||
|
Commercial rental
|
4.5 — 12
|
2,616,706
|
|
(1,001,965
|
)
|
1,614,741
|
|
2,499,010
|
|
(935,346
|
)
|
1,563,664
|
|
||||||||
|
Held for sale
|
403,229
|
|
(298,258
|
)
|
104,971
|
|
494,355
|
|
(365,337
|
)
|
129,018
|
|
|||||||||
|
Total
|
$
|
13,022,916
|
|
(4,667,654
|
)
|
8,355,262
|
|
12,480,342
|
|
(4,332,620
|
)
|
8,147,722
|
|
||||||||
_______________
|
(1)
|
Revenue earning equipment, net includes vehicles under capital leases of
$29 million
, less accumulated depreciation of
$14 million
, at
December 31, 2017
and
$43 million
, less accumulated depreciation of
$22 million
, at
December 31, 2016
.
|
Depreciation expense was
$1.16 billion
,
$1.10 billion
and
$1.04 billion
in
2017
,
2016
and
2015
, respectively.
In
2017
, based on current and expected market conditions, we accelerated depreciation on certain classes of vehicles expected to be made available for sale through June 2019. The impact of the change increased depreciation by $
21 million
in
2017
.
In 2016, based on current and expected market conditions, we accelerated depreciation on certain classes of vehicles expected to be made available for sale through June 2018. The impact of the change increased depreciation by
$10 million
in
2016
.
87
RYDER SYSTEM, INC. AND SUBSIDIARIES
NOTES TO CONSOLIDATED FINANCIAL STATEMENTS - (Continued)
Revenue earning equipment held for sale is stated at the lower of net book value or fair value less costs to sell. Losses on vehicles held for sale for which carrying values exceeded fair value are recognized at the time they arrive at our used truck centers and are presented within "Used vehicle sales, net" in the Consolidated Statements of Earnings. For revenue earning equipment held for sale, we stratify our fleet by vehicle type (trucks, tractors and trailers), weight class, age and other relevant characteristics and create classes of similar assets for analysis purposes. For a certain population of revenue earning equipment held for sale, fair value was determined based upon recent market prices obtained from our own sales experience for sales of each class of similar assets and vehicle condition. Expected declines in market prices were also considered when valuing the vehicles held for sale. These vehicles held for sale were classified within Level 3 of the fair value hierarchy. During
2017
,
2016
, and
2015
, we recognized losses to reflect changes in fair value of
$58 million
,
$67 million
and
$18 million
, respectively.
The following table presents our assets that are measured at fair value on a nonrecurring basis and considered a Level 3 fair value measurement:
|
|
Total Losses
(2)
|
|||||||||||||
|
December 31,
|
Year ended December 31,
|
|||||||||||||
|
|
2017
|
2016
|
2017
|
2016
|
||||||||||
|
Assets held for sale:
|
(In thousands)
|
(In thousands)
|
||||||||||||
|
Revenue earning equipment:
(1)
|
||||||||||||||
|
Trucks
|
$
|
33,208
|
|
24,178
|
|
$
|
30,812
|
|
14,645
|
|
||||
|
Tractors
|
27,976
|
|
57,348
|
|
21,261
|
|
47,597
|
|
||||||
|
Trailers
|
2,100
|
|
2,532
|
|
5,992
|
|
5,173
|
|
||||||
|
Total assets at fair value
|
$
|
63,284
|
|
84,058
|
|
$
|
58,065
|
|
67,415
|
|
||||
______________
|
(1)
|
Assets held for sale in the above table only include the portion of revenue earning equipment held for sale where net book values exceeded fair values and fair value adjustments were recorded. The net book value of assets held for sale not exceeding fair value was
$42 million
and
$45 million
as of
December 31, 2017
and
2016
, respectively. We have revised prior year amounts to reflect only the portion of revenue earning equipment held for sale where fair value adjustments were recorded.
|
|
(2)
|
Total losses represent fair value adjustments for all vehicles reclassified to held for sale throughout the period for which fair value was less than net book value.
|
For the
twelve months ended December 31, 2017
, the components of used vehicle sales, net were as follows:
|
|
Twelve months ended December 31,
|
||||||||
|
2017
|
2016
|
2015
|
|||||||
|
|
(In thousands)
|
||||||||
|
Gains on vehicle sales, net
|
$
|
(40,824
|
)
|
(68,387
|
)
|
(117,809
|
)
|
||
|
Losses from fair value adjustments
|
58,065
|
|
67,415
|
|
17,956
|
|
|||
|
Used vehicle sales, net
|
$
|
17,241
|
|
(972
|
)
|
(99,853
|
)
|
||
8.
OPERATING PROPERTY AND EQUIPMENT
|
|
Estimated
Useful Lives
|
December 31,
|
|||||||
|
|
2017
|
2016
|
|||||||
|
|
(In years)
|
(In thousands)
|
|||||||
|
Land
|
—
|
$
|
217,885
|
|
212,660
|
|
|||
|
Buildings and improvements
|
10 — 40
|
822,931
|
|
808,909
|
|
||||
|
Machinery and equipment
|
3 — 10
|
797,084
|
|
737,899
|
|
||||
|
Other
|
3 — 10
|
131,181
|
|
114,442
|
|
||||
|
1,969,081
|
|
1,873,910
|
|
||||||
|
Accumulated depreciation
|
(1,192,377
|
)
|
(1,128,040
|
)
|
|||||
|
Total
|
$
|
776,704
|
|
745,870
|
|
||||
Depreciation expense was
$94 million
,
$88 million
and
$84 million
in
2017
,
2016
and
2015
, respectively.
88
RYDER SYSTEM, INC. AND SUBSIDIARIES
NOTES TO CONSOLIDATED FINANCIAL STATEMENTS - (Continued)
9.
GOODWILL
The carrying amount of goodwill attributable to each reportable business segment with changes therein was as follows:
|
Fleet
Management
Solutions
|
Dedicated Transportation Solutions
|
Supply
Chain
Solutions
|
Total
|
||||||||||
|
|
(In thousands)
|
||||||||||||
|
Balance at January 1, 2016
|
|||||||||||||
|
Goodwill
|
$
|
231,358
|
|
40,808
|
|
146,190
|
|
418,356
|
|
||||
|
Accumulated impairment losses
|
(10,322
|
)
|
—
|
|
(18,899
|
)
|
(29,221
|
)
|
|||||
|
221,036
|
|
40,808
|
|
127,291
|
|
389,135
|
|
||||||
|
Foreign currency translation adjustment
|
(2,526
|
)
|
—
|
|
163
|
|
(2,363
|
)
|
|||||
|
Balance at December 31, 2016
|
|
||||||||||||
|
Goodwill
|
228,832
|
|
40,808
|
|
146,353
|
|
415,993
|
|
|||||
|
Accumulated impairment losses
|
(10,322
|
)
|
—
|
|
(18,899
|
)
|
(29,221
|
)
|
|||||
|
218,510
|
|
40,808
|
|
127,454
|
|
386,772
|
|
||||||
|
Acquisitions
|
6,506
|
|
—
|
|
—
|
|
6,506
|
|
|||||
|
Foreign currency translation adjustment and other
|
1,838
|
|
|
|
388
|
|
2,226
|
|
|||||
|
Balance at December 31, 2017
|
|
||||||||||||
|
Goodwill
|
237,176
|
|
40,808
|
|
146,741
|
|
424,725
|
|
|||||
|
Accumulated impairment losses
|
(10,322
|
)
|
—
|
|
(18,899
|
)
|
(29,221
|
)
|
|||||
|
$
|
226,854
|
|
40,808
|
|
127,842
|
|
395,504
|
|
|||||
We historically assessed goodwill for impairment on April 1st of each year or more often if deemed necessary. As described in Note 1, during 2017, we changed our goodwill impairment assessment date to October 1.
We performed quantitative assessments on
two
reporting units as of April 1, 2017, and on
one
reporting unit as of October 1, 2017, and determined there was
no
impairment as of both assessment dates. We performed qualitative assessments for
three
of our reporting units as of April 1, 2017, and on
four
reporting units as of October 1, 2017, which considered individual factors such as macroeconomic conditions, changes in our industry and the markets in which we operate, as well as our historical and expected future financial performance. After performing the qualitative assessments, we concluded it was more likely than not that fair value is greater than the carrying value and determined there was
no
impairment as of both assessment dates.
89
RYDER SYSTEM, INC. AND SUBSIDIARIES
NOTES TO CONSOLIDATED FINANCIAL STATEMENTS - (Continued)
10.
INTANGIBLE ASSETS
|
|
December 31,
|
||||||
|
|
2017
|
2016
|
|||||
|
|
(In thousands)
|
||||||
|
Indefinite lived intangible assets — Trade name
|
$
|
8,731
|
|
8,731
|
|
||
|
Finite lived intangible assets:
|
|||||||
|
Customer relationship intangibles
|
91,523
|
|
91,523
|
|
|||
|
Other intangibles, primarily trade name
|
2,367
|
|
2,367
|
|
|||
|
Accumulated amortization
|
(57,420
|
)
|
(51,578
|
)
|
|||
|
36,470
|
|
42,312
|
|
||||
|
Foreign currency translation adjustment
|
(2,271
|
)
|
(2,794
|
)
|
|||
|
Total
|
$
|
42,930
|
|
48,249
|
|
||
The Ryder trade name has been identified as having an indefinite useful life. Customer relationship intangibles are being amortized on a straight-line basis over their estimated useful lives, generally
7
-
19
years. We recognized amortization expense associated with finite lived intangible assets of approximately
$6 million
in both
2017
and
2016
, and
$7 million
in
2015
. The future amortization expense for each of the five succeeding years related to all intangible assets that are currently reported in the Consolidated Balance Sheets is estimated to range from
$3
-
$5 million
per year for
2018 - 2022
.
11.
DIRECT FINANCING LEASES AND OTHER ASSETS
|
|
|
December 31,
|
|||||
|
|
|
2017
|
|
2016
|
|||
|
|
|
(In thousands)
|
|||||
|
Direct financing leases, net
|
|
$
|
364,847
|
|
|
333,152
|
|
|
Investments held in Rabbi Trusts
|
|
61,425
|
|
|
48,451
|
|
|
|
Lease incentives
|
|
14,857
|
|
|
15,741
|
|
|
|
Insurance receivables
|
|
15,545
|
|
|
18,402
|
|
|
|
Start-up costs
|
13,750
|
|
7,422
|
|
|||
|
Prepaid pension asset
|
58,708
|
|
14,049
|
|
|||
|
Lease origination costs
|
9,387
|
|
9,227
|
|
|||
|
Deferred tax asset
|
6,736
|
|
9,009
|
|
|||
|
Other
|
14,294
|
|
16,831
|
|
|||
|
Total
|
$
|
559,549
|
|
472,284
|
|
||
Investments held in Rabbi Trusts are assets measured at fair value on a recurring basis, all of which are considered Level 1 of the fair value hierarchy. The following table presents the asset classes at
December 31, 2017
and
2016
:
|
|
December 31,
|
||||||
|
|
2017
|
2016
|
|||||
|
|
(In thousands)
|
||||||
|
Cash and cash equivalents
|
$
|
4,956
|
|
5,391
|
|
||
|
U.S. equity mutual funds
|
39,958
|
|
30,229
|
|
|||
|
Foreign equity mutual funds
|
8,001
|
|
5,232
|
|
|||
|
Fixed income mutual funds
|
8,510
|
|
7,599
|
|
|||
|
Total Investments held in Rabbi Trusts
|
$
|
61,425
|
|
48,451
|
|
||
90
RYDER SYSTEM, INC. AND SUBSIDIARIES
NOTES TO CONSOLIDATED FINANCIAL STATEMENTS - (Continued)
12.
ACCRUED EXPENSES AND OTHER LIABILITIES
|
|
December 31, 2017
|
December 31, 2016
|
|||||||||||||||||
|
|
Accrued
Expenses
|
Non-Current
Liabilities
|
Total
|
Accrued
Expenses
|
Non-Current
Liabilities
|
Total
|
|||||||||||||
|
|
(In thousands)
|
||||||||||||||||||
|
Salaries and wages
|
$
|
133,733
|
|
—
|
|
133,733
|
|
90,913
|
|
—
|
|
90,913
|
|
||||||
|
Deferred compensation
|
4,269
|
|
58,411
|
|
62,680
|
|
2,992
|
|
46,541
|
|
49,533
|
|
|||||||
|
Pension benefits
|
3,863
|
|
412,417
|
|
416,280
|
|
3,796
|
|
451,940
|
|
455,736
|
|
|||||||
|
Other postretirement benefits
|
1,481
|
|
19,760
|
|
21,241
|
|
1,506
|
|
19,459
|
|
20,965
|
|
|||||||
|
Other employee benefits
|
28,636
|
|
3,279
|
|
31,915
|
|
29,358
|
|
5,854
|
|
35,212
|
|
|||||||
|
Insurance obligations
(1)
|
130,848
|
|
242,473
|
|
373,321
|
|
127,470
|
|
234,336
|
|
361,806
|
|
|||||||
|
Operating taxes
|
95,848
|
|
—
|
|
95,848
|
|
92,150
|
|
—
|
|
92,150
|
|
|||||||
|
Income taxes
|
8,550
|
|
24,160
|
|
32,710
|
|
4,197
|
|
23,174
|
|
27,371
|
|
|||||||
|
Interest
|
30,003
|
|
—
|
|
30,003
|
|
27,277
|
|
—
|
|
27,277
|
|
|||||||
|
Deposits, mainly from customers
|
69,903
|
|
3,638
|
|
73,541
|
|
61,225
|
|
4,569
|
|
65,794
|
|
|||||||
|
Deferred revenue
|
14,004
|
|
—
|
|
14,004
|
|
14,064
|
|
—
|
|
14,064
|
|
|||||||
|
Restructuring liabilities
(2)
|
13,074
|
|
—
|
|
13,074
|
|
7,278
|
|
—
|
|
7,278
|
|
|||||||
|
Other
|
53,194
|
|
47,951
|
|
101,145
|
|
44,963
|
|
31,692
|
|
76,655
|
|
|||||||
|
Total
|
$
|
587,406
|
|
812,089
|
|
1,399,495
|
|
507,189
|
|
817,565
|
|
1,324,754
|
|
||||||
_________________
(1) Insurance obligations are primarily comprised of self-insured claim liabilities.
(2) The increase in restructuring liabilities from December 31, 2016 principally represents an accrual for employee termination costs. The majority of the balance remaining in restructuring liabilities is expected to be paid by the end of 2018.
We retain a portion of the accident risk under vehicle liability and workers’ compensation insurance programs. Self-insurance accruals are primarily based on actuarially estimated, undiscounted cost of claims, and include claims incurred but not reported. Such liabilities are based on estimates. Historical loss development factors are utilized to project the future development of incurred losses, and these amounts are adjusted based upon actual claim experience and settlements. While we believe the amounts are adequate, there can be no assurance that changes to our estimates may not occur due to limitations inherent in the estimation process. During
2017
, we recognized a benefit within earnings from continuing operations of
$9 million
from the favorable development of estimated prior years' self-insured loss reserves for the reasons noted above. During
2016
and
2015
, we recognized charges within earnings from continuing operations of
$9 million
and
$4 million
from the unfavorable development of prior year claims where costs exceeded self-insured loss reserves for the reasons noted above, as well as a settlement of a customer-extended insurance claim.
91
RYDER SYSTEM, INC. AND SUBSIDIARIES
NOTES TO CONSOLIDATED FINANCIAL STATEMENTS - (Continued)
13.
INCOME TAXES
The components of earnings from continuing operations before income taxes and the (benefit from) provision for income taxes from continuing operations were as follows:
|
|
Years ended December 31,
|
|||||||||
|
|
2017
|
2016
|
2015
|
|||||||
|
|
(In thousands)
|
|||||||||
|
Earnings from continuing operations before income taxes:
|
||||||||||
|
United States
|
$
|
254,327
|
|
344,614
|
|
408,757
|
|
|||
|
Foreign
|
59,459
|
|
61,767
|
|
60,458
|
|
||||
|
Total
|
$
|
313,786
|
|
406,381
|
|
469,215
|
|
|||
|
Current tax expense (benefit) from continuing operations:
|
||||||||||
|
Federal
(1)
|
$
|
6,752
|
|
2,731
|
|
(1,836
|
)
|
|||
|
State
(1)
|
9,360
|
|
7,713
|
|
5,748
|
|
||||
|
Foreign
|
6,442
|
|
6,411
|
|
5,272
|
|
||||
|
22,554
|
|
16,855
|
|
9,184
|
|
|||||
|
Deferred tax (benefit) expense from continuing operations:
|
||||||||||
|
Federal
|
(509,573
|
)
|
106,513
|
|
135,585
|
|
||||
|
State
|
7,985
|
|
16,259
|
|
20,111
|
|
||||
|
Foreign
|
1,805
|
|
2,114
|
|
(1,654
|
)
|
||||
|
(499,783
|
)
|
124,886
|
|
154,042
|
|
|||||
|
(Benefit from) provision for income taxes from continuing operations
|
$
|
(477,229
|
)
|
141,741
|
|
163,226
|
|
|||
______________
|
(1)
|
Excludes federal and state tax benefits resulting from the exercise of stock options and vesting of restricted stock awards, which were credited directly to “Additional paid-in capital” for the year ended December 31, 2015.
|
A reconciliation of the federal statutory tax rate with the effective tax rate from continuing operations follows:
|
|
Years ended December 31,
|
||||||||
|
|
2017
|
2016
|
2015
|
||||||
|
|
(Percentage of pre-tax earnings)
|
||||||||
|
Federal statutory tax rate
|
35.0
|
|
35.0
|
|
35.0
|
|
|||
|
Impact of one-time deemed repatriation
|
10.7
|
|
—
|
|
—
|
|
|||
|
Impact on deferred taxes for changes in tax rates
|
(197.5
|
)
|
(0.7
|
)
|
(0.9
|
)
|
|||
|
State income taxes, net of federal income tax benefit
|
4.5
|
|
5.0
|
|
5.0
|
|
|||
|
Foreign rates varying from federal statutory tax rate
|
(4.0
|
)
|
(3.3
|
)
|
(3.3
|
)
|
|||
|
Tax reviews and audits
|
(1.0
|
)
|
(0.7
|
)
|
(1.3
|
)
|
|||
|
Other, net
|
0.2
|
|
(0.4
|
)
|
0.3
|
|
|||
|
Effective tax rate
|
(152.1
|
)
|
34.9
|
|
34.8
|
|
|||
Tax Law Changes
On December 22, 2017, the 2017 Tax Cuts and Jobs Act (the “Act”) was signed into law. The Act makes broad and complex changes to the U.S. tax code and it will take time to fully interpret the changes. The Act significantly impacted our fourth quarter and full year 2017 earnings, and will impact earnings in future periods; however, we were not able to fully complete the accounting under ASC 740 for certain of the Act’s new provisions. In accordance with SEC Staff Accounting Bulletin No.118, to the extent the accounting for certain income tax effects of the Act was incomplete, but we were able to determine a reasonable estimate of those effects, a provisional amount (“provisional amount”) has been included in our financial statements. Conversely, where a reasonable estimate of the tax effects of the Act cannot be determined, no related provisional amounts have been included in the financial statements. We intend to adjust the tax effects for the relevant items during the allowed 2018 measurement period.
92
RYDER SYSTEM, INC. AND SUBSIDIARIES
NOTES TO CONSOLIDATED FINANCIAL STATEMENTS - (Continued)
Among other changes, the Act reduces the federal corporate tax rate from 35% to 21%. The tax rate change will decrease our effective tax rate going forward. Under generally accepted accounting principles, deferred tax assets and liabilities are measured using enacted tax rates expected to apply to taxable income in the years in which those temporary differences are expected to be recovered or settled. As a result of the federal tax rate reduction, we remeasured our net deferred tax liability at December 31, 2017. The remeasurement, which is a provisional estimate, resulted in a reduction in the value of our net deferred tax liability of
$619 million
, which was recorded as an income tax benefit in our consolidated statement of income for the three months ended December 31, 2017.
The Act also requires companies to pay a one-time transition tax on unremitted earnings of certain foreign subsidiaries that had not been subject to U.S. income tax and creates new taxes on certain foreign earnings. We have included a provisional estimate of
$33 million
for the transition tax in the December 31, 2017 financial statements. The estimate will be adjusted during the measurement period as we refine our determination of historical earnings and profits and the amount of cash and cash equivalents held in foreign entities.
The following provides a summary of the increases to net earnings from continuing operations from changes in tax laws by tax jurisdiction:
|
Tax Jurisdiction
|
|
Enactment Date
|
|
Net Earnings
|
|
(in thousands)
|
||||
|
2017
|
||||
|
United States
|
December 22, 2017
|
$585,912
|
||
|
Illinois
|
July 1, 2017
|
$(1,844)
|
||
|
2016
|
||||
|
North Carolina
|
August 4, 2016
|
$585
|
||
|
2015
|
|
|
||
|
Connecticut
|
|
June 30, 2015
|
|
$1,616
|
|
Other Jurisdictions
|
|
April 13, 2015 - November 18, 2015
|
|
$497
|
Deferred Income Taxes
The components of the net deferred income tax liability were as follows:
|
|
December 31,
|
||||||
|
|
2017
|
2016
|
|||||
|
|
(In thousands)
|
||||||
|
Deferred income tax assets:
|
|||||||
|
Self-insurance accruals
|
$
|
75,198
|
|
107,252
|
|
||
|
Net operating loss carryforwards
|
171,053
|
|
396,313
|
|
|||
|
Alternative minimum taxes
|
22,552
|
|
13,901
|
|
|||
|
Accrued compensation and benefits
|
65,532
|
|
81,454
|
|
|||
|
Federal benefit on state tax positions
|
11,950
|
|
19,247
|
|
|||
|
Pension benefits
|
82,547
|
|
162,141
|
|
|||
|
Miscellaneous other accruals
|
19,608
|
|
28,313
|
|
|||
|
448,440
|
|
808,621
|
|
||||
|
Valuation allowance
|
(18,667
|
)
|
(16,387
|
)
|
|||
|
429,773
|
|
792,234
|
|
||||
|
Deferred income tax liabilities:
|
|||||||
|
Property and equipment basis difference
|
(1,614,963
|
)
|
(2,451,151
|
)
|
|||
|
Other
|
(16,857
|
)
|
(20,735
|
)
|
|||
|
(1,631,820
|
)
|
(2,471,886
|
)
|
||||
|
Net deferred income tax liability
(1)
|
$
|
(1,202,047
|
)
|
(1,679,652
|
)
|
||
______________
|
(1)
|
Deferred tax assets of
$7 million
and
$9 million
have been included in "Direct financing leases and other assets" at
December 31, 2017
and
2016
.
|
93
RYDER SYSTEM, INC. AND SUBSIDIARIES
NOTES TO CONSOLIDATED FINANCIAL STATEMENTS - (Continued)
As of
December 31, 2017
, we have undistributed earnings of foreign subsidiaries of
$774 million
, the majority of which were reinvested into non-cash property, plant and equipment. The provisional estimate of the transition tax incurred in connection with the Act will result in U.S. federal income taxes on approximately
$345 million
of earnings and profit for U.S. federal income tax purposes. We have historically reinvested such earnings overseas indefinitely and may continue to reinvest future foreign earnings overseas indefinitely. As such, deferred income taxes have not been provided on undistributed earnings of foreign subsidiaries. However, because the Act implements a territorial tax system, whereby certain foreign subsidiary earnings can be repatriated to the U.S. with no federal tax, we are reassessing whether to indefinitely reinvest our overseas earnings. The determination of the amount of any additional unrecognized deferred tax liability is not practicable because of the complexities associated with the hypothetical calculations used in evaluating whether we will maintain the indefinite reinvestment assertion.
At
December 31, 2017
, we had U.S. federal tax effected net operating loss carryforwards of
$128 million
and various U.S. subsidiaries had state tax effected net operating loss carryforwards of
$29 million
both expiring through tax year 2037. We also had foreign tax effected net operating losses of
$14 million
that are available to reduce future income tax payments in several countries, subject to varying expiration rules. A valuation allowance has been established to reduce deferred income tax assets, principally foreign tax loss carryforwards, to amounts more likely than not to be realized. We had unused alternative minimum tax credits of
$23 million
at
December 31, 2017
, which may be refundable under the Act.
Uncertain Tax Positions
The following is a summary of tax years that are no longer subject to examination:
Federal —
audits of our U.S. federal income tax returns are closed through fiscal year 2009.
State
— for the majority of states, tax returns are closed through fiscal year 2009.
Foreign
— we are no longer subject to foreign tax examinations by tax authorities for tax years before 2010 in Canada, 2011 in Brazil, 2011 in Mexico and 2012 in the U.K., which are our major foreign tax jurisdictions.
The following table summarizes the activity related to unrecognized tax benefits (excluding the federal benefit received from state positions):
|
|
December 31,
|
|||||||||
|
|
2017
|
2016
|
2015
|
|||||||
|
|
(In thousands)
|
|||||||||
|
Balance at January 1
|
$
|
61,649
|
|
60,740
|
|
60,482
|
|
|||
|
Additions based on tax positions related to the current year
|
3,971
|
|
3,855
|
|
4,220
|
|
||||
|
Reductions due to lapse of applicable statutes of limitation
|
(3,332
|
)
|
(2,946
|
)
|
(3,962
|
)
|
||||
|
Gross balance at December 31
|
62,288
|
|
61,649
|
|
60,740
|
|
||||
|
Interest and penalties
|
5,860
|
|
5,219
|
|
4,912
|
|
||||
|
Balance at December 31
|
$
|
68,148
|
|
66,868
|
|
65,652
|
|
|||
Of the total unrecognized tax benefits,
$56 million
(net of the federal benefit on state issues) represents the amount of unrecognized tax benefits that, if recognized, would favorably affect the effective tax rate in future periods. The total includes
$5 million
of interest and penalties at both,
December 31, 2017
and
2016
, net of the federal benefit on state issues. Unrecognized tax benefits related to federal, state and foreign tax positions may decrease by
$3 million
by
December 31, 2018
, if audits are completed or tax years close during
2018
.
94
RYDER SYSTEM, INC. AND SUBSIDIARIES
NOTES TO CONSOLIDATED FINANCIAL STATEMENTS - (Continued)
Like-Kind Exchange Program
We have a like-kind exchange program for certain of our U.S.-based revenue earning equipment. Pursuant to the program, we dispose of vehicles and acquire replacement vehicles in a form whereby tax gains on disposal of eligible vehicles are deferred. To qualify for like-kind exchange treatment, we exchange through a qualified intermediary eligible vehicles being disposed of with vehicles being acquired, allowing us to generally carryover the tax basis of the vehicles sold (“like-kind exchanges”). The program results in a material deferral of federal and state income taxes, and a decrease in cash taxes in periods when we are not in a net operating loss (NOL) position. As part of the program, the proceeds from the sale of eligible vehicles are restricted for the acquisition of replacement vehicles and other specified applications. Due to the structure utilized to facilitate the like-kind exchanges, the qualified intermediary that holds the proceeds from the sales of eligible vehicles and the entity that holds the vehicles to be acquired under the program are required to be consolidated in the accompanying Consolidated Financial Statements in accordance with U.S. GAAP. The total assets, primarily revenue earning equipment, and the total liabilities, primarily vehicle accounts payable, held by these consolidated entities are equal in value as these entities are solely structured to facilitate the like-kind exchanges. At
December 31, 2017
and
2016
, these consolidated entities had total assets, primarily revenue earning equipment, and total liabilities, primarily accounts payable, of
$232 million
and
$140 million
, respectively. The Act repeals like-kind exchange treatment for revenue earning equipment after December 31, 2017.
14.
LEASES
Leases as Lessor
We lease revenue earning equipment to customers for periods ranging from
three
to
seven
years for trucks and tractors and up to
ten
years for trailers. From time to time, we may also lease facilities to third parties. The majority of our leases are classified as operating leases. However, some of our revenue earning equipment leases are classified as direct financing leases and, to a lesser extent, sales-type leases. The net investment in direct financing and sales-type leases consisted of:
|
|
December 31,
|
||||||
|
|
2017
|
2016
|
|||||
|
|
(In thousands)
|
||||||
|
Total minimum lease payments receivable
|
$
|
713,857
|
|
647,111
|
|
||
|
Less: Executory costs
|
(216,754
|
)
|
(196,469
|
)
|
|||
|
Minimum lease payments receivable
|
497,103
|
|
450,642
|
|
|||
|
Less: Allowance for uncollectibles
|
(327
|
)
|
(248
|
)
|
|||
|
Net minimum lease payments receivable
|
496,776
|
|
450,394
|
|
|||
|
Unguaranteed residuals
|
41,937
|
|
45,748
|
|
|||
|
Less: Unearned income
|
(91,870
|
)
|
(86,668
|
)
|
|||
|
Net investment in direct financing and sales-type leases
|
446,843
|
|
409,474
|
|
|||
|
Current portion
|
(81,996
|
)
|
(76,322
|
)
|
|||
|
Non-current portion
|
$
|
364,847
|
|
333,152
|
|
||
Our direct financing lease customers operate in a wide variety of industries, and we have no significant customer concentrations in any one industry. We assess credit risk for all of our customers including those who lease equipment under direct financing leases. Credit risk is assessed using an internally developed model, which incorporates credit scores from third party providers and our own custom risk ratings and is updated on a monthly basis. The external credit scores are developed based on the customer’s historical payment patterns and an overall assessment of the likelihood of delinquent payments. Our internal ratings are weighted based on the industry that the customer operates in, company size, years in business and other credit-related indicators (i.e., profitability, cash flow, liquidity, tangible net worth, etc.). Any one of the following factors may result in a customer being classified as high risk: i) history of late payments; ii) open lawsuits, liens or judgments; iii) in business
less than three years
; and iv) operates in an industry with low barriers to entry. For those customers who are designated as high risk, we typically require deposits to be paid in advance in order to mitigate our credit risk. Additionally, our receivables are collateralized by the vehicle’s fair value, which further mitigates our credit risk.
95
RYDER SYSTEM, INC. AND SUBSIDIARIES
NOTES TO CONSOLIDATED FINANCIAL STATEMENTS - (Continued)
The following table presents the credit risk profile by creditworthiness category of our direct financing lease receivables at
December 31, 2017
and
2016
:
|
December 31,
|
||||||
|
2017
|
2016
|
|||||
|
|
(In thousands)
|
|||||
|
Very low risk to low risk
|
$
|
201,434
|
|
192,853
|
|
|
|
Moderate
|
198,464
|
|
194,234
|
|
||
|
Moderately high to high risk
|
97,205
|
|
63,555
|
|
||
|
$
|
497,103
|
|
450,642
|
|
||
As of
December 31, 2017
and
2016
, the amount of direct financing lease receivables that were past due was not significant and there were
no
impaired receivables. Accordingly, there was no material risk of default with respect to these receivables.
Leases as Lessee
We lease facilities and office equipment. None of our leasing arrangements contain restrictive financial covenants.
During
2017
,
2016
and
2015
, rent expense (including rent of facilities and contingent rentals) was
$130 million
,
$127 million
and
$132 million
, respectively.
Lease Payments
Future minimum payments for leases in effect at
December 31, 2017
were as follows:
|
|
As Lessor
(1)
|
As Lessee
|
||||||||
|
|
Operating
Leases
|
Direct Financing and Sales-Type
Leases
|
Operating
Leases
|
|||||||
|
|
(In thousands)
|
|||||||||
|
2018
|
$
|
1,139,552
|
|
110,692
|
|
84,824
|
|
|||
|
2019
|
892,754
|
|
95,759
|
|
63,435
|
|
||||
|
2020
|
649,096
|
|
99,470
|
|
41,034
|
|
||||
|
2021
|
433,319
|
|
68,349
|
|
24,948
|
|
||||
|
2022
|
258,381
|
|
54,603
|
|
18,495
|
|
||||
|
Thereafter
|
210,213
|
|
68,230
|
|
38,288
|
|
||||
|
Total
|
$
|
3,583,315
|
|
497,103
|
|
271,024
|
|
|||
____________________
|
(1)
|
Amounts do not include contingent rentals, which may be received under certain leases on the basis of miles or changes in the Consumer Price Index. Contingent rentals from operating leases included in revenue were $
357 million
in
2017
and $
342 million
in both
2016
and
2015
. Contingent rentals from direct financing leases included in revenue were
$15 million
in
2017
,
$12 million
in
2016
and
$12 million
in
2015
.
|
The amounts in the previous table related to the lease of revenue earning equipment are based upon the general assumption that revenue earning equipment will remain on lease for the length of time specified by the respective lease agreements. The future minimum payments presented above related to the lease of revenue earning equipment are not a projection of future lease revenue or expense, and no effect has been given to renewals, new business, cancellations, contingent rentals or future rate changes.
96
RYDER SYSTEM, INC. AND SUBSIDIARIES
NOTES TO CONSOLIDATED FINANCIAL STATEMENTS - (Continued)
15.
DEBT
|
Weighted-Average
Interest Rate
|
|||||||||||||||
|
|
December 31,
|
|
December 31,
|
||||||||||||
|
|
2017
|
2016
|
Maturities
|
2017
|
2016
|
||||||||||
|
|
|
|
|
(In thousands)
|
|||||||||||
|
Short-term debt and current portion of long-term debt:
|
|||||||||||||||
|
Short-term debt
|
1.79
|
%
|
1.07
|
%
|
|
$
|
35,509
|
|
177,629
|
|
|||||
|
Current portion of long-term debt, including capital leases
|
790,560
|
|
613,781
|
|
|||||||||||
|
Total short-term debt and current portion of long-term debt
|
826,069
|
|
791,410
|
|
|||||||||||
|
Total long-term debt:
|
|||||||||||||||
|
U.S. commercial paper
(1)
|
1.56
|
%
|
0.87
|
%
|
2020
|
570,218
|
|
342,480
|
|
||||||
|
Global revolving credit facility
|
2.80
|
%
|
2.06
|
%
|
2020
|
17,328
|
|
4,703
|
|
||||||
|
Unsecured U.S. notes – Medium-term notes
(1)
|
2.73
|
%
|
2.67
|
%
|
2018-2025
|
4,014,091
|
|
4,113,421
|
|
||||||
|
Unsecured U.S. obligations, principally bank term loans
|
2.79
|
%
|
2.19
|
%
|
2018
|
50,000
|
|
50,000
|
|
||||||
|
Unsecured foreign obligations
|
1.50
|
%
|
1.55
|
%
|
2018-2020
|
230,380
|
|
232,092
|
|
||||||
|
Asset backed U.S. obligations
(2)
|
1.85
|
%
|
1.80
|
%
|
2018-2022
|
491,899
|
|
459,876
|
|
||||||
|
Capital lease obligations
|
3.53
|
%
|
3.17
|
%
|
2018-2023
|
20,871
|
|
24,184
|
|
||||||
|
Total before fair market value adjustment
|
5,394,787
|
|
5,226,756
|
|
|||||||||||
|
Fair market value adjustment on notes subject to hedging
(3)
|
(7,192
|
)
|
1,110
|
|
|||||||||||
|
Debt issuance costs
|
(13,453
|
)
|
(14,221
|
)
|
|||||||||||
|
5,374,142
|
|
5,213,645
|
|
||||||||||||
|
Current portion of long-term debt, including capital leases
|
(790,560
|
)
|
(613,781
|
)
|
|||||||||||
|
Long-term debt
|
4,583,582
|
|
4,599,864
|
|
|||||||||||
|
Total debt
|
$
|
5,409,651
|
|
5,391,274
|
|
||||||||||
_________________
|
(1)
|
Amounts are net of unamortized original issue discounts of
$6 million
and
$7 million
at
December 31, 2017
and
2016
, respectively.
|
|
(2)
|
Asset-backed U.S. obligations are related to financing transactions backed by a portion of our revenue earning equipment.
|
|
(3)
|
The notional amount of the executed interest rate swaps designated as fair value hedges was
$825 million
at
December 31, 2017
and
2016
. Refer to
Note 16
, "
Derivatives
," for additional information.
|
Maturities of total debt are as follows:
|
Capital Leases
|
Debt
|
||||||
|
|
(In thousands)
|
||||||
|
2018
|
$
|
7,559
|
|
818,510
|
|
||
|
2019
|
7,918
|
|
1,077,734
|
|
|||
|
2020
|
2,428
|
|
1,892,344
|
|
|||
|
2021
|
2,620
|
|
717,868
|
|
|||
|
2022
|
1,379
|
|
699,006
|
|
|||
|
Thereafter
|
—
|
|
190,510
|
|
|||
|
Total
|
21,904
|
|
5,395,972
|
|
|||
|
Imputed interest
|
(1,033
|
)
|
|||||
|
Present value of minimum capitalized lease payments
|
20,871
|
|
|||||
|
Current portion
|
(7,559
|
)
|
|||||
|
Long-term capitalized lease obligation
|
$
|
13,312
|
|
||||
97
RYDER SYSTEM, INC. AND SUBSIDIARIES
NOTES TO CONSOLIDATED FINANCIAL STATEMENTS - (Continued)
We maintain a
$1.2 billion
global revolving credit facility with a syndicate of
twelve
lending institutions led by Bank of America N.A., Bank of Tokyo-Mitsubishi UFJ, Ltd., BNP Paribas, Mizuho Corporate Bank, Ltd., Royal Bank of Canada, Lloyds Bank Plc, U.S. Bank National Association and Wells Fargo Bank, N.A. The facility matures in January 2020. The agreement provides for annual facility fees which range from
7.5 basis points
to
25 basis points
based on Ryder’s long-term credit ratings. The annual facility fee is currently
10
basis points, which applies to the total facility size of
$1.2 billion
.
The credit facility is used primarily to finance working capital but can also be used to issue up to
$75 million
in letters of credit (there were
no
letters of credit outstanding against the facility at
December 31, 2017
). At our option, the interest rate on borrowings under the credit facility is based on LIBOR, prime, federal funds or local equivalent rates. The credit facility contains no provisions limiting its availability in the event of a material adverse change to Ryder’s business operations; however, the credit facility does contain standard representations and warranties, events of default, cross-default provisions and certain affirmative and negative covenants.
In order to maintain availability of funding, we must maintain a ratio of debt to consolidated net worth of
less than or equal to 300%
. Net worth, as defined in the credit facility, represents shareholders' equity excluding any accumulated other comprehensive income or loss associated with our pension and other postretirement plans. The ratio at
December 31, 2017
, was
192%
. At
December 31, 2017
, there was
$577 million
available under the credit facility.
Our global revolving credit facility enables us to refinance short-term obligations on a long-term basis. Short-term commercial paper obligations not required for working capital needs are classified as long-term as we have both the intent and ability to refinance on a long-term basis. In addition, we have the intent and ability to refinance the current portion of long-term debt on a long-term basis. At
December 31, 2017
, we classified
$570 million
of short-term commercial paper and
$16 million
of the current portion of long-term debt as long-term debt. At
December 31, 2016
, we classified
$342 million
of short-term commercial paper and
$350 million
of current portion of long-term debt as long-term debt.
In August 2017, we issued
$300 million
of unsecured medium-term notes maturing in September 2022. In February 2017, we issued
$300 million
of unsecured medium-term notes maturing in March 2022. The proceeds from these notes were used to pay off maturing debt and for general corporate purposes. If these notes are downgraded below investment grade following, or as a result of, a change in control, the note holders can require us to repurchase all or a portion of the notes at a purchase price equal to 101% of principal value plus accrued and unpaid interest. On February 7, 2018, we exercised our call option and redeemed our unsecured medium term notes that were scheduled to mature on March 1, 2018. The notes were redeemed at a redemption price equal to 100% of the principal amount of
$350 million
plus interest accrued but not paid to the date of redemption.
In June
2017
, we received
$98 million
from financing transactions backed by a portion of our revenue earning equipment. The proceeds from these transactions were used for general corporate purposes. We have provided end of term guarantees for the residual value of the revenue earning equipment in these transactions. The transaction proceeds, along with the end of term residual value guarantees, have been included within "asset-backed U.S. obligations" in the preceding table.
We have a trade receivables purchase and sale program, pursuant to which we sell certain of our domestic trade accounts receivable to a bankruptcy remote, consolidated subsidiary of Ryder, that in turn sells, on a revolving basis, an ownership interest in certain of these accounts receivable to a committed purchaser. The subsidiary is considered a VIE and is consolidated based on our control of the entity’s activities. We use this program to provide additional liquidity to fund our operations, particularly when it is cost effective to do so. The costs under the program may vary based on changes in interest rates. The available proceeds that may be received under the program are limited to
$175 million
. In October
2017
, we renewed the trade receivables purchase and sale program. If no event occurs which causes early termination, the 364-day program will expire on October 22,
2018
. The program contains provisions restricting its availability in the event of a material adverse change to our business operations or the collectibility of the collateralized receivables. Sales of receivables under this program are accounted for as secured borrowings based on our continuing involvement in the transferred assets.
No
amounts were outstanding under the program at
December 31, 2017
and
2016
.
The fair value of total debt (excluding capital lease, asset backed U.S. obligations and debt issuance costs) was
$4.95 billion
at
December 31, 2017
and
$4.97 billion
at
December 31, 2016
. For publicly-traded debt, estimates of fair value were based on market prices. For other debt, fair value is estimated based on a model-driven approach using rates currently available to us for debt with similar terms and remaining maturities. The fair value measurements of our publicly-traded debt and our other debt were classified within Level 2 of the fair value hierarchy. The carrying amounts reported in the Consolidated Balance Sheets for "Cash and cash equivalents," "Receivables, net" and "Accounts payable" approximate fair value because of the immediate or short-term maturities of these financial instruments.
98
RYDER SYSTEM, INC. AND SUBSIDIARIES
NOTES TO CONSOLIDATED FINANCIAL STATEMENTS - (Continued)
16.
DERIVATIVES
From time to time, we enter into interest rate derivatives to manage our fixed and variable interest rate exposure and to better match the repricing of debt instruments to that of our portfolio of assets. We assess the risk that changes in interest rates will have either on the fair value of debt obligations or on the amount of future interest payments by monitoring changes in interest rate exposures and by evaluating hedging opportunities. We regularly monitor interest rate risk attributable to both our outstanding or forecasted debt obligations as well as our offsetting hedge positions. This risk management process involves the use of analytical techniques, including cash flow sensitivity analyses, to estimate the expected impact of changes in interest rates on our future cash flows.
As of
December 31, 2017
, we had interest rate swaps outstanding that are designated as fair value hedges for certain debt obligations, with a total notional value of
$825 million
and maturities through
2020
. Interest rate swaps are measured at fair value on a recurring basis using Level 2 fair value inputs. The fair value of these interest rate swaps was approximately a
$7 million
liability and a
$1 million
asset as of
December 31, 2017
and
2016
, respectively. The amounts are presented in "Other non-current liabilities" and "Direct financing leases and other assets" in our Consolidated Balance Sheets, respectively. Changes in the fair value of our interest rate swaps were offset by changes in the fair value of the hedged debt instrument. Accordingly, there was no ineffectiveness related to the interest rate swaps.
17.
GUARANTEES
We have executed various agreements with third parties that contain standard indemnifications that may require us to indemnify a third party against losses arising from a variety of matters such as lease obligations, financing agreements, environmental matters, and agreements to sell business assets. In each of these instances, payment by Ryder is contingent on the other party bringing about a claim under the procedures outlined in the specific agreement. Normally, these procedures allow us to dispute the other party’s claim. Additionally, our obligations under these agreements may be limited in terms of the amount and/or timing of any claim. We have entered into individual indemnification agreements with each of our independent directors, through which we will indemnify such director acting in good faith against any and all losses, expenses and liabilities arising out of such director’s service as a director of Ryder. The maximum amount of potential future payments under these agreements is generally unlimited.
We cannot predict the maximum potential amount of future payments under certain of these agreements, including the indemnification agreements, due to the contingent nature of the potential obligations and the distinctive provisions that are involved in each individual agreement. Historically, no such payments made by us have had a material adverse effect on our business. We believe that if a loss were incurred in any of these matters, the loss would not have a material adverse impact on our consolidated results of operations or financial position.
At
December 31, 2017
and
2016
, we had letters of credit and surety bonds outstanding, which primarily guarantee various insurance activities as noted in the following table:
|
|
December 31,
|
||||||
|
|
2017
|
2016
|
|||||
|
|
(In thousands)
|
||||||
|
Letters of credit
|
$
|
238,610
|
|
240,420
|
|
||
|
Surety bonds
|
111,007
|
|
113,696
|
|
|||
99
RYDER SYSTEM, INC. AND SUBSIDIARIES
NOTES TO CONSOLIDATED FINANCIAL STATEMENTS - (Continued)
18.
SHARE REPURCHASE PROGRAMS
In
December 2017
, our Board of Directors authorized a share repurchase program intended to mitigate the dilutive impact of shares issued under our employee stock plans (the program). Under the program, management is authorized to repurchase up to
1.5
million shares of common stock, the sum of which will not exceed the number of shares issued to employees under the Company’s employee stock plans from
December 31, 2017
to December 13, 2019. Share repurchases of common stock are made periodically in open-market transactions and are subject to market conditions, legal requirements and other factors. Management may establish prearranged written plans for the Company under Rule 10b5-1 of the Securities Exchange Act of 1934 as part of the program, which allow for share repurchases during Ryder’s quarterly blackout periods as set forth in the trading plan. As of
December 31, 2017
, we have not repurchased any shares under the
2017
program.
During
2017
,
2016
and
2015
, we repurchased
1.1 million
,
0.5 million
and
0.1 million
shares under previous share repurchase programs for $
78 million
,
$37 million
and
$6 million
, respectively.
19.
ACCUMULATED OTHER COMPREHENSIVE LOSS
Comprehensive income (loss) presents a measure of all changes in shareholders’ equity except for changes resulting from transactions with shareholders in their capacity as shareholders. The following summary sets forth the components of accumulated other comprehensive loss, net of tax:
|
Currency
Translation
Adjustments and Other
|
Net Actuarial
Loss
(1)
|
Prior Service
Credit
(1)
|
Accumulated
Other
Comprehensive
Loss
|
||||||||||
|
|
(In thousands)
|
||||||||||||
|
January 1, 2015
|
$
|
(36,087
|
)
|
(585,941
|
)
|
1,758
|
|
(620,270
|
)
|
||||
|
Amortization
|
—
|
|
19,505
|
|
(1,411
|
)
|
18,094
|
|
|||||
|
Other current period change
|
(99,933
|
)
|
(10,557
|
)
|
(69
|
)
|
(110,559
|
)
|
|||||
|
December 31, 2015
|
(136,020
|
)
|
(576,993
|
)
|
278
|
|
(712,735
|
)
|
|||||
|
Amortization
|
—
|
|
18,876
|
|
165
|
|
19,041
|
|
|||||
|
Other current period change
|
(70,590
|
)
|
(62,175
|
)
|
(7,573
|
)
|
(140,338
|
)
|
|||||
|
December 31, 2016
|
(206,610
|
)
|
(620,292
|
)
|
(7,130
|
)
|
(834,032
|
)
|
|||||
|
Amortization
|
—
|
|
20,267
|
|
219
|
|
20,486
|
|
|||||
|
Other current period change
|
66,172
|
|
39,872
|
|
1
|
|
106,045
|
|
|||||
|
December 31, 2017
|
$
|
(140,438
|
)
|
(560,153
|
)
|
(6,910
|
)
|
(707,501
|
)
|
||||
_______________________
|
(1)
|
These amounts are included in the computation of net periodic pension cost and pension settlement charge. See
Note 22
, "
Employee Benefit Plans
," for further information.
|
The gain from currency translation adjustments in
2017
of
$66 million
was primarily due to the strengthening of the British Pound and Canadian Dollar against the U.S. Dollar. The loss from currency translation adjustments of
$71 million
in
2016
was primarily due to the weakening of the British Pound against the U.S. Dollar, partially offset by the strengthening of the Canadian Dollar against the U.S. Dollar. The loss from currency translations in
2015
of
$100 million
was primarily due to the weakening of the Canadian Dollar and British Pound against the U.S. Dollar.
100
RYDER SYSTEM, INC. AND SUBSIDIARIES
NOTES TO CONSOLIDATED FINANCIAL STATEMENTS - (Continued)
20.
EARNINGS PER SHARE
The following table presents the calculation of basic and diluted earnings per common share from continuing operations:
|
|
Years ended December 31,
|
|||||||||
|
|
2017
|
2016
|
2015
|
|||||||
|
|
(In thousands, except per share amounts)
|
|||||||||
|
Earnings per share — Basic:
|
||||||||||
|
Earnings from continuing operations
|
$
|
791,015
|
|
264,640
|
|
305,989
|
|
|||
|
Less: Distributed and undistributed earnings allocated to unvested stock
|
(2,848
|
)
|
(840
|
)
|
(877
|
)
|
||||
|
Earnings from continuing operations available to common shareholders — Basic
|
$
|
788,167
|
|
263,800
|
|
305,112
|
|
|||
|
Weighted average common shares outstanding— Basic
|
52,613
|
|
53,015
|
|
52,814
|
|
||||
|
Earnings from continuing operations per common share — Basic
|
$
|
14.98
|
|
4.98
|
|
5.78
|
|
|||
|
Earnings per share — Diluted:
|
||||||||||
|
Earnings from continuing operations
|
$
|
791,015
|
|
264,640
|
|
305,989
|
|
|||
|
Less: Distributed and undistributed earnings allocated to unvested stock
|
(2,830
|
)
|
(836
|
)
|
(872
|
)
|
||||
|
Earnings from continuing operations available to common shareholders — Diluted
|
$
|
788,185
|
|
263,804
|
|
305,117
|
|
|||
|
Weighted average common shares outstanding— Basic
|
52,613
|
|
53,015
|
|
52,814
|
|
||||
|
Effect of dilutive equity awards
|
375
|
|
346
|
|
446
|
|
||||
|
Weighted average common shares outstanding— Diluted
|
52,988
|
|
53,361
|
|
53,260
|
|
||||
|
Earnings from continuing operations per common share — Diluted
|
$
|
14.87
|
|
4.94
|
|
5.73
|
|
|||
|
Anti-dilutive equity awards and market-based restrictive stock rights not included above
|
881
|
|
716
|
|
392
|
|
||||
21.
SHARE-BASED COMPENSATION PLANS
The following table provides information on share-based compensation expense and related income tax benefits recognized in
2017
,
2016
and
2015
:
|
|
Years ended December 31,
|
|||||||||
|
|
2017
|
2016
|
2015
|
|||||||
|
|
(In thousands)
|
|||||||||
|
Stock option and stock purchase plans
|
$
|
7,869
|
|
7,244
|
|
8,048
|
|
|||
|
Unvested stock awards
|
11,098
|
|
11,420
|
|
13,133
|
|
||||
|
Share-based compensation expense
|
18,967
|
|
18,664
|
|
21,181
|
|
||||
|
Income tax benefit
|
(6,628
|
)
|
(6,644
|
)
|
(7,271
|
)
|
||||
|
Share-based compensation expense, net of tax
|
$
|
12,339
|
|
12,020
|
|
13,910
|
|
|||
Total unrecognized pre-tax compensation expense related to share-based compensation arrangements at
December 31, 2017
was
$19 million
and is expected to be recognized over a weighted-average period of approximately
1.8
years. The total fair value of equity awards vested during
2017
,
2016
and
2015
were
$22 million
,
$17 million
and
$16 million
, respectively.
101
RYDER SYSTEM, INC. AND SUBSIDIARIES
NOTES TO CONSOLIDATED FINANCIAL STATEMENTS - (Continued)
Share-Based Incentive Awards
Share-based incentive awards are provided to employees under the terms of various share-based compensation plans (collectively, the “Plans”). The Plans are administered by the Compensation Committee of the Board of Directors. Awards under the Plans principally include at-the-money stock options, unvested stock and cash awards. Unvested stock awards include grants of market-based, performance-based, and time-vested restricted stock rights. Under the terms of our Plans, dividends on unvested stock are not paid unless the award vests. Upon vesting, the amount of the dividends paid is equal to the aggregate dividends declared on common shares during the period from the date of grant of the award until the date the shares underlying the award are delivered. There are
3.8 million
shares authorized for issuance under the Plans as of
December 31, 2017
. There are
2.5 million
shares remaining available for future issuance under the Plans as of
December 31, 2017
.
Stock options are awards that allow employees to purchase shares of our stock at a fixed price. Stock option awards are granted at an exercise price equal to the market price of our stock at the time of grant. These awards, which generally vest one-third each year, are fully vested
three
years from the grant date. Stock options granted since 2013 have contractual terms of
ten
years.
Restricted stock awards are unvested stock rights that are granted to employees and entitle the holder to shares of common stock as the award vests. Time-vested restricted stock rights typically vest in
three
years regardless of company performance. The fair value of the time-vested awards is determined and fixed based on Ryder’s stock price on the date of grant.
Performance-based restricted stock awards (PBRSRs) include a performance-based vesting condition. The awards are segmented into
three
one
-year performance periods. For these awards, up to 150% of the awards may be earned based on Ryder's one-year adjusted return on capital (ROC) measured against an annual ROC target. If earned, employees will receive the grant of stock three years after the grant date, provided they continue to be employed with Ryder, subject to Compensation Committee approval. For accounting purposes, the awards are not considered granted until the Compensation Committee approves the annual ROC target. During
2017
,
2016
and
2015
,
79,000
,
45,000
and
42,000
PBRSRs, respectively, were considered granted for accounting purposes. The fair value of the PBRSRs is determined and fixed on the grant date based on Ryder’s stock price on the date of grant. Share-based compensation expense is recognized on a straight-line basis over the vesting period, based upon the probability that the performance target will be met.
Market-based restricted stock awards include a market-based vesting provision. The awards are segmented into
three
performance periods of one, two and three years. At the end of each performance period, up to 150% of the award may be earned based on Ryder's total shareholder return (TSR) compared to the target TSR of a peer group over the applicable performance period. The awards compared Ryder's TSR to the TSR of a custom peer group. If earned, employees will receive the grant of stock at the end of the relevant three-year performance period provided they continue to be employed with Ryder, subject to Compensation Committee approval. The fair value of the market-based awards was determined on the date of grant using a Monte-Carlo valuation model. Share-based compensation expense is recognized on a straight-line basis over the vesting period and is recognized regardless of whether the awards vest.
Certain employees also received cash awards prior to 2017 as part of our long-term incentive compensation program. The cash awards have the same vesting provisions as the market-based restricted stock awards granted in the respective years. The cash awards are accounted for as liability awards as they are based upon our own stock performance and are settled in cash. As a result, the liability is adjusted to reflect fair value at the end of each reporting period. The fair value of the market-based cash awards was estimated using a lattice-based option pricing valuation model that incorporates a Monte-Carlo simulation. The liability related to the cash awards was
$1 million
at both
December 31, 2017
and
2016
.
The following table is a summary of compensation expense recognized related to cash awards in addition to share-based compensation expense reported in the previous table.
|
|
Years ended December 31
|
|||||||||
|
|
2017
|
2016
|
2015
|
|||||||
|
|
(In thousands)
|
|||||||||
|
Cash awards
|
$
|
174
|
|
689
|
|
532
|
|
|||
We grant restricted stock units (RSUs) to non-management members of the Board of Directors. Once granted, RSUs are eligible for non-forfeitable dividend equivalents but have no voting rights. The fair value of the awards is determined and fixed based on Ryder’s stock price on the date of grant. A board member receives the RSUs upon departure from the Board. The initial grant of RSUs will not vest unless the director has served a minimum of
one
year. When a board member receives RSUs, they are redeemed for an equivalent number of shares of our common stock. Share-based compensation expense is recognized for RSUs in the year the RSUs are granted.
102
RYDER SYSTEM, INC. AND SUBSIDIARIES
NOTES TO CONSOLIDATED FINANCIAL STATEMENTS - (Continued)
Option Awards
The following is a summary of option activity under our stock option plans as of and for the year ended
December 31, 2017
:
|
Shares
|
Weighted-
Average
Exercise
Price
|
Weighted-
Average
Remaining
Contractual
Term
|
Aggregate
Intrinsic Value
|
||||||||||
|
|
(In thousands)
|
|
(In years)
|
(In thousands)
|
|||||||||
|
Options outstanding at January 1
|
1,529
|
|
$
|
66.35
|
|
||||||||
|
Granted
|
465
|
|
76.43
|
|
|||||||||
|
Exercised
|
(235
|
)
|
55.41
|
|
|||||||||
|
Forfeited or expired
|
(42
|
)
|
70.56
|
|
|||||||||
|
Options outstanding at December 31
|
1,717
|
|
$
|
70.47
|
|
7.3
|
$
|
26,209
|
|
||||
|
Vested and expected to vest at December 31
|
1,649
|
|
$
|
70.61
|
|
7.4
|
$
|
25,320
|
|
||||
|
Exercisable at December 31
|
848
|
|
$
|
70.20
|
|
6.0
|
$
|
13,689
|
|
||||
The aggregate intrinsic values in the table above represent the total pre-tax intrinsic value (the difference between the close price of our stock on the last trading day of the year and the exercise price, multiplied by the number of in-the-money options) that would have been received by the option holders if all options were exercised at year-end. This amount fluctuates based on the fair market value of our stock.
Restricted Stock Awards
The following is a summary of the status of Ryder’s unvested restricted stock awards as of and for the year ended
December 31, 2017
:
|
|
Time-Vested
|
Market-Based
|
Performance-Based
|
|||||||||||||||
|
|
Shares
|
Weighted-
Average
Grant Date
Fair Value
|
Shares
|
Weighted-
Average
Grant Date
Fair Value
|
Shares
|
Weighted-
Average
Grant Date
Fair Value
|
||||||||||||
|
|
(In thousands)
|
|
(In thousands)
|
|
(In thousands)
|
|
||||||||||||
|
Unvested stock outstanding at January 1
|
476
|
$
|
67.31
|
|
66
|
$
|
64.33
|
|
72
|
$
|
70.92
|
|
||||||
|
Granted
|
117
|
75.61
|
|
45
|
73.43
|
|
79
|
76.47
|
|
|||||||||
|
Vested
(1)
|
(141)
|
78.18
|
|
(15)
|
61.07
|
|
(30)
|
75.62
|
|
|||||||||
|
Forfeited
(2)
|
(19)
|
69.95
|
|
(4)
|
81.47
|
|
(27)
|
48.71
|
|
|||||||||
|
Unvested stock outstanding at December 31
|
433
|
$
|
65.91
|
|
92
|
$
|
68.26
|
|
94
|
$
|
78.91
|
|
||||||
(1) Includes awards attained above target.
(2) Includes awards canceled due to employee terminations or performance and market conditions not being achieved.
Stock Purchase Plan
We maintain an Employee Stock Purchase Plan (ESPP) that enables eligible participants in the U.S. and Canada to purchase full or fractional shares of Ryder common stock through payroll deductions of up to
15%
of eligible compensation. The ESPP provides for quarterly offering periods during which shares may be purchased at
85%
of the fair market value of our stock. Beginning with the second quarter of 2015, we amended the ESPP to calculate the exercise price based only on the fair market value of the stock on the last trading day of the quarter. Prior to the second quarter of 2015, the exercise price was based on the lower of the fair market value on the first or last trading day of the quarter. Stock purchased under the ESPP must be held for
90
days. There were
5.5 million
shares authorized for issuance under the existing ESPP at
December 31, 2017
. There were
0.8 million
shares remaining available to be purchased in the future under the ESPP at
December 31, 2017
.
103
RYDER SYSTEM, INC. AND SUBSIDIARIES
NOTES TO CONSOLIDATED FINANCIAL STATEMENTS - (Continued)
The following table presents the weighted-average exercise price for shares granted and exercised under the ESPP:
|
|
Years ended December 31,
|
|||||||||||
|
|
2017
|
2016
|
2015
|
|||||||||
|
Stock purchase plan:
|
||||||||||||
|
Shares granted and exercised
|
160,000
|
|
192,000
|
|
178,000
|
|
||||||
|
Weighted average exercise plan
|
$
|
66.72
|
|
$
|
56.17
|
|
$
|
63.93
|
|
|||
Share-Based Compensation Fair Value Assumptions
The fair value of each option award is estimated on the date of grant using a Black-Scholes-Merton option-pricing valuation model that uses the weighted-average assumptions noted in the table below. Expected volatility is based on historical volatility of our stock and implied volatility from traded options on our stock. The risk-free rate for periods within the contractual life of the stock option award is based on the yield curve of a zero-coupon U.S. Treasury bond on the date the stock option award is granted with a maturity equal to the expected term of the stock option award. We use historical data to estimate stock option exercises and forfeitures within the valuation model. The expected term of stock option awards granted is derived from historical exercise experience under the share-based employee compensation arrangements and represents the period of time that stock option awards granted are expected to be outstanding. The fair value of market-based restricted stock awards is estimated using a lattice-based option-pricing valuation model that incorporates a Monte-Carlo simulation. Estimates of fair value are not intended to predict actual future events or the value ultimately realized by employees who receive equity awards, and subsequent events are not indicative of the reasonableness of the original estimates of fair value made by Ryder.
The following table presents the weighted-average assumptions used for options granted:
|
|
Years ended December 31,
|
|||||
|
|
2017
|
2016
|
2015
|
|||
|
Option plans:
|
||||||
|
Expected dividends
|
2.3%
|
3.0%
|
1.6%
|
|||
|
Expected volatility
|
28.5%
|
35.2%
|
26.4%
|
|||
|
Risk-free rate
|
1.9%
|
1.1%
|
1.4%
|
|||
|
Expected term in years
|
4.4 years
|
4.3 years
|
4.3 years
|
|||
|
Grant-date fair value
|
$15.71
|
$12.53
|
$18.47
|
|||
Exercise of Employee Stock Options and Purchase Plans
The total intrinsic value of options exercised during
2017
,
2016
and
2015
was
$5 million
,
$5 million
and
$11 million
, respectively. The total cash received from employees under all share-based employee compensation arrangements for
2017
,
2016
and
2015
was
$21 million
,
$18 million
and
$24 million
, respectively. In connection with these exercises, the tax benefits generated from share-based employee compensation arrangements were
$0.2 million
,
$0.6 million
and
$0.4 million
for
2017
,
2016
and
2015
, respectively. As discussed in Note 2, "Recent Accounting Pronouncements," excess tax benefits related to share-based payments are recorded to income tax expense beginning in
2017
.
104
RYDER SYSTEM, INC. AND SUBSIDIARIES
NOTES TO CONSOLIDATED FINANCIAL STATEMENTS - (Continued)
22.
EMPLOYEE BENEFIT PLANS
Pension Plans
We historically sponsored several defined benefit pension plans covering most employees not covered by union-administered plans, including certain employees in foreign countries. These plans generally provided participants with benefits based on years of service and career-average compensation levels.
In past years, we made amendments to defined benefit retirement plans which froze the retirement benefits for non-grandfathered and certain non-union employees in the U.S., Canada and the United Kingdom (U.K.). As a result of these amendments, non-grandfathered plan participants ceased accruing benefits under the plan as of the respective amendment effective date and began receiving an enhanced benefit under a defined contribution plan. All retirement benefits earned as of the amendment effective date were fully preserved and will be paid in accordance with the plan and legal requirements. The funding policy for these plans is to make contributions based on annual service costs plus amortization of unfunded past service liability, but not greater than the maximum allowable contribution deductible for federal income tax purposes. We may, from time to time, make voluntary contributions to our pension plans, which exceed the amount required by statute. The majority of the plans’ assets are invested in a master trust that, in turn, is invested primarily in commingled funds whose investments are listed stocks and bonds.
We also have a non-qualified supplemental pension plan covering certain U.S. employees, which provides for incremental pension payments from our funds so that total pension payments equal the amounts that would have been payable from our principal pension plans if it were not for limitations imposed by income tax regulations. The accrued pension liability related to this plan was
$55 million
and
$53 million
at
December 31, 2017
and
2016
, respectively.
Pension Expense
Pension expense from continuing operations was as follows:
|
|
Years ended December 31,
|
|||||||||
|
|
2017
|
2016
|
2015
|
|||||||
|
|
(In thousands)
|
|||||||||
|
Company-administered plans:
|
||||||||||
|
Service cost
|
$
|
12,345
|
|
12,977
|
|
13,820
|
|
|||
|
Interest cost
|
86,431
|
|
94,476
|
|
88,013
|
|
||||
|
Expected return on plan assets
|
(91,062
|
)
|
(90,588
|
)
|
(98,892
|
)
|
||||
|
Amortization of:
|
||||||||||
|
Net actuarial loss
|
32,987
|
|
31,777
|
|
30,741
|
|
||||
|
Prior service cost (credit)
|
579
|
|
2,976
|
|
(306
|
)
|
||||
|
41,280
|
|
51,618
|
|
33,376
|
|
|||||
|
Union-administered plans
|
15,553
|
|
9,597
|
|
8,328
|
|
||||
|
Net pension expense
|
$
|
56,833
|
|
61,215
|
|
41,704
|
|
|||
|
Company-administered plans:
|
||||||||||
|
U.S.
|
$
|
43,717
|
|
53,319
|
|
34,986
|
|
|||
|
Foreign
|
(2,437
|
)
|
(1,701
|
)
|
(1,610
|
)
|
||||
|
41,280
|
|
51,618
|
|
33,376
|
|
|||||
|
Union-administered plans
|
15,553
|
|
9,597
|
|
8,328
|
|
||||
|
$
|
56,833
|
|
61,215
|
|
41,704
|
|
||||
105
RYDER SYSTEM, INC. AND SUBSIDIARIES
NOTES TO CONSOLIDATED FINANCIAL STATEMENTS - (Continued)
During
2016
, we determined that certain pension benefit improvements made in 2009 had not been fully reflected in our projected benefit obligation. Because the amounts were not material to our consolidated financial statements in any individual period, and the cumulative amount is not material to 2016 results, we recognized a one-time, non-cash charge of
$8 million
in "Selling, general and administrative expenses" and a
$13 million
pre-tax increase to “Accumulated other comprehensive loss” in our consolidated financial statements to correctly state the pension benefit obligation and account for these 2009 benefit improvements.
The following table sets forth the weighted-average actuarial assumptions used for Ryder’s pension plans in determining annual pension expense:
|
|
U.S. Plans
Years ended December 31,
|
Foreign Plans
Years ended December 31,
|
||||||||||
|
|
2017
|
2016
|
2015
|
2017
|
2016
|
2015
|
||||||
|
Discount rate
|
4.20%
|
4.50%
|
4.15%
|
3.90%
|
3.70%
|
3.70%
|
||||||
|
Rate of increase in compensation levels
|
3.00%
|
3.00%
|
3.00%
|
3.10%
|
3.10%
|
3.10%
|
||||||
|
Expected long-term rate of return on plan assets
|
5.40%
|
5.85%
|
5.95%
|
5.48%
|
5.44%
|
5.50%
|
||||||
|
Gain and loss amortization period (years)
|
21
|
23
|
23
|
26
|
27
|
27
|
||||||
The return on plan assets assumption reflects the weighted-average of the expected long-term rates of return for the broad categories of investments held in the plans. The expected long-term rate of return is adjusted when there are fundamental changes in expected returns or in asset allocation strategies of the plan assets.
Obligations and Funded Status
The following table sets forth the benefit obligations, assets and funded status associated with our pension plans:
|
|
December 31,
|
||||||
|
|
2017
|
2016
|
|||||
|
|
(In thousands)
|
||||||
|
Change in benefit obligations:
|
|||||||
|
Benefit obligations at January 1
|
$
|
2,228,762
|
|
2,091,844
|
|
||
|
Service cost
|
12,345
|
|
12,977
|
|
|||
|
Interest cost
|
86,431
|
|
94,476
|
|
|||
|
Actuarial loss
|
100,905
|
|
189,523
|
|
|||
|
Pension annuity settlement
|
(66,423
|
)
|
—
|
|
|||
|
Benefits paid
|
(104,054
|
)
|
(96,723
|
)
|
|||
|
Foreign currency exchange rate changes
|
40,936
|
|
(63,335
|
)
|
|||
|
Benefit obligations at December 31
|
2,298,902
|
|
2,228,762
|
|
|||
|
Change in plan assets:
|
|||||||
|
Fair value of plan assets at January 1
|
1,787,075
|
|
1,647,286
|
|
|||
|
Actual return on plan assets
|
244,916
|
|
176,066
|
|
|||
|
Employer contribution
|
41,219
|
|
127,991
|
|
|||
|
Benefits paid
|
(104,054
|
)
|
(96,723
|
)
|
|||
|
Pension annuity settlement
|
(71,299
|
)
|
—
|
|
|||
|
Foreign currency exchange rate changes
|
43,473
|
|
(67,545
|
)
|
|||
|
Fair value of plan assets at December 31
|
1,941,330
|
|
1,787,075
|
|
|||
|
Funded status
|
$
|
(357,572
|
)
|
(441,687
|
)
|
||
|
Funded percent
|
84
|
%
|
80
|
%
|
|||
During 2017, we completed a transfer of future retiree benefits in our U.S. defined benefit plan to a third-party annuity company. We paid
$71 million
in connection with this transfer, which included a
$66 million
reduction in our projected benefit obligation and an annuity premium. We did not record a gain or loss on this transaction as the cost of all settlements during the year, including this transaction, were less than our combined service and interest costs for the year.
106
RYDER SYSTEM, INC. AND SUBSIDIARIES
NOTES TO CONSOLIDATED FINANCIAL STATEMENTS - (Continued)
The funded status of our pension plans was presented in the Consolidated Balance Sheets as follows:
|
|
December 31,
|
||||||
|
|
2017
|
2016
|
|||||
|
|
(In thousands)
|
||||||
|
Noncurrent asset
|
$
|
58,708
|
|
14,049
|
|
||
|
Current liability
|
(3,863
|
)
|
(3,796
|
)
|
|||
|
Noncurrent liability
|
(412,417
|
)
|
(451,940
|
)
|
|||
|
Net amount recognized
|
$
|
(357,572
|
)
|
(441,687
|
)
|
||
Amounts recognized in accumulated other comprehensive loss (pre-tax) consisted of:
|
|
December 31,
|
||||||
|
|
2017
|
2016
|
|||||
|
|
(In thousands)
|
||||||
|
Prior service cost
|
$
|
11,135
|
|
11,714
|
|
||
|
Net actuarial loss
|
878,386
|
|
961,010
|
|
|||
|
Net amount recognized
|
$
|
889,521
|
|
972,724
|
|
||
In
2018
, we expect to recognize
$29 million
of net actuarial loss amortization as a component of pension expense.
The following table sets forth the weighted-average actuarial assumptions used in determining funded status:
|
|
U.S. Plans
December 31,
|
Foreign Plans
December 31,
|
||||||
|
|
2017
|
2016
|
2017
|
2016
|
||||
|
Discount rate
|
3.70%
|
4.20%
|
2.70%
|
3.90%
|
||||
|
Rate of increase in compensation levels
|
3.00%
|
3.00%
|
3.10%
|
3.10%
|
||||
At
December 31, 2017
and
2016
, our accumulated benefit obligations, as well as, our pension obligations (accumulated benefit obligations (ABO), and projected benefit obligations (PBO)), greater than the fair value of the related plan assets for our U.S. and foreign plans were as follows:
|
|
U.S. Plans
December 31,
|
Foreign Plans
December 31,
|
Total
December 31,
|
||||||||||||||||
|
|
2017
|
2016
|
2017
|
2016
|
2017
|
2016
|
|||||||||||||
|
|
(In thousands)
|
||||||||||||||||||
|
Total accumulated benefit obligations
|
$
|
1,781,882
|
|
1,748,171
|
|
492,864
|
|
454,301
|
|
2,274,746
|
|
2,202,472
|
|
||||||
|
Plans with pension obligations in excess of plan assets:
|
|||||||||||||||||||
|
PBO
|
1,804,260
|
|
1,771,968
|
|
7,802
|
|
7,383
|
|
1,812,062
|
|
1,779,351
|
|
|||||||
|
ABO
|
1,781,882
|
|
1,748,171
|
|
6,502
|
|
5,997
|
|
1,788,384
|
|
1,754,168
|
|
|||||||
|
Fair value of plan assets
|
1,395,790
|
|
1,323,751
|
|
—
|
|
—
|
|
1,395,790
|
|
1,323,751
|
|
|||||||
Plan Assets
Our pension investment strategy is to reduce the effects of future volatility on the fair value of our pension assets relative to our pension liabilities. We increase our allocation of high quality, longer-term fixed income securities and reduce our allocation of equity investments as the funded status of the plans improve. The plans utilize several investment strategies, including actively and passively managed equity and fixed income strategies. The investment policy establishes targeted allocations for each asset class that incorporate measures of asset and liability risks. Deviations between actual pension plan asset allocations and targeted asset allocations may occur as a result of investment performance and changes in the funded status from time to time. Rebalancing of our pension plan asset portfolios is evaluated periodically and rebalanced if actual allocations exceed an acceptable range. U.S. plans account for approximately
72%
of our total pension plan assets. Equity securities primarily include investments in both domestic and international common collective trusts and publicly traded equities. Fixed income securities primarily include domestic collective trusts and corporate bonds. Other types of investments include private equity fund-of-funds and hedge fund-of-funds. Equity and fixed income securities in our international plans include actively and passively managed mutual funds.
107
RYDER SYSTEM, INC. AND SUBSIDIARIES
NOTES TO CONSOLIDATED FINANCIAL STATEMENTS - (Continued)
The following table presents the fair value of each major category of pension plan assets and the level of inputs used to measure fair value as of
December 31, 2017
and
2016
:
|
|
Fair Value Measurements at
December 31, 2017 |
||||||||||||
|
Asset Category
|
Total
|
Level 1
|
Level 2
|
Level 3
|
|||||||||
|
|
(In thousands)
|
||||||||||||
|
Equity securities:
|
|||||||||||||
|
U.S. common collective trusts
|
$
|
443,405
|
|
—
|
|
443,405
|
|
—
|
|
||||
|
Foreign common collective trusts
|
458,111
|
|
—
|
|
458,111
|
|
—
|
|
|||||
|
Fixed income securities:
|
|||||||||||||
|
Corporate bonds
|
85,117
|
|
—
|
|
85,117
|
|
—
|
|
|||||
|
Common collective trusts
|
840,104
|
|
—
|
|
840,104
|
|
—
|
|
|||||
|
Private equity and hedge funds
|
114,593
|
|
—
|
|
—
|
|
114,593
|
|
|||||
|
Total
|
$
|
1,941,330
|
|
—
|
|
1,826,737
|
|
114,593
|
|
||||
|
|
Fair Value Measurements at
December 31, 2016 |
||||||||||||
|
Asset Category
|
Total
|
Level 1
|
Level 2
|
Level 3
|
|||||||||
|
|
(In thousands)
|
||||||||||||
|
Equity securities:
|
|||||||||||||
|
U.S. common collective trusts
|
$
|
429,456
|
|
—
|
|
429,456
|
|
—
|
|
||||
|
Foreign common collective trusts
|
398,282
|
|
—
|
|
398,282
|
|
—
|
|
|||||
|
Fixed income securities:
|
|||||||||||||
|
Corporate bonds
|
76,086
|
|
—
|
|
76,086
|
|
—
|
|
|||||
|
Common collective trusts
|
780,367
|
|
—
|
|
780,367
|
|
—
|
|
|||||
|
Private equity and hedge funds
|
102,884
|
|
—
|
|
—
|
|
102,884
|
|
|||||
|
Total
|
$
|
1,787,075
|
|
—
|
|
1,684,191
|
|
102,884
|
|
||||
The following is a description of the valuation methodologies used for our pension assets as well as the level of input used to measure fair value:
Equity securities
— These investments include common and preferred stocks and index common collective trusts that track U.S. and foreign indices. The common collective trusts were valued at the unit prices established by the funds’ sponsors based on the fair value of the assets underlying the funds. Since the units of the funds are not actively traded, the fair value measurements have been classified within Level 2 of the fair value hierarchy.
Fixed income securities
— These investments include investment grade bonds of U.S. issuers from diverse industries, government issuers, index common collective trusts that track the Barclays Aggregate Index and other fixed income investments (primarily mortgage-backed securities). Fair values for the corporate bonds were valued using third-party pricing services. These sources determine prices utilizing market income models which factor in, where applicable, transactions of similar assets in active markets, transactions of identical assets in infrequent markets, interest rates, bond or credit default swap spreads and volatility. Since the corporate bonds are not actively traded, the fair value measurements have been classified within Level 2 of the fair value hierarchy. The common collective trusts were valued at the unit prices established by the funds’ sponsors based on the fair value of the assets underlying the funds. Since the units of the funds are not actively traded, the fair value measurements have been classified within Level 2 of the fair value hierarchy. The other investments are not actively traded and fair values are estimated using bids provided by brokers, dealers or quoted prices of similar securities with similar characteristics or pricing models. Therefore, the other investments have been classified within Level 2 of the fair value hierarchy.
Private equity and hedge funds
— These investments represent limited partnership interests in private equity and hedge funds. The partnership interests are valued by the general partners based on the underlying assets in each fund. The limited partnership interests are valued using unobservable inputs and have been classified within Level 3 of the fair value hierarchy.
108
RYDER SYSTEM, INC. AND SUBSIDIARIES
NOTES TO CONSOLIDATED FINANCIAL STATEMENTS - (Continued)
The following table presents a summary of changes in the fair value of the pension plans’ Level 3 assets for the years ended
December 31, 2017
and
2016
:
|
2017
|
2016
|
||||||
|
|
(In thousands)
|
||||||
|
Beginning balance at January 1
|
$
|
102,884
|
|
100,631
|
|
||
|
Return on plan assets:
|
|||||||
|
Relating to assets still held at the reporting date
|
10,795
|
|
1,548
|
|
|||
|
Relating to assets sold during the period
|
(405
|
)
|
703
|
|
|||
|
Purchases, sales, settlements and expenses
|
1,319
|
|
2
|
|
|||
|
Ending balance at December 31
|
$
|
114,593
|
|
102,884
|
|
||
The following table details pension benefits expected to be paid in each of the next five fiscal years and in aggregate for the five fiscal years thereafter:
|
|
(In thousands)
|
||
|
2018
|
$
|
102,131
|
|
|
2019
|
104,563
|
|
|
|
2020
|
109,013
|
|
|
|
2021
|
113,370
|
|
|
|
2022
|
117,272
|
|
|
|
2023-2027
|
626,726
|
|
|
For
2018
, required pension contributions to our pension plans are estimated to be
$34 million
.
Multi-employer Plans
We participate in multi-employer plans that provide defined benefits to certain employees covered by collective-bargaining agreements. Such plans are usually administered by a board of trustees comprised of the management of the participating companies and labor representatives. The net pension cost of these plans is equal to the annual contribution determined in accordance with the provisions of negotiated labor contracts. Assets contributed to such plans are not segregated or otherwise restricted to provide benefits only to our employees. The risks of participating in these multi-employer plans are different from single-employer plans in the following respects: 1) assets contributed to the multi-employer plan by one employer may be used to provide benefits to employees and former employees of other participating employers; 2) if a participating employer is no longer able to contribute to the plan, the unfunded obligations of the plan may be borne by the remaining participating employers at annual contribution rates under the collective bargaining agreements; 3) if there is a mass withdrawal of substantially all employers from the plan, we may be required to pay the plan an annual contribution based on historical contribution levels as prescribed by federal statute; and 4) if we choose to stop participating in some of our multi-employer plans, we may be required to pay those plans an amount based on the underfunded status of the plan, which is referred to as a withdrawal liability.
During
2017
, we recorded an estimated pension settlement charge of
$5 million
for the exit from the Central States Southeast and Southwest Areas multi-employer pension plan. This charge was recorded within “Selling, general, and administrative expenses” in our Consolidated Statement of Earnings and is included in the Union-administered plans expense. During
2015
, we recognized a benefit of
$1 million
for
adjustments to previously recognized estimated pension settlement charges related to our exit from U.S. multi-employer pension plans. These adjustments were included in "Selling, general, and administrative expenses" in our Consolidated Statement of Earnings and are a component of Union-administered plans expense.
Our participation in these plans is outlined in the table below. Unless otherwise noted, the most recent Pension Protection Act zone status available in
2017
and
2016
is for the plan years ended
December 31, 2016
and
December 31, 2015
, respectively. The zone status is based on information that we received from the plan. Among other factors, plans in the red zone are generally less than sixty-five percent funded, plans in the yellow zone are less than eighty percent funded, and plans in the green zone are at least eighty percent funded.
109
RYDER SYSTEM, INC. AND SUBSIDIARIES
NOTES TO CONSOLIDATED FINANCIAL STATEMENTS - (Continued)
|
|
Pension Protection Act Zone Status
|
Ryder Contributions
|
Expiration Date(s) of Collective-Bargaining Agreement(s)
|
|||||||||||||||||||
|
Pension Fund
|
Employer Identification Number
|
2017
|
2016
|
FIP/RP Status Pending/ Implemented
(1)
|
2017
|
2016
|
2015
|
Surcharge Imposed
|
||||||||||||||
|
|
|
|
|
|
(Dollars in thousands)
|
|
|
|||||||||||||||
|
Western Conference Teamsters
|
91-6145047
|
Green
|
Green
|
No
|
$
|
3,245
|
|
2,613
|
|
2,430
|
|
No
|
1/12/18 to 4/1/21
|
|||||||||
|
IAM National
|
51-6031295
|
Green
|
Green
|
No
|
3,891
|
|
4,162
|
|
3,801
|
|
No
|
3/31/17 to 11/30/19
|
||||||||||
|
Automobile Mechanics
Local No. 701 |
36-6042061
|
Yellow
|
Yellow
|
RP Adopted
|
2,048
|
|
2,201
|
|
1,902
|
|
Yes
|
10/31/17 to 5/31/19
|
||||||||||
|
Central States Southeast and Southwest Areas
|
36-6044243
|
Red
|
Red
|
RP Adopted
|
244
|
|
259
|
|
254
|
|
Yes
|
5/6/17 to 10/31/17
|
||||||||||
|
Other funds
|
671
|
|
501
|
|
450
|
|
||||||||||||||||
|
Total contributions
|
10,099
|
|
9,736
|
|
8,837
|
|
||||||||||||||||
|
Pension settlement charges (benefit)
|
5,454
|
|
(139
|
)
|
(509
|
)
|
||||||||||||||||
|
Union-administered plans
|
$
|
15,553
|
|
9,597
|
|
8,328
|
|
|||||||||||||||
_____________
|
(1)
|
The “FIP/RP Status Pending/Implemented” column indicates plans for which a financial improvement plan (FIP) or a rehabilitation plan (RP) is either pending or has been implemented.
|
Our contributions are impacted by changes in contractual contributions rates as well as changes in the number of employees covered by each plan.
Savings Plans
Employees who do not actively participate in pension plans and are not covered by union-administered plans are generally eligible to participate in enhanced savings plans. These plans provide for (i) a company contribution even if employees do not make contributions for employees hired before January 1, 2016, (ii) a company match of employee contributions of eligible pay, subject to tax limits and (iii) a discretionary company match. Savings plan costs totaled
$39 million
in
2017
and
$38 million
in both
2016
and
2015
.
Deferred Compensation and Long-Term Compensation Plans
We have deferred compensation plans that permit eligible U.S. employees, officers and directors to defer a portion of their compensation. The deferred compensation liability, including Ryder matching amounts and accumulated earnings, totaled
$63 million
and
$50 million
at
December 31, 2017
and
2016
, respectively.
We have established grantor trusts (Rabbi Trusts) to provide funding for benefits payable under the supplemental pension plan, deferred compensation plans and long-term incentive compensation plans. The assets held in the trusts were
$63 million
and
$50 million
at
December 31, 2017
and
2016
, respectively. The Rabbi Trusts’ assets consist of short-term cash investments and a managed portfolio of equity securities, including our common stock. These assets, except for the investment in our common stock, are included in “Direct financing leases and other assets” because they are available to our general creditors in the event of insolvency. The equity securities are classified as trading securities and stated at fair value. Both realized and unrealized gains and losses are included in “Miscellaneous income, net.” The Rabbi Trusts’ investment of
$2 million
in our common stock at both
December 31, 2017
and
2016
, is reflected at historical cost and included in shareholders’ equity.
Other Postretirement Benefits
We sponsor plans that provide retired U.S. and Canadian employees with certain healthcare and life insurance benefits. Substantially all U.S. and Canadian employees not covered by union-administered health and welfare plans are eligible for the healthcare benefits. Healthcare benefits for our principal plan are generally provided to qualified retirees under age
65
and eligible dependents. This plan requires employee contributions that vary based on years of service and include provisions that limit our contributions. In prior years, we made amendments to our healthcare benefits for early retirees which modified future eligibility requirements for non-grandfathered retirees in the U.S. The post-retirement medical plan was closed to participants who were not at least age
52
with
12
years of service as of December 31, 2013.
110
RYDER SYSTEM, INC. AND SUBSIDIARIES
NOTES TO CONSOLIDATED FINANCIAL STATEMENTS - (Continued)
Total postretirement benefit income was as follows:
|
|
Years ended December 31,
|
|||||||||
|
|
2017
|
2016
|
2015
|
|||||||
|
|
(In thousands)
|
|||||||||
|
Service cost
|
$
|
191
|
|
215
|
|
363
|
|
|||
|
Interest cost
|
833
|
|
906
|
|
1,097
|
|
||||
|
Amortization of:
|
||||||||||
|
Net actuarial gain
|
(1,796
|
)
|
(1,989
|
)
|
(1,773
|
)
|
||||
|
Prior service credit
|
(231
|
)
|
(231
|
)
|
(1,083
|
)
|
||||
|
Postretirement benefit income
|
$
|
(1,003
|
)
|
(1,099
|
)
|
(1,396
|
)
|
|||
|
U.S.
|
$
|
(1,308
|
)
|
(1,429
|
)
|
(1,887
|
)
|
|||
|
Foreign
|
305
|
|
330
|
|
491
|
|
||||
|
$
|
(1,003
|
)
|
(1,099
|
)
|
(1,396
|
)
|
||||
The following table sets forth the weighted-average discount rates used in determining annual postretirement benefit expense:
|
U.S. Plan
Years ended December 31,
|
Foreign Plan
Years ended December 31,
|
|||||||||||
|
|
2017
|
2016
|
2015
|
2017
|
2016
|
2015
|
||||||
|
Discount rate
|
4.20%
|
4.50%
|
4.15%
|
4.00%
|
4.00%
|
4.00%
|
||||||
Our postretirement benefit plans are not funded. The following table sets forth the benefit obligations associated with our postretirement benefit plans:
|
|
December 31,
|
||||||
|
|
2017
|
2016
|
|||||
|
|
(In thousands)
|
||||||
|
Benefit obligations at January 1
|
$
|
20,965
|
|
21,626
|
|
||
|
Service cost
|
191
|
|
215
|
|
|||
|
Interest cost
|
833
|
|
906
|
|
|||
|
Actuarial loss (gain)
|
16
|
|
(338
|
)
|
|||
|
Benefits paid
|
(1,182
|
)
|
(1,609
|
)
|
|||
|
Foreign currency exchange rate changes
|
418
|
|
165
|
|
|||
|
Benefit obligations at December 31
|
$
|
21,241
|
|
20,965
|
|
||
Amounts recognized in the Consolidated Balance Sheets consisted of:
|
|
December 31,
|
||||||
|
|
2017
|
2016
|
|||||
|
|
(In thousands)
|
||||||
|
Current liability
|
$
|
1,481
|
|
1,506
|
|
||
|
Noncurrent liability
|
19,760
|
|
19,459
|
|
|||
|
Amount recognized
|
$
|
21,241
|
|
20,965
|
|
||
111
RYDER SYSTEM, INC. AND SUBSIDIARIES
NOTES TO CONSOLIDATED FINANCIAL STATEMENTS - (Continued)
Amounts recognized in accumulated other comprehensive loss (pre-tax) consisted of:
|
|
December 31,
|
||||||
|
|
2017
|
2016
|
|||||
|
|
(In thousands)
|
||||||
|
Prior service credit
|
$
|
(154
|
)
|
(385
|
)
|
||
|
Net actuarial gain
|
(8,371
|
)
|
(10,186
|
)
|
|||
|
Net amount recognized
|
$
|
(8,525
|
)
|
(10,571
|
)
|
||
In
2018
, we expect to recognize approximately
$1 million
of the net actuarial gain as a component of postretirement benefit expense. The amount of prior service credit we expect to recognize in
2018
as a component of total postretirement benefit expense is not material.
Our annual measurement date is December 31 for both U.S. and foreign postretirement benefit plans. Assumptions used in determining accrued postretirement benefit obligations were as follows:
|
U.S. Plan
December 31,
|
Foreign Plan
December 31,
|
|||||||||||
|
|
2017
|
2016
|
2017
|
2016
|
||||||||
|
Discount rate
|
3.70
|
%
|
4.20
|
%
|
3.40
|
%
|
3.90
|
%
|
||||
|
Rate of increase in compensation levels
|
3.00
|
%
|
3.00
|
%
|
3.00
|
%
|
3.00
|
%
|
||||
|
Healthcare cost trend rate assumed for next year
|
7.25
|
%
|
7.50
|
%
|
5.00
|
%
|
5.00
|
%
|
||||
|
Rate to which the cost trend rate is assumed to decline (ultimate trend rate)
|
5.00
|
%
|
5.00
|
%
|
5.00
|
%
|
5.00
|
%
|
||||
|
Year that the rate reaches the ultimate trend rate
|
2027
|
|
2027
|
|
2017
|
|
2018
|
|
||||
Changing the assumed healthcare cost trend rates by
1%
in each year would not have a material effect on the accumulated postretirement benefit obligation at
December 31, 2017
or annual postretirement benefit expense for
2017
.
The following table details other postretirement benefits expected to be paid in each of the next five fiscal years and in aggregate for the five fiscal years thereafter:
|
|
(In thousands)
|
|
|
|
2018
|
$
|
1,491
|
|
|
2019
|
1,463
|
|
|
|
2020
|
1,428
|
|
|
|
2021
|
1,443
|
|
|
|
2022
|
1,442
|
|
|
|
2023-2027
|
6,602
|
|
|
112
RYDER SYSTEM, INC. AND SUBSIDIARIES
NOTES TO CONSOLIDATED FINANCIAL STATEMENTS - (Continued)
23.
ENVIRONMENTAL MATTERS
Our operations involve storing and dispensing petroleum products, primarily diesel fuel, regulated under environmental protection laws. These laws require us to eliminate or mitigate the effect of such substances on the environment. In response to these requirements, we continually upgrade our operating facilities and implement various programs to detect and minimize contamination. In addition, we have received notices from the Environmental Protection Agency (EPA) and others that we have been identified as a potentially responsible party under the Comprehensive Environmental Response, Compensation and Liability Act, the Superfund Amendments and Reauthorization Act and similar state statutes. We may be required to share in the cost of cleanup of
19
identified disposal sites.
Our environmental expenses which are presented within “Cost of fuel services” in our Consolidated Statements of Earnings, consist of remediation costs as well as normal recurring expenses such as licensing, testing and waste disposal fees. These expenses totaled
$12 million
,
$10 million
and
$9 million
in
2017
,
2016
and
2015
, respectively. The carrying amount of our environmental liabilities was
$10 million
and
$9 million
at
December 31, 2017
and
2016
, respectively. Our asset retirement obligations related to fuel tanks to be removed are not included above. Asset retirement obligations totaled
$26 million
as of December 31, 2017 and 2016, respectively. The carrying amount of our environmental liabilities and our asset retirement obligations are included in “Accrued expenses and other current liabilities” and “Other non-current liabilities” in our Consolidated Balance Sheets.
The ultimate cost of our environmental liabilities cannot presently be projected with certainty due to the presence of several unknown factors, primarily the level of contamination, the effectiveness of selected remediation methods, the stage of investigation at individual sites, the determination of our liability in proportion to other responsible parties and the recoverability of such costs from third parties. Based on information presently available, we believe that the ultimate disposition of these matters, although potentially material to the results of operations in any one year, will not have a material adverse effect on our financial condition or liquidity.
24.
OTHER ITEMS IMPACTING COMPARABILITY
Our primary measure of segment performance as shown in
Note 28
, "
Segment Reporting
", excludes certain items we do not believe are representative of the ongoing operations of the segment. Excluding these items from our segment measure of performance allows for better year over year comparison:
|
|
Years ended December 31,
|
||||||||
|
|
2017
|
2016
|
2015
|
||||||
|
|
(In thousands)
|
||||||||
|
Restructuring charges and fees, net
(1)
|
$
|
(21,405
|
)
|
(5,074
|
)
|
(18,068
|
)
|
||
|
Tax reform related bonus
|
(23,278
|
)
|
—
|
|
—
|
|
|||
|
Operating tax adjustment
|
(2,205
|
)
|
—
|
|
—
|
|
|||
|
Pension related adjustment
(2)
|
(5,454
|
)
|
(7,650
|
)
|
509
|
|
|||
|
Gain on sale of property
(3)
|
24,122
|
|
—
|
|
—
|
|
|||
|
Restructuring charges and fees, net and other items
|
$
|
(28,220
|
)
|
(12,724
|
)
|
(17,559
|
)
|
||
_______________
(1) Refer to
Note 4
, "
Restructuring Charges and Fees, Net
," for additional information.
(2) Refer to
Note 22
, "
Employee Benefit Plans
," for additional information.
(3) Refer to
Note 27
,
Miscellaneous Income, Net
for additional information.
In connection with the passing of the 2017 Tax Cuts and Jobs Act, we awarded a one-time bonus, totaling
$23 million
in the aggregate, to all U.S.-based non-incentive eligible employees of the Company as of
December 31, 2017
. The bonus is reflected within “Selling, general and administrative expenses” in our Consolidated Statement of Earnings.
During
2017
, we determined that certain operating tax expenses related to prior periods had not been recognized in prior period earnings. We recorded a one-time charge of
$2 million
within “Selling, general and administrative
expenses” in our Consolidated Statement of Earnings as the impact of the adjustment was not material to our
consolidated financial statements.
113
RYDER SYSTEM, INC. AND SUBSIDIARIES
NOTES TO CONSOLIDATED FINANCIAL STATEMENTS - (Continued)
25.
OTHER MATTERS
We are a party to various claims, complaints and proceedings arising in the ordinary course of our continuing business operations including, but not limited to, those relating to commercial and employment claims, environmental matters, risk management matters (e.g., vehicle liability, workers’ compensation, etc.) and administrative assessments primarily associated with operating taxes. We have established loss provisions for matters in which losses are probable and can be reasonably estimated. For matters from continuing operations, we believe that the resolution of these claims, complaints and legal proceedings will not have a material effect on our consolidated financial statements.
Our estimates regarding potential losses and materiality are based on our judgment and assessment of the claims utilizing currently available information. Although we will continue to reassess our reserves and estimates based on future developments, our objective assessment of the legal merits of such claims may not always be predictive of the outcome and actual results may vary from our current estimates.
26.
SUPPLEMENTAL CASH FLOW INFORMATION
Supplemental cash flow information was as follows:
|
|
Years ended December 31,
|
|||||||||
|
|
2017
|
2016
|
2015
|
|||||||
|
|
(In thousands)
|
|||||||||
|
Interest paid
|
$
|
129,559
|
|
143,990
|
|
144,973
|
|
|||
|
Income taxes paid
|
13,692
|
|
14,062
|
|
13,379
|
|
||||
|
Changes in accounts payable related to purchases of revenue earning equipment
|
80,781
|
|
(142,256
|
)
|
28,134
|
|
||||
|
Operating and revenue earning equipment acquired under capital leases
|
7,057
|
|
1,230
|
|
5,959
|
|
||||
27.
MISCELLANEOUS INCOME, NET
|
|
Years ended December 31,
|
||||||||
|
2017
|
2016
|
2015
|
|||||||
|
Gains on sales of operating property and equipment
|
$
|
26,093
|
|
2,475
|
|
3,045
|
|
||
|
Insurance proceeds/recoveries
|
1,734
|
|
966
|
|
—
|
|
|||
|
Contract settlement
|
1,600
|
|
—
|
|
55
|
|
|||
|
Foreign currency transaction gains
|
657
|
|
1,236
|
|
1,945
|
|
|||
|
Rabbi trust investment income
|
10,522
|
|
2,763
|
|
632
|
|
|||
|
Other, net
|
3,639
|
|
5,628
|
|
4,479
|
|
|||
|
Total
|
$
|
44,245
|
|
13,068
|
|
10,156
|
|
||
The increase in
2017
is primarily driven by gains of sales of properties of
$26 million
, which includes the gain on the sale of a SCS property of
$24 million
, and rabbi trust investment income of
$11 million
. The increase in
2016
is primarily driven by increased rabbi trust investment income.
114
RYDER SYSTEM, INC. AND SUBSIDIARIES
NOTES TO CONSOLIDATED FINANCIAL STATEMENTS - (Continued)
28.
SEGMENT REPORTING
Our operating segments are aggregated into reportable business segments based upon similar economic characteristics, products, services, customers and delivery methods. We report our financial performance in
three
business segments: (1) FMS, which provides leasing, commercial rental and maintenance of trucks, tractors and trailers to customers principally in the U.S., Canada and the U.K.; (2) DTS, which provides vehicles and drivers as part of a dedicated transportation solution in the U.S.; and (3) SCS, which provides comprehensive supply chain solutions including distribution and transportation services in North America and Singapore. Dedicated transportation services provided as part of an integrated, multi-service, supply chain solution to SCS customers are reported in the SCS business segment.
Our primary measurement of segment financial performance, defined as “Earnings Before Tax” (EBT) from continuing operations, includes an allocation of Central Support Services (CSS) and excludes non-operating pension costs, restructuring charges and fees, net discussed in
Note 4
, "
Restructuring Charges and Fees, Net
" and items discussed in
Note 24
, "
Other Items Impacting Comparability
." CSS represents those costs incurred to support all business segments, including human resources, finance, corporate services, public affairs, information technology, health and safety, legal, marketing and corporate communications. The objective of the EBT measurement is to provide clarity on the profitability of each business segment and, ultimately, to hold leadership of each business segment accountable for their allocated share of CSS costs. Certain costs are considered to be overhead not attributable to any segment and remain unallocated in CSS. Included among the unallocated overhead remaining within CSS are the costs for investor relations, public affairs and certain executive compensation. CSS costs attributable to the business segments are predominantly allocated to FMS, DTS and SCS as follows:
•
Finance, corporate services, and health and safety
— allocated based upon estimated and planned resource utilization;
•
Human resources
— individual costs within this category are allocated under various methods, including allocation based on estimated utilization and number of personnel supported;
•
Information technology
— principally allocated based upon utilization-related metrics such as number of users or minutes of CPU time. Customer-related project costs and expenses are allocated to the business segment responsible for the project; and
•
Other
— represents legal and other centralized costs and expenses including certain share-based incentive compensation costs. Expenses, where allocated, are based primarily on the number of personnel supported.
115
RYDER SYSTEM, INC. AND SUBSIDIARIES
NOTES TO CONSOLIDATED FINANCIAL STATEMENTS - (Continued)
Our FMS segment leases revenue earning equipment and provides fuel, maintenance and other ancillary services to the DTS and SCS segments. Inter-segment revenue and EBT are accounted for at rates similar to those executed with third parties. EBT related to inter-segment equipment and services billed to DTS and SCS customers (equipment contribution) are included in both FMS and the business segment which served the customer and then eliminated (presented as “Eliminations”). Prior amounts have been reclassified to conform to the current period presentation.
Segment results are not necessarily indicative of the results of operations that would have occurred had each segment been an independent, stand-alone entity during the periods presented. Each business segment follows the same accounting policies as described in
Note 1
, “
Summary of Significant Accounting Policies
.” Business segment revenue and EBT from continuing operations is as follows:
|
|
Years ended December 31,
|
|||||||||
|
|
2017
|
2016
|
2015
|
|||||||
|
|
(In thousands)
|
|||||||||
|
Revenue:
|
||||||||||
|
Fleet Management Solutions:
|
||||||||||
|
ChoiceLease
|
$
|
2,460,424
|
|
2,362,040
|
|
2,220,929
|
|
|||
|
Commercial rental
|
777,261
|
|
808,912
|
|
900,624
|
|
||||
|
ChoiceLease and commercial rental
|
3,237,685
|
|
3,170,952
|
|
3,121,553
|
|
||||
|
SelectCare
|
428,422
|
|
415,507
|
|
391,137
|
|
||||
|
Other
|
77,450
|
|
78,042
|
|
77,625
|
|
||||
|
Fuel services revenue
|
520,500
|
|
463,738
|
|
538,277
|
|
||||
|
Total Fleet Management Solutions from external customers
|
4,264,057
|
|
4,128,239
|
|
4,128,592
|
|
||||
|
Inter-segment revenue
|
469,514
|
|
427,955
|
|
417,100
|
|
||||
|
Fleet Management Solutions
|
4,733,571
|
|
4,556,194
|
|
4,545,692
|
|
||||
|
Dedicated Transportation Solutions
|
1,096,042
|
|
1,020,895
|
|
895,538
|
|
||||
|
Supply Chain Solutions
|
1,969,500
|
|
1,637,850
|
|
1,547,763
|
|
||||
|
Eliminations
|
(469,514
|
)
|
(427,955
|
)
|
(417,100
|
)
|
||||
|
Total revenue
|
$
|
7,329,599
|
|
6,786,984
|
|
6,571,893
|
|
|||
|
EBT:
|
||||||||||
|
Fleet Management Solutions
|
$
|
312,720
|
|
370,829
|
|
461,314
|
|
|||
|
Dedicated Transportation Solutions
|
55,328
|
|
63,571
|
|
45,575
|
|
||||
|
Supply Chain Solutions
|
103,102
|
|
105,532
|
|
93,575
|
|
||||
|
Eliminations
|
(53,275
|
)
|
(50,148
|
)
|
(47,193
|
)
|
||||
|
$
|
417,875
|
|
489,784
|
|
553,271
|
|
||||
|
Unallocated Central Support Services
|
(48,128
|
)
|
(40,736
|
)
|
(48,700
|
)
|
||||
|
Non-operating pension costs
(1)
|
(27,741
|
)
|
(29,943
|
)
|
(17,797
|
)
|
||||
|
Restructuring charges and fees, net and other items
(2)
|
(28,220
|
)
|
(12,724
|
)
|
(17,559
|
)
|
||||
|
Earnings before income taxes from continuing operations
|
$
|
313,786
|
|
406,381
|
|
469,215
|
|
|||
______________
|
(1)
|
Non-operating pension costs include the amortization of net actuarial loss and prior service costs, interest cost and expected return on plan assets
|
components of pension and postretirement benefit costs.
|
(2)
|
See
Note 24
, “
Other Items Impacting Comparability
,” for a discussion of items excluded from our primary measure of segment performance.
|
116
RYDER SYSTEM, INC. AND SUBSIDIARIES
NOTES TO CONSOLIDATED FINANCIAL STATEMENTS - (Continued)
The following table sets forth non-operating pension costs and share-based compensation expense, depreciation expense, used vehicle sales, net, amortization expense and other non-cash charges, net, interest expense (income), capital expenditures paid and total assets for the years ended
December 31, 2017
,
2016
and
2015
, as provided to the chief operating decision-maker for each of Ryder’s reportable business segments:
|
FMS
|
DTS
|
SCS
|
CSS
|
Eliminations
|
Total
|
||||||||||||||
|
(In thousands)
|
|||||||||||||||||||
|
2017
|
|||||||||||||||||||
|
Non-operating pension costs and share-based compensation expense
|
$
|
5,339
|
|
1,270
|
|
2,982
|
|
37,117
|
|
—
|
|
46,708
|
|
||||||
|
Depreciation expense
(1)
|
$
|
1,218,492
|
|
3,520
|
|
32,255
|
|
908
|
|
—
|
|
1,255,175
|
|
||||||
|
Used vehicle sales, net
|
$
|
17,553
|
|
(113
|
)
|
(199
|
)
|
—
|
|
—
|
|
17,241
|
|
||||||
|
Amortization expense and other non-cash charges, net
|
$
|
29,550
|
|
(21,967
|
)
|
1,015
|
|
3,516
|
|
—
|
|
12,114
|
|
||||||
|
Interest expense (income)
(2)
|
$
|
144,137
|
|
(1,659
|
)
|
(2,446
|
)
|
318
|
|
—
|
|
140,350
|
|
||||||
|
Capital expenditures paid
|
$
|
1,783,917
|
|
3,375
|
|
50,117
|
|
23,027
|
|
—
|
|
1,860,436
|
|
||||||
|
Total assets
|
$
|
10,386,613
|
|
276,832
|
|
864,022
|
|
196,686
|
|
(271,922
|
)
|
11,452,231
|
|
||||||
|
2016
|
|||||||||||||||||||
|
Non-operating pension costs and share-based compensation expense
|
$
|
5,464
|
|
1,254
|
|
2,764
|
|
46,775
|
|
—
|
|
56,257
|
|
||||||
|
Depreciation expense
(1)
|
$
|
1,156,888
|
|
3,222
|
|
25,956
|
|
984
|
|
—
|
|
1,187,050
|
|
||||||
|
Used vehicle sales, net
|
$
|
(724
|
)
|
(90
|
)
|
(158
|
)
|
—
|
|
—
|
|
(972
|
)
|
||||||
|
Amortization expense and other non-cash charges, net
|
$
|
34,652
|
|
1,027
|
|
3,215
|
|
(8,227
|
)
|
—
|
|
30,667
|
|
||||||
|
Interest expense (income)
(2)
|
$
|
151,297
|
|
(1,901
|
)
|
(1,663
|
)
|
110
|
|
—
|
|
147,843
|
|
||||||
|
Capital expenditures paid
|
$
|
1,814,146
|
|
2,551
|
|
64,186
|
|
24,274
|
|
—
|
|
1,905,157
|
|
||||||
|
Total assets
|
$
|
9,954,452
|
|
255,845
|
|
713,190
|
|
198,394
|
|
(219,427
|
)
|
10,902,454
|
|
||||||
|
2015
|
|||||||||||||||||||
|
Non-operating pension costs and share-based compensation expense
|
$
|
5,672
|
|
1,155
|
|
3,400
|
|
28,751
|
|
—
|
|
38,978
|
|
||||||
|
Depreciation expense
(1)
|
$
|
1,092,750
|
|
3,184
|
|
25,721
|
|
311
|
|
—
|
|
1,121,966
|
|
||||||
|
Used vehicle sales, net
|
$
|
(99,758
|
)
|
(54
|
)
|
(41
|
)
|
—
|
|
—
|
|
(99,853
|
)
|
||||||
|
Amortization expense and other non-cash charges, net
|
$
|
36,348
|
|
1,878
|
|
2,971
|
|
11,768
|
|
—
|
|
52,965
|
|
||||||
|
Interest expense (income)
(2)
|
$
|
154,276
|
|
(1,597
|
)
|
(2,174
|
)
|
(71
|
)
|
—
|
|
150,434
|
|
||||||
|
Capital expenditures paid
(3)
|
$
|
2,595,961
|
|
3,570
|
|
27,841
|
|
40,606
|
|
—
|
|
2,667,978
|
|
||||||
|
Total assets
|
$
|
10,061,092
|
|
275,634
|
|
636,647
|
|
202,129
|
|
(222,922
|
)
|
10,952,580
|
|
||||||
____________
|
(1)
|
Depreciation expense associated with CSS assets was allocated to business segments based upon estimated and planned asset utilization. Depreciation expense totaling
$24 million
,
$24 million
and
$22 million
during
2017
,
2016
and
2015
, respectively, associated with CSS assets was allocated to other business segments.
|
|
(2)
|
Interest expense was primarily allocated to the FMS segment since such borrowings were used principally to fund the purchase of revenue earning equipment used in FMS; however, interest income was also reflected in DTS and SCS based on targeted segment leverage ratios.
|
|
(3)
|
Excludes acquisition payments of
$1 million
in
2017
. See
Note 3
, “
Acquisitions
,” for additional information.
|
117
RYDER SYSTEM, INC. AND SUBSIDIARIES
NOTES TO CONSOLIDATED FINANCIAL STATEMENTS - (Continued)
Geographic Information
|
|
Years ended December 31,
|
|||||||||
|
|
2017
|
2016
|
2015
|
|||||||
|
|
(In thousands)
|
|||||||||
|
Revenue:
|
||||||||||
|
United States
|
$
|
6,378,784
|
|
5,892,384
|
|
5,603,697
|
|
|||
|
Foreign:
|
||||||||||
|
Canada
|
428,252
|
|
387,713
|
|
408,325
|
|
||||
|
Europe
|
321,375
|
|
339,420
|
|
391,339
|
|
||||
|
Mexico
|
170,398
|
|
139,176
|
|
139,583
|
|
||||
|
Singapore
|
30,790
|
|
28,291
|
|
28,949
|
|
||||
|
950,815
|
|
894,600
|
|
968,196
|
|
|||||
|
Total
|
$
|
7,329,599
|
|
6,786,984
|
|
6,571,893
|
|
|||
|
Long-lived assets:
|
||||||||||
|
United States
|
$
|
7,935,167
|
|
7,854,845
|
|
7,817,628
|
|
|||
|
Foreign:
|
||||||||||
|
Canada
|
623,576
|
|
532,403
|
|
504,027
|
|
||||
|
Europe
|
527,869
|
|
472,027
|
|
545,630
|
|
||||
|
Mexico
|
44,997
|
|
33,979
|
|
31,993
|
|
||||
|
Singapore
|
357
|
|
338
|
|
427
|
|
||||
|
1,196,799
|
|
1,038,747
|
|
1,082,077
|
|
|||||
|
Total
|
$
|
9,131,966
|
|
8,893,592
|
|
8,899,705
|
|
|||
Certain Concentrations
We have a diversified portfolio of customers across a full array of transportation and logistics solutions and across many industries. We believe this will help to mitigate the impact of adverse downturns in specific sectors of the economy. Our portfolio of ChoiceLease and commercial rental customers is not concentrated in any one particular industry or geographic region. We derive a significant portion of our SCS revenue from the automotive industry, mostly from manufacturers and suppliers of original equipment parts. During
2017
,
2016
and
2015
, the automotive industry accounted for approximately
40%
,
44%
and
41%
, respectively, of SCS total revenue.
118
RYDER SYSTEM, INC. AND SUBSIDIARIES
NOTES TO CONSOLIDATED FINANCIAL STATEMENTS - (Continued)
29.
QUARTERLY INFORMATION (UNAUDITED)
|
|
|
Earnings from Continuing Operations Before Income Taxes
|
Earnings from
Continuing Operations
|
Earnings from
Continuing
Operations per
Common Share
|
Net Earnings per
Common Share
|
|||||||||||||||||||||
|
|
Revenue
|
Net Earnings
|
Basic
|
Diluted
|
Basic
|
Diluted
|
||||||||||||||||||||
|
|
(In thousands, except per share amounts)
|
|||||||||||||||||||||||||
|
2017
|
||||||||||||||||||||||||||
|
First quarter
|
$
|
1,748,163
|
|
59,956
|
|
38,279
|
|
38,149
|
|
0.72
|
|
0.71
|
|
0.72
|
|
0.71
|
|
|||||||||
|
Second quarter
|
1,793,214
|
|
80,692
|
|
51,343
|
|
50,816
|
|
0.97
|
|
0.97
|
|
0.96
|
|
0.96
|
|
||||||||||
|
Third quarter
|
1,848,529
|
|
94,343
|
|
58,913
|
|
58,623
|
|
1.12
|
|
1.11
|
|
1.11
|
|
1.11
|
|
||||||||||
|
Fourth quarter
|
1,939,693
|
|
78,795
|
|
642,480
|
|
642,970
|
|
12.21
|
|
12.10
|
|
12.22
|
|
12.11
|
|
||||||||||
|
Full year
|
$
|
7,329,599
|
|
313,786
|
|
791,015
|
|
790,558
|
|
14.98
|
|
14.87
|
|
14.97
|
|
14.87
|
|
|||||||||
|
2016
|
||||||||||||||||||||||||||
|
First quarter
|
$
|
1,629,672
|
|
88,708
|
|
56,185
|
|
55,794
|
|
1.06
|
|
1.05
|
|
1.05
|
|
1.04
|
|
|||||||||
|
Second quarter
|
1,703,744
|
|
116,779
|
|
74,042
|
|
73,750
|
|
1.39
|
|
1.38
|
|
1.39
|
|
1.38
|
|
||||||||||
|
Third quarter
|
1,724,418
|
|
131,698
|
|
85,138
|
|
84,752
|
|
1.60
|
|
1.59
|
|
1.60
|
|
1.59
|
|
||||||||||
|
Fourth quarter
|
1,729,150
|
|
69,196
|
|
49,275
|
|
48,181
|
|
0.93
|
|
0.92
|
|
0.91
|
|
0.91
|
|
||||||||||
|
Full year
|
$
|
6,786,984
|
|
406,381
|
|
264,640
|
|
262,477
|
|
4.98
|
|
4.94
|
|
4.94
|
|
$
|
4.90
|
|
||||||||
Note: EPS amounts may not be additive due to rounding.
Quarterly and year-to-date computations of per share amounts are made independently; therefore, the sum of per-share amounts for the quarters may not equal per-share amounts for the year.
See
Note 4
, “
Restructuring Charges and Fees, Net
,” and
Note 24
, “
Other Items Impacting Comparability
,” for items included in earnings during
2017
and
2016
.
Earnings from continuing operations and net earnings reflect the tax benefit related to the 2017 Tax Cuts and Jobs Act that was signed into law in December 2017. See
Note 13
, "
Income Taxes
" for more information.
119
RYDER SYSTEM, INC. AND SUBSIDIARES
SCHEDULE II - VALUATION AND QUALIFYING ACCOUNTS
|
|
|
Additions
|
|
|
||||||||||||
|
Description
|
Balance at
Beginning
of Period
|
Charged to
Earnings
|
Transferred
from Other
Accounts
(1)
|
Deductions
(2)
|
Balance
at End
of Period
|
|||||||||||
|
|
(In thousands)
|
|||||||||||||||
|
2017
|
||||||||||||||||
|
Accounts receivable allowance
|
$
|
14,915
|
|
12,335
|
|
—
|
|
13,403
|
|
13,847
|
|
|||||
|
Self-insurance accruals
(3)
|
$
|
336,901
|
|
327,306
|
|
74,153
|
|
389,748
|
|
348,612
|
|
|||||
|
Valuation allowance on deferred tax assets
|
$
|
16,387
|
|
2,213
|
|
—
|
|
67
|
|
18,667
|
|
|||||
|
2016
|
||||||||||||||||
|
Accounts receivable allowance
|
$
|
15,560
|
|
13,118
|
|
—
|
|
13,763
|
|
14,915
|
|
|||||
|
Self-insurance accruals
(3)
|
$
|
311,821
|
|
324,673
|
|
71,703
|
|
371,296
|
|
336,901
|
|
|||||
|
Valuation allowance on deferred tax assets
|
$
|
14,991
|
|
98
|
|
—
|
|
(1,298
|
)
|
16,387
|
|
|||||
|
2015
|
||||||||||||||||
|
Accounts receivable allowance
|
$
|
16,388
|
|
11,172
|
|
—
|
|
12,000
|
|
15,560
|
|
|||||
|
Self-insurance accruals
(3)
|
$
|
298,853
|
|
295,399
|
|
68,999
|
|
351,430
|
|
311,821
|
|
|||||
|
Valuation allowance on deferred tax assets
|
$
|
24,742
|
|
(1,150
|
)
|
—
|
|
8,601
|
|
14,991
|
|
|||||
______________
|
(1)
|
Transferred from other accounts includes employee contributions made to the medical and dental self-insurance plans.
|
|
(2)
|
Deductions represent write-offs, lease termination payments, insurance claim payments during the period and net foreign currency translation adjustments.
|
|
(3)
|
Self-insurance accruals include vehicle liability, workers’ compensation, property damage, cargo and medical and dental, which comprise our self-insurance programs. Amounts charged to earnings include developments in prior years' selected loss development factors which benefited earnings by
$9 million
in
2017
and charged earnings by
$9 million
and
$4 million
in
2016
and
2015
, respectively. Prior year presentation of self-insurance accruals has been revised to reflect amounts charged to earnings and deductions consistent with current year presentation.
|
120
ACCOUNTING AND FINANCIAL DISCLOSURE
None.
Evaluation of Disclosure Controls and Procedures
As of the end of the period covered by this report, we carried out an evaluation, under the supervision and with the participation of management, including Ryder’s Chief Executive Officer and Chief Financial Officer, of the effectiveness of the design and operation of Ryder’s disclosure controls and procedures (as defined in Rule 13a-15(e) under the Securities Exchange Act of 1934). Based upon that evaluation, the Chief Executive Officer and Chief Financial Officer concluded that at
December 31, 2017
, Ryder’s disclosure controls and procedures (as defined in Rule 13a-15(e) under the Securities Exchange Act of 1934) were effective.
Management’s Report on Internal Control over Financial Reporting
Management’s Report on Internal Control over Financial Reporting and the Report of Independent Registered Certified Public Accounting Firm thereon are set out in Item 8 of Part II of this Form 10-K Annual Report.
Changes in Internal Controls over Financial Reporting
During the three months ended
December 31, 2017
, there were no changes in Ryder’s internal control over financial reporting that has materially affected or is reasonably likely to materially affect such internal control over financial reporting.
None.
The information required by Item 10 with respect to executive officers is included within Item 1 in Part I under the caption “Executive Officers of the Registrant” of this Form 10-K Annual Report.
The information required by Item 10 with respect to directors, audit committee, audit committee financial experts and Section 16(a) beneficial ownership reporting compliance is included under the captions “Election of Directors,” “Audit Committee” and “Section 16(a) Beneficial Ownership Reporting Compliance” in our definitive proxy statement, which will be filed with the Commission within 120 days after the close of the fiscal year, and is incorporated herein by reference.
Ryder has adopted a code of conduct applicable to all employees, including its Chief Executive Officer, Chief Financial Officer, Controller and Senior Financial Management. We will provide a copy of our code of conduct to anyone, free of charge, upon request through our Investor Relations Page, on our website at
www.ryder.com
.
The information required by Item 11 is included under the captions “Compensation Discussion and Analysis,” “Executive Compensation,” “Compensation Committee,” “Compensation Committee Report on Executive Compensation” and “Director Compensation” in our definitive proxy statement, which will be filed with the Commission within 120 days after the close of the fiscal year, and is incorporated herein by reference.
121
AND MANAGEMENT AND RELATED STOCKHOLDER MATTERS
The information required by Item 12 with respect to security ownership of certain beneficial owners and management is included under the captions “Security Ownership of Officers and Directors” and “Security Ownership of Certain Beneficial Owners” in our definitive proxy statement, which will be filed with the Commission within 120 days after the close of the fiscal year, and is incorporated herein by reference.
Securities Authorized for Issuance under Equity Compensation Plans
The following table includes information as of
December 31, 2017
, about certain plans which provide for the issuance of common stock in connection with the exercise of stock options and other share-based awards.
|
Plans
|
Number of Securities to be issued upon Exercise of Outstanding Options, Warrants and Rights
|
Weighted-Average Exercise Price of Outstanding Options, Warrants and Rights
|
Number of Securities Remaining Available for Future Issuance Under Equity Compensation Plans Excluding Securities Reflected in Column (a)
|
||||||||
|
(a)
|
(b)
|
(c)
|
|||||||||
|
Equity compensation plans approved by security holders:
|
|||||||||||
|
Broad based employee stock plans
|
2,250,700
|
|
(1)
|
$70.47
|
(3)
|
2,528,128
|
|
||||
|
Employee stock purchase plan
|
—
|
|
—
|
|
783,390
|
|
|||||
|
Non-employee directors' stock plans
|
207,066
|
|
(2)
|
—
|
|
38,236
|
|
||||
|
Total
|
2,457,766
|
|
$70.47
|
3,349,754
|
|
||||||
_______________
|
(1)
|
Includes
1,717,188
stock options,
231,900
time-vested restricted stock awards,
93,164
market-based restricted stock awards and
208,448
performance-based restricted stock awards, which includes
109,350
performance-based restricted stock rights not considered granted under accounting guidance for stock compensation. Refer to
Note 21
, "
Share-Based Compensation Plans
", for additional information.
|
|
(2)
|
Includes
200,559
time-vested restricted stock awards, as well as,
6,507
time-vested restricted stock awards vested but not exercisable until six months after the director's retirement.
|
|
(3)
|
Weighted-average exercise price of outstanding options excludes restricted stock awards and restricted stock units.
|
AND DIRECTOR INDEPENDENCE
The information required by Item 13 is included under the captions “Board of Directors” and “Related Person Transactions” in our definitive proxy statement, which will be filed with the Commission within 120 days after the close of the fiscal year, and is incorporated herein by reference.
The information required by Item 14 is included under the caption “Ratification of Independent Auditor” in our definitive proxy statement, which will be filed with the Commission within 120 days after the close of the fiscal year, and is incorporated herein by reference.
122
|
(a)
|
Items A through H and Schedule II are presented on the following pages of this Form 10-K Annual Report:
|
|
|
|
Page No.
|
|
1. Financial Statements for Ryder System, Inc. and Consolidated Subsidiaries:
|
|
|
|
|
||
|
|
||
|
|
||
|
|
||
|
|
||
|
|
||
|
|
||
|
2. Consolidated Financial Statement Schedule for the Years Ended December 31, 2017, 2016 and 2015
|
|
|
All other schedules are omitted because they are not applicable or the required information is shown in the consolidated financial statements or notes thereto.
Supplementary Financial Information consisting of selected quarterly financial data is included in Item 8 of this report.
3. Exhibits:
The following exhibits are filed with this report or, where indicated, incorporated by reference (Forms 10-K, 10-Q and 8-K referenced herein have been filed under the Commission’s file No. 1-4364). Ryder will provide a copy of the exhibits filed with this report at a nominal charge to those parties requesting them.
123
EXHIBIT INDEX
|
Exhibit
Number
|
|
Description
|
||
|
3.1
|
||||
|
3.2
|
|
|||
|
4.1
|
|
Ryder hereby agrees, pursuant to paragraph (b)(4)(iii) of Item 601 of Regulation S-K, to furnish the Commission with a copy of any instrument defining the rights of holders of long-term debt of Ryder, where such instrument has not been filed as an exhibit hereto and the total amount of securities authorized there under does not exceed 10% of the total assets of Ryder and its subsidiaries on a consolidated basis.
|
||
|
4.2
|
|
The First Supplemental Indenture between Ryder System, Inc. and The Chase Manhattan Bank (National Association) dated October 1, 1987, previously filed with the Commission as an exhibit to Ryder's Annual Report on Form 10-K for the year ended December 31, 1994, is incorporated by reference into this report.
|
||
|
4.3
|
|
The Form of Indenture between Ryder System, Inc. and The Chase Manhattan Bank (National Association) dated as of May 1, 1987, and supplemented as of November 15, 1990 and June 24, 1992, filed with the Commission on July 30, 1992 as an exhibit to Ryder's Registration Statement on Form S-3 (No. 33-50232), is incorporated by reference into this report.
|
||
|
4.4
|
|
|||
|
10.1(a)
|
|
|||
|
10.1(b)
|
|
|||
|
10.1(c)
|
|
|||
|
10.1(d)
|
|
|||
|
10.1(e)
|
||||
|
10.1(f)
|
||||
|
10.1(g)
|
||||
|
10.1(h)
|
||||
|
10.1(i)
|
||||
|
10.1(j)
|
||||
|
10.1(k)
|
||||
124
|
Exhibit
Number
|
|
Description
|
|
10.1(l)
|
||
|
10.1(m)
|
||
|
10.1(n)
|
||
|
10.1(o)
|
||
|
10.1(p)
|
||
|
10.1(q)
|
||
|
10.1(r)
|
||
|
10.1(s)
|
||
|
10.1(t)
|
||
|
10.1(u)
|
||
|
10.1(v)
|
||
|
10.1(w)
|
||
|
10.1(x)
|
||
|
10.1(y)
|
||
|
10.1(z)
|
||
|
10.1(aa)
|
||
|
10.1(bb)
|
||
125
|
Exhibit
Number
|
Description
|
|
|
10.1(cc)
|
||
|
10.2(a)
|
||
|
10.2(b)
|
||
|
10.3
|
||
|
10.4
|
|
|
|
10.5
|
|
|
|
10.6(a)
|
|
|
|
10.6(b)
|
||
|
10.6(c)
|
|
|
|
10.6(d)
|
|
|
|
10.7
|
||
|
12
|
||
|
21.1
|
|
|
|
23.1
|
|
|
|
24.1
|
||||
|
Robert J. Eck
|
Tamara L. Lundgren
|
|||
|
Michael F. Hilton
|
Robert A. Hagemann
|
|||
|
Luis P. Nieto, Jr.
|
E. Follin Smith
|
|||
|
Abbie J. Smith
|
Hansel E. Tookes, II
|
|||
|
John M. Berra
|
|
|||
|
31.1
|
|
|||
|
31.2
|
|
|||
|
32
|
|
|||
|
101.INS
|
|
XBRL Instance Document.
|
||
|
101.SCH
|
|
XBRL Taxonomy Extension Schema Document.
|
||
|
101.CAL
|
|
XBRL Taxonomy Extension Calculation Linkbase Document.
|
||
|
101.DEF
|
|
XBRL Taxonomy Extension Definition Linkbase Document.
|
||
|
101.LAB
|
|
XBRL Taxonomy Extension Label Linkbase Document.
|
||
|
101.PRE
|
|
XBRL Taxonomy Extension Presentation Linkbase Document.
|
||
126
|
(b)
|
Executive Compensation Plans and Arrangements:
|
Please refer to the description of Exhibits 10.1 through 10.6 set forth under Item 15(a)3 of this report for a listing of all management contracts and compensation plans and arrangements filed with this report pursuant to Item 601(b)(10) of Regulation S-K.
127
SIGNATURES
Pursuant to the requirements of Section 13 or 15(d) of the Securities Exchange Act of 1934, the registrant has duly caused this report to be signed on its behalf by the undersigned, thereunto duly authorized.
|
Date:
|
February 16, 2018
|
|
RYDER SYSTEM, INC.
|
|
|
By: /s/ Robert E. Sanchez
|
||
|
|
Robert E. Sanchez
|
||
|
|
Chairman, President and Chief Executive Officer
|
||
Pursuant to the requirements of the Securities Exchange Act of 1934, this report has been signed below by the following persons on behalf of the registrant and in the capacities and on the dates indicated.
|
Date:
|
February 16, 2018
|
|
By: /s/ ROBERT E. SANCHEZ
|
|
|
Robert E. Sanchez
|
||
|
|
Chairman, President and Chief Executive Officer
|
||
|
|
(Principal Executive Officer)
|
||
|
Date:
|
February 16, 2018
|
|
By: /s/ ART A. GARCIA
|
|
|
Art A. Garcia
|
||
|
|
Executive Vice President and Chief Financial Officer
|
||
|
|
(Principal Financial Officer)
|
||
|
Date:
|
February 16, 2018
|
|
By: /s/ FRANK MULLEN
|
|
|
Frank Mullen
|
||
|
|
Vice President and Controller
|
||
|
(Principal Accounting Officer)
|
|||
|
Date:
|
February 16, 2018
|
|
By: JOHN M. BERRA *
|
|
|
John M. Berra
|
||
|
|
Director
|
||
|
Date:
|
February 16, 2018
|
|
By: ROBERT J. ECK *
|
|
|
Robert J. Eck
|
||
|
|
Director
|
||
|
Date:
|
February 16, 2018
|
|
By: ROBERT A. HAGEMANN *
|
|
|
Robert A. Hagemann
|
||
|
|
Director
|
||
|
Date:
|
February 16, 2018
|
|
By: MICHAEL F. HILTON*
|
|
|
Michael F. Hilton
|
||
|
|
Director
|
||
128
|
Date:
|
February 16, 2018
|
|
By: TAMARA L. LUNDGREN*
|
|
|
Tamara L. Lundgren
|
||
|
|
Director
|
||
|
Date:
|
February 16, 2018
|
|
By: LUIS P. NIETO, JR. *
|
|
|
Luis P. Nieto, Jr.
|
||
|
|
Director
|
||
|
Date:
|
February 16, 2018
|
|
By: ABBIE J. SMITH *
|
|
|
Abbie J. Smith
|
||
|
|
Director
|
||
|
Date:
|
February 16, 2018
|
|
By: E. FOLLIN SMITH *
|
|
|
E. Follin Smith
|
||
|
|
Director
|
||
|
Date:
|
February 16, 2018
|
|
By: HANSEL E. TOOKES, II *
|
|
|
Hansel E. Tookes, II
|
||
|
|
Director
|
||
|
Date:
|
February 16, 2018
|
|
*By: /s/ ALENA BRENNER
|
|
|
Alena Brenner
|
||
|
|
Attorney-in-Fact, pursuant to a power of attorney
|
||
129
TABLE OF CONTENTS
Part IItem 1. BusinessItem 1A. Risk FactorsItem 1B. Unresolved Staff CommentsItem 2. PropertiesItem 3. Legal ProceedingsItem 4. Mine Safety DisclosuresPart IIItem 5. Market For Registrant S Common Equity, RelatedItem 6. Selected Financial DataItem 7. Management's Discussion and Analysis Of Financial Condition and Results Of OperationsItem 7. Management's Discussion and Analysis OfItem 7. Management's Discussion and Analysis Of Financial Condition and Results Of Operations - (continued)Item 7A. Quantitative and Qualitative Disclosures About Market RiskItem 8. Financial Statements and Supplementary DataItem 9. Changes in and Disagreements with Accountants onItem 9A. Controls and ProceduresItem 9B. Other InformationPart IIIItem 10. Directors, Executive Officers and Corporate GovernanceItem 11. Executive CompensationItem 12. Security Ownership Of Certain Beneficial OwnersItem 13. Certain Relationships and Related Transactions,Item 14. Principal Accountant Fees and ServicesPart IVItem 15. Exhibits and Financial Statement Schedules