UNITED STATES
SECURITIES AND EXCHANGE COMMISSION
Washington, D.C. 20549
FORM 20-F
|
o
|
REGISTRATION STATEMENT PURSUANT TO SECTIONS 12(b) OR 12(g) OF THE SECURITIES EXCHANGE ACT OF 1934
|
OR
|
þ
|
ANNUAL REPORT PURSUANT TO SECTION 13 OR 15(d) OF THE SECURITIES EXCHANGE ACT OF 1934
|
For the Fiscal Year Ended December 31, 2017
OR
|
o
|
TRANSITION REPORT PURSUANT TO SECTION 13 OR 15(d) OF THE SECURITIES EXCHANGE ACT OF 1934
|
OR
|
o
|
SHELL COMPANY REPORT PURSUANT TO SECTION 13 OR 15(d) OF THE SECURITIES EXCHANGE ACT OF 1934
|
Commission File Number 001-36085
Ferrari N.V.
(Exact Name of Registrant as Specified in Its Charter)
|
The Netherlands
|
|
(Jurisdiction of Incorporation or Organization)
|
Via Abetone Inferiore n. 4
I-41053 Maranello (MO)
Italy
Tel. No.: +39 0536 949111
(Address of Principal Executive Offices)
(Address, Including Zip Code, and Telephone Number, Including Area Code, of Registrant’s Principal Executive Offices)
Alessandro Gili
Tel. No.: +39 0536 949111
Facsimile No.: +39 0536 241494
Via Abetone Inferiore n. 4 I-41053 Maranello (MO) Italy
(Name, Telephone, E-mail and/or Facsimile number and Address of Company Contact Person)
Securities registered pursuant to Section 12(b) of the Act:
|
Title of each class
|
Name of each exchange on which registered
|
|
|
Ordinary Shares (par value of €0.01 each)
|
New York Stock Exchange
|
|
Securities registered pursuant to Section 12(g) of the Act: None
Securities for which there is a reporting obligation pursuant to Section 15(d) of the Act: None
Indicate the number of outstanding shares of each of the issuer’s classes of capital or common stock as of the close of the period covered by the annual report: 188,953,874 common shares, par value €0.01 per share, and 56,493,519 special voting shares, par value €0.01 per share.
Indicate by check mark if the registrant is a well-known seasoned issuer, as defined in Rule 405 of the Securities Act. Yes
þ
No
o
If this report is an annual or transition report, indicate by check mark if the registrant is not required to file reports pursuant to Section 13 or 15(d) of the Securities Act of 1934. Yes
o
No
þ
Indicate by check mark whether the registrant: (1) has filed all reports required to be filed by Section 13 or 15(d) of the Securities Exchange Act of 1934 during the preceding 12 months (or for such shorter period that the registrant was required to file such reports), and (2) has been subject to such filing requirements for the past 90 days. Yes
þ
No
o
Indicate by check mark whether the registrant has submitted electronically and posted on its corporate Web site, if any, every Interactive Data File required to be submitted and posted pursuant to Rule 405 of Regulation S-T (§232.405 of this chapter) during the preceding 12 months (or for such shorter period that the registrant was required to submit and post such files). Yes
þ
No
o
Indicate by check mark whether the registrant is a large accelerated filer, an accelerated filer, or a non-accelerated filer. See definition of “accelerated filer and large accelerated filer” in Rule 12b-2 of the Exchange Act. (Check one):
|
Large accelerated filer
þ
|
Accelerated filer
o
|
Non-accelerated filer
o
|
||
If an emerging growth company that prepares its financial statements in accordance with U.S. GAAP, indicate by check mark if the registrant has elected not to use the extended transition period for complying with any new or revised financial accounting standards† provided pursuant to Section 13(a) of the Exchange Act
o
The term “new or revised financial accounting standard” refers to any update issued by the Financial Accounting Standards Board to its Accounting Standards Codification after April 5, 2012.
Indicate by check mark which basis of accounting the registrant has used to prepare the financial statements included in this filing:
U.S. GAAP
o
International Financial Reporting Standards as issued by the International Accounting Standards Board
þ
Other
o
If “Other” has been checked in response to the previous question indicate by check mark which financial statement item the registrant has elected to follow: Item 17
o
or Item 18
o
.
If this is an annual report, indicate by check mark whether the registrant is a shell company (as defined in Rule 12b-2 of the Exchange Act).
Yes
o
No
þ
(APPLICABLE ONLY TO ISSUERS INVOLVED IN BANKRUPTCY PROCEEDINGS DURING THE PAST FIVE YEARS)
Indicate by check mark whether the registrant has filed all documents and reports required to be filed by Sections 12, 13 or 15(d) of the Securities Exchange Act of 1934 subsequent to the distribution of securities under a plan confirmed by a court. Yes
o
No
o
TABLE OF CONTENTS
|
Page
|
||
|
Item 1.
|
||
|
Item 2.
|
||
|
Item 3.
|
||
|
A.
|
||
|
B.
|
||
|
C.
|
||
|
D.
|
||
|
Item 4.
|
||
|
A.
|
||
|
B.
|
||
|
C.
|
||
|
D.
|
||
|
Item 4A.
|
||
|
Item 5.
|
||
|
A.
|
||
|
B.
|
||
|
C.
|
||
|
D.
|
||
|
E.
|
||
|
F.
|
||
|
G.
|
||
|
Item 6.
|
||
|
A.
|
||
|
B.
|
||
|
C.
|
||
|
D.
|
||
|
E.
|
||
|
Item 7.
|
||
|
A.
|
||
|
B.
|
||
|
C.
|
||
|
Item 8.
|
||
|
A.
|
||
|
B.
|
||
|
Item 9.
|
||
|
A.
|
||
|
B.
|
||
|
C.
|
||
|
D.
|
||
|
E.
|
||
|
F.
|
||
|
Item 10.
|
||
|
A.
|
||
|
B.
|
||
|
C.
|
||
|
D.
|
||
|
E.
|
||
|
F.
|
||
|
G.
|
||
|
H.
|
||
|
I.
|
||
|
Item 11.
|
||
|
Item 12.
|
||
|
A.
|
||
|
B.
|
||
|
C.
|
||
|
D.
|
||
|
Item 13.
|
||
|
Item 14.
|
||
|
Item 15.
|
||
|
Item 16A.
|
||
|
Item 16B.
|
||
|
Item 16C.
|
||
|
Item 16D.
|
||
|
Item 16E.
|
||
|
Item 16F.
|
||
|
Item 16G.
|
||
|
Item 16H.
|
||
|
Item 17.
|
||
|
Item 18.
|
||
|
Item 19.
|
||
Certain Defined Terms
In this report, unless otherwise specified, the terms “we,” “our,” “us,” the “Group,” the “Company” and “Ferrari” refer to Ferrari N.V., individually or together with its subsidiaries, as the context may require. References to “Ferrari N.V.” refer to the registrant (formerly named FE New N.V.) following completion of the Separation and to the registrant’s predecessor (formerly named New Business Netherlands N.V.) prior to completion of the Separation. References to “FCA” or “FCA Group” refer to Fiat Chrysler Automobiles N.V., together with its subsidiaries and its predecessor prior to the completion of the merger of Fiat S.p.A. with and into FCA on October 12, 2014 (at which time Fiat Investments N.V. was named Fiat Chrysler Automobiles N.V. or FCA), or any one of them, as the context may require. References to “Fiat” refer solely to Fiat S.p.A., the predecessor of FCA. References to the “Separation” refer to the series of transactions through which the Ferrari business was separated from FCA as summarized in
“Note on Presentation”
below.
See
“Basis of Preparation of the Consolidated Financial Statements”
below for additional information regarding the financial presentation.
Note on Presentation
This document includes the consolidated financial statements of Ferrari N.V. as of
December 31, 2017
and
2016
, and for the years ended December 31,
2017
,
2016
and
2015
prepared in accordance with International Financial Reporting Standards as issued by the International Accounting Standards Board (“IFRS”). We refer to these consolidated financial statements collectively as the “Consolidated Financial Statements.”
Basis of Preparation of the Consolidated Financial Statements
As explained in Note 1 to the Consolidated Financial Statements and in
“Item 4.A. History and Development of the Company”
, on October 29, 2014, Fiat Chrysler Automobiles N.V. (“FCA”) announced its intention to separate Ferrari S.p.A. from FCA. The separation was completed on January 3, 2016 and occurred through a series of transactions (together defined as the “Separation”) including (i) an intra-group restructuring which resulted in the Company’s acquisition of the assets and business of Ferrari North Europe Limited and the transfer by FCA of its 90 percent shareholding in Ferrari S.p.A. to the Company, (ii) the transfer of Piero Ferrari’s 10 percent shareholding in Ferrari S.p.A. to the Company, (iii) the initial public offering of common shares of the Company on the New York Stock Exchange, and (iv) the distribution, following the initial public offering, of FCA’s remaining interest in the Company to FCA’s shareholders. Following the Separation Ferrari operates as an independent, publicly traded company.
The transactions described above in (i) and (ii) (referred to collectively as the “Restructuring”) were completed in October 2015. The Restructuring comprised: (i) a capital reorganization of the group under the Company, which has been accounted for in the Consolidated Financial Statements as though it had occurred effective January 1, 2015 using FCA’s basis of accounting, and (ii) the issuance of a note by the Company to FCA (the “FCA Note”), which has been reflected in the Consolidated Financial Statements only from the date in which it occurred.
The remaining steps of the Separation, which were completed between January 1 and January 3, 2016 through two consecutive demergers followed by a merger under Dutch law, have been reflected in the Consolidated Financial Statements only from the date in which the related transactions occurred and had no impact on the Company’s results of operations or financial position. As part of the Separation a new entity, FE New N.V., was created. Pursuant to the demergers the shares in the Company held by FCA were ultimately transferred to FE New N.V., with FE New N.V. issuing shares in its capital to the shareholders of FCA. In connection with the demergers, the mandatory convertible security holders of FCA also received shares in FE New N.V. On completion of the Separation the Company was merged with and into FE New N.V. and FE New N.V. was renamed Ferrari N.V.
Following the Separation, the cash pooling and financial liabilities with the FCA Group were settled and the relevant agreements were terminated. The derivative contracts that were previously held by FCA were novated to Ferrari S.p.A.
On January 4, 2016 the Company also completed the listing of its common shares on the Mercato Telematico Azionario, the stock exchange managed by Borsa Italiana, under the ticker symbol RACE.
I
At
December 31, 2017
, the fully paid up share capital of the Company amounted to €2,504 thousand, comprising common shares and special voting shares all with nominal value of €0.01 per share. At December 31, 2017, the Company had 188,953,874 common shares and 56,493,519 special voting shares issued and outstanding.
The Group’s financial information is presented in Euro. In some instances, information is presented in U.S. Dollars. All references in this document to “Euro” and “€” refer to the currency introduced at the start of the third stage of European Economic and Monetary Union pursuant to the Treaty on the Functioning of the European Union, as amended, and all references to “U.S. Dollars,” “U.S.$” and “$” refer to the currency of the United States of America (the “United States”).
The language of this document is English. Certain legislative references and technical terms have been cited in their original language in order that the correct technical meaning may be ascribed to them under applicable law.
Certain totals in the tables included in this document may not add due to rounding.
II
Forward-Looking Statements
Statements contained in this report, particularly those regarding our possible or assumed future performance, competitive strengths, costs, dividends, reserves and growth, industry growth and other trends and projections and estimated company earnings are “forward-looking statements” that contain risks and uncertainties. In some cases, words such as “may,” “will,” “expect,” “could,” “should,” “intend,” “estimate,” “anticipate,” “believe,” “outlook,” “continue,” “remain,” “on track,” “design,” “target,” “objective,” “goal,” “plan” and similar expressions are used to identify forward-looking statements. These forward-looking statements reflect the respective current views of Ferrari with respect to future events and involve significant risks and uncertainties that could cause actual results to differ materially from those indicated in the forward-looking statements. These factors include, without limitation:
|
•
|
our ability to preserve and enhance the value of the Ferrari brand;
|
|
•
|
the success of our Formula 1 racing team and the expenses we incur for our Formula 1 activities;
|
|
•
|
our ability to keep up with advances in high performance car technology and to make appealing designs for our new models;
|
|
•
|
the challenges and costs of integrating hybrid technology more broadly into our car portfolio over time;
|
|
•
|
our ability to preserve our relationship with the automobile collector and enthusiast community;
|
|
•
|
our low volume strategy;
|
|
•
|
the ability of Maserati, our engine customer, to sell its planned volume of cars;
|
|
•
|
changes in client preferences and automotive trends;
|
|
•
|
changes in the general economic environment, including changes in some of the markets in which we operate, and changes in demand for luxury goods, including high performance luxury cars, which is highly volatile;
|
|
•
|
the impact of increasingly stringent fuel economy, emission and safety standards, including the cost of compliance, and any required changes to our products;
|
|
•
|
our ability to successfully carry out our growth strategy and, particularly, our ability to grow our presence in emerging market countries;
|
|
•
|
our ability to service and refinance our debt;
|
|
•
|
competition in the luxury performance automobile industry;
|
|
•
|
reliance upon a number of key members of executive management and employees, and the ability of our current management team to operate and manage effectively;
|
|
•
|
the performance of our dealer network on which we depend for sales and services;
|
|
•
|
increases in costs, disruptions of supply or shortages of components and raw materials;
|
|
•
|
disruptions at our manufacturing facilities in Maranello and Modena;
|
|
•
|
our ability to provide or arrange for adequate access to financing for our dealers and clients, and associated risks;
|
|
•
|
the performance of our licensees for Ferrari-branded products;
|
|
•
|
our ability to protect our intellectual property rights and to avoid infringing on the intellectual property rights of others;
|
|
•
|
product recalls, liability claims and product warranties;
|
|
•
|
our continued compliance with customs regulations of various jurisdictions;
|
|
•
|
labor relations and collective bargaining agreements;
|
|
•
|
exchange rate fluctuations, interest rate changes, credit risk and other market risks;
|
|
•
|
changes in tax, tariff or fiscal policies and regulatory, political and labor conditions in the jurisdictions in which we operate, including possible future bans of combustion engine cars in cities and the potential advent of self-driving technology;
|
III
|
•
|
our ability to ensure that our employees, agents and representatives comply with applicable law and regulations;
|
|
•
|
the adequacy of our insurance coverage to protect us against potential losses;
|
|
•
|
potential conflicts of interest due to director and officer overlaps with our largest shareholders;
|
|
•
|
our ability to maintain the functional and efficient operation of our information technology systems, including our ability to defend from the risk of cyberattacks on our in-vehicle technology; and
|
|
•
|
other factors discussed elsewhere in this document.
|
We expressly disclaim and do not assume any liability in connection with any inaccuracies in any of the forward-looking statements in this document or in connection with any use by any third party of such forward-looking statements. Actual results could differ materially from those anticipated in such forward-looking statements. We do not undertake an obligation to update or revise publicly any forward-looking statements.
Additional factors which could cause actual results and developments to differ from those expressed or implied by the forward-looking statements are included in the section “Risk Factors” of this report. These factors may not be exhaustive and should be read in conjunction with the other cautionary statements included in this report. You should evaluate all forward-looking statements made in this report in the context of these risks and uncertainties.
IV
Not Applicable.
Not Applicable.
A. Selected Financial Data
The following tables set forth selected historical consolidated financial and other data of Ferrari and have been derived from:
|
(i)
|
the audited Consolidated Financial Statements, included elsewhere in this document;
|
|
(ii)
|
the audited consolidated income statement of the Company for the years ended
December 31, 2014
and
2013
and the audited consolidated statement of financial position at
December 31, 2015
,
2014
and
2013
;
|
This financial information has been prepared in accordance with IFRS.
For the purposes of the financial information set forth in this section, with the exception of the FCA Note and subsequent refinancing, which were reflected from the dates on which they occurred, the Restructuring has been retrospectively reflected as though it had occurred effective January 1, 2013.
The following information should be read in conjunction with “Note on Presentation,” “Item 3.D.
Risk Factors
,” “Item 5.
Operating and Financial Review and Prospects
” and the Consolidated Financial Statements included elsewhere in this document. Historical results for any period are not necessarily indicative of results for any future period.
|
For the years ended December 31,
|
||||||||||||||
|
2017
|
2016
|
2015
|
2014
|
2013
|
||||||||||
|
(€ million, except per share data)
|
||||||||||||||
|
Net revenues
|
3,417
|
|
3,105
|
|
2,854
|
|
2,762
|
|
2,335
|
|
||||
|
EBIT
|
775
|
|
595
|
|
444
|
|
389
|
|
364
|
|
||||
|
Profit before taxes
|
746
|
|
567
|
|
434
|
|
398
|
|
366
|
|
||||
|
Net profit
|
537
|
|
400
|
|
290
|
|
265
|
|
246
|
|
||||
|
Net profit attributable to:
|
||||||||||||||
|
Owners of the parent
|
535
|
|
399
|
|
288
|
|
261
|
|
241
|
|
||||
|
Non-controlling interests
|
2
|
|
1
|
|
2
|
|
4
|
|
5
|
|
||||
|
Basic earnings per common share (€)
(1)
|
2.83
|
|
2.11
|
|
1.52
|
|
1.38
|
|
1.27
|
|
||||
|
Diluted earnings per common share (€)
(1) (2)
|
2.82
|
|
2.11
|
|
1.52
|
|
1.38
|
|
1.27
|
|
||||
|
Dividend paid per share (€)
|
—
|
|
—
|
|
—
|
|
—
|
|
—
|
|
||||
|
Distribution paid per common share (€)
(3) (4)
|
0.635
|
|
0.46
|
|
—
|
|
—
|
|
—
|
|
||||
_____________________________
|
(1)
|
Retrospectively reflects the issuance of 188,923,499 common shares as if the Separation had occurred on January 1, 2013. See also Note 13 to the Consolidated Financial Statements.
|
|
(2)
|
In order to calculate the diluted earnings per common share for the year ended December 31, 2017, the weighted average number of shares outstanding has been increased to take into consideration the theoretical effect of (i) the potential common shares that would be issued under the equity incentive plan and (ii) the potential common shares that would have been issued for the Non-Executive Directors’ compensation agreement. In order to calculate the diluted earnings per common share for the year ended December 31, 2016, the weighted average numbers of shares outstanding has been increased to
|
1
take into consideration the theoretical effect of the potential common shares that would have been issued for the Non-Executive Directors
’
compensation agreement. For the years ended December 31, 2015, 2014 and 2013 there were no potentially dilutive instruments. See Note 13 to the Consolidated Financial Statements for additional information.
|
(3)
|
Following approval of the annual accounts by the shareholders at the Annual General Meeting of the Shareholders on April 14, 2017, a cash distribution
|
of €0.635 per common share was approved, corresponding to a total distribution of €120 million. The distribution was made from the share premium reserve which is a distributable reserve under Dutch law.
|
(4)
|
Following approval of the annual accounts by the shareholders at the Annual General Meeting of the Shareholders on April 15, 2016, the Company paid a cash distribution of €0.46 per common share in
May 2016
, corresponding to a total distribution of €87 million. The distribution was made from the share premium reserve which is a distributable reserve under Dutch law.
|
|
At December 31,
|
||||||||||||||
|
2017
|
2016
|
2015
|
2014
|
2013
|
||||||||||
|
(€ million, except shares issued)
|
||||||||||||||
|
Cash and cash equivalents
|
648
|
|
458
|
|
183
|
|
134
|
|
114
|
|
||||
|
Deposits in FCA Group cash management pools
(1)
|
—
|
|
—
|
|
139
|
|
942
|
|
684
|
|
||||
|
Total assets
|
4,141
|
|
3,850
|
|
3,875
|
|
4,641
|
|
3,895
|
|
||||
|
Debt
|
1,806
|
|
1,848
|
|
2,260
|
|
510
|
|
317
|
|
||||
|
Total equity/(deficit)
(2)
|
784
|
|
330
|
|
(19
|
)
|
2,478
|
|
2,316
|
|
||||
|
Equity/(Deficit) attributable to owners of the parent
|
779
|
|
325
|
|
(25
|
)
|
2,470
|
|
2,290
|
|
||||
|
Non-controlling interests
|
5
|
|
5
|
|
6
|
|
8
|
|
26
|
|
||||
|
Share capital
|
3
|
|
3
|
|
4
|
|
4
|
|
4
|
|
||||
|
Common shares issued (in thousands of shares)
(3)
|
188,954
|
|
188,923
|
|
188,923
|
|
188,923
|
|
188,923
|
|
||||
_____________________________
|
(1)
|
Deposits in FCA Group cash management pools related to our participation in a group-wide cash management system at FCA prior to the Separation, where the operating cash management, main funding operations and liquidity investment of the Group were centrally coordinated by dedicated treasury companies with the objective of ensuring effective and efficient management of our funds. Following the Separation on January 3, 2016, these arrangements were terminated and we manage our liquidity and treasury function on a standalone basis.
|
|
(2)
|
The deficit at December 31, 2015 is a result of the effects of the Restructuring. See “Consolidated Statement of Changes in Equity” to the Consolidated Financial Statements for additional details.
|
|
(3)
|
The number of common shares issued retrospectively reflects the issuance of common shares (net of treasury shares), all with a nominal value of €0.01, as if the Separation had occurred on January 1, 2013.
|
Other Statistical Information
|
For the years ended December 31,
|
||||||||||||||
|
2017
|
2016
|
2015
|
2014
|
2013
|
||||||||||
|
Shipments (number of cars)
|
8,398
|
|
8,014
|
|
7,664
|
|
7,255
|
|
7,000
|
|
||||
|
Average number of employees for the period
|
3,336
|
|
3,115
|
|
2,954
|
|
2,843
|
|
2,774
|
|
||||
Exchange rates
These exchange rates are included for informational purposes only and may differ from the exchange rates used in the preparation of the Consolidated Financial Statements. For a description of the exchange rates used in the preparation of our Consolidated Financial Statements, please refer to section “Significant Accounting Policies” of the Consolidated Financial Statements included elsewhere in this document.
2
The table below shows the high, low, average and period end noon buying rates in The City of New York for cable transfers in foreign currencies as certified for customs purposes by the Federal Reserve Bank of New York for U.S.$ per €1.00. The average is computed using the noon buying rate on the last business day of each month during the period indicated.
|
Period
|
High
|
Low
|
Average
|
Period End
|
|||
|
Year ended December 31, 2013
|
1.3816
|
1.2774
|
1.3281
|
1.3779
|
|||
|
Year ended December 31, 2014
|
1.3927
|
1.2101
|
1.3210
|
1.2101
|
|||
|
Year ended December 31, 2015
|
1.2015
|
1.0524
|
1.1032
|
1.0859
|
|||
|
Year ended December 31, 2016
|
1.1516
|
1.0375
|
1.1072
|
1.0552
|
|||
|
Year ended December 31, 2017
|
1.2041
|
1.0416
|
1.1298
|
1.2022
|
|||
|
Year ended December 31, 2018 (through February 16
, 2018)
|
1.2488
|
1.1922
|
1.2259
|
1.2442
|
|||
The table below shows the high and low noon buying rates for Euro for each month during the six months prior to the date of this document.
|
Period
|
High
|
Low
|
|
|
September 2017
|
1.2041
|
1.1747
|
|
|
October 2017
|
1.1847
|
1.1580
|
|
|
November 2017
|
1.1936
|
1.1577
|
|
|
December 2017
|
1.2022
|
1.1725
|
|
|
January 2018
|
1.2488
|
1.1922
|
|
|
February 2018 (through February 16, 2018)
|
1.2482
|
1.2226
|
|
On February 16, 2018, the noon buying rate for U.S. Dollars was €1.00 = U.S.$ 1.2442.
Not applicable.
C. Reason for the Offer and Use of Proceeds
Not applicable.
D. Risk Factors
We face a variety of risks in our business. The risks and uncertainties described below are not the only ones facing us. Additional risks and uncertainties that we are unaware of or that we currently believe to be immaterial, may also become important factors that affect us.
Risks Related to Our Business, Strategy and Operations
We may not succeed in preserving and enhancing the value of the Ferrari brand, which we depend upon to drive demand and revenues.
Our financial performance is influenced by the perception and recognition of the Ferrari brand, which, in turn, depends on many factors such as the design, performance, quality and image of our cars, the appeal of our dealerships and stores, the success of our promotional activities including public relations and marketing, as well as our general profile, including our brand’s image of exclusivity. The value of our brand and our ability to achieve premium pricing for Ferrari-branded products may decline if we are unable to maintain the value and image of the Ferrari brand, including, in particular, its aura of exclusivity. Maintaining the value of our brand will depend significantly on our ability to continue to produce luxury performance cars of the highest quality. The market for luxury goods generally and for luxury automobiles in particular is intensely competitive, and we may not be successful in maintaining and strengthening the appeal of our brand. Client preferences, particularly among luxury goods, can vary over time, sometimes rapidly. We are therefore exposed to changing perceptions of our brand image,
3
particularly as we seek to attract new generations of clients and, to that end, we renovate and expand our models range. For example, the gradual expansion of hybrid engine technology will also introduce a notable change in the overall driver experience compared to the combustion engine cars of our range models to date. Any failure to preserve and enhance the value of our brand may materially and adversely affect our ability to sell our cars, to maintain premium pricing, and to extend the value of our brand into other activities profitably or at all.
We selectively license the Ferrari brand to third parties that produce and sell Ferrari-branded luxury goods and therefore we rely on our licensing partners to preserve and enhance the value of our brand. If our licensees or the manufacturers of these products do not maintain the standards of quality and exclusivity that we believe are consistent with the Ferrari brand, or if such licensees or manufacturers otherwise misuse the Ferrari brand, our reputation and the integrity and value of our brand may be damaged and our business, operating results and financial condition may be materially and adversely affected.
Our brand image depends in part on the success of our Formula 1 racing team.
The prestige, identity, and appeal of the Ferrari brand depend in part on the continued success of the Scuderia Ferrari racing team in the Formula 1 World Championship. The racing team is a key component of our marketing strategy and may be perceived by our clients as a demonstration of the technological capabilities of our Sports and GT cars which also supports the appeal of other Ferrari-branded luxury goods. We have focused on restoring the success of our Formula 1 racing team as our most recent driver’s championship and constructors’ championship were in 2007 and 2008, respectively. We are focused on improving our racing results and restoring our historical position as the premier racing team. If we are unable to attract and retain the necessary talent to succeed in international competitions or devote the capital necessary to fund successful racing activities, the value of the Ferrari brand and the appeal of our cars and other luxury goods may suffer. Even if we are able to attract such talent and adequately fund our racing activities, there is no assurance that this will lead to competitive success for our racing team.
The success of our racing team depends in particular on our ability to attract and retain top drivers and racing management and engineering talent. Our primary Formula 1 drivers, team managers and other key employees of Scuderia Ferrari are critical to the success of our racing team and if we were to lose their services, this could have a material adverse effect on the success of our racing team and correspondingly the Ferrari brand. If we are unable to find adequate replacements or to attract, retain and incentivize drivers and team managers, other key employees or new qualified personnel, the success of our racing team may suffer. As the success of our racing team forms a large part of our brand identity, a sustained period without racing success could detract from the Ferrari brand and, as a result, potential clients’ enthusiasm for the Ferrari brand and their perception of our cars, which could have an adverse effect on our business, results of operations and financial condition.
If we are unable to keep up with advances in high performance car technology, our competitive position may suffer.
Performance cars are characterized by leading-edge technology which is constantly evolving. In particular, advances in racing technology often lead to improved technology in road cars. Although we invest heavily in research and development, we may be unable to maintain our leading position in high performance car technology and, as a result, our competitive position may suffer. As technologies change, we plan to upgrade or adapt our cars and introduce new models in order to continue to provide cars with the latest technology. However, our cars may not compete effectively with our competitors’ cars if we are not able to develop, source and integrate the latest technology into our cars. For example, luxury performance cars will in the next few years begin to transition to hybrid technology, albeit at a slower pace compared to mass market vehicles. See “
The introduction of hybrid cars is costly and its long term success is uncertain
”.
Developing and applying new automotive technologies is costly, and may become even more costly in the future as available technology advances and competition in the industry increases. If our research and development efforts do not lead to improvements in car performance relative to the competition, or if we are required to spend more to achieve comparable results, sales of our cars or our profitability may suffer.
If our car designs do not appeal to clients, our brand and competitive position may suffer.
Design and styling are an integral component of our models and our brand. Our cars have historically been characterized by distinctive designs combining the aerodynamics of a sports car with powerful, elegant lines. We believe our clients purchase our cars for their appearance as well as their performance. However, we will need to renew over time the style of our cars to differentiate the new models we produce from older models, and to reflect the broader evolution of aesthetics in our markets. We devote great efforts to the design of our cars and most of our current models are designed by Ferrari Design Centre, our in-
4
house design team. If the design of our future models fails to meet the evolving tastes and preferences of our clients and prospective clients, or the appreciation of the wider public, our brand may suffer and our sales may be adversely affected.
The value of our brand depends in part on the automobile collector and enthusiast community.
An important factor in the connection of clients to the Ferrari brand is our strong relationship with the global community of automotive collectors and enthusiasts, particularly collectors and enthusiasts of Ferrari automobiles. This is influenced by our close ties to the automotive collectors’ community and our support of related events (such as car shows and driving events), at our headquarters in Maranello and through our dealers, the Ferrari museum and affiliations with regional Ferrari clubs. The support of this community also depends upon the perception of our cars as collectibles, which we also support through our Ferrari Classiche services, and the active resale market for our automobiles which encourages interest over the long term.
If there is a change in collector appetite or damage to the Ferrari brand, our ties to and the support we receive from this community may be diminished. Such a loss of enthusiasm for our cars from the automotive collectors’ community could harm the perception of the Ferrari brand and adversely impact our sales and profitability.
Demand for luxury goods, including luxury performance cars, is volatile, which may adversely affect our operating results.
Volatility of demand for luxury goods, in particular luxury performance cars, may adversely affect our business, operating results and financial condition. The markets in which we sell our cars have been subject to volatility in demand in recent periods. Demand for luxury automobiles depends to a large extent on general, economic, political and social conditions in a given market as well as the introduction of new vehicles and technologies. As a luxury performance car manufacturer and low volume producer, we compete with larger automobile manufacturers many of which have greater financial resources in order to withstand changes in the market and disruptions in demand. Demand for our cars may also be affected by factors directly impacting automobile prices or the cost of purchasing and operating automobiles, such as the availability and cost of financing, prices of raw materials and parts and components, fuel costs and governmental regulations, including tariffs, import regulation and other taxes, including taxes on luxury goods, resulting in limitations to the use of high performance sports cars or luxury goods more generally. Volatility in demand may lead to lower car unit sales, which may result in further downward price pressure and adversely affect our business, operating results and financial condition. These effects may have a more pronounced impact on us given our low volume strategy and relatively smaller scale as compared to large global mass-market automobile manufacturers.
Our low volume strategy may limit potential profits, and if volumes increase our brand exclusivity may be eroded.
A key to the appeal of the Ferrari brand and our marketing strategy is the aura of exclusivity and the sense of luxury which our brand conveys. A central facet to this exclusivity is the limited number of models and cars we produce and our strategy of maintaining our car waiting lists to reach the optimal combination of exclusivity and client service. Our low volume strategy is also an important factor in the prices that our clients are willing to pay for our cars. This focus on maintaining exclusivity limits our potential sales growth and profitability.
On the other hand, our current growth strategy contemplates a measured but significant increase in car sales above current levels as we target a larger customer base and modes of use, and we increase our focus on GT cars.
In pursuit of our strategy, we may be unable to maintain the exclusivity of the Ferrari brand. If we are unable to balance brand exclusivity with increased production, we may erode the desirability and ultimately the consumer demand for our cars. As a result, if we are unable to increase car production meaningfully or introduce new car models without eroding the image of exclusivity in our brand we may be unable to significantly increase our revenues.
Our revenues from Formula 1 activities may decline and our related expenses may grow.
Revenues from our Formula 1 activities depend principally on the income from our sponsorship agreements and on our share of Formula 1 revenues from broadcasting and other sources. See “Item 4.B.
Business—Formula 1 Activities
.” If we are unable to renew our existing sponsorship agreements or if we enter into new or renewed sponsorship agreements with less favorable terms, our revenues would decline. In addition, our share of Formula 1 results may decline if either our team’s performance worsens compared to other competing teams, or if the overall Formula 1 business suffers. Furthermore, in order to compete effectively on track we have been investing significant resources in research and development and to competitively compensate the best available drivers and other racing team members. These expenses also vary based on changes in Formula
5
1 regulations that require modification to our racing engines and cars. These expenses are expected to continue, and may grow further, including as a result of any changes in Formula 1 regulations, which would negatively affect our results of operations.
In addition the company that owns the Formula 1 business was recently acquired by new owners and it is uncertain whether and how the arrangements relating to the participation of Ferrari and the other teams competing in the championship may change in the future particularly in the period following the 2020 expiration of the current arrangements between racing teams and the operator of Formula 1. We are currently evaluating the terms and conditions under which we may continue to participate in the Formula 1 championship after the 2020 season and we cannot be certain that we or other racing teams will be successful in negotiating acceptable terms and conditions for continued participation. If we were to withdraw from Formula 1 this would affect our marketing and brand strategies and we currently are unable to predict the consequences on our business, financial condition and results of operations. See “Item 4.B.
Business—Formula 1 Activities
.” for a description of the change in ownership of Formula 1.
The small number of car models we produce and sell may result in greater volatility in our financial results.
We depend on the sales of our range and special series models and our limited edition supercar to generate our revenues. Our current product range consists of six range models (including three sports cars and three GT cars), one special series car and one limited edition supercar. While we anticipate expanding our car offerings, we expect that a limited number of models will continue to account for a large portion of our revenues at any given time in the foreseeable future. Therefore, our future operating results depend upon the continued market acceptance of each model in our line-up. There can be no assurance that our cars will continue to be successful in the market. It generally takes several years from the beginning of the development phase to the start of production for a new model and the car development process is capital intensive. As a result, we would likely be unable to replace quickly the revenue lost from one of our main car models if it does not achieve market acceptance. Furthermore, our revenues and profits may also be affected by our “special series” and limited edition cars that we launch from time to time and which are typically priced higher than our range models. There can be no assurance that we will be successful in developing, producing and marketing additional new cars that will sustain sales growth in the future.
Engine production revenues are dependent on Maserati’s ability to sell its cars.
We produce V8 and V6 engines for Maserati. In particular, we have a multi-year arrangement with Maserati to provide V6 engines through 2020, which may be followed by further production runs in future periods. In 2017 we recorded net revenues of €302 million from the sales of engines to Maserati. While Maserati is required to compensate us for certain costs we may incur, such as penalties from our suppliers, in the event that the sales of Maserati cars decline, or do not increase at the expected rate, such an event would adversely affect our revenues from the sale of engines.
Our business is subject to changes in client preferences and trends in the automotive and luxury industry.
Our continued success depends in part on our ability to originate and define product and trends in the automotive and luxury industry, as well as to anticipate and respond promptly to changing consumer demands and automotive trends in the design, styling, technology, production, merchandising and pricing of our products. Our products must appeal to a client base whose preferences cannot be predicted with certainty and are subject to rapid change. Evaluating and responding to client preferences has become even more complex in recent years, due to our expansion in new geographical markets. The introduction of electric and hybrid technology and the associated changes in customer preferences that may follow are also a challenge we will face in future periods. See also
“If we are unable to keep up with advances in high performance car technology, our competitive position may suffer”
and “
The introduction of hybrid cars is costly and its long term success is uncertain
”. If we misjudge the market for our products, we and our dealers may be faced with excess inventories for some cars and missed opportunities with others. In addition, there can be no assurance that we will be able to produce, distribute and market new products efficiently or that any product category that we may expand or introduce will achieve sales levels sufficient to generate profits. We will encounter this risk, for example, if we decide to expand our range to include one or more luxury high performance utility vehicles. Furthermore this risk is particularly pronounced as we expand in accordance with our strategy into adjacent segments of the luxury industry, where we do not have a level of experience and market presence comparable to the one we have in the automotive industry. Any of these risks could have a material adverse effect on our business, results of operations and financial condition.
Global economic conditions may adversely affect us.
Our sales volumes and revenues may be affected by overall general economic conditions. Deteriorating general economic conditions may affect disposable incomes and reduce consumer wealth impacting client demand, particularly for
6
luxury goods, which may negatively impact our profitability and put downward pressure on our prices and volumes. Furthermore, during recessionary periods, social acceptability of luxury purchases may decrease and higher taxes may be more likely to be imposed on certain luxury goods including our cars, which may affect our sales. Adverse economic conditions may also affect the financial health and performance of our dealers in a manner that will affect sales of our cars or their ability to meet their commitments to us.
Many factors affect the level of consumer spending in the luxury performance car industry, including the state of the economy as a whole, stock market performance, interest and exchange rates, inflation, political uncertainty, the availability of consumer credit, tax rates, unemployment levels and other matters that influence consumer confidence. In general, although our sales have historically been comparatively resilient in periods of economic turmoil, sales of luxury goods tend to decline during recessionary periods when the level of disposable income tends to be lower or when consumer confidence is low.
We distribute our products internationally and we may be affected by downturns in general economic conditions or uncertainties regarding future economic prospects that may impact the countries in which we sell a significant portion of our products. In particular, the majority of our current sales are in the EU and in the United States; if we are unable to expand in emerging markets, a downturn in mature economies such as the EU and the United States may negatively affect our financial performance. The EU economies in particular have suffered a prolonged period of slow growth since the 2008 financial crisis. In addition, uncertainties regarding future trade arrangements and industrial policies in various countries or regions, such as in the United Kingdom following the referendum to leave the European Union (see further
“We may be adversely affected by the UK determination to leave the European Union (Brexit)”
) create additional macroeconomic risk. In the United States, any policy to discourage import into the United States of vehicles produced elsewhere could adversely affect our operations. Any new policies and any steps we may take to address such new policies may have an adverse effect on our business, financial condition and results of operations. In addition, a further economic slowdown or changes in the economic and political situation in the Middle East region may impact the demand for our products in that market, which may adversely impact our revenues in the relevant periods. A significant decline in the EU, the global economy or in the specific economies of our markets, or in consumers’ confidence, could have a material adverse effect on our business. See also
“Developments in emerging markets may adversely affect out business”
.
New laws, regulations, or policies of governmental organizations regarding increased fuel economy requirements, reduced greenhouse gas or pollutant emissions, or vehicle safety, or changes in existing laws, may have a significant effect on our costs of operation and/or how we do business.
We are subject throughout the world to comprehensive and constantly evolving laws, regulations and policies. We expect the extent of the legal and regulatory requirements affecting our business and our costs of compliance to continue to increase significantly in the future. In Europe and the United States, for example, significant governmental regulation is driven by environmental, fuel economy, vehicle safety and noise emission concerns. Evolving regulatory requirements could significantly affect our product development plans and may limit the number and types of cars we sell and where we sell them, which may affect our revenue. Governmental regulations may increase the costs we incur to design, develop and produce our cars and may affect our product portfolio. Regulation may also result in a change in the character or performance characteristics of our cars which may render them less appealing to our clients. We anticipate that the number and extent of these regulations, and their effect on our cost structure and product line-up, will increase significantly in the future.
Current European legislation limits fleet average greenhouse gas emissions for new passenger cars, and new targets have been set in 2014 with more stringent emission targets applicable to the 2017-2021 period. Due to our small volume manufacturer (“SVM”) status we benefit from a derogation from the existing emissions requirement and we are instead required to meet, by 2021, alternative targets for our fleet of EU-registered vehicles.
In the United States, the U.S. Environmental Protection Agency (“EPA”) and the National Highway Traffic Safety Administration (“NHTSA”) have set the federal standards for passenger cars and light trucks to meet certain combined average greenhouse gas (“GHG”) and fuel economy (“CAFE”) levels and more stringent standards have been prescribed for model years 2017 through 2025. As a SVM that is able to demonstrate our operational independence from FCA, we expect to benefit from a derogation from currently applicable standards. We have also petitioned the EPA for alternative standards for the 2017-2021 model years, which are aligned to our technical and economic capabilities. In September 2016 we petitioned NHTSA for recognition as an independent manufacturer of less than 10,000 vehicles produced globally and we proposed alternative CAFE standards for Model Years 2017, 2018 and 2019. Then, in December, 2017, we amended the petition by proposing alternative CAFE standards for Model Years 2016, 2017 and 2018 instead, covering also the 2016 Model Year. NHTSA have not yet responded to our petition. We will need in the future to file with NHTSA a petition for 2019-2020 and 2021 model years. If our
7
petitions are rejected, we will not be able to benefit from the more favorable CAFE standards levels which we have petitioned for and this may require us to purchase additional CAFE credits in order to comply with applicable CAFE standards.
In addition, we are subject to legislation relating to the emission of other air pollutants such as, among others, the “Tier 3” Motor Vehicle Emission and Fuel Standards issued by the EPA, and the Zero Emission Vehicle regulation in California, which are subject to similar derogations for SVMs, as well as vehicle safety legislation. NHTSA also recently published guidelines for driver distraction, and the associated compliance costs may be substantial.
Other governments around the world, such as those in Canada, South Korea, China and certain Middle Eastern countries are also creating new policies to address these issues which could be even more stringent than the U.S. or European requirements. As in the United States and Europe, these government policies if applied to us could significantly affect our product development plans. In China, for example, Stage IV fuel consumption regulation targets a national average fuel consumption of 5.0L/100km by 2020.
In response to severe air quality issues in Beijing and other major Chinese cities, in 2016 the Chinese government published a more stringent emissions program (National 6), providing two different levels of stringency effective starting from 2020. Moreover autonomous Chinese regions and municipalities are allowed to implement these more stringent requirements in advance of 2020. If local Chinese regions and municipalities implement such requirements before 2020 this could lead us to revise our product development and production plans in China, incur significant costs and change marketing strategies in China, which may affect our profits.
We could lose our status as a SVM in the EU, the United States and other countries if we do not continue to meet all of the necessary eligibility criteria under applicable regulations as they evolve. In order to meet these criteria we may need to modify our growth plans or other operations. Furthermore, even if we continue to benefit from derogations as a SVM, we will be subject to alternative standards that the regulators deem appropriate for our technical and economic capabilities and such alternative standards may be significantly more stringent than those currently applicable to us.
Under these existing regulations, as well as new or stricter rules or policies, we could be subject to sizable civil penalties or have to restrict or modify product offerings drastically to remain in compliance. We may have to incur substantial capital expenditures and research and development expenditures to upgrade products and manufacturing facilities, which would have an impact on our cost of production and results of operation. For a description of recent fines we have paid and a summary of the regulation referred to in the paragraphs above please see
“Item 4.B. Business Overview - Regulatory Matters”
.
In the future, the advent of self-driving technology may result in regulatory changes that we cannot predict but may include limitations or bans on human driving in specific areas. Similarly, driving bans on combustion engine vehicles could be imposed, particularly in metropolitan areas, as a result of progress in electric and hybrid technology. Any such future developments may adversely affect the demand for our cars and our business.
In September 2017 the Chinese government issued the Administrative Measures on CAFC (Corporate Average Fuel Consumption) and NEV (New Energy Vehicle) Credits. This regulation establishes mandatory CAFC requirements, while providing additional flexibilities for SVMs (less than 2,000 units/year imported in China) that achieve a certain minimum CAFC yearly improvement rate. Because our CAFC is expected to exceed the regulatory ceiling, we will be required to purchase NEV credits. There is no assurance that an adequate market for NEV credits will develop in China and if we are not able to secure sufficient NEV credits this may adversely affect our business in China.
Our growth strategy exposes us to risks.
Our growth strategy includes a controlled expansion of our sales and operations, including the launching of new car models and expanding sales and dealer operations in targeted growth regions internationally. In particular, our growth strategy requires us to expand operations in regions that we have identified as having relatively high growth potential. We may encounter difficulties, including more significant competition in entering and establishing ourselves in these markets.
Our growth depends on the continued success of our existing cars, as well as the successful design and introduction of new cars. Our ability to create new cars and to sustain existing car models is affected by whether we can successfully anticipate and respond to consumer preferences and car trends. The failure to develop and launch successful new cars could hinder the growth of our business. Also, any delay in the development or launch of a new product could result in others bringing new products and technology to market first, which could compromise our competitive position. As part of our growth strategy, we plan to broaden the range of our models to capture additional customer demand for different types of vehicles and modes of
8
utilization. For example, we are currently evaluating the development and launch of a luxury high performance utility vehicle. In addition, we will gradually expand the use of hybrid technology in our road cars, consistent with customer preferences and broader industry trends. While we will seek to ensure that these changes remain fully consistent with the Ferrari car identity, we cannot be certain that they will prove profitable and commercially successful.
Our growth strategy may expose us to new business risks that we may not have the expertise, capability or the systems to manage. This strategy will also place significant demands on us by requiring us to continuously evolve and improve our operational, financial and internal controls. Continued expansion also increases the challenges involved in maintaining high levels of quality, management and client satisfaction, recruiting, training and retaining sufficient skilled management, technical and marketing personnel. If we are unable to manage these risks or meet these demands, our growth prospects and our business, results of operation and financial condition could be adversely affected.
We plan to redesign our international network footprint and skill set. We also plan to open additional retail stores in international markets. We do not yet have significant experience directly operating in many of these markets, and in many of them we face established competitors. Many of these countries have different operational characteristics, including but not limited to employment and labor, transportation, logistics, real estate, environmental regulations and local reporting or legal requirements.
Consumer demand and behavior, as well as tastes and purchasing trends may differ in these markets, and as a result, sales of our products may not be successful, or the margins on those sales may not be in line with those we currently anticipate. Furthermore, such markets will have upfront short-term investment costs that may not be accompanied by sufficient revenues to achieve typical or expected operational and financial performance and therefore may be dilutive to us in the short-term. In many of these countries, there is significant competition to attract and retain experienced and talented employees.
Consequently, if our international expansion plans are unsuccessful, our business, results of operation and financial condition could be materially adversely affected.
The introduction of hybrid cars is costly and its long term success is uncertain.
We intend to gradually introduce hybrid technology in both our sports and GT cars ranges. In accordance with our strategy, we believe hybrid technology will be key to providing continuing performance upgrades to our sports car customers, and will also help us capture the preferences of the urban, affluent GT cars purchasers whom we are increasingly targeting.
While we have introduced hybrid technology in some models, such as LaFerrari and LaFerrari Aperta, the integration of such technology more broadly into our car portfolio over time may present challenges and costs. We expect to increase R&D spending in 2018 particularly on hybrid technology-related projects. Although we expect to price our future hybrid cars appropriately to recoup the investments and expenditures we are making, we cannot be certain that these expenditures will be fully recovered. In addition, this transformation of our car technology creates risks and uncertainties such as the impact on driver experience, and the impact on the cars’ residual value over time, both of which may be met with an unfavorable market reaction. Other manufacturers of luxury sports cars may be more successful in implementing hybrid technology. Longer term, although we believe that combustion engines will continue to be fundamental to the Ferrari driver experience, pure electric cars may become the prevalent technology for performance sports cars thereby displacing hybrid models. See also “
If we are unable to keep up with advances in high performance car technology, our competitive position may suffer
.”
Because hybrid technology is a core component of our strategy, if the introduction of hybrid cars proves too costly or is unsuccessful in the market, our business and results of operations could be materially adversely affected.
Our indebtedness could adversely affect our operations and we may face difficulties in servicing or refinancing our debt.
As of
December 31, 2017
, our total consolidated debt was approximately €
1,806 million
(which includes our financial services), including €
500 million
aggregate principal amount of 1.500% notes due 2023, and €
700 million
aggregate principal amount of 0.250% notes due 2021, see Item 5.B
.
“
Liquidity and Capital Resources
”. Our current and long-term debt requires us to dedicate a portion of our cash flow to service interest and principal payments and, if interest rates rise, this amount may increase. In addition, our existing debt may limit our ability to raise further capital to execute our growth strategy or otherwise may place us at a competitive disadvantage relative to competitors that have less debt. The agreements governing our indebtedness do not prohibit the incurrence of additional indebtedness. To the extent we become more leveraged, the risks described above would increase. We may also have difficulty refinancing our existing debt or incurring new debt on terms that we would consider to be commercially reasonable, if at all.
9
We face competition in the luxury performance car industry.
We face competition in all product categories and markets in which we operate. We compete with other international luxury performance car manufacturers which own and operate well-known brands of high-quality cars, some of which form part of larger automotive groups and may have greater financial resources and bargaining power with suppliers than we do, particularly in light of our policy to maintain low volumes in order to preserve and enhance the exclusivity of our cars. We believe that we compete primarily on the basis of our brand image, the performance and design of our cars, our reputation for quality and the driving experience for our customers. If we are unable to compete successfully, our business, results of operations and financial condition could be adversely affected.
Developments in emerging markets may adversely affect our business.
We operate in a number of emerging markets, both directly and through our dealers and we have experienced increasing demand in China and other regions in Asia.
Our strategy contemplates expanding our sales in Asia, recognizing the increasing personal wealth in these markets. While demand in these markets has increased in recent years due to sustained economic growth and growth in personal income and wealth, we are unable to foresee the extent to which economic growth in these emerging markets will be sustained. For example, rising geopolitical tensions and potential slowdowns in the rate of growth there and in other emerging markets could limit the opportunity for us to increase unit sales and revenues in those regions in the near term.
Our exposure to emerging countries is likely to increase, as we pursue expanded sales in such countries. Economic and political developments in emerging markets, including economic crises or political instability, have had and could have in the future material adverse effects on our results of operations and financial condition. Further, in certain markets in which we or our dealers operate, required government approvals may limit our ability to act quickly in making decisions on our operations in those markets. Other government actions may also impact the market for luxury goods in these markets, such as tax changes or the active discouragement of luxury purchases.
Maintaining and strengthening our position in these emerging markets is a key component of our global growth strategy. However, initiatives from several global luxury automotive manufacturers have increased competitive pressures for luxury cars in several emerging markets. As these markets continue to grow, we anticipate that additional competitors, both international and domestic, will seek to enter these markets and that existing market participants will try to aggressively protect or increase their market share. Increased competition may result in pricing pressures, reduced margins and our inability to gain or hold market share, which could have a material adverse effect on our results of operations and financial condition. See also “
Global economic conditions may adversely us
”.
Our success depends largely on the ability of our current management team to operate and manage effectively.
Our success depends on the ability of our senior executives and other members of management to effectively manage our business as a whole and individual areas of the business. Our management team particularly benefits from the leadership of our CEO and Chairman, Sergio Marchionne, who engineered the operating and financial turnaround of Fiat and Chrysler and the global expansion of FCA into the eighth largest automaker in the world (based on 2017 vehicle sales worldwide). Our employees, particularly in our production facilities in and around Maranello, Italy include many highly skilled engineers, technicians and artisans. If we were to lose the services of any of these senior executives or key employees, this could have a material adverse effect on our business, operating results and financial condition. We have developed a management succession plans that we believe are appropriate in the circumstances, although it is difficult to predict with any certainty that we will replace these individuals with persons of equivalent experience and capabilities. If we are unable to find adequate replacements or to attract, retain and incentivize senior executives, other key employees or new qualified personnel, our business, results of operations and financial condition may suffer.
We rely on our dealer network to provide sales and services.
We do not own our Ferrari dealers and virtually all of our sales are made through our network of dealerships located throughout the world. If our dealers are unable to provide sales or service quality that our clients expect or do not otherwise adequately project the Ferrari image and its aura of luxury and exclusivity, the Ferrari brand may be negatively affected. We depend on the quality of our dealership network and our business, operating results and financial condition could be adversely affected if our dealers suffer financial difficulties or otherwise are unable to perform to our expectations. Furthermore, we may experience disagreements or disputes in the course of our relationship with our dealers or upon termination which may lead to financial costs, disruptions and reputational harm.
10
Our growth strategy also depends on our ability to attract a sufficient number of quality new dealers to sell our products in new areas. We may face competition from other luxury performance car manufacturers in attracting quality new dealers, based on, among other things, dealer margin, incentives and the performance of other dealers in the region. If we are unable to attract a sufficient number of new Ferrari dealers in targeted growth areas, our prospects could be materially adversely affected.
We depend on our suppliers, many of which are single source suppliers; and if these suppliers fail to deliver necessary raw materials, systems, components and parts of appropriate quality in a timely manner, our operations may be disrupted.
Our business depends on a significant number of suppliers, which provide the raw materials, components, parts and systems we require to manufacture cars and parts and to operate our business. We use a variety of raw materials in our business including aluminum, and precious metals such as palladium and rhodium. We source materials from a limited number of suppliers. We cannot guarantee that we will be able to maintain access to these raw materials, and in some cases this access may be affected by factors outside of our control and the control of our suppliers. In addition, prices for these raw materials fluctuate and while we seek to manage this exposure, we may not be successful in mitigating these risks.
As with raw materials, we are also at risk of supply disruption and shortages in parts and components we purchase for use in our cars. We source a variety of key components from third parties, including transmissions, brakes, driving-safety systems, navigation systems, mechanical, electrical and electronic parts, plastic components as well as castings and tires, which makes us dependent upon the suppliers of such components. In the future, we will also require a greater number of batteries and other components of hybrid engines as we introduce hybrid technology in our range model offering, and we expect producers of batteries will be called to increase the levels of supply as the shift to hybrid or electric technology gathers pace in the industry. While we obtain components from multiple sources whenever possible, similar to other small volume car manufacturers, most of the key components we use in our cars are purchased by us from single source suppliers. We generally do not qualify alternative sources for most of the single-sourced components we use in our cars and we do not maintain long-term agreements with a number of our suppliers. Furthermore, we have limited ability to monitor the financial stability of our suppliers.
While we believe that we may be able to establish alternate supply relationships and can obtain or engineer replacement components for our single-sourced components, we may be unable to do so in the short term, or at all, at prices or costs that we believe are reasonable. Qualifying alternate suppliers or developing our own replacements for certain highly customized components of our cars may be time consuming, costly and may force us to make costly modifications to the designs of our cars. For example, Takata Corporation (“Takata”) is currently the principal supplier of the airbags installed in our cars. Defective airbags manufactured by Takata have led to widespread recalls by several automotive manufacturers starting in 2015, including us (see further “
Car recalls may be costly and may harm our reputation
”; see also Item 4.B.
“
Regulatory Matters - Vehicle Safety
”. Takata filed for bankruptcy protection in Japan and the United States in June 2017. Failure by Takata to continue the supply of airbags may cause significant disruption to our operations.
In the past, we have replaced certain suppliers because they failed to provide components that met our quality control standards. The loss of any single or limited source supplier or the disruption in the supply of components from these suppliers could lead to delays in car deliveries to our clients, which could adversely affect our relationships with our clients and also materially and adversely affect our operating results and financial condition. Supply of raw materials, parts and components may also be disrupted or interrupted by natural disasters, as was the case in 2012 following the earthquake in the Emilia Romagna region of Italy.
Changes in our supply chain have in the past resulted and may in the future result in increased costs and delays in car production. We have also experienced cost increases from certain suppliers in order to meet our quality targets and development timelines and because of design changes that we have made. We may experience similar cost increases in the future. Additionally, we are negotiating with existing suppliers for cost reductions, seeking new and less expensive suppliers for certain parts, and attempting to redesign certain parts to make them less expensive to produce. If we are unsuccessful in our efforts to control and reduce supplier costs while maintaining a stable source of high quality supplies, our operating results will suffer. Additionally, cost reduction efforts may disrupt our normal production processes, thereby harming the quality or volume of our production.
Furthermore, if our suppliers fail to provide components in a timely manner or at the level of quality necessary to manufacture our cars, our clients may face longer waiting periods which could result in negative publicity, harm our reputation and relationship with clients and have a material adverse effect on our business, operating results and financial condition.
11
We depend on our manufacturing facilities in Maranello and Modena.
We assemble all of the cars that we sell and manufacture, and all of the engines we use in our cars and sell to Maserati, at our production facility in Maranello, Italy, where we also have our corporate headquarters. We manufacture all of our car chassis in a nearby facility in Modena, Italy. Our Maranello or Modena plants could become unavailable either permanently or temporarily for a number of reasons, including contamination, power shortage or labor unrest. Alternatively, changes in law and regulation, including export, tax and employment laws and regulations, or economic conditions, including wage inflation, could make it uneconomic for us to continue manufacturing our cars in Italy. In the event that we were unable to continue production at either of these facilities or it became uneconomic for us to continue to do so, we would need to seek alternative manufacturing arrangements which would take time and reduce our ability to produce sufficient cars to meet demand. Moving manufacturing to other locations may also affect the perception of our brand and car quality among our clients. Such a transfer would materially reduce our revenues and could require significant investment, which as a result could have a material adverse effect on our business, results of operations and financial condition.
Maranello and Modena are located in the Emilia-Romagna region of Italy which has the potential for seismic activity. For instance, in 2012 a major earthquake struck the region, causing production at our facilities to be temporarily suspended for a day. If major disasters such as earthquakes, fires, floods, hurricanes, wars, terrorist attacks, pandemics or other events occur, our headquarters and production facilities may be seriously damaged, or we may stop or delay production and shipment of our cars. As such damage from disasters or unpredictable events could have a material adverse impact on our business, results from operations and financial condition.
Car sales depend in part on the availability of affordable financing.
In certain regions, financing for new car sales has been available at relatively low interest rates for several years due to, among other things, expansive government monetary policies. Recent pronouncements of governments and central banks point to a change in the policy environment that may lead to a gradual contraction of monetary policies in coming periods. To the extent that interest rates rise generally, market rates for new car financing are expected to rise as well, which may make our cars less affordable to clients or cause consumers to purchase less expensive cars, adversely affecting our results of operations and financial condition. Additionally, if consumer interest rates increase substantially or if financial service providers tighten lending standards or restrict their lending to certain classes of credit, our clients may choose not to, or may not be able to, obtain financing to purchase our cars.
We may not be able to provide adequate access to financing for our dealers and clients, and our financial services operations may be disrupted.
Our dealers enter into wholesale financing arrangements to purchase cars from us to hold in inventory or to use in showrooms and facilitate retail sales, and retail clients use a variety of finance and lease programs to acquire cars.
In most markets, we rely on controlled finance companies and commercial relationships with third parties, including third party financial institutions, to provide financing to our dealers and retail clients. Finance companies are subject to various risks that could negatively affect their ability to provide financing services at competitive rates, including:
|
•
|
the performance of loans and leases in their portfolio, which could be materially affected by delinquencies or defaults;
|
|
•
|
higher than expected car return rates and the residual value performance of cars they lease; and
|
|
•
|
fluctuations in interest rates and currency exchange rates.
|
Furthermore, to help fund our retail and wholesale financing business, our financial services companies also access forms of funding available from the banking system in each market, including sales or securitization of receivables either in negotiated sales or through securitization programs. For example, in 2016, Ferrari Financial Services Inc. carried out revolving securitizations raising an aggregate of $481 million of initial proceeds. At December 31, 2017, an amount of $667 million was outstanding under revolving securitizations carried out by Ferrari Financial Services Inc. See Item 5.B. “
Liquidity and Capital Resources”
.
Should we lose the ability to access the securitization market at advantageous terms or at all, the funding of our wholesale financing business would become more difficult and expensive and our financial condition may be adversely affected.
12
Any financial services provider, including our controlled finance companies, will face other demands on its capital, as well as liquidity issues relating to other investments or to developments in the credit markets. Furthermore, they may be subject to regulatory changes that may increase their costs, which may impair their ability to provide competitive financing products to our dealers and retail clients. To the extent that a financial services provider is unable or unwilling to provide sufficient financing at competitive rates to our dealers and retail clients, such dealers and retail clients may not have sufficient access to financing to purchase or lease our cars. As a result, our car sales and market share may suffer, which would adversely affect our results of operations and financial condition.
Our dealer and retail customer financing in Europe are mainly provided through our partnership with FCA Bank S.p.A. (“FCA Bank”), a joint venture between FCA Italy S.p.A. and Crédit Agricole Consumer Finance S.A. (“CACF”). If we fail to maintain our partnership with FCA Bank or in the event of a termination of the joint venture or change of control of one of our joint venture partners, we may not be able to find a suitable alternative partner with similar resources and experience and continue to offer financing services to support the sales of Ferrari cars in key European markets, which could adversely affect our results of operations and financial condition.
We rely on our licensing and franchising partners to preserve the value of our licenses and the failure to maintain such partners could harm our business.
We currently have multi-year agreements with licensing partners for various Ferrari-branded products in the sports, lifestyle and luxury retail segments. We also have multi-year agreements with franchising partners for our Ferrari stores and theme park. In the future, we may enter into additional licensing or franchising arrangements. Many of the risks associated with our own products also apply to our licensed products and franchised stores. In addition, there are unique problems that our licensing or franchising partners may experience, including risks associated with each licensing partner’s ability to obtain capital, manage its labor relations, maintain relationships with its suppliers, manage its credit and bankruptcy risks, and maintain client relationships. While we maintain significant control over the products produced for us by our licensing partners and the franchisees running our Ferrari stores and theme parks, any of the foregoing risks, or the inability of any of our licensing or franchising partners to execute on the expected design and quality of the licensed products, Ferrari stores and theme park, or otherwise exercise operational and financial control over its business, may result in loss of revenue and competitive harm to our operations in the product categories where we have entered into such licensing or franchising arrangements. While we select our licensing and franchising partners with care, any negative publicity surrounding such partners could have a negative effect on licensed products, the Ferrari stores and theme parks or the Ferrari brand. Further, while we believe that we could replace our existing licensing or franchising partners if required, our inability to do so for any period of time could materially adversely affect our revenues and harm our business.
We depend on the strength of our trademarks and other intellectual property rights.
We believe that our trademarks and other intellectual property rights are fundamental to our success and market position. Therefore, our business depends on our ability to protect and promote our trademarks and other intellectual property rights. Accordingly, we devote substantial efforts to the establishment and protection of our trademarks and other intellectual property rights such as registered designs and patents on a worldwide basis. We believe that our trademarks and other intellectual property rights are adequately supported by applications for registrations, existing registrations and other legal protections in our principal markets. However, we cannot exclude the possibility that our intellectual property rights may be challenged by others, or that we may be unable to register our trademarks or otherwise adequately protect them in some jurisdictions. If a third party were to register our trademarks, or similar trademarks, in a country where we have not successfully registered such trademarks, it could create a barrier to our commencing trade under those marks in that country.
Third parties may claim that we infringe their intellectual property rights.
We believe that we hold all the rights required for our business operations (including intellectual property rights and third-party licenses). However, we are exposed to potential claims from third parties alleging that we infringe their intellectual property rights, since many competitors and suppliers also submit patent applications for their inventions and secure patent protection or other intellectual property rights. If we are unsuccessful in defending against any such claim, we may be required to pay damages or comply with injunctions which may disrupt our operations. We may also as a result be forced to enter into royalty or licensing agreements on unfavorable terms or to redesign products to comply with third parties’ intellectual property rights.
13
If our cars do not perform as expected our ability to develop, market and sell our cars could be harmed.
Our cars may contain defects in design and manufacture that may cause them not to perform as expected or that may require repair. There can be no assurance that we will be able to detect and fix any defects in the cars prior to their sale to consumers. Our cars may not perform in line with our clients’ evolving expectations or in a manner that equals or exceeds the performance characteristics of other cars currently available. For example, our newer cars may not have the durability or longevity of current cars, and may not be as easy to repair as other cars currently on the market. Any product defects or any other failure of our performance cars to perform as expected could harm our reputation and result in adverse publicity, lost revenue, delivery delays, product recalls, product liability claims, harm to our brand and reputation, and significant warranty and other expenses, and could have a material adverse impact on our business, operating results and financial condition.
Car recalls may be costly and may harm our reputation.
We have in the past and we may from time to time in the future be required to recall our products to address performance, compliance or safety-related issues. We may incur costs for these recalls, including replacement parts and labor to remove and replace the defective parts. For example, in the course of 2015 and 2016, we issued a series of recalls relating to defective air bags manufactured by Takata and installed on certain of our models. Also in light of uncertainties in our ability to recover the recall costs from Takata, which filed for bankruptcy in June 2017, we have recorded a provision regarding this matter which amounted to €35 million as of
December 31, 2017
. For a description of these and other recent recalls , see “Item 4.B.
Regulatory Matters—Vehicle Safety
”. In addition, regulatory oversight of recalls, particularly in the vehicle safety, has increased recently. Any product recalls can harm our reputation with clients, particularly if consumers call into question the safety, reliability or performance of our cars. Any such recalls could harm our reputation and result in adverse publicity, lost revenue, delivery delays, product liability claims and other expenses, and could have a material adverse impact on our business, operating results and financial condition.
We may become subject to product liability claims, which could harm our financial condition and liquidity if we are not able to successfully defend or insure against such claims.
We may become subject to product liability claims, which could harm our business, operating results and financial condition. The automobile industry experiences significant product liability claims and we have inherent risk of exposure to claims in the event our cars do not perform as expected or malfunction resulting in personal injury or death. A successful product liability claim against us could require us to pay a substantial monetary award. Moreover, a product liability claim could generate substantial negative publicity about our cars and business, adversely affecting our reputation and inhibiting or preventing commercialization of future cars which could have a material adverse effect on our brand, business, operating results and financial condition. While we seek to insure against product liability risks, insurance may be insufficient to protect against any monetary claims we may face and will not mitigate any reputational harm. Any lawsuit seeking significant monetary damages may have a material adverse effect on our reputation, business and financial condition. We may not be able to secure additional product liability insurance coverage on commercially acceptable terms or at reasonable costs when needed, particularly if we face liability for our products and are forced to make a claim under such a policy.
We are exposed to risks in connection with product warranties as well as the provision of services.
A number of our contractual and legal requirements oblige us to provide extensive warranties to our clients, dealers and national distributors. There is a risk that, relative to the guarantees and warranties granted, the calculated product prices and the provisions for our guarantee and warranty risks have been set or will in the future be set too low. There is also a risk that we will be required to extend the guarantee or warranty originally granted in certain markets for legal reasons, or provide services as a courtesy or for reasons of reputation where we are not legally obliged to do so, and for which we will generally not be able to recover from suppliers or insurers.
If we were to lose our Authorized Economic Operator certificate, we may be required to modify our current business practices and to incur increased costs, as well as experience shipment delays.
Because we ship and sell our cars in numerous countries, the customs regulations of various jurisdictions are important to our business and operations. To expedite customs procedure, we applied for, and currently hold, the European Union’s Authorized Economic Operator (AEO) certificate. The AEO certificate is granted to operators that meet certain requirements regarding supply chain security and the safety and compliance with law of the operator’s customs controls and procedures. Operators are audited periodically for continued compliance with the requirements. The AEO certificate allows us to benefit from special expedited customs treatment, which significantly facilitates the shipment of our cars in the various markets where we operate. The AEO certificate is subject to mandatory audit review by
May 1, 2019
according to the new European Customs
14
Legislation and therefore we will need to implement all necessary organization changes in order to comply with the new requirements. If we were to lose the AEO status, including for failure to meet one of the certification’s requirements, we would be required to change our business practices and to adopt standard customs procedures for the shipment of our cars. This could result in increased costs and shipment delays, which, in turn, could negatively affect our results of operations.
Labor laws and collective bargaining agreements with our labor unions could impact our ability to operate efficiently.
All of our production employees are represented by trade unions, are covered by collective bargaining agreements and/or are protected by applicable labor relations regulations that may restrict our ability to modify operations and reduce costs quickly in response to changes in market conditions. These regulations and the provisions in our collective bargaining agreements may impede our ability to restructure our business successfully to compete more efficiently and effectively, especially with those automakers whose employees are not represented by trade unions or are subject to less stringent regulations, which could have a material adverse effect on our results of operations and financial condition.
We are subject to risks associated with exchange rate fluctuations, interest rate changes, credit risk and other market risks.
We operate in numerous markets worldwide and are exposed to market risks stemming from fluctuations in currency and interest rates. The exposure to currency risk is mainly linked to the differences in geographic distribution of our sourcing and manufacturing activities from those in our commercial activities, as a result of which our cash flows from sales are denominated in currencies different from those connected to purchases or production activities. For example, we incur a large portion of our capital and operating expenses in Euro while we receive the majority of our revenues in currencies other than Euro. In addition, foreign exchange movements might also negatively affect the relative purchasing power of our clients which could also have an adverse effect on our results of operations. For example, in the second half of 2016, the foreign exchange markets had been subject to a high degree of volatility and the U.S. dollar appreciated significantly against the Euro while the pound sterling depreciated significantly against both the U.S. dollar and the Euro. The U.S. dollar trend was partially reversed in 2017, and in the initial months of 2018 the U.S. dollar has continued to depreciate considerably against the Euro. If this U.S. dollar weakness persists or increases, we expect that it will adversely impact our revenues and results of operations in 2018. Changes in exchange rates between the Euro on the one hand and, on the other hand, the main foreign currencies in which we operate, also affect our revenues and results of operations. See “Item 5. “
Operating and Financial Review, Trends, Uncertainties and Opportunities
”.
We seek to manage risks associated with fluctuations in currency through financial hedging instruments. Although we seek to manage our foreign currency risk in order to minimize any negative effects caused by rate fluctuations, including through hedging activities, there can be no assurance that we will be able to do so successfully, and our business, results of operations and financial condition could nevertheless be adversely affected by fluctuations in market rates, particularly if these conditions persist.
Our financial services activities are also subject to the risk of insolvency of dealers and retail clients, as well as unfavorable economic conditions in markets where these activities are carried out. Despite our efforts to mitigate such risks through the credit approval policies applied to dealers and retail clients, there can be no assurances that we will be able to successfully mitigate such risks, particularly with respect to a general change in economic conditions.
Changes in tax, tariff or fiscal policies could adversely affect demand for our products.
Imposition of any additional taxes and levies designed to limit the use of automobiles could adversely affect the demand for our vehicles and our results of operations. Changes in corporate and other taxation policies as well as changes in export and other incentives given by various governments or import or tariff policies could also adversely affect our results of operations. For example, the Chinese and Indian governments have recently imposed various measures intended to curb consumption of luxury goods, including, among other things, a tax specifically applicable to the purchase of luxury cars. While we are managing our product development and production operations on a global basis to reduce costs and lead times, unique national or regional standards can result in additional costs for product development, testing, and manufacturing. Governments often require the implementation of new requirements during the middle of a product cycle, which can be substantially more expensive than accommodating these requirements during the design of a new product. The imposition of any additional taxes and levies or change in government policy designed to limit the use of high performance sports cars or automobiles more generally could also adversely affect the demand for our cars. The occurrence of the above may have a material adverse effect on our business, results of operations and financial condition.
15
We may be adversely affected by the UK determination to leave the European Union (Brexit).
In a
June 23, 2016
, referendum, the United Kingdom voted to terminate the UK’s membership in the European Union (“
Brexit
”). As a result, negotiations are expected to take place to determine the future terms of the UK’s relationship with the European Union, including the terms of trade between the UK and the member states in the EU. Any effect of Brexit is expected to depend on the agreements, if any, that may be negotiated between the UK and the EU with respect to reciprocal market access and custom arrangements, during any transitional period and more permanently. Failure to reach appropriate agreements could adversely affect European or worldwide economic or market conditions. Approximately 9% percent of our cars and spare parts net revenues in 2017 were generated in the UK and we do not have any other significant operations in the UK, therefore, we do not believe that our global operations would be affected materially by Brexit. However, any adverse effect of Brexit on us or on global or regional economic or market conditions could adversely affect our business, results of operations and financial condition as customers may reduce or delay spending decisions on our products.
We face risks associated with our international operations, including unfavorable regulatory, political, tax and labor conditions and establishing ourselves in new markets, all of which could harm our business.
We currently have international operations and subsidiaries in various countries and jurisdictions in Europe, North America and Asia that are subject to the legal, political, regulatory, tax and social requirements and economic conditions in these jurisdictions. Additionally, as part of our growth strategy, we will continue to expand our sales, maintenance, and repair services internationally. However, such expansion requires us to make significant expenditures, including the establishment of local operating entities, hiring of local employees and establishing facilities in advance of generating any revenue. We are subject to a number of risks associated with international business activities that may increase our costs, impact our ability to sell our cars and require significant management attention. These risks include:
|
•
|
conforming our cars to various international regulatory and safety requirements where our cars are sold, or homologation;
|
|
•
|
difficulty in establishing, staffing and managing foreign operations;
|
|
•
|
difficulties attracting clients in new jurisdictions;
|
|
•
|
foreign government taxes, regulations and permit requirements, including foreign taxes that we may not be able to offset against taxes imposed upon us in Italy;
|
|
•
|
fluctuations in foreign currency exchange rates and interest rates, including risks related to any interest rate swap or other hedging activities we undertake;
|
|
•
|
our ability to enforce our contractual and intellectual property rights, especially in those foreign countries that do not respect and protect intellectual property rights to the same extent as do the United States, Japan and European countries, which increases the risk of unauthorized, and uncompensated, use of our technology;
|
|
•
|
European Union and foreign government trade restrictions, customs regulations, tariffs and price or exchange controls;
|
|
•
|
foreign labor laws, regulations and restrictions;
|
|
•
|
preferences of foreign nations for domestically produced cars;
|
|
•
|
changes in diplomatic and trade relationships;
|
|
•
|
political instability, natural disasters, war or events of terrorism; and
|
|
•
|
the strength of international economies.
|
If we fail to successfully address these risks, many of which we cannot control, our business, operating results and financial condition could be materially harmed.
16
Improper conduct of employees, agents, or other representatives could adversely affect our reputation and our business, operating results, and financial condition.
Our compliance controls, policies, and procedures may not in every instance protect us from acts committed by our employees, agents, contractors, or collaborators that would violate the laws or regulations of the jurisdictions in which we operate, including employment, foreign corrupt practices, environmental, competition, and other laws and regulations. Such improper actions could subject us to civil or criminal investigations, and monetary and injunctive penalties. In particular, our business activities may be subject to anti-corruption laws, regulations or rules of other countries in which we operate. If we fail to comply with any of these regulations, it could adversely impact our operating results and our financial condition. In addition, actual or alleged violations could damage our reputation and our ability to conduct business. Furthermore, detecting, investigating, and resolving any actual or alleged violation is expensive and can consume significant time and attention of our executive management.
Our insurance coverage may not be adequate to protect us against all potential losses to which we may be subject, which could have a material adverse effect on our business.
We maintain insurance coverage that we believe is adequate to cover normal risks associated with the operation of our business. However, there can be no assurance that any claim under our insurance policies will be honored fully or timely, our insurance coverage will be sufficient in any respect or our insurance premiums will not increase substantially. Accordingly, to the extent that we suffer loss or damage that is not covered by insurance or which exceeds our insurance coverage, or have to pay higher insurance premiums, our financial condition may be affected.
A disruption in our information technology could compromise confidential and sensitive information.
We depend on our information technology and data processing systems to operate our business, and a significant malfunction or disruption in the operation of our systems, or a security breach that compromises the confidential and sensitive information stored in those systems, could disrupt our business and adversely impact our ability to compete. Our ability to keep our business operating effectively depends on the functional and efficient operation of our information, data processing and telecommunications systems, including our car design, manufacturing, inventory tracking and billing and payment systems. We rely on these systems to enable a number of business processes and help us make a variety of day-to-day business decisions as well as to track transactions, billings, payments and inventory. Such systems are susceptible to malfunctions and interruptions due to equipment damage, power outages, and a range of other hardware, software and network problems. Those systems are also susceptible to cybercrime, or threats of intentional disruption, which are increasing in terms of sophistication and frequency, with the consequence that such cyber incidents may remain undetected for long periods of time. For any of these reasons, we may experience system malfunctions or interruptions. Although our systems are diversified, including multiple server locations and a range of software applications for different regions and functions, and we are currently undergoing an effort to assess and ameliorate risks to our systems, a significant or large scale malfunction or interruption of any one of our computer or data processing systems could adversely affect our ability to manage and keep our operations running efficiently, and damage our reputation if we are unable to track transactions and deliver products to our dealers and clients. A malfunction that results in a wider or sustained disruption to our business could have a material adverse effect on our business, results of operations and financial condition. In addition to supporting our operations, we use our systems to collect and store confidential and sensitive data, including information about our business, our clients and our employees. As our technology continues to evolve, we anticipate that we will collect and store even more data in the future, and that our systems will increasingly use remote communication features that are sensitive to both willful and unintentional security breaches. Much of our value is derived from our confidential business information, including car design, proprietary technology and trade secrets, and to the extent the confidentiality of such information is compromised, we may lose our competitive advantage and our car sales may suffer. We also collect, retain and use certain personal information, including data we gather from clients for product development and marketing purposes, and data we obtain from employees. In the event of a breach in security that allows third parties access to this personal information, we are subject to a variety of ever-changing laws on a global basis that require us to provide notification to the data owners, and that subject us to lawsuits, fines and other means of regulatory enforcement. To an increasing extent, the functionality and controls of our cars depend on in-vehicle information technology. Furthermore, such technology is capable of storing an increasing amount of personal information belonging to our customers. Any unauthorized access to in-vehicle IT systems may compromise the car security or the privacy of our customers’ information and expose us to claims as well as reputational damage. Ultimately, any significant compromise in the integrity of our data security could have a material adverse effect on our business.
17
Risks Related to our Common Shares
The market price and trading volume of our common shares may be volatile, which could result in rapid and substantial losses for our shareholders.
The market price of our common shares may be highly volatile and could be subject to wide fluctuations. In addition, the trading volume of our common shares may fluctuate and cause significant price variations to occur. If the market price of our common shares declines significantly, a shareholder may be unable to sell their common shares at or above their purchase price, if at all. The market price of our common shares may fluctuate or decline significantly in the future. Some of the factors that could negatively affect the price of our common shares, or result in fluctuations in the price or trading volume of our common shares, include:
|
•
|
variations in our operating results, or failure to meet the market’s earnings expectations;
|
|
•
|
publication of research reports about us, the automotive industry or the luxury industry, or the failure of securities analysts to cover our common shares;
|
|
•
|
departures of any members of our management team or additions or departures of other key personnel;
|
|
•
|
adverse market reaction to any indebtedness we may incur or securities we may issue in the future;
|
|
•
|
actions by shareholders;
|
|
•
|
changes in market valuations of similar companies;
|
|
•
|
changes or proposed changes in laws or regulations, or differing interpretations thereof, affecting our business, or enforcement of these laws and regulations, or announcements relating to these matters;
|
|
•
|
adverse publicity about the automotive industry or the luxury industry generally, or particularly scandals relating to those industries, specifically;
|
|
•
|
litigation and governmental investigations; and
|
|
•
|
general market and economic conditions.
|
The loyalty voting program may affect the liquidity of our common shares and reduce our common share price
.
The implementation of our loyalty voting program could reduce the trading liquidity and adversely affect the trading prices of our common shares. The loyalty voting program is intended to reward our shareholders for maintaining long-term share ownership by granting initial shareholders and persons holding our common shares continuously for at least three years the option to elect to receive special voting shares. Special voting shares cannot be traded and, if common shares participating in the loyalty voting program are sold they must be deregistered from the loyalty register and any corresponding special voting shares transferred to us for no consideration (
om niet
). This loyalty voting program is designed to encourage a stable shareholder base and, conversely, it may deter trading by shareholders that may be interested in participating in our loyalty voting program. Therefore, the loyalty voting program may reduce liquidity in our common shares and adversely affect their trading price.
The interests of our largest shareholders may differ from the interests of other shareholders.
Exor N.V. (“Exor”) is our largest shareholder, holding approximately 23.5 percent of our outstanding common shares and approximately 33.4 percent of our voting power. Therefore, Exor has a significant influence over these matters submitted to a vote of our shareholders, including matters such as adoption of the annual financial statements, declarations of annual dividends, the election and removal of the members of our Board of Directors, capital increases and amendments to our articles of association. In addition, Piero Ferrari, the Vice Chairman of Ferrari, holds approximately 10 percent of our outstanding common shares and approximately 15.4 percent of voting interest in us. As a result, he also has influence in matters submitted to a vote of our shareholders. Exor and Piero Ferrari informed us that they have entered into a shareholder agreement pursuant to which they have undertaken to consult for the purpose of forming, where possible, a common view on the items on the agenda of shareholders meetings. See “Item 7.
Major Shareholders and Related Party Transactions—Shareholders’ Agreement
”. The interests of Exor and Piero Ferrari may in certain cases differ from those of other shareholders. In addition, the sale of substantial
18
amounts of our common shares in the public market by Piero Ferrari or the perception that such a sale could occur could adversely affect the prevailing market price of the common shares.
We may have potential conflicts of interest with FCA and Exor and its related companies.
Questions relating to conflicts of interest may arise between us and FCA, our former largest shareholder prior to the Separation, in a number of areas relating to common shareholdings and management, as well as our past and ongoing relationships. Even after the Separation, overlaps remain among the directors and officers of us and FCA. For example, Mr. Sergio Marchionne, our Chairman and Chief Executive Officer, is the Chief Executive Officer of FCA. Mr. Marchionne and certain of our other directors and officers may also be directors or officers of FCA or Exor, our and FCA’s largest shareholder, including Mr. John Elkann, who is one of our Vice-Chairmen, the Chairman of FCA and the Chairman and Chief Executive Officer of Exor. These individuals owe duties both to us and to the other companies that they serve as officers and/or directors. This may raise conflicts as, for example, these individuals review opportunities that may be appropriate or suitable for both us and such other companies, or we pursue business transactions in which both we and such other companies have an interest, such as our arrangement to supply engines for Maserati cars. Exor holds approximately 23.5 percent of our outstanding common shares and approximately 33.4 percent of the voting power in us, while it holds approximately 29.2 percent of the outstanding common shares and approximately 43.1 percent of the voting power in FCA. Exor also owns a controlling interest in CNH Industrial N.V., which was part of the FCA group before its spin-off several years ago. These ownership interests could create actual, perceived or potential conflicts of interest when these parties or our common directors and officers are faced with decisions that could have different implications for us and FCA or Exor, as applicable.
Our loyalty voting program may make it more difficult for shareholders to acquire a controlling interest in Ferrari, change our management or strategy or otherwise exercise influence over us, which may affect the market price of our common shares.
The provisions of our articles of association which establish the loyalty voting program may make it more difficult for a third party to acquire, or attempt to acquire, control of our company, even if a change of control were considered favorably by shareholders holding a majority of our common shares. As a result of the loyalty voting program, a relatively large proportion of the voting power of Ferrari could be concentrated in a relatively small number of shareholders who would have significant influence over us. Exor has approximately 23.5 percent of our outstanding common shares and a voting interest in Ferrari of approximately 33.4 percent. Piero Ferrari holds approximately 10 percent of our outstanding common shares and, as a result of the loyalty voting mechanism, has approximately 15.4 percent of the voting power in our shares. In addition, Exor and Piero Ferrari informed us that they have entered into a shareholder agreement, summarized under “Item 7.
Major Shareholders and Related Party Transactions—Shareholders’ Agreement
”. As a result, Exor and Piero Ferrari may exercise significant influence on matters involving our shareholders. Exor and Piero Ferrari and other shareholders participating in the loyalty voting program may have the power effectively to prevent or delay change of control or other transactions that may otherwise benefit our shareholders. The loyalty voting program may also prevent or discourage shareholder initiatives aimed at changing Ferrari’s management or strategy or otherwise exerting influence over Ferrari. See “Item 10.B.
Memorandum and Articles of Association—The Ferrari Shares, Articles of Association and Terms and Conditions of the Special Voting Shares
.”
We are a Dutch public company with limited liability, and our shareholders may have rights different to those of shareholders of companies organized in the United States.
The rights of our shareholders may be different from the rights of shareholders governed by the laws of U.S. jurisdictions. We are a Dutch public company with limited liability (
naamloze vennootschap
). Our corporate affairs are governed by our articles of association and by the laws governing companies incorporated in the Netherlands. The rights of shareholders and the responsibilities of members of board of directors may be different from the rights of shareholders and the responsibilities of members of our board of directors in companies governed by the laws of other jurisdictions including the United States. In the performance of its duties, our board of directors is required by Dutch law to consider our interests and the interests of our shareholders, our employees and other stakeholders, in all cases with due observation of the principles of reasonableness and fairness. It is possible that some of these parties will have interests that are different from, or in addition to, your interests as a shareholder.
19
We expect to maintain our status as a “foreign private issuer” under the rules and regulations of the SEC and, thus, are exempt from a number of rules under the Exchange Act of 1934 and are permitted to file less information with the SEC than a company incorporated in the United States.
As a “foreign private issuer,” we are exempt from rules under the Securities Exchange Act of 1934, as amended (“the Exchange Act”) that impose certain disclosure and procedural requirements for proxy solicitations under Section 14 of the Exchange Act. In addition, our officers, directors and principal shareholders are exempt from the reporting and “short-swing” profit recovery provisions of Section 16 of the Exchange Act and the rules under the Exchange Act with respect to their purchases and sales of our common shares. Moreover, we are not required to file periodic reports and financial statements with the SEC as frequently or as promptly as U.S. companies whose securities are registered under the Exchange Act, nor are we required to comply with Regulation FD, which restricts the selective disclosure of material information. Accordingly, there may be less publicly available information concerning us than there is for U.S. public companies.
Our ability to pay dividends on our common shares may be limited and the level of future dividends is subject to change.
Our current dividend policy is set forth in “Item 8.
Financial Information - Dividend policy
”. Our payment of dividends on our common shares in the future will be subject to business conditions, financial conditions, earnings, cash balances, commitments, strategic plans and other factors that our Board of Directors may deem relevant at the time it recommends approval of the dividend. Our dividend policy is subject to change in the future based on changes in statutory requirements, market trends, strategic developments, capital requirements and a number of other factors. In addition, under our articles of association and Dutch law, dividends may be declared on our common shares only if the amount of equity exceeds the paid up and called up capital plus the reserves that have to be maintained pursuant to Dutch law or the articles of association. Further, even if we are permitted under our articles of association and Dutch law to pay cash dividends on our common shares, we may not have sufficient cash to pay dividends in cash on our common shares.
Our maintenance of two exchange listings may adversely affect liquidity in the market for our common shares and could result in pricing differentials of our common shares between the two exchanges.
Our shares are listed on both the NYSE and the
Mercato Telematico Azionario
(“MTA”). The dual listing of our common shares may split trading between the NYSE and the MTA, adversely affect the liquidity of the shares and the development of an active trading market for our common shares in one or both markets and may result in price differentials between the exchanges. Differences in the trading schedules, as well as volatility in the exchange rate of the two trading currencies, among other factors, may result in different trading prices for our common shares on the two exchanges.
It may be difficult to enforce U.S. judgments against us.
We are organized under the laws of the Netherlands, and a substantial portion of our assets are outside of the United States. Most of our directors and senior management and our independent auditors are resident outside the United States, and all or a substantial portion of their respective assets may be located outside the United States. As a result, it may be difficult for U.S. investors to effect service of process within the United States upon these persons. It may also be difficult for U.S. investors to enforce within the United States judgments against us predicated upon the civil liability provisions of the securities laws of the United States or any state thereof. In addition, there is uncertainty as to whether the courts outside the United States would recognize or enforce judgments of U.S. courts obtained against us or our directors and officers predicated upon the civil liability provisions of the securities laws of the United States or any state thereof. Therefore, it may be difficult to enforce U.S. judgments against us, our directors and officers and our independent auditors.
FCA creditors may seek to hold us liable for certain FCA obligations.
One step of our Separation from FCA included a demerger from FCA of our common shares previously held by it. In connection with a demerger under Dutch law, the demerged company may continue to be liable for certain obligations of the demerging company that exist at the time of the demerger, but only to the extent that the demerging company fails to satisfy such liabilities. Based on other actions taken as part of the Separation, we do not believe we retain any liability for obligations of FCA existing at the time of the Separation. Nevertheless, in the event that FCA fails to satisfy obligations to its creditors existing at the time of the demerger, it is possible that those creditors may seek to recover from us, claiming that we remain liable to satisfy such obligations. While we believe we would prevail against any such claim, litigation is inherently costly and uncertain and could have an adverse effect. See “Item 4.A.
History and Development of the Company
”.
20
Risks Related to Taxation
Changes to taxation or the interpretation or application of tax laws could have an adverse impact on our results of operations and financial condition.
Our business is subject to various taxes in different jurisdictions (mainly Italy), which include, among others, the Italian corporate income tax (“IRES”), regional trade tax (“IRAP”), value added tax (“VAT”), excise duty, registration tax and other indirect taxes. We are exposed to the risk that our overall tax burden may increase in the future.
Changes in tax laws or regulations or in the position of the relevant Italian and non-Italian authorities regarding the application, administration or interpretation of these laws or regulations, particularly if applied retrospectively, could have negative effects on our current business model and have a material adverse effect on our business, operating results and financial condition.
In order to reduce future potential disputes with tax authorities, we seek advance agreements with tax authorities on significant matters. In particular we filed a ruling application for advance pricing agreement (APA) on transfer pricing and a so called “interpello nuovi investimenti” (tax ruling on new investments) regarding tax credit on R&D expenses to confirm our interpretation and application of the law.
In addition, tax laws are complex and subject to subjective valuations and interpretive decisions, and we will periodically be subject to tax audits aimed at assessing our compliance with direct and indirect taxes. The tax authorities may not agree with our interpretations of, or the positions we have taken or intend to take on, tax laws applicable to our ordinary activities and extraordinary transactions. In case of challenges by the tax authorities to our interpretations, we could face long tax proceedings that could result in the payment of penalties and have a material adverse effect on our operating results, business and financial condition.
As a result of the demergers and the merger in connection with the Separation, we might be jointly and severally liable with FCA for certain tax liabilities arisen in the hands of FCA.
Although the Italian tax authorities confirmed in a positive advance tax ruling issued on
October 9, 2015
that the demergers and the Merger that was carried out in connection with the Separation would be respected as tax-free, neutral transactions from an Italian income tax perspective, under Italian tax law we may still be held jointly and severally liable, as a result of the combined application of the rules governing the allocation of tax liabilities in case of demergers and mergers, with FCA for taxes, penalties, interest and any other tax liability arising in the actions of FCA because of violations of its tax obligations related to tax years prior to the two Demergers described in the section “Item 4.A.
History and Development of the Company
.”
There may be potential “Passive Foreign Investment Company” tax considerations for U.S. holders.
Shares of our stock would be stock of a “passive foreign investment company,” or a PFIC, for U.S. federal income tax purposes with respect to a U.S. holder (as defined in “Item 10.E.
Taxation—Material U.S. Federal Income Tax Consequences
” below) if for any taxable year in which such U.S. holder held shares of our stock, after the application of applicable “look-through rules” (i) 75 percent or more of our gross income for the taxable year consists of “passive income” (including dividends, interest, gains from the sale or exchange of investment property and rents and royalties other than rents and royalties which are received from unrelated parties in connection with the active conduct of a trade or business, as defined in applicable Treasury Regulations), or (ii) at least 50 percent of our assets for the taxable year (averaged over the year and determined based upon value) produce or are held for the production of “passive income”. U.S. persons who own shares of a PFIC are subject to a disadvantageous U.S. federal income tax regime with respect to the income derived by the PFIC, the dividends they receive from the PFIC, and the gain, if any, they derive from the sale or other disposition of their shares in the PFIC.
While we believe that shares of our stock are not stock of a PFIC for U.S. federal income tax purposes, this conclusion is based on a factual determination made annually and thus is subject to change. Moreover, our common shares may become stock of a PFIC in future taxable years if there were to be changes in our assets, income or operations. See “Item 10.E.
Taxation—PFIC Considerations
” for a further discussion.
21
The consequences of the loyalty voting program are uncertain.
No statutory, judicial or administrative authority directly discusses how the receipt, ownership, or disposition of special voting shares should be treated for Italian or U.S. tax purposes and as a result, the tax consequences in those jurisdictions are uncertain.
The fair market value of the special voting shares, which may be relevant to the tax consequences, is a factual determination and is not governed by any guidance that directly addresses such a situation. Because, among other things, our special voting shares are not transferable (other than, in very limited circumstances, together with the associated common shares) and a shareholder will receive amounts in respect of the special voting shares only if we are liquidated, we believe and intend to take the position that the fair market value of each special voting share is minimal. However, the relevant tax authorities could assert that the value of the special voting shares as determined by us is incorrect.
The tax treatment of the loyalty voting program is unclear and shareholders are urged to consult their tax advisors in respect of the consequences of acquiring, owning and disposing of special voting shares. See “Item 10.E.
Taxation—Loyalty Voting Program
” for a further discussion.
We currently benefit or seek to benefit from certain special tax regimes, which may not be available in the future.
We currently calculate taxes due in Italy based, among other things, on certain tax breaks recognized by Italian Tax regulations for R&D expenses (available until fiscal year 2021 according to current regulations) and for the investments on manufacturing equipment (available until fiscal year 2018 according to current regulations), which result in a significant tax saving. A change in regulations or interpretation might adversely affect the availability of such exemptions and result in higher tax charges.
Italian Law No. 190 of December 2014, as subsequently amended and supplemented (Finance Act 2015) introduced an optional patent box regime in the Italian tax system. The patent box regime is a tax exemption related to,
inter alia
, the use of intellectual property assets. Business income derived from the use of each qualified intangible asset is partially exempted from taxation for both IRES and IRAP purposes. The application of such patent box regime may reduce our tax expenses and we are currently seeking to avail ourselves of such regime. However, this exemption is subject to a mandatory ruling by the Italian tax authorities and the outcome of the ruling procedure is not certain. We have filed a ruling application, but we are currently awaiting a response from the Italian tax authorities. In the event of a negative response from the Italian tax authorities, we will not be able to benefit from such exemption.
22
Item 4. Information on the Company
A. History and Development of the Company
Ferrari was incorporated as a public limited liability company (
naamloze vennootschap
) under the laws of the Netherlands on
September 4, 2015
with an indefinite duration. Our corporate seat (
statutaire zetel
) is in Amsterdam, the Netherlands, and our registered office and principal place of business is located at Via Abetone Inferiore n. 4, I-41053 Maranello (MO), Italy. Ferrari is registered with the Dutch Trade Register of the Chamber of Commerce under number 64060977. Its telephone number is +39-0536-949111. The name and address of the Company’s agent in the United States is: Ferrari North America, Inc., 50 Sylvan Avenue, Englewood Cliffs, NJ 07632. Its telephone number is +1 (201) 816 2600.
Our company is named after our founder Enzo Ferrari. An Alfa Romeo driver since 1924, Enzo Ferrari founded his own racing team, Scuderia Ferrari, in Modena in 1929 initially to race Alfa Romeo cars. In 1939 he set up his own company, initially called Auto Avio Costruzioni. In late 1943, Enzo Ferrari moved his headquarters from Modena to Maranello, which remains our headquarters to this day.
In 1947, we produced our first racing car, the 125 S. The 125 S’s powerful 12 cylinder engine would go on to become synonymous with the Ferrari brand. In 1948, the first road car, the Ferrari 166 Inter, was produced. Styling quickly became an integral part of the Ferrari brand.
In 1950, we began our participation in the Formula 1 World Championship, racing in the world’s second Grand Prix in Monaco, which makes Scuderia Ferrari the longest running Formula 1 team. We won our first Constructor World Title in 1952. Our success on the world’s tracks and roads extends beyond Formula 1, including victories in some of the most important car races such as the 24 Hours of Le Mans, the world’s oldest endurance automobile race, and the 24 Hours of Daytona.
The Fiat group acquired a 50 percent stake in Ferrari S.p.A. in 1969, which increased to 90 percent in 1988, after the death of Enzo Ferrari, with the remaining 10 percent held by Enzo Ferrari’s son, Piero Ferrari.
On
October 29, 2014
, FCA announced the intention to separate Ferrari S.p.A. from FCA (the “Separation”). The Separation was completed on January 3, 2016 through a series of transactions which are summarized below. On October 19, 2015 we completed a restructuring intended to facilitate the initial public offering of our shares (the “IPO”) which resulted in the establishment of New Business Netherlands N.V., then renamed Ferrari N.V. (“Predecessor Ferrari”) as the holding company of the Ferrari group holding a 100 percent interest in Ferrari S.p.A. Predecessor Ferrari was originally established as a 100 percent owned subsidiary of FCA on May 24, 2013. As a result of the restructuring, immediately prior to the IPO, FCA held approximately 90 percent of Predecessor Ferrari common shares and special voting shares and Piero Ferrari, the son of our founder, held the remainder of Predecessor Ferrari common shares and special voting shares. As part of the restructuring, Predecessor Ferrari incurred debt in order to optimize the capital structure of Predecessor Ferrari as a public company through the issue by Predecessor Ferrari to FCA of a promissory note (the “FCA Note”).
On October 20, 2015, FCA priced an IPO of shares of Predecessor Ferrari shares representing approximately 10 percent of Predecessor Ferrari’s common share capital and, on October 21, 2015, such common shares started trading on the New York Stock Exchange under the ticker symbol “RACE”. Following completion of the IPO, FCA owned approximately 80 percent of Predecessor Ferrari common shares, Piero Ferrari held approximately 10 percent of Predecessor Ferrari common shares and investors in the IPO held approximately 10 percent of Predecessor Ferrari common shares.
On December 16, 2015, Ferrari repaid the FCA Note with the proceeds of a loan drawn under a syndicated credit facility with a group of lenders.
The remaining steps of the Separation were carried out through the following transactions, which occurred between January 1 and January 3, 2016. Through two consecutive demergers under Dutch law (the “Demergers”), the equity interests in Predecessor Ferrari previously held by FCA, corresponding to approximately 80 percent of Predecessor Ferrari common share capital, were transferred to holders of FCA common shares and FCA mandatory convertible securities (“MCS”). Immediately after the Demergers, Predecessor Ferrari merged with and into Ferrari, as surviving company (the “Merger”). Upon effectiveness
of the Merger, Ferrari became the holding company of the Ferrari business.
On January 4, 2016 the Company also completed the listing of its common shares on the Mercato Telematico Azionario, the stock exchange managed by Borsa Italiana, under the ticker symbol RACE.
23
B. Business Overview
Business Summary
Ferrari is among the world’s leading luxury brands focused on the design, engineering, production and sale of the world’s most recognizable luxury performance sports cars. Our brand symbolizes exclusivity, innovation, state-of-the-art sporting performance and Italian design and engineering heritage. Our name and history and the image enjoyed by our cars are closely associated with our Formula 1 racing team, Scuderia Ferrari, the most successful team in Formula 1 history. From the inaugural year of Formula 1 in 1950 through the present, Scuderia Ferrari has won 229 Grand Prix races, 16 Constructor World titles and 15 Drivers’ World titles. We believe our history of excellence, technological innovation and defining style transcends the automotive industry, and is the foundation of the Ferrari brand and image. We design, engineer and produce our cars in Maranello, Italy, and sell them in over
60
markets worldwide through a network of
164
authorized dealers operating
185
points of sale.
We believe our cars are the epitome of performance, luxury and styling. Our current product range consists of six range models, including three sports cars (488 GTB, 488 Spider and 812 Superfast) and three GT cars (GTC4Lusso, GTC4Lusso T and California T), one special series car (F12tdf) and one limited edition supercar (LaFerrari Aperta). We also produce very limited editions series (
fuori serie
) and one-off cars. The 812 Superfast was launched in February 2017 and the Ferrari Portofino, which is the successor of the California T (which is being phased out), was unveiled in September 2017 with shipments expected to begin in the second quarter of 2018. The LaFerrari Aperta was unveiled in September 2016 to celebrate our 70th anniversary in 2017.
In
2017
, we shipped
8,398
cars and recorded net revenues of
€3,417 million
, EBIT of
€775 million
, net profit of
€537 million
, and earnings before interest, taxes, depreciation, and amortization (EBITDA) of
€1,036 million
. For additional information regarding EBITDA, which is a non-GAAP measure, including a reconciliation of EBITDA to net profit, see “Item 5.
Operating and Financial Review—Non-GAAP Financial Measures.
”
We pursue a low volume production strategy whilst broadening our product portfolio to target a larger customer base in order to maintain a reputation of exclusivity and scarcity among purchasers of our cars and carefully manage our production volumes and delivery waiting lists to promote this reputation. We divide our regional markets into EMEA, Americas, China, Hong Kong and Taiwan (on a combined basis) and Rest of APAC, representing respectively
44.5 percent
,
33.5 percent
,
7.3 percent
and
14.7 percent
of units shipped in
2017
.
We license the Ferrari brand to a selected number of producers and retailers of luxury and lifestyle goods. In addition, we design, source and sell Ferrari-branded products through a network of
18
Ferrari-owned stores and
30
franchised stores (including
8
Ferrari Store Junior), as well as on our website. As one of the world’s most recognized premium luxury brands, we believe we are well positioned to selectively expand the presence of the Ferrari brand in attractive and growing lifestyle categories consistent with our image, including sportswear, watches, accessories, consumer electronics and theme parks which we believe enhance the brand experience of our loyal following of clients and Ferrari enthusiasts.
We focus our marketing and promotion efforts in the investments we make in our racing activities, in particular Scuderia Ferrari’s participation in the Formula 1 World Championship, which is one of the most watched annual sports series in the world, with over
350
million television viewers in 2017
(Source: FOM/Kantar Media 2017)
. Although our most recent Formula 1 world title was in 2008, we are enhancing our focus on Formula 1 activities with the goal of improving recent racing results and restoring our historical position as the premier racing team in Formula 1. We believe that these activities support the strength and awareness of our brand among motor enthusiasts, clients and the general public.
We will continue focusing our efforts on protecting and enhancing the value of our brand to preserve our strong financial profile and participate in the premium luxury market growth. We intend to selectively pursue controlled and profitable growth in existing and emerging markets while expanding the Ferrari brand to carefully selected lifestyle categories.
24
Industry Overview
Luxury performance cars share several characteristics with other luxury goods such as quality, aesthetics, rarity, exclusivity and a high degree of non-functional associations all of which leads to significantly higher pricing as compared to mass market goods within the same category. While affected by global macroeconomic conditions, the luxury goods market is also impacted by several more specific factors, such as, in recent years, the significant economic growth and wealth creation in certain emerging economies and rising levels of affluence and demand from the emerging middle and upper classes in Asia and a general trend towards urbanization. Particularly following the 2008-2009 downturn, this has led the global luxury goods market to return to outperform global GDP
.
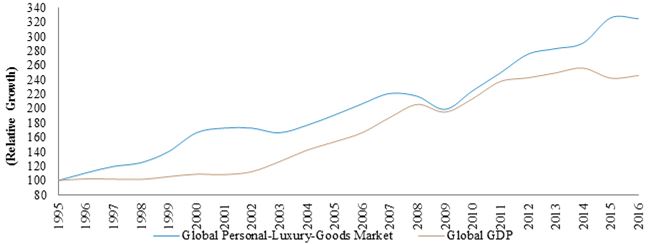
Source: Bain & Company
Within the luxury goods market, we define our target market for luxury performance cars as two-door cars powered by engines producing more than 500 hp and selling at a retail price in excess of Euro 150,000 (including VAT). The luxury performance car market historically has followed relatively closely growth patterns in the broader luxury market. The luxury performance car market is generally affected by global macroeconomic conditions and, although we and certain other manufacturers have proven relatively resilient, general downturns can have a disproportionate impact on sales of luxury goods in light of the discretionary nature of consumer spending in this market. Furthermore, because of the emotional nature of the purchasing decision, economic confidence and factors such as expectations regarding future income streams as well as the social acceptability of luxury goods may impact sales.
Following the sharp recession of 2008-2009, the luxury performance car market has been resilient to further economic downturns and stagnation in the broader economy, also a result of the increase of new product launches. A sustained period of wealth creation in several Asian countries and, to a lesser extent, in the Americas, has led to an expanding population of potential consumers of luxury goods. Developing consumer preferences in the Asian markets, where the newly affluent are increasingly embracing western brands of luxury products, have also led to higher demand for cars in our segment, which are all produced by established European manufacturers.
Additionally, the growing appetite of younger affluent purchasers for luxury performance cars has led to new entrants, which in turn has resulted in higher sales overall in the market.
25
Unlike in other segments of the broader luxury market, however, in the luxury performance car market, a significant portion of demand is driven by new product launches. The market share of individual producers fluctuates over time reflecting the timing of product launches. New launches tend to drive sales volumes even in difficult market environments because the novelty, exclusivity and excitement of a new product is capable of creating and capturing its own demand from clients.
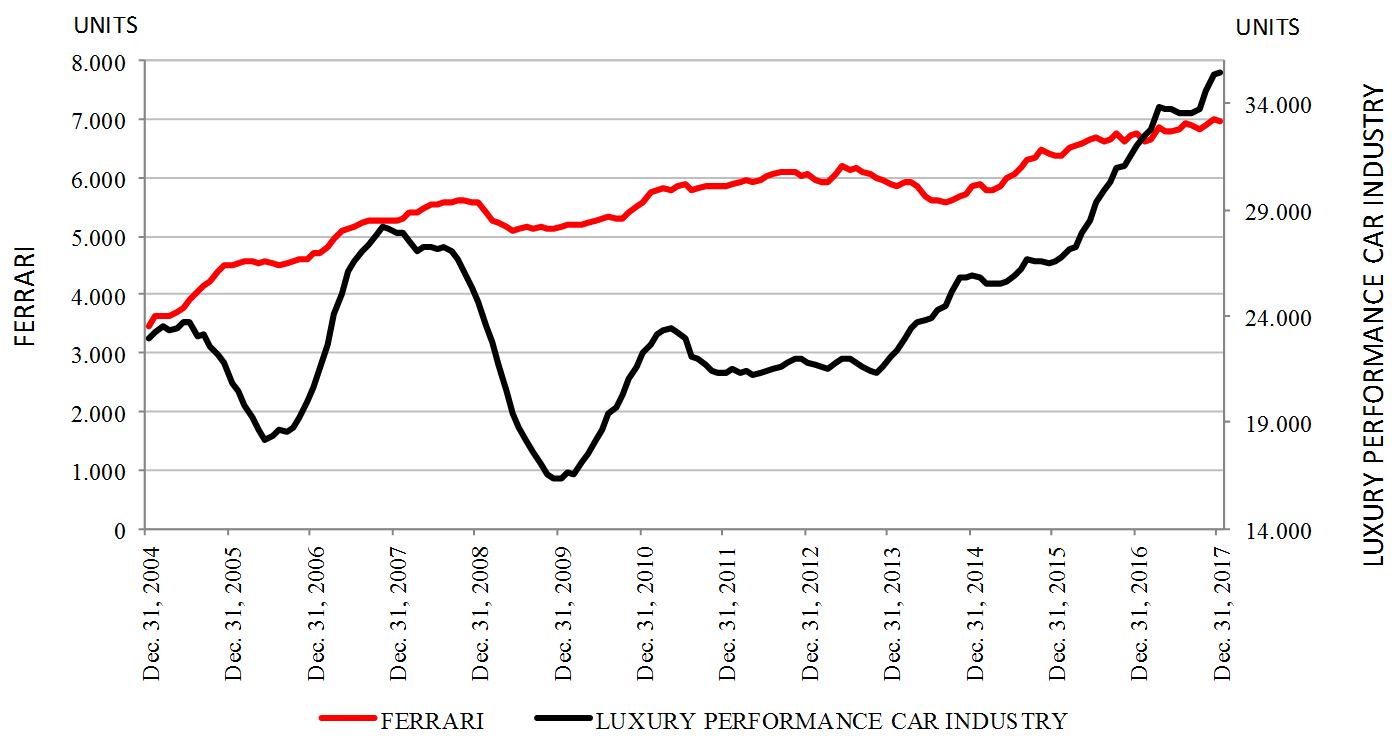
|
•
|
Data for the Luxury Performance Car Industry include all two door GT and Sports Cars with power above 500hp, and retail price above Euro 150,000 (including VAT) sold by Aston Martin, Audi, Bentley, Ferrari, Ford, Honda/Acura, Lamborghini, McLaren, Mercedes Benz, Porsche and Rolls-Royce.
|
|
•
|
Ferrari data based on the 22 top countries (excluding Middle East countries) for Ferrari annual registrations and sales (which accounted for approximately 85% of the total Ferrari shipments in 2017).
|
|
•
|
Data for the Luxury Performance Car Industry based on units registered (in Brazil, Japan, Taiwan, United Kingdom, Germany, France, Switzerland, Italy, Spain, Sweden, Netherlands, Belgium and Austria) or sold (in USA, South Korea, Thailand, China, Hong Kong, Australia, New Zealand, Singapore and Indonesia). Source: USA: US Maker Data Club, Brazil-JATO; Austria-OSZ; Belgium-FEBIAC; France-SIV; Germany-KBA; UK-SMMT; Italy-UNRAE; Netherlands- VWE; Spain- TRAFICO; Sweden-BranschData; Switzerland-ASTRA; China-China Automobile Industry Association-DataClub; Hong Kong-Hong Kong Motor Trader Association; Taiwan-Ministry of Transportation and Communications; Australia-VFACTS-S; Japan-JAIA; Indonesia-GAIKINDO; New Zealand-VFACTS; Singapore-LTA, MTA (Land Transport Authority, Motor Trader Associations); South Korea-KAIDA; Thailand -Department of Land Transportation
|
The luxury performance car market has now exceeded pre-crisis levels. As shown in the chart above, our volumes in recent years have proven less volatile than our competitors. We believe this is due to our strategy of maintaining low volumes compared to demand, as well as the higher number of models in our range and our more frequent product launches compared to our competitors.
26
In 2017, our volumes in the largest 22 markets were substantially in line with 2016, primarily driven by contribution from our range models. We had a market share of 20 percent in the luxury performance car market; with a 22 percent of market share in the sports car segment and 16 percent of market share in the GT segment. The chart below sets forth our market shares in 2017 in our largest 22 markets by geographical area.
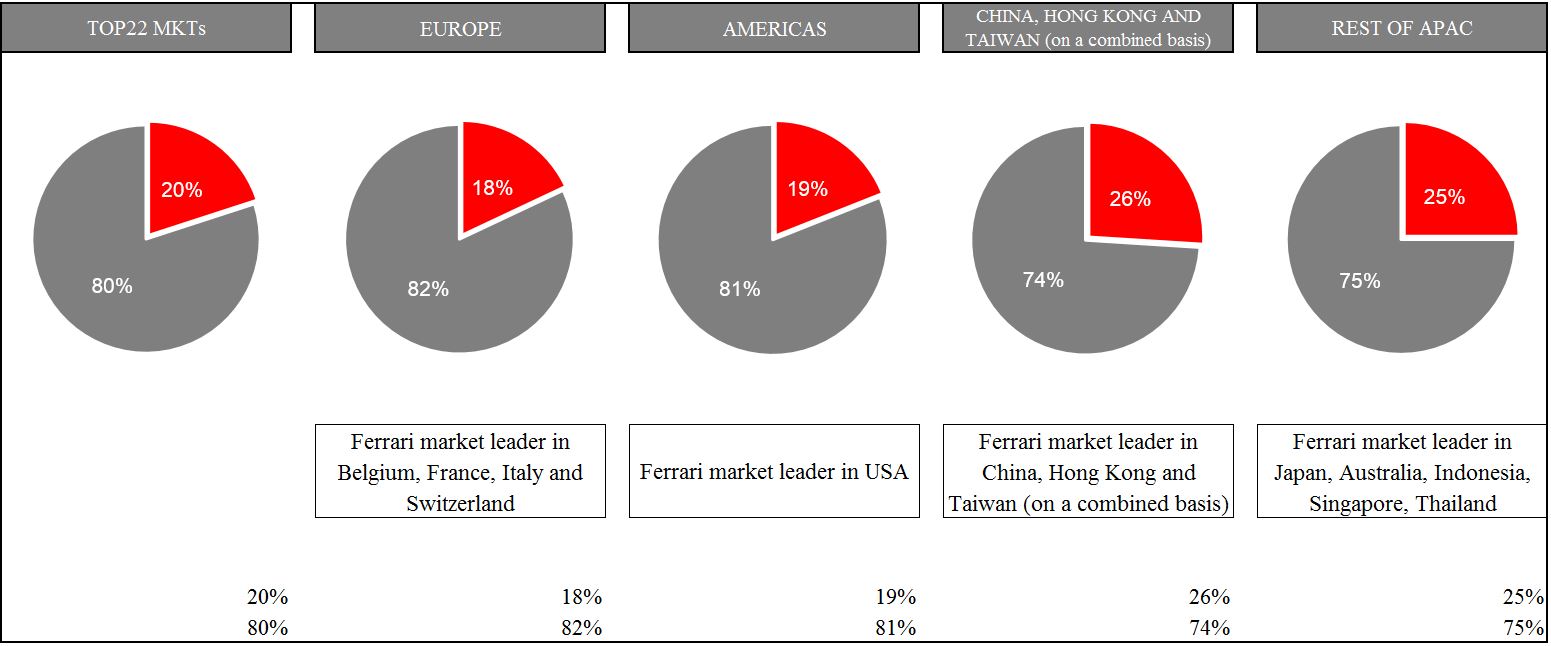
|
•
|
Data for the Luxury Performance Car Industry include all two door GT and sports cars with power above 500hp, and retail price above Euro 150,000 (including VAT) sold by Aston Martin, Audi, Bentley, Ferrari, Ford, Lamborghini, McLaren, Mercedes Benz, Porsche and Rolls-Royce.
|
|
•
|
Ferrari data based on the 22 top countries (excluding Middle East countries) for Ferrari annual registrations and sales (which accounted for approximately 85% of the total Ferrari shipments in 2017).
|
|
•
|
Data for the Luxury Performance Car Industry based on units registered (Brazil, Japan, Taiwan, United Kingdom, Germany, France, Switzerland, Italy, Spain, Sweden, Netherlands, Belgium and Austria) or sold (in USA, South Korea, Thailand, China, Hong Kong, Australia, New Zealand, Singapore and Indonesia). Source: USA: US Maker Data Club, Brazil-JATO; Austria-OSZ; Belgium-FEBIAC; France-SIV; Germany-KBA; UK-SMMT; Italy-UNRAE; Netherlands- VWE; Spain- TRAFICO; Sweden-BranschData; Switzerland-ASTRA; China-China Automobile Industry Association-DataClub; Hong Kong-Hong Kong Motor Trader Association; Taiwan-Ministry of Transportation and Communications; Australia-VFACTS-S; Japan-JAIA; Indonesia-GAIKINDO; New Zealand-VFACTS; Singapore-LTA, MTA (Land Transport Authority, Motor Trader Associations); South Korea-KAIDA; Thailand -Department of Land Transportation.
|
While we monitor our market share as an indicator of our brand appeal, we do not regard market share in the luxury performance market as particularly relevant as compared to other segments of the automotive industry. We are not focused on market share as a performance metric. Instead, we deliberately manage our supply relative to demand, to defend and promote our brand exclusivity and premium pricing. In recent years, we have produced a substantially constant number of cars per year in furtherance of that strategy.
Competition
Competition in the luxury performance car market is concentrated in a fairly small number of producers, including both large automotive companies as well as small producers exclusively focused on luxury cars, like us. The luxury performance car market includes a sports car segment and a GT segment.
In the sports car segment our products are the 488 GTB, 488 Spider, 812 Superfast and our latest special series, the F12tdf, and our principal competitors are Lamborghini (Huracán 4WD/2WD, Aventador, Aventador SV, in each case Coupé and Spider, and Huracán Performante), McLaren (570S/GT, 540C, 720S Coupé and Spider), Ford (GT), Honda (NSX), Porsche (911 Turbo, Turbo S, both Coupé and Spider), Mercedes (SL 63/65 AMG), Aston Martin (Vanquish and V12 Vantage/S, both Coupé and Spider), Audi (R8 V10 Coupé and Spider, R8V10 Plus and R8V10 RWS). In the GT segment our products are the California T, the Ferrari Portofino (the successor of the California T which is being phased out), the GTC4Lusso and the GTC4Lusso T models and our principal competitors are Rolls-Royce (Wraith and Dawn), Bentley (Continental GT/GTC, V12 and V8, Speed and S version, GT3-R and Supersports), Aston Martin (DB11 Coupé and Spider, V8 and V12) and Mercedes (S Coupé and Convertible 63/65 AMG, AMG ATC Coupé and Spider and AMG GTR).
27
In recent years, the market has shifted somewhat with an increased focus on the GT segment and the lower priced range of the sports car market, with larger automotive groups expanding their offering of premium cars to enter the luxury performance car market.
Competition in the luxury performance car market is driven by the strength of the brand and the appeal of the products in terms of performance, styling, novelty and innovation as well as on the manufacturers’ ability to renew its product offerings regularly in order to continue to stimulate customer demand. Larger automotive groups with a product offering in the luxury performance car market typically have larger financial resources compared to the small luxury car producers and therefore may have more flexibility in planning for product launches and capital spending over time.
Competition among similarly positioned luxury performance cars is also driven by price and total cost of ownership. We believe that the resilience of the value of our cars after a period of ownership is an important competitive factor because it decreases the total cost of ownership for our clients and promotes repeat purchases.
Sports and GT Cars
Our current product range includes six range models and one special series, equipped with either eight or twelve cylinder engines and divided into two classes: Sports cars and GT cars. We target end clients seeking high performance cars with distinctive design and state of the art technology. Within these parameters, we offer different models to meet our clients’ varying needs and to differentiate our line-up from that of other manufacturers, ranging from the exceptional performance of our Sports cars to the luxury and drivability of our GT cars. Our diversified product offering includes different architectures (such as front-engine and mid-rear engine), engine sizes (V8 and V12), body styles (such as coupes and spiders), and seating (2 seaters, 2+2 seaters and 4 seaters).
Our sports cars are characterized by compact bodies, a design guided by performance and aerodynamics, and often benefit from technologies initially developed for our Formula 1 single-seaters. They favor performance over comfort, seeking to provide a driver with an immediate response and superior handling, leveraging state of the art vehicle dynamics components and controls. In our sports car class, we offer three models: two of which are equipped with mid-rear V8 engines, namely the 488 GTB (with 670 hp) and the 488 Spider (with 670 hp); and one equipped with a front V12 engine, the 812 Superfast (with 800 hp). Our GT cars, while maintaining the performance expected of a Ferrari, are characterized by more refined interiors with a higher focus on comfort and quality of life on-board. In our GT class, we offer two models equipped with our V8 engine, the California T (with 560 hp) and the GTC4Lusso T (with 610 hp), the first Ferrari 4 seater equipped with a V8 turbo engine. We also offer one GT model equipped with our V12 engine, the GTC4Lusso (with 690 hp), our sport-luxury 4 seater and 4 wheel drive. The Ferrari Portofino (with 600 hp), the replacement of the California T, was unveiled in September 2017 and shipments are expected to begin in the second quarter of 2018.
We also from time to time design, engineer and produce special series cars which are based on our range models but introduce novel product concepts. These cars are characterized by significant hardware and software mechanical modifications designed to enhance performance and drivability. Our special series cars are particularly targeted to collectors and, from a commercial and product development standpoint, they facilitate the transition from existing to new range models. Our current special series model is the F12tdf, equipped with a V12 engine with 780 hp.
In addition to our range models and special series described above, we also continue the longstanding Ferrari tradition of limited edition supercars, very limited series (
fuori serie
) and one-off cars. Our limited edition supercars, which we typically launch in seven to 10 year intervals, are the highest expression of Ferrari performance and are often the forerunners of technological innovations for the future range models, with innovative features and futuristic design. At the Mondial de l’Automobile
2016
show in Paris we introduced an open top version of the LaFerrari, LaFerrari Aperta, to celebrate the 70
th
anniversary of Ferrari in
2017
. Our
fuori serie
cars can be based on range or special series mechanical components, but are characterized by important exterior body modifications resulting in an innovative product by concept or design. These exclusive cars are linked to specific events or celebrations, such as the F60 America (celebrating our 60
th
anniversary of sales in the United States) and the J50 (celebrating our 50
th
anniversary of sales in Japan). Our one-off cars are designed to meet the varying needs of our most loyal and discerning clients. They reflect the exact design and specifications required by our clients and are produced as a single, unique vehicle. (See “
-Limited Edition Supercars, Fuori Serie and One-Offs
”).
28
The table below sets forth our unit shipments for the years ended December 31,
2017
,
2016
and
2015
, by geographic market:
|
(Number of cars and % of total cars)
|
For the years ended December 31,
|
|||||||||||||||||
|
2017
|
%
|
2016
|
%
|
2015
|
%
|
|||||||||||||
|
EMEA
|
||||||||||||||||||
|
UK
|
843
|
|
10.0
|
%
|
769
|
|
9.6
|
%
|
740
|
|
9.7
|
%
|
||||||
|
Germany
|
710
|
|
8.5
|
%
|
675
|
|
8.4
|
%
|
595
|
|
7.8
|
%
|
||||||
|
Italy
|
417
|
|
5.0
|
%
|
364
|
|
4.5
|
%
|
285
|
|
3.7
|
%
|
||||||
|
France
|
346
|
|
4.1
|
%
|
306
|
|
3.8
|
%
|
274
|
|
3.6
|
%
|
||||||
|
Switzerland
|
339
|
|
4.0
|
%
|
333
|
|
4.2
|
%
|
340
|
|
4.4
|
%
|
||||||
|
Middle East
(1)
|
331
|
|
3.9
|
%
|
439
|
|
5.5
|
%
|
456
|
|
5.9
|
%
|
||||||
|
Other EMEA
(2)
|
751
|
|
9.0
|
%
|
724
|
|
9.1
|
%
|
661
|
|
8.6
|
%
|
||||||
|
Total EMEA
|
3,737
|
|
44.5
|
%
|
3,610
|
|
45.1
|
%
|
3,351
|
|
43.7
|
%
|
||||||
|
Americas
(3)
|
2,811
|
|
33.5
|
%
|
2,687
|
|
33.5
|
%
|
2,640
|
|
34.4
|
%
|
||||||
|
China, Hong Kong and Taiwan (on a combined basis)
|
617
|
|
7.3
|
%
|
619
|
|
7.7
|
%
|
610
|
|
8.0
|
%
|
||||||
|
Rest of APAC
(4)
|
1,233
|
|
14.7
|
%
|
1,098
|
|
13.7
|
%
|
1,063
|
|
13.9
|
%
|
||||||
|
Total
|
8,398
|
|
100.0
|
%
|
8,014
|
|
100.0
|
%
|
7,664
|
|
100.0
|
%
|
||||||
__________________________
|
(1)
|
Middle East includes the United Arab Emirates, Saudi Arabia, Bahrain, Lebanon, Qatar, Oman and Kuwait.
|
|
(2)
|
Rest of EMEA includes Africa and the other European markets not separately identified.
|
|
(3)
|
Americas includes the United States of America, Canada, Mexico, the Caribbean and Central and South America.
|
|
(4)
|
Rest of APAC mainly includes Japan, Australia, Singapore, Indonesia and South Korea.
|
The table below sets forth our unit shipments for the years ended December 31,
2017
,
2016
and
2015
, with a breakdown of Sports and GT cars:
|
(Number of cars)
|
For the years ended December 31,
|
||||||||
|
2017
|
2016
|
2015
|
|||||||
|
Sports
|
|||||||||
|
V8
(1)
|
4,845
|
|
4,221
|
|
3,534
|
|
|||
|
V12
(2)
|
998
|
|
1,152
|
|
1,169
|
|
|||
|
Total Sports
|
5,843
|
|
5,373
|
|
4,703
|
|
|||
|
GT
|
|||||||||
|
V8
|
1,619
|
|
2,247
|
|
2,638
|
|
|||
|
V12
|
936
|
|
394
|
|
323
|
|
|||
|
Total GT
|
2,555
|
|
2,641
|
|
2,961
|
|
|||
|
Total
|
8,398
|
|
8,014
|
|
7,664
|
|
|||
______________________________
|
(1)
|
Includes 458 Speciale and 458 Speciale A for 2015.
|
|
(2)
|
Includes the F12berlinetta for all periods presented, the LaFerrari until 2016, and from the third quarter of 2016 the LaFerrari Aperta.
|
We are also actively engaged in after sales activities driven, among other things, by the objective of preserving and extending the market value of the cars we sell. We believe our cars’ performance in terms of value preservation after a period of ownership significantly exceeds that of any other brand in the luxury car segment. High residual value is important to the primary market because clients, when purchasing our cars, take into account the expected resale value of the car in assessing the overall cost of ownership. Furthermore, a higher residual value potentially lowers the cost for the owner to switch to a new model thereby supporting client loyalty and promoting repeat purchases.
29
Range Models and Special Series
Our products include the range models and special series described below. Our range models currently consist of six models, including three sports cars, the 488 GTB, the 488 Spider and the 812 Superfast, and three GT cars, the California T, the GTC4Lusso and the GTC4Lusso T. The Ferrari Portofino will replace the California T, with shipments expected to begin in the second quarter of 2018.
We also offer special series cars based on our range models. These cars are characterized by significant hardware and software modifications (engine, aerodynamics, and dynamics among others), designed to enhance performance and drivability when compared to current range models. Our latest special series, unveiled in
October 2015
, is the F12tdf, which is based on the F12berlinetta.
All of our range and special series models feature highly customizable interior and exterior options such as forged rims, luxury leathers, seat style, panoramic roof, dashboard and steering wheel inserts (see “
—Personalization Program and Tailor Made Program
”).
488 GTB
The 488 GTB is a two seater berlinetta with a 670 hp mid-rear mounted V8 engine. It was launched in
March 2015
, 40 years after we unveiled our first ever mid-rear-engined V8 model (the 308 GTB). The model’s exterior and interior design was developed entirely by Ferrari Design Centre. Its large signature air intake scallop evokes the original 308 GTB and is divided into two sections by a splitter. Designed for track-level performance, the 488 GTB can also provide enjoyment to non-professional drivers for everyday use. Accelerating from 0-200 km/h in only 8.3 seconds, its new 3902 cc V8 turbo engine is at the top of the class for power output, torque and response times. In the cabin, the seamless integration of the new satellite control clusters, angled air vents and instrument panel heightens the sense that the cockpit is completely tailored around the driver, leading to an extremely sporty yet comfortable ambiance. The 488 GTB has collected various accolades including: Autocar (UK) – 2015 ‘Best Driver’s Car’, Sport Auto (Germany) – 2015 Best Brands Awards – “Best Coupé over €150,000” and Middle East Car of the Year (MECOTY) – ‘Best Supercar 2015’.
30
488 Spider
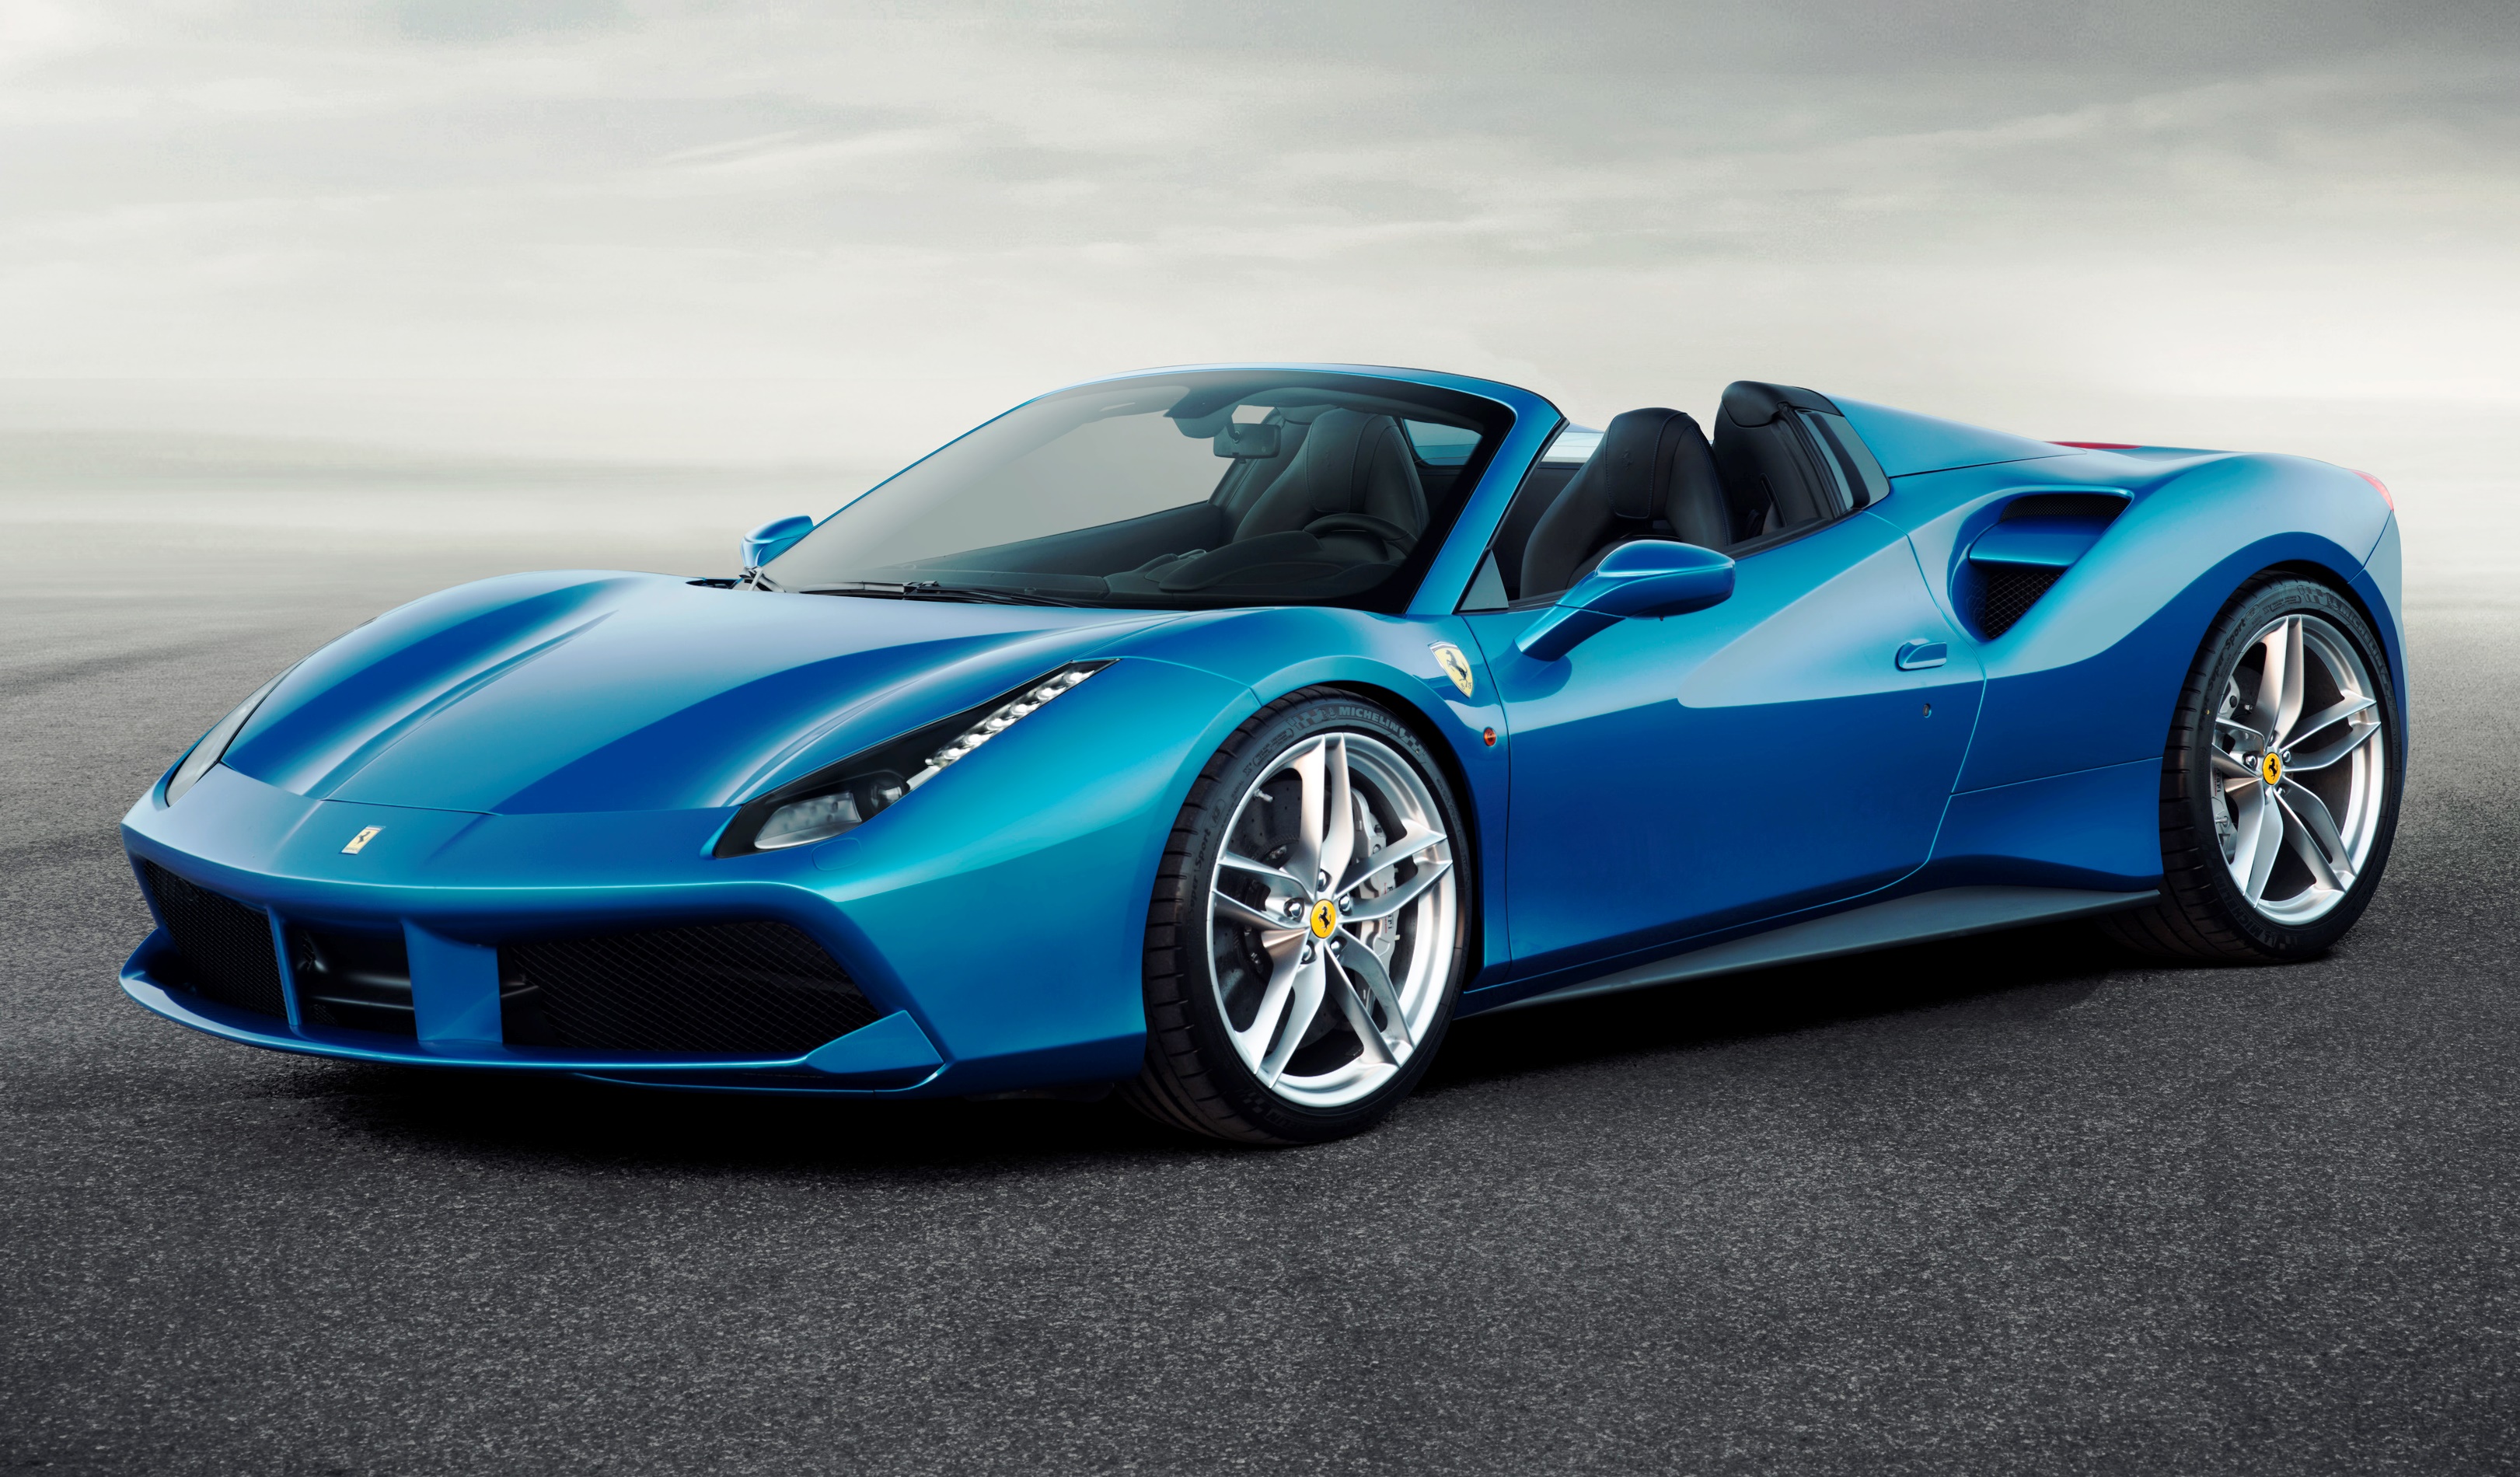
The 488 Spider, launched in September 2015, is a two seat coupe with a 670 hp mid-rear mounted V8 engine. Its retractable hard top, which saves approximately 25 kg on a soft top, unfolds and retracts in 14 seconds and can also be raised or lowered while the car is moving. If offers the full experience of sports car driving, especially on mixed and challenging surfaces, but aims to cater to those who do not need to constantly push their car to the limit on the track. Styled entirely in-house at Ferrari Design Centre and designed around the retractable hard top concept, the 488 Spider combines the prowess of the 488 GTB coupe’s mid-rear V8 with innovations in aerodynamics, including a new Ferrari-patented blown spoiler, which allows air to enter an intake at the base of the rear screen and exit via the bumper and reduces drag. The 488 Spider accelerates from 0 to 100 km/h in 3.0 seconds and from 0 to 200 km/h in 8.7 seconds and offers exceptional dynamic behavior, with close to no turbo lag and response time of just 0.8 seconds.
812 Superfast
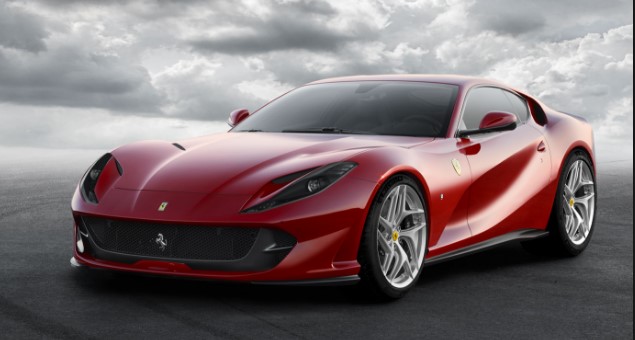
Unveiled at the Geneva Motor Show in 2017, the 812 Superfast is equipped with a 800 hp V12 engine. Built around highly evolved transaxle architecture and equipped with leading-edge components and controls, it boasts a striking design and aerodynamics as well as uniquely smooth handling. It ushers in a new generation of Ferrari 12-cylinders and we believe it is the new benchmark for mid-front-engined sports cars. This is a model that will deliver a riveting, rewarding driving experience on both road and track, thanks to its superb handling and ride comfort on longer trips. The 812 Superfast incorporates several innovations such as EPS (Electric Power Steering) for pure exhilarating fun, PCV system (Passo Corto Virtuale - four wheel steering system), an evolution of Side Slip Control (SSC) and innovative aerodynamics content.
31
F12tdf

The F12tdf was unveiled in October
2015
and has finished its limited series run in 2017. The F12tdf is our latest special series sports car (based on the F12berlinetta), which pays tribute to the Tour de France, the legendary endurance road race that Ferrari dominated in the 1950s and 1960s. Designed entirely in-house at Ferrari Design Centre, the F12tdf is a two seat coupe equipped with a 6262cc 65° V12 engine with a maximum power of 780 hp at 8,500 rpm. The F12tdf is the most powerful high performance Ferrari sports car ever built. Its engine’s sporty response is assured by a maximum torque of 705 Nm (up from 690 Nm) at 6,750 rpm with 80% of such force already available at 2,500 rpm. The F12tdf is equipped with a new Ferrari innovative rear-wheel steering system, known as the Virtual Short Wheelbase (or
Passo Corto Virtuale
), which together with wider front tires and other vehicle dynamic control systems provides the steering wheel response times and turn-in of a competition car while increasing stability at high speed. These factors combine to produce an outstanding acceleration: 0-100 km/h in 2.9 seconds and 0-200 km/h in 7.9 seconds.
California T

The California T, which is being phased out, followed the great success of our
2008
California model and is equipped with a 560 hp V8 turbo engine. Launched in
2014
, it is the only GT car in the segment to combine a retractable hard top, rear seats and a ski passage to the spacious trunk. Its new turbocharged V8 engine comes with a variable boost management system. This makes it the only turbo engine in the world with close to no turbo lag. It also features a revised rear and interior design and a 15 percent reduction in fuel consumption compared to its predecessor. Its lines, penned by Ferrari Design Centre in collaboration with Pininfarina, were awarded the
2015
Red Dot Design Award. In January
2016
, we announced the introduction of the Handling Speciale Package (“HSP”) on the California T. The HSP, designed to ensure increased performance, handling and response for a more sporty driving experience, was launched at the Geneva Motor Show in March
2016
.
32
Ferrari Portofino
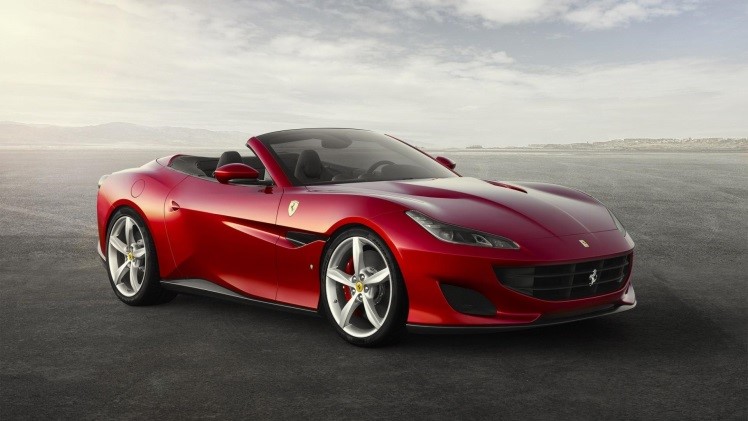
Unveiled in September 2017 at the Frankfurt Motorshow, the Ferrari Portofino is the successor of the California T in the Ferrari GT range. The model is set to lead its segment thanks to a combination of outright performance and versatility in addition to a level of driving pleasure and on-board comfort that we believe is unparalleled on the market. The car is 80 kg lighter than the California T thanks to the adoption of new components featuring innovative designs made possible by the use of advanced production techniques. This, combined with a 40 cv higher output than the California T, has resulted in a significant hike in performance and a corresponding drop in emissions. The Ferrari Portofino is capable of unleashing 600 cv and sprinting from 0 to 200 km/h in just 10.8 seconds. It combines the advantages of a retractable hard top, a roomy boot and generous cockpit space, complete with two rear seats suitable for short trips. The new car, which takes its name, Portofino, from the renowned village on the Italian Riviera, an eponym for stylish elegance, is a Ferrari designed to be driven every day delivering a unique Ferrari sound and superb driving pleasure even in day-to-day situations.
GTC4Lusso

Unveiled in February
2016
, the GTC4Lusso is our latest four-seater four-wheel drive Grand Tourer model. Its name recalls historic Ferrari models, such as the 330GT 2+2 and the 250 GT Berlinetta Lusso, renowned for their combination of elegance and performance. The Ferrari Design-penned GTC4Lusso adds a further refinement to the shooting brake coupe style to produce a streamlined, tapered silhouette. The GTC4Lusso is equipped with a 6262cc 65° V12 engine with a maximum power of 690 hp, maximum speed of 335/Km/h and acceleration of 0-100 km/h in 3.4 seconds The Ferrari-patented integrated four wheel drive and steering system allows the driver to effortlessly handle the exceptional torque in a variety of road conditions. Shipments of the GTC4Lusso began in the third quarter of
2016
.
33
GTC4Lusso T

Ferrari further broadened its range at the Mondial de l’Automobile
2016
in Paris with the world premiere of the new GTC4Lusso T, Maranello’s first ever full 4-seater to be powered by a V8, combining sportiness and versatility with day-to-day drivability.
The GTC4Lusso T is equipped with the latest evolution of the “International Engine of the Year 2016” V8 turbo family. The 3.9-liter engine produces a maximum of 610 cv at 7,500 rpm, delivering instant throttle response and smooth progressive pick-up across the rev range. This impressive performance is matched by fuel consumption figures that yield an excellent range, making the car ideal for both city driving and longer journeys.
Adding four-wheel steering and specific calibration of the dynamic control systems to the mix has produced an extremely agile and responsive car. Production of the GTC4Lusso T started in December
2016
and shipments started in the second quarter of
2017
.
Personalization Program and Tailor Made Program
All of our models feature highly customizable interior and exterior options, which together comprise our personalization catalogue. Some of these options include custom shop wheels, alternate brake caliper colors, parking cameras, MagneRide dual mode suspension, sport exhaust systems, panoramic roof option, various door configurations, steering wheel inserts and state of the art custom high fidelity sound systems.
With our “Special Equipment” program, we offer clients additional customization choices for their car. Our specialists are able to guide clients in creating a very customized car through a wide catalog of special items such as different types of rare leathers, custom stitching, special paints, special carbon fiber, and personalized luggage sets designed to match the car’s interior.
The “Atelier” and “Tailor Made” programs provide two additional levels of personalization in accordance with the expectations of our clients. In particular, in the “Tailor Made” program a dedicated Ferrari designer assists clients in selecting and applying virtually any specific design element chosen by the client. Our clients benefit from a large choice of finishes and accessories in an array of different materials (ranging from cashmere to denim), treatments and hues. To assist our clients’ choice we also offer three collections inspired by Ferrari’s own tradition:
Scuderia
(taking its lead from our sporting history),
Classica
(bringing a modern twist to the styling cues of our signature GT models) and
Inedita
(showcasing more experimental and innovation-led personalization).
34
Tailor Made 70th Anniversary Collection

As part of activities to mark the 70th anniversary of the company, Ferrari Tailor Made, together with the designers of the Ferrari Design Center have put a modern twist on the stylistic features that distinguished 70 iconic Ferraris of the past interpreted in a contemporary way on five of our range models for a total of 350 special edition liveries. All the cars are distinguished by the commemorative logo of the 70th anniversary along with an ID plaque with the name of the model that inspired it. The project was unveiled at the Paris Motor Show in September
2016
.
Limited Edition Supercars,
Fuori Serie and One-Offs
In line with our tradition of supercars starting with the 288GTO in 1984 through to the Enzo in 2002 and the LaFerrari Aperta, our latest supercar which we launched in 2016, we also produce limited edition supercars. These are the highest expression of Ferrari road car performance at the time and are often the forerunners of technological innovations for future range models, with innovative features and futuristic design. Furthermore, in connection with certain events or celebrations, we also launch very limited edition cars (our
fuori serie
). These models can be offered globally, or may be limited to specific local markets. Based on an exotic product concept not available on the standard Ferrari model range, these cars feature completely unique design and specifications compared to our other models.
35
LaFerrari Aperta

LaFerrari Aperta is the open top version of the LaFerrari, the latest in our line of supercars. Like its coupé sibling, the LaFerrari Aperta is equipped with hybrid technology. Alongside its powerful rear-wheel drive layout V12 engine (which generates 800 hp), the hybrid system comprises two electric motors and a special battery consisting of cells developed by the Scuderia Ferrari where the F138 KERS technology was pioneered. Because the battery generates an additional 163 hp, LaFerrari Aperta has a combined total of 963 hp. LaFerrari Aperta’s HY-KERS system is designed to achieve seamless integration and rapid communication between the V12 and electric motor, thus blending extreme performance with maximum efficiency. Thanks to the hybrid technology, LaFerrari Aperta generates almost 50 percent more horsepower than the Enzo, its predecessor, and 220 hp more than the F12, our most powerful car to date. Production and shipments started in the third quarter of
2016
and are expected to end in 2018.
Ferrari J50
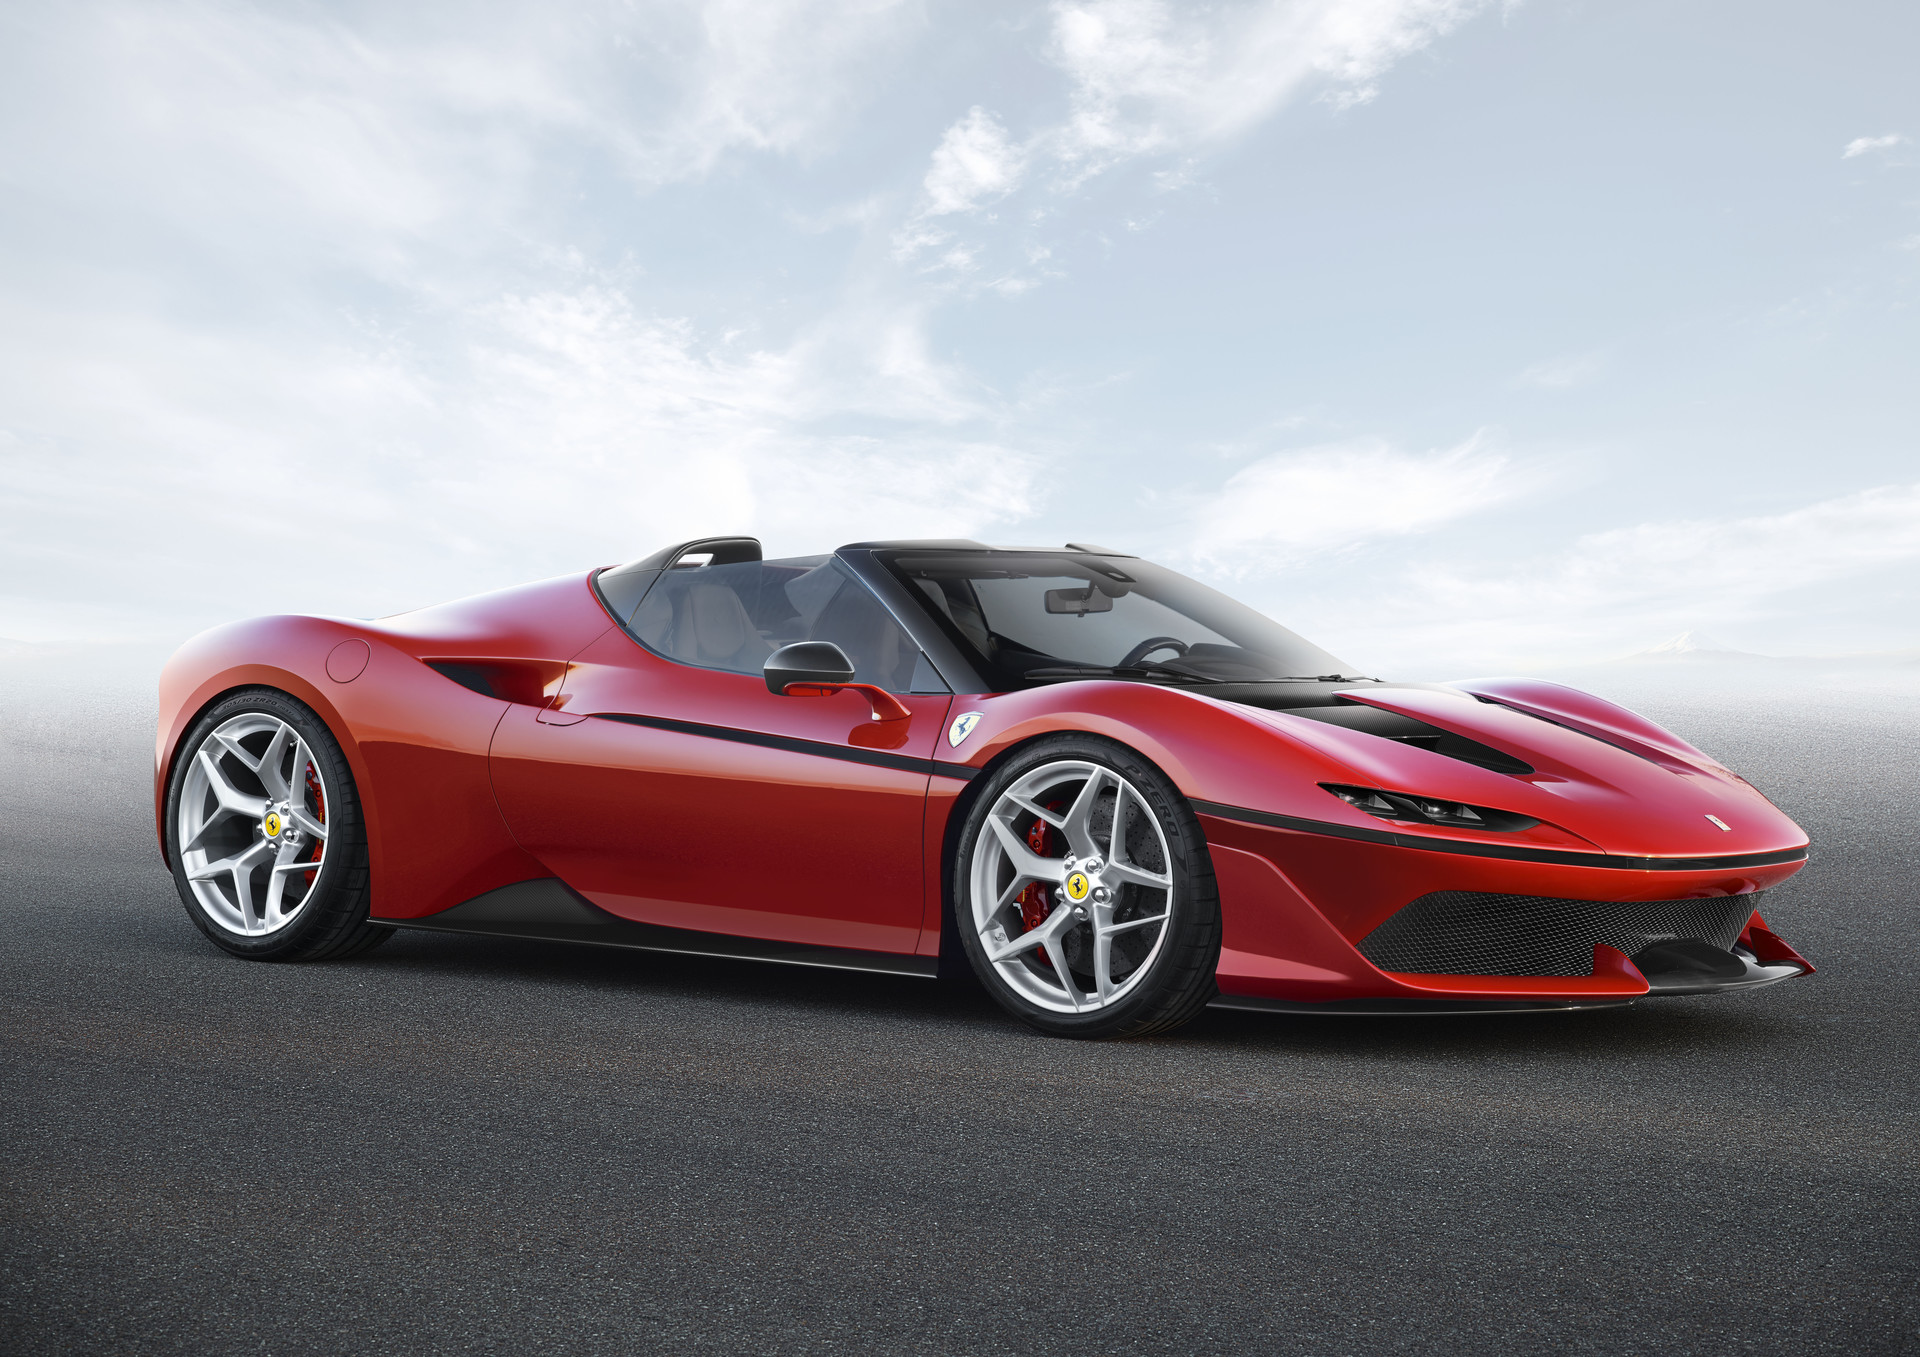
The J50 is a two-seater, mid-rear-engined roadster that marks a return to the targa body style evocative of several well-loved Ferrari road cars of the 1970s and 1980s. It was introduced during a celebration held at the National Art Center in Tokyo to commemorate the 50th anniversary of Ferrari in Japan in December 2016. Designed by the Ferrari Styling Centre team in Maranello, just 10 examples of the J50 will be built and, in the spirit of Ferrari’s
fuori serie
tradition, each one will be tailored specifically to the customer’s requirements. Based on the 488 Spider, the J50 is powered by a specific 690 cv version of the 3.9-liter V8 that won the overall International Engine of the Year Award this year. The bodywork is all new and heralds a radical
36
and futuristic design language, with a highly distinctive personality that suits the tastes of a clientele seeking the utmost in innovative styling. Production started during
2017
and all deliveries will take place in 2018.
One-Offs
Finally, in order to meet the varying needs of our most loyal and discerning clients, we also from time to time produce one-off models. While based on the chassis and equipped with engines of one of the current range models for homologation and registration purposes, these cars reflect the exact exterior and interior design specifications requested by the clients, and are produced as a single, unique car. Some of the most iconic models to have emerged from our One-Off program include the SP12 EC, the F12 TRS (a radical two-seat roadster created on the platform of the F12berlinetta in 2014) and the 458MM Speciale. The program is expanding due to increasing demand.
Non-Registered Racing Cars
Based on our Sports and GT cars, we also develop and manufacture special racing cars. These cars are not registered for use on the road and may only be used on track in competitive and non-competitive race events. This activity is managed by the Attività Sportive GT Department which includes: Competizioni GT (taking care of the GT racing) and Corse Clienti (taking care of the Ferrari Challenge one-make series, The Corso Pilota driving courses, the XX Programmes and the F1 Clienti activity).
37
488 GTR/GTLM and 488 GT3/GTD
They are sold to clients and private teams as racing cars specifically developed for professional racing with the aim to compete in the FIA World Endurance Championship, in several GT International series and also historical races like Daytona 24 Hours, Le Mans 24 Hours.
In 2016, its first year of competition, the 488 GTE won the FIA World Cup for GT Manufacturers and the 488 GT3 special car won several other competitions such as the GTD class of the IMSA SportsCar Championship and the GT class of the Asian Le Mans Series.
In 2017, the 488 GTE was even more successful gaining the FIA World Title for GT Manufacturers, the Drivers Title and Team Cup and the European Le Mans Series. The 488 GT3/D also doubled the victory, winning once again the IMSA SportsCar Championship.
XX Programme
Since
2005
, we have been operating our XX Programme, a non-competitive “owner-test drivers” program organized at some of the best known race tracks in Europe, Asia and North America. Through the XX Programme, we test advanced solutions and technological innovations by providing a select group of clients the opportunity to drive cars enhanced with superior
38
power and performance characteristics. As part of this program, we have developed the FXX K, based on LaFerrari, shipments of which started in the second quarter of
2015
. Although conceived as a track-only model, the FXX K was specially styled by Ferrari Design Centre working closely with the aerodynamics engineers. The FXX K received the Red Dot “Best of the Best” Design Award in
2015
, one of the most recognized design awards in the world. The FXX K Evo was launched in October 2017 at the Finali Mondiali in Mugello.
F1 Clienti
Introduced in 2003, the F1 Clienti program allows a limited number of exclusive Ferrari lovers to both purchase previously-used Scuderia Ferrari Formula 1 cars and experience them in full. Formula 1 cars that we sell as part of this program include recent cars of the 21
st
century, such as those driven by Kimi Raikkonen and Felipe Massa, and cars from decades ago, such as the 412 T2 of 1995, the last Formula 1 car to be powered by a 12-cylinder engine which is now back on the racetrack thanks to F1 Clienti.
Owners can focus exclusively on the driving experience, while the F1 Clienti program can arrange for the cars to be kept at Maranello for safekeeping, where F1 technicians and mechanics perform regular maintenance of the cars. The F1 Clienti program includes a series of events throughout the year that enable customers to experience the pleasure of driving on prestigious tracks in front of a live crowd.
39
Ferrari Challenge Trofeo Pirelli - 488 Challenge

Ferrari Challenge is the biggest one-make series in the world. The series was established in 1993 and the events are FIA approved, thus ensuring very high safety standards and dependable organization. The championship was an immediate success: the formula for the event ensures that cars are very closely matched, thus putting the focus on the drivers. There are three series: Europe, which is the oldest, North America and Asia-Pacific.
The 488 Challenge marks the 25th anniversary of the Ferrari Challenge and was launched in December
2016
at the Finali Mondiali in Daytona. The 488 Challenge is the first equipped with a turbo engine to get on track in the Ferrari one-make series. It is the most powerful car in the Challenge history thanks to 670 hp from the V8 3.9-liter engine derived from the 488 GTB. Ferrari’s patented Slip Slip Angle Control software is installed for the first time on a Challenge car, improving the longitudinal acceleration through bends by 4.2 percent. Production started in
2017
.
Corso Pilota Driving Courses
Initiated in 1993, Corso Pilota driving courses enable Ferrari customers to experience and appreciate the full formidable performance of the Ferrari models in a safe environment. It provides an opportunity to attend various, increasingly technical and complex courses that begin with the Sport, Advance, and Evolution levels, and culminate with the Challenge course. Led by professional instructors with years of Ferrari driving experience, the courses are designed to progressively develop participants’ driving style and skills so that they will obtain sufficient mastery to compete safely in real Challenge Championship races. The selection and preparation of the Ferrari cars used for the courses is of fundamental importance and the current fleet consists of 488 GTB, 812 Superfast and 488 Challenge models.
Sales and After-Sales
Our commercial team, which includes 234 employees at
December 31, 2017
, is organized in four geographic areas covering our principal regional end markets: (i) EMEA, which is also responsible for South Africa and India, (ii) Americas, (iii) China, Hong Kong and Taiwan (on a combined basis), and (iv) Rest of APAC (which includes the rest of Asia and Oceania).
Dealer network
We sell our cars exclusively through a network of authorized dealers (with the exception of one-offs which we sell directly to end clients). In our larger markets we act as importer either through wholly owned subsidiaries or, in China, through a subsidiary partly owned by a local partner, and we sell the cars to dealers for resale to end clients. In smaller markets we generally sell the cars to a single importer. We regularly assess the composition of our dealer network in order to maintain the highest level of quality. The dealer assessment and selection process may cause a variation of the number of dealers from time
40
to time. Following our decision to terminate the distributor in Hong Kong in 2016, we now import cars into Hong Kong directly and have appointed a new dealer which became fully operational during the third quarter of 2017. Moreover, we decided to establish a fully-owned subsidiary aimed to be closer to the market and enhance the brand visibility in this market. At
December 31, 2017
, our network comprised 164 dealers operating 185 points of sale.
We do not own dealerships and, while our strategy does not contemplate owning dealerships, we retain flexibility to consider all market requirements from time to time.
We believe that our careful and strict selection of the dealers that sell our cars is a key factor for promoting the integrity and success of our brand. Our selection criteria are based on the candidates’ reputation, financial solidity and track record. We are also mindful to select dealers who are able to provide an in-store experience and to market and promote our cars in a manner intended to preserve the Ferrari brand integrity and to ensure the highest level of client satisfaction.
While dealers may hold multiple franchises, we enjoy a high degree of prominence and level of representation at each point of sale, where most of the client interface and retail experience is exclusive to Ferrari. Our network and business development team works directly with individual dealers to ensure various standards are met. All dealers must conform to our rigorous design, layout and corporate identity guidelines ensuring uniformity of the image and client interface. Through the Ferrari Academy we provide training to dealers for sales, after sales and technical activities to ensure our dealer network delivers a consistent level of market leading standards across diverse cultural environments. We train and monitor dealers intensively and we collect and observe data relating to their profitability and financial health in order to prevent or mitigate any adverse experience for clients arising from a dealer ceasing to do business or experiencing financial difficulties. Our representatives visit dealerships regularly to measure compliance with our operating standards. We have the right to terminate dealer relationships in a variety of circumstances including failure to meet performance or financial standards, or failure to comply with our guidelines.
We provide a suggested retail price or a maximum retail price for all of our cars, but each dealer is free to negotiate different prices with clients and to provide financing. Although many of our clients in certain markets purchase our cars from dealers without financing, we provide direct or indirect finance and leasing services to retail clients and to dealers. (See “—
Financial Services
”).
The total number of our dealers as well as their geographical distribution tends to reflect closely the development or expected development of sales volumes to end clients in our various markets over time. Dealer turnover is relatively low, reflecting the strength of the franchise and our selection processes, but is sufficient to guarantee an orderly renewal over time and to stimulate the network’s health and performance.
The chart below sets forth the geographic distribution of our 185 points of sale at December 31, 2017:
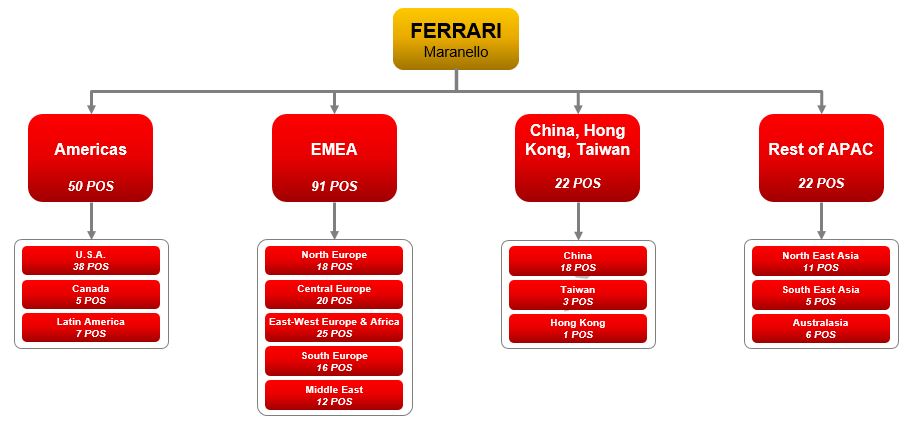
41
Our sales are diversified across our dealer network, with the largest dealer representing approximately 2.2 percent of sales, and our 15 largest dealers representing 21.7 percent of sales.
As part of our supply and demand management, we determine allocations based on various metrics including expected developments in the relevant market, the number of cars sold historically by the various dealers, current order book of dealers and the average waiting time of the end client in the relevant market. Our order reporting system allows us to collect and monitor information regarding end client orders and is able to assist us in production planning, allocation and dealer management.
Parts
We supply parts for current and older models of Ferrari to our authorized dealer network. In addition to substitution of spare parts during the life of the car, sales are driven by clients’ demand for parts to customize their cars and maximize performance, particularly after a change in ownership and to compete in the Ferrari
Challenge and other client races. We also supply parts to Ferrari models currently out of production, with stocks dating back to 1995. The stock of parts for even older models is currently owned and managed by a third party which in some cases also manufactures out-of-stock parts based on our design. The sale of parts is a profitable component of our product mix and it is expected to benefit from the increase in the number of Ferrari cars in circulation.
After Sales
Dealers provide after sales services to clients, either at facilities adjacent to showrooms, or in stand-alone service points across 231 facilities worldwide. After sales activities are very important for our business to ensure the client’s continued enjoyment of the car and the experience. Therefore, we enforce a strict quality control on our dealers’ services activities and we provide continued training and support to the dealers’ service personnel. This includes our team of “flying doctors,” Ferrari engineers who regularly travel to service centers to address difficult technical issues for our clients.
We also sell certain cars together with a scheduled program of recommended maintenance services in order to ensure that these cars are maintained to the highest standards to meet our strict requirements for performance and safety.
While we do not have any direct involvement in pre-owned car sales, we seek to support a healthy secondary market in order to promote the value of our brand, benefit our clients and facilitate sales of new cars. Our dealers provide an inspection service for clients seeking to sell their car which involves detailed checks on the car and a certification on which the client can rely, covering, among other things, the authenticity of the car, the conformity to original technical specifications, and the state of repair. Furthermore, we offer owners of classic Ferrari cars maintenance and restoration services.
Client Relations
Our clients are the backbone of our business together with our brand and our technology. We do not promote our brand or our cars through general advertising. Our main brand marketing and promotional activities have two principal targets.
Firstly, we target the general public. Our most significant effort in this respect is centered on our racing activities and the resonance of Scuderia Ferrari (see “
—Formula 1 Activities
”). We also engage in other brand-promotional activities, including participation in motor shows and other public events.
Secondly, we target existing and prospective clients, seeking to promote clients’ knowledge of our products, and their enjoyment of our cars both on road and on track, and to foster long term relationships with our clients, which is key to our success. In 2017, more than 65 percent of our new cars were sold to Ferrari owners.
By purchasing our cars, clients become part of a select community sharing a primary association with the Ferrari image and we foster this sense of fellowship with a number of initiatives. We strive to maximize the experience of our clients throughout their period of interaction with Ferrari — from first contact, through purchasing decision process, to waiting-time management and ownership.
Client events
We organize a number of client events at Maranello and elsewhere.
Our factory in Maranello is the core of our client engagement strategy and a symbolic hub attracting clients and prospects worldwide. Upon invitation, clients and prospects can visit the factory, witness some of its workings and experience several
42
Ferrari core values such as heritage, exclusivity and customization. At the factory, clients have the opportunity to configure their cars through our personalization and bespoke program (see “
—Personalization Program and Tailor Made Program
”).
Every new model launch is carefully staged and selected clients and prospects have preferential access to the new car. The new model presentation begins with the release of images providing a preliminary, often partial view of its design. Clients are then invited to a preview or world premiere. A public model presentation generally follows at motor shows where clients are provided access to the Ferrari stand. Further country and regional events follow before delivery of the first cars to dealers.
During 2017, to celebrate our 70th anniversary, over 60 nations hosted Ferrari events crafted to treat clients and enthusiasts to a string of unique experiences as part of the “
Driven by Emotion
” concept. Thus March 12, 2017 marked the start of the anniversary events, with Australasia opening the program.
The anniversary celebrations were flanked by many initiatives paying homage to the Cavallino Rampante heritage, not least two exclusive tours through Tuscany: the
Cavalcade Classiche
in May devoted to the cars that have made the history of Ferrari, and the
250 GTO rally
, dedicated to one of the best known and admired Ferraris of all time.
On September 7 and 8, moreover, clients were invited to a two day
World Premiere of the Ferrari Portofino
, the new GT convertible with a 600 hp V8 engine, at the famous former fishing village whose name it bears.
The festivities for the 70th anniversary culminated in Maranello on the weekend of September 9 and 10, when Ferrari hosted over 4,000 clients and almost 1,000 cars from all over the world at its Fiorano track.
Driving events
Driving events serve the dual objective of allowing clients to experience at their best the emotion of driving a Ferrari car, and to foster client loyalty and repeat purchases by creating superior car-usage occasions. Track and sporty driving activities are mainly targeted to clients with a preference for sports models.
In addition to several track day activities, organized by local sales departments and dealers to allow clients to use their cars on ad-hoc rented tracks, Ferrari has a central department responsible for professionally organizing races and racing courses,
Corse Clienti.
The
Corse Clienti
activities take place on some of the world’s most famous race tracks, and include both competitive races, such as the Ferrari Challenge Championships, and non-competitive events, such as with
XX and F1 Programme
. The
XX and F1 Programme
is a highly selective initiative dedicated to a restricted group of clients who own non-homologated GT race cars and F1 cars previously used in the Formula 1 Championship. Ferrari Challenge and XX/Formula 1 events are sometimes accompanied by so-called
Ferrari Racing Days
. These events are open to non-competing clients and prospects and a wider audience, and they offer the opportunity for important client gatherings.
In addition to on-track racing, we organize various on-the-road driving events, including both proprietary formats (
Ferrari Cavalcade, also including the International Edition
) or with a branded presence within an established driving event. For example, in the
Ferrari Tribute to Mille Miglia
and the
Ferrari Tribute to Targa Florio
modern Ferrari cars participate in their own regularity rally taking place shortly before the start of the classic Mille Miglia and Targa Florio races.
We see nurturing our clients’ passion for driving as a key asset for our future commercial success, particularly in markets where racing traditions are less pronounced. We offer to our prospective and existing clients interested in new Ferrari models our
Esperienza Ferrari
initiative, which consists of driving sessions designed to allow participants to experience the pleasure of driving a Ferrari with a team of highly qualified and skilled Ferrari instructors and technicians professionally trained in high-performance driving. In addition we also offer on-track driving courses to our clients, catering to different levels of skill and experience and teaching essential driving skills for high performance cars. In our newer markets, such as China, we also offer complimentary driving courses on track to any new car buyer.
Ferrari Classiche
The Ferrari Classiche department aims to provide Ferrari customers with a point of reference for managing their historic Ferrari vehicles with the objective of keeping as many of these classic cars on the road as possible. Services include the certification of the authenticity of classic Ferrari cars and vehicles of particular historical relevance, the management of Ferrari restoration and repair activities, as well as the management of Ferrari spare parts, including when these are no longer available on the market. The department also provides advice on repair operations carried out on Ferrari Classiche cars within its network.
43
Ferrari Classiche aims to create a platform of information and technical expertise to preserve and enhance over time the awareness and value of Ferrari’s heritage and brand. We view the surviving Ferrari vehicles of historical value as the tangible legacy and incarnation of our brand. The Ferrari Classiche department also supports and encourages the direct participation of clients in strategic historical events.
The Ferrari Classiche department in Maranello consists of an office of specialists and a workshop in which historic cars are restored and repaired. In addition, in order to provide an enhanced service to owners away from the proximity of the main workshop in Maranello, starting in 2017 Ferrari Classiche has authorized a new service network with 48 new “Officina Ferrari Classiche” workshops, primarily for vehicle repairs and the certifications’ inspections or revalidation, and the network is expected to expand in future periods.
The originality of the car with respect to the initial specifications is checked via a technical inspection, performed either at the Ferrari Classiche facility in Maranello or at an authorized Officina Ferrari Classiche, and benefits from a comprehensive archive containing drawings of each of the individual chassis details of historical components. Based on the evidence gathered during this inspection, the car is then presented to an expert committee, chaired by the founder’s son, Piero Ferrari, for the certification. In recent years, Ferrari has certified approximately 400 cars each year.
At the Maranello workshop, Ferrari Classiche carries out approximately 10 full restorations every year, along with 20 partial restorations. We use either original components and spare parts or replicas manufactured in accordance with the original specifications, and our restoration service offers our clients the opportunity to reinstate any classic Ferrari to its original pristine conditions.
Formula 1 Activities
Participation in the Formula 1 World Championship with Scuderia Ferrari is the core element of our marketing effort and an important source of technological innovation for the engineering, development and production of our Sports and GT cars. The Formula 1 World Championship is the pinnacle of motorsports with over
350
million television viewers in 2017
(Source: FOM/Kantar Media 2017)
, which make it one of the most watched annual sport series in the world.
Formula 1 cars rely on advanced technology, powerful hybrid engines and cutting edge aerodynamics, While Europe is the sport’s traditional base, Formula 1’s reach has expanded significantly and an increasing number of Grand Prix are held in non-European countries, such as China, Bahrain, United Arab Emirates, Singapore, Australia, Brazil, Canada, Japan, Mexico and the United States. This provides participants in the Formula 1 World Championship exceptional visibility on the world stage, and coverage now extends well beyond the range of conventional media with growing exposure on social networks.
Scuderia Ferrari has been racing in the Formula 1 World Championship since the series launched in 1950, and won its first Grand Prix in 1951. We are the only team that has competed in each season since launch and the oldest and most successful in the history of Formula 1, with 229 Grand Prix wins. Throughout our racing history, we have won 15 drivers’ championships and 16 constructors championships, more than any other team. Many of the best known drivers in the sport’s history have raced in Scuderia Ferrari’s distinctive red single-seaters including Alberto Ascari, Juan-Manuel Fangio, Niki Lauda, Gilles Villeneuve, Alain Prost and Michael Schumacher. Our drivers’ line-up currently comprises four-time World Champion Sebastian Vettel, who joined Ferrari at the beginning of 2015, and Kimi Raikkonen, now in his second term with the Scuderia Ferrari, for which he won the World Drivers title in 2007. Together, the two drivers have won a total of 67 Grands Prix.
The 2017 Formula 1 season was our most successful in the last seven years, with our team achieving five Grands Prix victories and five pole positions. In the Constructors’ Championship we achieved our best result since the current point system was implemented in 2010. Reorganization of the team and continuous research are part of an ongoing process aimed at further improving team performance in the future.
Participation in the Formula 1 World Championship is regulated by bilateral Team Agreements entered into between Formula 1 World Championship Limited (FOWC), the Formula 1’s commercial rights holder, and each competing Formula 1 racing team (including Ferrari) and by regulations issued by the Federation Internationale de l’Automobile (FIA), the motor sport’s governing body.
On January 23, 2017, Liberty Media Corporation completed the acquisition of all the shares of Delta Topco Limited, the holding company of FOWC. The bilateral Team Agreements will remain unaffected by the change of control. As a consequence of the change of control, Ferrari exercised the options it was granted pursuant to the Team Agreement and in February 2017 received approximately $11.4 million in cash (including $2.7 million of previously undistributed dividends), 145 thousand
44
Liberty Media Corporation shares (“Liberty Shares”) and $911 thousand of Liberty Media exchangeable notes. The Liberty Media exchangeable notes were subsequently converted to Liberty Media shares in November 2017.
The Team Agreements cover the 2013-2020 racing seasons and govern the terms by which the racing teams take their share of commercial profits. The FIA regulations regulate how the cars are manufactured and how the teams compete in races and include technical regulations governing aspects ranging from tires, weight to ignition, fueling and throttle requirements, and sporting regulations covering scoring and racing procedures. In return for their participation in Formula 1 races the teams receive a share of a prize fund based on the profits earned from Formula 1 related commercial activities managed by FOWC, including in particular, television broadcasting royalties and other sources, such as racetrack owners’ fees. Shares in a prize fund are paid to the teams, largely based on the relative ranking of each team in the championship. We use our share of these payments to defray part of the costs associated with Scuderia Ferrari, including the costs of designing and producing a set of single-seaters each year and the costs associated with managing a racing team including earnings of drivers, who generally are among the most highly paid athletes in the world. The terms under which racing teams may continue to participate in racing seasons following expiration of the current Team Agreements in 2020 are under discussion with the new owners of Formula 1 business. See “
Risk Factors - Our revenues from Formula 1 activities may decline and our related expenses may grow
.”
Improvements in technology and sometimes, changes in regulation, require the design and production of a new racing car every year. Therefore, in addition to our long-term research and development efforts, we begin designing our single-seaters each year in the Spring, in anticipation of the start of the racing season the following March. While the chassis we build each year are designed to be used throughout the racing season, the majority of other components fitted on our cars are adjusted from race to race depending on the characteristics of the circuits.
To maximize the performance, efficiency and safety of our single-seaters, while complying with the strict technical rules and restrictions set out by the FIA, our research and development team plays a key role in the development of our engines and cars. We often transfer technologies initially developed for racing to our road cars. Examples include steering wheel paddles for gearshifting, the use and development of composite materials, which makes cars lighter and faster, and technology related to hybrid propulsion.
Our road cars (especially our sports car models) have benefited from the know-how acquired in the wind tunnel by our racing car development teams, enjoying greater stability as they reach high speeds on and off the track. Our research and development team focused on combining minimal lap times with maximum efficiency, leading to advances in kinetic energy recovery system, or ERS, technology. Current advanced ERS feature two electric motor/generator units in every car, which allow the driver to recover, store and deploy energy generated both by the vehicle during braking and by the exhaust gases through a turbocharger. Building on our racing team’s expertise, we developed a hybrid ERS system for our LaFerrari and LaFerrari Aperta road cars.
The high brand visibility we achieve through participation in the Formula 1 World Championship has historically enabled us to benefit from significant sponsorships. Philip Morris International has been Scuderia Ferrari’s official sponsor for over forty years and, together with Shell (our official sponsor since 1996) remain our principal official sponsors. Banco Santander was also one of our official sponsors from 2008 until the end of 2017. Other official sponsors include Alfa Romeo, UPS, Kaspersky lab, Weichai, Hublot and Ray-Ban. Our official suppliers include, among others, Pirelli, Puma, Ray-Ban, IVECO, Mahle, NGK, Magneti Marelli and OMR. Visibility and placement of a sponsor’s logo reflects the level of sponsorship fees. Historically, our sponsors have sought advertising opportunities on the chassis of our cars, on clothes worn by our team members and drivers, and in the right to mention Ferrari in their marketing materials.
We use the platform provided by Formula 1 for a number of associated marketing initiatives, such as the hosting of clients and other key partners in the Scuderia Ferrari paddock to watch Grand Prix races, and our Formula 1 drivers participation in various promotional activities for our road cars. We often sell older single-seaters to clients for use in amateur racing or collection.
More generally, Formula 1 racing allows us to promote and market our brand and technology to a global audience without resorting to traditional advertising activities, therefore preserving the aura of exclusivity around our brand and limiting the marketing costs that we, as a company operating in the luxury industry, would otherwise incur.
The Mugello Circuit
We acquired the international Mugello circuit in Scarperia, near Florence, in 1988. We have renovated its buildings, 5.2 km race track and other testing and racing facilities, making Mugello what we believe to be one of the world’s finest circuits of its type, with FIA Grade 1 and FIM Grade A certifications, the highest level of homologation for a racetrack.
45
We promote the Mugello circuit to event organizers who regularly rent the circuit to host leading car and motorbike races, including the MotoGP World Championship since 1992. In 2017, almost 93,000 people attended the MotoGP World Championship at Mugello, a great attendance for the show.
In 2011, the Mugello circuit won its fifth “Best Grand Prix” award, the highest honor given by the motor sport world for MotoGP organizers. The Mugello circuit is the only track race to have received this award five times.
Brand Activities
Ferrari is one of the world’s leading luxury brands. We engage in brand development and protection activities through licensing contracts with selected partners, retail activities through a chain of franchised or directly managed stores, licensed theme parks and the development of a line of apparel and accessories sold exclusively in our monobrand stores and on our website
www.store.ferrari.com
.
Ferrari owns and manages two museums, one in Maranello and one in Modena, which attracted more than 530,000 visitors in 2017.
Licensing and Theme Parks
We enter into license agreements with a number of licensees for the design, development and production of Ferrari branded products.
We carefully select our licensees through a rigorous process and we contractually seek to ensure that our brand and intellectual property are protected and that the products which will eventually bear our brand are of adequate quality, appearance and market positioning.
The table below sets forth our current licensing mix.
|
Category
|
Principal Licensees
|
|
|
Accessories
|
o Luxottica (sunglasses)
o Tod’s (shoes and leather goods) |
|
|
Consumer electronics
|
o Various
|
|
|
Fragrances
|
o Perfume Holding
|
|
|
Sportswear
|
o Puma
|
|
|
Theme Parks
|
o Ferrari World, Abu Dhabi
o Ferrari Land, Port Aventura |
|
|
Toys
|
o Bburago (play-set)
o Lego (Lego toys) |
|
|
Video games
|
o Electronic Arts
o Microsoft
o Sony Polyphony o Ubisoft |
|
|
Watches
|
o Hublot (co-branded high-luxury watches)
o Movado (Scuderia Ferrari Watches)
|
|
|
Other (including collectors’ models, kid apparels, and accessories, stationary and credit cards)
|
o Various
|
|
A significant portion of our revenues from licensing activities consists of royalties we receive in connection with Ferrari World, our theme park in Abu Dhabi (13 percent of royalties generated by licensing activities). Ferrari World opened on Yas Island, on the North East side of Abu Dhabi’s mainland, in 2010. Ferrari World’s iconic sleek red roof is directly inspired by the classic double curve side profile of the Ferrari GT body, spanning 200,000 square meters and carrying the largest Ferrari logo ever created. Ferrari World Abu Dhabi offers an all-around Ferrari experience to children and adults alike. The attractions include futuristic 4D rides such as the child-friendly Speed of Magic and the world’s fastest roller-coaster, Formula Rossa, which reaches speeds of 240 km/h and simulates the breathtaking adrenaline rush of a Ferrari single-seater. New attractions like the roller-coaster Flying Aces, the children’s ride Benno’s Great Race and the Turbo Track vertical climbing accelerator have been opened in 2016 and 2017.
46
Our second theme park, Ferrari Land Portaventura, opened in April 2017 near Barcelona, and includes Red Force, the tallest and fastest roller-coaster in Europe. In the long-term we aim to open one theme park in each of the main geographic areas where we operate, including North America and Asia.
Retail and E-Commerce
Through our network of stores (franchised or directly managed), we offer a wide range of Scuderia Ferrari branded products, including a line of apparel and accessories exclusively sold in our stores and on our website. All products sold in our stores and on our website are either directly sourced from our selected network of suppliers or manufactured by our licensees.
At
December 31, 2017
, there were a total of 48 retail Ferrari stores, including those in Maranello, Milan, Rome, Macau, New York, Miami, Los Angeles, Johannesburg, Dubai and Abu Dhabi, of which
30
franchised stores (including
8
Ferrari Store Junior) and
18
stores owned and operated by us.
We require all franchisees to operate our monobrand stores according to our standards. Stores are designed, decorated, furnished and stocked according to our directions and specifications.
We use multiple criteria to select our franchisees, including know-how, financial condition, sales network and market access. Generally, we require that applicants meet certain minimum working capital requirements and have the requisite business facilities and resources. We typically enter into a standard franchising agreement with our franchisees. Pursuant to this agreement, the franchisee is authorized to sell our products exclusively at a suggested retail price. In exchange, we provide them with our products, the benefit of our marketing platform and association with our corporate identity.
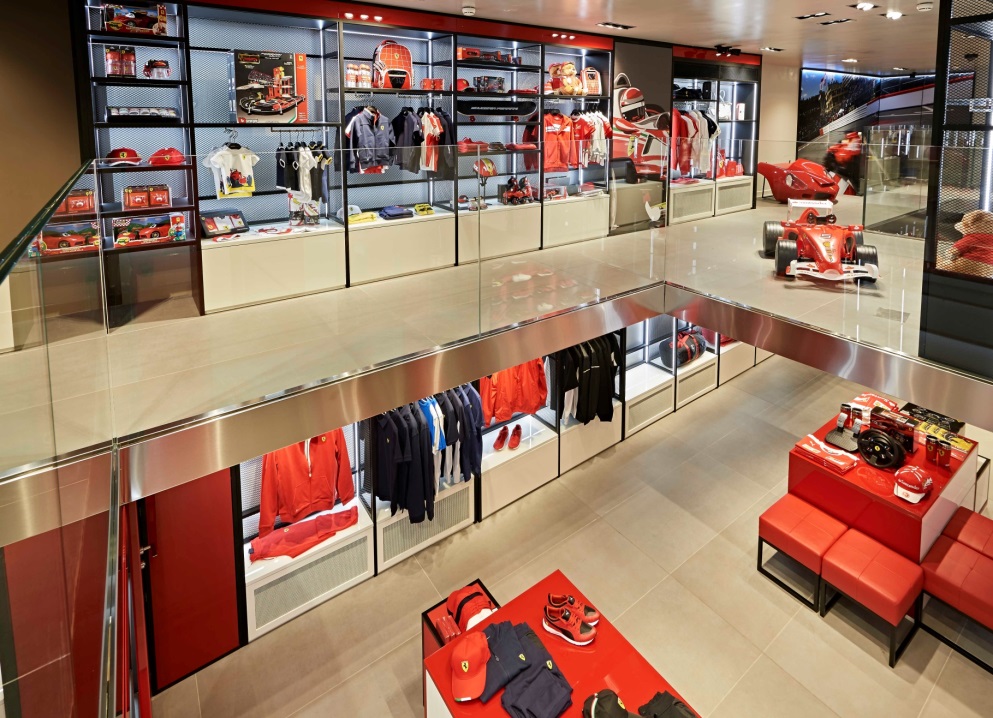
In recent years, e-commerce has proved to be an increasingly valuable sales channel, with over 490,000 registered users in more than 190 countries and translations in seven languages.
Design, Development and Manufacturing
Design
The design of our cars is an essential and distinctive component of our products and our brand. Our designers, modelers and engineers work together to create car bodies that incorporate the most innovative aerodynamic solutions in the sleek and powerful lines typical of our cars. The interiors of our cars seek to balance functionality, aesthetics and comfort. Our cockpits are designed to maximize the driving experience, more sporty or more comfortable, depending on the model through an ergonomic layout of all main controls clustered on the steering wheel, and our cars’ interiors boast elegant and sophisticated trims and
47
details. A guiding principle of our design is that each new model represents a clear departure from prior models and introduces new and distinctive aesthetic elements, delivering constant innovation within the furrow of tradition.
For the design of our cars we have relied historically on Italian coachbuilders such as Carrozzeria Touring, Vignale, Scaglietti and especially Pininfarina. The privileged partnership with Pininfarina, spanning over six decades, has helped define Ferrari’s design language and has established Ferrari at the forefront of design advance and excellence. Throughout the years this has been recognized repeatedly by a long series of awards being bestowed upon Ferrari road cars.
In 2010 we established the Ferrari Design Centre, our in-house design department, in order to improve our control over the design process and ensure long-term continuity of the Ferrari style. Its mission is to define and evolve the stylistic direction of the marque, imprinting all new products with a modern stamp, according to a futuristic, uncompromised vision. The name and logo “Ferrari Design” denotes all concepts and works from Ferrari Design Centre (see “
-Intellectual Property
”). Ferrari Design handles all aspects of automotive styling for the Ferrari road cars product range, encompassing the styling of all bodywork, external components and interior trim, applied to series production models for the GT and Sports car range special editions, limited editions, one-off models, concept cars and some track-only models. Ferrari Design also includes a color & trim team which handles the choice of materials and finishes for both exterior and interior trim and, in addition, is responsible for the Tailor Made program in conjunction with the product marketing department. Ferrari Design is also regularly involved with the styling and conceptual definition of Ferrari branded products produced by our licensees (see “
Brand Activities
”).
The department is organized as an integrated automotive design studio, employing a total workforce of approximately 90 people (both full-time workers and external contractors) including designers, 3D surfacing operators, physical modelers and graphic artists. It operates a modeling studio fully equipped with 5-axis milling machines with the capacity to develop various full-scale models (interior and exterior) in parallel.
Ferrari Design Centre entirely designed our most recent cars, such as the FXX K Evo, the Ferrari Portofino, the 812 Superfast, and also the GTC4Lusso, the GTC4Lusso T, the F12tdf, the 488 Spider, the 488 GTB, the 488 Challenge, the FXX K, the LaFerrari, the LaFerrari Aperta and the limited-series J50, while it designed other current range models, such as the F12berlinetta, in collaboration with Pininfarina. Although our collaboration with Pininfarina is still active with regard to certain special models and
fuori serie
, we expect that the design and development of most of our future models will be carried out primarily by Ferrari Design Centre.
During the 8 years of activity of the Ferrari Design Centre, our cars have been granted several renowned design awards, including, among the most recent:
|
•
|
812 Superfast
: Chicago Good Design Award (2017)
|
|
•
|
J50
: Red Dot Best of the Best (2017); Chicago Good Design Award (2017)
|
|
•
|
LaFerrari Aperta
: Honourable Mention - Sport, Performance and Innovation, International Compasso d’Oro Award (2017); Red Dot Design Award (2017)
|
|
•
|
GTC4Lusso
: iF Gold Design Award (2017); Red Dot Design Award (2017); Most Beautiful Supercar of the Year - International Automobile Festival Paris (2017); Chicago Good Design Award (2017)
|
|
•
|
458 MM Speciale
: iF Design Award (2017); Red Dot Design Award (2017)
|
|
•
|
488 GTB
: Red Dot Best of the Best (2016); iF Design Award (2016)
|
|
•
|
488 Spider
: iF Design Award (2016); Autonis Design Award (Auto Motor und Sport, D) - Beste Design - Neuheit: Cabrios (2016); Chicago Good Design Award (2016)
|
|
•
|
F12tdf
: Chicago Good Design Award (2016)
|
|
•
|
FXX K
: Red Dot Best of the Best (2015), iF Gold Award (2016); Compasso d’Oro ADI (2016)
|
|
•
|
LaFerrari
: Red Dot Design Award (2015); Best Cars - Coupé Category, Motor Presse Iberia Design of the Year (2015)
|
|
•
|
California T
: Red Dot Design Award (2015)
|
The new Ferrari Design Centre will be completed in Maranello in the first half of 2018. Sitting at the heart of the industrial complex, the new facility will cover more than 5,600 square meters distributed over four levels housing the main design office, a fully-equipped model making studio and a vast indoor/outdoor presentation space on the top floor. Additionally, the new building will host the Atelier and Tailor Made department to engage clients with Ferrari’s rich personalization services.
The architectural concept of the building aims to reflect the symbolic value of Ferrari’s advanced design process, drawing upon the interaction between digital technologies and the best Italian handmade craftsmanship tradition.
48
Product Development
Our product development process is highly structured with the aim of allowing us to respond quickly to market demand and technological breakthroughs and to maintain our position at the top end of the market for car performance and luxury. Our technology team is comprised of approximately 750 engineers and technicians at
December 31, 2017
. All of our cars are designed and engineered in Italy, at our factories in Maranello and Modena (Carrozzeria Scaglietti).
Our product development includes innovation programs, components programs and car programs, with regular management reviews and detailed cycle milestones. Our components programs are intended to ensure technological innovation and support the development of future models rather than to create an “off the shelf” catalog of available components.
All our cars are designed and manufactured based on two highly modular architectures incorporating front and mid-rear engines respectively. This allows for flexible manufacturing at low volumes and easy adaptation to different models with limited additional investment. Our architectures utilize a number of common structures, reducing tooling investment for new model production. When developing a new platform, we focus on innovation, leveraging on our collaboration with the select research centers and universities, and flexibility, allowing us to respond efficiently to potentially varied market demand. The flexibility of our platforms enables us to introduce our highly innovative contents on a wide range of models while, at the same time, reducing the fixed costs connected to the use of multiple platforms.
Consistent with our mission to develop cutting edge sports and GT cars, our product development efforts continually focus on improving core components, such as the powertrain, car dynamics, and the use of materials such as special aluminum alloys and carbon fiber (see “
—Design, Development and Manufacturing—Production Process
”).
The expertise we acquired in these fields has recently guided our efforts to combine improved performance with reductions in CO
2
emissions. In recent years, calls for CO
2
emissions reductions have come from regulatory initiatives as well as market demand. LaFerrari is an example of such efforts, and we believe it shows our ability to apply our core mechanical know-how to new and expanding fields such as hybrid technology.
Until 2017, we applied a development cycle for our range models which included “modified” or “M” models that incorporated certain elements of their predecessor models with relevant modifications not only for aesthetic updates but also for key technological improvements. As a result of the progressive implementation of a broadened and hybridized product portfolio we are converging our models into common platforms that will provide additional flexibility to manage propulsion systems and their subsequent evolution and will be aimed at targeting multiple elements such as weight reduction, increased performance, contents and technological adaptations in connection with market regulations.
We also run specific programs for our most critical components, independently from the development of new car models. This is the case of our engines, which we manufacture according to cycle milestones not necessarily connected with the release of a new car model. We have also been producing engines exclusively for Maserati. In 2011 we started the production of the F160 3.0-liter V6 Turbo, and since 2016 we also produce the F161 V6. In
2017
, we produced approximately 46,000 engines for Maserati. (See “
—Manufacturing of Engines for Maserati
”). Many of our components, such as those relating to transmission, power steering, navigation systems and the instrument cluster, are co-designed by us and our suppliers based on our specifications.
Our research and development operations constantly focus on innovating our cars’ concept and package, powertrains design, car architecture and components development. (See “
—Research and Development
”).
Procurement
We source a variety of components (including transmissions, brakes, driving-safety systems, navigation systems, mechanical, electrical and electronic, plastic components as well as castings and tires), raw materials (aluminum, and precious metals including palladium and rhodium), supplies, utilities, logistics and other services from numerous suppliers.
Our focus on excellence, in terms of luxury and performance, require us to select suppliers and partners that are able to meet our high standards. For the sourcing of certain key components with highly technological specifications, we have developed strongly synergic relationships with some of our suppliers, which we consider “key strategic innovation partners.” We currently rely on 14 key strategic innovation partners, including GETRAG and Brembo for the supply of transmissions and brakes respectively. We have also developed strong relationships with other industrial partners for bodyworks and chassis manufacturing and for powertrain and transmissions, among other things. Pursuant to our make-or-buy strategy, we generally retain production in-house whenever we have an interest in preserving or developing technological know-how or when we
49
believe that outsourcing would impair the efficiency and flexibility of our production process. Therefore, we continue to invest in the skills and processes required for low-volume production of components that we believe improve product quality.
For the year ended
December 31, 2017
, the purchases from our ten largest suppliers by value accounted for approximately 20
percent of total procurement costs, and no supplier accounted for more than ten percent of our total procurement costs.
We recognize the contribution of our suppliers to our success through various initiatives, including “Key Innovation Partners”, events devoted to Ferrari’s suppliers who displayed particular excellence or innovative flair.
Production Process
Our production facilities are located in Maranello and in Modena, Italy (see “Item 4.D.
Property, Plant, and Equipment
”). Our production processes include supply chain management, production and distribution logistics of cars in our range models and special series, as well as assembly of prototypes and avanseries.
Notwithstanding the low volumes of cars produced, our production process requires a great variety of inputs —over 40,000 product identifier codes sourced from approximately 1,000 total suppliers — entailing a complex supply chain management to ensure continuity of production. Our stock of supplies is warehoused in Ubersetto, near Maranello, and its management is outsourced to the logistics company Kuehne & Nagel.
Most of the manufacturing process takes place in Maranello, including aluminum alloy casting in our foundry, engine construction, mechanical machining, painting, car assembly, and bench testing; at our second plant in Modena (Carrozzeria Scaglietti) we manufacture our cars’ aluminum bodyworks. All parts and components not produced in house at Ferrari are sourced from our panel of suppliers (see “
—Procurement
”).
In recent years we have made significant investments in our manufacturing facilities, and between 2002 and 2012 the plants housing our production processes were entirely renovated or rebuilt. We plan our investment activities based on an estimated plant useful life of approximately 20 years. Equipment, on the other hand, may require substantial investment with the introduction of new models, particularly in the case of shell tools for the foundry, tools for machining, feature tools for body welding and special mounting equipment for the assembly.
At
December 31, 2017
, our production processes employed over 1,350 engineers, technicians and other personnel (approximately 1,230 blue collar employees including approximately 320 temporary production employees and approximately 120 white collar employees). We have a flexible production organization, which allows us to adjust production capacity to accommodate our expected production requirements. This is primarily due to the low volume of cars we produce per year and to our highly skilled and flexible employee base that can be deployed across various production areas. In addition, we can adjust our make-or-buy strategies to address fluctuations in the level of demand on our internal production resources. Our facilities can accommodate a meaningful increase in production compared to current output with the increase of weekend shifts to address special peaks in demand. Production could be increased even further with the introduction of a second shift on car assembly lines compared to the single shift currently operated. We constantly work to increase the utilization rate and reduce the internal scrap rate and we closely monitor an index of our production efficiency. In the past few years we have reduced our cycle time by approximately three percent per year. We are also committed to improve the reliability of our cars, reduce their defects, and optimize their finishing.
Unlike most low volume car producers, we operate our own foundry and machining department producing several of the main components of our engines, such as engine blocks, cylinders heads and crankshafts. We believe this accelerates product development and results in components that meet our specifications more closely.
Engine Production
Our engines are produced according to a vertical structure, from the casting of aluminum in our foundry up to the final assembly and testing of the engine. Several of the main components of our engines, such as blocks and cylinders heads are produced at our foundry in Maranello. For this purpose, we use a special aluminum alloy that includes seven percent silicon and a trace of iron, which improves mechanical integrity, and our own shell and sand casting molds. Once all components are ready, engines are assembled, on different lines for our V8 engines, V12 engines and for the V6 engines we manufacture for Maserati. The assembly process is a combination of automatic and manual operations. At the start of the assembly process, each engine is identified with a barcode and operations are recorded electronically. Every engine then goes to the test benches where its power and torque output are measured to ensure it delivers the expected performance. In 2017 we produced an average of
50
approximately 240 engines per day, including approximately 12 V12, 41 V8 (including 2 V8 turbo and 12 V8 aspirated for Maserati) and 187 V6 engines for Maserati (see “
—Manufacturing of Engines for Maserati
”).
Body Assembly
In parallel with the assembly of our engines, we prepare our body-shells at our panel shop Carrozzeria Scaglietti in Modena. The main components of body-shells are not manufactured internally but are sourced from manufacturers such as Officine Meccaniche Rezzatesi for chassis and Fontana Group and SuperForm for bodies. At Carrozzeria Scaglietti we have two different production lines dedicated to the assembly of our V8 and V12 aluminium bodies. We carefully check the alignment of the various parts —most importantly the engine cover and the wings —with electronic templates and gauges. Our highly trained specialists also perform surface controls to the aluminum panels and eliminate any imperfections by either filing or panel beating. In our Scaglietti plant we also have a dedicated line for the assembly of a special carbon fiber body for our supercar “LaFerrari Aperta”.
Painting
Our paint shop was inaugurated in 2004 with what we believe to be state-of-the-art technology. When transferred to our paint shop, the bodies are mounted on a loading bay, immersed in the cataphoresis tanks and subsequently transferred to a fixing gas fired oven at 140 degrees. Primers are then applied and fixed at 190 degrees until the completely grey body-shell is ready for painting. All body-shells are cleaned with automatic pressure blowers (to avoid the electrostatic effect) and carefully brushed with emu feathers (because of their natural electrostatic properties) to clean off any dirt particles or impurities before painting. The painting process is automated for the larger surfaces, while it is done by hand for some other localized areas. The whole car is painted at the same time to ensure color harmony. The bodies are finally polished with lacquer to fix the paint and give the bodies their final finish. In 2017 we substituted the robot which applies the base coat with a new generation robot to improve quality and technical efficiency.
Assembly Line and Final Checks
The final assembly of our cars takes place in our body-shop, built in 2008. We have two different lines placed at ground level and the first floor of the building. For each model, the initial assembly operations take place simultaneously on different lines and sections to maximize efficiency so while the body is assembled on the main line, the powertrain, as well as the cockpit and the doors, are prepared on a specific sub-line.
Personalization and Road Tests
During the process of assembly of our cars we manage the fitting of all bespoke interiors, components and special equipment options that our clients choose as part of our personalization program (see “
—Personalization Program and Tailor Made Program
”). After the assembly phase, every car completes a 40-kilometer road test-drive.
Finishing and Cleaning
After the road test all cars go to the finishing department. There, we thoroughly clean interior and exterior, check the whole car, polish and finish the bodies to give them their final appearance.
Manufacturing of Engines for Maserati
We have been producing engines for Maserati since 2003. The V8 engines that we historically produced and continue to produce for Maserati are variants of Ferrari families of engines and are mounted on Maserati’s highest performing models, such as the Quattroporte, Ghibli and Levante (turbo engines), and the Granturismo and the Grancabrio (aspirated engines). All of the V8 engines that we sell to Maserati are manufactured and assembled according to the same production processes we adopt for the V8s equipped on our cars (see “
-Production Process
”). In 2017, we sold approximately 340 V8 turbo engines and approximately 2,530 V8 aspirated engines to Maserati. In 2011 we began producing a family of engines exclusively for Maserati, in much larger production volumes to be installed on the Quattroporte and Ghibli (mainly the F160 3.0-liter V6 Turbo engines), and from 2016 we started the production of F161 engines to be installed on the Levante, Maserati’s SUV. We have a multi-year arrangement with Maserati to provide V6 engines, up to 2020. Under the framework agreement, Maserati is required to compensate us for certain costs we may incur, such as penalties from our suppliers, if there is a shortfall in the annual volume of engines actually purchased by Maserati in that year. In 2017, we sold approximately 43,000 V6 engines to Maserati in four different versions, ranging from 330 hp to 430 hp.
51
In order to meet the V6 volumes and specifications requirements, we built a dedicated assembly facility at Maranello with a much higher level of industrialization compared to production of our V12 and V8 engines. Due to the larger volumes and product specifications, our make-or-buy strategy for the production of F160 V6 and F161 V6 engines also differs from the strategy applicable to the production of Ferrari engines. The vast majority of the engine components are sourced externally from our panel of suppliers (see “
—Procurement
”) and then assembled in Maranello on our highly automatized V6 assembly line.
From the sale of engines to Maserati, we recorded net revenues of approximately €302 million in 2017.
Financial Services
We offer retail client financing for the purchase of our cars through Ferrari Financial Services (FFS) in our major markets, including the United States, as well as certain European markets through our associate Ferrari Financial Services GmbH (“FFS GmbH”). We also offer dealer financing through FFS in the United States. Until
December 2014
we offered dealer financing in the UK, Germany, Belgium and Switzerland and until May 2015 in Japan.
Through FFS, we offer a range of flexible, bespoke financial and ancillary services to clients (both new and current) interested in purchasing a wide range of cars, from our current product range of Sports and GT Cars, to older pre-owned models, to classic models, special series and competition cars, including retired Formula 1 single-seaters. FFS also provides special financing arrangements to a selected group of our most valuable and loyal customers.
In December 2014, we entered into a partnership with FGA Capital S.p.A. (now FCA Bank S.p.A. or FCA Bank), a 50/50 joint venture between FCA Italy S.p.A. and Crédit Agricole Consumer Finance S.A.; through this partnership financial services are provided to Ferrari dealers and customers in certain European countries. FCA Bank operates in 17 countries.
In May 2015, we entered into a partnership with JACCS Co., Ltd to support sales volume growth in the Japanese market with a full scale customer and dealer finance arrangement.
In light of our partnership with FCA Bank and JACCS Co., Ltd, and also due to changes to the banking and financial laws in Italy, we requested and obtained the cancellation of FFS from the list of regulated financial intermediaries in 2016.
In November 2016, FCA Bank acquired a majority stake in FFS GmbH for a total purchase price of €18.6 million. As a result of the transaction, FFS and FCA Bank will continue the operations of FFS GmbH as shareholders, supporting the sales of Ferrari cars in Germany, Great Britain and Switzerland and certain other European countries by offering innovative vehicle financing solutions to Ferrari customers. The funding of FFS GmbH has been provided by FCA Bank, which is also the consolidating entity.
At
December 31, 2017
, FFS’s portfolio of financial receivables was €733 million in aggregate, almost entirely in the Americas.
Research and Development
We engage in research and development activities aimed at improving the design, performance, safety, efficiency and reliability of our cars.
Our research and development center is in Maranello and, at
December 31, 2017
, included approximately 450
employees who are part of our broader technology team. Our personnel support product development efforts and have expertise in a number of disciplines, including mechanical, electrical, materials, computer science and chemical engineering.
We capitalized development costs of
€185 million
in
2017
,
€141 million
in
2016
, and
€154 million
in
2015
.
52
Research and development costs expensed during each period mainly include the research and development incurred for the Formula 1 racing activities to support the development of the sports and GT car models and prototypes, which are expensed as incurred. The following table summarizes our research and development expenditures in the years ended December 31,
2017
,
2016
and
2015
:
|
For the years ended December 31,
|
||||||||
|
2017
|
2016
|
2015
|
||||||
|
(€ thousand)
|
||||||||
|
Research and development costs expensed during the period
|
556,617
|
|
509,580
|
|
446,726
|
|
||
|
Amortization of capitalized development costs
|
100,502
|
|
104,055
|
|
114,856
|
|
||
|
Total research and development costs
|
657,119
|
|
613,635
|
|
561,582
|
|
||
We transfer technologies developed by our racing team to our Sports and GT models across all core vehicle development areas, such as aerodynamics, powertrain, and car dynamics. To that end, we also transfer research and development personnel between the Formula 1 team and the sports and GT cars team, and the two teams regularly join forces for ad-hoc projects in areas such as combustion engine, new materials or computational fluid dynamics for aerodynamic performance.
Vehicle Concept
Achieving the most efficient combination of lightweight materials and optimal weight distribution gives our cars their superior longitudinal and lateral driving dynamics. We employ a range of technologies to reduce car weight. For our range models we are currently developing an aluminum lightweight chassis and body, which is competitive with a carbon fiber chassis. For LaFerrari we are currently using state of the art carbon fiber technologies, which we developed in conjunction with our Formula 1 research and development team. We are currently developing a new architecture, aimed at further reducing car weight and increasing performance, and thus improving stiffness and reducing noise, vibration and harshness (NVH), among other things.
Powertrain
The powertrain is a core area of our research and development. As with other research and development areas, powertrain research benefits from a constant exchange between the Formula 1 team and designers of our Sports and GT cars.
Engines
Our V12 engines’ output ranges from 690 hp (in the GTC4 Lusso), to 780 hp (in the F12tdf), and up to 800 hp (in the LaFerrari Aperta). This range highlights our versatility in developing V12 aspirated engines, as there are no other carmakers which currently boast such specific high power ratios. With the California T and the 488 GTB, we transitioned from aspirated V8 engines to turbo charged engines. This allowed us to increase specific engine power more than 20 percent, while reducing emissions by up to eight percent. All Ferrari turbo engines are designed to have the same throttle response delivered by a naturally aspirated car. To achieve this goal we are investing in cutting edge turbo charging technologies (such as aluminum-titanium-alloys and ball bearings), with our strategic partner IHI.
To further improve efficiency with respect to emissions and performance we continuously improve on our engines, researching new materials with higher specifications for friction, thermal and mechanical stress. We are also investing in technologies that improve the combustion process, with research focusing on high pressure injection.
Transmissions
Our 7-shift double clutch gearbox is a core element of Ferrari powertrains. The architecture of the gearbox, combined with the shifting technologies developed by Ferrari, allow for one of the fastest and most performance orientated shifts on the market. The 488 GTB demonstrates the potential of this gearbox, reaching the 4th gear limiter in full acceleration in six seconds.
Vehicle dynamics
Suspension, braking systems and tires are key elements of vehicle dynamics. Our vehicle suspensions allow for a very rigid and direct force transmission which increases the response of the car, and we combine those with magnetorheological ride dampers. We continuously collaborate with our strategic partners in our effort to increase damper dynamics.
53
All Ferraris are equipped with carbon ceramic brakes, renowned for superior breaking performance. With the 458 Speciale we introduced a new generation of carbon ceramic brakes with even higher breaking performance and reduced weight, which have also been equipped on the F12tdf and we plan to introduce such brakes on our future sports cars.
Aerodynamics
We are constantly seeking to improve the aerodynamics of our models, working specifically on drag resistance and downforce.
We also use passive and active spoiler systems. Thanks to our collaboration with the racing team, who assist with calculations and testing, we believe we are able to develop innovative solutions in shorter timeframes.
Hybrid technology
With LaFerrari we developed not only a supercar with cutting edge engine performance and driving dynamics, but also a highly sophisticated hybrid car. In conjunction with our partner Magneti Marelli, we developed a compact electric power unit and DC/DC charger. The battery was developed in conjunction with our Formula 1 team, who has extensive know-how in high performance powertrains.
The LaFerrari project greatly expanded our knowledge of powertrain electrification and its implications on performance and efficiency. We actively work to improve performance and efficiency of electric powertrains and to extend the range of electric components in our cars (e.g. electric power steering).
We are undertaking an important program to understand the potential of hybrid technology and we are researching how to improve the performance and driving experience of our cars without losing fuel efficiency advantages.
We are working intensively to develop an efficient package introducing new electrified components. While maintaining the compactness of the car, we are also seeking to lower the weight as a low center of gravity is crucial not only to performance but also for maximizing the overall driving experience. In our research program we are also considering new technologies outside powertrain.
Intellectual Property
We own a number of design and utility patents and registered designs. We expect the number to grow as we continue to pursue technological innovations and to develop our design and brand activities.
We file patent applications in Europe, and around the world (including in the United States) to protect technology and improvements considered important to our business. No single patent is material to our business as a whole.
We also own a number of registered trademarks, designs and patents, including approximately 460 trademarks (word or figurative), registered in several countries and across a number classes. In particular, we ensure that the maximum level of protection is given to the following iconic trademarks, for which we own a total of approximately 4,500 applications/registrations in more than 128 countries, in most of the main classes for goods and services:
•
“Ferrari” (word)
•
“Ferrari” logotype:
54
•
the “Prancing Horse” (figurative):

•
the trademark (figurative):
•
the racing shield (figurative):

|
•
|
Scuderia Ferrari (word and figurative):
|

Our Sports and GT car models and Formula 1 single-seater models are also registered as trademarks (and logotypes) and we also register their designs and domain names.
The protection of intellectual property is also increasingly important in connection with our design and brand activities. Therefore, we adopt and follow internal processes and procedures to ensure both that all necessary protection is given to our intellectual property rights and that no third party rights are infringed by us. In addition, we are particularly active in seeking to limit any counterfeiting activities regarding our Ferrari branded products around the world. To reach this goal we closely monitor
55
trademark applications and domain names worldwide, actively interact with national and local authorities and customs and avail ourselves of a network of experienced outside counsels.
Regulatory Matters
We manufacture and sell our cars around the world and our operations are therefore subject to a variety of laws and regulations relating to environmental, health and safety and other matters. These laws regulate our cars, including their emissions, fuel consumption and safety, as well as our manufacturing facilities and operations, setting strict requirements on emissions, treatment and disposal of waste, water and hazardous materials and prohibitions on environmental contamination. Our vehicles, together with the engines that power them, must comply with extensive regional, national and local laws and regulations, and industry self-regulations (including those that regulate vehicle safety). However, we currently benefit from certain regulatory exemptions, because we qualify as a SVM or similar designation in most of the jurisdictions where we sell cars (including the United States). As outlined below, these exemptions provide a range of benefits, from less stringent emissions caps and compliance date extensions, to exemptions from zero emission vehicle production requirements.
We are in substantial compliance with the relevant regulatory requirements affecting our facilities and products around the world. We constantly monitor such requirements and adjust our operations as necessary to remain in compliance.
Greenhouse gas/CO
2
/fuel economy legislation
Current European legislation limits fleet average greenhouse gas emissions for new passenger cars to 130 grams of CO
2
per kilometer. This target, implemented gradually between 2012 and 2015, calls for 65 percent of the manufacturer’s newly registered cars to comply with the 130 grams limit in 2012, rising to 75 percent in 2013, 80 percent in 2014, and 100 percent from 2015 onwards. Due to our SVM status we benefit from a derogation from the 130 grams per kilometer emissions requirement available to small volume and niche manufacturers. Pursuant to that derogation, we are instead required to meet yearly CO
2
emissions targets, beginning in 2012, reaching a target level of 290 grams per kilometer in 2016 for our fleet of EU-registered vehicles that year. In 2015 we exceeded our alternative target and therefore we were required to pay a penalty of €411 thousand.
In 2014, the European Union set new 2020 emissions targets, calling for 95 percent of a manufacturer’s full fleet of new passenger cars registered in the EU in 2020 to average 95 grams of CO
2
per kilometer, rising to 100 percent of the fleet in 2021. The 2014 regulation extends the small volume and niche manufacturers derogation. Therefore, in December 2015, we submitted to the EU Commission our proposed CO
2
emissions target levels for the 2017-2021 period and the EU Commission approved our derogation in October 2016. Pursuant to that derogation, we are required to meet certain CO2 emissions target levels in the 2017-2021 period, reaching a target of 277 grams per kilometer in 2021 for our fleet of EU-registered cars that year.
In the United States, both Corporate Average Fuel Economy (“CAFE”) standards and greenhouse gas emissions (“GHG”) standards are imposed on manufacturers of passenger cars. Because the control of fuel economy is closely correlated with the control of GHG emissions, the United States Environmental Protection Agency (“EPA”) and the National Highway Traffic Safety Administration (“NHTSA”) have sought to harmonize fuel economy regulations with the regulation of GHG vehicle emissions (primarily CO
2
). These agencies have set the federal standards for passenger cars and light trucks to meet an estimated combined average fuel economy (CAFE) level that is equivalent to 35.5 miles per U.S. gallon for 2016 model year vehicles (250 grams CO
2
per mile). In August 2012, these agencies extended this program to cars and light trucks for model years 2017 through 2025, targeting an estimated combined average emissions level of 163 grams per mile in 2025, which is equivalent to 54.5 miles per gallon.
In November 2016, the EPA determined that the model years 2022-2025 standards, adopted by EPA in the 2012 final rule establishing the model year 2017-2025 standards, remain appropriate. In March 2017, EPA announced its intention to reconsider this decision, extending the review period for GHG standards definition.
In July 2017, the NHTSA published a notice of intent to prepare an Environmental Impact Statement (“EIS”) for Model Year 2022-2025 Corporate Average Fuel Economy standards, inviting stakeholders to provide comments. The EIS purpose is to define the potential environmental impacts of the Model Year 2022-2025 Fuel Economy standards and represents the first step of the rulemaking process relating to those model years.
For model years 2017-2025, the EPA allows a SVM, defined as manufacturers with less than 5,000 yearly unit sales in the United States, to petition for a less stringent standard. Based on our operational independence from FCA, the EPA has
56
granted us SVM status. We have therefore petitioned the EPA for alternative standards for the 2017-2021 model years, which are aligned to our technical and economic capabilities.
In September 2016, we petitioned NHTSA for recognition as an independent manufacturer of less than 10,000 vehicles produced globally, and we proposed alternative CAFE standards, for Model Year 2017, 2018 and 2019. In December, 2017, we amended the petition by proposing alternative CAFE standards for Model Year 2016, 2017 and 2018, covering also the 2016 Model Year. NHTSA have not yet responded to our petition. We will need in the future to file with NHTSA a petition for 2019-2020 and 2021 model years. If our petitions are rejected, we will not be able to benefit from the more favorable CAFE standards levels which we have petitioned for and this may require us to purchase additional CAFE credits in order to comply with applicable CAFE standards.
In February 2010, the California Air Resources Board (“CARB”) enacted regulations that deem manufacturers of vehicles for model years 2012-2016 which are in compliance with the EPA greenhouse gas emissions regulations to also be in compliance with California’s greenhouse gas emission regulations. In November 2012, the CARB extended these rules to include model years 2017-2025. In 2017 CARB performed a technical assessment regarding greenhouse gas standards for 2022 through 2025 Model Years, in parallel with EPA and NHTSA, the purpose of which is to verify whether the standards defined in 2012 can be still considered appropriate.
While Europe and the United States lead the implementation of these fuel consumption/CO
2
emissions programs, other jurisdictions typically follow on with adoption of similar regulations within a few years thereafter. In China, for example, Stage III fuel consumption regulations targeted a national average fuel consumption of 6.9L/100km by 2015 and Stage IV targets a national average fuel consumption of 5.0L/100km by 2020. In September 2017 the Chinese government issued the Administrative Measures on CAFC (Corporate Average Fuel Consumption) and NEV (New Energy Vehicle) Credits. This regulation establishes mandatory CAFC requirements, while providing additional flexibility for SVMs (less than 2,000 units/year imported in China) that achieve a certain minimum CAFC yearly improvement rate. Manufactures that exceed the CAFC regulatory ceiling are required to purchase NEV credits.
Exhaust and evaporative emissions requirements
In 2007, the European Union adopted the latest in a series of more-stringent standards for emissions of other air pollutants from passenger and light commercial vehicles, such as nitrogen oxides, carbon monoxide, hydrocarbons and particulates. These standards were phased in from September 2009 (Euro 5) and September 2014 (Euro 6) for passenger cars. In 2016, the European Union established that Euro 6 limits shall be evaluated through Real Driving Emissions (RDE) measurement procedure and a new test-cycle more representative of normal conditions of use (Worldwide Light Vehicles Test Procedure). These requirements became effective starting in 2017. SVMs (with a worldwide annual production lower than 10,000 units) are required to be compliant to RDE standards starting from 2020.
In April 2014, the “Tier 3” Motor Vehicle Emission and Fuel Standards issued by the EPA were finalized. With Tier 3, the EPA has established more stringent vehicle emission standards, requiring significant reductions in both tailpipe and evaporative emissions, including nitrogen oxides, volatile organic compounds, carbon monoxide and particulate matter. Beginning in 2017, the emission standards will be phased in and the requirement on fuel producers to reduce sulfur in gasoline will be effective. The new standards are intended to harmonize with California’s standards for 2015-2025 model years (so called “LEV3”) and will be implemented over the same timeframe as the U.S. federal CAFE and GHG standards for cars and light trucks described above. Because of our status as an operationally independent SVM, Ferrari obtained a longer, more flexible schedule for compliance with these standards under both the EPA and California Program.
In addition, California is moving forward with other stringent emission regulations for vehicles, including the Zero Emission Vehicle regulation (ZEV). The ZEV regulation requires manufacturers to increase their sales of zero emissions vehicles year on year, up to an industry average of approximately 15 percent of vehicles sold in the state by 2025. Because we currently sell fewer than 4,500 units in California, we are exempt from these requirements.
Additional stringency of evaporative emissions also requires more advanced materials and joints solutions to eliminate fuel evaporative losses, all for much longer warranty periods (up to 150,000 miles in the United States).
In response to severe air quality issues in Beijing and other major Chinese cities, in 2016 the Chinese government published a more stringent emissions program (National 6), providing two different level of stringency effective starting from 2020. Moreover autonomous regions and municipalities are allowed to implement in advance this more stringent requirement.
57
To comply with current and future environmental rules related to both fuel economy and pollutant emissions, we may have to incur substantial capital expenditure and research and development expenditure to upgrade products and manufacturing facilities, which would have an impact on our cost of production and results of operation.
Vehicle safety
Vehicles sold in Europe are subject to vehicle safety regulations established by the EU or by individual Member States. In 2009, the EU established a simplified framework for vehicle safety, repealing more than 50 directives and replacing them with a single regulation aimed at incorporating relevant United Nations standards. This incorporation process began in 2012. With respect to regulations on advanced safety systems, the EU now requires new model cars from 2011 on to have electronic stability control systems and tire pressure monitoring systems (beginning in 2012). Also introduced were regulations on low-rolling resistance tires. From April 2009, the criteria for whole vehicle type approval were extended to cover all new road vehicles, to be phased in over five years depending on the vehicle category. The framework is reviewed periodically, and a revised version of the General Safety Regulation is currently under discussion. As revised, the regulation would mandate new model cars to be compliant, among other things, with to Advanced Driver Assistance Systems (ADAS), pole side impact protection, full overlap frontal crash, small overlap crash requirements. In 2017 the EU published technical requirements for the Emergency Call (eCall) system, mandatory for new model cars starting from 2018.
Under U.S. federal law, all vehicles sold in the United States must comply with Federal Motor Vehicle Safety Standards (“FMVSS”) promulgated by the NHTSA. Manufacturers need to provide certification that all vehicles are in compliance with those standards. In addition, if a vehicle contains a defect that is related to motor vehicle safety or does not comply with an applicable FMVSS, the manufacturer must notify vehicle owners and provide a remedy at no cost to the consumer. Moreover, the Transportation Recall Enhancement, Accountability, and Documentation Act requires manufacturers to report certain information related to claims and lawsuits involving fatalities and injuries in the United States if alleged to be caused by their vehicles, and other information related to client complaints, warranty claims, and field reports in the United States, as well as information about fatalities and recalls outside the United States. Several new or amended FMVSSs will take effect during the next few years in certain instances under phase-in schedules that require only a portion of a manufacturer’s fleet to comply in the early years of the phase-in. These include an amendment to the side impact protection requirements that added several new tests and performance requirements (FMVSS No. 214), an amendment to roof crush resistance requirements (FMVSS No. 216), and a new rule for ejection mitigation requirements (FMVSS No. 226). Because of our status as SVM, Ferrari is required to be compliant at the end of the phase-in period. Under the Transportation Recall Enhancement, Accountability, and Documentation Act (“TREAD”), we must log certain information, including incidents involving death or injury, with the NHTSA. In 2014 we paid a $3.5 million civil penalty to the NHTSA for reporting failures related to the period 2011-2014 and for failure to comply with early warning reporting requirements in connection with three fatalities. We have upgraded our procedures for compliance.
On July 14, 2015, we issued a safety recall report with the NHTSA, after being notified by Takata Corporation that certain driver’s side airbags manufactured by Takata, installed in certain model year 2015 cars, were defective. The recall impacts 814 of our model year 2015 cars sold in the United States and also relates to up to an additional 1,600 model year 2015 cars in other regions. The defect, caused by pre-assembled airbags supplied by Takata, relates to insufficient gluing of the airbag cover and a possible incorrect installation of the driver’s airbag cushion. The replacement component has been produced with improved gluing methods as well as improved airbag assembly measures. We have implemented a recall to remedy this safety defect. In addition, Ferrari cars were included within the NHTSA Consent Order Amendment dated May 4, 2016 with Takata (the “Amended Consent Order”) due to a defect which may arise in the non-desiccated Takata passenger airbag inflators mounted on certain Ferrari cars. As a result of such Amended Consent Order, Ferrari filed a Part 573 Defect Information Report on May 23, 2016 with the NHTSA and has initiated a global recall relating to certain cars produced between 2008 and 2011. In December 2016, the NHTSA issued a Third Amendment to the Coordinated Remedy Order (“ACRO”) which included the list of Ferrari vehicles sold in the United States up to model year 2017 to be recalled. As a consequence of the ACRO, Ferrari has decided to extend the Takata global recall campaign to all vehicles worldwide mounting non-desiccated Takata passenger airbag inflators. In January 2017 Ferrari, in accordance with the Amended Consent Order and the ACRO, filed with the NHTSA a Part 573 Defect Information Report to include Model Year 2012 Zone A vehicles. In January 2018, Ferrari, in accordance with the Amended Consent Order and the ACRO, also filed with the NHTSA a Part 573 Defect Information Report to include Model Year 2013 Zone A vehicles. As a result of the ACRO and the decision to extend the worldwide Takata airbag inflator recall, Ferrari increased its provisions for the estimated charges for Takata airbag inflators recalls to €37 million in the year ended December 31, 2016 to cover the cost of the worldwide global Takata recall due to uncertainty of recoverability of the costs from Takata. At December 31, 2017 the provision amounted to €35 million.
In December 2015, we issued two safety calls reports with the NHTSA, after learning that certain low pressure fuel lines manufactured and supplied by Dytech — Dynamic Flued Technologies S.p.A. were defective. The recall impacts 185 California T vehicles and 119 488 GTB vehicles sold in the United States and 65 California T Vehicles and 199 488 GTB vehicles
58
sold in other regions. The defect was due to an improper coating treatment made by the supplier Dytech on the metallic part of the fuel pipe where it connects to the fuel pump. The replacement component has been produced with the proper coating. We have implemented a separate recall on each model to remedy this safety defect.
In 2016, the NHTSA published Phase II draft guidelines for driver distraction, for portable and aftermarket devices, and the associated compliance costs may be substantial. These guidelines, together with previously published Phase I provisions focus, among other things, on the need to modify the design of car devices and other driver interfaces to minimize driver distraction. Compliance with these new requirements, as well as other possible future NHTSA requirements, is likely to be difficult and/or costly. We are in the process of evaluating these guidelines and their potential impact on our results of operations and financial position and determining what steps and/or countermeasures, if any, we will need to make.
In 2017 Chinese authorities published the updated version of the current General Safety Regulation, becoming the driver market for the Event Data Recorder mandatory installation starting from 2021. Technical requirements will be defined through a dedicated standard within 2018.
59
C. Organizational Structure
Subsidiaries
The following table sets forth a list of the principal subsidiaries that are directly or indirectly controlled by Ferrari.
For each company, the following information is provided: name, country of residence, nature of business, the percentage interest held by Ferrari and its subsidiaries, and the percentage interest held by non-controlling interests at
December 31, 2017
.
Subsidiaries at
December 31, 2017
:
|
Name
|
Country
|
Nature of business
|
Shares held by the Group
|
Shares held by non-controlling interests
|
||||||
|
Directly held interests
|
||||||||||
|
Ferrari S.p.A.
|
Italy
|
Manufacturing
|
100
|
%
|
—
|
%
|
||||
|
Indirectly held through Ferrari S.p.A.
|
||||||||||
|
Ferrari North America Inc.
|
USA
|
Importer and distributor
|
100
|
%
|
—
|
%
|
||||
|
Ferrari Japan KK
|
Japan
|
Importer and distributor
|
100
|
%
|
—
|
%
|
||||
|
Ferrari Australasia Pty Limited
|
Australia
|
Importer and distributor
|
100
|
%
|
—
|
%
|
||||
|
Ferrari International Cars Trading (Shanghai) Co. L.t.d.
|
China
|
Importer and distributor
|
80
|
%
|
20
|
%
|
||||
|
Ferrari (HK) Limited
|
Hong Kong
|
Importer and distributor
|
100
|
%
|
—
|
%
|
||||
|
Ferrari Far East Pte Limited
|
Singapore
|
Service company
|
100
|
%
|
—
|
%
|
||||
|
Ferrari Management Consulting (Shanghai) Co. L.t.d.
|
China
|
Service company
|
100
|
%
|
—
|
%
|
||||
|
Ferrari South West Europe S.a.r.l.
|
France
|
Service company
|
100
|
%
|
—
|
%
|
||||
|
Ferrari Central East Europe GmbH
|
Germany
|
Service company
|
100
|
%
|
—
|
%
|
||||
|
G.S.A. S.A.
|
Switzerland
|
Service company
|
100
|
%
|
—
|
%
|
||||
|
Mugello Circuit S.p.A.
|
Italy
|
Racetrack management
|
100
|
%
|
—
|
%
|
||||
|
Ferrari Financial Services S.p.A.
|
Italy
|
Financial services
|
100
|
%
|
—
|
%
|
||||
|
Indirectly held through other Group entities
|
||||||||||
|
Ferrari Financial Services Inc.
(1)
|
USA
|
Financial services
|
100
|
%
|
—
|
%
|
||||
|
Ferrari Auto Securitization Transaction LLC
(2)
|
USA
|
Financial services
|
100
|
%
|
—
|
%
|
||||
|
Ferrari Auto Securitization Transaction - Lease, LLC
(2)
|
USA
|
Financial services
|
100
|
%
|
—
|
%
|
||||
|
Ferrari Financial Services Titling Trust
(2)
|
USA
|
Financial services
|
100
|
%
|
—
|
%
|
||||
|
Ferrari Auto Securitization Transaction - Select, LLC
(2)
|
USA
|
Financial services
|
100
|
%
|
—
|
%
|
||||
|
410, Park Display Inc.
(3)
|
USA
|
Retail
|
100
|
%
|
—
|
%
|
||||
______________________________
|
(1)
|
Shareholding held by Ferrari Financial Services S.p.A.
|
|
(2)
|
Shareholding held by Ferrari Financial Services Inc. (“FFS Inc”)
|
|
(3)
|
Shareholding held by Ferrari North America Inc.
|
The liquidation process of Ferrari North Europe Limited, which at December 31, 2016 was a wholly owned subsidiary, was completed in June 2017.
D. Property, Plant and Equipment
Our principal manufacturing facility is located in Maranello (Modena), Italy. It has an aggregate covered area of approximately 630 thousand square meters. Our Maranello plant hosts our corporate offices and most of the facilities we operate for the design, development and production of our Sports and GT cars, as well as of our Formula 1 single-seaters. (See “Item
60
4.B.
Business Overview—Design, Development and Manufacturing—Production Process
”). Except for some leased technical equipment, we own all of our facilities and equipment in Maranello.
Between 2003 and 2008 most of the buildings in Maranello, including the paint shop building and the production building, were either rebuilt or renovated. In 2015 we completed construction of the new building entirely dedicated to our Formula 1 team and racing activities, as well as the new wind tunnel 4WD.
Adjacent to the plant is our approximately 3,000 meter
Fiorano track, built in 1972 and remodeled in 1996. The track also houses the Formula 1 logistics offices. Additional facilities in Maranello include a product development center, a hospitality area and the Ferrari museum.
We also own the Mugello racing circuit in Scarperia, near Florence, which we rent to racing events organizers (see “Item 4.B.
Business Overview—Formula 1 Activities—The Mugello Circuit
”).
We own a second plant in Modena, named Carrozzeria Scaglietti. At this approximately 26 thousand square meter plant we manufacture aluminum bodyworks and chassis for our regular range, special series and prototype cars.
The total carrying value of our property, plant and equipment at December 31,
2017
was
€710,260 thousand
.
For information on our principal expenditures on property, plants and equipment, see “Item 5.B
Liquidity and Capital Resources-Capital Expenditures-Property, plant and equipment
”.
Not applicable.
61
MANAGEMENT’S DISCUSSION AND ANALYSIS OF FINANCIAL CONDITION AND RESULTS OF OPERATIONS OF THE GROUP
The following discussion of our financial condition and results of operations should be read together with the information included under
“
Item 3.A. Selected Financial Data,
”
“
Item 4. Information on the Company
”
and the Consolidated Financial Statements included elsewhere in this document. This discussion includes forward-looking statements, and involves numerous risks and uncertainties, including, but not limited to, those described under
“
Forward-Looking Statements
”
and the
“
Item 3.D. Risk Factors.
”
Actual results may differ materially from those contained in any forward-looking statements.
Overview
Ferrari is among the world’s leading luxury brands focused on the design, engineering, production and sale of the world’s most recognizable luxury performance sports cars. Our brand symbolizes, exclusivity, innovation, state-of-the-art sporting performance and Italian design and engineering heritage. Our name and history and the image enjoyed by our cars are closely associated with our Formula 1 racing team, Scuderia Ferrari, the most successful team in Formula 1 history. From the inaugural year of Formula 1 in 1950 through the present, Scuderia Ferrari has won 229 Grand Prix races, 16 Constructor World titles and 15 Drivers’ World titles. We believe our history of excellence, technological innovation and defining style transcends the automotive industry, and is the foundation of the Ferrari brand and image. We design, engineer and produce our cars in Maranello, Italy, and sell them in over
60
markets worldwide through a network of
164
authorized dealers operating
185
points of sale.
We believe our cars are the epitome of performance, luxury and styling. Our current product range consists of six range models, including three sports cars (488 GTB, 488 Spider and 812 Superfast) and three GT cars (GTC4Lusso, GTC4Lusso T and California T), one special series car (F12tdf) and one limited edition supercar (LaFerrari Aperta). We also produce very limited editions series (
fuori serie
) and one-off cars. The 812 Superfast was launched in February 2017 and the Ferrari Portofino, which is the successor of the California T (which is being phased out), was unveiled in September 2017 with shipments expected to begin in the second quarter of 2018. The LaFerrari Aperta was unveiled in September 2016 to celebrate our 70th anniversary in 2017.
In
2017
, we shipped
8,398
cars and recorded net revenues of
€3,417 million
, EBIT of
€775 million
, net profit of
€537 million
, earnings before interest, taxes, depreciation and amortization (EBITDA) of
€1,036 million
. For additional information regarding EBITDA, which is a non-GAAP measure, including a reconciliation of EBITDA to net profit, see “Item 5.
Operating and Financial Review—Non-GAAP Financial Measures.
”
We pursue a low volume production strategy whilst broadening our product portfolio to target a larger customer base in order to maintain a reputation of exclusivity and scarcity among purchasers of our cars and carefully manage our production volumes and delivery waiting lists to promote this reputation. We divide our regional markets into EMEA, Americas, China, Hong Kong and Taiwan (on a combined basis) and Rest of APAC, representing respectively
44.5 percent
,
33.5 percent
,
7.3 percent
and
14.7 percent
of units shipped in
2017
.
We license the Ferrari brand to a selected number of producers and retailers of luxury and lifestyle goods. In addition, we design, source and sell Ferrari-branded products through a network of
18
Ferrari-owned stores and
30
franchised stores (including
8
Ferrari Store Junior), as well as on our website. As one of the world’s most recognized premium luxury brands, we believe we are well positioned to selectively expand the presence of the Ferrari brand in attractive and growing lifestyle categories consistent with our image, including sportswear, watches, accessories, consumer electronics and theme parks which we believe enhance the brand experience of our loyal following of clients and Ferrari enthusiasts.
We focus our marketing and promotion efforts in the investments we make in our racing activities, in particular Scuderia Ferrari’s participation in the Formula 1 World Championship, which is one of the most watched annual sports series in the world, with over
350
million television viewers in 2017
(Source: FOM/Kantar Media 2017)
. Although our most recent Formula 1 world title was in 2008, we are enhancing our focus on Formula 1 activities with the goal of improving recent racing results and restoring our historical position as the premier racing team in Formula 1. We believe that these activities support the strength and awareness of our brand among motor enthusiasts, clients and the general public.
62
We will continue focusing our efforts on protecting and enhancing the value of our brand to preserve our strong financial profile and participate in the premium luxury market growth. We intend to selectively pursue controlled and profitable growth in existing and emerging markets while expanding the Ferrari brand to carefully selected lifestyle categories.
Trends, Uncertainties and Opportunities
Shipments
. Our results of operations depend on the achievement of shipment targets established in our budgets and business plans. One of the performance indicators we monitor is shipment volumes, which represent the number of cars we ship to third parties in a given period and which drive net revenues. We recognize revenues from car shipments once it is probable that the economic benefits associated with a transaction will flow to the Group and the revenue can be reliably measured. Revenue is recognized when the risks and rewards of ownership are transferred to our dealers, the sales price is agreed or determinable and collectability is reasonably assured; this generally corresponds to the date on which the cars are released to the carrier responsible for transporting them to dealers.
In general, our shipments do not vary based on changes in demand. Rather, we tend to ship based on volume targets we establish under our low volume strategy and growth objectives. As part of this strategy, we seek to manage waiting lists in the various markets in which we operate to respond appropriately to relative levels of demand while being sensitive to local client expectations in those markets. In certain markets, we believe that waiting lists have promoted our products’ sense of exclusivity; accordingly we monitor and manage such waiting lists to maintain such exclusivity while ensuring that we do not jeopardize client satisfaction.
In order to maintain a reputation of exclusivity among purchasers of our cars, we have continued our low volume strategy while responding to growing demand in emerging markets and demographic changes as the size and spending capacity of our target clients has grown, gradually increasing shipments from
7,664
in 2015 to
8,014
in 2016 and to
8,398
units in 2017. Our strategic business plan reflects a continuation of this strategy and a broadening of our product portfolio to target a larger customer base, with shipments increasing to over 9,000 units per year by 2018.
The following table sets forth our shipments by geographic location:
|
For the years ended December 31,
|
||||||||||||||||||
|
2017
|
%
|
2016
|
%
|
2015
|
%
|
|||||||||||||
|
EMEA
|
||||||||||||||||||
|
UK
|
843
|
|
10.0
|
%
|
769
|
|
9.6
|
%
|
740
|
|
9.7
|
%
|
||||||
|
Germany
|
710
|
|
8.5
|
%
|
675
|
|
8.4
|
%
|
595
|
|
7.8
|
%
|
||||||
|
Italy
|
417
|
|
5.0
|
%
|
364
|
|
4.5
|
%
|
285
|
|
3.7
|
%
|
||||||
|
France
|
346
|
|
4.1
|
%
|
306
|
|
3.8
|
%
|
274
|
|
3.6
|
%
|
||||||
|
Switzerland
|
339
|
|
4.0
|
%
|
333
|
|
4.2
|
%
|
340
|
|
4.4
|
%
|
||||||
|
Middle East
(1)
|
331
|
|
3.9
|
%
|
439
|
|
5.5
|
%
|
456
|
|
5.9
|
%
|
||||||
|
Other EMEA
(2)
|
751
|
|
9.0
|
%
|
724
|
|
9.1
|
%
|
661
|
|
8.6
|
%
|
||||||
|
Total EMEA
|
3,737
|
|
44.5
|
%
|
3,610
|
|
45.1
|
%
|
3,351
|
|
43.7
|
%
|
||||||
|
Americas
(3)
|
2,811
|
|
33.5
|
%
|
2,687
|
|
33.5
|
%
|
2,640
|
|
34.4
|
%
|
||||||
|
China, Hong Kong and Taiwan (on a combined basis)
|
617
|
|
7.3
|
%
|
619
|
|
7.7
|
%
|
610
|
|
8.0
|
%
|
||||||
|
Rest of APAC
(4)
|
1,233
|
|
14.7
|
%
|
1,098
|
|
13.7
|
%
|
1,063
|
|
13.9
|
%
|
||||||
|
Total
|
8,398
|
|
100.0
|
%
|
8,014
|
|
100.0
|
%
|
7,664
|
|
100.0
|
%
|
||||||
______________________________
(1)
Middle East includes the United Arab Emirates, Saudi Arabia, Bahrain, Lebanon, Qatar, Oman and Kuwait
(2)
Other EMEA includes Africa and the other European markets not separately identified
(3)
Americas includes the Unites States of America, Canada, Mexico, the Caribbean and Central and South America
(4)
Rest of APAC mainly includes Japan, Australia, Singapore, Indonesia and South Korea
63
We target our products to the upper end of the luxury car segment and buyers of our cars tend to belong to the wealthiest segment of the population. As the size and spending capacity of our target client base has grown significantly in recent years, our addressable market and the sense of exclusivity fostered by our low volume strategy have been further enhanced. In response, we have expanded our distribution capabilities and sought to rebalance the geographic distribution of shipments from several traditional markets, particularly in Europe, to growing markets such as China and other regions in Asia. For example, in 1993, 90 percent of our cars were sold in Italy, Germany and the United States; those markets now represent less than half of our unit shipments. Furthermore, the profitability of our cars may vary from market to market. Given that our shipment strategy is flexible, we are able to adjust shipment allocations across markets to respond to changes in our key markets.
Research, Development and Product Lifecycle
.
We engage in research and development activities aimed at improving the design, performance, safety, efficiency and reliability of our cars. The first stage of product development is the research phase. In this phase, we research the specifications of new models that we believe will appeal to our clients and will be commercially viable. Costs we incur for the development of cars and related components, engines and systems are recognized as an asset if, and only if, both of the following conditions under IAS 38 -
Intangible Assets
are met: that development costs can be measured reliably and that the technical feasibility of the product, volumes and pricing support the view that the development expenditure will generate future economic benefits. Capitalized development costs include all direct and indirect costs that may be directly attributed to the development process. Capitalized development costs are amortized on a straight-line basis from the start of production over the estimated lifecycle of the model and the useful life of the components (generally between four and eight years). All other research and development costs are expensed as incurred.
We also incur research and development expenses in connection with Formula 1 racing activities, including initiatives to maximize the performance, efficiency and safety of our racing cars. While we develop these technologies for initial use in our Formula 1 racing car, we seek to transfer these components and technologies, where appropriate, for use in our new models. Technological developments and changes in the regulations of the Formula 1 World Championship lead us to design, develop and construct a new racing car each year. Such costs are expensed in the income statement as incurred and classified as research and development costs. Research and development costs for Formula 1 activities can vary from year to year, often significantly, and may be difficult to predict because they are subject, among other things, to changes in race regulations and the need to respond to our car’s performance relative to other racing teams.
For the year ended December 31,
2017
, we capitalized development costs of
€185 million
and recognized amortization of capitalized development costs of
€101 million
(compared to
€141 million
and
€104 million
, respectively, for the year ended December 31,
2016
, and
€154 million
and
€115 million
, respectively, for the year ended December 31,
2015
).
For the year ended December 31,
2017
, we expensed research and development costs of
€556 million
(
€510 million
for
2016
and
€447 million
for
2015
).
Our results of operations are dependent on the comparative success of our product offering over time. Our range models typically have a lifecycle of four to five years, while our special series, supercars and limited edition cars typically have shorter lifecycles. A portion of our research and development efforts are related to the development of the various components used in our models, and in particular, electronic and mechanical components. Of the 2017 research and development costs, excluding Formula 1 activities, that were not eligible for capitalization, and as such were expensed, €45
million related to the research on components (€16 million for 2016 and €16 million for 2015), driven by innovation for hybrid technology. In 2017, we capitalized development costs relating to components of €52 million (€19 million for 2016 and €18 million for 2015). Our new models generally include new technology content, part of which is related to the output from the component research and development efforts. Our continued focus on component development has the objective of reducing the costs to develop new models.
Demand for our cars tends to be highest in the first year or two from a car’s launch, while in the latter two years demand is generally lower as our clients tend to focus on more recently introduced cars. We believe that our relatively short and predictable lifecycle supports both new car sales and the value of existing models both in the primary and resale markets. We also believe that this lifecycle ensures that our products remain responsive to the expectations of our clients. Our research and development expenditure (excluding Formula 1 research and development) is primarily affected by the timing of renewals to our product range and more recently, by our intention to integrate hybrid technology more broadly into our product portfolio. In particular, as a result of our strategy to update our product range and increase our efforts relating to hybrid technology, our research and development expenditure increased in 2017, and we expect this trend to continue in 2018. Consequently, we also expect amortization of capitalized development costs to increase in future periods.
64
Car Profitability
.
The relative profitability of the cars we sell tends to vary depending on a number of factors including engine size, exclusivity of the offering, content of the car and the geographic market in which it is sold. Our products equipped with V12 engines have historically commanded a higher price, and have therefore been more profitable than those equipped with the V8 engine. At
December 31, 2017
our V12 product offering included the LaFerrari Aperta, the F12tdf, the GTC4Lusso and the 812 Superfast, and our V8 product offering included the 488GTB, the 488 Spider, the GTC4Lusso T, the California T and the Ferrari Portofino. During part of the periods discussed below we also produced the LaFerrari, the F12berlinetta, the FF, the 458 Italia, the 458 Spider, the 458 Speciale and the 458 Speciale A, which are now discontinued.
Our total shipments (excluding shipments of the LaFerrari, the LaFerrari Aperta, the FXX K and the F60 America) represented by V12 models increased from 16.3 percent in 2015 to 18.3 percent in 2016, primarily driven by shipments of the F12tdf and the GTC4Lusso, which commenced in the fourth quarter of 2015 and the third quarter of 2016, respectively. V12 shipments further increased to 21.9 percent in 2017, primarily driven by shipments of the GTC4Lusso and the recently launched 812 Superfast, which commenced in the third quarter of 2017.
The exclusivity of a particular product offering is also a relevant factor in its profitability. For example, in November 2013, we launched the LaFerrari, a limited edition supercar with a limited production run of 499 units that was completed in 2016. The 500th LaFerrari was sold at auction for $7 million to benefit the reconstruction of Central Italy in the aftermath of the earthquakes of 2016. In light of the exclusivity of the offering, along with the “supercar” advanced technological and design content, the LaFerrari had a sales price in excess of €1 million, which is much higher than other models in the Ferrari product range. Therefore, our net revenues in 2015 and to a lesser extent in 2016, benefited significantly from shipments of the LaFerrari, which were completed in early 2016. In September 2016, we unveiled the LaFerrari Aperta, our latest limited edition supercar which, like the LaFerrari, is equipped with hybrid technology. The first shipments of the LaFerrari Aperta were in the third quarter of 2016. In general, more exclusive offerings generate higher net revenues and provide better margins than those generated on shipments of range models and special series cars. Similarly, our limited edition cars which we launch from time to time are typically sold at a significantly higher price point than our range models and therefore they benefit our results in the periods in which they are sold. We intend to schedule the launch and distribution of future models to minimize the volatility in financial performance due to the launch of our limited edition and supercars.
We seek to increase over time the average price point of our range models and special series by continually improving performance, technology and other features, and by leveraging the scarcity value resulting from our low volume strategy. In particular, we increased the price of selected models in selected markets from the fourth quarter of 2016 and in 2017 we introduced new models with higher average selling prices. Furthermore, the content of the cars we sell can be customized through our interior and exterior personalization program, which can be further enhanced through bespoke specifications. Incremental revenues from personalization are a particularly favorable factor of our pricing and product mix, due to the fact that we generate a margin on each additional option selected by the client. Additionally, as we integrate hybrid technology more broadly into our car portfolio, we expect our average price point to increase reflecting the more advanced technological content of the new hybrid models.
Maserati Engine Volumes
. We have been producing engines for Maserati since 2003. The V8 engines that we historically produced and continue to produce for Maserati are variants of Ferrari families of engines and are mounted on Maserati’s highest performing models. In 2011, we began producing a new family of V6 engines for Maserati for use in their cars. In order to meet our obligations under our agreement with Maserati, we constructed a new production line dedicated to the Maserati V6 engine, which was funded by Maserati.
Net revenues generated from the Maserati engine volumes depend on the orders received from Maserati, which in turn depend on Maserati production volumes. Net revenues from the sale of engines to Maserati were €302 million in 2017, €238 million in 2016 and €170 million in 2015. The increase in net revenues from Maserati engines from 2015 to 2017 was driven by an increase in orders received from Maserati and in particular, the Levante (Maserati’s SUV) and the Ghibli.
Cost of Sales
.
Cost of sales comprises expenses incurred in the manufacturing and distribution of cars and parts, including engines rented to other Formula 1 racing teams. Costs of materials, components and labor are the most significant elements of our cost of sales. The remaining costs principally include depreciation, amortization, insurance and transportation costs. Cost of sales also includes warranty, maintenance and product-related costs, which are estimated and recorded at the time of shipment of the car. Expenses that are directly attributable to our financial services companies, including the interest expenses related to their financing as a whole and provisions for risks and write-downs of assets, are also reported in cost of sales.
65
We purchase a variety of components (including mechanical, steel, aluminum, electrical and electronic, plastic components as well as casting and tires), raw materials (the most significant of which is aluminum) and supplies, and we incur costs of utilities, logistics and other services from numerous suppliers in the manufacture of our cars. Fluctuations in cost of sales are primarily related to the number of cars we produce and sell along with shifts in car mix. Newer models generally have more technologically advanced components and enhancements, including hybrid technology, and therefore have higher costs per unit; however we expect to price our future cars appropriately to recover such costs. Supercars and limited edition cars (
fuori serie
) also tend to have higher costs per unit but these higher costs tend to be more than offset by higher sales prices. Cost of sales are also affected, to a lesser extent, by fluctuations of certain raw material prices, although, we typically seek to manage these costs and minimize their volatility through the use of fixed price long-term purchase contracts.
In recent years, management has made efforts to achieve technical and commercial efficiencies. In particular, commercial efficiencies have been achieved through negotiating discounts where appropriate and entering into long-term contracts with suppliers, who commit upfront to passing on to us a portion of the efficiencies they achieve in performing our supply contract. Furthermore, efforts are made to award new business to existing suppliers, in order to negotiate favorable pricing. Technical efficiencies include efforts made to produce components using innovative, less expensive materials, without compromising the components’ performance. In order to achieve these technical efficiencies, we perform in-house research and development activities and we invite our suppliers to present us with solutions that they have developed.
As cost of sales also includes the depreciation of plant and equipment, cost of sales are affected by product launches, which trigger the commencement of depreciation of plant and equipment acquired specifically for the production of a certain model.
Effects of Foreign Currency Exchange Rates
. We are affected by fluctuations in foreign currency exchange rates (i) through translation of foreign currency financial statements into Euro on consolidation, which we refer to as the translation impact, and (ii) through transactions by entities in the Group in currencies other than their own functional currencies, which we refer to as the transaction impact.
Translation impacts arise in preparation of the consolidated financial statements; in particular, we present our consolidated financial statements in Euro, while the functional currency of each of our subsidiaries depends on the primary economic environment of that entity. In preparing the consolidated financial statements, we translate assets and liabilities measured in the functional currency of the subsidiaries into Euro using the foreign currency exchange rate prevailing at the balance sheet date, while we translate income and expenses using the average foreign currency exchange rates for the period covered. Accordingly, fluctuations in the foreign currency exchange rate of the functional currencies of our entities against the Euro impacts our results of operations.
Transaction impacts arise when our entities conduct transactions in currencies other than their own functional currency. We are therefore exposed to foreign currency risks in connection with scheduled payments and receipts in multiple currencies.
Our costs are primarily denominated in Euro, while our net revenues may be denominated in Euro, U.S. Dollars, Japanese Yen, Chinese Yuan or other currencies. In general, for the unhedged portion of our net revenues, an appreciation of the U.S. Dollar against the Euro would positively impact our net revenues and results of operations.
Our risk management policies contemplate the use of derivative financial instruments to hedge foreign currency exchange rate risk. In particular, we have used derivative financial instruments as cash flow hedges for the purpose of fixing the foreign currency exchange rate at which a predetermined proportion of forecasted transactions denominated in foreign currencies will be accounted for. Accordingly, our results of operations have not been fully exposed to fluctuations in foreign currency exchange rates. See “Item 11.
Quantitative and Qualitative Disclosures about Market Risk
” for information related to our foreign currency exchange rate risk policies after the Separation.
Regulation
.
We ship our cars throughout the world and are therefore subject to a variety of laws and regulations. These laws regulate our cars, including their emissions, fuel consumption and safety, and our manufacturing facilities. As we are currently a small volume manufacturer, in certain jurisdictions we benefit from certain regulatory exemptions, including less stringent emissions caps. Developing, engineering and producing cars which meet the regulatory requirements, and can therefore be sold in the relevant markets, requires a significant expenditure of resources.
Takata airbag inflator recalls.
On May 4, 2016, the United States National Highway Traffic Safety Administration (“NHTSA”) published an amendment (the “Amendment”) to the November 3, 2015 Takata Consent Order regarding Takata
66
airbags manufactured using non-desiccated Phase Stabilized Ammonium Nitrate (“PSAN”), expanding the scope of a prior recall under the Takata Consent Order. The recall is industry wide and replacement parts are limited as Takata is the single supplier.
In compliance with the Amendment to the Takata Consent Order, on May 16, 2016, Takata submitted a defect information report (“DIR”) to NHTSA declaring the non-desiccated PSAN airbag inflators, including those sold by Takata to the Group, defective.
Although we are not aware of any confirmed incidents or warranty claims relating to such airbag inflators mounted in our cars or that the airbag inflators were not performing as designed, as a result of the Amendment issued by NHTSA and the DIR issued by Takata, we initiated a global recall relating to certain cars produced between 2008 and 2011. Following a Third Amendment to the Coordinated Remedy Order (“ACRO”) published by NHTSA in December 2016 and an additional Takata DIR filed on January 3, 2017, we filed an additional DIR on January 10, 2017 to also include certain cars produced in 2012.
As a result of internal assessments, in 2016 we decided to extend the recall campaign to include all cars produced in all model years based on priority groups and the timeline set by NHTSA.
As a result of these developments and due to the uncertainty of recoverability of the costs from Takata, an aggregate provision of €37 million was recognized within cost of sales in the year ended December 31, 2016.
At December 31, 2017, the provision amounted to €35 million. Such provision reflects the current best estimate for future costs related to the entire recall campaign to be carried out by the Group.
Due to the significant scope and industry-wide nature of the Takata recall and the supply constraints of Takata, the charges for Takata airbag inflator recalls are considered to be “significant in nature but expected to incur infrequently” and therefore Ferrari has excluded these charges in the calculation of Adjusted EBITDA, Adjusted EBIT, Adjusted Net Profit and Adjusted Basic and Diluted Earnings per Common Share for 2016.
Sale of a majority stake in FFS GmbH
.
On November 7, 2016, we finalized an agreement with FCA Bank to provide financial services in Europe, under which FCA Bank acquired a majority stake in FFS GmbH from us for a purchase price of €18.6 million, which we received upon sale. In addition to the purchase price, as a result of the funding of FFS GmbH being directly provided by FCA Bank, which is the consolidating entity of FFS GmbH following the transaction, the Group also received cash of €432 million.
Upon completion of the transaction, FFS GmbH was deconsolidated and the 49.9 percent interest in FFS GmbH retained
by the Group is accounted for using the equity method. As a result, we will recognize our proportionate share of the future profits
or losses of FFS GmbH in the consolidated income statement within the line item “result from investments”.
Securitizations.
In 2016 we pursued a strategy of self-financing for our financial services business in the United States,
further reducing dependency on intercompany funding and increasing the portion of self-liquidating debt with various securitization transactions.
See “Net Debt and Net Industrial Debt” for additional details.
Debt repayments and bonds issuances
.
In March 2016, we fully repaid the €500 million Bridge Loan, primarily using proceeds from the €500 million inaugural bond (“2023 Bond”) we issued in March 2016. Also in 2016, we made voluntary prepayments and mandatory scheduled repayments on the Term Loan totaling €700 million. The Term Loan was fully repaid in 2017, primarily with proceeds from the €700 million principal bond (“2021 Bond”) we issued in November 2017. See
“Net Debt and Net Industrial Debt”
for additional details.
Equity incentive plan.
Following the approval of the equity incentive plan by the Board of Directors on March 1, 2017, on April 14, 2017 our Shareholders approved an award to our Chief Executive Officer under our equity incentive plan, which is applicable to all Group Executive Council (“GEC”) members and key leaders. Under our equity incentive plan, an aggregate of approximately
687 thousand
performance share units (“PSUs”) and an aggregate of approximately
119 thousand
restricted share units (“RSUs”) have been awarded. The grants of the PSUs and the RSUs, each representing the right to receive one common share, cover a
five
-year performance period from 2016 to 2020, consistent with our strategic horizon.
67
At December 31, 2017, we recognized a cumulative amount of
€28.2 million
as an increase to other reserves in equity for the PSU awards and RSU awards and had unrecognized compensation expense of approximately
€26.1 million
, which will be recognized over the remaining vesting period until 2020.
Critical Accounting Estimates
The Consolidated Financial Statements are prepared in accordance with IFRS which require the use of estimates, judgments and assumptions that affect the carrying amount of assets and liabilities, the disclosure of contingent assets and liabilities and the amounts of income and expenses recognized. The estimates and associated assumptions are based on elements that are known when the financial statements are prepared, on historical experience and on any other factors that are considered to be relevant.
The estimates and underlying assumptions are reviewed periodically and continuously by us. If the items subject to estimates do not perform as assumed, then the actual results could differ from the estimates, which would require adjustment accordingly. The effects of any changes in estimate are recognized in the consolidated income statement in the period in which the adjustment is made, or prospectively in future periods.
The items requiring estimates for which there is a risk that a material difference may arise in respect of the carrying amounts of assets and liabilities in the future are discussed below.
Recoverability of non-current assets with definite useful lives
Non-current assets with definite useful lives include property, plant and equipment and intangible assets. Intangible assets with definite useful lives mainly consist of capitalized development costs.
We periodically review the carrying amount of non-current assets with definite useful lives when events and circumstances indicate that an asset may be impaired. Impairment tests are performed by comparing the carrying amount and the recoverable amount of the cash-generating unit (“CGU”). The recoverable amount is the higher of the CGU’s fair value less costs of disposal and its value in use. In assessing the value in use, the estimated future cash flows are discounted to their present value using a pre-tax discount rate that reflects current market assessments of the time value of money and the risks specific to the CGU.
For the period covered by the Consolidated Financial Statements, we have not recognized any impairment charges for non-current assets with definite useful lives.
Recoverability of goodwill
Our goodwill at December 31, 2017 amounted €785 million and primarily relates to the Separation, as a result of which the Company recorded goodwill of €781 million reflecting FCA’s recorded goodwill relating to Ferrari S.p.A. In accordance with
IAS 36 - Impairment of Assets
, goodwill is not amortized and is tested for impairment annually or more frequently if facts or circumstances indicate that the asset may be impaired.
As the Group is composed of one operating segment, goodwill is tested at the Group level which represents the lowest level within the Group at which goodwill is monitored for internal management purposes in accordance with IAS 36. The impairment test is performed by comparing the carrying amount (which mainly comprises property, plant and equipment, goodwill and capitalized development costs) and the recoverable amount of the CGU. The recoverable amount of the CGU is the higher of its fair value less costs of disposal and its value in use.
For the period covered by the Consolidated Financial Statements, we have not recognized any impairment charges for goodwill.
Development costs
Development costs are capitalized if the conditions under
IAS 38 - Intangible Assets
have been met. The starting point for capitalization is based upon the technological and commercial feasibility of the project, which is usually when a product development project has reached a defined milestone according to our established product development model. Feasibility is
68
based on management’s judgment which is formed on the basis of estimated future cash flows. Capitalization ceases and amortization of capitalized development costs begins on start of production of the relevant project.
The amortization of development costs requires management to estimate the lifecycle of the related model. Any changes in such assumptions would impact the amortization charge recorded and the carrying amount of capitalized development costs. The periodic amortization charge is derived after determining the expected lifecycle of the related model and, if applicable, any expected residual value at the end of its life. Increasing an asset’s expected lifecycle or its residual value would result in a reduced amortization charge in the consolidated income statement.
The useful lives and residual values of our models are determined by management at the time of capitalization and reviewed annually for appropriateness and recoverability. The lives are based on historical experience with similar assets as well as anticipation of future events which may impact their life, such as changes in technology. Historically, changes in useful lives and residual values have not resulted in material changes to the amortization charge or estimated recoverability of the related assets.
For the year ended
December 31, 2017
, we capitalized development costs of
€185 million
(
€141 million
for the year ended
December 31, 2016
).
Product warranties liabilities
We establish reserves for product warranties at the time the sale is recognized. We issue various types of product warranties under which the performance of products delivered is generally guaranteed for a certain period or term, which is generally defined by the legislation in the country where the car is sold. The reserve for product warranties includes the expected costs of warranty obligations imposed by law or contract, as well as the expected costs for policy coverage. The estimated future costs of these actions are principally based on assumptions regarding the lifetime warranty costs of each car line and each model year of that car line, as well as historical claims experience for our cars. In addition, the number and magnitude of additional service actions expected to be approved, and policies related to additional service actions, are taken into consideration. Due to the uncertainty and potential volatility of these estimated factors, changes in the assumptions used could materially affect the results of operations.
We periodically initiate voluntary service actions to address various client satisfaction, safety and emissions issues related to cars sold. Included in the reserve is the estimated cost of these services and recall actions. The estimated future costs of these actions are based primarily on historical claims experience for our cars and the cost of parts and services to be incurred in the specified activities, and are recognized at the time when they are probable and reasonably estimable. Estimates of the future costs of these actions are inevitably imprecise due to several uncertainties, including the number of cars affected by a service or recall action. It is reasonably possible that the ultimate cost of these service and recall actions may require us to make expenditures in excess of (or less than) established reserves over an extended period of time. The estimate of warranty and additional service obligations is periodically reviewed during the year.
In addition, we make provisions for estimated product liability costs arising from property damage and personal injuries including wrongful death, and potential exemplary or punitive damages alleged to be the result of product defects. By nature, these costs can be infrequent, difficult to predict and have the potential to vary significantly in amount. Costs associated with these provisions are recorded in the consolidated income statement and any subsequent adjustments are recorded in the period in which the adjustment is determined.
Share-based compensation
We account for our equity incentive plan in accordance with IFRS 2 -
Share-based Payment,
which requires the recognition of share-based compensation expense based on the fair value of the awards granted. Share-based compensation for equity-settled awards containing market performance conditions is measured at the grant date of the awards using the Monte Carlo simulation model, which requires the input of subjective assumptions, including the expected volatility of our common stock, the dividend yield, interest rates and the correlation coefficient between our common stock and the relevant market index. The probability that the Group will achieve a certain level of Total Shareholder Return performance compared to the defined peer group is also considered. As a result, at the grant date management is required to make key assumptions and estimates regarding conditions that will occur in the future, which inherently involves uncertainty. Therefore, the amount of share-based compensation recognized has been effected by the significant assumptions and estimates used.
69
Other contingent liabilities
We make provisions in connection with pending or threatened disputes or legal proceedings when it is considered probable that there will be an outflow of funds and when the amount can be reasonably estimated. If an outflow of funds becomes possible but the amount cannot be estimated, the matter is disclosed in the notes to the Consolidated Financial Statements. We are the subject of legal and tax proceedings covering a wide range of matters in various jurisdictions. Due to the uncertainty inherent in such matters, it is difficult to predict the outflow of funds that could result from such disputes with any certainty. Moreover, the cases and claims against us often derive from complex legal issues which are subject to a differing degree of uncertainty, including the facts and circumstances of each particular case and the manner in which applicable law is likely to be interpreted and applied to such fact and circumstances, and the jurisdiction and the different laws involved. We monitor the status of pending legal proceedings and consult with experts on legal and tax matters on a regular basis. It is therefore possible that the provisions for our legal proceedings and litigation may vary as the result of future developments in pending matters.
Litigation
Various legal proceedings, claims and governmental investigations are pending against us on a wide range of topics, including car safety, emissions and fuel economy, early warning reporting, dealer, supplier and other contractual relationships, intellectual property rights and product warranty matters. Some of these proceedings allege defects in specific component parts or systems (including airbags, seatbelts, brakes, transmissions, engines and fuel systems) in various car models or allege general design defects relating to car handling and stability, sudden unintended movement or crashworthiness. These proceedings seek recovery for damage to property, personal injuries or wrongful death and in some cases could include a claim for exemplary or punitive damages. Adverse decisions in one or more of these proceedings could require us to pay substantial damages, or undertake service actions, recall campaigns or other costly actions.
Litigation is subject to many uncertainties, and the outcome of individual matters is not predictable with assurance. An accrual is established in connection with pending or threatened litigation if a loss is probable and a reliable estimate can be made. Since these accruals represent estimates, it is reasonably possible that the resolution of some of these matters could require us to make payments in excess of the amounts accrued. It is also reasonably possible that the resolution of some of the matters for which accruals could not be made may require us to make payments in an amount or range of amounts that could not be reasonably estimated.
The term “reasonably possible” is used herein to mean that the chance of a future transaction or event occurring is more than remote but less than probable. Although the final resolution of any such matters could have a material effect on our operating results for the particular reporting period in which an adjustment of the estimated reserve is recorded, it is believed that any resulting adjustment would not materially affect our consolidated financial position.
70
Non-GAAP Financial Measures
We monitor and evaluate our operating and financial performance using several non-GAAP financial measures including: EBITDA, Adjusted EBITDA, Adjusted EBIT, Adjusted Net Profit, Adjusted Basic and Diluted Earnings per Common Share, Net Debt, Net Industrial Debt, Free Cash Flow and Free Cash Flow from Industrial Activities, as well as a number of financial metrics measured on a constant currency basis. We believe that these non-GAAP financial measures provide useful and relevant information regarding our performance and our ability to assess our financial performance and financial position. They also provide us with comparable measures that facilitate management’s ability to identify operational trends, as well as make decisions regarding future spending, resource allocations and other operational decisions. While similar measures are widely used in the industry in which we operate, the financial measures we use may not be comparable to other similarly titled measures used by other companies nor are they intended to be substitutes for measures of financial performance or financial position as prepared in accordance with IFRS.
EBITDA and Adjusted EBITDA
EBITDA is defined as net profit before income tax expense, net financial expenses and amortization and depreciation. Adjusted EBITDA is defined as EBITDA as adjusted for income and costs that are significant in nature but expected to occur infrequently. The following table sets forth the calculation of EBITDA and Adjusted EBITDA for the years ended
December 31, 2017
,
2016
and
2015
, and provides a reconciliation of these non-GAAP measures to net profit. EBITDA is presented by management to aid investors in their analysis of the performance of the Group and to assist investors in the comparison of the Group’s performance with that of other companies. Adjusted EBITDA is presented to demonstrate how the underlying business has performed prior to the impact of the adjusted items which may obscure underlying performance and impair comparability of results between periods.
|
|
For the years ended December 31,
|
||||||||
|
|
2017
|
2016
|
2015
|
||||||
|
|
(€ million)
|
||||||||
|
Net profit
|
537
|
|
400
|
|
290
|
|
|||
|
Income tax expense
|
209
|
|
167
|
|
144
|
|
|||
|
Net financial expenses
|
29
|
|
28
|
|
10
|
|
|||
|
Amortization and depreciation
|
261
|
|
248
|
|
275
|
|
|||
|
EBITDA
|
1,036
|
|
843
|
|
719
|
|
|||
|
Charges for Takata airbag inflator recalls
|
—
|
|
37
|
|
—
|
|
|||
|
Expenses incurred in relation to the IPO
|
—
|
|
—
|
|
16
|
|
|||
|
Employees extra bonus
|
—
|
|
—
|
|
19
|
|
|||
|
Gain recognized on disposal of investment property assets and liabilities
|
—
|
|
—
|
|
(6
|
)
|
|||
|
Adjusted EBITDA
|
1,036
|
|
880
|
|
748
|
|
|||
71
Adjusted EBIT
Adjusted EBIT represents EBIT as adjusted for income and costs that are significant in nature but expected to occur infrequently. We present such information in order to present how the underlying business has performed prior to the impact of such items, which may obscure underlying performance and impair comparability of results between the periods. The following table sets forth the calculation of Adjusted EBIT for the years ended
December 31, 2017
,
2016
and
2015
.
|
|
For the years ended December 31,
|
||||||||
|
|
2017
|
2016
|
2015
|
||||||
|
|
(€ million)
|
||||||||
|
EBIT
|
775
|
|
595
|
|
444
|
|
|||
|
Charges for Takata airbag inflator recalls
|
—
|
|
37
|
|
—
|
|
|||
|
Expenses incurred in relation to the IPO
|
—
|
|
—
|
|
16
|
|
|||
|
Employees extra bonus
|
—
|
|
—
|
|
19
|
|
|||
|
Gain recognized on disposal of investment property assets and liabilities
|
—
|
|
—
|
|
(6
|
)
|
|||
|
Adjusted EBIT
|
775
|
|
632
|
|
473
|
|
|||
Adjusted Net Profit
Adjusted Net Profit represents net profit as adjusted for income and costs (net of tax effect), which are significant in nature, but expected to occur infrequently. The tax effect is calculated by applying the corporate tax rate in Italy, which was 24.0% for the year ended
December 31, 2017
and 27.5% for the years ended December 31,
2016
and
2015
, and the Italian Regional Income Tax (“IRAP”), which was 3.9% for the periods presented. We present such information in order to present how the underlying business has performed prior to the impact of such items, which may obscure underlying performance and impair comparability of results between the periods. The following table sets forth the calculation of Adjusted Net Profit for the years ended
December 31, 2017
,
2016
and
2015
.
|
For the years ended December 31,
|
|||||||||
|
2017
|
2016
|
2015
|
|||||||
|
(€ million)
|
|||||||||
|
Net profit
|
537
|
|
400
|
|
290
|
|
|||
|
Charges for Takata airbag inflator recalls (net of tax effect)
|
—
|
|
25
|
|
—
|
|
|||
|
Expenses incurred in relation to the IPO (net of tax effect)
|
—
|
|
—
|
|
11
|
|
|||
|
Employees extra bonus (net of tax effect)
|
—
|
|
—
|
|
13
|
|
|||
|
Gain recognized on disposal of investment property assets and liabilities (net of tax effect)
|
—
|
|
—
|
|
(4
|
)
|
|||
|
Adjusted Net Profit
|
537
|
|
425
|
|
310
|
|
|||
72
Adjusted Basic and Diluted Earnings per Common Share
Adjusted Basic and Diluted Earnings per Common Share represents earnings per share, as adjusted for income and costs (net of tax effect), which are significant in nature, but expected to occur infrequently. The tax effect is calculated by applying the corporate tax rate in Italy, which was 24.0% for the year ended
December 31, 2017
and 27.5% for the years ended December 31,
2016
and
2015
, and the Italian Regional Income Tax (“IRAP”), which was 3.9% for the periods presented. We present such information in order to present how the underlying business has performed prior to the impact of such items, which may obscure underlying performance and impair comparability of results between the periods. The following table sets forth the calculation of Adjusted Basic and Diluted Earnings per Common Share for the years ended
December 31, 2017
,
2016
and
2015
.
|
For the years ended December 31,
|
|||||||||||
|
2017
|
2016
|
2015
|
|||||||||
|
Net profit attributable to owners of the Company
|
€ million
|
535
|
|
399
|
|
288
|
|
||||
|
Charges for Takata airbag inflator recalls (net of tax effect)
|
€ million
|
—
|
|
25
|
|
—
|
|
||||
|
Expenses incurred in relation to the IPO (net of tax effect)
|
€ million
|
—
|
|
—
|
|
11
|
|
||||
|
Employees extra bonus (net of tax effect)
|
€ million
|
—
|
|
—
|
|
13
|
|
||||
|
Gain recognized on disposal of investment property assets and liabilities (net of tax effect)
|
€ million
|
—
|
|
—
|
|
(4
|
)
|
||||
|
Adjusted profit attributable to owners of the Company
|
€ million
|
535
|
|
424
|
|
308
|
|
||||
|
Weighted average number of common shares
|
thousand
|
188,951
|
|
188,923
|
|
188,923
|
|
||||
|
Adjusted basic earnings per common share
|
€
|
2.83
|
|
2.25
|
|
1.63
|
|
||||
|
Weighted average number of common shares for diluted earnings per common share
|
thousand
|
189,759
|
|
188,946
|
|
188,923
|
|
||||
|
Adjusted diluted earnings per common share
(1)
|
€
|
2.82
|
|
2.24
|
|
1.63
|
|
||||
_____________________________
|
(1)
|
For the year ended December 31, 2015 there were no potentially dilutive instruments. For the year ended December 31, 2016 the weighted average number of common shares for diluted earnings per share was increased to take into consideration the theoretical effect of the potential common shares that would be issued for the Non-Executive Directors’ compensation agreement. For the year ended December 31, 2017 the weighted average number of common shares for diluted earnings per share was increased to take into consideration the theoretical effect of (i) the potential common shares that would be issued for the Non-Executive Directors’ compensation agreement and (ii) the potential common shares that would be issued for the equity incentive program.
|
Net Debt and Net Industrial Debt
Net Industrial Debt is the primary measure used by us to analyze our financial leverage and capital structure, and is one of the key indicators, together with Net Debt, we use to measure our financial position. These measures are presented by management to aid investors in their analysis of the Group’s financial position and financial performance and to compare the Group’s financial position and financial performance with that of other companies. Net Industrial Debt is defined as total debt less cash and cash equivalents (Net Debt), further adjusted to exclude the funded portion of the self-liquidating financial receivables portfolio, which is the portion of our receivables from financing activities that we fund with external debt or intercompany loans.
The following table sets forth a reconciliation of Net Debt and Net Industrial Debt at
December 31, 2017
, and
2016
.
|
|
At December 31,
|
|||||
|
|
2017
|
|
2016
|
|||
|
|
(€ million)
|
|||||
|
Cash and cash equivalents
|
648
|
|
458
|
|
||
|
Debt
|
(1,806
|
)
|
(1,848
|
)
|
||
|
Net Debt
|
(1,158
|
)
|
(1,390
|
)
|
||
|
Funded portion of the self-liquidating financial receivables portfolio
|
685
|
|
737
|
|
||
|
Net Industrial Debt
|
(473
|
)
|
(653
|
)
|
||
73
Free Cash Flow and Free Cash Flow from Industrial Activities
Free Cash Flow and Free Cash Flow from Industrial Activities are two of our primary key performance indicators to measure the Group’s performance. These measures are presented by management to aid investors in their analysis of the Group’s financial performance and to compare the Group’s financial performance with that of other companies. Free Cash Flow is defined as cash flows from operating activities less cash flows used in investing activities. Free Cash Flow from Industrial Activities is defined as Free Cash Flow adjusted for the change in the self-liquidating financial receivables portfolio, which is the change in our receivables from financing activities. The following table sets forth our Free Cash Flow and Free Cash Flow from Industrial Activities for the years ended
December 31, 2017
,
2016
and
2015
.
|
|
For the years ended December 31,
|
||||||||
|
|
2017
|
2016
|
2015
|
||||||
|
|
(€ million)
|
||||||||
|
Cash flows from operating activities
|
663
|
|
1,005
|
|
707
|
|
|||
|
Cash flows used in investing activities
|
(379
|
)
|
(320
|
)
|
(317
|
)
|
|||
|
Free Cash Flow
|
284
|
|
685
|
|
390
|
|
|||
|
Change in the self-liquidating financial receivables portfolio
|
44
|
|
(405
|
)
|
39
|
|
|||
|
Free Cash Flow from Industrial Activities
|
328
|
|
280
|
|
429
|
|
|||
The change in the self-liquidating financial receivables portfolio in 2016 primarily relates to the deconsolidation of FFS GmbH following the sale of a majority stake in FFS GmbH to FCA Bank on November 7, 2016.
Constant Currency Information
The “Results of Operations” discussion below includes information about our net revenues on a constant currency basis. We use this information to assess how the underlying business has performed independent of fluctuations in foreign currency exchange rates. We calculate constant currency by applying the prior-period average foreign currency exchange rates to current period financial data expressed in local currency in which the relevant financial statements are denominated, in order to eliminate the impact of foreign currency exchange rate fluctuations (see Note 2 “Significant Accounting Policies” to the Consolidated Financial Statements, included in this document, for information on the foreign currency exchange rates applied). Although we do not believe that these measures are a substitute for GAAP measures, we do believe that such results excluding the impact of currency fluctuations year-on-year provide additional useful information to investors regarding the operating performance on a local currency basis.
In particular, the U.S. Dollar experienced moderate fluctuations compared to the Euro in 2017 compared to 2016. For example, if a U.S. entity with U.S. Dollar functional currency recorded net revenues of U.S. $100 million for 2017 and 2016, we would have reported €88.5 million in net revenues for 2017 (using the 2017 average exchange rate of 1.1297), a €1.8 million decrease over the €90.3 million reported for 2016 (using the 2016 average exchange rate of 1.1069). The constant currency presentation translates the 2017 net revenues using the 2016 foreign currency exchange rates, and therefore indicates that the underlying net revenues on a constant currency basis were unchanged year-on-year.
The U.S. Dollar did not experience significant fluctuations compared to the Euro in 2016 compared to 2015. For example, the effect of translating net revenues of $100 million for 2016 using the 2015 average exchange rate of 1.1094 would have been a decrease of €0.2 million.
74
A. Operating Results
Results of Operations
Consolidated Results of Operations –
2017
compared to
2016
and
2016
compared to
2015
The following is a discussion of the results of operations for the year ended
December 31, 2017
as compared to the year ended
December 31, 2016
, and for the year ended
December 31, 2016
as compared to the year ended
December 31, 2015
. The presentation includes line items as a percentage of net revenues for the respective periods presented to facilitate year-over-year comparisons.
|
For the years ended December 31,
|
|||||||||||||||||
|
2017
|
Percentage of net revenues
|
2016
|
Percentage of net revenues
|
2015
|
Percentage of net revenues
|
||||||||||||
|
(€ million, except percentages)
|
|||||||||||||||||
|
Net revenues
|
3,417
|
|
100.0
|
%
|
3,105
|
|
100.0
|
%
|
2,854
|
|
100.0
|
%
|
|||||
|
Cost of sales
|
1,651
|
|
48.3
|
%
|
1,580
|
|
50.9
|
%
|
1,499
|
|
52.5
|
%
|
|||||
|
Selling, general and administrative costs
|
329
|
|
9.6
|
%
|
295
|
|
9.5
|
%
|
339
|
|
11.9
|
%
|
|||||
|
Research and development costs
|
657
|
|
19.2
|
%
|
614
|
|
19.8
|
%
|
562
|
|
19.7
|
%
|
|||||
|
Other expenses, net
|
7
|
|
0.2
|
%
|
24
|
|
0.8
|
%
|
10
|
|
0.4
|
%
|
|||||
|
Result from investments
|
2
|
|
0.1
|
%
|
3
|
|
0.2
|
%
|
—
|
|
—
|
%
|
|||||
|
EBIT
|
775
|
|
22.7
|
%
|
595
|
|
19.2
|
%
|
444
|
|
15.6
|
%
|
|||||
|
Net financial expenses
|
29
|
|
0.9
|
%
|
28
|
|
0.9
|
%
|
10
|
|
0.4
|
%
|
|||||
|
Profit before taxes
|
746
|
|
21.9
|
%
|
567
|
|
18.3
|
%
|
434
|
|
15.2
|
%
|
|||||
|
Income tax expense
|
209
|
|
6.1
|
%
|
167
|
|
5.4
|
%
|
144
|
|
5.0
|
%
|
|||||
|
Net profit
|
537
|
|
15.8
|
%
|
400
|
|
12.9
|
%
|
290
|
|
10.2
|
%
|
|||||
Net revenues
The following table sets forth an analysis of our net revenues for the periods indicated:
|
|
For the years ended December 31,
|
Increase/(Decrease)
|
|||||||||||||||||||||||||||
|
|
2017
|
Percentage of net revenues
|
|
2016
|
Percentage of net revenues
|
2015
|
Percentage of net revenues
|
2017 vs. 2016
|
2016 vs. 2015
|
||||||||||||||||||||
|
|
(€ million, except percentages)
|
||||||||||||||||||||||||||||
|
Cars and spare parts
(1)
|
2,456
|
|
71.9
|
%
|
2,180
|
|
70.2
|
%
|
2,080
|
|
72.9
|
%
|
276
|
|
12.7
|
%
|
100
|
|
4.8
|
%
|
|||||||||
|
Engines
(2)
|
373
|
|
10.9
|
%
|
338
|
|
10.9
|
%
|
219
|
|
7.7
|
%
|
35
|
|
10.5
|
%
|
119
|
|
54.5
|
%
|
|||||||||
|
Sponsorship, commercial and brand
(3)
|
494
|
|
14.5
|
%
|
488
|
|
15.7
|
%
|
441
|
|
15.5
|
%
|
6
|
|
1.1
|
%
|
47
|
|
10.7
|
%
|
|||||||||
|
Other
(4)
|
94
|
|
2.7
|
%
|
99
|
|
3.2
|
%
|
114
|
|
3.9
|
%
|
(5
|
)
|
(5.1
|
)%
|
(15
|
)
|
(13.8
|
)%
|
|||||||||
|
Total net revenues
|
3,417
|
|
100.0
|
%
|
3,105
|
|
100.0
|
%
|
2,854
|
|
100.0
|
%
|
312
|
|
10.0
|
%
|
251
|
|
8.8
|
%
|
|||||||||
______________________________
|
(1)
|
Includes net revenues generated from shipments of our cars, including any personalization net revenues generated on these cars and sales of spare parts.
|
|
(2)
|
Includes net revenues generated from the sale of engines to Maserati for use in their cars and net revenues generated from the rental of engines to other Formula 1 racing teams.
|
|
(3)
|
Includes net revenues earned by our Formula 1 racing team, through sponsorship agreements and our share of the Formula 1 World Championship commercial revenues, and net revenues generated through the Ferrari brand, including merchandising, licensing and royalty income.
|
|
(4)
|
Primarily includes interest income generated by the Ferrari Financial Services entities and net revenues from the management of the racetrack.
|
75
2017
compared to
2016
Net revenues for
2017
were
€3,417 million
, an increase of
€312 million
, or
10.0 percent
(an increase of 11.2 percent on a constant currency basis), from
€3,105 million
for
2016
.
The increase in net revenues, including the positive impact of foreign currency hedging instruments, was attributable to the combination of (i) a
€276 million
increase in cars and spare parts net revenues, (ii) a
€35 million
increase in engines net revenues and (iii) a
€6 million
increase in sponsorship, commercial and brand net revenues, partially offset by (iv) a
€5 million
decrease in other net revenues.
Cars and spare parts
Cars and spare parts net revenues were
€2,456 million
for
2017
, an increase of
€276 million
, or
12.7 percent
, from
€2,180 million
for
2016
. The increase was primarily attributable to a €249 million increase in net revenues from range and special series cars and spare parts, as well as a €27 million increase in net revenues from supercars and limited edition cars.
The
€249 million
increase in net revenues from range and special series cars and spare parts was principally attributable to an increase in shipments of approximately 360 cars (excluding the LaFerrari and the LaFerrari Aperta) and positive mix, along with a greater contribution from personalization programs and pricing increases. Shipments of V12 range and special series models increased by approximately 25 percent, primarily attributable to an increase in shipments of the GTC4Lusso and our first shipments of the newly launched 812 Superfast which is now being sold in most of our markets, partially offset by the phase-outs of the F12berlinetta and the FF, as well as the F12tdf, which finished its limited series run. Shipments of V8 range models were in line with 2016, as increases in shipments of the 488 family and the GTC4Lusso T were substantially offset by the phase-out of the California T.
The
€249 million
increase in net revenues from range and special series cars and spare parts reflects increases in all four of our major geographical markets, including (i) a €146 million increase in EMEA, (ii) a €40 million increase in Americas, (iii) a €36 million increase in Rest of APAC, and (iv) a €27 million increase in China, Hong Kong and Taiwan (on a combined basis).
The €146 million increase in EMEA net revenues was primarily attributable to an increase in shipments and a greater contribution from personalization programs. The increase in shipments was driven by double-digit growth in shipments in Italy, France, and the UK, as well as mid-single digit growth in Germany, Switzerland and Other EMEA. The increase in shipments was primarily related to the 488 and GTC4Lusso families, as well as our first shipments of the newly launched 812 Superfast, which commenced in EMEA in the third quarter of 2017. This increase was partially offset by the phase-outs of the California T and F12berlinetta, as well as the F12tdf. A decrease in net revenues in the Middle East was primarily due to a reallocation of shipments into different markets triggered by difficult market conditions in the Middle East.
The €40 million increase in Americas net revenues was primarily attributable to positive volume and mix, along with a greater contribution from our personalization programs, partially offset by negative foreign exchange impact. In particular, the positive volume was driven by the 488 family and the GTC4Lusso, as well as the entry of the GTC4Lusso T and the 812 Superfast on the market in the fourth quarter of 2017, partially offset by the phase-outs of the California T and F12berlinetta, as well as the F12tdf.
The €36 million increase in Rest of APAC net revenues was primarily attributable to increases in Japan and other Rest of APAC, and to a lesser extent in Australia. The increase in Japan was driven by single-digit growth in shipments, primarily due to the GTC4Lusso family, partially offset by the phase-outs of the California T and F12berlinetta as well as negative foreign currency exchange impact. Double-digit growth in shipments was achieved in Australia and Rest of APAC, supported by the 488 and the GTC4Lusso families.
The €27 million increase in China, Hong Kong and Taiwan (on a combined basis) net revenues was primarily attributable to a positive mix, driven by the GTC4Lusso family and other V12 models, particularly in China, partially offset by a slowdown in Hong Kong due to our decision to terminate the distributor in 2016 and the new dealership only becoming fully operational in the third quarter of 2017.
76
The €27 million increase in net revenues from supercars and limited edition cars was attributable to shipments of LaFerrari Aperta, partially offset by the phase out of the LaFerrari shipments, which ended in 2016, as well as the non-registered racing car FXX K and the strictly limited edition F60 America completing their limited series run in 2016.
Engines
Net revenues generated from engines were
€373 million
for
2017
, an increase of
€35 million
, or
10.5 percent
, from
€338 million
for
2016
. The
€35 million
increase was mainly attributable to an increase in net revenues generated from the sale of engines to Maserati, driven by a 25 percent increase in the volume of engines shipped, partially offset by a decrease in net revenues from the rental of engines to Formula 1 racing teams due to the termination of the rental agreement with one of the Formula 1 teams.
Sponsorship, commercial and brand
Net revenues generated from sponsorship, commercial agreements and brand management activities were
€494 million
for
2017
, an increase of
€6 million
, or
1.1 percent
, from
€488 million
for
2016
. The increase was primarily related to an increase in net revenues from sponsorship and brand activities, partially offset by a decrease in Formula 1 net revenues due to our lower ranking in the World Constructors’ Championship in 2016 compared to 2015.
Other
Other
net revenues were
€94 million
for
2017
, a decrease of
€5 million
, or
5.1 percent
, from
€99 million
for
2016
. The
€5 million
decrease in other net revenues was primarily driven by the deconsolidation of the financial services business in Europe since November 2016 following the sale of a majority stake in FFS GmbH to FCA Bank.
2016
compared to
2015
Net revenues for 2016 were €3,105 million, an increase of €251 million, or 8.8 percent (an increase of 9.4 percent on a constant currency basis), from €2,854 million for 2015.
The increase in net revenues, including the positive impact of foreign currency hedging instruments, was attributable to the combination of (i) a €100 million increase in cars and spare parts net revenues, (ii) a €119 million increase in engines net revenues and (iii) a €47 million increase in sponsorship, commercial and brand net revenues, partially offset by (iv) a €15 million decrease in other net revenues.
Cars and spare parts
Cars and spare parts net revenues were €2,180 million for 2016, an increase of €100 million, or 4.8 percent, from €2,080 million for 2015. The increase was attributable to a €270 million increase in net revenues from range and special series cars and spare parts, which was partially offset by a decrease in net revenues from supercars and limited edition cars.
The €270 million increase in net revenues from range and special series cars and spare parts was primarily attributable to an increase in shipments of approximately 540 cars (excluding the LaFerrari and LaFerrari Aperta), positive contribution from our personalization programs and a price increase on certain models starting from the fourth quarter of 2016. Shipments of V12 models increased by 20.2 percent, primarily attributable to shipments of the F12tdf and the GTC4Lusso, which commenced in the fourth quarter of 2015 and the third quarter of 2016, respectively. These effects were partially offset by a decrease in shipments of the F12berlinetta, which was in its 5th year of commercialization, and the phase-out of the FF. Shipments of V8 models increased by 4.8 percent, driven by the 488 GTB and the 488 Spider, which were launched in the first quarter of 2015 and the third quarter of 2015, respectively, partially offset by the phase-out of the 458 family in 2015.
The €270 million increase in net revenues from range and special series cars and spare parts reflected increases in all four of our major geographical markets, including (i) €137 million in EMEA, (ii) €89 million in Americas, (iii) €43 million in Rest of APAC and (iv) €1 million in China, Hong Kong and Taiwan (on a combined basis).
The €137 million increase in EMEA net revenues was attributable to increases of €60 million in Italy, €23 million in Other EMEA, €21 million in Germany, €11 million in Switzerland, €11 million in France, €8 million in the Middle East and €3 million in the UK. Such increases were primarily attributable to positive effects from volume, our personalization programs
77
and positive mix. In particular, Italy, Other EMEA, Germany and France experienced double-digit growth in shipments, primarily driven by the 488 GTB, the 488 Spider, the F12tdf and the GTC4Lusso, partially offset by the phase-out of the 458 family in 2015. The positive mix effect in EMEA was driven by the F12tdf and the GTC4Lusso.
The €89 million increase in Americas net revenues was primarily attributable to positive effects from volume and mix, our personalization programs, the sale of spare parts and favorable foreign currency exchange. Positive volumes were driven by shipments of the 488 GTB, the 488 Spider and the F12tdf, partially offset by the phase-outs of the 458 family and the FF, while positive mix was driven by strong performance from the F12tdf.
The €43 million increase in Rest of APAC net revenues was attributable to increases of €30 million in Japan, €11 million in Australia and €2 million in other Rest of APAC. The €30 million increase in Japan was mainly attributable to positive effects from favorable foreign currency exchange, an increase in shipments and our personalization programs. The €11 million increase in Australia was primarily attributable to a double-digit increase in shipments, driven by the 488 GTB, the 488 Spider and the F12tdf, partially offset by a decrease in shipments of the 458 family.
The €1 million increase in China, Hong Kong and Taiwan (on a combined basis) net revenues was attributable to increases of €5 million in Taiwan and €4 million in mainland China, partially offset by an €8 million decrease in Hong Kong. The increases in Taiwan and mainland China were primarily attributable to increases in shipments that were driven by the 488 GTB and the 488 Spider. The decrease in Hong Kong was primarily related to our decision to terminate the distributor in Hong Kong.
The decrease in net revenues from supercars and limited edition cars was primarily driven by the LaFerrari which finished its limited series production run, partially offset by shipments of our latest limited edition supercar, the LaFerrari Aperta, which was launched in the third quarter of 2016 and celebrated our 70th anniversary in 2017, as well as shipments of the non-registered racing car FXX K and the F60 America, our limited edition V12 open air roadster that commemorated 60 years in the United States.
Engines
Net revenues generated from engines were €338 million for 2016, an increase of €119 million, or 54.5 percent, from €219 million for 2015. The €119 million increase was mainly attributable to a €68 million increase in net revenues generated from the sale of engines to Maserati, driven by a 47.2 percent increase in the volume of engines shipped, as well as an increase in net revenues generated from the rental of power units to other Formula 1 teams, primarily as a result of renting power units to three Formula 1 teams for the 2016 season compared with two Formula 1 teams for the 2015 season.
Sponsorship, commercial and brand
Net revenues generated from sponsorship, commercial agreements and brand management activities were €488 million for 2016, an increase of €47 million, or 10.7 percent, from €441 million for 2015. The increase was primarily related to our participation in the Formula 1 World Championship and in particular as a result of our improved ranking in the World Constructors’ Championship in 2015 compared to 2014, as well as an increase in net revenues from sponsorship and brand related activities.
Other
Other
net revenues were €99 million for 2016, a decrease of €15 million, or 13.8 percent, from €114 million for 2015. The €15 million decrease in other net revenues was primarily driven by other supporting activities, including the deconsolidation of the financial services business in Europe following the sale of a majority stake in FFS GmbH to FCA Bank on November 7, 2016.
78
Cost of sales
|
|
For the years ended December 31,
|
Increase/(Decrease)
|
|||||||||||||||||||||||||||
|
|
2017
|
Percentage of net revenues
|
2016
|
Percentage of net revenues
|
|
2015
|
Percentage of net revenues
|
2017 vs. 2016
|
2016 vs. 2015
|
||||||||||||||||||||
|
|
(€ million, except percentages)
|
||||||||||||||||||||||||||||
|
Cost of sales
|
1,651
|
|
48.3
|
%
|
1,580
|
|
50.9
|
%
|
1,499
|
|
52.5
|
%
|
71
|
|
4.5
|
%
|
81
|
|
5.4
|
%
|
|||||||||
2017
compared to
2016
Cost of sales for
2017
was
€1,651 million
, an increase of
€71 million
, or
4.5 percent
, from
€1,580 million
for
2016
. As a percentage of net revenues, cost of sales decreased from
50.9 percent
in
2016
to
48.3 percent
in
2017
.
The increase in cost of sales was primarily attributable to (i) increased costs of €58 million driven by an increase in volumes and personalization programs, (ii) increased costs of €46 million driven by an increase in production volumes of engines for Maserati and costs for supporting activities and (iii) an increase in production costs, including amortization and depreciation, of €4 million, partially offset by (iv) the effect of charges in 2016 for Takata airbag inflator recalls of €37 million.
The €58 million increase in cost of sales related to volumes and personalization programs was driven by the 488 family, the GTC4Lusso and the 812 Superfast. The €46 million increase in cost of sales related to the production of engines for Maserati and supporting activities was driven by a 25 percent increase in the volume of engines shipped to Maserati.
2016
compared to
2015
Cost of sales for 2016 was €1,580 million, an increase of €81 million, or 5.4 percent, from €1,499 million for 2015. As a percentage of net revenues, cost of sales decreased from 52.5 percent in 2015 to 50.9 percent in 2016.
The increase in cost of sales was primarily attributable to (i) an increase in costs of €59 million related to increased volumes and our personalization programs, (ii) an increase in costs of €65 million related to the production of engines for Maserati, engines rented to other Formula 1 racing teams, and other supporting activities, and (iii) charges for Takata airbag inflator recalls of €37 million, partially offset by (i) a decrease in costs of €61 million related to product mix and (ii) a decrease in production costs of €19 million, including direct materials savings and amortization and depreciation.
The €59 million increase in cost of sales related to volumes and personalization programs was driven by the 488 GTB, the 488 Spider, the F12tdf and the GTC4Lusso. The €65 million increase in cost of sales related to the production of engines for Maserati, engines rented to other Formula 1 racing teams and other supporting activities was driven by a 47.2 percent increase in the volume of engines shipped to Maserati and the rental of power units to three Formula 1 teams for the 2016 season compared with two Formula 1 teams for the 2015 season. The €61 million decrease in costs related to product mix was driven by a decrease in shipments of the LaFerrari, which finished its limited series production run, partially offset by shipments of the LaFerrari Aperta, the F60 America and an increase in the proportion of shipments of V12 models compared to V8 models in our range and special series cars, driven by shipments of the F12tdf and the GTC4Lusso. The €19 million decrease in production costs was driven by the LaFerrari, the phase-out of the 458 family and direct material savings.
79
Selling, general and administrative costs
|
|
For the years ended December 31,
|
Increase/(Decrease)
|
|||||||||||||||||||||||||||
|
|
2017
|
Percentage of net revenues
|
2016
|
Percentage of net revenues
|
2015
|
Percentage of net revenues
|
2017 vs. 2016
|
2016 vs. 2015
|
|||||||||||||||||||||
|
|
(€ million, except percentages)
|
||||||||||||||||||||||||||||
|
Selling, general and administrative costs
|
329
|
|
9.6
|
%
|
295
|
|
9.5
|
%
|
339
|
|
11.9
|
%
|
34
|
|
11.5
|
%
|
(44
|
)
|
(12.8
|
)%
|
|||||||||
2017
compared to
2016
Selling, general and administrative costs for
2017
were
€329 million
, an increase of
€34 million
, or
11.5 percent
, from
€295 million
for
2016
. As a percentage of net revenues, selling, general and administrative costs were substantially unchanged.
The increase in selling, general and administrative costs was primarily attributable to (i) share-based compensation expense related to the equity incentive plan, (ii) costs related to initiatives for Ferrari’s 70th anniversary, and (iii) costs related to new directly operated Ferrari stores, partially offset by (iv) the costs of the former CEO’s retirement package recognized in 2016 and (v) a decrease in costs due to the deconsolidation of FFS GmbH since November 2016.
2016
compared to
2015
Selling, general and administrative costs for 2016 were €295 million, a decrease of €44 million, or 12.8 percent, from €339 million for 2015. As a percentage of net revenues, selling, general and administrative costs decreased from 11.9 percent in 2015 to 9.5 percent for 2016.
The decrease in selling, general and administrative costs was mainly attributable to (i) advisory costs incurred in 2015 in relation to the initial public offering of €16 million, (ii) a decrease in allowance for doubtful accounts, primarily related to the effects of a provision recorded in 2015 in relation to a former commercial partner of our Formula 1 activities, (iii) a decrease in costs driven by a different ranking in Formula 1 racing, and (iv) the deconsolidation of FFS GmbH, which were partially offset by (i) the costs of the former CEO’s retirement package, (ii) costs related to new directly operated stores, (iii) costs related to the launch of new models and (iv) corporate costs.
Research and development costs
|
|
For the years ended December 31,
|
Increase/(Decrease)
|
|||||||||||||||||||||||||||
|
|
2017
|
|
Percentage of net revenues
|
2016
|
|
Percentage of net revenues
|
2015
|
Percentage of net revenues
|
2017 vs. 2016
|
2016 vs. 2015
|
|||||||||||||||||||
|
|
(€ million, except percentages)
|
||||||||||||||||||||||||||||
|
Research and development costs expensed during the year
|
556
|
|
16.3
|
%
|
510
|
|
16.4
|
%
|
447
|
|
15.7
|
%
|
46
|
|
9.2
|
%
|
63
|
|
14.1
|
%
|
|||||||||
|
Amortization of capitalized development costs
|
101
|
|
2.9
|
%
|
104
|
|
3.4
|
%
|
115
|
|
4.0
|
%
|
(3
|
)
|
(3.4
|
)%
|
(11
|
)
|
(9.4
|
)%
|
|||||||||
|
Research and development costs
|
657
|
|
19.2
|
%
|
614
|
|
19.8
|
%
|
562
|
|
19.7
|
%
|
43
|
|
7.1
|
%
|
52
|
|
9.3
|
%
|
|||||||||
2017
compared to
2016
Research and development costs for
2017
were
€657 million
, an increase of
€43 million
, or
7.1
percent, from
€614 million
for
2016
. As a percentage of net revenues, research and development costs were
19.2 percent
in
2017
compared to
19.8 percent
in
2016
.
The increase in research and development costs was attributable to an increase of
€46 million
in research and development costs expensed, partially offset by a decrease of
€3 million
in amortization of capitalized development costs.
80
The
€46 million
increase in research and development costs expensed during the year was primarily driven by research and development to support the innovation of our product range and components, in particular in relation to hybrid technology, partially offset by a decrease in research and development expenses for Formula 1 activities.
2016
compared to
2015
Research and development costs for
2016
were
€614 million
, an increase of
€52 million
, or
9.3
percent, from
€562 million
for
2015
. As a percentage of net revenues, research and development costs were
19.8 percent
in
2016
compared to
19.7 percent
in
2015
.
The increase in research and development costs was attributable to an increase of
€63 million
in research and development costs expensed during the year, partially offset by a decrease of
€11 million
in amortization of capitalized development costs.
The
€63 million
increase in research and development costs expensed during the year was primarily driven by Formula 1 activities and in particular, our efforts related to power unit projects and chassis area, and to a lesser extent, research and development costs on sports and GT cars.
The
€11 million
decrease in amortization of capitalized development costs was primarily attributable to the completion of the LaFerrari limited series production run and the phase-out of the 458 family, partially offset by amortization of capitalized development costs related to our newer model.
Other expenses, net
|
|
For the years ended December 31,
|
Increase/(Decrease)
|
||||||||||||||||||
|
|
2017
|
2016
|
2015
|
2017 vs. 2016
|
2016 vs. 2015
|
|||||||||||||||
|
|
(€ million, except percentages)
|
|||||||||||||||||||
|
Other expenses, net
|
7
|
|
24
|
|
10
|
|
(17
|
)
|
(72.0
|
)%
|
14
|
|
122.0
|
%
|
||||||
2017
compared to
2016
Other expenses, net for
2017
amounted to net other expenses of
€7 million
, a decrease of
€17 million
, or
72.0 percent
, compared to net other expenses of
€24 million
for
2016
.
For
2017
, other expenses, net included other expenses of €12 million, which mainly related to indirect taxes and miscellaneous expenses, partially offset by other income of €5 million, which mainly related to gains on disposals of property, plant and equipment, rental income and miscellaneous income.
For
2016
, other expenses, net included other expenses of €30 million, which mainly related to provisions (primarily due to disputes with a distributor), indirect taxes and miscellaneous expenses, partially offset by other income of €6 million, which mainly related to gains on the disposal of property plant and equipment, rental income and miscellaneous income.
2016
compared to
2015
Other expenses, net for 2016 amounted to net other expenses of €24 million, an increase of €14 million, or 122.0 percent, compared to net other expenses of €10 million for 2015.
For
2016
, other expenses, net included other expenses of €30 million, which mainly related to provisions (primarily due to disputes with a distributor), indirect taxes and miscellaneous expenses, partially offset by other income of €6 million, which mainly related to gains on the disposal of property plant and equipment, rental income and miscellaneous income.
For
2015
, other expenses, net included other expenses of €32 million, which mainly related to provisions, indirect taxes and miscellaneous expenses, partially offset by other income of €22 million, including a €6 million gain on disposal of assets
81
and liabilities related to investment properties and €6 million related to the release of provisions previously recorded in other expenses, as well as rental income and miscellaneous income.
Result from investments
|
For the years ended December 31,
|
Increase/(Decrease)
|
||||||||||||||||||
|
2017
|
2016
|
2015
|
2017 vs. 2016
|
2016 vs. 2015
|
|||||||||||||||
|
(€ million, except percentages)
|
|||||||||||||||||||
|
Result from investments
|
2
|
|
3
|
|
—
|
|
(1
|
)
|
(20.5
|
)%
|
3
|
|
n.m.
|
||||||
2017
compared to
2016
Result from investments of €2 million relates to the Group’s proportionate share of FFS GmbH’s net profit.
2016
compared to
2015
Result from investments of €3 million in 2016 includes i) the gain on the sale of a majority stake in FFS GmbH to FCA Bank on November 7, 2016, ii) the gain on the fair value measurement of the non-controlling interest retained in FFS GmbH, and iii) the Group’s proportionate share of FFS GmbH’s net profit subsequent to the sale in accordance with the equity method of accounting.
EBIT
|
|
For the years ended December 31,
|
Increase/(Decrease)
|
|||||||||||||||||||||||||||
|
|
2017
|
Percentage of net revenues
|
2016
|
Percentage of net revenues
|
2015
|
Percentage of net revenues
|
2017 vs. 2016
|
2016 vs. 2015
|
|||||||||||||||||||||
|
|
(€ million, except percentages)
|
||||||||||||||||||||||||||||
|
EBIT
|
775
|
|
22.7
|
%
|
595
|
|
19.2
|
%
|
444
|
|
15.6
|
%
|
180
|
|
30.3
|
%
|
151
|
|
33.9
|
%
|
|||||||||
2017
compared to
2016
EBIT for
2017
was
€775 million
, an increase of
€180 million
, or
30.3 percent
, from
€595 million
for
2016
. As a percentage of net revenues, EBIT increased from
19.2 percent
in 2016 to
22.7 percent
in 2017.
The increase in EBIT was primarily attributable to (i) positive volume impact of €67 million, (ii) favorable mix impact of €80 million, (iii) positive net foreign currency exchange impact of €53 million (resulting from positive €101 million relating to foreign currency hedging instruments, partially offset by an adverse impact on revenues from the weakening of foreign currencies against the Euro) and (iv) a decrease of €57 million in other supporting costs, including the effect of charges in 2016 for Takata airbag inflator recalls of €37 million, partially offset by (v) an increase in research and development costs of €43 million and (vi) an increase in selling, general and administrative costs of €34 million.
The positive volume impact was attributable to an increase in shipments of approximately 360 cars (excluding the LaFerrari and LaFerrari Aperta), driven by the GTC4Lusso and the 488 families, as well as our first shipments of the newly launched 812 Superfast, together with positive contribution from our personalization programs. These positive effects on volume were partially offset by the phase-outs of the California T and the F12berlinetta, as well as the F12tdf, which finished its limited series run in 2017. The favorable mix impact of €80 million was primarily attributable to an increase in shipments of the LaFerrari Aperta, as well as an increase in shipments of our V12 range and special series models and pricing increases. These positive effects on mix were partially offset by the end of the LaFerrari lifecycle in 2016, as well as the non-registered racing car FXX K and the strictly limited edition F60 America completing their limited series runs in 2016.
The increase in EBIT as a percentage of net revenues from
19.2 percent
in
2016
to
22.7 percent
in
2017
was primarily attributable to the combination of the previously mentioned effects on EBIT above and a decrease in cost of sales as a percentage of net revenues from
50.9 percent
in
2016
to
48.3 percent
in
2017
.
82
2016
compared to
2015
EBIT for
2016
was
€595 million
, an increase of
€151 million
, or
33.9 percent
, from
€444 million
for
2015
. As a percentage of net revenues, EBIT increased from
15.6
percent in
2015
to
19.2
percent in
2016
.
The increase in EBIT was primarily attributable to (i) positive volume impact of €69 million, (ii) positive net foreign currency exchange impact of €64 million (including positive €71 million relating to foreign currency hedging instruments), (iii) positive contribution of €54 million related to an increase in engine shipments to Maserati, engines rented to other Formula 1 racing teams and other supporting activities, including sponsorship, commercial and brand activities, and (iv) a decrease in selling, general and administrative costs of €44 million, which were partially offset by (i) unfavorable product mix of €28 million, and (ii) an increase in research and development costs of €52 million.
The positive volume impact of €69 million was attributable to an increase in shipments of approximately 540 cars (excluding the LaFerrari and LaFerrari Aperta), driven by the 488 GTB, the 488 Spider, the F12tdf (all of which were launched in 2015) and the GTC4Lusso (which commenced in the third quarter of 2016), as well as a positive contribution from our personalization programs. The unfavorable product mix of €28 million was primarily attributable to the completion of the LaFerrari limited series production run, the F12berlinetta, which is in its 5th year of commercialization, and the phase-out of the FF, partially offset by the F12tdf, the launch of the LaFerrari Aperta in the third quarter of 2016, shipments of the non-registered racing car FXX K and the F60 America, our limited edition V12 open air roadster that commemorates 60 years in the United States, and a price increase on certain models from the fourth quarter of 2016.
The increase in EBIT as a percentage of net revenues from
15.6
percent in
2015
to
19.2
percent in
2016
, was primarily attributable to the combination of the previously mentioned effects on EBIT above and a decrease in cost of sales as a percentage of net revenues from 52.5 percent in 2015 to 50.9 percent in 2016.
Net financial expenses
|
|
For the years ended December 31,
|
Increase/(Decrease)
|
||||||||||||||||
|
|
2017
|
2016
|
2015
|
2017 vs. 2016
|
2016 vs. 2015
|
|||||||||||||
|
|
(€ million, except percentages)
|
|||||||||||||||||
|
Net financial expenses
|
29
|
|
28
|
|
10
|
|
1
|
|
5.5%
|
18
|
|
n.m.
|
||||||
2017
compared to
2016
Net financial expenses for
2017
were
€29 million
compared to
€28 million
for
2016
, representing an increase of
€1 million
.
An increase in (i) net foreign exchange losses and (ii) interest expenses on bonds was substantially offset by (iii) a decrease in interest expenses on bank borrowings, primarily related to the Term Loan and the Bridge Loan which were fully repaid in November 2017 and March 2016, respectively, (iv) financial income related to the Delta Topco option and (v) a gain on the fair value measurement of the Series C Liberty Formula One shares (“Liberty Shares”) subsequent to initial recognition at cost.
2016
compared to
2015
Net financial expenses for
2016
were
€28 million
compared to
€10 million
for
2015
, representing an increase of
€18 million
.
The increase in net financial expenses was primarily attributable to interest expenses on debt incurred, directly or indirectly, as a result of the Restructuring which took place in October 2015, and in particular, interest expenses relating to the Term Loan, the Bridge Loan (which was fully repaid in March 2016), which were primarily used to repay a portion of the FCA Note and interest expenses, as well as interest expenses on the 2023 Bond. Net financial expenses also included interest expenses on other bank borrowings.
83
Income tax expense
|
|
For the years ended December 31,
|
Increase/(Decrease)
|
||||||||||||||||||
|
|
2017
|
2016
|
2015
|
2017 vs. 2016
|
2016 vs. 2015
|
|||||||||||||||
|
|
(€ million, except percentages)
|
|||||||||||||||||||
|
Income tax expense
|
209
|
|
167
|
|
144
|
|
42
|
|
24.5
|
%
|
23
|
|
16.3
|
%
|
||||||
2017
compared to
2016
Income tax expense for
2017
was
€209 million
, an increase of
€42 million
, or
24.5%
, from
€167 million
for
2016
. The increase in income tax expense was primarily attributable to an increase in profit before taxes from
€567 million
in
2016
to
€746 million
in
2017
, partially offset by a decrease in the effective tax rate net of IRAP from 25.8 percent in 2016 to 24.2 percent in 2017. The decrease in the effective tax rate net of IRAP was primarily attributable to the combined effects of a reduction in the corporate income tax rate from 27.5 percent to 24.0 percent (effective from 2017), deductions related to eligible research and development costs and depreciation of fixed assets in accordance with tax regulations in Italy, partially offset by a decrease in net deferred tax assets due to the Tax Cuts and Jobs Act
(the “Tax Act”), which was enacted into law in the U.S. on December 22, 2017.
The Tax Act includes various changes to the tax law, including a reduction in the corporate income tax rate from 35% to 21% effective January 1, 2018. We recognized the effects of the changes in the tax rate and laws resulting from the Tax Act in 2017, which resulted in a €4.7 million decrease in net deferred tax assets.
2016
compared to
2015
Income tax expense for 2016 was
€167 million
, an increase of
€23 million
, or
16.3 percent
, from
€144 million
for 2015. The increase in income tax expense was primarily attributable an increase in profit before taxes from €434 million in 2015 to €567 million for 2016, partially offset by a decrease in the effective tax rate net of IRAP from 30.0 percent in 2015 to 25.8 percent in 2016. The decrease in the effective tax rate net of IRAP was primarily attributable to the combined effects of adjustments to deferred taxes assets and liabilities due to a change in Italian tax law to reduce the corporate income tax rate from 27.5 percent to 24.0 percent (effective from 2017) and additional tax deductions in 2016 on eligible research and development costs and on investments and other expenses, in accordance with Italian tax regulations.
Recent Developments
On February 9, 2018 the Company announced its intention to launch a share buyback program. The Company expects the program to involve the repurchase from time to time of up to
€100 million
in common shares. The program is intended to optimize the capital structure of the Company. Shares repurchased may be used to meet the Company’s obligations arising from the equity incentive plan approved in 2017. Under the program, as of February 20, 2018 the Company purchased an aggregate of 190,600 common shares on the New York Stock Exchange (NYSE) for an aggregate consideration of
$22,838,301
. As of February 20, 2018 the Company held 5,160,225 common shares in treasury, and in total the Company held
2.06
percent of the total issued share capital in treasury, including the common shares and the special voting shares.
On February 20, 2018, the Company announced that Scuderia Ferrari has extended its partnership agreement with Philip Morris International, continuing a collaboration of nearly five decades.
On February 21, 2018, the Group announced that it has selected the 88th edition of the Geneva International Motor Show for the world premiere of the Ferrari 488 Pista, the Group’s successor to Ferrari’s V8-engined special series. The Ferrari 488 Pista marks a significant step forward from the previous special series in terms of both sporty dynamics and for the level of technological carryover from racing.
On February 22, 2018, the Company presented the new car for the 2018 Formula 1 World Championship.
On February 23, 2018, the Board of Directors of Ferrari N.V. recommended to the Company’s shareholders that the Company declare a dividend of €0.71 per common share, totaling approximately €134 million. The proposal is subject to the approval of the Company’s shareholders at the AGM to be held on April 13, 2018.
84
B. Liquidity and Capital Resources
Liquidity Overview
We require liquidity in order to meet our obligations and fund our business. Short-term liquidity is required to purchase raw materials, parts and components for car production, and to fund selling, administrative, research and development, and other expenses. In addition to our general working capital and operational needs, we expect to use cash for capital expenditures to support our existing and future products. We make capital investments mainly in Italy, for initiatives to introduce new products, enhance manufacturing efficiency, improve capacity, and for maintenance and environmental compliance. Our capital expenditure in 2018 is expected to be approximately €550 million, primarily to support continuous product range renewal and research and development expenditure to transition our product portfolio to hybrid technology. We plan to fund our capital expenditure primarily with cash from our operating activities.
Our business and results of operations depend on our ability to achieve certain minimum car shipment volumes. We have significant fixed costs and therefore, changes in our car shipment volumes can have a significant effect on profitability and liquidity. Prior to the Separation, which was completed on January 3, 2016, we managed our liquidity through participation in cash management and funding services provided by the treasury functions of the FCA Group. Following the Separation, we terminated such arrangements and we now centrally manage our operating cash management, liquidity and cash flow requirements on a standalone basis with the objective of ensuring effective and efficient management of our funds. We believe that our cash generation together with our current liquidity will be sufficient to meet our obligations and fund our business and capital expenditures.
See
“Net Debt and Net Industrial Debt”
below for additional details relating to the our liquidity.
Cyclical Nature of our Cash Flows
Our working capital is subject to month to month fluctuations due to, among others, production volumes, activity of our financial services portfolio, timing of tax payments and capital expenditure. In particular, our inventory levels increase in the periods leading up to launches of new models, during the phase out of prior models and at the end of the second quarter when our inventory levels are higher to support the summer plant shutdown.
The payment of taxes also affects our working capital. In 2016 our tax payments were higher as it was our first year as a standalone tax group. We paid the first tax advance in relation to 2016 taxes at the end of the second quarter of 2016 and the second advance in the fourth quarter of 2016. Also in 2016, we settled our 2015 tax balance from the FCA Group tax consolidation. In the second quarter of 2017, we paid the remaining balance of 2016 taxes as well as the first advance in relation to 2017 taxes, and we paid the second advance in the fourth quarter of 2017.
Our capital expenditure requirements are, among other things, influenced by the timing of the launch of new models and, in particular, our development costs peak in periods when we develop a significant number of new models to renew or refresh our product range. Going forward, our capital expenditure will also be influenced by research and development expenditure to support product range expansion. In 2018 and future periods we expect that our levels of capital expenditure will increase as we continue our investment in hybrid technology. Capital expenditure is also influenced by the timing of research and developments costs for our Formula 1 activities, for which expenditure is generally higher in the first and last quarter of the year.
We generally receive payment for cars between 30 and 40 days after the car is shipped (except when we provide dealer financing or sell invoices to a factor) while we tend to pay most suppliers between 90 and 105 days after we receive the raw materials or components. Additionally, we also receive advance payments from our customers, mainly for our supercars and limited edition cars. We maintain sufficient inventory of raw materials and components to ensure continuity of our production lines but delivery of most raw materials and components takes place monthly or more frequently in order to minimize inventories. The manufacture of one of our cars typically takes between 30 and 45 days, depending on the level of automation of the relevant production line, and the car is generally shipped to our dealers three to six days following the completion of production, although to ensure prompt deliveries in certain regions we may warehouse cars in local markets for longer periods of time. As a result, we tend to receive payment for cars shipped before we are required to make payment for the raw material and components used in manufacturing the cars.
85
Cash Flows
The following table summarizes the cash flows from/(used in) operating, investing and financing activities for each of the years ended December 31,
2017
,
2016
and
2015
. For additional details of our cash flows, see our Consolidated Financial Statements included elsewhere in this document.
|
For the years ended December 31,
|
||||||||
|
2017
|
2016
|
2015
|
||||||
|
(€ million)
|
||||||||
|
Cash flows from operating activities
|
663
|
|
1,005
|
|
707
|
|
||
|
Cash flows used in investing activities
|
(379
|
)
|
(320
|
)
|
(317
|
)
|
||
|
Cash flows used in financing activities
|
(85
|
)
|
(411
|
)
|
(351
|
)
|
||
|
Translation exchange differences
|
(9
|
)
|
1
|
|
10
|
|
||
|
Total change in cash and cash equivalents
|
190
|
|
275
|
|
49
|
|
||
Operating Activities — Year Ended
December 31, 2017
For the year ended December 31,
2017
, our cash flows from operating activities were
€663 million
, primarily the result of:
|
(i)
|
profit before tax of
€746 million
, adjusted to add back
€261 million
of depreciation and amortization expense, €39 million of other non-cash expenses and income (including net gains on disposals of property, plant and equipment and intangible assets as well as non-cash result from investments), €29 million of net finance costs and
€13 million
in provisions accrued. Other non-cash expenses were primarily attributable to share-based compensation expense under the equity incentive plan and equity-settled Non-Executive Directors’ compensation.
|
These cash inflows were partially offset by:
|
(i)
|
€73 million related to cash absorbed by the change in other operating assets and liabilities, primarily attributable to a decrease in advances for the LaFerrari Aperta in 2017, partially offset by advances received for the Ferrari J50;
|
|
(ii)
|
€61 million related to cash absorbed by the net change in inventories, trade payables and trade receivables. In particular, the movement was attributable to (a) cash absorbed by inventory of €88 million driven by projected volume growth in line with our 2018 production outlook, and (b) cash absorbed by trade receivables of €2 million, partially offset by (c) cash generated from trade payables of €29 million, driven by an increase in volumes;
|
(iii) €44 million related to cash absorbed from receivables from financing activities driven by an increase in the financial services portfolio in the United States;
|
(iv)
|
€32 million of net finance costs paid; and
|
|
(v)
|
income tax paid of
€215 million
, primarily related to the payment of the remaining balance of 2016 taxes and advances of 2017 taxes.
|
Operating Activities — Year Ended
December 31, 2016
For the year ended December 31,
2016
, our cash flows from operating activities were
€1,005 million
, primarily the result of:
|
(i)
|
profit before tax of
€567 million
, adjusted to add back
€248 million
of depreciation and amortization expense,
€82 million
in provisions and €28 million of net finance costs, partially offset by €41 million related to other non-cash expenses and income and net gains on disposal of property, plant and equipment and intangible assets, as well as €3 million non-cash result from investments. The €82 million in provisions accrued was primarily attributable to (a) a warranty and recall campaigns provision of €60 million, of which €37 million related to the Takata airbag
|
86
inflator recalls and the remainder primarily related to an increase in volumes, and (b) other risks of €22 million, primarily related to disputes with a distributor;
|
(ii)
|
€405 million related to cash generated by a decrease in receivables from financing activities, primarily attributable to a cash payment of €432 million received in November 2016 following the sale by the Group of the majority stake in FFS GmbH to FCA Bank, as a result of which FFS GmbH was deconsolidated by the Group and the funding of FFS GmbH is being directly provided by FCA Bank (see Note 17 to the Consolidated Financial Statements), partially offset by an increase in the financial services portfolio in the United States; and
|
|
(iii)
|
€7 million relating to cash generated by other operating assets and liabilities, which benefited by approximately €69 million from advances received, mainly related to the LaFerrari Aperta.
|
These cash inflows were partially offset by:
|
(i)
|
€20 million in net finance costs paid;
|
|
(ii)
|
€16 million related to cash absorbed by the net change in inventories, trade payables and trade receivables. In particular, the movement was attributable to (a) cash absorbed by inventory of €33 million, (b) cash absorbed by trade receivables of €89 million, partially offset by (c) cash generated from trade payables of €106 million, all of which were driven by an increase in volumes and Maserati engines; and
|
|
(iii)
|
income tax paid of €252 million, primarily related to payments of tax advances on 2016 taxes and the settlement of the 2015 tax balance from the FCA Group tax consolidation.
|
Operating Activities — Year Ended
December 31, 2015
For the year ended
December 31, 2015
, our cash flows from operating activities were
€707 million
, primarily the result of:
|
(i)
|
profit before tax of
€434 million
, adjusted to add back
€275 million
of depreciation and amortization expense,
€51 million
in provisions accrued, €32 million related to other non-cash expenses and income and net gains on disposal of property, plant and equipment and intangible assets, and €10 million of net finance costs. The €51 million in provisions accrued was composed of (a) warranty provision of €33 million, primarily related to the increase in cars shipped, and to a lesser extent, a change in mix driven by increased shipments of the LaFerrari and the FXX K, which have higher warranty costs compared to range and special series cars, (b) legal proceedings and disputes of €9 million, and (c) other risks and charges of €9 million. The €32 million related to other non-cash expenses and income and net gains on disposal of property, plant and equipment and intangible assets primarily related to the allowances for doubtful accounts of trade and financial receivables and the inventory provision;
|
|
(ii)
|
€121 million related to cash generated by a decrease in receivables from financing activities, primarily attributable to the full reimbursement of the financing of inventory related to the establishment of the Maserati standalone business in China, which at December 31, 2014 was equal to €147 million, and the sale of the financial assets portfolios of Ferrari Financial Services S.p.A. and Ferrari Financial Services Japan KK, partially offset by an increase of the financial services portfolio in the USA.
|
These cash inflows were partially offset by:
|
(i)
|
€33 million related to cash absorbed by the net change in inventories, trade payables and trade receivables. In particular, the movement was driven by (a) cash absorbed by trade payables of €46 million, mainly due to the full production of the LaFerrari in 2014 while at the end of 2015 the product lifecycle was nearing completion and shipments are planned to be completed in the first quarter of 2016, (b) cash absorbed by inventories of €3 million, consistent with increased volumes, partially offset by (c) cash generated from trade receivables of €16 million mainly due to collections of related party receivables;
|
|
(ii)
|
€25 million relating to cash absorbed by other operating cash flows, primarily attributable to the net change in other operating assets and liabilities;
|
87
|
(iii)
|
€13 million in net finance costs paid; and
|
|
(iv)
|
income tax paid of €145 million.
|
Investing Activities — Year Ended
December 31, 2017
For the year ended December 31,
2017
, our net cash used in investing activities was
€379 million
, primarily the result of:
|
(i)
|
€392 million of capital expenditures, mainly including €189 million related to additions to property, plant and equipment and €203 million relating to intangible assets. For a detailed analysis of additions to property, plant and equipment and intangible assets see “—
Capital Expenditures
” below.
|
These cash outflows were partially offset by:
|
(i)
|
€8 million of proceeds from exercising the Delta Topco option;
|
|
(ii)
|
€5 million of proceeds from the sale of property, plant and equipment and intangible assets.
|
Investing Activities — Year Ended December 31,
2016
For the year ended December 31,
2016
, our net cash used in investing activities was
€320 million
, primarily the result of:
|
(i)
|
€342 million of capital expenditures, including €176 million related to additions to property, plant and equipment and €166 million relating to additions to intangible assets. For a detailed analysis of additions to property, plant and equipment and intangible assets see “—
Capital Expenditures
” below;
|
These cash outflows were partially offset by:
|
(i)
|
€19 million of proceeds from the sale of a majority stake in FFS GmbH to FCA Bank; and
|
|
(ii)
|
€3 million proceeds from the sale of property, plant and equipment and intangible assets.
|
Investing Activities — Year Ended
December 31, 2015
For the year ended December 31, 2015, our net cash used in investing activities was €317 million, primarily the result of:
|
(i)
|
€356 million of capital expenditures, including €185 related to additions to property, plant and equipment and €171 million relating to additions to intangible assets. For a detailed analysis of additions to property, plant and equipment and intangible assets see “—
Capital Expenditures
” below;
|
These cash outflows were partially offset by:
|
(ii)
|
€37 million of proceeds from the disposal of assets and liabilities related to investment properties; and
|
|
(iii)
|
€2 million of proceeds from the sale of property, plant and equipment and intangible assets and the net change in investments and other financial assets.
|
88
Financing Activities — Year Ended
December 31, 2017
For the year ended December 31,
2017
, our net cash used in financing activities was
€85 million
, primarily the result of:
|
(i)
|
€795 million related to the full repayment of the Term Loan, including €100 million of mandatory scheduled payments in June 2017 and €695 million for the full repayment of the remaining balance in November 2017, primarily with the proceeds of the 2021 Bond;
|
|
(ii)
|
€120 million related to a cash distribution of reserves to holders of our common shares;
|
(iii) €8 million related to the net change in other debt; and
(iv) €1 million of dividends paid to non-controlling interests in our Chinese distributor, Ferrari International Cars Trading (Shanghai) Co. Ltd.
These cash outflows were partially offset by:
|
(i)
|
€694 million of net proceeds related to the issuance of the 2021 Bond (see
“Bonds”
below), which were used, together with additional cash held, for the full repayment of the Term Loan;
|
|
(ii)
|
€141 million of proceeds net of repayments related to our revolving securitization programs in the USA; and
|
|
(iii)
|
€4 million of net proceeds of other bank borrowings.
|
Financing Activities — Year Ended December 31,
2016
For the year ended December 31, 2016, net cash used in financing activities was
€411 million
, primarily the result of:
|
(i)
|
€701 million related to principal repayments of the Term Loan, including voluntary prepayments of €600 million (€300 million in September 2016 and €300 million in December 2016) and mandatory scheduled repayments of €92 million and $9 million in December 2016;
|
|
(ii)
|
€500 million related to the full repayment of the Bridge Loan;
|
|
(iii)
|
€212 million related to net repayments of other bank borrowings;
|
|
(iv)
|
€87 million cash distribution of reserves to holders of our common shares; and
|
|
(v)
|
€17 million of dividends paid to non-controlling interests in our Chinese distributor, Ferrari International Cars Trading (Shanghai) Co. Ltd;
|
These cash outflows were partially offset by:
|
(i)
|
€491 million of net proceeds related to the issuance of the 2023 Bond (see
“Bonds”
below);
|
|
(ii)
|
€463 million of proceeds net of repayments related to revolving securitization programs in the USA;
|
|
(iii)
|
€135 million in net proceeds from the settlement of the deposits in FCA Group cash management pools and liabilities with FCA;
|
|
(iv)
|
€16 million related to net change in other debt; and
|
|
(v)
|
€1 million of proceeds from the share premium contribution made by FCA in connection with the Restructuring.
|
89
Financing Activities — Year Ended
December 31, 2015
For the year ended December 31, 2015, net cash used in financing activities was
€351 million
, primarily the result of:
|
(i)
|
€3,211 million related to net repayments of financial liabilities with FCA, including repayment of the FCA Note for €2,800 million;
|
|
(ii)
|
€54 million related to dividends paid to non-controlling interests in our Chinese distributor, Ferrari International Cars Trading (Shanghai) Co. Ltd;
|
|
(iii)
|
€11 million related to net repayments of other debt; and
|
|
(iv)
|
€8 million related to the acquisition of non-controlling interests of the subsidiary Ferrari Financial Services S.p.A.
|
These cash outflows were partially offset by:
|
(i)
|
€2,119 million related to net proceeds from third-party financial liabilities, including €2,000 million from the new syndicated credit facility, of which €1,500 million under the Term Loan and €500 million under the Bridge Loan were used to repay financial liabilities with FCA, including a portion of the FCA Note, and
|
|
(ii)
|
€814 million related to the net change in deposits in FCA Group cash management pools, mainly used to repay a portion of the FCA Note.
|
Capital Expenditures
Capital expenditures are defined as cash outflows that result in additions to property, plant and equipment and intangible assets. Capital expenditures for the year ended December 31,
2017
were
€392 million
(
€342 million
and
€356 million
for the years ended December 31,
2016
and
2015
, respectively).
The following table sets a forth a breakdown of capital expenditures by category for each of the years ended December 31,
2017
,
2016
and
2015
:
|
For the years ended December 31,
|
||||||||
|
2017
|
2016
|
2015
|
||||||
|
(€ million)
|
||||||||
|
Intangible assets
|
||||||||
|
Externally acquired and internally generated development costs
|
185
|
|
141
|
|
154
|
|
||
|
Patents, concessions and licenses
|
12
|
|
12
|
|
9
|
|
||
|
Other intangible assets
|
6
|
|
13
|
|
8
|
|
||
|
Total intangible assets
|
203
|
|
166
|
|
171
|
|
||
|
Property, plant and equipment
|
||||||||
|
Industrial buildings
|
5
|
|
6
|
|
24
|
|
||
|
Plant, machinery and equipment
|
132
|
|
82
|
|
118
|
|
||
|
Other assets
|
13
|
|
7
|
|
11
|
|
||
|
Advances and assets under construction
|
39
|
|
81
|
|
32
|
|
||
|
Total property, plant and equipment
|
189
|
|
176
|
|
185
|
|
||
|
Total capital expenditures
|
392
|
|
342
|
|
356
|
|
||
Intangible assets
Our total capital expenditures in intangible assets for the year ended December 31,
2017
were
€203 million
(
€166 million
and
€171 million
for the years ended December 31,
2016
and
2015
, respectively), the most significant component of which relates to externally acquired and internally generated development costs. In particular, we make such investments to
90
support the development of our current and future product offering. The capitalized development costs primarily include materials costs and personnel expenses relating to engineering, design and development focused on content enhancement of existing cars and new models, including to transition our product portfolio to hybrid technology. We constantly invest in product development to ensure we can quickly and efficiently respond to market demand and/or technological breakthroughs and in order to maintain our position at the top of the performance and luxury sports car market.
For the year ended December 31,
2017
, we invested
€185 million
in externally acquired and internally generated development costs, of which €98 million related to development of models to be launched in future years and €87 million primarily related to the development of our current range and special series cars and components.
For the year ended December 31,
2016
, we invested
€141 million
in externally acquired and internally generated development costs, of which €85 million related to development of models to be launched in future years and €56 million primarily related to the development of our current range and special series cars and components.
For the year ended December 31,
2015
, we invested
€154 million
in externally acquired and internally generated development costs, of which €75 million related to development of models to be launched in future years and €79 million primarily related to the development of our current range and special series cars and components.
Investment in other intangible assets mainly relates to costs recognized for the implementation of software.
Property, plant and equipment
Our total capital expenditure in property, plant and equipment for the year ended December 31,
2017
was
€189 million
(
€176 million
and
€185 million
for the years ended December 31,
2016
and
2015
, respectively).
Our most significant investments generally relate to plant, machinery and equipment, which amounted to
€132 million
for the year ended December 31,
2017
(
€82 million
and
€118 million
for the years ended December 31,
2016
and
2015
, respectively) and to a lesser extent advances and assets under construction, which amounted to
€39 million
for the year ended December 31,
2017
(
€81 million
and
€32 million
for the years ended December 31,
2016
and
2015
, respectively). In particular, our most significant investments include investments in car production and engine assembly lines, as well as plant and machinery used for engine testing to ensure engines deliver the expected performance prior to installation in the car, referred to as the test bench.
For the year ended December 31,
2017
, investments in plant, machinery and equipment of
€132 million
were composed of €74 million
related to the investments in cars production lines, €12 million of investments related to our personalization programs and €9 million related to engine assembly lines. The residual amount of capital expenditure in plant, machinery and equipment was largely related to the purchase of industrial tools needed for production of cars.
For the year ended December 31,
2016
, investments in plant, machinery and equipment of
€82 million
were composed of €34 million related to the investments in cars production lines, €14 million related to engine assembly line and €3 million of investments related to our personalization programs. The residual amount of capital expenditure in plant, machinery and equipment was largely related to the purchase of industrial tools needed for production of cars.
For the year ended December 31,
2015
, investments in plant, machinery and equipment of
€118 million
were composed of €72 million related to the investments in cars production lines, €27 million to test bench equipment and machinery and €1 million related to upgrade works performed on the wind tunnel. The residual amount of capital expenditure in plant, machinery and equipment was largely related to the purchase of industrial tools needed for production of cars.
Advances and assets under construction for the year ended December 31,
2017
amounted to
€39 million
(
€81 million
and
€32 million
for the years ended December 31,
2016
and
2015
, respectively). In particular, for the year ended December 31,
2017
,
2016
and
2015
, advances and assets under construction primarily related to investments in car production lines for models to be launched in future years
.
91
Net Debt and Net Industrial Debt
Net Industrial Debt is the primary measure used by us to analyze our financial leverage and capital structure, and is one of the key indicators, together with Net Debt, we use to measure our financial position. These measures are presented by management to aid investors in their analysis of the Group’s financial position and financial performance and to compare the Group’s financial position and financial performance with that of other companies. Net Industrial Debt is defined as total debt less cash and cash equivalents (Net Debt), further adjusted to exclude the funded portion of the self-liquidating financial receivables portfolio, which is the portion of our receivables from financing activities that we fund with external debt or intercompany loans. The following table sets forth a reconciliation of Net Debt and Net Industrial Debt at December 31, 2017 and 2016.
|
At December 31,
|
||||||
|
2017
|
2016
|
|||||
|
(€ million)
|
||||||
|
Cash and cash equivalents
|
648
|
|
458
|
|
||
|
Total liquidity
|
648
|
|
458
|
|
||
|
Bonds
|
(1,194
|
)
|
(498
|
)
|
||
|
Securitizations
|
(556
|
)
|
(486
|
)
|
||
|
Borrowings from banks
|
(38
|
)
|
(37
|
)
|
||
|
Term Loan
|
—
|
|
(800
|
)
|
||
|
Other debt
|
(18
|
)
|
(27
|
)
|
||
|
Total debt
|
(1,806
|
)
|
(1,848
|
)
|
||
|
Net Debt
|
(1,158
|
)
|
(1,390
|
)
|
||
|
Funded portion of the self-liquidating financial receivables portfolio
|
685
|
|
737
|
|
||
|
Net Industrial Debt
|
(473
|
)
|
(653
|
)
|
||
Cash and cash equivalents
Cash and cash equivalents were
€648 million
at December 31,
2017
compared to
€458 million
at December 31,
2016
. The increase in cash and cash equivalents was primarily driven by
€284 million
of Free Cash Flow, partially offset by
€85 million
of cash flows used in financing activities. See
“Cash Flows”
above for further details.
Approximately 67% percent of our cash and cash equivalents were denominated in Euro at December 31, 2017. Our cash and cash equivalents denominated in currencies other than the Euro are available mostly to Ferrari S.p.A. and certain subsidiaries which operate in areas other than the United States and Europe. Cash held in such countries may be subject to transfer restrictions depending on the jurisdictions in which these subsidiaries operate. In particular, cash held in China, which amounted to €66 million at December 31, 2017 (€48 million at December 31, 2016), is subject to certain repatriation restrictions and may only be repatriated as dividends. Based on our review, we do not currently believe that such transfer restrictions have an adverse impact on our ability to meet our liquidity requirements.
Cash collected from the settlement of receivables or lines of credit pledged as collateral is subject to certain restrictions regarding its use and is principally applied to repay principal and interest of the funding. Such cash amounted to
€28.2 million
and
€19.4 million
at December 31, 2017 and 2016, respectively.
92
The following table sets forth an analysis of the currencies in which our cash and cash equivalents were denominated at the dates presented:
|
At December 31,
|
|||||
|
2017
|
2016
|
||||
|
(€ million)
|
|||||
|
Euro
|
435
|
|
|
318
|
|
|
U.S. Dollar
|
88
|
|
|
16
|
|
|
Chinese Yuan
|
62
|
|
|
58
|
|
|
Japanese Yen
|
26
|
|
|
37
|
|
|
Other currencies
|
37
|
|
|
29
|
|
|
Total
|
648
|
|
|
458
|
|
Total Available Liquidity
Our total available liquidity (defined as cash and cash equivalents plus undrawn committed credit lines) at December 31, 2017 was €
1,148 million
(€
958 million
at December 31, 2016).
The following table summarizes our total available liquidity:
|
At December 31,
|
|||||
|
2017
|
2016
|
||||
|
(€ million)
|
|||||
|
Cash and cash equivalents
|
648
|
|
458
|
|
|
|
Undrawn committed credit lines
|
500
|
|
500
|
|
|
|
Total available liquidity
|
1,148
|
|
958
|
|
|
The undrawn committed credit lines relate to a revolving credit facility. See
“The Facility”
below for further details.
Borrowings from banks
Borrowings from banks at December 31, 2017 mainly relate to financial liabilities of FFS Inc to support the financial services operations, and in particular (i) €29 million (€24 million at December 31, 2016) relating to a U.S. Dollar denominated credit facility for up to $50 million (drawn down for $35 million at December 31, 2017) and bearing interest at LIBOR plus a range of between 65 and 75 basis points; (ii) other borrowings from banks of €9 million (€13 million at December 31, 2016) relating to various short and medium term credit facilities.
Borrowings from banks at December 31, 2016 also included €800 million relating to the Term Loan, which was fully repaid in 2017, primarily with proceeds from the 2021 Bond issued in November 2017. See “The Facility” below.
The Facility
On November 30, 2015, the Company, as borrower and guarantor, and certain other members of the Group, as borrowers, entered into a €2.5 billion facility with a syndicate of banks (the “Facility”). At inception, the Facility comprised a bridge loan of €500 million (the “Bridge Loan”), a term loan of €1,500 million (the “Term Loan”) and a revolving credit facility of €500 million (the “RCF”).
In December 2015 the Bridge Loan and Term Loan were fully drawn down for the purposes of repaying financial liabilities with FCA, including the FCA Note that originated as a result of the Restructuring.
In March 2016, the Bridge Loan was fully repaid, primarily using the proceeds from the 2023 Bond (see
“Bonds”
below).
93
In 2016 and 2017 the Company made scheduled payments and voluntary prepayments, funded in part with the proceeds of the 2021 Bond described under “Bonds” below, to fully repay the Term Loan.
At December 31, 2017 and 2016 the RCF was undrawn. Proceeds of the RCF may be used from time to time for general corporate and working capital purposes of the Group. The RCF has a maturity of five years from inception of the Facility.
Bonds
2023 Bond
On March 16, 2016, the Company issued 1.5 percent coupon notes due March 2023, having a principal of €500 million. The bond was issued at a discount for an issue price of 98.977 percent, resulting in net proceeds of €490.7 million after the debt discount and issuance costs. The net proceeds were used, together with additional cash held by the Company, to fully repay the €500 million Bridge Loan under the Facility. The bond is unrated and was admitted to trading on the regulated market of the Irish Stock Exchange. The amount outstanding at December 31, 2017 of €498.9 million includes accrued interest of €5.9 million.
2021 Bond
On November 16, 2017, the Company issued 0.25 percent coupon notes due January 2021, having a principal of €700 million. The bond was issued at a discount for an issue price of 99.557 percent, resulting in net proceeds of €694.2 million after the debt discount and issuance costs. The net proceeds were primarily used to repay the Term Loan. The bond is unrated and was admitted to trading on the regulated market of the Irish Stock Exchange. The amount outstanding at December 31, 2017 of €694.6 million includes accrued interest of €0.2 million.
The notes for both the 2023 Bond and the 2021 Bond impose covenants on Ferrari including: (i) negative pledge clauses which require that, in case any security interest upon assets of Ferrari is granted in connection with other notes or debt securities with the consent of Ferrari are, or are intended to be, listed, such security should be equally and ratably extended to the outstanding notes, subject to certain permitted exceptions; (ii) pari passu clauses, under which the notes rank and will rank pari passu with all other present and future unsubordinated and unsecured obligations of Ferrari; (iii) events of default for failure to pay principal or interest or comply with other obligations under the notes with specified cure periods or in the event of a payment default or acceleration of indebtedness or in the case of certain bankruptcy events; and (iv) other clauses that are customarily applicable to debt securities of issuers with a similar credit standing. A breach of these covenants may require the early repayment of the notes. As of December 31, 2017 and 2016, Ferrari was in compliance with the covenants of the notes.
Securitizations
In 2016 and 2017 FFS Inc has pursued a strategy of self-financing, further reducing dependency on intercompany funding and increasing the portion of self-liquidating debt with various securitization transactions.
On January 19, 2016, FFS Inc entered into a revolving securitization program for funding of up to
$250 million
by pledging retail financial receivables in the United States as collateral. In 2016, proceeds from the first sale of financial receivables were
$242 million
and were primarily used to repay intercompany loans. The funding limit of the program has been progressively increased over time, including to
$275 million
on December 16, 2016, to
$325 million
on July 14, 2017, and to $350 million on December 15, 2017. The notes bear interest at a rate per annum equal to the aggregate of LIBOR plus a margin of
65
basis points. As of December 31, 2017 total proceeds from the sales of financial receivables under the program were
$325 million
. The securitization agreement requires the maintenance of an interest rate cap.
On October 20, 2016, FFS Inc entered into a revolving securitization program for funding of up to
$200 million
by pledging leasing financial receivables in the United States as collateral. In 2016, proceeds from the first sale of financial receivables were
$175 million
and were primarily used to repay U.S. Dollar denominated bank borrowings. On April 21, 2017 the funding limit of the program was increased to $225 million and this amount remained unchanged in the renewal of the program in September 2017. The notes bear interest at a rate per annum equal to the aggregate of LIBOR plus a margin of
65
basis points. As of December 31, 2017, total proceeds from the sales of financial receivables under the program were
$222 million
.The securitization agreement requires the maintenance of an interest rate cap.
On December 28, 2016, FFS Inc entered into a revolving securitization program for funding of up to
$120 million
by pledging credit lines to Ferrari customers secured by personal vehicle collections and personal guarantees in the United States
94
as collateral. In 2016, proceeds from the first sale of financial receivables were
$64 million
and were primarily used to repay U.S. Dollar denominated bank borrowings. On December 20, 2017, the funding limit was increased to $135 million. The notes bear interest at a rate per annum equal to the aggregate of LIBOR plus a margin of
120
basis points. As of December 31, 2017 total proceeds from the sales of financial receivables under the program were $120 million. The securitization agreement does not require an interest rate cap.
Cash collected from the settlement of receivables or lines of credit pledged as collateral is subject to certain restrictions regarding its use and is principally applied to repay principal and interest of the funding. Such cash amounted to
€28.2 million
and
€19.4 million
at December 31, 2017 and 2016, respectively.
Other debt
Other debt primarily relates to funding for operating activities of our U.S. subsidiaries.
Free Cash Flow and Free Cash Flow from Industrial Activities
Free Cash Flow and Free Cash Flow from Industrial Activities are two of our primary key performance indicators to measure the Group’s performance. These measures are presented by management to aid investors in their analysis of the Group’s financial performance and to compare the Group’s financial performance with that of other companies. Free Cash Flow is defined as cash flows from operating activities less cash flows used in investing activities. Free Cash Flow from Industrial Activities is defined as Free Cash Flow adjusted for the change in the self-liquidating financial receivables portfolio, which is the change in our receivables from financing activities. The following table sets forth our Free Cash Flow and Free Cash Flow from Industrial Activities for the years ended December 31,
2017
,
2016
and
2015
.
|
For the years ended December 31,
|
||||||||
|
2017
|
2016
|
2015
|
||||||
|
(€ million)
|
||||||||
|
Cash flows from operating activities
|
663
|
|
1,005
|
|
707
|
|
||
|
Cash flows used in investing activities
|
(379
|
)
|
(320
|
)
|
(317
|
)
|
||
|
Free Cash Flow
|
284
|
|
685
|
|
390
|
|
||
|
Change in the self-liquidating financial receivables portfolio
|
44
|
|
(405
|
)
|
39
|
|
||
|
Free Cash Flow from Industrial Activities
|
328
|
|
280
|
|
429
|
|
||
Free Cash Flow for the year ended December 31,
2017
was
€284 million
compared to
€685 million
for the year ended December 31,
2016
. For an explanation of the drivers in Free Cash Flow see
“Cash Flows”
above.
Free Cash Flow from Industrial Activities for the year ended December 31,
2017
was
€328 million
compared to
€280 million
for the year ended December 31,
2016
. The increase was primarily attributable to an increase in EBITDA and a decrease in tax payments (primarily due to the fact that in 2016 we made payments to settle the 2015 tax balance from the FCA Group tax consolidation) partially offset by an increase in capital expenditures, advances no longer being received for the LaFerrari Aperta and cash absorbed from an increase in net working capital.
Free Cash Flow for the year ended December 31, 2016 was
€685 million
compared to
€390 million
for the year ended December 31, 2015. For an explanation of the drivers in Free Cash Flow see
“Cash Flows”
above.
Free Cash Flow from Industrial Activities for the year ended December 31,
2016
was
€280 million
compared to
€429 million
for the year ended December 31,
2015
. The decrease was primarily attributable to the impact in 2015 of (i) the one-time reimbursement of the financing of inventory related to the establishment of the Maserati standalone business in China of €160 million and (ii) proceeds of €37 million from Maserati S.p.A. for the disposal of assets and liabilities relating to investment properties.
Excluding these one-time effects in 2015, Free Cash Flow from Industrial Activities of €280 million in 2016 represented an increase of €48 million compared to €232 million of Free Cash Flow from Industrial Activities in 2015. Such increase is mainly attributable to an increase in Adjusted EBITDA from €748 million in 2015 to €880 million in 2016, as well as a positive change in net working capital in 2016 compared to 2015 and advances received for LaFerrari Aperta, which were partially offset
95
by an increase in income taxes paid, primarily attributable to payments of 2016 tax advances and settlement of the 2015 tax balance.
C. Research and Development, Patents and Licenses, etc.
Research and Development
For a detailed analysis of research and development costs, see “Item 4.B.
Business—Research and Development
”.
D. Trend Information
Please refer to “Item 5
. Operating and Financial Review and Prospects—Trends, Uncertainties and Opportunities
”
for information required by this item.
E. Off Balance Sheet Arrangements
We have entered into various off-balance sheet arrangements with unconsolidated third parties in the ordinary course of business. For additional information see Note 30 “Commitments” to our Consolidated Financial Statements included elsewhere in this document.
96
F. Tabular Disclosure of Contractual Obligations
The following table summarizes payments due under our significant contractual commitments at December 31, 2017:
|
Payments due by period
|
|||||||||||||||
|
1 year
|
1 to 3 years
|
3 to 5 years
|
After
5 years
|
Total
|
|||||||||||
|
(€ million)
|
|||||||||||||||
|
Long-term debt
(1)
|
258
|
|
307
|
|
700
|
|
500
|
|
1,765
|
|
|||||
|
Interest on long-term financial liabilities
(2)
|
16
|
|
24
|
|
17
|
|
8
|
|
65
|
|
|||||
|
Operating lease obligations
(3)
|
1
|
|
1
|
|
—
|
|
—
|
|
2
|
|
|||||
|
Unconditional minimum purchase obligations
(4)
|
137
|
|
102
|
|
6
|
|
4
|
|
249
|
|
|||||
|
Purchase obligations
(5)
|
18
|
|
20
|
|
—
|
|
—
|
|
38
|
|
|||||
|
Total contractual obligations
|
430
|
|
454
|
|
723
|
|
512
|
|
2,119
|
|
|||||
______________________________
|
(1)
|
Amounts presented relate to the principal amounts of long-term debt and exclude the related interest expense that will be paid when due. For additional information see Note 25 “Debt” to our Consolidated Financial Statements included elsewhere in this document. The table above does not include short-term debt obligations.
|
|
(2)
|
Amounts include interest payments based on contractual terms and current interest rates on our long-term debt. Interest rates based on variable rates included above were determined using the current rates in effect at December 31, 2017.
|
|
(3)
|
Operating lease obligations mainly relate to leases for commercial properties and certain assets used in our business.
|
|
(4)
|
Unconditional minimum purchase obligations relate to our unconditional purchase obligations to purchase a fixed or minimum quantity of goods and/or services from suppliers with fixed and determinable price provisions. From time to time, in the ordinary course of our business, we enter into various arrangements with key suppliers in order to establish strategic and technological advantages. In particular, such agreements primarily relate to the purchase of research and development services and to a lesser extent, tooling obligations. This amount also includes unconditional purchase obligations to purchase a minimum quantity of goods and/or services in connection with certain of our sponsorship contracts.
|
|
(5)
|
Purchase obligations represent obligations to purchase property, plant and equipment.
|
The long-term debt obligations reflected in the table above can be reconciled to the amount in the statement of financial position at December 31, 2017 as follows:
|
Amount
|
||
|
(€ million)
|
||
|
Debt
|
1,806
|
|
|
Short-term debt obligations
|
(47
|
)
|
|
Amortized cost effects
|
6
|
|
|
Long-term debt
|
1,765
|
|
Pension, post-employment benefits and other provisions for employees
We provide post-employment benefits for certain of our active employees and retirees. We classify these benefits on the basis of the type of benefit provided and in particular as defined contribution plans, defined benefit obligations and other provisions for employees.
At December 31, 2017
the liability for such obligations amounted to
€84 million
(
€91 million
at
December 31, 2016
). See Note 23 to the Consolidated Financial Statements.
G. Safe Harbor
See section entitled “
Forward-Looking Statements
”
at the beginning of this report.
97
A. Directors and Senior Management
Set forth below is the name, year of birth and position of each of the persons currently serving as directors of Ferrari N.V. Unless otherwise indicated, the business address of each person listed below will be c/o Ferrari, Via Abetone Inferiore n. 4, I-41053 Maranello (MO), Italy. The current Board of Directors of Ferrari was appointed effective as of April 14, 2017 and its term of office will expire on the day the next Annual General Meeting of Shareholders is held, which is currently expected to be held on April 13, 2018.
|
Name
|
Year of Birth
|
Position
|
||
|
Sergio Marchionne
|
1952
|
Chairman, Chief Executive Officer and Executive Director
|
||
|
John Elkann
|
1976
|
Vice Chairman and Non-Executive Director
|
||
|
Piero Ferrari
|
1945
|
Vice Chairman and Non-Executive Director
|
||
|
Delphine Arnault
|
1975
|
Non-Executive Director
|
||
|
Louis C. Camilleri
|
1955
|
Senior Non-Executive Director
|
||
|
Giuseppina Capaldo
|
1969
|
Non-Executive Director
|
||
|
Eddy Cue
|
1964
|
Non-Executive Director
|
||
|
Sergio Duca
|
1947
|
Non-Executive Director
|
||
|
Lapo Elkann
|
1977
|
Non-Executive Director
|
||
|
Amedeo Felisa
|
1946
|
Non-Executive Director
|
||
|
Maria Patrizia Grieco
|
1952
|
Non-Executive Director
|
||
|
Adam Keswick
|
1973
|
Non-Executive Director
|
||
|
Elena Zambon
|
1964
|
Non-Executive Director
|
||
Summary biographies for persons who are currently directors of Ferrari are included below:
Sergio Marchionne
. Mr. Marchionne is the Chairman and Chief Executive Officer of Ferrari N.V.. Mr. Marchionne is also the Chairman of Ferrari S.p.A. since October 2014 and the Chief Executive Officer since June 2016. Mr. Marchionne currently serves as Chief Executive Officer of FCA, and Chairman and Chief Executive Officer of FCA U.S.. Mr. Marchionne leads FCA’s Group Executive Council and has been Chief Operating Officer of its NAFTA region since September 2011. He also serves as Chairman of CNH Industrial N.V. (“CNHI”). He was the chairman of Fiat Industrial and CNH Global N.V. until the integration of these companies into CNHI in 2013. Prior to joining FCA, Mr. Marchionne served as Chief Executive Officer of SGS SA, Chief Executive Officer of the Lonza Group Ltd. and Chief Executive Officer of Alusuisse Lonza (Algroup). He also served as Vice President of Legal and Corporate Development and Chief Financial Officer of the Lawson Group after serving as Vice President of Finance and Chief Financial Officer of Acklands Ltd. and Executive Vice President of Glenex Industries. Mr. Marchionne holds a Bachelor of Laws from Osgoode Hall Law School at York University in Toronto, Canada and a Master of Business Administration from the University of Windsor, Canada. Mr. Marchionne also holds a Bachelor of Arts with a major in Philosophy and minor in Economics from the University of Toronto. Mr. Marchionne serves on the Board of Directors of Philip Morris International Inc. and as Executive Chairman of SGS SA headquartered in Geneva. Additionally, Mr. Marchionne is non-executive Vice Chairman of Exor N.V.. Mr. Marchionne is a member of the Board of Directors of ACEA (European Automobile Manufacturers Association). He previously served as appointed non-executive Vice Chairman and Senior Independent Director of UBS AG.
John Elkann.
Mr. John Elkann is Vice Chairman of Ferrari N.V., Chairman and Chief Executive Officer of EXOR and Chairman of Fiat Chrysler Automobiles N.V.. Born in New York in 1976, Mr. Elkann obtained a scientific baccalaureate from the Lycée Victor Duruy in Paris and graduated in Engineering from Politecnico, the Engineering University of Turin. While at university, he gained work experience in various companies of the Fiat Group in the UK and Poland (manufacturing) as well as in France (sales and marketing). He started his professional career in 2001 at General Electric as a member of the Corporate Audit Staff, with assignments in Asia, the USA and Europe. John Elkann is Chairman of Giovanni Agnelli B.V. and of PartnerRe. He is Vice Chairman of Ferrari S.p.A. and a board member of The Economist Group and of GEDI Gruppo Editoriale S.p.A.. Mr. Elkann is a trustee of MoMA. He also serves as Vice Chairman of the Italian Aspen Institute and of the Giovanni Agnelli Foundation. Mr. John Elkann is the brother of Mr. Lapo Elkann (Non-Executive Director).
98
Piero Ferrari.
Mr. Piero Ferrari is Vice Chairman of Ferrari N.V. and he has been Vice Chairman of Ferrari S.p.A. since 1988. He also serves as Chairman of HPE-COXA, is a board member of Ferretti Group and a board member and Vice President of CRN Ancona (Ferretti Group). He was President of Piaggio Aero Industries S.p.A. from 1998 to 2014 and served as Chairman of the Italian Motor Sport Commission (CSAI) from 1998 to 2001 and BA SERVICE from 2000 to 2015. He was also a board member and Vice President of Banca Popolare dell’Emilia Romagna in Modena from 2002 to 2011 and from 2001 to 2014 respectively. The son of Ferrari’s founder Enzo Ferrari, Mr. Piero Ferrari covered a variety of management positions in the motor sport division of Ferrari from 1970 to 1988 with increasing responsibilities. His first position with Ferrari dates back to 1965 working on the production of the Dino 206 Competizione racing car. Mr. Piero Ferrari received an honorary degree in Aerospace Engineering from the University of Naples Federico II in 2004 and an Honorary Degree in Mechanical Engineering from the University of Modena and Reggio Emilia in 2005. In 2004, Mr. Piero Ferrari was awarded the title of Cavaliere del Lavoro.
Delphine Arnault.
Born on April 4th 1975, Ms. Delphine Arnault graduated from the EDHEC Business School and the London School of Economics. She began her career at McKinsey & Company, the global management consultancy firm, where she was a Consultant for two years. In 2001, she joined the Executive Committee of Christian Dior Couture where she directed several product lines. She was appointed Deputy General Manager of Christian Dior Couture in 2008 and in September 2013 Deputy General Manager of Louis Vuitton Malletier. She has been a main board director of LVMH Moët Hennessy Louis Vuitton SA since 2003. Delphine was appointed to the board of Château Cheval Blanc, the Saint-Emilion premier grand cru classé, and, until 2017, sat on the supervisory board of
Les Echos
, the leading French business daily. In 2002 she joined the board of Loewe, the celebrated Spanish leather goods company, and was appointed to Pucci’s Board of Directors in 2007. She was appointed to the boards of Céline in December 2011, Christian Dior SE in April 2012 and 21st Century Fox in June 2013. In December 2015 she joined the board of the Italian jeweler Repossi, in which LVMH is a shareholder. Delphine Arnault has also been a member of the supervisory board of M6 Group since November 2009 and of Havas since May 2013.
Louis C. Camilleri.
Mr. Camilleri is Senior Non-Executive Director and Chairman of the Board of Directors of Ferrari N.V.. Mr. Camilleri currently serves as Non-Executive Chairman of the Board of Philip Morris International Inc. (“PMI”). From March 2008 to May 2013, he served as Chairman and Chief Executive Officer of PMI. From April 2002 and August 2002 until March 2008, he was Chief Executive Officer and Chairman of Altria Group, Inc., respectively. From November 1996 to April 2002, he served as Senior Vice President and Chief Financial Officer of Altria Group, Inc. He had been employed continuously by Altria Group, Inc. and its subsidiaries (including PMI) in various capacities since 1978. Mr. Camilleri was appointed to the Board of Directors of América Móvil, S.A.B. de C.V. in April 2011, and previously served on the Board of Telmex International SAB from December 2009. Mr. Camilleri was a director of Kraft Foods Inc. (“Kraft”) from March 2001 to December 2007 and was Kraft’s Chairman from September 2002 to March 2007. Mr. Camilleri received a degree in Economics and Business Administration from HEC Lausanne, the Faculty of Business & Economics of the University of Lausanne (Switzerland).
Giuseppina Capaldo.
Ms. Capaldo is Full Professor of Private Law, at “La Sapienza” University of Rome. She is an independent member of the Board of Directors of Salini Impregilo S.p.A. (2012-present) and Banca Monte dei Paschi S.p.A. (2017-present). She was an independent member of the Board of Directors of Exor S.p.A. from 2012 to 2015 and Credito Fondiario S.p.A. (2014-2017). She was a member of the Board of Directors of Ariscom S.p.A. (an Italian insurance company) from 2012-2015 and A.D.I.R. - Assicurazioni di Roma (2006-2010). She collaborated with the Macchi di Cellere Gangemi law firm in the Banking and Finance, Corporate and M&A sectors (2004-2007). She has been Deputy Rector for Resource Planning and Assets (since 2014) at La Sapienza University; Director of LLM “Financial Markets Law” (since 2009). Previously, she served as Deputy Rector for Strategic Planning (2008-2014); Head of Department of “Law and Business” (2007-2013); and Director of PhD “Contract Law and Business” (2007-2011). Ms. Capaldo has a degree in Economics and a degree in Law from “La Sapienza” University of Rome, has been a licensed certified public accountant since 1992 and is listed in the Register of Independent Auditors (since 1999). In addition, Ms. Capaldo has been qualified to practice law in Italy since 2003. She authored several publications in the areas of contract law, insurance law, financial law and market legal theory.
Eddy Cue.
Mr. Cue currently serves as Apple Inc.’s Senior Vice President of Internet Software and Services. He joined Apple in 1989 and oversees Apple’s industry-leading content stores including the iTunes Store, the App Store and the iBooks Store, as well as Apple Pay, Siri, Maps, iAd, the iCloud services, and Apple’s productivity and creativity apps. Mr. Cue earned a bachelor’s degree in Computer Science and Economics from Duke University. He was recognized by renowned cancer research center City of Hope with their 2014 Spirit of Life Award, honoring an individual whose work has fundamentally impacted the music, film and entertainment industry.
99
Sergio Duca.
Mr. Duca is the Chairman of the Board of Statutory Auditors of Enel S.p.A. since April 2010 and a member of the Statutory Auditors of BasicNet S.p.A. since 2017. He also serves as Chairman of the Board of Auditors of the Fondazione per la Scuola of Compagnia di San Paolo and ISPI (Institute for the Study of International Politics), as well as a member of the board of auditors of the Intesa San Paolo Foundation Onlus. Mr. Duca has previously served as Chairman of the Board of Directors of Orizzonte SGR S.p.A. from 2008 until 2016, Chairman of the Board of Statutory Auditors of Exor S.p.A. until May 2015, Chairman of the Board of Statutory Auditors and effective auditor of GTech until April 2015, a member of the Board of ASTM S.p.A. and Chairman of the Audit Committee of ASTM S.p.A. from 2010 until 2013, Chairman of the Board of Statutory Auditors of Tosetti Value SIM and an independent director of Sella Gestione SGR until April 2010. From 1997 until July 2007, Mr. Duca was the Chairman of PricewaterhouseCoopers S.p.A.. In addition, he has previously served as Chairman of the Board of Auditors of the Silvio Tronchetti Provera Foundation, Chairman of the board of auditors of Compagnia di San Paolo until May 2016, member of the Edison Foundation’s advisory board and the University Bocconi in Milan’s development committee, as well as Chairman of the Bocconi’s Alumni Association’s Board of Auditors and a member of the Board of Auditors of the ANDAF (Italian Association of Chief Financial Officers). As a certified chartered accountant and auditor, he acquired broad experience through the PricewaterhouseCoopers network as the external auditor of a number of significant Italian listed companies. Mr. Duca graduated with honors in Economics and Business from University Bocconi in Milan.
Lapo Elkann
. Mr. Lapo Edovard Elkann is Chairman and Founder of Italia Independent Group and of Garage Italia Customs. Born in New York in 1977, after studying in France and England and gaining experience as assistant to Henry Kissinger, Lapo emerged as Worldwide Brand Promotion Director for Fiat Group where he successfully carried out several projects in below-the-line marketing and participated in the relaunch of the Fiat 500. In 2007 he undertook the entrepreneurial path founding the lifestyle brand “Italia Independent”, the creative factory “Independent Ideas” and the Holding “Italia Independent Group”, which was listed on the Italian Stock Exchange in June 2013. In 2011 he started a collaboration with Ferrari to create the Tailor Made Unit. In March 2015 he founded Garage Italia Customs, a customization service for the motion industry. In July 2013 he was inducted in the Automotive Hall of Fame, the American institution dedicated to preserving and celebrating outstanding automotive achievement. Lapo Elkann also serves on the Board of Directors of Pinacoteca Giovanni e Marella Agnelli. Mr. Lapo Elkann is the brother of Mr. John Elkann (Vice Chairman and Non-Executive Director).
Amedeo Felisa.
Mr. Felisa, who joined Ferrari in 1990, was the CEO of Ferrari S.p.A. from 2008 until June 2016. From 2006 to 2008 he served as General Manager and Deputy General Manager. From 1996 to 2004 he was the General Manager of the GT department, coordinating the product development, powertrains and vehicle departments of both Ferrari and Maserati with respect to the market positioning of the two brands. In the 1990s, as a Technical Senior Vice President, Mr. Felisa oversaw the planning, coordination and management of the entire technical department, including defining new business model plans, supervising the development of both innovation and products and managing the product development teams, including ensuring employee growth. Prior to joining Ferrari, he was a product development team leader at Alfa Romeo S.p.A.. Mr. Felisa holds a degree in mechanic engineering from the Milan Politecnico.
Maria Patrizia Grieco
. Mrs. Maria Patrizia Grieco has been the Chairman of the Board of Directors of Enel since May 2014. After graduating in law at the University of Milan, she started her career in 1977 at Italtel, where in 1994 she became Chief of the Legal and General Affairs directorate. In 1999, she was appointed General Manager to re-organize and reposition the company, and in 2002 she became Chief Executive Officer. Subsequently, she held the positions of Chief Executive Officer of Siemens Informatica, Partner of Value Partners and Chief Executive Officer of the Group Value Team (today NTT Data). From 2008 to 2013, she was Chief Executive Officer of Olivetti, where she also held the role of Chairman from 2011. She has been a director of Fiat Industrial and she is currently on the boards of Anima Holding, Ferrari, Amplifon, CIR and Bocconi University. Mrs. Grieco is also a member of the steering committee of Assonime. Maria Patrizia Grieco was appointed Chairman of the Italian Corporate Governance Committee in 2017. The purpose of the Committee is the promotion of good corporate governance practices of Italian listed companies.
Adam Keswick
. Mr. Adam Keswick was appointed Non-Executive Director of Jardine Matheson in 2016. He first joined the Jardine Matheson Group in 2001 before being appointed to the Board of Jardine Matheson in 2007. He was Deputy Managing Director of Jardine Matheson from 2012 to 2016 and became Chairman of Matheson & Co. in August 2016. Mr. Keswick is also Deputy Chairman of Jardine Lloyd Thompson and a director of Dairy Farm, Hongkong Land, Jardine Strategic and Mandarin Oriental. He is also a supervisory board member of Rothschild & Co..
100
Elena Zambon.
Ms. Zambon is President of Zambon S.p.A., a multinational pharmaceutical company founded in Vicenza in 1906, Vice President of ZaCh - Zambon Chemicals and member of the Board of Zambon Company S.p.A., holding company of the group. Ms. Zambon is the founder of Secofind, the multi-family office of the Zambon family, and President of the Foundation Zoé - Zambon Open Education. Ms. Zambon is a member of the Board of Unicredit and a member of the Board of IIT - Istituto Italiano di Tecnologia (Italian Institute of Technology). Furthermore, Ms. Zambon is President of AIdAF, the Italian Association of Family Businesses, a board member of FBN, Family Business Network, and Vice President of Aspen Institute Italia. In June 2017, Elena Zambon was appointed Vice President of Assolombarda for Research, Open Innovation, Life Sciences, EMA and Technopole. In June 2014 she was nominated “Cavaliere del Lavoro” by the President of the Italian Republic and has received the award “Imprenditore Olivettiano 2010” and “Marisa Belisario 2010”, annually assigned to women who have distinguished themselves in the business world. From 1989 to 1994, Ms. Zambon worked for Citibank. Ms. Zambon was born in Vicenza in 1964, and received a bachelor degree in Business Administration at the University “Bocconi” in Milan.
Ferrari’s management consists of a Group Executive Council, or GEC, led by the Chairman. Set forth below are the names, year of birth and position of each of the members of the GEC of Ferrari. Unless otherwise indicated, the business address of each person listed below will be c/o Ferrari, Via Abetone Inferiore n. 4, I-41053 Maranello (MO), Italy.
|
Name
|
Year of Birth
|
Position
|
||
|
Sergio Marchionne
|
1952
|
Chairman and Chief Executive Officer
|
||
|
Alessandro Gili
|
1971
|
Chief Financial Officer
|
||
|
Maurizio Arrivabene
|
1957
|
Managing Director of
Gestione Sportiva
|
||
|
Michele Antoniazzi
|
1969
|
Head of Human Resources
|
||
|
Nicola Boari
|
1970
|
Head of Product Marketing
|
||
|
Luca Fuso
|
1961
|
Chief Brand Officer
|
||
|
Enrico Galliera
|
1966
|
Chief Marketing and Commercial Officer
|
||
|
Michael Hugo Leiters
|
1971
|
Chief Technology Officer
|
||
|
Flavio Manzoni
|
1965
|
Head of Design
|
||
|
Vincenzo Regazzoni
|
1963
|
Chief Manufacturing Officer
|
||
Biographies for the members of the GEC of Ferrari are included below:
Sergio Marchionne.
See above.
Alessandro Gili.
Mr. Gili was appointed as our Chief Financial Officer in February 2015. In April 2015 he was also appointed as President of Ferrari Financial Services S.p.A.. In December 2016 he was assigned responsibility for Information and Communication Technology (ICT), Enterprise Risk Management (ERM) and Sustainability Reporting. From 2002 to 2014 he held multiple positions with Fiat, FCA US and FCA, including Group Chief Accounting Officer and Principal Accounting Officer, Vice President of World Class Finance and Processes, Corporate Controller and Chief Accounting Officer for FCA US, Head of Accounting and World Class Finance, Fiat Group Automobiles Sector, Director at Fiat Gesco (now FCA Services S.p.A.) and senior manager for KeyG Consulting S.p.A.. Prior to joining the Fiat Group Mr. Gili was a project manager for Innovative Redesign Managements Consultants. Mr. Gili spent the first years of his career in Audit at Coopers & Lybrand. Mr. Gili holds a degree in economics, finance and administration from Turin University and is a Certified Public Accountant and Certified Public Auditor in Italy.
Maurizio Arrivabene.
Mr. Maurizio Arrivabene was appointed as Managing Director of Ferrari Gestione Sportiva (Formula 1 activities) and Team Principal of Scuderia Ferrari in January 2015. From 1997 to 2014, he held multiple positions with Philip Morris International Management SA, most recently as Vice President of Marlboro Global Communication and Promotions and Event Marketing (from 2008 to 2011) and Vice President of Consumers, Channel Strategy and Event Marketing (from 2011 to 2014). Since 2010, Mr. Arrivabene is a member of the FIA Formula One Commission, initially representing Formula One sponsors and, since January 2015, representing Scuderia Ferrari. Since 2012 Mr. Arrivabene is serving as a member of the Board of Directors of Juventus F.C. S.p.A., where he has also been member of the Control and Risks Committee and the Nomination and Remuneration Committee from 2012 until 2015. Mr. Arrivabene studied architecture at the University of Venice and attended advanced courses at the IMD in Lausanne, Switzerland.
101
Michele Antoniazzi
. Mr. Michele Antoniazzi is Chief Human Resources Officer since April 2016. Before joining Ferrari, he held several senior roles in Magneti Marelli, becoming the Human Resources Director of the Automotive Lighting business line in 2012. Prior to that experience he was the Human Resources Director of the Suspension Systems business line from 2009 to 2012 and the Head of Organizational Development for the Sector Magneti Marelli from 2006 to 2012. He graduated from the University of Padova with a degree in Industrial and Organizational Psychology.
Nicola Boari.
Mr. Boari was appointed as our Head of Product Marketing and Market Intelligence in March 2010. Prior to joining Ferrari he worked at Indesit Company from 2004 to 2010, where he held various positions including product marketing director, responsible for product development for all product lines. From 1998 to 2004 he was a manager with the Boston Consulting Group. Mr. Boari holds a master in finance and economics from the London School of Economics and a PhD in economics from the University of Ancona, as well as a degree in finance and economics from the University of Bologna.
Luca Fuso.
Mr. Fuso was appointed as our Chief Brand Officer in September 2015. Prior to joining Ferrari, Mr. Fuso served as the Global Head of Proprietary Brand Division from 2013 to 2015 and as the Global Head of Licensed Brands Division from 2011 to 2013 of the SAFILO Group, an Italian eyewear designer and manufacturer. He has also previously served as Managing Director, Sportswear Division of Moncler - Industries S.p.A., an Italian apparel manufacturer and lifestyle brand, CEO and Managing Director of B&B Italia S.p.A., an Italian furniture company, and General Manager Business and various other roles at Diesel S.p.A., an Italian clothing company. Mr. Fuso received his degree in Business Administration from Perugia University and completed the Strategic Marketing Program at SDA Bocconi in Milan.
Enrico Galliera.
Mr. Galliera was appointed as our Chief Marketing and Commercial Officer in April 2010. From 1990 to 2010 he worked for Barilla S.p.A, where he held multiple positions, ultimately becoming Europe and export market unit director. During his time at Barilla S.p.A., Mr. Galliera also served as director of customer business development for Europe, general manager for South West Europe and trade marketing director for Italy. Mr. Galliera holds a degree in economics and political science from the University of Parma.
Michael Hugo Leiters.
Mr. Leiters was appointed as our Chief Technology Officer in January 2014. Prior to joining Ferrari he worked at Porsche AG from 2000 to 2013 where he held multiple positions, ultimately becoming head of the SUV product line in 2010. From 1996 to 2000, he served as an engineer and manager at the
Institut fur Produktionstechnologie
in Aachen, Germany. Mr. Leiters holds an engineering diploma and an engineering doctorate from RWTH-Aachen.
Flavio Manzoni.
Mr. Manzoni was appointed as our Head of Design in January 2010. From 2007 to 2010 he was Director of Creative Design at the Volkswagen Group where he was involved in designing most of the Skoda, Bentley, Bugatti and Volkswagen recent cars as well as redefining the aesthetic philosophy of these brands. From 2001 to 2006, he worked at Fiat Group as Head of Design for Lancia, Fiat and LCV. He has also held design positions at Lancia and Seat. Mr. Manzoni holds a degree in architecture with a thesis in industrial design from the University of Florence.
Vincenzo Regazzoni.
Mr. Regazzoni was appointed as our Chief Manufacturing Officer in March 2015. Prior to his appointment to that role, he held various senior production and industrial performance roles at Ferrari and Maserati, including head of Technologies and Infrastructure from 2010 to 2015 and head of Process/Product Technologies from 2003 to 2010. Prior to joining Ferrari in 1998, he held production roles at Varian S.p.A. and Fiat Auto S.p.A.. Mr. Regazzoni has a degree in mechanical engineering with a specialization in management systems and plant from Tor Vergata University in Rome.
102
B. Compensation
Introduction
This description below summarizes the remuneration policy applicable to the executive and non-executive directors of the Company and the remuneration paid to these individuals for the year ended on December 31, 2017. The form and amount of compensation received by the directors of Ferrari for the year ended on December 31, 2017 was determined in accordance with the remuneration policy. The Company may from time to time amend the remuneration policy subject to Shareholders’ approval when necessary.
Remuneration Policy for Executive Directors
The Board of Directors determines the compensation for our executive directors at the recommendation of the Compensation Committee and with reference to the remuneration policy. The remuneration policy is approved by our shareholders and is published on our corporate website
www.ferrari.com
.
The objective of the remuneration policy is to provide a compensation structure that allows us to attract and retain the most highly qualified executive talent and by motivating such executives to achieve business and financial goals that create long-term value for shareholders in a manner consistent with our core business and leadership values.
The policy is aligned with Dutch law and the Dutch Corporate Governance Code.
Features of the remuneration for executive directors
The remuneration policy aims to provide total compensation that:
|
•
|
attracts, retains and motivates qualified executives;
|
|
•
|
is competitive as compared to the compensation paid by comparable companies;
|
|
•
|
reinforces our performance driven culture and meritocracy; and
|
|
•
|
is aligned to shareholders interests.
|
The compensation structure for executive directors includes a fixed component and a variable component based on short and long-term performance. We believe that this compensation structure promotes the interests of Ferrari in the short and the long-term and is designed to encourage the executive directors to act in the best interests of Ferrari. In determining the level and structure of the compensation of the executive directors, the non-executive directors will take into account, among other things, Ferrari’s financial and operational results and other business objectives. We establish target compensation levels using a market-based approach and we periodically benchmark our executive compensation program against peer companies and monitor compensation levels and trends in the market.
Remuneration elements
On the basis of the remuneration policy objectives, compensation of executive directors consists,
inter alia
, of the following elements discussed below. We note that only the long-term incentives element was applicable in 2017.
Fixed component
The primary objective of the base salary (the fixed part of the annual cash compensation) for executive directors is to attract and retain highly qualified senior executives. Our policy is to periodically benchmark comparable salaries paid to executives with similar experience by comparable companies.
103
Variable components
Executive directors are also eligible to receive variable compensation subject to the achievement of pre-established financial and other identified performance targets. The short and long-term components of executive directors’ variable remuneration are linked to predetermined, assessable targets and add to long-term shareholder creation.
Short-term incentives
The primary objective of performance based short-term variable cash based incentives is to incentivize the executive directors to focus on the business priorities for the current or next year. The executive directors’ variable remuneration is linked to the achievement of short-term (i.e. annual) financial and other identified objectives proposed by the Compensation Committee and approved by the non-executive directors each year.
To determine the executive directors’ annual performance bonus, the Compensation Committee and the non-executive directors:
|
•
|
approve the executive directors’ targets and maximum allowable bonuses;
|
|
•
|
select the appropriate metrics and their weighting;
|
|
•
|
set the stretch objectives;
|
|
•
|
consider any unusual items in a performance year to determine the appropriate measurement of achievement; and
|
|
•
|
approve the final bonus determination.
|
In addition, upon proposal of the Compensation Committee, the non-executive directors have authority to grant periodic bonuses for specific transactions that are deemed exceptional in terms of strategic importance and effect on Ferrari’s results. The form of any such bonus (cash, common shares of Ferrari or options to purchase common shares) is determined by the non-executive directors from time to time.
Long-term incentives
Following the approval of the equity incentive plan by the Board of Directors, upon the recommendation of the Compensation Committee, on March 1, 2017, on April 14, 2017 the Shareholders approved an award to the Chief Executive Officer under the Company’s equity incentive plan. In particular, 450 thousand performance share units (“PSUs”) have been awarded to the Chief Executive Officer. The grants of the PSUs, which each represent the right to receive one common share of the Company, cover a five-year performance period from 2016 to 2020, consistent with the Company’s strategic horizon.
We believe that the equity incentive plan increases the alignment between the Company’s performance and shareholder interests, by linking the compensation opportunity of the Chief Executive Officer of the Company to increasing shareholder value.
The PSUs vest in three equal tranches in March 2019, 2020 and 2021, subject to the achievement of a market performance condition related to Total Shareholder Return (“TSR”). The interim partial vesting periods are independent of one another and any under-achievement in one period can be offset by over-achievement in subsequent periods. The target amount of PSUs vest as follows based on the Company’s TSR ranking compared to an industry specific peer group of eight, including the Company, (“Peer Group”):
|
Ferrari TSR Ranking
|
% of Target Awards that Vest
|
|
1
|
150%
|
|
2
|
120%
|
|
3
|
100%
|
|
4
|
75%
|
|
5
|
50%
|
104
The defined Peer Group is as follows:
|
Hermes
|
Burberry
|
Brunello Cucinelli
|
Ferragamo
|
|
LVMH
|
Moncler
|
Richemont
|
|
The total number of shares that will eventually be issued upon vesting of the PSUs may vary from the original award of 450 thousand, depending on the level of TSR performance achieved compared to the Peer Group.
The performance period for the PSUs commenced on January 1, 2016. The fair value of the awards used for accounting purposes was measured at the grant date using a Monte Carlo Simulation model. The range of the fair value of the PSUs that were awarded is €68.18-€72.06 per share. The key assumptions utilized to calculate the grant-date fair values for these awards are summarized below:
|
Key Assumptions
|
|
|
Grant date share price
|
€66.85
|
|
Expected volatility
|
17.4%
|
|
Dividend yield
|
1.2%
|
|
Risk-free rate
|
0%
|
The expected volatility was based on the observed volatility of the Peer Group. The risk-free rate was based on the iBoxx sovereign Eurozone yield.
Other benefits
Executive directors may also be entitled to customary fringe benefits such as personal use of aircraft, company car and driver, personal/home security, medical insurance, accident insurance, tax preparation and financial counseling. The Compensation Committee may grant other benefits to the executive directors in particular circumstances.
Internal pay ratios
The Company is not disclosing pay ratios for 2017 compensation, as the Dutch Corporate Governance Code does not describe the methodology to determine and disclose such ratios. The Company will continue to monitor the new and still evolving guidance under the Dutch Corporate Governance Code.
Remuneration Policy for Non-Executive Directors
Remuneration of non-executive directors is approved by the Company’s shareholders and periodically reviewed by the Compensation Committee.
Remuneration of non-executive directors is fixed and not dependent on the Company’s financial results. Non-executive directors are not eligible for variable compensation and do not participate in any incentive plans.
The current annual remuneration for the non-executive directors (which was approved at the Annual General Meeting of Shareholders’ of the Company, held on April 14, 2017) is:
|
•
|
$75,000 for each non-executive director.
|
|
•
|
An additional $10,000 for each member of the Audit Committee and $20,000 for the Audit Committee Chairman.
|
|
•
|
An additional $5,000 for each member of the Compensation Committee and the Governance and Sustainability Committee and $15,000 for the Compensation Committee Chairman and the Governance and Sustainability Committee Chairman.
|
|
•
|
An additional $25,000 for the lead non-executive director.
|
All remuneration of the non-executive directors will be paid in cash.
105
The Board of Directors will determine stock ownership guidelines applicable to directors and employees. The Compensation Committee has been considering options for determining formal stock ownership guidelines that will apply in connection with the first vesting opportunity under the Company’s equity incentive plan in 2019.
106
Directors’ Compensation
The following table summarizes the remuneration received by the members of the Board of Directors for the year ended December 31, 2017 from Ferrari and its subsidiaries.
|
Name
|
Office held
|
In office from/to
|
Annual fee (€)
|
Other compensation
(€) |
Total
|
|||
|
Sergio Marchionne
(1)
|
Chairman, Chief Executive Officer and Executive Director
|
01/01/17-12/31/17
|
—
|
|
—
|
|
—
|
|
|
John Elkann
|
Vice Chairman and Non-Executive Director
|
01/01/17-12/31/17
|
115,317
|
|
—
|
|
115,317
|
|
|
Piero Ferrari
|
Vice Chairman and Non-Executive Director
|
01/01/17-12/31/17
|
102,039
|
|
9,880
(2)
|
|
111,919
|
|
|
Delphine Arnault
|
Non-Executive Director
|
01/01/17-12/31/17
|
97,614
|
|
—
|
|
97,614
|
|
|
Louis C. Camilleri
|
Senior Non-Executive Director
|
01/01/17-12/31/17
|
133,021
|
|
—
|
|
133,021
|
|
|
Giuseppina Capaldo
|
Non-Executive Director
|
01/01/17-12/31/17
|
106,465
|
|
—
|
|
106,465
|
|
|
Eddy Cue
|
Non-Executive Director
|
01/01/17-12/31/17
|
102,039
|
|
—
|
|
102,039
|
|
|
Sergio Duca
|
Non-Executive Director
|
01/01/17-12/31/17
|
119,743
|
|
—
|
|
119,743
|
|
|
Lapo Elkann
|
Non-Executive Director
|
01/01/17-12/31/17
|
97,614
|
|
—
|
|
97,614
|
|
|
Amedeo Felisa
(3)
|
Non-Executive Director
|
01/01/17-12/31/17
|
47,655
|
|
40,000
(3)
|
|
87,655
|
|
|
Maria Patrizia Grieco
|
Non-Executive Director
|
01/01/17-12/31/17
|
106,465
|
|
—
|
|
106,465
|
|
|
Adam Keswick
|
Non-Executive Director
|
01/01/17-12/31/17
|
97,614
|
|
—
|
|
97,614
|
|
|
Elena Zambon
|
Non-Executive Director
|
01/01/17-12/31/17
|
102,039
|
|
—
|
|
102,039
|
|
|
(1)
|
No fixed compensation was paid by Ferrari or any of its subsidiaries to Mr. Marchionne in his capacity as Chairman or Chief Executive Officer for the year ended December 31, 2017.
|
|
(2)
|
Relates to a car benefit provided to the Vice-Chairman in accordance with the Remuneration policy of the Company.
|
|
(3)
|
Mr. Felisa served on the Board of Directors as Executive Director with a specific consultancy contract until the Annual General Meeting of Shareholders held on April 14, 2017, following which Mr Felisa served as Non-Executive Director.
|
Share-Based Compensation of Executive Directors
The following table gives an overview of the share plans held by the Chief Executive Officer.
|
Name
|
Grant Date
|
Vesting Date
|
Fair Value on
Grant Date
|
Awards Granted
|
Awards Vested
|
||
|
Sergio Marchionne
|
April 14, 2017
|
2019 / 2020 / 2021
|
€68.18 - €72.06
|
450,000
|
|
—
|
|
The above awards relate to 450 thousand PSUs awarded to the CEO under the equity incentive plan, which covers a five-year performance period from 2016 to 2020, consistent with the Company’s strategic horizon. The PSU awards vest in three equal tranches in March 2019, 2020 and 2021, subject to the achievement of a market performance condition related to Total Shareholder Return. At December 31, 2017 none of the PSU awards had vested. The total cost recognized in 2017 for the performance period 2016 and 2017 amounted to approximately €16.5 million. For further details please see Note 22
“Share-Based Compensation”
to the Consolidated Financial Statements.
Compensation of the members of the GEC
The compensation paid to or accrued during the year ended December 31, 2017 by Ferrari and its subsidiaries to the members of the GEC (excluding the CEO) amounted to €16.0 million in aggregate, including €4.7 million for share-based compensation in relation to PSUs and RSUs awarded to key management under the equity incentive plan for the performance period covering 2016 and 2017. The PSU and RSU awards vest in three equal tranches in March 2019, 2020 and 2021, subject to the achievement of a market performance condition related to Total Shareholder Return, therefore at December 31, 2017 none of the PSU or RSU awards had vested. For further details please see Note 22
“Share-Based Compensation”
to the Consolidated Financial Statements.
Director and Officer Overlaps
There are overlaps among the directors and officers of FCA and our directors and officers. These individuals owe duties both to us and to the other companies that they serve as officers and/or directors. This may raise certain conflicts of interest as, for example, these individuals review opportunities that may be appropriate or suitable for both Ferrari and such other companies, or business transactions are pursued in which both Ferrari and such other companies have an interest, such as Ferrari’s arrangement to supply engines for Maserati cars. For example, Mr. Marchionne is also the Chief Executive Officer of FCA, and certain of our other directors and officers may also be directors or officers of FCA or Exor, including Mr. John Elkann, who is our Vice Chairman, the Chairman of FCA and the Chairman and Chief Executive Officer of Exor. Exor holds approximately 23.5 percent of our outstanding common shares and approximately 33.4 percent of the voting power in the Company, while it holds approximately 29.2 percent of the outstanding common shares and 43.1 percent of the voting power in FCA. See “
Risk Factors-Risks related to our Common Shares-We may have potential conflicts of interest with FCA and Exor and its related companies
.”
107
C. Board Practices
Please refer to “Item 6.A.
Directors and Senior Management
”
for additional information concerning the Company’s Directors required by this item. None of our directors have a service contract with us that provides for benefits upon termination of employment.
Committees
The Board of Directors has established an Audit Committee effective as of January 3, 2016. Each member of the Audit Committee is an “independent” member of the Board of Directors under Rule 10A-3 under the Exchange Act and within the meaning of the Dutch corporate governance code (the “Code”).
The Compensation Committee and a Governance and Sustainability Committee were established by the Board of Directors effective as of January 3, 2016. The functions that these committees shall perform and their powers and responsibilities will be determined by the Board of Directors from time to time in light of our size and structure and the provisions of the Code.
The Audit Committee consists of the following members:
|
Name
|
Position
|
|
Sergio Duca
|
Chairperson
|
|
Giuseppina Capaldo
|
Member
|
|
Maria Patrizia Grieco
|
Member
|
Pursuant to the charter of the Audit Committee, the function of the Audit Committee is to assist the Board of Directors’ oversight of,
inter alia
: (i) the integrity of Ferrari’s financial statements, including any published interim reports; (ii) Ferrari’s financing; (iii) the systems of internal controls that management and/or the Board of Directors have established; (iv) Ferrari’s compliance with legal and regulatory requirements; (v) Ferrari’s policies and procedures for addressing certain actual or perceived conflicts of interest; (vi) risk management guidelines and policies; (vii) the review and approval of related party transactions, and (viii) the implementation and effectiveness of the company’s ethics and compliance program. The Audit Committee shall be comprised of at least three (3) non-executive directors elected by the Board of Directors. Each member of the Audit Committee shall:
|
•
|
neither have a material relationship with Ferrari, as determined by the Board of Directors nor be performing the functions of auditors or accountants for Ferrari;
|
|
•
|
be an “independent” member of the Board of Directors under the rules of the NYSE and Rule 10A-3 under the Exchange Act and within the meaning of the Code; and
|
|
•
|
be “financially literate” and have “accounting or selected financial management expertise” qualifications, as determined by the Board of Directors.
|
At least one member of the Audit Committee shall be a “financial expert” as defined in rules of the SEC and section 2(3) of the Dutch Decree on the Establishment of an audit committee.
The Governance and Sustainability Committee consists of the following members:
|
Name
|
Position
|
|
John Elkann
|
Chairperson
|
|
Eddy Cue
|
Member
|
|
Sergio Duca
|
Member
|
|
Piero Ferrari
|
Member
|
Pursuant to the charter of the Governance and Sustainability Committee, the function of the Governance and Sustainability Committee is to assist the Board of Directors with respect to the determination of,
inter alia
: (i) drawing up the selection criteria and appointment procedures for members of the Board of Directors; (ii) periodic assessment of the size and
108
composition of the Board of Directors; (iii) periodic assessment of the performance of individual directors and reporting this to the Board of Directors; (iv) proposals for appointment and reappointments of executive and non-executive directors. The Governance and Sustainability Committee shall be comprised of at least three (3) directors, at most one (1) of whom may be an executive director and at most two (2) of whom will not be independent within the meaning of the Code, elected by the Board of Directors.
The Compensation Committee consists of the following members:
|
Name
|
Position
|
|
Louis C. Camilleri
|
Chairperson
|
|
John Elkann
|
Member
|
|
Elena Zambon
|
Member
|
Pursuant to the charter of the Compensation Committee, the function of the Compensation Committee is to assist and advise the Board of Directors’ oversight of: (i) executive compensation; (ii) remuneration policy to be pursued; (iii) compensation of non-executive directors; (iv) remuneration report. The Compensation Committee shall be comprised of at least three (3) non-executive directors, at most one (1) of whom will not be independent within the meaning of the Code, elected by the Board of Directors.
D. Employees
Human capital is a crucial factor in our success, building on our position as a global leader in the luxury performance car sector and creating long-term, sustainable value. To recognize excellence, encourage professional development and create equal opportunities, we adopt a number of initiatives, such as our Graduates Project, aimed at identifying and recruiting graduates from the world’s best universities; our appraisal system to assess our manager, professional and white collar employees, through performance management metrics; our talent management and succession planning; training and skill-building initiatives; employee satisfaction and engagement surveys, including our so-called “Pit Stop” and “Pole Position” programs; and flexible work arrangements, commuting programs and a dedicated welfare program,
Formula Uomo,
which includes, among other programs,
Formula Benessere
Program
(offering medical assistance to employees and their families) and
Formula Estate Junior
(offering Summer Campus to the children of employees).
At December 31,
2017
, we had a total of
3,380
employees, including
92
executives. Of these, approximately 3,196 were based at our Maranello facility, and approximately 184 in offices around the world (including 8 executives), mostly in North America and China.
|
At December 31,
|
||||||||
|
2017
|
2016
|
2015
|
||||||
|
White collar employees
|
1,531
|
|
1,407
|
|
1,304
|
|
||
|
Italy
|
1,358
|
|
1,216
|
|
1,143
|
|
||
|
Rest of the world
|
173
|
|
191
|
|
161
|
|
||
|
Blue collar employees
|
1,757
|
|
1,751
|
|
1,607
|
|
||
|
Italy
|
1,754
|
|
1,748
|
|
1,604
|
|
||
|
Rest of the world
|
3
|
|
3
|
|
3
|
|
||
|
Executives
|
92
|
|
90
|
|
87
|
|
||
|
Total
|
3,380
|
|
3,248
|
|
2,998
|
|
||
The increase in employees in recent periods principally related to a strengthening of technical competencies, particularly within our GT cars development activities. Furthermore, in 2012, we began producing engines for the new Maserati cars. The planned production volumes required adoption of innovative work organization mechanisms, in terms of number of shifts and hours, thus enabling effective management of a varying production demand. The new activity required the addition of 253 workers, who are currently on agency contracts. These workers are not included in the total Ferrari employee head count referenced above.
Approximately 11 percent of the employees were trade union members in 2017. Our employees’ principal trade unions are
Federazione Italiana Metalmeccanici
(FIM-CISL),
Federazione Italiana Sindacati Metalmeccanici e Industrie Collegate
(FISMIC),
Unione Italiana Lavoratori Metalmeccanici
(UILM-UIL) and
Federazione Impiegati Operai Metallurgici
(FIOM-CGIL).
All of our employees are covered by collective bargaining agreements. Our managers are represented by the Italian trade union, Federmanager, and are subject to a collective bargaining agreement renewed on March 2, 2016 and in effect through December 31, 2017. Our other employees are covered by the collective bargaining agreement entered into by FCA and FIM-CISL, UILM-IUL, FISMIC, UGL and Associazione Quadri e Capi FIAT, which will expire on December 31, 2018, and by a Ferrari Enterprise Bargaining Agreement signed on June 22, 2016 by Ferrari and FIM, UILM and FISMIC, which will expire on December 31, 2019. This collective bargaining contract provides, among other things, for the payment of bonuses linked to performance up to a maximum of approximately €5,720 gross per year payable in three installments.
In addition to the collective agreements, we have individually negotiated agreements with several of our managers and other key employees providing for long-term incentives, exclusivity and non-compete provisions.
109
E. Share Ownership
The number of Shares directly and indirectly owned by members of the Board of Directors and members of the GEC on February 19, 2018 is set forth in the table below.
|
Name
|
Common Shares
|
Special Voting Shares
|
||
|
Piero Ferrari
|
18,894,295
|
|
18,892,160
|
|
|
Sergio Marchionne
|
1,462,000
|
|
—
|
|
|
John Elkann
|
15,375
|
|
—
|
|
|
Louis C. Camilleri
|
3,526
|
|
—
|
|
|
Delphine Arnault
|
2,803
|
|
—
|
|
|
Eddy Cue
|
2,692
|
|
—
|
|
|
Adam Keswick
|
2,643
|
|
—
|
|
|
Elena Zambon
|
1,808
|
|
—
|
|
|
Lapo Elkann
|
1,753
|
|
—
|
|
A. Major Shareholders
Exor is the largest shareholder of Ferrari through its approximately 23.5 percent shareholding interest in our outstanding common shares (as of February 19, 2018). See “Item 4.A.
History and Development of the Company
.” As a result of the loyalty voting mechanism, Exor’s voting power is approximately 33.4 percent. In addition, Mr. Piero Ferrari holds approximately 10 percent of our outstanding common shares and, as a result of the loyalty voting mechanism, his voting power is approximately 15.4 percent.
Exor and Mr. Piero Ferrari informed us that they have entered into a shareholder agreement, summarized below under “Shareholders’ Agreement”.
Exor resulted from a cross-border merger of its predecessor entity, Exor S.p.A. with and into Exor N.V. As a result of that merger, which was completed on December 11, 2016, all activities of Exor S.p.A. are continued by Exor under universal succession, including with respect to the holding of our shares. Exor is controlled by Giovanni Agnelli B.V., (“G.A.”) which holds 52.99 percent of its share capital. G.A. is a Dutch private company with limited liability (
besloten venootschap met beperkte aansprakelijkheid
)
with interests represented by shares, founded by Giovanni Agnelli and currently held by members of the Agnelli and Nasi families, descendants of Giovanni Agnelli, founder of Fiat. Its present principal business activity is to purchase, administer and dispose of equity interests in public and private entities and, in particular, to ensure the cohesion and continuity of the administration of its controlling equity interests. The managing directors of G.A. are John Elkann, Jeroen Preller, Florence Hinnen, Tiberto Brandolini d’Adda, Alessandro Nasi, Andrea Agnelli, Luca Ferrero de’ Gubernatis Ventimiglia and Eduardo Teodorani-Fabbri.
110
Based on the information in Ferrari’s shareholder register, regulatory filings with the Netherlands Authority for the Financial Markets (
stichting Autoriteit Financiële Markten,
the “AFM”) and the SEC and other sources available to us, the following persons owned, directly or indirectly, in excess of three percent of the common shares holding voting rights of Ferrari, as of February 19, 2018:
|
Shareholder
|
Number of common shares
|
Percentage owned
(1)
|
||
|
Exor N.V.
(2)
|
44,435,280
|
|
23.5
|
%
|
|
Piero Ferrari
(2)
|
18,894,295
|
|
10.0
|
%
|
|
T. Rowe Price Associates, Inc.
(3)
|
9,410,267
|
|
5.0
|
%
|
|
Blackrock, Inc.
(4)
|
6,763,273
|
|
3.6
|
%
|
|
Other public shareholders
|
109,450,759
|
|
57.9
|
%
|
(1) The percentages of share capital set out in this table are calculated as the ratio of (i) the aggregate number of outstanding common shares beneficially owned by the shareholder to (ii) the total number of outstanding common shares (net of treasury shares) of Ferrari. These percentages may slightly differ from the percentages of share capital included in the public register held by the AFM of all notifications made pursuant to the disclosure obligations under chapter 5.3 of the Dutch Act on financial supervision (Wet op het financieel toezicht; the “AFS”), such, inter alia, because any shares held in treasury by Ferrari are included in the relevant denominators for purposes of the AFS disclosure obligations.
(2) Each of Exor and Piero Ferrari participate in the loyalty voting program of Ferrari and therefore, as discussed above in this section, their voting power in Ferrari is higher than the percentage of common shares beneficially held as presented in this table.
(3) Based on filings with the SEC, T. Rowe Price Associates, Inc. is an investment adviser registered under Section 203 of the U.S. Investment Advisers Act of 1940 and, out of the common shares beneficially owned as set forth in the table, it has sole voting power over 3,143,852 common shares.
(4) Holdings as of December 7
th
, 2017 based on latest filings with the AFM.
Based on the information in Ferrari’s shareholder register and other sources available to us, as of February 16, 2018, approximately 39.3 million Ferrari common shares, or 20.8 percent of the outstanding Ferrari common shares, were held in the United States. As of the same date, approximately 1,200 record holders had registered addresses in the United States.
Shareholders’ Agreement
On December 23, 2015, Exor and Piero Ferrari entered into a Shareholders’ Agreement, which became effective at the completion of the Separation on January 3, 2016 (the “Shareholders’ Agreement”) and prior to the admission to listing and trading of the common shares of Ferrari on the MTA. Ferrari is not a party to the Shareholders’ Agreement and does not have any rights or obligations thereunder. Below is a summary of the principal provisions of the Shareholders’ Agreement based on regulatory filings made by Exor and Piero Ferrari.
Consultation
For the purposes of forming and exercising, to the extent possible, a common view on the items on the agenda of any General Meeting of shareholders of Ferrari, Exor and Piero Ferrari will consult with each other prior to each General Meeting. For the purposes of this consultation right and duties, representatives of each of Exor and Piero Ferrari shall meet in order to discuss in good faith whether they have or can find a common view as to the matters on the agenda of the immediately following General Meeting. This consultation right does not include an obligation to vote in any certain way nor does it constitute a veto right in favor of Piero Ferrari.
Pre-emption right in favor of Exor and right of first offer of Piero Ferrari
In the event that Piero Ferrari intends to transfer (in whole or in part) his Ferrari common shares or receives a third party offer for the acquisition of all or part of his Ferrari common shares, Exor will have the right to purchase all (but not less than all) of the common shares Piero Ferrari intends to transfer on the terms of the original proposed transfer by Piero Ferrari or, in case the original proposed transfer was for no consideration, at market prices determined pursuant to the agreement.
In the event Exor intends to transfer (in whole or in part) its common shares to a third party, either solicited or unsolicited, Piero Ferrari will have the right to make a binding, unconditional and irrevocable all cash offer for the purchase of such common shares.
The foregoing will not apply in the case of transfers of Ferrari common shares: (i) by any party to the Shareholders’ Agreement, to a party that qualifies as a “Loyalty Transferee” (as defined in the Ferrari Articles of Association) of such party, (ii) by Exor, to any affiliate of Giovanni Agnelli B.V., to a successor in business of Giovanni Agnelli B.V. and to any affiliate of a successor in business of Giovanni Agnelli e B.V., and (iii) by any party to the Shareholders’ Agreement that is an individual, to an entity wholly owned and controlled by that same party. In addition, the provisions regarding the pre-emption right in favor of Exor and right of first offer of Piero Ferrari shall not apply in relation to, and Piero Ferrari shall be free and allowed to carry
111
out, market sales to third parties of his Ferrari common shares which in the aggregate do not exceed, during the whole period of validity of the Shareholders Agreement, 0.5 percent of the number of common shares owned by Piero Ferrari upon completion of the Separation.
Term
The Shareholders’ Agreement entered into force upon completion of the Separation on January 3, 2016 and shall remain in force until the fifth anniversary of the effective date of the Separation, provided that if neither of the parties to the Shareholders’ Agreement terminates the Shareholders’ Agreement within six months before the end of the initial term, then the Shareholders’ Agreement shall be renewed automatically for another five year term.
The Shareholders’ Agreement shall terminate and cease to have any effect as a result of the transfer of all the common shares owned by either Exor or Piero Ferrari to a third party.
Governing law and jurisdiction
The Shareholders’ Agreement is governed by and must be interpreted according to the laws of the Netherlands. Any disputes arising out of or in connection with the Shareholders’ Agreement are subject to the exclusive jurisdiction of the competent court in Amsterdam, the Netherlands, without prejudice to the right of appeal and appeal to the Supreme Court.
B. Related Party Transactions
Parties related to us are all entities and individuals capable of exercising control, joint control or significant influence over us and our subsidiaries, companies belonging to the FCA group and the companies controlled by Exor (including CNH Industrial N.V. and its subsidiaries), and our unconsolidated subsidiaries, associates and joint ventures. In addition, members of our Board of Directors, Audit Committee and executives with strategic responsibilities and their families are also considered related parties.
We carry out transactions with related parties on commercial terms that are normal in the respective markets, considering the characteristics of the goods or services involved. Transactions carried out by us with these related parties, which have had an effect on revenues, cost of sales, and trade receivables and payables are primarily of a commercial nature. In particular, these transactions relate to:
Transactions with FCA
|
•
|
the sale of engines and car bodies to Maserati S.p.A. (“Maserati”) which is controlled by the FCA Group;
|
|
•
|
the purchase of engine components for the use in the production of Maserati engines from FCA US LLC, which is controlled by FCA Group;
|
|
•
|
the purchase of automotive lighting and automotive components from Magneti Marelli S.p.A., Automotive Lighting Italia S.p.A., Sistemi Sospensioni S.p.A. and Magneti Marelli Powertrain Slovakia s.r.o., which are controlled by the FCA Group;
|
|
•
|
transactions with other FCA Group companies, mainly relating to the services provided by FCA Group companies, including human resources, payroll, tax, customs and procurement of insurance coverage and sponsorship revenues for the display of FCA Group company logos on the Formula 1 cars;
|
|
•
|
in 2016, the Group sold a portion of its trade and financial receivables to the FCA Bank Group, which is a joint venture between FCA Group and Credit Agricole. On derecognition of the asset, the difference between the carrying amount and the consideration received or receivable was recognized in cost of sales;
|
|
•
|
on November 2016, the Group finalized an agreement with FCA Bank to provide financial services in Europe. Under such agreement FCA Bank acquired from the Group a majority stake in FFS GmbH for a purchase price of €18,595 thousand, which the Group received upon sale. In addition to the purchase price, as a result of the funding of FFS GmbH being directly provided by FCA Bank, the Group also received cash of €431,958 thousand.
|
112
Transactions with Exor Group companies
|
•
|
the Group incurs rental costs from Iveco Group companies related to the rental of trucks used by the Formula 1 racing team;
|
|
•
|
the Group earns sponsorship revenue from Iveco S.p.A.
|
Transactions with other related parties
|
•
|
the purchase of components for Formula 1 racing cars from COXA S.p.A., controlled by Piero Ferrari;
|
|
•
|
consultancy services provided by HPE S.r.l., controlled by Piero Ferrari;
|
|
•
|
sponsorship agreement relating to Formula 1 activities with Ferretti S.p.A.;
|
|
•
|
sale of cars to certain members of the Board of Directors of Ferrari N.V. and Exor.
|
Pursuant to the charter of the Audit Committee, the Audit Committee reviews and approves related party transactions in order ensure that they are entered into on arm’s length terms. In accordance with IAS 24, transactions with related parties also include compensation payable to Directors, Statutory Auditors and managers with strategic responsibilities. Please see Note 29 to the Consolidated Financial Statements for further details on our related party transactions.
C. Interests of Experts and Counsel
Not
applicable
.
A. Consolidated Statements and Other Financial Information
Consolidated Financial Statements
Refer to “Item 18.
Financial Statements
”
for our Consolidated Financial Statements and report of our independent registered public accounting firm included elsewhere in this document.
Export Sales
Refer to “Item 4.B
. Business Overview
”
for a discussion of our sales and distribution channels.
Legal Proceedings
Legal proceedings, claims and governmental investigations are pending against us on a wide range of topics, including car safety; emissions and fuel economy, early warning reporting; dealer, supplier and other contractual relationships; intellectual property rights and product warranty matters. Some of these proceedings allege defects in specific component parts or systems (including airbags, seat belts, brakes, transmissions, engines and fuel systems) in various car models or allege general design defects relating to car handling and stability, sudden unintended movement or crashworthiness. These proceedings seek recovery for damage to property, personal injuries or wrongful death and in some cases could include a claim for exemplary or punitive damages. Adverse decisions in one or more of these proceedings could require us to pay substantial damages, or undertake service actions, recall campaigns or other costly actions. For information regarding provisions made for legal proceedings, refer to Note 24 of our Consolidated Financial Statements included elsewhere in this document.
Dividend Policy
Subject to the approval by the Shareholders at the 2018 Annual General Meeting, the Company intends to make a dividend distribution to the holders of common shares of Euro 0.71 per common share, corresponding to a total dividend distribution to shareholders of approximately Euro 134 million.
We intend to return capital to holders of common shares over time through a sustainable dividend policy designed to provide adequate returns to shareholders, while supporting growth and protecting our creditworthiness in order to facilitate access to external funding. We intend to pay between 25% and 40% of our annual net profit by way of dividend; however, the actual level of dividends will be subject to our earnings, cash balances, commitments, strategic plans and other factors that our
113
Board of Directors may deem relevant at the time of the dividend. For additional information on distribution of profits, refer to “Item 10B.
Memorandum and Articles of Association
”. Our dividend policy is subject to change in the future based on changes in statutory requirements, market trends, strategic developments, capital requirements and a number of other factors.
All issued and outstanding common shares will rank equally and will be eligible for any profit or other payment that may be declared on the common shares. Pursuant to our Articles of Association, holders of special voting shares are entitled to a minimum dividend, which is allocated to the special dividend reserve. A distribution from the special dividend reserve or the (partial) release of the special dividend reserve will require a prior proposal from the Board of Directors and a subsequent resolution of the meeting of holders of special voting shares. Ferrari does not intend to propose any distribution from the special dividend reserve.
For additional information on distribution of profits, refer to “Item 10.B.
Memorandum and Article of Association
.”
B. Significant Changes
Except otherwise disclosed within this Annual Report on Form 20-F, no significant change has occurred since the date of the Consolidated Financial Statements.
114
A. Offer and Listing Details
On October 21, 2015, our common shares began trading on the NYSE under the symbol “RACE”. On January 4, 2016, our common shares began trading on the MTA under the symbol “RACE”.
The following table presents the high and low closing market prices of Ferrari common shares as reported on the NYSE and the MTA for each of the periods indicated:
|
NYSE
|
MTA
|
||||||||||
|
High
|
Low
|
High
|
Low
|
||||||||
|
($)
|
(€)
|
||||||||||
|
Period
|
|||||||||||
|
Fourth quarter 2015
(1)
|
45.66
|
|
56.75
|
|
N/A
|
|
N/A
|
|
|||
|
Year ended December 31, 2015
|
56.75
|
|
45.66
|
|
N/A
|
|
N/A
|
|
|||
|
Year ended December 31, 2016
|
58.67
|
|
32.00
|
|
56.55
|
|
28.00
|
|
|||
|
First quarter 2016
|
48.49
|
|
32.00
|
|
44.60
|
|
28.00
|
|
|||
|
Second quarter 2016
|
45.85
|
|
38.88
|
|
39.75
|
|
35.39
|
|
|||
|
Third quarter 2016
|
51.87
|
|
39.54
|
|
46.23
|
|
35.85
|
|
|||
|
Fourth quarter 2016
|
58.67
|
|
50.40
|
|
56.55
|
|
45.60
|
|
|||
|
Year ended December 31, 2017
|
120.00
|
|
58.28
|
|
103.80
|
|
55.05
|
|
|||
|
First quarter 2017
|
74.86
|
|
58.28
|
|
69.75
|
|
55.05
|
|
|||
|
Second quarter 2017
|
91.85
|
|
70.59
|
|
81.70
|
|
65.95
|
|
|||
|
Third quarter 2017
|
116.85
|
|
85.70
|
|
98.05
|
|
74.40
|
|
|||
|
Fourth quarter 2017
|
120.00
|
|
104.17
|
|
103.80
|
|
87.45
|
|
|||
|
Monthly
|
|
|
|
|
|
|
|
|
|||
|
August 2017
|
115.62
|
|
107.58
|
|
98.05
|
|
89.60
|
|
|||
|
September 2017
|
116.85
|
|
108.59
|
|
97.75
|
|
91.00
|
|
|||
|
October 2017
|
119.68
|
|
112.43
|
|
102.90
|
|
95.40
|
|
|||
|
November 2017
|
120.00
|
|
108.40
|
|
103.80
|
|
91.20
|
|
|||
|
December 2017
|
107.47
|
|
104.17
|
|
91.15
|
|
87.45
|
|
|||
|
January 2018
|
121.37
|
|
105.15
|
|
98.95
|
|
87.30
|
|
|||
|
February 2018 (through February 16)
|
129.71
|
|
119.62
|
|
105.00
|
|
97.80
|
|
|||
_____________________
(1) From October 21, 2015
B. Plan of Distribution
Not applicable.
C. Markets
Our common shares are listed and traded on the NYSE and on the MTA under the symbol “RACE”.
D. Selling Shareholders
Not applicable.
115
E. Dilution
Not applicable.
F. Expenses of the Issue
Not applicable.
A. Share Capital
Not applicable.
B. Memorandum and Articles of Association
A copy of the articles of association of Predecessor Ferrari has been filed as Exhibit 3.1 to Ferrari N.V. Registration Statement on Form F-1 filed on July 23, 2015.
Our articles of association are identical in all material aspect to those of Predecessor Ferrari.
The Ferrari Shares, Articles Of Association And Terms And Conditions Of The Special Voting Shares
Ferrari was incorporated as a public limited liability company (
naamloze vennootschap
) under the laws of the Netherlands on September 4, 2015 under the name FE New N.V., in contemplation of the Merger, and was renamed Ferrari N.V. effective as of January 3, 2016, upon effectiveness of the Merger. Its corporate seat (
statutaire zetel
) is in Amsterdam, the Netherlands, and its registered office and principal place of business is located at Via Abetone Inferiore n. 4, I-41053 Maranello (MO), Italy. Ferrari is registered with the Trade Register of the Chamber of Commerce under number 64060977. Its telephone number is +39-0536-949111.
Since incorporation Ferrari has had, and it intends to continue to have, its place of effective management in Italy. It will therefore be a tax resident of Italy under both Italian tax law and Article 4 of the Convention between the Kingdom of the Netherlands and the Republic of Italy for the avoidance of a double taxation with respect to taxes on income and on capital of 1980.
Following is a summary of material information relating to the Ferrari common shares, including summaries of certain provisions of the Ferrari Articles of Association (the “Ferrari Articles of Association”), the terms and conditions in respect of the Ferrari special voting shares (the “Terms and Conditions”) and the applicable Dutch law provisions in effect at the date of this annual report. The summaries of the Ferrari Articles of Association and the Terms and Conditions as set forth in this annual report are qualified in their entirety by reference to the full text of the Ferrari Articles of Association, and Terms and Conditions.
Share Capital
The authorized share capital of Ferrari is seven million five hundred thousand Euro (€7,500,000), divided into three hundred seventy five million (375,000,000) Ferrari common shares, nominal value of one Euro cent (€0.01) per share and an equal number of special voting shares, nominal value of one Euro cent (€0.01) per share.
Upon incorporation on September 4, 2015, Ferrari’s issued share capital was €50,000, fully paid and divided into 5,000,000 common shares having a nominal value of € 0.001 each. In connection with the Merger, Ferrari issued 188,923,499 common shares and 56,497,618 special voting shares, and the 5,000,000 common shares previously outstanding were retired and held in treasury. In 2017, 30,375 shares of such treasury shares have been transferred to non-executive directors who elected to receive part of their compensation in the form of common shares in accordance with our former remuneration policy.
A delegation of authority to the Ferrari Board of Directors to authorize the issuance of common shares without pre-emptive rights enables Ferrari to offer and sell newly issued common shares to investors free of pre-emptive rights for a period of five years from January 2, 2016. Under Dutch law, such authorization may not exceed a period of five years, but may be renewed by a resolution of the general meeting of shareholders for subsequent five-year periods at any time.
116
Ferrari common shares are registered shares represented by an entry in the share register of Ferrari. The Ferrari Board of Directors may determine that, for the purpose of trading and transfer of shares on a foreign stock exchange, such share certificates shall be issued in such form as shall comply with the requirements of such foreign stock exchange. A register of shareholders is maintained by Ferrari in the Netherlands and a branch register is maintained in the United States on Ferrari’s behalf by the Transfer Agent, which serves as branch registrar and transfer agent.
Beneficial interests in Ferrari common shares that are traded on the NYSE are held through the book-entry system provided by The Depository Trust Company (“DTC”) and are registered in Ferrari’s register of shareholders in the name of Cede & Co., as DTC’s nominee. Beneficial interests in the Ferrari common shares traded on the MTA are held through Monte Titoli S.p.A., the Italian central clearing and settlement system, as a participant in DTC.
Directors
Set forth below is a summary description of the material provisions of the Ferrari Articles of Association, relating to our directors. The summary does not restate the Ferrari Articles of Association in their entirety.
Ferrari’s directors serve on the Ferrari Board of Directors for a term of approximately one year, such term ending on the day that the first annual general meeting of the shareholders is held in the following calendar year. Ferrari’s shareholders appoint the directors of the Ferrari Board of Directors at a general meeting. Each director may be reappointed at any subsequent general meeting of shareholders. The general meeting of shareholders determines whether a director is an executive director or a non-executive director.
The Ferrari Board of Directors is a one tier board and consists of three or more members, comprising both members having responsibility for the day-to-day management of Ferrari (executive directors) and members not having such day-to-day responsibility (non-executive directors). The tasks of the executive and non-executive directors in a one-tier board such as Ferrari’s Board of Directors may be allocated under or pursuant to the Ferrari Articles of Association, provided that the general meeting has stipulated whether such director is appointed as executive or as non-executive director and furthermore provided that the task to supervise the performance by the directors of their duties can only be performed by the non-executive directors. In addition, an executive director may not be appointed chairman of the board or delegated the task of establishing the remuneration of executive directors or nominating directors for appointment. Tasks that are not allocated fall within the power of the Ferrari Board of Directors as a whole. Regardless of an allocation of tasks, all directors remain collectively responsible for the proper management and strategy of Ferrari (including supervision thereof in case of non-executive directors). The Ferrari Board of Directors may determine that one or more directors can lawfully adopt board resolutions concerning matters belonging to his or their duties.
Ferrari has a policy in respect of the remuneration of the members of the Ferrari Board of Directors. With due observation of the remuneration policy, the Ferrari Board of Directors may determine the remuneration for the directors in respect of the performance of their duties. The Ferrari Board of Directors must submit to the Annual General Meeting of Shareholders for its approval plans to award shares or the right to subscribe for shares. The policy was partially amended as approved by the general meeting of shareholders held on April 14, 2017 by introducing the principle that non-executive directors are paid in cash only and by introducing certain facilitations for the directors in the purchase or use of Company products. In addition the amended policy will provide for the Ferrari Board of Directors to issue stock ownership guidelines applicable to directors and employees.
Ferrari shall not grant the directors any personal loans or guarantees.
Loyalty Voting Program
In connection with the Separation, Ferrari issued special voting shares with a nominal value of one Euro cent (€0.01) per share, to FCA, Piero Ferrari and FCA shareholders holding FCA special voting shares prior to the Separation including Exor, in addition to Ferrari common shares.
After the Separation Exor holds approximately 33.4 percent of the voting power in us, Piero Ferrari holds approximately 15.4 percent of the voting power in us and public shareholders hold approximately 51.2 percent of the voting power in us. For more information on the Separation, see “Item 4.A.
History and Development of the Company.
”.
Subject to meeting certain conditions, our common shares can be registered in our loyalty register (the “Loyalty Register”) and all such common shares may qualify as qualifying common shares (“Qualifying Common Shares”). The holder of Qualifying Common Shares is entitled to receive without consideration one special voting share in respect of each such
117
Qualifying Common Share. Pursuant to the Terms and Conditions, and for so long as the Ferrari common shares remain in the Loyalty Register, such Ferrari common shares shall not be sold, disposed of, transferred, except in very limited circumstances (
i.e.,
transfers to affiliates or to relatives through succession, donation or other transfers (defined in the Terms and Conditions as “Loyalty Transferee”), but a shareholder may create or permit to exist any pledge, lien, fixed or floating charge or other encumbrance over such Ferrari common shares, provided that the voting rights in respect of such Ferrari common shares and any corresponding special voting shares remain with such shareholder at all times. Ferrari’s shareholders who want to directly or indirectly sell, dispose of, trade or transfer such Ferrari common shares or otherwise grant any right or interest therein, or create or permit to exist any pledge, lien, fixed or floating charge or other encumbrance over such Ferrari common shares with a potential transfer of voting rights relating to such encumbrances will need to submit a de-registration request as referred to in the Terms and Conditions, in order to transfer the relevant Ferrari common shares to the regular trading system (the “Regular Trading System”) except that a Ferrari shareholder may transfer Ferrari common shares included in the Loyalty Register to a Loyalty Transferee (as defined in the Terms and Conditions) of such Ferrari shareholder without transferring such shares from the Loyalty Register to the Regular Trading System.
Ferrari’s shareholders who seek to qualify to receive special voting shares can also request to have their Ferrari common shares registered in the Loyalty Register. Upon registration in the Loyalty Register such shares will be eligible to be treated as Qualifying Common Shares, provided they meet the conditions more fully described under “
—Terms and Conditions of the Special Voting Shares
” below.
Notwithstanding the fact that Article 13 of the Ferrari Articles of Association permits the Board of Directors of Ferrari to approve transfers of special voting shares, the special voting shares cannot be traded and are transferable only in very limited circumstances (
i.e.,
to a Loyalty Transferee described above, or to Ferrari for no consideration (
om niet
)).
Pursuant to Article 23 of the Ferrari Articles of Association, Ferrari shall maintain a special capital reserve to be credited against the share premium exclusively for the purpose of facilitating any issuance or cancellation of special voting shares. The special voting shares shall be issued and paid up against this special capital reserve.
The special voting shares have immaterial economic entitlements. Such economic entitlements are designed to comply with Dutch law but are immaterial for investors. The special voting shares carry the same voting rights as Ferrari common shares.
Section 10 of the Terms and Conditions include liquidated damages provisions intended to deter any attempt by holders to circumvent the terms of the special voting shares. Such liquidated damages provisions may be enforced by Ferrari by means of a legal action brought by Ferrari before competent courts of Amsterdam, the Netherlands. In particular, a violation of the provisions of the Terms and Conditions concerning the transfer of special voting shares, Electing Common Shares (common shares registered in the Loyalty Register for the purpose of becoming Qualifying Common Shares in accordance with the Ferrari Articles of Association) and Qualifying Common Shares may lead to the imposition of liquidated damages. Because we expect the restrictions on transfers of the special voting shares to be effective in practice we do not expect the liquidated damages provisions to be used.
Pursuant to Section 12 of the Terms and Conditions, any amendment to the Terms and Conditions (other than merely technical, non-material amendments and unless such amendment is required to ensure compliance with applicable law or regulations or the listing rules of any securities exchange on which the Ferrari common shares are listed) may only be made with the approval of the general meeting of shareholders of Ferrari.
At any time, a holder of Qualifying Common Shares or Electing Common Shares may request the de-registration of such shares from the Loyalty Register to enable free trading thereof in the Regular Trading System. Upon the de-registration from the Loyalty Register, such shares will cease to be Electing Common Shares or Qualifying Common Shares as the case may be and will be freely tradable and voting rights attached to the corresponding special voting shares will be suspended with immediate effect and such special voting shares shall be transferred to Ferrari for no consideration (
om niet
).
Terms and Conditions of the Special Voting Shares
The Terms and Conditions apply to the issuance, allocation, acquisition, holding, repurchase and transfer of special voting shares in our share capital and to certain aspects of Electing Common Shares, Qualifying Common Shares and Ferrari common shares, which are or will be registered in the Loyalty Register.
118
Application for Special Voting Shares
A Ferrari shareholder may at any time elect to participate in the loyalty voting program by requesting that Ferrari register all or some of the number of Ferrari common shares held by such Ferrari shareholder in the Loyalty Register. Such election shall be effective and registration in the Loyalty Register shall occur as of the end of the calendar month during which the election is made. If such Ferrari common shares (i.e. Electing Common Shares) have been registered in the Loyalty Register (and thus blocked from trading in the Regular Trading System) for an uninterrupted period of three years in the name of the same shareholder, the holder of such Ferrari common shares will be entitled to receive one Ferrari special voting share for each such Ferrari common share that has been registered. If at any moment in time such Ferrari common shares are de-registered from the Loyalty Register for whatever reason, the relevant shareholder loses its entitlement to hold a corresponding number of Ferrari special voting shares.
Withdrawal of Special Voting Shares
As described above, a holder of Qualifying Common Shares or Electing Common Shares may request that some or all of its Qualifying Common Shares or Electing Common Shares be de-registered from the Loyalty Register and if held outside the Regular Trading System, transfer such shares back to the Regular Trading System, which will allow such shareholder to freely trade its Ferrari common shares, as described below. From the moment of such request, the holder of Qualifying Common Shares shall be considered to have waived his rights to cast any votes associated with the Ferrari special voting shares which were issued and allocated in respect of such Qualifying Common Shares. Any such request would automatically trigger a mandatory transfer requirement pursuant to which the Ferrari special voting shares will be offered and transferred to Ferrari for no consideration in accordance with the Ferrari Articles of Association and the Terms and Conditions. Ferrari may continue to hold the special voting shares as treasury stock, but will not be entitled to vote any such treasury stock. Alternatively, Ferrari may withdraw and cancel the special voting shares, as a result of which the nominal value of such shares will be allocated to the special capital reserves of Ferrari. Consequently, the loyalty voting feature will terminate as to the relevant Qualifying Common Shares being deregistered from the Loyalty Register. No shareholder required to transfer special voting shares pursuant to the Terms and Conditions shall be entitled to any purchase price for such special voting shares and each shareholder expressly waives any rights in that respect as a condition to participation in the loyalty voting program.
Change of Control
A shareholder who is a holder of Qualifying Common Shares or Electing Common Shares must promptly notify the Agent and Ferrari upon the occurrence of a “change of control” as defined in the Ferrari Articles of Association, as described below. The change of control will trigger the de-registration of the relevant Electing Common Shares or Qualifying Common Shares or the relevant Ferrari common shares in the Loyalty Register. The voting rights attached to the special voting shares issued and allocated in respect of the relevant Qualified Common Shares will be suspended upon a direct or indirect change of control in respect of the relevant holder of such Qualifying Common Shares that are registered in the Loyalty Register.
For the purposes of this section a “change of control” shall mean, in respect of any Ferrari shareholder that is not an individual (
natuurlijk persoon
), any direct or indirect transfer in one or a series of related transactions as a result of which (i) a majority of the voting rights of such shareholder, (ii) the de facto ability to direct the casting of a majority of the votes exercisable at general meetings of shareholders of such shareholder and/or (iii) the ability to appoint or remove a majority of the directors, executive directors or board members or executive officers of such shareholder or to direct the casting of a majority or more of the voting rights at meetings of the board of directors, governing body or executive committee of such shareholder has been transferred to a new owner, provided that no change of control shall be deemed to have occurred if (a) the transfer of ownership and/or control is an intra-group transfer under the same parent company, (b) the transfer of ownership and /or control is the result of the succession or the liquidation of assets between spouses or the inheritance,
inter vivos
donation or other transfer to a spouse or a relative up to and including the fourth degree or (c) the fair market value of the Qualifying Common Shares held by such shareholder represents less than twenty percent (20 percent) of the total assets of the Transferred Group at the time of the transfer and the Qualifying Common Shares held by such shareholder, in the sole judgment of the company, are not otherwise material to the Transferred Group or the change of control transaction. “Transferred Group” shall mean the relevant shareholder together with its affiliates, if any, over which control was transferred as part of the same change of control transaction within the meaning of the definition of change of control.
Liability to Further Capital Calls
All of the outstanding Ferrari common shares and special voting shares are fully paid and non-assessable.
119
Additional Issuances and Rights of Preference
Issuance of Shares
The general meeting of shareholders of Ferrari (the “General Meeting”) has the authority to resolve on any issuance of shares, unless such authority has been delegated to the Board of Directors of Ferrari. In such a resolution, the General Meeting must determine the price and other terms of issuance. The Board of Directors of Ferrari may have the power to issue shares if it has been authorized to do so by the General Meeting, or pursuant to the Ferrari Articles of Association. Under Dutch law, such authorization may not exceed a period of five years, but may be renewed by a resolution of the General Meeting for subsequent five-year periods at any time. The Ferrari Board of Directors has been designated by the Ferrari Articles of Association as the competent body to issue Ferrari common shares and special voting shares up to the maximum aggregate amount of the Ferrari authorized share capital for an initial period of five years from January 2, 2016, which may be extended by the General Meeting with additional consecutive periods of up to a maximum of five years each.
Ferrari will not be required to obtain approval from a General Meeting to issue shares pursuant to the exercise of a right to subscribe for shares that was previously granted pursuant to authority granted by the shareholders or pursuant to delegated authority by the Board of Directors. The General Meeting shall, for as long as any such designation of the Board of Directors of Ferrari for this purpose is in force, no longer has authority to decide on the issuance of shares.
Rights of Pre-emption
Under Dutch law and the Ferrari Articles of Association, each Ferrari shareholder has a right of pre-emption in proportion to the aggregate nominal value of its shareholding upon the issuance of new Ferrari common shares (or the granting of rights to subscribe for Ferrari common shares). Exceptions to this right of pre-emption include the issuance of new Ferrari common shares (or the granting of rights to subscribe for common shares): (i) to employees of Ferrari or another member of its group pursuant to a stock compensation plan of Ferrari, (ii) against payment in kind (contribution other than in cash) and (iii) to persons exercising a previously granted right to subscribe for Ferrari common shares.
In the event of an issuance of special voting shares, shareholders shall not have any right of pre-emption.
The General Meeting may resolve to limit or exclude the rights of pre-emption upon an issuance of Ferrari common shares, which resolution requires approval of at least two-thirds of the votes cast, if less than half of the issued share capital is represented at the General Meeting. The Ferrari Articles of Association or the General Meeting may also designate the Ferrari Board of Directors to resolve to limit or exclude the rights of pre-emption in relation to the issuance of Ferrari common shares. Pursuant to Dutch law, the designation by the General Meeting may be granted to the Ferrari Board of Directors for a specified period of time of not more than five years and only if the Ferrari Board of Directors has also been designated or is simultaneously designated the authority to resolve to issue Ferrari common shares. The Ferrari Board of Directors is designated in the Ferrari Articles of Association as the competent body to exclude or limit rights of pre-emption for an initial period of five years from January 2, 2016, which may be extended by the General Meeting with additional periods up to a maximum of five years per period.
Repurchase of Shares
Upon agreement with the relevant Ferrari shareholder, Ferrari may acquire its own shares at any time for no consideration (
om niet
), or subject to certain provisions of Dutch law and the Ferrari Articles of Association for consideration, if: (i) Ferrari’s shareholders’ equity less the payment required to make the acquisition does not fall below the sum of called-up and paid-in share capital and any statutory reserves, (ii) Ferrari would thereafter not hold a pledge over Ferrari common shares or together with subsidiaries hold Ferrari common shares with an aggregate nominal value exceeding 50 percent of the Ferrari’s issued share capital and (iii) the Ferrari Board of Directors has been authorized to do so by the General Meeting.
The acquisition of fully paid-up shares by Ferrari other than for no consideration (
om niet
) requires authorization by the General Meeting. Such authorization may be granted for a period not exceeding 18 months and shall specify the number of shares, the manner in which the shares may be acquired and the price range within which shares may be acquired. The authorization is not required for the acquisition of shares from employees of Ferrari or another member of its Group, under a scheme applicable to such employees and no authorization is required for repurchase of shares acquired in certain other limited circumstances in which the acquisition takes place by operation of law, such as pursuant to mergers or demergers. Such shares must be officially listed on a price list of an exchange.
120
At a General Meeting the shareholders may resolve to designate the Board of Directors of Ferrari as the competent body to resolve on Ferrari acquiring any Ferrari’s fully paid up Ferrari common shares other than for no consideration (
om niet
) for a period of up to 18 months.
Ferrari may, jointly with its subsidiaries, hold Ferrari shares in its own capital exceeding one-tenth of its issued capital for no more than three years after acquisition of such Ferrari shares for no consideration (
om niet
) or in certain other limited circumstances in which the acquisition takes place by operation of law, such as pursuant to mergers or demergers. Any Ferrari shares held by Ferrari in excess of the amount permitted shall transfer to all members of the Ferrari Board of Directors jointly at the end of the last day of such three year period. Each member of the Ferrari Board of Directors shall be jointly and severally liable to compensate Ferrari for the value of the Ferrari shares at such time, with interest at the statutory rate thereon from such time. The term Ferrari shares in this paragraph shall include depositary receipts for shares and shares in respect of which Ferrari holds a right of pledge.
No votes may be cast at a General Meeting on the Ferrari shares held by Ferrari or its subsidiaries. Also no voting rights may be cast at a General Meeting in respect of Ferrari shares for which depositary receipts have been issued that are owned by Ferrari. Nonetheless, the holders of a right of usufruct or pledge in respect of shares held by Ferrari and its subsidiaries in Ferrari’s share capital are not excluded from the right to vote on such shares, if the right of usufruct or pledge was granted prior to the time such shares were acquired by Ferrari or its subsidiaries. Neither Ferrari nor any of its subsidiaries may cast votes in respect of a share on which it or its subsidiaries holds a right of usufruct or pledge.
Reduction of Share Capital
Shareholders at a General Meeting have the power to cancel shares acquired by Ferrari or to reduce the nominal value of the shares. A resolution to reduce the share capital requires a majority of at least two-thirds of the votes cast at the General Meeting, if less than one-half of the issued capital is present or represented at the meeting. If more than one-half of the issued share capital is present or represented at the meeting, a simple majority of the votes cast at the General Meeting is required. Any proposal for cancellation or reduction of nominal value is subject to general requirements of Dutch law with respect to reduction of share capital.
Transfer of Shares
In accordance with the provisions of Dutch law, pursuant to Article 12 of the Ferrari Articles of Association, the transfer or creation of Ferrari shares or a right
in rem
thereon requires a deed intended for that purpose and save when Ferrari is a party to the transaction, written acknowledgment by Ferrari of the transfer.
The transfer of Ferrari common shares that have not been entered into a book-entry system will be effected in accordance with Article 12 of the Ferrari Articles of Association.
Common shares that have been entered into the DTC book-entry system will be registered in the name of Cede & Co., as nominee for DTC and transfers of beneficial ownership of shares held through DTC will be effected by electronic transfer made by DTC participants. Article 12 of the Ferrari Articles of Association does not apply to the trading of such Ferrari common shares on a regulated market or the equivalent thereof.
Transfers of shares held outside of DTC (including Monte Titoli S.p.A., as a participant in DTC) or another direct registration system maintained by Computershare, Ferrari’s transfer agent in New York (“Transfer Agent”) and not represented by certificates are effected by a stock transfer instrument and require the written acknowledgment by Ferrari. Transfer of registered certificates is effected by presenting and surrendering the certificates to the Transfer Agent. A valid transfer requires the registered certificates to be properly endorsed for transfer as provided for in the certificates and accompanied by proper instruments of transfer and stock transfer tax stamps for, or funds to pay, any applicable stock transfer taxes.
Ferrari common shares are freely transferable. As described below, special voting shares are generally not transferable.
At any time, a holder of Ferrari common shares that are registered in the Loyalty Register (i.e. Electing Common Shares or Qualifying Common Shares) wishing to transfer such Ferrari common shares other than in limited specified circumstances (
i.e.,
transfers to affiliates or to relatives through succession, donation or other transfers) must first request a de-registration of such shares from the Loyalty Register and if held outside the Regular Trading System, transfer such common shares back into the Regular Trading System. After de-registration from the Loyalty Register, such Ferrari common shares no longer qualify as Electing Common Shares or Qualifying Common Shares, as a result, the holder of such Ferrari common shares is required to offer and transfer the special voting shares associated with such Ferrari common shares that were previously
121
Qualifying Common Shares to Ferrari for no consideration (
om niet
) as described in detail in “
—Loyalty Voting Program—Terms and Conditions of the Special Voting Shares—Withdrawal of Special Voting Shares
.”
Annual Accounts and Independent Auditor
Ferrari’s financial year is the calendar year. Within four months after the end of each financial year, the Ferrari Board of Directors will prepare the annual accounts, which must be accompanied by an annual report and an auditor’s report and will publish the accounts and annual report and will make those available for inspection at Ferrari’s registered office. All members of the Ferrari Board of Directors are required to sign the annual accounts and in case the signature of any member is missing, the reason for this must be stated. The annual accounts are to be adopted by the General Meeting at the annual general meeting of shareholders, at which meeting the members of the Ferrari Board of Directors will be discharged from liability for performance of their duties with respect to any matter disclosed in the annual accounts for the relevant financial year insofar this appears from the annual accounts. The annual accounts, the annual report and independent auditor’s report are made available through Ferrari’s website to the shareholders for review as from the day of the notice convening the annual general meeting of shareholders.
Payment of Dividends
Ferrari may make distributions to the shareholders and other persons entitled to the distributable profits only to the extent that its shareholders’ equity exceeds the sum of the paid-up and called up portion of the share capital and the reserves that must be maintained in accordance with Dutch law. No distribution of profits may be made to Ferrari itself for shares that Ferrari holds in its own share capital.
Ferrari may only make a distribution of dividends to the shareholders after the adoption of its statutory annual accounts demonstrating that such distribution is legally permitted. The Ferrari Board of Directors may determine that other freely distributable distributions shall be made, in whole or in part, from Ferrari’s share premium reserve or from any other reserve, provided that payments from reserves may only be made to the shareholders that are entitled to the relevant reserve upon the dissolution of Ferrari and provided further that the policy of Ferrari on additions to reserves and dividends is duly observed.
Holders of special voting shares will not receive any dividend in respect of the special voting shares. However Ferrari maintains a separate dividend reserve for the special voting shares for the sole purpose of the allocation of the mandatory minimal profits that accrue to the special voting shares. This allocation establishes a reserve for the amount that would otherwise be paid. The special voting shares do not carry any entitlement to any other reserve. Any distribution out of the special dividend reserve or the partial or full release of such reserve requires a prior proposal from the Ferrari Board of Directors and a subsequent resolution of the meeting of holders of special voting shares.
Insofar as the profits have not been distributed or allocated to the reserves, they may, by resolution of the General Meeting, be distributed as dividends on the Ferrari common shares only. The General Meeting may resolve, on the proposal of the Ferrari Board of Directors, to declare and distribute dividends in U.S. Dollars. The Ferrari Board of Directors may decide, subject to the approval of the General Meeting and the Ferrari Board of Directors having been designated as the body competent to pass a resolution for the issuance of shares, that a distribution shall, wholly or partially, be made in the form of shares, or that shareholders shall be given the option to receive a distribution either in cash or in the form of shares.
The right to dividends and distributions will lapse if the dividends or distributions are not claimed within five years following the day after the date on which they first became payable. Any dividends or other distributions made in violation of the Ferrari Articles of Association or Dutch law will have to be repaid by the shareholders who knew or should have known, of such violation.
General Meetings and Voting Rights
Annual Meeting
An annual General Meeting must be held within six months from the end of Ferrari’s preceding financial year. The purpose of the annual General Meeting is to discuss, among other things, the annual report, the adoption of the annual accounts, allocation of profits (including the proposal to distribute dividends), release of members of the Ferrari Board of Directors from liability for their management and supervision, and other proposals brought up for discussion by the Ferrari Board of Directors.
122
General Meeting and Place of Meetings
Other General Meetings will be held if requested by the Ferrari Board of Directors, the chairman of the Ferrari Board of Directors, the chairperson or the chief executive officer, or by the written request (stating the exact subjects to be discussed) of one or more shareholders representing in aggregate at least 10 percent of the issued share capital of the company (taking into account the relevant provisions of Dutch law, and the Ferrari Articles of Association and the applicable stock exchange regulations). General Meetings will be held in Amsterdam or Haarlemmermeer (Schiphol Airport), the Netherlands.
Convocation Notice and Agenda
General Meetings can be convened by a notice, specifying the subjects to be discussed, the place and the time of the meeting and admission and participation procedure, issued at least 15 days before the meeting or 42 days if shares of Ferrari or depositary receipts issued with cooperation of Ferrari have been admitted to trading on the MTA or another regulated market as referred to in Article 1:1 of the Dutch Financial Supervision Act. All convocations, announcements, notifications and communications to shareholders and other persons entitled to attend the General Meeting must be made on the company’s corporate website in accordance with the relevant provisions of Dutch law. The agenda for a General Meeting may contain the items requested by one or more shareholders representing at least three percent of the issued share capital of the company, taking into account the relevant provisions of Dutch law. Requests must be made in writing, including the reasons for adding the relevant item on the agenda, and received by the Ferrari Board of Directors at least 60 days before the day of the meeting.
Admission and Registration
Each shareholder entitled to vote, and each person holding a usufruct or pledge to whom the right to vote on the Ferrari common shares accrues, shall be authorized to attend the General Meeting, to address the General Meeting and to exercise its voting rights. The registration date of each General Meeting is the twenty-eighth day prior to the date of the General Meeting so as to establish which shareholders are entitled to attend and vote at the General Meeting. Only holders of shares and other persons entitled to vote or attend the General Meeting, at such registration date are entitled to attend and vote at the General Meeting. The convocation notice for the meeting shall state the registration date and the manner in which the persons entitled to attend the General Meeting may register and exercise their rights.
Those entitled to attend a General Meeting may be represented at a General Meeting by a proxy authorized in writing. The requirement that a proxy must be in written form is also fulfilled when it is recorded electronically.
Members of the Ferrari Board of Directors have the right to attend a General Meeting. In these General Meetings they have an advisory role.
Voting Rights
Each Ferrari common share and each special voting share confers the right on the holder to cast one vote at a General Meeting. Resolutions are passed by a simple majority of the votes cast, unless Dutch law or the Ferrari Articles of Association prescribes a larger majority. Under Dutch law and/or the Ferrari Articles of Association, the following matters require at least two-thirds of the votes cast at a meeting if less than half of the issued share capital is present or represented:
|
•
|
a resolution to reduce the issued share capital;
|
|
•
|
a resolution to amend the Ferrari Articles of Association;
|
|
•
|
a resolution to restrict or exclude rights of pre-emption;
|
|
•
|
a resolution to authorize the Ferrari Board of Directors to restrict or exclude shareholder rights of pre-emption;
|
|
•
|
a resolution to enter into a legal merger or a legal demerger; or
|
|
•
|
a resolution to dissolve Ferrari.
|
Shareholders’ Votes on Certain Transactions
Any important change in the identity or character of Ferrari must be approved by the General Meeting, including (i) the termination transfer to a third party of the business of Ferrari or practically the entire business of Ferrari; (ii) the entry into or breaking off of any long-term cooperation of Ferrari or a subsidiary with another legal entity or company or as a fully
123
liable partner of a general partnership or limited partnership, where such entry into or breaking off is of far-reaching importance to Ferrari; and (iii) the acquisition or disposal by Ferrari or a subsidiary of an interest in the capital of a company with a value of at least one-third of Ferrari’s assets according to the consolidated statement of financial position with explanatory notes included in the last adopted annual accounts of Ferrari.
Amendments to the Ferrari Articles of Association, including Variation of Rights
A resolution of the General Meeting to amend the Ferrari Articles of Association or to wind up Ferrari may be approved only if proposed by the Ferrari Board of Directors and must be approved by a vote of a majority of at least two-thirds of the votes cast if less than one-half of the issued share capital is present or represented at such General Meeting.
The rights of shareholders may be changed only by amending the Ferrari Articles of Association in compliance with Dutch law.
Dissolution and Liquidation
The General Meeting may resolve to dissolve Ferrari, upon a proposal of the Ferrari Board of Directors thereto. A majority of at least two-thirds of the votes cast shall be required if less than one-half of the issued capital is present or represented at the meeting. In the event of dissolution, Ferrari will be liquidated in accordance with Dutch law and the Ferrari Articles of Association and the liquidation shall be arranged by the members of the Ferrari Board of Directors, unless the General Meeting appoints other liquidators. During liquidation, the provisions of the Ferrari Articles of Association will remain in force as long as possible.
If Ferrari is dissolved and liquidated, whatever remains of Ferrari’s equity after all its debts have been discharged shall first be applied to distribute the aggregate balance of share premium reserves and other reserves (other than the special dividend reserve), to holders of Ferrari common shares in proportion to the aggregate nominal value of the Ferrari common shares held by each holder; secondly, from any balance remaining, an amount equal to the aggregate amount of the nominal value of the Ferrari common shares will be distributed to the holders of Ferrari common shares in proportion to the aggregate nominal value of Ferrari common shares held by each of them; thirdly, from any balance remaining, an amount equal to the aggregate amount of the special voting shares dividend reserve will be distributed to the holders of special voting shares in proportion to the aggregate nominal value of the special voting shares held by each of them; fourthly, from any balance remaining, the aggregate amount of the nominal value of the special voting shares will be distributed to the holders of special voting shares in proportion to the aggregate nominal value of the special voting shares held by each of them; and, lastly, any balance remaining will be distributed to the holders of Ferrari common shares in proportion to the aggregate nominal value of Ferrari common shares held by each of them.
Liability of Directors
Under Dutch law, the management of a company is a joint undertaking and each member of the Board of Directors can be held jointly and severally liable to Ferrari for damages in the event of improper or negligent performance of their duties. Further, members of the Board of Directors can be held liable to third parties based on tort, pursuant to certain provisions of the Dutch Civil Code. All directors are jointly and severally liable for failure of one or more co-directors. An individual director is only exempted from liability if he proves that he cannot be held seriously culpable for the mismanagement and that he has not been negligent in seeking to prevent the consequences of the mismanagement. In this regard a director may, however, refer to the allocation of tasks between the directors. In certain circumstances, directors may incur additional specific civil and criminal liabilities.
Indemnification of Directors and Officers
Under Dutch law, indemnification provisions may be included in a company’s articles of association. Under the Ferrari Articles of Association, Ferrari is required to indemnify its directors, officers, former directors, former officers and any person who may have served at Ferrari’s request as a director or officer of another company in which Ferrari owns shares or of which Ferrari is a creditor who were or are made a party or are threatened to be made a party or are involved in, any threatened, pending or completed action, suit, or proceeding, whether civil, criminal, administrative, arbitrative or investigative (each a “Proceeding”), or any appeal in such a Proceeding or any inquiry or investigation that could lead to such a Proceeding, against any and all liabilities, damages, reasonable and documented expenses (including reasonably incurred and substantiated attorney’s fees), financial effects of judgments, fines, penalties (including excise and similar taxes and punitive damages) and amounts paid in settlement in connection with such Proceeding by any of them. Notwithstanding the above, no indemnification shall be made
124
in respect of any claim, issue or matter as to which any of the above-mentioned indemnified persons shall be adjudged to be liable for gross negligence or willful misconduct in the performance of such person’s duty to Ferrari. This indemnification by Ferrari is not exclusive of any other rights to which those indemnified may be entitled otherwise. Ferrari has purchased directors’ and officers’ liability insurance for the members of the Board of Directors and certain other officers, substantially in line with that purchased by similarly situated companies.
Dutch Corporate Governance Code
The Dutch Corporate Governance Code contains principles and best practice provisions that regulate relations between the board and the shareholders (including the General Meeting). The Dutch Corporate Governance Code is divided into five chapters which address the following topics: (i) long-term value creation; (ii) effective management and supervision; (iii) remuneration; (iv) the general meeting; and (v) one-tier governance structure.
Dutch companies whose shares are listed on a government-recognized stock exchange, such as the NYSE, are required under Dutch law to disclose in their annual reports whether or not they apply the provisions of the Dutch Corporate Governance Code and, in the event that they do not apply a certain provision, to explain the reasons why they have chosen to deviate.
Ferrari acknowledges the importance of good corporate governance and supports the best practice provisions of the Dutch Corporate Governance Code. Therefore, Ferrari intends to comply with the relevant best practice provisions of the Dutch Corporate Governance Code except as may be noted from time to time in Ferrari’s annual reports.
The Dutch Corporate Governance Code has been revised in December 2016 and the revised Dutch Corporate Governance Code entered into force on January 1, 2018, being applicable retroactively as from the financial year 2017. Consequently, Ferrari is required to report in 2018 regarding its application of the revised Dutch Corporate Governance Code with respect to the financial year 2017.
Disclosure of Holdings under Dutch Law
Home member state for purposes of the EU Transparency Directive
The Netherlands is Ferrari’s home member state for the purposes of the EU Transparency Directive (Directive 2004/109/EC, as amended). As of the listing of the Ferrari common shares on the MTA, we are subject to financial and other reporting obligations under the AFS and the Dutch Financial Reporting Supervision Act (
Wet toezicht financiële verslaggeving
) (DFRSA), which both implement the EU Transparency Directive in the Netherlands.
Disclosure of information
Ferrari is required to publish its annual report (consisting of the audited annual accounts, the annual report and the responsibility statement) within four months after the end of each financial year and its half-yearly figures within three months after the end of the first six months of each financial year.
Shareholder disclosure and reporting obligations
As a result of the listing of the Ferrari common shares on the MTA, chapter 5.3 of the Dutch act on Financial Supervision (“AFS”) applies, pursuant to which any person who, directly or indirectly, acquires or disposes of an actual or potential capital interest and/or actual or potential voting rights in Ferrari must promptly give written notice to the Netherlands Authority for the Financial Markets (
stichting Autoriteit Financiële Markten
, the “AFM”) of such acquisition or disposal by means of a standard form if, as a result of such acquisition or disposal, the percentage of capital interest and/or voting rights held by such person reaches, exceeds or falls below the following thresholds: 3 percent, 5 percent, 10 percent, 15 percent, 20 percent, 25 percent, 30 percent, 40 percent, 50 percent, 60 percent, 75 percent and 95 percent.
For the purpose of calculating the percentage of capital interest or voting rights, the following interests must, inter alia, be taken into account: (i) shares and/or voting rights directly held (or acquired or disposed of) by any person, (ii) shares and/or voting rights held (or, acquired or disposed of) by such person’s controlled entities or by a third party for such person’s account, (iii) voting rights held (or acquired or disposed of) by a third party with whom such person has concluded an oral or written voting agreement, (iv) voting rights acquired pursuant to an agreement providing for a temporary transfer of voting rights in consideration for a payment, and (v) shares which such person, or any controlled entity or third party referred to above, may acquire pursuant to any option or other right to acquire shares.
125
As a consequence of the above, special voting shares shall be added to Ferrari common shares for the purposes of the above thresholds.
Controlled entities (within the meaning of the Dutch Financial Supervision Act) do not themselves have notification obligations under the AFS as their direct and indirect interests are attributed to their (ultimate) parent. If a person who has a three percent or larger interest in Ferrari’s share capital or voting rights ceases to be a controlled entity it must immediately notify the AFM and all notification obligations under the AFS will become applicable to such former controlled entity.
Special rules apply to the attribution of shares and/or voting rights which are part of the property of a partnership or other form of joint ownership. A holder of a pledge or right of usufruct in respect of shares can also be subject to notification obligations, if such person has, or can acquire, the right to vote on the shares. The acquisition of (conditional) voting rights by a pledgee or beneficial owner may also trigger notification obligations as if the pledgee or beneficial owner were the legal holder of the shares and/or voting rights.
Furthermore, when calculating the percentage of capital interest, a person is also considered to be in possession of shares if (i) such person holds a financial instrument the value of which is (in part) determined by the value of the shares or any distributions associated therewith and which does not entitle such person to acquire any shares, (ii) such person may be obliged to purchase shares on the basis of an option, or (iii) such person has concluded another contract whereby such person acquires an economic interest comparable to that of holding a share.
If a person’s capital interest and/or voting rights reaches, exceeds or falls below the above-mentioned thresholds as a result of a change in Ferrari’s issued and outstanding share capital or voting rights, such person is required to make a notification not later than on the fourth trading day after the AFM has published Ferrari’s notification as described below.
Following the implementation of Directive 2013/50/EU into the AFS, every holder of three percent more of the issued and outstanding share capital or voting rights whose interest has changed compared to his most recent notification, and which holder knows or should know that pursuant to this change his interest reaches or crosses a threshold as a result of certain acts (as described above and including the exchange of a financial instrument or a contract (pursuant to which the holder is deemed to have issued and outstanding shares or voting rights at his disposal)), must notify the AFM of this change.
Ferrari is required to notify the AFM promptly of any change of one percent or more in its issued and outstanding share capital or voting rights since a previous notification. Other changes in Ferrari’s issued and outstanding share capital or voting rights must be notified to the AFM within eight days after the end of the quarter in which the change occurred.
In addition to the above described notification obligations pertaining to capital interest or voting rights, pursuant to Regulation (EU) No 236/2012, as amended, notification must be made of any net short position of 0.2% in the issued share capital of Ferrari, and of every subsequent 0.1% above this threshold. Notifications starting at 0.5% and every subsequent 0.1% above this threshold will be made public via the short selling register of the AFM. Furthermore, gross short positions shall be notified in the event that a threshold is reached, exceeded or fallen below. With regard to gross short positions, the same disclosure thresholds as for holders of capital interests and/or voting rights apply.
Furthermore, each member of the Board of Directors must notify the AFM:
|
•
|
within two weeks after his/her appointment of the number of shares he/she holds and the number of votes he/she is entitled to cast in respect of Ferrari’s issued and outstanding share capital, and
|
|
•
|
subsequently of each change in the number of shares he/she holds and of each change in the number of votes he/she is entitled to cast in respect of Ferrari’s issued and outstanding share capital, immediately after the relevant change.
|
The AFM keeps a public register of all notifications made pursuant to these disclosure obligations and publishes any notification received which can be accessed via www.afm.nl. The notifications referred to in this paragraph should be made in writing by means of a standard form or electronically through the notification system of the AFM.
Non-compliance with these disclosure obligations is an economic offense and may lead to criminal prosecution. The AFM may impose administrative penalties for non-compliance, and the publication thereof. In addition, a civil court can impose measures against any person who fails to notify or incorrectly notifies the AFM of matters required to be notified. A claim requiring that such measures be imposed may be instituted by Ferrari and/or by one or more shareholders who alone or together
126
with others represent at least three percent of the issued and outstanding share capital of Ferrari or are able to exercise at least three percent of the voting rights. The measures that the civil court may impose include:
|
•
|
an order requiring appropriate disclosure;
|
|
•
|
suspension of the right to exercise the voting rights for a period of up to three years as determined by the court;
|
|
•
|
voiding a resolution adopted by the General Meeting, if the court determines that the resolution would not have been adopted but for the exercise of the voting rights of the person with a duty to disclose, or suspension of a resolution adopted by the general meeting of shareholders until the court makes a decision about such voiding; and
|
|
•
|
an order to refrain, during a period of up to five years as determined by the court, from acquiring shares and/or voting rights in Ferrari. Shareholders are advised to consult with their own legal advisers to determine whether the disclosure obligations apply to them.
|
Shareholders are advised to consult with their own legal advisers to determine whether the disclosure obligations apply to them.
Mandatory Bid Requirement
Under Dutch law any person, acting alone or in concert with others, who, directly or indirectly, acquires 30 percent or more of Ferrari’s voting rights will be obliged to launch a public offer for all outstanding shares in Ferrari’s share capital. An exception is made for shareholders who, whether alone or acting in concert with others, had an interest of at least 30 percent of Ferrari’s voting rights before the shares were first listed on the MTA and who still maintained such an interest after such first listing. Immediately after the first listing of Ferrari common shares on the MTA, Exor held more than 30 percent of Ferrari’s voting rights. Therefore Exor’s interest in Ferrari was grandfathered and the exception that applies to it will continue to apply to it for as long as its holding of shares represents over 30 percent of Ferrari’s voting rights.
Dutch Financial Reporting Supervision Act
On the basis of the Dutch Financial Reporting Supervision Act (
Wet toezicht financiële verslaggeving
), or the FRSA, the AFM supervises the application of financial reporting standards by, amongst others, companies whose corporate seat is in the Netherlands and whose securities are listed on a regulated market within the EU or in a non-EU country on a system similar to a regulated market.
Pursuant to the FRSA, the AFM has an independent right to (i) request an explanation from Ferrari regarding its application of the applicable financial reporting standards and (ii) recommend to us the making available of further explanations. If we do not comply with such a request or recommendation, the AFM may request that the Enterprise Chamber order us to (i) make available further explanations as recommended by the AFM, (ii) provide an explanation of the way we have applied the applicable financial reporting standards to our financial reports or (iii) prepare our financial reports in accordance with the Enterprise Chamber’s instructions.
Compulsory Acquisition
Pursuant to article 2:92a of the Dutch Civil Code (“DCC”), a shareholder who, for its own account, holds at least 95 percent of the issued share capital of Ferrari may institute proceedings against the other shareholders jointly for the transfer of their shares to it. The proceedings are held before the Dutch Enterprise Chamber and can be instituted by means of a writ of summons served upon each of the minority shareholders in accordance with the provisions of the Dutch Code of Civil Procedure. The Enterprise Chamber may grant the claim for the squeeze-out in relation to all minority shareholders and will determine the price to be paid for the shares, if necessary after appointment of one or three expert(s) who will offer an opinion to the Enterprise Chamber on the value to be paid for the shares of the minority shareholders. Once the order to transfer becomes final before the Enterprise Chamber, the person acquiring the shares must give written notice of the date and place of payment and the price to the holders of the shares to be acquired whose addresses are known to it. Unless the addresses of all of them are known to it, it must also publish the same in a Dutch daily newspaper with a national circulation. A shareholder can only appeal against the judgment of the Enterprise Chamber before the Dutch Supreme Court.
127
In addition, pursuant to article 2:359c of the DCC, an offeror under a public offer is also entitled to start a squeeze out procedure, within three months after the public offer, if following the public offer it holds at least 95% of the issued share capital of Ferrari representing at least 95% of the total voting rights. In the event of a mandatory offer, the mandatory offer price is in principle deemed to be a reasonable price, which has to be accepted by minority shareholders. In the event of a voluntary public offer, the offer price is considered reasonable if at least 90% of the shares have been acquired under the public offer.
Pursuant to article 2:359d of the DCC, if the offeror has acquired at least 95% of the issued share capital of Ferrari representing at least 95% of the total voting rights, each remaining minority shareholder is entitled to demand a squeeze out. This procedure must be initiated with the Enterprise Chamber within three months after the end of the period for tendering Shares in the public offer. With regard to the price per share to be paid by the majority Shareholder, the same procedure as for squeeze out proceedings initiated by the offeror, as set out in the previous paragraph, applies.
Disclosure of Trades in Listed Securities
Disclosure under Dutch Law
Pursuant to the AFS and the Market Abuse Regulation (EU) No 596/2014, each of the members of the Ferrari Board of Directors and any other person discharging managerial responsibilities within Ferrari and who in that capacity is authorized to make decisions affecting the future developments and business prospects of Ferrari and who has regular access to inside information relating, directly or indirectly, to Ferrari (each, an “Insider”) must notify the AFM of all transactions, conducted or carried out for his/her own account, relating to Ferrari common shares or financial instruments, the value of which is (in part) determined by the value of Ferrari common shares.
In addition, persons who are closely associated with members of the Board of Directors or any of the other Insiders must notify the AFM of all transactions conducted for their own account relating to Ferrari’s shares or financial instruments, the value of which is (in part) determined by the value of Ferrari’s shares. The Market Abuse Regulation designates the following categories of persons: (i) the spouse or any partner considered by applicable law as equivalent to the spouse, (ii) dependent children, (iii) other relatives who have shared the same household for at least one year at the relevant transaction date, and (iv) any legal person, trust or partnership, among other things, whose managerial responsibilities are discharged by a member of the Board of Directors or any other Insider or by a person referred to under (i), (ii) or (iii) above.
The AFM must be notified of transactions effected in either Ferrari’s shares or financial instruments, the value of which is (in part) determined by the value of Ferrari’s shares, following the transaction date by means of a standard form. Notifications under the Market Abuse Regulation may be postponed until the date that the value of the transactions carried out on a person’s own account, together with the transactions carried out by the persons associated with that person, reaches or exceeds the amount of €5,000 in the calendar year in question. The AFM keeps a public register of all notifications made pursuant to the AFS and the Market Abuse Regulation.
Ferrari is required to make inside information public. Inside information is precise information directly or indirectly relating to the issuer or the trade in its securities which has not yet been made public and publication of which could significantly affect the trading price of the securities. Ferrari must also provide the Consob with this inside information at the time of publication. Furthermore, Ferrari must without delay publish the inside information on its website and keep it available on Ferrari’s website for at least five years.
It is prohibited for any person to make use of inside information by conducting, effecting or attempting to conduct or effect a transaction in relevant financial instruments. In addition, it is prohibited for any person to pass on inside information relating to Ferrari or the trade in its securities to a third party or to recommend or induce, on the basis of inside information, any person to conduct a transaction in securities of Ferrari. Furthermore, it is prohibited for any person to manipulate or attempt to manipulate the market, for instance by conducting transactions which could lead to an incorrect or misleading signal of the supply of, the demand for or the price of the securities. The provisions of the Market Abuse Regulation concerning insider trading and manipulation of the market are self-executing and immediately applicable Italian law. Moreover, on October 2016 CONSOB started a process for the review (in light of the MAR Regulation) of certain regulatory provisions contained in the Issuers’ Regulation no. 11971/1999.
Non-compliance with these reporting obligations could lead to criminal penalties, administrative fines and cease-and-desist orders (and the publication thereof), imprisonment or other sanctions.
128
Shareholder Disclosure and Reporting Obligations under U.S. Law
Holders of Ferrari shares are subject to certain U.S. reporting requirements under the Securities Exchange Act of 1934 (the “Exchange Act”) for shareholders owning more than 5 percent of any class of equity securities registered pursuant to Section 12 of the Exchange Act. Among the reporting requirements are disclosure obligations intended to inform the market of significant accumulations of shares that may lead to a change of control of an issuer.
If Ferrari were to fail to qualify as a foreign private issuer in the future, Section 16(a) of the Exchange Act would require Ferrari’s directors and executive officers, and persons who own more than ten percent of a registered class of Ferrari’s equity securities, to file reports of ownership of, and transactions in, Ferrari’s equity securities with the SEC. Such directors, executive officers and ten percent stockholders would also be required to furnish Ferrari with copies of all Section 16 reports they file.
Disclosure Requirements under Italian law
Summarized below are the most significant requirements to be complied with by Ferrari in connection with the admission to listing of Ferrari common shares on the MTA. The breach of the obligations described below may result in the application of fines and criminal penalties (including, for instance, those provided for insider trading and market manipulation). Further requirements may be imposed by CONSOB and/or Borsa Italiana as a result of the listing of Ferrari common shares on the MTA.
In particular, the following main disclosure obligations provided for by the Legislative Decree no. 58/1998, or the Italian Financial Act, effective as of the date of this document shall apply to Ferrari, article 92 (equal treatment principle), article 114 (information to be provided to the public), article 114-
bis
(information to be provided to the market concerning the allocation of financial instruments to corporate officers, employees and collaborators), article 115 (information to be disclosed to CONSOB), article 115-
bis
(register of persons having access to inside information) and article 180 and the following (relating to insider trading and market manipulation). In addition to the above, the applicable provisions set forth under the market rules (including those relating to the timing for the payment of dividends) shall apply to Ferrari.
Disclosure of Inside Information
Pursuant to the Italian Financial Act, Ferrari shall disclose to the public, without delay, any inside information which: (i) is specific, (ii) has not been made public, (iii) relates directly to Ferrari or Ferrari’s common shares, and (iv) if it were made public, would be likely to have a material impact on the prices of Ferrari’s common shares (the “Inside Information”). In this regard, Inside Information shall be deemed specific if: (a) it refers to a set of circumstances which exists or may reasonably be expected to occur and (b) it is precise enough to allow the recipient to come to a conclusion as to the possible effect of the relevant set of circumstances or events on the prices of listed financial instruments (i.e., Ferrari’s common shares). The above disclosure requirement shall be complied with through the publication of a press release by Ferrari, in accordance with the modalities set forth from time to time under Dutch and Italian law, disclosing to the public the relevant Inside Information. The provisions of the Market Abuse Regulation concerning the disclosure of inside information are self-executing and immediately applicable under Italian law. Moreover, on October 2016 CONSOB started a process for the review (in light of the MAR Regulation) of certain regulatory provisions contained in the Issuers’ Regulation no. 11971/1999.
Under specific circumstances, CONSOB may at any time request: (a) Ferrari to disclose to the public specific information or documentation where deemed appropriate or necessary or alternatively (b) to be provided with specific information or documentation. For this purpose, CONSOB has wide powers to, among other things, carry out inspections or request information to the members of the managing board, the members of the supervisory board or to the external auditor.
Ferrari shall publish and transmit to CONSOB any information disseminated in any non EU-countries where Ferrari’s common shares are listed (i.e., the U.S.), if this information is significant for the purposes of the evaluation of Ferrari’s common shares listed on the MTA.
Insiders’ Register
Pursuant to the MAR, Ferrari and its subsidiaries, as well as persons acting on their behalf or for their account, shall draw up, and keep promptly updated, a list of persons who, in the exercise of their employment, profession or duties, have access to Inside Information. Ferrari shall provide such list to the competent authority at its request.
129
Public Tender Offers
Certain rules provided for under Italian law with respect to both voluntary and mandatory public tender offers shall apply to any offer launched for Ferrari’s common shares. In particular, among other things, the provisions concerning the tender offer price, the content of the offer document and the disclosure of the tender offer will be subject to the supervision by CONSOB and Italian law.
Election and Removal of Directors
Ferrari’s Articles of Association provide that Ferrari’s Board of Directors shall be composed of three or more members.
Directors are appointed by a simple majority of the votes validly cast at a General Meeting. The General Meeting may at any time suspend or dismiss any director.
C. Material Contracts
For a discussion of our syndicated facility, and issuance of notes please see “Item 5.B.
Liquidity and Capital Resources
”.
D. Exchange Controls
Under Dutch law, there are no exchange control restrictions on investments in, or payments on, the Ferrari common shares. There are no special restrictions in the Ferrari Articles of Association or Dutch law that limit the right of shareholders who are not citizens or residents of the Netherlands to hold or vote the Ferrari common shares.
E. Taxation
Material United States Federal Income Tax Consequences
This section describes the material U.S. federal income tax consequences of owning Ferrari common shares and special voting shares. It applies solely to U.S. holders (as defined below) that hold common shares or special voting shares of Ferrari as capital assets. This section does not apply to holders subject to special rules, including:
|
•
|
a dealer in securities or foreign currencies,
|
|
•
|
a regulated investment company,
|
|
•
|
a trader in securities that elects to use a mark-to-market method of accounting for securities holdings,
|
|
•
|
a tax-exempt organization,
|
|
•
|
a bank, financial institution, or insurance company,
|
|
•
|
a person liable for the alternative minimum tax,
|
|
•
|
a person that actually or constructively owns 10 percent or more, by vote or value, of Ferrari,
|
|
•
|
a person that holds common shares or special voting shares of Ferrari as part of a straddle or a hedging, conversion, or other risk reduction transaction for U.S. federal income tax purposes,
|
|
•
|
a person that acquired common shares or special voting shares of Ferrari pursuant to the exercise of employee stock options or otherwise as compensation, or
|
|
•
|
a person whose functional currency is not the U.S. Dollar.
|
This section is based on the Internal Revenue Code of 1986, as amended (the “Code”), its legislative history, existing and proposed regulations, published rulings and court decisions, as well as on applicable tax treaties, all as of the date hereof. These laws are subject to change, possibly on a retroactive basis.
130
If an entity or arrangement treated as a partnership for U.S. federal income tax purposes holds shares, the U.S. federal income tax treatment of a partner will generally depend on the status of the partner and the tax treatment of the partnership. A partner in an entity treated as a partnership for U.S. federal income tax purposes holding shares should consult its tax advisors with regard to the U.S. federal income tax treatment of the ownership of Ferrari common shares.
Holders should consult their own tax advisors regarding the U.S. federal, state and local and foreign and other tax consequences of owning and disposing of Ferrari common shares in their particular circumstances.
For purposes of this discussion, a “U.S. holder” is a beneficial owner of common shares of Ferrari that is:
|
•
|
an individual that is a citizen or resident of the United States;
|
|
•
|
a corporation, or other entity taxable as a corporation, created or organized under the laws of the United States;
|
|
•
|
an estate whose income is subject to U.S. federal income tax regardless of its source; or
|
|
•
|
a trust if (i) a U.S. court can exercise primary supervision over the trust’s administration and one or more U.S. persons are authorized to control all substantial decisions of the trust or (ii) the trust has made a valid election under applicable Treasury Regulations to be treated as a U.S. person.
|
Taxation of Dividends
Under the U.S. federal income tax laws, and subject to the discussion of PFIC taxation below, a U.S. holder must include in its gross income the gross amount of any dividend paid by Ferrari to the extent of its current or accumulated earnings and profits (as determined for U.S. federal income tax purposes). Dividends will be taxed as ordinary income to the extent that they are paid out of Ferrari’s current or accumulated earnings and profits. Dividends paid to a non-corporate U.S. holder by certain “qualified foreign corporations” that constitute qualified dividend income are taxable to the holder at the preferential rates applicable to long-term capital gains provided that the holder holds the shares for more than 60 days during the 121-day period beginning 60 days before the ex-dividend date and meets other holding period requirements. For this purpose, common shares of Ferrari are treated as stock of a “qualified foreign corporation” if Ferrari is eligible for the benefits of an applicable comprehensive income tax treaty with the United States or if such stock is readily tradable on an established securities market in the United States. The common shares of Ferrari are listed on the New York Stock Exchange and Ferrari expects to be eligible for the benefits of such a treaty. Accordingly, subject to the discussion of PFIC taxation below, dividends Ferrari pays with respect to the shares are expected to constitute qualified dividend income, assuming the holding period requirements are met. However, no assurance can be given that the common shares of Ferrari will be treated as readily tradable on an established securities market in the United States or that Ferrari will qualify for the benefits of a comprehensive income tax treaty with the United States.
A U.S. holder must include any foreign tax withheld from the dividend payment in this gross amount even though the holder does not in fact receive the amount withheld. The dividend is taxable to a U.S. holder when the U.S. holder receives the dividend, actually or constructively.
The dividend will not be eligible for the dividends-received deduction allowed to U.S. corporations in respect of dividends received from other U.S. corporations.
Distributions in excess of current and accumulated earnings and profits, as determined for U.S. federal income tax purposes, will be treated as a non-taxable return of capital to the extent of the U.S. holder’s basis in Ferrari common shares, causing a reduction in the U.S. holder’s adjusted basis in Ferrari common shares, and thereafter as capital gain.
Subject to certain limitations, any non-U.S. tax withheld and paid over to a non-U.S. taxing authority is eligible for credit against a U.S. holder’s U.S. federal income tax liability except to the extent a refund of the tax withheld is available to the U.S. holder under non-U.S. tax law or under an applicable tax treaty. The amount allowed to a U.S. holder as a credit is limited to the amount of the U.S. holder’s U.S. federal income tax liability that is attributable to income from sources outside the U.S. and is computed separately with respect to different types of income that the U.S. holder receives from non-U.S. sources. Subject to the discussion below regarding Section 904(h) of the Code, dividends paid by Ferrari will be foreign source income and will generally be “passive” income for purposes of computing the foreign tax credit allowable to a U.S. holder.
Under Section 904(h) of the Code, dividends paid by a foreign corporation that is treated as 50 percent or more owned, by vote or value, by U.S. persons may be treated as U.S. source income (rather than foreign source income) for foreign tax credit
131
purposes, to the extent the foreign corporation earns U.S. source income, unless such corporation has less than 10 percent of applicable earnings and profits attributable to sources within the U.S. In certain circumstances, U.S. holders may be able to choose the benefits of Section 904(h)(10) of the Code and elect to treat dividends that would otherwise be U.S. source dividends as foreign source dividends, but in such a case the foreign tax credit limitations would be separately determined with respect to such “resourced” income. In general, therefore, the application of Section 904(h) of the Code may adversely affect a U.S. holder’s ability to use foreign tax credits. Ferrari does not believe that it is 50 percent or more owned by U.S. persons. In addition, Ferrari believes that its earnings and profits attributable to sources within the U.S. will not exceed 10 percent of applicable earnings and profits. However, these conclusions are factual determinations and are subject to change; no assurance can therefore be given that Ferrari may not be treated as 50 percent or more owned by U.S. persons for purposes of Section 904(h) of the Code or that less than 10 percent of Ferrari’s earnings and profits will be attributable to sources within the U.S. U.S. holders are strongly urged to consult their own tax advisors regarding the possible impact if Section 904(h) of the Code should apply.
Taxation of Capital Gains
Subject to the discussion of PFIC taxation and expected tax consequences of the Separation below, a U.S. holder that sells or otherwise disposes of its Ferrari common shares will recognize capital gain or loss for U.S. federal income tax purposes equal to the difference between the U.S. Dollar value of the amount that the U.S. holder realizes and the U.S. holder’s tax basis in those shares. Capital gain of a noncorporate U.S. holder is generally taxed at preferential rates where the property is held for more than one year. The gain or loss will be U.S. source income or loss for foreign tax credit limitation purposes. The deduction of capital losses is subject to limitations.
Loyalty Voting Program
NO STATUTORY, JUDICIAL OR ADMINISTRATIVE AUTHORITY DIRECTLY DISCUSSES HOW THE RECEIPT, OWNERSHIP OR DISPOSITION OF SPECIAL VOTING SHARES SHOULD BE TREATED FOR U.S. FEDERAL INCOME TAX PURPOSES AND AS A RESULT, THE U.S. FEDERAL INCOME TAX CONSEQUENCES ARE UNCERTAIN. ACCORDINGLY, WE URGE U.S. HOLDERS TO CONSULT THEIR TAX ADVISOR AS TO THE TAX CONSEQUENCES OF THE RECEIPT, OWNERSHIP AND DISPOSITION OF SPECIAL VOTING SHARES.
Receipt of special voting shares
If a U.S. holder receives special voting shares, the tax consequences of the receipt of special voting shares is unclear. While distributions of stock are tax-free in certain circumstances, it is possible that the distribution of special voting shares could be treated as a distribution subject to tax as described above in “—
Taxation of Dividends
” if such distribution were considered to result in a “disproportionate distribution.” If the distribution of special voting shares were so treated, the amount of the distribution should equal the fair market value of the special voting shares received. Ferrari believes and intends to take the position that the value of each special voting share is minimal. However, because the fair market value of the special voting shares is factual and is not governed by any guidance that directly addresses such a situation, the IRS could assets that the value of the special voting shares (and thus the amount of the distribution) as determined by Ferrari is incorrect.
Ownership of special voting shares
Ferrari believes that U.S. holders holding special voting shares should not have to recognize income in respect of amounts transferred to the special voting shares dividend reserve that are not paid out as dividends. Section 305 of the Code may, in certain circumstances, require a holder of preferred shares to recognize income even if no dividends are actually received on such shares if the preferred shares are redeemable at a premium and the redemption premium results in a “constructive distribution.” Preferred shares for this purpose refer to shares that do not participate in corporate growth to any significant extent. Ferrari believes that Section 305 of the Code should not apply to any amounts transferred to the special voting shares dividend reserve that are not paid out as dividends so as to require current income inclusion by U.S. holders because, among other things, (i) the special voting shares are not redeemable on a specific date and a U.S. holder is only entitled to receive amounts in respect of the special voting shares upon liquidation, (ii) Section 305 of the Code does not require the recognition of income in respect of a redemption premium if the redemption premium does not exceed a
de minimis
amount and, even if the amounts transferred to the special voting shares dividend reserve that are not paid out as dividends are considered redemption premium, the amount of the redemption premium is likely to be “
de minimis
” as such term is used in the applicable Treasury Regulations. Ferrari therefore intends to take the position that the transfer of amounts to the special voting shares dividend reserve that are not paid out as dividends does not result in a “constructive distribution,” and this determination is binding on all U.S. holders of special voting shares other than a U.S. holder that explicitly discloses its contrary determination in the manner prescribed by the applicable regulations. However, because the tax treatment of the loyalty voting program is unclear and because Ferrari’s determination is
132
not binding on the IRS, it is possible that the IRS could disagree with Ferrari’s determination and require current income inclusion in respect of such amounts transferred to the special voting shares dividend reserve that are not paid out as dividends.
Disposition of special voting shares
The tax treatment of a U.S. holder that has its special voting shares redeemed for zero consideration after removing its common shares from the Loyalty Register is unclear. It is possible that a U.S. holder would recognize a loss to the extent of the U.S. holder’s basis in its special voting shares. Such loss would be a capital loss and would be a long-term capital loss if a U.S. holder has held its special voting shares for more than one year. It is also possible that a U.S. holder would not be allowed to recognize a loss upon the redemption of its special voting shares and instead a U.S. holder should increase the basis in its Ferrari common shares by an amount equal to the basis in its special voting shares. Such basis increase in a U.S. holder’s Ferrari common shares would decrease the gain, or increase the loss, that a U.S. holder would recognize upon the sale or other taxable disposition of its Ferrari common shares.
THE U.S. FEDERAL INCOME TAX TREATMENT OF THE LOYALTY VOTING PROGRAM IS UNCLEAR AND U.S. HOLDERS ARE URGED TO CONSULT THEIR TAX ADVISORS IN RESPECT OF THE CONSEQUENCES OF ACQUIRING, OWNING, AND DISPOSING OF SPECIAL VOTING SHARES.
PFIC Considerations
Ferrari believes that shares of its stock will not be stock of a PFIC for U.S. federal income tax purposes, but this conclusion is based on a factual determination made annually and thus is subject to change. As discussed in greater detail below, if shares of Ferrari stock were to be treated as stock of a PFIC, gain realized (subject to the discussion below regarding a mark-to-market election) on the sale or other disposition of shares of Ferrari stock would not be treated as capital gain, and a U.S. holder would be treated as if such U.S. holder had realized such gain and certain “excess distributions” ratably over the U.S. holder’s holding period for its shares of Ferrari stock and would be taxed at the highest tax rate in effect for each such year to which the gain was allocated, together with an interest charge in respect of the tax attributable to each such year. With certain exceptions, a U.S. holder’s shares of Ferrari stock would be treated as stock in a PFIC if Ferrari were a PFIC at any time during such U.S. holder’s holding period in the shares. Dividends received from Ferrari would not be eligible for the special tax rates applicable to qualified dividend income if Ferrari were treated as a PFIC in the taxable years in which the dividends are paid or in the preceding taxable year (regardless of whether the U.S. holder held shares of Ferrari stock in such year) but instead would be taxable at rates applicable to ordinary income.
Ferrari would be a PFIC with respect to a U.S. holder if for any taxable year in which the U.S. holder held shares of Ferrari stock, after the application of applicable “look-through rules”:
|
•
|
75 percent or more of Ferrari’s gross income for the taxable year consists of “passive income” (including dividends, interest, gains from the sale or exchange of investment property and rents and royalties other than rents and royalties that are received from unrelated parties in connection with the active conduct of a trade or business, as defined in applicable Treasury Regulations); or
|
|
•
|
at least 50 percent of its assets for the taxable year (averaged over the year and determined based upon value) produce or are held for the production of passive income.
|
Because the determination whether a foreign corporation is a PFIC is primarily factual and there is little administrative or judicial authority on which to rely to make a determination, the IRS might not agree that Ferrari is not a PFIC. Moreover, no assurance can be given that Ferrari would not become a PFIC for any future taxable year if there were to be changes in Ferrari’s assets, income or operations.
If Ferrari were to be treated as a PFIC for any taxable year included in whole or in part in a U.S. holder’s holding period of Ferrari and such U.S. holder is treated as owning shares of Ferrari stock for purposes of the PFIC rules (and regardless of whether Ferrari remains a PFIC for subsequent taxable years), the U.S. holder (i) would be liable to pay U.S. federal income tax at the highest applicable income tax rates on (a) ordinary income upon the receipt of excess distributions (the portion of any distributions received by the U.S. holder on shares of Ferrari stock in a taxable year in excess of 125 percent of the average annual distributions received by the U.S. holder in the three preceding taxable years or, if shorter, the U.S. holder’s holding period for the Ferrari common shares) and (b) on any gain from the disposition of shares of Ferrari stock, plus interest on such amounts, as if such excess distributions or gain had been recognized ratably over the U.S. holder’s holding period of the shares of Ferrari stock, and (ii) may be required to annually file Form 8621 with the IRS reporting information concerning Ferrari.
133
If Ferrari were to be treated as a PFIC for any taxable year and provided that Ferrari common shares are treated as “marketable stock” within the meaning of applicable Treasury Regulations, which Ferrari believes will be the case, a U.S. holder may make a mark-to-market election with respect to such U.S. holder’s common shares. Under a mark-to-market election, any excess of the fair market value of the Ferrari common shares at the close of any taxable year over the U.S. holder’s adjusted tax basis in the Ferrari common shares is included in the U.S. holder’s income as ordinary income. These amounts of ordinary income would not be eligible for the favorable tax rates applicable to qualified dividend income or long-term capital gains. In addition, the excess, if any, of the U.S. holder’s adjusted tax basis at the close of any taxable year over the fair market value of the Ferrari common shares is deductible in an amount equal to the lesser of the amount of the excess or the amount of the net mark-to-market gains that the U.S. holder included in income in prior years. A U.S. holder’s tax basis in Ferrari common shares would be adjusted to reflect any such income or loss. Gain realized on the sale, exchange or other disposition of Ferrari common shares would be treated as ordinary income, and any loss realized on the sale, exchange or other disposition of Ferrari common shares would be treated as ordinary loss to the extent that such loss does not exceed the net mark-to-market gains previously included by the U.S. holder.
The adverse consequences of owning stock in a PFIC could also be mitigated if a U.S. holder makes a valid “qualified electing fund” election (“QEF election”), which, among other things, would require a U.S. holder to include currently in income its pro rata share of the PFIC’s net capital gain and ordinary earnings, based on earnings and profits as determined for U.S. federal income tax purposes. Because of the administrative burdens involved, Ferrari does not intend to provide information to its holders that would be required to make such election effective.
A U.S. holder that holds shares of Ferrari stock during a period when Ferrari is a PFIC will be subject to the foregoing rules for that taxable year and all subsequent taxable years with respect to that U.S. holder’s holding of Ferrari common shares, even if Ferrari ceases to be a PFIC, subject to certain exceptions for U.S. holders that made a mark-to-market or QEF election. U.S. holders are strongly urged to consult their tax advisors regarding the PFIC rules, and the potential tax consequences to them if Ferrari were determined to be a PFIC.
Material Netherlands Tax Consequences
This section describes solely the material Dutch tax consequences of the acquisition, ownership and disposal of Ferrari common shares and, if applicable, Ferrari special voting shares by Non-Resident holders of such shares (as defined below). It does not consider every aspect of Dutch taxation that may be relevant to a particular holder of Ferrari common shares and, if applicable, Ferrari special voting shares in special circumstances or who is subject to special treatment under applicable law. Shareholders and any potential investor should consult their own tax advisors regarding the Dutch tax consequences of acquiring, owning and disposing of Ferrari common shares and, if applicable, Ferrari special voting shares in their particular circumstances.
Where in this section English terms and expressions are used to refer to Dutch concepts, the meaning to be attributed to such terms and expressions shall be the meaning to be attributed to the equivalent Dutch concepts under Dutch tax law. Where in this section the terms “the Netherlands” and “Dutch” are used, these refer solely to the European part of the Kingdom of the Netherlands.
This summary also assumes that the board shall control the conduct of the affairs of Ferrari and shall procure that Ferrari is organized such that Ferrari should be treated as solely resident of Italy for the application of the tax treaty as concluded between Italy and The Netherlands. A change in facts and circumstances based upon which Ferrari is no longer considered to be solely resident of Italy for the application of the mentioned treaty may invalidate the contents of this section, which will not be updated to reflect any such change.
This description is based on the tax law of the Netherlands (unpublished case law not included) as it stands at the date of this Form. The law upon which this description is based is subject to change, perhaps with retroactive effect. Any such change may invalidate the contents of this description, which will not be updated to reflect such change.
Where in this Dutch taxation discussion reference is made to “a holder of Ferrari common shares and, if applicable, Ferrari special voting shares”, that concept includes, without limitation:
|
1.
|
an owner of one or more Ferrari common shares and/or Ferrari special voting shares who in addition to the title to such Ferrari common shares and/or Ferrari special voting shares, has an economic interest in such Ferrari common shares and/or Ferrari special voting shares;
|
134
|
2.
|
a person who or an entity that holds the entire economic interest in one or more Ferrari common shares and/or Ferrari special voting shares;
|
|
3.
|
a person who or an entity that holds an interest in an entity, such as a partnership or a mutual fund, that is transparent for Dutch tax purposes, the assets of which comprise one or more Ferrari common shares and/or Ferrari special voting shares, within the meaning of 1. or 2. above; or
|
|
4.
|
a person who is deemed to hold an interest in Ferrari common shares and/or Ferrari special voting shares, as referred to under 1. to 3., pursuant to the attribution rules of article 2.14a, of the Dutch Income Tax Act 2001 (
Wet inkomstenbelasting 2001
), with respect to property that has been segregated, for instance in a trust or a foundation.
|
Scope of the summary.
The summary of Dutch taxes set out in this section “Material Dutch tax consequences” only applies to a holder of Ferrari common shares and, if applicable Ferrari special voting shares who is a Non-Resident holder of such shares. For the purpose of this summary a holder of Ferrari common shares and, if applicable Ferrari special voting shares is a Non-Resident holder of such shares if such holder is neither a resident nor deemed to be resident in The Netherlands for purposes of Dutch income tax or corporation tax as the case may be.
Please note that this summary does not describe the tax considerations for holders of Ferrari common shares and, if applicable Ferrari special voting shares who are individuals and derive benefits from Ferrari common shares and, if applicable Ferrari special voting shares that are a remuneration or deemed to be a remuneration in connection with past, present or future employment performed in The Netherlands or management activities and functions or membership of a management board (
bestuurder
) or a supervisory board (
commissaris
) of a Netherlands resident entity by such holder or certain individuals related to such holder (as defined in The Dutch Income Tax Act 2001).
Taxes on income and capital gains
A Non-resident holder (as defined above) of Ferrari common shares and, if applicable, Ferrari special voting shares will not be subject to any Dutch taxes on income or capital gains in respect of any benefits derived or deemed to be derived by such holder from such holder’s Ferrari common shares and, if applicable, Ferrari special voting shares, including any capital gain realized on the disposal thereof, unless:
|
1.
|
such holder derives profits from an enterprise directly, or pursuant to a co-entitlement to the net value of such enterprise, other than as a holder of securities, which enterprise either is managed in the Netherlands or carried on, in whole or in part, through a permanent establishment or a permanent representative which is taxable in the Netherlands, and such holder’s Ferrari common shares and, if applicable, Ferrari special voting shares are attributable to such enterprise; or
|
|
2.
|
such holder is an individual and such holder derives benefits from Ferrari common shares and, if applicable, Ferrari special voting shares that are taxable as benefits from miscellaneous activities (
resultaat uit overige werkzaamheden
) in the Netherlands. Such holder may, inter alia, derive, or be deemed to derive, benefits from Ferrari common shares and, if applicable, Ferrari special voting shares that are taxable as benefits from miscellaneous activities if such holder’s investment activities go beyond the activities of an active portfolio investor, for instance in the case of use of insider knowledge or comparable forms of special knowledge.
|
|
|
Benefits derived or deemed to be derived from certain miscellaneous activities by a child or a foster child who is under eighteen years of age are attributed to the parent who exercises, or the parents who exercise, authority over the child, irrespective of the country of residence of the child.
|
Dividend withholding tax
Ferrari is generally required to withhold Dutch dividend withholding tax at a rate of 15 percent from dividends distributed by it. As an exception to this rule, Ferrari may not be required to withhold Dutch dividend withholding tax from Non-Resident holders of shares (as defined above) if it is considered to be a tax resident of both the Netherlands and Italy, in accordance with the domestic tax residency provisions applied by each of these jurisdictions, while the double tax treaty between the Netherlands and Italy attributes the tax residency exclusively to Italy.
135
Gift and inheritance taxes
If a holder of Ferrari common shares and, if applicable, Ferrari special voting shares disposes of Ferrari common shares and, if applicable, Ferrari special voting shares by way of gift, in form or in substance, or if a holder of Ferrari common shares and, if applicable, Ferrari special voting shares who is an individual dies, no Dutch gift tax or Dutch inheritance tax, as applicable, will be due, unless:
i. the donor is, or the deceased was, resident or deemed to be resident in the Netherlands for purposes of Dutch gift tax or Dutch inheritance tax, as applicable; or
ii. the donor made a gift of Ferrari common shares and, if applicable, Ferrari special voting shares, then became a resident or deemed resident of the Netherlands, and died as a resident or deemed resident of the Netherlands within 180 days of the date of the gift.
For purposes of the above, a gift of Ferrari common shares and, if applicable, Ferrari special voting shares made under a condition precedent is deemed to be made at the time the condition precedent is satisfied.
Value Added Tax
No Dutch value added tax will arise in respect of any payment in consideration for the issue of Ferrari common shares and, if applicable, Ferrari special voting shares.
Registration taxes and duties
No Dutch registration tax, transfer tax, stamp duty or any other similar documentary tax or duty, other than court fees, is payable in the Netherlands by a holder in respect of or in connection with (i) the subscription, issue, placement or allotment of Ferrari common shares and, if applicable, Ferrari special voting shares, (ii) the enforcement by way of legal proceedings (including the enforcement of any foreign judgment in the courts of the Netherlands) of the documents relating to the issue of Ferrari common shares and, if applicable, Ferrari special voting shares or the performance by Ferrari of Ferrari’s obligations under such documents, or (iii) the transfer of Ferrari common shares and, if applicable, Ferrari special voting shares.
Material Italian Income Tax Consequences
This section describes solely the material Italian tax consequences of acquiring, holding, and disposing of Ferrari common shares and, if applicable, Ferrari special voting shares. It does not consider every aspect of Italian taxation that may be relevant to a particular holder of Ferrari common shares and, if applicable, Ferrari special voting shares in special circumstances or who is subject to special treatment under applicable law, and it is not intended to be applicable in all respects to all classes of investors.
Shareholders and any potential prospective investors should consult their own tax advisors regarding the Italian tax consequences of acquiring, holding, and disposing of Ferrari common shares and, if applicable, Ferrari special voting shares in their particular circumstances and should investigate the nature and the origin of the amounts received as distributions in connection with the Ferrari common shares (dividends or reserves).
Where in this section English terms and expressions are used to refer to Italian concepts, the meaning to be given to these terms and expressions shall be the meaning to be given to the equivalent Italian concepts under Italian tax law. This summary assumes that Ferrari common shares will be listed on a regulated market. This summary also assumes that Ferrari is organized, and that the business will be conducted, in the manner outlined in this report. A change to the organizational structure or to the manner in which Ferrari conducts its business may invalidate the contents of this section, which will not be updated to reflect any such change.
This summary is based on the tax laws of the Republic of Italy and case law / practice (unpublished case law / practice is not included) as it stands at the date of this report. The law upon which this description is based is subject to change, potentially with retroactive effect. Any such change may invalidate the contents of this description, which will not be updated to reflect this change.
136
Definitions
In this section, the following terms have the meaning defined below:
|
•
|
“CITA”: Presidential Decree No. 917 of December 22, 1986 (the Consolidated Income Tax Act);
|
|
•
|
“EEA State”: a State that is party to the European Economic Area Agreement;
|
|
•
|
“IRES”: Italian corporate income tax;
|
|
•
|
|
|
•
|
“Italian White List”: the list of countries and territories allowing a satisfactory exchange of information with Italy currently included in the Italian Ministerial Decree of September 4, 1996, as subsequently amended by Ministerial Decree 9 August 2016, published on the Official Gazette n. 195 of 22 August 2016. The list is expected to be updated every six months. Countries can be removed from the list if their tax authorities consistently do not co-operate with the Italian tax authorities on the exchange of tax information;
|
|
•
|
“Non-Qualified Holdings”: holdings of common shares in Ferrari, including rights or securities through which Ferrari common shares may be acquired, other than Qualified Holdings;
|
|
•
|
“Qualified Holdings”: holdings of common shares in Ferrari, including rights or securities through which Ferrari common shares may be acquired, that represent, in case of shares listed on regulated markets, either (i) more than two percent of the overall voting rights exercisable at ordinary shareholders’ meetings or (ii) an interest in Ferrari’s issued and outstanding capital in excess of 5 percent; and
|
|
•
|
“Transfer of Qualified Holdings”: transfers of common shares in Ferrari, including rights or securities through which Ferrari common shares may be acquired, that exceed, over a period of 12 (twelve) months, the threshold for qualifying as Qualified Holdings. The twelve-month period starts from the date when the shares, securities and the rights owned represent a percentage of voting rights or interest in Ferrari’s capital that exceeds the aforesaid thresholds. In case of rights or securities through which Ferrari common shares may be acquired, the percentage of voting rights or interest in Ferrari’s capital potentially attributable to the holding of such rights and securities is taken into account.
|
Taxation of Dividends
The tax regime summarized in this subsection “Taxation of Dividends” applies only to classes of holders of Ferrari common shares and, if applicable, Ferrari special voting shares that are described here below.
Dividends paid by Ferrari are subject to the tax regime generally applicable to dividends paid by companies that are resident for tax purposes in the Republic of Italy.
The tax regime may vary as follows.
|
(A)
|
I
TALIAN
R
ESIDENT
P
ERSONS
|
|
(i)
|
Individuals not engaged in business activity
|
Under Decree No. 600 of September 29, 1973 (“Decree 600”), as amended by art. 1(1003) of Law No. 205 of 27 December 2017 (the “
2018 Budget Law
”), dividends paid from January 1, 2018 to Italian resident individuals who hold the Ferrari common shares neither in connection with a business activity nor in the context of the discretionary investment portfolio regime (“
risparmio gestito”
) as defined in subparagraph (A)(ii) below are subject to 26 percent tax withheld at source in Italy. In this case, the holders are not required to report the dividends in their income tax returns.
However, dividends from Qualified Holdings that (1) are resolved to be distributed from January 1, 2018 to December 31, 2022 and (2) are paid out of profits earned until the fiscal year ending December 31, 2017 are not subject to any tax withheld at source in Italy, provided that, in this case, the holders declare at the time of receipt that the dividends relate to Qualified Holdings. In this case, dividends must be reported in the income tax return, but only 58.14 percent (49.72 percent for dividends that are paid out of profits earned in fiscal years beginning before December 31, 2016) of such dividends are included in the holder’s overall income taxable in Italy.
137
|
(ii)
|
Individuals not engaged in business activity and holding the Ferrari common shares under the “risparmio gestito” regime
|
Dividends paid from January 1, 2018 to Italian resident individuals who do not hold the Ferrari common shares in connection with a business activity are not subject to any tax withheld at source in Italy if (a) the holder has entrusted the management of the shares to an authorized intermediary under a discretionary asset management contract, and (c) the holder has elected for the discretionary investment portfolio regime (“
risparmio gestito”
) under Article 7 of Legislative Decree No. 461 of November 21, 1997 (“Decree 461”). In this case, the dividends are included in the annual accrued management result (
risultato maturato annuo di gestione
), which is subjected to a 26 percent substitute tax.
However, dividends from Qualified Holdings that (1) are resolved upon in the Shareholders’ meeting to be distributed from January 1, 2018 to December 31, 2022 and (2) are paid out of profits earned until the fiscal year ending on December 31, 2017, cannot be subject to the aforementioned 26 percent substitute tax under the discretionary investment portfolio regime (
“risparmio gestito”
) and are included in the holder’s overall taxable income for 58.14 percent of their amount (49.72 percent for dividends that are paid out of profits earned in fiscal years beginning before December 31, 2016).
|
(iii)
|
Sole Proprietors
|
Dividends paid to Italian resident individuals who hold the Ferrari common shares in connection with a business activity (“Sole Proprietors”) are not subject to any tax withheld at source in Italy, provided that, in this case, the holders declare at the time of receipt that the profits collected are from holdings connected with their business activity. In this case, dividends must be reported in the income tax return, but only 58.14 percent of such dividends (49.72 percent for dividends that are paid out of profits earned in fiscal years beginning before December 31, 2016) are included in the holder’s overall business income taxable in Italy.
|
(iv)
|
Partnerships (Italian “società in nome collettivo”, “società in accomandita semplice”, “società semplici
”
and similar Italian partnerships as referred to in Article 5 CITA), as well as companies and other business entities referred to in Article 73(1)(a)-(b) CITA
|
No Italian tax is withheld at source on dividends paid to Italian partnerships (such as Italian “
società semplici
”, “
società in nome collettivo
”, “
società in accomandita semplice”
and similar partnerships as referred to in Article 5 CITA).
Only 58.14 percent of dividends (49.72 percent for dividends that are paid out of profits earned in fiscal years beginning before December 31, 2016) paid to Italian partnerships carrying out business activities (such as Italian “
società in nome collettivo
”, “
società in accomandita semplice
” and similar partnerships as referred to in Article 5 CITA) are included in the overall income to be reported by the partnership.
Under a certain interpretation, due to a lack of coordination among the various provisions following the amendments introduced by Article 1, paragraphs 999-1006 of the 2018 Budget Law, dividends paid from 1 January 2018 to simple partnership (“
società semplici
”) would concur for their entire amount in the calculation of the taxable income.
However, dividends paid to simple partnerships (“
società semplici
”) that (1) are resolved to be distributed from 1 January 2018 to 31 December 2022 and (2) are paid out of profits earned until the fiscal year pending on 31 December 2017,should be included in the taxable income reported by the simple partnership (“
società semplici
”) for only 58.14 per cent of their amount (49.72 percent for dividends that are paid out of profits earned in fiscal years beginning before 31 December 2016).
No Italian tax is withheld at source on dividends paid to Italian resident companies and other Italian resident business entities as referred to in Article 73(1)(a)-(b) CITA, including, among others, corporations (“
società per azioni”
), partnerships limited by shares (“
società in accomandita per azioni”
), limited liability companies (“
società a responsabilità limitata”
) and public and private entities whose sole or primary purpose is to carry out business activities. Only 5 percent of the dividends are included in the overall business income subject to IRES, unless the common shares in Ferrari are deemed to be held for trading (pursuant to art. 2 of The Ministerial Decree 10 January 2018) by holders that apply IAS / IFRS international accounting standards under Regulation No. 1606/2002 of the European Parliament and Council of July 19, 2002. In this latter case, the full amount of the dividends is included in the holder’s overall business income subject to IRES.
For some types of companies and under certain conditions, dividends are also partially included in the net value of production, which is subject to the regional tax on productive activities (“IRAP”).
138
|
(v)
|
Non-business entities referred to in Article 73(1)(c) CITA
|
No Italian tax is withheld at source on dividends paid to Italian resident non-business entities referred to in Article 73(1)(c) CITA (including Italian resident trusts that do not carry out a business activity), except for Italian collective investment vehicles (“OICR”). 100 percent of the dividends (77.74 percent for dividends that are paid out of profits earned in fiscal years beginning before December 31, 2016) are included in the holder’s overall income subject to IRES.
|
(vi)
|
Persons exempt from IRES and persons outside the scope of IRES
|
Dividends paid to Italian resident persons that are exempt from IRES are generally subject to 26 percent tax withheld at source.
No Italian tax is instead withheld at source on dividends paid to persons that are outside the scope of IRES (“
esclusi”
) under Article 74(1) CITA.
|
(vii)
|
Pension funds and OICR (other than Real Estate AIF)
|
No Italian tax is withheld at source on dividends paid to (a) Italian pension funds governed by Legislative Decree No. 252 of December 5, 2005 (“Decree 252”) and (b) Italian OICR, other than real estate investment funds and Italian real estate SICAFs (real estate alternative investment funds, “Real Estate AIF”).
Dividends received by Italian pension funds are taken into account to compute the pension fund’s net annual accrued yield, which is subject to a 20 percent flat tax (“
imposta sostitutiva”
).
Dividends received by OICR that are set up in, and organized under the laws of, Italy and that are subject to regulatory supervision (other than Real Estate AIF) are not subject to taxation at the level of the OICR.
|
(viii)
|
Real Estate AIF
|
No Italian tax is withheld at source on dividends paid to Italian Real Estate AIF. Moreover, dividends are not subject to either IRES or IRAP at the level of the Real Estate AIF. However, income realized by Italian Real Estate AIF is attributed pro rata to Italian resident unitholders / shareholders, irrespective of any actual distribution, on a tax transparency basis if the Italian resident unitholders / shareholders are not institutional investors and hold units / shares in the Real Estate AIF representing more than 5 percent of the Real Estate AIF’s net asset value.
|
(B)
|
N
ON
-I
TALIAN
R
ESIDENT
P
ERSONS
|
|
(i)
|
Non-resident persons holding the common shares in Ferrari through a permanent establishment in Italy
|
No Italian tax is withheld at source on dividends paid to non-resident persons that hold the common shares in Ferrari through a permanent establishment in Italy to which the common shares in Ferrari are effectively connected. Only 5 percent of the dividends are included in the overall income subject to IRES, unless the common shares in Ferrari are deemed to be held for trading (pursuant to art. 2 of The Ministerial Decree 10 January 2018) by holders that apply IAS / IFRS international accounting standards under Regulation No. 1606/2002 of the European Parliament and the Council of July 19, 2002. In this latter case, the full amount of the dividends is included in the overall business income subject to IRES.
For some types of businesses and under certain conditions, dividends are also partially included in the net value of production, which is subject to IRAP.
If dividends are paid with respect to common shares in Ferrari that are not connected with a permanent establishment in Italy of a non-resident person, please see subparagraph (B)(ii) below.
|
(ii)
|
Non-resident persons that do not hold the common shares in Ferrari through a permanent establishment in Italy
|
A 26 percent tax withheld at source generally applies on dividends paid to non-resident persons that do not have a permanent establishment in Italy to which the common shares in Ferrari are effectively connected.
Subject to a specific application that must be submitted to the Italian tax authorities under the terms and conditions provided by law, non-resident holders are entitled to relief (in the form of a refund), which cannot be greater than 11/26 (eleven twenty-sixths) of the tax levied in Italy, if they can demonstrate that they have paid final tax abroad on the same profits. Holders
139
who may be eligible for the relief should consult with their own independent tax advisors to determine whether they are eligible for, and how to obtain, the tax refund.
As an alternative to the relief described above, persons resident in countries that have a double tax treaty in force with Italy may request that the withholding tax on dividends be levied at the (reduced) rate provided under the applicable tax treaty provided that the non-resident person promptly submits proper documentation.
The domestic withholding tax rate on dividends is 1.2 percent (and not 26 percent) if the recipients and beneficial owners of the dividends on Ferrari common shares are companies or entities that are (a) resident for tax purposes in an EU Member State or in an EEA State that is included in the Italian White List and (b) subject to corporate income tax in such State. These companies and entities are not entitled to the relief described above. As a result of the IRES rate reduction provided for by Finance Act 2016 the withholding tax rate was reduced from 1.375 percent to 1.2 percent with effect for fiscal years following the fiscal year that is current on December 31, 2016 (i.e., from 2017 for taxpayers that follow the calendar year).
The domestic withholding tax rate on dividends is 11 percent (and not 26 percent) if the recipients and beneficial owners of the dividends on Ferrari common shares are pension funds that are set up in an EU Member States or an EEA Member State included in the Italian White List. These pension funds are not entitled to the relief described above.
Under Article 27-
bis
of Decree 600, which implemented in Italy the Directive 435/90/EEC of July 23, 1990, then recast in EU Directive 2011/96 of November 30, 2011 (the “Parent Subsidiary Directive”), a company is entitled to a full refund of the withholding tax levied on the dividends if it (a) has one of the legal forms provided for in the appendix to the Parent Subsidiary Directive, (b) is resident for tax purposes in an EU Member State without being considered to be resident outside the EU according to a double tax treaty signed with a non-EU country, (c) is subject in the country of residence to one of the taxes indicated in the appendix to the Parent Subsidiary Directive with no possibility of benefiting from optional or exemption regimes that have no territorial or time limitations, and (d) directly holds common shares in Ferrari that represent an interest in the issued and outstanding capital of Ferrari of no less than 10 percent for an uninterrupted period of at least one year. If these conditions are met, and as an alternative to submitting a refund request after the dividend distribution, the non-resident company may request that no tax be levied at the time the dividends are paid, provided that
(x)
the 1-year holding period under condition (d) above has already run and
(y)
the non-resident company promptly submits proper documentation. In case of transactions put in place for the sole or main purposes of obtaining a tax advantage that defeats the object or purpose of the Parent Subsidiary Directive, Italian tax authorities may deny the refund or challenge the exemption trough the general anti-avoidance provision set forth by Article 10-bis of Law No. 212 of July 27, 2000.
Under the Agreement between the European Community and the Swiss Confederation providing for measures equivalent to those laid down in Council Directive 2003/48/EC on taxation of savings income in the form of interest payments, the withholding tax refund / exemption regime described above also applies to dividends paid to a company that (a) is resident for tax purposes in Switzerland without being considered to be resident outside Switzerland according to a double tax treaty signed with a non-EU country, (b) is a limited company, (c) is subject to Swiss corporate tax without being exempted or benefiting from preferential tax regimes, and (d) directly holds common shares in Ferrari that represent an interest in Ferrari’s issued and outstanding capital of no less than 25 percent for an uninterrupted period of at least two years.
Dividends distributed to international entities or bodies that benefit from exemption from taxation in Italy pursuant to international rules or treaties entered into force in Italy will not be subject to withholding tax.
|
(iii)
|
U.S. holders (without permanent establishment in Italy) of Ferrari common shares and, if applicable, Ferrari special voting shares
|
If Ferrari is considered to be a tax resident of both Italy and the Netherlands, in accordance with the domestic tax residency provisions applied by each of these jurisdictions, while the double tax treaty between Italy and the Netherlands attributes the tax residency exclusively to Italy, Ferrari will be required to apply Italian dividend withholding tax on dividends distributed to U.S. holders of Ferrari common shares and, if applicable, Ferrari special voting shares. However, certain U.S. holders of Ferrari common shares and, if applicable, Ferrari special voting shares may qualify for full or partial relief from the Italian dividend withholding tax under the Convention between the Government of the United States of America and the Government of the Italian Republic for the avoidance of double taxation with respect to taxes on income and the prevention of fraud or fiscal evasion signed in Washington, D.C. on August 25, 1999 (the “Italy-U.S. Treaty”). On the basis of Article 10 of the Italy-U.S. Treaty, (a) qualifying U.S. holders are entitled to a reduced Italian dividend withholding tax rate (i.e., 15 percent); (b) qualifying U.S. companies are entitled, under certain conditions, to a reduced Italian dividend withholding tax rate (5 percent) and (c) certain
140
qualified U.S. governmental entities are entitled, under certain conditions, to a full exemption from Italian dividend withholding tax.
Taxation of distributions of Equity Reserves
The tax regime summarized in this subsection “Taxation of distributions of Equity Reserves” applies only to classes of holders of Ferrari common shares and, if applicable, Ferrari special voting shares that are described here below.
The information provided in this subsection summarizes the Italian tax regime applicable to the distributions by Ferrari - other than in case of reduction of excess capital, withdrawal, exclusion, redemption or liquidation - of equity reserves as referred to under Article 47(5) CITA, such as, for instance, reserves or other funds formed with share premiums, equalizing interests (“
interessi di conguaglio”
) paid in by the subscribers, equity (other than share capital) contributions (“
versamenti a fondo perduto”
) or share capital account payments (“
versamenti in conto capitale”
) made by shareholders and tax-exempt revaluation reserves (the “Equity Reserves”).
|
(A)
|
I
TALIAN
R
ESIDENT
P
ERSONS
|
|
(i)
|
Individuals not engaged in business activity
|
Regardless of what holders have resolved upon in the shareholders’ meeting, the amounts received as distribution out of Equity Reserves of Ferrari by Italian resident individuals who do not hold the Ferrari common shares in connection with a business activity are deemed to be, and treated as, profits for the recipients to the extent that Ferrari has current year profits and retained profits (except for any portion thereof earmarked to a tax-deferred reserve or non-distributable reserves). Amounts treated as profits are subject to the same tax regime described above for dividends. Amounts received as distributions out of Equity Reserves, net of any amount already treated as profits as per the above, reduce the holder’s tax basis in Ferrari common shares correspondingly. Distributions out of Equity Reserves that are in excess of the holders’ tax basis in the Ferrari common shares are treated as dividends for tax purposes. Special rules may apply if the individual holders have elected with regard to the common shares in Ferrari into the discretionary investment portfolio regime (“
regime del risparmio gestito”
) described in subparagraph (A)(i) of the subsection “Taxation of Capital Gains” below.
|
(ii)
|
Sole Proprietors, business partnerships (Italian “società in nome collettivo,” “società in accomandita semplice” and similar Italian partnerships as referred to in Article 5 CITA), as well as companies and other business entities referred to in Article 73(1)(a)-(b) CITA
|
Regardless of what holders have resolved upon in the shareholders’ meeting, the amounts received as distribution out of Equity Reserves of Ferrari by Italian Sole Proprietors, Italian business partnerships (Italian “
società in nome collettivo
,” “
società in accomandita semplice
” and similar Italian partnerships as referred to in Article 5 CITA), and Italian resident companies and other business entities referred to in Article 73(1)(a)-(b) CITA are deemed to be, and are treated as, profits for the recipients to the extent that Ferrari has current year profits and retained profits (except for any portion thereof earmarked to a tax-deferred reserve or non-distributable reserves). Amounts treated as profits should be subject to the same tax regime described above for dividends. Amounts received as distributions out of Equity Reserves, net of any amount already treated as profits as per the above, reduce the holder’s tax basis in the Ferrari common shares correspondingly. Distributions out of Equity Reserves that are in excess of the holders’ tax basis in the common shares in Ferrari are treated as capital gains for tax purposes and should be subject to the same regime described in the subsection “Taxation of Capital Gains” below.
|
(iii)
|
Non-business entities referred to in Article 73(1)(c) CITA
|
Amounts received by Italian resident non-business entities referred to in Article 73(1)(c) CITA as distributions out of Equity Reserves, net of any amount already treated as profits as per the rules described in subparagraph (A)(i) above, reduce the holder’s tax basis in the Ferrari common shares correspondingly. Distributions out of Equity Reserves that are in excess of the holders’ tax basis in the common shares in Ferrari not held in connection with a business activity are treated as dividends for tax purposes.
|
(iv)
|
Persons exempt from IRES
|
Amounts received by Italian resident persons exempt from IRES as distributions out of Equity Reserves, net of any amount already treated as profits as per the rules described in subparagraph (A)(i) above, reduce the holder’s tax basis in the Ferrari common shares correspondingly. Distributions out of Equity Reserves that are in excess of the holders’ tax basis in the common shares in Ferrari not held in connection with a business activity are treated as dividends for tax purposes.
141
|
(v)
|
Pension funds and OICR (other than Real Estate AIF)
|
Based on a systematic interpretation of the statute, amounts received by Italian pension funds governed by Article 17 of Decree 252 as distributions out of Equity Reserves should be taken into account to compute the pension fund’s net annual accrued yield, which is subject to a 20 percent flat tax (“
imposta sostitutiva”
). The value of the common shares in Ferrari at the end of the same tax year should also be included in the net annual accrued yield.
Conversely, any amounts received by OICR that are set up in, and organized under the laws of, Italy and that are subject to regulatory supervision (other than Real Estate AIF) as distributions out of Equity Reserves are not subject to taxation at the level of the OICR.
|
(vi)
|
Real Estate AIF
|
Amounts received by Italian Real Estate AIF as distributions out of Equity Reserves are not subject to IRES or IRAP at the level of the Real Estate AIF. However, income realized by Italian Real Estate AIF is attributed pro rata to the Italian resident unitholders / shareholders, irrespective of any actual distribution, on a tax transparency basis if the Italian resident unitholders / shareholders are not institutional investors and hold units / shares in the Real Estate AIF representing more than 5 percent of the Real Estate AIF’s net asset value.
|
(B)
|
N
ON
-I
TALIAN
R
ESIDENT
P
ERSONS
|
|
(i)
|
Non-resident persons that do not hold the common shares in Ferrari through a permanent establishment in Italy
|
For non-Italian resident persons (whether individuals or corporations) without a permanent establishment in Italy to which the common shares in Ferrari are effectively connected, the amounts received as distributions out of Equity Reserves are subject to the same tax regime as applicable to Italian resident individuals not engaged in business activity described in paragraph A(i) of this subsection “Taxation of distributions of Equity Reserves”. Therefore, the amounts received as distributions out of Equity Reserves, net of any amount that has already been treated as profits as per the rules described in subparagraph (A)(i) above, reduce the holder’s tax basis in the Ferrari common shares correspondingly. Distributions out of Equity Reserves that are in excess of the holders’ tax basis in the common shares in Ferrari are treated as dividends for tax purposes and are subject to taxation according to the rules referred to under paragraph B(ii) of subsection “Taxation of Dividends” above.
|
(ii)
|
Non-resident persons holding the common shares in Ferrari through a permanent establishment in Italy
|
For non-Italian resident persons that hold the common shares in Ferrari through a permanent establishment in Italy to which the Ferrari common shares are effectively connected, the amounts received as distributions out of Equity Reserves are subject to the same tax regime as applicable to Italian resident companies and other business entities referred to in Article 73(1)(a)-(b) CITA as described in subparagraph (A)(ii) above. If the Equity Reserves distribution relates to common shares in Ferrari that are not connected to a permanent establishment in Italy of the non-resident recipient, reference must be made to subparagraph (B)(i) above.
Taxation of Capital Gains
The tax regime summarized in this subsection “Taxation of Capital Gains” applies only to classes of holders of Ferrari common shares and, if applicable, Ferrari special voting shares that are described here below.
|
(A)
|
I
TALIAN
R
ESIDENT
P
ERSONS
|
|
(i)
|
Italian resident individuals not engaged in business activity
|
The tax regime of capital gains and capital losses realized from January 1, 2018 to December 31 2018 by Italian resident individuals upon transfer for consideration of the common shares in Ferrari (as well as of securities or rights whereby common shares in Ferrari may be acquired), other than capital gains and capital losses realized in connection with a business activity, depends on whether the transfer is a Transfer of Qualified Holdings.
T
RANSFER
O
F
Q
UALIFIED
H
OLDINGS
. 58.14 percent of the capital gains realized upon Transfers of Qualified Holdings must be included in the individual’s overall taxable income and reported in the individual’s annual income tax return. If the Transfer of Qualified Holdings gives rise to a capital loss, 58.14 percent of such loss may be offset against the corresponding taxable amount of any capital gain of the same nature that is realized in the same tax year; any excess of capital losses over
142
capital gains can be carried forward in the following years up to the fourth, provided that this capital loss is reported in the income tax return for the year when the capital loss is realized.
T
RANSFER
O
F
N
ON
-
QUALIFIED
H
OLDINGS
. Capital gains on Non-Qualified Holdings are subject to a 26 percent substitute tax (“CGT”). The taxpayer may opt for any of the following three tax regimes:
|
a.
|
Tax return regime (“
regime della dichiarazione”
). Under this regime, capital gains and capital losses realized during the tax year must be reported in the income tax return. CGT is computed on capital gains net of capital losses of the same nature and must be paid by the term for paying the balance of the annual income tax. Capital losses in excess of capital gains may be carried forward and offset against capital gains realized in any of the four following tax years. Capital losses may be carried forward and offset against capital gains of the same nature realized after June 30, 2014, but up to the following amount in case of capital losses realized up to June 30, 2014: (i) 48.08 percent of the relevant capital losses realized before January 1, 2012, and (ii) 76.92 percent of the capital losses realized from January 1, 2012 to June 30, 2014. This regime is the default regime if the taxpayer does not elect into any of the two alternative regimes described in (b) and (c) below.
|
|
b.
|
Nondiscretionary investment portfolio regime (“
risparmio amministrato”
) (optional). Under this regime, CGT is applied separately on capital gains realized on each transfer of common shares in Ferrari. This regime is allowed subject to (x) the Ferrari common shares being managed or in custody with Italian banks, broker-dealers (“
società di intermediazione mobiliare”
) or certain authorized financial intermediaries; and (y) an express election for the nondiscretionary investment portfolio regime being made in writing in due time by the relevant holder. Under this regime, the financial intermediary is responsible for accounting for and paying (on behalf of the taxpayer) CGT in respect of capital gains realized on each transfer of the common shares in Ferrari (as well as in respect of capital gains realized at revocation of the intermediary’s mandate), net of any relevant capital losses of the same nature. Capital losses may be carried forward and offset against capital gains of the same nature realized within the same relationship of deposit in the same tax year or in the following tax years up to the fourth. Capital losses may be carried forward and offset against capital gains of the same nature realized after June 30, 2014, but up to the following amount in case of capital losses realized up to June 30, 2014: (i) 48.08 percent of the relevant capital losses realized before January 1, 2012, and (ii) 76.92 percent of the capital losses realized from January 1, 2012 to June 30, 2014. Under this regime, the holder is not required to report capital gains in the annual income tax return.
|
|
c.
|
Discretionary investment portfolio regime (“
risparmio gestito”
) (optional). This regime is allowed for holders who have entrusted the management of their financial assets, including the Ferrari common shares, to an authorized intermediary and have elected in writing into this regime. Under this regime, capital gains accrued on the Ferrari common shares are included in the computation of the annual increase in value of the managed assets accrued (even if not realized) at year end, which is subject to CGT. The managing authorized intermediary applies the tax on behalf of the taxpayer. Any decrease in value of the managed assets accrued at year end may be carried forward and offset against any increase in value of the managed assets accrued in any of the four following tax years. Decreases in value of the managed assets may be carried forward and offset against any subsequent increase in value accrued at July 1, 2014, but up to the following amount in case of decreases in value occurred up to June 30, 2014: (i) 48.08 percent of the relevant decreases in value occurred before January 1, 2012; and (ii) 76.92 percent of the decreases in value occurred from January 1, 2012 to June 30, 2014. Under this regime, the holder is not required to report capital gains in the annual income tax return.
|
Following the amendments introduced by the 2018 Budget Law, the capital gains realized from January 1, 2019 by Italian resident individuals upon transfer for consideration of the common share in Ferrari (as well as of securities or rights whereby common shares in Ferrari may be acquired), other than capital gains realized in connection with a business activity, are subject to the 26 percent CGT under one of the three tax regimes described above (
“regime della dichiarazione”, “risparmio amministrato”, “risparmio gestito”
) regardless of the fact that they derived from Qualified Holdings or Non-qualified Holdings.
|
(ii)
|
Sole Proprietors and business partnerships (Italian “società in nome collettivo,” “società in accomandita semplice” and similar Italian partnerships as referred to in Article 5 CITA)
|
Capital gains realized from January 1, 2018 by Italian Sole Proprietors and Italian business partnerships (Italian “
società in nome collettivo
,” “
società in accomandita semplice
” and similar Italian partnerships as referred to in Article 5 CITA) upon transfer for consideration of the common shares in Ferrari must be fully included in the overall business income and
143
reported in the annual income tax return. Capital losses (or other negative items of income) derived by this class of holders upon transfer for consideration of the common shares in Ferrari would be fully deductible from the holder’s income.
However, if the conditions for the participation exemption regime under subparagraph (A)(iii) below are met, only 58.14 percent of the capital gains recognized by sole proprietors and 49.72 percent of the capital gains must be included in the overall business income. Capital losses realized on common shares in Ferrari that meet the conditions under a and b of subparagraph (A)(iii) below are only partially deductible (similarly to what is provided for the taxation of capital gains).
For the purpose of determining capital gains and capital losses, the holder’s tax basis in the Ferrari common shares is reduced by any write-down that the holder has deducted in previous tax years.
|
(iii)
|
Companies and other business entities referred to in Article 73(1)(a)-(b) CITA
|
Capital gains realized by Italian resident companies and other business entities as referred to in Article 73(1)(a)-(b) CITA (including partnerships limited by shares and public and private entities whose sole or primary purpose is carrying out business activity) upon transfer for consideration of the common shares in Ferrari must be fully included in the overall taxable business income subject to IRES in the tax year in which the capital gains are realized or, upon election, may be spread in equal installments over a maximum of five tax years (including the tax year when the capital gain is realized). The election for the installment computation is only available if the common shares in Ferrari have been held for no less than three years and booked as fixed financial assets (“
immobilizzazioni finanziarie”
) in the last three financial statements.
However, under Article 87 CITA (participation exemption), capital gains realized upon transfer of common shares in Ferrari are 95 percent exempt if both the following requirements are met:
|
a.
|
The common shares in Ferrari have been uninterruptedly held as of the first day of the twelfth month prior to the transfer, treating the Ferrari common shares acquired on the most recent date as being transferred first (on a “last in first out” basis); and
|
|
b.
|
The common shares in Ferrari have been booked as fixed financial assets in the first financial statements closed during the holding period. In case of holders that draft their financial statements according to IAS / IFRS international accounting standards, the common shares in Ferrari are deemed as fixed financial assets if they are not deemed to be held as held for trading (pursuant to art. 2 of The Ministerial Decree 10 January 2018).
|
The law lays down certain additional conditions for the exemption to be available. Based on the assumption that Ferrari is a holding company, that its shares are listed on a regulated market, and that pursuant to Article 87(5) CITA its assets are predominantly composed of shareholdings in companies which satisfy the additional conditions set forth by Article 87 CITA in order to enjoy the participation exemption regime (i.e., the companies are not resident in a State with a preferential tax system and carry on a business activity), these additional conditions should be met.
The transfer of shares booked as fixed financial assets and shares booked as inventory must be considered separately with reference to each class. If the requirements for the participation exemption are met, any capital loss realized on the common shares in Ferrari cannot be deducted.
For the purpose of determining capital gains and capital losses, the holder’s tax basis in the Ferrari common shares is reduced by any write-down that the holder has deducted in previous tax years.
Capital losses (as well as negative differences between revenues and costs) relating to shares that do not meet the participation exemption requirements are not relevant (and cannot be deducted) to the extent of the non-taxable amount of dividends (or advance dividend) received by the holder in the 36 (thirty-six) months prior to the transfer (dividend washing rule). This anti-avoidance rule applies to shares acquired in the 36-month period preceding the realization of the capital loss (or the negative difference), provided that requirements under Article 87(1)(c)-(d) CITA (i.e., the company is not resident in a State with a preferential tax system and carries on a business activity) are met. The anti-avoidance rule does not apply to holders that draft their financial statements according to IAS / IFRS international accounting standards under Regulation (EC) No. 1606/2002 of the European Parliament and the Council of July 19, 2002. When the amount of the aforesaid capital losses (and negative differences) deriving from a transaction (or a series of transactions) on shares traded on regulated markets is greater than € 50,000.00, the taxpayer must report the data and the information regarding the transaction to the Italian tax authorities.
144
Moreover, in case of capital losses greater than €5,000,000.00 deriving from the transfer (or a series of transfers) of shares booked as fixed financial assets, the holder must report the data and the information to the Italian tax authorities. Holders that draft their financial statements according to IAS / IFRS international accounting standards are under no such obligation.
For some types of companies and under certain conditions, capital gains on common shares in Ferrari are also included in the net value of production that is subject to IRAP.
|
(iv)
|
Non-business entities referred to in Article 73(1)(c) CITA and non-business partnerships (“società semplici”) referred to in Article 5 CITA
|
Capital gains realized, outside the scope of a business activity, by Italian resident non-business entities referred to in Article 73(1)(c) CITA (other than OICR) and Italian non-business partnerships as referred to in Article 5 CITA are subject to tax under the same rules as provided for capital gains realized by Italian resident individuals who do not hold the Ferrari common shares in connection with a business activity.
However only 49.72 percent (rather than 58.14 percent) of the capital gains realized from January 1, 2018 to December 31, 2018 upon Transfers of Qualified Holdings must be included in the non-business partnership’s overall taxable income and reported in the annual income tax return. Similarly, only 49.72 percent (rather than 58.14 percent) of capital losses realized from January 1, 2018 to December 31, 2018 upon Transfers of Qualified Holdings may be offset against the taxable amount of any capital gain of the same nature that is realized in the following years up to the fourth, provided that such capital loss is reported in the income tax return of the year when the capital loss is realized.
|
(v)
|
Pension funds and OICR (other than Real Estate AIF)
|
Capital gains on common shares in Ferrari held by Italian pension funds governed by Decree 252 must be taken into account to compute the pension fund’s net annual accrued yield, which is subject to a 20 percent flat tax (“
imposta sostitutiva”
).
Capital gains on common shares in Ferrari held by OICRs that are set up in, and organized under the laws of, Italy and that are subject to regulatory supervision (other than Real Estate AIF) are not subject to tax at the level of the OICR.
|
(vi)
|
Real Estate AIF
|
Capital gains on common shares in Ferrari held by Italian Real Estate AIF are not subject to IRES or IRAP at the level of the Real Estate AIF.
|
(B)
|
N
ON
-I
TALIAN
R
ESIDENT
P
ERSONS
|
|
(i)
|
Non-resident persons holding the common shares in Ferrari through a permanent establishment in Italy
|
If non-Italian resident persons hold the common shares in Ferrari through a permanent establishment in Italy to which the common shares in Ferrari are effectively connected, capital gains realized upon disposal of the common shares in Ferrari must be included in the permanent establishment’s income taxable in Italy according to the tax regime as provided for the capital gains realized by Italian resident companies and other business entities as referred to in Article 73(1)(a)-(b) CITA, which is summarized under subparagraph (A)(iii) above. If the common shares in Ferrari are not connected to a permanent establishment in Italy of the non-resident person, reference must be made to subparagraph (B)(ii) below.
(ii)
Non-resident persons that do not hold the common shares in Ferrari through a permanent establishment in Italy
a. Non-Qualified Holdings. Based on the fact that Ferrari common shares are listed on a regulated market, no tax applies in Italy on capital gains realized by non-Italian resident holders without a permanent establishment in Italy upon transfer for consideration of common shares in Ferrari that do not qualify as Transfers of Qualified Holdings, even if the Ferrari common shares are held in Italy and regardless of the provisions set forth in any applicable double tax treaty. In such case, in order to benefit from this exemption, non-Italian resident holders who hold the Ferrari common shares with an Italian authorized financial intermediary and either are subject to the nondiscretionary investment portfolio regime or have elected for the discretionary investment portfolio regime may be required to timely submit to the Italian authorized financial intermediary an affidavit whereby they state that they are not resident in Italy for tax purposes.
145
|
b.
|
Qualified Holdings. Capital gains realized from January 1, 2018 to December 31, 2018 by non-Italian resident holders without a permanent establishment in Italy upon Transfers of Qualified Holdings are included in the holder’s income taxable in Italy according to the same rules as applicable to capital gains realized from January 1, 2018 to December 31, 2018 by Italian resident individuals not engaged in business activity. These capital gains must be reported in the annual income tax return and cannot be subject to the nondiscretionary investment portfolio regime or the discretionary investment portfolio regime. Capital gains realized as from January 1, 2019 by non-Italian resident holders without a permanent establishment in Italy upon Transfers of Qualified Holdings are included in the holder’s income taxable in Italy according to the same rules as applicable to capital gains as realized from January 1, 2019 by Italian resident individuals not engaged in business activity. In case the non-Italian resident holders hold the Ferrari common shares under management or in custody with Italian banks, broker-dealers (
“società di intermediazione mobiliare
”) or certain authorized financial intermediaries, the nondiscretionary investment portfolio regime is applied by the relevant Italian financial intermediary without any option to be exercised by such holders; however, the non-Italian resident holders can renounce to the nondiscretionary investment portfolio regime. The provisions of double tax treaties entered into by Italy may apply if more favourable.
|
Special voting shares
No statutory, judicial or administrative authority directly discusses how the receipt, ownership or disposal of special voting shares should be treated for Italian income tax purposes and as a result, the Italian tax consequences are uncertain. Accordingly, we urge Ferrari shareholders to consult their tax advisors as to the tax consequences of the receipt, ownership and disposal of special voting shares.
Receipt of special voting shares
A shareholder that receives special voting shares issued by Ferrari should in principle not recognize any taxable income upon the receipt of special voting shares. Under a possible interpretation, the issue of special voting shares can be treated as the issue of bonus shares free of charge to the shareholders out of existing available reserves of Ferrari. Such issue should not have any material effect on the allocation of the tax basis of a shareholder between its Ferrari common shares and its Ferrari special voting shares. Because the special voting shares are not transferable and their limited economic rights can be enjoyed only at the time of the liquidation of Ferrari, we believe and intend to take the position that the fair market value of each special voting share is minimal. However, because the determination of the fair market value of the special voting shares is not governed by any guidance that directly addresses such a situation and is unclear, the Italian tax authorities could assert that the value of the special voting shares as determined by us is incorrect.
Ownership of special voting shares
Shareholders of special voting shares should not have to recognize income in respect of any amount transferred to the special voting shares dividend reserve, but not paid out as dividends, in respect of the special voting shares.
Disposition of special voting shares
The tax treatment of a Ferrari shareholder that has its special voting shares redeemed for no consideration after removing its shares from the Loyalty Register is unclear. It is possible that a shareholder should recognize a loss to the extent of the shareholder’s tax basis (if any). The deductibility of such loss depends on individual circumstances and conditions generally required by Italian law. It is also possible that a Ferrari shareholder would not be allowed to recognize a loss upon the redemption of its special voting shares and instead should increase its basis in its Ferrari common shares by an amount equal to the tax basis (if any) in its special voting shares.
Transfer tax
Contracts or other legal instruments relating to the transfer of securities (including the transfer of the Ferrari common shares) are subject to registration tax as follows: (i) notary deeds (“
atti pubblici”
) and private deeds with notarized signatures (“
scritture private authenticate”
) executed in Italy must mandatorily be registered with the Italian tax authorities and are subject to €200.00 registration tax; and (ii) private deeds (“
scritture private”
) are subject to €200.00 registration tax only if they are voluntary filed for registration with the Italian tax authorities or if the so-called “
caso d’uso
” or “
enunciazione
” occurs.
146
Financial Transaction Tax
|
(i)
|
Transfer of ownership of the Ferrari shares
|
Article 1(491-500) of Law No. 228 of December 24, 2012 introduced a financial transaction tax (‘‘
FTT’’
) applicable, among others, to the transfers of the ownership of (i) shares issued by Italian resident corporations, (ii) participating financial instruments (as defined under Article 2346(6) of the Italian Civil Code) issued by Italian resident corporations, and (iii) securities representing equity investments in Italian resident corporations such as American Depositary Receipts and Global Depositary Receipts, regardless of the place of residence of the issuer of such securities and of the place where the contract has been concluded.
The residence of the issuer for the purposes of FTT is the place where the issuer has its registered office (intended as its corporate seat).
Since the corporate seat of Ferrari is not in Italy, transfers of ownership of the shares in Ferrari will not be subject to FTT.
|
(ii)
|
High-frequency trading
|
Transactions carried out on the Italian financial markets are subject to a tax on high-frequency trading with regard to financial instruments referred to in subparagraph (
i
) above “
Transfer of ownership of the Ferrari shares
.”
Transfer of the Ferrari Shares upon Death or by Gift
Subject to certain exceptions, Italian inheritance and gift tax is generally payable on transfers of assets and rights (including the common shares and the special voting shares in Ferrari) (i) by reason of death or gift by Italian resident persons (or other transfers for no consideration and the creation of liens on such assets for a specific purpose, including the segregation of assets into a trust), even if the transferred assets are held outside Italy, and (ii) by reason of death or gift by non-Italian resident persons, but limited to transferred assets held in Italy. Shares in corporations that are resident in Italy for tax purposes (because they have their registered office or their place of effective management or their main business purpose in Italy for the greater part of the tax year) are deemed to be held in Italy.
Subject to certain exceptions, transfers of assets and rights (including the common shares and the special voting shares in Ferrari) on death or by gift are generally subject to inheritance and gift tax as follows:
|
a.
|
At a rate of 4 percent in case of transfers made to the spouse or relatives in direct line, on the portion of the global net value of the transferred assets, if any, exceeding, for each beneficiary, €1,000,000.00.
|
|
b.
|
At a rate of 6 percent in case of transfers made to relatives up to the fourth degree or relatives-in-law up to the third degree on the entire value of the transferred assets (in the case of transfers to brothers or sisters, the six percent rate is applicable only on the portion of the global net value of the transferred assets, if any, exceeding, for each beneficiary, €100,000.00).
|
|
c.
|
At a rate of 8 percent in any other case.
|
If the transfer is made in favor of persons with severe disabilities, the tax applies on the value exceeding €1,500,000.00 at the rates illustrated above, depending on the type of relationship existing between the deceased or donor and the beneficiary.
As from January 1, 2017, (i) the segregation of rights and assets (including the common shares and the special voting shares in Ferrari) in a trust or (ii) the fiduciary contract pursuant to Article 1(3) of Law No. 112 of June 22, 2016, or (iii) the earmarking of the assets under Article 2645-ter of the Italian civil code, will be exempt from the Italian inheritance and gift tax if the aforementioned deeds are exclusively made in favor of persons with severe disabilities and all the conditions set out in Article 6 of Law No. 112 of June 22, 2016 are properly met. The exemption also applies to the re-transfer of the assets to the persons who have segregated the same assets (i) in a trust, or (ii) in a fiduciary contract pursuant to Article 1(3) of Law No. 112 of June 22, 2016, or (iii) in the earmarking of the assets under Article 2645-ter of the Italian civil code, if the death of the beneficiaries occurs before the death of the settlors.
147
Stamp Duty
Under Article 13(2
bis
-2
ter
) of Decree No. 642 of October 26, 1972, a 0.20 percent stamp duty generally applies on communications and reports that Italian financial intermediaries periodically send to their clients in relation to the financial products that are deposited with such intermediaries. Shares are included in the definition of financial products for these purposes. Communications and reports are deemed to be sent at least once a year even if the Italian financial intermediary is under no obligation to either draft or send such communications and reports.
The stamp duty cannot exceed €14,000.00 for investors other than individuals.
Based on the wording of the law and the implementing decree issued by the Italian Ministry of Finance on May 24, 2012, the 0.20 percent stamp duty does not apply to communications and reports that the Italian financial intermediaries send to investors who do not qualify as “clients” according to the regulations issued by the Bank of Italy on September 30, 2016, as amended by the regulations issued by the Bank of Italy on August 3, 2017. Communications and reports sent to this type of investors are subject to the ordinary €2.00 stamp duty for each copy.
The taxable base of the stamp duty is the market value or-in the lack thereof-the nominal value or the redemption amount of any financial product.
Wealth Tax on Financial Products Held Abroad
Under Article 19 of Decree No. 201 of December 6, 2011, Italian resident individuals holding certain financial products outside of Italian territory (including shares) are required to pay a wealth tax at the rate of 0.20 percent. The wealth tax applies on the market value at the end of the relevant year or-in the lack thereof-on the nominal value or the redemption value of such financial products held outside of Italian territory. Taxpayers may deduct from the Italian wealth tax a tax credit equal to any wealth tax paid in the country where the financial products are held (up to the amount of the Italian wealth tax due).
Certain Reporting Obligations for Italian Resident Holders
Under Law Decree No. 167 of June 28, 1990, individuals, non-business entities and non-business partnerships that are resident in Italy for tax purposes and, during the fiscal year, hold financial assets abroad (including possibly the common shares and the special voting shares in Ferrari) must, in certain circumstances, disclose these financial assets to the Italian tax authorities in section RW of their income tax return (or if the income tax return is not due, in a proper form that must be filed within the same term as prescribed for the annual income tax return), regardless of the value of such assets (save for deposits or bank accounts having an aggregate value not exceeding €15,000.00 throughout the year). The requirement applies also if the persons above, being not the direct holder of the financial assets, are the beneficial owners thereof for the purposes of anti-money laundering legislation.
No disclosure requirements exist for financial assets (including the common shares and the special voting shares in Ferrari) under management or administration entrusted to Italian resident intermediaries (Italian banks, broker-dealers (SIM), fiduciary companies or other professional intermediaries as indicated under Article 1 of Decree No. 167 of June 28, 1990) and for contracts concluded through their intervention, provided that the cash flows and the income derived from such assets and contracts have been subjected to Italian withholding tax or substitute tax by such intermediaries.
F. Dividends and Paying Agents
Not applicable.
G. Statements by Experts
Not applicable.
H. Documents on Display
You may read and copy any document we file with or furnish to the SEC at the SEC’s public reference room at 100 F Street, N.E., Room 1580, Washington, D.C. 20549. You may also obtain documents we file with or furnish to the SEC on the SEC’s website at
www.sec.gov
. The address of the SEC’s website is provided solely for information purposes and is not intended to be an active link. Please visit the website or call the SEC at 1-800-732-0330 for further information about its public reference
148
room. Reports and other information concerning the business of Ferrari may also be inspected at the offices of the New York Stock Exchange, 11 Wall Street, New York, New York 10005.
We also make our periodic reports as well as other information filed with or furnished to the SEC available, free of charge, through our website, at
http://corporate.ferrari.com
,
as soon as reasonably practicable after those reports and other information are electronically filed with or furnished to the SEC. The information on our website is not incorporated by reference in this document.
I. Subsidiary Information
Not applicable.
Due to the nature of our business, we are exposed to a variety of market risks, including foreign currency exchange rate risk and to a lesser extent, interest rate risk.
Our exposure to foreign currency exchange rate risk arises from the geographic distribution of our shipments, as we generally sell our models in the currencies of the various markets in which we operate, while our industrial activities are all based in Italy, and primarily denominated in Euro.
Our exposure to interest rate risk arises from the need to fund certain activities and the necessity to deploy surplus funds. Changes in market interest rates may have the effect of either increasing or decreasing our net profit/(loss), thereby indirectly affecting the costs and returns of financing and investing transactions.
These risks could significantly affect our financial position, results of operations and cash flows, and for this reason these risks are identified and monitored, in order to detect potential negative effects in advance and take the necessary actions to mitigate them, primarily through our operating and financing activities and if required, through the use of derivative financial instruments.
We have in place various risk management policies, which primarily relate to foreign exchange, interest rate and liquidity risks. Our risk management policies permit derivatives to be used for managing exposures to foreign exchange rates and interest rates. Counterparties to these agreements are major financial institutions. Derivatives cannot be entered into for speculative purposes.
In particular, we have used derivative financial instruments as cash flow hedges for the purpose of fixing the foreign currency exchange rate at which a predetermined proportion of forecasted transactions denominated in foreign currencies will be accounted for.
Accordingly, as a result of applying risk management policies with respect to foreign currency exchange exposure, our results of operations have not been fully exposed to fluctuations in foreign currency exchange rates. However, despite these risk management policies and hedging transactions, sudden adverse movements in foreign currency exchange rates could have a significant effect on the Group’s earnings and cash flows.
We also enter into interest rate caps as requested by certain of our securitization agreements.
The following section provides qualitative and quantitative disclosures on the effect that these risks may have. The quantitative data reported in the following section does not have any predictive value, in particular the sensitivity analysis on finance market risks does not reflect the complexity of the market or the reaction which may result from any changes that are assumed to take place.
149
Quantitative information on foreign currency exchange rate risk
We are exposed to risk resulting from changes in foreign currency exchange rates, which can affect our earnings and equity. In particular:
|
•
|
Where a Group company incurs costs in a currency different from that of its revenues, any change in foreign currency exchange rates can affect the operating results of that company. In 2017, the total trade flows exposed to foreign currency exchange rate risk amounted to the equivalent of 51 percent of the Group’s turnover (57 percent in 2016).
|
|
•
|
The main foreign currency exchange rate to which the Group is exposed is the Euro/U.S. Dollar for sales in U.S. Dollar in the United States and other markets where the U.S. Dollar is the reference currency. In 2017, the value of commercial activity exposed to fluctuations in the Euro/U.S. Dollar exchange rate accounted for approximately 62 percent (60 percent in 2016) of the total currency risk from commercial activity. In 2017, the commercial activity exposed to the Euro/Pound Sterling exchange rate exceeded 10 percent while in 2016 such exposure was below 10 percent. Other significant exposures included the exchange rate between the Euro and the following currencies: Japanese Yen, Chinese Renminbi, Swiss Franc, Canadian Dollar and Australian Dollar. None of these exposures, taken individually, exceeded 10 percent of the Group’s total foreign currency exchange rate exposure for commercial activity in 2017. It is the Group’s policy to use derivative financial instruments to hedge between 50 and 90 percent of certain exposures subject to foreign currency exchange risk for up to twelve months.
|
|
•
|
Several subsidiaries are located in countries that are outside the Eurozone, in particular the United States, the United Kingdom, Switzerland, China, Hong Kong, Japan, Australia and Singapore. As the Group’s reporting currency is the Euro, the income statements of those companies are converted into Euro using the average exchange rate for the period and, even if revenues and margins are unchanged in local currency, changes in exchange rates can impact the amount of revenues, costs and profit as restated in Euro.
|
|
•
|
The amount of assets and liabilities of consolidated companies that report in a currency other than the Euro may vary from period to period as a result of changes in exchange rates. The effects of these changes are recognized directly in equity as a component of other comprehensive income/(loss) under gains/(losses) from currency translation differences.
|
The Group monitors its principal exposure to conversion exchange risk, although there was no specific hedging in this respect at the reporting date.
Exchange differences arising on the settlement of monetary items or on reporting monetary items at rates different from those at which they were initially recorded during the period or in previous financial statements, are recognized in the consolidated income statement within the net financial income/(expenses) line item or as cost of sales for charges arising from financial services companies.
The impact of foreign currency exchange rate differences recorded within financial income/(expenses) for the year ended
December 31, 2017
, except for those arising on financial instruments measured at fair value, amounted to net losses of
€18,059 thousand
(net gains of
€8,335 thousand
and
€10,794 thousand
for the years ended
December 31, 2016
and
2015
, respectively).
The impact of foreign currency exchange rate differences arising from financial services companies recognized under cost of sales, except for those arising on financial instruments measured at fair value, amounted to net losses of
€58,808 thousand
in 2016 (net gains of
€20,908 thousand
in 2015). Following the deconsolidation of FFS GmbH in November 2016, all of the Group’s financial services activities are conducted in the functional currency of the related financial services companies, therefore, such impact in 2017 was nil.
Except as noted above, there have been no substantial changes in
2017
in the nature or structure of exposure to foreign currency exchange rate risk or in the Group’s hedging policies.
The potential decrease in fair value of derivative financial instruments held by the Group at
December 31, 2017
to hedge against foreign currency exchange rate risk, which would arise in the case of a hypothetical, immediate and adverse change of
10 percent
in the exchange rates of the major foreign currencies with the Euro, would be approximately
€45,439 thousand
(
€128,753 thousand
at
December 31, 2016
). Receivables, payables and future trade flows for which hedges have been put in
150
place were not included in the analysis. It is reasonable to assume that changes in foreign currency exchange rates will produce the opposite effect, of an equal or greater amount, on the underlying transactions that have been hedged.
Quantitative information on interest rate risk
Our exposure to interest rate risk, though less significant, arises from the need to fund financial services activities and the necessity to deploy surplus funds. Changes in market interest rates may have the effect of either increasing or decreasing our net profit/(loss), thereby indirectly affecting the costs and returns of financing and investing transactions.
Our most significant floating rate financial assets at December 31, 2017 were cash and cash equivalents and certain receivables from financing activities (related to client and dealer financing) while 32 percent of our total debt bears floating rates of interest. At December 31, 2017, a 10 basis point decrease in interest rates on floating rate financial assets and debt, with all other variables held constant, would have resulted in a decrease in profit before taxes of €225 thousand on an annual basis (an increase of €367 thousand at December 31, 2016). The analysis is based on the assumption that floating rate financial assets and debt which expires during the projected 12-month period will be renewed or reinvested in similar instruments, bearing the hypothetical short-term interest rates.
A. Debt Securities
Not applicable.
B. Warrants and Rights
Not applicable.
C. Other Securities
Not applicable.
D. American Depositary Shares
Not applicable.
151
None.
None.
Disclosure Controls and Procedures
Under the supervision, and with the participation, of our management, including our Chief Executive Officer and Chief Financial Officer, we conducted an evaluation of the effectiveness of our disclosure controls and procedures as of December 31, 2017 pursuant to Exchange Act Rule 13a-15(b). Based on that evaluation, our Chief Executive Officer and Chief Financial Officer concluded that our disclosure controls and procedures are effective to provide reasonable assurance that information required to be disclosed in our Exchange Act filings is recorded, processed, summarized and reported within the time periods specified in the SEC’s rules and forms and that such information is accumulated and communicated to our management, including our Chief Executive Officer and Chief Financial Officer, as appropriate, to allow timely decisions regarding required disclosure.
Management’s Report on Internal Control over Financial Reporting
The Company’s management is responsible for establishing and maintaining adequate internal control over financial reporting. The Company’s internal control system was designed to provide reasonable assurance regarding the preparation and fair presentation of published financial statements in accordance with IFRS.
All internal control systems, no matter how well designed, have inherent limitations. Therefore, even those systems determined to be effective can provide only reasonable assurance with respect to financial statement preparation and presentation in accordance with IFRS.
Management assessed the effectiveness of the Company’s internal control over financial reporting as of December 31, 2017, using the criteria set forth in the “Internal Control - Integrated Framework (2013)” issued by the Committee of Sponsoring Organizations of the Treadway Commission (COSO). Based on that assessment, management believes that, as of December 31, 2017, the Company’s internal control over financial reporting was effective.
The Company’s independent registered public accounting firm has issued an audit report on the effectiveness of the Company’s internal control over financial reporting. That report is included herein.
Changes in Internal Control
No change to our internal control over financial reporting occurred during the year ended December 31, 2017 that has materially affected, or is reasonably likely to materially affect, our internal control over financial reporting.
152
REPORT OF INDEPENDENT REGISTERED PUBLIC ACCOUNTING FIRM
The Board of Directors and Shareholders of
Ferrari N.V.
Opinion on Internal Control over Financial Reporting
We have audited Ferrari N.V.’s internal control over financial reporting as of December 31, 2017, based on criteria established in Internal Control-Integrated Framework issued by the Committee of Sponsoring Organizations of the Treadway Commission (2013 framework) (the COSO criteria). In our opinion, Ferrari N.V. (the Company) maintained, in all material respects, effective internal control over financial reporting as of December 31, 2017, based on the COSO criteria
.
We also have audited, in accordance with the standards of the Public Company Accounting Oversight Board (United States) (PCAOB), the consolidated statements of financial position of Ferrari N.V. as of December 31, 2017 and 2016, and the related consolidated income statements, statements of comprehensive income, cash flows and changes in equity for each of the three years in the period ended December 31, 2017, and the related notes, and our report dated February 23, 2018 expressed an unqualified opinion thereon.
Basis for Opinion
The Company’s management is responsible for maintaining effective internal control over financial reporting and for its assessment of the effectiveness of internal control over financial reporting included in the accompanying Management’s Report on Internal Control over Financial Reporting. Our responsibility is to express an opinion on the Company’s internal control over financial reporting based on our audit. We are a public accounting firm registered with the PCAOB and are required to be independent with respect to the Company in accordance with the U.S. federal securities laws and the applicable rules and regulations of the Securities and Exchange Commission and the PCAOB.
We conducted our audit in accordance with the standards of the PCAOB. Those standards require that we plan and perform the audit to obtain reasonable assurance about whether effective internal control over financial reporting was maintained in all material respects.
Our audit included obtaining an understanding of internal control over financial reporting, assessing the risk that a material weakness exists, testing and evaluating the design and operating effectiveness of internal control based on the assessed risk, and performing such other procedures as we considered necessary in the circumstances. We believe that our audit provides a reasonable basis for our opinion.
Definition and Limitations of Internal Control Over Financial Reporting
A company’s internal control over financial reporting is a process designed to provide reasonable assurance regarding the reliability of financial reporting and the preparation of financial statements for external purposes in accordance with generally accepted accounting principles. A company’s internal control over financial reporting includes those policies and procedures that (1) pertain to the maintenance of records that, in reasonable detail, accurately and fairly reflect the transactions and dispositions of the assets of the company; (2) provide reasonable assurance that transactions are recorded as necessary to permit preparation of financial statements in accordance with generally accepted accounting principles, and that receipts and expenditures of the company are being made only in accordance with authorizations of management and directors of the company; and (3) provide reasonable assurance regarding prevention or timely detection of unauthorized acquisition, use, or disposition of the company’s assets that could have a material effect on the financial statements.
Because of its inherent limitations, internal control over financial reporting may not prevent or detect misstatements. Also, projections of any evaluation of effectiveness to future periods are subject to the risk that controls may become inadequate because of changes in conditions, or that the degree of compliance with the policies or procedures may deteriorate.
/s/ Ernst & Young S.p.A.
Milan, Italy
February 23, 2018
153
Our board of directors has determined that Mr. Sergio Duca is the “audit committee financial expert.” Mr. Sergio Duca is an independent director under NYSE standards.
We have adopted a Code of Conduct which applies to all of our employees, including our principal executive, principal financial and principal accounting officers. Our Code of Conduct is intended to meet the definition of “code of ethics” under Item 16B of Form 20-F under the Exchange Act. Our Code of Conduct is posted on our website at http://corporate.ferrari.com/en/governance/code-conduct. If the provisions of our Code of Conduct that apply to our principal executive officer, principal financial officer or principal accounting officer are amended, or if a waiver is granted, we will disclose such amendment or waiver.
Ernst & Young S.p.A., the member firms of Ernst & Young and their respective affiliates (collectively, the Ernst & Young Entities) were appointed to serve as our independent registered public accounting firm for the years ended
December 31, 2017
and
2016
. We incurred the following fees from the Ernst & Young Entities for professional services for the years ended
December 31, 2017
and
2016
, respectively:
|
Twelve Months Ended
|
|||
|
2017
|
2016
|
||
|
(€ thousands)
|
|||
|
Audit fees
|
1,610
|
1,554
|
|
|
Audit-related fees
|
2
|
25
|
|
|
Tax fees
|
4
|
32
|
|
|
Total
|
1,616
|
1,611
|
|
“Audit Fees” are the aggregate fees earned by the Ernst & Young Entities for the audit of our consolidated annual financial statements, reviews of interim financial statements and attestation services that are provided in connection with statutory and regulatory filings or engagements. “Audit-Related Fees” are fees charged by the Ernst & Young Entities for assurance and related services that are reasonably related to the performance of the audit or review of our financial statements and are not reported under “Audit Fees.” This category comprises fees for the audit of employee benefit plans and pension plans, agreed-upon procedure engagements and other attestation services subject to regulatory requirements. In 2015, approximately €2 million audit fees related to the listing process were paid.
Audit Committee’s pre-approval policies and procedures
Our Audit Committee nominates and engages our independent registered public accounting firm to audit our consolidated financial statements. Our Audit Committee has a policy requiring management to obtain the Audit Committee’s approval before engaging our independent registered public accounting firm to provide any other audit or permitted non-audit services to us or our subsidiaries. Pursuant to this policy, which is designed to ensure that such engagements do not impair the independence of our independent registered public accounting firm, the Audit Committee reviews and pre-approves (if appropriate) specific audit and non- audit services in the categories Audit Services, Audit-Related Services, Tax Services, and any other services that may be performed by our independent registered public accounting firm.
None.
On April 14, 2017 the Ferrari’s Annual General Meeting of Shareholders (“AGM”) delegated to the Board of Directors authority to purchase common shares of Ferrari up to a maximum of 10% of Ferrari’s issued common shares as of the date of
154
the AGM. Pursuant to the authorization, Ferrari may purchase shares of its own common stock from time to time in the 18 months following the AGM, at a price not more than 10% above or not more than 10% below the average of the closing price on the NYSE and/or MTA for the five business days prior to the date of the purchase.
No such purchases were made in 2017.
Not applicable.
Ferrari N.V. is a company organized under the laws of The Netherlands and qualifies as a foreign private issuer under the NYSE listing standards. In accordance with the NYSE corporate governance rules, as a foreign private issuer we are permitted to follow home-country practice in some circumstances in lieu of the provisions of the corporate governance rules contained in Section 303A of the NYSE Listed Company Manual that are applicable to U.S. companies. In addition, we must disclose any significant ways in which our corporate governance practices differ from those followed by U.S. companies listed on the NYSE.
Both the Dutch and NYSE corporate governance regimes were adopted with the goal of fostering trust and confidence in the honesty, integrity and transparency of how business is conducted at and by public companies. Because these corporate governance regimes are based on the same principles, they are similar in many respects. However, certain differences exist between Dutch and NYSE corporate governance rules, as summarized below. We believe that our corporate governance practices and guidelines are consistent, in principle, with those required of U.S. companies listed on the NYSE. In addition, we endorse the principles and Best Practice Provisions of the Dutch Corporate Governance Code, or the “Dutch Code”. In contrast to NYSE rules applicable to U.S. companies, the Dutch Code is based on the “comply or explain” principle. As a result, deviations from the best practice provisions of the Dutch Code are allowed, as long as they are explained in our annual report.
The Dutch Corporate Governance Code has been revised in December 2016 and the revised Dutch Corporate Governance Code entered into force on January 1, 2018, being applicable retroactively as from the financial year 2017. Consequently, Ferrari must report in 2018 regarding its application of the revised Dutch Corporate Governance Code over financial year 2017.
The discussion below summarizes the significant differences between our corporate governance practices and the NYSE standards applicable to U.S. companies, as well as certain ways in which our governance practices deviate from those suggested in the Dutch Code.
Dutch legal requirements concerning director independence differ in certain respects from the rules applicable to U.S. companies listed on the NYSE. While under most circumstances both regimes require that a majority of board members be “independent,” the definition of this term under the Dutch Code differs from the definition used under the NYSE corporate governance standards. In some cases the Dutch requirement is more stringent, such as by requiring a longer “look- back” period (five years) for former executive directors and employees and by requiring that in certain circumstances only one non-executive board member may be not “independent” within the meaning of the Dutch Code. The Dutch Code recommends, specifically for one-tier governance structures, that a majority of the members of the board be non-executive and independent. Currently, a majority of our Board is “independent” under the NYSE definition (9 of the 13 members) and the Dutch Code (8 of the 13 members). We deviate from the Dutch Code’s best practice provision regarding the maximum number of one non-executive that may not be independent due to being affiliated with a shareholder holding more than 10% of the shares in Ferrari, or being a relative of such a person. Since our non-executive board member Mr. John Elkann also serves as chairman and chief executive officer of Exor N.V., Mr John Elkann is affiliated with a shareholder holding more than 10% of the shares in the Company. Given the family ties between Mr. Lapo Elkann and Mr. John Elkann, the Company has two non-executive board members affiliated with a shareholder holding more than 10% of the shares in Ferrari. We believe however that this deviation from the Dutch Code is appropriate in light of the valuable contributions to the Board in light of Mr. John Elkann’s and Mr. Lapo Elkann’s knowledge of the automotive and luxury industries, as well as the Company’s business position. Finally, pursuant to Dutch law, persons may not be appointed as non-executive directors of Ferrari if such persons are non-executive director, member of the supervisory board or other similar bodies for five or more (Dutch) companies of a certain size and such persons cannot be appointed as executive directors of Ferrari if such persons are non-executive director at more than two other (Dutch) companies of a certain size or if such person is the chairperson of the board of supervisors or the one tier board of another (Dutch) company of a certain size.
155
The NYSE requires that, when an audit committee member of a U.S. domestic listed company serves on four or more audit committees of public companies, the listed company should disclose (either on its website or in its annual proxy statement or annual report on Form 10-K) that the board of directors has determined that this simultaneous service would not impair the director’s service to the listed company. Dutch law does not require the Company to make such a determination.
NYSE rules require a U.S. listed company to have a compensation committee and a nominating/corporate governance committee composed entirely of independent directors. As a foreign private issuer, we do not have to comply with this requirement, although we do have a Compensation Committee and a Governance and Sustainability Committee. Our Compensation Committee Charter states that a maximum of one member of the Compensation Committee may be non-independent according to the Dutch Code. Two of the three current members of the Compensation Committee are independent under the Dutch Code and the NYSE rules. Our Governance and Sustainability Committee Charter states that the Committee shall be comprised of at least three directors, elected by the Board, which shall also appoint one of them as chairperson of the Governance and Sustainability Committee, or Chairperson. Of the directors elected to serve on the Committee, no more than one may be an executive director and no more than two may be non-independent under the Dutch Code. These are both deviations from the Dutch Code which recommends that only non-executive directors serve on Board committees and more than half of the members of Board committees be independent. Although we are not currently making use of this possibility, we allow for an executive director to serve on the Governance and Sustainability Committee, because we believe that the Committee’s broad duties benefit from the presence of an executive board member. The position of Mr. John Elkann and Mr. Ferrari, both being non-independent, in this committee
inter alia
follows from the duties of the governance and sustainability committee, which are more extensive than the duties of a selection and appointment committee. These duties warrant participation of Mr. Ferrari, the son of Ferrari’s founder, and Mr. John Elkann, who each bring valuable contributions to the Board in light of their knowledge of the automotive and luxury industries, as well as the Company’s business. Current composition of our Governance and Sustainability Committee comprises two non-independent non-executive directors, one of whom as the Chairperson, and two other directors who are considered independent under Dutch Corporate Governance Code. A majority of the members of the Governance and Sustainability Committee is independent under the NYSE rules.
In contrast to NYSE rules applicable to U.S. companies, which require that external auditors be appointed by the Audit Committee, the general rule under Dutch law is that external auditors are appointed by the general meeting of shareholders. In accordance with the requirements of Dutch law, the appointment and removal of our independent registered public accounting firm must be resolved upon by the general meeting of shareholders. Our Audit Committee is responsible for recommending to the shareholders the appointment and compensation of the independent registered public accounting firm and,
inter alia
, oversees and evaluates the work of our independent registered public accounting firm.
Under NYSE listing standards, shareholders of U.S. companies must be given the opportunity to vote on all equity compensation plans and to approve material revisions to those plans, with limited exceptions set forth in the NYSE rules. As a foreign private issuer we are permitted to follow our home country laws regarding shareholder approval of compensation plans, and, under Dutch law, such approval from shareholders is not required for equity compensation plans for employees other than the members of the Board, provided that the authority to grant equity rights has been delegated by the general meeting of shareholders to the Board. For equity compensation plans for members of the Board and/or in the event that the authority to issue shares and/or rights to subscribe for shares has not been delegated to the Board, approval of the general meeting of shareholders is required.
While NYSE rules do not require listed companies to have shareholders approve or declare dividends, the Dutch Code requires that a dividend distribution be a separate agenda item in the general meeting of shareholders, in which the annual accounts are adopted. In our case, Article 23 of our Articles of Association provide that annual dividends must be resolved upon by our general meeting of shareholders. For a discussion of our dividend policy, see
“Item 8
. Financial Information—Dividend Policy
.”
In accordance with the corporate governance rules of the NYSE applicable to foreign private issuers, we also disclose these differences between our corporate governance practices and those required of domestic companies by the NYSE listing standards on our website at
www.ferrari.com.
Not applicable.
156
We have responded to Item 18 in lieu of responding to this item.
The audited Consolidated Financial Statements as required under Item 18 are attached hereto starting on page F-1 of this Form 20-F.
|
Exhibit Number
|
Description of Documents
|
|
1.1
|
|
|
1.2
|
|
|
2.1
|
|
|
2.2
|
|
|
4.1
|
|
|
8.1
|
|
|
12.1
|
|
|
12.2
|
|
|
13.1
|
|
|
13.2
|
|
|
23
|
|
|
101.INS
|
XBRL Instance Document
|
|
101.SCH
|
XBRL Taxonomy Extension Schema Document
|
|
101.CAL
|
XBRL Taxonomy Extension Calculation Linkbase Document
|
|
101.DEF
|
XBRL Taxonomy Extension Definition Linkbase Document
|
|
101.LAB
|
XBRL Taxonomy Extension Label Linkbase Document
|
|
101.PRE
|
XBRL Taxonomy Extension Presentation Linkbase Document
|
157
SIGNATURES
The registrant hereby certifies that it meets all of the requirements for filing on Form 20-F and that it has duly caused and authorized the undersigned to sign this annual report on its behalf.
|
Ferrari N.V.
|
||
|
By:
|
/s/ Alessandro Gili
|
|
|
Name: Alessandro Gili
|
||
|
Title: Chief Financial Officer
|
||
Dated: February 23, 2018
158
Ferrari N.V.
Index to Consolidated Financial Statements
|
Page
|
||
F-1
REPORT OF INDEPENDENT REGISTERED PUBLIC ACCOUNTING FIRM
The Board of Directors and Shareholders of
Ferrari N.V.
Opinion on the Financial Statements
We have audited the accompanying consolidated statements of financial position of Ferrari N.V. (the “Company”) as of December 31, 2017 and 2016, and the related consolidated income statements, statements of comprehensive income, cash flows and changes in equity for each of the three years in the period ended December 31, 2017, and the related notes (collectively referred to as the “financial statements”). In our opinion, the financial statements present fairly, in all material respects, the consolidated financial position of the Company at December 31, 2017 and 2016, and the consolidated results of its operations and its cash flows for each of the three years in the period ended December 31, 2017, in conformity with International Financial Reporting Standards as issued by the International Accounting Standards Board.
We also have audited, in accordance with the standards of the Public Company Accounting Oversight Board (United States) (PCAOB), the Company’s internal control over financial reporting as of December 31, 2017, based on criteria established in Internal Control-Integrated Framework issued by the Committee of Sponsoring Organizations of the Treadway Commission (2013 framework) and our report dated February 23, 2018 expressed an unqualified opinion thereon.
Basis for Opinion
These financial statements are the responsibility of the Company’s management. Our responsibility is to express an opinion on the Company’s financial statements based on our audits. We are a public accounting firm registered with the PCAOB and are required to be independent with respect to the Company in accordance with the U.S. federal securities laws and the applicable rules and regulations of the Securities and Exchange Commission and the PCAOB.
We conducted our audits in accordance with the standards of the PCAOB. Those standards require that we plan and perform the audit to obtain reasonable assurance about whether the financial statements are free of material misstatement, whether due to error or fraud. Our audits included performing procedures to assess the risks of material misstatement of the financial statements, whether due to error or fraud, and performing procedures that respond to those risks. Such procedures included examining, on a test basis, evidence regarding the amounts and disclosures in the financial statements. Our audits also included evaluating the accounting principles used and significant estimates made by management, as well as evaluating the overall presentation of the financial statements. We believe that our audits provide a reasonable basis for our opinion.
/s/ Ernst & Young S.p.A.
We have served as the Company’s auditor since 2015.
Milan, Italy
February 23, 2018
F-2
Ferrari N.V.
CONSOLIDATED INCOME STATEMENT
for the years ended December 31,
2017
,
2016
and
2015
|
For the years ended December 31,
|
||||||||||
|
Note
|
2017
|
2016
|
2015
|
|||||||
|
(€ thousand)
|
||||||||||
|
Net revenues
|
4
|
3,416,890
|
|
3,105,084
|
|
2,854,369
|
|
|||
|
Cost of sales
|
5
|
1,650,860
|
|
1,579,690
|
|
1,498,806
|
|
|||
|
Selling, general and administrative costs
|
6
|
329,065
|
|
295,242
|
|
338,626
|
|
|||
|
Research and development costs
|
7
|
657,119
|
|
613,635
|
|
561,582
|
|
|||
|
Other expenses, net
|
8
|
6,867
|
|
24,501
|
|
11,035
|
|
|||
|
Result from investments
|
9
|
2,437
|
|
3,066
|
|
—
|
|
|||
|
EBIT
|
775,416
|
|
595,082
|
|
444,320
|
|
||||
|
Net financial expenses
|
10
|
29,260
|
|
27,729
|
|
10,151
|
|
|||
|
Profit before taxes
|
746,156
|
|
567,353
|
|
434,169
|
|
||||
|
Income tax expense
|
11
|
208,760
|
|
167,635
|
|
144,115
|
|
|||
|
Net profit
|
537,396
|
|
399,718
|
|
290,054
|
|
||||
|
Net profit attributable to:
|
||||||||||
|
Owners of the parent
|
535,393
|
|
398,762
|
|
287,816
|
|
||||
|
Non-controlling interests
|
3
|
2,003
|
|
956
|
|
2,238
|
|
|||
|
Basic earnings per common share (in €)
|
13
|
2.83
|
|
2.11
|
|
1.52
|
|
|||
|
Diluted earnings per common share (in €)
|
13
|
|
2.82
|
|
|
2.11
|
|
|
1.52
|
|
The accompanying notes are an integral part of the Consolidated Financial Statements.
F-3
Ferrari N.V.
CONSOLIDATED STATEMENT OF COMPREHENSIVE INCOME
for the years ended December 31,
2017
,
2016
and
2015
|
For the years ended December 31,
|
||||||||||
|
Note
|
2017
|
2016
|
2015
|
|||||||
|
(€ thousand)
|
||||||||||
|
Net profit
|
537,396
|
|
399,718
|
|
290,054
|
|
||||
|
Items that will not be reclassified to the consolidated income statement in subsequent periods:
|
||||||||||
|
(Losses)/Gains on remeasurement of defined benefit plans
|
21
|
(730
|
)
|
(1,448
|
)
|
898
|
|
|||
|
Related tax impact
|
21
|
203
|
|
(18
|
)
|
(308
|
)
|
|||
|
Total items that will not be reclassified to the consolidated income statement in subsequent periods
|
(527
|
)
|
(1,466
|
)
|
590
|
|
||||
|
Items that may be reclassified to the consolidated income statement in subsequent periods:
|
||||||||||
|
Gains on cash flow hedging instruments
|
21
|
34,971
|
|
51,086
|
|
8,234
|
|
|||
|
Exchange differences on translating foreign operations
|
21
|
(15,346
|
)
|
4,118
|
|
13,344
|
|
|||
|
Related tax impact
|
21
|
(9,757
|
)
|
(16,943
|
)
|
(2,600
|
)
|
|||
|
Total items that may be reclassified to the consolidated income statement in subsequent periods
|
9,868
|
|
38,261
|
|
18,978
|
|
||||
|
Total other comprehensive income, net of tax
|
9,341
|
|
36,795
|
|
19,568
|
|
||||
|
Total comprehensive income
|
546,737
|
|
436,513
|
|
309,622
|
|
||||
|
Total comprehensive income attributable to:
|
||||||||||
|
Owners of the parent
|
545,071
|
|
435,691
|
|
306,699
|
|
||||
|
Non-controlling interests
|
1,666
|
|
822
|
|
2,923
|
|
||||
The accompanying notes are an integral part of the Consolidated Financial Statements.
F-4
Ferrari N.V.
CONSOLIDATED STATEMENT OF FINANCIAL POSITION
at December 31,
2017
, and
2016
|
At December 31,
|
|||||||
|
Note
|
2017
|
2016
|
|||||
|
(€ thousand)
|
|||||||
|
Assets
|
|||||||
|
Goodwill
|
14
|
785,182
|
|
785,182
|
|
||
|
Intangible assets
|
15
|
440,456
|
|
354,394
|
|
||
|
Property, plant and equipment
|
16
|
710,260
|
|
669,283
|
|
||
|
Investments and other financial assets
|
17
|
30,038
|
|
33,935
|
|
||
|
Deferred tax assets
|
11
|
94,091
|
|
119,357
|
|
||
|
Total non-current assets
|
2,060,027
|
|
1,962,151
|
|
|||
|
Inventories
|
18
|
393,765
|
|
323,998
|
|
||
|
Trade receivables
|
19
|
239,410
|
|
243,977
|
|
||
|
Receivables from financing activities
|
19
|
732,947
|
|
790,377
|
|
||
|
Current tax receivables
|
19
|
6,125
|
|
1,312
|
|
||
|
Other current assets
|
19
|
45,441
|
|
53,729
|
|
||
|
Current financial assets
|
20
|
15,683
|
|
16,276
|
|
||
|
Cash and cash equivalents
|
647,706
|
|
457,784
|
|
|||
|
Total current assets
|
2,081,077
|
|
1,887,453
|
|
|||
|
Total assets
|
4,141,104
|
|
3,849,604
|
|
|||
|
Equity and liabilities
|
|||||||
|
Equity attributable to owners of the parent
|
778,678
|
|
324,995
|
|
|||
|
Non-controlling interests
|
3
|
5,258
|
|
4,810
|
|
||
|
Total equity
|
21
|
783,936
|
|
329,805
|
|
||
|
|
|||||||
|
Employee benefits
|
23
|
84,159
|
|
91,024
|
|
||
|
Provisions
|
24
|
197,392
|
|
215,227
|
|
||
|
Deferred tax liabilities
|
11
|
10,977
|
|
13,111
|
|
||
|
Debt
|
25
|
1,806,181
|
|
1,848,041
|
|
||
|
Other liabilities
|
26
|
620,350
|
|
656,275
|
|
||
|
Other financial liabilities
|
20
|
1,444
|
|
39,638
|
|
||
|
Trade payables
|
27
|
607,505
|
|
614,888
|
|
||
|
Current tax payables
|
29,160
|
|
41,595
|
|
|||
|
Total equity and liabilities
|
4,141,104
|
|
3,849,604
|
|
|||
The accompanying notes are an integral part of the Consolidated Financial Statements.
F-5
Ferrari N.V.
for the years ended December 31,
2017
,
2016
and
2015
|
For the years ended December 31,
|
|||||||||
|
2017
|
2016
|
2015
|
|||||||
|
(€ thousand)
|
|||||||||
|
Cash and cash equivalents at beginning of the year
|
457,784
|
|
182,753
|
|
134,278
|
|
|||
|
Cash flows from operating activities:
|
|||||||||
|
Profit before taxes
|
746,156
|
|
567,353
|
|
434,169
|
|
|||
|
Amortization and depreciation
|
260,606
|
|
247,717
|
|
274,757
|
|
|||
|
Provision accruals
|
13,473
|
|
82,418
|
|
50,873
|
|
|||
|
Result from investments
|
(2,437
|
)
|
(3,066
|
)
|
—
|
|
|||
|
Net finance costs
|
29,260
|
|
27,729
|
|
10,151
|
|
|||
|
Other non-cash expenses/(income)
|
43,453
|
|
(38,465
|
)
|
38,813
|
|
|||
|
Net gains on disposal of property, plant and equipment and intangible assets
|
(2,585
|
)
|
(2,652
|
)
|
(6,964
|
)
|
|||
|
Change in inventories
|
(88,483
|
)
|
(33,187
|
)
|
(2,885
|
)
|
|||
|
Change in trade receivables
|
(1,745
|
)
|
(88,847
|
)
|
15,693
|
|
|||
|
Change in trade payables
|
29,333
|
|
106,163
|
|
(45,792
|
)
|
|||
|
Change in receivables from financing activities
|
(44,123
|
)
|
404,568
|
|
120,902
|
|
|||
|
Change in other operating assets and liabilities
|
(72,803
|
)
|
7,149
|
|
(24,698
|
)
|
|||
|
Finance income received
|
4,402
|
|
2,684
|
|
5,347
|
|
|||
|
Finance costs paid
|
(36,222
|
)
|
(22,239
|
)
|
(18,081
|
)
|
|||
|
Income tax paid
|
(215,486
|
)
|
(252,026
|
)
|
(145,017
|
)
|
|||
|
Total
|
662,799
|
|
1,005,299
|
|
707,268
|
|
|||
|
Cash flows used in investing activities:
|
|||||||||
|
Investments in property, plant and equipment
|
(188,904
|
)
|
(175,647
|
)
|
(184,910
|
)
|
|||
|
Investments in intangible assets
|
(202,506
|
)
|
(166,340
|
)
|
(171,033
|
)
|
|||
|
Proceeds from the sale of property, plant and equipment and intangible assets
|
3,663
|
|
2,931
|
|
1,370
|
|
|||
|
Proceeds from exercising the Delta Topco option
|
8,307
|
|
—
|
|
—
|
|
|||
|
Proceeds from the sale of a majority stake in FFS GmbH
|
—
|
|
18,595
|
|
—
|
|
|||
|
Proceeds from the sale of assets and liabilities related to investment properties
|
—
|
|
—
|
|
37,130
|
|
|||
|
Change in investments and other financial assets
|
—
|
|
—
|
|
377
|
|
|||
|
Total
|
(379,440
|
)
|
(320,461
|
)
|
(317,066
|
)
|
|||
|
Cash flows used in financing activities:
|
|||||||||
|
Proceeds from bonds
|
694,172
|
|
490,729
|
|
—
|
|
|||
|
Proceeds from securitizations, net of repayments
|
141,115
|
|
462,700
|
|
—
|
|
|||
|
Proceeds from Term Loan and Bridge Loan
|
—
|
|
—
|
|
1,994,712
|
|
|||
|
Repayment of Term Loan
|
(795,254
|
)
|
(700,846
|
)
|
—
|
|
|||
|
Repayment of Bridge Loan
|
—
|
|
(500,000
|
)
|
—
|
|
|||
|
Net change in other bank borrowings
|
4,385
|
|
(211,832
|
)
|
123,993
|
|
|||
|
Net change in other debt
|
(8,280
|
)
|
15,847
|
|
(11,114
|
)
|
|||
|
Net change in deposits in FCA Group cash management pools and financial liabilities with FCA Group
|
—
|
|
135,094
|
|
(2,396,422
|
)
|
|||
|
Cash distribution of reserves
|
(119,985
|
)
|
(86,905
|
)
|
—
|
|
|||
|
Dividends paid to non-controlling interest
|
(1,218
|
)
|
(17,207
|
)
|
(53,942
|
)
|
|||
|
Acquisition of non-controlling interest
|
—
|
|
—
|
|
(8,500
|
)
|
|||
|
Change in equity
|
—
|
|
1,384
|
|
—
|
|
|||
|
Total
|
(85,065
|
)
|
(411,036
|
)
|
(351,273
|
)
|
|||
|
Translation exchange differences
|
(8,372
|
)
|
1,229
|
|
9,546
|
|
|||
|
Total change in cash and cash equivalents
|
189,922
|
|
275,031
|
|
48,475
|
|
|||
|
Cash and cash equivalents at end of the year
|
647,706
|
|
457,784
|
|
182,753
|
|
|||
The accompanying notes are an integral part of the Consolidated Financial Statements.
F-6
Ferrari N.V.
CONSOLIDATED STATEMENT OF CHANGES IN EQUITY
for the years ended December 31,
2017
,
2016
and
2015
|
Share capital
|
Retained earnings
and other reserves |
Cash flow hedge reserve
|
Currency translation differences
|
Remeasurement of defined benefit plans
|
Equity attributable to owners of the parent
|
Non-controlling interests
|
Total
|
||||||||||||||||
|
(€ thousand)
|
|||||||||||||||||||||||
|
At January 1, 2015
|
3,778
|
|
2,503,614
|
|
(58,557
|
)
|
29,912
|
|
(9,129
|
)
|
2,469,618
|
|
8,695
|
|
2,478,313
|
|
|||||||
|
Transaction with non-controlling interest
|
—
|
|
(2,602
|
)
|
—
|
|
—
|
|
—
|
|
(2,602
|
)
|
(5,898
|
)
|
(8,500
|
)
|
|||||||
|
Net profit
|
—
|
|
287,816
|
|
—
|
|
—
|
|
—
|
|
287,816
|
|
2,238
|
|
290,054
|
|
|||||||
|
Other comprehensive income/(loss)
|
—
|
|
—
|
|
5,634
|
|
12,659
|
|
590
|
|
18,883
|
|
685
|
|
19,568
|
|
|||||||
|
Restructuring
(1)
|
—
|
|
|
(2,800,000
|
)
|
|
—
|
|
|
—
|
|
|
—
|
|
|
(2,800,000
|
)
|
|
—
|
|
|
(2,800,000
|
)
|
|
Share premium contribution
(2)
|
—
|
|
|
1,162
|
|
|
—
|
|
|
—
|
|
|
—
|
|
|
1,162
|
|
|
—
|
|
|
1,162
|
|
|
Reclassification
(3)
|
—
|
|
(2,117
|
)
|
—
|
|
—
|
|
2,117
|
|
—
|
|
—
|
|
—
|
|
|||||||
|
At December 31, 2015
|
3,778
|
|
(12,127
|
)
|
(52,923
|
)
|
42,571
|
|
(6,422
|
)
|
(25,123
|
)
|
5,720
|
|
(19,403
|
)
|
|||||||
|
Net profit
|
—
|
|
398,762
|
|
—
|
|
—
|
|
—
|
|
398,762
|
|
956
|
|
399,718
|
|
|||||||
|
Other comprehensive income/(loss)
|
—
|
|
—
|
|
34,143
|
|
4,252
|
|
(1,466
|
)
|
36,929
|
|
(134
|
)
|
36,795
|
|
|||||||
|
Cash distribution of reserves
|
—
|
|
|
(86,905
|
)
|
|
—
|
|
|
—
|
|
|
—
|
|
|
(86,905
|
)
|
|
—
|
|
|
(86,905
|
)
|
|
Dividends to non-controlling interests
|
—
|
|
|
—
|
|
|
—
|
|
|
—
|
|
|
—
|
|
|
—
|
|
|
(1,732
|
)
|
|
(1,732
|
)
|
|
Share-based compensation
(4)
|
—
|
|
|
1,110
|
|
|
—
|
|
|
—
|
|
|
—
|
|
|
1,110
|
|
|
—
|
|
|
1,110
|
|
|
Separation
(5)
|
(1,274
|
)
|
|
1,496
|
|
|
—
|
|
|
—
|
|
|
—
|
|
|
222
|
|
|
—
|
|
|
222
|
|
|
At December 31, 2016
|
2,504
|
|
302,336
|
|
(18,780
|
)
|
46,823
|
|
(7,888
|
)
|
324,995
|
|
4,810
|
|
329,805
|
|
|||||||
|
Net profit
|
—
|
|
535,393
|
|
—
|
|
—
|
|
—
|
|
535,393
|
|
2,003
|
|
537,396
|
|
|||||||
|
Other comprehensive income/(loss)
|
—
|
|
—
|
|
25,214
|
|
(15,009
|
)
|
(527
|
)
|
9,678
|
|
(337
|
)
|
9,341
|
|
|||||||
|
Cash distribution of reserves
|
—
|
|
(119,985
|
)
|
—
|
|
—
|
|
—
|
|
(119,985
|
)
|
—
|
|
(119,985
|
)
|
|||||||
|
Dividends to non-controlling interests
|
—
|
|
—
|
|
—
|
|
—
|
|
—
|
|
—
|
|
(1,218
|
)
|
(1,218
|
)
|
|||||||
|
Share-based compensation
(4)
|
—
|
|
28,597
|
|
—
|
|
—
|
|
—
|
|
28,597
|
|
—
|
|
28,597
|
|
|||||||
|
At December 31, 2017
|
2,504
|
|
746,341
|
|
6,434
|
|
31,814
|
|
(8,415
|
)
|
778,678
|
|
5,258
|
|
783,936
|
|
|||||||
____________________________
|
(1)
|
Relates to the remaining principal amount of the note issued by the Company to FCA (
“
FCA Note
”)
recognized in connection with the Restructuring.
|
|
(2)
|
Relates to the effect of a share premium contribution made by FCA N.V. in connection with the Restructuring.
|
|
(3)
|
Relates to the reclassification of the actuarial gain recognized on the remeasurement of the defined benefit pension plan of the former Chairman of the Group.
|
|
(4)
|
Relates to the equity-settled Non-Executive Directors
’
compensation and from 2017 also the equity incentive plan. See Note 21
“
Equity
”
and Note 22
“
Share-based Compensation
”
for additional details.
|
|
(5)
|
Reflects the effects of the Separation.
|
The accompanying notes are an integral part of the Consolidated Financial Statements.
F-7
Ferrari N.V.
NOTES TO THE CONSOLIDATED FINANCIAL STATEMENTS
at December 31, 2017 and 2016
1. BACKGROUND AND BASIS OF PRESENTATION
Background
Ferrari is among the world’s leading luxury brands. The activities of Ferrari N.V. (herein referred to as “Ferrari” or the “Company” and together with its subsidiaries the “Group”) and its subsidiaries are focused on the design, engineering, production and sale of luxury performance sports cars. The cars are designed, engineered and produced in Maranello and Modena, Italy and sold in more than
60
markets worldwide through a network of
164
authorized dealers operating
185
points of sale. The Ferrari brand is licensed to a selected number of producers and retailers of luxury and lifestyle goods, with Ferrari branded merchandise also sold through a network of
18
Ferrari-owned stores and
30
franchised stores (including
8
Ferrari Store Junior), as well as on the Group’s website. To facilitate the sale of new and used cars, the Group provides various forms of financing, through cooperation and other agreements, to both clients and dealers. Ferrari also participates in the Formula 1 World Championship through Scuderia Ferrari. The activities of Scuderia Ferrari are the core element of Ferrari marketing and promotional activities and an important source of innovation supporting the technological advancement of Ferrari sports and street cars.
Fiat S.p.A. (merged with and into Fiat Chrysler Automobiles N.V. in
October 2014
, Fiat S.p.A. and Fiat Chrysler Automobiles are defined as “FCA” as the context requires and together with their subsidiaries the “FCA Group”) acquired
50 percent
of Ferrari S.p.A. in 1969, and over time expanded its shareholding to
90 percent
ownership, while the remaining
10 percent
non-controlling interest was owned by Piero Ferrari.
On
October 29, 2014
, Fiat Chrysler Automobiles N.V. (“FCA”) announced its intention to separate Ferrari S.p.A. from FCA. The separation was completed on
January 3, 2016
and occurred through a series of transactions (together defined as the “Separation”) including (i) an intra-group restructuring which resulted in the Company’s acquisition of the assets and business of Ferrari North Europe Limited and the transfer by FCA of its 90 percent shareholding in Ferrari S.p.A. to the Company, (ii) the transfer of Piero Ferrari’s 10 percent shareholding in Ferrari S.p.A. to the Company, (iii) the initial public offering of common shares of the Company on the New York Stock Exchange, and (iv) the distribution, following the initial public offering, of FCA’s remaining interest in the Company to FCA’s shareholders. Following the Separation, Ferrari operates as an independent, publicly traded company.
The transactions described above in (i) and (ii) (referred to collectively as the “Restructuring”) were completed in October 2015. The Restructuring comprised: (i) a capital reorganization of the group under the Company, which has been accounted for in the consolidated financial statements as though it had occurred effective January 1, 2015 using FCA’s basis of accounting, and (ii) the issuance of the FCA Note, which has been reflected in the consolidated financial statements only from the date on which it occurred.
The remaining steps of the Separation, which were completed between January 1 and January 3, 2016 through two consecutive demergers followed by a merger under Dutch law, have been reflected in these consolidated financial statements only from the date on which the related transactions occurred and had no impact on the Company’s results of operations or financial position. As part of the Separation a new entity, FE New N.V., was created. Pursuant to the demergers the shares in the Company held by FCA were ultimately transferred to FE New N.V., with FE New N.V. issuing shares in its capital to the shareholders of FCA. In connection with the demergers, the mandatory convertible security holders of FCA also received shares in FE New N.V. On completion of the Separation the Company was merged with and into FE New N.V. and FE New N.V. was renamed Ferrari N.V.
Following the Separation, the cash pooling and financial liabilities with the FCA Group were settled and the relevant agreements were terminated. The derivative contracts that were previously held by FCA were novated to Ferrari S.p.A.
On January 4, 2016 the Company also completed the listing of its common shares on the Mercato Telematico Azionario, the stock exchange managed by Borsa Italiana, under the ticker symbol RACE.
At December 31, 2017, the fully paid up share capital of the Company amounted to
€2,504 thousand
, comprising common shares and special voting shares all with nominal value of
€0.01
per share. At December 31, 2017, the Company had
188,953,874
common shares and
56,493,519
special voting shares issued and outstanding.
F-8
Ferrari N.V.
NOTES TO THE CONSOLIDATED FINANCIAL STATEMENTS
at December 31, 2017 and 2016
References to the Company in these consolidated financial statements refer to Ferrari N.V. (formerly named FE New N.V.) following the Separation and to Ferrari N.V.’s predecessor (formerly named New Business Netherlands N.V.), prior to the completion of the Separation.
Basis of preparation
Authorization of consolidated financial statements and compliance with International Financial Reporting Standards
These consolidated financial statements of Ferrari N.V. were authorized for issuance on February 23, 2018.
The consolidated financial statements have been prepared in accordance with the International Financial Reporting Standards as issued by the International Accounting Standards Board (“IFRS”). The designation IFRS also includes International Accounting Standards (“IAS”) as well as all the interpretations of the International Financial Reporting Interpretations Committee (“IFRIC” and “SIC”).
The consolidated financial statements are prepared under the historical cost method, modified as required for the measurement of certain financial instruments, as well as on a going concern basis.
The Group’s presentation currency is the Euro, which is also the functional currency of the Company, and unless otherwise stated information is presented in thousands of Euro.
Transactions with FCA
The Group generates a portion of its net revenues from sale of goods to other FCA Group companies. In particular, net revenues generated from FCA Group companies amounted to
€324,033 thousand
, €
248,685 thousand
and €
194,506 thousand
for the years ended December 31,
2017
,
2016
and
2015
, respectively. See Note 29 for further details.
The Group enters into commercial transactions with the FCA Group in the ordinary course of business. Receivables and payables are settled in the ordinary course of business and are recorded as assets and liabilities on the consolidated statement of financial position.
Historically the Group received various services, including human resources, payroll, financial reporting and tax, customs, accounting and treasury, institutional and industrial relations, procurement of insurance coverage, internal audit, IT and systems, risk, corporate security, executive compensation, legal and corporate affairs from the FCA Group. Following the Separation, the Group has been gradually internalizing these services. The costs for the recharge of services received, including costs for termination packages, totaled
€8,548 thousand
,
€15,021 thousand
and
€11,559 thousand
for the years ended December 31,
2017
,
2016
and
2015
, respectively. These costs were recharged by the FCA Group based on the actual costs incurred for the services provided to the Group and are reflected as expenses according to their nature in the consolidated financial statements.
Prior to the Separation the Group participated in a group-wide cash management system at FCA Group, where the operating cash management, main funding operations and liquidity investment of the Group were centrally coordinated by dedicated treasury companies. The Group accessed funds deposited in these accounts on a daily basis, had the contractual right to withdraw these funds on demand and terminate these cash management arrangements depending on FCA’s ability to pay at the relevant time. The deposits with FCA Group relating to the cash management system were recorded in the consolidated statement of financial position as “Deposits in FCA Group cash management pools” and the finance income earned on such deposits was recorded as net financial income/expenses in the consolidated income statement. Prior to the Separation, certain entities of the Group also entered into credit lines with FCA Group entities. These financial liabilities were provided primarily to finance the activities of the Group’s financial services portfolio in North America and were recorded as “Debt” in the consolidated statement of financial position. The finance expense associated with such financial liabilities was recorded in “Cost of sales” in the consolidated income statement. The deposits with FCA Group relating to the cash management and the credit lines with FCA Group entities were settled and terminated following the Separation. Management believes that the assumptions underlying the consolidated financial statements for the periods prior to the Separation, including the recharges of expenses from FCA, are reasonable. Nevertheless, for the periods prior to the Separation, the consolidated financial statements may not include all of the actual expenses that would have been incurred by the Group and may not reflect the consolidated results of operations, financial position and cash flows had Ferrari been a stand-alone company during those periods. Actual costs that
F-9
Ferrari N.V.
NOTES TO THE CONSOLIDATED FINANCIAL STATEMENTS
at December 31, 2017 and 2016
would have been incurred if Ferrari had been a stand-alone company would depend on multiple factors, including organizational structure and strategic decisions made in various areas.
2. SIGNIFICANT ACCOUNTING POLICIES
Format of the financial statements
The consolidated financial statements include the consolidated income statement, consolidated statement of comprehensive income, consolidated statement of financial position, consolidated statement of cash flows, consolidated statement of changes in equity and notes thereto, (the “Consolidated Financial Statements”).
For presentation of the consolidated income statement, the Group uses a classification based on the function of expenses, as it is more representative of the format used for internal reporting and management purposes and is consistent with international practice.
In the consolidated income statement, the Group also presents a subtotal for Earnings Before Interest and Taxes (EBIT). EBIT distinguishes between the profit before taxes arising from operating items and those arising from financing activities. EBIT is the primary measure used by the Group’s Chief Operating Decision Maker (“CODM”) to assess performance.
For the consolidated statement of financial position, a mixed format has been selected to present current and non-current assets and liabilities, as permitted by IAS 1 paragraph 60. More specifically, the Consolidated Financial Statements include both industrial companies and financial services companies. The investment portfolios of the financial services companies are included in current assets as the investments will be realized in their normal operating cycle. However, the financial services companies obtain only a portion of their funding from the market; the remainder has historically been obtained mainly through funding from certain of the Group’s operating companies and, to a lesser extent, prior to the Separation, intercompany funding from FCA Group, which provided funding to the financial services entities as the need arose. This financial service structure within the Group does not allow the separation of financial liabilities funding the financial services operations (whose assets are reported within current assets) and those funding the industrial operations. Presentation of financial liabilities as current or non-current based on their date of maturity would not facilitate a meaningful comparison with financial assets, which are categorized on the basis of their normal operating cycle. Disclosure as to the due date of the debt is provided in Note 25.
The consolidated statement of cash flows is presented using the indirect method. Starting from 2017, the Group has disclosed separately finance income received and finance costs paid on the consolidated statement of cash flows. The comparative information for the years ended December 31, 2016 and 2015 has been reclassified accordingly. This did not affect any of the subtotals presented on the consolidated statement of cash flows.
New standards and amendments effective from January 1,
2017
The following new standards and amendments that are applicable from January 1,
2017
were adopted by the Group for the preparation of these Consolidated Financial Statements.
|
•
|
The Group adopted the amendments to
IAS 12 - Income taxes.
The amendments clarify how to account for deferred tax assets related to debt instruments measured at fair value. Specifically, the amendments clarify the requirements on recognition of deferred tax assets for unrealized losses in order to address diversity in practice. There was no effect from the adoption of these amendments.
|
|
•
|
The Group adopted the amendments to
IAS 7 - Statement of Cash Flows,
which requires companies to provide information about changes in their financing liabilities. The amendments are aimed at improving disclosures so that users of financial statements are better able to understand the changes in a company’s debt, including changes from cash flows and non-cash changes. There was no effect from the adoption of these amendments.
|
|
•
|
The Group adopted the amendments to
IFRS 12 - Disclosure of Interests in Other Entities
which were included in the
Annual Improvements to IFRSs 2014 - 2016 Cycle
. The amendments relate to disclosures of an entity’s interest in a subsidiary, a joint venture or an associate (or a portion of its interest in a joint venture or an associate) that is classified (or included in a disposal group that is classified) as held for sale in accordance with IFRS 5. There was no effect from the adoption of these amendments.
|
F-10
Ferrari N.V.
NOTES TO THE CONSOLIDATED FINANCIAL STATEMENTS
at December 31, 2017 and 2016
New standards, amendments and interpretations not yet effective
The standards, amendments and interpretations issued by the International Accounting Standards Board (“IASB”) that will have mandatory application in
2018
or subsequent years are listed below:
In
May 2014
, the IASB issued
IFRS 15 - Revenue from Contracts with Customers
. The standard requires a company to recognize revenue upon transfer of control of goods or services to a customer at an amount that reflects the consideration it expects to receive. This new revenue recognition model defines a five step process to achieve this objective. The updated guidance also requires additional disclosures about the nature, amount, timing and uncertainty of revenue and cash flows arising from customer contracts. In April 2016, the IASB issued amendments to the standard which do not change the underlying principles of the standard, but clarify how those principles should be applied. The amendments clarify how to identify a performance obligation in a contract, determine whether a company is a principal or an agent and determine whether the revenue from granting a license should be recognized at a point in time or over time. The amendments also provide two additional reliefs to reduce cost and complexity. The standard and amendments are effective for annual periods beginning on or after January 1, 2018, with earlier adoption permitted. The Group will adopt the standard and amendments for its annual period beginning on January 1, 2018. The Group has completed its analysis of the impact of adoption, including an analysis of each of the Group’s revenue streams by applying the five-step model provided under IFRS 15. In performing the analysis, the Group identified the main revenue streams (please refer to Note 4), and as permitted under the standard, applied the guidance in IFRS 15 to portfolios of contracts (or performance obligations) with similar characteristics in situations where the Group reasonably expects that the effects on the financial statements of applying the standard to the portfolio would not differ materially from applying the standard to the individual contracts (or performance obligations) within that portfolio. Based on the analysis performed, the Group concluded that the current accounting treatment of revenue from contracts with customers is in accordance with the requirements of IFRS 15. The Group will not apply any of the practical expedients permitted upon transition under the guidance in appendix C of IFRS 15. As permitted under IFRS 15, the Group will adopt the standard and amendments retrospectively with the cumulative effect of initial adoption recognized at the date of initial application (the “modified retrospective approach”), which has been determined to be January 1, 2018 and there will be no material impact on the Group’s consolidated financial statements upon initial adoption of the standard and amendments.
In July 2014 the IASB issued
IFRS 9 - Financial Instruments
. The improvements introduced by the new standard includes a logical approach for classification and measurement of financial instruments driven by cash flow characteristics and the business model in which an asset is held, a single “expected loss” impairment model for financial assets and a substantially reformed approach for hedge accounting. The standard is effective, retrospectively with limited exceptions, for annual periods beginning on or after January 1, 2018 with earlier application permitted. In October 2017 the IASB issued amendments to IFRS 9 that allow, under certain conditions, for a prepayable financial asset with negative compensation payments to be measured at amortized cost or at fair value through other comprehensive income. The final amendments also contain a clarification relating to the accounting for a modification or exchange of a financial liability measured at amortized cost that does not result in the derecognition of the financial liability. The amendments are effective on or after January 1, 2019. The Group has completed its analysis of the impact of adoption, including an analysis of each of the Group’s classes of financial assets, financial liabilities and derivative instruments by applying the requirements provided by the new standard. Based on the analysis performed, the Group concluded that the current accounting treatment of financial assets, financial liabilities and derivative instruments is in accordance with the requirements of IFRS 9 and, therefore, there will be no material impact on the Group’s consolidated financial statements upon initial adoption of the standard and related amendments.
In January 2016, the IASB issued
IFRS 16 - Leases
which sets out the principles for the recognition, measurement, presentation and disclosure of leases for both parties to a contract and replaces the previous leases standard, IAS 17 - Leases. IFRS 16, which is not applicable to service contracts, but only applicable to leases or lease components of a contract, defines a lease as a contract that conveys to the customer (lessee) the right to use an asset for a period of time in exchange for consideration. IFRS 16 eliminates the classification of leases for the lessee as either operating leases or finance leases as required by IAS 17 and, instead, introduces a single lessee accounting model whereby a lessee is required to recognize assets and liabilities for all leases with a term that is greater than 12 months, unless the underlying asset is of low value, and to recognize depreciation of lease assets separately from interest on lease liabilities in the income statement. As IFRS 16 substantially carries forward the lessor accounting requirements in IAS 17, a lessor will continue to classify its leases as operating leases or finance leases and to account for those two types of leases differently. IFRS 16 is effective from January 1, 2019 with early adoption allowed only if
IFRS 15 - Revenue from Contracts with Customers
is also applied. The Group will not early adopt the standard and is currently evaluating the method of implementation and impact of adoption.
F-11
Ferrari N.V.
NOTES TO THE CONSOLIDATED FINANCIAL STATEMENTS
at December 31, 2017 and 2016
In June 2016, the IASB issued amendments to
IFRS 2 - Share-Based Payment
,
which provide requirements on the accounting for (i) the effects of vesting and non-vesting conditions on the measurement of cash-settled share-based payments; (ii) share-based payment transactions with a net settlement feature for withholding tax obligations; and (iii) a modification to the terms and conditions of a share-based payment that changes the classification of the transaction from cash-settled to equity-settled. The amendments are effective for annual periods beginning on or after January 1, 2018 with early application permitted. The Group will apply the amendments to share-based payment transactions under the Group’s equity incentive plan that contains a net settlement feature for withholding tax obligations, resulting in such transactions being classified in their entirety as equity-settled. The Group does not expect any additional impact from the adoption of these amendments.
In December 2016, the IASB issued
Annual Improvements to IFRSs 2014 - 2016 Cycle
, which has amendments to three Standards:
IFRS 12 - Disclosure of Interests in Other Entities
(effective date of January 1, 2017)
, IFRS 1- First-time Adoption of International Financial Reporting Standards
(effective date of January 1, 2018) and
IAS 28 - Investments in Associates and Joint Ventures
(effective date of January 1, 2018). The amendments clarify, correct or remove redundant wording in the related IFRS Standard and are not expected to have a material impact upon adoption.
In December 2016, the IASB issued
IFRIC Interpretation 22 - Foreign Currency Transactions and Advance Consideration
which addresses the exchange rate to use in transactions that involve advance consideration paid or received in a foreign currency. The interpretation is effective on or after January 1, 2018. The Group is currently evaluating the impact of adoption of this interpretation.
In May 2017, the IASB issued
IFRS 17 - Insurance Contracts
which establishes principles for the recognition, measurement, presentation and disclosure of insurance contracts issued as well as guidance relating to reinsurance contracts held and investment contracts with discretionary participation features issued. IFRS 17 is effective on or after January 1, 2021 with early adoption allowed if
IFRS 15 - Revenue from Contracts with Customers
and
IFRS 9 - Financial Instruments
are also applied. The Group does not expect any impact from the adoption of this standard.
In June 2017, the IASB issued
IFRIC Interpretation 23 - Uncertainty over Income Tax Treatments
which provides requirements regarding how to reflect uncertainties in accounting for income taxes. The interpretation is effective on or after January 1, 2019. The Group is currently evaluating the impact of adoption of this interpretation.
In October 2017 the IASB issued amendments to
IAS 28 - Long Term Interests in Associates and Joint Ventures
to clarify that an entity applies IFRS 9 to long-term interests in an associate or joint venture that form part of the net investment in the associate or joint venture but to which the equity method is not applied. The amendment is effective on or after January 1, 2019. The Group does not expect a material impact from the adoption of these amendments.
In December 2017, the IASB issued
Annual Improvements to IFRSs 2015 - 2017 Cycle
, which has amendments to the following four Standards:
IFRS 3 - Business Combinations,
in relation to obtaining control of a business which was previously accounted for as an interest in a joint operation,
IFRS 11- Joint Arrangements,
in relation to obtaining joint control of a business which was previously accounted for as a joint operation,
IAS 12 - Income Taxes,
clarifying the treatment of taxes in relation to dividend payments
and
IAS 23 - Borrowing Costs,
clarifying the treatment of borrowings which were previously capitalized when the related asset is ready for its intended use or sale. The amendments are effective on or after January 1, 2019. The Group is currently evaluating the impact of adoption of these amendments.
In February 2018, the IASB issued amendments to
IAS 19 - Employee Benefits
. When there is a change to a defined benefit plan (an amendment, curtailment or settlement) the amendments require that a company use the updated assumptions from the remeasurement of a net defined benefit liability or asset to determine current service cost and net interest for the remainder of the reporting period after the change to the plan. These amendments are effective on or after January 1, 2019. The Group does not expect a material impact from the adoption of these amendments.
F-12
Ferrari N.V.
NOTES TO THE CONSOLIDATED FINANCIAL STATEMENTS
at December 31, 2017 and 2016
Basis of consolidation
Subsidiaries
Subsidiaries are entities over which the Group has control. Control is achieved when the Group has power over the investee, when it is exposed to, or has rights to, variable returns from its involvement with the investee, and has the ability to use its power over the investee to affect the amount of the investor’s returns. Subsidiaries are consolidated on a line by line basis from the date on which the Group achieves control. The Group reassesses whether or not it controls an investee if facts and circumstances indicate that there are changes to one or more of the three elements of control listed above.
The Group recognizes any non-controlling interests (“NCI”) in the acquiree on an acquisition-by-acquisition basis, either at fair value or at the non-controlling interest’s share of the recognized amounts of the acquiree’s identifiable net assets. Net profit or loss and each component of other comprehensive income/(loss) are attributed to the owners of the parent and to the non-controlling interests. Total comprehensive income/(loss) of subsidiaries is attributed to owners of the parent and to the non-controlling interests even if this results in the non-controlling interests having a deficit balance.
All significant intra-group balances and transactions and any unrealized gains and losses arising from intra-group transactions are eliminated in preparing the Consolidated Financial Statements.
Subsidiaries are deconsolidated from the date when control ceases. When the Group ceases to have control over a subsidiary, it derecognizes the assets (including any goodwill) and liabilities of the subsidiary at their carrying amounts, derecognizes the carrying amount of non-controlling interests in the former subsidiary and recognizes the fair value of any consideration received from the transaction. Any retained interest in the former subsidiary is then remeasured to its fair value.
In 2016 the Group sold a majority stake in Ferrari Financial Services GmbH. From such date, the Group’s remaining interest has been remeasured at fair value and accounted for using the equity method.
Interests in associates
An associate is an entity over which the Group has significant influence. Significant influence is the power to participate in the financial and operating policy decisions of the investee but without having control or joint control over those policies. Associates are accounted for using the equity method of accounting from the date significant influence is obtained.
Under the equity method, the investments are initially recognized at cost and adjusted thereafter to recognize the Group’s share of the profit/(loss) and other comprehensive income/(loss) of the investee. The Group’s share of the investee’s profit/(loss) is recognized in the consolidated income statement. Distributions received from an investee reduce the carrying amount of the investment. Post-acquisition movements in other comprehensive income/(loss) are recognized in other comprehensive income/(loss) with a corresponding adjustment to the carrying amount of the investment.
Unrealized gains on transactions between the Group and its associates are eliminated to the extent of the Group’s interest in the associate. Unrealized losses are also eliminated unless the transaction provides evidence of an impairment of the asset transferred.
When the Group’s share of the losses of an associate exceeds the Group’s interest in that associate, the Group discontinues recognizing its share of further losses. Additional losses are provided for, and a liability is recognized, only to the extent that the Group has incurred legal or constructive obligations or made payments on behalf of the associate.
The Group discontinues the use of the equity method from the date the investment ceases to be an associate or when it is classified as available-for-sale.
Interests in joint operations
A joint operation is a joint arrangement whereby the parties that have joint control of the arrangement have rights to the assets and obligations for the liabilities, relating to the arrangement. Joint control is the contractually agreed sharing of control of an arrangement, which exists only when decisions about the relevant activities require the unanimous consent of the parties sharing control.
F-13
Ferrari N.V.
NOTES TO THE CONSOLIDATED FINANCIAL STATEMENTS
at December 31, 2017 and 2016
When the Group undertakes its activities under joint operations, it recognizes in relation to its interest in the joint operation: (i) its assets, including its share of any assets held jointly, (ii) its liabilities, including its share of any liabilities incurred jointly, (iii) its revenue from the sale of its share of the output arising from the joint operation, (iv) its share of the revenue from the sale of the output by the joint operation, and (v) its expenses, including its share of any expenses incurred jointly.
Foreign currency transactions
The functional currency of the Group’s entities is the currency of their primary economic environment. In individual companies, transactions in foreign currencies are recorded at the exchange rate prevailing at the date of the transaction. Monetary assets and liabilities denominated in foreign currencies at the balance sheet date are translated at the foreign currency exchange rate prevailing at that date. Exchange differences arising on the settlement of monetary items or on reporting monetary items at rates different from those at which they were initially recorded during the period or in previous financial statements are recognized in the consolidated income statement.
Consolidation of foreign entities
All assets and liabilities of foreign consolidated companies with a functional currency other than the Euro are translated using the closing rates at the date of the consolidated statement of financial position. Income and expenses are translated into Euro at the average foreign currency exchange rate for the period. Translation differences resulting from the application of this method are classified as currency translation differences within other comprehensive income/(loss) until the disposal of the investment. Average foreign currency exchange rates for the period are used to translate the cash flows of foreign subsidiaries in preparing the consolidated statement of cash flows.
Goodwill, assets acquired and liabilities assumed arising from the acquisition of entities with a functional currency other than the Euro are recognized in the Consolidated Financial Statements in the functional currency and translated at the foreign currency exchange rate at the acquisition date. These balances are translated at subsequent balance sheet dates at the relevant foreign currency exchange rate.
The principal foreign currency exchange rates used to translate other currencies into Euro were as follows:
|
2017
|
2016
|
2015
|
|||||||||||||||
|
Average
|
At December 31,
|
Average
|
At December 31,
|
Average
|
At December 31,
|
||||||||||||
|
U.S. Dollar
|
1.1297
|
|
1.1993
|
|
1.1069
|
|
1.0541
|
|
1.1094
|
|
1.0887
|
|
|||||
|
Pound Sterling
|
0.8767
|
|
0.8872
|
|
0.8194
|
|
0.8562
|
|
0.7259
|
|
0.7340
|
|
|||||
|
Swiss Franc
|
1.1117
|
|
1.1702
|
|
1.0901
|
|
1.0739
|
|
1.0677
|
|
1.0835
|
|
|||||
|
Japanese Yen
|
126.7112
|
|
135.0100
|
|
120.2169
|
|
123.4000
|
|
134.2956
|
|
131.0700
|
|
|||||
|
Chinese Yuan
|
7.6290
|
|
7.8044
|
|
7.3519
|
|
7.3202
|
|
6.9723
|
|
7.0608
|
|
|||||
|
Australian Dollar
|
1.4732
|
|
1.5346
|
|
1.4883
|
|
1.4596
|
|
1.4775
|
|
1.4897
|
|
|||||
|
Canadian Dollar
|
1.4647
|
|
1.5039
|
|
1.4659
|
|
1.4188
|
|
1.4184
|
|
1.5116
|
|
|||||
|
Singapore Dollar
|
1.5588
|
|
1.6024
|
|
1.5275
|
|
1.5234
|
|
1.5253
|
|
1.5417
|
|
|||||
|
Hong Kong Dollar
|
8.8045
|
|
9.3720
|
|
8.5924
|
|
8.1751
|
|
8.6014
|
|
8.4376
|
|
|||||
Intangible assets
Goodwill
Goodwill is not amortized, but is tested for impairment annually or more frequently if events or changes in circumstances indicate that it might be impaired. After initial recognition, goodwill is measured at cost less any accumulated impairment losses.
Development costs
Development costs for car project production and related components, engines and systems are recognized as an asset if, and only if, both of the following conditions under IAS 38 -
Intangible Assets
are met: that development costs can be measured
F-14
Ferrari N.V.
NOTES TO THE CONSOLIDATED FINANCIAL STATEMENTS
at December 31, 2017 and 2016
reliably and that the technical feasibility of the product, volumes and pricing support the view that the development expenditure will generate future economic benefits. Capitalized development costs include all direct and indirect costs that may be directly attributed to the development process.
Capitalized development costs are amortized on a straight-line basis from the start of production over the estimated lifecycle of the model and the useful life of the components (generally between four and eight years). All other research and development costs are expensed as incurred.
In particular the Group incurs significant research and development costs through the Formula 1 racing activities. These costs are considered fundamental to the development of the sports and street car models and prototypes. The model for the Formula 1 racing activities continually evolves and as such these costs are expensed as incurred.
Patents, concessions and licenses
Separately acquired patents, concessions and licenses are initially recognized at cost. Patents, concessions and licenses acquired in a business combination are initially recognized at fair value. Patents, concessions and licenses are amortized on a straight-line basis over their useful economic lives, which is generally between three and five years.
Other intangible assets
Other intangible assets mainly relate to the registration of trademarks and have been recognized in accordance with IAS 38 -
Intangible Assets
, where it is probable that the use of the asset will generate future economic benefits for the Group and where the cost of the asset can be measured reliably. Other intangible assets are measured at cost less any impairment losses and amortized on a straight-line basis over their estimated life, which is generally between
three
and
five
years.
Property, plant and equipment
Cost
Property, plant and equipment is initially recognized at cost which comprises the purchase price, any costs directly attributable to bringing the assets to the location and condition necessary to be capable of operating in the manner intended by management, capitalized borrowing costs and any initial estimate of the costs of dismantling and removing the item and restoring the site on which it is located. Self-constructed assets are initially recognized at production cost. Subsequent expenditures and the cost of replacing parts of an asset are capitalized only if they increase the future economic benefits embodied in that asset. All other expenditures are expensed as incurred. When such replacement costs are capitalized, the carrying amount of the parts that are replaced is recognized as a loss in the period of replacement in the consolidated income statement.
Depreciation
Depreciation is calculated on a straight-line basis over the estimated useful lives of the assets, as follows:
|
Depreciation rates
|
|
|
Industrial buildings
|
3% - 20%
|
|
Plant, machinery and equipment
|
5% - 22%
|
|
Other assets
|
12% - 25%
|
Land is not depreciated.
If the asset being depreciated consists of separately identifiable components whose useful lives differ from that of the other parts making up the asset, depreciation is charged separately for each of its component parts through application of the ‘component approach’.
F-15
Ferrari N.V.
NOTES TO THE CONSOLIDATED FINANCIAL STATEMENTS
at December 31, 2017 and 2016
Borrowing costs
General and specific borrowing costs directly attributable to the acquisition, construction or production of qualifying assets, which are assets that necessarily take a substantial period of time to get ready for their intended use, are added to the cost of those assets, until such time as the assets are substantially ready for their intended use.
All other borrowing costs are expensed in net financial expenses if related to the Group’s industrial activities or cost of sales if related to the Group’s financial services activities in the consolidated income statement, as incurred.
Impairment of assets
The Group continuously monitors its operations to assess whether there is any indication that its intangible assets (including development costs) and its property, plant and equipment may be impaired. Goodwill is tested for impairment annually or more frequently, if there is an indication that an asset may be impaired.
If indications of impairment are present, the carrying amount of the asset is reduced to its recoverable amount, which is the higher of fair value less costs of disposal and its value in use. The recoverable amount is determined for the individual asset, unless the asset does not generate cash inflows that are largely independent of those from other assets or groups of assets, in which case the asset is tested as part of the cash-generating unit (“CGU”) to which the asset belongs. A CGU is the smallest identifiable group of assets that generates cash inflows that are largely independent of the cash inflows from other assets or groups of assets. In assessing the value in use of an asset or CGU, the estimated future cash flows are discounted to their present value using a discount rate that reflects current market assessments of the time value of money and the risks specific to the asset or CGU. An impairment loss is recognized if the recoverable amount is lower than the carrying amount.
Where an impairment loss for assets other than goodwill, subsequently no longer exists or has decreased, the carrying amount of the asset or CGU is increased to the revised estimate of its recoverable amount, but not in excess of the carrying amount that would have been recorded had no impairment loss been recognized. The reversal of an impairment loss is recognized in the consolidated income statement immediately.
Financial instruments
Presentation
Financial instruments held by the Group are presented in the Consolidated Financial Statements as described in the following paragraphs.
Investments and other financial assets include investment properties, investments in unconsolidated companies and other non-current financial assets.
Current financial assets, as defined in
IAS 39 - Financial Instruments: Recognition and Measurement
, include trade receivables, receivables from financing activities and current financial assets (which include derivative financial instruments stated at fair value), deposits in FCA Group cash management pools and cash and cash equivalents.
Financial liabilities comprise debt (which include bank borrowings and financial liabilities with FCA Group) and other financial liabilities (which mainly include derivative financial instruments stated at fair value), trade payables and other liabilities.
Measurement
Non-current financial assets other than investments, as well as current financial assets and financial liabilities, are accounted for in accordance with
IAS 39 - Financial Instruments: Recognition and Measurement
.
Current financial assets are recognized on the basis of the settlement date and, on initial recognition, are measured at acquisition cost. Subsequent to initial recognition, current financial assets are measured at fair value. When market prices are not directly available, the fair value of current financial assets are measured using appropriate valuation techniques (e.g. discounted cash flow analysis based on market information available at the balance sheet date).
F-16
Ferrari N.V.
NOTES TO THE CONSOLIDATED FINANCIAL STATEMENTS
at December 31, 2017 and 2016
Loans and receivables which are not held by the Group for trading (loans and receivables originating in the ordinary course of business) and equity investments whose fair value cannot be determined reliably, are measured, to the extent that they have a fixed term, at amortized cost, using the effective interest rate method. When the financial assets do not have a fixed term, they are measured at acquisition cost. Receivables with maturities of over one year which bear no interest or an interest rate significantly lower than market rates are discounted using market rates. Assessments are made regularly as to whether there is any objective evidence that a financial asset or group of assets may be impaired. If any such evidence exists, an impairment loss is included in the consolidated income statement for the period within net financial income/(expenses).
Except for derivative instruments, financial liabilities are measured at amortized cost using the effective interest rate method.
Derivative financial instruments
Derivative financial instruments are used for economic hedging purposes, in order to reduce currency risks. In accordance with IAS 39, derivative financial instruments qualify for hedge accounting only when at the inception of the hedge there is formal designation and documentation of the hedging relationship, the hedge is expected to be highly effective, its effectiveness can be reliably measured and it is highly effective throughout the financial reporting periods for which it is designated.
All derivative financial instruments are measured at fair value.
When derivative financial instruments qualify for hedge accounting, the following accounting treatments apply:
|
•
|
Cash flow hedges
- Where a derivative financial instrument is designated as a hedge of the exposure to variability in future cash flows of a recognized asset or liability or a highly probable forecasted transaction and could affect the consolidated income statement, the effective portion of any gain or loss on the derivative financial instrument is recognized directly in other comprehensive income/(loss). The cumulative gain or loss is reclassified from other comprehensive income/(loss) to the consolidated income statement at the same time as the economic effect arising from the hedged item affects the consolidated income statement. The gain or loss associated with a hedge or part of a hedge that has become ineffective is recognized in the consolidated income statement immediately within net financial income/(expense). When a hedging instrument or hedge relationship is terminated but the hedged transaction is still expected to occur, the cumulative gain or loss realized to the point of termination remains in other comprehensive income/(loss) and is recognized in the consolidated income statement at the same time as the underlying transaction occurs. If the hedged transaction is no longer probable, the cumulative unrealized gain or loss held in other comprehensive income/(loss) is recognized in the consolidated income statement immediately.
|
The Group did not use fair value hedges or hedges of a net investment in the period covered by these Consolidated Financial Statements.
For further information on the effects reflected on the consolidated income statement from derivative financial instruments refer to Note 20.
If hedge accounting cannot be applied, the gains or losses from the fair value measurement of derivative financial instruments are recognized immediately in the consolidated income statement within net financial income/(expenses).
Trade receivables
Trade receivables are amounts due from clients for goods sold or services provided in the ordinary course of business. Trade receivables are recognized initially at fair value and subsequently measured at amortized cost using the effective interest rate method, less any provision for allowances.
Inventories
Inventories of raw materials, semi-finished products and finished goods are stated at the lower of cost and net realizable value, cost being determined on a first-in first-out (FIFO) basis. The measurement of inventories includes the direct costs of materials, labor and indirect costs (variable and fixed). Purchase costs include ancillary costs. Prototypes are recognized at their
F-17
Ferrari N.V.
NOTES TO THE CONSOLIDATED FINANCIAL STATEMENTS
at December 31, 2017 and 2016
estimated realizable value, if lower than production cost. Provision is made for obsolete and slow-moving raw materials, finished goods, spare parts and other supplies based on their expected future use and realizable value. Net realizable value is the estimated selling price in the ordinary course of business less the estimated costs of completion and the estimated costs for sale and distribution.
Transfers of financial assets
The Group sells certain of its trade receivables through factoring transactions without recourse. In addition, the Group sells certain of its receivables from financing activities under securitization programs. Securitization transactions involve the sale, on a non-recourse basis, of a financial receivables portfolio to a special purpose vehicle, which in turn finances the purchase of such financial receivables by issuing asset-backed securities in the form of notes whose repayment of principal and interest depends on the cash flows generated by the related financial receivables.
The Group derecognizes the financial assets when, and only when, the contractual rights and risks to the cash flows arising from the related financial assets are no longer held or the Group has transferred the financial assets. In the case of a transfer of financial assets, if the Group transfers substantially all the risks and rewards of ownership of the financial assets, it derecognizes such assets and separately recognizes as assets or liabilities any rights and obligations created or retained in the transfer. On derecognition of financial assets, the difference between the carrying amount of the assets and the consideration received or receivable for the transfer of the assets is recognized in the consolidated income statement in cost of sales.
Cash and cash equivalents
Cash and cash equivalents includes cash in hand, deposits held at call with banks and other short-term highly liquid investments with original maturities of three months or less.
Employee benefits
Defined contribution plans
Costs arising from defined contribution plans are expensed as incurred.
Defined benefit plans
The Group’s net obligations are determined separately for each plan by estimating the present value of future benefits that employees have earned in the current and prior periods, and deducting the fair value of any plan assets. The present value of the defined benefit obligation is measured using actuarial techniques and actuarial assumptions that are unbiased and mutually compatible and attributes benefits to periods in which the obligation to provide post-employment benefits arise by using the Projected Unit Credit Method.
The components of the defined benefit cost are recognized as follows:
|
•
|
the service costs are recognized in the consolidated income statement by function and presented in the relevant line items (cost of sales, selling, general and administrative costs, research and development costs, etc.);
|
|
•
|
the net interest on the defined benefit liability is recognized in the consolidated income statement as net financial income /(expenses), and is determined by multiplying the net liability/(asset) by the discount rate used to discount obligations taking into account the effect of contributions and benefit payments made during the year; and
|
|
•
|
the remeasurement components of the net obligations, which comprise actuarial gains and losses and any change in the effect of the asset ceiling are recognized immediately in other comprehensive income/(loss). These remeasurement components are not reclassified in the consolidated income statement in a subsequent period.
|
F-18
Ferrari N.V.
NOTES TO THE CONSOLIDATED FINANCIAL STATEMENTS
at December 31, 2017 and 2016
Other long-term employee benefits
The Group’s obligations represent the present value of future benefits that employees have earned in return for their service during the current and prior periods. Remeasurement components on other long-term employee benefits are recognized in the consolidated income statement in the period in which they arise.
Share-based compensation
The Group has implemented an equity incentive plan that provides for the granting of share-based compensation to the Chief Executive Officer, all other members of the Group Executive Council (“GEC”) and key leaders. The equity incentive plan is accounted for in accordance with
IFRS 2 - Share-based Payment
, which requires the Company to recognize share-based compensation expense based on fair value of awards granted. Compensation expense for the equity-settled awards containing market performance conditions is measured at the grant date fair value of the award using the Monte Carlo simulation model, which requires the input of subjective assumptions, including the expected volatility of the Company’s common stock, the dividend yield, interest rates and a correlation coefficient between the common stock and the relevant market index. The fair value of the awards which are conditional only on a recipient’s continued service to the Company is measured using the share price at the grant date adjusted for the present value of future distributions which employees will not receive during the vesting period.
Share-based compensation expense relating to the equity incentive plan is recognized over the service period within selling, general and administrative costs or cost of sales in the consolidated income statement depending on the function of the employee, with an offsetting increase to equity.
Non-Executive Directors’ compensation settled in common shares of the Company is accounted for as equity-settled share-based compensation and measured at the fair value of the related compensation, which is recognized as an expense over the service period with an offsetting increase to equity.
Provisions
Provisions are recognized when the Group has a present obligation, legal or constructive, as a result of a past event, it is probable that an outflow of resources embodying economic benefits will be required to settle the obligation and a reliable estimate of the amount of the obligation can be made.
Warranty and recall campaigns provision
All cars are sold with warranty coverage. The warranty coverage generally applies to defects that may become apparent within a certain period from the purchase of the car.
The warranty provision is recognized at the time of the sale of the car, based on the present value of management’s estimate of the expected cost to fulfill the obligations over the contractual warranty period. Estimates are principally based on the Group’s historical claims or costs experience and the cost of parts and services to be incurred in the activities. The costs related to these provisions are recognized within cost of sales at the time when they are probable and reasonably estimable.
Deferred income
Deferred income relates to amounts received by the Group under various agreements, which are reliant on the future performance of a service or other act of the Group. Deferred income is recognized as net revenues when the Group has fulfilled its obligations under the terms of the various agreements.
Range models (models belonging to the Ferrari product portfolio, excluding special series, limited edition and one-off (
fuori serie)
models) are sold with a scheduled maintenance program to ensure that the cars are maintained to the highest standards to meet the Group’s strict requirements for performance and safety. Amounts attributable to the maintenance program are not recognized as income immediately, but are deferred over the maintenance program term. The amount of the deferred income related to this program, is based on the estimated fair value of the service to be provided.
F-19
Ferrari N.V.
NOTES TO THE CONSOLIDATED FINANCIAL STATEMENTS
at December 31, 2017 and 2016
Advances
Advances relate to amounts received from or billed to customers in advance of having delivered the related cars or provided the related services.
Revenue recognition
Revenues from shipments of cars are recognized if it is probable that the economic benefits associated with a transaction will flow to the Group and the revenue can be reliably measured. Revenues are recognized when the risks and rewards of ownership are transferred to the Group’s dealers, the sales price is agreed or determinable and collectability is reasonably assured; for cars this generally corresponds to the date when the cars are released to the carrier responsible for transporting cars to dealers.
Revenues are recognized net of discounts including but not limited to, sales incentives and performance based bonuses.
Revenues from separately-priced extended warranty contracts are recognized over the contract period in proportion to the costs expected to be incurred based on historical information. A loss on these contracts is recognized if the sum of the expected costs for services under the contract exceeds unearned revenues. The Group offers a scheduled maintenance program on range models, which is not separately priced. The Group allocates revenue between the car and the maintenance program based on their relative estimated fair values. Amounts paid and attributed to the maintenance program are deferred and recognized as net revenues over the maintenance program period.
Revenues from sponsorship and licensing agreements are recognized on a straight-line basis over the contract term. Certain of the sponsorship agreements contain performance related conditions while certain of the licensing agreements contain minimum guaranteed payments. Performance related sponsorship revenues and licensing revenues in excess of the minimum guaranteed payment are recognized when certain, which is typically when the related conditions have been achieved.
Revenues also include operating lease rentals in conjunction with the rental of engines to other Formula 1 racing teams. Revenues from operating leases are recognized on a straight-line basis over the relevant term of the lease.
Interest income earned in conjunction with the provision of client and dealer financing are reported within the line item “Finance income from financial services companies” using the effective interest rate method.
Revenues from commercial activities relate to the revenues received from participating in the Formula 1 World Championship. The revenues attributable to each racing team are governed by a specific agreement and depend upon, among other factors, the prior year ranking of each of the racing teams. Revenues of the commercial activities are recognized pro-rata over the year.
Cost of sales
Cost of sales comprises expenses incurred in the manufacturing and distribution of cars and parts, including the engines rented to other Formula 1 racing teams, of which, cost of materials, components and labor costs are the most significant portion. The remaining costs principally include depreciation, amortization, insurance and transportation costs. Cost of sales also includes warranty and product-related costs, which are estimated and recorded at the time of sale of the car.
Expenses which are directly attributable to the financial services companies, including the interest expenses related to their financing as a whole and provisions for risks and write-downs of assets, are also reported in cost of sales.
Taxes
Income taxes include all taxes based upon the taxable profits of the Group. Current and deferred taxes are recognized as income or expense and are included in the consolidated income statement for the period, except tax arising from (i) a transaction or event which is recognized, in the same or a different period, either in other comprehensive income/(loss) or directly in equity, or (ii) a business combination.
Deferred taxes are accounted using the full liability method. Deferred tax liabilities are recognized for all taxable temporary differences between the carrying amounts of assets or liabilities and their tax base, except to the extent that the deferred
F-20
Ferrari N.V.
NOTES TO THE CONSOLIDATED FINANCIAL STATEMENTS
at December 31, 2017 and 2016
tax liabilities arise from the initial recognition of goodwill or the initial recognition of an asset or liability in a transaction which is not a business combination and at the time of the transaction, affects neither accounting profit nor taxable profit. Deferred tax assets are recognized for all deductible temporary differences to the extent that it is probable that taxable profit will be available against which the deductible temporary differences can be utilized, unless the deferred tax assets arise from the initial recognition of an asset or liability in a transaction that is not a business combination and at the time of the transaction, affects neither accounting profit nor taxable profit.
Deferred tax assets and liabilities are measured at the substantively enacted tax rates in the respective jurisdictions in which the Group operates that are expected to apply to the period when the asset is realized or liability is settled. Any remeasurements to deferred tax assets and liabilities as a result of changes in substantially enacted tax rates are recognized in the income statement.
The recoverability of deferred tax assets is dependent on the Group’s ability to generate sufficient future taxable income in the period in which it is assumed that the deductible temporary differences reverse and tax losses carried forward can be utilized. In making this assessment, the Group considers future taxable income arising on the most recent budgets and plans, prepared by using the same criteria described for testing the impairment of assets and goodwill, moreover, it estimates the impact of the reversal of taxable temporary differences on earnings and it also considers the period over which these assets could be recovered. The carrying amount of deferred tax assets is reduced to the extent that it is not probable that sufficient taxable profit will be available to allow the benefit of part or all of the deferred tax assets to be utilized.
The Group recognizes deferred tax liabilities associated with the existence of a subsidiary’s undistributed profits, except when it is able to control the timing of the reversal of the temporary difference; and it is probable that this temporary difference will not reverse in the foreseeable future. The Group recognizes deferred tax assets associated with the deductible temporary differences on investments in subsidiaries only to the extent that it is probable that the temporary differences will reverse in the foreseeable future and taxable profit will be available against which the temporary difference can be utilized.
Deferred tax assets relating to the carry-forward of unused tax losses and tax credits, as well as those arising from deductible temporary differences, are recognized to the extent that it is probable that future profits will be available against which they can be utilized.
Current income taxes and deferred taxes are offset when they relate to the same taxation authority and there is a legally enforceable right of offset.
Italian Regional Income Tax (“IRAP”) is recognized within income tax expense. IRAP is calculated on a measure of income defined by the Italian Civil Code as the difference between operating revenues and costs, before financial income and expense, and in particular before the cost of fixed-term employees, credit losses and any interest included in lease payments. IRAP is applied on the tax base at
3.9 percent
for the years ended December 31,
2017
,
2016
and
2015
.
Other taxes not based on income, such as property taxes and capital taxes, are included in other expenses/(income), net.
Dividends
Dividends payable by the Group are reported as a change in equity in the period in which they are approved by shareholders or the Board of Directors as applicable under local rules and regulations.
Rounding of amounts
All amounts disclosed in the financial statements and notes have been rounded off to the nearest thousand Euro unless otherwise stated.
F-21
Ferrari N.V.
NOTES TO THE CONSOLIDATED FINANCIAL STATEMENTS
at December 31, 2017 and 2016
3. SCOPE OF CONSOLIDATION
Ferrari N.V. is the parent company of the Group and it holds, directly and indirectly, interests in the Group’s main operating companies. The Group’s scope of consolidation at December 31,
2017
and
2016
was as follows:
|
At December 31, 2017
|
At December 31, 2016
|
|||||||||||||||
|
Name
|
Country
|
Nature of business
|
Shares held by the Group
|
Shares held by NCI
|
Shares held by the Group
|
Shares held by NCI
|
||||||||||
|
Directly held interests
|
||||||||||||||||
|
Ferrari S.p.A.
|
Italy
|
Manufacturing
|
100
|
%
|
—
|
%
|
100
|
%
|
—
|
%
|
||||||
|
Indirectly held through Ferrari S.p.A.
|
||||||||||||||||
|
Ferrari North America Inc.
|
USA
|
Importer and distributor
|
100
|
%
|
—
|
%
|
100
|
%
|
—
|
%
|
||||||
|
Ferrari Japan KK
|
Japan
|
Importer and distributor
|
100
|
%
|
—
|
%
|
100
|
%
|
—
|
%
|
||||||
|
Ferrari Australasia Pty Limited
|
Australia
|
Importer and distributor
|
100
|
%
|
—
|
%
|
100
|
%
|
—
|
%
|
||||||
|
Ferrari (HK) Limited
|
Hong Kong
|
Importer and distributor
|
100
|
%
|
—
|
%
|
100
|
%
|
—
|
%
|
||||||
|
Ferrari International Cars Trading (Shanghai) Co. L.t.d.
|
China
|
Importer and distributor
|
80
|
%
|
20
|
%
|
80
|
%
|
20
|
%
|
||||||
|
Ferrari Far East Pte Limited
|
Singapore
|
Service company
|
100
|
%
|
—
|
%
|
100
|
%
|
—
|
%
|
||||||
|
Ferrari Management Consulting (Shanghai) Co. L.t.d.
|
China
|
Service company
|
100
|
%
|
—
|
%
|
100
|
%
|
—
|
%
|
||||||
|
Ferrari South West Europe S.a.r.l.
|
France
|
Service company
|
100
|
%
|
—
|
%
|
100
|
%
|
—
|
%
|
||||||
|
Ferrari Central East Europe GmbH
|
Germany
|
Service company
|
100
|
%
|
—
|
%
|
100
|
%
|
—
|
%
|
||||||
|
G.S.A. S.A.
|
Switzerland
|
Service company
|
100
|
%
|
—
|
%
|
100
|
%
|
—
|
%
|
||||||
|
Ferrari North Europe Limited
(1)
|
UK
|
Service company
|
n.a.
|
|
n.a.
|
|
100
|
%
|
—
|
%
|
||||||
|
Mugello Circuit S.p.A.
|
Italy
|
Racetrack management
|
100
|
%
|
—
|
%
|
100
|
%
|
—
|
%
|
||||||
|
Ferrari Financial Services S.p.A.
|
Italy
|
Financial services
|
100
|
%
|
—
|
%
|
100
|
%
|
—
|
%
|
||||||
|
Indirectly held through other Group entities
|
||||||||||||||||
|
Ferrari Financial Services Inc.
(2)
|
USA
|
Financial services
|
100
|
%
|
—
|
%
|
100
|
%
|
—
|
%
|
||||||
|
Ferrari Auto Securitization Transaction, LLC
(3)
|
USA
|
Financial services
|
100
|
%
|
—
|
%
|
100
|
%
|
—
|
%
|
||||||
|
Ferrari Auto Securitization Transaction - Lease, LLC
(3)
|
USA
|
Financial services
|
100
|
%
|
—
|
%
|
100
|
%
|
—
|
%
|
||||||
|
Ferrari Auto Securitization Transaction - Select, LLC
(3)
|
USA
|
Financial services
|
100
|
%
|
—
|
%
|
100
|
%
|
—
|
%
|
||||||
|
Ferrari Financial Services Titling Trust
(3)
|
USA
|
Financial services
|
100
|
%
|
—
|
%
|
100
|
%
|
—
|
%
|
||||||
|
410, Park Display Inc.
(4)
|
USA
|
Retail
|
100
|
%
|
—
|
%
|
100
|
%
|
—
|
|
||||||
|
(1)
|
On June 30, 2017, the liquidation process of Ferrari North Europe Limited was completed
|
|
(2)
|
Shareholding held by Ferrari Financial Services S.p.A.
|
|
(3)
|
Shareholding held by Ferrari Financial Services Inc. (“FFS Inc”).
|
|
(4)
|
Shareholding held by Ferrari North America Inc.
|
On April 30, 2016, the liquidation process of Ferrari Financial Services Japan KK was completed. At
December 31, 2015
Ferrari Financial Services Japan KK was a wholly owned subsidiary.
Ferrari Financial Services GmbH (“FFS GmbH”) was a subsidiary of the Group until November 7, 2016 when the Group sold a majority stake in FFS GmbH to FCA bank. Upon completion of the transaction, FFS GmbH was deconsolidated and the
49.9 percent
interest in FFS GmbH retained by the Group was accounted for using the equity method. See Note 17.
As permitted by IFRS, certain subsidiaries (mainly dormant companies or entities with insignificant operations) are excluded from consolidation on a line-by-line basis and are accounted for at cost. Their aggregate assets and revenues represent
F-22
Ferrari N.V.
NOTES TO THE CONSOLIDATED FINANCIAL STATEMENTS
at December 31, 2017 and 2016
less than 1 percent of the Group’s respective amounts for each period and at each date presented by these Consolidated Financial Statements.
Non-controlling interests
The non-controlling interests at
December 31, 2017
and
2016
relate to Ferrari International Cars Trading (Shanghai) Co. L.t.d. (“FICTS”), in which the Group holds an
80 percent
interest. The net profit attributable to non-controlling interests for the years ended
December 31, 2017
,
2016
and
2015
relates to the non-controlling interest in FICTS and for the year ended
December 31, 2015
also the non-controlling interest in Ferrari Financial Services S.p.A.:
|
At December 31,
|
|||||
|
2017
|
2016
|
||||
|
(€ thousand)
|
|||||
|
Equity attributable to non-controlling interests - FICTS
|
5,258
|
|
4,810
|
|
|
|
For the years ended December 31,
|
||||||||
|
2017
|
2016
|
2015
|
||||||
|
(€ thousand)
|
||||||||
|
Net profit attributable to non-controlling interests
|
2,003
|
|
956
|
|
2,238
|
|
||
|
Of which attributable to FICTS
|
2,003
|
|
956
|
|
1,351
|
|
||
|
Of which attributable to Ferrari Financial Services S.p.A.
|
—
|
|
—
|
|
887
|
|
||
In July 2015 the Group acquired the remaining
10 percent
of non-controlling interest of its subsidiary Ferrari Financial Services S.p.A. from Aldasa GmbH, and as a result from such date the Group owns
100 percent
of the share capital of Ferrari Financial Services S.p.A.
The non-controlling interests in FICTS and Ferrari Financial Services S.p.A. are not considered to be significant to the Group for the relevant periods.
Restrictions
The Group may be subject to restrictions which limit its ability to use cash in relation to its interest in FICTS. In particular, cash held in China is subject to certain repatriation restrictions (and may only be repatriated as dividends). Based on the Group’s review, it does not believe that such transfer restrictions have any adverse impacts on its ability to meet liquidity requirements. Cash held in China at
December 31, 2017
amounted to
€66,456 thousand
(
€47,555 thousand
at
December 31, 2016
).
Cash collected from the settlement of receivables or lines of credit pledged as collateral is subject to certain restrictions regarding its use and is principally applied to repay principal and interest of the funding. Such cash amounted to
€28,230 thousand
at
December 31, 2017
(
€19,411 thousand
at
December 31, 2016
).
Segment reporting
The Group has determined that it has
one
operating and
one
reportable segment based on the information reviewed by its CODM in making decisions regarding allocation of resources and to assess performance.
Use of estimates
The Consolidated Financial Statements are prepared in accordance with IFRS which require the use of estimates, judgments and assumptions that affect the carrying amount of assets and liabilities, the disclosure of contingent assets and liabilities and the amounts of income and expenses recognized. The estimates and associated assumptions are based on elements that are known when the financial statements are prepared, on historical experience and on any other factors that are considered to be relevant.
F-23
Ferrari N.V.
NOTES TO THE CONSOLIDATED FINANCIAL STATEMENTS
at December 31, 2017 and 2016
The estimates and underlying assumptions are reviewed periodically and continuously by the Group. If the items subject to estimates do not perform as assumed, then the actual results could differ from the estimates, which would require adjustment accordingly. The effects of any changes in estimate are recognized in the consolidated income statement in the period in which the adjustment is made, or prospectively in future periods.
The items requiring estimates for which there is a risk that a material difference may arise in respect of the carrying amounts of assets and liabilities in the future are discussed below.
Recoverability of non-current assets with definite useful lives
Non-current assets with definite useful lives include property, plant and equipment and intangible assets. Intangible assets with definite useful lives mainly consist of capitalized development costs.
The Group periodically reviews the carrying amount of non-current assets with definite useful lives when events and circumstances indicate that an asset may be impaired. Impairment tests are performed by comparing the carrying amount and the recoverable amount of the cash-generating unit (“CGU”). The recoverable amount is the higher of the CGU’s fair value less costs of disposal and its value in use. In assessing the value in use, the estimated future cash flows are discounted to their present value using a pre-tax discount rate that reflects current market assessments of the time value of money and the risks specific to the CGU.
For the period covered by these Consolidated Financial Statements, the Group has not recognized any impairment charges for non-current assets with definite useful lives.
Recoverability of goodwill
The Group’s goodwill at December 31, 2017 amounted to
€785,182 thousand
and primarily relates to the Separation, as a result of which the Company recorded goodwill of
€780,542 thousand
reflecting FCA’s recorded goodwill relating to Ferrari S.p.A. In accordance with
IAS 36 - Impairment of Assets
, goodwill is not amortized and is tested for impairment annually or more frequently if facts or circumstances indicate that the asset may be impaired.
As the Group is composed of
one
operating segment, goodwill is tested at the Group level, which represents the lowest level within the Group at which goodwill is monitored for internal management purposes in accordance with IAS 36. The impairment test is performed by comparing the carrying amount (which mainly comprises property, plant and equipment, goodwill and capitalized development costs) and the recoverable amount of the CGU. The recoverable amount of the CGU is the higher of its fair value less costs of disposal and its value in use.
Development costs
Development costs are capitalized if the conditions under
IAS 38 - Intangible Assets
have been met. The starting point for capitalization is based upon the technological and commercial feasibility of the project, which is usually when a product development project has reached a defined milestone according to the Group’s established product development model. Feasibility is based on management’s judgment which is formed on the basis of estimated future cash flows. Capitalization ceases and amortization of capitalized development costs begins on start of production of the relevant project.
The amortization of development costs requires management to estimate the lifecycle of the related model. Any changes in such assumptions would impact the amortization charge recorded and the carrying amount of capitalized development costs. The periodic amortization charge is derived after determining the expected lifecycle of the related model and, if applicable any expected residual value at the end of its life. Increasing an asset’s expected lifecycle or its residual value would result in a reduced amortization charge in the consolidated income statement.
The useful lives and residual values of the Group’s models are determined by management at the time of capitalization and reviewed annually for appropriateness and recoverability. The lives are based on historical experience with similar assets as well as anticipation of future events which may impact their life such as changes in technology. Historically changes in useful lives and residual values have not resulted in material changes to the Group’s amortization charge or estimated recoverability of the related assets.
F-24
Ferrari N.V.
NOTES TO THE CONSOLIDATED FINANCIAL STATEMENTS
at December 31, 2017 and 2016
For the year ended
December 31, 2017
, the Group capitalized development costs of
€185,115 thousand
(
€141,396 thousand
for the year ended
December 31, 2016
).
Product warranties liabilities
The Group establishes reserves for product warranties at the time the sale is recognized. The Group issues various types of product warranties under which the performance of products delivered is generally guaranteed for a certain period or term, which is generally defined by the legislation in the country where the car is sold. The reserve for product warranties includes the expected costs of warranty obligations imposed by law or contract, as well as the expected costs for policy coverage. The estimated future costs of these actions are principally based on assumptions regarding the lifetime warranty costs of each car line and each model year of that car line, as well as historical claims experience for the Group’s cars. In addition, the number and magnitude of additional service actions expected to be approved, and policies related to additional service actions, are taken into consideration. Due to the uncertainty and potential volatility of these estimated factors, changes in the assumptions used could materially affect the results of operations.
The Group periodically initiates voluntary service actions to address various client satisfaction, safety and emissions issues related to cars sold. Included in the reserve is the estimated cost of these services and recall actions. The estimated future costs of these actions are based primarily on historical claims experience for the Group’s cars and the cost of parts and services to be incurred in the specified activities, and are recognized at the time when they are probable and reasonably estimable. Estimates of the future costs of these actions are inevitably imprecise due to several uncertainties, including the number of cars affected by a service or recall action. It is reasonably possible that the ultimate cost of these service and recall actions may require the Group to make expenditures in excess of (or less than) established reserves over an extended period of time. The estimate of warranty and additional service obligations is periodically reviewed during the year.
In addition, the Group makes provisions for estimated product liability costs arising from property damage and personal injuries including wrongful death, and potential exemplary or punitive damages alleged to be the result of product defects. By nature, these costs can be infrequent, difficult to predict, and have the potential to vary significantly in amount. Costs associated with these provisions are recorded in the consolidated income statement and any subsequent adjustments are recorded in the period in which the adjustment is determined.
Share-based compensation
The Group accounts for its equity incentive plan in accordance with IFRS 2 -
Share-based Payment,
which requires the recognition of share-based compensation expense based on the fair value of the awards granted. Share-based compensation for equity-settled awards containing market performance conditions is measured at the grant date of the awards using the Monte Carlo simulation model, which requires the input of subjective assumptions, including the expected volatility of our common stock, the dividend yield, interest rates and the correlation coefficient between our common stock and the relevant market index. The probability that the Group will achieve a certain level of Total Shareholder Return performance compared to the defined peer group is also considered. As a result, at the grant date management is required to make key assumptions and estimates regarding conditions that will occur in the future, which inherently involves uncertainty. Therefore, the amount of share-based compensation recognized has been effected by the significant assumptions and estimates used.
Other contingent liabilities
The Group makes provisions in connection with pending or threatened disputes or legal proceedings when it is considered probable that there will be an outflow of funds and when the amount can be reasonably estimated. If an outflow of funds becomes possible but the amount cannot be estimated, the matter is disclosed in the notes to the Consolidated Financial Statements. The Group is the subject of legal and tax proceedings covering a wide range of matters in various jurisdictions. Due to the uncertainty inherent in such matters, it is difficult to predict the outflow of funds that could result from such disputes with any certainty. Moreover, the cases and claims against the Group often derive from complex legal issues which are subject to a differing degree of uncertainty, including the facts and circumstances of each particular case and the manner in which applicable law is likely to be interpreted and applied to such fact and circumstances, and the jurisdiction and the different laws involved. The Group monitors the status of pending legal proceedings and consults with experts on legal and tax matters on a regular basis. It is therefore possible that the provisions for the Group’s legal proceedings and litigation may vary as the result of future developments in pending matters.
F-25
Ferrari N.V.
NOTES TO THE CONSOLIDATED FINANCIAL STATEMENTS
at December 31, 2017 and 2016
Litigation
Various legal proceedings, claims and governmental investigations are pending against the Group on a wide range of topics, including car safety, emissions and fuel economy, early warning reporting, dealer, supplier and other contractual relationships, intellectual property rights and product warranties matters. Some of these proceedings allege defects in specific component parts or systems (including airbags, seatbelts, brakes, transmissions, engines and fuel systems) in various car models or allege general design defects relating to car handling and stability, sudden unintended movement or crashworthiness. These proceedings seek recovery for damage to property, personal injuries or wrongful death and in some cases could include a claim for exemplary or punitive damages. Adverse decisions in one or more of these proceedings could require the Group to pay substantial damages, or undertake service actions, recall campaigns or other costly actions.
Litigation is subject to many uncertainties, and the outcome of individual matters is not predictable with assurance. An accrual is established in connection with pending or threatened litigation if a loss is probable and a reliable estimate can be made. Since these accruals represent estimates, it is reasonably possible that the resolution of some of these matters could require the Group to make payments in excess of the amounts accrued. It is also reasonably possible that the resolution of some of the matters for which accruals could not be made may require the Group to make payments in an amount or range of amounts that could not be reasonably estimated.
The term “reasonably possible” is used herein to mean that the chance of a future transaction or event occurring is more than remote but less than probable. Although the final resolution of any such matters could have a material effect on the Group’s operating results for the particular reporting period in which an adjustment of the estimated reserve is recorded, it is believed that any resulting adjustment would not materially affect the consolidated financial position of the Group.
F-26
Ferrari N.V.
NOTES TO THE CONSOLIDATED FINANCIAL STATEMENTS
at December 31, 2017 and 2016
4. NET REVENUES
Net revenues are as follows:
|
For the years ended December 31,
|
||||||||
|
2017
|
2016
|
2015
|
||||||
|
(€ thousand)
|
||||||||
|
Cars and spare parts
|
2,455,955
|
|
2,180,045
|
|
2,080,228
|
|
||
|
Engines
|
373,313
|
|
337,924
|
|
218,657
|
|
||
|
Sponsorship, commercial and brand
|
494,082
|
|
488,514
|
|
441,128
|
|
||
|
Other
|
93,540
|
|
98,601
|
|
114,356
|
|
||
|
Total net revenues
|
3,416,890
|
|
3,105,084
|
|
2,854,369
|
|
||
Other net revenues primarily include interest income generated by financial service activities and net revenues from the management of the Mugello racetrack.
5. COST OF SALES
Cost of sales in
2017
,
2016
and
2015
amounted to
€1,650,860 thousand
,
€1,579,690 thousand
and
€1,498,806 thousand
, respectively, comprising mainly of expenses incurred in the manufacturing and distribution of cars and spare parts, including the engines sold to Maserati and engines rented to other Formula 1 racing teams, of which the cost of materials, components and labor are the most significant elements. The remaining costs principally include depreciation, amortization, insurance and transportation costs. Cost of sales also includes warranty and product-related costs, which are estimated and recorded at the time of shipment of the car.
Cost of sales in
2016
included
€36,994 thousand
related to the charges for Takata airbag inflator recalls. See Note 24
“Provisions”
for additional details.
Interest and other financial expenses from financial services companies included within cost of sales in
2017
,
2016
and
2015
amounted to
€30,945 thousand
,
€21,307 thousand
and
€23,702 thousand
, respectively.
6. SELLING, GENERAL AND ADMINISTRATIVE COSTS
General and administrative costs in
2017
,
2016
and
2015
amounted to
€155,581 thousand
,
€148,812 thousand
and
€174,451 thousand
, respectively, and mainly consist of administration expenses and other general expenses that are not directly attributable to sales, manufacturing or research and development functions.
In
2015
, general and administrative costs include
€15,789 thousand
in costs related to the initial public offering process and
€19,106 thousand
related to the one off extra bonus paid to employees for the initial public offering.
Selling costs in
2017
,
2016
and
2015
amounted to
€173,484 thousand
,
€146,430 thousand
and
€164,175 thousand
, respectively, and mainly consist of costs for marketing and events, sales personnel, and retail stores. Marketing and events expenses consist primarily of costs in connection with trade and auto shows, media and client events for the launch of new models as well as sponsorship and indirect marketing costs incurred through the Formula 1 racing team, Scuderia Ferrari.
F-27
Ferrari N.V.
NOTES TO THE CONSOLIDATED FINANCIAL STATEMENTS
at December 31, 2017 and 2016
7. RESEARCH AND DEVELOPMENT COSTS
Research and development costs are as follows:
|
For the years ended December 31,
|
||||||||
|
2017
|
2016
|
2015
|
||||||
|
(€ thousand)
|
||||||||
|
Research and development costs expensed during the year
|
556,617
|
|
509,580
|
|
446,726
|
|
||
|
Amortization of capitalized development costs
|
100,502
|
|
104,055
|
|
114,856
|
|
||
|
Total research and development costs
|
657,119
|
|
613,635
|
|
561,582
|
|
||
The main component of research and development costs expensed during the period relate to research and development expenses to support the innovation of our product range and components, in particular, in relation to hybrid technology and Formula 1 developments. Research and development costs also include amortization of capitalized development costs.
In
2016
, the U.S. National Highway Traffic Safety Administration (“NHTSA”) published new Visual-Manual Driver
Distraction Phase II draft guidelines. These guidelines focus, among other things, on the need to modify the design of car devices and other driver interfaces to minimize driver distraction. The Group is evaluating these guidelines and their potential impact on the Group’s results of operations and financial position and determining what steps and/or countermeasures, if any, the Group will need to make.
8. OTHER EXPENSES, NET
Other expenses, net are as follows:
|
For the years ended December 31,
|
||||||||
|
2017
|
2016
|
2015
|
||||||
|
(€ thousand)
|
||||||||
|
Other expenses
|
11,830
|
|
30,249
|
|
33,137
|
|
||
|
Other income
|
(4,963
|
)
|
(5,748
|
)
|
(22,102
|
)
|
||
|
Other expenses, net
|
6,867
|
|
24,501
|
|
11,035
|
|
||
Other expenses in
2017
include
€5,593 thousand
related to indirect taxes and
€6,237 thousand
related to miscellaneous expenses.
Other income in
2017
includes
€2,585 thousand
of gain on the disposal of property plant and equipment,
€1,747 thousand
related to rental income and
€631 thousand
related to miscellaneous income.
Other expenses in
2016
include
€15,469 thousand
related to provisions, primarily related to disputes with a distributor,
€5,628 thousand
related to indirect taxes and
€9,152 thousand
related to miscellaneous expenses.
Other income in
2016
includes
€2,903 thousand
of gain on the disposal of property plant and equipment,
€1,569 thousand
related to rental income and
€1,276 thousand
related to miscellaneous income.
Other expenses in
2015
include
€12,933 thousand
related to provisions, of which
€8,822 thousand
related to legal proceedings and disputes and
€4,111 thousand
primarily related to disputes with suppliers, employees and other parties relating to contracts. The most significant accruals to the provision for legal proceedings and disputes recognized in
2015
relate to litigation with a former distributor.
Other income in
2015
includes
€5,802 thousand
for the gain on the sale of a group of assets related to the investment properties in Modena, Italy, which the Group sold to the tenant, Maserati S.p.A., an FCA Group company. The total sale price (as determined by an independent valuation) amounted to
€37,130 thousand
and was received in the third quarter of
2015
. At the transaction date the net book value of the assets and liabilities disposed of was
€31,328 thousand
.
F-28
Ferrari N.V.
NOTES TO THE CONSOLIDATED FINANCIAL STATEMENTS
at December 31, 2017 and 2016
9. RESULT FROM INVESTMENTS
Result from investments of
€2,437 thousand
in
2017
related to the Group’s proportionate share of FFS GmbH’s net profit.
Result from investments of
€3,066 thousand
in 2016 includes
€660 thousand
related to the gain on the sale of a majority stake in FFS GmbH to FCA Bank on
November 7, 2016
,
€1,489 thousand
related to the gain on the fair value measurement of the non-controlling interest retained in FFS GmbH and
€917 thousand
related to the Group’s proportionate share of FFS GmbH’s net profit for the period from November 7, 2016 to
December 31, 2016
. See Note 17 for additional details.
F-29
Ferrari N.V.
NOTES TO THE CONSOLIDATED FINANCIAL STATEMENTS
at December 31, 2017 and 2016
10. NET FINANCIAL EXPENSES
The following table sets out details of financial income and expenses, including the amounts reported in the consolidated income statement within the net financial expenses line item, as well as interest income from financial services activities, recognized under net revenues, and interest expenses and other financial charges from financial services activities, recognized under cost of sales.
|
For the years ended December 31,
|
||||||||
|
2017
|
2016
|
2015
|
||||||
|
Financial income:
|
(€ thousand)
|
|||||||
|
Interest income from bank deposits
|
1,153
|
|
843
|
|
54
|
|
||
|
Other interest income and financial income
|
5,284
|
|
1,841
|
|
6,473
|
|
||
|
Interest income and other financial income
|
6,437
|
|
2,684
|
|
6,527
|
|
||
|
Finance income from financial services companies
|
50,254
|
|
58,236
|
|
61,587
|
|
||
|
Total financial income
|
56,691
|
|
60,920
|
|
68,114
|
|
||
|
|
|
|
|
|
|
|
||
|
Total financial income relating to:
|
|
|
|
|
|
|
||
|
Industrial companies (A)
|
6,437
|
|
2,684
|
|
6,527
|
|
||
|
Financial services companies (reported in net revenues)
|
50,254
|
|
58,236
|
|
61,587
|
|
||
|
|
|
|
|
|
||||
|
Financial expenses:
|
|
|
|
|
|
|
||
|
Interest expenses on financial liabilities with FCA Group
|
—
|
|
—
|
|
(15,745
|
)
|
||
|
Capitalized borrowing costs
|
1,578
|
|
1,519
|
|
1,530
|
|
||
|
Other interest cost and financial expenses
|
(3,775
|
)
|
(4,090
|
)
|
(3,163
|
)
|
||
|
Interest expenses and other financial expenses
|
(2,197
|
)
|
(2,571
|
)
|
(17,378
|
)
|
||
|
Interest expenses from banks
|
(23,057
|
)
|
(27,042
|
)
|
(3,357
|
)
|
||
|
Interest on bonds
|
(9,231
|
)
|
(6,937
|
)
|
—
|
|
||
|
Write-downs of financial receivables
|
(3,530
|
)
|
(3,864
|
)
|
(9,607
|
)
|
||
|
Net interest expenses on employee benefits provisions
|
—
|
|
(389
|
)
|
(79
|
)
|
||
|
Other financial expenses
|
(12,008
|
)
|
(5,831
|
)
|
(5,029
|
)
|
||
|
Total financial expenses
|
(50,023
|
)
|
(46,634
|
)
|
(35,450
|
)
|
||
|
Net expenses from derivative financial instruments and foreign currency exchange rate differences
|
(16,619
|
)
|
(5,086
|
)
|
(4,930
|
)
|
||
|
Total financial expenses and net expenses from derivative financial instruments and foreign currency exchange rate differences
|
(66,642
|
)
|
(51,720
|
)
|
(40,380
|
)
|
||
|
|
|
|
|
|
|
|
||
|
Total financial expenses and net expenses from derivative financial instruments and foreign currency exchange rate differences relating to:
|
|
|
|
|
|
|
||
|
Industrial companies (B)
|
(35,697
|
)
|
(30,413
|
)
|
(16,678
|
)
|
||
|
Financial services companies (reported in cost of sales)
|
(30,945
|
)
|
(21,307
|
)
|
(23,702
|
)
|
||
|
Net financial expenses relating to industrial companies (A+B)
|
(29,260
|
)
|
(27,729
|
)
|
(10,151
|
)
|
||
Interest expenses from banks for the year ended
December 31, 2017
and 2016 includes interest expenses on the Term Loan, which was fully repaid in November 2017, and for the year ended December 31,
2016
also includes interest expenses on the Bridge Loan, which was fully repaid in
March 2016
. Interest expenses from banks for all years presented also includes interest expenses related to financial services activities, which are reported within cost of sales, as well as interest expenses on other bank borrowings.
Interest on bonds includes interest expenses on the bonds issued in November 2017 (“2021 Bond”) and
March 2016
(“2023 Bond”). See Note 25 “Debt” for additional details.
F-30
Ferrari N.V.
NOTES TO THE CONSOLIDATED FINANCIAL STATEMENTS
at December 31, 2017 and 2016
Financial income for the year ended December 31, 2017 includes amounts recognized in relation to the Delta Topco option and a gain on the fair value measurement of the Series C Liberty Formula One shares (“Liberty Shares”) subsequent to initial recognition at cost.
Interest expenses on financial liabilities with FCA Group for the year ended
December 31, 2015
included
€9,333 thousand
related to the FCA Note.
11. INCOME TAXES
Income tax expense is as follows:
|
For the years ended December 31,
|
||||||||
|
2017
|
2016
|
2015
|
||||||
|
(€ thousand)
|
||||||||
|
Current tax expense
|
201,274
|
|
189,492
|
|
153,739
|
|
||
|
Deferred tax expense/(income)
|
8,718
|
|
(18,290
|
)
|
(9,410
|
)
|
||
|
Taxes relating to prior periods
|
(1,232
|
)
|
(3,567
|
)
|
(214
|
)
|
||
|
Total income tax expense
|
208,760
|
|
167,635
|
|
144,115
|
|
||
The reconciliation between actual income tax expense and the theoretical income tax expense, calculated on the basis of the theoretical tax rates in effect in Italy, is as follows:
|
For the years ended December 31,
|
||||||||
|
2017
|
2016
|
2015
|
||||||
|
(€ thousand)
|
||||||||
|
Theoretical income tax expense, net of IRAP
|
179,077
|
|
156,022
|
|
119,396
|
|
||
|
Tax effect on:
|
||||||||
|
Permanent differences
|
(7,061
|
)
|
(10,219
|
)
|
5,846
|
|
||
|
Effect of changes in tax rate and tax regulations
|
4,862
|
|
1,280
|
|
4,005
|
|
||
|
Differences between foreign tax rates and the theoretical Italian tax rate and tax holidays
|
2,344
|
|
853
|
|
1,631
|
|
||
|
Taxes relating to prior years
|
(1,232
|
)
|
(3,567
|
)
|
(214
|
)
|
||
|
Withholding tax on earnings
|
2,420
|
|
2,017
|
|
(384
|
)
|
||
|
Total income tax expense, net of IRAP
|
180,410
|
|
146,386
|
|
130,280
|
|
||
|
Effective tax rate, net of IRAP
|
24.2
|
%
|
25.8
|
%
|
30.0
|
%
|
||
|
IRAP (current and deferred)
|
28,350
|
|
21,249
|
|
13,835
|
|
||
|
Total income tax expense
|
208,760
|
|
167,635
|
|
144,115
|
|
||
Theoretical income taxes have been calculated at the corporate income tax rate in Italy for the respective years, which was
24.0 percent
for the year ended
December 31, 2017
and
27.5 percent
for the years ended
December 31, 2016
and
2015
. During
2015
a change in Italian tax law approved a reduction in the corporate income tax rate from
27.5 percent
to
24.0 percent
, effective from
2017
.
In order to facilitate the understanding of the tax rate reconciliation presented above, income tax expense has been presented net of Italian Regional Income Tax (“IRAP”). IRAP is calculated on a measure of income defined by the Italian Civil Code as the difference between operating revenues and costs, before financial income and expense, and in particular before the cost of fixed-term employees, credit losses and any interest included in lease payments. IRAP is applied on the tax base at
3.9 percent
for each of the years ended December 31,
2017
,
2016
and
2015
.
F-31
Ferrari N.V.
NOTES TO THE CONSOLIDATED FINANCIAL STATEMENTS
at December 31, 2017 and 2016
The decrease in the effective tax rate net of IRAP from
25.8 percent
in 2016 to
24.2
percent in 2017 was primarily attributable to the combined effects of a reduction in the Italian corporate income tax rate from
27.5 percent
to
24.0 percent
(effective from 2017), deductions related to eligible research and development costs and depreciation of fixed assets in accordance with tax regulations in Italy, partially offset by a decrease in net deferred tax assets due to the Tax Cuts and Jobs Act that was enacted into law in the U.S.
The Tax Cuts and Jobs Act (the “Tax Act”) was enacted into law in the U.S. on December 22, 2017. The Tax Act includes various changes to the tax law, including a reduction in the corporate income tax rate from
35%
to
21%
effective January 1, 2018. The Group recognized the effects of the changes in the tax rate and laws resulting from the Tax Act in 2017, which resulted in a
€4,646 thousand
decrease in net deferred tax assets, recorded through the income statement, related to adjusting deferred tax assets and liabilities to reflect the new corporate tax rate. The accounting for the effects of the rate change on deferred tax balances is complete and no provisional amounts were recorded for this item.
The decrease in the effective tax rate net of IRAP from
30.0 percent
in
2015
to
25.8 percent
in
2016
was primarily attributable to the combined effects of the previously mentioned adjustments to deferred taxes due to the reduction in the Italian corporate income tax rate and additional tax deductions in
2016
on eligible research and development costs and on investments and other expenses, in accordance with changes in tax regulations in Italy.
The analysis of deferred tax assets and deferred tax liabilities at December 31,
2017
and
2016
, is as follows:
|
At December 31,
|
|||||
|
2017
|
2016
|
||||
|
(€ thousand)
|
|||||
|
Deferred tax assets:
|
|||||
|
To be recovered after 12 months
|
63,286
|
|
72,142
|
|
|
|
To be recovered within 12 months
|
30,805
|
|
47,215
|
|
|
|
94,091
|
|
119,357
|
|
||
|
Deferred tax liabilities:
|
|||||
|
To be realized after 12 months
|
(9,885
|
)
|
(10,517
|
)
|
|
|
To be realized within 12 months
|
(1,092
|
)
|
(2,594
|
)
|
|
|
(10,977
|
)
|
(13,111
|
)
|
||
|
Net deferred tax assets
|
83,114
|
|
106,246
|
|
|
F-32
Ferrari N.V.
NOTES TO THE CONSOLIDATED FINANCIAL STATEMENTS
at December 31, 2017 and 2016
The movements in deferred income tax assets and liabilities during the year, without taking into consideration the offsetting of balances within the same tax jurisdiction, are as follows:
|
At December 31, 2016
|
Recognized in consolidated income statement
|
Charged to equity
|
Translation
differences and other changes |
At December 31, 2017
|
||||||||||
|
(€ thousand)
|
||||||||||||||
|
Deferred tax assets arising on:
|
||||||||||||||
|
Provisions
|
111,321
|
|
(6,959
|
)
|
—
|
|
(2,119
|
)
|
102,243
|
|
||||
|
Deferred income
|
43,549
|
|
2,649
|
|
—
|
|
—
|
|
46,198
|
|
||||
|
Employee benefits
|
2,370
|
|
(11
|
)
|
203
|
|
—
|
|
2,562
|
|
||||
|
Cash flow hedge reserve
|
7,325
|
|
—
|
|
(9,757
|
)
|
—
|
|
(2,432
|
)
|
||||
|
Foreign currency exchange rate differences
|
3,028
|
|
(2,288
|
)
|
—
|
|
—
|
|
740
|
|
||||
|
Inventory obsolescence
|
24,569
|
|
13,515
|
|
—
|
|
(469
|
)
|
37,615
|
|
||||
|
Allowances for doubtful accounts
|
4,107
|
|
(94
|
)
|
—
|
|
(14
|
)
|
3,999
|
|
||||
|
Depreciation
|
19,853
|
|
(3,283
|
)
|
—
|
|
—
|
|
16,570
|
|
||||
|
Other
|
13,833
|
|
2,007
|
|
—
|
|
(3,457
|
)
|
12,383
|
|
||||
|
Total deferred tax assets
|
229,955
|
|
5,536
|
|
(9,554
|
)
|
(6,059
|
)
|
219,878
|
|
||||
|
Deferred tax liabilities arising on:
|
||||||||||||||
|
Depreciation
|
(17,592
|
)
|
7,408
|
|
—
|
|
1,254
|
|
(8,930
|
)
|
||||
|
Capitalization of development costs
|
(90,480
|
)
|
(24,295
|
)
|
—
|
|
—
|
|
(114,775
|
)
|
||||
|
Employee benefits
|
(1,745
|
)
|
(123
|
)
|
—
|
|
—
|
|
(1,868
|
)
|
||||
|
Exchange rate differences
|
(3,547
|
)
|
2,900
|
|
—
|
|
—
|
|
(647
|
)
|
||||
|
Cash flow hedge reserve
|
(1
|
)
|
—
|
|
—
|
|
—
|
|
(1
|
)
|
||||
|
Lease accounting
|
(11,004
|
)
|
352
|
|
—
|
|
—
|
|
(10,652
|
)
|
||||
|
Withholding tax on undistributed earnings
|
(1,150
|
)
|
1,150
|
|
—
|
|
—
|
|
—
|
|
||||
|
Total deferred tax liabilities
|
(125,519
|
)
|
(12,608
|
)
|
—
|
|
1,254
|
|
(136,873
|
)
|
||||
|
Deferred tax asset arising on tax loss carry-forward
|
1,810
|
|
(1,646
|
)
|
—
|
|
(55
|
)
|
109
|
|
||||
|
Total net deferred tax assets
|
106,246
|
|
(8,718
|
)
|
(9,554
|
)
|
(4,860
|
)
|
83,114
|
|
||||
F-33
Ferrari N.V.
NOTES TO THE CONSOLIDATED FINANCIAL STATEMENTS
at December 31, 2017 and 2016
|
At December 31, 2015
|
Recognized in consolidated income statement
|
Charged
to equity |
Changes in the scope of consolidation
|
Translation
differences and other changes |
At December 31, 2016
|
||||||||||||
|
(€ thousand)
|
|||||||||||||||||
|
Deferred tax assets arising on:
|
|||||||||||||||||
|
Provisions
|
77,915
|
|
29,461
|
|
—
|
|
(78
|
)
|
4,023
|
|
111,321
|
|
|||||
|
Deferred income
|
39,318
|
|
4,231
|
|
—
|
|
—
|
|
—
|
|
43,549
|
|
|||||
|
Employee benefits
|
2,242
|
|
(54
|
)
|
(18
|
)
|
—
|
|
200
|
|
2,370
|
|
|||||
|
Cash flow hedge reserve
|
24,267
|
|
—
|
|
(16,943
|
)
|
—
|
|
1
|
|
7,325
|
|
|||||
|
Foreign currency exchange rate differences
|
343
|
|
2,685
|
|
—
|
|
—
|
|
—
|
|
3,028
|
|
|||||
|
Inventory obsolescence
|
25,075
|
|
(626
|
)
|
—
|
|
—
|
|
120
|
|
24,569
|
|
|||||
|
Allowances for doubtful accounts
|
3,633
|
|
485
|
|
—
|
|
—
|
|
(11
|
)
|
4,107
|
|
|||||
|
Depreciation
|
21,682
|
|
(1,783
|
)
|
—
|
|
—
|
|
(46
|
)
|
19,853
|
|
|||||
|
Other
|
10,838
|
|
(1,808
|
)
|
—
|
|
6,989
|
|
(2,186
|
)
|
13,833
|
|
|||||
|
Total deferred tax assets
|
205,313
|
|
32,591
|
|
(16,961
|
)
|
6,911
|
|
2,101
|
|
229,955
|
|
|||||
|
Deferred tax liabilities arising on:
|
|||||||||||||||||
|
Depreciation
|
(14,571
|
)
|
(2,591
|
)
|
—
|
|
—
|
|
(430
|
)
|
(17,592
|
)
|
|||||
|
Capitalization of development costs
|
(79,531
|
)
|
(10,949
|
)
|
—
|
|
—
|
|
—
|
|
(90,480
|
)
|
|||||
|
Employee benefits
|
(1,713
|
)
|
(32
|
)
|
—
|
|
—
|
|
—
|
|
(1,745
|
)
|
|||||
|
Exchange rate differences
|
(1,970
|
)
|
(1,577
|
)
|
—
|
|
—
|
|
—
|
|
(3,547
|
)
|
|||||
|
Cash flow hedge reserve
|
(1
|
)
|
—
|
|
—
|
|
—
|
|
—
|
|
(1
|
)
|
|||||
|
Lease accounting
|
(11,457
|
)
|
453
|
|
—
|
|
—
|
|
—
|
|
(11,004
|
)
|
|||||
|
Withholding tax on undistributed earnings
|
(1,150
|
)
|
—
|
|
—
|
|
—
|
|
—
|
|
(1,150
|
)
|
|||||
|
Total deferred tax liabilities
|
(110,393
|
)
|
(14,696
|
)
|
—
|
|
—
|
|
(430
|
)
|
(125,519
|
)
|
|||||
|
Deferred tax asset arising on tax loss carry-forward
|
4,357
|
|
395
|
|
—
|
|
(2,949
|
)
|
7
|
|
1,810
|
|
|||||
|
Total net deferred tax assets
|
99,277
|
|
18,290
|
|
(16,961
|
)
|
3,962
|
|
1,678
|
|
106,246
|
|
|||||
The decision to recognize deferred tax assets is made for each company in the Group by assessing whether the conditions exist for the future recoverability of such assets by taking into account the basis of the most recent forecasts from budgets and business plans.
Deferred taxes on the undistributed earnings of subsidiaries have not been recognized, except in cases where it is probable the distribution will occur in the foreseeable future.
Starting in 2016 following the completion of the Separation, the Group’s entities participate in a group Italian tax consolidation under Ferrari N.V. Previously, the Group participated in the FCA Group Italian tax consolidation.
12. OTHER INFORMATION BY NATURE
Personnel costs in
2017
,
2016
and
2015
amounted to
€305,584 thousand
,
€294,047 thousand
and
€284,947 thousand
, respectively. These amounts include costs that were capitalized mainly in connection to product development activities.
In
2017
,
2016
and
2015
the Group had an average number of employees of
3,336
,
3,115
and
2,954
, respectively.
13. EARNINGS PER SHARE
For the purpose of calculating earnings per share for the year ended
December 31, 2015
, the weighted average number of common shares outstanding retrospectively reflects the effects of the Separation.
F-34
Ferrari N.V.
NOTES TO THE CONSOLIDATED FINANCIAL STATEMENTS
at December 31, 2017 and 2016
Basic earnings per share
Basic earnings per share is calculated by dividing the profit attributable to equity holders of the Company by the weighted average number of common shares in issue. The following table provides the amounts used in the calculation of basic earnings per share for the years ended December 31,
2017
,
2016
and
2015
:
|
For the years ended December 31,
|
|||||||||
|
2017
|
2016
|
2015
|
|||||||
|
Profit attributable to owners of the Company
|
€ thousand
|
535,393
|
|
398,762
|
|
287,816
|
|
||
|
Weighted average number of common shares
|
thousand
|
188,951
|
|
188,923
|
|
188,923
|
|
||
|
Basic earnings per common share
|
€
|
2.83
|
|
2.11
|
|
1.52
|
|
||
Diluted earnings per share
For the year ended December 31, 2017 the weighted average number of common shares for diluted earnings per share was increased to take into consideration the theoretical effect of (i) the potential common shares that would be issued under the equity incentive plan (see Note 22 for additional details of the equity incentive plan) and (ii) the potential common shares that would have been issued for the Non-Executive Directors’ compensation agreement. For the year ended December 31, 2016 the weighted average number of common shares for diluted earnings per share was increased to take into consideration the theoretical effect of the potential common shares that would have been issued for the Non-Executive Directors’ compensation agreement. For the year ended
December 31, 2015
there were no potentially dilutive instruments.
The following table provides the amounts used in the calculation of diluted earnings per share for the years ended December 31,
2017
,
2016
and
2015
:
|
For the years ended December 31,
|
|||||||||
|
2017
|
2016
|
2015
|
|||||||
|
Profit attributable to owners of the Company
|
€ thousand
|
535,393
|
|
398,762
|
|
287,816
|
|
||
|
Weighted average number of common shares for diluted earnings per common share
|
thousand
|
189,759
|
|
188,946
|
|
188,923
|
|
||
|
Diluted earnings per common share
|
€
|
2.82
|
|
2.11
|
|
1.52
|
|
||
14. GOODWILL
At
December 31, 2017
and 2016 goodwill amounted to
€785,182 thousand
.
In accordance with IAS 36, goodwill is not amortized and is tested for impairment annually, or more frequently if facts or circumstances indicate that the asset may be impaired. Impairment testing is performed by comparing the carrying amount and the recoverable amount of the CGU. The recoverable amount of the CGU is the higher of its fair value less costs of disposal and its value in use.
The assumptions used in this process represent management’s best estimate for the period under consideration. The estimate of the value in use of the CGU for purposes of performing the annual impairment test was based on the following assumptions:
|
•
|
The expected future cash flows covering the period from
2018
through
2022
have been derived from the Ferrari business plan. In particular the estimate considers expected EBITDA adjusted to reflect the expected capital expenditure. These cash flows relate to the CGU in its condition when preparing the financial statements and exclude the estimated cash flows that might arise from restructuring plans or other structural changes. Volumes and sales mix used for estimating the future cash flows are based on assumptions that are considered reasonable and sustainable and represent the best estimate of expected conditions regarding market trends for the CGU over the period considered.
|
F-35
Ferrari N.V.
NOTES TO THE CONSOLIDATED FINANCIAL STATEMENTS
at December 31, 2017 and 2016
|
•
|
The expected future cash flows include a normalized terminal period used to estimate the future results beyond the time period explicitly considered, which were calculated by using the specific medium/long-term growth rate for the sector equal to
2.0 percent
in
2017
(
2.0 percent
in
2016
and
2.1 percent
in
2015
).
|
|
•
|
The expected future cash flows have been estimated in Euro, and discounted using a post-tax discount rate appropriate for that currency, determined by using a base WACC of
7.0 percent
in
2017
(
7.0 percent
in
2016
and
7.6 percent
in
2015
). The WACC used reflects the current market assessment of the time value of money for the period being considered and the risks specific to the CGU under consideration.
|
The recoverable amount of the CGU was significantly higher than its carrying amount. Furthermore, the exclusivity of the business, its historical profitability and its future earnings prospects indicate that the carrying amount of the goodwill will continue to be recoverable, even in the event of difficult economic and market conditions.
15. INTANGIBLE ASSETS
|
Externally
acquired development costs |
Development
costs internally generated |
Patents,
concessions and licenses |
Other
intangible assets |
Total
|
|||||||||||
|
(€ thousand)
|
|||||||||||||||
|
Gross carrying amount at
January 1, 2016 |
834,483
|
|
437,254
|
|
131,237
|
|
45,470
|
|
1,448,444
|
|
|||||
|
Additions
|
104,009
|
|
37,387
|
|
12,110
|
|
12,834
|
|
166,340
|
|
|||||
|
Reclassification
|
—
|
|
—
|
|
4,369
|
|
(4,369
|
)
|
—
|
|
|||||
|
Change in scope of consolidation
|
|
—
|
|
|
—
|
|
|
(3,458
|
)
|
|
—
|
|
|
(3,458
|
)
|
|
Translation differences
|
—
|
|
—
|
|
(66
|
)
|
(93
|
)
|
(159
|
)
|
|||||
|
Balance at December 31, 2016
|
938,492
|
|
474,641
|
|
144,192
|
|
53,842
|
|
1,611,167
|
|
|||||
|
Additions
|
142,795
|
|
42,320
|
|
12,416
|
|
4,975
|
|
202,506
|
|
|||||
|
Reclassification
|
—
|
|
—
|
|
12,289
|
|
(12,289
|
)
|
—
|
|
|||||
|
Translation differences
|
—
|
|
—
|
|
(1,011
|
)
|
(1,443
|
)
|
(2,454
|
)
|
|||||
|
Balance at December 31, 2017
|
1,081,287
|
|
516,961
|
|
167,886
|
|
45,085
|
|
1,811,219
|
|
|||||
|
Accumulated amortization at January 1, 2016
|
696,911
|
|
289,009
|
|
117,766
|
|
36,948
|
|
1,140,634
|
|
|||||
|
Amortization
|
77,240
|
|
26,815
|
|
11,628
|
|
2,419
|
|
118,102
|
|
|||||
|
Reclassification
|
|
—
|
|
|
—
|
|
|
3,317
|
|
|
(3,317
|
)
|
|
—
|
|
|
Change in scope of consolidation
|
|
—
|
|
|
—
|
|
|
(1,766
|
)
|
|
—
|
|
|
(1,766
|
)
|
|
Translation differences
|
—
|
|
—
|
|
(144
|
)
|
(53
|
)
|
(197
|
)
|
|||||
|
Balance at December 31, 2016
|
774,151
|
|
315,824
|
|
130,801
|
|
35,997
|
|
1,256,773
|
|
|||||
|
Amortization
|
72,978
|
|
27,524
|
|
14,312
|
|
2,308
|
|
117,122
|
|
|||||
|
Translation differences
|
—
|
|
—
|
|
(3,307
|
)
|
175
|
|
(3,132
|
)
|
|||||
|
Balance at December 31, 2017
|
847,129
|
|
343,348
|
|
141,806
|
|
38,480
|
|
1,370,763
|
|
|||||
|
Carrying amount at:
|
|||||||||||||||
|
January 1, 2016
|
137,572
|
|
148,245
|
|
13,471
|
|
8,522
|
|
307,810
|
|
|||||
|
December 31, 2016
|
164,341
|
|
158,817
|
|
13,391
|
|
17,845
|
|
354,394
|
|
|||||
|
December 31, 2017
|
234,158
|
|
173,613
|
|
26,080
|
|
6,605
|
|
440,456
|
|
|||||
Additions of
€202,506 thousand
in
2017
(
€166,340 thousand
in
2016
) primarily relate to externally acquired and internally generated costs for the development of new and existing models.
F-36
Ferrari N.V.
NOTES TO THE CONSOLIDATED FINANCIAL STATEMENTS
at December 31, 2017 and 2016
16. PROPERTY, PLANT AND EQUIPMENT
|
Land
|
Industrial
buildings |
Plant, machinery and equipment
|
Other
assets |
Advances and assets under construction
|
Total
|
||||||||||||
|
(€ thousand)
|
|||||||||||||||||
|
Gross carrying amount at
January 1, 2016 |
22,671
|
|
331,177
|
|
1,691,482
|
|
131,627
|
|
35,763
|
|
2,212,720
|
|
|||||
|
Additions
|
—
|
|
5,596
|
|
81,678
|
|
7,322
|
|
81,051
|
|
175,647
|
|
|||||
|
Divestitures
|
—
|
|
(1,021
|
)
|
(9,902
|
)
|
(7,631
|
)
|
—
|
|
(18,554
|
)
|
|||||
|
Reclassification
|
—
|
|
1,578
|
|
22,898
|
|
1,441
|
|
(28,341
|
)
|
(2,424
|
)
|
|||||
|
Change in scope of consolidation
|
—
|
|
|
—
|
|
|
—
|
|
|
(613
|
)
|
|
—
|
|
|
(613
|
)
|
|
Translation differences
|
10
|
|
173
|
|
—
|
|
476
|
|
—
|
|
659
|
|
|||||
|
Balance at December 31, 2016
|
22,681
|
|
337,503
|
|
1,786,156
|
|
132,622
|
|
88,473
|
|
2,367,435
|
|
|||||
|
Additions
|
892
|
|
4,691
|
|
131,981
|
|
11,855
|
|
39,485
|
|
188,904
|
|
|||||
|
Divestitures
|
—
|
|
(77
|
)
|
(31,877
|
)
|
(3,101
|
)
|
(368
|
)
|
(35,423
|
)
|
|||||
|
Reclassification
|
—
|
|
355
|
|
73,160
|
|
(2,685
|
)
|
(70,830
|
)
|
—
|
|
|||||
|
Translation differences
|
(36
|
)
|
(723
|
)
|
42
|
|
(1,700
|
)
|
—
|
|
(2,417
|
)
|
|||||
|
Balance at December 31, 2017
|
23,537
|
|
341,749
|
|
1,959,462
|
|
136,991
|
|
56,760
|
|
2,518,499
|
|
|||||
|
Accumulated amortization at January 1, 2016
|
—
|
|
123,099
|
|
1,364,471
|
|
99,020
|
|
—
|
|
1,586,590
|
|
|||||
|
Depreciation
|
—
|
|
9,995
|
|
109,939
|
|
9,681
|
|
—
|
|
129,615
|
|
|||||
|
Divestitures
|
—
|
|
(608
|
)
|
(11,628
|
)
|
(6,039
|
)
|
—
|
|
(18,275
|
)
|
|||||
|
Reclassification
|
—
|
|
|
177
|
|
|
(1,786
|
)
|
|
1,609
|
|
|
—
|
|
|
—
|
|
|
Change in scope of consolidation
|
—
|
|
|
—
|
|
|
—
|
|
|
(312
|
)
|
|
—
|
|
|
(312
|
)
|
|
Translation differences
|
—
|
|
159
|
|
(1
|
)
|
376
|
|
—
|
|
534
|
|
|||||
|
Balance at December 31, 2016
|
—
|
|
132,822
|
|
1,460,995
|
|
104,335
|
|
—
|
|
1,698,152
|
|
|||||
|
Depreciation
|
—
|
|
9,860
|
|
124,629
|
|
8,995
|
|
—
|
|
143,484
|
|
|||||
|
Divestitures
|
—
|
|
(69
|
)
|
(29,761
|
)
|
(2,469
|
)
|
—
|
|
(32,299
|
)
|
|||||
|
Translation differences
|
—
|
|
(353
|
)
|
(94
|
)
|
(651
|
)
|
—
|
|
(1,098
|
)
|
|||||
|
Balance at December 31, 2017
|
—
|
|
142,260
|
|
1,555,769
|
|
110,210
|
|
—
|
|
1,808,239
|
|
|||||
|
Carrying amount at:
|
|||||||||||||||||
|
January 1, 2016
|
22,671
|
|
208,078
|
|
327,011
|
|
32,607
|
|
35,763
|
|
626,130
|
|
|||||
|
December 31, 2016
|
22,681
|
|
204,681
|
|
325,161
|
|
28,287
|
|
88,473
|
|
669,283
|
|
|||||
|
December 31, 2017
|
23,537
|
|
199,489
|
|
403,693
|
|
26,781
|
|
56,760
|
|
710,260
|
|
|||||
Additions of
€188,904 thousand
in
2017
were mainly comprised of additions of
€131,981 thousand
to plant, machinery and equipment and additions of
€39,485 thousand
related to advances and assets under construction. Additions to plant, machinery and equipment in
2017
mainly related to investments in cars production lines, personalization programs and engine assembly lines. Additions to advances and assets under construction in
2017
mainly related to car production lines of models to be launched in future years.
Additions of
€175,647 thousand
in
2016
were mainly comprised of additions of
€81,678 thousand
to plant, machinery and equipment and additions of
€81,051 thousand
related to advances and assets under construction. Additions to plant, machinery and equipment in
2016
mainly related to investments in cars production lines, engine assembly lines and personalization programs. Additions to advances and assets under construction in
2016
mainly related to car production lines of models to be launched in future years.
At
December 31, 2017
, the Group had contractual commitments for the purchase of property, plant and equipment amounting to
€37,844 thousand
(
€49,614 thousand
at
December 31, 2016
).
F-37
Ferrari N.V.
NOTES TO THE CONSOLIDATED FINANCIAL STATEMENTS
at December 31, 2017 and 2016
17. INVESTMENTS AND OTHER FINANCIAL ASSETS
|
At December 31,
|
|||||
|
2017
|
2016
|
||||
|
(€ thousand)
|
|||||
|
Investments accounted for using the equity method
|
23,340
|
|
20,948
|
|
|
|
Delta Topco option
|
—
|
|
11,967
|
|
|
|
Other securities and financial assets
|
6,698
|
|
1,020
|
|
|
|
Total investments and other financial assets
|
30,038
|
|
33,935
|
|
|
Investments accounted for using the equity method
Investments accounted for using the equity method relates to the Group’s investment in FFS GmbH. In particular, on
November 7, 2016
, Ferrari and FCA Bank finalized an agreement to provide financial services in Europe, under which FCA Bank acquired a majority stake in FFS GmbH from Ferrari for a purchase price of
€18,595 thousand
, which was received upon sale. In addition to the purchase price, as a result of the funding of FFS GmbH being directly provided by FCA Bank, which is the consolidating entity of FFS GmbH following the transaction, the Group also received cash of
€431,958 thousand
.
Upon completion of the transaction, FFS GmbH was deconsolidated and the
49.9 percent
interest in FFS GmbH retained by Ferrari is accounted for using the equity method.
Changes in the investments accounted for using the equity method during the years ended
December 31, 2017
and
2016
were as follows:
|
|
(€ thousand)
|
|
|
Balance at January 1, 2016
|
—
|
|
|
Change in scope of consolidation
|
18,542
|
|
|
Fair value measurement of interest retained by the Group
|
1,489
|
|
|
Proportionate share of net profit for the period from November 7 to December 31, 2016
|
917
|
|
|
Balance at December 31, 2016
|
20,948
|
|
|
Proportionate share of net profit for the year ended December 31, 2017
|
2,437
|
|
|
Proportionate share of remeasurement of defined benefit plans
|
(45
|
)
|
|
Balance at December 31, 2017
|
23,340
|
|
F-38
Ferrari N.V.
NOTES TO THE CONSOLIDATED FINANCIAL STATEMENTS
at December 31, 2017 and 2016
Summarized financial information relating to
FFS GmbH at and for the years ended
December 31, 2017
and
2016
were as follows:
|
At December 31,
|
|||||
|
2017
|
2016
|
||||
|
(€ thousand)
|
|||||
|
Assets
|
|||||
|
Intangible assets
|
647
|
|
1,133
|
|
|
|
Property, plant and equipment
|
66
|
|
119
|
|
|
|
Deferred tax assets
|
1,977
|
|
2,736
|
|
|
|
Total non-current assets
|
2,690
|
|
3,988
|
|
|
|
Inventories
|
259
|
|
412
|
|
|
|
Trade receivables
|
1,461
|
|
472
|
|
|
|
Receivables from financing activities
|
493,985
|
|
463,108
|
|
|
|
Other current assets
|
8,292
|
|
3,543
|
|
|
|
Cash and cash equivalents
|
8,109
|
|
29,087
|
|
|
|
Total current assets
|
512,106
|
|
496,622
|
|
|
|
Total assets
|
514,796
|
|
500,610
|
|
|
|
Equity and liabilities
|
|||||
|
Equity
|
44,705
|
|
39,921
|
|
|
|
Non-current liabilities and provisions
|
8,903
|
|
7,920
|
|
|
|
Debt
|
457,787
|
|
447,272
|
|
|
|
Trade payables
|
457
|
|
123
|
|
|
|
Other liabilities
|
2,944
|
|
5,374
|
|
|
|
Total equity and liabilities
|
514,796
|
|
500,610
|
|
|
|
For the year ended December 31,
|
|||||
|
2017
|
2016
|
||||
|
(€ thousand)
|
|||||
|
Net revenues
|
26,505
|
|
27,471
|
|
|
|
Cost of sales
|
11,525
|
|
9,563
|
|
|
|
Selling, general and administrative costs
|
8,173
|
|
8,432
|
|
|
|
Other expenses, net
|
245
|
|
180
|
|
|
|
Profit before taxes
|
6,562
|
|
9,296
|
|
|
|
Income tax expense
|
1,689
|
|
2,070
|
|
|
|
Net profit
|
4,873
|
|
7,226
|
|
|
Delta Topco option
The Group was granted an option to purchase a fixed number of shares in Delta Topco for a fixed price on the occurrence of certain events. Delta Topco is a company belonging to the Formula 1 Group (the group responsible for the promotion of the Formula 1 World Championship).
The Group exercised the Delta Topco option as a result of the sale of Delta Topco to Liberty Media Corporation, which was completed on January 23, 2017. On February 22, 2017, the Group received (i) €
10,878 thousand
in cash (including €
2,571 thousand
of previously undistributed dividends), (ii) approximately
145 thousand
Liberty Shares, which were initially recognized at cost of €
2,887 thousand
(based on the original underlying agreement), and (iii) €
851 thousand
of Liberty Media exchangeable notes in relation to the Delta Topco option. The Liberty Media exchangeable notes were subsequently converted into Liberty Media shares in November 2017.
F-39
Ferrari N.V.
NOTES TO THE CONSOLIDATED FINANCIAL STATEMENTS
at December 31, 2017 and 2016
Other securities and financial assets
Other securities and financial assets primarily include the Liberty Shares obtained as a result of exercising the Delta Topco option and the subsequent conversion of Liberty Media exchangeable notes into Liberty Shares. The Liberty Shares are measured at fair value which amounted to €
5,705 thousand
at
December 31, 2017
.
18. INVENTORIES
|
At December 31,
|
|||||
|
2017
|
2016
|
||||
|
(€ thousand)
|
|||||
|
Raw materials
|
99,225
|
|
95,594
|
|
|
|
Semi-finished goods
|
87,678
|
|
72,472
|
|
|
|
Finished goods
|
206,862
|
|
155,932
|
|
|
|
Total inventories
|
393,765
|
|
323,998
|
|
|
The accrual to the provision for slow moving and obsolete inventories recognized within cost of sales during
2017
was
€10,140 thousand
(
€2,120 thousand
in
2016
and
€11,610 thousand
in
2015
).
Changes in the provision for slow moving and obsolete inventories were as follows:
|
2017
|
2016
|
||||
|
(€ thousand)
|
|||||
|
At January 1,
|
60,548
|
|
60,588
|
|
|
|
Provision
|
10,140
|
|
2,120
|
|
|
|
Use and other changes
|
(3,699
|
)
|
(2,160
|
)
|
|
|
At December 31,
|
66,989
|
|
60,548
|
|
|
19. CURRENT RECEIVABLES AND OTHER CURRENT ASSETS
|
At December 31,
|
|||||
|
2017
|
2016
|
||||
|
(€ thousand)
|
|||||
|
Trade receivables
|
239,410
|
|
243,977
|
|
|
|
Receivables from financing activities
|
732,947
|
|
790,377
|
|
|
|
Current tax receivables
|
6,125
|
|
1,312
|
|
|
|
Other current assets
|
45,441
|
|
53,729
|
|
|
|
Total
|
1,023,923
|
|
1,089,395
|
|
|
F-40
Ferrari N.V.
NOTES TO THE CONSOLIDATED FINANCIAL STATEMENTS
at December 31, 2017 and 2016
Trade receivables
The following table sets forth a breakdown of trade receivables by nature:
|
At December 31,
|
|||||
|
2017
|
2016
|
||||
|
(€ thousand)
|
|||||
|
Trade receivables due from:
|
|||||
|
FCA Group companies
|
75,245
|
|
75,694
|
|
|
|
Dealers
|
48,166
|
|
47,208
|
|
|
|
Sponsors
|
30,058
|
|
42,789
|
|
|
|
Brand activities
|
33,283
|
|
15,650
|
|
|
|
Other
|
52,658
|
|
62,636
|
|
|
|
Total
|
239,410
|
|
243,977
|
|
|
Trade receivables due from dealers relate to receivables for the sale of cars across the dealer network and are generally settled within
15
to
60
days from the date of invoice.
Trade receivables due from FCA Group companies mainly relate to the sale of engines and car bodies to Maserati S.p.A. and Officine Maserati Grugliasco S.p.A. (together “Maserati”) which are controlled by the FCA Group. For additional information, see Note 29.
Trade receivables due from sponsors relate to amounts receivable from sponsors of the Group’s Formula 1 activities.
Trade receivables due from brand activities relate to amounts receivable for licensing and merchandising activities.
The Group is not exposed to concentration of third party credit risk.
The following table sets forth a breakdown of trade receivables by currency:
|
At December 31,
|
|||||
|
2017
|
2016
|
||||
|
(€ thousand)
|
|||||
|
Trade receivables denominated in:
|
|||||
|
Euro
|
172,492
|
|
155,545
|
|
|
|
U.S. Dollar
|
53,618
|
|
62,701
|
|
|
|
Pound Sterling
|
2,915
|
|
1,222
|
|
|
|
Chinese Yuan
|
2,947
|
|
3,819
|
|
|
|
Japanese Yen
|
3,151
|
|
16,310
|
|
|
|
Other
|
4,287
|
|
4,380
|
|
|
|
Total
|
239,410
|
|
243,977
|
|
|
F-41
Ferrari N.V.
NOTES TO THE CONSOLIDATED FINANCIAL STATEMENTS
at December 31, 2017 and 2016
Trade receivables are shown net of an allowance for doubtful accounts determined on the basis of insolvency risk and historical experience. Accruals to the allowance for doubtful accounts are recorded in selling, general and administrative costs in the consolidated income statement. Changes in the allowance for doubtful accounts during the year were as follows:
|
2017
|
2016
|
||||
|
(€ thousand)
|
|||||
|
At January 1,
|
19,174
|
|
18,371
|
|
|
|
Provision
|
3,231
|
|
3,504
|
|
|
|
Use and other changes
|
(412
|
)
|
(2,701
|
)
|
|
|
At December 31,
|
21,993
|
|
19,174
|
|
|
Receivables from financing activities
Receivables from financing activities are as follows:
|
At December 31,
|
|||||
|
2017
|
2016
|
||||
|
(€ thousand)
|
|||||
|
Client financing
|
704,014
|
|
758,679
|
|
|
|
Dealer financing
|
28,933
|
|
31,698
|
|
|
|
Total receivables from financing activities
|
732,947
|
|
790,377
|
|
|
Receivables from financing activities are shown net of an allowance for doubtful accounts determined on the basis of insolvency risks. Accruals to the allowance for doubtful accounts are recorded in cost of sales in the consolidated income statement. Changes in the allowance for doubtful accounts of receivables from financing activities during the year are as follows:
|
2017
|
2016
|
||||
|
(€ thousand)
|
|||||
|
At January 1,
|
11,556
|
|
18,671
|
|
|
|
Provision
|
3,530
|
|
2,455
|
|
|
|
Change in scope of consolidation
|
—
|
|
(8,409
|
)
|
|
|
Use and other changes
|
(8,138
|
)
|
(1,161
|
)
|
|
|
At December 31,
|
6,948
|
|
11,556
|
|
|
Client financing
Client financing relates to financing provided by the Group to Ferrari clients to finance their car acquisition. During
2017
the average contractual duration at inception of such contracts was approximately
66
months and the weighted average interest rate was approximately
5.1 percent
. Receivables for client financing are generally secured on the titles of cars or other personal guarantees.
Following the sale of a majority stake in FFS GmbH to FCA Bank and the deconsolidation of FFS GmbH on
November 7, 2016
, client financing mainly relates to activities in the United States and is denominated in U.S. Dollars.
Dealer financing
The Group provides dealer financing in
the United States. Receivables for dealer financing are typically generated by sales of cars managed under dealer network financing programs as a component of the portfolio of the financial services companies. In
2017
these receivables were interest bearing at a rate between
3.3 percent
and
6.0 percent
(between
2.9 percent
and
5.2 percent
in
2016
), with the exception of an initial limited, non-interest bearing period. The contractual terms governing
F-42
Ferrari N.V.
NOTES TO THE CONSOLIDATED FINANCIAL STATEMENTS
at December 31, 2017 and 2016
the relationships with the dealer network vary from country to country, although payment terms generally range from 1 to 6 months. Receivables on dealer financing are generally secured by the title of the car or other collateral.
Other current assets
Other current assets are as follows:
|
At December 31,
|
|||||
|
2017
|
2016
|
||||
|
(€ thousand)
|
|||||
|
Prepayments
|
27,980
|
|
31,611
|
|
|
|
Italian and foreign VAT credits
|
11,988
|
|
12,032
|
|
|
|
Due from personnel
|
959
|
|
747
|
|
|
|
Security deposits
|
1,014
|
|
932
|
|
|
|
Other receivables
|
3,500
|
|
8,407
|
|
|
|
Total other current assets
|
45,441
|
|
53,729
|
|
|
At December 31, 2017
, the Group had provided guarantees through third parties amounting to
€132,014 thousand
(
€89,014 thousand
at
December 31, 2016
), principally to banks and relevant tax authorities in relation to (i) a U.S. Dollar denominated credit facility of FFS Inc, (ii) the validity of value added tax (“VAT”) and duties for which the Group requested reimbursement from the relevant tax authorities, (iii) the VAT related to temporary import of classic cars for restoration activities which would become due if the car is not exported.
The analysis of current receivables and other current assets by due date (excluding prepayments) is as follows:
|
At December 31, 2017
|
||||||||||||||
|
Due within one year
|
Due between one and five years
|
Due beyond five years
|
Overdue
|
Total
|
||||||||||
|
(€ thousand)
|
||||||||||||||
|
Trade receivables
|
207,074
|
|
—
|
|
—
|
|
32,336
|
|
239,410
|
|
||||
|
Receivables from financing activities
|
144,621
|
|
529,489
|
|
46,894
|
|
11,943
|
|
732,947
|
|
||||
|
Client financing
|
134,972
|
|
513,079
|
|
44,020
|
|
11,943
|
|
704,014
|
|
||||
|
Dealer financing
|
9,649
|
|
16,410
|
|
2,874
|
|
—
|
|
28,933
|
|
||||
|
Current tax receivables
|
5,667
|
|
458
|
|
—
|
|
—
|
|
6,125
|
|
||||
|
Other current receivables
|
16,767
|
|
682
|
|
7
|
|
5
|
|
17,461
|
|
||||
|
Total
|
374,129
|
|
530,629
|
|
46,901
|
|
44,284
|
|
995,943
|
|
||||
F-43
Ferrari N.V.
NOTES TO THE CONSOLIDATED FINANCIAL STATEMENTS
at December 31, 2017 and 2016
|
At December 31, 2016
|
||||||||||||||
|
Due within one year
|
Due between one and five years
|
Due beyond five years
|
Overdue
|
Total
|
||||||||||
|
(€ thousand)
|
||||||||||||||
|
Trade receivables
|
225,402
|
|
8
|
|
—
|
|
18,567
|
|
243,977
|
|
||||
|
Receivables from financing activities
|
146,412
|
|
554,030
|
|
48,341
|
|
41,594
|
|
790,377
|
|
||||
|
Client financing
|
136,602
|
|
536,954
|
|
43,529
|
|
41,594
|
|
758,679
|
|
||||
|
Dealer financing
|
9,810
|
|
17,076
|
|
4,812
|
|
—
|
|
31,698
|
|
||||
|
Current tax receivables
|
690
|
|
622
|
|
—
|
|
—
|
|
1,312
|
|
||||
|
Other current receivables
|
21,572
|
|
539
|
|
7
|
|
—
|
|
22,118
|
|
||||
|
Total
|
394,076
|
|
555,199
|
|
48,348
|
|
60,161
|
|
1,057,784
|
|
||||
Receivables from financing activities at
December 31, 2017
and
2016
relate entirely to the financial services portfolio and are generally secured on the titles of cars or other guarantees.
20. CURRENT FINANCIAL ASSETS AND OTHER FINANCIAL LIABILITIES
|
At December 31,
|
|||||
|
2017
|
2016
|
||||
|
(€ thousand)
|
|||||
|
Financial derivatives
|
11,686
|
|
10,388
|
|
|
|
Other financial assets
|
3,997
|
|
5,888
|
|
|
|
Current financial assets
|
15,683
|
|
16,276
|
|
|
Current financial assets and other financial liabilities mainly relates to foreign exchange derivatives. The following table sets further the analysis of derivative assets and liabilities at December 31, 2017 and 2016.
|
At December 31,
|
|||||||||||
|
2017
|
2016
|
||||||||||
|
Positive fair
value |
Negative fair
value |
Positive fair
value |
Negative fair
value |
||||||||
|
(€ thousand)
|
|||||||||||
|
Cash flow hedge:
|
|||||||||||
|
Foreign currency forwards
|
8,848
|
|
(1,136
|
)
|
8,160
|
|
(39,580
|
)
|
|||
|
Total cash flow hedges
|
8,848
|
|
(1,136
|
)
|
8,160
|
|
(39,580
|
)
|
|||
|
Other foreign exchange derivatives
|
1,729
|
|
(308
|
)
|
1,548
|
|
(58
|
)
|
|||
|
Interest rate caps
|
1,109
|
|
|
—
|
|
|
680
|
|
|
—
|
|
|
Total
|
11,686
|
|
(1,444
|
)
|
10,388
|
|
(39,638
|
)
|
|||
Other foreign exchange derivatives relate to foreign currency forwards which do not meet the requirements to be recognized as cash flow hedges. Interest rate caps relate to derivative instruments we are required to enter into as part of certain of our securitization agreements.
F-44
Ferrari N.V.
NOTES TO THE CONSOLIDATED FINANCIAL STATEMENTS
at December 31, 2017 and 2016
The following tables provide an analysis by foreign currency and due date of outstanding derivative financial instruments based on their fair value and notional amounts:
|
At December 31, 2017
|
|||||||||||
|
Fair value due within one year
|
Total fair value
|
Notional amount due within one year
|
Total notional amount
|
||||||||
|
(€ thousand)
|
|||||||||||
|
Currencies:
|
|||||||||||
|
U.S. Dollar
|
2,637
|
|
2,637
|
|
114,317
|
|
114,317
|
|
|||
|
Pound Sterling
|
510
|
|
510
|
|
110,032
|
|
110,032
|
|
|||
|
Chinese Yuan
|
(97
|
)
|
(97
|
)
|
18,095
|
|
18,095
|
|
|||
|
Swiss Franc
|
1,999
|
|
1,999
|
|
43,552
|
|
43,552
|
|
|||
|
Japanese Yen
|
4,402
|
|
4,402
|
|
81,890
|
|
81,890
|
|
|||
|
Other
(1)
|
791
|
|
791
|
|
95,738
|
|
95,738
|
|
|||
|
Total amount
|
10,242
|
|
10,242
|
|
463,624
|
|
463,624
|
|
|||
______________________________
(1) Other mainly includes the Australian Dollar, the Hong Kong Dollar and the Canadian Dollar.
|
At December 31, 2016
|
|||||||||||
|
Fair value due within one year
|
Total fair value
|
Notional amount due within one year
|
Total notional amount
|
||||||||
|
(€ thousand)
|
|||||||||||
|
Currencies:
|
|||||||||||
|
U.S. Dollar
|
(33,758
|
)
|
(33,758
|
)
|
788,274
|
|
788,274
|
|
|||
|
Pound Sterling
|
3,668
|
|
3,668
|
|
106,056
|
|
106,056
|
|
|||
|
Chinese Yuan
|
(125
|
)
|
(125
|
)
|
19,917
|
|
19,917
|
|
|||
|
Swiss Franc
|
(476
|
)
|
(476
|
)
|
47,923
|
|
47,923
|
|
|||
|
Japanese Yen
|
2,835
|
|
2,835
|
|
91,854
|
|
91,854
|
|
|||
|
Other
(1)
|
(1,394
|
)
|
(1,394
|
)
|
74,822
|
|
74,822
|
|
|||
|
Total amount
|
(29,250
|
)
|
(29,250
|
)
|
1,128,846
|
|
1,128,846
|
|
|||
______________________________
(1) Other mainly includes the Australian Dollar, the Hong Kong Dollar and the Canadian Dollar
Cash flow hedges
The effects recognized in the consolidated income statement mainly relate to currency risk management and in particular the exposure to fluctuations in the Euro/U.S. Dollar exchange rate for sales in U.S. Dollars.
The policy of the Group for managing foreign currency risk normally requires hedging of a portion of projected future cash flows from trading activities and orders acquired (or contracts in progress) in foreign currencies which will occur within the following 12 months. It is considered reasonable that the hedging effect arising from this and recorded in the cash flow hedge reserve will be recognized in the consolidated income statement, mainly during the following 12 months.
Derivatives relating to currency risk management are treated as cash flow hedges where the derivative qualifies for hedge accounting. The amount recorded in the cash flow hedge reserve will be recognized in the consolidated income statement according to the timing of the flows of the underlying transaction.
F-45
Ferrari N.V.
NOTES TO THE CONSOLIDATED FINANCIAL STATEMENTS
at December 31, 2017 and 2016
The Group reclassified gains and losses, net of the tax effect, from other comprehensive income/(loss) to the consolidated income statement as follows:
|
For the years ended December 31,
|
||||||||
|
2017
|
2016
|
2015
|
||||||
|
(€ thousand)
|
||||||||
|
Net revenues/(costs)
|
19,724
|
|
(69,368
|
)
|
(145,095
|
)
|
||
|
Net financial expenses
|
—
|
|
—
|
|
(23,745
|
)
|
||
|
Income tax (expense)/benefit
|
(5,503
|
)
|
19,354
|
|
53,016
|
|
||
|
Total recognized in the consolidated income statement
|
14,221
|
|
(50,014
|
)
|
(115,824
|
)
|
||
The ineffectiveness of cash flow hedges was not material for the years
2017
,
2016
and
2015
.
21. EQUITY
Share capital
At December 31, 2017 and 2016, the fully paid up share capital of the Company was
€2,504 thousand
, consisting of
193,923,499
common shares and
56,497,618
special voting shares, all with a nominal value of
€0.01
per share. At December 31, 2017, the Company had
4,969,625
common shares and
4,099
special voting shares held in treasury, while at December 31, 2016, the Company had
5,000,000
common shares and
2,930
special voting shares held in treasury. The decrease in common shares held in treasury primarily reflects the granting of shares to Non-Executive Directors as part of their directors’ compensation.
The Company did not issue new common shares or special voting shares in the initial public offering and did not receive any of the proceeds.
The loyalty voting structure
The purpose of the loyalty voting structure is to reward ownership of the Company’s common shares and to promote stability of the Company’s shareholder base by granting long-term shareholders of the Company with special voting shares. Following the Separation, Exor N.V. (“Exor”) and Piero Ferrari participate in the Company’s loyalty voting program and, therefore, effectively hold
two
votes for each of the common shares they hold. Investors who purchased common shares in the initial public offering may elect to participate in the loyalty voting program by registering their common shares in the loyalty share register and holding them for
three
years. The loyalty voting program will be effected by means of the issue of special voting shares to eligible holders of common shares. Each special voting share entitles the holder to exercise
one
vote at the Company’s shareholders meeting. Only a minimal dividend accrues to the special voting shares allocated to a separate special dividend reserve, and the special voting shares do not carry any entitlement to any other reserve of the Group. The special voting shares have only immaterial economic entitlements and, as a result, do not impact the Company’s earnings per share calculation.
Retained earnings and other reserves
Retained earnings and other reserves includes:
|
•
|
the share premium reserve of
€5,768,544 thousand
at
December 31, 2017
(
€5,888,529 thousand
at
December 31, 2016
). The share premium reserve originated from the issuance of common shares pursuant to the Restructuring and from a share premium contribution of
€1,162 thousand
made by FCA in 2015 and received in 2016. As explained below, the movements in 2017 and 2016 relate to cash distributions made from this reserve;
|
|
•
|
the legal reserve of
€8 thousand
at
December 31, 2017
and
€14 thousand
at
December 31, 2016
, determined in accordance with Dutch law.
|
Following approval of the annual accounts by the shareholders at the Annual General Meeting of the Shareholders on April 14, 2017, a cash distribution of
€0.635
per common share was approved, corresponding to a total distribution of
€119,985 thousand
. In May 2017 the Company paid
€114,738 thousand
of the distribution and the remainder was paid in July 2017. Following approval of the annual accounts by the shareholders at the Annual General Meeting of the Shareholders on
April 15,
F-46
Ferrari N.V.
NOTES TO THE CONSOLIDATED FINANCIAL STATEMENTS
at December 31, 2017 and 2016
2016
, the Company paid a cash distribution of
€0.46
per common share in
May 2016
, corresponding to a total distribution of
€86,905 thousand
. Both distributions were made from the share premium reserve which is a distributable reserve under Dutch law.
At
December 31, 2017
a cumulative amount of
€28,179 thousand
was recognized as an increase to other reserves for the PSU and RSU awards under the Group’s equity incentive plan. See Note 22 for additional details.
Equity-settled Non-Executive Directors’ compensation amounted to
€418 thousand
and
€1,110 thousand
for the years ended
December 31, 2017
and
2016
and was recognized as an increase to other reserves. See Note 29 for additional details.
Other comprehensive income
The following table presents other comprehensive income:
|
For the years ended December 31,
|
||||||||
|
2017
|
2016
|
2015
|
||||||
|
(€ thousand)
|
||||||||
|
Items that will not be reclassified to the consolidated income statement in subsequent periods:
|
||||||||
|
(Losses)/Gains on remeasurement of defined benefit plans
(1)
|
(730
|
)
|
(1,448
|
)
|
898
|
|
||
|
Total items that will not be reclassified to the consolidated income statement in subsequent periods
|
(730
|
)
|
(1,448
|
)
|
898
|
|
||
|
Items that may be reclassified to the consolidated income statement in subsequent periods:
|
||||||||
|
Gains/(Losses) on cash flow hedging instruments arising during the period
|
54,695
|
|
(18,282
|
)
|
(160,606
|
)
|
||
|
(Gains)/Losses on cash flow hedging instruments reclassified to the consolidated income statement
|
(19,724
|
)
|
69,368
|
|
168,840
|
|
||
|
Gains on cash flow hedging instruments
|
34,971
|
|
51,086
|
|
8,234
|
|
||
|
Exchange differences on translating foreign operations arising during the period
|
(15,346
|
)
|
4,118
|
|
13,344
|
|
||
|
Total items that may be reclassified to the consolidated income statement in subsequent periods
|
19,625
|
|
55,204
|
|
21,578
|
|
||
|
Total other comprehensive income
|
18,895
|
|
53,756
|
|
22,476
|
|
||
|
Related tax impact
|
(9,554
|
)
|
(16,961
|
)
|
(2,908
|
)
|
||
|
Total other comprehensive income, net of tax
|
9,341
|
|
36,795
|
|
19,568
|
|
||
|
(1)
|
For the year ended December 31, 2017 includes
€45 thousand
related to the Group
’
s proportionate share of the remeasurement of defined benefit plans of FFS GmbH, for which the Group holds a
49.9 percent
interest.
|
Losses on remeasurement of defined benefit plans mainly include actuarial gains and losses arising during the period. These gains and losses are offset against the related net defined benefit liabilities.
The tax effect relating to other comprehensive income are as follows:
|
For the years ended December 31,
|
||||||||||||||||||||||||||
|
2017
|
2016
|
2015
|
||||||||||||||||||||||||
|
Pre-tax balance
|
Related tax impact
|
Net balance
|
Pre-tax balance
|
Related tax impact
|
Net balance
|
Pre-tax balance
|
Related tax impact
|
Net balance
|
||||||||||||||||||
|
(€ thousand)
|
||||||||||||||||||||||||||
|
(Losses)/Gains on remeasurement of defined benefit plans
|
(730
|
)
|
203
|
|
(527
|
)
|
(1,448
|
)
|
(18
|
)
|
(1,466
|
)
|
898
|
|
(308
|
)
|
590
|
|
||||||||
|
Gains on cash flow hedging instruments
|
34,971
|
|
(9,757
|
)
|
25,214
|
|
51,086
|
|
(16,943
|
)
|
34,143
|
|
8,234
|
|
(2,600
|
)
|
5,634
|
|
||||||||
|
Exchange gains on translating foreign operations
|
(15,346
|
)
|
—
|
|
(15,346
|
)
|
4,118
|
|
—
|
|
4,118
|
|
13,344
|
|
—
|
|
13,344
|
|
||||||||
|
Total other comprehensive income
|
18,895
|
|
(9,554
|
)
|
9,341
|
|
53,756
|
|
(16,961
|
)
|
36,795
|
|
22,476
|
|
(2,908
|
)
|
19,568
|
|
||||||||
F-47
Ferrari N.V.
NOTES TO THE CONSOLIDATED FINANCIAL STATEMENTS
at December 31, 2017 and 2016
Transactions with non-controlling interests
With the exception of dividends paid to non-controlling interests, there were no transactions with non-controlling interests for the years ended
December 31, 2017
or
2016
.
Transactions with non-controlling interests for the year ended
December 31, 2015
relate to the purchase of the remaining
10 percent
of NCI of the subsidiary FFS from Aldasa GmbH. The purchase price for the FFS shares was
€8,500 thousand
(based on an independent valuation) and the carrying value of the
10 percent
interest at the time of purchase was
€5,898 thousand
. In accordance with IAS 27, the difference of
€2,602 thousand
was recorded as a reduction to equity.
Policies and processes for managing capital
The Group’s objectives when managing capital are to create value for shareholders as a whole, safeguard business continuity and support the growth of the Group. As a result, the Group endeavors to maintain a satisfactory economic return for its shareholders and guarantee economic access to external sources of funds.
22. SHARE-BASED COMPENSATION
Following the approval of the equity incentive plan by the Board of Directors on March 1, 2017, on April 14, 2017 the Shareholders approved an award to the Chief Executive Officer under the Company’s equity incentive plan, which is applicable to all Group Executive Council (“GEC”) members and key leaders of the Company. Under the Company’s equity incentive plan, an aggregate of approximately
687 thousand
performance share units (“PSUs”) and an aggregate of approximately
119 thousand
restricted share units (“RSUs”) have been awarded. The grants of the PSUs and the RSUs, each representing the right to receive one common share of the Company, cover a
five
-year performance period from 2016 to 2020, consistent with the Company’s strategic horizon.
At December 31, 2017, the Company has recognized a cumulative amount of
€28,179 thousand
as an increase to other reserves in equity for the PSU awards and RSU awards and had unrecognized compensation expense of approximately
€26,051 thousand
, which will be recognized over the remaining vesting period until 2020.
Performance Share Units
The Company awarded members of the GEC and key leaders a total target of approximately
237 thousand
PSUs and
450 thousand
PSUs to its Chief Executive Officer. The PSUs vest in
three
equal tranches in March 2019, 2020 and 2021, subject to the achievement of a market performance condition related to Total Shareholder Return (“TSR”). The interim partial vesting periods are independent of one another and any under-achievement in one period can be offset by over-achievement in subsequent periods. The target amount of PSUs vests as follows based on the Company’s TSR ranking compared to an industry specific peer group of eight, including the Company, (“Peer Group”):
|
Ferrari TSR Ranking
|
% of Target Awards that Vest
|
|
|
CEO
|
GEC and Key Leaders
|
|
|
1
|
150%
|
150%
|
|
2
|
120%
|
120%
|
|
3
|
100%
|
100%
|
|
4
|
75%
|
—
|
|
5
|
50%
|
—
|
The defined Peer Group is as follows:
|
Hermes
|
Burberry
|
Brunello Cucinelli
|
Ferragamo
|
|
LVMH
|
Moncler
|
Richemont
|
|
F-48
Ferrari N.V.
NOTES TO THE CONSOLIDATED FINANCIAL STATEMENTS
at December 31, 2017 and 2016
The total number of shares that will eventually be issued upon vesting of the PSUs may vary from the original award of
687 thousand
, depending on the level of TSR performance achieved compared to the Peer Group.
None
of the PSU awards were forfeited and
none
of the outstanding PSUs had vested at December 31, 2017.
The performance period for the PSUs commenced on January 1, 2016. The fair value of the awards used for accounting purposes was measured at the grant date using a Monte Carlo Simulation model. The range of the fair value of the PSUs that were awarded is
€59.36
-
€72.06
per share. The key assumptions utilized to calculate the grant-date fair values for these awards are summarized below:
|
Key assumptions
|
|
|
Grant date share price
|
€66.85
|
|
Expected volatility
|
17.4%
|
|
Dividend yield
|
1.2%
|
|
Risk-free rate
|
0%
|
The expected volatility was based on the observed volatility of the Peer Group. The risk-free rate was based on the iBoxx sovereign Eurozone yield.
Retention Restricted Share Units
The Company awarded members of the GEC and key leaders a total of approximately
119 thousand
RSUs. The Chief Executive Officer has not received any RSUs. The RSU awards granted to GEC members and key leaders are conditional on a recipient’s continued service to the Company, as described below. The RSUs, each of which represents the right to receive one common share of the Company, will vest in
three
equal tranches in March 2019, 2020 and 2021, subject to continued employment with the Company at the time of vesting. None of the RSU awards were forfeited and none of the RSU awards had vested at December 31, 2017.
The performance period for the RSUs commenced on January 1, 2016. The fair value of the awards was measured using the share price at the grant date adjusted for the present value of future distributions which employees will not receive during the vesting period. The range of the fair value of the RSUs awarded is
€63.00
-
€64.64
per share.
23. EMPLOYEE BENEFITS
The Group’s provisions for employee benefits are as follows:
|
At December 31,
|
|||||
|
2017
|
2016
|
||||
|
(€ thousand)
|
|||||
|
Present value of defined benefit obligations:
|
|||||
|
Italian employee severance indemnity (TFR)
|
22,641
|
|
23,783
|
|
|
|
Pension plans
|
604
|
|
828
|
|
|
|
Total present value of defined benefit obligations
|
23,245
|
|
24,611
|
|
|
|
Other provisions for employees
|
60,914
|
|
66,413
|
|
|
|
Total provisions for employee benefits
|
84,159
|
|
91,024
|
|
|
Defined contribution plan
The Group recognizes the cost for defined contribution plans over the period in which the employee renders service and classifies this by function in cost of sales, selling, general and administrative costs and research and development costs. The total income statement expense for defined contributions plans in the years ended
December 31, 2017
,
2016
and
2015
was
€3,149 thousand
,
€9,719 thousand
and
€2,990 thousand
, respectively.
F-49
Ferrari N.V.
NOTES TO THE CONSOLIDATED FINANCIAL STATEMENTS
at December 31, 2017 and 2016
Defined benefit obligations
Italian employee severance indemnity (TFR)
Trattamento di fine rapporto or “TFR” relates to the amounts that employees in Italy are entitled to receive when they leave the company and is calculated based on the period of employment and the taxable earnings of each employee. Under certain conditions the entitlement may be partially advanced to an employee during the employee’s working life.
The Italian legislation regarding this scheme was amended by Law 296 of 27 December 2006 and subsequent decrees and regulations issued in the first part of 2007. Under these amendments, companies with at least 50 employees are obliged to transfer the TFR to the “Treasury fund” managed by the Italian state-owned social security body (“INPS”) or to supplementary pension funds. Prior to the amendments, accruing TFR for employees of all Italian companies could be managed by the company itself. Consequently, the Italian companies’ obligation to INPS and the contributions to supplementary pension funds take the form, under IAS 19 revised, of “Defined contribution plans” whereas the amounts recorded in the provision for employee severance pay retain the nature of “Defined benefit plans”. Accordingly, the provision for employee severance indemnity in Italy consists of the residual obligation for TFR until December 31, 2006. This is an unfunded defined benefit plan as the benefits have already been almost entirely earned, with the sole exception of future revaluations. Since 2007 the scheme has been classified as a defined contribution plan, and the Group recognizes the associated cost, being the required contributions to the pension funds, over the period in which the employee renders service.
Pension plans
Group companies, primarily in Germany sponsor non-contributory defined benefit pension plans, for which the Group meets the benefit payment obligation when it falls due. Benefits provided depends on the employee’s length of service and their salary in the final years leading up to retirement.
The expected benefit payments for the defined benefit obligations are as follows:
|
Expected benefit payments
|
||||||
|
TFR
|
Pension plans
|
|||||
|
(€ thousand)
|
||||||
|
2018
|
1,350
|
|
41
|
|
||
|
2019
|
1,401
|
|
41
|
|
||
|
2020
|
1,596
|
|
42
|
|
||
|
2021
|
1,960
|
|
42
|
|
||
|
2022
|
1,725
|
|
3,262
|
|
||
|
Beyond 2022
|
7,089
|
|
597
|
|
||
|
Total
|
15,121
|
|
4,025
|
|
||
F-50
Ferrari N.V.
NOTES TO THE CONSOLIDATED FINANCIAL STATEMENTS
at December 31, 2017 and 2016
The following table summarizes the changes in the defined benefit obligations:
|
TFR liability
|
Pension plans
|
Total
|
||||||
|
(€ thousand)
|
||||||||
|
Amounts at December 31, 2015
|
23,119
|
|
805
|
|
23,924
|
|
||
|
Included in the consolidated income statement
|
391
|
|
(37
|
)
|
354
|
|
||
|
Included in other comprehensive income/loss
|
||||||||
|
Actuarial losses from financial assumptions
|
1,580
|
|
232
|
|
1,812
|
|
||
|
Other
|
||||||||
|
Benefits paid
|
(1,337
|
)
|
(172
|
)
|
|
(1,509
|
)
|
|
|
Other changes
|
30
|
|
—
|
|
30
|
|
||
|
Amounts at December 31, 2016
|
23,783
|
|
828
|
|
24,611
|
|
||
|
Included in the consolidated income statement
|
—
|
|
142
|
|
142
|
|
||
|
Included in other comprehensive income/loss
|
||||||||
|
Actuarial losses/(gains) from financial assumptions
|
820
|
|
(135
|
)
|
685
|
|
||
|
Other
|
||||||||
|
Benefits paid
|
(1,964
|
)
|
(164
|
)
|
(2,128
|
)
|
||
|
Other changes
|
2
|
|
(67
|
)
|
(65
|
)
|
||
|
Amounts at December 31, 2017
|
22,641
|
|
604
|
|
23,245
|
|
||
Amounts recognized in the consolidated income statement are as follows:
|
For the years ended December 31,
|
||||||||||||||||||||||||||
|
2017
|
2016
|
2015
|
||||||||||||||||||||||||
|
TFR
|
Pension plans
|
Total
|
TFR
|
Pension plans
|
Total
|
TFR
|
Pension plans
|
Total
|
||||||||||||||||||
|
(€ thousand)
|
||||||||||||||||||||||||||
|
Current service cost
|
—
|
|
141
|
|
141
|
|
31
|
|
(41
|
)
|
(10
|
)
|
8
|
|
72
|
|
80
|
|
||||||||
|
Interest (income)/expense
|
—
|
|
1
|
|
1
|
|
360
|
|
4
|
|
364
|
|
74
|
|
—
|
|
74
|
|
||||||||
|
Total recognized in the consolidated income statement
|
—
|
|
142
|
|
142
|
|
391
|
|
(37
|
)
|
354
|
|
82
|
|
72
|
|
154
|
|
||||||||
The discount rates used for the measurement of the Italian TFR obligation are based on yields of high-quality (AA rated) fixed income securities for which the timing and amounts of payments match the timing and amounts of the projected benefit payments. For this plan, the single weighted average discount rate that reflects the estimated timing and amount of the scheme future benefit payments for
2017
is equal to
1.5 percent
(
1.3 percent
in
2016
and
1.6 percent
in
2015
). The average duration of the Italian TFR is approximately
9
years. Retirement or employee leaving rates are developed to reflect actual and projected Group experience and legal requirements for retirement in Italy.
The discount rates used for the measurement of the pension plan obligation (excluding TFR) and the interest expense/(income) of net period cost, are based on the rate of return on high-quality (AA rated) fixed income investments for which the timing and amounts of payments match the timing and amounts of the projected pension defined benefit plan which for
2017
was equal to approximately
0.7 percent
(
1.3 percent
2016
and
1.6 percent
in
2015
). The average duration of the obligations is approximately
13 years
.
F-51
Ferrari N.V.
NOTES TO THE CONSOLIDATED FINANCIAL STATEMENTS
at December 31, 2017 and 2016
Current service cost is recognized by function in cost of sales, selling, general and administrative costs or research and development costs.
The sensitivity of the defined benefit obligation to changes in the weighted principal assumptions is:
|
At December 31,
|
|||||||||||
|
2017
|
2016
|
||||||||||
|
Changes in assumption of +1% discount rate
|
Changes in assumption of -1% discount rate
|
Changes in assumption of +1% discount rate
|
Changes in assumption of -1% discount rate
|
||||||||
|
(€ thousand)
|
|||||||||||
|
Impact on defined benefit obligation
|
(1,771
|
)
|
2,036
|
|
(1,909
|
)
|
2,201
|
|
|||
The above sensitivity analysis on TFR is based on a change in an assumption while holding all other assumptions constant. In practice, this is unlikely to occur, and changes in some of the assumptions may be correlated. When calculating the sensitivity of the defined benefit obligation to significant actuarial assumptions the same method has been applied as when calculating the defined benefit liability recognized in the statement of the financial position.
Other provisions for employees
Other provisions for employees consist of the expected future amounts payable to employees in connection with other remuneration schemes, which are not subject to actuarial valuation, including long-term bonus plans.
At
December 31, 2017
, other provisions for employees comprised long term bonus benefits amounting to
€58,090 thousand
(
€64,432 thousand
at
December 31, 2016
), jubilee benefits granted to certain employees by the Group in the event of achieving
30
years of service amounting to
€2,745 thousand
(
€1,905 thousand
at
December 31, 2016
), and other provisions for employees benefits amounting to
€79 thousand
(
€76 thousand
at
December 31, 2016
).
24. PROVISIONS
Changes in provisions were as follows:
|
At
December 31, 2016 |
Additional provisions
|
Utilization
|
Translation differences and other
|
At
December 31, 2017 |
||||||||||
|
(€ thousand)
|
||||||||||||||
|
Warranty and recall campaigns provision
|
122,411
|
|
16,705
|
|
(15,328
|
)
|
(652
|
)
|
123,136
|
|
||||
|
Legal proceedings and disputes
|
45,336
|
|
6,670
|
|
(1,271
|
)
|
(360
|
)
|
50,375
|
|
||||
|
Other risks
|
47,480
|
|
8,339
|
|
(30,320
|
)
|
(1,618
|
)
|
23,881
|
|
||||
|
Total provisions
|
215,227
|
|
31,714
|
|
(46,919
|
)
|
(2,630
|
)
|
197,392
|
|
||||
Warranty and recall campaigns provision
The warranty and recall campaigns provision represents the best estimate of commitments given by the Group for contractual, legal, or constructive obligations arising from product warranties given for a specified period of time. Such provisions are recognized on shipment of the car to the dealer.
The warranty and recall campaigns provision is estimated on the basis of the Group’s past experience and contractual terms. Related costs are recognized within cost of sales.
Takata airbag inflator recalls
On May 4, 2016, the United States National Highway Traffic Safety Administration (“NHTSA”) published an amendment (the “Amendment”) to the November 3, 2015 Takata Consent Order regarding Takata airbags manufactured using
F-52
Ferrari N.V.
NOTES TO THE CONSOLIDATED FINANCIAL STATEMENTS
at December 31, 2017 and 2016
non-desiccated Phase Stabilized Ammonium Nitrate (“PSAN”), expanding the scope of a prior recall under the Takata Consent Order. The recall is industry wide and replacement parts are limited as Takata is the single supplier.
In compliance with the Amendment to the Takata Consent Order, on May 16, 2016, Takata submitted a defect information report (“DIR”) to NHTSA declaring the non-desiccated PSAN airbag inflators, including those sold by Takata to the Group,
defective.
Although the Group was not aware of any confirmed incidents or warranty claims relating to such airbag inflators mounted in its cars or that the airbag inflators were not performing as designed, as a result of the Amendment issued by NHTSA and the DIR issued by Takata, the Group initiated a global recall relating to certain cars produced between 2008 and 2011. Following a Third Amendment to the Coordinated Remedy Order (“ACRO”) published by NHTSA in December 2016 and an additional Takata DIR filed on January 3, 2017, the Group filed an additional DIR on January 10, 2017 to also include certain cars produced in 2012.
As a result of internal assessments, in 2016 Ferrari decided to extend the recall campaign to include all cars produced in all model years based on priority groups and the timeline set by NHTSA.
As a result of these developments and due to the uncertainty of recoverability of the costs from Takata, an aggregate provision of €
36,994 thousand
was recognized within cost of sales in the year ended December 31, 2016.
At December 31, 2017, the provision amounted to
€34,567 thousand
. Such provision reflects the current best estimate for future costs related to the entire recall campaign to be carried out by the Group.
Legal proceedings and disputes
The provision for legal proceedings and disputes represents management’s best estimate of the expenditures expected to be required to settle or otherwise resolve legal proceedings and disputes. This class of claims relate to allegations by contractual counterparties that the Group has violated the terms of the arrangements, including by terminating the applicable relationships. Judgments in these proceedings may be issued in 2018, although any such judgment may remain subject to judicial review. While the outcome of such proceedings is uncertain, any losses in excess of the provisions recorded are not expected to be material to the Group’s financial condition or results of operations.
The utilization related to the reversal of accruals for legal proceedings and disputes resolved in 2017. Accruals to the provision for legal proceedings and disputes are recognized within other expenses, net.
Other risks
The provision for other risks are related to disputes and matters which are not subject to legal proceedings, including disputes with suppliers, distributors, employees and other parties. The utilization in 2017 primarily relates to a dispute with a distributor as well as various contractual risks.
The following table sets forth additional provisions to other risks recognized for the years ended
December 31, 2017
,
2016
and
2015
.
|
For the years ended December 31,
|
||||||||
|
2017
|
2016
|
2015
|
||||||
|
(€ thousand)
|
||||||||
|
Recorded in the consolidated income statement within:
|
||||||||
|
Cost of sales
|
8,065
|
|
4,499
|
|
3,847
|
|
||
|
Other expenses, net
|
—
|
|
14,559
|
|
4,111
|
|
||
|
Selling, general and administrative costs
|
274
|
|
2,604
|
|
8
|
|
||
|
Income tax expense
|
—
|
|
—
|
|
569
|
|
||
|
8,339
|
|
21,662
|
|
8,535
|
|
|||
F-53
Ferrari N.V.
NOTES TO THE CONSOLIDATED FINANCIAL STATEMENTS
at December 31, 2017 and 2016
25. DEBT
|
Balance at December 31, 2016
|
Proceeds from borrowings
|
Repayments of borrowings
|
Interest accrued and other
|
Translation differences
|
Balance at December 31, 2017
|
||||||||||||
|
(€ thousand)
|
|||||||||||||||||
|
Borrowings from banks
|
836,886
|
|
10,074
|
|
(800,943
|
)
|
264
|
|
(8,222
|
)
|
38,059
|
|
|||||
|
Bonds
|
497,614
|
|
694,172
|
|
—
|
|
1,731
|
|
—
|
|
1,193,517
|
|
|||||
|
Securitizations
|
485,670
|
|
232,520
|
|
(91,405
|
)
|
178
|
|
(70,687
|
)
|
556,276
|
|
|||||
|
Other debt
|
27,871
|
|
34,804
|
|
(43,084
|
)
|
—
|
|
(1,262
|
)
|
18,329
|
|
|||||
|
Total debt
|
1,848,041
|
|
971,570
|
|
(935,432
|
)
|
2,173
|
|
(80,171
|
)
|
1,806,181
|
|
|||||
The breakdown of debt by nature and by maturity is as follows:
|
At December 31,
|
|||||||||||||||||||||||
|
2017
|
2016
|
||||||||||||||||||||||
|
Due within one year
|
Due between
one and
five years
|
Due beyond five years
|
Total
|
Due within one year
|
Due between
one and
five years
|
Due beyond five years
|
Total
|
||||||||||||||||
|
(€ thousand)
|
|||||||||||||||||||||||
|
Bonds
|
—
|
|
694,623
|
|
498,894
|
|
1,193,517
|
|
—
|
|
—
|
|
497,614
|
|
497,614
|
|
|||||||
|
Securitizations
|
254,891
|
|
301,385
|
|
—
|
|
556,276
|
|
144,597
|
|
341,073
|
|
—
|
|
485,670
|
|
|||||||
|
Borrowings from banks
|
32,811
|
|
5,248
|
|
—
|
|
38,059
|
|
227,408
|
|
609,478
|
|
—
|
|
836,886
|
|
|||||||
|
Other debt
|
18,329
|
|
—
|
|
—
|
|
18,329
|
|
27,871
|
|
—
|
|
—
|
|
27,871
|
|
|||||||
|
Total debt
|
306,031
|
|
1,001,256
|
|
498,894
|
|
1,806,181
|
|
399,876
|
|
950,551
|
|
497,614
|
|
1,848,041
|
|
|||||||
Borrowings from banks
Borrowings from banks at
December 31, 2017
mainly relate to financial liabilities of FFS Inc to support the financial services operations, and in particular (i)
€29,189 thousand
(
€23,745 thousand
at
December 31, 2016
) relating to a U.S. Dollar denominated credit facility for up to
$50 million
(drawn down for
$35 million
at December 31, 2017) and bearing interest at LIBOR plus a range of between 65 and 75 basis points; (ii) other borrowings from banks of
€8,870 thousand
(
€12,707 thousand
at
December 31, 2016
) relating to various short and medium term credit facilities.
Borrowings from banks at
December 31, 2016
also included
€800,383 thousand
relating to the Term Loan, which was fully repaid in 2017, primarily with proceeds from the 2021 Bond issued in November 2017. See
“The Facility”
below.
The Facility
On November 30, 2015, the Company, as borrower and guarantor, and certain other members of the Group, as borrowers, entered into a
€2.5 billion
facility with a syndicate of banks (the “Facility”). At inception, the Facility comprised a bridge loan of
€500 million
(the “Bridge Loan”), a term loan of
€1,500 million
(the “Term Loan”) and a revolving credit facility of
€500 million
(the “RCF”).
In December 2015 the Bridge Loan and Term Loan were fully drawn down for the purposes of repaying financial liabilities with FCA, including the FCA Note that originated as a result of the Restructuring.
In March 2016, the Bridge Loan was fully repaid, primarily using the proceeds from the 2023 Bond (see “Bonds” below).
In 2016 and 2017 the Company made scheduled payments and voluntary prepayments, funded in part with the proceeds of the 2021 Bond described under “Bonds” below, to fully repay the Term Loan.
F-54
Ferrari N.V.
NOTES TO THE CONSOLIDATED FINANCIAL STATEMENTS
at December 31, 2017 and 2016
At
December 31, 2017
and
2016
the RCF was undrawn. Proceeds of the RCF may be used from time to time for general corporate and working capital purposes of the Group. The RCF has a maturity of five years from inception of the Facility.
Bonds
2023 Bond
On March 16, 2016, the Company issued
1.5 percent
coupon notes due March 2023, having a principal of
€500 million
. The bond was issued at a discount for an issue price of
98.977 percent
, resulting in net proceeds of
€490,729 thousand
after the debt discount and issuance costs. The net proceeds were used, together with additional cash held by the Company, to fully repay the
€500 million
Bridge Loan under the Facility. The bond is unrated and was admitted to trading on the regulated market of the Irish Stock Exchange. The amount outstanding at
December 31, 2017
of
€498,894 thousand
includes accrued interest of
€5,938 thousand
.
2021 Bond
On November 16, 2017, the Company issued
0.25 percent
coupon notes due January 2021, having a principal of
€700 million
. The bond was issued at a discount for an issue price of
99.557 percent
, resulting in net proceeds of
€694,172 thousand
after the debt discount and issuance costs. The net proceeds were primarily used to repay the Term Loan. The bond is unrated and was admitted to trading on the regulated market of the Irish Stock Exchange. The amount outstanding at
December 31, 2017
of
€694,623 thousand
includes accrued interest of
€221 thousand
.
The notes for both the 2023 Bond and the 2021 Bond impose covenants on Ferrari including: (i) negative pledge clauses which require that, in case any security interest upon assets of Ferrari is granted in connection with other notes or debt securities with the consent of Ferrari are, or are intended to be, listed, such security should be equally and ratably extended to the outstanding notes, subject to certain permitted exceptions; (ii) pari passu clauses, under which the notes rank and will rank pari passu with all other present and future unsubordinated and unsecured obligations of Ferrari; (iii) events of default for failure to pay principal or interest or comply with other obligations under the notes with specified cure periods or in the event of a payment default or acceleration of indebtedness or in the case of certain bankruptcy events; and (iv) other clauses that are customarily applicable to debt securities of issuers with a similar credit standing. A breach of these covenants may require the early repayment of the notes. As of
December 31, 2017
and 2016, Ferrari was in compliance with the covenants of the notes.
Securitizations
In
2016
and
2017
FFS Inc has pursued a strategy of self-financing, further reducing dependency on intercompany funding and increasing the portion of self-liquidating debt with various securitization transactions.
On January 19, 2016, FFS Inc entered into a revolving securitization program for funding of up to
$250 million
by pledging retail financial receivables in the United States as collateral. In 2016, proceeds from the first sale of financial receivables were
$242 million
and were primarily used to repay intercompany loans. The funding limit of the program has been progressively increased over time, including to
$275 million
on December 16, 2016, to
$325 million
on July 14, 2017, and to
$350 million
on December 15, 2017. The notes bear interest at a rate per annum equal to the aggregate of LIBOR plus a margin of
65
basis points. As of
December 31, 2017
total proceeds from the sales of financial receivables under the program were $
325 million
. The securitization agreement requires the maintenance of an interest rate cap.
On October 20, 2016, FFS Inc entered into a revolving securitization program for funding of up to
$200 million
by pledging leasing financial receivables in the United States as collateral. In 2016, proceeds from the first sale of financial receivables were
$175 million
and were primarily used to repay U.S. Dollar denominated bank borrowings. On April 21, 2017 the funding limit of the program was increased to
$225 million
and this amount remained unchanged in the renewal of the program in September 2017. The notes bear interest at a rate per annum equal to the aggregate of LIBOR plus a margin of
65
basis points. As of
December 31, 2017
total proceeds from the sales of financial receivables under the program were $
222 million
. The securitization agreement requires the maintenance of an interest rate cap.
On December 28, 2016, FFS Inc entered into a revolving securitization program for funding of up to
$120 million
by pledging credit lines to Ferrari customers secured by personal vehicle collections and personal guarantees in the United States as collateral. In 2016, proceeds from the first sale of financial receivables were
$64 million
and were primarily used to repay
F-55
Ferrari N.V.
NOTES TO THE CONSOLIDATED FINANCIAL STATEMENTS
at December 31, 2017 and 2016
U.S. Dollar denominated bank borrowings. On December 20, 2017 the funding limit of the program was increased to
$135 million
. The notes bear interest at a rate per annum equal to the aggregate of LIBOR plus a margin of
120
basis points. As of
December 31, 2017
total proceeds from the sales of financial receivables under the program were $
120 million
. The securitization agreement does not require an interest rate cap.
Cash collected from the settlement of receivables or lines of credit pledged as collateral is subject to certain restrictions regarding its use and is principally applied to repay principal and interest of the funding. Such cash amounted to €
28,230 thousand
at
December 31, 2017
(€
19,411 thousand
at
December 31, 2016
).
Other debt
Other debt primarily relates to funding for operating activities of the Group’s U.S. subsidiaries.
26. OTHER LIABILITIES
An analysis of other liabilities is as follows:
|
At December 31,
|
|||||
|
2017
|
2016
|
||||
|
(€ thousand)
|
|||||
|
Deferred income
|
274,186
|
|
273,069
|
|
|
|
Advances and security deposits
|
167,293
|
|
229,975
|
|
|
|
Accrued expenses
|
77,024
|
|
61,403
|
|
|
|
Payables to personnel
|
38,488
|
|
36,843
|
|
|
|
Social security payables
|
20,553
|
|
18,559
|
|
|
|
Other
|
42,806
|
|
36,426
|
|
|
|
Total other liabilities
|
620,350
|
|
656,275
|
|
|
Deferred income primarily includes amounts received under the scheduled maintenance program of
€173,646 thousand
at
December 31, 2017
and
€155,121 thousand
at
December 31, 2016
, which are deferred and recognized as net revenues over the length of the maintenance program term. Deferred income also includes amounts collected under various other agreements, which are dependent upon the future performance of a service or other act of the Group.
Advances and security deposits at
December 31, 2017
and at
December 31, 2016
primarily include advances received from clients for the purchase of special series, limited edition and supercars. Upon shipment of such cars, the advances are recognized as revenue. The decrease in 2017 primarily related to a reduction in advances received for the LaFerrari Aperta, which was partially offset by advances received for the Ferrari J50.
An analysis of other liabilities (excluding accrued expenses and deferred income) by due date is as follows:
|
At December 31,
|
|||||||||||||||||||||||
|
2017
|
2016
|
||||||||||||||||||||||
|
Due within one year
|
Due between
one and
five years
|
Due beyond five years
|
Total
|
Due within one year
|
Due between
one and
five years
|
Due beyond five years
|
Total
|
||||||||||||||||
|
(€ thousand)
|
|||||||||||||||||||||||
|
Total other liabilities (excluding accrued expenses and deferred income)
|
264,380
|
|
4,760
|
|
—
|
|
269,140
|
|
309,864
|
|
4,913
|
|
7,026
|
|
321,803
|
|
|||||||
27. TRADE PAYABLES
Trade payables of
€607,505 thousand
at
December 31, 2017
(
€614,888 thousand
at December 31,
2016
) are entirely due within one year. The carrying amount of trade payables is considered to be equivalent to their fair value.
F-56
Ferrari N.V.
NOTES TO THE CONSOLIDATED FINANCIAL STATEMENTS
at December 31, 2017 and 2016
28. FAIR VALUE MEASUREMENT
IFRS 13 establishes a hierarchy that categorizes into three levels the inputs to the valuation techniques used to measure fair value by giving the highest priority to quoted prices (unadjusted) in active markets for identical assets and liabilities (level 1 inputs) and the lowest priority to unobservable inputs (level 3 inputs). In some cases, the inputs used to measure the fair value of an asset or a liability might be categorized within different levels of the fair value hierarchy. In those cases, the fair value measurement is categorized in its entirety in the same level of the fair value hierarchy at the lowest level input that is significant to the entire measurement.
Levels used in the hierarchy are as follows:
|
•
|
Level 1 inputs are quoted prices (unadjusted) in active markets for identical assets and liabilities that the Group can access at the measurement date.
|
|
•
|
Level 2 inputs are inputs other than quoted prices included within level 1 that are observable for the assets or liabilities, either directly or indirectly.
|
|
•
|
Level 3 inputs are unobservable inputs for the assets and liabilities.
|
Assets and liabilities that are measured at fair value on a recurring basis
The following table shows the fair value hierarchy for financial assets and liabilities that are measured at fair value on a recurring basis at
December 31, 2017
and
2016
:
|
At December 31, 2017
|
|||||||||||||
|
Note
|
Level 1
|
Level 2
|
Level 3
|
Total
|
|||||||||
|
(€ thousand)
|
|||||||||||||
|
Cash and cash equivalents
|
647,706
|
|
—
|
|
—
|
|
647,706
|
|
|||||
|
Investments and other financial assets - Liberty Shares
|
17
|
5,705
|
|
—
|
|
—
|
|
5,705
|
|
||||
|
Current financial assets
|
20
|
—
|
|
11,686
|
|
—
|
|
11,686
|
|
||||
|
Total assets
|
653,411
|
|
11,686
|
|
—
|
|
665,097
|
|
|||||
|
Other financial liabilities
|
20
|
—
|
|
1,444
|
|
—
|
|
1,444
|
|
||||
|
Total liabilities
|
—
|
|
1,444
|
|
—
|
|
1,444
|
|
|||||
|
At December 31, 2016
|
|||||||||||||
|
Note
|
Level 1
|
Level 2
|
Level 3
|
Total
|
|||||||||
|
(€ thousand)
|
|||||||||||||
|
Cash and cash equivalents
|
457,784
|
|
—
|
|
—
|
|
457,784
|
|
|||||
|
Investments and other financial assets - Delta Topco option
|
17
|
—
|
|
11,967
|
|
—
|
|
11,967
|
|
||||
|
Current financial assets
|
20
|
—
|
|
10,388
|
|
—
|
|
10,388
|
|
||||
|
Total assets
|
457,784
|
|
22,355
|
|
—
|
|
480,139
|
|
|||||
|
Other financial liabilities
|
20
|
—
|
|
39,638
|
|
—
|
|
39,638
|
|
||||
|
Total liabilities
|
—
|
|
39,638
|
|
—
|
|
39,638
|
|
|||||
There were no transfers between fair value hierarchy levels between 2016 and 2017.
In 2017, the Group exercised the Delta Topco option as a result of the sale of Delta Topco to Liberty Media Corporation, which was completed on January 23, 2017. Therefore the Delta Topco option was derecognized and the Group’s investment in the Liberty Shares and exchangeable notes were recognized. In November 2017 the Liberty exchangeable notes were converted into Liberty Shares.
F-57
Ferrari N.V.
NOTES TO THE CONSOLIDATED FINANCIAL STATEMENTS
at December 31, 2017 and 2016
The fair value of current financial assets and other financial liabilities is related to derivative financial instruments and is measured by taking into consideration market parameters at the balance sheet date, using valuation techniques widely accepted in the financial business environment. In particular, the fair value of forward contracts, currency swaps and interest rate caps is determined by taking the prevailing foreign currency exchange rate and interest rates, as applicable, at the balance sheet date.
The fair value of cash and cash equivalents usually approximates fair value due to the short maturity of these instruments, which consist primarily of bank current accounts.
Assets and liabilities not measured at fair value on a recurring basis
For financial instruments represented by short-term receivables and payables, for which the present value of future cash flows does not differ significantly from carrying value, the Group assumes that carrying value is a reasonable approximation of the fair value. In particular, the carrying amount of current receivables and other current assets and of trade payables and other liabilities approximates their fair value.
The following table represents carrying amount and fair value for the most relevant categories of financial assets and liabilities not measured at fair value on a recurring basis:
|
At December 31,
|
|||||||||||||
|
2017
|
2016
|
||||||||||||
|
Note
|
Carrying amount
|
Fair value
|
Carrying amount
|
Fair value
|
|||||||||
|
(€ thousand)
|
|||||||||||||
|
Receivables from financing activities
|
732,947
|
|
732,947
|
|
790,377
|
|
790,377
|
|
|||||
|
Client financing
|
704,014
|
|
704,014
|
|
758,679
|
|
758,679
|
|
|||||
|
Dealer financing
|
19
|
28,933
|
|
28,933
|
|
31,698
|
|
31,698
|
|
||||
|
Total
|
732,947
|
|
732,947
|
|
790,377
|
|
790,377
|
|
|||||
|
Debt
|
25
|
1,806,181
|
|
1,819,337
|
|
1,848,041
|
|
1,849,000
|
|
||||
29. RELATED PARTY TRANSACTIONS
Pursuant to IAS 24, the related parties of the Group are entities and individuals capable of exercising control, joint control or significant influence over the Group and its subsidiaries, companies belonging to the FCA Group and Exor Group, unconsolidated subsidiaries of the Group, associates and joint ventures. In addition, members of Ferrari Group Board of Directors, Board of Statutory Auditors and executives with strategic responsibilities and their families are also considered related parties.
The Group carries out transactions with related parties on commercial terms that are normal in the respective markets, considering the characteristics of the goods or services involved. Transactions carried out by the Group with these related parties are primarily of a commercial nature and, in particular, these transactions relate to:
Transactions with FCA Group companies
|
•
|
the sale of engines and car bodies to Maserati S.p.A. (“Maserati”) which is controlled by the FCA Group;
|
|
•
|
the purchase of engine components for the use in the production of Maserati engines from FCA US LLC, which is controlled by FCA Group;
|
|
•
|
the purchase of automotive lighting and automotive components from Magneti Marelli S.p.A., Automotive Lighting Italia S.p.A., Sistemi Sospensioni S.p.A. and Magneti Marelli Powertrain Slovakia s.r.o. (which form part of “Magneti Marelli”), which are controlled by the FCA Group;
|
F-58
Ferrari N.V.
NOTES TO THE CONSOLIDATED FINANCIAL STATEMENTS
at December 31, 2017 and 2016
|
•
|
transactions with other FCA Group companies, mainly relating to the services provided by FCA Group companies, including human resources, payroll, tax, customs and procurement of insurance coverage and sponsorship revenues for the display of FCA Group company logos on the Formula 1 cars;
|
|
•
|
in 2016, the Group sold a portion of its trade and financial receivables to the FCA Bank Group, which is a joint venture between FCA Group and Credit Agricole. On derecognition of the asset, the difference between the carrying amount and the consideration received or receivable was recognized in cost of sales;
|
|
•
|
in November
2016
, the Group finalized an agreement with FCA Bank to provide financial services in Europe. Under such agreement FCA Bank acquired from the Group a majority stake in FFS GmbH for a purchase price of
€18,595 thousand
, which the Group received upon sale. In addition to the purchase price, as a result of the funding of FFS GmbH being directly provided by FCA Bank, the Group also received cash of
€431,958 thousand
.
|
Transactions with Exor Group companies
|
•
|
the Group incurs rental costs from Iveco Group companies related to the rental of trucks used by the Formula 1 racing team;
|
|
•
|
the Group earns sponsorship revenue from Iveco S.p.A.
|
Transactions with other related parties
|
•
|
the purchase of components for Formula 1 racing cars from COXA S.p.A., controlled by Piero Ferrari;
|
|
•
|
consultancy services provided by HPE S.r.l., controlled by Piero Ferrari;
|
|
•
|
sponsorship agreement relating to Formula 1 activities with Ferretti S.p.A.;
|
|
•
|
sale of cars to certain members of the Board of Directors of Ferrari N.V. and Exor.
|
Pursuant to the charter of the Audit Committee, the Audit Committee reviews and approves related party transactions in order ensure that they are entered into on arm’s length terms. In accordance with IAS 24, transactions with related parties also include compensation to Directors, the Audit Committee and managers with strategic responsibilities.
F-59
Ferrari N.V.
NOTES TO THE CONSOLIDATED FINANCIAL STATEMENTS
at December 31, 2017 and 2016
The amounts of the transactions with related parties recognized in the consolidated income statement are as follows:
|
For the years ended December 31,
|
||||||||||||||||||||||||||
|
2017
|
2016
|
2015
|
||||||||||||||||||||||||
|
Net revenues
|
Costs
(1)
|
Net financial expenses/(income)
|
Net revenues
|
Costs
(1)
|
Net financial expenses/(income)
|
Net revenues
|
Costs
(1)
|
Net financial expenses/(income)
|
||||||||||||||||||
|
(€ thousand)
|
||||||||||||||||||||||||||
|
FCA Group companies
|
||||||||||||||||||||||||||
|
Maserati
|
315,407
|
|
4,698
|
|
—
|
|
241,478
|
|
1,933
|
|
—
|
|
184,444
|
|
2,250
|
|
67
|
|
||||||||
|
FCA US LLC
|
6
|
|
44,882
|
|
—
|
|
—
|
|
37,612
|
|
—
|
|
1,253
|
|
23,562
|
|
—
|
|
||||||||
|
Magneti Marelli
|
1,866
|
|
36,670
|
|
—
|
|
1,735
|
|
29,663
|
|
—
|
|
1,397
|
|
29,746
|
|
—
|
|
||||||||
|
Other FCA Group companies
|
6,754
|
|
7,007
|
|
(1,191
|
)
|
5,472
|
|
9,163
|
|
(471
|
)
|
7,412
|
|
42,768
|
|
(11,601
|
)
|
||||||||
|
Total FCA Group companies
|
324,033
|
|
93,257
|
|
(1,191
|
)
|
248,685
|
|
78,371
|
|
(471
|
)
|
194,506
|
|
98,326
|
|
(11,534
|
)
|
||||||||
|
Exor Group companies (excluding the FCA Group)
|
283
|
|
492
|
|
—
|
|
192
|
|
173
|
|
—
|
|
277
|
|
338
|
|
—
|
|
||||||||
|
Other related parties
|
||||||||||||||||||||||||||
|
COXA S.p.A.
|
48
|
|
6,141
|
|
—
|
|
121
|
|
7,096
|
|
—
|
|
174
|
|
7,561
|
|
—
|
|
||||||||
|
HPE S.r.l.
|
—
|
|
7,525
|
|
—
|
|
—
|
|
6,447
|
|
—
|
|
11
|
|
5,518
|
|
—
|
|
||||||||
|
Other related parties
|
2,111
|
|
—
|
|
—
|
|
1,950
|
|
24
|
|
—
|
|
1,024
|
|
6
|
|
—
|
|
||||||||
|
Total other related parties
|
2,159
|
|
13,666
|
|
—
|
|
2,071
|
|
13,567
|
|
—
|
|
1,209
|
|
13,085
|
|
—
|
|
||||||||
|
Total transactions with related parties
|
326,475
|
|
107,415
|
|
(1,191
|
)
|
250,948
|
|
92,111
|
|
(471
|
)
|
195,992
|
|
111,749
|
|
(11,534
|
)
|
||||||||
|
Total for the Group
|
3,416,890
|
|
1,986,792
|
|
29,260
|
|
3,105,084
|
|
1,899,433
|
|
27,729
|
|
2,854,369
|
|
1,848,467
|
|
10,151
|
|
||||||||
______________________________
(1) Costs include cost of sales, selling, general and administrative costs and other expenses/(income).
Non-financial assets and liabilities originating from related party transactions are as follows:
|
At December 31,
|
|||||||||||||||||||||||
|
2017
|
2016
|
||||||||||||||||||||||
|
Trade receivables
|
Trade payables
|
Other current assets
(1)
|
Other liabilities
(2)
|
Trade receivables
|
Trade payables
|
Other current assets
(1)
|
Other liabilities
(2)
|
||||||||||||||||
|
(€ thousand)
|
|||||||||||||||||||||||
|
FCA Group companies
|
|||||||||||||||||||||||
|
Maserati
|
71,560
|
|
3,028
|
|
—
|
|
37,496
|
|
73,532
|
|
4,462
|
|
—
|
|
32,379
|
|
|||||||
|
FCA US LLC
|
129
|
|
6,848
|
|
—
|
|
—
|
|
166
|
|
12,529
|
|
—
|
|
—
|
|
|||||||
|
Magneti Marelli
|
899
|
|
8,103
|
|
—
|
|
—
|
|
1,739
|
|
6,702
|
|
—
|
|
—
|
|
|||||||
|
Other FCA Group companies
|
2,657
|
|
4,646
|
|
2,097
|
|
27
|
|
257
|
|
3,291
|
|
1,439
|
|
12
|
|
|||||||
|
Total FCA Group companies
|
75,245
|
|
22,625
|
|
2,097
|
|
37,523
|
|
75,694
|
|
26,984
|
|
1,439
|
|
32,391
|
|
|||||||
|
Exor Group companies (excluding the FCA Group)
|
345
|
|
202
|
|
—
|
|
—
|
|
235
|
|
41
|
|
—
|
|
—
|
|
|||||||
|
Other related parties
|
|||||||||||||||||||||||
|
COXA S.p.A.
|
3
|
|
1,142
|
|
—
|
|
—
|
|
16
|
|
1,194
|
|
—
|
|
—
|
|
|||||||
|
HPE S.r.l.
|
—
|
|
1,150
|
|
—
|
|
—
|
|
—
|
|
1,162
|
|
—
|
|
—
|
|
|||||||
|
Other related parties
|
268
|
|
—
|
|
—
|
|
—
|
|
554
|
|
68
|
|
—
|
|
4
|
|
|||||||
|
Total other related parties
|
271
|
|
2,292
|
|
—
|
|
—
|
|
570
|
|
2,424
|
|
—
|
|
4
|
|
|||||||
|
Total transactions with related parties
|
75,861
|
|
25,119
|
|
2,097
|
|
37,523
|
|
76,499
|
|
29,449
|
|
1,439
|
|
32,395
|
|
|||||||
|
Total for the Group
|
239,410
|
|
607,505
|
|
51,566
|
|
649,510
|
|
243,977
|
|
614,888
|
|
55,041
|
|
697,870
|
|
|||||||
______________________________
(1) Other current assets include other current assets and current tax receivables.
(2) Other liabilities include other liabilities and current tax payables.
F-60
Ferrari N.V.
NOTES TO THE CONSOLIDATED FINANCIAL STATEMENTS
at December 31, 2017 and 2016
Financial assets and liabilities originating from related party transactions are as follows:
|
2017
|
2016
|
||||||||||||||||
|
Receivables from financing activities
|
Current financial assets
|
Debt
|
Receivables from financing activities
|
Current financial assets
|
Debt
|
||||||||||||
|
FCA Global Finance
|
|
|
—
|
|
—
|
|
—
|
|
861
|
|
—
|
|
|||||
|
Total transactions with related parties
|
—
|
|
—
|
|
—
|
|
—
|
|
861
|
|
—
|
|
|||||
|
Total for the Group
|
732,947
|
|
15,683
|
|
1,806,181
|
|
790,377
|
|
16,276
|
|
1,848,041
|
|
|||||
Emoluments to Directors, Statutory Auditors and Key Management
The fees of the Directors and Statutory Auditors of Ferrari N.V. (and for 2015 also Ferrari S.p.A.) for carrying out their respective functions, including those in other consolidated companies, are as follows:
|
For the years ended December 31,
|
||||||||
|
2017
|
2016
|
2015
|
||||||
|
(€ thousand)
|
||||||||
|
Directors of
Ferrari N.V.
|
17,767
|
|
8,617
|
|
243
|
|
||
|
Directors of Ferrari
S.p.A.
|
—
|
|
—
|
|
2,904
|
|
||
|
Statutory auditors
|
112
|
|
105
|
|
105
|
|
||
|
Total emoluments
|
17,879
|
|
8,722
|
|
3,252
|
|
||
The aggregate compensation to Directors of Ferrari N.V. for year ended December 31, 2017 was
€17,767 thousand
, inclusive of the following:
•
€1,277 thousand
for salary; and
|
•
|
€16,490 thousand
for share-based compensation recognized for the performance period 2016 and 2017 in relation to
450 thousand
PSUs awarded to the CEO under the equity incentive plan, which covers a
five
-year performance period from 2016 to 2020, consistent with the Company’s strategic horizon. The PSU awards vest in
three
equal tranches in March 2019, 2020 and 2021, subject to the achievement of a market performance condition related to Total Shareholder Return, therefore at December 31, 2017 none of the PSU awards had vested. See Note 22
“Share-based compensation”
for information related to the equity incentive plan.
|
The aggregate compensation to Directors of Ferrari N.V. for year ended December 31, 2016 was
€8,617 thousand
and for the year ended December 31, 2015, including Ferrari S.p.A., was
€3,147 thousand
, inclusive of the following:
|
•
|
€
2,827 thousand
in
2016
and €
2,372 thousand
in
2015
for salary;
|
|
•
|
€290 thousand
in 2016 and
€775 thousand
in
2015
as the Group’s contribution to defined benefit obligations and long-term bonus plans; and
|
|
•
|
€5,500 thousand
in 2016 for compensation costs related to the retirement of the former CEO of the Group.
|
Non-Executive Directors’ compensation for the years ended December 31, 2017 and 2016 included
€418 thousand
and
€1,110 thousand
, respectively, that was settled in treasury shares in 2017.
F-61
Ferrari N.V.
NOTES TO THE CONSOLIDATED FINANCIAL STATEMENTS
at December 31, 2017 and 2016
Following the election of the Board of Directors at the Annual General Meeting of Shareholders on April 15, 2016, Non-Executive Directors had the option to receive the board retainer fee component of their Directors’ compensation in
50%
cash and
50%
Ferrari common shares, or alternatively, to receive
100%
in Ferrari common shares. Following the Annual General Meeting of Shareholders on April 14, 2017, Non-Executive Directors’ compensation is fully settled in cash. The amounts settled in Ferrari common shares were accounted for as equity-settled share-based compensation and recognized as increases to equity in the relevant year.
The aggregate compensation for remaining key management in
2017
was
€16,015 thousand
(
€12,290 thousand
in
2016
), inclusive of the following:
|
•
|
€10,964 thousand
for salary (
€11,059 thousand
in 2016);
|
|
•
|
€314 thousand
for long-term benefits (
€1,231 thousand
in
2016
); and
|
|
•
|
€4,737 thousand
for share-based compensation in relation to PSUs and RSUs awarded to key management under the equity incentive plan for the performance period covering 2016 and 2017. The PSU and RSU awards vest in three equal tranches in March 2019, 2020 and 2021, subject to the achievement of a market performance condition related to Total Shareholder Return, therefore at December 31, 2017 none of the PSU or RSU awards had vested. See Note 22
“Share-based compensation”
for information related to the equity incentive plan.
|
30. COMMITMENTS
Arrangements with key suppliers
From time to time, in the ordinary course of business, the Group enters into various arrangements with key third party suppliers in order to establish strategic and technological advantages. A limited number of these arrangements contain unconditional purchase obligations to purchase a fixed or minimum quantity of goods and/or services with fixed and determinable price provisions.
Arrangements with sponsors
Certain of the Group’s sponsorship contracts include terms whereby the Group is obligated to purchase a minimum quantity of goods and/or services from its sponsors.
Future minimum purchase obligations under these arrangements at
December 31, 2017
were as follows:
|
At December 31, 2017
|
||||||||||||||
|
Due within one year
|
Due between one and three years
|
Due between three and five years
|
Due beyond five years
|
Total
|
||||||||||
|
(€ thousand)
|
||||||||||||||
|
Minimum purchase obligations
|
137,250
|
|
101,988
|
|
5,760
|
|
4,372
|
|
249,370
|
|
||||
Operating lease agreements
The future aggregate minimum lease payments under non-cancellable operating leases, mainly relating to the lease of property and cars, are as follows:
|
At December 31, 2017
|
||||||||||||||
|
Due within one year
|
Due between one and three years
|
Due between three and five years
|
Due beyond five years
|
Total
|
||||||||||
|
(€ thousand)
|
||||||||||||||
|
Future minimum lease payments under operating lease agreements
|
694
|
|
1,353
|
|
105
|
|
—
|
|
2,152
|
|
||||
F-62
Ferrari N.V.
NOTES TO THE CONSOLIDATED FINANCIAL STATEMENTS
at December 31, 2017 and 2016
During
2017
, the Group’s operating lease expenses amounted to €
16,964 thousand
(€
14,820 thousand
in
2016
and €
19,612 thousand
in
2015
).
31. QUALITATIVE AND QUANTITATIVE INFORMATION ON FINANCIAL RISKS
The Group is exposed to the following financial risks connected with its operations:
|
•
|
financial market risk (principally relating to foreign currency exchange rates, and to a much lesser extent, interest rates), as the Group operates internationally in different currencies;
|
|
•
|
liquidity risk, with particular reference to the availability of funds and access to the credit market, should the Group require, and to financial instruments in general;
|
|
•
|
credit risk, arising both from its normal commercial relations with final clients and dealers, and its financing activities.
|
These risks could significantly affect the Group’s financial position, results of operations and cash flows, and for this reason the Group identifies and monitors these risks, in order to detect potential negative effects in advance and take the necessary action to mitigate them, primarily through its operating and financing activities and if required, through the use of derivative financial instruments.
The following section provides qualitative and quantitative disclosures on the effect that these risks may have upon the Group. The quantitative data reported in the following section does not have any predictive value. In particular, the sensitivity analysis on finance market risks does not reflect the complexity of the market or the reaction which may result from any changes that are assumed to take place.
Financial market risks
Due to the nature of the Group’s business, the Group is exposed to a variety of market risks, including foreign currency exchange rate risk and to a lesser extent, interest rate risk.
The Group’s exposure to foreign currency exchange rate risk arises from the geographic distribution of the Group’s shipments, as the Group generally sells its models in the currencies of the various markets in which the Group operates, while the Group’s industrial activities are all based in Italy, and primarily denominated in Euro.
The Group’s exposure to interest rate risk arises from the need to fund certain activities and the necessity to deploy surplus funds. Changes in market interest rates may have the effect of either increasing or decreasing the Group’s net profit/(loss), thereby indirectly affecting the costs and returns of financing and investing transactions.
These risks could significantly affect the Group’s financial position, results of operations and cash flows, and for this reason these risks are identified and monitored, in order to detect potential negative effects in advance and take the necessary actions to mitigate them, primarily through the Group’s operating and financing activities, and if required, through the use of derivative financial instruments.
The Group has in place various risk management policies, which primarily relate to foreign exchange, interest rate and liquidity risks. The Group’s risk management policies permit derivatives to be used for managing exposures to foreign exchange rates and interest rates. Counterparties to these agreements are major financial institutions. Derivatives cannot be entered into for speculative purposes.
In particular, the Group used derivative financial instruments as cash flow hedges for the purpose of fixing the foreign currency exchange rate at which a predetermined proportion of forecasted transactions denominated in foreign currencies will be accounted for. Accordingly, as a result of applying risk management policies with respect to foreign currency exchange exposure, the Group’s results of operations have not been fully exposed to fluctuations in foreign currency exchange rates. However, despite these risk management policies and hedging transactions, sudden adverse movements in foreign currency exchange rates could have a significant effect on the Group’s earnings and cash flows.
F-63
Ferrari N.V.
NOTES TO THE CONSOLIDATED FINANCIAL STATEMENTS
at December 31, 2017 and 2016
The Group also enters into interest rate caps as requested by certain of its securitization agreements.
Information on the fair value of derivative financial instruments held is provided in Note 20.
Information on foreign currency exchange rate risk
The Group is exposed to risk resulting from changes in foreign currency exchange rates, which can affect its earnings and equity. In particular:
|
•
|
Where a Group company incurs costs in a currency different from that of its revenues, any change in foreign currency exchange rates can affect the operating results of that company. In
2017
, the total trade flows exposed to foreign currency exchange rate risk amounted to the equivalent of
51 percent
of the Group’s turnover (
57 percent
in
2016
).
|
|
•
|
The main foreign currency exchange rate to which the Group is exposed is the Euro/U.S. Dollar for sales in U.S. Dollar in the United States and other markets where the U.S. Dollar is the reference currency. In
2017
, the value of commercial activity exposed to fluctuations in the Euro/U.S. Dollar exchange rate accounted for approximately
62 percent
(
60 percent
in
2016
) of the total currency risk from commercial activity. In 2017, the commercial activity exposed to the Euro/Pound Sterling exchange rate exceeded 10 percent while in 2016 such exposure was below 10 percent. Other significant exposures included the exchange rate between the Euro and the following currencies: Japanese Yen, Chinese Renminbi, Swiss Franc, Canadian Dollar and Australian Dollar. None of these exposures, taken individually, exceeded 10 percent of the Group’s total foreign currency exchange rate exposure for commercial activity in
2017
. It is the Group’s policy to use derivative financial instruments to hedge between
50
and
90 percent
of certain exposures subject to foreign currency exchange risk for up to twelve months.
|
|
•
|
Several subsidiaries are located in countries that are outside the Eurozone, in particular the United States, the United Kingdom, Switzerland, China, Hong Kong, Japan, Australia and Singapore. As the Group’s reporting currency is the Euro, the income statements of those companies are converted into Euro using the average exchange rate for the period and, even if revenues and margins are unchanged in local currency, changes in exchange rates can impact the amount of revenues, costs and profit as restated in Euro.
|
|
•
|
The amount of assets and liabilities of consolidated companies that report in a currency other than the Euro may vary from period to period as a result of changes in exchange rates. The effects of these changes are recognized directly in equity as a component of other comprehensive income/(loss) under gains/(losses) from currency translation differences.
|
The Group monitors its principal exposure to conversion exchange risk, although there was no specific hedging in this respect at the reporting date.
Exchange differences arising on the settlement of monetary items or on reporting monetary items at rates different from those at which they were initially recorded during the period or in previous financial statements, are recognized in the consolidated income statement within the net financial income/(expenses) line item or as cost of sales for charges arising from financial services companies.
The impact of foreign currency exchange rate differences recorded within financial income/(expenses) for the year ended
December 31, 2017
, except for those arising on financial instruments measured at fair value, amounted to net losses of
€18,059 thousand
(net gains of
€8,335 thousand
and
€10,794 thousand
for the years ended
December 31, 2016
and
2015
, respectively).
The impact of foreign currency exchange rate differences arising from financial services companies recognized under cost of sales, except for those arising on financial instruments measured at fair value, amounted to net losses of
€58,808 thousand
in 2016 (net gains of
€20,908 thousand
in
2015
). Following the deconsolidation of FFS GmbH in November 2016, all of the Group’s financial services activities are conducted in the functional currency of the related financial services companies, therefore, such impact in 2017 was nil.
F-64
Ferrari N.V.
NOTES TO THE CONSOLIDATED FINANCIAL STATEMENTS
at December 31, 2017 and 2016
Except as noted above, there have been no substantial changes in
2017
in the nature or structure of exposure to foreign currency exchange rate risk or in the Group’s hedging policies.
The potential decrease in fair value of derivative financial instruments held by the Group at
December 31, 2017
to hedge against foreign currency exchange rate risk, which would arise in the case of a hypothetical, immediate and adverse change of
10 percent
in the exchange rates of the major foreign currencies with the Euro, would be approximately
€45,439 thousand
(
€128,753 thousand
at
December 31, 2016
). Receivables, payables and future trade flows for which hedges have been put in place were not included in the analysis. It is reasonable to assume that changes in foreign currency exchange rates will produce the opposite effect, of an equal or greater amount, on the underlying transactions that have been hedged.
Information on interest rate risk
The Group’s exposure to interest rate risk, though less significant, arises from the need to fund financial services activities and the necessity to deploy surplus funds. Changes in market interest rates may have the effect of either increasing or decreasing the Group’s net profit/(loss), thereby indirectly affecting the costs and returns of financing and investing transactions.
The Group’s most significant floating rate financial assets at
December 31, 2017
were cash and cash equivalents and certain receivables from financing activities (related to client and dealer financing) while
32 percent
of our total debt bears floating rates of interest. At
December 31, 2017
, a
10
basis point decrease in interest rates on floating rate financial assets and debt, with all other variables held constant, would have resulted in a decrease in profit before taxes of
€225 thousand
on an annual basis (an increase of
€367 thousand
at
December 31, 2016
). The analysis is based on the assumption that floating rate financial assets and debt which expires during the projected
12
-month period will be renewed or reinvested in similar instruments, bearing the hypothetical short-term interest rates.
Liquidity risk
Liquidity risk arises if the Group is unable to obtain the funds needed to carry out its operations under economic conditions. The main determinant of the Group’s liquidity position is the cash generated by or used in operating and investing activities.
From an operating point of view, the Group manages liquidity risk by monitoring cash flows and keeping an adequate level of funds at its disposal. The main funding operations and investments in cash and marketable securities of the Group are centrally managed or supervised by the treasury department with the aim of ensuring effective and efficient management of the Group’s liquidity. The Group has established series of policies which are managed or supervised centrally by the treasury department with the purpose of optimizing the management of funds and reducing liquidity risk which include:
|
•
|
centralizing liquidity management through the use of cash pooling arrangement
|
|
•
|
maintaining a conservative level of available liquidity
|
|
•
|
diversifying sources of funding
|
|
•
|
obtaining adequate credit lines
|
|
•
|
monitoring future liquidity requirements on the basis of business planning
|
Intercompany financing between Group entities is not restricted other than through the application of covenants requiring that transactions with related parties be conducted at arm’s length terms.
Details on the maturity profile of the Group’s financial assets and liabilities and on the structure of derivative financial instruments are provided in Notes 20 and 26. Details of the repayment of derivative financial instruments are provided in Note 20.
During 2015 the Group entered into a new revolving credit facility of
€500 million
. This facility was entirely undrawn at
December 31, 2016
and
2017
. The Group believes that the funds currently available to it, in addition to those that will be generated from operating activities, will enable Ferrari to satisfy the requirements of its investing activities and working capital needs, fulfill its obligations to repay its debt and ensure an appropriate level of operating and strategic flexibility. The Group, therefore believes there is no significant risk of a lack of liquidity.
F-65
Ferrari N.V.
NOTES TO THE CONSOLIDATED FINANCIAL STATEMENTS
at December 31, 2017 and 2016
Credit risk
Credit risk is the risk of economic loss arising from the failure to collect a receivable. Credit risk encompasses the direct risk of default and the risk of a deterioration of the creditworthiness of the counterparty.
The maximum credit risk to which the Group is theoretically exposed at
December 31, 2017
is represented by the carrying amounts of the financial assets stated in the consolidated statement of financial position sheet and the nominal value of the guarantees provided.
Dealers and clients are subject to a specific evaluation of their creditworthiness. Additionally, it is Group practice to obtain financial guarantees against risks associated with credit granted for the purchase of cars and parts. These guarantees are further strengthened, where possible, by retaining title on cars subject to financing agreement.
Credit positions of material significance are evaluated on an individual basis. Where objective evidence exists that they are uncollectible, in whole or in part, specific write-downs are recognized. The amount of the write-down is based on an estimate of the recoverable cash flows, timing of those cash flows, the cost of recovery and the fair value of any guarantees received.
Receivables from financing activities amounting to
€732,947 thousand
at
December 31, 2017
(
€790,377 thousand
at
December 31, 2016
) are shown net of the allowance for doubtful accounts amounting to
€6,948 thousand
(
€11,556 thousand
at
December 31, 2016
). After considering the allowance for doubtful accounts,
€11,943 thousand
of receivables were overdue (€
41,594 thousand
at
December 31, 2016
). Therefore, overdue receivables represent a minor portion of receivables from financing activities.
Receivables from financing activities relate entirely to the financial services portfolio and such receivables are generally secured on the titles of cars or other guarantees.
Trade receivables amounting to
€239,410 thousand
at
December 31, 2017
(
€243,977 thousand
at
December 31, 2016
) are shown net of the allowance for doubtful accounts amounting to
€21,993 thousand
(
€19,174 thousand
at
December 31, 2016
). After considering the allowance for doubtful accounts,
€32,336 thousand
of receivables were overdue (€
18,567 thousand
at
December 31, 2016
).
32. ENTITY-WIDE DISCLOSURES
The following table presents an analysis of net revenues by geographic location of the Group’s clients:
______________________________
|
For the years ended December 31,
|
||||||||
|
2017
|
2016
|
2015
|
||||||
|
(€ thousand)
|
||||||||
|
Italy
|
563,921
|
|
387,184
|
|
238,532
|
|
||
|
Other EMEA
|
1,308,261
|
|
1,314,788
|
|
1,209,916
|
|
||
|
Americas
(1)
|
920,858
|
|
835,045
|
|
884,971
|
|
||
|
China, Hong Kong and Taiwan (on a combined basis)
|
282,550
|
|
272,223
|
|
257,249
|
|
||
|
Rest of APAC
(2)
|
341,300
|
|
295,844
|
|
263,701
|
|
||
|
Total net revenues
|
3,416,890
|
|
3,105,084
|
|
2,854,369
|
|
||
|
(1)
|
Americas includes the United States of America, Canada, Mexico, the Caribbean and of Central and South America
|
|
(2)
|
Rest of APAC mainly includes Japan, Australia, Singapore, Indonesia and South Korea
|
F-66
Ferrari N.V.
NOTES TO THE CONSOLIDATED FINANCIAL STATEMENTS
at December 31, 2017 and 2016
The following table presents an analysis of non-current assets other than financial instruments and deferred tax assets by geographic location:
|
At December 31,
|
|||||||||||||||||
|
2017
|
2016
|
||||||||||||||||
|
Property, plant and equipment
|
Goodwill
|
Intangible assets
|
Property, plant and equipment
|
Goodwill
|
Intangible assets
|
||||||||||||
|
(€ thousand)
|
|||||||||||||||||
|
Italy
|
704,262
|
|
785,182
|
|
439,369
|
|
661,770
|
|
785,182
|
|
353,116
|
|
|||||
|
Other EMEA
|
2,368
|
|
—
|
|
—
|
|
2,430
|
|
—
|
|
—
|
|
|||||
|
Americas
(1)
|
2,760
|
|
—
|
|
812
|
|
3,877
|
|
—
|
|
988
|
|
|||||
|
China, Hong Kong and Taiwan (on a combined basis)
|
264
|
|
—
|
|
—
|
|
258
|
|
—
|
|
—
|
|
|||||
|
Rest of APAC
(2)
|
606
|
|
—
|
|
275
|
|
948
|
|
—
|
|
290
|
|
|||||
|
Total
|
710,260
|
|
785,182
|
|
440,456
|
|
669,283
|
|
785,182
|
|
354,394
|
|
|||||
______________________________
|
(1)
|
Americas includes the United States of America, Canada, Mexico, the Caribbean and of Central and South America
|
|
(2)
|
Rest of APAC mainly includes Japan, Australia, Singapore, Indonesia and South Korea
|
33. SUBSEQUENT EVENTS
The Group has evaluated subsequent events through February 23, 2018, which is the date the Consolidated Financial Statements were authorized for issuance.
On February 9, 2018 the Company announced its intention to launch a share buyback program. The Company expects the program to involve the repurchase from time to time of up to
€100 million
in common shares. The program is intended to optimize the capital structure of the Company. Shares repurchased may be used to meet the Company’s obligations arising from the equity incentive plan approved in 2017. Under the program, as of February 20, 2018 the Company purchased an aggregate of
190,600
common shares on the New York Stock Exchange (NYSE) for an aggregate consideration of $
22,838,301
. As of February 20, 2018 the Company held
5,160,225
common shares in treasury, and in total the Company held
2.06
percent of the total issued share capital in treasury, including the common shares and the special voting shares.
On February 20, 2018, the Company announced that Scuderia Ferrari has extended its partnership agreement with Philip Morris International, continuing a collaboration of nearly five decades.
On February 21, 2018, the Group announced that it has selected the 88th edition of the Geneva International Motor Show for the world premiere of the Ferrari 488 Pista, the Group’s successor to Ferrari’s V8-engined special series. The Ferrari 488 Pista marks a significant step forward from the previous special series in terms of both sporty dynamics and for the level of technological carryover from racing.
On February 22, 2018, the Company presented the new car for the 2018 Formula 1 World Championship.
On February 23, 2018, the Board of Directors of Ferrari N.V. recommended to the Company’s shareholders that the Company declare a dividend of
€0.71
per common share, totaling approximately
€134 million
. The proposal is subject to the approval of the Company’s shareholders at the AGM to be held on April 13, 2018.
F-67
TABLE OF CONTENTS
Part IItem 1. Identity Of Directors, Senior Management and AdvisersItem 2. Offer Statistics and Expected TimetableItem 3. Key InformationItem 4. Information on The CompanyItem 4A. Unresolved Staff CommentsItem 5. Operating and Financial Review and ProspectsItem 3. A. Selected Financial Data,Item 3. D. Risk FactorsItem 6. Directors, Senior Management and EmployeesItem 7. Major Shareholders and Related Party TransactionsItem 8. Financial InformationItem 9. The Offer and ListingItem 10. Additional InformationItem 11. Quantitative and Qualitative Disclosures About Market RiskItem 12. Description Of Securities Other Than Equity SecuritiesPart IIItem 13. Defaults, Dividends Arrearages and DelinquenciesItem 14. Material Modifications To The Rights Of Security Holders and Use Of ProceedsItem 15. Controls and ProceduresItem 16A. Audit Committee Financial ExpertItem 16B. Code Of EthicsItem 16C. Principal Accountant Fees and ServicesItem 16D. Exemptions From The Listing Standards For Audit CommitteesItem 16E. Purchases Of Equity Securities By The Issuer and Affiliated PurchasersItem 16F. Change in Registrant S Certifying AccountantItem 16F. Change in RegistrantItem 16G. Corporate GovernanceItem 16H. Mine Safety DisclosurePart IIIItem 17. Financial StatementsItem 18. Financial StatementsItem 19. Exhibits