LIVERAMP HOLDINGS, INC.
10-Ks and 10-Qs
|
|
|
|
|
|
|
|
|
|
|
|
|
|
|
|
|
|
|
|
|
|
|
|
|
|
|
|
|
|
|
|
|
|
|
|
|
|
|
|
|
|
|
|
|
|
|
|
|
|
|
|
|
|
|
|
|
|
|
UNITED STATES
SECURITIES AND EXCHANGE COMMISSION
Washington, D. C. 20549
FORM 10-K
(Mark One)
|
☒
|
ANNUAL REPORT PURSUANT TO SECTION 13 OR 15(d) OF THE SECURITIES EXCHANGE ACT OF 1934
|
For the fiscal year ended
March 31, 2018
OR
|
☐
|
TRANSITION REPORT PURSUANT TO SECTION 13 OR 15(d) OF THE SECURITIES EXCHANGE ACT OF 1934
|
For the transition period from
to
Commission file number 0-13163
ACXIOM CORPORATION
(Exact name of registrant as specified in its charter)
|
DELAWARE
|
71-0581897
|
|
(State or Other Jurisdiction of Incorporation
or Organization)
|
(I.R.S. Employer Identification No.)
|
|
301 E. Dave Ward Drive,
|
72032
|
|
Conway, Arkansas
(Address of Principal Executive Offices)
|
(Zip Code)
|
(501) 342-1000
(Registrant’s telephone number, including area code)
Securities registered pursuant to Section 12(b) of the Act:
|
Title of each class
|
Name of each exchange on which registered
|
|
|
Common Stock, $.10 Par Value
|
The NASDAQ Global Select Market
|
|
Securities registered pursuant to Section 12(g) of the Act:
None
Indicate by check mark if the registrant is a well-known seasoned issuer, as defined in Rule 405 of the Securities Act.
Yes [X] No [ ]
Indicate by check mark if the registrant is not required to file reports pursuant to Section 13 or Section 15(d) of the Exchange Act.
Yes [ ] No [X]
Indicate by check mark whether the registrant (1) has filed all reports required to be filed by Section 13 or 15(d) of the Securities Exchange Act of 1934 during the preceding 12 months (or for such shorter period that the registrant was required to file such reports), and (2) has been subject to such filing requirements for the past 90 days.
Yes [X] No [ ]
Indicate by check mark whether the registrant has submitted electronically and posted on its corporate Web site, if any, every Interactive Data File required to be submitted and posted pursuant to Rule 405 of Regulation S-T (§232.405 of this chapter) during the preceding 12 months (or for such shorter period that the registrant was required to submit and post such files).
Yes [X] No [ ]
Indicate by check mark if disclosure of delinquent filers pursuant to Item 405 of Regulation S-K (§229.405 of this chapter) is not contained herein, and will not be contained, to the best of registrant’s knowledge, in definitive proxy or information statements incorporated by reference in Part III of this Form 10-K or any amendment to this Form 10-K. [ ]
Indicate by check mark whether the registrant is a large accelerated filer, an accelerated filer, a non-accelerated filer, or a smaller reporting company. See the definitions of “large accelerated filer,” “accelerated filer,” “smaller reporting company” and “emerging growth company” in Rule 12b-2 of the Exchange Act.
|
Large accelerated filer [X]
|
Accelerated filer [ ]
|
|
Non-accelerated filer [ ]
|
Smaller reporting company [ ]
|
|
(Do not check if a smaller reporting company)
|
Emerging growth company [ ]
|
If an emerging growth company, indicate by check mark if the registrant has elected not to use the extended transition period for complying with any new or revised financial accounting standards provided pursuant to Section 13(a) of the Exchange Act. [ ]
Indicate by check mark whether the registrant is a shell company (as defined in Rule 12b-2 of the Act).
Yes [ ] No [X]
The aggregate market value of the voting stock held by non-affiliates of the registrant, based upon the closing sale price of the registrant’s Common Stock, $.10 par value per share, as of the last business day of the registrant’s most recently completed second fiscal quarter as reported on the NASDAQ Global Select Market was approximately $1,887,964,114. (For purposes of determination of the above stated amount only, all directors, executive officers and 10% or more shareholders of the registrant are presumed to be affiliates.)
The number of shares of Common Stock, $.10 par value per share, outstanding as of
May 21, 2018
was
77,060,281
.
Table of Contents
|
Page
|
|
2
DOCUMENTS INCORPORATED BY REFERENCE
Portions of the Proxy Statement for the 2018 Annual Meeting of Stockholders (“2018 Proxy Statement”) of Acxiom Corporation (“Acxiom,” the “Company,” “we”, “us”, or “our”) are incorporated by reference into Part III of this Form 10-K.
3
AVAILABILITY OF SEC FILINGS AND CORPORATE GOVERNANCE INFORMATION
Our website address is www.acxiom.com, where copies of documents which we have filed with the Securities and Exchange Commission (“SEC”) may be obtained free of charge as soon as reasonably practicable after being filed electronically. Included among those documents are our Annual Reports on Form 10-K, Quarterly Reports on Form 10-Q, Current Reports on Form 8-K, and amendments to those reports filed or furnished pursuant to Section 13(a) or 15(d) of the Securities Exchange Act of 1934, as amended (“Exchange Act”). Copies may also be obtained through the SEC’s EDGAR site, or by sending a written request for copies to Acxiom Investor Relations, 100 Redwood Shores Parkway, Redwood City, California 94065. Copies of all our SEC filings were available on our website during the past fiscal year covered by this Form 10-K. In addition, at the “Corporate Governance” section of our website, we have posted copies of our Corporate Governance Principles, the charters for the Audit/Finance, Compensation, Executive, and Governance/Nominating Committees of the Board of Directors, the codes of ethics
applicable to directors, financial personnel and all employees, and other information relating to the governance of the Company. Although referenced herein, information contained on or connected to our corporate website is not incorporated by reference into this annual report on Form 10-K and should not be considered part of this report or any other filing we make with the SEC.
CAUTIONARY STATEMENTS RELEVANT TO FORWARD-LOOKING INFORMATION
This Annual Report on Form 10-K, including, without limitation, the items set forth on pages F-3 – F-21 in Management’s Discussion and Analysis of Financial Condition and Results of Operations, contains and may incorporate by reference certain statements that may be deemed to be “forward-looking statements” within the meaning of the Private Securities Litigation Reform Act of 1995, as amended (the “PSLRA”), and that are intended to enjoy the protection of the safe harbor for forward-looking statements provided by the PSLRA. These statements, which are not statements of historical fact, may contain estimates, assumptions, projections and/or expectations regarding the Company’s financial position, results of operations, market position, product development, growth opportunities, economic conditions, and other similar forecasts and statements of expectation. Forward-looking statements are often identified by words or phrases such as “anticipate,” “estimate,” “plan,” “expect,” “believe,” “intend,” “foresee,” or the negative of these terms or other similar variations thereof. These forward-looking statements are not guarantees of future performance and are subject to a number of factors and uncertainties that could cause the Company’s actual results and experiences to differ materially from the anticipated results and expectations expressed in the forward-looking statements.
Forward-looking statements may include but are not limited to the following:
|
•
|
management’s expectations about the macro economy;
|
|
•
|
statements containing a projection of revenues, income (loss), earnings (loss) per share, capital expenditures, dividends, capital structure, or other financial items;
|
|
•
|
statements of the plans and objectives of management for future operations, including, but not limited to, those statements contained under the heading “Acxiom’s Growth Strategy” in Part I, Item 1 of this Annual Report on Form 10-K;
|
|
•
|
statements of future economic performance, including, but not limited to, those statements contained in Management’s Discussion and Analysis of Financial Condition and Results of Operations contained in this Annual Report on Form 10-K;
|
|
•
|
statements containing any assumptions underlying or relating to any of the above statements; and
|
|
•
|
statements containing a projection or estimate.
|
Among the factors that may cause actual results and expectations to differ from anticipated results and expectations expressed in such forward-looking statements are the following:
|
•
|
the risk factors described in Part I, “Item 1A. Risk Factors” and elsewhere in this report and those described from time to time in our future reports filed with the SEC;
|
4
|
•
|
the possibility that, in the event a change of control of the Company is sought, certain clients may attempt to invoke provisions in their contracts allowing for termination upon a change in control, which may result in a decline in revenue and profit;
|
|
•
|
the possibility that the integration of acquired businesses may not be as successful as planned;
|
|
•
|
the possibility that the fair value of certain of our assets may not be equal to the carrying value of those assets now or in future time periods;
|
|
•
|
the possibility that sales cycles may lengthen;
|
|
•
|
the possibility that we will not be able to properly motivate our sales force or other associates;
|
|
•
|
the possibility that we may not be able to attract and retain qualified technical and leadership associates, or that we may lose key associates to other organizations;
|
|
•
|
the possibility that we will not be able to continue to receive credit upon satisfactory terms and conditions;
|
|
•
|
the possibility that competent, competitive products, technologies or services will be introduced into the marketplace by other companies;
|
|
•
|
the possibility that there will be changes in consumer or business information industries and markets that negatively impact the Company;
|
|
•
|
the possibility that we will not be able to protect proprietary information and technology or to obtain necessary licenses on commercially reasonable terms;
|
|
•
|
the possibility that there will be changes in the legislative, accounting, regulatory and consumer environments affecting our business, including but not limited to litigation, legislation, regulations and customs impairing our ability to collect, manage, aggregate and use data;
|
|
•
|
the possibility that data suppliers might withdraw data from us, leading to our inability to provide certain products and services;
|
|
•
|
the possibility that data purchasers will reduce their reliance on us by developing and using their own, or alternative, sources of data generally or with respect to certain data elements or categories;
|
|
•
|
the possibility that we may enter into short-term contracts which would affect the predictability of our revenues;
|
|
•
|
the possibility that the amount of ad hoc, volume-based and project work will not be as expected;
|
|
•
|
the possibility that we may experience a loss of data center capacity or interruption of telecommunication links or power sources;
|
|
•
|
the possibility that we may experience failures or breaches of our network and data security systems, leading to potential adverse publicity, negative customer reaction, or liability to third parties;
|
|
•
|
the possibility that our clients may cancel or modify their agreements with us;
|
|
•
|
the possibility that we will not successfully complete customer contract requirements on time or meet the service levels specified in the contracts, which may result in contract penalties or lost revenue;
|
|
•
|
the possibility that we experience processing errors which result in credits to customers, re-performance of services or payment of damages to customers;
|
|
•
|
general and global negative economic conditions; and
|
|
•
|
our tax rate and other effects of the changes to U.S. federal tax law.
|
With respect to the provision of products or services outside our primary base of operations in the United States, all of the above factors apply, along with the difficulty of doing business in numerous sovereign jurisdictions due to differences in scale, competition, culture, laws and regulations.
5
Other factors are detailed from time to time in periodic reports and registration statements filed with the SEC. The Company believes that it has the product and technology offerings, facilities, associates and competitive and financial resources for continued business success, but future revenues, costs, margins and profits are all influenced by a number of factors, including those discussed above, all of which are inherently difficult to forecast.
In light of these risks, uncertainties and assumptions, the Company cautions readers not to place undue reliance on any forward-looking statements. Forward-looking statements and such risks, uncertainties and assumptions speak only as of the date of this Annual Report on Form 10-K, and the Company expressly disclaims any obligation or undertaking to update or revise any forward-looking statements contained herein, to reflect any change in our expectations with regard thereto, or any other change based on the occurrence of future events, the receipt of new information or otherwise, except to the extent otherwise required by law.
6
Acxiom Corporation is a global technology and enablement services company with a vision to transform data into value for everyone. Through a simple, open approach to connecting systems and data, we provide the data foundation for the world’s best marketers. By making it safe and easy to activate, validate, enhance, and unify data, we provide marketers with the ability to deliver relevant messages at scale and tie those messages back to actual results. Our products and services enable people-based marketing, allowing our clients to generate higher return on investment and drive better omni-channel customer experiences.
Acxiom is a Delaware corporation founded in 1969 in Conway, Arkansas. Our common stock is listed on the NASDAQ Global Select Market under the symbol “ACXM.” We serve a global client base from locations in the United States, Europe, and the Asia-Pacific (“APAC”) region. Our client list includes many of the world’s largest and best-known brands across most major industry verticals, including but not limited to financial, insurance and investment services, automotive, retail, telecommunications, high tech, healthcare, travel, entertainment, non-profit, and government.
We excel in relationships with organizations that view the activation, management, and application of data as an integral component of their business. We generate our revenue from the following business segments:
|
•
|
Connectivity.
Our Connectivity segment enables clients to build an omni-channel view of the customer and activate that understanding across the open marketing ecosystem.
|
|
•
|
Audience Solutions.
Our Audience Solutions segment helps clients validate the accuracy of their data, enhance it with additional insight, and keep it up to date, enabling clients to reach desired audiences with highly relevant messages.
|
|
•
|
Marketing Services.
Our Marketing Services segment helps clients unify data at the individual level in a privacy-safe environment and use it to achieve data-driven results.
|
Across these segments, we leverage a common set of technical capabilities, each of which delivers increasing value with scale. We provide the largest number of integrations to marketing platforms and data providers in the digital marketing ecosystem, enabling our clients to innovate through their preferred choice of technology, data, and services providers. Our industry-leading recognition and data assets power best-in-class consumer identification and linking with the highest level of accuracy. And, our expertise in data stewardship enables us to process large volumes ethically and securely in accordance with regional data protection requirements.
Together, our products and services form the “power grid” for data, the critical foundation for people-based marketing that brands need to engage consumers across today’s highly fragmented landscape of channels and devices.
Industry Trends
Overwhelming Complexity in Digital Marketing Ecosystem
Marketing has evolved significantly in recent years driven by rapid innovation and an explosion of data, channels, devices, and applications. Historically, brands interacted with consumers through a limited number of channels, with limited visibility into the activities taking place. Today, companies interact with consumers across a growing number of touchpoints, including online, social, mobile and point-of-sale. The billions of interactions that take place each day between brands and consumers create a trove of valuable data that can be collected and analyzed. However, most companies are unable to cut through the complexity to effectively harness and leverage this data.
Increasing Fragmentation
Today, customer journeys span multiple channels and devices over time, resulting in data silos and fragmented identities. As consumers engage with brands across various touchpoints – over the web, mobile devices and applications, by email and television, and in physical stores – they may not be represented as single unique individuals with complex behaviors, appearing instead as disparate data points with dozens of different identifiers. Becky Smith who lives at 123 Main Street may appear as beckys@acme.com when she uses Facebook, becky@yahoo.com when she signs into Yahoo Finance, cookie 123 when she browses msn.com, cookie ABC when
7
she browses aol.com, and so on. As a result, marketers struggle to understand the cross-channel, cross-device habits of consumers and the different steps they take on their path to conversion. More specifically, data silos and fragmented identities prevent brands from being able to resolve all relevant data to a specific individual; this poses a challenge to formation of accurate, actionable insights about a brand’s consumers or campaigns.
Marketing Waste
Every day, brands spend billions of dollars on advertising and marketing, yet many of the messages they deliver are irrelevant, repetitive, mistimed, or simply reach the wrong audience. In addition, as the marketing landscape continues to grow and splinter across a growing array of online and offline channels, it is increasingly difficult to attribute marketing spend to a measurable outcome, such as an in-store visit or sale. Wasted marketing spend is largely driven by the fragmented ecosystem of brands, data providers, marketing applications, media providers, and agencies that are involved in the marketing process, but operate without cohesion. Without a common understanding of consumer identity to unify otherwise siloed data, brands are unable to define accurate audience segments and derive insights that would enable better decision making.
Heightened Privacy and Security Concerns
Diligence in the areas of consumer privacy and security is and will continue to be paramount. Consumer understanding of the benefits of marketing technology often lags the pace of innovation, inspiring new demands from government agencies and consumer advocacy groups across the world. These factors compound the liability every company faces when managing and activating consumer data.
The New Era of People-Based Marketing
Historically, marketers were forced to cast a wide net to reach a desired audience. They might, for example, have run a television commercial during a specific program or placed generic advertising alongside certain types of web content, often exposing their message to millions of consumers outside their target audience. Today, however, rich data opens the door to granular audience targeting and better, more engaging customer experiences. For example, digital publishers like Facebook and Twitter now provide marketers with the ability to target very specific audiences – males, over the age of 30, who live in zip code 94123, and own pets, for instance.
Consumers are demanding personalization, and every piece of marketing content served has the potential to be individually relevant, addressable, and measurable. By understanding which devices, email addresses, and postal addresses relate to the same individual, marketers can deliver seamless experiences as consumers engage a brand across touchpoints. At the same time, by targeting consumers at the individual level, organizations can reduce marketing waste and more easily attribute their marketing spend to actual results.
People-Based Marketing is Complex and Challenging to Navigate
Innovation has fueled the growth of a highly-fragmented technology landscape, forcing brands to contend with thousands of marketing technologies and data silos. To make every customer experience relevant across channels and devices, organizations need a data foundation and common network that can break down those silos, make data portable, and accurately recognize people throughout the customer journey. Marketing is becoming more audience-centric, automated, and optimized. However, a number of important factors make people-based marketing in the digital era complex and challenging to navigate:
|
•
|
Recognition.
For organizations to target audiences at the individual level, they must be able to recognize consumers across all channels and devices, and link multiple identifiers and data elements back to a persistent identifier to create a single view of the customer.
|
|
•
|
Scaled Data Assets.
Quality, depth, and
recency of data matters when deriving linkages between identifiers. Organizations must have access to an extensive set of data and be able to match that data with a high degree of accuracy to perform true cross-device audience targeting.
|
|
•
|
Integrations.
The fragmented marketing landscape creates a need for a common network of integrations that make it easy and safe to match and activate data anywhere in the ecosystem.
|
8
|
•
|
Walled Gardens.
Walled gardens, or marketing platforms that restrict the use of data outside of their walls, are becoming more pervasive and can result in loss of control, lack of transparency, and fragmented brand experiences. Organizations need a solution that enables an open ecosystem and ensures complete control over customer data, along with the flexibility to choose a diversified approach to meeting marketing goals.
|
|
•
|
Big Data Challenges.
The volume of data available to optimize marketing performance is enormous and continues to grow. Organizations
will continue to struggle with the management, activation, retrieval, and ability to unify data across channels and formats.
|
|
•
|
Privacy and Compliance.
Preserving brand integrity and delivering positive customer experiences is a top priority for every marketer. Organizations must be able to manage large sets of complex data ethically, securely, within legal boundaries, and in a way that protects consumers.
|
|
•
|
Technical Expertise.
Organizing, managing, and deriving insight from large sets of consumer data is complicated. Consequently, brands must rely on technical expertise and know-how in the form of third-party services to remove the barriers to effectively managing their data and leveraging its full value.
|
Acxiom: Solutions That Power People-Based Marketing
Our products and services provide the data foundation brands need to power people-based marketing. We make it safe and easy to activate, validate, enhance, and unify data, enabling marketers to deliver relevant messages at scale and link their campaigns to actual results. We help our clients generate higher return on investment and drive better customer interactions and experiences.
As noted above, Acxiom has three business segments, each helping our clients address the inherent challenges associated with people-based marketing in a digital era. During fiscal 2018, we undertook a comprehensive review of our businesses to drive cleaner lines of sight, to create clearer accountabilities and to maximize its strategic flexibility. Following this review, we intend to reorganize our business and actively explore options to further strengthen Acxiom Marketing Solutions, a segment combining Marketing Services and lines of business from Audience Solutions. Beginning in fiscal 2019, we will report our results in two business segments: LiveRamp and Acxiom Marketing Solutions.
Connectivity
As shown in the illustration below, our Connectivity segment enables our clients to build an omni-channel view of the customer and activate that understanding across the marketing ecosystem.
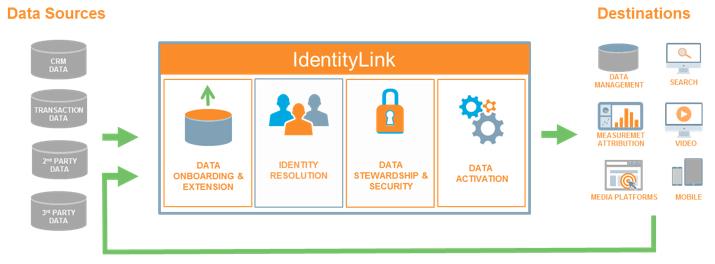
Through integrations with more than 575 leading digital marketing platforms and data providers, we have become a key point of entry into the digital ecosystem, helping our clients eliminate data silos and unlock greater value from the marketing tools they use every day. We provide a foundational identity resolution layer enabling our clients to identify and reach consumers across channels and measure the impact of marketing on sales, using the marketing platform of their choice.
Today, our primary Connectivity offering is LiveRamp® IdentityLink™, an identity resolution service that ties data back to real people and makes it possible to onboard that data for people-based marketing initiatives across digital channels. Leveraging AbiliTec® and the LiveRamp identity graph, IdentityLink first resolves a client’s first-, second-, and third-party, exposure, and transaction data to persistent anonymous consumer identifiers that represent real
9
people in a privacy-safe way. This omni-channel view of the consumer can then be onboarded to and between any of the 575 plus partners in our ecosystem to support targeting, personalization and measurement use cases.
|
Targeting
|
Personalization
|
Measurement
|

|

|

|
|
Example
|
Example
|
Example
|
|
Clients can upload known data from first-, second-, and third-party data sources, resolve it to an omnichannel privacy-safe link with IdentityLink, then onboard to one of 575+ LiveRamp partners to deploy targeted ads to known customers.
|
Clients can deliver highly relevant content the moment viewers visit their websites' landing page, no login required. Leveraging IdentityLink, clients can resolve customer segment data to devices and digital IDs, onboard that data to a personalization platform and provide one-to-one experiences without compromising user privacy.
|
Clients can connect exposure data with first and third-party purchase data across channels by resolving all customer devices back to the customers to which they belong. Then, clients can onboard that data to a measurement platform to clearly establish cause, effect and impact.
|
IdentityLink operates in an Acxiom SafeHaven® certified environment with technical, operational, and personnel controls designed to ensure our clients’ data is kept private and secure.
IdentityLink is sold to brands and the companies' brands partners to execute their marketing including marketing technology providers, data providers, publishers and agencies.
|
•
|
IdentityLink for Brands and Agencies.
IdentityLink allows brands and their agencies to execute people-based marketing by creating an omni-channel understanding of the consumer and activating that understanding across their choice of best-of-breed digital marketing platforms.
|
|
•
|
IdentityLink for Marketing Technology Providers.
IdentityLink provides marketing technology providers with the ability to offer people-based targeting, measurement and personalization within their platforms. This adds value for brands by increasing reach, as well as the speed at which they can activate their marketing data.
|
|
•
|
IdentityLink for Data Owners.
IdentityLink allows data owners to easily connect their data to the digital ecosystem and better monetize it. Data can be distributed to clients or made available through the
IdentityLink Data Store
feature. This adds value for brands as it allows them to augment their understanding of consumers, and increase both their reach against and understanding of customers and prospects.
|
|
•
|
IdentityLink for Publishers.
IdentityLink allows publishers to offer people-based marketing on their properties. This adds value for brands by providing direct access to their customers and prospects in the publisher’s premium inventory.
|
Audience Solutions
Our Audience Solutions segment helps clients validate the accuracy of their data, enhance it with additional insight, and keep it up to date, enabling clients to reach desired audiences with highly relevant messages. Leveraging our recognition and data assets, clients can identify, segment, and differentiate their audiences for more effective marketing and superior customer experiences. Audience Solutions’ offerings include InfoBase®, our large
10
consumer data store that serves as the basis for Acxiom’s consumer demographics products, and AbiliTec, our patented identity resolution technology that assists our clients in reconciling and managing variations of customer identity over time and across multiple channels.
|
•
|
InfoBase.®
With more than 1,500 demographic, socio-economic and lifestyle data elements and several thousand predictive models, our InfoBase products provide marketers with the ability to identify and reach the right audience with the right message across both traditional and digital channels. Through partnerships with over 100 online publishers and digital marketing platforms, including Facebook, Google, Twitter, 4INFO, AOL, eBay and MSN, marketers can use InfoBase data to create and target specific audiences. Data can be accessed directly or through the Acxiom Audience Cloud, a web-based, self-service tool that makes it easy to build and distribute third-party custom data segments.
|
|
•
|
AbiliTec.®
As shown in the illustration below, AbiliTec helps brands recognize individuals and households using a number of different input variables and connect identities online and offline.
|
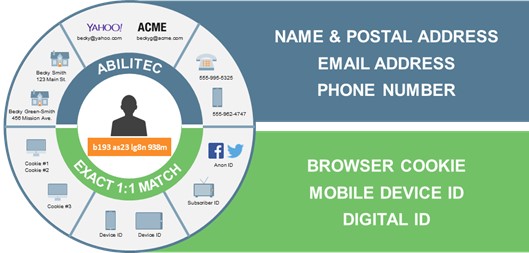
By identifying and linking multiple identifiers and data elements back to a persistent ID, our clients are able to create a single view of the customer, which allows them to perform more effective audience targeting and deliver better, more relevant customer experiences.
Marketing Services
Our Marketing Services segment helps clients unify data at the individual level in a privacy-safe environment, so they can execute people-based marketing campaigns, tie back to real results, and drive a continual cycle of optimization. We help architect the foundation for data-driven marketing by delivering solutions that integrate customer and prospect data across the enterprise, thereby enabling our clients to establish a single view of the customer. We also support our clients in navigating the complexities of consumer privacy regulation, making it easy and safe for them to use innovative technology, maintain choice in channels and media, and stay agile in this competitive era of the consumer. These services allow our clients to generate higher return on marketing investments and, at the same time, drive better, more relevant customer experiences.
Our Marketing Services segment includes the following service offerings: Marketing Database Services and Strategy and Analytics. The Marketing Services segment also included Impact Email Platform and Services until the disposition of the business in August 2016.
|
•
|
Marketing Database Services.
Our Marketing Database offering provides solutions that unify consumer data across an enterprise, enabling clients to execute relevant, people-based marketing and activate data across the marketing ecosystem. Our consumer marketing databases, which we design, build, and manage for our clients, make it possible for clients to collect and analyze information from all sources, thereby increasing customer acquisition, retention, and loyalty. Through our growing partner network, clients are able to integrate their data with best-of-breed marketing solutions while respecting and protecting consumer privacy.
|
|
•
|
Strategy and Analytics.
Our Strategy and Analytics group consists of marketing strategists and data scientists who leverage industry knowledge and advanced analytics to assist our clients with identifying growth opportunities, addressing marketing data and technology needs, and adopting best practices. In addition, we help our clients identify and address their data privacy and governance requirements.
|
11
|
•
|
Impact Email Platform and Services.
Until the August 2016 disposition, Acxiom Impact™ provided email and cross-channel data-driven marketing solutions for enterprise marketers, including a proprietary marketing platform and agency services.
|
Together, our products and services form the “power grid” for data, the critical foundation for people-based marketing that brands need to engage consumers across today's highly fragmented landscape of channels and devices.
We provide integrations with the largest number of marketing platforms and data providers in the digital marketing ecosystem, enabling our clients to innovate through their preferred choice of technology, data, and services providers. Our industry-leading recognition and data assets power best-in-class consumer identification and linking across channels and devices. And, our integrated services offering provides the expertise required to manage large sets of data legally, ethically, securely, and in a way that protects consumer privacy.
Competitive Strengths
Our competitive strengths include core capabilities that enable brands to execute effective people-based marketing.
|
•
|
Most Advanced Consumer-Level Recognition.
Acxiom’s proprietary, patented recognition technology draws upon an extensive historical reference base to identify and link together multiple consumer records and identifiers. We use the pioneering algorithms of AbiliTec and deterministic matching to link individuals and households to the right cookies, mobile device IDs, and user accounts at social networks. As a result, we are able match online and offline data with a high degree of speed and accuracy.
|
|
•
|
Scale Leader in Data Onboarding and Connectivity.
We created the category of Data Connectivity and we are the largest provider of data onboarding services. We match records with the highest level of accuracy and offer the most flexibility for activating data through our extensive set of integrations. Today, we work with over 400 direct customers and onboard the data of more than 1,000 companies through our partner and reseller relationships.
|
|
•
|
Extensive Coverage.
We activate data across an ecosystem of more than 575 partners, representing the largest network of connections in the digital marketing space. We use 100% deterministic matching, resulting in the strongest combination of reach and accuracy. We offer multi-sourced insight into approximately 700 million consumers worldwide, and our data products contain over 5,000 data elements from hundreds of sources with permission rights.
|
|
•
|
Unique Position in Marketing Ecosystem.
We are a neutral data infrastructure provider. We provide the connectivity required to build best-of-breed integrated marketing stacks, allowing our clients to innovate through their preferred choice of data, technology, and services providers. We strive to make every marketing application more valuable by providing access to more customer data. We enable the open marketing stack and power the open garden.
|
|
•
|
Standard Bearer for Privacy and Security.
For more than 45 years, Acxiom has been a leader in the area of data stewardship, as evidenced by:
|
|
◦
|
The industry's first Chief Privacy Officer role created in 1991 whose sole focus is the protection and responsible use of consumer data
|
|
◦
|
The use of a data SafeHaven®, a privacy-compliant environment that allows marketers and partners to connect different types of data while protecting and governing its use
|
|
◦
|
Industry-leading expertise in safely connecting data across the online and offline worlds
|
|
◦
|
The creation of aboutthedata.com®, the first-of-its-kind consumer portal that provides consumers with more transparency and understanding about how their data is gathered and used for marketing purposes
|
|
•
|
Expertise in Big Data.
We currently manage large datasets for leading marketing organizations around the world, executing more than 1 trillion global data transactions per week. This data includes both customer and prospect records as well as core campaign and engagement logs used for measurement and analytics.
|
12
|
•
|
Strong Client Relationships.
We serve more than 2,500 clients directly, and tens of thousands of companies around the world use our data. We manage data for more than 40% of the Fortune 100 and have deep relationships with companies and business-to-consumer marketing leaders in key industries, including financial services, retail, telecommunications, media, insurance, health care, automotive, technology, and travel and entertainment.
|
Growth Strategy
While the terms “big data” and “data management platforms,” or “DMPs,” have recently become more common, for more than 45 years, Acxiom has been a thought leader and innovator in solving large-scale data problems and improving marketing results for our clients. Key elements of our growth strategy include:
|
•
|
Continue to Innovate and Extend Leadership Position in Data Connectivity.
We intend to continue to make substantial investments in our Connectivity solutions and extend our market leadership through innovation. Our investments will focus on automation, speed, higher match rates, expanded partner integrations, and new product development.
|
|
•
|
Establish the Standard for Recognition and User Identification in the Marketing Ecosystem.
We intend to establish AbiliTec as the standard for consumer-level recognition across the marketing ecosystem, providing a single source for user identification and audience targeting.
|
|
•
|
Continue to Grow Our Client Base and Expand Existing Client Relationships.
We plan to acquire an increasing number of new customers through the expansion of our direct sales teams. In addition, we intend to increase revenue from existing customers, many of whom are new Connectivity customers who have data infrastructure needs our Audience Solutions and Marketing Services businesses can help address.
|
|
•
|
Expand Global Presence.
We believe significant opportunities exist for us to expand our Connectivity offerings in key geographic markets where we already operate, such as Europe, China, Japan, and Australia. We intend to leverage existing infrastructure and expand operations to launch and grow our Connectivity business in those key markets.
|
|
•
|
Build an Enduring Business.
We do not aspire to be mediocre, good, or even great - we intend to be the absolute best in everything we do. We employ exceptional people, challenge them to accomplish exceptional things, and achieve exceptional results for our clients and shareholders. We will do this through five guiding principles: 1) Above all, we do what is right; 2) We always say what we mean, and do what we say; 3) We empower people; 4) We respect people and time; and 5) We get stuff done.
|
Privacy Considerations
The growing online advertising and e-commerce industries are converging, with consumers expecting a seamless experience across all channels, in real time. This challenges marketing organizations to balance the deluge of data and demands of the consumer with responsible, privacy-compliant methods of managing data internally and with advertising technology intermediaries.
We have policies and operational practices governing Acxiom’s use of data that we believe reflect leading best practices and actively promote a set of effective privacy guidelines for digital advertising and direct marketing via all channels of addressable media, e-commerce, risk management and information industries as a whole. We remain certified under the European Union (“EU”)-U.S. Safe Harbor and are preparing for its potential replacement, the EU-US Privacy Shield. We also are operating as applicable under EU model contract clauses and contractually comply with other international data protection requirements in an effort to ensure our continued ability to process information across borders. We have a dedicated team in place to oversee our compliance with the privacy regulations that govern our business activities in the various countries in which we operate.
The U.S. Congress continues to debate privacy legislation, and there are many different types of privacy legislation pending at the state level. In all of the non-U.S. locations in which we do business, laws and regulations governing the collection and use of personal data either exist or are being contemplated.
We expect the trend of enacting and revising data protection laws to continue and that new and expanded privacy legislation in various forms will be implemented in the U.S. and in other countries around the globe. We are
13
supportive of legislation that codifies the current industry guidelines of meaningful transparency for the individual and appropriate choices regarding whether information related to that individual is shared with independent third parties for marketing purposes. We also support legislation requiring all custodians of sensitive information to deploy reasonable information security safeguards to protect that information.
Clients
Our client base consists primarily of Fortune 1000 companies and organizations in the financial services, insurance, information services, direct marketing, retail, consumer packaged goods, technology, automotive, healthcare, travel and communications industries as well as in non-profit and government sectors. We seek to maintain long-term relationships with our clients, many of which typically operate under contracts with initial terms of at least two years. We have historically experienced high retention rates among our clients.
Our ten largest clients represented approximately 36% of our revenues in fiscal year 2018 but no single client accounted for more than 10% of our consolidated revenues.
Sales and Marketing
The process of buying marketing services has become more complex and therefore requires a more collaborative decision process between client and provider. As such, our approach to sales and marketing is strategy-led and client-intimate. Utilizing a proprietary maturity model, we employ both a diagnostic approach, guided by gaps between a client’s current and desired state, and a prescriptive approach, focused on proven solutions and approaches to close those gaps.
Our sales teams focus on new business development across all markets – sales to new clients and sales of new lines of business to existing clients, as well as revenue growth within existing accounts. We organize our client relationships around industry verticals, as we believe that understanding and speaking to the nuances of each industry is the most effective way to positively impact our clients’ businesses.
Our partner organization focuses on enabling key media partners, agencies and software providers who can help drive value for our clients or who benefit from using Acxiom for data, analytics and audience management.
The focus of our marketing efforts is to disseminate our thought leadership. We do this by promoting topical points of view across multiple touch points and by fueling our sales efforts with prescriptive insights.
Research and Development
Research and development expense was
$94.9 million
in fiscal
2018
, compared to
$82.1 million
in fiscal
2017
, and
$74.2 million
in fiscal
2016
. Management expects to maintain investment spending at similar levels in fiscal
2019
.
Competition
Competitors for our Connectivity services are typically also members of our partner ecosystem, creating a paradigm where competition is the norm. Our primary competitors are companies that sell data onboarding as part of a suite of marketing applications or services. Walled gardens that offer a direct interface for matching CRM data compete for a portion of our services, particularly amongst marketers that have not yet adopted in-house platforms for programmatic marketing or attribution. Some providers of tag management, data management, and cross-device marketing solutions have adopted positioning similar to our Connectivity business and compete for mindshare.
Our traditional competitors for our Audience Solutions and Marketing Services offerings have been database marketing services providers. We find that the competitive landscape is becoming more complex and now includes a range of players. Our primary competitors tend to be database marketing services providers, data companies and data distributors. In-house IT departments provide a secondary source of competition for portions of our offerings. Other types of companies such as technology consultants, business process outsourcers, analytics consultants, and management consultants participate to a lesser extent in portions of our market space.
Different types of competitors have different core competencies and assets that they bring to bear. We compete for both broad-based and specific solutions. Our competitors can vary depending on the type of solution we are competing for. Generally, competition is based on the quality and reliability of the offering, whether the strategy will
14
deliver the desired business results for the client, historical success and market presence. Competition for more granular offerings is based on variables that are more specific. With regard to data products, for example, we compete with two types of firms: data providers and list providers. Competition is based on the quality and comprehensiveness of the information provided, the ability to deliver the information in products and formats that our clients need, and, to a lesser extent, pricing.
In markets outside the United States, we face both global players as well as local market players. Local market players vary between those offering a range of services and those who may compete with us in more limited areas, such as for data products or data integration services.
We continue to focus on levers to increase our competitiveness
and
believe that investing in the product and technology platform of our business is a key to our continued success. Further, we believe that enabling a broad partner ecosystem will help us to continue to provide competitive differentiation.
Seasonality and Inflation
Although we cannot accurately determine the amounts attributable to inflation, we are affected by inflation through increased costs of compensation and other operating expenses. If inflation were to increase over the low levels of recent years, the impact in the short run would be to cause increases in costs, which we would attempt to pass on to our clients, although there is no assurance that we would be able to do so. Generally, the effects of inflation in recent years have been offset by technological advances, economies of scale and other operational efficiencies.
Our traditional direct marketing operations typically experience their lowest revenue in the first quarter of the fiscal year, with higher revenue in the second, third, and fourth quarters. To minimize the impact of these fluctuations, we continue to seek long-term arrangements with more predictable revenues.
Pricing
Given the diverse nature of the markets and industries in which our clients operate, we deploy a number of pricing techniques designed to yield acceptable margins and returns on invested capital. In our Marketing Services segment, the majority of revenue is generated from highly customized, outsourced solutions in which prices are dictated by the scope, complexity, nature of assets deployed and service levels required. These solutions are generally provided under long-term contracts and our revenue consists primarily of recurring monthly billings, and to a lesser extent, other volume and variable based billings. In our Audience Solutions segment, revenue is generated from licensing fees, which are typically in the form of recurring monthly billings, as well as transactional revenue based on volume or one-time usage. In addition, Audience Solutions generates digital data revenue from certain publishers and addressable television providers in the form of revenue-sharing agreements. Finally, our Connectivity segment primarily generates revenue from monthly recurring subscription fees sold on an annual basis. To a lesser extent, it also generates revenue from data providers and certain digital publishers in the form of revenue-sharing agreements. Examples of Acxiom pricing techniques are value based recurring revenue models, transactional models, subscription or license models, and professional services models, among others.
Employees
Acxiom employs approximately 3,380 employees (associates) worldwide. No U.S. associates are represented by a labor union or subject to a collective bargaining agreement. To the best of management’s knowledge, approximately 15 associates are elected members of work councils or trade unions representing Acxiom associates in the European Union.
Acxiom has never experienced a work stoppage, and we believe that our employee relations are good.
Executive Officers of the Registrant
Acxiom’s executive officers, their current positions, ages and business experience are listed below. They are elected by the board of directors annually or as necessary to fill vacancies or to fill new positions. There are no family relationships among any of the officers or directors of the Company.
Scott E. Howe
, age 50, joined the Company in 2011 as its Chief Executive Officer and President. He currently serves on and chairs the Executive Committee of the Company’s board of directors. Prior to joining Acxiom, he served as corporate vice president of Microsoft Advertising Business Group from 2007–2010. In this role, he
15
managed a multi-billion dollar business encompassing all emerging businesses related to online advertising, including search, display, ad networks, in-game, mobile, digital cable and a variety of enterprise software applications. In 2010, he co-founded and served as interim CEO and president of King of the Web, Inc., a portfolio of online game shows. Mr. Howe was employed from 1999–2007 as an executive and later as a corporate officer at aQuantive, Inc. where he managed three lines of business, including Avenue A|Razorfish (a leading Seattle
-
based global consultancy in digital marketing and technology), DRIVE Performance Media (now Microsoft Media Network), and Atlas International (an ad serving technology now owned by Facebook). Earlier in his career, he was with The Boston Consulting Group and Kidder, Peabody & Company, Inc. He previously served on the boards of Blue Nile, Inc. (NASDAQ: NILE), a leading online retailer of diamonds and fine jewelry, the Internet Advertising Bureau (IAB) and the Center for Medical Weight Loss. He is a
magna cum laude
graduate of Princeton University, where he earned a degree in economics, and he holds an MBA from Harvard University.
Warren C. Jenson
, age 61, is the Company’s Chief Financial Officer & Executive Vice President. He also serves as President of Acxiom International. He joined Acxiom in 2012 and is responsible for all aspects of Acxiom’s financial management and the Company’s business operations outside the United States. Prior to joining Acxiom, he served as COO at Silver Spring Networks, a successful start-up specializing in smart grid networking technology, where he had responsibility for the company’s service delivery, operations and manufacturing organizations. From 2002 - 2008 he was CFO at Electronic Arts Inc., a leading global interactive entertainment software company. He has more than 30 years of experience in strategy and operational finance and has been a part of some of the most important success stories of the last two decades, including Amazon.com, NBC and Electronic Arts. He also helped shape and successfully navigate digital transformations at NBC and Delta Airlines. In addition, he was twice designated one of the “Best CFOs in America” by
Institutional Investor
magazine, and he was also honored as Bay Area Venture CFO of the Year in 2010. He also has significant experience in M&A and corporate development experience. Mr. Jenson's board experience includes Digital Globe (NYSE: DGI), Tapjoy, and the Marshall School of Business at the University of Southern California. He holds a bachelor's degree in accounting and a master of accountancy degree, both from Brigham Young University.
Jerry C. Jones
, age 62, is the Company’s Chief Ethics and Legal Officer, Executive Vice President, Interim Chief People & Culture Officer, and Assistant Secretary. He joined Acxiom in 1999 and currently oversees the Company’s legal, data ethics and human resources matters. He also assists in the strategy and execution of mergers and acquisitions and the Company’s strategic initiatives. Prior to joining Acxiom, Mr. Jones was employed for 19 years as an attorney with the Rose Law Firm in Little Rock, Arkansas, representing a broad range of business interests. Mr. Jones is a member of the board of directors of Agilysys, Inc. (NASDAQ: AGYS), a leading developer and marketer of proprietary enterprise software, services and solutions to the hospitality and retail industries, where he serves on the Audit Committee and the Nominating & Governance Committee. He also serves on the board of directors of Heifer International and on the UA Little Rock Board of Visitors, and is a co-founder of uhire U.S. He is a Special Advisor to the Club de Madrid, an organization composed of over 100 former Presidents and Prime Ministers from more than 60 democratic countries. He was a member of the board of directors of Entrust, Inc. until it was purchased by private investors in 2009 and is former chairman of the board of the Arkansas Virtual Academy. Mr. Jones holds a bachelor’s degree in public administration and a juris doctorate degree, both from the University of Arkansas.
James F. Arra
, age 52, was divisional co-president of the Company’s Connectivity Division, a position he held from September 2017 through the end of our fiscal year ended March 31, 2018. Beginning in fiscal 2019, he assumed the position of divisional co-president of the Company's LiveRamp division. In this role, he is responsible for leading the go-to-market strategy for LiveRamp’s client verticals: brands, agencies, data providers, platforms and publishers. Since joining LiveRamp in 2013, Mr. Arra has held several key leadership roles, most recently serving as Chief Operating Officer. From 2009 to 2012, Mr. Arra was Vice President of worldwide sales at TRUSTe, where he helped grow the company from less than 1,000 customers to more than 6,000 customers in just over three years. Prior to TRUSTe, he was in a sales leadership role at Vontu, a data security company that was acquired by Symantec, and before that was a vice president and general manager at FreeMarkets, a publicly traded SaaS company that subsequently merged with Ariba. Mr. Arra holds a bachelor’s degree in electrical engineering with a minor in quantitative economics and decision theory from the University of California, San Diego.
Anneka R. Gupta
, age 30, was divisional co-president of the Company's Connectivity Division, a position she held from September 2017 through the end of our fiscal year ended March 31, 2018. Beginning in fiscal 2019, she assumed the position of co-president of the Company's LiveRamp division. She is responsible for leading LiveRamp’s product, engineering, marketing, and general and administrative functions. Previously Ms. Gupta was LiveRamp’s chief product officer, overseeing product strategy and execution. During her seven-year tenure at
16
LiveRamp (which was acquired by Acxiom in 2014), Ms. Gupta has led successful efforts in a variety of disciplines, including marketing, recruiting, product management and software development. In 2016, Ms. Gupta was recognized as a “Top 10 Digital Marketing Innovator” by AdAge magazine. She holds a bachelor’s degree in math and computational sciences from Stanford University and has completed the Executive Program at the Stanford University Graduate School of Business.
Richard E. Erwin
, age 51, joined Acxiom in 2015 as President and General Manager of Acxiom's Audience Solutions Division and was responsible for driving the strategy, growth and profitability of Acxiom’s industry-leading data products and services through the end of the fiscal year ended March 31, 2018. Beginning in fiscal 2019, he assumed the position of divisional co-president of the Acxiom Marketing Solutions division where he is responsible for data product management and marketing, analytics, global data, data strategy With over two decades in the data-driven marketing industry, Mr. Erwin is a leading voice in the field of omnichannel marketing and an outspoken advocate for the value of data in the global economy. Prior to joining Acxiom in 2015, he spent 10 years at Experian, a large global information company, most recently as president of the Consumer Insights and Targeting Division of Experian Marketing Services. During his tenure there, he led the turnaround and growth of seven legacy data and analytics businesses and established the company as a force in the digital marketing services industry. Prior to Experian, he held numerous senior management roles in his 12-year career at RR Donnelley. Mr. Erwin is a director of the Internet Advertising Bureau (IAB) and is a founding director of the IAB’s Data Center of Excellence. He also serves on the board of trustees of Shedd Aquarium in Chicago. He is a past vice chairman and treasurer of the Data Marketing Association and is a past director of Chicago Youth Centers and RevSpring, Inc. Mr. Erwin holds a bachelor’s degree in marketing from Michigan State University and a master’s degree in business administration from Northwestern University (Kellogg).
Dennis D. Self
, age 52, was President and General Manager of Acxiom's Marketing Services Division through the end of our fiscal year ended March 31, 2018. Beginning in fiscal 2019, he assumed the position of divisional co-president of the Acxiom Marketing Solutions division where he is responsible for providing strategic leadership to the following teams: sales and market engagement, client management, service delivery, industry solutions, solution development, and technology and engineering. His previous positions at Acxiom include senior vice president of the Marketing Services Delivery and Operational Services organization, and chief information officer. Prior to joining the Company in 2013, Mr. Self served as vice president and chief information officer at Gilead Sciences, Inc. from 2011-2013. Prior to his employment with Gilead, he served as CIO at Electronic Arts for four years. His previous experience includes serving as an IT strategy consultant for Deloitte Consulting, HP, A.T. Kearney and Andersen Consulting. Mr. Self holds a bachelor’s degree in management information systems from Old Dominion University and an MBA from the University of Chicago.
17
The risks described below could materially and adversely affect our business, financial condition and results of future operations.
Failure to keep up with rapidly changing technologies and marketing practices could cause our products and services to become less competitive or obsolete, which could result in loss of market share and decreased revenues and net income.
Advances in information technology are changing the way our clients use and purchase information products and services. Maintaining the technological competitiveness of our data products, processing functionality, software systems and services is key to our continued success. However, the complexity and uncertainty regarding the development of new technologies and the extent and timing of market acceptance of innovative products and services create difficulties in maintaining this competitiveness. Without the timely introduction of new products, services and enhancements, our products and services will become technologically or commercially obsolete over time, in which case our revenue and operating results would suffer.
Consumer needs and the business information industry as a whole are in a constant state of change. For example, in recent years, we have seen a decline in the use of direct mail marketing and an increase in the use of alternative marketing channels such as online advertising. Our ability to continually improve our current processes and products in response to changes in technology and to develop new products and services are essential in maintaining our competitive position, preserving our market share and meeting the increasingly sophisticated requirements of our clients. If we fail to enhance our current products and services or fail to develop new products in light of emerging technologies and industry standards, we could lose clients to current or future competitors, which could result in impairment of our growth prospects, loss of market share and decreased revenues.
A significant breach of the confidentiality of the information we hold or of the security of our or our customers’, suppliers’, or other partners’ computer systems could be detrimental to our business, reputation and results of operations.
Our business requires the storage, transmission and utilization of data, including personally identifiable information, much of which must be maintained on a confidential basis. These activities may make us a target of cyber-attacks by third parties seeking unauthorized access to the data we maintain, including our data and client data, or to disrupt our ability to provide service. Any failure to prevent or mitigate security breaches and improper access to or disclosure of the data we maintain, including personal information, could result in the loss or misuse of such data, which could harm our business and reputation and diminish our competitive position. In addition, computer malware, viruses, social engineering, and general hacking have become more prevalent. As a result of the types and volume of personal data on our systems, we believe that we are a particularly attractive target for such breaches and attacks.
In recent years, the frequency, severity, sophistication of cyber attacks, computer malware, viruses, social engineering, and other intentional misconduct by computer hackers has significantly increased, and government agencies and security experts have warned about the growing risks of hackers, cyber criminals and other potential attackers targeting information technology systems. Such third parties could attempt to gain entry to our systems for the purpose of stealing data or disrupting the systems. In addition, our security measures may also be breached due to employee error, malfeasance, system errors or vulnerabilities, including vulnerabilities of our vendors, suppliers, their products, or otherwise. Third parties may also attempt to fraudulently induce employees or clients into disclosing sensitive information such as user names, passwords or other information to gain access to our clients’ data or our data, including intellectual property and other confidential business information. We believe we have taken appropriate measures to protect our systems from intrusion, but we cannot be certain that advances in criminal capabilities, discovery of new vulnerabilities in our systems and attempts to exploit those vulnerabilities, physical system or facility break-ins and data thefts or other developments will not compromise or breach the technology protecting our systems and the information we possess.
Although we have developed systems and processes that are designed to protect our data and client data, to prevent data loss, and to prevent or detect security breaches, our databases have in the past been and in the future may be subject to unauthorized access by third parties, and we may incur significant costs in protecting against or remediating cyber-attacks. Any security breach could result in operational disruptions that impair our ability to meet our clients’ requirements, which could result in decreased revenues. Also, whether there is an actual or a perceived
18
breach of our security, our reputation could suffer irreparable harm, causing our current and prospective clients to reject our products and services in the future and deterring data suppliers from supplying us data. Further, we could be forced to expend significant resources in response to a security breach, including those expended in repairing system damage, increasing cyber security protection costs by deploying additional personnel and protection technologies, and litigating and resolving legal claims or governmental inquiries and investigations, all of which could divert the attention of our management and key personnel away from our business operations. In any event, a significant security breach could materially harm our business, financial condition and operating results.
Our clients, suppliers and other partners are primarily responsible for the security of their information technology environments, and we rely heavily on them and other third parties to supply clean data content and/or to utilize our products and services in a secure manner. Each of these third parties may face risks relating to cyber security, which could disrupt their businesses and therefore materially impact ours. While we provide guidance and specific requirements in some cases, we do not directly control any of such parties’ cyber security operations, or the amount of investment they place in guarding against cyber security threats. Accordingly, we are subject to any flaw in or breaches of their systems, which could materially impact our business, operations and financial results.
Changes in legislative, judicial, regulatory, or cultural environments relating to information collection and use may limit our ability to collect and use data. Such developments could cause revenues to decline, increase the cost and availability of data and adversely affect the demand for our products and services.
We receive, store and process personal information and other data from and about consumers in addition to our clients, employees, and services providers. Our handling of this data is subject to a variety of federal, state, and foreign laws and regulations and is subject to regulation by various government authorities. Our data handling also is subject to contractual obligations and may be deemed to be subject to industry standards.
The U.S. federal and various state and foreign governments have adopted or proposed limitations on the collection, distribution, use and storage of data relating to individuals, including the use of contact information and other data for marketing, advertising and other communications with individuals and businesses. In the U.S., various laws and regulations apply to the collection, processing, disclosure, and security of certain types of data. Additionally, the FTC and many state attorneys general are interpreting federal and state consumer protection laws as imposing standards for the online collection, use, dissemination and security of data.
The regulatory framework for privacy issues worldwide is currently evolving and is likely to remain uncertain for the foreseeable future. The occurrence of unanticipated events often rapidly drives the adoption of legislation or regulation affecting the use of data and the manner in which we conduct our business. Restrictions could be placed upon the collection, management, aggregation and use of information, which could result in a material increase in the cost of collecting or otherwise obtaining certain kinds of data and could limit the ways in which we may use or disclose information.
In the U.S., the U.S. Congress and state legislatures, along with federal regulatory authorities have recently increased their attention on matters concerning the collection and use of consumer data. In the U.S., non-sensitive consumer data generally may be used under current rules and regulations, subject to certain restrictions, so long as the person does not affirmatively “opt-out” of the collection or use of such data. In Europe, the reverse is true. If the European “opt-in” model were to be adopted in the U.S., less data would be available and the cost of data would be higher. Decreased availability and increased costs of information could adversely affect our ability to meet our clients’ requirements and could result in decreased revenues. In addition to government regulation, privacy advocacy and industry groups may propose new and different self-regulatory standards that either legally or contractually apply to us or our clients.
In Europe, the European General Data Protection Regulation ("GDPR") took effect on May 25, 2018 and applies to products and services that we provide in Europe. The GDPR includes operational requirements for companies that receive or process personal data of residents of the European Union that are different than those that were in place in the European Union. For example, we will be required to offer new controls to data subjects in Europe before processing data for certain aspects of our service. In addition, the GDPR includes significant penalties for non-compliance. In addition, some countries are considering or have passed legislation implementing data protection requirements or requiring local storage and processing of data or similar requirements that could increase the cost and complexity of delivering our services. Any failure to achieve required data protection standards may result in lawsuits, regulatory fines, or other actions or liability, all of which may harm our operating results.
19
In June 2016, a referendum was passed in the United Kingdom to leave the European Union, commonly referred to as “Brexit.” This decision creates an uncertain political and economic environment in the United Kingdom and other European Union countries, even though the formal process for leaving the European Union may take years to complete. For example, it is unclear whether the United Kingdom will enact data protection laws or regulations designed to be consistent with GDPR and how data transfers to and from the United Kingdom will be regulated. A Data Protection Bill is undergoing the legislative process in the United Kingdom that generally would be consistent with the GDPR, but it is unclear whether this bill ultimately will be enacted. The full effect of Brexit is uncertain and depends on any agreements the United Kingdom may make to retain access to European Union markets. Consequently, no assurance can be given about the impact of the outcome and our business may be seriously harmed.
We are also subject to laws and regulations that dictate whether, how, and under what circumstances we can transfer, process and/or receive certain data that is critical to our operations, including data shared between countries or regions in which we operate and data shared among our products and services. For example, in 2016, the European Union and the U.S. agreed to an alternative transfer framework for data transferred from the European Union to the U.S., called the Privacy Shield, but this new framework is subject to an annual review that could result in changes to our obligations and also may be challenged by national regulators or private parties. In addition, the other bases upon which we rely to legitimize the transfer of such data, such as Standard Contractual Clauses, have been subjected to regulatory and judicial scrutiny. If one or more of the legal bases for transferring data from Europe to the U.S. is invalidated, if we are unable to transfer data between and among countries and regions in which we operate, or if we are prohibited from sharing data among our products and services, it could affect the manner in which we provide our services or adversely affect our financial results.
Because the interpretation and application of privacy and data protection laws, regulations and standards are uncertain, it is possible that these laws, regulations and standards may be interpreted and applied in a manner that is inconsistent with our data management practices or the technological features of our solutions. If so, in addition to the possibility of fines, investigations, lawsuits and other claims and proceedings, it may be necessary or desirable for us to fundamentally change our business activities and practices or modify our products and services, which could have an adverse effect on our business. We may be unable to make such changes or modifications in a commercially reasonable manner or at all. Any inability to adequately address privacy concerns, even if unfounded, or any actual or perceived failure to comply with applicable privacy or data protection laws, regulations, standards or policies, could result in additional cost and liability to us, damage our reputation, inhibit sales and harm our business. Furthermore, the costs of compliance with, and other burdens imposed by, the laws, regulations, standards and policies that are applicable to the businesses of our clients may limit the use and adoption of, and reduce the overall demand for, our platform. Privacy concerns, whether valid or not valid, may inhibit market adoption of our platform particularly in certain industries and foreign countries.
Unfavorable publicity and negative public perception about our industry could adversely affect our business and operating results.
With the growth of online advertising and e-commerce, there is increasing awareness and concern among the general public, privacy advocates, mainstream media, governmental bodies and others regarding marketing, advertising, and privacy matters, particularly as they relate to individual privacy interests and the global reach of the online marketplace. See “Item 1. Business – Privacy Considerations” in this Form 10-K. Any unfavorable publicity or negative public perception about us, our industry, including our competitors, or even other data focused industries can affect our business and results of operations, and may lead to digital publishers like Facebook or Twitter changing their business practices or additional regulatory scrutiny or lawmaking that affects us or our industry. For example, in recent years, consumer advocates, mainstream media and elected officials have increasingly and publicly criticized the data and marketing industry for its collection, storage and use of personal data. The negative public attention Facebook faced following revelations about Cambridge Analytica's use of data led Facebook to change how it delivers targeted advertising, as well as its relationship with us and some of our competitors. This public scrutiny may lead to general distrust of our industry, consumer reluctance to share and permit use of personal data and increased consumer opt-out rates, any of which could negatively influence, change or reduce our current and prospective clients’ demand for our products and services and adversely affect our business and operating results.
20
Industry consolidations may increase competition for our products and services, which could negatively impact our financial condition and operating results.
We compete against numerous providers of products and services in several separate markets. See “Item 1. Business - Competition” in this Form 10-K. Since we offer a larger variety of products and services than many of these competitors, we have been able to successfully compete. However, the dynamics of the marketplace would be significantly altered if several of these providers were to combine with each other to offer a wider variety of products and services that more directly compete with our portfolio of products and services. If our competitors were to combine forces to create a single-source provider of multiple products and services to the markets in which we compete, we could experience increased price competition, lower demand for our products and services, and loss of market share, each of which could negatively affect our operating results.
Significant system disruptions, loss of data center capacity or interruption of telecommunication links could adversely affect our business and results of operations.
Our business is heavily dependent upon highly complex data processing capability. Our ability to protect our data centers against damage or interruption from fire, flood, tornadoes, power loss, telecommunications or equipment failure or other disasters and events beyond our control is critical to our continued success. The online services we provide are dependent on links to telecommunication providers. We believe we have taken reasonable precautions to protect our data centers and telecommunication links from events that could interrupt our operations. Any damage to our data centers or any failure of our telecommunications links that causes loss of data center capacity or otherwise causes interruptions in our operations, however, could materially adversely affect our ability to quickly and effectively respond to our clients’ requirements, which could result in loss of their confidence, adversely impact our ability to attract new clients and force us to expend significant resources to repair the damage. Such events could have a material adverse effect on our business, financial condition and operating results.
Each of our business segments is subject to substantial competition from a diverse group of competitors. New products and pricing strategies introduced by these competitors in the markets where our products and services are offered could decrease our market share or cause us to lower our prices in a manner that reduces our operating margin and the profitability of our products.
Each of our business segments faces significant competition in all its offerings and within each of its markets. See “Item 1. Business - Competition” in this Form 10-K. Our competitors include database marketing services providers, DMPs (Data Management Platforms), data companies and data distributors, some of whom may have significantly greater financial, technical, marketing or other resources allocated to serving customers. Other types of companies such as technology consultants, business process outsourcers, analytics consultants and management consultants participate to a lesser extent in portions of our market space. Additionally, we compete with the in-house IT departments of some of our existing and prospective clients that have developed or are developing the in-house capacity to perform the services we provide. Maintaining technological competitiveness in our data products, processing functionality, software systems and services, continually improving our current processes, and developing and introducing new products and services are necessary to maintain our competitive position. If we fail to do so, we could lose clients to current or future competitors, which could result in decreased revenues, net income and earnings per share.
The resources we allocate to each market in which we compete vary, as do the number and size of our competitors across these markets. These competitors may be in a better position to develop new products and pricing strategies that more quickly and effectively respond to changes in customer requirements in these markets. Some of our competitors may choose to sell products or services competitive to ours at lower prices by accepting lower margins and profitability, or may be able to sell products or services competitive to ours at lower prices given proprietary ownership of data, technical superiority or economies of scale. Such introduction of competent, competitive products, pricing strategies or other technologies by our competitors that are superior to or that achieve greater market acceptance than our products and services could adversely affect our business. In such event, we could experience a decline in market share and be forced to reduce our prices, resulting in lower profit margins for the Company.
21
Engagements with certain clients, particularly those with long-term, fixed price agreements, may prove to be costlier than anticipated, thereby adversely impacting future operating results.
The pricing and other terms of our client contracts, are based on estimates and assumptions we make at the time we enter into these contracts. These estimates reflect our best judgments regarding the nature of the engagement and our expected costs to provide the contracted services and could differ from actual results. Any increased or unexpected costs or unanticipated delays in connection with the performance of these engagements, including delays caused by factors outside our control, could make these contracts less profitable or unprofitable, which would have an adverse effect on our profit margin. Our exposure to this risk increases generally in proportion to the scope of the client contract and is higher in the early stages of such a contract. Our failure to meet a client’s expectations in any type of contract may result in an unprofitable engagement, which could adversely affect our operating results and result in future rejection of our products and services by current and prospective clients.
The failure to recruit and retain qualified personnel could hinder our ability to successfully manage our business, which could have a material adverse effect on our financial position and operating results.
Our growth strategy and future success depend in large part on our ability to attract and retain technical, client services, sales, consulting, research and development, marketing, administrative and management personnel. The complexity of our data products, processing functionality, software systems and services requires highly trained professionals. While we presently have a sophisticated, dedicated and experienced team of associates who have a deep understanding of our business and in many cases have been with Acxiom for decades, the labor market for these individuals has historically been very competitive due to the limited number of people available with the necessary technical skills and understanding, compensation strategies, general economic conditions and various other factors. As the business information and marketing industries continue to become more technologically advanced, we anticipate increased competition for qualified personnel. The loss or prolonged absence of the services of highly trained personnel like the Company’s current team of associates, or the inability to recruit and retain additional, qualified associates, could have a material adverse effect on our business, financial position or operating results.
Processing errors or delays in completing service level requirements could result in loss of client confidence, harm to our reputation and negative financial consequences.
Processing errors, or significant errors and defects in our products, can be harmful to our business and result in increases in operating costs. Such errors may result in the issuance of credits to clients, re-performance of work, payment of damages, future rejection of our products and services by current and prospective clients and irreparable harm to our reputation. Likewise, the failure to meet contractual service level requirements or to meet specified goals within contractual timeframes could result in monetary penalties or lost revenue. Taken together, these issues could result in loss of revenue and decreases in profit margins as service and support costs increase.
Data suppliers may withdraw data that we have previously collected or withhold data from us in the future, leading to our inability to provide products and services to our clients, which could lead to a decrease in revenue and loss of client confidence.
Much of the data that we use is either purchased or licensed from third-party data suppliers, and we are dependent upon our ability to obtain necessary data licenses on commercially reasonable terms. We compile the remainder of the data that we use from public record sources. We could suffer material adverse consequences if our data suppliers were to withhold their data from us, which could occur either because we fail to maintain sufficient relationships with the suppliers or if they decline to provide, or are prohibited from providing, such data to us due to legal, contractual, privacy, competition or other economic concerns. For example, data suppliers could withhold their data from us if there is a competitive reason to do so, if we breach our contract with a supplier, if they are acquired by one of our competitors, if legislation is passed restricting the use or dissemination of the data they provide or if judicial interpretations are issued restricting use of such data. Additionally, we could terminate relationships with our data suppliers if they fail to adhere to our data quality standards. If a substantial number of data suppliers were to withdraw or withhold their data from us, or if we sever ties with our data suppliers based on their inability to meet our data standards, our ability to provide products and services to our clients could be materially adversely impacted, which could result in decreased revenues, net income and earnings per share.
22
A failure in the integrity or a reduction in the quality of our data could harm our brand and result in a loss of revenue and an increase in legal claims.
The reliability of our solutions depends upon the integrity and quality of the data in our database. A failure in the integrity of our database, whether inadvertently or through the actions of a third party, or a reduction in the quality of our data could harm us by exposing us to client or third-party claims or by causing a loss of client confidence in our solutions. We may experience an increase in risks to the integrity of our database and quality of our data as we move toward real-time, non-identifiable, consumer-powered data through our Enterprise Data Management Platform. We must continue to invest in our database to improve and maintain the quality, timeliness and coverage of the data if we are to maintain our competitive position and retain our clients’ confidence. Failure to do so could result in significant harm to our reputation and growth prospects, as well as a loss of revenue.
The loss of a contract upon which we rely for a significant portion of our revenues could adversely affect our operating results.
Our ten largest clients represented approximately 36% of our revenues in fiscal year 2018, but no single client accounted for more than 10% of the consolidated revenues of the Company. The loss of, or decrease in revenue from, any of our significant clients for any reason could have a material adverse effect on our revenue and operating results.
While a significant amount of our total revenue is currently derived from clients who have long-term contracts (defined as contracts with initial terms of two years or more), these contracts have been entered into at various times, and some of them are in the latter part of their terms and are approaching their originally scheduled expiration dates. In addition, many of these contracts contain provisions allowing the client to terminate prior to the end of the term upon giving advance notice. Even if renewed by these clients, the terms of the renewal contracts may not have a term as long as, or may otherwise be on terms less favorable than, the original contract. Revenue from clients with long-term contracts is not necessarily “fixed” or guaranteed as portions of the revenue from these clients is volume-driven or project-related. With respect to the portion of our business that is not under long-term contract, revenues are even less predictable and are almost completely volume-driven or project-related. Therefore, we must engage in continual sales efforts to maintain revenue stability and future growth with all our clients or our operating results will suffer. If a significant client fails to renew a contract, or renews the contract on terms less favorable to us than before, our business could be negatively impacted if additional business were not obtained to replace or supplement that which was lost.
Acquisition and divestiture activities may disrupt our ongoing business and may involve increased expenses, and we may not realize the financial and strategic goals contemplated at the time of a transaction, all of which could adversely affect our business and growth prospects.
Historically, we have engaged in acquisitions to grow our business. To the extent we find suitable and attractive acquisition candidates and business opportunities in the future, we may continue to acquire other complementary businesses, products and technologies and enter into joint ventures or similar strategic relationships. While we believe we will be able to successfully integrate newly acquired businesses into our existing operations, there is no certainty that future acquisitions or alliances will be consummated on acceptable terms or that we will be able to integrate successfully the services, content, products and personnel of any such transaction into our operations. In addition, any future acquisitions, joint ventures or similar relationships may cause a disruption in our ongoing business and distract our management. Further, we may be unable to realize the revenue improvements, cost savings and other intended benefits of any such transaction. The occurrence of any of these events could result in decreased revenues, net income and earnings per share.
We have also divested assets in the past and may do so again in the future. As with acquisitions, divestitures involve significant risks and uncertainties, such as:
|
•
|
disruption of our ongoing business;
|
|
•
|
reductions of our revenues or earnings per share;
|
|
•
|
unanticipated liabilities, legal risks and costs;
|
|
•
|
the potential loss of key personnel;
|
23
|
•
|
distraction of management from our ongoing business; and
|
|
•
|
impairment of relationships with employees and clients because of migrating a business to new owners.
|
Because acquisitions and divestitures are inherently risky, transactions we undertake may not be successful and may have a material adverse effect on our business, results of operations, financial condition or cash flows.
Our balance sheet includes significant amounts of goodwill, and we have experienced goodwill impairment charges in the past. The impairment of a significant portion of this asset would negatively affect our business, financial condition, and results of operations.
Goodwill is a significant portion of our total assets. Goodwill accounted for approximately 49% of the total assets on our consolidated balance sheet as of March 31, 2018. We may not realize the full carrying value of our goodwill. Goodwill is measured and tested for impairment on an annual basis in the first quarter of the Company’s fiscal year and between annual tests if an event occurs or changes in circumstances suggest a potential decline in the fair value of goodwill. A significant amount of judgment is involved in determining if an indicator or change in circumstances relating to impairment has occurred. If testing indicates that impairment has occurred, we would be required to write off the impaired portion of goodwill, resulting in a change to our earnings. An impairment of a significant portion of goodwill could have a material adverse effect on our operating results and financial condition.
Our business is directly dependent upon and correlates closely to the marketing levels and ongoing business activities of our existing clients. If material adverse developments in domestic and global economic and market conditions adversely affect our clients’ businesses, our business and results of operations could equally suffer.
We serve clients from locations in the Asia-Pacific region, Europe and the United States. Our client list includes many of the largest organizations in these regions across most major industry verticals, including but not limited to financial, insurance and investment services, automotive, retail, telecommunications, high tech, healthcare, travel, entertainment, non-profit and government. Our results of operations are affected directly by the level of business activity of our clients, which in turn is affected by the level of economic activity in the industries and markets that they serve. Future widespread economic slowdowns in any of these markets, particularly in the United States, may negatively affect the businesses, purchasing decisions and spending of our clients and prospective clients, which could result in reductions in our existing business as well as our new business development. In the event of such widespread economic downturn, we will likely experience a reduction in current projects, longer sales cycles, deferral or delay of purchase commitments for our data products, processing functionality, software systems and services, and increased price competition, all of which could adversely affect our revenue and operating results.
Our operations outside the U.S. are subject to risks that may harm the Company’s business, financial condition or results of operations.
During the last fiscal year, we received approximately 9% of our revenues from business outside the United States. The cost of executing our business plan in non-U.S. locations is increasingly expensive. In those non-U.S. locations where legislation restricting the collection and use of personal data currently exists, less data is available and at a much higher cost. In some foreign markets, the types of products and services we offer have not been generally available and thus are not fully understood by prospective clients. Upon entering these markets, we must educate and condition the markets, increasing the cost and difficulty of successfully executing our business plan in these markets. Additionally, each of our foreign locations is generally expected to fund its own operations and cash flows, although periodically funds may be loaned or invested from the U.S. to the foreign subsidiaries. Because of such loan or investment, exchange rate movements of foreign currencies may have an impact on our future costs of, or future cash flows from, foreign investments. We have not entered into any foreign currency forward exchange contracts or other derivative instruments to hedge the effects of adverse fluctuations in foreign currency exchange rates.
Additional risks inherent in our non-U.S. business activities generally include, among others, potentially longer accounts receivable payment cycles, the costs and difficulties of managing international operations, potentially adverse tax consequences, and greater difficulty enforcing intellectual property rights. The various risks which are inherent in doing business in the U.S. are also generally applicable to doing business outside of the U.S., but such risks may be exaggerated by factors normally associated with international operations, such as differences in culture, laws and regulations, especially restrictions on collection, management, aggregation and use of
24
information. Failure to effectively manage the risks facing our non-U.S. business activities could materially adversely affect our operating results.
In addition, when operating in foreign jurisdictions, we must comply with complex foreign and U.S. laws and regulations, such as the U.S. Foreign Corrupt Practices Act, the U.K. Bribery Act and other local laws prohibiting corrupt payments to government officials, as well as anti-competition regulations and data protection laws and regulations. Violations of these laws and regulations could result in fines and penalties, criminal sanctions, restrictions on our business conduct and on our ability to offer our products and services in one or more countries. Such violations could also adversely affect our reputation with existing and prospective clients, which could negatively impact our operating results and growth prospects.
Our products and services have long and variable sales cycles due to their nature as enterprise-wide solutions. Failure to accurately predict these sales cycles could impair our ability to forecast operating results, which could result in a decline in the market value of our stock.
When purchasing our products and services, our clients and prospects are often faced with a significant commitment of capital, the need to integrate new software and/or hardware platforms across multiple business units and other changes in company-wide operational procedures, all of which result in cautious deliberation and evaluation by prospective clients, longer sales cycles and delays in completing transactions. Additional delays result from the significant up-front expenses and substantial time, effort and other resources necessary of our clients to implement our solutions. For example, depending on the size of a prospective client’s business and its needs, a sales cycle can range from two weeks to nine months. Because of these longer sales cycles, revenues and operating results may vary significantly from period to period. As a result, it is often difficult to accurately forecast our revenues on a quarterly basis as it is not always possible for us to predict the quarter in which sales will actually be completed. This difficulty in predicting revenue, combined with the revenue fluctuations we may experience from quarter to quarter, can adversely affect and cause substantial fluctuations in our stock price.
Third parties may claim that we are infringing their intellectual property and we could suffer significant litigation or licensing expenses or be prevented from selling products or services. Additionally, third parties may infringe our intellectual property and we may suffer competitive injury or expend significant resources enforcing our rights.
As our business is focused on data-driven results and analytics, we rely heavily on proprietary information technology, processes and other protectable intellectual property rights. From time to time, third parties may claim that one or more of our products or services infringe their intellectual property rights. We analyze and take action in response to such claims on a case-by-case basis. Any dispute or litigation regarding patents or other intellectual property could be costly and time-consuming due to the complexity of our technology and the uncertainty of intellectual property litigation, which could divert the attention of our management and key personnel away from our business operations. A claim of intellectual property infringement could force us to enter into a costly or restrictive license agreement, which might not be available under acceptable terms or at all, or could subject us to significant damages or to an injunction against development and sale of certain of our products or services.
Our proprietary portfolio consists of various intellectual property rights, including patents, copyrights, database rights, source code, trademarks, trade secrets, know-how, confidentiality provisions and licensing arrangements. The extent to which such rights can be protected varies from jurisdiction to jurisdiction. If we do not enforce our intellectual property rights vigorously and successfully, our competitive position may suffer which could harm our operating results.
Our brand and reputation are key assets and competitive strengths of our Company, and our business may be adversely affected if events occur that could cause us to be negatively perceived in the marketplace.
For over 45 years, Acxiom has been a thought leader and innovator in solving large-scale data problems and improving marketing results through high-performance, highly scalable, highly secured and privacy-compliant marketing solutions, with a track record of building strong technology and being an innovator in the marketing services space. Our brand and reputation earned over these years are key assets of the Company. Our ability to attract and retain clients is highly dependent upon the external perceptions of our level of data quality, our ability to deliver consumer insights, our enterprise data management and analytical capabilities, the competence of our current associate team, and our ability to meet contractual service level requirements in a timely manner. Negative perceptions or publicity regarding these matters could damage our reputation with prospective clients and the public
25
generally. Adverse developments with respect to our industry may also, by association, negatively impact our reputation, or result in higher regulatory or legislative scrutiny. Any damage to our brand or reputation could have a material adverse effect on our business and operating results.
Failure to recover significant, up-front capital investments required by certain client contracts could be harmful to the Company’s financial condition and operating results.
Certain of our client contracts require significant investment in the early stages, which we expect to recover through billings over the life of the contract. These contracts may involve the construction of new computer systems and communications networks or the development and deployment of new technologies. Substantial performance risk exists in each contract with these characteristics, and some or all elements of service delivery under these contracts are dependent upon successful completion of the development, construction and deployment phases. Failure to successfully meet our contractual requirements under these contracts over their life increases the possibility that we may not recover our capital investments in these contracts. Failure to recover our capital investments could be detrimental to the profitability of the particular engagement as well as our operating results.
The decline in direct mail business could occur more rapidly than we are able to offset with new revenues from investments in new products and services, which could, in turn, negatively impact revenue, net income and profit margins.
Postal rate increases are expected to continue. As postal costs continue to rise, we expect to see increased pressure on direct mailers to leverage digital and other forms of online communication and to mail fewer pieces. The concerns of direct mailers are further exacerbated by the on-going financial struggles of the United States Postal Service (“USPS”). In recent years, the USPS has incurred significant financial losses and may, as a result, implement significant changes to the breadth or frequency of its mail delivery. USPS cost cutting measures have included, among other things, consolidation of USPS’s mail processing network and changes to USPS’s service standards for market-dominant mail products. These ongoing changes are expected to increase mail processing time and slow delivery frequency, which in turn may decrease marketers and the general public’s willingness to continue to use traditional mail, which may negatively impact our direct mail clients and thus the Company’s revenue derived from our traditional direct marketing business. Additionally, those in the traditional direct mail business, as well as the USPS, are under growing pressure to reduce their impact on the environment. It is uncertain at this time what either marketers or the USPS will do to lessen their impact. From a postal service perspective, the actions to be taken may involve changing certain aspects of mail service that would negatively affect direct marketers. From a marketer’s perspective, such actions could have the same effect as increased rates, thereby causing them to mail fewer pieces, which may negatively impact the Company’s revenue derived from our traditional direct marketing business.
Changes in tax laws or regulations that are applied adversely to us or our customers may have a material
adverse effect on our business, cash flow, financial condition or results of operations.
New
i
ncome, sales, use or other tax laws, statutes, rules, regulations or ordinances could be enacted at any time, which could affect the tax treatment of our domestic and foreign earnings. Any new taxes could adversely affect our domestic and international business operations, and our business and financial performance. Further, existing tax laws, statutes, rules, regulations or ordinances could be interpreted, changed, modified or applied adversely to us. For example, recently enacted U.S. tax reform legislation ("Tax Act") contains many significant changes to the U.S. tax laws, the precise consequences to us of which have not yet been finalized. Changes in corporate tax rates, the availability of the net deferred tax assets relating to our U.S. operations, the taxation of foreign earnings, and the deductibility of expenses contained in the Tax Act or other tax reform legislation could have a material impact on the value of our deferred tax assets, could result in significant one-time charges in the current or future taxable years, and could increase our future U.S. tax expense. Furthermore, changes to the taxation of undistributed foreign earnings could change our future intentions regarding reinvestment of such earnings. The foregoing items could have a material adverse effect on our business, cash flow, financial condition or results of operations.
26
None.
Acxiom is headquartered in Conway, Arkansas with additional locations around the United States. We also have operations in Europe and Asia-Pacific. In general, our facilities are in good condition, and we believe that they are adequate to meet our current needs. The table below sets forth the location, form of ownership and general use of our principal properties currently being used by each business segment.
|
Location
|
|
Held
|
|
Use
|
|
Business Segment
|
|
United States:
|
|
|
|
|
|
|
|
|
|
|
|
|
|
|
|
Conway, Arkansas
|
|
Ten facilities
held in fee
|
|
Data center; office space
|
|
Marketing Services,
Audience Solutions,
Connectivity
|
|
|
|
|
|
|
|
|
|
Little Rock, Arkansas
|
|
One building held in fee and one lease
|
|
Data center; office space
|
|
Marketing Services,
Audience Solutions,
Connectivity
|
|
|
|
|
|
|
|
|
|
Redwood City,
California
|
|
Lease
|
|
Office space
|
|
Connectivity
|
|
|
|
|
|
|
|
|
|
San Francisco,
California
|
|
Lease
|
|
Data center; Office space
|
|
Connectivity
|
|
|
|
|
|
|
|
|
|
Downers Grove,
Illinois
|
|
Lease
|
|
Office space
|
|
Marketing Services,
Audience Solutions
|
|
|
|
|
|
|
|
|
|
New York, New
York
|
|
Lease
|
|
Office space
|
|
Marketing Services,
Audience Solutions,
Connectivity
|
|
|
|
|
|
|
|
|
|
Austin, Texas
|
|
Lease
|
|
Office space
|
|
Marketing Services,
Audience Solutions
|
27
|
Location
|
|
Held
|
|
Use
|
|
Business Segment
|
|
Europe:
|
|
|
|
|
|
|
|
|
|
|
|
|
|
|
|
London, England
|
|
Lease
|
|
Office space
|
|
Marketing Services,
Audience Solutions,
Connectivity
|
|
|
|
|
|
|
|
|
|
Normanton, England
|
|
Lease
|
|
Data center; office space
|
|
Audience Solutions
|
|
|
|
|
|
|
|
|
|
Paris, France
|
|
Lease
|
|
Data center; office space
|
|
Connectivity
|
|
|
|
|
|
|
|
|
|
Frankfurt, Germany
|
|
Lease
|
|
Office space
|
|
Audience Solutions
|
|
|
|
|
|
|
|
|
|
Munich, Germany
|
|
Lease
|
|
Office space
|
|
Audience Solutions
|
|
|
|
|
|
|
|
|
|
Gdansk, Poland
|
|
Lease
|
|
Office space
|
|
Marketing Services,
Audience Solutions
|
|
|
|
|
|
|
|
|
|
China:
|
|
|
|
|
|
|
|
|
|
|
|
|
|
|
|
Shanghai, China
|
|
Lease
|
|
Office space
|
|
Marketing Services,
Audience Solutions,
Connectivity
|
|
|
|
|
|
|
|
|
|
Nantong, China
|
|
Lease
|
|
Data center; office space
|
|
Marketing Services,
Audience Solutions,
Connectivity
|
The material set forth in Note 11 of Notes to Consolidated Financial Statements in Item 15 of this Annual Report on Form 10-K is incorporated herein by reference.
Not applicable.
28
Market Information
The outstanding shares of Acxiom’s common stock are listed and traded on the NASDAQ Global Select Market under the symbol “ACXM.” The following table reflects the range of high and low sales prices of Acxiom’s common stock as reported by NASDAQ for each quarter in fiscal
2018
and
2017
.
|
Fiscal 2018
|
High
|
Low
|
||||||
|
Fourth Quarter
|
$
|
32.93
|
|
$
|
18.60
|
|
||
|
Third Quarter
|
27.93
|
|
24.45
|
|
||||
|
Second Quarter
|
27.53
|
|
21.80
|
|
||||
|
First Quarter
|
29.11
|
|
25.47
|
|
||||
|
Fiscal 2017
|
High
|
Low
|
||||||
|
Fourth Quarter
|
$
|
30.40
|
|
$
|
24.74
|
|
||
|
Third Quarter
|
27.70
|
|
22.72
|
|
||||
|
Second Quarter
|
27.24
|
|
21.25
|
|
||||
|
First Quarter
|
23.57
|
|
19.11
|
|
||||
Stockholders
As of May 21, 2018, the approximate number of record holders of the Company’s common stock was 1,798.
Dividends
The Company has not paid dividends on its common stock in the past two fiscal years. The Board of Directors may consider paying dividends in the future but has no plans to pay dividends in the short term.
29
Performance Graph
The graph below matches Acxiom Corporation's cumulative 5-Year total shareholder return on common stock with the cumulative total returns of the NASDAQ Composite index and the NASDAQ Computer & Data Processing index. The graph tracks the performance of a $100 investment in our common stock and in each index (with the reinvestment of all dividends) from 3/31/2013 to 3/31/2018.

|
|
3/13
|
|
3/14
|
|
3/15
|
|
3/16
|
|
3/17
|
|
3/18
|
|
|
Acxiom Corporation
|
100.00
|
|
168.60
|
|
90.64
|
|
105.10
|
|
139.56
|
|
111.32
|
|
|
NASDAQ Composite
|
100.00
|
|
131.36
|
|
154.40
|
|
155.94
|
|
190.23
|
|
228.86
|
|
|
NASDAQ Computer & Data Processing
|
100.00
|
|
141.51
|
|
155.12
|
|
191.20
|
|
226.47
|
|
291.54
|
|
The performance graph and the related chart and text, are being furnished solely to accompany this Annual Report on Form 10-K pursuant to Item 201(e) of Regulation S-K, and are not being filed for purposes of Section 18 of the Securities Exchange Act of 1934, as amended, and are not to be incorporated by reference into any filing of ours, whether made before or after the date hereof, regardless of any general incorporation language in such filing. The stock price performance included in this graph is not necessarily indicative of future stock price performance.
30
Purchases of Equity Securities by the Issuer and Affiliated Purchasers
The table below provides information regarding purchases by Acxiom of its common stock during the periods indicated.
|
Period
|
Total Number of Shares Purchased
|
Average Price Paid
Per Share
|
Total Number of Shares Purchased as Part of Publicly Announced Plans or Programs
|
Maximum Number (or Approximate
Dollar Value) of Shares that May Yet
Be Purchased Under the
Plans or Programs
|
||||||||||
|
January 2018
|
—
|
|
$
|
—
|
|
—
|
|
$
|
174,809,780
|
|
||||
|
February 2018
|
749,014
|
|
$
|
28.12
|
|
749,014
|
|
$
|
153,746,582
|
|
||||
|
March 2018
|
964,128
|
|
$
|
29.44
|
|
964,128
|
|
$
|
125,366,674
|
|
||||
|
Total
|
1,713,142
|
|
$
|
28.86
|
|
1,713,142
|
|
N/A
|
|
|||||
The repurchases listed above were made pursuant to a repurchase program adopted by the Board of Directors on August 29, 2011. That program was subsequently modified and expanded, most recently on
March 30, 2018
. Under the modified common stock repurchase program, the Company may purchase up to $
500 million
of its common stock through the period ending
December 31, 2019
. Through
March 31, 2018
, the Company had repurchased
20.1 million
shares of its stock for
$374.6 million
, leaving remaining capacity of
$125.4 million
under the stock repurchase program.
For information pertaining to selected financial data of Acxiom, refer to page F-2 of the Financial Supplement, which is attached hereto and incorporated herein by reference.
The information required by this item appears in the Financial Supplement at pages F-3 – F-21, which is attached hereto and incorporated herein by reference.
Market Risk
Market risk is the risk of loss from adverse changes in market prices and rates. Our primary market risks include interest rate risk and foreign currency exchange rate risk.
Interest Rate Risk
.
Acxiom’s earnings are affected by changes in short-term interest rates primarily because of our revolving credit agreement, which bears interest at a floating rate. Risk can be estimated by measuring the impact of a near-term adverse movement of one percentage point in short-term market interest rates. If short-term market interest rates increase one percentage point during the next four quarters compared to the previous four quarters, there would be no material adverse impact on Acxiom’s results of operations. Additionally, to manage our risk from market interest rates, we actively monitor interest rates, and may enter into derivative instruments such as interest rate swaps to lock the interest rate on a portion of our variable debt. We do not enter into derivative or interest rate transactions for trading or other speculative purposes.
Foreign Currency Exchange Rate Risk
. Acxiom has a presence in the United Kingdom, France, Germany, Poland, Australia, China and Japan. In general, each of the foreign locations is expected to fund its own operations and cash flows, although funds may be loaned or invested from the U.S. to the foreign subsidiaries. Therefore, exchange rate movements of foreign currencies may have an impact on Acxiom’s future costs or on future cash flows from foreign investments. Acxiom has not entered into any foreign currency forward exchange contracts or other derivative instruments to hedge the effects of adverse fluctuations in foreign currency exchange rates.
31
The financial statements required by this item appear in the Financial Supplement at pages F-24 – F-66, which is attached hereto and incorporated herein by reference.
None.
Disclosure Controls and Procedures
Our management has evaluated, under the supervision and with the participation of our Chief Executive Officer and Chief Financial Officer, the effectiveness of our disclosure controls and procedures as of
March 31, 2018
. Based on their evaluation as of
March 31, 2018
, our Chief Executive Officer and Chief Financial Officer have concluded that our disclosure controls and procedures (as defined in Rules 13a-15(e) and 15d-15(e) under the Securities Exchange Act of 1934, as amended) were effective at the reasonable assurance level to ensure that the information required to be disclosed by us in the Annual Report on Form 10-K was (i) recorded, processed, summarized and reported within the time periods specified in the SEC’s rules and regulations and (ii) accumulated and communicated to our management, including our Chief Executive Officer and Chief Financial Officer, to allow timely decisions regarding required disclosure.
Our management, including our Chief Executive Officer and Chief Financial Officer, does not expect that our disclosure controls and procedures or our internal controls over financial reporting will prevent all errors and all fraud. A control system, no matter how well conceived and operated, can provide only reasonable, not absolute, assurance that the objectives of the control system are met. Further, the design of a control system must reflect the fact that there are resource constraints and the benefits of controls must be considered relative to their costs. Because of the inherent limitations in all control systems, no evaluation of controls can provide absolute assurance that all control issues and instances of fraud, if any, with Acxiom have been detected.
Management’s Report on Internal Control Over Financial Reporting
The management of Acxiom Corporation (the Company) is responsible for establishing and maintaining adequate internal control over financial reporting (as defined in Rules 13a-15(f) under the Securities Exchange Act of 1934, as amended).
The Company’s internal control over financial reporting is a process designed to provide reasonable assurance regarding the reliability of financial reporting and the preparation of financial statements for external purposes in accordance with generally accepted accounting principles, and includes those policies and procedures that:
|
•
|
Pertain to the maintenance of records that, in reasonable detail, accurately and fairly reflect the transactions and dispositions of the assets of the Company;
|
|
•
|
Provide reasonable assurance that transactions are recorded as necessary to permit preparation of financial statements in accordance with generally accepted accounting principles, and that receipts and expenditures of the Company are being made only in accordance with authorizations of management and directors of the Company; and
|
|
•
|
Provide reasonable assurance regarding prevention or timely detection of unauthorized acquisition, use or disposition of the Company’s assets that could have a material effect on the financial statements.
|
Because of its inherent limitations, internal control over financial reporting may not prevent or detect misstatements. Also, projections of any evaluations of effectiveness to future periods are subject to the risk that controls may become inadequate because of changes in conditions, or that the degree of compliance with the policies or procedures may deteriorate.
The Company’s management, with participation of the Chief Executive Officer and Chief Financial Officer, assessed the effectiveness of the Company’s internal control over financial reporting as of
March 31, 2018
. In making this
32
assessment, the Company’s management used the criteria set forth by the Committee of Sponsoring Organizations of the Treadway Commission (COSO) in
Internal Control-Integrated Framework (2013)
.
Based on management’s assessment and those criteria, the Company’s management determined that the Company’s internal control over financial reporting was effective as of
March 31, 2018
.
KPMG LLP, the Company’s independent registered public accounting firm, has audited the Company’s internal control over financial reporting, as stated in their report, which is included herein.
Changes in Internal Control Over Financial Reporting
During the three months ended March 31, 2018, there were no changes in our internal control over financial reporting that have materially affected, or are reasonably likely to materially affect, our internal control over financial reporting.
Not applicable.
33
The information concerning our executive officers is contained in Part I of this Annual Report on Form 10-K under the caption “Executive Officers of the Registrant” which is included there pursuant to Instruction 3 to Item 401(b) of the SEC’s Regulation S-K.
The Acxiom Board of Directors has adopted codes of ethics applicable to our principal executive, financial and accounting officers and all other persons performing similar functions. Copies of these codes of ethics are posted on Acxiom’s website at www.acxiom.com under the “About – Codes of Ethics” section of the site. The remaining information required by this item appears under the captions “Election of Directors,” “Corporate Governance” and “Section 16(a) Beneficial Ownership Reporting Compliance” in Acxiom's
2018
Proxy Statement, which information is incorporated herein by reference.
The information required by this item appears under the heading “Executive Compensation” in Acxiom's
2018
Proxy Statement, which information is incorporated herein by reference.
Securities Authorized for Issuance Under Equity Compensation Plans
The following table contains information about our common stock which may be issued upon the exercise of options under our existing equity compensation plans as of the end of
fiscal 2018
(
March 31, 2018
):
|
|
|
|
|
Number of securities
|
||||||
|
|
Number of
|
|
|
available for future
|
||||||
|
|
securities
|
|
|
issuance
|
||||||
|
|
to be issued upon
|
|
|
under equity
|
||||||
|
|
exercise of
|
|
Weighted-average
|
compensation
|
||||||
|
|
outstanding
|
|
exercise price of
|
plans (excluding
|
||||||
|
|
options,
|
|
outstanding options,
|
securities
|
||||||
|
Plan category
|
warrants and rights
|
|
warrants and rights
|
reflected in column (a))
|
||||||
|
|
(a)
|
|
(b)
|
(c)
|
||||||
|
Equity compensation plans approved by shareholders
|
2,344,181
|
|
1
|
$
|
13.60
|
|
6,592,135
|
|
||
|
Equity compensation plans not approved by shareholders
|
221,106
|
|
2
|
13.74
|
|
29,393
|
|
|||
|
Total
|
2,565,287
|
|
|
$
|
13.61
|
|
6,621,528
|
|
||
_____________________________________________
|
1
|
This figure represents stock options issued under shareholder-approved stock option plans, of which
392,777
were assumed in connection with our fiscal 2015 acquisition of LiveRamp,
172,919
were assumed in connection with our fiscal 2017 acquisition of Arbor, and
34,053
were assumed in connection with our fiscal 2017 acquisition of Circulate.
|
|
2
|
Issued pursuant to the Company’s 2011 Nonqualified Equity Compensation Plan described below, which does not require shareholder approval under the exception provided for in NASDAQ Marketplace Rule 5635(c)(4).
|
Equity Compensation Plan Not Approved by Security Holders
The Company adopted the 2011 Nonqualified Equity Compensation Plan of Acxiom Corporation (the “2011 Plan”) for the purpose of making equity grants to induce new key executives to join the Company. The awards that may be made under the 2011 Plan include stock options, stock appreciation rights, restricted stock awards, RSU awards, performance awards, or other stock unit awards. To receive such an award, a person must be newly employed with the Company with the award being provided as an inducement material to their employment,
34
provided the award is first properly approved by the board of directors or an independent committee of the board. The board of directors and its compensation committee are the administrators of the 2011 Plan, and as such, determine all matters relating to awards granted under the 2011 Plan, including the eligible recipients, whether and to what extent awards are to be granted, the number of shares to be covered by each grant and the terms and conditions of the awards. The 2011 Plan has not been approved by the Company’s shareholders.
The remaining information required by this item appears under the heading “Stock Ownership” in Acxiom's
2018
Proxy Statement, which information is incorporated herein by reference.
The information required by this item appears under the headings “Related-Party Transactions” and “Corporate Governance - Board and Committee Matters” in Acxiom's
2018
Proxy Statement, which information is incorporated herein by reference.
The information required by this item appears under the heading “Ratification of Independent Registered Public Accountant - Fees Billed for Services Rendered by Independent Auditor” in Acxiom's
2018
Proxy Statement, which information is incorporated herein by reference.
35
(a) The following documents are filed as a part of this report:
1.
Financial Statements.
The following consolidated financial statements of the registrant and its subsidiaries included in the Financial Supplement and the Independent Auditors' Reports thereof are attached hereto. Page references are to page numbers in the Financial Supplement.
|
|
Page
|
2.
Financial Statement Schedules.
All schedules are omitted because they are not applicable or not required or because the required information is included in the consolidated financial statements or notes thereto.
3.
Exhibits.
The following exhibits are filed with this report or are incorporated by reference to previously filed material:
Exhibit No.
|
2.1
|
|
2.2
|
|
2.3
|
|
3.1
|
36
|
3.2
|
|
10.1
|
|
10.2
|
|
10.3
|
|
10.4
|
|
10.5
|
|
10.6
|
|
10.7
|
|
10.8
|
|
10.9
|
|
10.10
|
|
10.11
|
|
10.12
|
|
10.13
|
|
10.14
|
|
10.15
|
37
|
10.16
|
|
10.17
|
|
10.18
|
|
10.19
|
|
10.20
|
|
10.21
|
|
10.22
|
|
10.23
|
|
10.24
|
|
10.25
|
|
10.26
|
|
10.27
|
|
21
|
|
23
|
|
24
|
|
31.1
|
|
31.2
|
38
|
32.1
|
|
32.2
|
|
101
|
The following financial information from our Annual Report on Form 10-K for the fiscal year ended March 31, 2018, formatted in XBRL: (i) Consolidated Balance Sheets as of March 31, 2018 and 2017; (ii) Consolidated Statements of Operations for the fiscal years ended March 31, 2018, 2017 and 2016; (iii) Consolidated Statements of Comprehensive Income for the fiscal years ended March 31, 2018, 2017 and 2016; (iv) Consolidated Statements of Stockholders’ Equity for the fiscal years ended March 31, 2018, 2017 and 2016; (v) Consolidated Statements of Cash Flows for the fiscal years ended March 31, 2018, 2017 and 2016; and (vi) Notes to the Consolidated Financial Statements
|
39
SIGNATURES
Pursuant to the requirements of Section 13 or 15(d) of the Securities Exchange Act of 1934, the registrant has duly caused this report to be signed on its behalf by the undersigned, thereunto duly authorized.
|
|
ACXIOM CORPORATION
|
|
|
|
|
|
|
Date: May 25, 2018
|
By:
|
/s/ Warren C. Jenson
|
|
|
|
Warren C. Jenson
|
|
|
|
Chief Financial Officer & Executive Vice President
|
|
(principal financial and accounting officer)
|
||
40
Pursuant to the requirements of the Securities Exchange Act of 1934, this report has been signed below by the following persons on behalf of the registrant and in the capacities and on the dates indicated.
|
Signature
|
|
|
|
|
|
|
|
|
|
|
|
/s/ John L. Battelle*
|
|
Director
|
|
May 25, 2018
|
|
John L. Battelle
|
|
|
|
|
|
|
|
|
|
|
|
/s/ Timothy R. Cadogan*
|
|
Director
|
|
May 25, 2018
|
|
Timothy R. Cadogan
|
|
|
|
|
|
|
|
|
|
|
|
|
Director
|
|
May 25, 2018
|
|
|
William T. Dillard II
|
|
|
|
|
|
|
|
|
|
|
|
/s/ Richard P. Fox*
|
|
Director
|
|
May 25, 2018
|
|
Richard P. Fox
|
|
|
|
|
|
/s/ Jerry D. Gramaglia*
|
|
Director (Non-Executive Chairman of the Board)
|
|
May 25, 2018
|
|
Jerry D. Gramaglia
|
|
|
|
|
|
|
|
|
|
|
|
/s/ William J. Henderson*
|
|
Director
|
|
May 25, 2018
|
|
William J. Henderson
|
|
|
|
|
|
/s/ Scott E. Howe*
|
|
Director, CEO & President (principal executive officer)
|
|
May 25, 2018
|
|
Scott E. Howe
|
|
|
|
|
|
|
|
|
|
|
|
/s/ Clark M. Kokich*
|
|
Director
|
|
May 25, 2018
|
|
Clark M. Kokich
|
|
|
|
|
|
|
|
|
|
|
|
/s/ Debora B. Tomlin*
|
|
Director
|
|
May 25, 2018
|
|
Debora B. Tomlin
|
|
|
|
|
|
/s/ Warren C. Jenson
|
|
Chief Financial Officer & Executive Vice President (principal financial and accounting officer)
|
|
May 25, 2018
|
|
Warren C. Jenson
|
|
|
|
|
|
*By:
|
/s/ Catherine L. Hughes
|
|
|
Catherine L. Hughes
|
|
|
Attorney-in-Fact
|
41
ACXIOM CORPORATION
INDEX TO FINANCIAL SUPPLEMENT
TO ANNUAL REPORT ON FORM 10-K
FOR THE YEAR ENDED MARCH 31, 2018
|
Annual Financial Statements:
|
|
F-1
ACXIOM CORPORATION
SELECTED FINANCIAL DATA
(In thousands, except per share data)
|
Year ended March 31,
|
2018
|
2017
|
2016
|
2015
|
2014
|
||||||||||||||
|
Statement of operations data:
|
|
|
|
|
|||||||||||||||
|
Revenues
|
$
|
917,406
|
|
$
|
880,247
|
|
$
|
850,088
|
|
$
|
804,911
|
|
$
|
805,153
|
|
||||
|
Net earnings (loss) from continuing operations
|
$
|
23,480
|
|
$
|
4,108
|
|
$
|
(8,648
|
)
|
$
|
(26,542
|
)
|
$
|
(17,340
|
)
|
||||
|
Earnings from discontinued operations, net of tax
|
—
|
|
—
|
|
15,351
|
|
15,511
|
|
26,143
|
|
|||||||||
|
Net earnings (loss)
|
$
|
23,480
|
|
$
|
4,108
|
|
$
|
6,703
|
|
$
|
(11,031
|
)
|
$
|
8,803
|
|
||||
|
Net earnings (loss) attributable to Acxiom
|
$
|
23,480
|
|
$
|
4,108
|
|
$
|
6,703
|
|
$
|
(11,031
|
)
|
$
|
8,863
|
|
||||
|
Basic earnings (loss) per share:
|
|
|
|
|
|
|
|
|
|||||||||||
|
Net earnings (loss) from continuing operations
|
$
|
0.30
|
|
$
|
0.05
|
|
$
|
(0.11
|
)
|
$
|
(0.34
|
)
|
$
|
(0.23
|
)
|
||||
|
Net earnings from discontinued operations
|
—
|
|
—
|
|
0.20
|
|
0.20
|
|
0.35
|
|
|||||||||
|
Net earnings (loss)
|
$
|
0.30
|
|
$
|
0.05
|
|
$
|
0.09
|
|
$
|
(0.14
|
)
|
$
|
0.12
|
|
||||
|
Net earnings (loss) attributable to Acxiom
|
$
|
0.30
|
|
$
|
0.05
|
|
$
|
0.09
|
|
$
|
(0.14
|
)
|
$
|
0.12
|
|
||||
|
Diluted earnings (loss) per share:
|
|
|
|
|
|
|
|
|
|||||||||||
|
Net earnings (loss) from continuing operations
|
$
|
0.29
|
|
$
|
0.05
|
|
$
|
(0.11
|
)
|
$
|
(0.34
|
)
|
$
|
(0.23
|
)
|
||||
|
Net earnings from discontinued operations
|
—
|
|
—
|
|
0.20
|
|
0.20
|
|
0.35
|
|
|||||||||
|
Net earnings (loss)
|
$
|
0.29
|
|
$
|
0.05
|
|
$
|
0.09
|
|
$
|
(0.14
|
)
|
$
|
0.12
|
|
||||
|
Net earnings (loss) attributable to Acxiom
|
$
|
0.29
|
|
$
|
0.05
|
|
$
|
0.09
|
|
$
|
(0.14
|
)
|
$
|
0.12
|
|
||||
Acxiom has not paid cash dividends for any of the periods reported.
|
As of March 31,
|
2018
|
2017
|
2016
|
2015
|
2014
|
||||||||||||||
|
Balance sheet data:
|
|
|
|
|
|
|
|
|
|||||||||||
|
Current assets
|
$
|
360,345
|
|
$
|
368,519
|
|
$
|
376,010
|
|
$
|
511,404
|
|
$
|
656,056
|
|
||||
|
Current liabilities
|
$
|
178,355
|
|
$
|
230,213
|
|
$
|
224,000
|
|
$
|
283,792
|
|
$
|
249,469
|
|
||||
|
Total assets
|
$
|
1,209,253
|
|
$
|
1,234,538
|
|
$
|
1,149,849
|
|
$
|
1,294,087
|
|
$
|
1,310,497
|
|
||||
|
Long-term debt, excluding current installments
|
$
|
227,837
|
|
$
|
189,241
|
|
$
|
157,897
|
|
$
|
244,753
|
|
$
|
275,976
|
|
||||
|
Total equity
|
$
|
749,095
|
|
$
|
738,980
|
|
$
|
698,968
|
|
$
|
703,257
|
|
$
|
682,857
|
|
||||
The selected financial data for the periods reported above has been derived from the consolidated financial statements and, unless otherwise indicated, reflect the Company’s continuing operations. Refer to Note 4 – Discontinued Operations and Dispositions for additional information regarding discontinued operations.
This information should be read in conjunction with “Management’s Discussion and Analysis of Financial Condition and Results of Operations” and the historical financial statements and related notes contained in this report. The historical results are not necessarily indicative of results to be expected in any future period.
F-2
Management’s Discussion and Analysis of Financial Condition and Results of Operations
We begin Management’s Discussion and Analysis of Financial Condition and Results of Operations with an overview of our operating segments, summary results and notable events. This overview is followed by a summary of our critical accounting policies and estimates that we believe are important to understanding the assumptions and judgments incorporated in our reported financial results. We then provide a more detailed analysis of our results of operations and financial condition.
Unless otherwise indicated, we refer to captions such as earnings (loss), and earnings (loss) per share from continuing operations attributable to the Company simply as “earnings (loss)”, and “earnings (loss) per share” throughout this Management’s Discussion and Analysis. Similarly, discussion of other matters in our consolidated financial statements relates to continuing operations unless otherwise indicated.
Introduction and Overview
Acxiom Corporation is a global technology and enablement services company with a vision to transform data into value for everyone. Through a simple, open approach to connecting systems and data, we provide the data foundation for the world’s best marketers. By making it safe and easy to activate, validate, enhance, and unify data, we provide marketers with the ability to deliver relevant messages at scale and tie those messages back to actual results. Our products and services enable people-based marketing, allowing our clients to generate higher return on investment and drive better omni-channel customer experiences.
Acxiom is a Delaware corporation founded in 1969 in Conway, Arkansas. Our common stock is listed on the NASDAQ Global Select Market under the symbol “ACXM.” We serve a global client base from locations in the United States, Europe, and the Asia-Pacific (“APAC”) region. Our client list includes many of the world’s largest and best-known brands across most major industry verticals, including but not limited to financial, insurance and investment services, automotive, retail, telecommunications, high tech, healthcare, travel, entertainment, non-profit, and government.
Operating Segments
Our operating segments provide management with a comprehensive view of our key businesses based on how we manage our operations and measure results. Additional information related to our operating segments is contained in Note 17 – Segment Information of the Notes to Consolidated Financial Statements.
Connectivity
As shown in the illustration below, our Connectivity segment enables our clients to build an omni-channel view of the consumer and activate that understanding across the marketing ecosystem.
Through integrations with more than 575 leading digital marketing platforms and data providers, we have become a key point of entry into the digital ecosystem, helping our clients eliminate data silos and unlock greater value from the marketing tools they use every day. We provide a foundational identity resolution layer enabling our clients to identify and reach consumers across channels and measure the impact of marketing on sales, using the marketing platform of their choice.
F-3
Today, our primary Connectivity offering is LiveRamp IdentityLink™, an identity resolution service that ties data back to real people and makes it possible to onboard that data for people-based marketing initiatives across digital channels. Leveraging AbiliTec® and the LiveRamp identity graph, IdentityLink first resolves a client’s first-, second-, and third-party, exposure, and transaction data to persistent anonymous consumer identifiers that represent real people in a privacy-safe way. This omni-channel view of the consumer can then be onboarded to and between any of the 575 plus partners in our ecosystem to support targeting, personalization and measurement use cases.
|
Targeting
|
Personalization
|
Measurement
|
|
|
|
|
|
Example
|
Example
|
Example
|
|
Clients can upload known data from first-, second-, and third-party data sources, resolve it to an omnichannel privacy-safe link with IdentityLink, then onboard to one of 575+ LiveRamp partners to deploy targeted ads to known customers.
|
Clients can deliver highly relevant content the moment viewers visit their websites' landing page, no login required. Leveraging IdentityLink, clients can resolve customer segment data to devices and digital IDs, onboard that data to a personalization platform and provide one-to-one experiences without compromising user privacy.
|
Clients can connect exposure data with first and third-party purchase data across channels by resolving all customer devices back to the customers to which they belong. Then, clients can onboard that data to a measurement platform to clearly establish cause, effect and impact.
|
IdentityLink operates in an Acxiom SafeHaven® certified environment with technical, operational, and personnel controls designed to ensure our clients’ data is kept private and secure.
IdentityLink is sold to brands and the companies' brands partners to execute their marketing, including marketing technology providers, data providers, publishers and agencies.
|
•
|
IdentityLink for Brands and Agencies.
IdentityLink allows brands and their agencies to execute people-based marketing by creating an omni-channel understanding of the consumer and activating that understanding across their choice of best-of-breed digital marketing platforms.
|
|
•
|
IdentityLink for Marketing Technology Providers.
IdentityLink provides marketing technology providers with the ability to offer people-based targeting, measurement and personalization within their platforms. This adds value for brands by increasing reach, as well as the speed at which they can activate their marketing data.
|
|
•
|
IdentityLink for Data Owners.
IdentityLink allows data owners to easily connect their data to the digital ecosystem and better monetize it. Data can be distributed directly to clients or made available through the
IdentityLink Data Store
feature. This adds value for brands as it allows them to augment their understanding of consumers, and increase both their reach against and understanding of customers and prospects.
|
|
•
|
IdentityLink for Publishers.
IdentityLink allows publishers to offer people-based marketing on their properties. This adds value for brands by providing direct access to their customers and prospects in the publisher’s premium inventory.
|
F-4
Our Connectivity revenue consists primarily of monthly recurring subscription fees sold on an annual basis. To a lesser extent, we generate revenue from data providers and certain digital publishers in the form of revenue-sharing agreements.
Audience Solutions (“AS”)
Our AS segment helps clients validate the accuracy of their data, enhance it with additional insight, and keep it up to date, enabling clients to reach desired audiences with highly relevant messages. Leveraging our recognition and data assets, clients can identify, segment, and differentiate their audiences for more effective marketing and superior customer experiences. AS offerings include InfoBase®, our large consumer data store that serves as the basis for Acxiom’s consumer demographics products, and AbiliTec, our patented identity resolution technology that assists our clients in reconciling and managing variations of customer identity over time and across multiple channels.
InfoBase.
With more than 1,500 demographic, socio-economic and lifestyle data elements and several thousand predictive models, our InfoBase products provide marketers with the ability to identify and reach the right audience with the right message across both traditional and digital channels. Through partnerships with over 100 online publishers and digital marketing platforms, including Facebook, Google, Twitter, 4INFO, AOL, eBay and MSN, marketers can use InfoBase data to create and target specific audiences. Data can be accessed directly or through the Acxiom Audience Cloud, a web-based, self-service tool that makes it easy to build and distribute third-party custom data segments.
|
•
|
AbiliTec.
As shown in the illustration below, AbiliTec helps brands recognize individuals and households using a number of different input variables and connects identities online and offline.
|
By identifying and linking multiple identifiers and data elements back to a persistent ID, our clients are able to create a single view of the customer, which allows them to perform more effective audience targeting and deliver better, more relevant customer experiences.
Our AS revenue includes licensing fees, which are typically in the form of recurring monthly billings, as well as transactional revenue based on volume or one-time usage. In addition, AS generates digital data revenue from certain digital publishers and addressable television providers in the form of revenue sharing agreements. Our Marketing Database clients are a significant channel for our AS offerings.
Marketing Services (“MS”)
Our MS segment helps clients unify data at the individual level in a privacy-safe environment, so they can execute people-based marketing campaigns, tie back to real results, and drive a continual cycle of optimization. We help architect the foundation for data-driven marketing by delivering solutions that integrate customer and prospect data across the enterprise, thereby enabling our clients to establish a single view of the customer. We also support our clients in navigating the complexities of consumer privacy regulation, making it easy and safe for them to use innovative technology, maintain choice in channels and media, and stay agile in this competitive era of the consumer. These services allow our clients to generate higher return on marketing investments and, at the same time, drive better, more relevant customer experiences.
The MS segment includes the following service offerings: Marketing Database Services and Strategy and Analytics. The MS segment also included Impact Email Platform and Services until the disposition of the business in August 2016.
F-5
|
•
|
Marketing Database Services.
Our Marketing Database offering provides solutions that unify consumer data across an enterprise, enabling clients to execute relevant, people-based marketing and activate data across the marketing ecosystem. Our consumer marketing databases, which we design, build, and manage for our clients, make it possible for our clients to collect and analyze information from all sources, thereby increasing customer acquisition, retention, and loyalty. Through our growing partner network, clients are able to integrate their data with best-of-breed marketing solutions while respecting and protecting consumer privacy.
|
Marketing Database Services are generally provided under long-term contracts. Our revenue consists primarily of recurring monthly billings, and to a lesser extent, other volume and variable based billings.
|
•
|
Strategy and Analytics
. Our Strategy and Analytics offering consists of marketing strategists and data scientists who leverage industry knowledge and advanced analytics to assist our clients with identifying growth opportunities, addressing marketing data and technology needs, and adopting best practices. In addition, we help our clients identify and address their data privacy and governance requirements.
|
Strategy and Analytics revenue consists primarily of project-based fees.
|
•
|
Impact Email Platform and Services.
Until the August 2016 disposition, Acxiom Impact™ provided email and cross-channel data-driven marketing solutions for enterprise marketers, including a proprietary marketing platform and agency services.
|
Acxiom Impact™ revenue consists of (1) volume-based fees for the use of the Impact email platform and (2) project-based and retainer-based fees for associated agency services.
Summary
Together, our products and services form the “power grid” for data, the critical foundation for people-based marketing that brands need to engage consumers across today’s highly fragmented landscape of channels and devices.
We provide integrations with the largest number of marketing platforms and data providers in the digital marketing ecosystem, enabling our clients to innovate through their preferred choice of technology, data, and services providers. Our industry-leading identity resolution and data assets power best-in-class consumer identification and linking across channels and devices. And, our integrated services offering provides the expertise required to manage large sets of data legally, ethically, securely, and in a way that protects consumer privacy.
F-6
Summary Results and Notable Events
During fiscal 2018, the Company entered into a Sixth Amended and Restated Credit Agreement (the "restated credit agreement") as part of refinancing its prior credit agreement. The Company used an initial draw of $230 million to pay off the outstanding $225 million term and revolving loan balances, with interest, and fund $4 million in fees related to the restated agreement.
During fiscal 2017, the Company acquired all of the outstanding shares of Arbor Technologies, Inc. (“Arbor”) and Circulate.com, Inc. (“Circulate”). Arbor and Circulate help publishers connect people-based data to the marketing ecosystem. Arbor and Circulate are included in the Connectivity segment, and increase the scale of the Company’s omni-channel identity graph and network. The Company has included the financial results of Arbor and Circulate in the consolidated financial statements from the dates of acquisition. The consideration paid for the outstanding shares and vested stock options was approximately $137.4 million, net of cash acquired of approximately $9.5 million. The consideration paid for unvested stock options has an estimated fair value of $9.2 million. These options are not part of the purchase price and will be expensed as non-cash compensation over the applicable vesting periods.
During fiscal 2017, the Company completed the sale of its Impact email business to Zeta Interactive for total consideration of $22.0 million, including a $4.0 million subordinated promissory note with interest accruing at a rate of 6.0% per annum. The note was paid in full during fiscal 2018. The Company also entered into a separate multi-year contract to provide Zeta Interactive with Connectivity and Audience Solutions services. Prior to the disposition, the Impact email business was included in the Marketing Services segment results.
During fiscal 2016, the Company completed the sale of its ITO business to Charlesbank Capital Partners and M/C Partners. The business qualified for treatment as discontinued operations during fiscal 2016. Accordingly, the results of operations, cash flows, and the balance sheet amounts pertaining to ITO, for all periods reported, have been classified as discontinued operations in the consolidated financial statements.
A summary of the most recently completed fiscal year is presented below.
|
•
|
Revenues of $917.4 million, a 4.2% increase from $880.2 million in
fiscal 2017
.
|
|
•
|
Cost of revenue of $466.4 million, a 2.4% decrease from $477.7 million in
fiscal 2017
.
|
|
•
|
Gross margin increased to 49.2% from 45.7% in
fiscal 2017
.
|
|
•
|
Total operating expenses of $440.4 million, a 13.8% increase from $386.9 million in
fiscal 2017
.
|
|
•
|
Cost of revenue and operating expenses for
fiscal 2018
and
2017
include the following items:
|
|
◦
|
Non-cash stock compensation of $63.2 million and $49.1 million, respectively (cost of revenue and operating expenses)
|
|
◦
|
Purchased intangible asset amortization of $23.9 million and $18.6 million, respectively (cost of revenue)
|
|
◦
|
Separation and transformation costs of $20.8 million and $8.6 million, respectively (operating expenses)
|
|
◦
|
Restructuring charges and other adjustments of $6.4 million and $8.4 million, respectively (operating expenses)
|
|
•
|
Net earnings increased to $23.5 million or $0.29 per diluted share compared to net earnings of $4.1 million or $0.05 per diluted share in fiscal 2017. The increase is primarily due to recently enacted changes in tax law, including a one-time benefit for the remeasurement of net deferred tax liabilities.
|
|
•
|
Net cash provided by operating activities of $112.2 million, a 3.2% decrease from $115.8 million in
fiscal 2017
.
|
|
•
|
The Company repurchased 3.3 million shares of its common stock for $88.9 million under the Company’s common stock repurchase program.
|
F-7
|
•
|
The Company refinanced its debt facility to consist of a $600 million revolving credit facility with a maturity in June 2022.
|
This summary highlights significant events and transactions of the Company during the fiscal years ended
March 31, 2018 and 2017
. However, this summary is not intended to be a full discussion of the Company’s results. This summary should be read in conjunction with the following discussion of Results of Operations and Capital Resources and Liquidity and with the Company’s consolidated financial statements and footnotes accompanying this report.
Critical Accounting Policies
We prepare our consolidated financial statements in conformity with U.S. generally accepted accounting principles (“GAAP”) as set forth in the Financial Accounting Standards Board’s (“FASB”) Accounting Standards Codification (“ASC”) and we consider the various staff accounting bulletins and other applicable guidance issued by the United States Securities and Exchange Commission (“SEC”). GAAP, as set forth within the ASC, requires management to make certain estimates, judgments and assumptions. We believe that the estimates, judgments and assumptions upon which we rely are reasonable based upon information available to us at the time that these estimates, judgments and assumptions are made. These estimates, judgments and assumptions can affect the reported amounts of assets and liabilities and the disclosure of contingent assets and liabilities as of the date of the financial statements and the reported amounts of revenues and expenses during the reporting periods. Note 1 to the accompanying consolidated financial statements includes a summary of significant accounting policies used in the preparation of Acxiom’s consolidated financial statements. Of those policies, we have identified the following as the most critical because they are both important to the portrayal of the Company’s financial condition and operating results, and they may require management to make judgments and estimates about inherently uncertain matters:
|
•
|
Revenue Recognition
|
|
•
|
Goodwill and Intangible Assets
|
|
•
|
Accounting for Income Taxes
|
Revenue Recognition
The Company’s policy follows the guidance from ASC 605,
Revenue Recognition
.
The Company provides marketing database services under long-term arrangements. These arrangements may require the Company to perform setup activities such as the design and build of a database, and may include other products and services purchased at the same time, or within close proximity of one another (referred to as multiple element arrangements). Each element within a multiple element arrangement is accounted for as a separate unit of accounting provided the following criteria are met: the delivered products or services have value to the customer on a standalone basis; and for an arrangement that includes a general right of return relative to the delivered products or services, delivery or performance of the undelivered product or service is considered probable and is substantially controlled by us. We consider a deliverable to have standalone value if the product or service is sold separately by us or another vendor or could be resold by the customer. Further, our revenue arrangements generally do not include a general right of return related to the delivered products. Where the aforementioned criteria for a separate unit of accounting are not met, the deliverable is combined with the undelivered element(s) and treated as a single unit of accounting for purposes of allocation of the arrangement consideration and revenue recognition.
For our multiple-element arrangements, we allocate revenue to each element based on a selling price hierarchy at the arrangement’s inception. The relative selling price for each unit of accounting in a multiple-element arrangement is established using vendor-specific objective evidence ("VSOE"), if available, third-party evidence ("TPE"), if available, or management’s best estimate of stand-alone selling price ("BESP"). In most cases, the Company has neither VSOE nor TPE and therefore uses BESP. The total arrangement consideration is allocated to each separate unit of accounting for each of the deliverables using the relative selling prices of each unit based on the aforementioned selling price hierarchy. We limit the amount of revenue recognized for delivered elements to an amount that is not contingent upon future delivery of additional products or services or meeting any specified performance conditions.
F-8
The objective of BESP is to determine the price at which the Company would transact a sale if the product or service were sold on a stand-alone basis. Management’s BESP is determined by considering multiple factors including actual contractual selling prices when the item is sold on a stand-alone basis, as well as market conditions, competition, internal costs, profit objectives and pricing practices. As pricing and marketing strategies evolve, we may modify our pricing practices in the future, which could result in changes to BESP, or to the development of VSOE or TPE for individual products or services. As a result, future revenue recognition for multiple-element arrangements could differ from recognition in the current period. Our relative selling prices are analyzed on an annual basis or more frequently if we experience significant changes in selling prices.
Revenues are recognized when: (1) persuasive evidence of an arrangement exists; (2) we deliver the products and services; (3) the sale price is fixed or determinable; and (4) collection is reasonably assured. Revenues that are not recognized at the time of sale because the foregoing conditions are not met are recognized when those conditions are subsequently met. Where applicable, we reduce revenue for certain incentive programs where we can sufficiently estimate the effects of these items. In some cases, the arrangements also contain provisions requiring customer acceptance of the setup activities prior to commencement of the ongoing services arrangement. Up-front fees billed during the setup phase for these arrangements are deferred and setup costs that are direct and incremental to the contract are capitalized. Revenue recognition does not begin until after customer acceptance in cases where contracts contain acceptance provisions. Once the setup phase is complete and customer acceptance occurs, the Company recognizes revenue and the related costs for each element as delivered. In situations where the arrangement does not require customer acceptance before the Company begins providing services, revenue is recognized for each element as delivered and no costs are deferred.
The Company evaluates its marketing database arrangements to determine whether the arrangement contains a lease. If the arrangement is determined to contain a lease, applicable accounting standards require the Company to account for the lease component separately from the remaining components of the arrangement. In cases where marketing database arrangements are determined to include a lease, the lease is evaluated to determine whether it is a capital lease or operating lease and accounted for accordingly. These lease revenues are not significant to the Company’s consolidated financial statements.
Sales of third-party software, hardware and certain other equipment are recognized when delivered. If such sales are part of a multiple-element arrangement, they are recognized as a separate element unless collection of the sales price is dependent upon delivery of other products or services. Additionally, the Company evaluates revenue from the sale of data, software, hardware and equipment in accordance with accounting standards to determine whether such revenue should be recognized on a gross or a net basis. All the factors in the accounting standards are considered with the primary factor being whether the Company is the primary obligor in the arrangement. “Out-of-pocket” expenses incurred by, and reimbursed to, the Company in connection with customer contracts are recorded as gross revenue.
The Company also performs services on a project basis outside of, or in addition to, the scope of long-term arrangements. The Company recognizes revenue from these services as the services are performed.
All taxes assessed on revenue-producing transactions described above are presented on a net basis, or excluded from revenues.
Revenues from the licensing of data are recognized upon delivery of the data to the customer. Revenue from the licensing of data to the customer in circumstances where the license agreement contains a volume cap is recognized in proportion to the total records to be delivered under the arrangement. Revenue from the sale of data on a per-record basis is recognized as the records are delivered.
Revenues from Connectivity services are primarily recorded as monthly recurring subscription fees, and from data providers and certain digital publishers in the form of revenue-sharing agreements.
Goodwill and Intangible Assets
Goodwill is measured and tested for impairment on an annual basis in the first quarter of the Company's fiscal year in accordance with ASC 350,
Intangibles-Goodwill and Other
, or more frequently if indicators of impairment exist. In performing our goodwill impairment test, we first evaluate goodwill to determine if it is more likely than not that the occurrence of an event or change in circumstances has reduced the fair value of a reporting segment below its carrying value. The qualitative assessment requires that we consider events or circumstances that may include
F-9
macroeconomic conditions, industry and market considerations, cost factors, overall financial performance, changes in management or key personnel, changes in strategy, changes in customers, and changes in our stock price. If, after assessing the totality of events or circumstances, we determine that it is more likely than not that the fair value of our reporting segments is greater than the carrying amounts, then the two-step goodwill impairment test is not performed.
If the qualitative assessment indicates that the two-step quantitative analysis should be performed, we evaluate goodwill for impairment by comparing the fair value of each of our reporting segments to its carrying value, including the associated goodwill. To determine the fair values, we use the equal weighting of the market approach based on comparable publicly traded companies in similar lines of businesses and the income approach based on estimated discounted future cash flows. Our cash flow assumptions consider historical forecasted revenue, operating costs and other relevant factors.
We completed our annual impairment test during the first quarter of fiscal
2018
. We determined, after performing a qualitative review of each reporting segment, that it is more likely than not that the fair value of each of our reporting segments exceeds the respective carrying amounts. Accordingly, there was no indication of impairment, and the two-step quantitative goodwill impairment test was not performed. We did not recognize any goodwill impairment charges in fiscal 2017. During fiscal 2016, we recognized a $5.4 million goodwill impairment loss related to our APAC Audience Solutions segment and a $0.5 million goodwill impairment loss related to our Brazil operation.
We amortize intangible assets with finite lives over their estimated useful lives and review them for impairment whenever an impairment indicator exists. We continually monitor events and changes in circumstances that could indicate carrying amounts of our long-lived assets, including our intangible assets, may not be recoverable. When such events or changes in circumstances occur, we assess recoverability by determining whether the carrying value of such assets will be recovered through the undiscounted expected future cash flows. If the future undiscounted cash flows are less than the carrying amount of these assets, we recognize an impairment loss based on any excess of the carrying amount over the fair value of the assets. We did not recognize any intangible asset impairment charges in fiscal 2018, 2017, or 2016.
During fiscal 2018, our intangible assets were amortized over their estimated useful lives ranging from
two
years to
ten
years. Amortization is based on the pattern in which the economic benefits of the intangible asset will be consumed or on a straight-line basis when the consumption pattern is not apparent. The weighted average useful lives of our intangible assets were as follows:
|
Weighted Average Useful Life (years)
|
||
|
Developed technology
|
4
|
|
|
Customer relationships
|
6
|
|
|
Trade names
|
3
|
|
|
Publisher relationships
|
6
|
|
Income Taxes
The Company makes estimates and judgments in determining the provision for income taxes for financial statement purposes. These estimates and judgments occur in the calculation of tax credits, benefits, and deductions, and in the calculation of certain deferred tax assets and liabilities that arise from differences in the timing of recognition of revenue and expense for tax and financial statement purposes, as well as the interest and penalties related to uncertain tax positions. Significant changes in these estimates may result in an increase or decrease to the tax provision in a subsequent period. The Company assesses the likelihood that it will be able to recover its deferred tax assets. If recovery is not likely, the Company increases the provision for taxes by recording a valuation allowance against the deferred tax assets that it estimates will not ultimately be recoverable. The Company believes that the deferred tax assets recorded on the consolidated balance sheets will be ultimately recovered. However, should a change occur in the Company’s ability to recover its deferred tax assets, its tax provision would increase in the period in which the Company determined that the recovery was not likely.
F-10
The calculation of tax liabilities involves dealing with uncertainties in the application of complex tax laws and regulations. The Company recognizes liabilities for uncertain tax positions based on a two-step process pursuant to ASC 740,
Income Taxes
. The first step is to evaluate the tax position for recognition by determining whether the weight of available evidence indicates that it is more likely than not that the position will be sustained on audit, including resolution of related appeals or litigation processes, if any. If the Company determines that a tax position will more likely than not be sustained on audit, the second step requires the Company to estimate and measure the tax benefit as the largest amount that is more than 50% likely to be realized upon ultimate settlement. It is inherently difficult and subjective to estimate such amounts, as the Company must determine the probability of various possible outcomes.
The Company re-evaluates these uncertain tax positions on a quarterly basis. This evaluation is based on factors such as changes in facts or circumstances, changes in tax law, new audit activity, and effectively settled issues. Determining whether an uncertain tax position is effectively settled requires judgment. Such a change in recognition or measurement would result in the recognition of a tax benefit or an additional charge to the tax provision.
The Tax Act significantly changes U.S. corporate income tax laws by, among other things, reducing the U.S. federal corporate tax rate from 35% to 21%. Accordingly, the Company made a provisional remeasurement of its federal deferred tax assets and liabilities to reflect the lower tax rate enacted during the third quarter of fiscal 2018. See Note 13 to the Consolidated Financial Statements - Income Taxes for additional information.
Results of Operations
A summary of selected financial information for each of the years reported is presented below (dollars in thousands, except per share amounts):
|
|
|
|
|
% Change
|
% Change
|
||||||||||||
|
|
2018
|
2017
|
2016
|
2018-2017
|
2017-2016
|
||||||||||||
|
Revenues
|
$
|
917,406
|
|
$
|
880,247
|
|
$
|
850,088
|
|
4
|
%
|
4
|
%
|
||||
|
Cost of revenue
|
466,436
|
|
477,686
|
|
488,382
|
|
(2
|
)
|
(2
|
)
|
|||||||
|
Gross profit
|
450,970
|
|
402,561
|
|
361,706
|
|
12
|
|
11
|
|
|||||||
|
Total operating expenses
|
440,371
|
|
386,872
|
|
374,769
|
|
14
|
|
3
|
|
|||||||
|
Income (loss) from operations
|
10,599
|
|
15,689
|
|
(13,063
|
)
|
(32
|
)
|
220
|
|
|||||||
|
Net earnings (loss) from continuing operations
|
23,480
|
|
4,108
|
|
(8,648
|
)
|
472
|
|
148
|
|
|||||||
|
Diluted earnings (loss) per share from continuing operations
|
$
|
0.29
|
|
$
|
0.05
|
|
$
|
(0.11
|
)
|
480
|
|
146
|
|
||||
Revenues
The Company’s revenues by reporting segment for each of the years reported is presented below (dollars in thousands):
|
|
|
|
|
% Change
|
% Change
|
||||||||||||
|
|
2018
|
2017
|
2016
|
2018-2017
|
2017-2016
|
||||||||||||
|
Revenues
|
|
|
|
|
|
||||||||||||
|
Marketing Services
|
$
|
379,047
|
|
$
|
410,840
|
|
$
|
449,772
|
|
(8
|
)%
|
(9
|
)%
|
||||
|
Audience Solutions
|
327,358
|
|
322,065
|
|
297,846
|
|
2
|
|
8
|
|
|||||||
|
Connectivity
|
211,001
|
|
147,342
|
|
102,470
|
|
43
|
|
44
|
|
|||||||
|
Total revenues
|
$
|
917,406
|
|
$
|
880,247
|
|
$
|
850,088
|
|
4
|
%
|
4
|
%
|
||||
Total revenues were
$917.4 million
in fiscal
2018
, a
$37.2 million
, or
4.2%
,
increase
from fiscal
2017
. Strong revenue growth in Connectivity ($63.7 million) was partially offset by items totaling $23.5 million: the disposition of the Acxiom Impact business ($20.4 million) and the transition of the Australia operations to a Connectivity focused business ($3.1 million reduction in MS and AS). These unfavorable items were partially offset by a $2.5 million favorable impact from exchange rates.
F-11
Total revenues were
$880.2 million
in fiscal
2017
, a
$30.2 million
, or
3.5%
,
increase
from fiscal
2016
. The revenue growth was due to strong AS and Connectivity results. The year over year growth was negatively impacted by several items totaling $52.6 million: the disposition of the Acxiom Impact business ($39.8 million), the unfavorable impact of exchange rates ($5.8 million), the transition of the Australia operations business to a Connectivity focused business ($4.6 million reduction in MS and AS), and the exit from Brazil during fiscal year 2016 ($2.3 million).
MS revenue was
$379.0 million
in fiscal
2018
, a
$31.8 million
, or
7.7%
,
decrease
compared to fiscal
2017
. On a geographic basis, U.S. MS revenue decreased $30.7 million, or 8.1%, due to the sale of Acxiom Impact ($20.4 million) and other volume and contract reductions. International MS revenue decreased $1.1 million, or 3.7%, due primarily to decreases related to the Australia restructure. By line of business, Marketing Database revenue decreased $7.7 million (U.S. $5.3 million, International $2.4 million), Strategy and Analytics revenue declined $3.7 million (primarily U.S.) and Impact declined due to the sale of Acxiom Impact.
MS revenue was
$410.8 million
in fiscal
2017
, a
$38.9 million
, or
8.7%
,
decrease
compared to fiscal
2016
. On a geographic basis, U.S. MS revenue decreased $31.2 million, or 7.6%, due largely to the sale of Acxiom Impact ($39.8 million). International MS revenue decreased $7.7 million, or 20.3%. Excluding the unfavorable impact of exchange rates ($3.3 million), International MS revenue decreased $4.4 million and was impacted by the Australia restructure and Brazil exit. By line of business, increases in Marketing Database ($15.4 million) were offset by declines in Strategy and Analytics ($10.4 million) and the sale of Acxiom Impact ($39.8 million).
AS revenue was
$327.4 million
in fiscal
2018
, a
$5.3 million
, or
1.6%
,
increase
compared to fiscal
2017
. On a geographic basis, U.S. AS revenue increased $3.6 million, or 1.3%, due to increases in Digital Data business with new and existing customers offset by decreases in Recognition. International AS revenue increased $1.7 million, or 5.1%, primarily in Europe from Digital Data growth. By line of business, AS revenue growth in Digital Data ($10.4 million), though our publisher and digital partner network, was partially offset by declines in Recognition ($4.5 million) and Consumer Data ($3.2 million). As the digital data business model evolves, some revenue sharing arrangements will convert to license arrangements and certain publishers will decide to seek alternative data arrangements. These changes could impact AS growth rates in the future. In fact, the Company was notified in late March 2018 by Facebook, a large AS Digital Data customer, that Facebook would discontinue over the next several months its Facebook Partner Categories offering. Facebook Partner Categories provides audience targeting options by leveraging third-party data providers, including Acxiom’s AS division. Digital Data revenue from Facebook was approximately $40.0 million in fiscal 2018 and is expected to be significantly lower in fiscal 2019.
AS revenue was
$322.1 million
in fiscal
2017
, a
$24.2 million
, or
8.1%
,
increase
compared to fiscal
2016
. On a geographic basis, U.S. AS revenue increased $25.8 million, or 9.8%, due to increases in Digital Data business with new and existing customers. International AS revenue decreased $1.6 million, or 4.6%. International AS revenue increases in Europe ($2.4 million) were offset by decreases in Brazil ($1.2 million) and Australia ($3.2 million) due to restructuring. By line of business, AS revenue growth in Digital Data through our publisher and digital partner network ($28.3 million) were offset by declines in Consumer Data ($3.1 million).
Connectivity revenue was
$211.0 million
in fiscal
2018
, a
$63.7 million
, or
43.2%
,
increase
compared to fiscal
2017
. The increase was due to LiveRamp growth, partially offset by a $2.4 million decrease in revenue from the revenue-sharing arrangements due to a lost customer. On a geographic basis, U.S. Connectivity revenue increased $55.1 million, or 40.2%, from fiscal 2017. International Connectivity revenue increased $8.5 million, or 84.3%. Connectivity revenue will also be impacted by the announced discontinuance of Facebook’s Partner Categories offering. Connectivity revenue from Facebook was approximately $20.0 million in fiscal 2018 and is expected to be significantly lower in fiscal 2019.
Connectivity revenue was
$147.3 million
in fiscal
2017
, a
$44.9 million
, or
43.8%
,
increase
compared to fiscal
2016
. The increase was related to LiveRamp including the acquisitions of Arbor and Circulate, partially offset by a $6.1 million decrease from the revenue-sharing arrangements due to a lost customer. On a geographic basis, U.S. Connectivity revenue increased $41.9 million, or 44.0%, from fiscal 2016. International Connectivity revenue increased $3.0 million, or 41.1%.
Cost of revenue and Gross profit
The Company’s cost of revenue and gross profit for each of the years reported is presented below (dollars in thousands):
F-12
|
|
|
|
|
% Change
|
% Change
|
||||||||||||
|
|
2018
|
2017
|
2016
|
2018-2017
|
2017-2016
|
||||||||||||
|
Cost of revenue
|
$
|
466,436
|
|
$
|
477,686
|
|
$
|
488,382
|
|
(2
|
)%
|
(2
|
)%
|
||||
|
Gross profit
|
450,970
|
|
402,561
|
|
361,706
|
|
12
|
|
11
|
|
|||||||
|
Gross margin
|
49.2
|
%
|
45.7
|
%
|
42.5
|
%
|
7
|
%
|
8
|
%
|
|||||||
Cost of revenue: Includes all direct costs of sales such as data and other third-party costs directly associated with revenue. Cost of revenue also includes expenses for each of the Company’s operations functions including client services, account management, agency, strategy and analytics, IT, data acquisition, and products operations. Finally, cost of revenue includes amortization of internally developed software and other acquisition related intangibles.
Cost of revenue was
$466.4 million
in fiscal
2018
, a
$11.3 million
, or
2.4%
,
decrease
from fiscal
2017
, due primarily to the disposition of Acxiom Impact ($18.2 million). Gross margins increased to
49.2%
compared to
45.7%
in the prior year. The gross margin increase is due to the Connectivity revenue increases and MS cost efficiencies. U.S. gross margins increased to 50.4% in the current year from 47.0% in the prior year for the same reasons. International gross margins increased to 36.7% in the current year from 32.0% in the prior year due to Connectivity revenue growth.
Cost of revenue was
$477.7 million
in fiscal
2017
, a
$10.7 million
, or
2.2%
,
decrease
from fiscal
2016
, due primarily to the disposition of Acxiom Impact ($25.4 million). Gross margins increased to
45.7%
compared to
42.5%
in the prior year. The gross margin increase is due to cost efficiencies and the AS and Connectivity revenue increases. U.S. gross margins increased to 47.0% in fiscal 2017 from 43.8% in the prior year due to the AS and Connectivity revenue growth. International gross margins increased to 32.0% in fiscal 2017 from 30.4% in the prior year due to cost efficiencies and Connectivity revenue growth.
Operating Expenses
The Company’s operating expenses for each of the years reported is presented below (dollars in thousands):
|
|
|
|
|
% Change
|
% Change
|
||||||||||||
|
|
2018
|
2017
|
2016
|
2018-2017
|
2017-2016
|
||||||||||||
|
Operating expenses:
|
|
|
|
|
|
||||||||||||
|
Research and development
|
$
|
94,873
|
|
$
|
82,109
|
|
$
|
74,247
|
|
16
|
%
|
11
|
|
||||
|
Sales and marketing
|
215,599
|
|
166,676
|
|
146,176
|
|
29
|
|
14
|
|
|||||||
|
General and administrative
|
123,526
|
|
129,714
|
|
135,385
|
|
(5
|
)
|
(4
|
)
|
|||||||
|
Impairment of goodwill and other assets
|
—
|
|
—
|
|
6,829
|
|
—
|
|
(100
|
)
|
|||||||
|
Gains, losses and other items, net
|
6,373
|
|
8,373
|
|
12,132
|
|
(24
|
)
|
(31
|
)
|
|||||||
|
Total operating expenses
|
$
|
440,371
|
|
$
|
386,872
|
|
$
|
374,769
|
|
14
|
%
|
3
|
%
|
||||
Research and development (“R&D”): Includes operating expenses for the Company’s engineering and product/project management functions supporting research, new development, and related product enhancement.
R&D expenses were
$94.9 million
in fiscal
2018
,
an increase
of
$12.8 million
, or
15.5%
, compared to fiscal
2017
, and are
10.3%
of total revenues compared to
9.3%
in fiscal
2017
. The increase is due primarily to an increase in non-cash stock compensation of $4.4 million, and Connectivity and AS investments of $10.4 million and $1.6 million, respectively. The increases were partially offset by a decrease in MS of $3.0 million related primarily to the U.S. Impact disposition. The increase in non-cash stock compensation is largely related to the Arbor and Circulate acquisitions.
R&D expenses were
$82.1 million
in fiscal
2017
,
an increase
of
$7.9 million
, or
10.6%
, compared to fiscal
2016
, and are
9.3%
of total revenues compared to
8.7%
in fiscal
2016
. Connectivity and AS investments ($9.5 million and $2.2 million, respectively) were partially offset by cost reductions in MS ($6.3 million).
Sales and marketing (“S&M”): Includes operating expenses for the Company’s sales, marketing, and product marketing functions.
F-13
S&M expenses were
$215.6 million
in fiscal
2018
,
an increase
of
$48.9 million
, or
29.4%
, compared to fiscal
2017
, and are
23.5%
of total revenues compared to
18.9%
in fiscal
2017
. The increase is due largely to non-cash stock compensation of $14.6 million (largely related to the Arbor and Circulate acquisitions), and Connectivity investments of $30.2 million, corporate marketing of $3.8 million, and AS investments of $1.4 million. The increases were partially offset by a decrease in MS ($1.0 million) due primarily to lower variable compensation.
S&M expenses were
$166.7 million
in fiscal
2017
,
an increase
of
$20.5 million
, or
14.0%
, compared to fiscal
2016
, and are
18.9%
of total revenues compared to
17.2%
in fiscal
2016
. The increase is due to Connectivity and U.S. headcount investments and non-cash stock compensation.
General and administrative (G&A): Represents operating expenses for all corporate functions, including finance, human resources, legal, corporate IT, and the corporate office.
G&A expenses were
$123.5 million
in fiscal
2018
,
a decrease
of
$6.2 million
, or
4.8%
, compared to fiscal
2017
, and are
13.5%
of total revenues compared to
14.7%
in fiscal
2017
. The decrease is due primarily to lower non-cash stock compensation of $5.6 million, lower incentive compensation accruals, and other cost savings offset by a $12.2 million increase in separation and transformation costs. Prior year non-cash stock compensation costs were impacted by adjustments to increase expected performance levels for certain performance based awards.
G&A expenses were
$129.7 million
in fiscal
2017
,
a decrease
of
$5.7 million
, or
4.2%
, compared to fiscal
2016
, and are
14.7%
of total revenues compared to
15.9%
in fiscal
2016
. The decrease is due to a $12.2 million decline in separation and transformation costs, offset partially by an increase in non-cash stock based compensation.
Impairment of goodwill and other: Represents the amount of impairment related to goodwill and other related long-lived assets.
Impairment of goodwill and other was
$6.8 million
in fiscal
2016
, representing the impairment of APAC AS ($6.1 million) and Brazil MS and AS ($0.7 million).
Gains, losses, and other items, net: Represents restructuring costs and other adjustments.
Gains, losses and other items, net of
$6.4 million
in fiscal
2018
,
a decrease
of
$2.0 million
, or
23.9%
, compared to fiscal
2017
. The fiscal
2018
amount includes a $2.6 million charge related to the restructuring of the Redwood City, California lease and $3.8 million in severance and other associate-related charges.
Gains, losses and other items, net of
$8.4 million
in fiscal
2017
,
a decrease
of
$3.8 million
, or
31.0%
, compared to fiscal 2016. The fiscal
2017
amount included a $5.1 million charge related to the restructuring of the Redwood City, California lease, a $1.3 million charge representing the write-off of accumulated foreign currency translation related to Brazil, a $2.2 million gain on the sale of the Little Rock, Arkansas Rivermarket building, $1.4 million in merger related expenses related to the Arbor and Circulate acquisitions, and a $0.3 million gain on sale of the Acxiom Impact business.
F-14
Income (Loss) from Operations and Profit (Loss) Margins
The Company’s income (loss) from operations and margin by segment for each of the years reported is presented below (dollars in thousands):
|
|
2018
|
2017
|
2016
|
||||||||
|
Operating income (loss) and margin:
|
|
|
|
||||||||
|
Marketing Services
|
$
|
83,304
|
|
$
|
80,622
|
|
$
|
74,371
|
|
||
|
|
22.0
|
%
|
19.6
|
%
|
16.5
|
%
|
|||||
|
Audience Solutions
|
124,192
|
|
123,238
|
|
109,598
|
|
|||||
|
|
37.9
|
%
|
38.3
|
%
|
36.8
|
%
|
|||||
|
Connectivity
|
18,399
|
|
5,333
|
|
(3,298
|
)
|
|||||
|
|
8.7
|
%
|
3.6
|
%
|
(3.2
|
)%
|
|||||
|
Less:
|
|
|
|
|
|
|
|||||
|
Corporate
|
121,769
|
|
117,342
|
|
127,844
|
|
|||||
|
Purchased intangible asset amortization
|
23,920
|
|
18,644
|
|
15,466
|
|
|||||
|
Non-cash stock compensation
|
63,234
|
|
49,145
|
|
31,463
|
|
|||||
|
Impairment of goodwill and other
|
—
|
|
—
|
|
6,829
|
|
|||||
|
Gains, losses and other items, net
|
6,373
|
|
8,373
|
|
12,132
|
|
|||||
|
Income (loss) from operations
|
$
|
10,599
|
|
$
|
15,689
|
|
$
|
(13,063
|
)
|
||
|
Total operating margin
|
1.2
|
%
|
1.8
|
%
|
(1.5
|
)%
|
|||||
Income
from operations was
$10.6 million
in fiscal
2018
compared to
$15.7 million
in fiscal
2017
. Operating margin was
1.2%
compared to
1.8%
in fiscal
2017
. The decrease of $5.1 million was due primarily to increases in non-cash stock compensation, largely related to the Arbor and Circulate acquisitions, and separation and transformation costs included in corporate costs, offset partially by increases in operating segments' income from operations (primarily Connectivity).
Income
from operations was
$15.7 million
in fiscal
2017
compared to a
loss
of
$13.1 million
in fiscal
2016
. Operating margin was
1.8%
compared to negative
1.5%
in fiscal
2016
. The improvement in income from operations of $28.8 million was due primarily to an increase in each of the segment’s income from operations and lower business separation and transformation costs in Corporate, lower gains, losses and other items, net, offset partially by an increase in non-cash stock based compensation.
MS
income
from operations was
$83.3 million
, a
22.0%
margin, in fiscal
2018
compared to
income
of
$80.6 million
, a
19.6%
margin, in fiscal
2017
. U.S. margins increased to 23.6% in the current period from 20.9% due to R&D and S&M cost reductions, including R&D reductions related to the Impact disposition. International operating margins decreased to 2.7% from 3.4% due primarily to the revenue decrease.
MS
income
from operations was
$80.6 million
, a
19.6%
margin, in fiscal
2017
compared to
income
of
$74.4 million
, a
16.5%
margin, in fiscal
2016
. U.S. margins increased to 20.9% in fiscal 2017 from 17.7% due to R&D and S&M cost reductions. International margins decreased to 3.4% from 3.7% due to the revenue decrease.
AS
income
from operations was
$124.2 million
, a
37.9%
margin, in fiscal
2018
compared to
income
of
$123.2 million
, a
38.3%
margin, in fiscal
2017
. U.S. margins decreased to 39.6% in the current period from 39.9% as the increase in gross profit was offset by investments in R&D and S&M. International operating margins decreased to 23.7% from 24.2% due to increases in S&M.
AS
income
from operations was
$123.2 million
, a
38.3%
margin, in fiscal
2017
compared to
income
of
$109.6 million
, a
36.8%
margin, in fiscal
2016
. U.S. margins decreased to 39.9% in fiscal 2017 from 40.1% due to ongoing R&D and S&M investments. International margins increased to 24.2% from 11.6% due to expanding gross profit margins.
Connectivity
income
from operations was
$18.4 million
, an
8.7%
margin, in fiscal
2018
compared to
income
of
$5.3 million
, a
3.6%
margin, in fiscal
2017
. A $52.6 million increase in gross profit was partially offset by R&D and S&M investments.
F-15
Connectivity
income
from operations was
$5.3 million
, a
3.6%
margin, in fiscal
2017
compared to a
loss
of
$3.3 million
, a negative
3.2%
margin, in fiscal
2016
as the increase in gross profit was offset partially by continued R&D and S&M investments.
Other Income (Expense), Income Taxes and Other Items
Interest expense was $10.1 million in fiscal 2018 compared to $7.4 million in fiscal 2017. The increase is primarily related to $70 million in borrowings in the third quarter of fiscal 2017 related to the Arbor and Circulate acquisitions and an increase in the average rate of approximately 82 basis points. On June 20, 2017, the Company refinanced its debt facility to consist of a $600 million revolving credit facility, of which $230 million was outstanding at March 31, 2018.
Interest expense was $7.4 million in fiscal 2017 compared to $7.7 million in fiscal 2016. The decrease is primarily related to the reduction in the term loan balance offset by $0.7 million of new interest expense on line of credit borrowings. The average balance of the term loan and line of credit decreased approximately $40 million and the average rate remained approximately flat.
Other income was $0.2 million in fiscal 2018 compared to $0.3 million in fiscal 2017 and $0.5 million in fiscal 2016. Other, net primarily consists of foreign currency transaction gains and losses, and interest and investment income.
Income tax benefit was $22.8 million on pretax income of $0.7 million for fiscal 2018. The income tax benefit is primarily attributable to a $24.6 million benefit for the remeasurement of deferred tax liabilities as a result of the Tax Act. In addition, the effective tax rate reflects the Tax Act's permanent reduction in the U.S. federal corporate income tax rate. Fiscal 2018 also included a $6.4 million income tax expense due to nondeductible stock-based compensation, primarily related to the Arbor and Circulate acquisitions, a net $5.0 million benefit related to U.S. research and development tax credits, and a $3.0 million benefit related to net excess tax benefits from stock-based compensation.
The fiscal 2017 effective tax rate was 52.5%. Fiscal 2017 included a $4.5 million federal and state tax benefit, net of associated valuation allowance, related to the Acxiom Impact disposition. Fiscal 2017 also included a net $2.3 million income tax benefit related to U.S. research and development tax credits. In addition, nondeductible stock-based compensation, primarily related to the Arbor Holdback Agreement and incentive stock options issued in connection with the LiveRamp acquisition, had a $3.3 million unfavorable impact on income tax expense.
The fiscal 2016 effective tax rate was 57.4%. Fiscal 2016 included a net $3.6 million tax benefit related to the release of a deferred tax valuation allowance in a certain foreign jurisdiction. Fiscal 2016 also included a net $4.0 million income tax benefit related to U.S. research and development tax credits. In addition, nondeductible stock-based compensation, primarily related to incentive stock options issued in connection with the LiveRamp acquisition, had a $1.9 million unfavorable impact on income tax expense.
The effective tax rates for all periods were impacted by losses in foreign jurisdictions. The Company does not record the income tax benefit of certain of those losses due to uncertainty of future utilization.
Discontinued operations
In fiscal 2016, the Company completed the sale of its ITO operations. As a result, the ITO business qualified for treatment as discontinued operations. The results of operations, cash flows, and the balance sheet amounts pertaining to ITO have been classified as discontinued operations in the consolidated financial statements.
F-16
Summary results of operations of ITO for the fiscal year ended March 31, 2016 are segregated and included in earnings from discontinued operations, net of tax, in the Company’s consolidated statements of operations and are as follows (dollars in thousands):
|
|
2016
|
|||
|
Revenues
|
$
|
69,410
|
|
|
|
Earnings from discontinued operations before income taxes
|
$
|
10,050
|
|
|
|
Gain on sale of discontinued operations before income taxes
|
9,349
|
|
||
|
Income taxes
|
3,598
|
|
||
|
Earnings from discontinued operations, net of tax
|
$
|
15,801
|
|
|
During fiscal 2018, the Company undertook a comprehensive review of its businesses to drive cleaner lines of sight, to create clearer accountabilities and to maximize its strategic flexibility. Following this review, the Company intends to reorganize its business and actively explore options to further strengthen Acxiom Marketing Solutions, a business unit combining MS and lines of business from AS, and deliver greater value to its clients. These options may include a strategic partnership, acquisition, tax-free merger, joint venture, tax-free spin-off, sale or other potential strategic combinations.
Beginning April 1, 2018, the Company will report its results in two business segments: LiveRamp and Acxiom Marketing Solutions.
F-17
Capital Resources and Liquidity
Working Capital and Cash Flow
Working capital at
March 31, 2018
totaled
$182.0 million
, a
$43.7 million
increase
when compared to
$138.3 million
at
March 31, 2017
, due primarily to the debt refinancing, as the amended credit agreement does not require periodic principal debt service, and a decrease in accrued payroll.
The Company’s cash is primarily located in the United States. Approximately
$22.1 million
of the total cash balance of
$142.3 million
, or approximately
15.5%
, is located outside of the United States. The Company has no current plans to repatriate this cash to the United States.
Accounts receivable days sales outstanding, from continuing operations, was
61
days at
March 31, 2018
and
57
days at
March 31, 2017
, respectively, and is calculated as follows (dollars in thousands):
|
|
March 31, 2018
|
March 31, 2017
|
|||||
|
Numerator – trade accounts receivable, net
|
$
|
167,188
|
|
$
|
142,768
|
|
|
|
Denominator:
|
|
|
|
|
|||
|
Quarter revenue
|
244,781
|
|
224,867
|
|
|||
|
Number of days in quarter
|
90
|
|
90
|
|
|||
|
Average daily revenue
|
$
|
2,720
|
|
$
|
2,499
|
|
|
|
Days sales outstanding
|
61
|
|
57
|
|
|||
Net cash provided by operating activities was
$112.2 million
in fiscal
2018
compared to
$115.8 million
and
$113.6 million
in fiscal
2017
and
2016
, respectively. The $3.6 million decrease in fiscal 2018 and the $2.2 million increase in fiscal 2017 resulted primarily from an increase in cash earnings offset by changes in working capital.
Investing activities used cash of
$60.3 million
in fiscal
2018
compared to
$159.3 million
and
$69.2 million
in fiscal
2017
and
2016
, respectively. The decrease of used cash in fiscal 2018 related primarily to the $137.4 million of net cash paid in the Arbor and Circulate acquisitions in fiscal 2017. Fiscal 2018 investing activities consisted of capital expenditures of $44.2 million, capitalization of software of $13.7 million, net cash paid in the acquisition of Pacific Data Partners LLC ("PDP") of $4.5 million, $1.0 million for a long-term investment, and $0.9 million of data acquisition costs, offset partially by $4.0 million net cash received from the note receivable related to the Acxiom Impact sale. The increase for fiscal 2017 related primarily to the $137.4 million of net cash paid in the Arbor and Circulate acquisitions. Additional fiscal 2017 investing activities consisted of capital expenditures of $48.0 million, capitalization of software of $14.5 million and $0.9 million of data acquisition costs
Financing activities
used
cash of
$81.5 million
in fiscal
2018
. Proceeds from the debt refinancing of $230.0 million were used to pay the outstanding $225 million term and revolving loan balances, with interest, along with $4.0 million in fees related to the restated credit agreement. Fiscal
2018
financing activities also included $88.9 million of cash to acquire treasury stock, offset by $8.7 million in proceeds from the sale of common stock. Financing activities
provided
cash of
$25.8 million
in fiscal
2017
. Fiscal
2017
financing activities included $15.7 million in proceeds from the sale of common stock and $2.9 million excess tax benefits from stock-based compensation, offset by $32.2 million in payments of debt and $30.5 million to acquire treasury stock.
On August 29, 2011, the board of directors adopted a common stock repurchase program. That program was subsequently modified and expanded, most recently on
March 30, 2018
(see Note 12 – Stockholders’ Equity). Under the modified common stock repurchase program, the Company may purchase up to
$500 million
of its common stock through the period ending
December 31, 2019
. During the fiscal year ended
March 31, 2018
, the Company repurchased
3.3 million
shares of its common stock for
$88.9 million
. During the fiscal year ended
March 31, 2017
, the Company repurchased
1.3 million
shares of its common stock for
$30.5 million
. During the fiscal year ended
March 31, 2016
, the Company repurchased
2.6 million
shares of its common stock for
$52.8 million
. From program inception and through
March 31, 2018
, the Company had repurchased
20.1 million
shares of its stock for
$374.6 million
, leaving remaining capacity of
$125.4 million
under the stock repurchase program.
Net cash provided by discontinued operations was $130.6 million in fiscal 2016, primarily from net cash received of $130.2 million for the sale of ITO.
F-18
Credit and Debt Facilities
See Note 10 – “Long-Term Debt” of the Notes to Consolidated Financial Statements for further details related to the Company’s amended and restated credit agreement.
Based on our current expectations, we believe our liquidity and capital resources will be sufficient to operate our business. However, we may take advantage of opportunities to generate additional liquidity or refinance existing debt through capital market transactions. The amount, nature, and timing of any capital market transactions will depend on our operating performance and other circumstances; our then-current commitments and obligations; the amount, nature, and timing of our capital requirements; any limitations imposed by our current credit arrangements; and overall market conditions.
Off-Balance Sheet Items and Commitments
In connection with the Impact email disposition, the Company assigned a facility lease to the buyer of the business. The Company guaranteed the facility lease as required by the asset disposition agreement. Should the assignee default, the Company would be required to perform under the terms of the facility lease, which runs through September 2021. At
March 31, 2018
, the Company’s maximum potential future rent payments under this guarantee totaled
$2.1 million
.
There were no material outstanding letters of credit at
March 31, 2018
or
March 31, 2017
.
Contractual Commitments
The following table presents the Company's contractual cash obligations, exclusive of interest, and purchase commitments at
March 31, 2018
. The table does not include the future payment of liabilities related to uncertain tax positions of
$2.1 million
as the Company is not able to predict the periods in which the payments will be made (dollars in thousands):
|
|
For the years ending March 31,
|
|||||||||||||||||||||||||||
|
|
2019
|
2020
|
2021
|
2022
|
2023
|
Thereafter
|
Total
|
|||||||||||||||||||||
|
Revolving credit borrowings
|
$
|
—
|
|
$
|
—
|
|
$
|
—
|
|
$
|
—
|
|
$
|
230,000
|
|
$
|
—
|
|
$
|
230,000
|
|
|||||||
|
Other debt
|
1,583
|
|
1,362
|
|
348
|
|
—
|
|
—
|
|
—
|
|
3,293
|
|
||||||||||||||
|
Total long-term debt
|
1,583
|
|
1,362
|
|
348
|
|
—
|
|
230,000
|
|
—
|
|
233,293
|
|
||||||||||||||
|
Operating leases
|
16,525
|
|
15,945
|
|
15,490
|
|
15,096
|
|
8,745
|
|
12,345
|
|
84,146
|
|
||||||||||||||
|
Total contractual cash obligations
|
$
|
18,108
|
|
$
|
17,307
|
|
$
|
15,838
|
|
$
|
15,096
|
|
$
|
238,745
|
|
$
|
12,345
|
|
$
|
317,439
|
|
|||||||
|
|
For the years ending March 31,
|
|||||||||||||||||||||||||||
|
|
2019
|
2020
|
2021
|
2022
|
2023
|
Thereafter
|
Total
|
|||||||||||||||||||||
|
Total purchase commitments
|
$
|
40,488
|
|
$
|
18,235
|
|
$
|
9,060
|
|
$
|
1,539
|
|
$
|
338
|
|
$
|
—
|
|
$
|
69,660
|
|
|||||||
Purchase commitments include contractual commitments for the purchase of data and open purchase orders for equipment, paper, office supplies, construction and other items. Purchase commitments in some cases will be satisfied by entering into future operating leases, capital leases, or other financing arrangements, rather than payment of cash. The above commitments relating to long-term obligations do not include future payments of interest. The Company estimates interest payments on debt for fiscal
2019
of
$12.0 million
.
The following are contingencies or guarantees under which the Company could be required, in certain circumstances, to make cash payments as of
March 31, 2018
(dollars in thousands):
|
Lease guarantees
|
$
|
2,116
|
|
|
Surety bonds
|
405
|
|
|
While the Company does not have any other material contractual commitments for capital expenditures, certain levels of investments in facilities and computer equipment continue to be necessary to support the growth of the
F-19
business. In some cases, the Company also licenses software and sells hardware to clients. Management believes that the Company’s existing available debt and cash flow from operations will be sufficient to meet the Company’s working capital and capital expenditure requirements for the foreseeable future. The Company also evaluates acquisitions from time to time, which may require up-front payments of cash.
For a description of certain risks that could have an impact on results of operations or financial condition, including liquidity and capital resources, see “Risk Factors” contained in Part I, Item 1A, of this Annual Report.
Key Trends and Uncertainties
The following is a summary of selected trends, events or uncertainties that the Company believes may have a significant impact on its future performance.
|
•
|
The macroeconomic environment has a direct impact on overall marketing and advertising expenditures in the U.S. and abroad. As marketing budgets are often more discretionary in nature, they are easier to reduce in the short term as compared to other corporate expenses. Future widespread economic slowdowns in any of the industries or markets our clients serve, particularly in the United States, could reduce the marketing expenditures of our clients and prospective customers.
|
|
•
|
With the growth of online advertising and e-commerce, there is increasing awareness and concern among the general public, privacy advocates, mainstream media, governmental bodies and others regarding marketing and privacy matters, particularly as they relate to individual privacy interests and global reach of the online marketplace. Negative publicity and/or increased restrictions on the collection, management, aggregation and use of information could result in reduced demand for our products or services, decreased availability of certain kinds of data and/or a material increase in the cost of collecting and using certain kinds of data.
|
|
•
|
In recent years, we have witnessed an ongoing shift from direct marketing to alternative marketing channels. We believe this trend will continue and that, in the long term, a substantial portion of overall marketing and advertising expenditures will be moved to alternative marketing channels.
|
|
•
|
Compromises in the security or stability of our data and systems, including from cyber-based attacks, the unauthorized transmission of confidential information or systems interruptions could negatively affect our economic condition.
|
Seasonality and Inflation
Although we cannot accurately determine the amounts attributable to inflation, we are affected by inflation through increased compensation costs and other operating expenses. If inflation were to increase over the low levels of recent years, the impact in the short run would be to cause increases in costs, which we would attempt to pass on to clients, although there is no assurance that we would be able to do so. Generally, the effects of inflation in recent years have been offset by technological advances, economies of scale and other operational efficiencies.
Our traditional direct marketing operations typically experience their lowest revenue in the first quarter of the fiscal year, with higher revenue in the second, third, and fourth quarters. To minimize the impact of these fluctuations, we continue to seek long-term arrangements with more predictable revenues.
F-20
Non-U.S. Operations
The Company has a presence in the United Kingdom, France, Germany, Poland, Australia and China. Most of the Company’s exposure to exchange rate fluctuation is due to translation gains and losses as there are no material transactions that cause exchange rate impact. In general, each of the foreign locations is expected to fund its own operations and cash flows, although funds may be loaned or invested from the U.S. to the foreign subsidiaries subject to limitations in the Company’s revolving credit facility. These advances are considered long-term investments, and any gain or loss resulting from changes in exchange rates as well as gains or losses resulting from translating the foreign financial statements into U.S. dollars are included in accumulated other comprehensive income. Exchange rate movements of foreign currencies may have an impact on the Company’s future costs or on future cash flows from foreign investments. The Company has not entered into any foreign currency forward exchange contracts or other derivative instruments to hedge the effects of adverse fluctuations in foreign currency exchange rates.
Recent Accounting Pronouncements –
See “Adoption of New Accounting Standards” and “Recent Accounting Pronouncements” under Note 1, “Summary of Significant Accounting Policies,” of the Notes to Consolidated Financial Statements for a discussion of certain accounting standards that have been issued during
fiscal 2018
and
2017
.
F-21
Report of Independent Registered Public Accounting Firm
The Board of Directors and Stockholders
Acxiom Corporation:
Opinions on the Consolidated Financial Statements and Internal Control Over Financial Reporting
We have audited the accompanying consolidated balance sheets of Acxiom Corporation and subsidiaries as of
March 31, 2018 and 2017
, the related consolidated statements of operations, comprehensive income, stockholders’ equity, and cash flows for each of the years in the three-year period ended
March 31, 2018
, and the related notes (collectively, the "consolidated financial statements"). We also have audited the Company's internal control over financial reporting as of
March 31, 2018
, based on criteria established in
Internal Control – Integrated Framework (2013)
issued by the Committee of Sponsoring Organizations of the Treadway Commission.
In our opinion, the consolidated financial statements referred to above present fairly, in all material respects, the financial position of the Company as of
March 31, 2018 and 2017
and the results of its operations and its cash flows for each of the years in the three-year period ended
March 31, 2018
, in conformity with U.S. generally accepted accounting principles. Also in our opinion, the Company maintained, in all material respects, effective internal control over financial reporting as of
March 31, 2018
, based on criteria established in
Internal Control – Integrated Framework (2013)
issued by the Committee of Sponsoring Organizations of the Treadway Commission.
Basis for Opinions
The Company's management is responsible for these consolidated financial statements, for maintaining effective internal control over financial reporting, and for its assessment of the effectiveness of internal control over financial reporting, included in the accompanying Management’s Report on Internal Control over Financial Reporting. Our responsibility is to express an opinion on the Company's consolidated financial statements and an opinion on the Company’s internal control over financial reporting based on our audits. We are a public accounting firm registered with the Public Company Accounting Oversight Board (United States) (PCAOB) and are required to be independent with respect to the Company in accordance with the U.S. federal securities laws and the applicable rules and regulations of the Securities and Exchange Commission and the PCAOB.
We conducted our audits in accordance with the standards of the PCAOB. Those standards require that we plan and perform the audits to obtain reasonable assurance about whether the consolidated financial statements are free of material misstatement, whether due to error or fraud, and whether effective internal control over financial reporting was maintained in all material respects.
Our audits of the consolidated financial statements included performing procedures to assess the risks of material misstatement of the consolidated financial statements, whether due to error or fraud, and performing procedures that respond to those risks. Such procedures included examining, on a test basis, evidence regarding the amounts and disclosures in the consolidated financial statements. Our audits also included evaluating the accounting principles used and significant estimates made by management, as well as evaluating the overall presentation of the consolidated financial statements. Our audit of internal control over financial reporting included obtaining an understanding of internal control over financial reporting, assessing the risk that a material weakness exists, and testing and evaluating the design and operating effectiveness of internal control based on the assessed risk. Our audits also included performing such other procedures as we considered necessary in the circumstances. We believe that our audits provide a reasonable basis for our opinions.
Definition and Limitations of Internal Control Over Financial Reporting
A company’s internal control over financial reporting is a process designed to provide reasonable assurance regarding the reliability of financial reporting and the preparation of financial statements for external purposes in accordance with generally accepted accounting principles. A company’s internal control over financial reporting includes those policies and procedures that (1) pertain to the maintenance of records that, in reasonable detail, accurately and fairly reflect the transactions and dispositions of the assets of the company; (2) provide reasonable assurance that transactions are recorded as necessary to permit preparation of financial statements in accordance with generally accepted accounting principles, and that receipts and expenditures of the company are being made only in accordance with authorizations of management and directors of the company; and (3) provide reasonable assurance regarding
F-22
prevention or timely detection of unauthorized acquisition, use, or disposition of the company’s assets that could have a material effect on the financial statements.
Because of its inherent limitations, internal control over financial reporting may not prevent or detect misstatements. Also, projections of any evaluation of effectiveness to future periods are subject to the risk that controls may become inadequate because of changes in conditions, or that the degree of compliance with the policies or procedures may deteriorate.
KPMG LLP
We have served as the Company's auditor since 2003.
Dallas, Texas
May 25, 2018
F-23
ACXIOM CORPORATION AND SUBSIDIARIES
CONSOLIDATED BALANCE SHEETS
MARCH 31,
2018
AND
2017
(Dollars in thousands, except per share data)
|
|
March 31,
2018 |
March 31,
2017 |
|||||
|
ASSETS
|
|
|
|
||||
|
Current assets:
|
|
|
|
|
|||
|
Cash and cash equivalents
|
$
|
142,279
|
|
$
|
170,343
|
|
|
|
Trade accounts receivable, net
|
167,188
|
|
142,768
|
|
|||
|
Refundable income taxes
|
9,733
|
|
7,098
|
|
|||
|
Other current assets
|
41,145
|
|
48,310
|
|
|||
|
Total current assets
|
360,345
|
|
368,519
|
|
|||
|
Property and equipment, net of accumulated depreciation and amortization
|
156,533
|
|
155,974
|
|
|||
|
Software, net of accumulated amortization of $314,185 in 2018 and $288,122 in 2017
|
34,984
|
|
47,638
|
|
|||
|
Goodwill
|
595,995
|
|
592,731
|
|
|||
|
Purchased software licenses, net of accumulated amortization of $66,190 in 2018 and $72,403 in 2017
|
7,703
|
|
7,972
|
|
|||
|
Deferred income taxes
|
12,225
|
|
10,261
|
|
|||
|
Other assets, net
|
41,468
|
|
51,443
|
|
|||
|
|
$
|
1,209,253
|
|
$
|
1,234,538
|
|
|
|
LIABILITIES AND EQUITY
|
|
|
|
|
|||
|
Current liabilities:
|
|
|
|
|
|||
|
Current installments of long-term debt
|
$
|
1,583
|
|
$
|
39,819
|
|
|
|
Trade accounts payable
|
46,688
|
|
40,208
|
|
|||
|
Accrued payroll and related expenses
|
42,499
|
|
53,238
|
|
|||
|
Other accrued expenses
|
55,865
|
|
59,861
|
|
|||
|
Deferred revenue
|
31,720
|
|
37,087
|
|
|||
|
Total current liabilities
|
178,355
|
|
230,213
|
|
|||
|
Long-term debt
|
227,837
|
|
189,241
|
|
|||
|
Deferred income taxes
|
40,243
|
|
58,374
|
|
|||
|
Other liabilities
|
13,723
|
|
17,730
|
|
|||
|
Commitments and contingencies
|
|
|
|
|
|||
|
Equity:
|
|
|
|
|
|||
|
Common stock, $0.10 par value (authorized 200 million shares; issued 136.1 million and 132.9 million shares at March 31, 2018 and 2017, respectively)
|
13,609
|
|
13,288
|
|
|||
|
Additional paid-in capital
|
1,235,679
|
|
1,154,429
|
|
|||
|
Retained earnings
|
628,331
|
|
602,609
|
|
|||
|
Accumulated other comprehensive income
|
10,767
|
|
7,999
|
|
|||
|
Treasury stock, at cost (58.3 million and 54.6 million shares at March 31, 2018 and 2017, respectively)
|
(1,139,291
|
)
|
(1,039,345
|
)
|
|||
|
Total equity
|
749,095
|
|
738,980
|
|
|||
|
|
$
|
1,209,253
|
|
$
|
1,234,538
|
|
|
See accompanying notes to consolidated financial statements.
F-24
ACXIOM CORPORATION AND SUBSIDIARIES
CONSOLIDATED STATEMENTS OF OPERATIONS
YEARS ENDED MARCH 31,
2018
,
2017
AND
2016
(Dollars in thousands, except per share amounts)
|
|
2018
|
2017
|
2016
|
||||||||
|
Revenues
|
$
|
917,406
|
|
$
|
880,247
|
|
$
|
850,088
|
|
||
|
Cost of revenue
|
466,436
|
|
477,686
|
|
488,382
|
|
|||||
|
Gross profit
|
450,970
|
|
402,561
|
|
361,706
|
|
|||||
|
Operating expenses:
|
|
|
|
||||||||
|
Research and development
|
94,873
|
|
82,109
|
|
74,247
|
|
|||||
|
Sales and marketing
|
215,599
|
|
166,676
|
|
146,176
|
|
|||||
|
General and administrative
|
123,526
|
|
129,714
|
|
135,385
|
|
|||||
|
Impairment of goodwill and other assets
|
—
|
|
—
|
|
6,829
|
|
|||||
|
Gains, losses and other items, net
|
6,373
|
|
8,373
|
|
12,132
|
|
|||||
|
Total operating expenses
|
440,371
|
|
386,872
|
|
374,769
|
|
|||||
|
Income (loss) from operations
|
10,599
|
|
15,689
|
|
(13,063
|
)
|
|||||
|
Other income (expense):
|
|
|
|
|
|
|
|||||
|
Interest expense
|
(10,131
|
)
|
(7,381
|
)
|
(7,669
|
)
|
|||||
|
Other, net
|
241
|
|
334
|
|
452
|
|
|||||
|
Total other expense
|
(9,890
|
)
|
(7,047
|
)
|
(7,217
|
)
|
|||||
|
Income (loss) from continuing operations before income taxes
|
709
|
|
8,642
|
|
(20,280
|
)
|
|||||
|
Income taxes (benefit)
|
(22,771
|
)
|
4,534
|
|
(11,632
|
)
|
|||||
|
Net earnings (loss) from continuing operations
|
23,480
|
|
4,108
|
|
(8,648
|
)
|
|||||
|
Earnings from discontinued operations, net of tax
|
—
|
|
—
|
|
15,351
|
|
|||||
|
Net earnings
|
$
|
23,480
|
|
$
|
4,108
|
|
$
|
6,703
|
|
||
|
Basic earnings (loss) per share:
|
|
|
|
|
|
|
|||||
|
Net earnings (loss) from continuing operations
|
$
|
0.30
|
|
$
|
0.05
|
|
$
|
(0.11
|
)
|
||
|
Net earnings from discontinued operations
|
—
|
|
—
|
|
0.20
|
|
|||||
|
Net earnings
|
$
|
0.30
|
|
$
|
0.05
|
|
$
|
0.09
|
|
||
|
Diluted earnings (loss) per share:
|
|
|
|
|
|
|
|||||
|
Net earnings (loss) from continuing operations
|
$
|
0.29
|
|
$
|
0.05
|
|
$
|
(0.11
|
)
|
||
|
Net earnings from discontinued operations
|
—
|
|
—
|
|
0.20
|
|
|||||
|
Net earnings
|
$
|
0.29
|
|
$
|
0.05
|
|
$
|
0.09
|
|
||
See accompanying notes to consolidated financial statements.
F-25
ACXIOM CORPORATION AND SUBSIDIARIES
CONSOLIDATED STATEMENTS OF COMPREHENSIVE INCOME
YEARS ENDED MARCH 31,
2018
,
2017
AND
2016
(Dollars in thousands)
|
|
2018
|
2017
|
2016
|
||||||||
|
Net earnings
|
$
|
23,480
|
|
$
|
4,108
|
|
$
|
6,703
|
|
||
|
Other comprehensive income (loss):
|
|
|
|
|
|
|
|||||
|
Change in foreign currency translation adjustment
|
2,768
|
|
(706
|
)
|
(907
|
)
|
|||||
|
Unrealized gain on interest rate swap
|
—
|
|
115
|
|
84
|
|
|||||
|
Other comprehensive income (loss)
|
2,768
|
|
(591
|
)
|
(823
|
)
|
|||||
|
Comprehensive income
|
$
|
26,248
|
|
$
|
3,517
|
|
$
|
5,880
|
|
||
See accompanying notes to consolidated financial statements.
F-26
ACXIOM CORPORATION AND SUBSIDIARIES
CONSOLIDATED STATEMENTS OF STOCKHOLDERS’ EQUITY
YEARS ENDED MARCH 31,
2018
,
2017
AND
2016
(Dollars in thousands)
|
|
|
|
|
|
Accumulated
|
|
|
|
|||||||||||||||||||||
|
|
Common Stock
|
Additional
|
|
other
|
Treasury Stock
|
|
|||||||||||||||||||||||
|
|
Number
|
|
paid-in
|
Retained
|
comprehensive
|
Number
|
|
Total
|
|||||||||||||||||||||
|
|
of shares
|
Amount
|
Capital
|
earnings
|
income
|
of shares
|
Amount
|
Equity
|
|||||||||||||||||||||
|
Balances at March 31, 2015
|
127,938,797
|
|
$
|
12,794
|
|
$
|
1,034,526
|
|
$
|
591,798
|
|
$
|
9,413
|
|
(50,102,724
|
)
|
$
|
(945,274
|
)
|
$
|
703,257
|
|
|||||||
|
Employee stock awards, benefit plans and other issuances
|
1,338,663
|
|
134
|
|
15,627
|
|
—
|
|
—
|
|
(294,522
|
)
|
(5,344
|
)
|
10,417
|
|
|||||||||||||
|
Tax impact of stock options and restricted stock
|
—
|
|
—
|
|
(293
|
)
|
—
|
|
—
|
|
—
|
|
—
|
|
(293
|
)
|
|||||||||||||
|
Non-cash stock-based compensation from continuing operations
|
61,464
|
|
6
|
|
31,457
|
|
—
|
|
—
|
|
—
|
|
—
|
|
31,463
|
|
|||||||||||||
|
Non-cash stock-based compensation from discontinued operations
|
—
|
|
—
|
|
1,008
|
|
|
|
|
|
|
|
|
|
1,008
|
|
|||||||||||||
|
Restricted stock units vested
|
1,051,182
|
|
105
|
|
(105
|
)
|
—
|
|
—
|
|
—
|
|
—
|
|
—
|
|
|||||||||||||
|
Acquisition of treasury stock
|
—
|
|
—
|
|
—
|
|
—
|
|
—
|
|
(2,633,436
|
)
|
(52,764
|
)
|
(52,764
|
)
|
|||||||||||||
|
Comprehensive income (loss):
|
|
|
|
|
|
|
|
|
|
|
|
|
|
|
|
|
|||||||||||||
|
Foreign currency translation
|
—
|
|
—
|
|
—
|
|
—
|
|
(907
|
)
|
—
|
|
—
|
|
(907
|
)
|
|||||||||||||
|
Unrealized gain on interest rate swap
|
—
|
|
—
|
|
—
|
|
—
|
|
84
|
|
—
|
|
—
|
|
84
|
|
|||||||||||||
|
Net earnings
|
—
|
|
—
|
|
—
|
|
6,703
|
|
—
|
|
—
|
|
—
|
|
6,703
|
|
|||||||||||||
|
Balances at March 31, 2016
|
130,390,106
|
|
$
|
13,039
|
|
$
|
1,082,220
|
|
$
|
598,501
|
|
$
|
8,590
|
|
(53,030,682
|
)
|
$
|
(1,003,382
|
)
|
$
|
698,968
|
|
|||||||
|
Employee stock awards, benefit plans and other issuances
|
1,233,566
|
|
123
|
|
21,007
|
|
—
|
|
—
|
|
(236,870
|
)
|
(5,421
|
)
|
15,709
|
|
|||||||||||||
|
Tax impact of stock options and restricted stock
|
—
|
|
—
|
|
2,183
|
|
—
|
|
—
|
|
—
|
|
—
|
|
2,183
|
|
|||||||||||||
|
Non-cash stock-based compensation
|
236,162
|
|
24
|
|
49,121
|
|
—
|
|
—
|
|
—
|
|
—
|
|
49,145
|
|
|||||||||||||
|
Restricted stock units vested
|
1,015,539
|
|
102
|
|
(102
|
)
|
—
|
|
—
|
|
—
|
|
—
|
|
—
|
|
|||||||||||||
|
Acquisition of treasury stock
|
—
|
|
—
|
|
—
|
|
—
|
|
—
|
|
(1,314,840
|
)
|
(30,542
|
)
|
(30,542
|
)
|
|||||||||||||
|
Comprehensive income (loss):
|
|
|
|
|
|
|
|
|
|
|
|
|
|
|
|
|
|||||||||||||
|
Foreign currency translation
|
—
|
|
—
|
|
—
|
|
—
|
|
(706
|
)
|
—
|
|
—
|
|
(706
|
)
|
|||||||||||||
|
Unrealized gain on interest rate swap
|
—
|
|
—
|
|
—
|
|
—
|
|
115
|
|
—
|
|
—
|
|
115
|
|
|||||||||||||
|
Net earnings
|
—
|
|
—
|
|
—
|
|
4,108
|
|
—
|
|
—
|
|
—
|
|
4,108
|
|
|||||||||||||
|
Balances at March 31, 2017
|
132,875,373
|
|
$
|
13,288
|
|
$
|
1,154,429
|
|
$
|
602,609
|
|
$
|
7,999
|
|
(54,582,392
|
)
|
$
|
(1,039,345
|
)
|
$
|
738,980
|
|
|||||||
|
Cumulative-effect adjustment from adoption of ASU 2016-09
|
—
|
|
—
|
|
384
|
|
2,242
|
|
—
|
|
—
|
|
—
|
|
2,626
|
|
|||||||||||||
|
Employee stock awards, benefit plans and other issuances
|
1,054,754
|
|
105
|
|
19,622
|
|
—
|
|
—
|
|
(420,419
|
)
|
(11,062
|
)
|
8,665
|
|
|||||||||||||
|
Non-cash stock-based compensation
|
628,208
|
|
63
|
|
61,397
|
|
—
|
|
—
|
|
—
|
|
—
|
|
61,460
|
|
|||||||||||||
|
Restricted stock units vested
|
1,521,341
|
|
153
|
|
(153
|
)
|
—
|
|
—
|
|
—
|
|
—
|
|
—
|
|
|||||||||||||
|
Acquisition of treasury stock
|
—
|
|
—
|
|
—
|
|
—
|
|
—
|
|
(3,302,106
|
)
|
(88,884
|
)
|
(88,884
|
)
|
|||||||||||||
|
Comprehensive income:
|
|
|
|
|
|
|
|
|
|
|
|
|
|
|
|
|
|||||||||||||
|
Foreign currency translation
|
—
|
|
—
|
|
—
|
|
—
|
|
2,768
|
|
—
|
|
—
|
|
2,768
|
|
|||||||||||||
|
Net earnings
|
—
|
|
—
|
|
—
|
|
23,480
|
|
—
|
|
—
|
|
—
|
|
23,480
|
|
|||||||||||||
|
Balances at March 31, 2018
|
136,079,676
|
|
$
|
13,609
|
|
$
|
1,235,679
|
|
$
|
628,331
|
|
$
|
10,767
|
|
(58,304,917
|
)
|
$
|
(1,139,291
|
)
|
$
|
749,095
|
|
|||||||
See accompanying notes to consolidated financial statements.
F-27
ACXIOM CORPORATION AND SUBSIDIARIES
CONSOLIDATED STATEMENTS OF CASH FLOWS
YEARS ENDED MARCH 31,
2018
,
2017
AND
2016
(Dollars in thousands)
|
|
2018
|
2017
|
2016
|
||||||||
|
Cash flows from operating activities:
|
|
|
|
||||||||
|
Net earnings
|
$
|
23,480
|
|
$
|
4,108
|
|
$
|
6,703
|
|
||
|
Earnings from discontinued operations, net of tax
|
—
|
|
—
|
|
(15,351
|
)
|
|||||
|
Adjustments to reconcile net earnings to net cash provided by operating activities:
|
|
|
|
|
|
|
|||||
|
Depreciation and amortization
|
86,371
|
|
82,690
|
|
85,463
|
|
|||||
|
Loss on disposal of assets
|
3,348
|
|
3,040
|
|
232
|
|
|||||
|
Write-off of debt issuance costs
|
720
|
|
—
|
|
—
|
|
|||||
|
Impairment of goodwill and other assets
|
—
|
|
—
|
|
6,829
|
|
|||||
|
Deferred income taxes
|
(16,974
|
)
|
(8,818
|
)
|
(11,664
|
)
|
|||||
|
Non-cash stock-based compensation expense
|
63,234
|
|
49,145
|
|
31,463
|
|
|||||
|
Changes in operating assets and liabilities:
|
|
|
|
|
|
|
|||||
|
Accounts receivable, net
|
(22,000
|
)
|
(11,161
|
)
|
(13,014
|
)
|
|||||
|
Other assets
|
(4,740
|
)
|
(172
|
)
|
(13,632
|
)
|
|||||
|
Accounts payable and other liabilities
|
(14,359
|
)
|
4,302
|
|
25,529
|
|
|||||
|
Deferred revenue
|
(6,927
|
)
|
(7,304
|
)
|
11,084
|
|
|||||
|
Net cash provided by operating activities
|
112,153
|
|
115,830
|
|
113,642
|
|
|||||
|
Cash flows from investing activities:
|
|
|
|
|
|
|
|||||
|
Capitalized software development costs
|
(13,739
|
)
|
(14,477
|
)
|
(14,880
|
)
|
|||||
|
Capital expenditures
|
(44,197
|
)
|
(47,993
|
)
|
(47,423
|
)
|
|||||
|
Data acquisition costs
|
(907
|
)
|
(881
|
)
|
(1,553
|
)
|
|||||
|
Proceeds from sales of assets
|
—
|
|
25,494
|
|
—
|
|
|||||
|
Equity investments
|
(1,000
|
)
|
(1,000
|
)
|
—
|
|
|||||
|
Cash paid in acquisitions, net of cash acquired
|
(4,478
|
)
|
(137,383
|
)
|
(5,386
|
)
|
|||||
|
Net cash received in dispositions
|
4,000
|
|
16,988
|
|
—
|
|
|||||
|
Net cash used in investing activities
|
(60,321
|
)
|
(159,252
|
)
|
(69,242
|
)
|
|||||
|
Cash flows from financing activities:
|
|
|
|
|
|
|
|||||
|
Proceeds from debt
|
230,000
|
|
70,000
|
|
—
|
|
|||||
|
Payments of debt
|
(227,320
|
)
|
(32,243
|
)
|
(87,231
|
)
|
|||||
|
Debt issuance costs
|
(4,001
|
)
|
—
|
|
—
|
|
|||||
|
Sale of common stock, net of stock acquired for withholding taxes
|
8,665
|
|
15,709
|
|
10,417
|
|
|||||
|
Excess tax benefits from stock-based compensation
|
—
|
|
2,852
|
|
3,551
|
|
|||||
|
Acquisition of treasury stock
|
(88,884
|
)
|
(30,542
|
)
|
(52,764
|
)
|
|||||
|
Net cash provided by (used in) financing activities
|
(81,540
|
)
|
25,776
|
|
(126,027
|
)
|
|||||
|
Net cash used in continuing operations
|
(29,708
|
)
|
(17,646
|
)
|
(81,627
|
)
|
|||||
See accompanying notes to consolidated financial statements
F-28
ACXIOM CORPORATION AND SUBSIDIARIES
CONSOLIDATED STATEMENTS OF CASH FLOWS (Continued)
YEARS ENDED MARCH 31, 2018, 2017 AND 2016
(Dollars in thousands)
|
2018
|
2017
|
2016
|
|||||||||
|
Cash flows from discontinued operations:
|
|
|
|
|
|
|
|||||
|
Net cash provided by operating activities
|
—
|
|
—
|
|
6,323
|
|
|||||
|
Net cash provided by investing activities
|
—
|
|
—
|
|
124,506
|
|
|||||
|
Net cash used in financing activities
|
—
|
|
—
|
|
(206
|
)
|
|||||
|
Net cash provided by discontinued operations
|
—
|
|
—
|
|
130,623
|
|
|||||
|
Net cash provided by (used in) continuing and discontinued operations
|
(29,708
|
)
|
(17,646
|
)
|
48,996
|
|
|||||
|
Effect of exchange rate changes on cash
|
1,644
|
|
(1,640
|
)
|
(377
|
)
|
|||||
|
Net change in cash and cash equivalents
|
(28,064
|
)
|
(19,286
|
)
|
48,619
|
|
|||||
|
Cash and cash equivalents at beginning of period
|
170,343
|
|
189,629
|
|
141,010
|
|
|||||
|
Cash and cash equivalents at end of period
|
$
|
142,279
|
|
$
|
170,343
|
|
$
|
189,629
|
|
||
|
Supplemental cash flow information:
|
|
|
|
|
|
|
|||||
|
Cash paid during the period for:
|
|
|
|
|
|
|
|||||
|
Interest
|
$
|
9,169
|
|
$
|
7,779
|
|
$
|
8,145
|
|
||
|
Income taxes, net of refunds
|
1,236
|
|
6,866
|
|
6,100
|
|
|||||
|
Noncash investing and financing activities:
|
|||||||||||
|
Leasehold improvements paid directly by lessor
|
978
|
|
—
|
|
—
|
|
|||||
See accompanying notes to consolidated financial statements.
F-29
ACXIOM CORPORATION AND SUBSIDIARIES
NOTES TO CONSOLIDATED FINANCIAL STATEMENTS
MARCH 31, 2018, 2017 AND 2016
1. ORGANIZATION AND SUMMARY OF SIGNIFICANT ACCOUNTING POLICIES:
Description of Business -
Acxiom is a global technology and enablement services company with a vision to transform data into value for everyone. Through a simple, open approach to connecting systems and data, we provide the data foundation for the world’s best marketers. By making it safe and easy to activate, validate, enhance, and unify data, we provide marketers with the ability to deliver relevant messages at scale and tie those messages back to actual results. Our products and services enable people-based marketing, allowing our clients to generate higher return on investment and drive better omni-channel customer experiences.
Acxiom is a Delaware corporation founded in 1969 in Conway, Arkansas. Our common stock is listed on the NASDAQ Global Select Market under the symbol “ACXM.” We serve a global client base from locations in the United States, Europe, and the Asia-Pacific (“APAC”) region. Our client list includes many of the world’s largest and best-known brands across most major industry verticals, including but not limited to financial, insurance and investment services, automotive, retail, telecommunications, high tech, healthcare, travel, entertainment, non-profit, and government.
Basis of Presentation and Principles of Consolidation -
The accompanying consolidated financial statements include the accounts of the Company and its subsidiaries, after elimination of all significant intercompany accounts and transactions. We have prepared the accompanying consolidated financial statements in accordance with accounting principles generally accepted in the United States of America (“GAAP”) as set forth in the Financial Accounting Standards Board’s (“FASB”) Accounting Standards Codification (“ASC”) and we consider the various staff accounting bulletins and other applicable guidance issued by the United States Securities and Exchange Commission ("SEC").
Use of Estimates -
In preparing Consolidated Financial Statements and related disclosures in conformity with GAAP and pursuant to the rules and regulations of the SEC, we must make estimates and judgments that affect the amounts reported in the consolidated financial statements and accompanying notes. Estimates are used in determining, among other items, the fair value of acquired assets and assumed liabilities, projected cash flows associated with recoverability of assets, restructuring and impairment accruals, litigation and facilities lease loss accruals, stock-based compensation, and the recognition and measurement of current and deferred income taxes, including the measurement of uncertain tax positions. Actual results may differ materially from these estimates.
Discontinued Operations -
Discontinued operations comprise those activities that have been disposed of during the period or which have been classified as held for sale at the end of the period, and represent a separate major line of business or geographical area that can be clearly distinguished for operational and financial reporting purposes. In fiscal 2016, the Company sold its IT Infrastructure Management business (“ITO”) and began reporting the results of operations, cash flows and the balance sheet amounts pertaining to ITO as a component of discontinued operations in the consolidated financial statements.
Unless otherwise indicated, information in the notes to the consolidated financial statements relates to continuing operations.
F-30
Significant Accounting Policies
Cash and Cash Equivalents -
The Company considers all highly-liquid investments with original maturities of three months or less to be cash equivalents. The Company has no restricted cash.
Revenue Recognition -
The Company’s policy follows the guidance from ASC 605,
Revenue Recognition
.
The Company provides marketing database services under long-term arrangements. These arrangements may require the Company to perform setup activities such as the design and build of a database, and may include other products and services purchased at the same time, or within close proximity of one another (referred to as multiple element arrangements). Each element within a multiple element arrangement is accounted for as a separate unit of accounting provided the following criteria are met: the delivered products or services have value to the customer on a standalone basis; and for an arrangement that includes a general right of return relative to the delivered products or services, delivery or performance of the undelivered product or service is considered probable and is substantially controlled by us. We consider a deliverable to have standalone value if the product or service is sold separately by us or another vendor or could be resold by the customer. Further, our revenue arrangements generally do not include a general right of return related to the delivered products. Where the aforementioned criteria for a separate unit of accounting are not met, the deliverable is combined with the undelivered element(s) and treated as a single unit of accounting for purposes of allocation of the arrangement consideration and revenue recognition.
For our multiple-element arrangements, we allocate revenue to each element based on a selling price hierarchy at the arrangement’s inception. The relative selling price for each unit of accounting in a multiple-element arrangement is established using vendor-specific objective evidence ("VSOE"), if available, third-party evidence ("TPE"), if available, or management’s best estimate of stand-alone selling price ("BESP"). The Company has neither VSOE nor TPE and therefore uses BESP. The total arrangement consideration is allocated to each separate unit of accounting for each of the deliverables using the relative selling prices of each unit based on the aforementioned selling price hierarchy. We limit the amount of revenue recognized for delivered elements to an amount that is not contingent upon future delivery of additional products or services or meeting any specified performance conditions.
The objective of BESP is to determine the price at which the Company would transact a sale if the product or service were sold on a stand-alone basis. Management’s BESP is determined by considering multiple factors including actual contractual selling prices when the item is sold on a stand-alone basis, as well as market conditions, competition, internal costs, profit objectives and pricing practices. As pricing and marketing strategies evolve, we may modify our pricing practices in the future, which could result in changes to BESP, or to the development of VSOE or TPE for individual products or services. As a result, future revenue recognition for multiple-element arrangements could differ from recognition in the current period. Our relative selling prices are analyzed on an annual basis or more frequently if we experience significant changes in selling prices.
Revenues are recognized when: (1) persuasive evidence of an arrangement exists; (2) we deliver the products and services; (3) the sale price is fixed or determinable; and (4) collection is reasonably assured. Revenues that are not recognized at the time of sale because the foregoing conditions are not met are recognized when those conditions are subsequently met. Where applicable, we reduce revenue for certain incentive programs where we can sufficiently estimate the effects of these items. In some cases, the arrangements also contain provisions requiring customer acceptance of the setup activities prior to commencement of the ongoing services arrangement. Up-front fees billed during the setup phase for these arrangements are deferred and setup costs that are direct and incremental to the contract are capitalized. Revenue recognition does not begin until after customer acceptance in cases where contracts contain acceptance provisions. Once the setup phase is complete and customer acceptance occurs, the Company recognizes revenue and the related costs for each element as delivered. In situations where the arrangement does not require customer acceptance before the Company begins providing services, revenue is recognized for each element as delivered and no costs are deferred.
The Company evaluates its marketing database arrangements to determine whether the arrangement contains a lease. If the arrangement is determined to contain a lease, applicable accounting standards require the Company to account for the lease component separately from the remaining components of the arrangement. In cases where
F-31
marketing database arrangements are determined to include a lease, the lease is evaluated to determine whether it is a capital lease or operating lease and accounted for accordingly. These lease revenues are not significant to the Company’s consolidated financial statements.
Sales of third-party software, hardware and certain other equipment are recognized when delivered. If such sales are part of a multiple-element arrangement, they are recognized as a separate element unless collection of the sales price is dependent upon delivery of other products or services. Additionally, the Company evaluates revenue from the sale of data, software, hardware and equipment in accordance with accounting standards to determine whether such revenue should be recognized on a gross or a net basis. All the factors in the accounting standards are considered with the primary factor being whether the Company is the primary obligor in the arrangement. “Out-of-pocket” expenses incurred by, and reimbursed to, the Company in connection with customer contracts are recorded as gross revenue.
The Company also performs services on a project basis outside of, or in addition to, the scope of long-term arrangements. The Company recognizes revenue from these services as the services are performed.
All taxes assessed on revenue-producing transactions described above are presented on a net basis, or excluded from revenues.
Revenues from the licensing of data are recognized upon delivery of the data to the customer. Revenue from the licensing of data to the customer in circumstances where the license agreement contains a volume cap is recognized in proportion to the total records to be delivered under the arrangement. Revenue from the sale of data on a per-record basis is recognized as the records are delivered.
Revenues from Connectivity services are primarily recorded as monthly recurring subscription fees, and from data providers and certain digital publishers in the form of revenue-sharing agreements.
Accounts Receivable
Accounts receivable includes amounts billed to customers as well as unbilled amounts recognized in accordance with the Company’s revenue recognition policies, as stated above. Unbilled amounts included in accounts receivable, which generally arise from the delivery of data and performance of services to customers in advance of billings, were
$11.6 million
at
March 31, 2018
and
$14.1 million
March 31, 2017
.
Accounts receivable are presented net of allowance for doubtful accounts. The Company evaluates its allowance for doubtful accounts based on a combination of factors at each reporting date. Each account or group of accounts is evaluated based on specific information known to management regarding each customer’s ability or inability to pay, as well as historical experience for each customer or group of customers, the length of time the receivable has been outstanding, and current economic conditions in the customer’s industry. Accounts receivable that are determined to be uncollectible are charged against the allowance for doubtful accounts.
F-32
A summary of the activity of the allowance for doubtful accounts, returns and credits is as follows (dollars in thousands):
|
|
|
|
|
Bad debts
|
|
||||||||||||||
|
|
Balance at
|
Additions
|
|
written off,
|
|
||||||||||||||
|
|
beginning
|
charged to
|
|
net of
|
Balance at
|
||||||||||||||
|
|
of
|
costs and
|
Other
|
amounts
|
end of
|
||||||||||||||
|
|
period
|
expenses
|
changes
|
recovered
|
period
|
||||||||||||||
|
2016:
|
|
|
|
|
|
||||||||||||||
|
Allowance for doubtful accounts, returns and credits
|
$
|
4,423
|
|
$
|
3,673
|
|
$
|
56
|
|
$
|
(890
|
)
|
$
|
7,262
|
|
||||
|
2017:
|
|
|
|
|
|
|
|
|
|
|
|||||||||
|
Allowance for doubtful accounts, returns and credits
|
$
|
7,262
|
|
$
|
1,859
|
|
$
|
(372
|
)
|
$
|
(2,643
|
)
|
$
|
6,106
|
|
||||
|
2018:
|
|
|
|
|
|
|
|
|
|
|
|||||||||
|
Allowance for doubtful accounts, returns and credits
|
$
|
6,106
|
|
$
|
1,054
|
|
$
|
236
|
|
$
|
(564
|
)
|
$
|
6,832
|
|
||||
Other fiscal 2018 changes in the table above result primarily from the effects of exchange rates.
Deferred Revenue
Deferred revenue consists of amounts billed in excess of revenue recognized. Deferred revenues are subsequently recorded as revenue when earned in accordance with the Company’s revenue recognition policies.
Property and Equipment -
Property and equipment are stated at cost. Depreciation and amortization are calculated on the straight-line method over the estimated useful lives of the assets as follows: buildings and improvements, up to
30
years; data processing equipment,
2
-
5
years, and office furniture and other equipment,
3
-
7
years.
Property held under capitalized lease arrangements is included in property and equipment, and the associated liabilities are included in long-term debt. Amortization of property under capitalized leases is included in depreciation and amortization expense. Property and equipment taken out of service and held for sale is recorded at the lower of depreciated cost or net realizable value and depreciation is ceased.
Leases -
Rent expense on operating leases is recorded on a straight-line basis over the term of the lease agreement.
Software, Purchased Software Licenses, and Research and Development Costs –
Costs of internally developed software are capitalized in accordance with ASC 350-40,
Internal Use Software
.
The standard generally requires that research and development costs incurred prior to the beginning of the application development stage of software products are charged to operations as such costs are incurred. Once the application development stage has begun, costs are capitalized until the software is available for general release. Costs of internally developed computer software are amortized on a straight-line basis over the remaining estimated economic life of the software product, generally
two
to
five years
(see Note 8 – Software Costs).
Costs of purchased software licenses are amortized on a straight-line basis over the estimated economic life of the license, generally not to exceed
five
years (see Note 8 – Software Costs).
Capitalized software, including both purchased and internally developed, is reviewed when facts and circumstances indicate the carrying amount may not be recoverable and, if necessary, the Company reduces the carrying value of each product to its fair value.
F-33
Business Combinations –
We apply the provisions of ASC 805,
Business Combinations
, in accounting for its acquisitions. It requires us to recognize separately from goodwill the assets acquired and the liabilities assumed at the acquisition date fair values. Goodwill as of the acquisition date is measured as the excess of consideration transferred over the net of the acquisition date fair values of the assets acquired and the liabilities assumed. While we use our best estimates and assumptions to accurately value assets acquired and liabilities assumed at the acquisition date as well as any contingent consideration, where applicable, our estimates are inherently uncertain and subject to refinement. As a result, during the measurement period, which may be up to one year from the acquisition date, we record adjustments to the assets acquired and liabilities assumed with the corresponding offset to goodwill. Upon the conclusion of the measurement period or final determination of the values of assets acquired and liabilities assumed, whichever comes first, any subsequent adjustments are recorded to our consolidated statements of operations.
Goodwill and Intangible Assets -
Goodwill is measured and tested for impairment on an annual basis in the first quarter of the Company's fiscal year in accordance with ASC 350,
Intangibles-Goodwill and Other
, or more frequently if indicators of impairment exist. In performing our goodwill impairment test, we first evaluate goodwill to determine if it is more likely than not that the occurrence of an event or change in circumstances has reduced the fair value of a reporting unit below its carrying value. The qualitative assessment requires that we consider events or circumstances that may include macroeconomic conditions, industry and market considerations, cost factors, overall financial performance, changes in management or key personnel, changes in strategy, changes in customers, and changes in our stock price. If, after assessing the totality of events or circumstances, we determine that it is more likely than not that the fair value of our reporting units is greater than the carrying amounts, then the two-step goodwill impairment test is not performed.
If the qualitative assessment indicates that the two-step quantitative analysis should be performed, we evaluate goodwill for impairment by comparing the fair value of each of our reporting units to its carrying value, including the associated goodwill. To determine the fair values, we use the equal weighting of the market approach based on comparable publicly traded companies in similar lines of businesses and the income approach based on estimated discounted future cash flows. Our cash flow assumptions consider historical forecasted revenue, operating costs and other relevant factors.
We completed our annual impairment test during the first quarter of fiscal
2018
. We determined, after performing a qualitative review of each reporting unit, that it is more likely than not that the fair value of each of our reporting units exceeds the respective carrying amounts. Accordingly, there was no indication of impairment, and the two-step quantitative goodwill impairment test was not performed. We did not recognize any goodwill impairment charges in fiscal 2017. During fiscal 2016, we recognized a
$5.4 million
goodwill impairment loss related to our APAC Audience Solutions segment and a
$0.5 million
goodwill impairment loss related to our Brazil operation.
We amortize intangible assets with finite lives over their estimated useful lives and review them for impairment whenever an impairment indicator exists. We continually monitor events and changes in circumstances that could indicate carrying amounts of our long-lived assets, including our intangible assets, may not be recoverable. When such events or changes in circumstances occur, we assess recoverability by determining whether the carrying value of such assets will be recovered through the undiscounted expected future cash flows. If the future undiscounted cash flows are less than the carrying amount of these assets, we recognize an impairment loss based on any excess of the carrying amount over the fair value of the assets. We did not recognize any intangible asset impairment charges in fiscal 2018, 2017, or 2016.
F-34
During fiscal 2018, our intangible assets were amortized over their estimated useful lives ranging from
two
years to
ten
years. Amortization is based on the pattern in which the economic benefits of the intangible asset will be consumed or on a straight-line basis when the consumption pattern is not apparent. The weighted average useful lives of our intangible assets were as follows:
|
Weighted Average Useful Life (years)
|
||
|
Developed technology
|
4
|
|
|
Customer relationships
|
6
|
|
|
Trade names
|
3
|
|
|
Publisher relationships
|
6
|
|
Impairment of Long-lived Assets -
Long-lived assets and certain identifiable intangibles are reviewed for impairment whenever events or changes in circumstances indicate that the carrying amount of an asset may not be recoverable. The Company considers factors such as operating losses, declining outlooks, and business conditions when evaluating the necessity for an impairment analysis. Recoverability of assets to be held and used is measured by a comparison of the carrying amount of an asset group to the undiscounted cash flows expected to result from the use and eventual disposition of the asset group. If such assets are impaired, the impairment to be recognized is measured by the amount by which the carrying amount of the assets exceeds the fair value of the assets.
During fiscal 2016, in conjunction with the goodwill impairment tests noted above, the Company also tested certain other long-lived assets in the affected units for impairment. The Company recorded impairment charges of
$0.9 million
related to other long-lived assets, primarily property and equipment.
Fair Value of Financial Instruments -
We apply the provisions of ASC 820,
Fair Value Measurement
, to our assets and liabilities that we are required to measure at fair value pursuant to other accounting standards. The additional disclosure regarding our fair value measurements is included in Note 16.
Concentration of Credit Risk -
Financial instruments that potentially subject us to concentrations of credit risk consist primarily of trade accounts, unbilled and notes receivable. The Company’s receivables are from a large number of customers. Accordingly, the Company’s credit risk is affected by general economic conditions. The Company maintains deposits in federally insured financial institutions more than federally insured limits. Management, however, believes the Company is not exposed to significant credit risk due to the financial position of the depository institutions in which those deposits are held.
Income Taxes -
The Company and its domestic subsidiaries file a consolidated federal income tax return. The Company’s foreign subsidiaries file separate income tax returns in the countries in which their operations are based.
The Company makes estimates and judgments in determining the provision for income taxes for financial statement purposes. These estimates and judgments occur in the calculation of tax credits, benefits, and deductions, and in the calculation of certain deferred tax assets and liabilities that arise from differences in the timing of recognition of revenue and expense for tax and financial statement purposes, as well as the interest and penalties related to uncertain tax positions. Significant changes in these estimates may result in an increase or decrease to the tax provision in a subsequent period. The Company assesses the likelihood that it will be able to recover its deferred tax assets. If recovery is not likely, the Company increases the provision for taxes by recording a valuation allowance against the deferred tax assets that it estimates will not ultimately be recoverable. The Company believes that the deferred tax assets recorded on the consolidated balance sheets will be ultimately recovered. However, should a change occur in the Company’s ability to recover its deferred tax assets, its tax provision would increase in the period in which the Company determined that the recovery was not likely.
F-35
The calculation of tax liabilities involves dealing with uncertainties in the application of complex tax laws and regulations. The Company recognizes liabilities for uncertain tax positions based on a two-step process pursuant to ASC 740,
Income Taxes
. The first step is to evaluate the tax position for recognition by determining whether the weight of available evidence indicates that it is more likely than not that the position will be sustained on audit, including resolution of related appeals or litigation processes, if any. If the Company determines that a tax position will more likely than not be sustained on audit, the second step requires the Company to estimate and measure the tax benefit as the largest amount that is more than 50% likely to be realized upon ultimate settlement. It is inherently difficult and subjective to estimate such amounts, as the Company must determine the probability of various outcomes.
The Company re-evaluates these uncertain tax positions on a quarterly basis. This evaluation is based on factors such as changes in facts or circumstances, changes in tax law, new audit activity, and effectively settled issues. Determining whether an uncertain tax position is effectively settled requires judgment. Such a change in recognition or measurement would result in the recognition of a tax benefit or an additional charge to the tax provision.
The Tax Act significantly changes U.S. corporate income tax laws by, among other things, reducing the U.S. federal corporate tax rate from 35% to 21%. Accordingly, the Company made a provisional remeasurement of its federal deferred tax assets and liabilities to reflect the lower tax rate enacted during the third quarter of fiscal 2018. See Note 13 - Income Taxes for additional information.
Foreign Currency -
The reporting currency of the Company is the U.S. dollar. The functional currency of our foreign operations generally is the applicable local currency for each foreign subsidiary. The balance sheets of the Company’s foreign subsidiaries are translated at period-end rates of exchange, and the statements of operations are translated at the average exchange rate for the period. The effects of foreign currency translation adjustments are included in accumulated other comprehensive income in the consolidated statements of stockholders’ equity and comprehensive income.
Advertising Expense -
Advertising costs are expensed as incurred. Advertising expense was approximately
$11.6 million
,
$9.3 million
and
$5.9 million
for the fiscal years ended
March 31, 2018
,
2017
and
2016
, respectively. Advertising expense is included in operating expenses in the consolidated statements of operations.
Guarantees -
The Company accounts for the guarantees of indebtedness of others under applicable accounting standards which require a guarantor to recognize, at the inception of the guarantee, a liability for the fair value of the obligation undertaken in issuing the guarantee. A guarantor is also required to make additional disclosures in its financial statements about obligations under certain guarantees issued. The Company’s liability for the fair value of guarantees is not material (see Note 11 – Commitments and Contingencies).
Legal Contingencies -
We are currently involved in various claims and legal proceedings. Quarterly, we review the status of each significant matter and assess our potential financial exposure. We accrue a liability for an estimated loss if the potential loss from any claim or legal proceeding is considered probable, and the amount can be reasonably estimated. Note 11, Commitments and Contingencies, provides additional information regarding certain of our legal contingencies.
F-36
Earnings (Loss) per Share -
A reconciliation of the numerator and denominator of basic and diluted earnings (loss) per share is shown below (in thousands, except per share amounts):
|
|
2018
|
2017
|
2016
|
||||||||
|
Net earnings (loss) from continuing operations
|
$
|
23,480
|
|
$
|
4,108
|
|
$
|
(8,648
|
)
|
||
|
Earnings from discontinued operations, net of tax
|
—
|
|
—
|
|
15,351
|
|
|||||
|
Net earnings
|
$
|
23,480
|
|
$
|
4,108
|
|
$
|
6,703
|
|
||
|
Basic earnings (loss) per share:
|
|
|
|
|
|
|
|||||
|
Basic weighted-average shares outstanding
|
78,891
|
|
77,609
|
|
77,616
|
|
|||||
|
Basic earnings (loss) per share:
|
|
|
|
|
|
|
|||||
|
Continuing operations
|
$
|
0.30
|
|
$
|
0.05
|
|
$
|
(0.11
|
)
|
||
|
Discontinued operations
|
—
|
|
—
|
|
0.20
|
|
|||||
|
Net earnings
|
$
|
0.30
|
|
$
|
0.05
|
|
$
|
0.09
|
|
||
|
Diluted earnings (loss) per share:
|
|
|
|
|
|
|
|||||
|
Basic weighted-average shares outstanding
|
78,891
|
|
77,609
|
|
77,616
|
|
|||||
|
Dilutive effect of common stock options, warrants, and restricted stock as computed under the treasury stock method
|
2,625
|
|
2,239
|
|
—
|
|
|||||
|
Diluted weighted-average shares outstanding
|
81,516
|
|
79,848
|
|
77,616
|
|
|||||
|
Diluted earnings (loss) per share:
|
|
|
|
|
|
|
|||||
|
Continuing operations
|
$
|
0.29
|
|
$
|
0.05
|
|
$
|
(0.11
|
)
|
||
|
Discontinued operations
|
—
|
|
—
|
|
0.20
|
|
|||||
|
Net earnings
|
$
|
0.29
|
|
$
|
0.05
|
|
$
|
0.09
|
|
||
Due to the net loss from continuing operations in fiscal
2016
, the dilutive effect of options, warrants and restricted stock units covering
1.5 million
shares of common stock was excluded from the earnings per share calculation since the impact on the calculation was anti-dilutive. Additional options and warrants to purchase shares of common stock and restricted stock units that were outstanding during the periods presented but were not included in the computation of diluted earnings (loss) per share because the effect was anti-dilutive are shown below (in thousands, except per share amounts):
|
|
2018
|
2017
|
2016
|
||||||||||||||||||||
|
Number of shares outstanding under options, warrants and restricted stock units
|
20
|
90
|
1,654
|
||||||||||||||||||||
|
Range of exercise prices for options
|
$
|
32.85
|
|
-
|
$
|
32.85
|
|
$
|
27.77
|
|
-
|
$
|
32.85
|
|
$
|
17.49
|
|
-
|
$
|
62.06
|
|
||
Stock-based Compensation -
The Company records stock-based compensation expense according to the provisions of ASC Topic 718,
Compensation – Stock Compensation
. ASC Topic 718 requires all stock-based payments to employees, including grants of employee stock options, to be recognized in the statement of operations over the service period of the award based on their fair values. Under the provisions of ASC Topic 718, the Company determines the appropriate fair value model to be used for valuing stock-based payments and the amortization method for compensation cost.
The Company has stock option plans and equity compensation plans (collectively referred to as the “stock-based plans”) administered by the compensation committee (“compensation committee”) of the board of directors under which options and restricted stock units were outstanding as of
March 31, 2018
.
The Company’s equity compensation plan provides that all associates (employees, officers, directors, affiliates, independent contractors or consultants) are eligible to receive awards (grant of any option, stock appreciation right, restricted stock award, restricted stock unit award, performance award, performance share, performance unit,
F-37
qualified performance-based award, or other stock unit award) under the plan with the terms and conditions applicable to an award set forth in applicable grant documents.
Incentive stock option awards granted under the stock-based plans cannot be granted with an exercise price less than
100%
of the per-share market value of the Company’s shares at the date of grant and have a maximum duration of
ten years
from the date of grant. Board policy currently requires that nonqualified options also must be priced at or above the fair market value of the common stock at the time of grant with a maximum duration of
ten years
.
Restricted stock units may be issued under the equity compensation plan and represent the right to receive shares in the future by way of an award agreement which includes vesting provisions. Award agreements can further provide for forfeitures triggered by certain prohibited activities, such as breach of confidentiality. All restricted stock units will be expensed over the vesting period and adjusted for forfeitures as incurred. The vesting of some restricted stock units is subject to the Company’s achievement of certain performance criteria, as well as the individual remaining employed by the Company for a period of years.
The Company also has outstanding performance-based stock appreciation rights and performance-based stock units. These are expensed over the vesting period of the award.
The Company receives income tax deductions because of the exercise of nonqualified stock options and the vesting of other stock-based awards. These excess tax benefits and deficiencies are included as a component of income tax expense and reflected as an operating cash flow included in changes in operating assets and liabilities.
Restructuring –
The Company records costs associated with employee terminations and other exit activity in accordance with ASC 420,
Exit or Disposal Cost Obligations
, depending on whether the costs relate to exit or disposal activities under the accounting standards, or whether they are other post-employment termination benefits. Under applicable accounting standards for exit or disposal costs, the Company records employee termination benefits as an operating expense when the benefit arrangement is communicated to the employee and no significant future services are required. Under the accounting standards related to post employment termination benefits the Company records employee termination benefits when the termination benefits are probable and can be estimated. The Company recognizes the present value of facility lease termination obligations, net of estimated sublease income and other exit costs, when the Company has future payments with no future economic benefit or a commitment to pay the termination costs of a prior commitment. In future periods the Company will record accretion expense to increase the liability to an amount equal to the estimated future cash payments necessary to exit the leases. This requires judgment and management estimation to determine the expected time frame for securing a subtenant, the amount of sublease income to be received and the appropriate discount rate to calculate the present value of the future cash flows. Should actual lease exit costs differ from estimates, the Company may be required to adjust the restructuring charge which will impact net earnings in the period any adjustment is recorded.
Adoption of New Accounting Standards –
In January 2017, the FASB issued ASU 2017-01, "Business Combinations (Topic 805): Clarifying the Definition of a Business" ("ASU 2017-01"), which amended the existing FASB Accounting Standards Codification. The standard provides additional guidance to assist entities with evaluation of whether transactions should be accounted for as acquisitions (or disposals) of assets or businesses. The definition of a business affects many areas of accounting, including acquisitions, disposals, goodwill, and consolidation. ASU 2017-01 is effective for the Company beginning in fiscal 2019, with early adoptions permitted. We adopted the standard in the current fiscal year, on a prospective basis, and adoption of this guidance did not have a material impact on our consolidated financial statements and related disclosures.
In November 2016, the FASB issued ASU 2016-18, "Statement of Cash Flows (Topic 230): Restricted Cash" ("ASU 2016-18"). This standard is intended to reduce diversity in the presentation of restricted cash and restricted cash equivalents in the statement of cash flows. The standard requires that restricted cash and restricted cash equivalents be included as components of total cash and cash equivalents as presented on the statement of cash flows. As a result, entities will no longer present transfers between cash and cash equivalents and restricted cash and restricted cash equivalents in the statement of cash flows. ASU 2016-18 is effective for annual periods beginning after December 15, 2017 (fiscal 2019 for the Company), including interim periods within those fiscal
F-38
years; earlier adoption is permitted. We adopted the standard during the current fiscal year. Early adoption did not result in any changes to our existing accounting policies, presentation of items in our consolidated financial statements and related disclosures, or any changes resulting from the retrospective application to all periods reported.
In March 2016, the FASB issued ASU No. 2016-09, "Compensation - Stock Compensation (Topic 718): Improvements to Employee Share-Based Payment Accounting" ("ASU 2016-09"), which is intended to improve the accounting for stock-based payment transactions as part of the FASB's simplification initiative. The ASU changes five aspects of the accounting for stock-based payment award transactions that will affect public companies, including: (1) accounting for income taxes; (2) classification of excess tax benefits on the statement of cash flows; (3) forfeitures; (4) minimum statutory tax withholding requirements; and (5) classification of employee taxes paid on the statement of cash flows when an employer withholds shares for tax-withholding purposes. The inclusion of excess tax benefits and deficiencies as a component of our income tax provision will increase volatility within our provision for income taxes as the amount of excess tax benefits or deficiencies from stock-based compensation awards depends on our stock price at the date the awards vest or the date of option exercises. This guidance also requires excess tax benefits to be presented as an operating activity on the statement of cash flows and allows an entity to make an accounting policy election to either estimate expected forfeitures or to account for them as they occur.
We adopted ASU No. 2016-09 during the current fiscal year, which required us to reflect any adjustments as of April 1, 2017. We elected to account for forfeitures as they occur rather than estimating expected forfeitures. We recorded the cumulative impact of adoption through an increase in retained earnings of
$2.2 million
, of which
$2.6 million
related to deferred tax assets from certain federal and state research tax credit carryforwards attributable to excess tax benefits from stock-based compensation that had not been previously recognized, offset by
$0.4 million
related to elimination of the forfeiture pool. We elected to prospectively adopt the effect on the statement of cash flows and accordingly, did not restate the Consolidated Statements of Cash Flows for fiscal 2017 and 2016, respectively.
Recent Accounting Pronouncements Not Yet Adopted –
In May 2017, the FASB issued ASU 2017-09, "Compensation-Stock Compensation (Topic 719): Scope of Modification Accounting" ("ASU 2017-09"). ASU 2017-09 clarifies when changes to the terms or conditions of a stock-based payment award must be accounted for as modifications. ASU 2017-09 will reduce diversity in practice and result in fewer changes to the terms of an award being accounted for as modifications. Under ASU 2017-09, an entity will not apply modification accounting to a stock-based payment award if the award's fair value, vesting conditions and classification as an equity or liability instrument are the same immediately before and after the change. ASU 2017-09 will be applied prospectively to awards modified on or after the adoption date. The guidance is effective for annual periods, and interim periods within those annual periods, beginning after December 15, 2017. ASU 2017-09 is effective for the Company beginning in fiscal 2019. The Company continues to evaluate the impact of the adoption of this guidance on its consolidated financial statements, but does not expect it to have a material impact.
In January 2017, the FASB issued ASU 2017-04, "Intangibles-Goodwill and Other (Topic 350): Simplifying the Test for Goodwill Impairment" ("ASU 2017-04"), which eliminates step two from the goodwill impairment test. Under ASU 2017-04, an entity should recognize an impairment charge for the amount by which the carrying amount of a reporting unit exceeds its fair value; however, the loss recognized should not exceed the total amount of goodwill allocated to that reporting unit. ASU 2017-04 is effective for annual periods beginning after December 15, 2019 (fiscal 2021 for the Company), including interim periods within those fiscal years; earlier adoption is permitted for goodwill impairment tests performed on testing dates after January 1, 2017. The Company does not expect the adoption of this guidance to have a material impact on its consolidated financial statements and related disclosures.
In February 2016, the FASB issued ASU No. 2016-02, "Leases (Topic 842)" ("ASU 2016-02"), as a comprehensive new standard that amends various aspects of existing guidance for leases and requires additional disclosures about leasing arrangements. The new standard will require lessees to recognize a right-of-use asset and a lease liability on the balance sheet for all leases except for short-term leases. For lessees, leases will continue to be classified as either operating or finance in the income statement. Lessor accounting is similar to the current model but updated to align with certain changes to the lessee model. Lessors will continue to classify leases as operating, direct financing or sales-type leases. Subsequently, the FASB has issued various ASU's to provide further clarification around certain aspects of Topic 842. ASU 2016-02 is effective for annual periods beginning after December 15, 2018 (fiscal
F-39
2020 for the Company), including interim periods within those fiscal years, with early adoption permitted. We will adopt the new standard on April 1, 2019 using the modified retrospective approach. The Company is continuing to evaluate the impact of the adoption of this guidance on its consolidated financial statements and related disclosures.
In May 2014, the FASB issued update ASU 2014-09, Revenue from Contracts with Customers (Topic 606) and issued subsequent amendments to the initial guidance in August 2015, March 2016, April 2016, May 2016 and December 2016 within ASU 2015-14, ASU 2016-08, ASU 2016-10, ASU 2016-12 and ASU 2016-20, respectively. Topic 606 supersedes nearly all existing revenue recognition guidance under GAAP. The core principle of the new guidance is to recognize revenues when promised goods or services are transferred to customers in an amount that reflects the consideration to which the entity expects to be entitled in exchange for those goods or services. The guidance defines a five-step process to achieve this core principle and, in doing so, it is possible more judgment and estimates may be required within the revenue recognition process than are required under existing GAAP, including identifying performance obligations in the contract, estimating the amount of variable consideration to include in the transaction price and allocating the transaction price to each separate performance obligation, among others. Topic 606 also provides guidance on the recognition of costs related to obtaining customer contracts. Companies may adopt Topic 606 using a full retrospective or modified retrospective method. The Company adopted the standard on April 1, 2018 using the modified retrospective method.
During fiscal 2018, the Company completed its evaluation of Topic 606. Based on the evaluation, the Company does not expect it to have a material impact on its results of operations or cash flows in the periods after adoption. Most revenue streams will be recorded consistently under both the current standard and new standard; however, the Company noted the following impact:
Under the current standard, we expense costs related to the acquisition of revenue-generating contracts as incurred. Under the new standard, we will be required to capitalize incremental costs to acquire contracts and amortize them over the expected period of benefit, which we have determined as a range from two to five years.
At April 1, 2018, the Company expects to record the cumulative impact of Topic 606 through an increase in retained earnings of approximately
$12.5 million
rather than retrospectively adjusting prior periods. The cumulative adjustment will primarily relate to the capitalization of certain costs incremental to contract acquisition.
Topic 606 also requires expanded disclosure regarding the nature, timing, and uncertainty of revenue transactions, and costs incurred to obtain customer contracts. The Company has evaluated these disclosure requirements and incorporated the collection of relevant data into its reporting process. These disclosures will be reflected beginning in the Company’s Quarterly Report on Form 10-Q for the quarter ended June 30, 2018.
The Company does not anticipate that the adoption of any other recent accounting pronouncements will have a material impact on the Company's consolidated financial position, results of operations or cash flows.
F-40
2. RESTRUCTURING, IMPAIRMENT AND OTHER CHARGES:
The following table summarizes the restructuring activity included in gains, losses and other items, net in the consolidated statements of operations for the fiscal years ended
March 31, 2018
,
2017
and
2016
(dollars in thousands):
|
|
Associate-related
|
Lease
|
|
||||||||
|
|
reserves
|
accruals
|
Total
|
||||||||
|
March 31, 2015
|
$
|
7,211
|
|
$
|
5,228
|
|
$
|
12,439
|
|
||
|
Restructuring charges and adjustments
|
8,630
|
|
3,002
|
|
11,632
|
|
|||||
|
Payments
|
(12,986
|
)
|
(4,706
|
)
|
(17,692
|
)
|
|||||
|
March 31, 2016
|
$
|
2,855
|
|
$
|
3,524
|
|
$
|
6,379
|
|
||
|
Restructuring charges and adjustments
|
3,755
|
|
2,985
|
|
6,740
|
|
|||||
|
Payments
|
(4,210
|
)
|
(2,201
|
)
|
(6,411
|
)
|
|||||
|
March 31, 2017
|
$
|
2,400
|
|
$
|
4,308
|
|
$
|
6,708
|
|
||
|
Restructuring charges and adjustments
|
3,832
|
|
2,564
|
|
6,396
|
|
|||||
|
Payments
|
(3,481
|
)
|
(1,580
|
)
|
(5,061
|
)
|
|||||
|
March 31, 2018
|
$
|
2,751
|
|
$
|
5,292
|
|
$
|
8,043
|
|
||
Restructuring Plans
In fiscal 2018, the Company recorded a total of
$6.4 million
in restructuring charges and adjustments included in gains, losses and other items, net in the consolidated statement of operations. The expense included severance and other associate-related charges of
$3.8 million
, and lease accruals and adjustments of
$2.6 million
.
The associate-related accruals of
$3.8 million
related to the termination of associates in the United States and Europe. Of the amount accrued,
$2.2 million
remained accrued as of
March 31, 2018
. These costs are expected to be paid out in fiscal 2019. The lease accruals and adjustments of
$2.6 million
result from the Company's exit from certain leased office facilities.
In fiscal 2017, the Company recorded a total of
$8.9 million
in restructuring charges and adjustments included in gains, losses and other items, net in the consolidated statement of operations. The expense included severance and other associate-related charges of
$3.8 million
, lease accruals and adjustments of
$3.0 million
, and leasehold improvement write offs of
$2.1 million
. The associate-related accruals of
$3.8 million
were fully paid in fiscal 2018. The lease accruals and adjustments of
$3.0 million
resulted from the Company’s exit from certain leased office facilities (
$1.5 million
), and adjustments to estimates related to the fiscal 2015 lease accruals (
$1.5 million
).
In fiscal 2016, the Company recorded a total of
$12.0 million
in restructuring charges and adjustments included in gains, losses and other items, net in the consolidated statement of operations. The expense included severance and other associate-related charges of
$8.6 million
, Europe lease termination charges and accruals of
$3.0 million
, and leasehold improvement write offs of
$0.4 million
. The associate-related accruals of
$8.6 million
related to the termination of associates in the United States, Europe, Brazil and Australia. Of the amount accrued for 2016,
$0.2 million
remained accrued as of
March 31, 2018
. These costs are expected to be paid out in fiscal 2019. The Europe lease termination charges and accruals of
$3.0 million
were fully paid during fiscal 2016.
In fiscal 2015, the Company recorded a total of
$21.8 million
in restructuring charges and adjustments included in gains, losses and other items, net in the consolidated statement of operations. The expense included severance and other associate-related charges of
$13.3 million
, lease accruals of
$6.5 million
, and the write-off of leasehold improvements of
$2.0 million
. Of the associate-related accruals of
$13.3 million
,
$0.3 million
remained accrued as of
March 31, 2018
. These amounts are expected to be paid out in fiscal 2019.
The fiscal 2015, 2017, and 2018 lease accruals described above relate to three floors, each vacated in a certain fiscal year, of one facility. Of the consolidated fiscal 2015, 2017, and 2018 facility lease restructuring charges of
$12.1 million
,
$5.3 million
remained accrued as of
March 31, 2018
. The Company intends to sublease the facilities to the extent possible. The liabilities will be satisfied over the remainder of the leased properties' terms, which continue through November 2025. Actual sublease receipts may differ from the estimates originally made by the
F-41
Company. Any future changes in the estimates or in the actual sublease income could require future adjustments to the liabilities, which would impact net earnings (loss) in the period the adjustment is recorded.
Gains, Losses and Other Items
Gains, losses and other items for each of the years presented are as follows (dollars in thousands):
|
|
2018
|
2017
|
2016
|
||||||||
|
Restructuring plan charges and adjustments
|
$
|
6,396
|
|
$
|
6,740
|
|
$
|
11,632
|
|
||
|
Other restructuring charges
|
—
|
|
2,125
|
|
381
|
|
|||||
|
Write-off of accumulated foreign currency translation in Brazil
|
—
|
|
1,315
|
|
—
|
|
|||||
|
Gain on disposition of assets
|
—
|
|
(2,986
|
)
|
—
|
|
|||||
|
Acquisition-related costs
|
—
|
|
1,365
|
|
—
|
|
|||||
|
Other
|
(23
|
)
|
(186
|
)
|
119
|
|
|||||
|
|
$
|
6,373
|
|
$
|
8,373
|
|
$
|
12,132
|
|
||
3. ACQUISITIONS:
Pacific Data Partners
On February 14, 2018, the Company acquired all the outstanding units of Pacific Data Partners LLC ("PDP") in order to accelerate its ability to power people-based B2B marketing. The Company paid approximately
$4.5 million
in cash, net of
$0.5 million
funds held in escrow and
$0.2 million
cash acquired. The escrow funds are expected to be delivered to the PDP sellers one year from the acquisition date. The Company has omitted pro forma disclosures related to this acquisition as the pro forma effect of this acquisition is not material. The results of operations of this acquisition are included in the Company's consolidated results beginning February 14, 2018.
The following table presents the purchase price allocation related to assets acquired and liabilities assumed (dollars in thousands):
|
February 14, 2018
|
||||
|
Assets acquired:
|
|
|||
|
Cash
|
$
|
228
|
|
|
|
Trade accounts receivable
|
224
|
|
||
|
Developed technology (Software, net)
|
2,000
|
|
||
|
Goodwill
|
3,260
|
|
||
|
Intangible assets (Other assets)
|
200
|
|
||
|
Total assets acquired
|
5,912
|
|
||
|
Accounts payable and accrued expenses
|
(706
|
)
|
||
|
Net assets acquired
|
5,206
|
|
||
|
Less:
|
|
|||
|
Funds held in escrow
|
(500
|
)
|
||
|
Cash acquired
|
(228
|
)
|
||
|
Net cash paid
|
$
|
4,478
|
|
|
The fair values assigned to tangible and identifiable intangible assets acquired and liabilities assumed were based on calculations and valuations using management’s estimates and assumptions and were based on the information that was available as of the date of acquisition.
In connection with the PDP acquisition, the Company assumed the outstanding performance compensation plan under the 2018 Equity Compensation Plan of Pacific Data Partners, LLC ("PDP PSU plan"). Under the PDP PSU plan, performance compensation will be paid to plan participants in
four
annual increments based on attainment of
F-42
certain Connectivity B2B run rate revenue targets for the performance period covering April 1, 2018 to March 31, 2022. Each annual payout will be determined at the close of each fiscal year within the performance period, on a cumulative basis. The amount of each annual payout will be settled in shares of Company common stock. The number of shares of Company common stock issued to participants will be equal to
90%
of the annual payout divided by the volume weighted average stock price for the
20
trading days prior to, and ending on, the end of each annual performance period, plus,
10%
of the annual payout divided by the volume weighted average stock price for the
20
trading days prior to, and ending on, the date of the closing of the acquisition. Total performance attainment may result in combined payouts ranging from
$0.0 million
to
$65.0 million
.
The performance compensation paid under the PDP PSU plan will be recorded as non-cash stock-based compensation as it is attributable to post-combination service (see Note 12 - Stockholders' Equity). The non-cash stock-based compensation expense will be recognized over the requisite service and performance period based on expected attainment.
90%
of the performance compensation will be settleable in a number of shares calculated using a variable
20
-day stock price factor, determined in future periods, and will be classified as a liability-based equity award. As of each reporting date,
90%
of any recognized, but unpaid portions of the performance compensation plan will be recorded in other accrued expenses in the Consolidated Balance Sheet. The remaining 10% of the performance compensation will be classified as an equity-based equity award.
Through
March 31, 2018
, the Company recognized a total of
$2.0 million
in non-cash stock-based compensation expense in the consolidated statements of operations related to the PDP PSU plan.
Arbor and Circulate
The Company acquired all the outstanding shares of Arbor Technologies, Inc. (“Arbor”) and Circulate.com, Inc. (“Circulate”) on November 22, 2016 and November 29, 2016, respectively. Arbor and Circulate help publishers connect people-based data to the marketing ecosystem. Arbor and Circulate are included in the Connectivity segment, and increase the scale of the Company’s omni-channel identity graph and network. The Company has included the financial results of Arbor and Circulate in the consolidated financial statements from the dates of acquisition. The consideration paid for the outstanding shares and vested stock options was approximately
$137.4 million
, net of cash acquired of approximately
$9.5 million
. The consideration paid for unvested stock options had an estimated fair value of
$9.2 million
. These options are not part of the purchase price and will be expensed as non-cash stock compensation over the applicable vesting periods.
In connection with the Arbor acquisition, the Company agreed to pay
$38.3 million
to certain key employees (see “Consideration Holdback” in note 12). The consideration holdback is payable over
30
equal, monthly increments and is settleable in shares of Company common stock. The number of shares to be issued monthly will vary depending on the market price of the shares on the date of issuance and will be recorded as non-cash stock compensation expense as the shares are issued. The consideration holdback is not part of the purchase price as vesting is dependent on continued employment of the key employees.
Following the closing of Arbor, the Company granted new awards of restricted stock units to select employees of Arbor to induce them to accept employment with the Company (the “Arbor Inducement Awards”). The Arbor Inducement Awards had a grant date fair value of
$10.4 million
, and vest over
three years
with
34%
of the total vesting on the first anniversary of the closing date and
8.25%
vesting each three months thereafter, subject to the employee’s continued service through each vesting date. Following the closing of Circulate, the Company granted new awards of restricted stock units to select employees of Circulate to induce them to accept employment with the Company (the “Circulate Inducement Awards”). The Circulate Inducement Awards had a grant date fair value of
$10.0 million
. The Circulate Inducement Awards granted to certain key employees of Circulate vest over
two years
with
50%
of the total vesting on the first anniversary of the closing date and
12.5%
vesting each three months thereafter, subject to the employee’s continued service through each vesting date and vesting acceleration upon a qualifying termination as set forth in the applicable employee’s offer letter with the Company. The Circulate Inducement Awards granted to all other Circulate employees vest incrementally over
four years
with
25%
of the total vesting on the first anniversary date of the closing, and
25%
vesting each 12 months thereafter, subject to the employee’s continued service through each vesting date.
On November 29, 2016, the Company delivered
$5.9 million
of cash to an escrow agent according to the terms of the Circulate acquisition agreement. The cash was restricted as to withdrawal or use by the Company. The restricted cash was delivered to the Circulate sellers
one year
from the acquisition date, during fiscal 2018. The
F-43
principal escrow amount was owned by the Company until funds were delivered to the Circulate sellers. All interest and earnings on the principal escrow amount remain property of the Company.
The following table summarizes the fair values of assets acquired and liabilities assumed as of the date of the acquisitions (dollars in thousands):
|
November 22 and November 29,
2016
|
||||
|
Assets acquired:
|
|
|||
|
Cash
|
$
|
9,495
|
|
|
|
Trade accounts receivable
|
3,352
|
|
||
|
Goodwill
|
105,670
|
|
||
|
Intangible assets (Other assets)
|
40,800
|
|
||
|
Other current and noncurrent assets
|
278
|
|
||
|
Total assets acquired
|
159,595
|
|
||
|
Deferred income taxes
|
(8,093
|
)
|
||
|
Accounts payable and accrued expenses
|
(4,623
|
)
|
||
|
Net assets acquired
|
146,879
|
|
||
|
Less:
|
|
|||
|
Cash acquired
|
(9,495
|
)
|
||
|
Net cash paid
|
$
|
137,384
|
|
|
The excess of purchase consideration over the fair value of net tangible and identifiable intangible assets acquired was recorded as goodwill and is primarily attributed to development of future technology and products, development of future customer relationships, and the Arbor and Circulate assembled workforces. The Company allocated the goodwill to the reporting unit that was expected to benefit from the acquired goodwill. Goodwill is not deductible for U.S. income tax purposes.
The Company recognized the assets and liabilities acquired based on estimates of their acquisition date fair values. The determination of the fair values of the acquired assets and liabilities assumed (and the related determination of the estimated lives of depreciable tangible and identifiable intangible assets) requires significant judgement. The Company believes that the information available at the date of acquisition provided a reasonable basis for estimating the fair values of the assets acquired and the liabilities assumed.
The amounts allocated to intangible assets in the table above included publisher relationships, developed technology, customer relationships, and trade name. Intangible assets will be amortized on a straight-line basis over the estimated useful lives of
1
to
6
years. The following table presents the components of intangible assets acquired and their estimated useful lives as of the acquisition date (dollars in thousands):
|
|
|
Useful life
|
|||
|
|
Fair value
|
(in years)
|
|||
|
Publisher relationships
|
$
|
23,800
|
|
6
|
|
|
Developed technology
|
9,300
|
|
2 to 4
|
||
|
Customer relationships
|
7,100
|
|
6
|
||
|
Trade name
|
600
|
|
1
|
||
|
Total intangible assets
|
$
|
40,800
|
|
|
|
The Company has omitted disclosures of revenue and net loss of the acquired companies from the acquisition dates of November 22, 2016 and November 29, 2016, respectively, to March 31, 2017 as the amounts are not material.
F-44
During the year ended March 31, 2017, the Company incurred
$1.4 million
of acquisition costs related to the Arbor and Circulate acquisitions, which are included in gains, losses, and other items, net on the consolidated statement of operations (see Note 2 - Restructuring, Impairment and Other Charges).
The unaudited pro forma financial information in the table below summarizes the combined results of operations for Acxiom, Arbor and Circulate for the purposes of unaudited pro forma financial information disclosure as if the companies were combined as of the beginning of fiscal 2016. The unaudited pro forma financial information for all periods presented included the business combination accounting effects resulting from these acquisitions, including amortization charges from acquired intangible assets, stock-based compensation charges for unvested restricted stock-based awards and stock options assumed, if any, and the related tax effects as though the aforementioned companies were combined as of the beginning of fiscal 2016. The unaudited pro forma financial information as presented below is for informational purposes only and is not necessarily indicative of the results of operations that would have been achieved if the acquisitions had taken place at the beginning of fiscal 2016.
The unaudited pro forma financial information for the years ended March 31, 2017 and 2016, respectively, combined the historical results of Acxiom for the years ended March 31, 2017 and 2016 and the historical results of Arbor and Circulate for the years ended December 31, 2016 and 2015 (adjusted due to differences in reporting periods) and the effects of the pro forma adjustments listed above. The unaudited pro forma financial information was as follows (dollars in thousands, except per share data):
|
|
2017
|
2016
|
|||||
|
Revenues
|
$
|
887,495
|
|
$
|
853,249
|
|
|
|
Net loss from continuing operations
|
$
|
(17,025
|
)
|
$
|
(38,903
|
)
|
|
|
Basic and diluted loss per share from continuing operations
|
$
|
(0.22
|
)
|
$
|
(0.30
|
)
|
|
Addressable Television Net Assets from Allant (“Allant”)
On December 1, 2015, the Company acquired certain addressable television net assets from The Allant Group, Inc. The acquisition provides the Company additional consumer insight capabilities that enable clients to more effectively reach their television channel customer base and audiences. The Company paid approximately
$5.4 million
in cash. The Company has omitted pro forma disclosures related to this acquisition as the pro forma effect of this acquisition is not material. The results of operation for the acquisition are included in the Company’s consolidated results beginning December 1, 2015.
The following table presents the purchase price allocation related to assets acquired and liabilities assumed (dollars in thousands):
|
|
December 1, 2015
|
|||
|
Assets acquired:
|
|
|||
|
Trade accounts receivable
|
$
|
499
|
|
|
|
Goodwill
|
1,377
|
|
||
|
Developed technology (Software)
|
2,700
|
|
||
|
Other intangible assets (Other assets, net)
|
1,400
|
|
||
|
Net assets acquired
|
5,976
|
|
||
|
Accounts payable
|
(590
|
)
|
||
|
Net cash paid
|
$
|
5,386
|
|
|
The fair values assigned to tangible and identifiable intangible assets acquired and liabilities assumed were based on calculations and valuations using management’s estimates and assumptions and were based on the information that was available as of the date of acquisition.
F-45
4. DISCONTINUED OPERATIONS AND DISPOSITIONS:
Disposition of Impact email business
In fiscal 2017, the Company completed the sale of its Impact email business to Zeta Interactive for total consideration of
$22.0 million
, including a
$4.0 million
subordinated promissory note with interest accruing at a rate of
6%
per annum. The note was paid in full in fiscal 2018. The Company also entered into a separate multi-year contract to provide Zeta Interactive with Connectivity and Audience Solutions services. Prior to the disposition, the Impact email business was included in the Marketing Services segment results.
The business did not meet the requirements of a discontinued business; therefore, all financial results are included in continuing operations. The Company recorded a gain on sale of
$0.3 million
, included in gains, losses and other items, net. The transaction also generated a
$4.3 million
income tax benefit.
Revenues and income (loss) from operations from the disposed Impact email business are shown below (dollars in thousands):
|
|
2017
|
2016
|
||||||
|
Revenues
|
$
|
20,375
|
|
$
|
60,199
|
|
||
|
Income (loss) from operations
|
$
|
(157
|
)
|
$
|
10,105
|
|
||
IT Infrastructure Management business (“ITO”)
On May 20, 2015, the Company announced it had entered into a definitive agreement to sell its ITO business to Charlesbank Capital Partners and M/C Partners. The sale was completed on July 31, 2015. Beginning in the first quarter of fiscal 2016, the Company began reporting the results of operations, cash flows, and the balance sheet amounts pertaining to ITO as a component of discontinued operations in the consolidated financial statements. Prior to the discontinued operations classification, the ITO business unit was included in the IT Infrastructure Management segment in the Company’s segment results.
At the closing of the transaction, the Company received total consideration of
$131.0 million
(
$140.0 million
stated sales price less closing adjustments and transaction costs of
$9.0 million
). In addition, the Company has the right to participate in distributions of the divested entity above a defined amount. The Company reported a gain of
$9.3 million
on the sale which is included in earnings from discontinued operations, net of tax.
On July 31, 2015, the Company applied
$55.0 million
of proceeds from the sale to repay outstanding Company indebtedness to comply with the Company’s existing credit agreement (see Note 10 – Long-Term Debt). The Company allocated interest expense associated with the
$55.0 million
repayment of Company indebtedness to the ITO discontinued operating business. Allocated interest expense was
$0.4 million
for the fiscal year ended March 31, 2016. We used the remaining proceeds from the sale to fund expansion of its common stock repurchase program and for general corporate purposes.
F-46
Summary results of operations of ITO for the fiscal year ended March 31, 2016 are segregated and included in earnings from discontinued operations, net of tax, in the consolidated statements of operations. The following table is a reconciliation of the major classes of line items constituting earnings from discontinued operations, net of tax (dollars in thousands):
|
|
2016
|
||
|
Major classes of line items constituting earnings from discontinued operations, net of tax:
|
|
||
|
Revenues
|
$
|
69,410
|
|
|
Cost of revenue
|
50,837
|
|
|
|
Gross profit
|
18,573
|
|
|
|
Operating expenses:
|
|
||
|
Sales and marketing
|
1,192
|
|
|
|
General and administrative
|
6,053
|
|
|
|
Gain on sale of discontinued operations
|
(9,349
|
)
|
|
|
Gains, losses and other items, net
|
367
|
|
|
|
Total operating expenses
|
(1,737
|
)
|
|
|
Earnings from discontinued operations
|
20,310
|
|
|
|
Interest expense
|
(681
|
)
|
|
|
Other, net
|
(230
|
)
|
|
|
Earnings from discontinued operations before income taxes
|
19,399
|
|
|
|
Income taxes
|
3,598
|
|
|
|
Earnings from discontinued operations, net of tax
|
$
|
15,801
|
|
ITO was a provider of managed hosting and cloud infrastructure services, optimized for mid-tier enterprises. The Company entered into certain agreements with ITO in which support services, including data center co-location services, will be provided from the Company to ITO, and from ITO to the Company. Additionally, the Company entered into certain other agreements with ITO to provide or receive leased office space. The terms of these agreements range from several months to the longest of which continues through July 2020. The agreements generally provide cancellation provisions, without penalty, at various times throughout the term.
Cash inflows and outflows related to the agreements are included in cash flows from operating activities in the consolidated statements of cash flows. Revenues and expenses related to the agreements are included in income (loss) from operations in the consolidated statements of operations. The related cash inflows and outflows and revenues and expenses for the periods reported are shown below (dollars in thousands):
|
|
2018
|
2017
|
2016
|
||||||||
|
Cash inflows
|
$
|
6,575
|
|
$
|
7,214
|
|
$
|
4,728
|
|
||
|
Cash outflows
|
$
|
1,976
|
|
$
|
4,140
|
|
$
|
4,165
|
|
||
|
Revenues
|
$
|
7,511
|
|
$
|
6,470
|
|
$
|
4,650
|
|
||
|
Expenses
|
$
|
1,770
|
|
$
|
3,284
|
|
$
|
4,617
|
|
||
F-47
5. OTHER CURRENT AND NONCURRENT ASSETS:
Other current assets consist of the following (dollars in thousands):
|
|
March 31,
|
March 31,
|
|||||
|
|
2018
|
2017
|
|||||
|
Prepaid expenses and other
|
$
|
27,594
|
|
$
|
25,714
|
|
|
|
Escrow deposit (see Note 3 - Acquisitions)
|
—
|
|
5,880
|
|
|||
|
Note receivable (see Note 4 – Discontinued Operations and Dispositions)
|
—
|
|
4,000
|
|
|||
|
Assets of non-qualified retirement plan (see Note 6 - Other Accrued Expenses)
|
13,551
|
|
12,716
|
|
|||
|
Other current assets
|
$
|
41,145
|
|
$
|
48,310
|
|
|
Other noncurrent assets consist of the following (dollars in thousands):
|
|
March 31,
|
March 31,
|
|||||
|
|
2018
|
2017
|
|||||
|
Acquired intangible assets, net
|
$
|
33,922
|
|
$
|
43,884
|
|
|
|
Deferred data acquisition costs
|
1,036
|
|
1,116
|
|
|||
|
Other miscellaneous noncurrent assets
|
6,510
|
|
6,443
|
|
|||
|
Noncurrent assets
|
$
|
41,468
|
|
$
|
51,443
|
|
|
6. OTHER ACCRUED EXPENSES:
Other accrued expenses consist of the following (dollars in thousands):
|
|
March 31,
|
March 31,
|
|||||
|
|
2018
|
2017
|
|||||
|
Accrued purchase consideration (see Note 3 - Acquisitions)
|
$
|
—
|
|
$
|
5,880
|
|
|
|
Liabilities of non-qualified retirement plan (see Note 5 - Other Current and Noncurrent Assets)
|
13,551
|
|
12,716
|
|
|||
|
Other accrued expenses
|
42,314
|
|
41,265
|
|
|||
|
Other accrued expenses
|
$
|
55,865
|
|
$
|
59,861
|
|
|
7. GOODWILL AND INTANGIBLE ASSETS:
Goodwill by operating segment and activity for the years ended
March 31, 2018
and
2017
was as follows (dollars in thousands):
|
|
Marketing
|
Audience
|
|
|
|||||||||||
|
|
Services
|
Solutions
|
Connectivity
|
Total
|
|||||||||||
|
Balance at March 31, 2016
|
$
|
124,586
|
|
$
|
273,430
|
|
$
|
94,729
|
|
$
|
492,745
|
|
|||
|
Acquisitions of Arbor and Circulate (see note 3)
|
—
|
|
—
|
|
105,670
|
|
105,670
|
|
|||||||
|
Impact email disposition (see note 4)
|
(5,684
|
)
|
—
|
|
—
|
|
(5,684
|
)
|
|||||||
|
Allant purchase accounting adjustments
|
—
|
|
18
|
|
—
|
|
18
|
|
|||||||
|
Change in foreign currency translation adjustment
|
(12
|
)
|
—
|
|
(6
|
)
|
(18
|
)
|
|||||||
|
Balance at March 31, 2017
|
$
|
118,890
|
|
$
|
273,448
|
|
$
|
200,393
|
|
$
|
592,731
|
|
|||
|
Acquisition of PDP (see note 3)
|
—
|
|
—
|
|
3,260
|
|
3,260
|
|
|||||||
|
Arbor purchase accounting adjustments
|
—
|
|
—
|
|
(21
|
)
|
(21
|
)
|
|||||||
|
Change in foreign currency translation adjustment
|
18
|
|
—
|
|
7
|
|
25
|
|
|||||||
|
Balance at March 31, 2018
|
$
|
118,908
|
|
$
|
273,448
|
|
$
|
203,639
|
|
$
|
595,995
|
|
|||
Year end balances in the table above are net of accumulated impairment losses of
$120.1 million
at
March 31, 2018
and
2017
, respectively.
F-48
Goodwill by component included in each operating segment as of
March 31, 2018
was:
|
|
Marketing
|
Audience
|
|
|
|||||||||||
|
|
Services
|
Solutions
|
Connectivity
|
Total
|
|||||||||||
|
U.S.
|
$
|
110,910
|
|
$
|
273,448
|
|
$
|
200,072
|
|
$
|
584,430
|
|
|||
|
APAC
|
7,998
|
|
—
|
|
3,567
|
|
11,565
|
|
|||||||
|
Balance at March 31, 2018
|
$
|
118,908
|
|
$
|
273,448
|
|
$
|
203,639
|
|
$
|
595,995
|
|
|||
The amounts allocated to intangible assets from acquisitions include developed technology, customer relationships, trade names, and publisher relationships. Amortization lives for those intangibles range from
two
years to
ten
years. The following table shows the amortization activity of intangible assets (dollars in thousands):
|
|
2018
|
2017
|
2016
|
||||||||
|
Developed technology, gross (Software)
|
$
|
54,150
|
|
$
|
52,150
|
|
$
|
42,850
|
|
||
|
Accumulated amortization
|
(43,533
|
)
|
(29,775
|
)
|
(17,950
|
)
|
|||||
|
Net developed technology
|
$
|
10,617
|
|
$
|
22,375
|
|
$
|
24,900
|
|
||
|
Customer relationship/Trade name, gross (Other assets, net)
|
$
|
43,364
|
|
$
|
43,164
|
|
$
|
35,466
|
|
||
|
Accumulated amortization
|
(27,953
|
)
|
(21,702
|
)
|
(16,263
|
)
|
|||||
|
Net customer/trade name
|
$
|
15,411
|
|
$
|
21,462
|
|
$
|
19,203
|
|
||
|
Publisher relationship, gross (Other assets, net)
|
$
|
23,800
|
|
$
|
23,800
|
|
$
|
—
|
|
||
|
Accumulated amortization
|
(5,289
|
)
|
(1,378
|
)
|
—
|
|
|||||
|
Net publisher relationship
|
$
|
18,511
|
|
$
|
22,422
|
|
$
|
—
|
|
||
|
Total intangible assets, gross
|
$
|
121,314
|
|
$
|
119,114
|
|
$
|
78,316
|
|
||
|
Total accumulated amortization
|
(76,775
|
)
|
(52,855
|
)
|
(34,213
|
)
|
|||||
|
Total intangible assets, net
|
$
|
44,539
|
|
$
|
66,259
|
|
$
|
44,103
|
|
||
Intangible assets by operating segment as of
March 31, 2018
was (dollars in thousands):
|
|
Marketing
|
Audience
|
|
|
|||||||||||
|
|
Services
|
Solutions
|
Connectivity
|
Total
|
|||||||||||
|
Developed technology
|
—
|
|
600
|
|
10,017
|
|
10,617
|
|
|||||||
|
Customer/Trade name
|
11
|
|
311
|
|
15,089
|
|
15,411
|
|
|||||||
|
Publisher relationship
|
—
|
|
—
|
|
18,511
|
|
18,511
|
|
|||||||
|
Balance at March 31, 2018
|
$
|
11
|
|
$
|
911
|
|
$
|
43,617
|
|
$
|
44,539
|
|
|||
Total amortization expense related to intangible assets was
$23.9 million
,
$18.6 million
, and
$15.5 million
in fiscal
2018
,
2017
, and
2016
, respectively. As of
March 31, 2018
, estimated future amortization expenses related to purchases and other intangible assets were as follows (dollars in thousands):
|
Year ending March 31,
|
|
||
|
2019
|
$
|
15,980
|
|
|
2020
|
11,950
|
|
|
|
2021
|
8,025
|
|
|
|
2022
|
5,150
|
|
|
|
2023
|
3,434
|
|
|
|
|
$
|
44,539
|
|
F-49
8. SOFTWARE COSTS:
The Company recorded amortization expense related to internally developed computer software of
$28.4 million
,
$27.5 million
, and
$30.7 million
for fiscal
2018
,
2017
and
2016
, respectively, including
$13.8 million
,
$11.8 million
, and
$10.0 million
, respectively, related to internally developed software acquired as part of recent acquisitions (see Note 7 - Goodwill and Intangible Assets). Amortization expense in fiscal
2018
and fiscal
2016
also included
$1.0 million
and
$1.8 million
, respectively, of accelerated amortization expense resulting from adjusting the remaining estimated useful lives of certain capitalized software products which the Company no longer uses.
The Company recorded amortization expense related to purchased software licenses of
$1.7 million
,
$3.0 million
, and
$3.8 million
in fiscal
2018
,
2017
and
2016
, respectively.
9. PROPERTY AND EQUIPMENT:
Property and equipment, some of which has been pledged as collateral for long-term debt, is summarized as follows (dollars in thousands):
|
|
March 31,
|
March 31,
|
|||||
|
|
2018
|
2017
|
|||||
|
Land
|
$
|
5,398
|
|
$
|
5,398
|
|
|
|
Buildings and improvements
|
195,609
|
|
189,666
|
|
|||
|
Data processing equipment
|
262,254
|
|
249,131
|
|
|||
|
Office furniture and other equipment
|
28,005
|
|
32,086
|
|
|||
|
|
491,266
|
|
476,281
|
|
|||
|
Less accumulated depreciation and amortization
|
334,733
|
|
320,307
|
|
|||
|
|
$
|
156,533
|
|
$
|
155,974
|
|
|
Depreciation expense on property and equipment was
$43.5 million
,
$42.9 million
and
$40.6 million
for the fiscal years ended
March 31, 2018
,
2017
and
2016
, respectively.
Long-term debt consists of the following (dollars in thousands):
|
|
March 31,
|
March 31,
|
|||||
|
|
2018
|
2017
|
|||||
|
Term loan credit agreement
|
$
|
—
|
|
$
|
155,000
|
|
|
|
Revolving credit borrowings
|
230,000
|
|
70,000
|
|
|||
|
Other debt and long-term liabilities
|
3,293
|
|
5,612
|
|
|||
|
Total long-term debt
|
233,293
|
|
230,612
|
|
|||
|
Less current installments
|
1,583
|
|
39,819
|
|
|||
|
Less deferred debt financing costs
|
3,873
|
|
1,552
|
|
|||
|
Long-term debt, excluding current installments and deferred debt financing costs
|
$
|
227,837
|
|
$
|
189,241
|
|
|
On June 20, 2017, the Company entered into a Sixth Amended and Restated Credit Agreement (the "restated credit agreement") as part of refinancing its prior credit agreement. On that day, the Company used an initial draw of
$230 million
to pay off the outstanding
$225 million
term and revolving loan balances, with interest, and fund
$4.0 million
in fees related to the restated credit agreement. The fees are being amortized over the term of the agreement.
The Company's restated credit agreement provides for (1) revolving credit facility borrowings consisting of revolving loans, letters of credit participation, and swing-line loans (the “revolving loans”) in an aggregate amount of
$600 million
and (2) a provision allowing the Company to request an increase of the aggregate amount of the revolving loans in an amount not to exceed
$150 million
. The restated credit agreement is secured by the accounts receivable of the Company and its domestic subsidiaries, as well as by the outstanding stock of certain subsidiaries of the Company. The restated credit agreement contains customary representations, warranties, affirmative and
F-50
negative covenants, and default and acceleration provisions. The restated credit agreement matures, and is fully due and payable, on June 20, 2022 and allows for prepayments before maturity.
The revolving loan borrowings bear interest at
LIBOR
or at an alternative base rate plus a credit spread. At
March 31, 2018
, the revolving loan borrowing bears interest at LIBOR plus a credit spread of
2%
. The weighted-average interest rate on revolving credit borrowings at
March 31, 2018
was
3.9%
. There were no material outstanding letters of credit at
March 31, 2018
or
March 31, 2017
.
Under the terms of the restated credit agreement, the Company is required to maintain certain debt-to-cash flow and interest coverage ratios, among other restrictions. At
March 31, 2018
, the Company was in compliance with these covenants and restrictions.
The Company’s future obligations, excluding interest, under its long-term debt at
March 31, 2018
are as follows (dollars in thousands):
|
Year ending March 31,
|
|
||
|
2019
|
$
|
1,583
|
|
|
2020
|
1,362
|
|
|
|
2021
|
348
|
|
|
|
2022
|
—
|
|
|
|
2023
|
230,000
|
|
|
|
|
$
|
233,293
|
|
11. COMMITMENTS AND CONTINGENCIES:
Legal Matters
The Company is involved in various claims and legal proceedings. Management routinely assesses the likelihood of adverse judgments or outcomes to these matters, as well as ranges of probable losses, to the extent losses are reasonably estimable. The Company records accruals for these matters to the extent that management concludes a loss is probable and the financial impact, should an adverse outcome occur, is reasonably estimable. These accruals are reflected in the Company’s consolidated financial statements. In management’s opinion, the Company has made appropriate and adequate accruals for these matters, and management believes the probability of a material loss beyond the amounts accrued to be remote. However, the ultimate liability for these matters is uncertain, and if accruals are not adequate, an adverse outcome could have a material effect on the Company’s consolidated financial condition or results of operations. The Company maintains insurance coverage above certain limits. There are currently no matters pending against the Company or its subsidiaries for which the potential exposure is considered material to the Company’s consolidated financial statements.
Commitments
The Company leases data processing equipment, office furniture and equipment, land and office space under noncancellable operating leases. The Company has a future commitment for lease payments over the next
22
years of
$84.0 million
.
Total rental expense on operating leases was
$15.9 million
,
$15.9 million
, and
$17.1 million
for the fiscal years ended
March 31, 2018
,
2017
and
2016
, respectively. Future minimum lease payments under all noncancellable operating leases for the five years ending
March 31, 2023
, are as follows:
2019
,
$16.5 million
;
2020
,
$15.9 million
;
2021
,
$15.5 million
;
2022
,
$15.1 million
; and
2023
,
$8.7 million
.
In connection with the Impact email disposition during fiscal 2017 (see Note 4 – Discontinued Operations and Dispositions), the Company assigned a facility lease to the buyer of the business. The Company guaranteed the facility lease as required by the asset disposition agreement. Should the assignee default, the Company would be required to perform under the terms of the facility lease, which runs through September 2021. At
March 31, 2018
, the Company’s maximum potential future rent payments under this guarantee totaled
$2.1 million
.
F-51
12. STOCKHOLDERS’ EQUITY:
The Company has authorized
200 million
shares of
$0.10
par value common stock and
1 million
shares of
$1.00
par value preferred stock. The board of directors of the Company may designate the relative rights and preferences of the preferred stock when and if issued. Such rights and preferences could include liquidation preferences, redemption rights, voting rights and dividends, and the shares could be issued in multiple series with different rights and preferences. The Company currently has no plans for the issuance of any shares of preferred stock.
At
March 31, 2018
, the Company had outstanding
4,942
warrants to purchase shares of its common stock. The outstanding warrants carry an exercise price of
$13.24
and expire March 17, 2019.
On August 29, 2011, the board of directors adopted a common stock repurchase program. That program was subsequently modified and expanded, most recently on
March 30, 2018
. Under the modified common stock repurchase program, the Company may purchase up to
$500 million
of its common stock through the period ending
December 31, 2019
. During the fiscal year ended
March 31, 2018
, the Company repurchased
3.3 million
shares of its common stock for
$88.9 million
. During the fiscal year ended
March 31, 2017
, the Company repurchased
1.3 million
shares of its common stock for
$30.5 million
. During the fiscal year ended
March 31, 2016
, the Company repurchased
2.6 million
shares of its common stock for
$52.8 million
. Through
March 31, 2018
, the Company has repurchased
20.1 million
shares of its stock for
$374.6 million
, leaving remaining capacity of
$125.4 million
under the stock repurchase program.
The Company paid no dividends on its common stock for any of the years reported.
Share-based Compensation Plans
The Company has stock option and equity compensation plans for which a total of
34.5 million
shares of the Company’s common stock have been reserved for issuance since the inception of the plans. At
March 31, 2018
, there were a total of
6.6 million
shares available for future grants under the plans.
Stock Option Activity of Continuing Operations
In fiscal
2017
, as part of the Company’s acquisition of Arbor (see Note 3 - Acquisitions), the Company issued
285,339
replacement stock options having a per share weighted-average fair value and exercise price of
$25.85
and
$1.27
, respectively, to Arbor employees who had outstanding unvested stock options to purchase Arbor stock. The fair value of the replacement options was determined using a customized
binomial lattice
model with the following assumptions: dividend yield of
0.0%
since Acxiom is currently not paying dividends and there are no plans to pay dividends; risk-free interest rates from
2.24%
to
2.32%
, based on the rate of U.S. Treasury securities with a term equal to the remaining term of each option; remaining terms of each option from
8.6
to
9.9
years; expected volatility of
38%
, based on both the historical volatility of Acxiom stock, as well as the implied volatility of traded Acxiom options; and a suboptimal exercise multiple of
1.4
, based on actual historical exercise activity of Acxiom options.
The number of shares and exercise price of each replacement option were determined by converting Arbor options into equivalent Acxiom options by multiplying the number of shares subject to Arbor options by the exchange ratio of
.41998
and by dividing the exercise price for each Arbor option by the exchange ratio of
.41998
. Once the value of each replacement option was determined, the total fair value of
$7.4 million
, net of any forfeitures, will be expensed by the Company over the remaining vesting period of each option.
Also in fiscal
2017
, as part of the Company’s acquisition of Circulate, the Company issued
73,164
replacement stock options having a per share weighted-average fair value and exercise price of
$24.80
and
$2.30
, respectively, to Circulate employees who had outstanding unvested stock options to purchase Circulate stock. The total fair value of
$1.8 million
, net of any forfeitures, will be expensed by the Company over the remaining vesting period of each option.
In fiscal 2016, the Company granted
445,785
stock options, having a per-share weighted-average fair value of
$6.48
. This valuation was determined using a customized
binomial lattice
approach with the following weighted-average assumptions: dividend yield of
0.0%
since Acxiom is currently not paying dividends and there are no plans to pay dividends; risk-free interest rate of
2.2%
, based on the rate of U.S. Treasury securities with a term equal to the life of the options; expected option life of
4.5
years, an output of the lattice model; expected volatility of
40%
, based on both the historical volatility of Acxiom stock, as well as the implied volatility of traded Acxiom options; and a suboptimal exercise multiple of
1.4
, determined using actual historical exercise activity of Acxiom options.
F-52
Stock option activity during the year ended
March 31, 2018
was:
|
|
|
|
Weighted-average
|
|
||||||||
|
|
|
Weighted-average
|
remaining
|
Aggregate
|
||||||||
|
|
Number of
|
exercise price
|
contractual term
|
Intrinsic value
|
||||||||
|
|
shares
|
per share
|
(in years)
|
(in thousands)
|
||||||||
|
Outstanding at March 31, 2017
|
3,033,071
|
|
$
|
13.14
|
|
|
|
|||||
|
Performance units converted to options
|
299,641
|
|
$
|
21.32
|
|
|
|
|
||||
|
Exercised
|
(661,931
|
)
|
$
|
13.89
|
|
|
$
|
8,568
|
|
|||
|
Forfeited or cancelled
|
(105,494
|
)
|
$
|
20.25
|
|
|
|
|
||||
|
Outstanding at March 31, 2018
|
2,565,287
|
|
$
|
13.61
|
|
5.5
|
$
|
23,538
|
|
|||
|
Exercisable at March 31, 2018
|
1,995,309
|
|
$
|
13.60
|
|
5.0
|
$
|
18,382
|
|
|||
The aggregate intrinsic value for options exercised in fiscal
2018
,
2017
, and
2016
was
$8.6 million
,
$9.8 million
, and
$10.7 million
, respectively. The aggregate intrinsic value at period end represents total pre-tax intrinsic value (the difference between Acxiom’s closing stock price on the last trading day of the period and the exercise price for each in-the-money option) that would have been received by the option holders had option holders exercised their options on
March 31, 2018
. This amount changes based upon changes in the fair market value of Acxiom’s stock.
A summary of stock options outstanding and exercisable as of
March 31, 2018
was:
|
|
|
|
Options outstanding
|
Options exercisable
|
||||||||||||||||||
|
Range of
|
|
Weighted-average
|
Weighted-average
|
|
Weighted-average
|
|||||||||||||||||
|
exercise price
|
Options
|
remaining
|
exercise price
|
Options
|
exercise price
|
|||||||||||||||||
|
per share
|
outstanding
|
contractual life
|
per share
|
exercisable
|
per share
|
|||||||||||||||||
|
$
|
0.61
|
|
—
|
$
|
9.99
|
|
619,749
|
|
6.1 years
|
$
|
1.68
|
|
434,021
|
|
$
|
1.79
|
|
|||||
|
$
|
10.00
|
|
—
|
$
|
19.99
|
|
1,229,616
|
|
4.7 years
|
$
|
14.96
|
|
1,043,930
|
|
$
|
14.47
|
|
|||||
|
$
|
20.00
|
|
—
|
$
|
24.99
|
|
696,370
|
|
6.6 years
|
$
|
21.31
|
|
497,806
|
|
$
|
21.32
|
|
|||||
|
$
|
25.00
|
|
—
|
$
|
32.85
|
|
19,552
|
|
5.6 years
|
$
|
32.85
|
|
19,552
|
|
$
|
32.85
|
|
|||||
|
|
|
|
2,565,287
|
|
5.5 years
|
$
|
13.61
|
|
1,995,309
|
|
$
|
13.60
|
|
|||||||||
Total expense related to stock options was approximately
$5.0 million
in fiscal
2018
,
$6.9 million
in fiscal
2017
, and
$9.8 million
in fiscal
2016
. Of the fiscal
2018
,
2017
and
2016
expense,
$1.1 million
,
$4.3 million
and
$6.7 million
, respectively, relates to LiveRamp replacement stock options. Of the fiscal
2018
expense,
$2.7 million
relates to Arbor and Circulate replacement stock options. Future expense for all options is expected to be approximately
$6.2 million
in total over the next
three
years.
Performance Stock Option Unit Activity
In fiscal 2017, the Company granted
633,604
performance-based stock option units with a fair value at the date of grant of
$4.9 million
, determined using a Monte Carlo simulation model. All the units granted in fiscal 2017 vest and become exercisable in three equal tranches, each being subject to attainment of performance criteria and a subsequent service period established by the compensation committee of the board of directors (“compensation committee”). Each of the three tranches may vest in a number of stock options, from
zero
to
300%
of the initial award, each having a weighted-average exercise price of
$21.40
, based on the attainment of certain revenue growth and operating margin targets for the years ending March 31, 2017, 2018, and 2019 respectively. Each tranche is subject to a service period following the respective performance periods, such that each tranche will cliff vest in
two
separate
50%
increments over
two
years beginning with the compensation committee meeting that immediately follows the end of the respective performance period.
F-53
Performance stock option unit activity during the year ended
March 31, 2018
was:
|
|
|
|
Weighted-average
|
|
|||||||||
|
|
|
Weighted-average
|
remaining
|
Aggregate
|
|||||||||
|
|
Number
|
exercise price
|
contractual term
|
intrinsic value
|
|||||||||
|
|
of shares
|
per share
|
(in years)
|
(in thousands)
|
|||||||||
|
Outstanding at March 31, 2017
|
555,123
|
|
$
|
21.41
|
|
2.1
|
|
|
|||||
|
Performance units converted to options
|
(183,322
|
)
|
$
|
21.41
|
|
|
|
||||||
|
Forfeited or cancelled
|
(42,397
|
)
|
$
|
21.32
|
|
|
|
||||||
|
Outstanding at March 31, 2018
|
329,404
|
|
$
|
21.42
|
|
1.6
|
|
$
|
446
|
|
|||
|
Exercisable at March 31, 2018
|
—
|
|
$
|
—
|
|
—
|
|
$
|
—
|
|
|||
Of the performance stock option units outstanding at
March 31, 2018
,
164,702
reached maturity of the relevant performance period at
March 31, 2018
. The units are expected to vest at an approximate
0%
attainment level during the subsequent service period, resulting in cancellation of the units.
Total expense related to performance stock option units was
$0.5 million
in fiscal
2018
and
$1.3 million
in fiscal
2017
. Future expense for these performance stock option units is expected to be approximately
$1.5 million
over the next
three
years.
Stock Appreciation Right (“SAR”) Activity
During fiscal 2015, the Company granted
245,404
performance-based SARs with a fair value at the date of grant of
$0.5 million
and having an exercise price of
$40
. All of the performance-based SARs granted in fiscal 2015 vest subject to attainment of performance criteria established by the compensation committee. The SAR units reached maturity of the relevant performance period on March 31, 2017. The units achieved a 100% performance attainment level. However, application of the vesting multiplier resulted in zero shares granted and cancellation of all the units during fiscal 2018.
SAR activity during the year ended
March 31, 2018
was:
|
|
|
|
Weighted-average
|
|
|||||||||
|
|
|
Weighted-average
|
remaining
|
Aggregate
|
|||||||||
|
|
Number
|
exercise price
|
contractual term
|
intrinsic value
|
|||||||||
|
|
of shares
|
per share
|
(in years)
|
(in thousands)
|
|||||||||
|
Outstanding at March 31, 2017
|
245,404
|
|
$
|
40.00
|
|
—
|
|
|
|||||
|
Forfeited or cancelled
|
(245,404
|
)
|
$
|
40.00
|
|
||||||||
|
Outstanding at March 31, 2018
|
—
|
|
$
|
—
|
|
—
|
|
$
|
—
|
|
|||
|
Exercisable at March 31, 2018
|
—
|
|
$
|
—
|
|
—
|
|
$
|
—
|
|
|||
Total expense related to SARs in fiscal
2017
and
2016
was approximately
$0.2 million
in each period.
Restricted Stock Unit Activity
Non-vested time-vesting restricted stock units activity during the year ended
March 31, 2018
was:
|
|
|
Weighted-average
|
Weighted-average
|
|||||
|
|
|
fair value per
|
remaining
|
|||||
|
|
Number
|
share at grant
|
contractual
|
|||||
|
|
of shares
|
date
|
term (in years)
|
|||||
|
Outstanding at March 31, 2017
|
3,307,577
|
|
$
|
22.57
|
|
2.45
|
||
|
Granted
|
1,794,915
|
|
$
|
26.22
|
|
|
||
|
Vested
|
(1,236,644
|
)
|
$
|
22.58
|
|
|
||
|
Forfeited or cancelled
|
(416,847
|
)
|
$
|
23.54
|
|
|
||
|
Outstanding at March 31, 2018
|
3,449,001
|
|
$
|
24.35
|
|
2.32
|
||
F-54
During fiscal
2018
, the Company granted time-vesting restricted stock units covering
1,794,915
shares of common stock with a fair value at the date of grant of
$47.1 million
. Of the restricted stock units granted in the current period,
1,463,285
vest over
four
years,
106,571
vest over
three
years,
174,368
vest over
two
years, and
50,691
vest over
one
year.
During fiscal
2017
, the Company granted time-vesting restricted stock units covering
2,309,183
shares of common stock with a fair value at the date of grant of
$55.4 million
, of which units covering
768,710
shares, with a fair value at grant date of
$20.0 million
, were granted to former Arbor and Circulate employees subsequent to the acquisitions (see Note 3 - Acquisitions). Of the restricted stock units granted in the current period,
1,454,340
vest in equal annual increments over
four
years,
398,079
partially cliff vest at the one-year anniversary and then over equal quarterly increments during the subsequent two years,
408,534
partially cliff vest at the one-year anniversary and then over equal quarterly increments during the subsequent year, and
48,230
vest in
one
year.
During fiscal
2016
, the Company granted time-vesting restricted stock units covering
1,427,561
shares of common stock with a fair value at the date of grant of
$27.0 million
. Of the restricted stock units granted in the current period,
1,041,572
vest in equal annual increments over
four
years,
70,799
vest in equal annual increments over
two
years,
72,650
vest in
one
year, and
242,540
vest in equal quarterly increments starting
15 months
after the date of grant.
Valuation of time-vesting restricted stock units for all periods presented is equal to the quoted market price for the shares on the date of grant. The total fair value of time-vesting restricted stock units vested in fiscal
2018
,
2017
, and
2016
was
$52.1 million
,
$23.1 million
, and
$17.6 million
, respectively and is measured as the quoted market price of the Company’s common stock on the vesting date for the number of shares vested.
Non-vested performance-based restricted stock units activity during the year ended
March 31, 2018
was:
|
|
|
Weighted-average
|
Weighted-average
|
|||||
|
|
|
fair value per
|
remaining
|
|||||
|
|
Number
|
share at
|
contractual
|
|||||
|
|
of shares
|
grant date
|
term (in years)
|
|||||
|
Outstanding at March 31, 2017
|
732,711
|
|
$
|
20.89
|
|
1.13
|
||
|
Granted
|
425,880
|
|
$
|
26.24
|
|
|
||
|
Additional earned performance shares
|
359,206
|
|
$
|
18.96
|
|
|||
|
Vested
|
(781,622
|
)
|
$
|
19.00
|
|
|||
|
Forfeited or cancelled
|
(53,412
|
)
|
$
|
22.64
|
|
|
||
|
Outstanding at March 31, 2018
|
682,763
|
|
$
|
25.23
|
|
1.54
|
||
During fiscal 2018, the Company granted performance-based restricted stock units covering
425,880
shares of common stock having a fair value at the date of grant of
$11.2 million
. Of the performance-based restricted stock units granted in fiscal 2018,
221,746
units - having a fair value at the date of grant of
$6.2 million
, determined using a Monte Carlo simulation model - vest subject to attainment of performance criteria established by the compensation committee of the board of directors (“compensation committee”) and continuous employment through the vesting date. The
221,746
units may vest in a number of shares from
zero
to
200%
of the award, based on the total shareholder return of Acxiom common stock compared to total shareholder return of a group of peer companies (“TSR”) established by the compensation committee for the period from April 1, 2017 to March 31, 2020.
Of the performance-based restricted stock units granted in the current period,
87,184
units - having a fair value at the date of grant of
$2.1 million
, based on the quoted market price for the shares on the date of grant - vest over two periods, each being subject to attainment of performance criteria established by the compensation committee and continuous employment through the vesting date. At the end of the first year, the performance units may vest in a number of shares, from
zero
to
75%
of the initial award. At the end of the second year, the performance units may vest in a number of shares, from
zero
to
150%
of the initial award, less the number of shares awarded at completion of year one. The units will vest based on the attainment of certain revenue growth initiatives for the period from October 1, 2017 to September 30, 2019.
The remaining
116,950
performance-based restricted stock units granted in the current period - having a fair value at the date of grant of
$2.9 million
, based on the quoted market price for the shares on the date of grant - vest in
three
equal tranches, each being subject to attainment of performance criteria established by the compensation
F-55
committee and continuous employment through the vesting date. Each of the three tranches may vest in a number of shares, from
zero
to
300%
of the initial award, based on the attainment of certain revenue growth and operating margin targets for the years ending March 31, 2018, 2019, and 2020, respectively. The first tranche reaching maturity at March 31, 2018 achieved an approximate
53%
attainment. As a result, approximately
18,868
shares will vest and approximately
16,551
shares will be cancelled during the first quarter of fiscal 2019.
During fiscal
2017
, the Company granted performance-based restricted stock units covering
263,835
shares of common stock with a fair value at the date of grant of
$6.6 million
, determined using a Monte Carlo simulation model. Of the performance-based restricted stock units granted in fiscal 2017,
9,416
units represent award modifications that included
14,349
corresponding cancelled units. The remaining
254,419
performance-based restricted stock units, having a fair value at the date of grant of
$6.3 million
, vest subject to attainment of performance criteria established by the compensation committee. Those units may vest in a number of shares from
zero
to
200%
of the award, based on the total shareholder return of Acxiom common stock compared to total shareholder return of a group of peer companies (“TSR”) established by the compensation committee of the board of directors for the period from April 1, 2016 to March 31, 2019.
During fiscal
2016
, the Company granted performance-based restricted stock units covering
367,807
shares of common stock with a fair value at the date of grant of
$6.8 million
. All the performance-based restricted stock units granted in fiscal
2017
vest subject to attainment of performance criteria established by the compensation committee. The units granted in the current period may vest in a number of shares from
zero
to
200%
of the award, based on the attainment of an earnings-per-share target for fiscal 2018, with a modifier based on the total shareholder return of Acxiom common stock compared to total shareholder return of a group of peer companies established by the compensation committee for the period from April 1, 2015 to March 31, 2018. The value of the performance-based restricted stock units is determined using a Monte Carlo simulation model.
During fiscal 2018,
781,622
performance-based restricted stock units vested. Of the fiscal 2018 performance-based restricted stock units vested,
252,760
related to a performance period ended March 31, 2017. During fiscal 2018,
157,985
units vested at a
160%
attainment level based on performance results approved by the compensation committee, resulting in issuance of
252,760
shares of common stock, of which
94,775
are included in additional earned performance shares referenced in the table above. Of the fiscal 2018 performance-based restricted stock units vested,
528,862
related to a performance period ended March 31, 2018.
264,431
units vested at
200%
attainment level based on performance results approved by the compensation committee, resulting in issuance of
528,862
shares of common stock, of which
264,431
are included in the additional earned performance shares referenced in the table above. There were
no
performance-based restricted stock units vested in fiscal 2017 and 2016.
The expense related to restricted stock in fiscal
2018
,
2017
, and
2016
was
$39.1 million
,
$33.3 million
, and
$19.4 million
, respectively. Future expense for restricted stock units is expected to be approximately
$35.0 million
in fiscal
2019
,
$25.2 million
in fiscal
2020
,
$13.1 million
in fiscal
2021
and
$2.5 million
in fiscal
2022
.
Other Performance Unit Activity
During fiscal 2016, the Company granted
323,080
performance-based units, having a fair value at the date of grant of
$0.9 million
. These performance-based units vest subject to attainment of performance criteria established by the compensation committee. The units may vest in a number of units up to
100%
of the award, based on the attainment of certain Company common stock share price targets for the period from July 1, 2015 to June 30, 2017. At March 31, 2017,
284,618
of these performance-based units remained outstanding. The units reached maturity of the relevant performance period on June 30, 2017. The units achieved an approximate
9%
performance attainment level, resulting in issuance of
24,573
shares of common stock and cancellation of
260,045
units during fiscal 2018.
During fiscal 2015, the Company granted
312,575
performance-based units with a fair value at the date of grant of
$1.6 million
. All the other performance-based units granted in fiscal 2015 vest subject to attainment of performance criteria established by the compensation committee.
Of the units granted in fiscal 2015,
201,464
may vest in a number of units up to
100%
of the award, based on the attainment of certain revenue targets for the period from April 1, 2014 to March 31, 2017. These performance-based stock units reached maturity of the relevant performance period on March 31, 2017. The units achieved
100%
performance attainment level. However, application of the share price adjustment factor resulted in zero shares granted and cancellation of all the units during fiscal 2018.
F-56
The remaining
111,111
units granted in fiscal 2015 may vest in a number of units up to
100%
of the award, based on the attainment of certain revenue targets for the period from April 1, 2015 to March 31, 2018. These performance-based stock units reached maturity of the relevant performance period on March 31, 2018. The units achieved
100%
performance attainment level. However, application of the share price factor resulted in an approximate
59%
reduction in shares granted, in the first quarter of fiscal 2019.
Other performance unit activity during the year ended
March 31, 2018
was:
|
|
|
Weighted average
|
Weighted-average
|
||||||
|
|
|
fair value per
|
remaining
|
||||||
|
|
Number
|
share at
|
contractual
|
||||||
|
|
of shares
|
grant date
|
term (in years)
|
||||||
|
Outstanding at March 31, 2017
|
597,193
|
|
$
|
4.14
|
|
1.30
|
|
||
|
Vested
|
(24,573
|
)
|
$
|
2.94
|
|
||||
|
Forfeited or cancelled
|
(461,509
|
)
|
$
|
3.92
|
|
|
|||
|
Outstanding at March 31, 2018
|
111,111
|
|
$
|
5.33
|
|
—
|
|
||
The expense related to other performance units in fiscal
2018
,
2017
and
2016
was
$0.3 million
,
$1.0 million
, and
$0.9
, respectively. There is no future expense related to the units outstanding at March 31, 2018.
Consideration Holdback
As part of the Company’s acquisition of Arbor in fiscal 2017,
$38.3 million
of the acquisition consideration otherwise payable with respect to shares of restricted Arbor common stock held by certain key employees was subject to holdback by the Company pursuant to agreements with those employees (each, a “Holdback Agreement”). The consideration holdback will vest in
30
equal, monthly increments following the date of close, subject to the Arbor key employees’ continued employment through each monthly vesting date. At each vesting date, 1/30th of the
$38.3 million
holdback consideration will vest and be settled in shares of Company common stock. The number of shares will be based on the then current market price of the Company common stock.
Total expense related to the Holdback Agreement was approximately
$15.3 million
and
$5.1 million
in fiscal 2018 and 2017, respectively. As a result,
578,071
and
184,214
shares were issued to the Arbor key employees in fiscal 2018 and fiscal 2017, respectively. Future expense for consideration holdback is expected to be approximately
$15.3 million
in fiscal
2019
and
$2.6 million
in fiscal
2020
.
Pacific Data Partners Assumed Performance Plan
In connection with the PDP acquisition in fiscal 2018, the Company assumed the outstanding performance compensation plan under the 2018 Equity Compensation Plan of Pacific Data Partners, LLC ("PDP PSU plan"). Under the PDP PSU plan, performance compensation will be paid to plan participants in
four
annual increments based on attainment of certain Connectivity B2B run rate revenue targets for the performance period covering April 1, 2018 to March 31, 2022. Each annual payout will be determined at the close of each fiscal year within the performance period, on a cumulative basis. The amount of each annual payout will be settled in shares of Company common stock. The number of shares of Company common stock issued to participants will be equal to
90%
of the annual payout divided by the volume weighted average stock price for the
20
trading days prior to, and ending on, the end of each annual performance period, plus,
10%
of the annual payout divided by the volume weighted average stock price for the
20
trading days prior to, and ending on, the date of the closing of the acquisition. Total performance attainment may result in combined payouts ranging from
zero
to
$65.0 million
.
The performance compensation paid under the PDP PSU plan will be recorded as non-cash stock-based compensation since it is attributable to post-combination service. The non-cash stock-based compensation expense will be recognized over the requisite service and performance period based on expected attainment.
90%
of the performance compensation will be settleable in a number of shares calculated using a variable 20-day stock price factor, determined in future periods, and will be classified as a liability-based equity award. As of each reporting date,
90%
of any recognized, but unpaid portions of the performance compensation plan will be recorded in other accrued expenses in the Consolidated Balance Sheet. The remaining
10%
of the performance compensation will be classified as an equity-based equity award.
F-57
Through
March 31, 2018
, the Company recognized a total of
$2.0 million
in non-cash stock-based compensation expense in the consolidated statements of operations related to the PDP PSU plan. Future expense for the PDP PSU plan is expected to be approximately
$15.8 million
in fiscal
2019
,
$15.7 million
in fiscal
2020
,
$15.8 million
in fiscal
2021
, and
$15.7 million
in fiscal
2022
, based on expectations of full attainment. At
March 31, 2018
, the recognized, but unpaid, portion balance in other accrued expenses in the Consolidated Balance Sheet was
$1.2 million
.
Qualified Employee Stock Purchase Plan
In addition to the share-based plans, the Company maintains a qualified employee stock purchase plan (“ESPP”) that permits substantially all employees to purchase shares of common stock at a discount from the market price. At
March 31, 2018
, there were approximately
0.6 million
shares available for issuance under the ESPP.
During the combined fiscal years of
2018
,
2017
, and
2016
,
275,980
shares were purchased under the plan. The total expense to the Company, representing the discount to the market price, for fiscal
2018
,
2017
and
2016
was approximately
$0.4 million
,
$0.4 million
, and
$0.2 million
, respectively.
Accumulated Other Comprehensive Income
The accumulated balances for each component of other comprehensive income was (dollars in thousands):
|
|
March 31,
|
March 31,
|
|||||
|
|
2018
|
2017
|
|||||
|
Foreign currency translation
|
$
|
10,767
|
|
$
|
7,999
|
|
|
|
|
$
|
10,767
|
|
$
|
7,999
|
|
|
13. INCOME TAXES:
Total income tax expense (benefit) was allocated as follows (dollars in thousands):
|
|
2018
|
2017
|
2016
|
||||||||
|
Earnings (loss) from continuing operations
|
$
|
(22,771
|
)
|
$
|
4,534
|
|
$
|
(11,632
|
)
|
||
|
Earnings from discontinued operations
|
—
|
|
—
|
|
3,598
|
|
|||||
|
Stockholders’ equity:
|
|
|
|
|
|
|
|||||
|
Tax shortfall (excess tax benefits) from share-based compensation
|
—
|
|
(2,183
|
)
|
293
|
|
|||||
|
|
$
|
(22,771
|
)
|
$
|
2,351
|
|
$
|
(7,741
|
)
|
||
Income tax expense (benefit) attributable to earnings (loss) from continuing operations consists of (dollars in thousands):
|
|
2018
|
2017
|
2016
|
||||||||
|
Current:
|
|
|
|
||||||||
|
U.S. Federal
|
$
|
(6,334
|
)
|
$
|
9,778
|
|
$
|
(2,410
|
)
|
||
|
Non-U.S.
|
616
|
|
472
|
|
535
|
|
|||||
|
State
|
(79
|
)
|
3,102
|
|
1,907
|
|
|||||
|
|
(5,797
|
)
|
13,352
|
|
32
|
|
|||||
|
Deferred:
|
|
|
|
|
|
|
|||||
|
U.S. Federal
|
(19,113
|
)
|
(3,680
|
)
|
(3,789
|
)
|
|||||
|
Non-U.S.
|
549
|
|
405
|
|
(3,220
|
)
|
|||||
|
State
|
1,590
|
|
(5,543
|
)
|
(4,655
|
)
|
|||||
|
|
(16,974
|
)
|
(8,818
|
)
|
(11,664
|
)
|
|||||
|
Total
|
$
|
(22,771
|
)
|
$
|
4,534
|
|
$
|
(11,632
|
)
|
||
F-58
Earnings (loss) before income tax attributable to U.S. and non-U.S. continuing operations consists of (dollars in thousands):
|
|
2018
|
2017
|
2016
|
||||||||
|
U.S.
|
$
|
(2,552
|
)
|
$
|
7,936
|
|
$
|
(6,952
|
)
|
||
|
Non-U.S.
|
3,261
|
|
706
|
|
(13,328
|
)
|
|||||
|
Total
|
$
|
709
|
|
$
|
8,642
|
|
$
|
(20,280
|
)
|
||
Earnings (loss) before income taxes, as shown above, are based on the location of the entity to which such earnings (loss) are attributable. However, since such earnings (loss) may be subject to taxation in more than one country, the income tax provision shown above as U.S. or non-U.S. may not correspond to the earnings (loss) shown above.
Below is a reconciliation of expected income tax expense (benefit) computed by applying the blended U.S. federal statutory rate of
31.5%
for fiscal 2018, and the U.S. federal statutory rate of 35.0% for fiscal 2017 and fiscal 2016, respectively, to earnings (loss) before income taxes to actual income tax expense (benefit) from continuing operations (dollars in thousands):
|
|
2018
|
2017
|
2016
|
||||||||
|
Computed expected income tax (benefit)
|
$
|
223
|
|
$
|
3,025
|
|
$
|
(7,098
|
)
|
||
|
Increase (reduction) in income taxes resulting from:
|
|
|
|
|
|
|
|||||
|
State income taxes, net of federal benefit
|
1,203
|
|
(1,586
|
)
|
(1,796
|
)
|
|||||
|
Research and other tax credits
|
(5,015
|
)
|
(2,285
|
)
|
(4,027
|
)
|
|||||
|
Effect of federal rate change on deferred taxes
|
(24,565
|
)
|
—
|
|
—
|
|
|||||
|
Nondeductible expenses
|
1,028
|
|
1,156
|
|
661
|
|
|||||
|
Acxiom Impact disposition
|
—
|
|
(4,502
|
)
|
—
|
|
|||||
|
Stock-based compensation
|
3,590
|
|
3,308
|
|
1,857
|
|
|||||
|
Non-U.S. subsidiaries taxed at other rates
|
246
|
|
614
|
|
2,468
|
|
|||||
|
Adjustment to valuation allowances
|
—
|
|
2,896
|
|
(3,585
|
)
|
|||||
|
Acquisitions costs
|
—
|
|
478
|
|
—
|
|
|||||
|
Foreign income inclusion
|
84
|
|
473
|
|
—
|
|
|||||
|
Other, net
|
435
|
|
957
|
|
(112
|
)
|
|||||
|
|
$
|
(22,771
|
)
|
$
|
4,534
|
|
$
|
(11,632
|
)
|
||
On December 22, 2017, the U.S. enacted significant tax law changes following the passage of H.R.1, “An Act to Provide for Reconciliation Pursuant to Titles II and V of the Concurrent Resolution on the Budget for Fiscal Year 2018” (the “Tax Act”) (previously known as “The Tax Cuts and Jobs Act”). The Tax Act included significant changes to existing tax law, including a permanent reduction to the U.S. federal corporate income tax rate from 35% to 21%, a one-time repatriation tax on deferred foreign income (“Transition Tax”), and numerous other changes to business-related deductions.
The permanent reduction to the U.S. federal corporate income tax rate from 35% to 21% became effective January 1, 2018 (the “Effective Date”). Because the Effective Date did not fall on the first day of our fiscal year, we are required to apply a blended tax rate for the entire fiscal year based on a weighted daily average rate. As a result of the Tax Act, our U.S. federal statutory corporate income tax rate is
31.5%
for the fiscal year ended March 31, 2018.
The Company recorded a
$24.6 million
benefit for the remeasurement of net deferred tax liabilities to reflect the reduced tax rate that will apply when these deferred taxes are settled or realized in future periods. While the Company was able to make a reasonable estimate of the impact of the reduction to the corporate tax rate, its rate may be affected by other analyses related to the Tax Act, including, but not limited to, the state tax effect of adjustments made to federal temporary differences. In addition, due to the complexity of the new global intangible low-taxed income ("GILTI") tax rules, we are continuing to evaluate this provision of the Tax Act and the application of ASC 740. Under GAAP, the Company is allowed to make an accounting policy choice to either (i) treat taxes due on future U.S. inclusions in taxable income related to GILTI as a current-period expense when incurred, or (ii) factor
F-59
in such amounts into the measurement of deferred taxes. The Company has not made a policy decision regarding whether to record deferred taxes on GILTI. We will continue to analyze the full effects of the Tax Act on our consolidated financial statements and expect to complete our analysis by our quarter ending December 31, 2018.
In fiscal 2017, the Company incurred a tax loss on the Acxiom Impact disposition, resulting in a capital loss carryforward. Based on management’s assessment of realizability, a valuation allowance was established against the related deferred tax asset. The state income tax benefit resulting from the Acxiom Impact disposition, net of related valuation allowances, is reflected above in State income taxes, net of federal benefit.
Due to changes in management’s assessment of the realizability of deferred tax assets in certain foreign jurisdictions, the Company released
$3.6 million
in valuation allowances in fiscal 2016.
The tax effects of temporary differences that give rise to significant portions of the deferred tax assets and liabilities at
March 31, 2018
and
2017
are presented below (dollars in thousands). In accordance with income tax accounting standards, as of
March 31, 2018
, the Company has not recognized deferred income taxes on approximately
$20.7 million
of undistributed earnings of foreign subsidiaries that are indefinitely reinvested outside the respective parent’s country. Calculation of the deferred income tax related to these earnings is not practicable.
|
|
2018
|
2017
|
|||||
|
Deferred tax assets:
|
|
|
|
|
|||
|
Accrued expenses
|
$
|
6,681
|
|
$
|
9,517
|
|
|
|
Deferred revenue
|
491
|
|
1,837
|
|
|||
|
Net operating loss carryforwards
|
51,068
|
|
50,414
|
|
|||
|
Stock-based compensation
|
10,884
|
|
19,854
|
|
|||
|
Nonqualified deferred compensation
|
3,217
|
|
4,672
|
|
|||
|
Capital loss carryforward
|
2,099
|
|
3,414
|
|
|||
|
Tax credit carryforwards
|
13,427
|
|
10,403
|
|
|||
|
Other
|
234
|
|
(791
|
)
|
|||
|
Total deferred tax assets
|
88,101
|
|
99,320
|
|
|||
|
Less valuation allowance
|
(49,719
|
)
|
(47,074
|
)
|
|||
|
Net deferred tax assets
|
38,382
|
|
52,246
|
|
|||
|
Deferred tax liabilities:
|
|
|
|
|
|||
|
Prepaid expenses
|
$
|
(4,111
|
)
|
$
|
(1,192
|
)
|
|
|
Capitalized software costs
|
(7,343
|
)
|
(11,582
|
)
|
|||
|
Property and equipment
|
(4,837
|
)
|
(9,800
|
)
|
|||
|
Intangible assets
|
(42,281
|
)
|
(77,785
|
)
|
|||
|
Accrued expenses
|
(7,828
|
)
|
—
|
|
|||
|
Total deferred tax liabilities
|
(66,400
|
)
|
(100,359
|
)
|
|||
|
Net deferred tax liabilities
|
$
|
(28,018
|
)
|
$
|
(48,113
|
)
|
|
At March 31, 2018, the Company has net operating loss carryforwards of approximately
$21.5 million
and
$55.4 million
for U.S. federal and state income tax purposes, respectively. Of the net operating loss carryforwards,
$4.8 million
will not expire, and the remaining carryforwards expire in various amounts and will completely expire if not used by 2037. The Company has a capital loss carryforward of
$8.3 million
, which will expire if not used by 2022. The Company has foreign net operating loss carryforwards of approximately
$142.2 million
. Of this amount,
$141.6 million
do not have expiration dates. The remainder expires in various amounts and will completely expire if not used by 2027. The Company has federal and state credit carryforwards of
$7.5 million
and
$22.7 million
, respectively. Of the credit carryforwards,
$8.5 million
will not expire, and the remainder will expire in various amounts and will completely expire if not used by 2038.
In assessing the realizability of deferred tax assets, management considers whether it is more likely than not that some portion or all of the deferred tax assets will not be realized. The ultimate realization of deferred tax assets is dependent upon the generation of future taxable income of the proper character during the periods in which those temporary differences become deductible.
F-60
Based upon the Company’s history of profitability and taxable income and the reversal of taxable temporary differences in the U.S., management believes that apart from the U.S. federal capital loss carryforward and various carryforwards in certain states it is more likely than not the Company will realize the benefits of the deductible temporary differences. The Company has established valuation allowances against
$0.9 million
of deferred tax assets related to the U.S. federal capital loss carryforward and
$4.0 million
of deferred tax assets related to loss carryforwards in the states where activity does not support the deferred tax asset.
Based upon the Company’s history of losses in certain non-U.S. jurisdictions, the Company has not recorded a benefit for current foreign losses in these jurisdictions. In addition, Management believes it is not more likely than not the Company will realize the benefits of certain foreign loss carryforwards and has established valuation allowances in the amount of
$44.8 million
against deferred tax assets in such jurisdictions.
No
valuation allowance has been established against deferred tax assets in non-U.S. jurisdictions in which historical profits and forecasted continuing profits exist. The earnings of subsidiaries in such jurisdictions and the differences in income taxes computed using the U.S. statutory tax rate and the effective tax rate in such jurisdictions are not significant.
The following table sets forth changes in the total gross unrecognized tax benefits for the fiscal years ended
March 31, 2018
,
2017
and
2016
(dollars in thousands):
|
2018
|
2017
|
2016
|
|||||||||
|
Balance at beginning of period
|
$
|
12,870
|
|
$
|
10,906
|
|
$
|
9,711
|
|
||
|
Increases related to prior year tax positions
|
1,134
|
|
307
|
|
1,717
|
|
|||||
|
Decreases related to prior year tax positions
|
(208
|
)
|
(466
|
)
|
(1,227
|
)
|
|||||
|
Increases related to current year tax positions
|
3,172
|
|
2,123
|
|
2,035
|
|
|||||
|
Settlements with taxing authorities
|
—
|
|
—
|
|
(1,330
|
)
|
|||||
|
Lapse of statute of limitations
|
(1,553
|
)
|
—
|
|
—
|
|
|||||
|
Balance at end of period
|
$
|
15,415
|
|
$
|
12,870
|
|
$
|
10,906
|
|
||
Gross unrecognized tax benefits as of March 31, 2018 was
$15.4 million
, of which up to
$12.5 million
would reduce the Company’s effective tax rate in future periods if and when realized. The Company reports accrued interest and penalties related to unrecognized tax benefits in income tax expense. The combined amount of accrued interest and penalties related to tax positions on tax returns was approximately
$0.5 million
as of March 31, 2018. There was no material change in accrued interest and penalties during fiscal 2018. The Company anticipates a reduction of
$2.3 million
of unrecognized tax benefits within the next 12 months, as a result of a lapse of the statute of limitations.
The Company files a consolidated U.S. federal income tax return and tax returns in various state and local jurisdictions. The Company’s subsidiaries also file tax returns in various foreign jurisdictions in which they operate. In the U.S., the statute of limitations for Internal Revenue Service examinations remains open for the Company’s federal income tax returns for fiscal years after 2014. The status of state and local and foreign tax examinations varies by jurisdiction. The Company does not anticipate any material adjustments to its financial statements resulting from tax examinations currently in progress.
14. RETIREMENT PLANS:
The Company has a qualified 401(k) retirement savings plan which covers substantially all U.S. employees. The Company also offers a supplemental nonqualified deferred compensation plan (“SNQDC Plan”) for certain highly-compensated employees. The Company matches
50%
of the first
6%
of employee’s annual aggregate contributions. The Company may also contribute additional amounts to the plans at the discretion of the board of directors.
Company contributions for the above plans amounted to approximately
$7.1 million
,
$6.5 million
, and
$6.1 million
in fiscal years
2018
,
2017
, and
2016
, respectively. Included in both other current assets and other accrued liabilities are the assets and liabilities of the SNQDC Plan in the amount of
$13.6 million
and
$12.7 million
at
March 31, 2018
and
2017
, respectively.
F-61
The Company has
one
small defined benefit pension plan covering certain employees in Germany. Both the projected benefit obligation and accumulated benefit obligation were
$0.4 million
as of
March 31, 2018
and
2017
, respectively. There were
no
plan assets as of either
March 31, 2018
or
March 31, 2017
, resulting in an excess of benefit obligations over plan assets of
$0.4 million
at
March 31, 2018
and
2017
, respectively.
15. FOREIGN OPERATIONS:
The Company attributes revenue to each geographic region based on the location of the Company’s operations. The following table shows financial information by geographic area for the years
2018
,
2017
and
2016
(dollars in thousands):
Revenue
|
|
2018
|
2017
|
2016
|
||||||||
|
United States
|
$
|
834,635
|
|
$
|
807,387
|
|
$
|
770,043
|
|
||
|
Foreign
|
|
|
|
|
|
|
|||||
|
Europe
|
$
|
66,589
|
|
$
|
55,427
|
|
$
|
52,562
|
|
||
|
APAC
|
16,182
|
|
17,433
|
|
25,138
|
|
|||||
|
Other
|
—
|
|
—
|
|
2,345
|
|
|||||
|
All Foreign
|
$
|
82,771
|
|
$
|
72,860
|
|
$
|
80,045
|
|
||
|
|
$
|
917,406
|
|
$
|
880,247
|
|
$
|
850,088
|
|
||
Long-lived assets excluding financial instruments (dollars in thousands):
|
|
March 31,
|
||||||
|
|
2018
|
2017
|
|||||
|
United States
|
$
|
824,673
|
|
$
|
843,127
|
|
|
|
Foreign
|
|
|
|
|
|||
|
Europe
|
$
|
8,990
|
|
$
|
9,096
|
|
|
|
APAC
|
15,245
|
|
13,796
|
|
|||
|
All Foreign
|
$
|
24,235
|
|
$
|
22,892
|
|
|
|
|
$
|
848,908
|
|
$
|
866,019
|
|
|
16. FAIR VALUE OF FINANCIAL INSTRUMENTS:
The following methods and assumptions were used to estimate the fair value of each class of financial instruments for which it is practicable to estimate that value.
Cash and cash equivalents, trade receivables, unbilled and notes receivable, short-term borrowings and trade payables - The carrying amount approximates fair value because of the short maturity of these instruments.
Long-term debt - The interest rate on the revolving credit agreement is adjusted for changes in market rates and therefore the carrying value approximates fair value. The estimated fair value of other long-term debt was determined based upon the present value of the expected cash flows considering expected maturities and using interest rates currently available to the Company for long-term borrowings with similar terms. At
March 31, 2018
, the estimated fair value of long-term debt approximates its carrying value.
Under applicable accounting standards financial assets and liabilities are classified in their entirety based on the lowest level of input that is significant to the fair value measurements. The Company assigned assets and liabilities to the hierarchy in the accounting standards, which is Level 1 - quoted prices in active markets for identical assets or liabilities, Level 2 - significant other observable inputs and Level 3 - significant unobservable inputs.
F-62
The following table presents the balances of assets measured at fair value as of
March 31, 2018
and
2017
(dollars in thousands):
|
As of March 31, 2018
|
Level 1
|
Level 2
|
Level 3
|
Total
|
|||||||||||
|
Assets:
|
|
|
|
|
|||||||||||
|
Other current assets
|
$
|
13,551
|
|
$
|
—
|
|
$
|
—
|
|
$
|
13,551
|
|
|||
|
Total assets
|
$
|
13,551
|
|
$
|
—
|
|
$
|
—
|
|
$
|
13,551
|
|
|||
|
As of March 31, 2017
|
Level 1
|
Level 2
|
Level 3
|
Total
|
|||||||||||
|
Assets:
|
|
|
|
|
|||||||||||
|
Other current assets
|
$
|
12,716
|
|
$
|
—
|
|
$
|
—
|
|
$
|
12,716
|
|
|||
|
Total assets
|
$
|
12,716
|
|
$
|
—
|
|
$
|
—
|
|
$
|
12,716
|
|
|||
17. SEGMENT INFORMATION:
The Company reports segment information consistent with the way management internally disaggregates its operations to assess performance and to allocate resources.
Revenues and cost of revenue are generally directly attributed to the segments. Certain revenue contracts are allocated among the segments based on the relative value of the underlying products and services. Cost of revenue, excluding non-cash stock compensation expense and purchased intangible asset amortization, is directly charged in most cases and allocated in certain cases based upon proportional usage.
Operating expenses, excluding non-cash stock compensation expense and purchased intangible asset amortization, are attributed to the segment groups as follows:
|
•
|
Research and development expenses are primarily directly recorded to each segment group based on identified products supported.
|
|
•
|
Sales and marketing expenses are primarily directly recorded to each segment group based on products supported and sold.
|
|
•
|
General and administrative expenses are generally not allocated to the segments unless directly attributable.
|
|
•
|
Gains, losses and other items, net are not allocated to the segment groups.
|
We do not track our assets by operating segments. Consequently, it is not practical to show assets by operating segment.
F-63
The following table presents information by business segment (dollars in thousands):
|
|
2018
|
2017
|
2016
|
||||||||
|
Revenues:
|
|
|
|
||||||||
|
Marketing Services
|
$
|
379,047
|
|
$
|
410,840
|
|
$
|
449,772
|
|
||
|
Audience Solutions
|
327,358
|
|
322,065
|
|
297,846
|
|
|||||
|
Connectivity
|
211,001
|
|
147,342
|
|
102,470
|
|
|||||
|
Total segment revenues
|
$
|
917,406
|
|
$
|
880,247
|
|
$
|
850,088
|
|
||
|
Gross profit
(1)
:
|
|
|
|
|
|
|
|||||
|
Marketing Services
|
$
|
139,185
|
|
$
|
140,647
|
|
$
|
152,258
|
|
||
|
Audience Solutions
|
202,235
|
|
198,186
|
|
167,715
|
|
|||||
|
Connectivity
|
140,885
|
|
88,251
|
|
61,199
|
|
|||||
|
Total segment gross profit
|
$
|
482,305
|
|
$
|
427,084
|
|
$
|
381,172
|
|
||
|
Income from operations
(1)
:
|
|
|
|
|
|
|
|||||
|
Marketing Services
|
$
|
83,304
|
|
$
|
80,622
|
|
$
|
74,371
|
|
||
|
Audience Solutions
|
124,192
|
|
123,238
|
|
109,598
|
|
|||||
|
Connectivity
|
18,399
|
|
5,333
|
|
(3,298
|
)
|
|||||
|
Total segment income from operations
|
$
|
225,895
|
|
$
|
209,193
|
|
$
|
180,671
|
|
||
|
Depreciation and amortization:
|
|
|
|
|
|
|
|||||
|
Marketing Services
|
$
|
6,885
|
|
$
|
7,549
|
|
$
|
9,988
|
|
||
|
Audience Solutions
|
12,553
|
|
13,286
|
|
12,909
|
|
|||||
|
Connectivity
|
28,772
|
|
21,906
|
|
19,932
|
|
|||||
|
Total depreciation and amortization
|
$
|
48,210
|
|
$
|
42,741
|
|
$
|
42,829
|
|
||
|
(1)
|
Gross profit and Income from operations reflect only the direct and allocable controllable costs of each segment and do not include allocations of corporate expenses (primarily general and administrative expenses) and gains, losses, and other items, net. Additionally, gross profit and income from operations do not include non-cash stock compensation expense and purchased intangible asset amortization.
|
The following table reconciles total segment gross profit to gross profit and total segment income from operations to income from operations (dollars in thousands):
|
|
2018
|
2017
|
2016
|
||||||||
|
Total segment gross profit
|
$
|
482,305
|
|
$
|
427,084
|
|
$
|
381,172
|
|
||
|
Less:
|
|
|
|
||||||||
|
Purchased intangible asset amortization
|
23,920
|
|
18,644
|
|
15,466
|
|
|||||
|
Non-cash stock compensation
|
6,416
|
|
5,879
|
|
2,150
|
|
|||||
|
Accelerated amortization
|
999
|
|
—
|
|
1,850
|
|
|||||
|
Gross profit
|
$
|
450,970
|
|
$
|
402,561
|
|
$
|
361,706
|
|
||
|
Total segment income from operations
|
$
|
225,895
|
|
$
|
209,193
|
|
$
|
180,671
|
|
||
|
Less:
|
|
|
|
||||||||
|
Corporate expenses (principally general and administrative)
|
120,770
|
|
117,342
|
|
125,994
|
|
|||||
|
Gains, losses and other items, net
|
6,373
|
|
8,373
|
|
12,132
|
|
|||||
|
Impairment of goodwill and other
|
—
|
|
—
|
|
6,829
|
|
|||||
|
Purchased intangible asset amortization
|
23,920
|
|
18,644
|
|
15,466
|
|
|||||
|
Non-cash stock compensation
|
63,234
|
|
49,145
|
|
31,463
|
|
|||||
|
Accelerated amortization
|
999
|
|
—
|
|
1,850
|
|
|||||
|
Income (loss) from operations
|
$
|
10,599
|
|
$
|
15,689
|
|
$
|
(13,063
|
)
|
||
F-64
18. UNAUDITED SELECTED QUARTERLY FINANCIAL DATA:
The following tables contain selected unaudited statement of operations information for each quarter of 2018 and 2017. The following information reflects all normal recurring adjustments necessary for a fair presentation of the information for the periods presented. The operating results for any quarter are not necessarily indicative of results for any future period. Unaudited quarterly results are as follows:
|
|
Quarter ended
|
Quarter ended
|
Quarter ended
|
Quarter ended
|
|||||||||||
|
|
June 30,
|
September 30,
|
December 31,
|
March 31,
|
|||||||||||
|
(dollars in thousands except per-share amounts)
|
2017
|
2017
|
2017
|
2018
|
|||||||||||
|
Revenue
|
$
|
212,514
|
|
$
|
225,240
|
|
$
|
234,871
|
|
$
|
244,781
|
|
|||
|
Gross profit
|
98,554
|
|
110,168
|
|
118,951
|
|
123,297
|
|
|||||||
|
Income (loss) from operations
|
(5,707
|
)
|
453
|
|
11,058
|
|
4,795
|
|
|||||||
|
Net earnings (loss)
|
(1,300
|
)
|
(3,336
|
)
|
22,941
|
|
5,175
|
|
|||||||
|
Basic earnings (loss) per share:
|
|
|
|
|
|
|
|
|
|||||||
|
Net earnings (loss)
|
(0.02
|
)
|
(0.04
|
)
|
0.29
|
|
0.07
|
|
|||||||
|
Diluted earnings (loss) per share:
|
|
|
|
|
|
|
|
|
|||||||
|
Net earnings (loss)
|
(0.02
|
)
|
(0.04
|
)
|
0.28
|
|
0.06
|
|
|||||||
|
|
Quarter ended
|
Quarter ended
|
Quarter ended
|
Quarter ended
|
|||||||||||
|
|
June 30,
|
September 30,
|
December 31,
|
March 31,
|
|||||||||||
|
(dollars in thousands except per-share amounts)
|
2016
|
2016
|
2016
|
2017
|
|||||||||||
|
Revenue
|
$
|
214,801
|
|
$
|
217,267
|
|
$
|
223,312
|
|
$
|
224,867
|
|
|||
|
Gross profit
|
91,982
|
|
97,162
|
|
106,844
|
|
106,573
|
|
|||||||
|
Income (loss) from operations
|
8,162
|
|
7,120
|
|
9,115
|
|
(8,709
|
)
|
|||||||
|
Net earnings (loss)
|
3,976
|
|
7,140
|
|
1,073
|
|
(8,081
|
)
|
|||||||
|
Basic earnings (loss) per share:
|
|
|
|
|
|
|
|
|
|||||||
|
Net earnings (loss)
|
0.05
|
|
0.09
|
|
0.01
|
|
(0.10
|
)
|
|||||||
|
Diluted earnings (loss) per share:
|
|
|
|
|
|
|
|
|
|||||||
|
Net earnings (loss)
|
0.05
|
|
0.09
|
|
0.01
|
|
(0.10
|
)
|
|||||||
Some earnings (loss) per share amounts may not add due to rounding.
F-65
TABLE OF CONTENTS
Part IItem 1. BusinessItem 1A. Risk FactorsItem 1B. Unresolved Staff CommentsItem 2. PropertiesItem 3. Legal ProceedingsItem 4. Mine Safety DisclosuresPart IIItem 5. Market For Registrant's Common Equity, Related Stockholder Matters and Issuer Purchases Of Equity SecuritiesItem 6. Selected Financial DataItem 7. Management's Discussion and Analysis Of Financial Condition and Results Of OperationsItem 7A. Quantitative and Qualitative Disclosures About Market RiskItem 8. Financial Statements and Supplementary DataItem 9. Changes in and Disagreements with Accountants on Accounting and Financial DisclosureItem 9A. Controls and ProceduresItem 9B. Other InformationPart IIIItem 10. Directors, Executive Officers and Corporate GovernanceItem 11. Executive CompensationItem 12. Security Ownership Of Certain Beneficial Owners and Management and Related Stockholder MattersItem 13. Certain Relationships and Related Transactions, and Director IndependenceItem 14. Principal Accountant Fees and ServicesPart IVItem 15. Exhibits, Financial Statement Schedules