LIVERAMP HOLDINGS, INC.
10-Ks and 10-Qs
|
|
|
|
|
|
|
|
|
|
|
|
|
|
|
|
|
|
|
|
|
|
|
|
|
|
|
|
|
|
|
|
|
|
|
|
|
|
|
|
|
|
|
|
|
|
|
|
|
|
|
|
|
|
|
|
|
|
|
UNITED STATES
SECURITIES AND EXCHANGE COMMISSION
Washington, D.C. 20549
FORM 10-Q
(Mark One)
|
[X]
|
QUARTERLY REPORT PURSUANT TO SECTION 13 OR 15(d) OF THE SECURITIES EXCHANGE ACT OF 1934
|
For the quarterly period ended
December 31, 2017
OR
|
[ ]
|
TRANSITION REPORT PURSUANT TO SECTION 13 OR 15(d) OF THE SECURITIES EXCHANGE ACT OF 1934
|
For the transition period from ----- to -----
Commission file number 0-13163
|
Acxiom Corporation
|
|
|
(Exact Name of Registrant as Specified in Its Charter)
|
|
|
|
|
|
DELAWARE
(State or Other Jurisdiction of
Incorporation or Organization)
|
71-0581897
(I.R.S. Employer
Identification No.)
|
|
|
|
|
301 E. Dave Ward Drive
Conway, Arkansas
(Address of Principal Executive Offices)
|
72032
(Zip Code)
|
|
|
|
|
(501) 342-1000
(Registrant's Telephone Number, Including Area Code)
|
|
Indicate by check mark whether the registrant: (1) has filed all reports required to be filed by Section 13 or 15(d) of the Securities Exchange Act of 1934 during the preceding 12 months (or for such shorter period that the registrant was required to file such reports), and (2) has been subject to such filing requirements for the past 90 days.
Yes [X] No [ ]
Indicate by check mark whether the registrant has submitted electronically and posted on its corporate Web site, if any, every Interactive Data File required to be submitted and posted pursuant to Rule 405 of Regulation S-T (§232.405 of this chapter) during the preceding 12 months (or for such shorter period that the registrant was required to submit and post such files).
Yes [X] No [ ]
Indicate by check mark whether the registrant is a large accelerated filer, an accelerated filer, a non-accelerated filer or a smaller reporting company. See the definitions of “large accelerated filer,” “accelerated filer,” “smaller reporting company” and "emerging growth company" in Rule 12b-2 of the Exchange Act.
|
Large accelerated filer [X]
|
Accelerated filer [ ]
|
|
|
|
|
Non-accelerated filer [ ]
|
Smaller reporting company [ ]
|
|
(Do not check if a smaller reporting company)
|
Emerging growth company [ ]
|
If an emerging growth company, indicate by check mark if the registrant has elected not to use the extended transition period for complying with any new or revised financial accounting standards provided pursuant to Section 13(a) of the Exchange Act. [ ]
Indicate by check mark whether the registrant is a shell company (as defined in Rule 12b-2 of the Exchange Act).
Yes [ ] No [X]
The number of shares of common stock, $ 0.10 par value per share, outstanding as of
February 2, 2018
was
79,100,637
.
ACXIOM CORPORATION AND SUBSIDIARIES
INDEX
REPORT ON FORM 10-Q
December 31, 2017
|
Page No.
|
||
|
|
||
|
|
||
|
|
||
|
|
||
|
|
||
|
|
||
|
|
||
|
|
||
|
|
||
|
|
|
|
|
|
||
|
|
|
|
2
ACXIOM CORPORATION AND SUBSIDIARIES
CONDENSED CONSOLIDATED BALANCE SHEETS
(Dollars in thousands)
|
|
December 31,
2017 |
March 31,
2017 |
||||||
|
ASSETS
|
(Unaudited)
|
|
|
|||||
|
Current assets:
|
|
|
|
|
||||
|
Cash and cash equivalents
|
$
|
177,807
|
|
$
|
170,343
|
|
||
|
Trade accounts receivable, net
|
155,634
|
|
142,768
|
|
||||
|
Refundable income taxes
|
6,365
|
|
7,098
|
|
||||
|
Other current assets
|
42,357
|
|
48,310
|
|
||||
|
Total current assets
|
382,163
|
|
368,519
|
|
||||
|
Property and equipment, net of accumulated depreciation and amortization
|
153,039
|
|
155,974
|
|
||||
|
Software, net of accumulated amortization
|
37,489
|
|
47,638
|
|
||||
|
Goodwill
|
592,827
|
|
592,731
|
|
||||
|
Purchased software licenses, net of accumulated amortization
|
7,775
|
|
7,972
|
|
||||
|
Deferred income taxes
|
9,621
|
|
10,261
|
|
||||
|
Other assets, net
|
43,576
|
|
51,443
|
|
||||
|
|
$
|
1,226,490
|
|
$
|
1,234,538
|
|
||
|
LIABILITIES AND EQUITY
|
|
|
|
|
||||
|
Current liabilities:
|
|
|
|
|
||||
|
Current installments of long-term debt
|
$
|
1,837
|
|
$
|
39,819
|
|
||
|
Trade accounts payable
|
46,211
|
|
40,208
|
|
||||
|
Accrued payroll and related expenses
|
36,592
|
|
53,238
|
|
||||
|
Other accrued expenses
|
53,999
|
|
59,861
|
|
||||
|
Deferred revenue
|
34,169
|
|
37,087
|
|
||||
|
Total current liabilities
|
172,808
|
|
230,213
|
|
||||
|
Long-term debt
|
227,943
|
|
189,241
|
|
||||
|
Deferred income taxes
|
34,300
|
|
58,374
|
|
||||
|
Other liabilities
|
17,328
|
|
17,730
|
|
||||
|
Commitments and contingencies
|
|
|
|
|
||||
|
Equity:
|
|
|
|
|
||||
|
Common stock
|
13,552
|
|
13,288
|
|
||||
|
Additional paid-in capital
|
1,216,565
|
|
1,154,429
|
|
||||
|
Retained earnings
|
623,156
|
|
602,609
|
|
||||
|
Accumulated other comprehensive income
|
9,826
|
|
7,999
|
|
||||
|
Treasury stock, at cost
|
(1,088,988
|
)
|
(1,039,345
|
)
|
||||
|
Total equity
|
774,111
|
|
738,980
|
|
||||
|
|
$
|
1,226,490
|
|
$
|
1,234,538
|
|
||
See accompanying notes to condensed consolidated financial statements.
3
ACXIOM CORPORATION AND SUBSIDIARIES
CONDENSED CONSOLIDATED STATEMENTS OF OPERATIONS
(Unaudited)
(Dollars in thousands, except per share amounts)
|
|
For the three months ended
|
|||||||
|
|
December 31,
|
|||||||
|
|
2017
|
2016
|
||||||
|
Revenues
|
$
|
234,871
|
|
$
|
223,312
|
|
||
|
Cost of revenue
|
115,920
|
|
116,468
|
|
||||
|
Gross profit
|
118,951
|
|
106,844
|
|
||||
|
Operating expenses:
|
|
|
||||||
|
Research and development
|
23,318
|
|
20,950
|
|
||||
|
Sales and marketing
|
53,730
|
|
43,048
|
|
||||
|
General and administrative
|
30,886
|
|
31,620
|
|
||||
|
Gains, losses and other items, net
|
(41
|
)
|
2,111
|
|
||||
|
Total operating expenses
|
107,893
|
|
97,729
|
|
||||
|
Income from operations
|
11,058
|
|
9,115
|
|
||||
|
Other income (expense):
|
|
|
||||||
|
Interest expense
|
(2,566
|
)
|
(1,743
|
)
|
||||
|
Other, net
|
419
|
|
35
|
|
||||
|
Total other expense
|
(2,147
|
)
|
(1,708
|
)
|
||||
|
Income before income taxes
|
8,911
|
|
7,407
|
|
||||
|
Income taxes (benefit)
|
(14,030
|
)
|
6,334
|
|
||||
|
Net earnings
|
$
|
22,941
|
|
$
|
1,073
|
|
||
|
Basic earnings per share
|
$
|
0.29
|
|
$
|
0.01
|
|
||
|
Diluted earnings per share
|
$
|
0.28
|
|
$
|
0.01
|
|
||
See accompanying notes to condensed consolidated financial statements.
4
ACXIOM CORPORATION AND SUBSIDIARIES
CONDENSED CONSOLIDATED STATEMENTS OF OPERATIONS
(Unaudited)
(Dollars in thousands, except per share amounts)
|
|
For the nine months ended
|
|||||||
|
|
December 31,
|
|||||||
|
|
2017
|
2016
|
||||||
|
Revenues
|
$
|
672,625
|
|
$
|
655,380
|
|
||
|
Cost of revenue
|
344,952
|
|
359,392
|
|
||||
|
Gross profit
|
327,673
|
|
295,988
|
|
||||
|
Operating expenses:
|
|
|
||||||
|
Research and development
|
70,894
|
|
58,631
|
|
||||
|
Sales and marketing
|
152,288
|
|
118,243
|
|
||||
|
General and administrative
|
95,166
|
|
91,993
|
|
||||
|
Gains, losses and other items, net
|
3,521
|
|
2,724
|
|
||||
|
Total operating expenses
|
321,869
|
|
271,591
|
|
||||
|
Income from operations
|
5,804
|
|
24,397
|
|
||||
|
Other income (expense):
|
|
|
||||||
|
Interest expense
|
(7,432
|
)
|
(5,244
|
)
|
||||
|
Other, net
|
(61
|
)
|
135
|
|
||||
|
Total other expense
|
(7,493
|
)
|
(5,109
|
)
|
||||
|
Income (loss) before income taxes
|
(1,689
|
)
|
19,288
|
|
||||
|
Income taxes (benefit)
|
(19,994
|
)
|
7,099
|
|
||||
|
Net earnings
|
$
|
18,305
|
|
$
|
12,189
|
|
||
|
Basic earnings per share
|
$
|
0.23
|
|
$
|
0.16
|
|
||
|
Diluted earnings per share
|
$
|
0.22
|
|
$
|
0.15
|
|
||
See accompanying notes to condensed consolidated financial statements.
5
ACXIOM CORPORATION AND SUBSIDIARIES
CONDENSED CONSOLIDATED STATEMENTS OF COMPREHENSIVE INCOME
(Unaudited)
(Dollars in thousands)
|
|
For the three months ended
|
|||||||
|
|
December 31,
|
|||||||
|
|
2017
|
2016
|
||||||
|
Net earnings
|
$
|
22,941
|
|
$
|
1,073
|
|
||
|
Other comprehensive income:
|
|
|
||||||
|
Change in foreign currency translation adjustment
|
416
|
|
(1,340
|
)
|
||||
|
Unrealized gain on interest rate swap
|
—
|
|
21
|
|
||||
|
Other comprehensive income
|
416
|
|
(1,319
|
)
|
||||
|
Comprehensive income
|
$
|
23,357
|
|
$
|
(246
|
)
|
||
See accompanying notes to condensed consolidated financial statements.
6
ACXIOM CORPORATION AND SUBSIDIARIES
CONDENSED CONSOLIDATED STATEMENTS OF COMPREHENSIVE INCOME
(Unaudited)
(Dollars in thousands)
|
|
For the nine months ended
|
|||||||
|
|
December 31,
|
|||||||
|
|
2017
|
2016
|
||||||
|
Net earnings
|
$
|
18,305
|
|
$
|
12,189
|
|
||
|
Other comprehensive income (loss):
|
|
|
||||||
|
Change in foreign currency translation adjustment
|
1,827
|
|
(2,410
|
)
|
||||
|
Unrealized gain on interest rate swap
|
—
|
|
117
|
|
||||
|
Other comprehensive income (loss)
|
1,827
|
|
(2,293
|
)
|
||||
|
Comprehensive income
|
$
|
20,132
|
|
$
|
9,896
|
|
||
See accompanying notes to condensed consolidated financial statements.
7
ACXIOM CORPORATION AND SUBSIDIARIES
CONDENSED CONSOLIDATED STATEMENT OF EQUITY
NINE MONTHS ENDED
DECEMBER 31, 2017
(Unaudited)
(Dollars in thousands)
|
|
|
|
|
|
Accumulated
|
|
|
|
||||||||||||||||||||||
|
|
Common Stock
|
Additional
|
|
other
|
Treasury Stock
|
|
||||||||||||||||||||||||
|
|
Number
|
|
paid-in
|
Retained
|
comprehensive
|
Number
|
|
Total
|
||||||||||||||||||||||
|
|
of shares
|
Amount
|
Capital
|
earnings
|
income
|
of shares
|
Amount
|
Equity
|
||||||||||||||||||||||
|
Balances at March 31, 2017
|
132,875,373
|
|
$
|
13,288
|
|
$
|
1,154,429
|
|
$
|
602,609
|
|
$
|
7,999
|
|
(54,582,392
|
)
|
$
|
(1,039,345
|
)
|
$
|
738,980
|
|
||||||||
|
Cumulative-effect adjustment from adoption of ASU 2016-09
|
—
|
|
—
|
|
384
|
|
2,242
|
|
—
|
|
—
|
|
—
|
|
$
|
2,626
|
|
|||||||||||||
|
Employee stock awards, benefit plans and other issuances
|
805,768
|
|
80
|
|
15,229
|
|
—
|
|
—
|
|
(389,912
|
)
|
(10,202
|
)
|
$
|
5,107
|
|
|||||||||||||
|
Non-cash stock-based compensation
|
487,385
|
|
49
|
|
46,658
|
|
—
|
|
—
|
|
—
|
|
—
|
|
$
|
46,707
|
|
|||||||||||||
|
Restricted stock units vested
|
1,351,652
|
|
135
|
|
(135
|
)
|
—
|
|
—
|
|
—
|
|
—
|
|
$
|
—
|
|
|||||||||||||
|
Acquisition of treasury stock
|
—
|
|
—
|
|
—
|
|
—
|
|
—
|
|
(1,588,964
|
)
|
(39,441
|
)
|
$
|
(39,441
|
)
|
|||||||||||||
|
Comprehensive income:
|
|
|
|
|
|
|
|
|
|
|
|
|
|
|
|
|
||||||||||||||
|
Foreign currency translation
|
—
|
|
—
|
|
—
|
|
—
|
|
1,827
|
|
—
|
|
—
|
|
$
|
1,827
|
|
|||||||||||||
|
Net earnings
|
—
|
|
—
|
|
—
|
|
18,305
|
|
—
|
|
—
|
|
—
|
|
$
|
18,305
|
|
|||||||||||||
|
Balances at December 31, 2017
|
135,520,178
|
|
$
|
13,552
|
|
$
|
1,216,565
|
|
$
|
623,156
|
|
$
|
9,826
|
|
(56,561,268
|
)
|
$
|
(1,088,988
|
)
|
$
|
774,111
|
|
||||||||
See accompanying notes to condensed consolidated financial statements
8
ACXIOM CORPORATION AND SUBSIDIARIES
CONDENSED CONSOLIDATED STATEMENTS OF CASH FLOWS
(Unaudited)
(Dollars in thousands)
|
|
For the nine months ended
|
|||||||
|
December 31,
|
||||||||
|
|
2017
|
2016
|
||||||
|
Cash flows from operating activities:
|
|
|
||||||
|
Net earnings
|
$
|
18,305
|
|
$
|
12,189
|
|
||
|
Adjustments to reconcile net earnings to net cash provided by operating activities:
|
|
|
|
|
||||
|
Depreciation and amortization
|
63,719
|
|
61,097
|
|
||||
|
Loss (gain) on disposal or impairment of assets
|
2,646
|
|
(520
|
)
|
||||
|
Accelerated deferred debt costs
|
720
|
|
—
|
|
||||
|
Deferred income taxes
|
(20,451
|
)
|
(1,982
|
)
|
||||
|
Non-cash stock compensation expense
|
46,707
|
|
33,955
|
|
||||
|
Changes in operating assets and liabilities:
|
|
|
||||||
|
Accounts receivable, net
|
(11,432
|
)
|
(6,161
|
)
|
||||
|
Other assets
|
(1,277
|
)
|
8,653
|
|
||||
|
Accounts payable and other liabilities
|
(18,232
|
)
|
(11,819
|
)
|
||||
|
Deferred revenue
|
(4,314
|
)
|
(10,247
|
)
|
||||
|
Net cash provided by operating activities
|
76,391
|
|
85,165
|
|
||||
|
Cash flows from investing activities:
|
|
|
|
|
||||
|
Capitalized software development costs
|
(10,332
|
)
|
(11,171
|
)
|
||||
|
Capital expenditures
|
(26,950
|
)
|
(30,096
|
)
|
||||
|
Data acquisition costs
|
(621
|
)
|
(463
|
)
|
||||
|
Equity investments
|
(1,000
|
)
|
—
|
|
||||
|
Net cash received from disposition
|
4,000
|
|
16,988
|
|
||||
|
Net cash paid in acquisitions
|
—
|
|
(137,383
|
)
|
||||
|
Net cash used in investing activities
|
(34,903
|
)
|
(162,125
|
)
|
||||
|
Cash flows from financing activities:
|
|
|
|
|
||||
|
Proceeds from debt
|
230,000
|
|
70,000
|
|
||||
|
Payments of debt
|
(226,732
|
)
|
(24,173
|
)
|
||||
|
Fees for debt refinancing
|
(4,001
|
)
|
—
|
|
||||
|
Sale of common stock, net of stock acquired for withholding taxes
|
5,107
|
|
9,670
|
|
||||
|
Excess tax benefits from stock-based compensation
|
—
|
|
1,785
|
|
||||
|
Acquisition of treasury stock
|
(39,441
|
)
|
(30,542
|
)
|
||||
|
Net cash provided by (used) in financing activities
|
(35,067
|
)
|
26,740
|
|
||||
|
Effect of exchange rate changes on cash
|
1,043
|
|
(1,559
|
)
|
||||
|
Net change in cash and cash equivalents
|
7,464
|
|
(51,779
|
)
|
||||
|
Cash and cash equivalents at beginning of period
|
170,343
|
|
189,629
|
|
||||
|
Cash and cash equivalents at end of period
|
$
|
177,807
|
|
$
|
137,850
|
|
||
See accompanying notes to condensed consolidated financial statements.
9
ACXIOM CORPORATION AND SUBSIDIARIES
CONDENSED CONSOLIDATED STATEMENTS OF CASH FLOWS (Continued)
(Unaudited)
(Dollars in thousands)
|
|
For the nine months ended
|
|||||||
|
December 31,
|
||||||||
|
|
2017
|
2016
|
||||||
|
Supplemental cash flow information:
|
|
|
|
|
||||
|
Cash paid during the period for:
|
|
|
|
|
||||
|
Interest
|
$
|
6,712
|
|
$
|
5,301
|
|
||
|
Income taxes, net of refunds
|
1,152
|
|
4,796
|
|
||||
|
Non-cash investing and financing activities:
|
||||||||
|
Leasehold improvements paid directly by lessor
|
978
|
|
—
|
|
||||
See accompanying notes to condensed consolidated financial statements.
10
ACXIOM CORPORATION AND SUBSIDIARIES
NOTES TO CONDENSED CONSOLIDATED FINANCIAL STATEMENTS
(Unaudited)
1. BASIS OF PRESENTATION AND SUMMARY OF SIGNIFICANT ACCOUNTING POLICIES:
These condensed consolidated financial statements have been prepared by Acxiom Corporation (“Registrant,” “Acxiom,” we, us or the “Company”), without audit, pursuant to the rules and regulations of the Securities and Exchange Commission (the “SEC” or the “Commission”). In the opinion of the Registrant’s management, all adjustments necessary for a fair presentation of the results for the periods included have been made, and the disclosures are adequate to make the information presented not misleading. All such adjustments are of a normal recurring nature. Certain note information has been omitted because it has not changed significantly from that reflected in Notes 1 through 19 of the Notes to Consolidated Financial Statements filed as part of Item 8 of the Registrant’s annual report on Form 10-K for the fiscal year ended March 31, 2017 (“2017 Annual Report”), as filed with the Commission on May 26, 2017. This quarterly report and the accompanying condensed consolidated financial statements should be read in connection with the 2017 Annual Report. The financial information contained in this quarterly report is not necessarily indicative of the results to be expected for any other period or for the full fiscal year ending March 31, 2018.
Management of the Company has made a number of estimates and assumptions relating to the reporting of assets and liabilities and the disclosure of contingent assets and liabilities to prepare these condensed consolidated financial statements in conformity with accounting principles generally accepted in the United States (“U.S. GAAP”). Actual results could differ from those estimates. Certain of the accounting policies used in the preparation of these condensed consolidated financial statements are complex and require management to make judgments and/or significant estimates regarding amounts reported or disclosed in these financial statements. Additionally, the application of certain of these accounting policies is governed by complex accounting principles and their interpretation. A discussion of the Company’s significant accounting principles and their application is included in Note 1 of the Notes to Consolidated Financial Statements and in Item 7, Management’s Discussion and Analysis of Financial Condition and Results of Operations, of the Company’s 2017 Annual Report.
Accounting Pronouncements Adopted During the Current Year
In January 2017, the Financial Accounting Standards Board ("FASB") issued Accounting Standards Update ("ASU") No. 2017-01, "Business Combinations (Topic 805): Clarifying the Definition of a Business" ("ASU 2017-01"), which amended the existing FASB Accounting Standards Codification. The standard provides additional guidance to assist entities with evaluation of whether transactions should be accounted for as acquisitions (or disposals) of assets or businesses. The definition of a business affects many areas of accounting, including acquisitions, disposals, goodwill, and consolidation. ASU 2017-01 is effective for the Company beginning in fiscal 2019, with early adoptions permitted. We adopted the standard in the current fiscal year, on a prospective basis, and do not expect the adoption of this guidance to have a material impact on our condensed consolidated financial statements and related disclosures.
In November 2016, the FASB issued ASU 2016-18, "Statement of Cash Flows (Topic 230): Restricted Cash" ("ASU 2016-18"). This standard is intended to reduce diversity in the presentation of restricted cash and restricted cash equivalents in the statement of cash flows. The standard requires that restricted cash and restricted cash equivalents be included as components of total cash and cash equivalents as presented on the statement of cash flows. As a result, entities will no longer present transfers between cash and cash equivalents and restricted cash and restricted cash equivalents in the statement of cash flows. ASU 2016-18 is effective for annual periods beginning after December 15, 2017 (fiscal 2019 for the Company), including interim periods within those fiscal years; earlier adoption is permitted. We adopted the standard during the current fiscal year. Early adoption did not result in any changes to our existing accounting policies, presentation of items in our condensed consolidated financial statements and related disclosures, or any changes resulting from the retrospective application to all periods reported.
In March 2016, the FASB issued ASU No. 2016-09, "Compensation - Stock Compensation (Topic 718): Improvements to Employee Share-Based Payment Accounting" ("ASU 2016-09"), which is intended to improve the accounting for stock-based payment transactions as part of the FASB's simplification initiative. The ASU changes five aspects of the accounting for stock-based payment award transactions that will affect public companies,
11
including: (1) accounting for income taxes; (2) classification of excess tax benefits on the statement of cash flows; (3) forfeitures; (4) minimum statutory tax withholding requirements; and (5) classification of employee taxes paid on the statement of cash flows when an employer withholds shares for tax-withholding purposes. The inclusion of excess tax benefits and deficiencies as a component of income tax expense will increase volatility within our provision for income taxes as the amount of excess tax benefits or deficiencies from stock-based compensation awards depends on our stock price at the date the awards vest or the date of option exercises. This guidance also requires excess tax benefits to be presented as an operating activity on the statement of cash flows and allows an entity to make an accounting policy election to either estimate expected forfeitures or to account for them as they occur.
We adopted ASU No. 2016-09 during the current fiscal year, which required us to reflect any adjustments as of April 1, 2017. We elected to account for forfeitures as they occur rather than estimating expected forfeitures. We recorded the cumulative impact of adoption through an increase in retained earnings of
$2.2 million
, of which
$2.6 million
related to deferred tax assets from certain federal and state research tax credit carryforwards attributable to excess tax benefits from stock-based compensation that had not been previously recognized, offset by
$0.4 million
related to elimination of the forfeiture pool. We elected to prospectively adopt the effect on the statement of cash flows and accordingly, did not restate the Condensed Consolidated Statement of Cash Flows for the
nine months ended
December 31, 2016
.
Recent Accounting Pronouncements Not Yet Adopted
In January 2017, the FASB issued ASU 2017-04, "Intangibles-Goodwill and Other (Topic 350): Simplifying the Test for Goodwill Impairment" ("ASU 2017-04"), which eliminates step two from the goodwill impairment test. Under ASU 2017-04, an entity should recognize an impairment charge for the amount by which the carrying amount of a reporting unit exceeds its fair value; however, the loss recognized should not exceed the total amount of goodwill allocated to that reporting unit. ASU 2017-04 is effective for annual periods beginning after December 15, 2019 (fiscal 2021 for the Company), including interim periods within those fiscal years; earlier adoption is permitted for goodwill impairment tests performed on testing dates after January 1, 2017. The Company does not expect the adoption of this guidance to have a material impact on its consolidated financial statements and related disclosures.
In February 2016, the FASB issued ASU No. 2016-02, "Leases (Topic 842)" ("ASU 2016-02"), as a comprehensive new standard that amends various aspects of existing guidance for leases and requires additional disclosures about leasing arrangements. The new standard will require lessees to recognize a right-of-use asset and a lease liability on the balance sheet for all leases with the exception of short-term leases. For lessees, leases will continue to be classified as either operating or finance in the income statement. Lessor accounting is similar to the current model but updated to align with certain changes to the lessee model. Lessors will continue to classify leases as operating, direct financing or sales-type leases. ASU 2016-02 is effective for annual periods beginning after December 15, 2018 (fiscal 2020 for the Company), including interim periods within those fiscal years. Earlier adoption is permitted. In the financial statements in which the ASU is first applied, leases shall be measured and recognized at the beginning of the earliest comparative period presented with an adjustment to equity. The Company is continuing to evaluate the impact of the adoption of this guidance on its consolidated financial statements and related disclosures.
In May 2014, the FASB issued update ASU 2014-09, "Revenue from Contracts with Customers (Topic 606)" ("ASU 2014-09") and issued subsequent amendments to the initial guidance in August 2015, March 2016, April 2016, May 2016, and December 2016 within ASU 2015-14, ASU 2016-08, ASU 2016-10, ASU 2016-12 and ASU 2016-20, respectively (ASU 2014-09 and the subsequent amendments, collectively, "Topic 606"). Topic 606 supersedes nearly all existing revenue recognition guidance under U.S. GAAP. The core principle of the new guidance is to recognize revenues when promised goods or services are transferred to customers in an amount that reflects the consideration that is expected to be received for those goods or services. The guidance defines a five-step process to achieve this core principle and, in doing so, it is possible more judgment and estimates may be required within the revenue recognition process than are required under existing U.S. GAAP, including identifying performance obligations in the contract, estimating the amount of variable consideration to include in the transaction price and allocating the transaction price to each separate performance obligation, among others. Topic 606 also provides guidance on the recognition of costs related to obtaining customer contracts. The effective date for the Company is the first quarter of fiscal 2019 using either of two methods: (i) retrospective application to each prior reporting period presented with the option to elect certain practical expedients; or (ii) retrospective application with the cumulative effect recognized at the date of initial application and providing certain additional disclosures. The Company has completed its preliminary assessment of the new standard and is continuing assessment as we complete
12
implementation design activities. We plan to adopt Topic 606 in the first quarter of fiscal 2019 pursuant to the aforementioned adoption method (ii), and we do not believe there will be a material impact to our revenues upon adoption. We are continuing to evaluate the impact to our revenues related to our pending adoption of Topic 606 and our preliminary assessments are subject to change. We are also continuing to evaluate the provisions of Topic 606 related to costs of obtaining customer contracts.
The Company does not anticipate that the adoption of any other recent accounting pronouncements will have a material impact on the Company's consolidated financial position, results of operations or cash flows.
2. EARNINGS PER SHARE AND STOCKHOLDERS’ EQUITY:
Earnings Per Share
A reconciliation of the numerator and denominator of basic and diluted earnings per share is shown below (in thousands, except per share amounts):
|
|
For the three months ended
|
For the nine months ended
|
||||||||||||||
|
December 31,
|
December 31,
|
|||||||||||||||
|
|
2017
|
2016
|
2017
|
2016
|
||||||||||||
|
Basic earnings per share:
|
|
|
|
|
|
|
||||||||||
|
Net earnings
|
$
|
22,941
|
|
$
|
1,073
|
|
$
|
18,305
|
|
$
|
12,189
|
|
||||
|
Basic weighted-average shares outstanding
|
79,043
|
|
77,507
|
|
78,983
|
|
77,475
|
|
||||||||
|
|
|
|
|
|
|
|
|
|
||||||||
|
Basic earnings per share
|
$
|
0.29
|
|
$
|
0.01
|
|
$
|
0.23
|
|
$
|
0.16
|
|
||||
|
Diluted earnings per share:
|
|
|
|
|
|
|
|
|
||||||||
|
Basic weighted-average shares outstanding
|
79,043
|
|
77,507
|
|
78,983
|
|
77,475
|
|
||||||||
|
Dilutive effect of common stock options, warrants, and restricted stock as computed under the treasury stock method
|
2,826
|
|
2,344
|
|
2,611
|
|
2,019
|
|
||||||||
|
Diluted weighted-average shares outstanding
|
81,869
|
|
79,851
|
|
81,594
|
|
79,494
|
|
||||||||
|
|
|
|
|
|
|
|
|
|
||||||||
|
Diluted earnings per share
|
$
|
0.28
|
|
$
|
0.01
|
|
$
|
0.22
|
|
$
|
0.15
|
|
||||
Options and warrants to purchase shares of common stock and restricted stock units that were outstanding during the periods presented but were not included in the computation of diluted earnings per share because the effect was anti-dilutive are shown below (shares in thousands):
|
For the three months ended
|
For the nine months ended
|
|||||||||||
|
|
December 31,
|
December 31,
|
||||||||||
|
|
2017
|
2016
|
2017
|
2016
|
||||||||
|
Number of shares outstanding under options, warrants and restricted stock units
|
97
|
|
156
|
|
89
|
|
345
|
|
||||
|
Range of exercise prices for options
|
$32.85
|
|
$32.85
|
|
$32.85
|
|
$20.27-$32.85
|
|
||||
Stockholders’ Equity
On August 29, 2011, the board of directors adopted a common stock repurchase program. That program was subsequently modified and expanded, most recently on July 28, 2016. Under the modified common stock repurchase program, the Company may purchase up to
$400.0 million
of its common stock through the period ending
June 30, 2018
. During the
nine months ended
December 31, 2017
, the Company repurchased
1.6 million
shares of its common stock for
$39.4 million
. Through
December 31, 2017
, the Company had repurchased a total
13
of
18.4 million
shares of its stock for
$325.2 million
, leaving remaining capacity of
$74.8 million
under the stock repurchase program.
Accumulated Other Comprehensive Income
Accumulated other comprehensive income accumulated balances of
$9.8 million
and
$8.0 million
at
December 31, 2017
and March 31, 2017, respectively, reflect accumulated foreign currency translation adjustments.
3. SHARE-BASED COMPENSATION:
Share-based Compensation Plans
The Company has stock option and equity compensation plans for which a total of
34.5 million
shares of the Company’s common stock have been reserved for issuance since the inception of the plans. These plans provide that the exercise prices of qualified options will be at or above the fair market value of the common stock at the time of the grant. Board policy requires that nonqualified options also be priced at or above the fair market value of the common stock at the time of grant. At
December 31, 2017
, there were a total of
6.2 million
shares available for future grants under the plans.
During the quarter ended June 30, 2017, the Board voted to amend the Amended and Restated 2005 Equity Compensation Plan to increase the number of shares available under the plan from
28.4 million
shares to
32.9 million
shares, bringing the total number of shares reserved for issuance since inception of the plans from
30.0 million
shares at
March 31, 2017
to
34.5 million
shares at
December 31, 2017
. That amendment received shareholder approval at the August 8, 2017 annual shareholders' meeting.
Stock Option Activity
Stock option activity for the
nine months ended
December 31, 2017
was:
|
|
|
|
Weighted-average
|
|
|||||||||
|
|
|
Weighted-average
|
remaining
|
Aggregate
|
|||||||||
|
Number of
|
exercise price
|
contractual term
|
Intrinsic value
|
||||||||||
|
|
shares
|
per share
|
(in years)
|
(in thousands)
|
|||||||||
|
Outstanding at March 31, 2017
|
3,033,071
|
|
$
|
13.14
|
|
|
|
||||||
|
Performance units converted to options
|
299,641
|
|
$
|
21.32
|
|
|
|
|
|||||
|
Exercised
|
(526,842
|
)
|
$
|
15.05
|
|
|
$
|
6,044
|
|
||||
|
Forfeited or canceled
|
(88,870
|
)
|
$
|
20.08
|
|
|
|
|
|||||
|
Outstanding at December 31, 2017
|
2,717,000
|
|
$
|
13.45
|
|
5.7
|
$
|
38,448
|
|
||||
|
Exercisable at December 31, 2017
|
2,109,993
|
|
$
|
13.53
|
|
5.1
|
$
|
29,701
|
|
||||
The aggregate intrinsic value at period end represents the total pre-tax intrinsic value (the difference between Acxiom’s closing stock price on the last trading day of the period and the exercise price for each in-the-money option) that would have been received by the option holders had option holders exercised their options on
December 31, 2017
. This amount changes based upon changes in the fair market value of Acxiom’s common stock.
A summary of stock options outstanding and exercisable as of
December 31, 2017
was:
|
|
|
|
Options outstanding
|
Options exercisable
|
||||||||||||||||||||
|
Range of
|
|
Weighted-average
|
Weighted-average
|
|
Weighted-average
|
|||||||||||||||||||
|
exercise price
|
Options
|
remaining
|
exercise price
|
Options
|
exercise price
|
|||||||||||||||||||
|
per share
|
outstanding
|
contractual life
|
per share
|
exercisable
|
per share
|
|||||||||||||||||||
|
$
|
0.61
|
|
—
|
$
|
9.99
|
|
690,169
|
|
6.4 years
|
$
|
1.68
|
|
474,434
|
|
$
|
1.77
|
|
|||||||
|
$
|
10.00
|
|
—
|
$
|
19.99
|
|
1,262,595
|
|
4.9 years
|
$
|
14.94
|
|
1,076,909
|
|
$
|
14.47
|
|
|||||||
|
$
|
20.00
|
|
—
|
$
|
24.99
|
|
744,684
|
|
6.6 years
|
$
|
21.31
|
|
539,098
|
|
$
|
21.33
|
|
|||||||
|
$
|
25.00
|
|
—
|
$
|
32.85
|
|
19,552
|
|
5.9 years
|
$
|
32.85
|
|
19,552
|
|
$
|
32.85
|
|
|||||||
|
|
|
|
2,717,000
|
|
5.7 years
|
$
|
13.45
|
|
2,109,993
|
|
$
|
13.53
|
|
|||||||||||
14
Total expense related to stock options for the
nine months ended
December 31, 2017
and
2016
was approximately
$4.1 million
and
$5.4 million
, respectively. Future expense for these options is expected to be approximately
$7.1 million
in total over the next
four years
.
Performance Stock Option Unit Activity
Performance stock option unit activity for the
nine months ended
December 31, 2017
was:
|
|
|
|
Weighted-average
|
|
||||||||||
|
|
|
Weighted-average
|
remaining
|
Aggregate
|
||||||||||
|
|
Number
|
exercise price
|
contractual term
|
intrinsic value
|
||||||||||
|
|
of shares
|
per share
|
(in years)
|
(in thousands)
|
||||||||||
|
Outstanding at March 31, 2017
|
555,123
|
|
$
|
21.41
|
|
|
|
|||||||
|
Performance units converted to options
|
(183,322
|
)
|
$
|
21.41
|
|
|||||||||
|
Forfeited or canceled
|
(25,201
|
)
|
$
|
21.32
|
|
|
|
|||||||
|
Outstanding at December 31, 2017
|
346,600
|
|
$
|
21.41
|
|
1.9
|
|
$
|
2,131
|
|
||||
|
Exercisable at December 31, 2017
|
—
|
|
$
|
—
|
|
—
|
|
$
|
—
|
|
||||
Of the performance stock option units outstanding at
March 31, 2017
,
183,322
reached maturity of the relevant performance period at March 31, 2017. During the quarter ended June 30, 2017, the units vested at an approximate
163%
attainment level resulting in issuance of
299,641
stock options having a weighted average exercise price of
$21.32
.
Total expense related to performance stock option units for the
nine months ended
December 31, 2017
and
2016
was
$0.9 million
and
$1.0 million
, respectively. Future expense for these performance stock option units is expected to be approximately
$2.1 million
in total over the next
four years
.
Stock Appreciation Right ("SAR") Activity
SAR activity for the
nine months ended
December 31, 2017
was:
|
|
|
|
Weighted-average
|
|
||||||||||
|
|
|
Weighted-average
|
remaining
|
Aggregate
|
||||||||||
|
|
Number
|
exercise price
|
contractual term
|
intrinsic value
|
||||||||||
|
|
of shares
|
per share
|
(in years)
|
(in thousands)
|
||||||||||
|
Outstanding at March 31, 2017
|
245,404
|
|
$
|
40.00
|
|
|
|
|||||||
|
Forfeited or canceled
|
(245,404
|
)
|
$
|
40.00
|
|
|||||||||
|
Outstanding at December 31, 2017
|
—
|
|
$
|
—
|
|
—
|
|
$
|
—
|
|
||||
All of the SAR units outstanding at
March 31, 2017
reached maturity of the relevant performance period on March 31, 2017. The units achieved a
100%
performance attainment level. However, application of the vesting multiplier resulted in zero shares granted and cancellation of all the units during the quarter ended June 30, 2017.
Restricted Stock Unit Activity
During the
nine months ended
December 31, 2017
, the Company granted time-vesting restricted stock units covering
1,687,416
shares of common stock with a fair value at the date of grant of
$44.2 million
. Of the restricted stock units granted in the current period,
358,812
vest in equal annual increments over
four years
,
106,571
vest in equal annual increments over
three
years,
1,008,851
vest
25%
at the one-year anniversary and
75%
in equal quarterly increments over the subsequent
three
years,
174,368
vest
50%
at the
one
-year anniversary and
50%
in equal quarterly increments over the following year, and
38,814
vest in
one year
. Grant date fair value of these units is equal to the quoted market price for the shares on the date of grant.
15
Non-vested time-vesting restricted stock unit activity for the
nine months ended
December 31, 2017
was:
|
|
|
Weighted-average
|
|
||||||
|
|
|
fair value per
|
Weighted-average
|
||||||
|
|
Number
|
share at grant
|
remaining contractual
|
||||||
|
|
of shares
|
date
|
term (in years)
|
||||||
|
Outstanding at March 31, 2017
|
3,307,577
|
|
$
|
22.57
|
|
2.45
|
|||
|
Granted
|
1,687,416
|
|
$
|
26.17
|
|
|
|||
|
Vested
|
(1,067,370
|
)
|
$
|
22.30
|
|
|
|||
|
Forfeited or canceled
|
(345,581
|
)
|
$
|
23.36
|
|
|
|||
|
Outstanding at December 31, 2017
|
3,582,042
|
|
$
|
24.27
|
|
2.48
|
|||
During the
nine months ended
December 31, 2017
, the Company granted performance-based restricted stock units covering
425,880
shares of common stock having a fair value at the date of grant of
$11.2 million
. Of the performance-based restricted stock units granted in the current period,
221,746
units - having a fair value at the date of grant of
$6.2 million
, determined using a Monte Carlo simulation model - vest subject to attainment of performance criteria established by the compensation committee of the board of directors (“compensation committee”) and continuous employment through the vesting date. The
221,746
units may vest in a number of shares from
zero
to
200%
of the award, based on the total shareholder return of Acxiom common stock compared to total shareholder return of a group of peer companies (“TSR”) established by the compensation committee for the period from April 1, 2017 to March 31, 2020.
Of the performance-based restricted stock units granted in the current period,
87,184
units - having a fair value at the date of grant of
$2.1 million
, based on the quoted market price for the shares on the date of grant - vest over
two
periods, each being subject to attainment of performance criteria established by the compensation committee and continuous employment through the vesting date. At the end of the first year, the performance units may vest in a number of shares, from
zero
to
75%
of the initial award. At the end of the second year, the performance units may vest in a number of shares, from
zero
to
150%
of the initial award, less the number of shares awarded at completion of year one. The units will vest based on the attainment of certain revenue growth initiatives for the period from October 1, 2017 to September 30, 2019.
The remaining
116,950
performance-based restricted stock units granted in the current period - having a fair value at the date of grant of
$2.9 million
, based on the quoted market price for the shares on the date of grant - vest in
three
equal tranches, each being subject to attainment of performance criteria established by the compensation committee and continuous employment through the vesting date. Each of the three tranches may vest in a number of shares, from
zero
to
300%
of the initial award, based on the attainment of certain revenue growth and operating margin targets for the years ending March 31, 2018, 2019, and 2020, respectively.
Non-vested performance-based restricted stock unit activity for the
nine months ended
December 31, 2017
was:
|
|
|
Weighted-average
|
|
||||||
|
|
|
fair value per
|
Weighted-average
|
||||||
|
|
Number
|
share at grant
|
remaining contractual
|
||||||
|
|
of shares
|
date
|
term (in years)
|
||||||
|
Outstanding at March 31, 2017
|
732,711
|
|
$
|
20.89
|
|
1.13
|
|||
|
Granted
|
425,880
|
|
$
|
26.22
|
|
|
|||
|
Additional earned performance shares
|
94,775
|
|
$
|
19.46
|
|
||||
|
Vested
|
(252,760
|
)
|
$
|
19.46
|
|
||||
|
Forfeited or canceled
|
(48,422
|
)
|
$
|
22.00
|
|
|
|||
|
Outstanding at December 31, 2017
|
952,184
|
|
$
|
23.45
|
|
1.37
|
|||
16
Of the performance-based restricted stock units outstanding at
March 31, 2017
,
157,985
related to a performance period ended March 31, 2017. During the quarter ended June 30, 2017, the units vested at a
160%
attainment level based on performance results approved by the compensation committee, resulting in issuance of
252,760
shares of common stock, of which
94,775
were the additional earned performance shares referenced in the table above.
Of the performance-based restricted stock units outstanding at
December 31, 2017
,
251,399
will reach maturity of the relevant performance period at March 31, 2018. The units are expected to vest at an approximate
200%
attainment level, resulting in issuance of approximately
502,798
shares of common stock, before consideration of the TSR multiplier, in the first quarter of fiscal 2019.
Total expense related to restricted stock for the
nine months ended
December 31, 2017
and
2016
was approximately
$29.5 million
and
$24.4 million
, respectively. Future expense for restricted stock units is expected to be approximately
$11.8 million
for the
three months
ending March 31, 2018,
$36.0 million
in fiscal 2019,
$24.6 million
in fiscal 2020,
$11.7 million
in fiscal 2021, and
$2.0 million
in fiscal 2022.
Other Performance Unit Activity
Other performance-based stock unit activity for the
nine months ended
December 31, 2017
was:
|
|
|
Weighted-average
|
|
||||||
|
|
|
fair value per
|
Weighted-average
|
||||||
|
|
Number
|
share at grant
|
remaining contractual
|
||||||
|
|
of shares
|
date
|
term (in years)
|
||||||
|
Outstanding at March 31, 2017
|
597,193
|
|
$
|
4.14
|
|
0.30
|
|||
|
Vested
|
(24,573
|
)
|
$
|
2.94
|
|
||||
|
Forfeited or canceled
|
(461,509
|
)
|
$
|
3.92
|
|
|
|||
|
Outstanding at December 31, 2017
|
111,111
|
|
$
|
5.33
|
|
0.25
|
|||
Of the other performance-based stock units outstanding at
March 31, 2017
,
201,464
reached maturity of the relevant performance period on March 31, 2017. The units achieved a
100%
performance attainment level. However, application of the share price adjustment factor resulted in
zero
shares granted and cancellation of all the units during the quarter ended June 30, 2017.
Of the other performance-based stock units outstanding at March 31, 2017,
284,618
reached maturity of the relevant performance period on June 30, 2017. The units achieved an approximate
9%
performance attainment level, resulting in issuance of
24,573
shares of common stock during the quarter ended September 30, 2017.
The remaining
111,111
performance-based units outstanding at December 31, 2017 will reach maturity of the relevant performance period on March 31, 2018. The units are expected to achieve a
100%
performance attainment level. However, application of the share price adjustment factor is expected to result in an approximate 75% reduction in shares granted, in the first quarter of fiscal 2019.
Total expense related to other performance units for the
nine months ended
December 31, 2017
and
2016
was
$0.1 million
and
$0.7 million
, respectively. Future expense for these performance units is expected to be approximately
$0.1 million
over the next
three
months ending March 31, 2018.
Consideration Holdback
As part of the Company’s acquisition of Arbor in fiscal 2017,
$38.3 million
of the acquisition consideration otherwise payable with respect to shares of restricted Arbor common stock held by certain key employees was subject to holdback by the Company pursuant to agreements with those employees (each, a “Holdback Agreement”). The consideration holdback vests in
30
equal monthly increments following the date of close, subject to the Arbor key employees' continued employment through each monthly vesting date. At each vesting date, 1/30th of the
$38.3 million
holdback consideration vests and is settled in shares of Company common stock. The number of shares is based on the then-current market price of the Company common stock.
Total expense related to the Holdback Agreement for the
nine months ended
December 31, 2017
was approximately
$11.5 million
.
17
4. DISPOSITION:
Disposition of Impact email business
In fiscal 2017, the Company completed the sale of its Impact email business to Zeta Interactive for total consideration of
$22.0 million
, including a
$4.0 million
subordinated promissory note with interest accruing at a rate of
6.0%
per annum. The note was paid in full during the quarter ended September 30, 2017. The Company also entered into a separate multi-year contract to provide Zeta Interactive with Connectivity and Audience Solutions services. Prior to the disposition, the Impact email business was included in the Marketing Services segment results. The business did not meet the requirements of a discontinued business; therefore, all financial results are included in continuing operations.
Revenue and income from operations from the disposed Impact email business are shown below (dollars in thousands):
|
For the three months ended
|
For the nine months ended
|
|||||||||||||||
|
|
December 31,
|
December 31,
|
||||||||||||||
|
|
2017
|
2016
|
2017
|
2016
|
||||||||||||
|
Revenues
|
$
|
—
|
|
$
|
—
|
|
$
|
—
|
|
$
|
20,375
|
|
||||
|
Income from operations
|
$
|
—
|
|
$
|
—
|
|
$
|
—
|
|
$
|
120
|
|
||||
5. OTHER CURRENT AND NONCURRENT ASSETS:
Other current assets consist of the following (dollars in thousands):
|
|
December 31, 2017
|
March 31,
2017
|
||||||
|
Prepaid expenses and other
|
$
|
28,246
|
|
$
|
25,714
|
|
||
|
Escrow deposit
|
—
|
|
5,880
|
|
||||
|
Note receivable
|
—
|
|
4,000
|
|
||||
|
Assets of non-qualified retirement plan
|
14,111
|
|
12,716
|
|
||||
|
Other current assets
|
$
|
42,357
|
|
$
|
48,310
|
|
||
Other noncurrent assets consist of the following (dollars in thousands):
|
|
December 31, 2017
|
March 31,
2017
|
||||||
|
Acquired intangible assets, net
|
$
|
36,183
|
|
$
|
43,884
|
|
||
|
Deferred data acquisition costs
|
982
|
|
1,116
|
|
||||
|
Other miscellaneous noncurrent assets
|
6,411
|
|
6,443
|
|
||||
|
Noncurrent assets
|
$
|
43,576
|
|
$
|
51,443
|
|
||
6. OTHER ACCRUED EXPENSES:
Other accrued expenses consist of the following (dollars in thousands):
|
|
December 31, 2017
|
March 31,
2017
|
||||||
|
Accrued purchase consideration
|
$
|
—
|
|
$
|
5,880
|
|
||
|
Liabilities of non-qualified retirement plan
|
14,111
|
|
12,716
|
|
||||
|
Other accrued expenses
|
39,888
|
|
41,265
|
|
||||
|
Other accrued expenses
|
$
|
53,999
|
|
$
|
59,861
|
|
||
18
7. GOODWILL:
The following table summarizes Goodwill activity, by segment, for the
nine months ended
December 31, 2017
(dollars in thousands):
|
|
Marketing
Services
|
Audience
Solutions
|
Connectivity
|
Total
|
||||||||||||
|
Balance at March 31, 2017
|
$
|
118,890
|
|
$
|
273,448
|
|
$
|
200,393
|
|
$
|
592,731
|
|
||||
|
Arbor adjustment
|
—
|
|
—
|
|
(21
|
)
|
(21
|
)
|
||||||||
|
Change in foreign currency translation adjustment
|
82
|
|
—
|
|
35
|
|
117
|
|
||||||||
|
Balance at December 31, 2017
|
$
|
118,972
|
|
$
|
273,448
|
|
$
|
200,407
|
|
$
|
592,827
|
|
||||
Goodwill by component included in each segment as of
December 31, 2017
was:
|
|
Marketing
Services |
Audience
Solutions |
Connectivity
|
Total
|
||||||||||||
|
U.S.
|
$
|
110,910
|
|
$
|
273,448
|
|
$
|
196,812
|
|
$
|
581,170
|
|
||||
|
APAC
|
8,062
|
|
—
|
|
3,595
|
|
11,657
|
|
||||||||
|
Balance at December 31, 2017
|
$
|
118,972
|
|
$
|
273,448
|
|
$
|
200,407
|
|
$
|
592,827
|
|
||||
8. LONG-TERM DEBT:
Long-term debt consists of the following (dollars in thousands):
|
|
December 31, 2017
|
March 31,
2017
|
||||||
|
Term loan credit agreement
|
$
|
—
|
|
$
|
155,000
|
|
||
|
Revolving credit borrowings
|
230,000
|
|
70,000
|
|
||||
|
Other debt
|
3,881
|
|
5,612
|
|
||||
|
Total long-term debt
|
233,881
|
|
230,612
|
|
||||
|
Less current installments
|
1,837
|
|
39,819
|
|
||||
|
Less deferred debt financing costs
|
4,101
|
|
1,552
|
|
||||
|
Long-term debt, excluding current installments and deferred debt financing costs
|
$
|
227,943
|
|
$
|
189,241
|
|
||
On June 20, 2017, the Company entered into a Sixth Amended and Restated Credit Agreement (the "restated credit agreement") as part of refinancing its prior credit agreement. On that day, the Company used an initial draw of
$230 million
to pay off the outstanding
$225 million
term and revolving loan balances, with interest, along with
$4.0 million
in fees related to the restated credit agreement. The fees are being amortized over the term of the agreement.
The Company's restated credit agreement provides for (1) revolving credit facility borrowings consisting of revolving loans, letters of credit participation, and swing-line loans (the “
revolving loans
”) in an aggregate amount of
$600 million
and (2) a provision allowing the Company to request an increase of the aggregate amount of the revolving loans in an amount not to exceed
$150 million
. The restated credit agreement is secured by the accounts receivable of the Company and its domestic subsidiaries, as well as by the outstanding stock of certain subsidiaries of the Company. The restated credit agreement contains customary representations, warranties, affirmative and negative covenants, and default and acceleration provisions. The restated credit agreement matures, and is fully due and payable, on June 20, 2022 and allows for prepayments before maturity.
19
The revolving loan borrowings bear interest at
LIBOR
or at an alternative base rate plus a credit spread. At
December 31, 2017
, the revolving loan borrowing bears interest at LIBOR plus a credit spread of
2%
. The weighted-average interest rate on revolving credit borrowings at
December 31, 2017
was
3.6%
. There were no material outstanding letters of credit at
December 31, 2017
or March 31, 2017.
Under the terms of the restated credit agreement, the Company is required to maintain certain debt-to-cash flow and interest coverage ratios, among other restrictions. At
December 31, 2017
, the Company was in compliance with these covenants and restrictions.
9. ALLOWANCE FOR DOUBTFUL ACCOUNTS:
Trade accounts receivable are presented net of allowances for doubtful accounts, returns and credits of
$6.3 million
at
December 31, 2017
and
$6.1 million
at
March 31, 2017
.
10. SEGMENT INFORMATION:
The Company reports segment information consistent with the way management internally disaggregates its operations to assess performance and to allocate resources.
Revenues and cost of revenue are generally directly attributed to the segments. Certain revenue contracts are allocated among the segments based on the relative value of the underlying products and services. Cost of revenue, excluding non-cash stock compensation expense and purchased intangible asset amortization, is directly charged in most cases and allocated in certain cases based upon proportional usage.
Operating expenses, excluding non-cash stock compensation expense and purchased intangible asset amortization, are attributed to the segment groups as follows:
|
•
|
Research and development expenses are primarily directly recorded to each segment group based on identified products supported.
|
|
•
|
Sales and marketing expenses are primarily directly recorded to each segment group based on products supported and sold.
|
|
•
|
General and administrative expenses are generally not allocated to the segments unless directly attributable.
|
|
•
|
Gains, losses and other items, net are not allocated to the segment groups.
|
We do not track our assets by operating segments. Consequently, it is not practical to show assets by operating segment.
20
The following table presents information by business segment (dollars in thousands):
|
|
For the three months ended
|
For the nine months ended
|
||||||||||||||
|
|
December 31,
|
December 31,
|
||||||||||||||
|
|
2017
|
2016
|
2017
|
2016
|
||||||||||||
|
Revenues:
|
|
|
|
|
||||||||||||
|
Marketing Services
|
$
|
94,457
|
|
$
|
101,177
|
|
$
|
280,093
|
|
$
|
316,571
|
|
||||
|
Audience Solutions
|
84,436
|
|
83,399
|
|
238,984
|
|
235,669
|
|
||||||||
|
Connectivity
|
55,978
|
|
38,736
|
|
153,548
|
|
103,140
|
|
||||||||
|
Total segment revenues
|
$
|
234,871
|
|
$
|
223,312
|
|
$
|
672,625
|
|
$
|
655,380
|
|
||||
|
Gross profit
(1)
:
|
|
|
|
|
|
|
|
|
||||||||
|
Marketing Services
|
$
|
35,798
|
|
$
|
37,494
|
|
$
|
101,476
|
|
$
|
109,440
|
|
||||
|
Audience Solutions
|
52,821
|
|
53,120
|
|
148,352
|
|
143,030
|
|
||||||||
|
Connectivity
|
37,914
|
|
23,091
|
|
100,730
|
|
60,509
|
|
||||||||
|
Total segment gross profit
|
$
|
126,533
|
|
$
|
113,705
|
|
$
|
350,558
|
|
$
|
312,979
|
|
||||
|
Income from operations
(1)
:
|
|
|
|
|
|
|
|
|
||||||||
|
Marketing Services
|
$
|
22,063
|
|
$
|
21,127
|
|
$
|
63,721
|
|
$
|
61,109
|
|
||||
|
Audience Solutions
|
33,112
|
|
34,572
|
|
91,151
|
|
89,640
|
|
||||||||
|
Connectivity
|
6,808
|
|
1,877
|
|
12,475
|
|
3,831
|
|
||||||||
|
Total segment income from operations
|
$
|
61,983
|
|
$
|
57,576
|
|
$
|
167,347
|
|
$
|
154,580
|
|
||||
(1)
Gross profit and income from operations reflect only the direct and allocable controllable costs of each segment and do not include allocations of corporate expenses (primarily general and administrative expenses) and gains, losses, and other items, net. Additionally, segment gross profit and income from operations do not include non-cash stock compensation expense and purchased intangible asset amortization.
The following table reconciles total segment gross profit to gross profit and total operating segment income from operations to income from operations (dollars in thousands):
|
For the three months ended
|
For the nine months ended
|
|||||||||||||||
|
|
December 31,
|
December 31,
|
||||||||||||||
|
|
2017
|
2016
|
2017
|
2016
|
||||||||||||
|
Total segment gross profit
|
$
|
126,533
|
|
$
|
113,705
|
|
$
|
350,558
|
|
$
|
312,979
|
|
||||
|
Less:
|
|
|
|
|
||||||||||||
|
Purchased intangible asset amortization
|
5,971
|
|
4,621
|
|
17,958
|
|
12,588
|
|
||||||||
|
Non-cash stock compensation
|
1,611
|
|
2,240
|
|
4,927
|
|
4,403
|
|
||||||||
|
Gross profit
|
$
|
118,951
|
|
$
|
106,844
|
|
$
|
327,673
|
|
$
|
295,988
|
|
||||
|
Total segment income from operations
|
$
|
61,983
|
|
$
|
57,576
|
|
$
|
167,347
|
|
$
|
154,580
|
|
||||
|
Less:
|
|
|
|
|
||||||||||||
|
Corporate expenses (principally general and administrative)
|
23,862
|
|
24,184
|
|
75,582
|
|
75,342
|
|
||||||||
|
Separation and transformation costs included in general and administrative
|
5,214
|
|
4,118
|
|
17,775
|
|
5,573
|
|
||||||||
|
Gains, losses and other items, net
|
(41
|
)
|
2,111
|
|
3,521
|
|
2,725
|
|
||||||||
|
Purchased intangible asset amortization
|
5,971
|
|
4,621
|
|
17,958
|
|
12,588
|
|
||||||||
|
Non-cash stock compensation
|
15,919
|
|
13,427
|
|
46,707
|
|
33,955
|
|
||||||||
|
Income from operations
|
$
|
11,058
|
|
$
|
9,115
|
|
$
|
5,804
|
|
$
|
24,397
|
|
||||
21
11. RESTRUCTURING, IMPAIRMENT AND OTHER CHARGES:
The following table summarizes the restructuring activity for the
nine months ended
December 31, 2017
(dollars in thousands):
|
|
Associate-related
reserves |
Lease
accruals |
Total
|
|||||||||
|
March 31, 2017
|
$
|
2,400
|
|
$
|
4,308
|
|
$
|
6,708
|
|
|||
|
Restructuring charges and adjustments
|
1,476
|
|
2,068
|
|
3,544
|
|
||||||
|
Payments
|
(2,842
|
)
|
(1,187
|
)
|
(4,029
|
)
|
||||||
|
December 31, 2017
|
$
|
1,034
|
|
$
|
5,189
|
|
$
|
6,223
|
|
|||
The above balances are included in other accrued expenses and other liabilities on the condensed consolidated balance sheet.
Restructuring Plans
In the
nine months ended
December 31, 2017
, the Company recorded a total of
$3.5 million
in restructuring charges and adjustments included in gains, losses and other items, net in the condensed consolidated statement of operations. The expense included severance and other associate-related charges of
$1.5 million
, lease accruals and adjustments of
$1.0 million
, and leasehold improvement write-offs of
$1.1 million
.
The associate-related accruals of
$1.5 million
relate to the termination of associates in the United States. Of the amount accrued,
$0.3 million
remained accrued as of
December 31, 2017
. These costs are expected to be paid out in fiscal 2018.
The lease accruals and adjustments of
$1.0 million
result from the Company's exit from certain leased office facilities. Of the amount accrued, together with the deferred rent credits of
$1.4 million
related to the space,
$2.1 million
remained accrued as of
December 31, 2017
.
In fiscal 2017, the Company recorded a total of
$8.9 million
in restructuring charges and adjustments included in gains, losses and other items, net in the condensed consolidated statement of operations. The expense included severance and other associate-related charges of
$3.8 million
, lease accruals and adjustments of
$3.0 million
, and leasehold improvement write-offs of
$2.1 million
. Of the associate-related accruals of
$3.8 million
,
$0.2 million
remained accrued as of
December 31, 2017
. These costs are expected to be paid out in fiscal 2018. The lease accruals and adjustments of
$3.0 million
resulted from the Company's exit from certain leased office facilities (
$1.5 million
) and adjustments to estimates related to the fiscal 2015 lease accruals (
$1.5 million
). Of the amount accrued for fiscal 2017 lease accruals,
$2.3 million
remained accrued as of
December 31, 2017
.
In fiscal 2016, the Company recorded a total of
$12.0 million
in restructuring charges and adjustments included in gains, losses and other items, net in the condensed consolidated statement of operations. The expense included severance and other associate-related charges of
$8.6 million
, lease termination charges and accruals of
$3.0 million
, and leasehold improvement write-offs of
$0.4 million
. Of the associate-related accruals of
$8.6 million
,
$0.2 million
remained accrued as of
December 31, 2017
. These amounts are expected to be paid out in fiscal 2018. The lease termination charges and accruals of
$3.0 million
were fully paid during fiscal 2016.
In fiscal 2015, the Company recorded a total of
$21.8 million
in restructuring charges and adjustments included in gains, losses and other items, net in the condensed consolidated statement of operations. The expense included severance and other associate-related charges of
$13.3 million
, lease accruals of
$6.5 million
, and the write-off of leasehold improvements of
$2.0 million
. Of the associate-related accruals of
$13.3 million
,
$0.3 million
remained accrued as of
December 31, 2017
. These amounts are expected to be paid out in fiscal 2018. Of the lease accruals of
$6.5 million
,
$0.8 million
remained accrued as of
December 31, 2017
.
With respect to the fiscal 2015, 2017, and 2018 lease accruals described above, the Company intends to sublease the facilities to the extent possible. The liabilities will be satisfied over the remainder of the leased properties' terms, which continue through November 2025. Actual sublease receipts may differ from the estimates originally made by
22
the Company. Any future changes in the estimates or in the actual sublease income could require future adjustments to the liabilities, which would impact net earnings (loss) in the period the adjustment is recorded.
Gains, Losses and Other Items
Gains, losses and other items for each of the periods presented are as follows (dollars in thousands):
|
|
For the three months ended
|
For the nine months ended
|
||||||||||||||
|
|
December 31,
|
December 31,
|
||||||||||||||
|
|
2017
|
2016
|
2017
|
2016
|
||||||||||||
|
Restructuring plan charges and adjustments
|
$
|
(18
|
)
|
$
|
899
|
|
$
|
3,545
|
|
$
|
2,107
|
|
||||
|
Gain on disposition of Impact email business
|
—
|
|
(155
|
)
|
—
|
|
(784
|
)
|
||||||||
|
Arbor and Circulate acquisition-related costs
|
—
|
|
1,365
|
|
—
|
|
1,365
|
|
||||||||
|
Other
|
(23
|
)
|
2
|
|
(24
|
)
|
36
|
|
||||||||
|
|
$
|
(41
|
)
|
$
|
2,111
|
|
$
|
3,521
|
|
$
|
2,724
|
|
||||
12. COMMITMENTS AND CONTINGENCIES:
Legal Matters
The Company is involved in various claims and legal proceedings. Management routinely assesses the likelihood of adverse judgments or outcomes to these matters, as well as ranges of probable losses, to the extent losses are reasonably estimable. The Company records accruals for these matters to the extent that management concludes a loss is probable and the financial impact, should an adverse outcome occur, is reasonably estimable. These accruals are reflected in the Company’s condensed consolidated financial statements. In management’s opinion, the Company has made appropriate and adequate accruals for these matters, and management believes the probability of a material loss beyond the amounts accrued to be remote. However, the ultimate liability for these matters is uncertain, and if accruals are not adequate, an adverse outcome could have a material effect on the Company’s consolidated financial condition or results of operations. The Company maintains insurance coverage above certain limits. There are currently no matters pending against the Company or its subsidiaries for which the potential exposure is considered material to the Company’s condensed consolidated financial statements.
Commitments
The Company leases data processing equipment, office furniture and equipment, land and office space under noncancellable operating leases. The Company has a future commitment for lease payments over the next
23 years
of
$84.5 million
.
In connection with the Impact email disposition during fiscal 2017, the Company assigned a facility lease to the buyer of the business. The Company guaranteed the facility lease as required by the asset disposition agreement. Should the assignee default, the Company would be required to perform under the terms of the facility lease, which continues through September 2021. At
December 31, 2017
, the Company’s maximum potential future rent payments under this guarantee totaled
$2.3 million
.
13. INCOME TAX:
On December 22, 2017, the United States (“U.S.”) enacted significant changes to U.S. tax law following the passage of H.R.1, “An Act to Provide for Reconciliation Pursuant to Titles II and V of the Concurrent Resolution on the Budget for Fiscal Year 2018” (the “Tax Act”) (previously known as “The Tax Cuts and Jobs Act”). The Tax Act included significant changes to existing tax law, including a permanent reduction to the U.S. federal corporate income tax rate from 35% to 21%, a one-time repatriation tax on deferred foreign income (“Transition Tax”), and numerous other changes to business-related deductions.
The permanent reduction to the U.S. federal corporate income tax rate from 35% to 21% is effective January 1, 2018 (the “Effective Date”). Because the Effective Date does not fall on the first day of our fiscal year, we are required to apply a blended tax rate for the entire fiscal year by applying a prorated percentage of the number of
23
days before and after the Effective Date. As a result of the Tax Act, we have determined that our U.S. federal statutory corporate income tax rate will be
31.5%
for the fiscal year ending March 31, 2018.
We recorded a
$20.3 million
benefit for the remeasurement of net deferred tax liabilities, which was included in income tax expense (benefit) in the Company's Condensed Consolidated Statements of Operations. We remeasured our deferred taxes to reflect the reduced Federal tax rate that will apply when these deferred taxes are settled or realized in future periods. To calculate the remeasurement of deferred taxes we estimated the periods during which the existing deferred taxes will be settled or realized. The remeasurement of deferred taxes included in our condensed consolidated financial statements will be subject to further revisions if our current estimates are different from our actual future operating results.
Given the Company's aggregate deficit related to foreign earnings and profits, we have determined that the Company will not incur a Transition Tax liability.
On December 22, 2017, the SEC issued Staff Accounting Bulletin 118 (“SAB 118”) which provides guidance on accounting for the tax effects of the Tax Act. The SEC staff (the “Staff”) recognized that a registrant’s review of certain income tax effects of the Tax Act may be incomplete at the time financial statements are issued for the reporting period that includes the enactment date, including interim periods therein. If a company does not have the necessary information available, prepared or analyzed for certain income tax effects of the Tax Act, SAB 118 allows a company to report provisional numbers and adjust those amounts during the measurement period not to extend beyond one year. The adjustments to net deferred tax liabilities are provisional amounts estimated based on information available as of December 31, 2017. These amounts are subject to change as we obtain information necessary to complete the calculations. We will recognize any changes to the provisional amounts as we refine our estimates of the cumulative temporary differences, including those related to immediate deduction for qualified property, and our interpretations of the application of the Tax Act.
We continue to review the anticipated impacts of the global intangible low taxed income (“GILTI”) and base erosion anti-abuse tax (“BEAT”) on the Company, which are not effective until fiscal year 2019. The Company has not recorded any impact associated with either GILTI or BEAT in the tax rate for the third quarter of fiscal year 2018.
Within the calculation of its annual effective tax rate the Company has used assumptions and estimates that may change as a result of future guidance, interpretation, and rule-making from the Internal Revenue Service, the SEC, and the FASB and/or various other taxing jurisdictions. For example, the Company anticipates that the U.S. state jurisdictions will continue to determine and announce their conformity to the Tax Act, which could have an impact on the annual effective tax rate.
In determining the quarterly provision for income taxes, the Company makes its best estimate of the effective income tax rate expected to be applicable for the full fiscal year. The estimated effective income tax rate for the current fiscal year is impacted by nondeductible stock-based compensation, state income taxes, research tax credits, and losses in foreign jurisdictions. State income taxes are influenced by the geographic and legal entity mix of the Company’s U.S. income as well as the diversity of rules among the states. The Company does not record a tax benefit for certain foreign losses due to uncertainty of future utilization.
As a result of adopting ASU 2016–09 during the first quarter of the current fiscal year, all excess tax benefits and deficiencies from stock–based compensation are recognized as income tax benefit and expense in the Company’s Condensed Consolidated Statement of Operations in the reporting period in which they occur. For the three months and nine months ended December 31, 2017, the Company recognized discrete income tax expense of
$0.1 million
and benefit of
$1.9 million
, respectively, related to net excess tax benefits and deficiencies.
14. FAIR VALUE OF FINANCIAL INSTRUMENTS:
The following methods and assumptions were used to estimate the fair value of each class of financial instruments for which it is practicable to estimate that value.
Cash and cash equivalents, trade receivables, unbilled and notes receivable, short-term borrowings and trade payables - The carrying amount approximates fair value because of the short maturity of these instruments.
Long-term debt - The interest rate on the revolving credit agreement is adjusted for changes in market rates and therefore the carrying value approximates fair value. The estimated fair value of other long-term debt was
24
determined based upon the present value of the expected cash flows considering expected maturities and using interest rates currently available to the Company for long-term borrowings with similar terms. At
December 31, 2017
, the estimated fair value of long-term debt approximates its carrying value.
Under applicable accounting standards financial assets and liabilities are classified in their entirety based on the lowest level of input that is significant to the fair value measurements. The Company assigned assets and liabilities to the hierarchy in the accounting standards, which is Level 1 - quoted prices in active markets for identical assets or liabilities, Level 2 - significant other observable inputs and Level 3 - significant unobservable inputs.
The following table presents the balances of assets measured at fair value as of
December 31, 2017
(dollars in thousands):
|
|
Level 1
|
Level 2
|
Level 3
|
Total
|
||||||||||||
|
Assets:
|
|
|
|
|
||||||||||||
|
Other current assets
|
$
|
14,111
|
|
$
|
—
|
|
$
|
—
|
|
$
|
14,111
|
|
||||
|
Total assets
|
$
|
14,111
|
|
$
|
—
|
|
$
|
—
|
|
$
|
14,111
|
|
||||
25
We begin Management’s Discussion and Analysis of Financial Condition and Results of Operations with an overview of our operating segments, summary financial results and notable events. This overview is followed by a summary of our critical accounting policies and estimates that we believe are important to understanding the assumptions and judgments incorporated in our reported financial results. We then provide a more detailed analysis of our results of operations and financial condition.
Introduction and Overview
Acxiom Corporation is a global technology and enablement services company with a vision to transform data into value for everyone. Through a simple, open approach to connecting systems and data, we provide the data foundation for the world’s best marketers. By making it safe and easy to activate, validate, enhance, and unify data, we provide marketers with the ability to deliver relevant messages at scale and tie those messages back to actual results. Our products and services enable people-based marketing, allowing our clients to generate higher return on investment and drive better omnichannel customer experiences.
Acxiom is a Delaware corporation founded in 1969 in Conway, Arkansas. Our common stock is listed on the NASDAQ Global Select Market under the symbol “ACXM.” We serve a global client base from locations in the United States, Europe, and the Asia-Pacific (“APAC”) region. Our client list includes many of the world’s largest and best-known brands across most major industry verticals, including but not limited to financial, insurance and investment services, automotive, retail, telecommunications, high tech, healthcare, travel, entertainment, non-profit, and government.
Operating Segments
Our operating segments provide management with a comprehensive view of our key businesses based on how we manage our operations and measure results. Additional information related to our operating segments and geographic information is contained in Note 10 - Segment Information of the Notes to Condensed Consolidated Financial Statements.
Connectivity
As shown in the illustration below, our Connectivity segment enables our clients to build an omnichannel view of the consumer and activate that understanding across the marketing ecosystem.
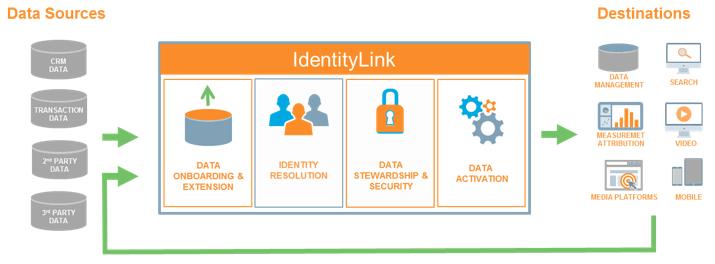
Through integrations with more than 550 leading digital marketing platforms and data providers, we have become a key point of entry into the digital ecosystem, helping our clients eliminate data silos and unlock greater value from the marketing tools they use every day. We provide a foundational identity resolution layer enabling our clients to identify and reach consumers across channels and measure the impact of marketing on sales, using the marketing platform of their choice.
Today, our primary Connectivity offering is LiveRamp IdentityLink, an identity resolution service that ties data back to real people and makes it possible to onboard that data for people-based marketing initiatives across digital channels. Leveraging AbiliTec and the LiveRamp identity graph, IdentityLink first resolves a client’s first-, second-,
26
and third-party exposure, and transaction data to persistent anonymous consumer identifiers that represent real people in a privacy-safe way. This omnichannel view of the consumer can then be onboarded to and between any of the 550 plus partners in our ecosystem to support targeting, personalization and measurement use cases.
|
Targeting
|
Personalization
|
Measurement
|

|

|

|
|
Example
|
Example
|
Example
|
|
Clients can upload known data from first-, second-, and third-party data sources, resolve it to an omnichannel privacy-safe link with IdentityLink, then onboard to one of 550+ LiveRamp partners to deploy targeted ads to known customers.
|
Clients can deliver highly relevant content the moment viewers visit their website landing page, no login required. Leveraging IdentityLink, clients can resolve customer segment data to devices and digital IDs, onboard that data to a personalization platform and provide one-to-one experiences without compromising user privacy.
|
Clients can connect exposure data with first- and third-party purchase data across channels by resolving all customer devices back to the customers to which they belong. Then, clients can onboard that data to a measurement platform to clearly establish cause, effect and impact.
|
IdentityLink operates in an Acxiom SafeHaven® certified environment with technical, operational, and personnel controls designed to ensure our clients’ data is kept private and secure.
IdentityLink is sold to brands and the companies brands partner to execute their marketing, including marketing technology providers, data providers, publishers and agencies.
|
•
|
IdentityLink for Brands and Agencies.
IdentityLink allows brands and their agencies to execute people-based marketing by creating an omnichannel understanding of the consumer and activating that understanding across their choice of best-of-breed digital marketing platforms.
|
|
•
|
IdentityLink for Marketing Technology Providers.
IdentityLink provides marketing technology providers with the ability to offer people-based targeting, measurement and personalization within their platforms. This adds value for brands by increasing reach, as well as the speed at which they can activate their marketing data.
|
|
•
|
IdentityLink for Data Owners.
IdentityLink allows data owners to easily connect their data to the digital ecosystem and better monetize it. Data can be distributed directly to clients or made available through the
IdentityLink Data Store
feature. This adds value for brands as it allows them to augment their understanding of consumers, and increase both their reach to and understanding of customers and prospects.
|
|
•
|
IdentityLink for Publishers.
IdentityLink allows publishers to offer people-based marketing on their properties. This adds value for brands by providing direct access to their customers and prospects in the publisher’s premium inventory.
|
Our Connectivity revenue consists primarily of monthly recurring subscription fees sold on an annual basis. To a lesser extent, we generate revenue from data providers and certain digital publishers in the form of revenue-sharing agreements.
27
Audience Solutions (“AS”)
Our AS segment helps clients validate the accuracy of their data, enhance it with additional insight, and keep it up to date, enabling clients to reach desired audiences with highly relevant messages. Leveraging our recognition and data assets, clients can identify, segment, and differentiate their audiences for more effective marketing and superior customer experiences. AS offerings include InfoBase, our large consumer data store that serves as the basis for Acxiom’s consumer demographics products, and AbiliTec, our patented identity resolution technology that assists our clients in reconciling and managing variations of customer identity over time and across multiple channels.
|
•
|
InfoBase.
With more than 1,500 demographic, socio-economic and lifestyle data elements and several thousand predictive models, our InfoBase products provide marketers with the ability to identify and reach the right audience with the right message across both traditional and digital channels. Through partnerships with over 100 online publishers and digital marketing platforms, including Facebook, Google, Twitter, 4INFO, AOL, eBay and MSN, marketers can use InfoBase data to create and target specific audiences. Data can be accessed directly or through the Acxiom Audience Cloud, a web-based, self-service tool that makes it easy to build and distribute third-party custom data segments.
|
|
•
|
AbiliTec.
As shown in the illustration below, AbiliTec helps brands recognize individuals and households using a number of different input variables and connects identities online and offline.
|
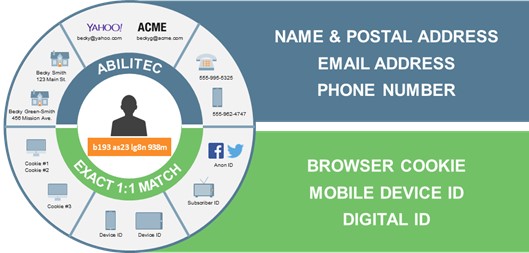
By identifying and linking multiple identifiers and data elements back to a persistent ID, our clients are able to create a single view of the customer, which allows them to perform more effective audience targeting and deliver better, more relevant customer experiences.
Our AS revenue includes licensing fees, which are typically in the form of recurring monthly billings, as well as transactional revenue based on volume or one-time usage. In addition, AS generates digital data revenue from certain digital publishers and addressable television providers in the form of revenue sharing agreements. Our Marketing Database clients are a significant channel for our AS offerings.
Marketing Services (“MS”)
Our MS segment helps clients unify data at the individual level in a privacy-safe environment, so they can execute people-based marketing campaigns, tie back to real results, and drive a continual cycle of optimization. We help architect the foundation for data-driven marketing by delivering solutions that integrate customer and prospect data across the enterprise, thereby enabling our clients to establish a single view of the customer. We also support our clients in navigating the complexities of consumer privacy regulation, making it easy and safe for them to use innovative technology, maintain choice in channels and media, and stay agile in this competitive era of the consumer. These services allow our clients to generate higher return on marketing investments and, at the same time, drive better, more relevant customer experiences.
The MS segment includes the following service offerings: Marketing Database Services and Strategy and Analytics. The MS segment also included Impact Email Platform and Services until the disposition of the business in August 2016.
28
|
•
|
Marketing Database Services.
Our Marketing Database offering provides solutions that unify consumer data across an enterprise, enabling clients to execute relevant, people-based marketing and activate data across the marketing ecosystem. Our consumer marketing databases, which we design, build, and manage for our clients, make it possible for our clients to collect and analyze information from all sources, thereby increasing customer acquisition, retention, and loyalty. Through our growing partner network, clients are able to integrate their data with best-of-breed marketing solutions while respecting and protecting consumer privacy.
|
Marketing Database Services are generally provided under long-term contracts. Our revenue consists primarily of recurring monthly billings, and to a lesser extent, other volume and variable based billings.
|
•
|
Strategy and Analytics
. Our Strategy and Analytics offering consists of marketing strategists and data scientists who leverage industry knowledge and advanced analytics to assist our clients with identifying growth opportunities, addressing marketing data and technology needs, and adopting best practices. In addition, we help our clients identify and address their data privacy and governance requirements.
|
Strategy and Analytics revenue consists primarily of project-based fees.
|
•
|
Impact Email Platform and Services.
Until the August 2016 disposition, Acxiom Impact™ provided email and cross-channel data-driven marketing solutions for enterprise marketers, including a proprietary marketing platform and agency services.
|
Acxiom Impact
TM
revenue consisted of (1) volume-based fees for the use of the Impact email platform and (2) project-based and retainer-based fees for associated agency services.
Summary
Together, our products and services form the “power grid” for data, the critical foundation for people-based marketing that brands need to engage consumers across today’s highly fragmented landscape of channels and devices.
We provide integrations with the largest number of marketing platforms and data providers in the digital marketing ecosystem, enabling our clients to innovate through their preferred choice of technology, data, and services providers. Our industry-leading identity resolution and data assets power best-in-class consumer identification and linking across channels and devices. And, our integrated services offering provides the expertise required to manage large sets of data legally, ethically, securely, and in a way that protects consumer privacy.
29
Summary Results and Notable Events
A summary of the quarter ended
December 31, 2017
is presented below:
|
•
|
Revenues were $234.9 million, a 5.2% increase from $223.3 million in the same quarter a year ago.
|
|
•
|
Cost of revenue was $115.9 million, a 0.5% decrease from $116.5 million in the same quarter a year ago.
|
|
•
|
Gross margin increased to 50.6% from 47.8% in the same quarter a year ago.
|
|
•
|
Total operating expenses were $107.9 million, a 10.4% increase from $97.7 million in the same quarter a year ago.
|
|
•
|
Cost of revenue and operating expenses for the quarters ended December 31, 2017 and 2016 include the following items:
|
|
◦
|
Non-cash stock compensation of $15.9 million and $13.4 million, respectively (cost of revenue and operating expenses)
|
|
◦
|
Purchased intangible asset amortization of $6.0 million and $4.6 million, respectively (cost of revenue)
|
|
◦
|
Separation and transformation costs of $5.2 million and $4.1 million, respectively (operating expenses)
|
|
◦
|
Restructuring charges and other adjustments of $0.0 million and $2.1 million, respectively (operating expenses)
|
|
•
|
Net earnings increased to $22.9 million or $0.28 per diluted share compared to net earnings of $1.1 million or $0.01 per diluted share in the same quarter a year ago. The increase is primarily due to recent changes as a result of the Tax Act, including a $20.3 million one-time benefit for the remeasurement of net deferred tax liabilities.
|
|
•
|
Net cash provided by operating activities of $43.6 million, a $5.3 million decrease compared to $48.9 million in the same quarter a year ago.
|
|
•
|
The Company repurchased 0.7 million shares of its common stock for $19.7 million under the Company's common stock repurchase program.
|
This summary highlights financial results as well as other significant events and transactions of the Company during the quarter ended
December 31, 2017
. However, this summary is not intended to be a full discussion of the Company’s results. This summary should be read in conjunction with the following discussion of Results of Operations and Capital Resources and Liquidity and with the Company’s condensed consolidated financial statements and footnotes accompanying this report.
30
Results of Operations
A summary of selected financial information for each of the periods reported is presented below (dollars in thousands, except per share amounts):
|
For the three months ended
|
|
For the nine months ended
|
||||||||||||||||||||
|
December 31,
|
|
December 31,
|
||||||||||||||||||||
|
%
|
%
|
|||||||||||||||||||||
|
2017
|
2016
|
|
Change
|
|
2017
|
|
2016
|
|
Change
|
|||||||||||||
|
Revenues
|
$
|
234,871
|
|
$
|
223,312
|
|
5
|
|
$
|
672,625
|
|
$
|
655,380
|
|
3
|
|
||||||
|
Cost of revenue
|
115,920
|
|
116,468
|
|
(1
|
)
|
344,952
|
|
359,392
|
|
(4
|
)
|
||||||||||
|
Gross profit
|
118,951
|
|
106,844
|
|
11
|
|
327,673
|
|
295,988
|
|
11
|
|
||||||||||
|
Total operating expenses
|
107,893
|
|
97,729
|
|
10
|
|
321,869
|
|
271,591
|
|
19
|
|
||||||||||
|
Income from operations
|
11,058
|
|
9,115
|
|
21
|
|
5,804
|
|
24,397
|
|
(76
|
)
|
||||||||||
|
Net earnings
|
22,941
|
|
1,073
|
|
2,038
|
|
18,305
|
|
12,189
|
|
50
|
|
||||||||||
|
Diluted earnings per share
|
$
|
0.28
|
|
$
|
0.01
|
|
2,700
|
|
$
|
0.22
|
|
$
|
0.15
|
|
47
|
|
||||||
Revenues
The Company's revenues by reporting segment for the periods reported is presented below (dollars in thousands):
|
|
For the three months ended
|
|
For the nine months ended
|
|||||||||||||||||||
|
|
December 31,
|
|
December 31,
|
|||||||||||||||||||
|
|
%
|
%
|
||||||||||||||||||||
|
Revenues
|
2017
|
2016
|
|
Change
|
|
2017
|
|
2016
|
|
Change
|
||||||||||||
|
Marketing Services
|
$
|
94,457
|
|
$
|
101,177
|
|
(7
|
)
|
$
|
280,093
|
|
$
|
316,571
|
|
(12
|
)
|
||||||
|
Audience Solutions
|
84,436
|
|
83,399
|
|
1
|
|
238,984
|
|
235,669
|
|
1
|
|
||||||||||
|
Connectivity
|
55,978
|
|
38,736
|
|
45
|
|
153,548
|
|
103,140
|
|
49
|
|
||||||||||
|
Total revenues
|
$
|
234,871
|
|
$
|
223,312
|
|
5
|
|
$
|
672,625
|
|
$
|
655,380
|
|
3
|
|
||||||
Total revenues were
$234.9 million
, an increase of 5.2%, or $11.6 million, from
$223.3 million
in the same quarter a year ago. Strong revenue growth in Connectivity ($17.2 million) was partially offset by a decline in MS of $6.7 million due to non-recurring transactions in the prior year of $4.8 million as well as volume and contract reductions. The impact of exchange rates was positive by approximately $1.5 million.
Total revenues were
$672.6 million
, an increase of 2.6%, or $17.2 million for the
nine months ended
December 31, 2017
. Strong revenue growth in Connectivity ($50.4 million) was partially offset by items totaling $22.8 million: the disposition of the Acxiom Impact business ($20.4 million) and the transition of the Australia operations to a Connectivity focused business ($2.4 million reduction in MS and AS).
MS revenue for the quarter ended
December 31, 2017
was
$94.5 million
, a $6.7 million, or 6.6%, decrease compared to the same quarter a year ago. On a geographic basis, U.S. MS revenue decreased $5.3 million, or 5.7%, due to non-recurring transactions in the prior year of $4.8 million and volume and contract reductions. International MS revenue decreased $1.4 million, or 16.8%. By line of business, Marketing Database revenue decreased $6.8 million (U.S. $4.5 million, Europe $1.1 million and APAC $0.6 million), while Strategy and Analytics was flat quarter over quarter.
MS revenue for the
nine months ended
December 31, 2017
was
$280.1 million
, a $36.5 million, or 11.5%, decrease compared to the same period a year ago. On a geographic basis, U.S. MS revenue decreased $33.8 million, or 11.5%, due to the sale of Acxiom Impact ($20.4 million) and other volume and contract reductions. International MS revenue decreased $2.7 million, or 11.4%. By line of business, Marketing Database revenue decreased $13.3 million (U.S. $9.9 million, Europe $2.7 million and APAC $0.7 million), Strategy and Analytics revenue declined $2.6 million (primarily U.S.) and Impact declined due to the sale of Acxiom Impact.
AS revenue for the quarter ended
December 31, 2017
was
$84.4 million
, a $1.0 million, or 1.2%, increase compared to the same quarter a year ago. On a geographic basis, U.S. AS revenue increased $0.2 million, or 0.2%,
31
due to increases of $1.3 million in Consumer Data and Recognition, offset by a reduction in Digital Data business. International AS revenue increased $0.9 million, or 9.4%, primarily from Europe Digital Data. By line of business, AS revenue growth in Recognition ($1.2 million) and Global Data Sales ($1.1 million) was offset by a reduction in Digital Data ($1.2 million) through our publisher and digital partner network. As the Digital Data business model evolves, some revenue sharing arrangements will convert to license arrangements and certain publishers will decide to seek alternative data relationships. In fact, one significant publisher relationship recently converted to a license-based arrangement. As a result, we would expect more significant revenue declines in our fiscal 2018 fourth quarter. These trends may continue into fiscal 2019.
AS revenue for the
nine months ended
December 31, 2017
was
$239.0 million
, a $3.3 million, or 1.4%, increase compared to the same period a year ago. On a geographic basis, U.S. AS revenue increased $2.3 million, or 1.1%, due to an increase of $8.3 million in Digital Data business offset by decreases in Consumer Data and Recognition. International AS revenue increased $1.1 million, or 4.3%, primarily in Europe. By line of business, AS revenue growth in Digital Data ($11.7 million), through our publisher and digital partner network, was offset by declines in Consumer Data ($8.9 million) and Recognition ($1.6 million). As the Digital Data business model evolves, some revenue sharing arrangements will convert to license arrangements and certain publishers will decide to seek alternative data relationships.
Connectivity revenue for the quarter ended
December 31, 2017
was
$56.0 million
, a $17.2 million, or 44.5%, increase compared to the same quarter a year ago. The increase was due to LiveRamp growth. On a geographic basis, U.S. Connectivity revenue increased $14.6 million, or 40.4%, from the same quarter a year ago. International Connectivity revenue increased $2.6 million, or 100.2%.
Connectivity revenue for the
nine months ended
December 31, 2017
was
$153.5 million
, a $50.4 million, or 48.9%, increase compared to the same period a year ago. The increase was due to LiveRamp growth. On a geographic basis, U.S. Connectivity revenue increased $44.7 million, or 46.7%, from the same period a year ago. International Connectivity revenue increased $5.7 million, or 76.6%.
Cost of revenue and Gross profit
The Company’s cost of revenue and gross profit for each of the periods reported is presented below (dollars in thousands):
|
|
For the three months ended
|
For the nine months ended
|
||||||||||||||||||||
|
|
December 31,
|
December 31,
|
||||||||||||||||||||
|
|
|
|
%
|
|
|
%
|
||||||||||||||||
|
|
2017
|
2016
|
Change
|
2017
|
2016
|
Change
|
||||||||||||||||
|
Cost of revenue
|
$
|
115,920
|
|
$
|
116,468
|
|
(1
|
)
|
$
|
344,952
|
|
$
|
359,392
|
|
(4
|
)
|
||||||
|
Gross profit
|
$
|
118,951
|
|
$
|
106,844
|
|
11
|
|
$
|
327,673
|
|
$
|
295,988
|
|
11
|
|
||||||
|
Gross margin %
|
50.6
|
|
47.8
|
|
6
|
|
48.7
|
|
45.2
|
|
8
|
|
||||||||||
Cost of revenue: Includes all direct costs of sales such as data and other third-party costs directly associated with revenue. Cost of revenue also includes expenses for each of the Company’s operations functions including client services, account management, agency, strategy and analytics, IT, data acquisition, and product operations. Finally, cost of revenue includes amortization of internally developed software and other acquisition related intangibles.
Cost of revenue was
$115.9 million
for the quarter ended
December 31, 2017
, a $0.5 million, or 0.5%, decrease from the same quarter a year ago. Gross margins increased to 50.6% compared to 47.8% in the prior year. The gross margin increase is due to the Connectivity revenue increases and MS cost efficiencies. U.S. gross margins increased to 51.7% in the current year from 49.0% in the prior year again due to the Connectivity revenue growth and MS efficiencies. International gross margins increased to 40.3% from 35.8%.
Cost of revenue was
$345.0 million
for the
nine months ended
December 31, 2017
, a $14.4 million, or 4.0%, decrease from the same period a year ago, due primarily to the disposition of Acxiom Impact ($18.2 million). Gross margins increased to 48.7% compared to 45.2% in the prior year. The gross margin increase is due to the Connectivity revenue increases and MS cost efficiencies. U.S. gross margins increased to 50.0% in the current year from 46.3% for the same reasons. International gross margins increased to 35.2% from 32.5%.
32
Operating Expenses
The Company’s operating expenses for each of the periods reported is presented below (dollars in thousands):
|
|
For the three months ended
|
For the nine months ended
|
||||||||||||||||||||
|
|
December 31,
|
December 31,
|
||||||||||||||||||||
|
|
|
|
%
|
|
|
%
|
||||||||||||||||
|
Operating expenses
|
2017
|
2016
|
Change
|
2017
|
2016
|
Change
|
||||||||||||||||
|
Research and development
|
$
|
23,318
|
|
$
|
20,950
|
|
11
|
|
$
|
70,894
|
|
$
|
58,631
|
|
21
|
|
||||||
|
Sales and marketing
|
53,730
|
|
43,048
|
|
25
|
|
152,288
|
|
118,243
|
|
29
|
|
||||||||||
|
General and administrative
|
30,886
|
|
31,620
|
|
(2
|
)
|
95,166
|
|
91,993
|
|
3
|
|
||||||||||
|
Gains, losses and other items, net
|
(41
|
)
|
2,111
|
|
(102
|
)
|
3,521
|
|
2,724
|
|
29
|
|
||||||||||
|
Total operating expenses
|
$
|
107,893
|
|
$
|
97,729
|
|
10
|
|
$
|
321,869
|
|
$
|
271,591
|
|
19
|
|
||||||
Research and development (“R&D”): Includes operating expenses for the Company’s engineering and product/project management functions supporting research, new development, and related product enhancement.
R&D expenses were
$23.3 million
for the quarter ended
December 31, 2017
, an increase of $2.4 million, or 11.3%, compared to the same quarter a year ago, and are 9.9% of total revenues compared to 9.4% in the prior year. The increase is due primarily to non-cash stock compensation of $0.6 million, and Connectivity and AS investments of $1.9 million and $0.4 million, respectively. The increase in non-cash stock compensation is largely related to the Arbor and Circulate acquisitions.
R&D expenses were
$70.9 million
for the
nine months ended
December 31, 2017
, an increase of $12.3 million, or 20.9%, compared to the same period a year ago, and are 10.5% of total revenues compared to 8.9% in the prior year. The increase is due primarily to non-cash stock compensation of $4.0 million, and Connectivity and AS investments of $8.8 million and $1.6 million, respectively, offset partially by a decrease in MS of $2.8 million related mostly to the U.S. Impact disposition. The increase in non-cash stock compensation is largely related to the Arbor and Circulate acquisitions.
Sales and marketing (“S&M”): Includes operating expenses for the Company’s sales, marketing, and product marketing functions.
S&M expenses were
$53.7 million
for the quarter ended
December 31, 2017
, an increase of $10.7 million, or 24.8%, compared to the same quarter a year ago, and are 22.9% of total revenues compared to 19.3% in the prior year. The increase is due to primarily to non-cash stock compensation of $3.9 million (largely related to the Arbor and Circulate acquisitions), and Connectivity investments of $8.3 million. The increases were partially offset by a decrease in MS ($2.5 million) due primarily to lower variable compensation.
S&M expenses were
$152.3 million
for the
nine months ended
December 31, 2017
, an increase of $34.0 million, or 28.8%, compared to the same period a year ago, and are 22.6% of total revenues compared to 18.0% in the prior year. The increase is due to primarily to non-cash stock compensation of $11.9 million (largely related to the Arbor and Circulate acquisitions), and Connectivity investments of $23.6 million, corporate marketing of $4.2 million, and AS investments of $2.2 million. The increases were partially offset by a decrease in MS ($7.8 million) due primarily to lower variable compensation.
General and administrative (G&A): Represents operating expenses for all corporate functions, including finance, human resources, legal, corporate IT, and the corporate office.
G&A expenses were
$30.9 million
for the quarter ended
December 31, 2017
, a decrease of $0.7 million, or 2.3%, compared to the same quarter a year ago, and are 13.2% of total revenues compared to 14.2% in the prior year. The decrease is due primarily to a decrease in non-cash stock compensation of $1.5 million, incentive compensation accruals, and other cost savings offset by a $1.1 million increase in separation and transformation costs.
G&A expenses were
$95.2 million
for the
nine months ended
December 31, 2017
, an increase of $3.2 million, or 3.4%, compared to the same period a year ago, and are 14.1% of total revenues compared to 14.0% in the prior
33
year. The increase is due primarily to a $12.2 million increase in separation and transformation costs offset partially by a decrease in non-cash stock compensation of $4.5 million, incentive compensation accruals, and other cost savings. Prior year non-cash stock compensation costs were impacted by adjustments to increase expected performance levels for certain performance based awards.
Gains, losses, and other items, net: Represents restructuring costs and other adjustments.
Gains, losses and other items, net of $0.0 million for the quarter ended December 31, 2017 decreased $2.2 million compared to the same quarter a year ago. Gains, losses and other items, net of $3.5 million for the nine months ended December 31, 2017 increased $0.8 million compared to the same period a year ago. The current year includes a $2.1 million charge related to the restructuring of the Redwood City, California lease and $1.5 million in severance and other associate-related charges.
Income from Operations and Profit Margins
The Company’s income from operations, as well as operating margin by segment, for each of the periods reported is presented below (dollars in thousands):
|
|
For the three months ended
|
For the nine months ended
|
||||||||||||||
|
|
December 31,
|
December 31,
|
||||||||||||||
|
|
2017
|
2016
|
2017
|
2016
|
||||||||||||
|
Operating income and margin:
|
|
|
|
|
||||||||||||
|
Marketing Services
|
$
|
22,063
|
|
$
|
21,127
|
|
$
|
63,721
|
|
$
|
61,109
|
|
||||
|
|
23.4
|
%
|
20.9
|
%
|
22.7
|
%
|
19.3
|
%
|
||||||||
|
Audience Solutions
|
33,112
|
|
34,572
|
|
91,151
|
|
89,640
|
|
||||||||
|
|
39.2
|
%
|
41.5
|
%
|
38.1
|
%
|
38.0
|
%
|
||||||||
|
Connectivity
|
6,808
|
|
1,877
|
|
12,475
|
|
3,831
|
|
||||||||
|
|
12.2
|
%
|
4.8
|
%
|
8.1
|
%
|
3.7
|
%
|
||||||||
|
Less:
|
|
|
|
|
|
|
|
|
||||||||
|
Corporate expenses
|
23,862
|
|
24,184
|
|
75,582
|
|
75,342
|
|
||||||||
|
Purchased intangible asset amortization
|
5,971
|
|
4,621
|
|
17,958
|
|
12,588
|
|
||||||||
|
Non-cash stock compensation
|
15,919
|
|
13,427
|
|
46,707
|
|
33,955
|
|
||||||||
|
Restructuring charges
|
(41
|
)
|
2,111
|
|
3,521
|
|
2,725
|
|
||||||||
|
Separation and transformation costs
|
5,214
|
|
4,118
|
|
17,775
|
|
5,573
|
|
||||||||
|
Income from operations
|
$
|
11,058
|
|
$
|
9,115
|
|
$
|
5,804
|
|
$
|
24,397
|
|
||||
|
Total operating margin
|
4.7
|
%
|
4.1
|
%
|
0.9
|
%
|
3.7
|
%
|
||||||||
Income from operations was
$11.1 million
for the quarter ended
December 31, 2017
compared to
$9.1 million
for the same quarter a year ago. Operating margin was
4.7%
compared to
4.1%
. The increase in income from operations of $1.9 million was due primarily to the increase in Connectivity income from operations, offset partially by increases in non-cash stock compensation, largely related to the Arbor and Circulate acquisitions, and separation and transformation costs.
Income from operations was
$5.8 million
for the
nine months ended
December 31, 2017
compared to
$24.4 million
for the same period a year ago. Operating margin was
0.9%
compared to
3.7%
. The decrease of $18.6 million was due primarily to increases in non-cash stock compensation, largely related to the Arbor and Circulate acquisitions, and separation and transformation costs, offset partially by increases in operating segments' income from operations.
MS income from operations was
$22.1 million
, a
23.4%
margin, for the quarter ended
December 31, 2017
compared to
$21.1 million
, a
20.9%
margin, for the same quarter a year ago. U.S. margins increased to 25.8% in the current quarter from 22.2% due to S&M cost reductions. International operating margins decreased to a negative 7.5% from 6.6% due to the revenue decrease.
MS income from operations was
$63.7 million
, a
22.7%
margin, for the
nine months ended
December 31, 2017
compared to
$61.1 million
, a
19.3%
margin, for the same period a year ago. U.S. margins increased to 24.9% in the
34
current period from 20.2% due to R&D and S&M cost reductions, including R&D reductions related to the Impact disposition. International operating margins decreased to a negative 4.2% from 8.3%.
AS income from operations was
$33.1 million
, a
39.2%
margin, for the quarter ended
December 31, 2017
compared to
$34.6 million
, a
41.5%
margin, for the same quarter a year ago. U.S. margins decreased to 39.8% in the current quarter from 42.9% due to flat revenue and investments in S&M and R&D. International operating margins increased to 34.8% from 30.2%.
AS income from operations was
$91.2 million
, a
38.1%
margin, for the
nine months ended
December 31, 2017
compared to
$89.6 million
, a
38.0%
margin, for the same period a year ago. U.S. margins decreased to 39.6% in the current period from 39.7% due to the increase in gross profit offset by investments in S&M and R&D. International operating margins increased to 26.3% from 23.5%.
Connectivity income from operations was
$6.8 million
, a
12.2%
margin, for the quarter ended
December 31, 2017
compared to
$1.9 million
, a
4.8%
margin, for the same quarter a year ago. A $14.8 million increase in gross profit was partially offset by R&D and S&M investments.
Connectivity income from operations was
$12.5 million
, an
8.1%
margin, for the
nine months ended
December 31, 2017
compared to
$3.8 million
, a
3.7%
margin, for the same period a year ago. A $40.2 million increase in gross profit was partially offset by R&D and S&M investments.
Corporate expenses were
$23.9 million
for the quarter ended
December 31, 2017
compared to
$24.2 million
for the same quarter a year ago, and are 10.2% of total revenues compared to 10.8% in the prior year.
Corporate expenses were $75.6 million for the nine months ended
December 31, 2017
compared to $75.3 million for the same period a year ago, and are 11.2% of total revenues compared to 11.5% in the prior year.
Other Expense, Income Taxes and Other Items
Interest expense was $2.6 million for the quarter ended
December 31, 2017
compared to $1.7 million for the same quarter a year ago. The increase is primarily related to $70 million of borrowings in the third quarter of fiscal year 2017 related to the Arbor and Circulate acquisitions and an increase in the average rate of approximately 96 basis points.
Interest expense was $7.4 million for the nine months ended
December 31, 2017
compared to $5.2 million for the same period a year ago. The increase is primarily related to $70 million of borrowings in the third quarter of fiscal year 2017 related to the Arbor and Circulate acquisitions and an increase in the average rate of approximately 81 basis points. On June 20, 2017, the Company refinanced its debt facility to consist of a $600 million revolving credit facility, of which $230 million was outstanding at December 31, 2017.
Other income was $0.4 million for the quarter ended
December 31, 2017
compared to $0.0 million for the same quarter a year ago. Other expense was $0.1 million for the nine months ended
December 31, 2017
compared to other income of $0.1 million for the same period a year ago. Other income and expense primarily consists of foreign currency transaction gains and losses in each period reported. The current year to date period includes $0.7 million for accelerated deferred debt costs related to the debt refinancing.
Income tax benefit was $14.0 million on pretax income of $8.9 million for the quarter ended
December 31, 2017
compared to income tax expense of $6.3 million on pretax income of $7.4 million for the same quarter last year. The decrease in the year-over-year effective tax rate for the quarter ended December 31, 2017 is primarily attributable to the $20.3 million discrete benefit for the remeasurement of net deferred tax liabilities as a result of the Tax Act. In addition, the effective tax rate for the quarter ended December 31, 2017 reflects the Tax Act's permanent reduction in the U.S. federal corporate income tax rate. The effective tax rate for the current quarter was also impacted by nondeductible share-based compensation related to the Arbor and Circulate acquisitions.
Income tax benefit was $20.0 million on pretax loss of $1.7 million for the nine months ended
December 31, 2017
compared to income tax expense of $7.1 million on pretax income of $19.3 million for the same period last year. The increase in the year-over-year effective tax rate for the nine months ended December 31, 2017 is primarily attributable to the $20.3 million discrete benefit for the remeasurement of net deferred tax liabilities as a result of the Tax Act. In addition, the effective tax rate for the nine months ended December 31, 2017 reflects the Tax Act's permanent reduction in the U.S. federal corporate income tax rate. The effective tax rate for the nine months ended
35
December 31, 2017 was impacted by nondeductible share-based compensation related to the Arbor and Circulate acquisitions. In the nine months ended December 31, 2017, the Company also recognized tax benefits of $1.9 million related to net excess tax benefits from share-based compensation. During the nine months ended December 31, 2016, the Company recorded a $4.1 million income tax benefit related to the disposition of the Acxiom Impact business.
As a result of the Tax Act, we have determined that our U.S. federal statutory corporate income tax rate will be 31.5% for the fiscal year ending March 31, 2018, and we expect the U.S. federal statutory rate to be 21% for fiscal years beginning after March 31, 2018.
Over the last three quarters, Acxiom has undergone a comprehensive review of its businesses to drive cleaner lines of sight, clearer accountabilities and to maximize its strategic flexibility. Following this review, the Company intends to reorganize its business and actively explore options to further strengthen Acxiom Marketing Solutions, a business unit combining MS and lines of business from AS, and deliver greater value to its clients. These options may include a strategic partnership, acquisition, tax-free merger, joint venture, tax-free spin-off, sale or other potential strategic combinations.
Capital Resources and Liquidity
Working Capital and Cash Flow
Working capital at
December 31, 2017
totaled
$209.4 million
, a
$71.0 million
increase when compared to
$138.3 million
at March 31, 2017, due primarily to the debt refinancing, as the amended credit agreement does not require periodic principal debt service, and a decrease in accrued payroll.
The Company’s cash is primarily located in the United States. Approximately $18.3 million of the total cash balance of $177.8 million, or approximately 10.3%, is located outside of the United States. The Company has no current plans to repatriate this cash to the United States.
Accounts receivable days sales outstanding was
61
days at
December 31, 2017
compared to 57 days at March 31, 2017, and is calculated as follows (dollars in thousands):
|
|
December 31, 2017
|
March 31,
2017
|
||||||
|
Numerator – trade accounts receivable, net
|
$
|
155,634
|
|
$
|
142,768
|
|
||
|
Denominator:
|
|
|
|
|
||||
|
Quarter revenue
|
234,871
|
|
224,867
|
|
||||
|
Number of days in quarter
|
92
|
|
90
|
|
||||
|
Average daily revenue
|
$
|
2,553
|
|
$
|
2,499
|
|
||
|
Days sales outstanding
|
61
|
|
57
|
|
||||
Net cash provided by operating activities was
$76.4 million
for the
nine months ended
December 31, 2017
, compared to
$85.2 million
in the same period a year ago. The $8.8 million decrease resulted primarily from unfavorable changes in working capital.
Investing activities used cash of $34.9 million during the
nine months ended
December 31, 2017
compared to $162.1 million in the same period a year ago, due primarily to the $137.4 million of net cash paid in the Arbor and Circulate acquisitions in the prior year. Investing activities also consisted of capital expenditures ($27.0 million compared to $30.1 million in the prior period), capitalization of software ($10.3 million compared to $11.2 million in the prior period), net cash received in the disposition of the U.S. Impact business ($4.0 million compared to $17.0 million in the prior period), and $1.0 million in the current year for a long-term investment.
Financing activities used cash of $35.1 million during the
nine months ended
December 31, 2017
compared to cash provided of $26.7 million in the same period a year ago. Proceeds from the debt refinancing of $230.0 million were used to pay off the outstanding $225 million term and revolving loan balances, with interest, along with $4.0 million in fees related to the restated credit agreement. Other financing activities consisted of treasury stock purchases of $39.4 million (1.6 million shares of the Company's common stock pursuant to the board of directors' approved stock repurchase plan) compared to $30.5 million in the prior period (1.3 million shares). Financing activities in the prior year included proceeds from debt of $70.0 million to partially fund the Arbor and Circulate acquisitions.
36
On August 29, 2011, the board of directors adopted a common stock repurchase program. That program was subsequently modified and expanded, most recently on July 28, 2016 (see Note 2 - Earnings Per Share). Under the modified common stock repurchase program, the Company may purchase up to
$400.0 million
of its common stock through the period ending
June 30, 2018
. During the
nine months ended
December 31, 2017
, the Company repurchased
1.6 million
shares of its common stock for
$39.4 million
. Through
December 31, 2017
, the Company had repurchased a total of
18.4 million
shares of its stock for
$325.2 million
, leaving remaining capacity of
$74.8 million
under the stock repurchase program.
Credit and Debt Facilities
See Note 8 “Long-Term Debt” of the Notes to Condensed Consolidated Financial Statements for further details related to the Company’s amended and restated credit agreement.
Based on our current expectations, we believe our liquidity and capital resources will be sufficient to operate our business. However, we may take advantage of opportunities to generate additional liquidity or refinance existing debt through capital market transactions. The amount, nature, and timing of any capital market transactions will depend on our operating performance and other circumstances; our then-current commitments and obligations; the amount, nature, and timing of our capital requirements; any limitations imposed by our current credit arrangements; and overall market conditions.
Off-Balance Sheet Items and Commitments
In connection with the Acxiom Impact disposition, the Company assigned a facility lease to the buyer of the business. The Company guaranteed the facility lease as required by the asset disposition agreement. Should the assignee default, the Company would be required to perform under the terms of the facility lease, which continues through September 2021. At
December 31, 2017
, the Company's maximum potential future rent payments subject to this guarantee totaled
$2.3 million
.
There were no material outstanding letters of credit at
December 31, 2017
or March 31, 2017.
Contractual Commitments
The following table presents the Company’s contractual cash obligations, exclusive of interest, and purchase commitments at
December 31, 2017
. The table does not include the future payment of liabilities related to uncertain tax positions of
$5.1 million
as the Company is not able to predict the periods in which the payments will be made. The amounts for 2018 represent the remaining
three months ending March 31, 2018
. All other periods represent fiscal years ending March 31 (dollars in thousands).
|
|
For the years ending March 31,
|
|||||||||||||||||||||||||||
|
|
2018
|
2019
|
2020
|
2021
|
2022
|
Thereafter
|
Total
|
|||||||||||||||||||||
|
Revolving credit borrowings
|
$
|
—
|
|
$
|
—
|
|
$
|
—
|
|
$
|
—
|
|
$
|
—
|
|
$
|
230,000
|
|
$
|
230,000
|
|
|||||||
|
Other debt
|
588
|
|
1,583
|
|
1,362
|
|
348
|
|
—
|
|
—
|
|
3,881
|
|
||||||||||||||
|
Total long-term debt
|
588
|
|
1,583
|
|
1,362
|
|
348
|
|
—
|
|
230,000
|
|
233,881
|
|
||||||||||||||
|
Operating leases
|
5,113
|
|
19,447
|
|
14,537
|
|
14,181
|
|
13,839
|
|
17,393
|
|
84,510
|
|
||||||||||||||
|
Total contractual cash obligations
|
$
|
5,701
|
|
$
|
21,030
|
|
$
|
15,899
|
|
$
|
14,529
|
|
$
|
13,839
|
|
$
|
247,393
|
|
$
|
318,391
|
|
|||||||
|
|
For the years ending March 31,
|
|||||||||||||||||||||||||||
|
|
|
2018
|
|
2019
|
|
2020
|
|
2021
|
|
2022
|
|
Thereafter
|
|
Total
|
||||||||||||||
|
Total purchase commitments
|
|
$
|
13,080
|
|
|
$
|
22,149
|
|
|
$
|
16,096
|
|
|
$
|
8,262
|
|
|
$
|
1,284
|
|
|
$
|
338
|
|
|
$
|
61,209
|
|
Purchase commitments include contractual commitments for the purchase of data and open purchase orders for equipment, paper, office supplies, construction and other items. Purchase commitments in some cases will be satisfied by entering into future operating leases, capital leases, or other financing arrangements, rather than payment of cash. The above commitments relating to long-term obligations do not include future payments of interest. The Company estimates future interest payments on debt for the remainder of fiscal 2018 of
$2.7 million
.
37
The following are contingencies or guarantees under which the Company could be required, in certain circumstances, to make cash payments as of
December 31, 2017
(dollars in thousands):
|
Lease guarantees
|
$
|
2,260
|
|
|
Surety bonds
|
$
|
405
|
|
While the Company does not have any other material contractual commitments for capital expenditures, certain levels of investments in facilities and computer equipment continue to be necessary to support the growth of the business. In some cases, the Company also licenses software and sells hardware to clients. Management believes that the Company’s existing available debt and cash flow from operations will be sufficient to meet the Company’s working capital and capital expenditure requirements for the foreseeable future. The Company also evaluates acquisitions from time to time, which may require up-front payments of cash.
For a description of certain risks that could have an impact on results of operations or financial condition, including liquidity and capital resources, see “Risk Factors” contained in Part I, Item 1A, of the Company’s 2017 Annual Report.
Non-U.S. Operations
The Company has a presence in the United Kingdom, France, Germany, Poland, Australia, China and Japan. Most of the Company’s exposure to exchange rate fluctuation is due to translation gains and losses as there are no material transactions that cause exchange rate impact. In general, each of the foreign locations is expected to fund its own operations and cash flows, although funds may be loaned or invested from the U.S. to the foreign subsidiaries subject to limitations in the Company’s revolving credit facility. These advances are considered long-term investments, and any gain or loss resulting from changes in exchange rates as well as gains or losses resulting from translating the foreign financial statements into U.S. dollars are included in accumulated other comprehensive income. Exchange rate movements of foreign currencies may have an impact on the Company’s future costs or on future cash flows from foreign investments. The Company has not entered into any foreign currency forward exchange contracts or other derivative instruments to hedge the effects of adverse fluctuations in foreign currency exchange rates.
Critical Accounting Policies
We prepare our condensed consolidated financial statements in conformity with U.S. GAAP. These accounting principles require management to make certain judgments and assumptions that affect the reported amounts of assets and liabilities and the disclosure of contingent assets and liabilities as of the date of the financial statements and the reported amounts of revenues and expenses during the reporting periods. The consolidated financial statements in the Company’s 2017 Annual Report include a summary of significant accounting policies used in the preparation of Acxiom’s consolidated financial statements. In addition, the Management’s Discussion and Analysis filed as part of the 2017 Annual Report contains a discussion of the policies that management has identified as the most critical because they require management’s use of complex and/or significant judgments. None of the Company’s critical accounting policies have materially changed since the date of the last annual report.
Accounting Pronouncements Adopted During the Current Year
See “Accounting Pronouncements Adopted During the Current Year” under Note 1, “Basis of Presentation and Summary of Significant Accounting Policies,” of the Notes to Condensed Consolidated Financial Statements for a discussion of certain accounting standards that have been issued and were adopted during the current fiscal year.
New Accounting Pronouncements Not Yet Adopted
See “Recent Accounting Pronouncements Not Yet Adopted” under Note 1, “Basis of Presentation and Summary of Significant Accounting Policies,” of the Notes to Condensed Consolidated Financial Statements for a discussion of certain accounting standards that have been issued but not yet adopted.
38
Forward-looking Statements
This Quarterly Report on Form 10-Q contains forward-looking statements. These statements, which are not statements of historical fact, may contain estimates, assumptions, projections and/or expectations regarding the Company’s financial position, results of operations, market position, product development, growth opportunities, economic conditions, and other similar forecasts and statements of expectation. Forward-looking statements are often identified by words or phrases such as “anticipate,” “estimate,” “plan,” “expect,” “believe,” “intend,” “foresee,” or the negative of these terms or other similar variations thereof. These forward-looking statements are not guarantees of future performance and are subject to a number of factors and uncertainties that could cause the Company’s actual results and experiences to differ materially from the anticipated results and expectations expressed in the forward-looking statements.
Forward-looking statements may include but are not limited to the following:
|
•
|
management’s expectations about the macro economy;
|
|
•
|
statements containing a projection of revenues, income (loss), earnings (loss) per share, capital expenditures, dividends, capital structure, or other financial items;
|
|
•
|
statements of the plans and objectives of management for future operations, including, but not limited to, those statements contained under the heading “Acxiom’s Growth Strategy” in Part I, Item 1 of the Company's 2017 Annual Report on Form 10-K;
|
|
•
|
statements of future economic performance, including, but not limited to, those statements contained in Management’s Discussion and Analysis of Financial Condition and Results of Operations contained in the Company's 2017 Annual Report on Form 10-K;
|
|
•
|
statements containing any assumptions underlying or relating to any of the above statements; and
|
|
•
|
statements containing a projection or estimate
|
Among the factors that may cause actual results and expectations to differ from anticipated results and expectations expressed in such forward-looking statements are the following:
|
•
|
the risk factors described in Part I, “Item 1A. Risk Factors” included in the Company's 2017 Annual Report and those described from time to time in our future reports filed with the SEC;
|
|
•
|
the possibility that, in the event a change of control of the Company is sought, certain clients may attempt to invoke provisions in their contracts allowing for termination upon a change in control, which may result in a decline in revenue and profit;
|
|
•
|
the possibility that the integration of acquired businesses may not be as successful as planned;
|
|
•
|
the possibility that the fair value of certain of our assets may not be equal to the carrying value of those assets now or in future time periods;
|
|
•
|
the possibility that sales cycles may lengthen;
|
|
•
|
the possibility that we will not be able to properly motivate our sales force or other associates;
|
|
•
|
the possibility that we may not be able to attract and retain qualified technical and leadership associates, or that we may lose key associates to other organizations;
|
|
•
|
the possibility that we will not be able to continue to receive credit upon satisfactory terms and conditions;
|
|
•
|
the possibility that competent, competitive products, technologies or services will be introduced into the marketplace by other companies;
|
39
|
•
|
the possibility that there will be changes in consumer or business information industries and markets that negatively impact the Company;
|
|
•
|
the possibility that we will not be able to protect proprietary information and technology or to obtain necessary licenses on commercially reasonable terms;
|
|
•
|
the possibility that there will be changes in the legislative, accounting, regulatory and consumer environments affecting our business, including but not limited to litigation, legislation, regulations and customs impairing our ability to collect, manage, aggregate and use data;
|
|
•
|
the possibility that data suppliers might withdraw data from us, leading to our inability to provide certain products and services;
|
|
•
|
the possibility that data purchasers will reduce their reliance on us by developing and using their own, or alternative, sources of data generally or with respect to certain data elements or categories;
|
|
•
|
the possibility that we may enter into short-term contracts, which would affect the predictability of our revenues;
|
|
•
|
the possibility that the amount of ad hoc, volume-based and project work will not be as expected;
|
|
•
|
the possibility that we may experience a loss of data center capacity or interruption of telecommunication links or power sources;
|
|
•
|
the possibility that we may experience failures or breaches of our network and data security systems, leading to potential adverse publicity, negative customer reaction, or liability to third parties;
|
|
•
|
the possibility that our clients may cancel or modify their agreements with us;
|
|
•
|
the possibility that we will not successfully complete customer contract requirements on time or meet the service levels specified in the contracts, which may result in contract penalties or lost revenue;
|
|
•
|
the possibility that we may experience processing errors that result in credits to customers, re-performance of services or payment of damages to customers;
|
|
•
|
general and global negative economic conditions; and
|
|
•
|
our tax rate and other effects of the changes to U.S. federal tax law.
|
With respect to the provision of products or services outside our primary base of operations in the United States, all of the above factors apply, along with the difficulty of doing business in numerous sovereign jurisdictions due to differences in scale, competition, culture, laws and regulations.
Other factors are detailed from time to time in periodic reports and registration statements filed with the SEC. The Company believes that it has the product and technology offerings, facilities, associates and competitive and financial resources for continued business success, but future revenues, costs, margins and profits are all influenced by a number of factors, including those discussed above, all of which are inherently difficult to forecast.
In light of these risks, uncertainties and assumptions, the Company cautions readers not to place undue reliance on any forward-looking statements. The Company undertakes no obligation to publicly update or revise any forward-looking statements based on the occurrence of future events, the receipt of new information or otherwise.
40
We believe there have been no material changes in our market risk exposures for the
nine months ended
December 31, 2017
, as compared with those discussed in our Annual Report on Form 10-K for the fiscal year ended March 31, 2017.
(a) Evaluation of Disclosure Controls and Procedures.
Our management, with the participation of our Chief Executive Officer and President (our principal executive officer) and our Chief Financial Officer and Executive Vice President (our principal financial and accounting officer), evaluated the effectiveness of our disclosure controls and procedures (as defined under Rule 13a-15(e) of the Securities Exchange Act of 1934, as amended). Based on this evaluation, our principal executive officer and our principal financial and accounting officer concluded that as of
December 31, 2017
, our disclosure controls and procedures were effective.
(b) Changes in Internal Control over Financial Reporting.
There have been no changes in our internal control over financial reporting that occurred during the fiscal quarter ended
December 31, 2017
that have materially affected, or are reasonably likely to materially affect, our internal control over financial reporting.
41
There are currently no matters pending against the Company or its subsidiaries for which the potential exposure is considered material to the Company’s condensed consolidated financial statements.
The risks described in Part I, Item 1A, “Risk Factors” in our Annual Report on Form 10-K for the year ended March 31, 2017, which was filed with the Securities and Exchange Commission on May 26, 2017, remain current in all material respects. Those risk factors do not identify all risks that we face. Our operations could also be affected by factors that are not presently known to us or that we currently consider to be immaterial to our operations. If any of the identified risks or others not specified in our SEC filings materialize, our business, financial condition, or results of operations could be materially adversely affected. In these circumstances, the market price of our common stock could decline.
(a)
Not applicable.
(b)
Not applicable.
(c)
The table below provides information regarding purchases by Acxiom of its common stock during the periods indicated.
|
|
|
|
|
Maximum Number (or Approximate
|
||||||||
|
|
Total Number
|
Average Price
|
Total Number of Shares
|
Dollar Value) of Shares that May Yet
|
||||||||
|
|
of Shares
|
Paid
|
Purchased as Part of Publicly
|
Be Purchased Under the
|
||||||||
|
Period
|
Purchased
|
Per Share
|
Announced Plans or Programs
|
Plans or Programs
|
||||||||
|
October 2017
|
—
|
|
n/a
|
—
|
|
$
|
94,474,907
|
|
||||
|
November 2017
|
339,883
|
|
26.54
|
339,883
|
|
85,455,426
|
|
|||||
|
December 2017
|
389,081
|
|
27.36
|
389,081
|
|
74,809,780
|
|
|||||
|
Total
|
728,964
|
|
26.98
|
728,964
|
|
$
|
74,809,780
|
|
||||
On August 29, 2011, the board of directors adopted a common stock repurchase program. That program was subsequently modified and expanded, most recently on July 28, 2016. Under the modified common stock repurchase program, the Company may purchase up to
$400.0 million
of its common stock through the period ending
June 30, 2018
. Through
December 31, 2017
, the Company had repurchased a total of
18.4 million
shares of its stock for
$325.2 million
, leaving remaining capacity of
$74.8 million
under the stock repurchase program.
Not applicable.
Not applicable.
Not applicable.
42
The following exhibits are filed with this quarterly report:
|
10.1
|
|
||
|
10.2
|
|
||
|
10.3
|
|
||
|
10.4
|
|
||
|
10.5
|
|
||
|
10.6
|
|
||
|
10.7
|
|
||
|
10.8
|
|
||
|
31.1
|
|
||
|
|
|
||
|
31.2
|
|
||
|
|
|
||
|
32.1
|
|
||
|
|
|
||
|
32.2
|
|
||
|
|
|
||
43
|
101
|
|
The following financial information from our Quarterly Report on Form 10-Q for the quarter ended December 31, 2017, formatted in XBRL: (i) Condensed Consolidated Balance Sheets at December 31, 2017, and March 31, 2017, (ii) Condensed Consolidated Statements of Operations for the Three Months ended December 31, 2017 and 2016, (iii) Condensed Consolidated Statements of Operations for the Nine Months ended December 31, 2017 and 2016, (iv) Condensed Consolidated Statements of Comprehensive Income (Loss) for the Three Months ended December 31, 2017 and 2016, (v) Condensed Consolidated Statements of Comprehensive Income (Loss) for the Nine Months ended December 31, 2017 and 2016, (vi) Condensed Consolidated Statement of Equity for the Nine Months ended December 31, 2017, (vii) Condensed Consolidated Statements of Cash Flows for the Nine Months ended December 31, 2017 and 2016, and (vi) the Notes to Condensed Consolidated Financial Statements, tagged in detail.
|
|
44
SIGNATURE
Pursuant to the requirements of the Securities Exchange Act of 1934, the Registrant has duly caused this report to be signed on its behalf by the undersigned thereunto duly authorized.
|
|
Acxiom Corporation
|
|
|
|
|
|
|
|
|
|
|
Dated: February 7, 2018
|
|
|
|
|
|
|
|
|
By:
|
/s/ Warren C. Jenson
|
|
|
|
(Signature)
|
|
|
|
Warren C. Jenson
|
|
|
|
Chief Financial Officer & Executive Vice President
|
|
|
|
(principal financial and accounting officer)
|
45
TABLE OF CONTENTS
Part I. Financial InformationItem 1. Financial StatementsItem 2. Management S Discussion and Analysis Of Financial Condition and Results Of OperationsItem 3. Quantitative and Qualitative Disclosures About Market RiskItem 4. Controls and ProceduresPart II. Other InformationItem 1. Legal ProceedingsItem 1A. Risk FactorsItem 2. Unregistered Sales Of Equity Securities and Use Of ProceedsItem 3. Defaults Upon Senior SecuritiesItem 4. Mine Safety DisclosuresItem 5. Other InformationItem 6. Exhibits