ROYAL CARIBBEAN CRUISES LTD
10-Ks and 10-Qs
|
|
|
|
|
|
|
|
|
|
|
|
|
|
|
|
|
|
|
|
|
|
|
|
|
|
|
|
|
|
|
|
|
|
|
|
|
|
|
|
|
|
|
|
|
|
|
|
|
|
|
|
|
|
|
|
|
|
|
SECURITIES AND EXCHANGE COMMISSION
Washington, D.C. 20549
FORM 10-K
|
(Mark One)
|
|
|
x
|
ANNUAL REPORT PURSUANT TO SECTION 13 OR 15(d) OF THE SECURITIES EXCHANGE ACT OF 1934
|
For the fiscal year ended
December 31, 2017
or
|
o
|
TRANSITION REPORT PURSUANT TO SECTION 13 OR 15(d) OF THE SECURITIES EXCHANGE ACT OF 1934
|
For the transition period from to
Commission file number: 1-11884
ROYAL CARIBBEAN CRUISES LTD.
(Exact name of registrant as specified in its charter)
|
Republic of Liberia
(State or other jurisdiction of
incorporation or organization)
|
98-0081645
(I.R.S. Employer Identification No.)
|
1050 Caribbean Way, Miami, Florida 33132
(Address of principal executive offices) (zip code)
(305) 539-6000
(Registrant's telephone number, including area code)
Securities registered pursuant to Section 12(b) of the Act:
|
Title of each class
|
Name of each exchange on which registered
|
|
|
Common Stock, par value $.01 per share
|
New York Stock Exchange
|
|
Securities registered pursuant to Section 12(g) of the Act: None
Indicate by check mark if the registrant is a well-known seasoned issuer, as defined in Rule 405 of the Securities Act. Yes
x
No
o
Indicate by check mark if the registrant is not required to file reports pursuant to Section 13 or Section 15(d) of the Act. Yes
o
No
x
Indicate by check mark whether the registrant (1) has filed all reports required to be filed by Section 13 or 15(d) of the Securities Exchange Act of 1934 during the preceding 12 months (or for such shorter period that the registrant was required to file such reports), and (2) has been subject to such filing requirements for the past 90 days. Yes
x
No
o
Indicate by check mark whether the registrant has submitted electronically and posted on its corporate Web site, if any, every Interactive Data File required to be submitted and posted pursuant to Rule 405 of Regulation S-T (§232.405 of this chapter) during the preceding 12 months (or for such shorter period that the registrant was required to submit and post such files). Yes
x
No
o
Indicate by check mark if disclosure of delinquent filers pursuant to Item 405 of Regulation S-K (§229.405 of this chapter) is not contained herein, and will not be contained, to the best of registrant's knowledge, in definitive proxy or information statements incorporated by reference in Part III of this Form 10-K or any amendment to this Form 10-K.
o
Indicate by check mark whether the registrant is a large accelerated filer, an accelerated filer, a non-accelerated filer, a smaller reporting company, or an emerging growth company. See the definitions of “large accelerated filer,” “accelerated filer,” “smaller reporting company,” and “emerging growth company” in Rule 12b-2 of the Exchange Act.
|
Large accelerated filer
x
|
Accelerated filer
o
|
Non-accelerated filer
o
|
Smaller reporting company
o
|
|||
|
Emerging growth company
o
|
(Do not check if a smaller reporting company)
|
|||||
If an emerging growth company, indicate by check mark if the registrant has elected not to use the extended transition period for complying with any new or revised financial accounting standards provided pursuant to Section 13(a) of the Exchange Act.
o
Indicate by check mark whether the registrant is a shell company (as defined in Rule 12b-2 of the Act). Yes
o
No
x
The aggregate market value of the registrant's common stock at
June 30, 2017
(based upon the closing sale price of the common stock on the New York Stock Exchange on
June 30, 2017
) held by those persons deemed by the registrant to be non-affiliates was approximately
$19.9 billion
. Shares of the registrant's common stock held by each executive officer and director and by each entity or person that, to the registrant's knowledge, owned 10% or more of the registrant's outstanding common stock as of
June 30, 2017
have been excluded from this number in that these persons may be deemed affiliates of the registrant. This determination of possible affiliate status is not necessarily a conclusive determination for other purposes.
There were
213,749,009
shares of common stock outstanding as of
February 12, 2018
.
DOCUMENTS INCORPORATED BY REFERENCE
Portions of the registrant's Definitive Proxy Statement relating to its
2018
Annual Meeting of Shareholders are incorporated by reference in Part III, Items 10-14 of this Annual Report on Form 10-K as indicated herein.
ROYAL CARIBBEAN CRUISES LTD.
TABLE OF CONTENTS
|
Page
|
||||
As used in this Annual Report on Form 10-K, the terms “Royal Caribbean,” the “Company,” “we,” “our” and “us” refer to Royal Caribbean Cruises Ltd. and, depending on the context, Royal Caribbean Cruises Ltd.’s consolidated subsidiaries and/or affiliates. The terms “Royal Caribbean International,” “Celebrity Cruises,” and “Azamara Club Cruises” refer to our wholly-owned global cruise brands. Throughout this Annual Report on Form 10-K, we also refer to regional brands in which we hold an ownership interest, including “TUI Cruises,” “Pullmantur” and “SkySea Cruises."However
,
because these regional brands are unconsolidated investments, our operating results and other disclosures herein do not include these brands unless otherwise specified. In accordance with cruise vacation industry practice, the term “berths” is determined based on double occupancy per cabin even though many cabins can accommodate three or more passengers.
This Annual Report on Form 10-K also includes trademarks, trade names and service marks of other companies. Use or display by us of other parties’ trademarks, trade names or service marks is not intended to and does not imply a relationship with, or endorsement or sponsorship of us by, these other parties other than as described herein.
General
We are the world’s second largest cruise company. We own and operate three global cruise brands: Royal Caribbean International, Celebrity Cruises and Azamara Club Cruises (our "Global Brands"). We also own a 50% joint venture interest in the German brand TUI Cruises, a 49% interest in the Spanish brand Pullmantur and a 36% interest in the Chinese brand SkySea Cruises (collectively, our "Partner Brands"). Together, our Global Brands and our Partner Brands operate a combined total of
49
ships in the cruise vacation industry with an aggregate capacity of approximately
124,070
berths as of
December 31, 2017
.
Our ships operate on a selection of worldwide itineraries that call on approximately
540
destinations on all
seven
continents. In addition to our headquarters in Miami, Florida, we have offices and a network of international representatives around the world which primarily focus on sales and market development.
We compete principally by establishing valued brands that offer exceptional service provided by our crew and on the basis of innovation and quality of ships, variety of itineraries, choice of destinations and price. We believe that our commitment to build state-of-the-art ships and to invest in the maintenance and upgrade of our fleet to, among other things, incorporate our latest signature innovations, allows us to continue to attract new and loyal repeat guests.
We believe cruising continues to be a popular vacation choice due to its inherent value, extensive itineraries and variety of shipboard and shoreside activities. In addition, we believe our brands are well-positioned globally and possess the ability to attract a wide range of guests by appealing to multiple customer bases allowing our global sourcing to be well diversified.
Royal Caribbean was founded in 1968 as a partnership. Its corporate structure has evolved over the years and the current parent corporation, Royal Caribbean Cruises Ltd., was incorporated on July 23, 1985 in the Republic of Liberia under the Business Corporation Act of Liberia.
Our Global Brands
Our Global Brands include Royal Caribbean International, Celebrity Cruises and Azamara Club Cruises.
We believe our Global Brands possess the versatility to enter multiple cruise market segments within the cruise vacation industry. Although each of our Global Brands has its own marketing style as well as ships and crews of various sizes, the nature of the products sold and services delivered by our Global Brands share a common base (i.e., the sale and provision of cruise vacations). Our Global Brands also have similar itineraries as well as similar cost and revenue components. In addition, our Global Brands source passengers from similar markets around the world and operate in
1
similar economic environments with a significant degree of commercial overlap. As a result, we strategically manage our Global Brands as a single business with the ultimate objective of maximizing long-term shareholder value.
Royal Caribbean International
Royal Caribbean International is positioned to compete in both the contemporary and premium segments of the cruise vacation industry. The brand appeals to families with children of all ages, as well as both older and younger couples, providing cruises that generally feature a casual ambiance as well as a variety of activities and entertainment venues. We believe that the quality of the Royal Caribbean International brand allows it to achieve market coverage that is among the broadest of any of the major cruise brands in the cruise vacation industry. Royal Caribbean International’s strategy is to attract an array of vacationing guests by providing a wide variety of itineraries to destinations worldwide including Alaska, Asia, Australia, Bahamas, Bermuda, Canada, the Caribbean, Europe, the Panama Canal and New Zealand with cruise lengths that range from two to 23 nights. Royal Caribbean International offers multiple innovative options for onboard dining, entertainment and other onboard activities. Because of the brand’s ability to deliver extensive and innovative product offerings at an excellent value to consumers, we believe Royal Caribbean International is well positioned to attract new consumers to cruising and to continue to bring loyal repeat guests back for their next vacation.
Under our Royal Caribbean International brand, we operate 24 ships with an aggregate capacity of approximately 76,450 berths. Additionally, we have six ships on order with an aggregate capacity of approximately 30,500 berths. These ships include our fourth and fifth Quantum-class ships, which are scheduled to enter service in the second quarter of 2019 and fourth quarter of 2020, respectively, the fourth and fifth Oasis-class ships, which are scheduled to enter service in the first quarter of 2018 and second quarter of 2021, respectively, and the first and second ships of a new generation, known as our Icon-class, which are expected to enter service in the second quarters of 2022 and 2024, respectively.
Celebrity Cruises
Celebrity Cruises is positioned within the premium segment of the cruise vacation industry. Celebrity Cruises’ strategy is to target affluent consumers by delivering a destination-rich, modern luxury experience on upscale ships that offer, among other things, luxurious accommodations, high-end design spaces, high-standard service and fine dining. Celebrity Cruises offers a range of itineraries to destinations, including Alaska, Asia, Australia, Bermuda, Canada, the Caribbean, Europe, the Galapagos Islands, Hawaii, India, New Zealand, the Panama Canal and South America with cruise lengths ranging from two to 19 nights.
Under our Celebrity Cruises brand, we operate 12 ships with an aggregate capacity of approximately 23,170 berths. Additionally, we have five ships on order with an aggregate capacity of approximately 11,700 berths. These ships include four ships of a new generation, known as our Edge-class, which are expected to enter service in the fourth quarter of 2018, the first quarter of 2020 and the fourth quarters of 2021 and 2022, respectively, and a ship designed for the Galapagos Islands, which is expected to enter service in the second quarter of 2019.
Azamara Club Cruises
Azamara Club Cruises is designed to serve the up-market segment of the North American, United Kingdom and Australian markets. The up-market segment incorporates elements of the premium segment and the luxury segment which is generally characterized by smaller ships, high standards of accommodation and service and exotic itineraries. Azamara Club Cruises’ strategy is to deliver distinctive destination experiences through unique itineraries with more overnights and longer stays as well as comprehensive tours allowing guests to experience the destination in more depth. Azamara Club Cruises offers a variety of itineraries to popular destinations, including Asia, Australia/New Zealand, Northern and Western Europe, the Mediterranean, Central and North America and the less-traveled islands of the Caribbean.
Under our Azamara Club Cruises brand, we operate two ships with an aggregate capacity of approximately 1,400
2
berths offering cruise itineraries ranging from four to 21 nights. Additionally, during 2017, we entered into an agreement to purchase a 700 berth ship that is scheduled to be delivered in March 2018 and expected to enter service during the third quarter of 2018.
Our Partner Brands
Our Global Brands are complemented by our 50% joint venture interest in TUI Cruises, which is specifically tailored for the German market, our 49% interest in the Spanish brand Pullmantur, which is primarily focused on the cruise market in Spain, and our 36% interest in SkySea Cruises, which is specifically tailored for the Chinese market. We account for our investments in our Partner Brands under the equity method of accounting and, accordingly, the operating results of these Partner Brands are not included in our consolidated results of operations. Refer to Note 1.
General
and Note 6.
Other Assets
to our consolidated financial statements under Item 8.
Financial Statements and Supplementary Data
for further details.
TUI Cruises
TUI Cruises is a joint venture owned 50% by us and 50% by TUI AG, a German tourism and shipping company, which is designed to serve the contemporary and premium segments of the German cruise market by offering a product tailored for German guests. All onboard activities, services, shore excursions and menu offerings are designed to suit the preferences of this target market.
TUI Cruises operates six ships, with an aggregate capacity of approximately 13,800 berths. Included in this count is
Mein Schiff 6,
which entered the fleet in May 2017. Additionally, TUI Cruises has two ships on order which are scheduled for delivery in the second quarter of 2018 and the first quarter of 2019, respectively.
Pullmantur
Pullmantur Holdings S.L. ("Pullmantur Holdings"), the parent company of the Pullmantur brand, is a joint venture owned 49% by us and 51% by Springwater Capital LLC ("Springwater"). Pullmantur operates in the contemporary segment of the Spanish and Latin American cruise markets and is designed to attract Spanish-speaking families and couples and includes a Spanish-speaking crew as well as tailored food and entertainment options. The four ships operated by Pullmantur have an aggregate capacity of approximately 7,450 berths.
SkySea Cruises
We have a strategic partnership with Ctrip.com International Ltd. ("Ctrip"), a Chinese travel service provider, to operate the cruise brand known as SkySea Cruises. We and Ctrip each own 36% of the venture, with the remaining equity held by the venture's management and a private equity fund. SkySea Cruises commenced operations during the second quarter of 2015 and operates one ship,
SkySea
Golden Era,
which has a capacity of approximately 1,800 berths. SkySea Cruises offers a custom-tailored product for Chinese cruise guests. All onboard activities, services, shore excursions and menu offerings are designed to suit the preferences of this target market.
Industry
Cruising is considered a well-established vacation sector in the North American and European markets and a developing sector in several other emerging markets. Industry data indicates that market penetration rates are still low and that a significant portion of cruise guests carried are first-time cruisers. We believe this presents an opportunity for long-term growth and a potential for increased profitability.
3
The following table details industry market penetration rates for North America, Europe and Asia/Pacific computed based on the number of annual cruise guests as a percentage of the total population:
|
Year
|
North America
(1)(2)
|
Europe
(1)(3)
|
Asia/Pacific
(1)(4)
|
|||
|
2013
|
3.32%
|
1.24%
|
0.05%
|
|||
|
2014
|
3.46%
|
1.23%
|
0.06%
|
|||
|
2015
|
3.36%
|
1.25%
|
0.08%
|
|||
|
2016
|
3.43%
|
1.23%
|
0.11%
|
|||
|
2017
|
3.56%
|
1.21%
|
0.12%
|
|||
___________________________________________________________________
|
(1)
|
Source: Our estimates are based on a combination of data obtained from publicly available sources including the International Monetary Fund, United Nations, Department of Economic and Social Affairs, Cruise Lines International Association ("CLIA") and G.P. Wild. In addition, our estimates incorporate our own analysis utilizing the same publicly available cruise industry data as a base.
|
|
(2)
|
Our estimates include the United States and Canada.
|
|
(3)
|
Our estimates include European countries relevant to the industry (e.g., Nordics, Germany, France, Italy, Spain and the United Kingdom).
|
|
(4)
|
Our estimates include the Southeast Asia (e.g., Singapore, Thailand and the Philippines), East Asia (e.g., China and Japan), South Asia (e.g., India and Pakistan) and Oceania (e.g., Australia and Fiji Islands) regions.
|
We estimate that the global cruise fleet was served by a weighted average of approximately
517,000
berths during
2017
with approximately
311
ships at the end of
2017
. As of December 31, 2017, there were approximately
75
ships with an estimated
184,000
berths that are expected to be placed in service in the global cruise market between
2018
and
2022
, although it is also possible that ships could be ordered or taken out of service during these periods. We estimate that the global cruise industry carried approximately
25.8 million
cruise guests in
2017
compared to approximately
24.0 million
cruise guests carried in
2016
and approximately
23.0 million
cruise guests carried in
2015
.
The following table details the growth in global weighted average berths and the global, North American, European and Asia/Pacific cruise guests over the past five years (in thousands, except berth data):
|
Year
|
Weighted-Average
Supply of Berths Marketed Globally (1) |
Royal Caribbean Cruises Ltd. Total Berths
(2)
|
Global
Cruise Guests (1) |
North American Cruise Guests
(1)(3)
|
European Cruise Guests
(1)(4)
|
Asia/Pacific Cruise Guests
(1)(5)
|
||||||
|
2013
|
432,000
|
98,750
|
21,343
|
11,710
|
6,430
|
2,045
|
||||||
|
2014
|
448,000
|
105,750
|
22,039
|
12,269
|
6,387
|
2,382
|
||||||
|
2015
|
469,000
|
112,700
|
23,000
|
12,004
|
6,587
|
3,129
|
||||||
|
2016
|
493,000
|
123,270
|
24,000
|
12,274
|
6,512
|
4,466
|
||||||
|
2017
|
517,000
|
124,070
|
25,800
|
12,854
|
6,435
|
5,068
|
||||||
___________________________________________________________________
|
(1)
|
Source: Our estimates of the number of global cruise guests and the weighted-average supply of berths marketed globally are based on a combination of data that we obtain from various publicly available cruise industry trade information sources. We use data obtained from Seatrade Insider, Cruise Industry News and company press releases to estimate weighted-average supply of berths and CLIA and G.P. Wild to estimate cruise guest information. In addition, our estimates incorporate our own analysis utilizing the same publicly available cruise industry data as a base.
|
|
(2)
|
Total berths include our berths related to our Global Brands and Partner Brands.
|
|
(3)
|
Our estimates include the United States and Canada.
|
|
(4)
|
Our estimates include European countries relevant to the industry (e.g., Nordics, Germany, France, Italy, Spain and the United Kingdom).
|
4
|
(5)
|
Our estimates include the Southeast Asia (e.g., Singapore, Thailand and the Philippines), East Asia (e.g., China and Japan), South Asia (e.g., India and Pakistan) and Oceania (e.g., Australia and Fiji Islands) regions.
|
North America
Industry cruise guests are primarily sourced from North America, which represented approximately
50%
of global cruise guests in
2017
. The compound annual growth rate in cruise guests sourced from this market was approximately
2%
from
2013
to
2017
.
Europe
Industry cruise guests sourced from Europe represented approximately
25%
of global cruise guests in
2017
. Cruise guests sourced from this market remained consistent compared to
2013
.
Asia/Pacific
Industry cruise guests sourced from the Asia/Pacific region represented approximately
20%
of global cruise guests in
2017
. The compound annual growth rate in cruise guests sourced from this market was approximately
25%
from
2013
to
2017
. The Asia/Pacific region is experiencing the highest growth rate of the major regions, although it will continue to represent a relatively small sector compared to North America.
Competition
We compete with a number of cruise lines. Our principal competitors are Carnival Corporation & plc, which owns, among others, Aida Cruises, Carnival Cruise Line, Costa Cruises, Cunard Line, Holland America Line, P&O Cruises, Princess Cruises and Seabourn; Disney Cruise Line; MSC Cruises; and Norwegian Cruise Line Holdings Ltd, which owns Norwegian Cruise Line, Oceania Cruises and Regent Seven Seas Cruises. Cruise lines also compete with other vacation alternatives such as land-based resort hotels, internet-based alternative lodging sites and sightseeing destinations for consumers’ leisure time. Demand for such activities is influenced by political and general economic conditions. Companies within the vacation market are dependent on consumer discretionary spending.
Operating Strategies
Our principal operating strategies are to:
|
•
|
protect the health, safety and security of our guests and employees and protect the environment in which our vessels and organization operate,
|
|
•
|
strengthen and support our human capital in order to better serve our global guest base and grow our business,
|
|
•
|
further strengthen our consumer engagement in order to enhance our revenues,
|
|
•
|
increase the awareness and market penetration of our brands globally,
|
|
•
|
focus on cost efficiency, manage our operating expenditures and ensure adequate cash and liquidity, with the overall goal of maximizing our return on invested capital and long-term shareholder value,
|
|
•
|
strategically invest in our fleet through the upgrade and maintenance of existing ships and the transfer of key innovations across each brand, while prudently expanding our fleet with new state-of-the-art cruise ships,
|
|
•
|
capitalize on the portability and flexibility of our ships by deploying them into those markets and
|
5
itineraries that provide opportunities to optimize returns, while continuing our focus on existing key markets,
|
•
|
further enhance our technological capabilities to service customer preferences and expectations in an innovative manner, while supporting our strategic focus on profitability, and
|
|
•
|
maintain strong relationships with travel agencies, which continue to be the principal industry distribution channel, while enhancing our consumer outreach programs.
|
Safety, environment and health policies
We are committed to protecting the safety, environment and health of our guests, employees and others working on our behalf. We are also committed to protecting the marine environment and communities in which we operate. Our efforts in these areas are guided by a Maritime Advisory Board of experts, overseen by the Safety, Environment and Health Committee of our Board of Directors and managed by our dedicated Safety, Environment and Health Department which is responsible for all of our maritime safety, global security, environmental stewardship and medical/public health activities.
We believe in transparent reporting on our safety, environment and health performance as well as our corporate responsibility efforts and annually publish a Sustainability Report in accordance with the guidelines of the Global Reporting Initiative. This report, which is accessible on our corporate website, highlights our progress with regards to those environmental and social aspects of our business that we believe are most significant to our organization and stakeholders. Our corporate website also provides information about our environmental performance goals and our voluntary reporting of onboard security incidents. The foregoing information contained on our website is not a part of any of these reports and is not incorporated by reference herein or in any other report or document we file with the Securities and Exchange Commission.
Human capital
We believe that our employees, both shipboard and shoreside, are a critical success factor for our business. We strive to identify, hire, develop, motivate and retain the best employees, who provide our guests with extraordinary vacations. Attracting, engaging, and retaining key employees has been and will remain critical to our success.
We focus on providing our employees with a competitive compensation structure and development and other personal and professional growth opportunities in order to strengthen and support our human capital. We also select, develop and have strategies to retain high performing leaders to advance the enterprise now and in the future. To that end, we pay special attention to identifying high performing potential leaders and developing deep bench strength so these leaders can assume leadership roles throughout the organization. We strive to maintain a work environment that reinforces collaboration, motivation and innovation, and believe that maintaining our strong employee-focused culture is beneficial to the growth and expansion of our business.
Consumer engagement
We place a strong focus on identifying the needs of our guests and creating product features and innovations that our customers value. We are focused on targeting high-value guests by better understanding consumer data and insights to create communication strategies that resonate with our target audiences.
We target customers across all touch points and identify underlying needs for which guests are willing to pay a premium. We rely on various programs during the cruise-planning, cruising and after-cruise periods aimed at increasing ticket prices, onboard revenues and occupancy. We have and continue to strategically invest in onboard projects on our ships that we believe drive profitability and improve the guest experience.
6
Global awareness and market penetration
We increase brand awareness and market penetration of our cruise brands in various ways, including the use of communication strategies and marketing campaigns designed to emphasize the qualities of each brand and to broaden the awareness of the brand, especially among target groups. Our marketing strategies include the use of traditional media, mobile and digital media, as well as social media and influencers, brand websites and travel agencies. Our brands engage past and potential guests by collaborating with travel partners and through call centers, international offices and international representatives. In addition, our Global Brands target repeat guests with exclusive benefits offered through their respective loyalty programs.
We sell and market our Global Brands, Royal Caribbean International, Celebrity Cruises and Azamara Club Cruises, to guests outside of the United States and Canada through our commercial teams located in the United Kingdom, France, Germany, Norway, Italy, Spain, Singapore, China, Australia, New Zealand and Mexico. We believe that having a local presence in these markets provides us with the ability to react more quickly to local market conditions and better understand our consumer base in each market. We further extend our geographic reach with a network of approximately
60
independent international representatives located throughout the world covering more than
110
countries. Historically, our focus has been to primarily source guests for our Global Brands from North America. We continue to expand our focus on selling and marketing our cruise brands to guests in countries outside of North America by tailoring itineraries and onboard product offerings to the cultural characteristics and preferences of our international guests. In addition, we explore opportunities that may arise to acquire or develop brands tailored to specific markets.
Passenger ticket revenues generated by sales originating in countries outside of the United States were approximately
41%
of total passenger ticket revenues in
2017
and
45%
in each of
2016
and
2015
. International guests have grown from approximately
2.3 million
in
2013
to approximately
2.5 million
in
2017
. Refer to Item 1A.
Risk Factors
-“
Conducting business globally may result in increased costs and other risks”
for a discussion of the risks associated with our international operations.
Cost efficiency, operating expenditures and adequate cash and liquidity
In 2017, we continued our commitment to control our operating costs and will continue to do so in 2018. For example, we continue our initiatives to reduce energy consumption and, by extension, fuel costs. These include the design of more energy-efficient ships as well as the implementation of more efficient hardware, including improvements in operations and voyage planning as well as improvements to the propulsion, machinery, HVAC and lighting systems. The overall impact of these efforts has resulted in an approximate 34% improvement in energy efficiency from 2005 through 2016 and we believe that our energy consumption per guest is currently the lowest in the cruise industry. In order to sustain our competitive advantage, we will continue to seek innovative technologies.
We are focused on maintaining a strong liquidity position, reducing our debt and maintaining investment grade credit metrics. We believe these strategies enhance our ability to achieve our overall goal of maximizing our long-term shareholder value.
Fleet upgrade, maintenance and expansion
We place a strong focus on innovation, which we seek to achieve by introducing new concepts on our new ships and continuously making improvements to our fleet. Several of these innovations have become signature elements of our brands, such as the “Royal Promenade” (a boulevard with shopping, dining and entertainment venues) for the Royal Caribbean International brand and enhanced design features found on our Solstice-class ships for the Celebrity Cruises brand.
Our upgrade and maintenance programs enable us to incorporate many of our latest signature innovations throughout the brand fleet and allow us to benefit from economies of scale by leveraging our suppliers. Ensuring consistency across our fleet provides us with the flexibility to redeploy our ships among our brand portfolio.
7
We are committed to building state-of-the-art ships at a moderate growth rate and we believe our success in this area provides us with a competitive advantage. Our newer vessels traditionally generate higher revenue yield premiums and are more efficient to operate than older vessels.
Our Global Brands have twelve ships expected to be delivered between 2018 and the end of 2024. These consist of
two
Quantum-class ships, which are scheduled to enter service in the second quarter of 2019 and fourth quarter of 2020, respectively,
two
Oasis-class ships, which are scheduled to enter service in the first quarter of 2018 and second quarter of 2021, respectively, four ships of a new generation for Celebrity Cruises, which are scheduled to enter service in the fourth quarter of 2018, the second quarter of 2020 and the fourth quarters of 2021 and 2022, respectively, a ship designed for the Galapagos Islands, which is scheduled to enter service in the second quarter of 2019, and two ships of a new generation for Royal Caribbean International, which are scheduled to enter service in the second quarters of 2022 and 2024, respectively. Additionally, we entered into an agreement to purchase a ship for Azamara Club Cruises that is scheduled to enter service in the third quarter of 2018. The addition of these ships is expected to increase passenger capacity of our Global Brands by approximately 42,900 berths by the end of 2024. Additionally, TUI Cruises, our 50% joint venture, has agreements for the construction of two new ships, which are scheduled to enter service in the second quarter of 2018 and the first quarter of 2019, respectively, with an expected total capacity of approximately
5,700
berths.
In addition, we regularly evaluate opportunities to order new ships, purchase existing ships or sell ships in our current fleet. In the current environment of high industry demand, we recently have placed new ship orders earlier than we have historically done as well as more aggressively sought to sell older capacity.
Markets and itineraries
In an effort to penetrate untapped markets, diversify our consumer base and respond to changing economic and geopolitical market conditions, we continue to seek opportunities to optimally deploy ships to new and stronger markets and itineraries throughout the world. The portability of our ships allows us to readily deploy our ships to meet demand within our existing cruise markets. We make deployment decisions generally 12 to 18 months in advance, with the goal of optimizing the overall profitability of our portfolio. Additionally, the infrastructure investments we have made to create a flexible global sourcing model has made our brands relevant in a number of markets around the world, which allows us to be opportunistic and source the highest yielding guests for our itineraries.
Our ships offer a wide selection of itineraries that call on approximately
540
destinations in
96
countries, spanning all seven continents. We are focused on obtaining the best possible long-term shareholder returns by operating in established markets while growing our presence in developing markets. New capacity allows us to expand into new markets and itineraries. Our brands have expanded their mix of itineraries while strengthening our ability to further penetrate the Asian and Australian markets. Additionally, in order to capitalize on the summer season in the Southern Hemisphere and mitigate the impact of the winter weather in the Northern Hemisphere, our brands have focused on deployment in the Caribbean, Asia and Australia during that period.
In an effort to secure desirable berthing facilities for our ships, and to provide new or enhanced cruise destinations for our guests, we actively assist or invest in the development or enhancement of certain port facilities and infrastructure, including mixed-use commercial properties, located in strategic ports of call. Generally, we collaborate with local, private or governmental entities by providing management and/or financial assistance and often enter into long-term port usage arrangements. Our participation in these efforts is generally accomplished via investments with the relevant government authority and/or various other strategic partnerships established to develop and/or operate the port facilities, by providing direct development and management expertise or in certain limited circumstances, by providing direct or indirect financial support. In exchange for our involvement, we generally secure preferential berthing rights for our ships.
8
Technological capabilities
The need to develop and use innovative technology is increasingly important. Technology is a pervasive part of virtually every business process we use to support our strategic focus and provide a quality experience to our customers before, during and after their cruise. In the last few years, we introduced RFID WOW bands on some of our ships to make many onboard processes easier and more comfortable for our guests. Moreover, as the use of our various websites and social media platforms continue to increase along with the use of technology onboard our ships by both our guests and crew, we continually need to upgrade our systems, infrastructure and technologies to facilitate this growth. For instance, in 2017, we continued to advance our onboard technology in areas such as internet connectivity at sea, guest check-in and dining. Additionally, we have introduced and continue to improve our mobile-friendly websites for our travel partners and direct customers and to invest in mobile apps that enhance the guest experience onboard our ships. Cyber security and data privacy are a continued focus and we have made and will continue to make significant investments to protect our customer data, intellectual property and global operations.
Additionally, as we expand into new markets, we must ensure that we have the proper technology in place to support the market. For instance, our capabilities need to adapt to each of our markets' languages and regulations. As we expand our business, this has been an increased focus for us.
Travel agency support and consumer outreach
Travel agencies continue to be the primary source of ticket sales for our ships. We believe in the value of this distribution channel and invest heavily in maintaining strong relationships with our travel partners. To accomplish this goal, we seek to ensure that our commission rates and incentive structures remain competitive with the marketplace. We provide brand dedicated sales representatives who serve as advisors to our travel partners. We also provide trained customer service representatives, call centers and online training tools.
In addition, we continue to operate our Consumer Outreach department, which provides consumers 24-hour access to our vacation planners and customer service agents in our call centers. In addition, we maintain and invest in our websites, including mobile applications and mobile websites, which allow guests to directly plan, book and customize their cruise, including the ability to add a variety of onboard amenities.
We also have a robust Onboard Cruise Sales department to help guests to book their next cruise vacations while onboard our ships.
Guest Services
We offer to handle virtually all travel aspects related to guest reservations and transportation, including arranging guest pre- and post-hotel stay arrangements and air transportation.
Royal Caribbean International, Celebrity Cruises and Azamara Club Cruises offer rewards to their guests through their loyalty programs, Crown & Anchor Society, Captain’s Club and Le Club Voyage, respectively, to encourage repeat business. Crown & Anchor Society has approximately
12.8 million
members worldwide. Captain’s Club and Le Club Voyage have approximately
3.7 million
members combined worldwide. Members are recognized through increasing membership status by accumulating cruise points or credits, depending on the brand, which may be redeemed on future sailings. Members are awarded points or credits in proportion to the number of cruise days and stateroom category. The loyalty programs provide certain tiers of membership benefits which entitle guests to upgraded experiences and rewards relative to the status achieved once the guests have accumulated the number of cruise points or credits specified for each tier. In addition, upon achieving a certain level of cruise points or credits, members benefit from reciprocal membership benefits across all of our loyalty programs. Examples of the rewards available under our loyalty programs include, but are not limited to, priority ship embarkation, priority waitlist for shore excursions, complimentary laundry service, complimentary internet, booklets with onboard discount offers, upgraded bathroom amenities, private seating on the pool deck, ship tours and, in the case of our most loyal guests who have achieved the highest levels of cruise points or credits, complimentary cruise days. We regularly work to enhance each of our loyalty programs by adding
9
new features and amenities in order to reward our repeat guests.
Operations
Cruise Ships and Itineraries
As of
December 31, 2017
, our Global Brands and Partner Brands collectively operated
49
ships with a selection of worldwide itineraries ranging from two to 23 nights that call on approximately
540
destinations.
The following table presents summary information concerning the ships we expect to operate in
2018
under our Global Brands and Partner Brands and their geographic areas of operation based on current
2018
itineraries (subject to change).
|
Ship
|
Year Ship
Built |
Year Ship
Entered/Will Enter Service (1) |
Approximate
Berths |
Primary Areas of Operation
|
||||
|
Royal Caribbean International
|
||||||||
|
Symphony of the Seas
|
2018
|
2018
|
5,450
|
Mediterranean, Eastern/Western Caribbean
|
||||
|
Harmony of the Seas
|
2016
|
2016
|
5,450
|
Eastern/Western Caribbean
|
||||
|
Ovation of the Seas
|
2016
|
2016
|
4,100
|
Eastern Asia, Australia/New Zealand
|
||||
|
Anthem of the Seas
|
2015
|
2015
|
4,150
|
Bermuda, Canada, Eastern/Southern Caribbean
|
||||
|
Quantum of the Seas
|
2014
|
2014
|
4,150
|
Eastern Asia
|
||||
|
Allure of the Seas
|
2010
|
2010
|
5,450
|
Eastern/Western Caribbean
|
||||
|
Oasis of the Seas
|
2009
|
2009
|
5,450
|
Eastern/Western Caribbean
|
||||
|
Independence of the Seas
|
2008
|
2008
|
3,600
|
Northern Europe, Mediterranean, Western Caribbean
|
||||
|
Liberty of the Seas
|
2007
|
2007
|
3,750
|
Western Caribbean
|
||||
|
Freedom of the Seas
|
2006
|
2006
|
3,750
|
Eastern/Western Caribbean, Mediterranean
|
||||
|
Jewel of the Seas
|
2004
|
2004
|
2,150
|
Mediterranean, Southern Caribbean
|
||||
|
Mariner of the Seas
|
2003
|
2003
|
3,100
|
Eastern Asia, Bahamas
|
||||
|
Serenade of the Seas
|
2003
|
2003
|
2,100
|
Eastern/Southern Caribbean, Northern Europe, Canada, Bermuda
|
||||
|
Navigator of the Seas
|
2002
|
2002
|
3,250
|
Northern Europe, Southern/Western Caribbean, Mediterranean
|
||||
|
Brilliance of the Seas
|
2002
|
2002
|
2,100
|
Northern Europe, Western Caribbean
|
||||
|
Adventure of the Seas
|
2001
|
2001
|
3,200
|
Eastern/Western/Southern Caribbean, Canada
|
||||
|
Radiance of the Seas
|
2001
|
2001
|
2,100
|
Alaska, Australia/New Zealand
|
||||
|
Explorer of the Seas
|
2000
|
2000
|
3,250
|
Alaska, Australia/New Zealand
|
||||
|
Voyager of the Seas
|
1999
|
1999
|
3,250
|
Eastern Asia, Australia/New Zealand
|
||||
|
Vision of the Seas
|
1998
|
1998
|
2,000
|
Mediterranean, Western Caribbean
|
||||
|
Enchantment of the Seas
|
1997
|
1997
|
2,250
|
Bahamas
|
||||
|
Rhapsody of the Seas
|
1997
|
1997
|
2,000
|
Mediterranean, Western Caribbean
|
||||
|
Grandeur of the Seas
|
1996
|
1996
|
1,950
|
Southern Caribbean, Bermuda, Canada, Bahamas
|
||||
|
Majesty of the Seas
|
1992
|
1992
|
2,350
|
Bahamas, Cuba, Western Caribbean
|
||||
|
Empress of the Seas
|
1990
|
2016
|
1,550
|
Bahamas, Cuba, Western Caribbean
|
||||
10
|
Ship
|
Year Ship
Built |
Year Ship
Entered/Will Enter Service (1) |
Approximate
Berths |
Primary Areas of Operation
|
||||
|
Celebrity Cruises
|
|
|
|
|||||
|
Celebrity Edge
|
2018
|
2018
|
2,900
|
Eastern/Western Caribbean
|
||||
|
Celebrity Reflection
|
2012
|
2012
|
3,000
|
Mediterranean, Eastern/Western/Southern Caribbean
|
||||
|
Celebrity Silhouette
|
2011
|
2011
|
2,850
|
Northern Europe, Mediterranean, Eastern/Western/Southern Caribbean
|
||||
|
Celebrity Eclipse
|
2010
|
2010
|
2,850
|
Northern Europe, Mediterranean, Southern Caribbean, South America
|
||||
|
Celebrity Equinox
|
2009
|
2009
|
2,850
|
Eastern/Western/Southern Caribbean
|
||||
|
Celebrity Solstice
|
2008
|
2008
|
2,850
|
Alaska, Australia/New Zealand
|
||||
|
Celebrity Xploration
|
2007
|
2016
|
20
|
Galapagos Islands
|
||||
|
Celebrity Constellation
|
2002
|
2002
|
2,150
|
Mediterranean, Middle East, Southeast Asia
|
||||
|
Celebrity Summit
|
2001
|
2001
|
2,150
|
Southern Caribbean, Bermuda, Canada
|
||||
|
Celebrity Infinity
|
2001
|
2001
|
2,150
|
South America, Alaska, Western Caribbean, Bahamas
|
||||
|
Celebrity Xpedition
|
2001
|
2004
|
100
|
Galapagos Islands
|
||||
|
Celebrity Millennium
|
2000
|
2000
|
2,150
|
Alaska, Southeastern/Eastern Asia
|
||||
|
Celebrity Xperience
|
1982
|
2016
|
50
|
Galapagos Islands
|
||||
|
Azamara Club Cruises
|
||||||||
|
Azamara Quest
|
2000
|
2007
|
700
|
Mediterranean, Eastern/Western/Southern Caribbean, Latin America, Middle East, Australia, Asia
|
||||
|
Azamara Journey
|
2000
|
2007
|
700
|
Southeastern Asia, Eastern Asia, Australia/New Zealand, Mediterranean, Northern Europe, Cuba
|
||||
|
Azamara Pursuit
|
2001
|
2018
|
700
|
Mediterranean, Northern Europe, South America
|
||||
|
Pullmantur
|
||||||||
|
Zenith
|
1992
|
2014
|
1,400
|
Mediterranean, Northern Europe, Eastern Caribbean
|
||||
|
Monarch
|
1991
|
2013
|
2,350
|
Eastern/Southern Caribbean
|
||||
|
Horizon
|
1990
|
2010
|
1,400
|
Mediterranean, Middle East
|
||||
|
Sovereign
|
1988
|
2008
|
2,300
|
Mediterranean, Brazil
|
||||
|
TUI Cruises
|
||||||||
|
Mein Schiff 1
(2)
|
2018
|
2018
|
2,850
|
Southeastern Asia, Middle East, Mediterranean
|
||||
|
Mein Schiff 6
|
2017
|
2017
|
2,500
|
North/South/Central America, Mediterranean
|
||||
|
Mein Schiff 5
|
2016
|
2016
|
2,500
|
Southern Caribbean, Mediterranean, Dubai, Northern Europe
|
||||
|
Mein Schiff 4
|
2015
|
2015
|
2,500
|
Northern Europe, Mediterranean, Dubai
|
||||
|
Mein Schiff 3
|
2014
|
2014
|
2,500
|
Northern Europe, Eastern/Southern Caribbean, Mediterranean, Southeast Asia
|
||||
|
Mein Schiff 2
|
1997
|
2011
|
1,900
|
Mediterranean
|
||||
|
SkySea Cruises
|
||||||||
|
SkySea Golden Era
|
1995
|
2015
|
1,800
|
Eastern Asia
|
||||
|
Total
|
134,070
|
|||||||
11
__________________________________________________________________
|
(1)
|
The year a ship entered service refers to the year in which the ship commenced or is expected to commence cruise revenue operations for the brand.
|
|
(2)
|
TUI Cruises' newbuild scheduled for delivery in 2018 will enter service as
Mein Schiff 1
and the existing
Mein Schiff 1
, not included above, is planned for transfer to an affiliate of TUI AG, our joint venture partner in TUI Cruises.
|
Our Global Brands and our Partner Brands have thirteen ships on order. Two ships on order are being built in Germany by Meyer Werft GmbH, four are being built in Finland by Meyer Turku shipyard, six are being built in France by STX France and one is being built in the Netherlands by De Hoop Lobith. The expected dates that the ships on order will enter service and their approximate berths are as follows:
|
Ship
|
Expected to Enter
Service
|
Approximate
Berths
|
||
|
Royal Caribbean International —
|
|
|
||
|
Oasis-class:
|
|
|
||
|
Symphony of the Seas
|
1st Quarter 2018
|
5,450
|
||
|
Unnamed
|
2nd Quarter 2021
|
5,450
|
||
|
Quantum-class:
|
|
|
||
|
Spectrum of the Seas
|
2nd Quarter 2019
|
4,150
|
||
|
Unnamed
|
4th Quarter 2020
|
4,150
|
||
|
Icon-class:
|
||||
|
Unnamed
|
2nd Quarter 2022
|
5,650
|
||
|
Unnamed
|
2nd Quarter 2024
|
5,650
|
||
|
Celebrity Cruises —
|
||||
|
Edge-class:
|
||||
|
Celebrity Edge
|
4th Quarter 2018
|
2,900
|
||
|
Celebrity Beyond
|
2nd Quarter 2020
|
2,900
|
||
|
Unnamed
|
4th Quarter 2021
|
2,900
|
||
|
Unnamed
|
4th Quarter 2022
|
2,900
|
||
|
Celebrity Flora
|
2nd Quarter 2019
|
100
|
||
|
TUI Cruises (50% joint venture)
(1)
—
|
|
|
||
|
Mein Schiff 1
|
2nd Quarter 2018
|
2,850
|
||
|
Unnamed
|
1st Quarter 2019
|
2,850
|
||
|
Total Berths
|
47,900
|
|||
___________________________________________________________________
|
(1)
|
TUI Cruises plans to offset this additional capacity through the planned transfer of their existing, oldest ships,
Mein Schiff 1
and
Mein Schiff 2,
in 2018 and 2019, respectively, to an affiliate of TUI AG, our joint venture partner in TUI Cruises.
|
In September 2017, we entered into an agreement to purchase a 700 berth ship for our Azamara Club Cruises brand that is scheduled to be delivered in March 2018 and expected to enter service during the third quarter of 2018.
Seasonality
Our revenues are seasonal based on the demand for cruises. Demand is strongest for cruises during the Northern Hemisphere’s summer months and holidays. In order to mitigate the impact of the winter weather in the Northern Hemisphere and to capitalize on the summer season in the Southern Hemisphere, our brands have focused on deployment in the Caribbean, Asia and Australia during that period.
12
Passengers and Capacity
Selected statistical information is shown in the following table (see
Financial Presentation
-
Description of Certain Line Items
and
Selected Operational and Financial Metrics
under Item 7.
Management’s Discussion and Analysis of Financial Condition and Results of Operations
, for definitions):
|
|
Year Ended December 31,
|
||||||||
|
|
2017
|
2016
(1)
|
2015
|
2014
|
2013
|
||||
|
Passengers Carried
|
5,768,496
|
5,754,747
|
5,401,899
|
5,149,952
|
4,884,763
|
||||
|
Passenger Cruise Days
|
40,033,527
|
40,250,557
|
38,523,060
|
36,710,966
|
35,561,772
|
||||
|
Available Passenger Cruise Days (APCD)
|
36,930,939
|
37,844,644
|
36,646,639
|
34,773,915
|
33,974,852
|
||||
|
Occupancy
|
108.4%
|
106.4%
|
105.1%
|
105.6%
|
104.7%
|
||||
___________________________________________________________________
|
(1)
|
Does not include November and December 2015 amounts for Pullmantur as the net Pullmantur result for those months was included within
Other expense
in our consolidated statements of comprehensive income (loss) for the year ended December 31, 2016, as a result of the elimination of the Pullmantur reporting lag, and did not affect Gross Yields, Net Yields, Gross Cruise Costs, Net Cruise Costs and Net Cruise Costs Excluding Fuel. Additionally, effective August 2016, we no longer include Pullmantur Holdings in these amounts.
|
Cruise Pricing
Our cruise ticket prices include accommodations and a wide variety of activities and amenities, including meals and entertainment. Prices vary depending on many factors including the destination, cruise length, stateroom category selected and the time of year the cruise takes place. Although we grant credit terms in select markets mainly outside of the United States, our payment terms generally require an upfront deposit to confirm a reservation, with the balance due prior to the sailing. Our cruises are generally available for sale at least one year in advance and often as much as two years in advance of sailing. During the selling period of a cruise, we continually monitor and adjust our cruise ticket prices for available guest staterooms based on demand, with the objective of maximizing net yields. In early 2015, in an effort to preserve the integrity of our cruise pricing, we implemented a new policy against introducing incremental discounting on our ticket prices in certain markets within 30 days of the sailing date. We continue to follow this policy.
As we grow our business globally, our sale arrangements with travel agents may vary. For instance, our sale arrangements in the mainland Chinese market are primarily composed of travel agent charter and group sales with full payment due close-in to sailing, and to a lesser extent, retail agency and direct sales.
We have developed and implemented enhancements to our reservations system that provide us and our travel partners with additional capabilities. The enhancements also allow us to better understand and react to the current demand and pricing environment and implement a variety of promotions.
We offer air transportation to our guests through our air transportation program available in major cities around the world. Generally, air tickets are sold to guests at prices close to cost which vary by gateway and destination.
Passenger ticket revenues accounted for approximately
72%
,
72%
and
73%
of total revenues in
2017
,
2016
and
2015
, respectively.
Onboard Activities and Other Revenues
Our cruise brands offer modern fleets with a wide array of onboard services, amenities and activities which vary by brand and ship. While many onboard activities are included in the base price of a cruise, we realize additional revenues from, among other things, gaming, the sale of alcoholic and other beverages, internet and other telecommunication services, gift shop items, shore excursions, photography, spa/salon and fitness services, art auctions,
13
retail shops and a wide variety of specialty restaurants and dining options. Many of these services are available for pre-booking prior to embarkation. These activities are provided either directly by us or by independent concessionaires from which we receive a percentage of their revenues.
In conjunction with our cruise vacations, we offer pre- and post-cruise hotel packages to our Royal Caribbean International, Celebrity Cruises and Azamara Club Cruises guests. We also offer cruise vacation protection coverage to guests in a number of markets, which provides guests with coverage for trip cancellation, medical protection and baggage protection. Onboard and other revenues accounted for approximately
28%
,
28%
and
27%
of total revenues in
2017
,
2016
and
2015
, respectively.
Segment Reporting
We operate three wholly-owned cruise brands, Royal Caribbean International, Celebrity Cruises and Azamara Club Cruises. In addition, we have a 50% investment in a joint venture with TUI AG which operates the German brand TUI Cruises, a 49% interest in the Spanish brand Pullmantur and have a 36% interest in the Chinese brand SkySea Cruises. We believe our brands possess the versatility to enter multiple cruise market segments within the cruise vacation industry. Although each of our brands has its own marketing style as well as ships and crews of various sizes, the nature of the products sold and services delivered by our brands share a common base (i.e., the sale and provision of cruise vacations). Our brands also have similar itineraries as well as similar cost and revenue components. In addition, our brands source passengers from similar markets around the world and operate in similar economic environments with a significant degree of commercial overlap. As a result, our brands have been aggregated as a single reportable segment based on the similarity of their economic characteristics, types of consumers, regulatory environment, maintenance requirements, supporting systems and processes as well as products and services provided. Our Chairman and Chief Executive Officer has been identified as the chief operating decision-maker and all significant operating decisions including the allocation of resources are based upon the analyses of the Company as one segment.
(
For financial information see Item 8.
Financial Statements and Supplementary Data
.)
Employees
As of
December 31, 2017
, our Global Brands employed approximately
66,000
employees, including
60,000
shipboard employees as well as
6,000
full-time and
100
part-time employees in our shoreside operations. As of
December 31, 2017
, approximately
85%
of our shipboard employees were covered by collective bargaining agreements.
Insurance
We maintain insurance on the hull and machinery of our ships, with insured values generally equal to the net book value of each ship. This coverage is maintained with reputable insurance underwriters from the British, Scandinavian, French, United States and other reputable international insurance markets.
We are members of three Protection and Indemnity ("P&I") clubs, which are part of a worldwide group of 13 P&I clubs, known as the International Group of P&I Clubs (the “IG”). Liabilities, costs and expenses for illness and injury to crew, guest injury, pollution and other third-party claims in connection with our cruise activities are covered by our P&I clubs, subject to the clubs’ rules and the limits of coverage determined by the IG. P&I coverage provided by the clubs is on a mutual basis and we are subject to additional premium calls in the event of a catastrophic loss incurred by any member of the 13 P&I clubs, whereby the reinsurance limits purchased by the IG are exhausted. We are also subject to additional premium calls based on investment and underwriting shortfalls experienced by our own individual insurers.
We maintain war risk insurance for legal liability to crew, guests and other third parties as well as for loss or damage to our vessels arising from acts of war, including invasion, insurrection, terrorism, rebellion, piracy and hijacking. Our primary war risk coverage is provided by a Norwegian war risk insurance association and our excess war risk insurance is provided by our three P&I clubs. Consistent with most marine war risk policies, our coverage is subject to cancellation in the event of a change in risk. In the event of a war between major powers, our primary policies
14
terminate after thirty days’ notice and our excess policies terminate immediately. Our excess policies are also subject to cancellation after a notice period of seven days in the event of other changes in risk. These notice periods allow for premiums to be renegotiated based on changes in risk.
Insurance coverage for shoreside property and casualty exposures, shipboard inventory, off-vessel liability, directors and officers and other risks are maintained with various global insurance companies.
We do not carry business interruption insurance for our ships based on our evaluation of the risks involved and protective measures already in place, as compared to the cost of insurance.
All insurance coverage is subject to certain limitations, exclusions and deductible levels. In addition, in certain circumstances, we either self-insure or co-insure a portion of these risks. Premiums charged by insurance carriers, including carriers in the maritime insurance industry, increase or decrease from time to time and tend to be cyclical in nature. These cycles are impacted both by our own loss experience and by losses incurred in direct and reinsurance markets. We historically have been able to obtain insurance coverage in amounts and at premiums we have deemed to be commercially acceptable. No assurance can be given that affordable and secure insurance markets will be available to us in the future, particularly for war risk insurance.
Trademarks
We own a number of registered trademarks related to the Royal Caribbean International, Celebrity Cruises and Azamara Club Cruises cruise brands. The registered trademarks include the name “Royal Caribbean International” and its crown and anchor logo, the name “Celebrity Cruises” and its “X” logo, the name “Azamara Club Cruises” and its globe with an “A” logo, and the names of various cruise ships, as well as loyalty program names and other marketing programs. We believe our largest brands' trademarks are widely recognized throughout the world and have considerable value. The duration of trademark registrations varies from country to country. However, trademarks are generally valid and may be renewed indefinitely as long as they are in use and/or their registrations are properly maintained.
Regulation
Our ships are regulated by various international, national, state and local laws, regulations and treaties in force in the jurisdictions in which they operate. In addition, our ships are registered in the Bahamas, Malta or in the case of our ships operating in the Galapagos Islands, Ecuador. Each ship is subject to regulations issued by its country of registry, including regulations issued pursuant to international treaties governing the safety of our ships, guests and crew as well as environmental protection. Each country of registry conducts periodic inspections to verify compliance with these regulations as discussed more fully below. Ships operating out of ports of call around the world are also subject to inspection by the maritime authorities of that country for compliance with international treaties and local regulations. Additionally, ships operating out of the United States ports are subject to inspection by the United States Coast Guard for compliance with international treaties and by the United States Public Health Service for sanitary and health conditions. Our ships are also subject to similar inspections pursuant to the laws and regulations of various other countries our ships visit.
We believe that we are in material compliance with all the regulations applicable to our ships and that we have all licenses necessary to conduct our business. Health, safety, security, environmental and financial responsibility issues are, and we believe will continue to be, an area of focus by the relevant government authorities in the United States and internationally. From time to time, various regulatory and legislative changes may be proposed that could impact our operations and subject us to increasing compliance costs in the future.
Safety and Security Regulations
Our ships are required to comply with international safety standards defined in the International Convention for Safety of Life at Sea (“SOLAS”), which, among other things, establishes requirements for ship design, structural features, materials, construction, lifesaving equipment and safe management and operation of ships to ensure guest
15
and crew safety. The SOLAS standards are revised from time to time and changes are incorporated into the operation of our ships. Compliance with these modified standards have not historically had a material effect on our operating costs. SOLAS incorporates the International Safety Management Code (“ISM Code”), which provides an international standard for the safe management and operation of ships and for pollution prevention. The ISM Code is mandatory for all vessels, including passenger vessel operators.
All of our operations and ships are regularly audited by various national authorities and maintain the required certificates of compliance with the ISM Code.
Our ships are subject to various security requirements, including the International Ship and Port Facility Security Code (“ISPS Code”), which is part of SOLAS, and the U.S. Maritime Transportation Security Act of 2002 (“MTSA”), which applies to ships that operate in U.S. ports. In order to satisfy these security requirements, we implement security measures, conduct vessel security assessments, and develop security plans. The security plans for all of our ships have been submitted to and approved by the respective countries of registry for our ships in compliance with the ISPS Code and the MTSA.
The Cruise Vessel Security and Safety Act of 2010, which applies to passenger vessels which embark or include port stops within the United States, requires the implementation of certain safety design features as well as the establishment of practices for the reporting of and dealing with allegations of crime. The cruise industry supported this legislation and we believe that our internal standards are generally as strict or stricter than the law requires. A few provisions of the law call for regulations which have not yet been finalized; however, based on proposed regulations issued by the U.S. Coast Guard in January 2015, we do not expect any material costs due to implementing these regulations.
Environmental Regulations
We are subject to various international and national laws and regulations relating to environmental protection. Under such laws and regulations, we are generally prohibited from discharging materials other than food waste into the waterways. We have made, and will continue to make, capital and other expenditures to comply with environmental laws and regulations. From time to time, environmental and other regulators consider more stringent regulations, which may affect our operations and increase our compliance costs. We believe that the impact of ships on the global environment will continue to be an area of focus by the relevant authorities throughout the world and, accordingly, may subject us to increasing compliance costs in the future, including the items described below.
Our ships are subject to the International Maritime Organization’s (‘‘IMO’’) regulations under the International Convention for the Prevention of Pollution from Ships (the ‘‘MARPOL Regulations’’) and the International Convention for the Control and Management of Ships Ballast Water and Sediments (Ballast Water Management Convention), which includes requirements designed to minimize pollution by oil, sewage, garbage, air emissions and the transfer of non-native/non-indigenous species. We have obtained the relevant international compliance certificates relating to oil, sewage, air pollution prevention and ballast water for all of our ships.
The MARPOL Regulations impose global limitations on the sulfur content of emissions emitted by ships operating worldwide to 3.5%. The MARPOL Regulations also establish special Emission Control Areas (‘‘ECAs’’) with stringent limitations on sulfur emissions in these areas. There are four established ECAs that restrict sulfur emissions: the Baltic Sea, the North Sea/English Channel, certain waters surrounding the North American coast, and the waters surrounding Puerto Rico and the U.S. Virgin Islands (the “Caribbean ECA”).
Ships operating in these sulfur ECAs have been required to reduce their emissions sulfur content from 1.0% to 0.1%. This reduction has not had a significant impact on our results of operations to date largely due to a number of mitigating steps we have taken over the last several years, including equipping all of our new ships delivered during or after 2014 with advanced emissions purification ("AEP") systems covering all engines and actively developing and testing AEP systems on the majority of our remaining fleet.
16
We continue to implement our AEP system strategy both for our ships on order and for the majority of the ships on our fleet. As our new ships are delivered, they will provide us with additional operational and deployment flexibility. Prior to 2017, we had in place exemptions for 19 of our ships which applied while they were sailing in the North American and Caribbean ECAs. These exemptions delay the requirement to comply with the additional sulfur content reduction pending our continued development and deployment of AEP systems on these ships. By the end of 2017, we completed deployment of the AEP system or systems on 17 of the 19 ships covered by the exemptions. We believe that the learning from our existing endeavors as well as our further efforts with regards to this technology will allow us to implement an effective AEP system retrofit strategy for our fleet.
By January 1, 2020, the MARPOL regulations will require the worldwide limitations on sulfur content on emissions to be reduced from 3.5% to 0.5%. As this regulation is implemented worldwide and if our mitigation strategies are ineffective, including our AEP system retrofit strategy, our fuel costs could increase significantly.
All new ships that began construction after January 1, 2016 are required to meet more stringent nitrogen oxide emission limits when operating within the North American and U.S. Caribbean Sea ECA. We have been in the process of evaluating a number of technological alternatives over the last several years to address these new requirements and believe that we will be able to comply with these limits without a significant impact to our operations or fuel costs.
Effective July 1, 2015, the European Commission adopted legislation that requires cruise ship operators with ships visiting ports in the European Union to monitor and report on the ship’s annual carbon dioxide emissions starting in 2018. Additionally, in 2019, the IMO's monitoring and reporting system (IMO data and collection system), which is applicable to all ship itineraries, will enter into force. While we do not expect compliance with either of these regulations to materially impact our costs or results of operations, the adopting legislations both present the new monitoring and reporting requirements as the first step of a staged approach which could ultimately result in additional costs or charges associated with carbon dioxide emissions.
Effective September 8, 2017, the IMO Ballast Water Management Convention requires ships that carry and discharge ballast water to meet specific discharge standards by installing Ballast Water Treatment Systems within the next five years. We do not expect compliance with this regulation to have a material effect on our results of operations.
Consumer Financial Responsibility Regulations
We are required to obtain certificates from the United States Federal Maritime Commission relating to our ability to satisfy liability in cases of non-performance of obligations to guests, as well as casualty and personal injury. As a condition to obtaining the required certificates, we arrange through our insurers for the provision of surety for our ship-operating companies. The required surety amount is currently
$30.0 million
per operator and is subject to additional consumer price index based adjustments.
We are also required by the United Kingdom, Norway, Finland, and the Baltics to establish our financial responsibility for any liability resulting from the non-performance of our obligations to guests from these jurisdictions. In the United Kingdom we are currently required by the Association of British Travel Agents to provide performance bonds totaling approximately
£44 million
. The Norwegian Travel Guarantee Fund requires us to maintain performance bonds in varying amounts during the course of the year to cover our financial responsibility in Norway, Finland and the Baltics. These amounts ranged from
NOK 39 million
to
NOK 100 million
during
2017
.
Certain other jurisdictions also require that we establish financial responsibility to our guests resulting from the non-performance of our obligations; however, the related amounts do not have a material effect on our costs.
Regulations Regarding Protection of Disabled Persons
In June 2013, the U.S. Architectural and Transportation Barriers Compliance Board proposed guidelines for the construction and alteration of passenger vessels to ensure that the vessels are readily accessible to and usable by passengers with disabilities. Once finalized, these guidelines will be used by the U.S. Department of Transportation
17
and U.S. Department of Justice to implement mandatory and enforceable standards for passenger vessels covered by the Americans with Disabilities Act. While we believe our vessels have been designed and outfitted to meet the needs of our guests with disabilities, we cannot at this time accurately predict whether we will be required to make material modifications or incur significant additional expenses given the uncertainty of the proposed guidelines.
Taxation of the Company
The following is a summary of our principal taxes, exemptions and special regimes. In addition to or instead of income taxation, virtually all jurisdictions where our ships call impose some tax or fee, or both, based on guest headcount, tonnage or some other measure.
Our consolidated operations are primarily foreign corporations engaged in the owning and operating of passenger cruise ships in international transportation.
U.S. Income Taxation
The following is a discussion of the application of the U.S. federal and state income tax laws to us and is based on the current provisions of the U.S. Internal Revenue Code, Treasury Department regulations, administrative rulings, court decisions and the relevant state tax laws, regulations, rulings and court decisions of the states where we have business operations. All of the foregoing is subject to change, and any such change could affect the accuracy of this discussion.
Application of Section 883 of the Internal Revenue Code
We and Celebrity Cruises, Inc. are engaged in a trade or business in the United States, and many of our ship-owning subsidiaries, depending upon the itineraries of their ships, receive income from sources within the United States. Additionally, our United Kingdom tonnage tax company is a ship-operating company classified as a disregarded entity for U.S. federal income tax purposes that may earn U.S. source income. Under Section 883 of the Internal Revenue Code, certain foreign corporations may exclude from gross income (and effectively from branch profits tax as such earnings do not give rise to effectively connected earnings and profits) U.S. source income derived from or incidental to the international operation of a ship or ships, including income from the leasing of such ships.
A foreign corporation will qualify for the benefits of Section 883 if, in relevant part: (1) the foreign country in which the foreign corporation is organized grants an equivalent exemption to corporations organized in the United States; and (2) the stock of the corporation (or the direct or indirect corporate parent thereof) is “primarily and regularly traded on an established securities market” in the United States. In the opinion of our U.S. tax counsel, Drinker Biddle & Reath LLP, based on the representations and assumptions set forth in that opinion, we, Celebrity Cruises Inc. and our ship-owning subsidiaries with U.S. source shipping income qualify for the benefits of Section 883 because we and each of those subsidiaries are incorporated in Liberia, which is a qualifying country, and our common stock is primarily and regularly traded on an established securities market in the United States (i.e., we are a "publicly traded" corporation). If, in the future, (1) Liberia no longer qualifies as an equivalent exemption jurisdiction, and we do not reincorporate in a jurisdiction that does qualify for the exemption, or (2) we fail to qualify as a publicly traded corporation, we and all of our ship-owning or operating subsidiaries that rely on Section 883 to exclude qualifying income from gross income would be subject to U.S. federal income tax on their U.S. source shipping income and income from activities incidental thereto.
We believe that most of our income and the income of our ship-owning subsidiaries, including our U.K. tonnage tax company which is considered a division for U.S. tax purposes, is derived from or incidental to the international operation of a ship or ships and, therefore, is exempt from taxation under Section 883.
Regulations under Section 883 list activities that are not considered by the Internal Revenue Service to be incidental to the international operation of ships including the sale of air and land transportation, shore excursions and pre- and post-cruise tours. Our income from these activities that is earned from sources within the United States will be subject
18
to U.S. taxation.
Taxation in the Absence of an Exemption Under Section 883
If we, the operator of our vessels, Celebrity Cruises Inc., or our ship-owning subsidiaries were to fail to meet the requirements of Section 883 of the Internal Revenue Code, or if the provision was repealed, then, as explained below, such companies would be subject to U.S. income taxation on a portion of their income derived from or incidental to the international operation of our ships.
Because we and Celebrity Cruises Inc. conduct a trade or business in the United States, we and Celebrity Cruises Inc. would be taxable at regular corporate rates on our separate company taxable income (i.e., without regard to the income of our ship-owning subsidiaries) on income which is effectively connected with our U.S. trade or business (generally only income from U.S. sources). In addition, if any of our earnings and profits effectively connected with our U.S. trade or business were withdrawn, or were deemed to have been withdrawn, from our U.S. trade or business, those withdrawn amounts would be subject to a “branch profits” tax at the rate of 30%. We and Celebrity Cruises Inc. would also be potentially subject to tax on portions of certain interest paid by us at rates of up to 30%.
If Section 883 were not available to our ship-owning subsidiaries, each such subsidiary would be subject to a special 4% tax on its U.S. source gross transportation income, if any, each year because it does not have a fixed place of business in the United States and its income is derived from the leasing of a ship.
Other United States Taxation
We and Celebrity Cruises, Inc. earn U.S. source income from activities not considered incidental to international shipping. The tax on such income is not material to our results of operation for all years presented.
State Taxation
We, Celebrity Cruises Inc. and certain of our subsidiaries are subject to various U.S. state income taxes which are generally imposed on each state’s portion of the U.S. source income subject to federal income taxes. Additionally, the state of Alaska subjects an allocated portion of the total income of companies doing business in Alaska and certain other affiliated companies to Alaska corporate state income taxes and also imposes a 33% tax on adjusted gross income from onboard gambling activities conducted in Alaska waters. This did not have a material impact to our results of operations for all years presented.
2017 Tax Cuts and Jobs Act
On December 22, 2017, the Tax Cuts and Jobs Act was signed into law. Among other things, the new legislation reduces the federal corporate income tax rate to 21% from 35%, resulting in an immaterial benefit related to the reduction of our U.S. deferred tax liability. Although there are a number of provisions which apply to us, we do not expect any material impact to our overall tax expense as a result of the legislation.
Maltese and Spanish Income Taxation
Effective July 31, 2016, we sold 51% of our interest in Pullmantur Holdings. We account for our retained investment under the equity method of accounting. There was no tax impact to us as a result of this sale transaction. The surviving Pullmantur company continues to be subject to the tax laws of Spain and Malta.
Under the sale agreement, we remain responsible for pre-sale tax matters with respect to years that are still open under the statute of limitations.
United Kingdom Income Taxation
We operate fifteen ships under companies which have elected to be subject to the United Kingdom tonnage tax
19
regime (“U.K. tonnage tax”).
Companies subject to U.K. tonnage tax pay a corporate tax on a notional profit determined with reference to the net tonnage of qualifying vessels. The requirements for a company to qualify for the U.K. tonnage tax regime include being subject to U.K. corporate income tax, operating qualifying ships, which are strategically and commercially managed in the United Kingdom, and fulfilling a seafarer training requirement.
Relevant shipping profits include income from the operation of qualifying ships and from shipping related activities. Our U.K. income from non-shipping activities which do not qualify under the U.K. tonnage tax regime and which are not considered significant, remain subject to U.K. corporate income tax.
Brazilian Income Taxation
Previously, Pullmantur and our U.K. tonnage tax company chartered certain ships to Brazilian subsidiary companies for operations in Brazil. Both Pullmantur and Royal Caribbean International ceased charters to Brazil in January 2016 and March 2016, respectively. While Brazilian charters took place, the Brazilian subsidiaries' earnings were subject to Brazilian taxation which was not considered significant. The charter payments made to the U.K. tonnage tax company and to Pullmantur were exempt from Brazilian income tax under Brazilian domestic law. Additionally, remittances of revenue from sales of certain cruises in the Brazilian market are subject to taxation.
Chinese Taxation
Our U.K. tonnage tax company operates ships in international transportation in China. The income earned from this operation is exempt from taxation in China under the U.K./China double tax treaty and other circulars addressing indirect taxes. Changes to or failure to qualify for the treaty or circular could cause us to lose the benefits provided which would have a material impact on our results of operations. Our Chinese income from non-shipping activities or from shipping activities not qualifying for treaty or circular protection and which are considered insignificant, remain subject to Chinese taxation.
Other Taxation
We and certain of our subsidiaries are subject to value-added and other indirect taxes most of which are reclaimable, zero-rated or exempt.
Website Access to Reports
We make available, free of charge, access to our Annual Reports, all quarterly and current reports and all amendments to those reports, as soon as reasonably practicable after such reports are electronically filed with or furnished to the Securities and Exchange Commission through our website at
www.rclcorporate.com
. The information contained on our website is not a part of any of these reports and is not incorporated by reference herein.
20
Executive Officers of the Company
As of
February 20, 2018
, our executive officers are:
|
Name
|
Age
|
Position
|
|
|
Richard D. Fain
|
70
|
Chairman, Chief Executive Officer and Director
|
|
|
Jason T. Liberty
|
42
|
Executive Vice President, Chief Financial Officer
|
|
|
Adam M. Goldstein
|
58
|
President and Chief Operating Officer
|
|
|
Michael W. Bayley
|
59
|
President and Chief Executive Officer, Royal Caribbean International
|
|
|
Lisa Lutoff-Perlo
|
60
|
President and Chief Executive Officer, Celebrity Cruises
|
|
|
Lawrence Pimentel
|
66
|
President and Chief Executive Officer, Azamara Club Cruises
|
|
|
Harri U. Kulovaara
|
65
|
Executive Vice President, Maritime
|
|
|
Bradley H. Stein
|
62
|
Senior Vice President, General Counsel, Chief Compliance Officer
|
|
|
Henry L. Pujol
|
50
|
Senior Vice President, Chief Accounting Officer
|
|
Richard D. Fain has served as a director since 1981 and as our Chairman and Chief Executive Officer since 1988. Mr. Fain is a recognized industry leader, having participated in shipping for over 40 years and having held a number of prominent industry positions, such as Chairman of the Cruise Lines International Association (CLIA), the largest cruise industry trade association. He currently serves as Chairman of the University of Miami Board of Trustees as well as on the National Board of the Posse Foundation. He is also former chairman of the Miami Business Forum, the Greater Miami Convention and Visitors Bureau, and the United Way of Miami-Dade.
Jason T. Liberty has been employed by the Company since 2005 and has served as Chief Financial Officer since May 2013. Mr. Liberty previously served as Senior Vice President, Strategy and Finance from September 2012 through May 2013, overseeing the Company’s Corporate and Strategic Planning, Treasury, Investor Relations and Deployment functions. Prior to this, Mr. Liberty served, from 2010 through 2012, as Vice President of Corporate and Revenue Planning and, from 2008 to 2010, as Vice President of Corporate and Strategic Planning. Before joining Royal Caribbean, Mr. Liberty was a Senior Manager at the international public accounting firm of KPMG LLP.
Adam M. Goldstein has served as President and Chief Operating Officer since April 2014. Prior to this, he served as President of Royal Caribbean International since February 2005 and as its President and Chief Executive Officer since September 2007. Mr. Goldstein has been employed with Royal Caribbean since 1988 in a variety of positions, including Executive Vice President, Brand Operations of Royal Caribbean International, Senior Vice President, Total Guest Satisfaction and Senior Vice President, Marketing. Mr. Goldstein served as National Chair of the United States Travel Association (formerly, Travel Industry Association of America) in 2001 and as Chairman of CLIA in 2015 and 2016. Mr. Goldstein began a two-year term as Chairman of the Florida-Caribbean Cruise Association (FCCA) in January 2017.
Michael W. Bayley has served as President and Chief Executive Officer of Royal Caribbean International since December 2014. Prior to this, he served as President and Chief Executive Officer of Celebrity Cruises since August 2012. Mr. Bayley has been employed by Royal Caribbean for over 30 years, having started as an Assistant Purser onboard one of the Company’s ships. He has served in a number of roles including as Executive Vice President, Operations from February 2012 until August 2012. Other positions Mr. Bayley has held include Executive Vice President, International from May 2010 until February 2012; Senior Vice President, International from December 2007 to May 2010; Senior Vice President, Hotel Operations for Royal Caribbean International; and Chairman and Managing Director of Island Cruises.
Lisa Lutoff-Perlo has served as President and Chief Executive Officer of Celebrity Cruises since December 2014. Prior to this, she served as Executive Vice President, Operations for Royal Caribbean International from September 2012 to December 2014, where she was responsible for all of Royal Caribbean International's hotel, marine and port operations. Ms. Lutoff-Perlo has been employed with the Company since 1985 in a variety of positions within both
21
Celebrity Cruises and Royal Caribbean International. She started at Royal Caribbean International as District Sales Manager for New England and from August 2008 to August 2012 she was responsible for Celebrity Cruises’ hotel operation.
Lawrence Pimentel has served as President and Chief Executive Officer of Azamara Club Cruises since July 2009. From 2001 until January 2009, Mr. Pimentel was President, Chief Executive Officer, Director and co-owner of SeaDream Yacht Club, a privately held luxury cruise line located in Miami, Florida with two yacht-style ships that sailed primarily in the Caribbean and Mediterranean. From April 1991 to February 2001, Mr. Pimentel was President and Chief Executive Officer of Carnival Corp.’s Seabourn Cruise Line and from May 1998 to February 2001, he was President and Chief Executive Officer of Carnival Corp.’s Cunard Line.
Harri U. Kulovaara has served as Executive Vice President, Maritime since January 2005. Mr. Kulovaara is responsible for fleet design and newbuild operations. Mr. Kulovaara also chairs our Maritime Safety Advisory Board. Mr. Kulovaara has been employed with Royal Caribbean since 1995 in a variety of positions, including Senior Vice President, Marine Operations, and Senior Vice President, Quality Assurance. Mr. Kulovaara is a naval architect and engineer.
Bradley H. Stein has served as General Counsel and Corporate Secretary of the Company since 2006. He has also served as Senior Vice President and Chief Compliance Officer of the Company since February 2009 and February 2011, respectively. Mr. Stein has been with Royal Caribbean since 1992. Before joining Royal Caribbean, Mr. Stein worked in private practice in New York and Miami.
Henry L. Pujol has served as Senior Vice President, Chief Accounting Officer of the Company since May 2013. Mr. Pujol originally joined Royal Caribbean in 2004 as Assistant Controller and was promoted to Corporate Controller in May 2007. Before joining Royal Caribbean, Mr. Pujol was a Senior Manager at the international public accounting firm of KPMG LLP.
22
The risk factors set forth below and elsewhere in this Annual Report on Form 10-K are important factors that could cause actual results to differ from expected or historical results. It is not possible to predict or identify all such risks. There may be additional risks that we consider not to be material, or which are not known, and any of these risks could have the effects set forth below.
The ordering of the risk factors set forth below is not intended to reflect any Company indication of priority or likelihood. See Item 7. Management’s Discussion and Analysis of Financial Condition and Results of Operations for a cautionary note regarding forward-looking statements.
Adverse worldwide economic or other conditions could reduce the demand for cruises and passenger spending, adversely impacting our operating results, cash flows and financial condition including potentially impairing the value of our ships and other assets.
The demand for cruises is affected by international, national and local economic conditions. Weak or uncertain economic conditions impact consumer confidence and pose a risk as vacationers may postpone or reduce discretionary spending. This, in turn, may result in cruise booking slowdowns, decreased cruise prices and lower onboard revenues. Given the global nature of our business, we are exposed to many different economies and our business could be hurt by challenging conditions in any of our markets. Any significant deterioration of international, national or local economic conditions could result in a prolonged period of booking slowdowns, depressed cruise prices and reduced onboard revenues.
Fears of terrorist attacks, war, and other hostilities could have a negative impact on our results of operations.
Events such as terrorist attacks, war (or war-like conditions), conflicts (domestic or cross-border), civil unrest and other hostilities, including an escalation in the frequency or severity of incidents, and the resulting political instability, travel restrictions and advisories, and concerns over safety and security aspects of traveling or the fear of any of the foregoing have had, and could have in the future, a significant adverse impact on demand and pricing in the travel and vacation industry. In view of our global operations, we are susceptible to a wide range of adverse events. These events could also result in additional security measures taken by local authorities which may potentially impact access to ports and/or destinations.
Our operating costs could increase due to market forces and economic or geo-political factors beyond our control.
Our operating costs, including fuel, food, payroll and benefits, airfare, taxes, insurance and security costs, are all subject to increases due to market forces and economic or geo-political conditions or other factors beyond our control. Increases in these operating costs could adversely affect our profitability.
Fluctuations in foreign currency exchange rates, fuel prices and interest rates could affect our financial results.
We are exposed to market risk attributable to changes in foreign currency exchange rates, fuel prices and interest rates. Significant changes in any of the foregoing could have a material impact on our financial results, net of the impact of our hedging activities and natural offsets. Our operating results have been and will continue to be impacted, often significantly, by changes in each of these factors. The value of our earnings in foreign currencies is adversely impacted by a strong United States dollar. In addition, any significant increase in fuel prices could materially and adversely affect our business as fuel prices not only impact our fuel costs, but also some of our other expenses, such as crew travel, freight and commodity prices. See “Item 7.
Management’s Discussion and Analysis of Financial Condition and Results of Operations
” and “Item 7A.
Quantitative and Qualitative Disclosures About Market Risk
” for more information.
Conducting business globally may result in increased costs and other risks.
We operate our business globally. Operating internationally exposes us to a number of risks, including increased exposure to a wider range of regional and local economic conditions, volatile local political conditions, potential
23
changes in duties and taxes, including changing and/or uncertain interpretations of existing tax laws and regulations, required compliance with additional laws and policies affecting cruising, vacation or maritime businesses or governing the operations of foreign-based companies, currency fluctuations, interest rate movements, difficulties in operating under local business environments, port quality and availability in certain regions, U.S. and global anti-bribery laws or regulations, imposition of trade barriers and restrictions on repatriation of earnings.
Our future growth strategies increasingly depend on the growth and sustained profitability of certain international markets, such as China. Some factors that will be critical to our success in developing these markets may be different than those affecting our more-established North American and European markets. In the Chinese market, in particular, our future success depends on our ability to continue to raise awareness of our products, evolve the available distribution channels and adapt our offerings to best suit the Chinese consumer. China’s economy differs from the economies of other developed countries in many respects and, as the legal and regulatory system in China continues to evolve, there may be greater uncertainty as to the interpretation and enforcement of applicable laws and regulations. In March 2017, China's National Tourism Administration issued a directive to travel agents to halt sales of holiday packages to South Korea. This travel restriction has had a direct impact on our related itineraries impacting the overall performance of our China business. It is uncertain what the ultimate scope and duration of this restriction will be, but to the extent that this or similar sanctions affecting regional travel and/or tourism continues or are put in place, it may impact local demand, available cruise itineraries and the overall financial performance of the China market.
Operating globally also exposes us to numerous and sometimes conflicting legal, regulatory and tax requirements. In many parts of the world, including countries in which we operate, practices in the local business communities might not conform to international business standards. We must adhere to policies designed to promote legal and regulatory compliance as well as applicable laws and regulations. However, we might not be successful in ensuring that our employees, agents, representatives and other third parties with whom we associate throughout the world properly adhere to them. Failure by us, our employees or any of these third parties to adhere to our policies or applicable laws or regulations could result in penalties, sanctions, damage to our reputation and related costs which in turn could negatively affect our results of operations and cash flows.
We have operations in and source passengers from the United Kingdom and other member countries of the European Union. In March 2017, the United Kingdom notified the European Council of its intent to withdraw from the European Union. Since the initial referendum in June 2016, the expected withdrawal has resulted in increased volatility in the global financial markets and, in particular, in global currency exchange rates. The expected withdrawal could potentially adversely affect tax, legal and regulatory regimes to which our business in the region is subject. The expected withdrawal could also, among other potential outcomes, disrupt the free movement of goods, services and people between the United Kingdom and the European Union. Further, as the expected withdrawal approaches, continued uncertainty around these issues could lead to adverse effects on the economy of the United Kingdom, including the value of the British Pound, and the other economies in which we operate, making it more difficult to source passengers from these regions. These risks may be exacerbated if voters of other countries within the European Union similarly elect to exit the European Union in future referendums.
As a global operator, our business may be also impacted by changes in U.S. policy or priorities in areas such as trade, immigration and/or environmental or labor regulations, among others. Depending on the nature and scope of any such changes, they could impact our domestic and international business operations. Any such changes, and any international response to them, could potentially introduce new barriers to passenger or crew travel and/or cross border transactions, impact our guest experience and/or increase our operating costs.
If we are unable to address these risks adequately, our financial position and results of operations could be adversely affected, including potentially impairing the value of our ships and other assets.
Price increases for commercial airline service for our guests or major changes or reduction in commercial airline service and/or availability could adversely impact the demand for cruises and undermine our ability to provide reasonably priced vacation packages to our guests.
24
Many of our guests depend on scheduled commercial airline services to transport them to or from the ports where our cruises embark or disembark. Increases in the price of airfare would increase the overall price of the cruise vacation to our guests, which may adversely impact demand for our cruises. In addition, changes in the availability of commercial airline services could adversely affect our guests’ ability to obtain airfare, as well as our ability to fly our guests to or from our cruise ships, which could adversely affect our results of operations.
Incidents or adverse publicity concerning our ships and/or passengers or the cruise vacation industry in general, unusual weather conditions and other natural disasters or disruptions could affect our reputation as well as impact our sales and results of operations.
The ownership and/or operation of cruise ships, private destinations, port facilities and shore excursions involves the risk of accidents, illnesses, mechanical failures, environmental incidents and other incidents which may bring into question safety, health, security and vacation satisfaction which could negatively impact our reputation. Incidents involving cruise ships, and, in particular the safety, health and security of guests and crew and media coverage thereof have impacted and could in the future impact demand for our cruises and pricing in the industry. Our reputation and our business could also be damaged by negative publicity regarding the cruise industry in general, including publicity regarding the spread of contagious disease and the potentially adverse environmental impacts of cruising. The considerable expansion in the use of social media and digital marketing over recent years has compounded the potential scope of any negative publicity. If any such incident or news cycle occurs during a time of high seasonal demand, the effect could disproportionately impact our results of operations for the year. In addition, incidents involving cruise ships may result in additional costs to our business, increasing government or other regulatory oversight and, in the case of incidents involving our ships, potential litigation.
Our cruise ships and port facilities may also be adversely impacted by weather or natural disasters or disruptions, such as hurricanes. We are often forced to alter itineraries and occasionally cancel a cruise or a series of cruises or to redeploy our ships due to these types of events, which could have an adverse effect on our sales and profitability in the current and future periods. For example, the 2017 hurricane season was particularly impactful to our operations in the Caribbean. Increases in the frequency, severity or duration of severe weather events, including those related to climate change, could exacerbate the impact and cause further disruption to our operations. In addition, these and any other events which impact the travel industry more generally may negatively impact our ability to deliver guests or crew to our cruises and/or interrupt our ability to obtain services and goods from key vendors in our supply chain. Any of the foregoing could have an adverse impact on our results of operations and on industry performance.
An increase in capacity worldwide or excess capacity in a particular market could adversely impact our cruise sales and/or pricing.
Although our ships can be redeployed, cruise sales and/or pricing may be impacted by the introduction of new ships into the marketplace, reductions in cruise capacity, overall market growth and deployment decisions of ourselves and our competitors. As of December 31, 2017, a total of
75
new ships with approximately
184,000
berths are on order for delivery through
2022
in the cruise industry. The further net growth in capacity from these new ships and future orders, without an increase in the cruise industry’s demand and/or share of the vacation market, could depress cruise prices and impede our ability to achieve yield improvement.
In addition, to the extent that we or our competitors deploy ships to a particular itinerary and the resulting capacity in that region exceeds the demand, we may lower pricing and profitability may be lower than anticipated. This risk exists in emerging cruise markets, such as China, where capacity has grown rapidly over the past few years and in mature markets where excess capacity is typically redeployed. Any of the foregoing could have an adverse impact on our results of operations, cash flows and financial condition, including potentially impairing the value of our ships and other assets.
Unavailability of ports of call may adversely affect our results of operations
.
25
We believe that port destinations are a major reason why guests choose to go on a particular cruise or on a cruise vacation. The availability of ports is affected by a number of factors, including existing capacity constraints, constraints related to the size of certain ships, security, environmental and health concerns, adverse weather conditions and natural disasters, financial limitations on port development, exclusivity arrangements that ports may have with our competitors, local governmental regulations and local community concerns about port development and other adverse impacts on their communities from additional tourists. In addition, fuel costs may adversely impact the destinations on certain of our itineraries. Any limitations on the availability or feasibility of our ports of call or on the availability of shore excursions and other service providers at such ports could adversely affect our results of operations.
Our reliance on shipyards, their subcontractors and our suppliers to implement our newbuild and ship upgrade programs and to repair and maintain our ships exposes us to risks which, if realized, could adversely impact our business.
We rely on shipyards, their subcontractors and our suppliers to effectively construct our new ships and to repair, maintain and upgrade our existing ships on a timely basis and in a cost effective manner.
There are a limited number of shipyards with the capability and capacity to build our new ships and, accordingly, increased demand for available new construction slots and/or continued consolidation in the cruise shipyard industry (including completion of Italian shipbuilder Fincantieri's bid for STX France) could impact our ability to construct new ships when and as planned, cause us to continue to commit to new ship orders earlier than we have historically done so and/or result in stronger bargaining power on the part of the shipyards and the export credit agencies providing financing for the project. Our inability to timely and cost-effectively procure new capacity could have a significant negative impact on our future business plans and results of operations.
Building, repairing, maintaining and/or upgrading a ship is sophisticated work that involves significant risks. In addition, the prices of labor and/or various commodities that are used in the construction of ships can be subject to volatile price changes, including the impact of fluctuations in foreign exchange rates. Shipyards, their subcontractors and/or our suppliers may encounter financial, technical or design problems when doing these jobs. If materialized, these problems could impact the timely delivery or costs of new ships or the ability of shipyards to repair and upgrade our fleet in accordance with our needs or expectations. In addition, delays or mechanical faults may result in cancellation of cruises or, in more severe situations, new ship orders, or necessitate unscheduled drydocks and repairs of ships. These events and any related adverse publicity could result in lost revenue, increased operating expenses, or both, and thus adversely affect our results of operations.
We may lose business to competitors throughout the vacation market
.
We operate in the vacation market and cruising is one of many alternatives for people choosing a vacation. We therefore risk losing business not only to other cruise lines, but also to other vacation operators, which provide other leisure options including hotels, resorts, internet-based alternative lodging sites and package holidays and tours.
We face significant competition from other cruise lines on the basis of cruise pricing, travel agent preference and also in terms of the nature of ships and services we offer to guests. Our principal competitors within the cruise vacation industry include Carnival Corporation & plc, which owns, among others, Aida Cruises, Carnival Cruise Line, Costa Cruises, Cunard Line, Holland America Line, P&O Cruises, Princess Cruises and Seabourn; Disney Cruise Line; MSC Cruises; and Norwegian Cruise Line Holdings Ltd, which owns Norwegian Cruise Line, Oceania Cruises and Regent Seven Seas Cruises. Our revenues are sensitive to the actions of other cruise lines in many areas including pricing, scheduling, capacity and promotions, which can have a substantial adverse impact not only on our revenues, but on overall industry revenues.
In the event that we do not effectively market or differentiate our cruise brands from our competitors or otherwise compete effectively with other vacation alternatives and new or existing cruise companies, our results of operations and financial position could be adversely affected.
26
We may not be able to obtain sufficient financing or capital for our needs or may not be able to do so on terms that are acceptable or consistent with our expectations.
To fund our capital expenditures (including new ship orders), operations and scheduled debt payments, we have historically relied on a combination of cash flows provided by operations, drawdowns under available credit facilities, the incurrence of additional indebtedness and the sale of equity or debt securities in private or public securities markets. Any circumstance or event which leads to a decrease in consumer cruise spending, such as worsening global economic conditions or significant incidents impacting the cruise industry, could negatively affect our operating cash flows. See “-
Adverse worldwide economic, geopolitical or other conditions…
” and “-
Incidents or adverse publicity concerning our ships and/or passengers or the cruise vacation industry…”
for more information.
Although we believe we can access sufficient liquidity to fund our operations, investments and obligations as expected, there can be no assurances to that effect. Our ability to access additional funding as and when needed, our ability to timely refinance and/or replace our outstanding debt securities and credit facilities on acceptable terms and our cost of funding will depend upon numerous factors including, but not limited to, the vibrancy of the financial markets, our financial performance, the performance of our industry in general and the size, scope and timing of our financial needs. In addition, even where financing commitments have been secured, significant disruptions in the capital and credit markets could cause our banking and other counterparties to breach their contractual obligations to us. This could include failures of banks or other financial service companies to fund required borrowings under our loan agreements or to pay us amounts that may become due or return collateral that is refundable under our derivative contracts for hedging of fuel prices, interest rates and foreign currencies or other agreements. If any of the foregoing occurs it may have a negative impact on our cash flows, including our ability to meet our obligations, our results of operations and our financial condition.
Our liquidity could be adversely impacted if we are unable to satisfy the covenants required by our credit facilities.
Our debt agreements contain covenants, including covenants restricting our ability to take certain actions and financial covenants. Our ability to maintain our credit facilities may also be impacted by changes in our ownership base. More specifically, we may be required to prepay our bank financing facilities if any person acquires ownership of more than 50% of our common stock or, subject to certain exceptions, during any 24-month period, a majority of the Board is no longer comprised of individuals who were members of the Board on the first day of such period. Our public debt securities also contain change of control provisions that would be triggered by a third-party acquisition of greater than 50% of our common stock coupled with a ratings downgrade.
Our failure to comply with the terms of our debt facilities could result in an event of default. Generally, if an event of default under any debt agreement occurs, then pursuant to cross default acceleration clauses, our outstanding debt and derivative contract payables could become due and/or terminated. In addition, in such events, our credit card processors could hold back payments to create a reserve. We cannot provide assurances that we would have sufficient liquidity to repay, or the ability to refinance the debt if such amounts were accelerated upon an event of default.
If we are unable to appropriately balance our cost management and capital allocation strategies with our goal of satisfying guest expectations, it may adversely impact our business success.
Our goals call for us to provide high quality products and deliver high quality services. There can be no assurance that we can successfully balance these goals with our cost management and capital allocation strategies. Our business also requires us to make capital allocation decisions, such as ordering new ships and/or upgrading our existing fleet, based on expected market preferences and projected demand. There can be no assurance that our strategies will be successful, which could adversely impact our business, financial condition and results of operations. Investments in older tonnage, in particular, run the risk of not meeting expected returns and diluting related asset values.
Our attempts to expand our business into new markets and new ventures may not be successful.
27
We opportunistically seek to grow our business through, among other things, expansion into new destination or source markets and establishment of new ventures complementary to our current offerings. These attempts to expand our business increase the complexity of our business, require significant levels of investment and can strain our management, personnel, operations and systems. There can be no assurance that these business expansion efforts will develop as anticipated or that we will succeed, and if we do not, we may be unable to recover our investment, which could adversely impact our business, financial condition and results of operations.
Our reliance on travel agencies to sell and market our cruises exposes us to certain risks which, if realized, could adversely impact our business.
We rely on travel agencies to generate the majority of bookings for our ships. Accordingly, we must ensure that our commission rates and incentive structures remain competitive. If we fail to offer competitive compensation packages, these agencies may be incentivized to sell cruises offered by our competitors to our detriment, which could adversely impact our operating results. Our reliance on third-party sellers is particularly pronounced in certain markets, such as China, where we have a large number of travel agent charter and group sales and less retail agency and direct booking. In addition, the travel agent industry is sensitive to economic conditions that impact discretionary income. Significant disruptions, especially disruptions impacting those agencies that sell a high volume of our business, or contractions in the industry could reduce the number of travel agencies available for us to market and sell our cruises, which could have an adverse impact on our financial condition and results of operations.
Disruptions in our shoreside or shipboard operations or our information systems may adversely affect our results of operations.
Our principal executive office and principal shoreside operations are located in Florida, and we have shoreside offices throughout the world. Actual or threatened natural disasters (e.g., hurricanes/typhoons, earthquakes, tornadoes, fires or floods) or similar events in these locations may have a material impact on our business continuity, reputation and results of operations. In addition, substantial or repeated information systems failures, computer viruses or cyber-attacks impacting our shoreside or shipboard operations could adversely impact our business. We do not generally carry business interruption insurance for our shoreside or shipboard operations or our information systems. As such, any losses or damages incurred by us could have an adverse impact on our results of operations.
The loss of key personnel, our inability to recruit or retain qualified personnel, or disruptions among our shipboard personnel due to strained employee relations could adversely affect our results of operations.
Our success depends, in large part, on the skills and contributions of key executives and other employees, and on our ability to recruit, develop and retain high quality personnel. As demand for qualified personnel in the industry grows, we must continue to effectively recruit, train, motivate and retain our employees, both shoreside and on our ships, in order to effectively compete in our industry, maintain our current business and support our projected global growth.
As of December 31, 2017,
85%
of our shipboard employees were covered by collective bargaining agreements. A dispute under our collective bargaining agreements could result in a work stoppage of those employees covered by the agreements. We may not be able to satisfactorily renegotiate these collective bargaining agreements when they expire. In addition, existing collective bargaining agreements may not prevent a strike or work stoppage on our ships. We may also be subject to or affected by work stoppages unrelated to our business or collective bargaining agreements. Any such work stoppages or potential work stoppages could have a material adverse effect on our financial results, as could a loss of key employees, our inability to recruit or retain qualified personnel or disruptions among our personnel.
Business activities that involve our co-investment with third parties may subject us to additional risks.
Partnerships, joint ventures and other business structures involving our co-investment with third parties generally include some form of shared control over the operations of the business and create additional risks, including the possibility that other investors in such ventures could become bankrupt or otherwise lack the financial resources to
28
meet their obligations, or could have or develop business interests, policies or objectives that are inconsistent with ours. With the sale of 51% of our interest in Pullmantur Holdings in July 2016, we continue to expand the breadth of our co-investment activities, which also include TUI Cruises, SkySea Cruises, Grand Bahama Shipyard and minority ownership investments in various port development and other projects. In addition to financial risks, our co-investment activities may also present managerial and operational risks and expose us to reputational or legal concerns. These or other issues related to our co-investment with third parties could adversely impact our operations.
We rely on supply chain vendors and third-party service providers who are integral to the operations of our businesses. These vendors and service providers may be unable or unwilling to deliver on their commitments or may act in ways that could harm our business.
We rely on supply chain vendors to deliver key products to the operations of our businesses around the world. Any event impacting a vendor’s ability to deliver goods of the required quality at the location and time needed could negatively impact our ability to deliver our cruise experience. Events impacting our supply chain could be caused by factors beyond the control of our suppliers or us, including inclement weather, natural disasters, increased demand, problems in production or distribution and/or disruptions in third-party logistics or transportation systems. Interruptions to our supply chain could increase costs and could limit the availability of products critical to our operations.
In order to achieve cost and operational efficiencies, we outsource to third-party vendors certain services that are integral to the operations of our global businesses, such as our onboard concessionaires, certain of our call center operations and operation of a large part of our information technology systems. We are subject to the risk that certain decisions are subject to the control of our third-party service providers and that these decisions may adversely affect our activities. A failure to adequately monitor a third-party service provider’s compliance with a service level agreement or regulatory or legal requirements could result in significant economic and reputational harm to us. There is also a risk the confidentiality, privacy and/or security of data held by third parties or communicated over third-party networks or platforms could become compromised.
A failure to keep pace with developments in technology or technological obsolescence could impair our operations or competitive position.
Our business continues to demand the use of sophisticated technology and systems. These technologies and systems require significant investment and must be proven, refined, updated, and/or replaced with more advanced systems in order to continue to meet our customers’ demands and expectations. If we are unable to do so in a timely manner or within reasonable cost parameters or if we are unable to appropriately and timely train our employees to operate any of these new systems, our business could suffer. We also may not achieve the benefits that we anticipate from any new technology or system, and a failure to do so could result in higher than anticipated costs or could impair our operating results.
We may be exposed to the threat of cyber attacks and/or data breaches, including the risks and costs associated with protecting our key operating systems and maintaining integrity and security of our business information, as well as personal data of our guests, employees and business partners.
Cyber attacks can vary in scope and intent from economically driven attacks to malicious attacks targeting our key operating systems with the intent to disrupt, disable or otherwise cripple our maritime and /or shoreside operations. This can include any combination of phishing attacks, malware and/or viruses targeted at our key systems. The breadth and scope of this threat has grown over time, and the techniques and sophistication used to conduct cyber attacks, as well as the sources and targets of the attacks, change frequently. While we invest time, effort and capital resources to secure our key systems and networks, our security measures cannot provide absolute assurance that we will be successful in preventing or responding to all such attacks.
A successful cyber attack may target us directly, or may be the result of a third party vendor's inadequate care. In either scenario, the Company may suffer damage to its key systems and/or data that could interrupt our operations, adversely impact our reputation and brand and expose us to increased risks of governmental investigation, litigation
29
and other liability, any of which could adversely affect our business. Furthermore, responding to such an attack and mitigating the risk of future attacks could result in additional operating and capital costs in systems technology, personnel, monitoring and other investments.
In addition to malicious cyber attacks, we are also subject to various risks associated with the collection, handling, storage and transmission of sensitive information. In the course of doing business, we collect large volumes of internal, customer and other third-party data, including personally identifiable information and individual credit data, for various business purposes. We are subject to federal, state and international laws (including the European Union General Data Protection Regulation which will take effect in May 2018), as well as industry standards, relating to the collection, use, retention, security and transfer of personally identifiable information and individual credit data. In many cases, these laws apply not only to third-party transactions, but also to transfers of information between the Company and its subsidiaries, and among the Company, its subsidiaries and other parties with which the Company has commercial relations. Several jurisdictions have passed laws in this area, and other jurisdictions are considering imposing additional restrictions. These laws continue to develop and may be inconsistent from jurisdiction to jurisdiction. Complying with emerging and changing international requirements has caused, and may cause us to incur substantial costs or require us to change our business practices. If we fail to comply with the various applicable data collection and privacy laws, we could be exposed to fines, penalties, restrictions, litigation or other expenses, and our business could be adversely impacted.
Even if we are fully compliant with legal and/or industry standards and any relevant contractual requirements, we still may not be able to prevent security breaches involving sensitive data and/or critical systems. Any breach, theft, loss, or fraudulent use of guest, employee, third-party or company data, could adversely impact our reputation and brand and our ability to retain or attract new customers, and expose us to risks of data loss, business disruption, governmental investigation, litigation and other liability, any of which could adversely affect our business. Significant capital investments and other expenditures could be required to remedy the problem and prevent future breaches, including costs associated with additional security technologies, personnel, experts and credit monitoring services for those whose data has been breached. Further, if we or our vendors experience significant data security breaches or fail to detect and appropriately respond to significant data security breaches, we could be exposed to government enforcement actions and private litigation.
The potential unavailability of insurance coverage or an inability to obtain insurance coverage at commercially reasonable rates may adversely affect our financial condition or results of operations.
We seek to maintain appropriate insurance coverage at commercially reasonable rates. We normally insure based on the cost of an asset rather than replacement value and we also elect to self-insure, co-insure, or use deductibles in certain circumstances for certain risks such as loss of use of a ship or a cyber-security breach. The limits of insurance coverage we purchase are based on the availability of the coverage, evaluation of our risk profile and cost of coverage. Accordingly, we are not protected against all risks which could result in an unexpected decrease in our revenue and results of operations in the event of an incident.
We are members of three Protection and Indemnity ("P&I") clubs, which are part of a worldwide group of 13 P&I clubs, known as the International Group of P&I Clubs (the “IG”). P&I coverage provided by the clubs is on a mutual basis and we are subject to additional premium calls in the event of a catastrophic loss incurred by any member of the 13 P&I clubs, whereby the reinsurance limits purchased by the IG are exhausted. We are also subject to additional premium calls based on investment and underwriting shortfalls experienced by our own individual insurers.
We cannot be certain that insurance and reinsurance coverage will be available to us and at commercially reasonable rates in the future. Additionally, if we or other insureds sustain significant losses, the result may be higher insurance premiums, cancellation of coverage, or the inability to obtain coverage. Such events could adversely affect our financial condition or results of operations.
Environmental, labor, health and safety, financial responsibility and other maritime regulations could affect operations and increase operating costs.
30
The United States and various state and foreign government or regulatory agencies have enacted or may enact environmental regulations or policies, such as requiring the use of low sulfur fuels, that could increase our direct cost to operate in certain markets, increase our cost for fuel, limit the supply of compliant fuel, cause us to incur significant expenses to purchase and/or develop new equipment and adversely impact the cruise vacation industry. While we have taken and expect to continue to take a number of actions to mitigate the potential impact of certain of these regulations, there can be no assurances that these efforts will be successful or completed on a timely basis.
There is increasing global regulatory focus on climate change and greenhouse gas (GHG) emissions. These regulatory efforts, both internationally and in the United States are still developing, and we cannot yet determine what the final regulatory programs or their impact will be in any jurisdiction where we do business. However, such climate change-related regulatory activity in the future may adversely affect our business and financial results by requiring us to reduce our emissions, purchase allowances or otherwise pay for our emissions. Such activity may also impact us by increasing our operating costs, including fuel costs.
Some environmental groups have also lobbied for more stringent regulation of cruise ships and have generated negative publicity about the cruise vacation industry and its environmental impact. See Item 1.
Business-Regulation-Environmental Regulations
.
In addition, we are subject to various international, national, state and local laws, regulations and treaties that govern, among other things, discharge from our ships, safety standards applicable to our ships, treatment of disabled persons, health and sanitary standards applicable to our guests, security standards on board our ships and at the ship/port interface areas, and financial responsibilities to our guests. These issues are, and we believe will continue to be, an area of focus by the relevant authorities throughout the world. This could result in the enactment of more stringent regulation of cruise ships that could subject us to increasing compliance costs in the future.
A change in our tax status under the United States Internal Revenue Code, or other jurisdictions, may have adverse effects on our income
.
We and a number of our subsidiaries are foreign corporations that derive income from a U.S. trade or business and/or from sources within the United States. Drinker Biddle & Reath LLP, our U.S. tax counsel, has delivered to us an opinion, based on certain representations and assumptions set forth in it, to the effect that this income, to the extent derived from or incidental to the international operation of a ship or ships, is excluded from gross income for U.S. federal income tax purposes pursuant to Section 883 of the Internal Revenue Code. We believe that most of our income (including that of our subsidiaries) is derived from or incidental to the international operation of a ship or ships.
Our ability to rely on Section 883 could be challenged or could change in the future. Provisions of the Internal Revenue Code, including Section 883, are subject to legislative change at any time. Moreover, changes could occur in the future with respect to the identity, residence or holdings of our direct or indirect shareholders, trading volume or trading frequency of our shares, or relevant foreign tax laws of Liberia such that it no longer qualifies as an equivalent exemption jurisdiction, that could affect our eligibility for the Section 883 exemption. Accordingly, there can be no assurance that we will continue to be exempt from U.S. income tax on U.S. source shipping income in the future. If we were not entitled to the benefit of Section 883, we and our subsidiaries would be subject to U.S. taxation on a portion of the income derived from or incidental to the international operation of our ships, which would reduce our net income.
Additionally, portions of our business are operated by companies that are within the United Kingdom tonnage tax regime. Further, some of our operations are conducted in jurisdictions where we rely on tax treaties to provide exemption from taxation. To the extent the United Kingdom tonnage tax laws change or we do not continue to meet the applicable qualification requirements or if tax treaties are changed or revoked, we may be required to pay higher income tax in these jurisdictions, adversely impacting our results of operations.
31
As budgetary constraints continue to adversely impact the jurisdictions in which we operate, increases in income tax regulations, tax audits or tax reform affecting our operations may be imposed.
Litigation, enforcement actions, fines or penalties could adversely impact our financial condition or results of operations and/or damage our reputation.
Our business is subject to various United States and international laws and regulations that could lead to enforcement actions, fines, civil or criminal penalties or the assertion of litigation claims and damages. In addition, improper conduct by our employees, agents or joint venture partners could damage our reputation and/or lead to litigation or legal proceedings that could result in civil or criminal penalties, including substantial monetary fines. In certain circumstances it may not be economical to defend against such matters and/or a legal strategy may not ultimately result in us prevailing in a matter. Such events could lead to an adverse impact on our financial condition or results of operations.
We are not a United States corporation and our shareholders may be subject to the uncertainties of a foreign legal system in protecting their interests.
Our corporate affairs are governed by our Articles of Incorporation and By-Laws and by the Business Corporation Act of Liberia. The provisions of the Business Corporation Act of Liberia resemble provisions of the corporation laws of a number of states in the United States. However, while most states have a fairly well developed body of case law interpreting their respective corporate statutes, there are very few judicial cases in Liberia interpreting the Business Corporation Act of Liberia. As such, the rights and fiduciary responsibilities of directors under Liberian law are not as clearly established as the rights and fiduciary responsibilities of directors under statutes or judicial precedent in certain United States jurisdictions. For example, the right of shareholders to bring a derivative action in Liberian courts may be more limited than in United States jurisdictions. There may also be practical difficulties for shareholders attempting to bring suit in Liberia and Liberian courts may or may not recognize and enforce foreign judgments. Thus, our public shareholders may have more difficulty in protecting their interests with respect to actions by management, directors or controlling shareholders than would shareholders of a corporation incorporated in a United States jurisdiction.
Provisions of our Articles of Incorporation, By-Laws and Liberian law could inhibit others from acquiring us, prevent a change of control, and may prevent efforts by our shareholders to change our management.
Certain provisions of our Articles of Incorporation and By-Laws and Liberian law may inhibit third parties from effectuating a change of control of the Company without Board approval which could result in the entrenchment of current management. These include provisions in our Articles of Incorporation that prevent third parties, other than A. Wilhelmsen AS. and Cruise Associates, from acquiring beneficial ownership of more than 4.9% of our outstanding shares without the consent of our Board of Directors.
32
None.
Information about our cruise ships, including their size and primary areas of operation, may be found within the
Operating Strategies - Fleet upgrade, maintenance and expansion
section and the
Operations - Cruise Ships and Itineraries
sections in
Item 1
. Business
. Information regarding our cruise ships under construction, estimated expenditures and financing may be found within the
Future Capital Commitments
and
Funding Needs and Sources
sections of Item 7.
Management’s Discussion and Analysis of Financial Condition and Results of Operations.
Our principal executive office and principal shoreside operations are located in leased office buildings at the Port of Miami, Florida. We also lease a number of other offices in the US and throughout Europe, Asia, Mexico, South America and Australia to administer our brand operations globally.
We believe that our facilities are adequate for our current needs and that we are capable of obtaining additional facilities as necessary.
We also operate two private destinations which we utilize as ports-of-call on certain itineraries: (i) an island we own in the Bahamas which we call CocoCay; and (ii) Labadee, a secluded peninsula we lease on the north coast of Haiti.
We are routinely involved in claims typical within the cruise vacation industry. The majority of these claims are covered by insurance. We believe the outcome of such claims, net of expected insurance recoveries, will not have a material adverse impact on our financial condition or results of operations and cash flows.
None.
33
Market Information
Our common stock is listed on the New York Stock Exchange ("NYSE") under the symbol "RCL." The table below sets forth the high and low sales prices of our common stock as reported by the NYSE for the two most recent years by quarter:
|
|
NYSE
Common Stock
|
||
|
|
High
|
Low
|
|
|
2017
|
|||
|
Fourth Quarter
|
$133.75
|
$117.55
|
|
|
Third Quarter
|
$125.00
|
$107.79
|
|
|
Second Quarter
|
$115.63
|
$93.86
|
|
|
First Quarter
|
$101.11
|
$82.72
|
|
|
2016
|
|||
|
Fourth Quarter
|
$86.84
|
$67.53
|
|
|
Third Quarter
|
$75.72
|
$65.10
|
|
|
Second Quarter
|
$84.56
|
$64.95
|
|
|
First Quarter
|
$99.81
|
$64.21
|
|
Holders
As of
February 12, 2018
, there were
1,529
record holders of our common stock. Since certain of our shares are held by brokers and other institutions on behalf of shareholders, the foregoing number is not representative of the number of beneficial owners.
Dividends
In
2016
, we declared cash dividends on our common stock of
$0.375
per share during the first and second quarters of
2016
. We increased the dividend amount to
$0.48
per share for the dividends declared in the third and fourth quarters of
2016
and the first and second quarters of
2017
. The dividend amount was increased to
$0.60
per share for the dividends declared in the third and fourth quarters of
2017
.
Holders of our common stock have an equal right to share in our profits in the form of dividends when and if declared by our Board of Directors out of funds legally available. Holders of our common stock have no rights to any sinking fund.
There are no exchange control restrictions on remittances of dividends on our common stock since (1) we are and intend to maintain our status as a nonresident Liberian entity under the Liberia Revenue Code of 2000 as Amended and the regulations thereunder, and (2) our ship-owning subsidiaries are not now engaged, and are not in the future expected to engage, in any business in Liberia, including voyages exclusively within the territorial waters of the Republic of Liberia. Under current Liberian law, no Liberian taxes or withholding will be imposed on payments to holders of our securities other than to a holder that is a resident Liberian entity or a resident individual or an individual or entity subject to taxation in Liberia as a result of having a permanent establishment within the meaning of the Liberia Revenue Code of 2000 as Amended in Liberia.
The declaration of dividends shall at all times be subject to the final determination of our Board of Directors that a dividend is prudent at that time in consideration of the needs of the business.
34
Share Repurchases
The following table presents the total number of shares of our common stock that we repurchased during the quarter ended December 31, 2017:
|
Period
|
Total number of shares purchased
|
Average price paid per share
|
Total number of shares purchased as part of publicly announced plans or programs
(1)
|
Approximate dollar value of shares that may yet be purchased under the plans or programs
|
|||
|
October 1, 2017 - October 31, 2017
|
—
|
—
|
—
|
$375,000,000
|
|||
|
November 1, 2017 - November 30, 2017
|
275,647
|
$124.05
|
275,647
|
$341,000,000
|
|||
|
December 1, 2017 - December 31, 2017
|
526,470
|
$124.96
|
526,470
|
$275,000,000
|
|||
|
Total
|
802,117
|
802,117
|
|||||
___________________________________________________________________
|
(1)
|
On April 28, 2017, we announced that our board of directors authorized a 12-month common stock repurchase program for up to $500 million. The timing and number of shares to be repurchased will depend on a variety of factors including price and market conditions. During the fourth quarter of 2017, we repurchased 0.8 million shares of our common stock for a total of $100 million in open market transactions that were recorded within
Treasury stock
in our consolidated balance sheet. Repurchases under the program may be made at management's discretion from time to time on the open market or through privately negotiated transactions.
|
35
Performance Graph
The following graph compares the total return, assuming reinvestment of dividends, on an investment in the Company, based on performance of the Company's common stock, with the total return of the Standard & Poor's 500 Composite Stock Index and the Dow Jones United States Travel and Leisure Index for a five year period by measuring the changes in common stock prices from December 31,
2012
to December 31,
2017
.
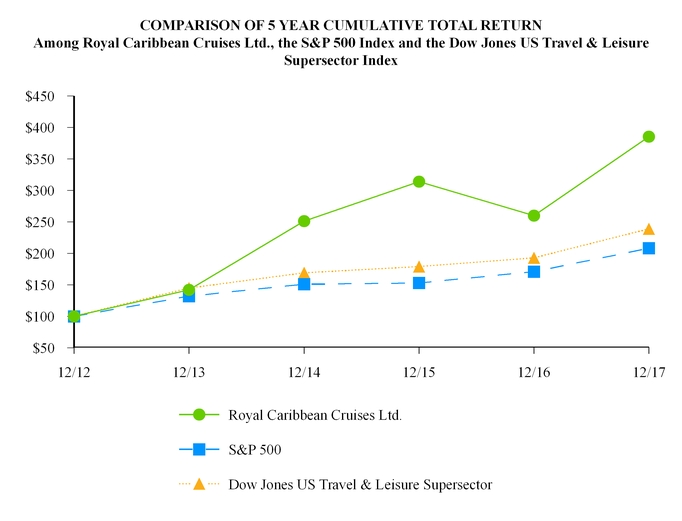
|
12/12
|
12/13
|
12/14
|
12/15
|
12/16
|
12/17
|
||||||
|
Royal Caribbean Cruises Ltd
.
|
100.00
|
142.11
|
251.44
|
313.65
|
260.04
|
385.47
|
|||||
|
S&P 500
|
100.00
|
132.39
|
150.51
|
152.59
|
170.84
|
208.14
|
|||||
|
Dow Jones US Travel & Leisure
|
100.00
|
145.48
|
169.28
|
179.27
|
192.85
|
238.77
|
|||||
The stock performance graph assumes for comparison that the value of the Company's common stock and of each index was
$100
on December 31,
2012
and that all dividends were reinvested. Past performance is not necessarily an indicator of future results.
36
The selected consolidated financial data presented below for the years
2013
through
2017
and as of the end of each such year, except for Adjusted Net Income amounts, are derived from our audited consolidated financial statements and should be read in conjunction with those financial statements and the related notes as well as in conjunction with Item 7.
Management's Discussion and Analysis of Financial Condition and Results of Operations
.
|
Year Ended December 31,
|
|||||||||||||||||||
|
2017
|
2016
|
2015
|
2014
|
2013
|
|||||||||||||||
|
(in thousands, except per share data)
|
|||||||||||||||||||
|
Operating Data:
|
|||||||||||||||||||
|
Total revenues
|
$
|
8,777,845
|
|
$
|
8,496,401
|
|
$
|
8,299,074
|
|
$
|
8,073,855
|
|
$
|
7,959,894
|
|
||||
|
Operating income
|
$
|
1,744,056
|
|
$
|
1,477,205
|
|
$
|
874,902
|
|
$
|
941,859
|
|
$
|
798,148
|
|
||||
|
Net income
|
$
|
1,625,133
|
|
$
|
1,283,388
|
|
$
|
665,783
|
|
$
|
764,146
|
|
$
|
473,692
|
|
||||
|
Adjusted Net Income
(1) (2) (3) (4)
|
$
|
1,625,133
|
|
$
|
1,314,689
|
|
$
|
1,065,066
|
|
$
|
755,729
|
|
$
|
539,224
|
|
||||
|
Per Share Data—Basic:
|
|||||||||||||||||||
|
Net income
|
$
|
7.57
|
|
$
|
5.96
|
|
$
|
3.03
|
|
$
|
3.45
|
|
$
|
2.16
|
|
||||
|
Adjusted Net Income
|
$
|
7.57
|
|
$
|
6.10
|
|
$
|
4.85
|
|
$
|
3.41
|
|
$
|
2.46
|
|
||||
|
Weighted-average shares
|
214,617
|
|
215,393
|
|
219,537
|
|
221,658
|
|
219,638
|
|
|||||||||
|
Per Share Data—Diluted:
|
|||||||||||||||||||
|
Net income
|
$
|
7.53
|
|
$
|
5.93
|
|
$
|
3.02
|
|
$
|
3.43
|
|
$
|
2.14
|
|
||||
|
Adjusted Net Income
|
$
|
7.53
|
|
$
|
6.08
|
|
$
|
4.83
|
|
$
|
3.39
|
|
$
|
2.44
|
|
||||
|
Weighted-average shares and potentially dilutive shares
|
215,694
|
|
216,316
|
|
220,689
|
|
223,044
|
|
220,941
|
|
|||||||||
|
Dividends declared per common share
|
$
|
2.16
|
|
$
|
1.71
|
|
$
|
1.35
|
|
$
|
1.10
|
|
$
|
0.74
|
|
||||
|
Balance Sheet Data:
|
|||||||||||||||||||
|
Total assets
|
$
|
22,296,317
|
|
$
|
22,310,324
|
|
$
|
20,782,043
|
|
$
|
20,524,060
|
|
$
|
19,915,003
|
|
||||
|
Total debt, including capital leases
|
$
|
7,539,451
|
|
$
|
9,387,436
|
|
$
|
8,527,243
|
|
$
|
8,254,818
|
|
$
|
7,916,860
|
|
||||
|
Common stock
|
$
|
2,352
|
|
$
|
2,346
|
|
$
|
2,339
|
|
$
|
2,331
|
|
$
|
2,308
|
|
||||
|
Total shareholders' equity
|
$
|
10,702,303
|
|
$
|
9,121,412
|
|
$
|
8,063,039
|
|
$
|
8,284,359
|
|
$
|
8,808,265
|
|
||||
___________________________________________________________________
|
(1)
|
For 2017, 2016 and 2015, refer to
Financial Presentation
and
Results of Operations
under Item 7.
Management's Discussion and Analysis of Financial Condition and Results of Operations
for definition of Adjusted Net Income and reconciliation of Adjusted Net Income to Net income.
|
|
(2)
|
Amount for 2017 includes a gain of
$30.9 million
related to the sale of
Legend of the Seas
.
|
|
(3)
|
Amount for 2014 excludes restructuring and related impairment charges of
$4.3 million
,
other initiative costs of
$21.2 million
, an
$11.0 million
loss related to the estimated impact of Pullmantur's non-core businesses that were sold in 2014 and a loss of
$17.4 million
recognized on the sale of
Celebrity Century
. Additionally, the amount for 2014 excludes
$28.9 million
of net income resulting from the change in our voyage proration methodology and the reversal of a deferred tax asset valuation allowance of
$33.5 million
due to Spanish tax reform.
|
|
(4)
|
Amount for 2013 excludes restructuring and related impairment charges of
$56.9 million
and an
$8.6 million
loss related to the estimated impact of Pullmantur's non-core businesses that were sold in 2014.
|
37
Cautionary Note Concerning Forward-Looking Statements
The discussion under this caption "Management's Discussion and Analysis of Financial Condition and Results of Operations" and elsewhere in this document, including, for example, under the "Risk Factors" and "Business" captions, includes "forward-looking statements" within the meaning of the Private Securities Litigation Reform Act of 1995. All statements other than statements of historical fact, including statements regarding guidance (including our expectations for the
first
quarter and full year of
2018
and our earnings and yield estimates for
2018
set forth under the heading "Outlook" below), business and industry prospects or future results of operations or financial position, made in this Annual Report on Form 10-K are forward-looking. Words such as "anticipate," "believe," "could," "estimate," "expect," "goal," "intend," "may," "plan," "project," "seek," "should," "will," "driving" and similar expressions are intended to further identify any of these forward-looking statements. Forward-looking statements reflect management's current expectations but they are based on judgments and are inherently uncertain. Furthermore, they are subject to risks, uncertainties and other factors that could cause our actual results, performance or achievements to differ materially from the future results, performance or achievements expressed or implied in those forward-looking statements. Examples of these risks, uncertainties and other factors include, but are not limited to, those discussed in this Annual Report on Form 10-K and, in particular, the risks discussed under the caption "Risk Factors" in Part I, Item 1A of this report.
All forward-looking statements made in this Annual Report on Form 10-K speak only as of the date of this document. Given these risks and uncertainties, readers are cautioned not to place undue reliance on such forward-looking statements. We undertake no obligation to publicly update or revise any forward-looking statements, whether as a result of new information, future events or otherwise.
Overview
The discussion and analysis of our financial condition and results of operations have been organized to present the following:
|
•
|
a review of our critical accounting policies and of our financial presentation, including discussion of certain operational and financial metrics we utilize to assist us in managing our business;
|
|
•
|
a discussion of our results of operations for the year ended
December 31, 2017
compared to the same period in
2016
and the year ended
December 31, 2016
compared to the same period in
2015
;
|
|
•
|
a discussion of our business outlook, including our expectations for selected financial items for the
first
quarter and full year of
2018
; and
|
|
•
|
a discussion of our liquidity and capital resources, including our future capital and contractual commitments and potential funding sources.
|
Critical Accounting Policies
Our consolidated financial statements are prepared in accordance with accounting principles generally accepted in the United States of America ("GAAP"). (Refer to Note 1.
General
and Note 2.
Summary of Significant Accounting Policies
to our consolidated financial statements under Item 8.
Financial Statements and Supplementary Data
). Certain of our accounting policies are deemed "critical," as they require management's highest degree of judgment, estimates and assumptions. We have discussed these accounting policies and estimates with the audit committee of our board of directors. We believe our most critical accounting policies are as follows:
Ship Accounting
Our ships represent our most significant assets and are stated at cost less accumulated depreciation and amortization. Depreciation of ships is generally computed net of a 15% projected residual value using the straight-line method over the estimated useful life of the asset, which is generally 30 years. The 30-year useful life of our newly constructed ships and 15% associated residual value are both based on the weighted-average of all major components
38
of a ship. Our useful life and residual value estimates take into consideration the impact of anticipated technological changes, long-term cruise and vacation market conditions and historical useful lives of similarly-built ships. In addition, we take into consideration our estimates of the weighted-average useful lives of the ships' major component systems, such as hull, superstructure, main electric, engines and cabins. Given the very large and complex nature of our ships, our accounting estimates related to ships and determinations of ship improvement costs to be capitalized require considerable judgment and are inherently uncertain. We do not have cost segregation studies performed to specifically componentize our ship systems. Therefore, we estimate the costs of component systems based principally on general and technical information known about major ship component systems and their lives and our knowledge of the cruise vacation industry. We do not identify and track depreciation by ship component systems, but instead utilize these estimates to determine the net cost basis of assets replaced or refurbished. Improvement costs that we believe add value to our ships are capitalized as additions to the ship and depreciated over the shorter of the improvements' estimated useful lives or that of the associated ship. The estimated cost and accumulated depreciation of replaced or refurbished ship components are written off and any resulting losses are recognized in
Cruise operating expenses
.
We use the deferral method to account for drydocking costs. Under the deferral method, drydocking costs incurred are deferred and charged to expense on a straight-line basis over the period to the next scheduled drydock, which we estimate to be a period of thirty to sixty months based on the vessel's age as required by Class. Deferred drydock costs consist of the costs to drydock the vessel and other costs incurred in connection with the drydock which are necessary to maintain the vessel's Class certification. Class certification is necessary in order for our cruise ships to be flagged in a specific country, obtain liability insurance and legally operate as passenger cruise ships. The activities associated with those drydocking costs cannot be performed while the vessel is in service and, as such, are done during a drydock as a planned major maintenance activity. The significant deferred drydock costs consist of hauling and wharfage services provided by the drydock facility, hull inspection and related activities (e.g., scraping, pressure cleaning, bottom painting), maintenance to steering propulsion, thruster equipment and ballast tanks, port services such as tugs, pilotage and line handling, and freight associated with these items. We perform a detailed analysis of the various activities performed for each drydock and only defer those costs that are directly related to planned major maintenance activities necessary to maintain Class. The costs deferred are related to activities not otherwise routinely periodically performed to maintain a vessel's designed and intended operating capability. Repairs and maintenance activities are charged to expense as incurred.
We use judgment when estimating the period between drydocks, which can result in adjustments to the estimated amortization of drydock costs. If the vessel is disposed of before the next drydock, the remaining balance in deferred drydock is written-off to the gain or loss upon disposal of vessel in the period in which the sale takes place. We also use judgment when identifying costs incurred during a drydock which are necessary to maintain the vessel's Class certification as compared to those costs attributable to repairs and maintenance which are expensed as incurred.
We believe we have made reasonable estimates for ship accounting purposes. However, should certain factors or circumstances cause us to revise our estimates of ship useful lives or projected residual values, depreciation expense could be materially higher or lower. If circumstances cause us to change our assumptions in making determinations as to whether ship improvements should be capitalized, the amounts we expense each year as repairs and maintenance costs could increase, partially offset by a decrease in depreciation expense. If we had reduced our estimated average ship useful life by one year, depreciation expense for
2017
would have increased by approximately
$51.5 million
. If our ships were estimated to have no residual value, depreciation expense for
2017
would have increased by approximately
$215.5 million
.
Valuation of Goodwill, Indefinite-Lived Intangible Assets and Long-Lived Assets
We review goodwill and indefinite-lived intangible assets for impairment at the reporting unit level annually or, when events or circumstances dictate, more frequently. The impairment review for goodwill consists of a qualitative assessment of whether it is more-likely-than-not that a reporting unit's fair value is less than its carrying amount, and if necessary, a two-step goodwill impairment test. Factors to consider when performing the qualitative assessment include general economic conditions, limitations on accessing capital, changes in forecasted operating results, changes in fuel prices and fluctuations in foreign exchange rates. If the qualitative assessment demonstrates that it is more-likely-than-not that the estimated fair value of the reporting unit exceeds its carrying value, it is not necessary to perform the two-step goodwill impairment test. We may elect to bypass the qualitative assessment and proceed directly to step
39
one, for any reporting unit, in any period. On a periodic basis, we elect to bypass the qualitative assessment and proceed to step one to corroborate the results of recent years' qualitative assessments. We can resume the qualitative assessment for any reporting unit in any subsequent period.
When performing the two-step goodwill impairment test, the fair value of the reporting unit is determined and compared to the carrying value of the net assets allocated to the reporting unit. We estimate the fair value of our reporting units using a probability-weighted discounted cash flow model. The estimation of fair value utilizing discounted expected future cash flows includes numerous uncertainties which require our significant judgment when making assumptions of expected revenues, operating costs, marketing, selling and administrative expenses, interest rates, ship additions and retirements as well as assumptions regarding the cruise vacation industry's competitive environment and general economic and business conditions, among other factors. The principal assumptions we use in the discounted cash flow model are projected operating results, weighted-average cost of capital, and terminal value. The discounted cash flow model uses the most current projected operating results for the upcoming fiscal year as a base. To that base, we add future years' cash flows assuming multiple revenue and expense scenarios that reflect the impact of different global economic environments beyond the base year on the reporting unit. We discount the projected cash flows using rates specific to the reporting unit based on its weighted-average cost of capital. If the fair value of the reporting unit exceeds its carrying value, no further analysis or write-down of goodwill is required. If the fair value of the reporting unit is less than the carrying value of its net assets, the implied fair value of the reporting unit is allocated to all its underlying assets and liabilities, including both recognized and unrecognized tangible and intangible assets, based on their fair value. If necessary, goodwill is then written down to its implied fair value.
The impairment review for indefinite-life intangible assets consists of a comparison of the fair value of the asset with its carrying amount. We estimate the fair value of these assets using a discounted cash flow model and various valuation methods depending on the nature of the intangible asset, such as the relief-from-royalty method for trademarks and tradenames. If the carrying amount exceeds its fair value, an impairment loss is recognized in an amount equal to that excess. If the fair value exceeds its carrying amount, the indefinite-life intangible asset is not considered impaired. As of December 31,
2017
, the carrying amount of indefinite-life intangible assets was not material. Other intangible assets assigned finite useful lives are amortized on a straight-line basis over their estimated useful lives.
We review our ships and other long-lived assets for impairment whenever events or changes in circumstances indicate, based on estimated undiscounted future cash flows, that the carrying amount of these assets may not be fully recoverable. We evaluate asset impairment at the lowest level for which identifiable cash flows are largely independent of the cash flows of other assets and liabilities. The lowest level for which we maintain identifiable cash flows that are independent of the cash flows of other assets and liabilities is at the ship level for our ships and, prior to the sale of the aircraft, at the aggregated asset group level for our aircraft. If estimated future cash flows are less than the carrying value of an asset, an impairment charge is recognized to the extent its carrying value exceeds fair value.
We estimate fair value based on quoted market prices in active markets, if available. If active markets are not available we base fair value on independent appraisals, sales price negotiations and projected future cash flows discounted at a rate estimated by management to be commensurate with the business risk. Quoted market prices are often not available for individual reporting units and for indefinite-life intangible assets. Accordingly, we estimate the fair value of a reporting unit and an indefinite-life intangible asset using an expected present value technique.
Royal Caribbean International
During the fourth quarter of
2017
, we performed a qualitative assessment of the Royal Caribbean International reporting unit. Based on our qualitative assessment, we concluded that it was more-likely-than-not that the estimated fair value of the Royal Caribbean International reporting unit exceeded its carrying value and thus, we did not proceed to the two-step goodwill impairment test. No indicators of impairment exist primarily because the reporting unit's fair value has consistently exceeded its carrying value by a significant margin and forecasts of operating results generated by the reporting unit appear sufficient to support its carrying value. As of
December 31, 2017
, the carrying amount of goodwill attributable to our Royal Caribbean reporting unit was
$286.9 million
.
40
2015 Impairment of Pullmantur Related Assets
During the third quarter of 2015, we performed an interim impairment evaluation of Pullmantur’s goodwill and trademarks and trade names in connection with the preparation of our financial statements. As a result of this analysis, we determined that the carrying value of the Pullmantur reporting unit exceeded its fair value. Similarly, we determined that the carrying value of Pullmantur’s trademarks and trade names exceeded their fair value. Accordingly, upon the completion of the relevant impairment tests discussed above, we recognized impairment charges of
$123.8 million
and
$174.3 million
for goodwill and trademark and trade names, respectively, during the quarter ended September 30, 2015. These charges reflected the full carrying amounts of the goodwill and trademark and trade names leaving Pullmantur with no intangible assets on its books.
In conjunction with performing the two-step goodwill impairment test for the Pullmantur reporting unit, we identified that the estimated fair value of certain long-lived assets, consisting of two ships and three aircraft, was less than their carrying values. As a result of this determination, we evaluated these assets pursuant to our long-lived asset impairment test, resulting in an impairment charge of $113.2 million to write down these assets to their estimated fair values during the quarter ended September 30, 2015.
Derivative Instruments
We enter into various forward, swap and option contracts to manage our interest rate exposure and to limit our exposure to fluctuations in foreign currency exchange rates and fuel prices. These instruments are recorded on the balance sheet at their fair value and the vast majority are designated as hedges. We also use non-derivative financial instruments designated as hedges of our net investment in our foreign operations and investments. Although certain of our derivative financial instruments do not qualify or are not accounted for under hedge accounting, we do not hold or issue derivative financial instruments for trading or other speculative purposes. We account for derivative financial instruments in accordance with authoritative guidance. Refer to Note 2.
Summary of Significant Accounting Policies
and Note 14.
Fair Value Measurements and Derivative Instruments
to our consolidated financial statements under Item 8.
Financial Statements and Supplementary Data
for more information on related authoritative guidance, the Company's hedging programs and derivative financial instruments.
We enter into foreign currency forward contracts and collars, interest rate, cross-currency and fuel swaps and options with third-party institutions in over-the-counter markets. We estimate the fair value of our foreign currency forward contracts and interest rate and cross-currency swaps using expected future cash flows based on the instruments' contract terms and published forward prices for foreign currency exchange and interest rates. We apply present value techniques and LIBOR or EURIBOR-based discount rates to convert the expected future cash flows to the current fair value of the instruments.
We estimate the fair value of our foreign currency collars using standard option pricing models with inputs based on the options' contract terms, such as exercise price and maturity, and readily available public market data, such as foreign exchange prices, foreign exchange volatility levels and discount rates.
We estimate the fair value of our fuel swaps using expected future cash flows based on the swaps' contract terms and forward prices. We derive forward prices from forward fuel curves based on pricing inputs provided by third-party institutions that transact in the fuel indices we hedge. We validate these pricing inputs against actual market transactions and published price quotes for similar assets. We apply present value techniques and LIBOR-based discount rates to convert the expected future cash flows to the current fair value of the instruments. We also corroborate our fair value estimates using valuations provided by our counterparties.
We adjust the valuation of our derivative financial instruments to incorporate credit risk.
We believe it is unlikely that materially different estimates for the fair value of our foreign currency forward contracts and interest rate, cross-currency and fuel swaps and options would be derived from other appropriate valuation models using similar assumptions, inputs or conditions suggested by actual historical experience.
Contingencies—Litigation
On an ongoing basis, we assess the potential liabilities related to any lawsuits or claims brought against us. While it is typically very difficult to determine the timing and ultimate outcome of such actions, we use our best judgment
41
to determine if it is probable that we will incur an expense related to the settlement or final adjudication of such matters and whether a reasonable estimation of such probable loss, if any, can be made. In assessing probable losses, we take into consideration estimates of the amount of insurance recoveries, if any, which are recorded as assets when recoverability is probable. We accrue a liability when we believe a loss is probable and the amount of loss can be reasonably estimated. Due to the inherent uncertainties related to the eventual outcome of litigation and potential insurance recoveries, it is possible that certain matters may be resolved for amounts materially different from any provisions or disclosures that we have previously made.
Seasonality
Our revenues are seasonal based on demand for cruises. Demand is strongest for cruises during the Northern Hemisphere's summer months and holidays. In order to mitigate the impact of the winter weather in the Northern Hemisphere and to capitalize on the summer season in the Southern Hemisphere, our brands have focused on deployment to the Caribbean, Asia and Australia during that period.
Financial Presentation
Description of Certain Line Items
Revenues
Our revenues are comprised of the following:
|
•
|
Passenger ticket revenues
, which consist of revenue recognized from the sale of passenger tickets and the sale of air transportation to and from our ships; and
|
|
•
|
Onboard and other revenues
, which consist primarily of revenues from the sale of goods and/or services onboard our ships not included in passenger ticket prices, cancellation fees, sales of vacation protection insurance and pre- and post-cruise tours.
Onboard and other revenues
also includes revenues we receive from independent third-party concessionaires that pay us a percentage of their revenues in exchange for the right to provide selected goods and/or services onboard our ships, as well as revenues received for our bareboat charter, procurement and management related services we perform on behalf of our unconsolidated affiliates.
|
Cruise Operating Expenses
Our cruise operating expenses are comprised of the following:
|
•
|
Commissions, transportation and other expenses
, which consist of those costs directly associated with passenger ticket revenues, including travel agent commissions, air and other transportation expenses, port costs that vary with passenger head counts and related credit card fees;
|
|
•
|
Onboard and other expenses
, which consist of the direct costs associated with onboard and other revenues, including the costs of products sold onboard our ships, vacation protection insurance premiums, costs associated with pre- and post-cruise tours and related credit card fees as well as the minimal costs associated with concession revenues, as the costs are mostly incurred by third-party concessionaires and costs incurred for the procurement and management related services we perform on behalf of our unconsolidated affiliates;
|
|
•
|
Payroll and related expenses
, which consist of costs for shipboard personnel (costs associated with our shoreside personnel are included in
Marketing, selling and administrative expenses
);
|
|
•
|
Food expenses
, which include food costs for both guests and crew;
|
|
•
|
Fuel expenses
, which include fuel and related delivery, storage and emission consumable costs and the financial impact of fuel swap agreements; and
|
42
|
•
|
Other operating expenses
, which consist primarily of operating costs such as repairs and maintenance, port costs that do not vary with passenger head counts, vessel related insurance, entertainment and gains and/or losses related to the sale of our ships, if any.
|
We do not allocate payroll and related expenses, food expenses, fuel expenses or other operating expenses to the expense categories attributable to passenger ticket revenues or onboard and other revenues since they are incurred to provide the total cruise vacation experience.
Selected Operational and Financial Metrics
We utilize a variety of operational and financial metrics which are defined below to evaluate our performance and financial condition. As discussed in more detail herein, certain of these metrics are non-GAAP financial measures. These non-GAAP financial measures are provided along with the related GAAP financial measures as we believe they provide useful information to investors as a supplement to our consolidated financial statements, which are prepared and presented in accordance with GAAP. The presentation of non-GAAP financial information is not intended to be considered in isolation or as a substitute for, or superior to, the financial information prepared and presented in accordance with GAAP.
Adjusted Earnings per Share ("Adjusted EPS")
represents Adjusted Net Income divided by weighted average shares outstanding or by diluted weighted average shares outstanding, as applicable. We believe that this non-GAAP measure is meaningful when assessing our performance on a comparative basis.
Adjusted Net Income
represents net income excluding certain items that we believe adjusting for is meaningful when assessing our performance on a comparative basis. For the periods presented, these items included the impairment of the Pullmantur related assets, the net loss related to the elimination of the Pullmantur reporting lag, the net gain related to the 51% sale of the Pullmantur and CDF Croisières de France ("CDF") brands, restructuring charges and other initiative costs related to our Pullmantur right-sizing strategy and other restructuring initiatives.
Available Passenger Cruise Days
("APCD") is our measurement of capacity and represents double occupancy per cabin multiplied by the number of cruise days for the period, which excludes canceled cruise days and drydock days. We use this measure to perform capacity and rate analysis to identify our main non-capacity drivers that cause our cruise revenue and expenses to vary.
Double-Double
Program
refers to the multi-year Adjusted EPS and Return on Invested Capital ("ROIC") goals we publicly announced in 2014 and sought to achieve by the end of 2017. We designed this program to help us better execute and achieve our business goals by clearly articulating longer-term financial objectives. Under the Double-Double Program, we targeted Adjusted EPS of $6.78 by the end of 2017, which was double our 2014 Adjusted EPS of $3.39. We also targeted ROIC of 10% by the end of 2017 as compared to ROIC of 5.9% in 2014.
Gross Cruise Costs
represent the sum of total cruise operating expenses plus marketing, selling and administrative expenses.
Gross Yields
represent total revenues per APCD.
Net Cruise Costs
and
Net Cruise Costs Excluding Fuel
represent Gross Cruise Costs excluding commissions, transportation and other expenses and onboard and other expenses and, in the case of Net Cruise Costs Excluding Fuel, fuel expenses (each of which is described above under the
Description of Certain Line Items
heading). In measuring our ability to control costs in a manner that positively impacts net income, we believe changes in Net Cruise Costs and Net Cruise Costs Excluding Fuel to be the most relevant indicators of our performance. A reconciliation of historical Gross Cruise Costs to Net Cruise Costs and Net Cruise Costs Excluding Fuel is provided below under
Results of Operations
. For the periods presented, Net Cruise Costs excludes the net gain related to the 51% sale of the Pullmantur and CDF brands, restructuring charges and other initiative costs related to our Pullmantur right-sizing strategy and other restructuring initiatives
.
Net Revenues
represent total revenues less commissions, transportation and other expenses and onboard and other expenses (each of which is described above under the
Description of Certain Line Items
heading).
43
Net Yields
represent Net Revenues per APCD. We utilize Net Revenues and Net Yields to manage our business on a day-to-day basis as we believe that they are the most relevant measures of our pricing performance because they reflect the cruise revenues earned by us net of our most significant variable costs, which are commissions, transportation and other expenses and onboard and other expenses. A reconciliation of historical Gross Yields to Net Yields is provided below under
Results of Operations
. For the periods presented, Net Yields excludes initiative costs related to the sale of the Pullmantur and CDF brands.
Occupancy
, in accordance with cruise vacation industry practice, is calculated by dividing Passenger Cruise Days by APCD. A percentage in excess of 100% indicates that three or more passengers occupied some cabins.
Passenger Cruise Days
represent the number of passengers carried for the period multiplied by the number of days of their respective cruises.
We believe Net Yields, Net Cruise Costs and Net Cruise Costs Excluding Fuel are our most relevant non-GAAP financial measures. However, a significant portion of our revenue and expenses are denominated in currencies other than the United States dollar. Because our reporting currency is the United States dollar, the value of these revenues and expenses can be affected by changes in currency exchange rates. Although such changes in local currency prices are just one of many elements impacting our revenues and expenses, they can be an important element. For this reason, we also monitor Net Yields, Net Cruise Costs and Net Cruise Costs Excluding Fuel as if the current periods' currency exchange rates had remained constant with the comparable prior periods' rates, or on a "Constant Currency" basis.
It should be emphasized that Constant Currency is primarily used for comparing short-term changes and/or projections. Changes in guest sourcing and shifting the amount of purchases between currencies can change the impact of the purely currency-based fluctuations.
The use of certain significant non-GAAP measures, such as Net Yields, Net Cruise Costs and Net Cruise Costs Excluding Fuel, allows us to perform capacity and rate analysis to separate the impact of known capacity changes from other less predictable changes which affect our business. We believe these non-GAAP measures provide expanded insight to measure revenue and cost performance in addition to the GAAP based financial measures. There are no specific rules or regulations for determining non-GAAP and Constant Currency measures, and as such, there exists the possibility that they may not be comparable to other companies within the industry. We have not provided a quantitative reconciliation of (i) projected Total revenues to projected Net Revenues, (ii) projected Gross Yields to projected Net Yields, (iii) projected Gross Cruise Costs to projected Net Cruise Costs and projected Net Cruise Costs Excluding Fuel and (iv) projected Net Income and Earnings per Share to projected Adjusted Net Income and Adjusted Earnings per Share because preparation of meaningful GAAP projections of Total revenues, Gross Yields, Gross Cruise Costs, Net Income and Earnings per Share would require unreasonable effort. Due to significant uncertainty, we are unable to predict, without unreasonable effort, the future movement of foreign exchange rates, fuel prices and interest rates inclusive of our related hedging programs. In addition, we are unable to determine the future impact of restructuring expenses or other non-core business related gains and losses which may result from strategic initiatives. These items are uncertain and could be material to our results of operations in accordance with GAAP. Due to this uncertainty, we do not believe that reconciling information for such projected figures would be meaningful.
44
Executive Overview
Our 2017 net income was $1.6 billion, or $7.53 per diluted share, compared to $1.3 billion, or $5.93 per diluted share, in 2016. Adjusted Net Income for 2017 was $1.6 billion, or $7.53 per diluted share, compared to $1.3 billion, or $6.08 per diluted share, in 2016. Adjusted EPS for 2017 represents the fourth straight year we achieved a record amount, growing approximately 24% compared to 2016.
The year 2017 marked the final year of our Double-Double program ("Double-Double"), which was comprised of two multi-year financial targets, including doubling our 2014 Adjusted EPS to $6.78 and achieving double-digit ROIC by the end of 2017. The Double-Double program was successful in galvanizing our large workforce and drove a real step change in performance. Our long-term commitment to grow revenue yields, manage costs and maintain steady capacity growth guided us towards the achievement of the Double-Double. We finished 2017 with Adjusted EPS of $7.53 and ROIC in excess of 10%, exceeding our Double-Double targets. During the Double-Double period, we have experienced annual Adjusted EPS growth of approximately 24%, 26% and 42% and annual ROIC growth of approximately 18%, 17% and 29%, in each of 2017, 2016 and 2015, respectively.
Additionally, Net Yields on a Constant-Currency basis increased for the eighth consecutive year. For the year ended December 31, 2017, our Net Yields on a Constant-Currency basis increased by 6.4%, primarily driven by increases in both ticket and onboard yields and by a benefit from the deconsolidation of the Pullmantur brand. Strong demand for Europe and North America products combined with strong onboard trends are responsible for the growth. Partly offsetting these successes was the impact of the 2017 hurricane season and China's South Korea travel restrictions.
Net onboard revenue yield in 2017 grew by 6.8% year-over-year on a Constant Currency basis. Growth came from a variety of areas, including beverage package sales, specialty restaurants, shore excursions, and our high speed onboard internet products.
We remain dedicated to finding efficiencies, identifying synergies and reducing costs, while at the same time, focusing on strategic investments in areas that will boost revenue. In 2017, our Net Cruise Costs Excluding Fuel increased by 2.0% on a Constant Currency basis compared to 2016.
The Company remains focused on improving returns for our shareholders. In 2017, we bought back $225 million shares of common stock under our $500 million share repurchase program that was announced in April 2017. We also announced a 25% increase to our common stock dividend, our fifth consecutive year with a dividend increase. In addition, during 2017, both Moody’s and S&P upgraded our senior unsecured debt rating to investment grade.
In 2018, all three of our Global Brands will each welcome a ship in the same year - a first in our history. Royal Caribbean International will welcome newbuild
Symphony of the Seas
in April; Azamara Club Cruises will welcome
Azamara Pursuit
in August; and Celebrity Cruises will welcome its newbuild
Celebrity Edge
in November. In 2018, we expect our capacity in the Caribbean will increase as
Symphony of the Seas
and
Celebrity Edge
join the Caribbean in the winter,
Celebrity Infinity
returns to the Caribbean and we upsize
Jewel of the Seas
to
Freedom of the Seas
and
Enchantment of the Seas
to
Mariner of the Seas
. As a result of
Mariner of the Seas
repositioning from Asia/Pacific to North America to make way for
Spectrum of the Seas’
arrival in early 2019, we expect our Asia/Pacific capacity will decrease year over year and will account for 17% of our total capacity in 2018. We expect Europe will represent 17% of our capacity in 2018 with growth driven by the
Symphony of the Seas'
inaugural Western Mediterranean season replacing
Freedom of the Seas
and the addition of
Azamara Pursuit.
In November 2017, we announced the order of
Celebrity Flora
, the brand’s first ship designed specifically for the Galapagos Islands, which we expect will sail beginning in 2019. In addition to investing in new hardware and our existing hardware through our fleet modernization programs,
Royal Amplified
and
Celebrity Revolution
, we continue to opportunistically evaluate selling or transferring older ships to further optimize our fleet. Since 2014, we have sold four ships - the sale of
Celebrity Century
to a subsidiary of Skysea Holdings, the sale of
Ocean Dream
to an unrelated third-party, the sale of
Splendour of the Seas
to TUI Cruises, and sale of
Legend of the Seas
to an affiliate of TUI AG, our joint venture partner in TUI Cruises.
45
After announcing our achievement of Double-Double, we thanked employees for their contribution with individual salary bonuses of five percent. Employees received equity-based awards equal to five percent of their 2017 salaries in an $80 million program called the "
Thank You, Thank You Bonus
." The awards, which vest over three years, went to all employees – shipboard and shoreside, full-time and part-time, domestic and overseas. Corporate officers, however, were excluded. In addition to the five percent equity-based awards, we will contribute to the Crew Welfare Fund for upgrades to crew living and recreational areas.
Results of Operations
In addition to the items discussed above under "Executive Overview," significant items for
2017
include:
|
•
|
Both our net income and Adjusted Net Income for the year ended
December 31, 2017
was
$1.6 billion
, or
$7.53
per share on a diluted basis, respectively, as compared to both net income and Adjusted Net Income of
$1.3 billion
, or
$5.93
and
$6.08
per share on a diluted basis, respectively, for the year ended December 31, 2016.
|
|
•
|
The estimated negative impact resulting from the third quarter 2017 hurricane-related disruptions was approximately $0.26 per share on a diluted basis to our net income and Adjusted Net Income for the year ended December 31, 2017.
|
|
•
|
Total revenues increased by
$281.4 million
for the year ended
December 31, 2017
compared to the same period in 2016 primarily due to an increase in ticket prices and onboard spending on a per passenger basis, which are further discussed below.
|
|
•
|
Total Cruise operating expenses decreased by
$119.0 million
for the year ended
December 31, 2017
compared to the same period in 2016, primarily due to the decrease in capacity, which is further discussed below.
|
Other items for
2017
include:
|
•
|
In May 2017, TUI Cruises, our 50% joint venture, took delivery of
Mein Schiff 6
.
|
|
•
|
During the second quarter of 2017, we entered into agreements with Meyer Turku to build two Icon-class ships. In October 2017, we entered into credit agreements for the unsecured financing of these ships for up to 80% of each ship's contract price. Refer to Note 15.
Commitments and Contingencies
to our consolidated financial statements for further information.
|
|
•
|
During the third quarter of 2017, we entered into an agreement to purchase a ship for our Azamara Club Cruises brand. The sale is expected to be completed with the delivery of the ship scheduled for March 2018, and the ship is expected to enter service during the third quarter of 2018.
|
|
•
|
During the fourth quarter of 2017, we entered into a credit agreement for the unsecured financing of a ship we have on order designed for the Galapagos Islands for our Celebrity Cruises brand. Refer to Note 7.
Long-Term Debt
to our consolidated financial statements for further information.
|
46
We reported net income, Adjusted Net Income, earnings per share and Adjusted Earnings per Share as shown in the following table (in thousands, except per share data):
|
Year Ended December 31,
|
|||||||||||
|
2017
|
2016
|
2015
|
|||||||||
|
Net income
|
$
|
1,625,133
|
|
$
|
1,283,388
|
|
$
|
665,783
|
|
||
|
Adjusted Net Income
|
1,625,133
|
|
1,314,689
|
|
1,065,066
|
|
|||||
|
Net Adjustments to Net Income - Increase
|
$
|
—
|
|
$
|
31,301
|
|
$
|
399,283
|
|
||
|
Adjustments to Net Income:
|
|||||||||||
|
Impairment of Pullmantur related assets
(1)
|
$
|
—
|
|
$
|
—
|
|
$
|
399,283
|
|
||
|
Net loss related to the elimination of the Pullmantur reporting lag
|
—
|
|
21,656
|
|
—
|
|
|||||
|
Net gain related to the sale of the Pullmantur and CDF Croisières de France brands
|
—
|
|
(3,834
|
)
|
—
|
|
|||||
|
Restructuring charges
|
—
|
|
8,452
|
|
—
|
|
|||||
|
Other initiative costs
|
—
|
|
5,027
|
|
—
|
|
|||||
|
Net Adjustments to Net Income - Increase
|
$
|
—
|
|
$
|
31,301
|
|
$
|
399,283
|
|
||
|
Basic:
|
|||||||||||
|
Earnings per Share
|
$
|
7.57
|
|
$
|
5.96
|
|
$
|
3.03
|
|
||
|
Adjusted Earnings per Share
|
$
|
7.57
|
|
$
|
6.10
|
|
$
|
4.85
|
|
||
|
Diluted:
|
|||||||||||
|
Earnings per Share
|
$
|
7.53
|
|
$
|
5.93
|
|
$
|
3.02
|
|
||
|
Adjusted Earnings per Share
|
$
|
7.53
|
|
$
|
6.08
|
|
$
|
4.83
|
|
||
|
Weighted-Average Shares Outstanding:
|
|||||||||||
|
Basic
|
214,617
|
|
215,393
|
|
219,537
|
|
|||||
|
Diluted
|
215,694
|
|
216,316
|
|
220,689
|
|
|||||
___________________________________________________________________
(1) Includes a net deferred income tax benefit of
$12.0 million
related to the Pullmantur impairment.
47
The following table presents operating results as a percentage of total revenues for the last three years:
|
Year Ended December 31,
|
||||||||
|
2017
|
2016
|
2015
|
||||||
|
Passenger ticket revenues
|
71.9
|
%
|
72.4
|
%
|
73.0
|
%
|
||
|
Onboard and other revenues
|
28.1
|
%
|
27.6
|
%
|
27.0
|
%
|
||
|
Total revenues
|
100.0
|
%
|
100.0
|
%
|
100.0
|
%
|
||
|
Cruise operating expenses:
|
||||||||
|
Commissions, transportation and other
|
15.5
|
%
|
15.9
|
%
|
16.9
|
%
|
||
|
Onboard and other
|
5.6
|
%
|
5.8
|
%
|
6.7
|
%
|
||
|
Payroll and related
|
9.7
|
%
|
10.4
|
%
|
10.4
|
%
|
||
|
Food
|
5.6
|
%
|
5.7
|
%
|
5.8
|
%
|
||
|
Fuel
|
7.8
|
%
|
8.4
|
%
|
9.6
|
%
|
||
|
Other operating
|
11.5
|
%
|
12.8
|
%
|
12.1
|
%
|
||
|
Total cruise operating expenses
|
55.8
|
%
|
59.0
|
%
|
61.4
|
%
|
||
|
Marketing, selling and administrative expenses
|
13.5
|
%
|
13.0
|
%
|
13.1
|
%
|
||
|
Depreciation and amortization expenses
|
10.8
|
%
|
10.5
|
%
|
10.0
|
%
|
||
|
Impairment of Pullmantur related assets
|
—
|
%
|
—
|
%
|
5.0
|
%
|
||
|
Operating income
|
19.9
|
%
|
17.4
|
%
|
10.5
|
%
|
||
|
Other expense
|
(1.4
|
)%
|
(2.3
|
)%
|
(2.5
|
)%
|
||
|
Net income
|
18.5
|
%
|
15.1
|
%
|
8.0
|
%
|
||
Selected statistical information is shown in the following table:
|
Year Ended December 31,
|
||||||||
|
2017
|
2016
(1)
|
2015
|
||||||
|
Passengers Carried
|
5,768,496
|
|
5,754,747
|
|
5,401,899
|
|
||
|
Passenger Cruise Days
|
40,033,527
|
|
40,250,557
|
|
38,523,060
|
|
||
|
APCD
|
36,930,939
|
|
37,844,644
|
|
36,646,639
|
|
||
|
Occupancy
|
108.4
|
%
|
106.4
|
%
|
105.1
|
%
|
||
___________________________________________________________________
|
(1)
|
Does not include November and December 2015 amounts for Pullmantur as the net Pullmantur result for those months was included within
Other expense
in our consolidated statements of comprehensive income (loss) for the year ended December 31, 2016, as a result of the elimination of the Pullmantur reporting lag, and did not affect Gross Yields, Net Yields, Gross Cruise Costs, Net Cruise Costs and Net Cruise Costs Excluding Fuel. Additionally, effective August 2016, we no longer include Pullmantur Holdings in these amounts.
|
48
Gross Yields and Net Yields were calculated as follows (in thousands, except APCD and Yields):
|
Year Ended December 31,
|
|||||||||||||||
|
2017
|
2017
On a Constant Currency basis |
2016
|
2015
|
||||||||||||
|
Passenger ticket revenues
|
$
|
6,313,170
|
|
$
|
6,302,600
|
|
$
|
6,149,323
|
|
$
|
6,058,821
|
|
|||
|
Onboard and other revenues
|
2,464,675
|
|
2,462,531
|
|
2,347,078
|
|
2,240,253
|
|
|||||||
|
Total revenues
|
8,777,845
|
|
8,765,131
|
|
8,496,401
|
|
8,299,074
|
|
|||||||
|
Less:
|
|||||||||||||||
|
Commissions, transportation and other
|
1,363,170
|
|
1,361,001
|
|
1,349,677
|
|
1,400,778
|
|
|||||||
|
Onboard and other
|
495,552
|
|
493,790
|
|
493,558
|
|
553,104
|
|
|||||||
|
Net revenues including other initiative costs
|
6,919,123
|
|
6,910,340
|
|
6,653,166
|
|
6,345,192
|
|
|||||||
|
Less:
|
|||||||||||||||
|
Other initiative costs included within Net Revenues
|
—
|
|
—
|
|
(2,230
|
)
|
—
|
|
|||||||
|
Net Revenues
|
$
|
6,919,123
|
|
$
|
6,910,340
|
|
$
|
6,655,396
|
|
$
|
6,345,192
|
|
|||
|
APCD
|
36,930,939
|
|
36,930,939
|
|
37,844,644
|
|
36,646,639
|
|
|||||||
|
Gross Yields
|
$
|
237.68
|
|
$
|
237.34
|
|
$
|
224.51
|
|
$
|
226.46
|
|
|||
|
Net Yields
|
$
|
187.35
|
|
$
|
187.12
|
|
$
|
175.86
|
|
$
|
173.15
|
|
|||
49
Gross Cruise Costs, Net Cruise Costs and Net Cruise Costs Excluding Fuel were calculated as follows (in thousands, except APCD and costs per APCD):
___________________________________________________________________
|
Year Ended December 31,
|
|||||||||||||||
|
2017
|
2017 On a
Constant Currency basis |
2016
|
2015
|
||||||||||||
|
Total cruise operating expenses
|
$
|
4,896,579
|
|
$
|
4,891,324
|
|
$
|
5,015,539
|
|
$
|
5,099,393
|
|
|||
|
Marketing, selling and administrative expenses
(1)
|
1,186,016
|
|
1,189,694
|
|
1,100,290
|
|
1,086,504
|
|
|||||||
|
Gross Cruise Costs
|
6,082,595
|
|
6,081,018
|
|
6,115,829
|
|
6,185,897
|
|
|||||||
|
Less:
|
|||||||||||||||
|
Commissions, transportation and other
|
1,363,170
|
|
1,361,001
|
|
1,349,677
|
|
1,400,778
|
|
|||||||
|
Onboard and other
|
495,552
|
|
493,790
|
|
493,558
|
|
553,104
|
|
|||||||
|
Net Cruise Costs including other initiative costs
|
4,223,873
|
|
4,226,227
|
|
4,272,594
|
|
4,232,015
|
|
|||||||
|
Less:
|
|||||||||||||||
|
Net gain related to the sale of Pullmantur and CDF Croisières de France brands included within other operating expenses
|
—
|
|
—
|
|
(3,834
|
)
|
—
|
|
|||||||
|
Other initiative costs included within cruise operating expenses and marketing, selling and administrative expenses
|
—
|
|
—
|
|
2,433
|
|
—
|
|
|||||||
|
Net Cruise Costs
|
4,223,873
|
|
4,226,227
|
|
4,273,995
|
|
4,232,015
|
|
|||||||
|
Less:
|
|||||||||||||||
|
Fuel
(2)
|
681,118
|
|
681,114
|
|
713,252
|
|
795,801
|
|
|||||||
|
Net Cruise Costs Excluding Fuel
|
$
|
3,542,755
|
|
$
|
3,545,113
|
|
$
|
3,560,743
|
|
$
|
3,436,214
|
|
|||
|
APCD
|
36,930,939
|
|
36,930,939
|
|
37,844,644
|
|
36,646,639
|
|
|||||||
|
Gross Cruise Costs per APCD
|
$
|
164.70
|
|
$
|
164.66
|
|
$
|
161.60
|
|
$
|
168.80
|
|
|||
|
Net Cruise Costs per APCD
|
$
|
114.37
|
|
$
|
114.44
|
|
$
|
112.94
|
|
$
|
115.48
|
|
|||
|
Net Cruise Cost Excluding Fuel per APCD
|
$
|
95.93
|
|
$
|
95.99
|
|
$
|
94.09
|
|
$
|
93.77
|
|
|||
|
(1)
|
For the year ended December 31, 2016, amount does not include restructuring charges of
$8.5 million
.
|
|
(2)
|
For the year ended December 31, 2016, amount does not include fuel expense of
$0.4 million
included within other initiative costs associated with the redeployment of Pullmantur’s
Empress
to the Royal Caribbean International brand.
|
Outlook
The company does not make predictions about fuel pricing, interest rates or currency exchange rates but does provide guidance about its future business activities. On
January 24, 2018
, we announced the following initial full year and
first
quarter
2018
guidance based on the then current fuel pricing, interest rates and currency exchange rates:
50
Full Year
2018
|
As Reported
|
Constant Currency
|
||
|
Net Yields
|
2.75% to 4.75%
|
1.5% to 3.5%
|
|
|
Net Cruise Costs per APCD
|
1.0% to 1.5%
|
0.5% to 1.0%
|
|
|
Net Cruise Costs per APCD, excluding Fuel
|
2.0% to 2.5%
|
1.5% to 2.0%
|
|
|
Capacity Increase
|
3.9%
|
||
|
Depreciation and Amortization
|
$1,053 to $1,063 million
|
||
|
Interest Expense, net
|
$280 to $290 million
|
||
|
Fuel Consumption (metric tons)
|
1,350,100
|
||
|
Fuel Expenses
|
$675 million
|
||
|
Percent Hedged (fwd consumption)
|
50%
|
||
|
Impact of 10% change in fuel prices
|
$38 million
|
||
|
1% Change in Currency
|
$18 million
|
||
|
1% Change in Net Yield
|
$75 million
|
||
|
1% Change in NCC x Fuel
|
$38 million
|
||
|
100 basis pt. Change in LIBOR
|
$30 million
|
||
|
Adjusted Earnings per Share — Diluted
|
$8.55 to $8.75
|
||
First Quarter
2018
|
|
As Reported
|
|
Constant Currency
|
|
Net Yields
|
Approx. 5.5%
|
3.0% to 3.5%
|
|
|
Net Cruise Costs per APCD
|
Approx. 8.5%
|
Approx. 7.5%
|
|
|
Net Cruise Costs per APCD, excluding Fuel
|
Approx. 11.0%
|
Approx. 10.0%
|
|
|
Capacity Decrease
|
(3.9%)
|
||
|
Depreciation and Amortization
|
$245 to $250 million
|
||
|
Interest Expense, net
|
$59 to $63 million
|
||
|
Fuel Consumption (metric tons)
|
324,400
|
||
|
Fuel Expenses
|
$162 million
|
||
|
Percent Hedged (fwd consumption)
|
50%
|
||
|
Impact of 10% change in fuel prices
|
$9 million
|
||
|
1% Change in Currency
|
$4 million
|
||
|
1% Change in Net Yield
|
$16 million
|
||
|
1% Change in NCC x Fuel
|
$10 million
|
||
|
100 basis pt. Change in LIBOR
|
$5 million
|
||
|
Adjusted Earnings per Share — Diluted
|
Approx. $0.95
|
||
Since our earnings release on
January 24, 2018
, bookings have remained consistent with our previous expectations. Accordingly, our forecast has remained essentially unchanged.
Volatility in foreign currency exchange rates affects the United States dollar value of our earnings. Based on our highest net exposure for each quarter and the full year 2018, the top five foreign currencies are ranked below. For example, the Australian Dollar is the most impactful currency in the first and fourth quarters of 2018. Rankings are based on estimated net exposures.
51
|
Ranking
|
Q1
|
Q2
|
Q3
|
Q4
|
FY 2018
|
|||||
|
1
|
AUD
|
GBP
|
GBP
|
AUD
|
GBP
|
|||||
|
2
|
CAD
|
AUD
|
CNH
|
GBP
|
AUD
|
|||||
|
3
|
GBP
|
CAD
|
EUR
|
CAD
|
CAD
|
|||||
|
4
|
EUR
|
CNH
|
CAD
|
EUR
|
EUR
|
|||||
|
5
|
CNH
|
EUR
|
AUD
|
CNH
|
CNH
|
|||||
The currency abbreviations above are defined as follows:
|
Currency Abbreviation
|
Currency
|
|
|
AUD
|
Australian Dollar
|
|
|
CAD
|
Canadian Dollar
|
|
|
CNH
|
Chinese Yuan
|
|
|
EUR
|
Euro
|
|
|
GBP
|
British Pound
|
|
Year Ended December 31,
2017
Compared to Year Ended December 31,
2016
In this section, references to
2017
refer to the year ended December 31,
2017
and references to
2016
refer to the year ended December 31,
2016
.
Revenues
Total revenues for
2017
increased
$281.4 million
, or
3.3%
, to
$8.8 billion
from
$8.5 billion
in
2016
.
Passenger ticket revenues
comprised
71.9%
of our
2017
total revenues. Passenger ticket revenues increased by
$163.8 million
, or
2.7%
from 2016, despite the impact of canceled sailings resulting from hurricane-related disruptions during the third quarter of 2017. The increase was primarily due to:
|
•
|
an increase of
$301.8 million
in ticket prices primarily driven by the improvement in our ticket price on a per passenger basis due to the exit of the Pullmantur ships and the addition of
Harmony of the Seas
and
Ovation of the Seas,
as well as higher pricing on North America and Europe sailings. The increase in ticket prices on these itineraries was partially offset by lower pricing on Asia/Pacific sailings; and
|
|
•
|
the favorable effect of changes in foreign currency exchange rates related to our revenue transactions denominated in currencies other than the United States dollar of approximately
$10.6 million
.
|
The increase in passenger ticket revenues was partially offset by a
2.4%
decrease in capacity, which decreased
passenger ticket revenues
by
$148.5 million
primarily due to the sale of our majority interest in Pullmantur Holdings during the third quarter of 2016, the sale of
Splendour of the Seas
in the second quarter of 2016 and the sale of
Legend of the Seas
in first quarter of 2017, which was partially offset by an increase in capacity due to the addition of
Ovation of the Seas
and
Harmony of the Seas
into our fleet during the second quarter of 2016.
The remaining
28.1%
of
2017
total revenues was comprised of
Onboard and other revenues
, which increased
$117.6 million
, or
5.0%
. The increase in
Onboard and other revenues
was primarily due to:
|
•
|
a
$125.3 million
increase in onboard revenue attributable to higher spending on a per passenger basis primarily due to our revenue enhancing initiatives, including beverage package, shore excursion and specialty restaurant sales and promotions and increased revenue associated with internet and other telecommunication service.
|
|
•
|
a
$45.7 million
increase in other revenue primarily due to charter revenue and management fees earned from Pullmantur Holdings.
|
52
The increase was partially offset by a
$55.6 million
decrease attributable to the 2.4% decrease in capacity noted above, including the impact of canceled sailings resulting from hurricane-related disruptions during the third quarter of 2017.
Onboard and other revenues
included concession revenues of
$326.5 million
in
2017
and
$316.9 million
in
2016
.
Cruise Operating Expenses
Total cruise operating expenses for
2017
decreased
$119.0 million
, or
2.4%
, to
$4.9 billion
in 2017 from
$5.0 billion
in
2016
. The decrease was primarily due to:
|
•
|
a
$120.5 million
decrease attributable to the 2.4% decrease in capacity noted above;
|
|
•
|
a
$30.9 million
gain resulting from the sale of
Legend of the Seas
in 2017 compared to an immaterial gain from the sale of
Splendour of the Seas
in 2016;
|
|
•
|
a
$17.2 million
decrease in air expense due to itinerary changes and lower ticket costs;
|
|
•
|
a
$16.8 million
decrease in vessel maintenance primarily due to the timing of scheduled drydocks; and
|
|
•
|
a
$15.5 million
decrease in fuel expense, excluding the impact of the decrease in capacity. Our cost of fuel (net of the financial impact of fuel swap agreements) for 2017 decreased 4.6% per metric ton compared to 2016.
|
The decrease was partially offset by:
|
•
|
a
$33.8 million
increase in commissions expense mainly due to the increase in ticket prices discussed above and changes in commission incentives;
|
•
a
$19.3 million
increase in head taxes primarily due to itinerary changes; and
|
•
|
an
$18.9 million
increase in food expenses mainly due to our new culinary initiatives.
|
Marketing, Selling and Administrative Expenses
Marketing, selling and administrative expenses
for 2017 increased
$77.3 million
, or
7.0%
, to
$1.2 billion
from
$1.1 billion
in 2016. The increase was primarily due to an increase in payroll and benefits mostly driven by higher stock prices year over year related to our performance share awards, partially offset by a decrease in expenses due to the sale of our majority interest in Pullmantur Holdings.
Depreciation and Amortization Expenses
Depreciation and amortization expenses
for
2017
increased
$56.3 million
, or
6.3%
, to
$951.2 million
from
$894.9 million
in
2016
.
T
he increase was primarily due to the addition of
Ovation of the Seas
and
Harmony of the Seas
in the second quarter of 2016, new shipboard additions associated with our ship upgrade projects and to a lesser extent, additions related to our shoreside projects. The increase was partially offset by the decrease in depreciation associated with the sale of
Legend of the Seas
in the first quarter of 2017 and to a lesser extent, the sale of
Splendour of the Seas
in the second quarter of 2016.
Other Income (Expense)
53
Interest expense, net of interest capitalized
, decreased
$7.4 million
, or
2.4%
, to
$300.0 million
in
2017
from
$307.4 million
in
2016
. The decrease was due to a lower average debt level in 2017 compared to 2016, partially offset by higher interest rates in 2017 compared to 2016.
Equity investment income
increased
$27.9 million
, or
21.7%
, to
$156.2 million
in
2017
from
$128.4 million
in 2016 primarily due to an increase in income from TUI Cruises, one of our equity method investments.
Other expense
decreased
$30.4 million
, or
85.2%
, to
$5.3 million
in
2017
from
$35.7 million
in
2016
. The decrease was primarily due to a net loss of
$21.7 million
related to the elimination of the Pullmantur reporting lag in 2016 which did not recur in 2017.
Gross and Net Yields
Gross and Net Yields increased
5.9%
and
6.5%
in
2017
, respectively, compared to
2016
primarily due to the increase in passenger ticket and onboard and other revenues discussed above.
Gross and Net Cruise Costs
Gross Cruise Costs remained consistent in
2017
compared to
2016
. Net Cruise Costs decreased
1.2%
in
2017
compared to
2016
primarily due to the decrease in capacity and cruise operating expenses discussed above. Gross Cruise Costs per APCD and Net Cruise Costs per APCD increased
1.9%
and
1.3%
in
2017
, respectively, compared to
2016
. The increase was mainly due to the hurricane-related disruptions during the third quarter of 2017 which reduced our capacity; however, certain operating expenses were still incurred, negatively impacting our metrics per APCD. Net Cruise Costs Excluding Fuel per APCD increased
2.0%
in
2017
compared to
2016
.
Other Comprehensive Income
Other comprehensive income
in 2017 was
$582.2 million
compared to
$411.9 million
in 2016. The increase of
$170.3 million
or
41.3%
was primarily due to the
Gain on cash flow derivative hedges
in 2017 of
$570.5 million
compared to
$411.2 million
in 2016. The increase of
$159.3 million
in 2017 was primarily due to an increase in foreign currency forward contract values in 2017 compared to a decrease in 2016, which was partially offset by lower amounts of fuel swap losses reclasssified to income in 2017 and a smaller increase in fuel swap instrument values in 2017 compared to 2016.
Year Ended December 31, 2016 Compared to Year Ended December 31, 2015
In this section, references to 2016 refer to the year ended December 31, 2016 and references to 2015 refer to the year ended December 31, 2015.
Revenues
Total revenues for 2016 increased $197.3 million, or 2.4%, to $8.5 billion from $8.3 billion in 2015.
Passenger ticket revenues
comprised 72.4% of our 2016 total revenues. Passenger ticket revenues increased by $90.5 million, or 1.5%. The increase was primarily due to:
|
•
|
a 3.3% increase in capacity, which increased
passenger ticket revenues by
$198.1 million, net of the capacity decrease resulting from the sale of our majority interest in Pullmantur Holdings; and
|
|
•
|
an increase of $63.9 million in ticket prices primarily driven by our newest ships
as well as higher pricing on Alaska and Caribbean sailings. The increase in ticket prices was partially offset by lower pricing on Mediterranean and Asia sailings.
|
54
The increase in passenger ticket revenues was partially offset by the unfavorable effect of changes in foreign currency exchange rates related to our revenue transactions denominated in currencies other than the United States dollar of approximately $171.5 million.
The remaining 27.6% of 2016 total revenues was comprised of
Onboard and other revenues
, which increased $106.8 million, or 4.8%. The increase in
Onboard and other revenues
was primarily due to:
|
•
|
a $70.5 million increase attributable to the 3.3% increase in capacity noted above; and
|
|
•
|
an $89.9 million increase in onboard revenue attributable to higher spending on a per passenger basis primarily due to our ship upgrade programs and other revenue enhancing initiatives, including various beverage and gaming initiatives, the promotion of specialty restaurants and the increased revenue associated with internet and other telecommunication services partially offset by a decrease in port activities revenue mainly due to itinerary changes.
|
The increase was partially offset by:
|
•
|
an approximate $16.4 million unfavorable effect of changes in foreign currency exchange rates related to our onboard and other revenue transactions denominated in currencies other than the United States dollar; and
|
|
•
|
a $37.2 million decrease in other revenues primarily related to our travel agency business that was sold in 2015 partially offset by an increase in revenue received for our bareboat charter and ship management services associated with our unconsolidated affiliates. The decrease in revenues from our travel agency business sold is mostly offset by the related decrease in travel agency expenses discussed below.
|
Onboard and other revenues
included concession revenues of $316.9 million in 2016 and $327.1 million in 2015.
Cruise Operating Expenses
Total cruise operating expenses for 2016 decreased $83.9 million, or 1.6%, to $5.0 billion in 2016 from $5.1 billion in 2015. The decrease was primarily due to:
|
•
|
a $114.4 million decrease in fuel expense, excluding the impact of the increase in capacity. Our cost of fuel (net of the financial impact of fuel swap agreements) for 2016 decreased 10.3% per metric ton compared to 2015;
|
|
•
|
an approximate $40.9 million favorable effect of changes in foreign currency exchange rates related to our cruise operating expenses denominated in currencies other than the United States dollar;
|
|
•
|
a $41.2 million decrease in other expenses primarily related to our travel agency business that was sold in 2015, which mostly offsets the related decrease in travel agency revenues discussed above;
|
|
•
|
a $25.0 million decrease in air expense primarily due to the decrease in air transportation sales and lower costs; and
|
|
•
|
a $20.2 million decrease in shore excursion expense attributable to lower contractual costs incurred and the decrease in port activities revenue discussed above.
|
The decrease was partially offset by a $164.7 million increase attributable to the 3.3% increase in capacity noted above.
Marketing, Selling and Administrative Expenses
Marketing, selling and administrative expenses
for 2016 remained consistent compared to 2015.
55
Depreciation and Amortization Expenses
Depreciation and amortization expenses
for 2016 increased $67.9 million, or 8.2%, to $894.9 million from $827.0 million in 2015. The increase was primarily due to the addition of
Harmony of the Seas
and
Ovation of the Seas
in the second quarter of 2016 into our fleet and the addition of
Anthem of the Seas
in the second quarter of 2015 and, to a lesser extent, new shipboard additions associated with our ship upgrade projects. The increase was partially offset by the sale of
Splendour of the Seas
in April 2016.
Impairment of Pullmantur Related Assets
During 2015, we recognized an impairment charge of $411.3 million to write down Pullmantur's goodwill to its implied fair value and to write down trademarks and trade names and certain long-lived assets, consisting of three aircraft that was then owned and operated by Pullmantur Air and two ships owned and operated by Pullmantur, to their fair value.
Other Income (Expense)
Interest expense, net of interest capitalized
, decreased $29.6 million, or 10.7%, to $307.4 million in 2016 from $277.7 million in 2015. The increase was due to a higher average debt level attributable to the financing of
Ovation of the Seas
and
Harmony of the Seas
, partially offset by lower pricing on debt refinanced in 2015.
Equity investment income
increased $47.3 million, or 58.4%, to $128.4 million in 2016 from $81.0 million in 2015 mainly due to the increase in income from TUI Cruises, one of our equity method investments.
Other expense
in 2016 was $35.7 million compared to $24.4 million in 2015. The increase in expense of $11.2 million was primarily due to a net loss of $21.7 million related to the elimination of the Pullmantur reporting lag in 2016. The increase in other expense was partially offset by a decrease of $9.6 million in foreign exchange losses from the remeasurement of monetary assets and liabilities denominated in foreign currency.
Gross and Net Yields
Gross Yields remained consistent in 2016 compared to 2015. Net Yields increased 1.6% in 2016 compared to 2015 primarily due to the increase in passenger ticket and onboard and other revenues discussed above. Gross Yields and Net Yields increased 1.3% and 3.9%, respectively, in 2016 compared to 2015 on a Constant Currency basis.
Gross and Net Cruise Costs
Gross Cruise Costs decreased 1.1% in 2016 compared to 2015 primarily due to the decrease in fuel. Net Cruise Costs increased 1.0% in 2016 compared to 2015 primarily due to the increase in capacity, partially offset by the decrease in fuel, which are further discussed above. Gross Cruise Costs per APCD and Net Cruise Costs per APCD decreased 4.3% and 2.2%, respectively, in 2016 compared to 2015 primarily due to the decrease in fuel. Gross Cruise Costs per APCD on a Constant Currency basis decreased 3.4% in 2016 compared to 2015. Net Cruise Costs per APCD on a Constant Currency basis decreased 1.7% in 2016 compared to 2015. Net Cruise Costs Excluding Fuel per APCD remained consistent in 2016 compared to 2015 and increased 0.9% in 2016 compared to 2015 on a Constant Currency basis.
Other Comprehensive Income (Loss)
Other comprehensive income
in 2016 was $411.9 million
compared to a loss of
$431.4 million in 2015. The change of $843.4 million was primarily due to the
Gain on cash flow derivative hedges
in 2016 of $411.2 million compared to the
Loss on cash flow derivative hedges
of $406.0 million in 2015. The gain in 2016 resulted mostly from the reclassification of losses to earnings during 2016 from fuel cash flow hedges. In addition, there was an increase in the fair value of our fuel swaps in 2016 as a result of higher forward fuel prices. The loss in 2015 was primarily due to the decrease in the fair value of our fuel swaps and of our foreign currency forward contracts as a
56
result of decreases in fuel prices and forward currency rates, somewhat offset by the reclassification of losses to earnings during 2015 from fuel cash flow hedges.
Future Application of Accounting Standards
Refer to Note 2.
Summary of Significant Accounting Policies
to our consolidated financial statements under Item 8.
Financial Statements and Supplementary Data
for further information on
Recent Accounting Pronouncements
.
Liquidity and Capital Resources
Sources and Uses of Cash
Cash flow generated from operations provides us with a significant source of liquidity.
Net cash provided by operating activities
increased
$357.9 million
to
$2.9 billion
in
2017
compared to
$2.5 billion
in
2016
. The increase in cash provided by operating activities was primarily attributable to an increase in proceeds from customer deposits, an increase in cash receipts from onboard spending and a decrease in fuel costs in
2017
compared to
2016
. Additionally, dividends received from unconsolidated affiliates increased by
$33.7 million
.
Net cash provided by operating activities
increased $570.3 million to $2.5 billion in 2016 compared to $1.9 billion in 2015. The increase in cash provided by operating activities was primarily attributable to an increase in proceeds from customer deposits, an increase in cash receipts from onboard spending and a decrease in fuel costs in 2016 compared to 2015. Additionally, dividends received from unconsolidated affiliates increased by $42.6 million.
Net cash used in investing activities
decreased
$2.5 billion
to
$213.6 million
in
2017
compared to
$2.7 billion
in
2016
. The decrease was primarily attributable to a decrease in capital expenditures of
$1.9 billion
due to ship deliveries in 2016,
Ovation of the Seas
and
Harmony of the Seas
, compared to no ship deliveries in 2017. In addition, we received
$230.0 million
of proceeds from the sale of property and equipment in 2017 which did not occur in 2016. Furthermore, during 2017, we received cash of
$63.2 million
on settlements on our foreign currency forward contracts compared to cash paid of
$213.2 million
during 2016.
Net cash used in investing activities
increased $981.9 million to $2.7 billion in 2016 compared to $1.7 billion in 2015. The increase was primarily attributable to an increase in capital expenditures of $881.0 million in 2016 compared to the same period in 2015 primarily due to the deliveries of
Ovation of the Seas
and
Harmony of the Seas
in 2016. Additionally, cash repayments received on loans to our unconsolidated affiliates decreased $86.0 million in 2016 compared to the same period in 2015 mainly due to TUI Cruises repaying in 2015 the outstanding balance of the debt facility we originally provided to them in 2011.
Net cash used in financing activities
was
$2.7 billion
in
2017
compared to
Net cash provided in financing activities of
$243.8 million
in
2016
. The change was primarily attributable to a decrease in debt proceeds of
$1.5 billion
, an increase in debt repayments of
$1.5 billion
and a higher amount of dividends paid during 2017 compared to 2016, partially offset by a decrease of stock repurchases of
$75.0 million
during 2017 compared to 2016. The decrease in debt proceeds was primarily due to the $841.8 million unsecured term loan borrowed in April 2016 to finance
Ovation of the Sea
s and the €700.7 million and $226.1 million unsecured term loans borrowed in May 2016 to finance
Harmony of the Seas
that did not recur in 2017
and lower drawings on our revolving credit facilities during 2017 compared to 2016, partially offset by
$800 million
in proceeds received from unsecured senior notes issued during 2017 which did not occur in 2016. The increase in repayment of debt was primarily due to higher payments on our revolving credit facilities.
Net cash provided by financing activities
was $243.8 million in 2016 compared to
Net cash used in financing activities
of $253.5 million in 2015. The change was primarily attributable to an increase in debt proceeds of $2.9 billion during 2016 compared to 2015, partially offset by an increase in repayment of debt of $2.2 billion, an increase in
stock repurchases of
$100.0 million
and an increase in dividends paid of $66.3 million during 2016 compared to 2015. The increase in debt proceeds was primarily due to the $841.8 million unsecured term loan borrowed in April 2016 to finance
Ovation of the Sea
s, the €700.7 million and $226.1 million unsecured term loans borrowed in May
57
2016 to finance
Harmony of the Seas
, the $200.0 million unsecured term loan borrowed in April 2016 and higher drawings on our revolving credit facilities during 2016 compared to the $742.1 million unsecured term loan borrowed in April 2015 to finance
Anthem of the Seas.
The increase in repayment of debt was primarily due to higher payments on our revolving credit facilities.
Future Capital Commitments
Our future capital commitments consist primarily of new ship orders. As of
December 31, 2017
, we have two Quantum-class ships, two Oasis-class ships and two ships of a new generation, known as our Icon-class, on order for our Royal Caribbean International brand with an aggregate capacity of approximately 30,500 berths. Additionally, we have four ships of a new generation, known as our Edge-class, and a ship designed for the Galapagos Islands on order for our Celebrity Cruises brand with an aggregate capacity of approximately 11,700 berths. For each of these orders, we have committed unsecured financing arrangements in place covering 80% of the cost of the ship, almost all of which include sovereign financing guarantees. Furthermore, during 2017, we entered into an agreement to purchase a ship for our Azamara Club Cruises brand that is scheduled to be delivered in March 2018 and expected to enter service during the third quarter of 2018.
As of
December 31, 2017
, the aggregate cost of our ships on order, not including the TUI Cruises' ships on order, was approximately
$13.3 billion
, of which we had deposited
$465.7 million
as of such date. Approximately
54.0%
of the aggregate cost was exposed to fluctuations in the Euro exchange rate at
December 31, 2017
. (Refer to Note 14.
Fair Value Measurements and Derivative Instruments
and Note 15.
Commitments and Contingencies
to our consolidated financial statements under Item 8.
Financial Statements and Supplementary Data)
.
As of
December 31, 2017
, anticipated overall capital expenditures, based on our existing ships on order, are approximately
$3.4 billion
for
2018
,
$2.1 billion
for
2019
,
$2.5 billion
for
2020
and
$2.5 billion
for
2021
.
Contractual Obligations
As of
December 31, 2017
, our contractual obligations were as follows (in thousands):
|
|
Payments due by period
|
||||||||||||||||||
|
|
|
Less than
|
1-3
|
3-5
|
More than
|
||||||||||||||
|
|
Total
|
1 year
|
years
|
years
|
5 years
|
||||||||||||||
|
Operating Activities:
|
|
|
|
|
|
|
|
|
|
|
|||||||||
|
Operating lease obligations
(1)
|
$
|
241,468
|
|
$
|
29,420
|
|
$
|
44,191
|
|
$
|
22,644
|
|
$
|
145,213
|
|
||||
|
Interest on long-term debt
(2)
|
1,275,346
|
|
250,600
|
|
415,000
|
|
292,665
|
|
317,081
|
|
|||||||||
|
Other
(3)
|
879,206
|
|
214,444
|
|
282,570
|
|
150,003
|
|
232,189
|
|
|||||||||
|
Investing Activities:
|
0
|
|
|||||||||||||||||
|
Ship purchase obligations
(4)
|
10,888,494
|
|
2,368,806
|
|
3,063,165
|
|
4,089,153
|
|
1,367,370
|
|
|||||||||
|
Financing Activities:
|
0
|
|
|||||||||||||||||
|
Long-term debt obligations
(5)
|
7,506,312
|
|
1,185,038
|
|
2,047,882
|
|
2,012,922
|
|
2,260,470
|
|
|||||||||
|
Capital lease obligations
(6)
|
33,139
|
|
3,476
|
|
7,210
|
|
8,395
|
|
14,058
|
|
|||||||||
|
Other
(7)
|
21,552
|
|
8,868
|
|
11,217
|
|
1,467
|
|
—
|
|
|||||||||
|
Total
|
$
|
20,845,517
|
|
$
|
4,060,652
|
|
$
|
5,871,235
|
|
$
|
6,577,249
|
|
$
|
4,336,381
|
|
||||
___________________________________________________________________
(1) We are obligated under noncancelable operating leases primarily for offices, warehouses and motor vehicles. Amounts represent contractual obligations with initial terms in excess of one year.
(2) Long-term debt obligations mature at various dates through fiscal year 2028 and bear interest at fixed and variable rates. Interest on variable-rate debt is calculated based on forecasted debt balances, including the impact of interest rate swap agreements, using the applicable rate at
December 31, 2017
. Debt denominated in other currencies is calculated based on the applicable exchange rate at
December 31, 2017
.
58
(3) Amounts primarily represent future commitments with remaining terms in excess of one year to pay for our usage of certain port facilities, marine consumables, services and maintenance contracts. Amounts do not include the PortMiami lease further discussed below under
Off-Balance Sheet Arrangements
.
(4) Amounts do not include potential obligations which remain subject to cancellation at our sole discretion.
(5) Amounts represent debt obligations with initial terms in excess of one year. Debt denominated in other currencies is calculated based on the applicable exchange rate at
December 31, 2017
.
(6) Amounts represent capital lease obligations with initial terms in excess of one year.
(7) Amounts represent fees payable to sovereign guarantors in connection with certain of our export credit debt facilities and facility fees on our revolving credit facilities.
Please refer to
Funding Needs and Sources
for discussion on the planned funding of the above contractual obligations.
As a normal part of our business, depending on market conditions, pricing and our overall growth strategy, we continuously consider opportunities to enter into contracts for the building of additional ships. We may also consider the sale of ships or the purchase of existing ships. We continuously consider potential acquisitions and strategic alliances. If any of these were to occur, they would be financed through the incurrence of additional indebtedness, the issuance of additional shares of equity securities or through cash flows from operations.
Off-Balance Sheet Arrangements
We and TUI AG have each guaranteed repayment of
50%
of a bank loan provided to TUI Cruises which is due 2022. Notwithstanding this, the lenders have agreed to release each shareholder’s guarantee if certain conditions are met by April 2018. As of
December 31, 2017
,
€95.1 million
, or approximately
$114.2 million
based on the exchange rate at
December 31, 2017
, remains outstanding. Based on current facts and circumstances, we do not believe potential obligations under this guarantee are probable.
TUI Cruises has entered into various ship construction and credit agreements that include certain restrictions on each of our and TUI AG's ability to reduce our current ownership interest in TUI Cruises below
37.55%
through 2021.
In July 2016, we executed an agreement with Miami Dade County (“MDC”), which was simultaneously assigned to Sumitomo Banking Corporation (“SMBC”), to lease land from MDC and construct a new cruise terminal at PortMiami in Miami, Florida. The terminal is expected to be approximately 170,000 square feet and will serve as a homeport. During the construction period, SMBC will fund the costs of the terminal’s construction and land lease. Upon completion of the terminal's construction, we will operate and lease the terminal from SMBC for a five-year term. We determined that the lease arrangement between SMBC and us should be accounted for as an operating lease upon completion of the terminal.
Some of the contracts that we enter into include indemnification provisions that obligate us to make payments to the counterparty if certain events occur. These contingencies generally relate to changes in taxes, increased lender capital costs and other similar costs. The indemnification clauses are often standard contractual terms and are entered into in the normal course of business. There are no stated or notional amounts included in the indemnification clauses and we are not able to estimate the maximum potential amount of future payments, if any, under these indemnification clauses. We have not been required to make any payments under such indemnification clauses in the past and, under current circumstances, we do not believe an indemnification obligation is probable.
As of December 31, 2017
, other than the items described above, we are not party to any other off-balance sheet arrangements, including guarantee contracts, retained or contingent interest, certain derivative instruments and variable interest entities, that either have, or are reasonably likely to have, a current or future material effect on our financial position.
Funding Needs and Sources
We have significant contractual obligations of which our debt service obligations and the capital expenditures associated with our ship purchases represent our largest funding needs. As of
December 31, 2017
, we had approximately
$4.1 billion
in contractual obligations due through
December 31, 2018
of which approximately
$1.2 billion
relates to debt maturities,
$0.3 billion
relates to interest on long-term debt and
$2.4 billion
relates to ship purchase payments, including the final installments payable due upon the deliveries of
Symphony of the Seas
and
Celebrity Edge
in the
59
first and fourth quarters of 2018, respectively. We have historically relied on a combination of cash flows provided by operations, drawdowns under our available credit facilities, the incurrence of additional debt and/or the refinancing of our existing debt and the issuance of additional shares of equity securities to fund these obligations.
We had a working capital deficit of
$3.9 billion
and
$3.7 billion
as of
December 31, 2017
and
December 31, 2016
, respectively. Included within our working capital deficit is
$1.2 billion
and
$1.3 billion
of current portion of debt, including capital leases, as of
December 31, 2017
and
December 31, 2016
, respectively. Similar to others in our industry, we operate with a substantial working capital deficit. This deficit is mainly attributable to the fact that, under our business model, a vast majority of our passenger ticket receipts are collected in advance of the applicable sailing date. These advance passenger receipts remain a current liability until the sailing date. The cash generated from these advance receipts is used interchangeably with cash on hand from other sources, such as our revolving credit facilities and other cash from operations. The cash received as advanced receipts can be used to fund operating expenses for the applicable future sailing or otherwise, pay down our revolving credit facilities, invest in long term investments or any other use of cash. In addition, we have a relatively low-level of accounts receivable and rapid turnover results in a limited investment in inventories. We generate substantial cash flows from operations and our business model, along with our unsecured revolving credit facilities, has historically allowed us to maintain this working capital deficit and still meet our operating, investing and financing needs. We expect that we will continue to have working capital deficits in the future.
As of
December 31, 2017
, we had liquidity of
$2.2 billion
, consisting of approximately
$0.1 billion
in cash and cash equivalents and
$2.1 billion
available under our unsecured revolving credit facilities. We anticipate that our cash flows from operations and our current financing arrangements, as described above, will be adequate to meet our capital expenditures and debt repayments over the next twelve-month period.
In April 2017, Moody's changed our senior unsecured debt credit rating to Baa3 with a stable outlook. Consistent with the provisions of our interest rate derivatives instruments, all collateral that was posted with our counterparties as of that date was returned in April 2017. In addition, the interest margins and guarantee premium payable under certain of our credit agreements were automatically reduced in accordance with their terms.
On April 28, 2017, we announced that our Board of Directors authorized a twelve-month common stock repurchase program for up to $500 million. As of December 31, 2017, we have $275.0 million that remains available for future common stock repurchase transactions under this Board approved program. Future repurchases may be made at management's discretion from time to time on the open market or through privately negotiated transactions. Repurchases under the program are expected to be funded from available cash or borrowings under our revolving credit facilities. Refer to Note 8. Shareholders' Equity to our consolidated financial statements for further information.
If any person acquires ownership of more than 50% of our common stock or, subject to certain exceptions, during any 24-month period, a majority of the Board is no longer comprised of individuals who were members of the Board on the first day of such period, we may be obligated to prepay indebtedness outstanding under our credit facilities, which we may be unable to replace on similar terms. Our public debt securities also contain change of control provisions that would be triggered by a third-party acquisition of greater than 50% of our common stock coupled with a ratings downgrade. If this were to occur, it would have an adverse impact on our liquidity and operations.
Debt Covenants
Certain of our financing agreements contain covenants that require us, among other things, to maintain minimum net worth of at least
$8.0 billion
, a fixed charge coverage ratio of at least 1.25x and limit our net debt-to-capital ratio to no more than
62.5%
. The fixed charge coverage ratio is calculated by dividing net cash from operations for the past four quarters by the sum of dividend payments plus scheduled principal debt payments in excess of any new financings for the past four quarters. Our minimum net worth and maximum net debt-to-capital calculations exclude the impact of
Accumulated other comprehensive loss
on
Total shareholders' equity
. We were well in excess of all debt covenant requirements as of
December 31, 2017
. The specific covenants and related definitions can be found in the applicable debt agreements, the majority of which have been previously filed with the Securities and Exchange Commission.
60
Dividends
In December
2017
, we declared a cash dividend on our common stock of
$0.60
per share which was paid in the first quarter of
2018
. We declared a cash dividend on our common stock of
$0.60
per share during the third quarter of
2017
which was paid in the fourth quarter of
2017
. During the first and second quarters of
2017
, we declared a cash dividend on our common stock of
$0.48
per share which was paid in the second and third quarters of 2017, respectively. During the first quarter of
2017
, we also paid a cash dividend on our common stock of
$0.48
per share which was declared during the fourth quarter of 2016.
61
Financial Instruments and Other
General
We are exposed to market risk attributable to changes in interest rates, foreign currency exchange rates and fuel prices. We try to mitigate these risks through a combination of our normal operating and financing activities and through the use of derivative financial instruments pursuant to our hedging practices and policies. The financial impact of these hedging instruments is primarily offset by corresponding changes in the underlying exposures being hedged. We achieve this by closely matching the amount, term and conditions of the derivative instrument with the underlying risk being hedged. Although certain of our derivative financial instruments do not qualify or are not accounted for under hedge accounting, our objective is not to hold or issue derivative financial instruments for trading or other speculative purposes. (Refer to Note 14.
Fair Value Measurements
and Derivative Instruments
to our consolidated financial statements under Item 8.
Financial Statements and Supplementary Data.
)
Interest Rate Risk
Our exposure to market risk for changes in interest rates relates to our long-term debt obligations including future interest payments. At
December 31, 2017
, approximately
57.4%
of our long-term debt was effectively fixed as compared to
40.5%
as of
December 31, 2016
. We use interest rate swap agreements to modify our exposure to interest rate movements and to manage our interest expense.
Market risk associated with our long-term fixed rate debt is the potential increase in fair value resulting from a decrease in interest rates. We use interest rate swap agreements that effectively convert a portion of our fixed-rate debt to a floating-rate basis to manage this risk. At
December 31, 2017
and
December 31, 2016
, we maintained interest rate swap agreements on the following fixed-rate debt instruments:
|
Debt Instrument
|
Swap Notional as of December 31, 2017 (In thousands)
|
Maturity
|
Debt Fixed Rate
|
Swap Floating Rate: LIBOR plus
|
All-in Swap Floating Rate as of December 31, 2017
|
||
|
Oasis of the Seas
term loan
|
$
|
140,000
|
|
October 2021
|
5.41%
|
3.87%
|
5.44%
|
|
Unsecured senior notes
|
650,000
|
|
November 2022
|
5.25%
|
3.63%
|
5.05%
|
|
|
$
|
790,000
|
|
|||||
These interest rate swap agreements are accounted for as fair value hedges.
The estimated fair value of our long-term fixed-rate debt at
December 31, 2017
was
$2.4 billion
, using quoted market prices, where available, or using the present value of expected future cash flows which incorporates risk profile. The fair value of our fixed to floating interest rate swap agreements was estimated to be a liability of
$19.8 million
as of
December 31, 2017
, based on the present value of expected future cash flows. A hypothetical one percentage point decrease in interest rates at
December 31, 2017
would increase the fair value of our hedged and unhedged long-term fixed-rate debt by approximately
$127.4 million
and would increase the fair value of our fixed to floating interest rate swap agreements by approximately
$31.8 million
.
Market risk associated with our long-term floating-rate debt is the potential increase in interest expense from an increase in interest rates. We use interest rate swap agreements that effectively convert a portion of our floating-rate debt to a fixed-rate basis to manage this risk. A hypothetical one percentage point increase in interest rates would increase our forecasted
2018
interest expense by approximately
$30.1 million
, assuming no change in foreign currency exchange rates.
At
December 31, 2017
and
December 31, 2016
, we maintained interest rate swap agreements on the following floating-rate debt instruments:
62
|
Debt Instrument
|
Swap Notional as of December 31, 2017 (In thousands)
|
Maturity
|
Debt Floating Rate
|
All-in Swap Fixed Rate
|
|||
|
Celebrity Reflection
term loan
|
$
|
381,792
|
|
October 2024
|
LIBOR plus
|
0.40%
|
2.85%
|
|
Quantum of the Seas
term loan
|
551,250
|
|
October 2026
|
LIBOR plus
|
1.30%
|
3.74%
|
|
|
Anthem of the Seas
term loan
|
573,958
|
|
April 2027
|
LIBOR plus
|
1.30%
|
3.86%
|
|
|
Ovation of the Seas
term loan
|
726,250
|
|
April 2028
|
LIBOR plus
|
1.00%
|
3.16%
|
|
|
Harmony of the Seas
term loan
(1)
|
728,373
|
|
May 2028
|
EURIBOR plus
|
1.15%
|
2.26%
|
|
|
$
|
2,961,623
|
|
|||||
___________________________________________________________________
|
(1)
|
Interest rate swap agreements hedging the Euro-denominated term loan for
Harmony of the Seas
include EURIBOR zero-floors matching the hedged debt EURIBOR zero-floor. Amount presented is based on the exchange rate as of
December 31, 2017
.
|
These interest rate swap agreements are accounted for as cash flow hedges.
The fair value of our floating to fixed interest rate swap agreements was estimated to be a liability of
$24.5 million
as of
December 31, 2017
based on the present value of expected future cash flows. These interest rate swap agreements are accounted for as cash flow hedges.
Foreign Currency Exchange Rate Risk
Our primary exposure to foreign currency exchange rate risk relates to our ship construction contracts denominated in Euros, our foreign currency denominated debt and our international business operations. We enter into foreign currency forward contracts, collar options and cross-currency swap agreements to manage portions of the exposure to movements in foreign currency exchange rates.
The estimated fair value, as of
December 31, 2017
, of our Euro-denominated forward contracts associated with our ship construction contracts was an asset of
$235.9 million
, based on the present value of expected future cash flows. As of
December 31, 2017
, the aggregate cost of our ships on order, not including the TUI Cruises' ships on order, was approximately
$13.3 billion
, of which we had deposited
$465.7 million
as of such date. Approximately
54.0%
and
66.7%
of the aggregate cost of the ships under construction was exposed to fluctuations in the Euro exchange rate at
December 31, 2017
and
December 31, 2016
, respectively. A hypothetical 10% strengthening of the Euro as of
December 31, 2017
, assuming no changes in comparative interest rates, would result in a
$716.0 million
increase in the United States dollar cost of the foreign currency denominated ship construction contracts exposed to fluctuations in the Euro exchange rate. The majority of our foreign currency forward contracts, collar options and cross-currency swap agreements are accounted for as cash flow, fair value or net investment hedges depending on the designation of the related hedge.
Our international business operations subject us to foreign currency exchange risk. We transact business in many different foreign currencies and maintain investments in foreign operations which may expose us to financial market risk resulting from fluctuations in foreign currency exchange rates. Movements in foreign currency exchange rates may affect the value of our earnings in foreign currencies and cash flows. We manage most of this exposure on a consolidated basis, which allows us to take advantage of any natural offsets. Therefore, weakness in one particular currency might be offset by strengths in other currencies over time. The extent to which one currency is effective as a natural offset of another currency fluctuates over time. In addition, some foreign currency exposures have little to no mitigating natural offsets available.
We consider our investments in our foreign operations to be denominated in relatively stable currencies and of a long-term nature. As of
December 31, 2017
, we maintained foreign currency forward contracts and designated them as hedges of a portion of our net investment in TUI cruises of
€101.0 million
, or approximately
$121.3 million
based on the exchange rate at
December 31, 2017
. These forward currency contracts mature in October 2021.
63
We also address the exposure of our investments in foreign operations by denominating a portion of our debt in our subsidiaries' and investments' functional currencies and designating it as a hedge of these subsidiaries and investments. We had designated debt as a hedge of our net investments in TUI Cruises of approximately
€246.0 million
, or approximately
$295.3 million
, through December 31, 2017. As of December 31, 2016, we had designated debt as a hedge of our net investments in TUI Cruises of approximately
€295.0 million
, or approximately
$311.2 million
.
We have included approximately
$68.5 million
and
$114.0 million
of foreign-currency transaction losses and of changes in the fair value of derivatives in the foreign currency translation adjustment component of
Accumulated other comprehensive loss
at
December 31, 2017
and
December 31, 2016
, respectively.
Lastly, on a regular basis, we enter into foreign currency forward contracts and, from time to time, we utilize cross-currency swap agreements to minimize the volatility resulting from the remeasurement of net monetary assets and liabilities denominated in a currency other than our functional currency or the functional currencies of our foreign subsidiaries. During
2017
, we maintained an average of approximately
$739.4 million
of these foreign currency forward contracts. These instruments are not designated as hedging instruments. In
2017
,
2016
and
2015
changes in the fair value of the foreign currency forward contracts resulted in a gain (loss) of approximately
$62.0 million
,
$(51.1) million
and
$(55.5) million
, respectively, which offset (losses) gains arising from the remeasurement of monetary assets and liabilities denominated in foreign currencies in those same years of
$(75.6) million
,
$39.8 million
and
$34.6 million
, respectively. These changes were recognized in earnings within
Other expense
in our consolidated statements of comprehensive income (loss).
Fuel Price Risk
Our exposure to market risk for changes in fuel prices relates primarily to the consumption of fuel on our ships. Fuel cost (net of the financial impact of fuel swap agreements), as a percentage of our total revenues, was approximately
7.8%
in
2017
,
8.4%
in
2016
and
9.6%
in
2015
. We use fuel swap agreements to mitigate the financial impact of fluctuations in fuel prices.
As of
December 31, 2017
, we had fuel swap agreements to pay fixed prices for fuel with an aggregate notional amount of approximately
$828.5 million
, maturing through
2021
. The fuel swap agreements represented
50%
of our projected
2018
fuel requirements,
46%
of our projected
2019
fuel requirements,
36%
of our projected
2020
fuel requirements and
14%
of our projected
2021
fuel requirements. These fuel swap agreements are generally accounted for as cash flow hedges. The estimated fair value of these contracts at
December 31, 2017
was estimated to be an asset of
$14.3 million
. We estimate that a hypothetical
10%
increase in our weighted-average fuel price from that experienced during the year ended
December 31, 2017
would increase our forecasted
2018
fuel cost by approximately
$38.0 million
, net of the impact of fuel swap agreements.
Our Consolidated Financial Statements and Quarterly Selected Financial Data are included beginning on page F-1 of this report.
None.
64
Evaluation of Disclosure Controls and Procedures
Our management, with the participation of our Chairman and Chief Executive Officer and Chief Financial Officer, conducted an evaluation of the effectiveness of our disclosure controls and procedures, as such term is defined in Exchange Act Rule 13a-15(e), as of the end of the period covered by this report. Based upon such evaluation, our Chairman and Chief Executive Officer and Chief Financial Officer concluded that those controls and procedures are effective to provide reasonable assurance that information required to be disclosed by us in the reports that we file or submit under the Exchange Act is accumulated and communicated to management, including our Chairman and Chief Executive Officer and our Chief Financial Officer, as appropriate, to allow timely decisions regarding required disclosure and are effective to provide reasonable assurance that such information is recorded, processed, summarized and reported within the time periods specified by the SEC’s rules and forms.
Management's Report on Internal Control Over Financial Reporting
Our management is responsible for establishing and maintaining adequate internal control over financial reporting, as such term is defined in Exchange Act Rule 13a-15(f). Our management, with the participation of our Chairman and Chief Executive Officer and our Chief Financial Officer, conducted an evaluation of the effectiveness of our internal control over financial reporting based on the
Internal Control-Integrated Framework (2013)
issued by the Committee of Sponsoring Organizations of the Treadway Commission. Based on this evaluation, management concluded that our internal control over financial reporting was effective as of
December 31, 2017
. The effectiveness of our internal control over financial reporting as of
December 31, 2017
has been audited by PricewaterhouseCoopers LLP, the independent registered certified public accounting firm that audited our consolidated financial statements included in this Annual Report on Form 10-K, as stated in its report, which is included herein on page F-2.
Changes in Internal Control Over Financial Reporting
There were no changes in our internal control over financial reporting identified in connection with the evaluation required by Exchange Act Rule 13a-15(d) during the quarter ended
December 31, 2017
that have materially affected, or are reasonably likely to materially affect, our internal control over financial reporting.
Inherent Limitations on Effectiveness of Controls
It should be noted that any system of controls, however well designed and operated, can provide only reasonable, and not absolute, assurance that the objectives of the system will be met. In addition, the design of any control system is based in part upon certain assumptions about the likelihood of future events. Because of these and other inherent limitations of control systems, there is only reasonable assurance that our controls will succeed in achieving their goals under all potential future conditions.
None.
65
Items 10, 11, 12, 13 and 14. Directors, Executive Officers and Corporate Governance; Executive Compensation; Security Ownership of Certain Beneficial Owners and Management and Related Stockholder Matters; Certain Relationships and Related Transactions; and Director Independence and Principal Accountant Fees and Services
.
Except for information concerning executive officers (called for by Item 401(b) of Regulation S-K), which is included in Part I of this Annual Report on Form 10-K, the information required by Items 10, 11, 12, 13 and 14 is incorporated herein by reference to the Royal Caribbean Cruises Ltd. Definitive Proxy Statement relating to our 2018 Annual Meeting of Shareholders (the "Proxy Statement") to be filed with the Securities and Exchange Commission no later than 120 days after the close of the fiscal year. Please refer to the following sections in the Proxy Statement for more information regarding our corporate governance: "
Corporate Governance
"; "
Proposal 1—Election of Directors
"; and "
Certain Relationships and Related Person Transactions.
" Copies of the Proxy Statement will become available when filed through our Investor Relations website at www.rclcorporate.com (please see "Financial Reports" under "Financial Information"); by contacting our Investor Relations department at 1050 Caribbean Way, Miami, Florida 33132—telephone (305) 982-2625; or by visiting the SEC's website at www.sec.gov.
We have adopted a Code of Business Conduct and Ethics that applies to all of our employees, including our executive officers, and our directors. A copy of the Code of Business Conduct and Ethics is posted in the corporate governance section of our website at www.rclcorporate.com and is available in print, without charge, to shareholders upon written request to our Corporate Secretary at Royal Caribbean Cruises, Ltd., 1050 Caribbean Way, Miami, Florida 33132. Any amendments to the code or any waivers from any provisions of the code granted to executive officers or directors will be promptly disclosed to investors by posting on our website at www.rclcorporate.com. None of the websites referenced in this Annual Report on Form 10-K or the information contained therein is incorporated herein by reference.
66
(a)(1) Financial Statements
Our Consolidated Financial Statements have been prepared in accordance with Item 8.
Financial Statements and Supplementary Data
and are included beginning on page F-1 of this report.
|
(2)
|
Financial Statement Schedules
|
None.
|
(3)
|
Exhibits
|
67
INDEX TO EXHIBITS
Exhibits 10.22 through 10.50 represent management compensatory plans or arrangements.
|
Incorporated By Reference
|
||||||||
|
Exhibit Number
|
Exhibit Description
|
Form
|
Exhibit
|
Filing Date/ Period End Date
|
||||
|
3.1
|
S-3
|
3.1
|
3/23/2009
|
|||||
|
3.2
|
8-K
|
3.1
|
9/11/2013
|
|||||
|
4.1
|
Indenture dated as of July 15, 1994, by and between the Company, as issuer, and The Bank of New York Trust Company, N.A., successor to NationsBank of Georgia, National Association, as Trustee
|
20-F
|
2.4
|
12/31/1994
|
||||
|
4.2
|
Sixth Supplemental Indenture dated as of October 14, 1997, to the Indenture, dated as of July 15, 1994, by and between the Company, as issuer, and The Bank of New York Trust Company, N.A., as Trustee
|
20-F
|
2.11
|
12/31/1997
|
||||
|
4.3
|
Eighth Supplemental Indenture dated as of March 16, 1998, to the Indenture, dated as of July 15, 1994, by and between the Company, as issuer, and The Bank of New York Trust Company, N.A., as Trustee
|
20-F
|
2.13
|
12/31/1997
|
||||
|
4.4
|
S-3
|
4.1
|
7/31/2006
|
|||||
|
4.5
|
8-K
|
4.1
|
11/7/2012
|
|||||
|
4.6
|
8-K
|
4.1
|
11/28/2017
|
|||||
|
10.1
|
Amended and Restated Registration Rights Agreement dated as of July 30, 1997, by and among the Company, A. Wilhelmsen AS., Cruise Associates, Monument Capital Corporation, Archinav Holdings, Ltd. and Overseas Cruiseship, Inc.
|
20-F
|
2.20
|
12/31/1997
|
||||
|
10.2
|
8-K
|
10.1
|
6/19/2015
|
|||||
|
10.3
|
8-K
|
10.1
|
12/7/2017
|
|||||
|
10.4
|
8-K
|
10.1
|
8/26/2013
|
|||||
|
10.5
|
10-Q
|
10.2
|
6/30/2015
|
|||||
|
10.6
|
8-K
|
10.3
|
10/17/2017
|
|||||
|
10.7
|
10-K
|
10.7
|
12/31/2015
|
|||||
|
10.8
|
10-K
|
10.8
|
12/31/2015
|
|||||
68
|
Incorporated By Reference
|
||||||||
|
Exhibit Number
|
Exhibit Description
|
Form
|
Exhibit
|
Filing Date/ Period End Date
|
||||
|
10.9
|
10-Q
|
10.1
|
3/31/2016
|
|||||
|
10.10
|
10-K
|
10.10
|
12/31/2015
|
|||||
|
10.11
|
8-K
|
10.1
|
2/5/2015
|
|||||
|
10.12
|
10-K
|
10.10
|
12/31/2016
|
|||||
|
10.13
|
8-K
|
10.1
|
11/19/2015
|
|||||
|
10.14
|
8-K
|
10.2
|
11/19/2015
|
|||||
|
10.15
|
8-K
|
10.1
|
6/28/2016
|
|||||
|
10.16
|
8-K
|
10.2
|
6/28/2016
|
|||||
|
10.17
|
8-K
|
10.1
|
7/28/2017
|
|||||
|
10.18
|
8-K
|
10.2
|
7/28/2017
|
|||||
|
10.19
|
8-K
|
10.3
|
7/28/2017
|
|||||
|
10.20
|
8-K
|
10.1
|
10/17/2017
|
|||||
69
|
Incorporated By Reference
|
||||||||
|
Exhibit Number
|
Exhibit Description
|
Form
|
Exhibit
|
Filing Date/ Period End Date
|
||||
|
10.21
|
8-K
|
10.2
|
10/17/2017
|
|||||
|
10.22
|
8-K
|
10.1
|
12/8/2005
|
|||||
|
10.23
|
8-K
|
10.1
|
9/22/2006
|
|||||
|
10.24
|
10-K
|
10.17
|
12/31/2016
|
|||||
|
10.25
|
10-Q
|
10.3
|
9/30/2008
|
|||||
|
10.26
|
10-Q
|
10.4
|
9/30/2008
|
|||||
|
10.27
|
10-K
|
10.23
|
12/31/2013
|
|||||
|
10.28
|
10-Q
|
10.7
|
9/30/2017
|
|||||
|
10.29
|
10-K
|
10.31
|
12/31/2010
|
|||||
|
10.30
|
10-K
|
10.27
|
12/31/2014
|
|||||
|
10.31
|
10-K
|
10.26
|
12/31/2015
|
|||||
|
10.32
|
10-K
|
10.22
|
12/31/2012
|
|||||
|
10.33
|
10-K
|
10.23
|
12/31/2012
|
|||||
|
10.34
|
10-Q
|
10.2
|
6/30/2013
|
|||||
|
10.35
|
10-Q
|
10.3
|
6/30/2015
|
|||||
|
10.36
|
10-K
|
10.33
|
12/31/2014
|
|||||
|
10.37
|
10-K
|
10.31
|
12/31/2016
|
|||||
|
10.38
|
10-Q
|
10.4
|
6/30/2015
|
|||||
|
10.39
|
8-K
|
10.2
|
12/8/2005
|
|||||
|
10.40
|
10-K
|
10.29
|
12/31/2006
|
|||||
|
10.41
|
10-K
|
10.28
|
12/31/2007
|
|||||
|
10.42
|
10-K
|
10.36
|
12/31/2008
|
|||||
|
10.43
|
8-K
|
10.3
|
12/8/2005
|
|||||
|
10.44
|
10-K
|
10.31
|
12/31/2006
|
|||||
|
10.45
|
10-K
|
10.31
|
12/31/2007
|
|||||
|
10.46
|
10-Q
|
10.1
|
9/30/2008
|
|||||
|
10.47
|
10-K
|
10.38
|
12/31/2008
|
|||||
70
|
Incorporated By Reference
|
||||||||
|
Exhibit Number
|
Exhibit Description
|
Form
|
Exhibit
|
Filing Date/ Period End Date
|
||||
|
10.48
|
10-K
|
10.35
|
12/31/2013
|
|||||
|
12.1
|
||||||||
|
21.1
|
||||||||
|
23.1
|
||||||||
|
23.2
|
||||||||
|
24.1
|
||||||||
|
31.1
|
||||||||
|
31.2
|
||||||||
|
32.1
|
||||||||
|
*
|
Filed herewith
|
|
**
|
Furnished herewith
|
Interactive Data File
|
101
|
—The following financial statements from Royal Caribbean Cruises Ltd.'s Annual Report on Form 10-K for the year ended December 31, 2017, as filed with the SEC on February 20, 2018, formatted in XBRL, as follows:
|
|
|
(i)
|
the Consolidated Statements of Comprehensive Income (Loss) for the years ended December 31, 2017, 2016 and 2015;
|
|
|
(ii)
|
the Consolidated Balance Sheets at December 31, 2017 and 2016;
|
|
|
(iii)
|
the Consolidated Statements of Cash Flows for the years ended December 31, 2017, 2016 and 2015;
|
|
|
(iv)
|
the Consolidated Statements of Shareholders' Equity for the years ended December 31, 2017, 2016 and 2015; and
|
|
|
(v)
|
the Notes to the Consolidated Financial Statements, tagged in summary and detail.
|
|
None.
SIGNATURES
Pursuant to the requirements of the Securities Exchange Act of 1934, the registrant has duly caused this report to be signed on its behalf by the undersigned, thereunto duly authorized.
|
ROYAL CARIBBEAN CRUISES LTD.
(Registrant)
|
|
|
By:
|
/s/ JASON T. LIBERTY
|
|
Jason T. Liberty
Executive Vice President, Chief Financial Officer
(Principal Financial Officer and duly authorized signatory) |
|
February 20, 2018
Pursuant to the requirements of the Securities Exchange Act of 1934, this report has been signed below by the following persons on behalf of the registrant and in the capacities indicated on
February 20, 2018
.
|
/s/ RICHARD D. FAIN
|
|
Richard D. Fain
Director, Chairman and Chief Executive Officer
(Principal Executive Officer)
|
|
/s/ JASON T. LIBERTY
|
|
Jason T. Liberty
Executive Vice President, Chief Financial Officer
(Principal Financial Officer)
|
|
/s/ HENRY L. PUJOL
|
|
Henry L. Pujol
Senior Vice President, Chief Accounting Officer (Principal Accounting Officer)
|
|
*
|
|
John F. Brock
Director |
|
*
|
|
William L. Kimsey
Director
|
|
*
|
|
Maritza G. Montiel
Director |
|
*
|
|
Ann S. Moore
Director
|
|
*
|
|
Eyal M. Ofer
Director
|
|
*
|
|
Thomas J. Pritzker
Director
|
|
*
|
|
William K. Reilly
Director
|
|
*
|
|
Bernt Reitan
Director
|
|
*
|
|
Vagn O. Sørensen
Director
|
|
*
|
|
Donald Thompson
Director
|
|
*
|
|
Arne Alexander Wilhelmsen
Director
|
|
*By:
|
/s/ JASON T. LIBERTY
|
|
Jason T. Liberty,
as Attorney-in-Fact
|
|
71
ROYAL CARIBBEAN CRUISES LTD.
INDEX TO CONSOLIDATED FINANCIAL STATEMENTS
|
Page
|
|
F-1
Report of Independent Registered Public Accounting Firm
To the Board of Directors and Shareholders
of Royal Caribbean Cruises Ltd.
Opinions on the Financial Statements and Internal Control over Financial Reporting
We have audited the accompanying consolidated balance sheets of Royal Caribbean Cruises Ltd. and its subsidiaries as of December 31, 2017 and 2016, and the related consolidated statements of comprehensive income (loss), shareholders’ equity and cash flows for each of the three years in the period ended December 31, 2017, including the related notes (collectively referred to as the “consolidated financial statements”). We also have audited the Company's internal control over financial reporting as of December 31, 2017, based on criteria established in
Internal Control - Integrated Framework
(2013) issued by the Committee of Sponsoring Organizations of the Treadway Commission (COSO).
In our opinion, the consolidated financial statements referred to above present fairly, in all material respects, the financial position of the Company as of December 31, 2017 and 2016, and the results of their operations and their cash flows for each of the three years in the period ended December 31, 2017 in conformity with accounting principles generally accepted in the United States of America. Also in our opinion, the Company maintained, in all material respects, effective internal control over financial reporting as of December 31, 2017, based on criteria established in
Internal Control - Integrated Framework
(2013) issued by the COSO.
Basis for Opinions
The Company's management is responsible for these consolidated financial statements, for maintaining effective internal control over financial reporting, and for its assessment of the effectiveness of internal control over financial reporting, included in Management's Report on Internal Control over Financial Reporting appearing under Item 9A. Our responsibility is to express opinions on the Company’s consolidated financial statements and on the Company's internal control over financial reporting based on our audits. We are a public accounting firm registered with the Public Company Accounting Oversight Board (United States) ("PCAOB") and are required to be independent with respect to the Company in accordance with the U.S. federal securities laws and the applicable rules and regulations of the Securities and Exchange Commission and the PCAOB.
We conducted our audits in accordance with the standards of the PCAOB. Those standards require that we plan and perform the audits to obtain reasonable assurance about whether the consolidated financial statements are free of material misstatement, whether due to error or fraud, and whether effective internal control over financial reporting was maintained in all material respects.
Our audits of the consolidated financial statements included performing procedures to assess the risks of material misstatement of the consolidated financial statements, whether due to error or fraud, and performing procedures that respond to those risks. Such procedures included examining, on a test basis, evidence regarding the amounts and disclosures in the consolidated financial statements. Our audits also included evaluating the accounting principles used and significant estimates made by management, as well as evaluating the overall presentation of the consolidated financial statements. Our audit of internal control over financial reporting included obtaining an understanding of internal control over financial reporting, assessing the risk that a material weakness exists, and testing and evaluating the design and operating effectiveness of internal control based on the assessed risk. Our audits also included performing such other procedures as we considered necessary in the circumstances. We believe that our audits provide a reasonable basis for our opinions.
Definition and Limitations of Internal Control over Financial Reporting
A company’s internal control over financial reporting is a process designed to provide reasonable assurance regarding the reliability of financial reporting and the preparation of financial statements for external purposes in accordance with generally accepted accounting principles. A company’s internal control over financial reporting includes those policies and procedures that (i) pertain to the maintenance of records that, in reasonable detail, accurately and fairly reflect the transactions and dispositions of the assets of the company; (ii) provide reasonable assurance that transactions are recorded as necessary to permit preparation of financial statements in accordance with generally accepted accounting principles, and that receipts and expenditures of the company are being made only in accordance with authorizations of management and directors of the company; and (iii) provide reasonable assurance regarding prevention or timely detection of unauthorized acquisition, use, or disposition of the company’s assets that could have a material effect on the financial statements.
F-2
Because of its inherent limitations, internal control over financial reporting may not prevent or detect misstatements. Also, projections of any evaluation of effectiveness to future periods are subject to the risk that controls may become inadequate because of changes in conditions, or that the degree of compliance with the policies or procedures may deteriorate.
/s/ PricewaterhouseCoopers LLP
Certified Public Accountants
Miami, Florida
February 20, 2018
We have served as the Company’s auditor since at least 1989, which includes periods before the Company became subject to SEC reporting requirements. We have not determined the specific year we began serving as auditor of the Company.
F-3
ROYAL CARIBBEAN CRUISES LTD.
|
Year Ended December 31,
|
|||||||||||
|
2017
|
2016
|
2015
|
|||||||||
|
(in thousands, except per share data)
|
|||||||||||
|
Passenger ticket revenues
|
$
|
6,313,170
|
|
$
|
6,149,323
|
|
$
|
6,058,821
|
|
||
|
Onboard and other revenues
|
2,464,675
|
|
2,347,078
|
|
2,240,253
|
|
|||||
|
Total revenues
|
8,777,845
|
|
8,496,401
|
|
8,299,074
|
|
|||||
|
Cruise operating expenses:
|
|||||||||||
|
Commissions, transportation and other
|
1,363,170
|
|
1,349,677
|
|
1,400,778
|
|
|||||
|
Onboard and other
|
495,552
|
|
493,558
|
|
553,104
|
|
|||||
|
Payroll and related
|
852,990
|
|
882,891
|
|
861,775
|
|
|||||
|
Food
|
492,857
|
|
485,673
|
|
480,009
|
|
|||||
|
Fuel
|
681,118
|
|
713,676
|
|
795,801
|
|
|||||
|
Other operating
|
1,010,892
|
|
1,090,064
|
|
1,007,926
|
|
|||||
|
Total cruise operating expenses
|
4,896,579
|
|
5,015,539
|
|
5,099,393
|
|
|||||
|
Marketing, selling and administrative expenses
|
1,186,016
|
|
1,108,742
|
|
1,086,504
|
|
|||||
|
Depreciation and amortization expenses
|
951,194
|
|
894,915
|
|
827,008
|
|
|||||
|
Impairment of Pullmantur related assets
|
—
|
|
—
|
|
411,267
|
|
|||||
|
7,033,789
|
|
7,019,196
|
|
7,424,172
|
|
||||||
|
Operating Income
|
1,744,056
|
|
1,477,205
|
|
874,902
|
|
|||||
|
Other income (expense):
|
|||||||||||
|
Interest income
|
30,101
|
|
20,856
|
|
12,025
|
|
|||||
|
Interest expense, net of interest capitalized
|
(299,982
|
)
|
(307,370
|
)
|
(277,725
|
)
|
|||||
|
Equity investment income
|
156,247
|
|
128,350
|
|
81,026
|
|
|||||
|
Other expense
(1)
|
(5,289
|
)
|
(35,653
|
)
|
(24,445
|
)
|
|||||
|
(118,923
|
)
|
(193,817
|
)
|
(209,119
|
)
|
||||||
|
Net Income
|
$
|
1,625,133
|
|
$
|
1,283,388
|
|
$
|
665,783
|
|
||
|
Basic Earnings per Share:
|
|||||||||||
|
Net income
|
$
|
7.57
|
|
$
|
5.96
|
|
$
|
3.03
|
|
||
|
Diluted Earnings per Share:
|
|||||||||||
|
Net income
|
$
|
7.53
|
|
$
|
5.93
|
|
$
|
3.02
|
|
||
|
Comprehensive Income (Loss)
|
|||||||||||
|
Net Income
|
$
|
1,625,133
|
|
$
|
1,283,388
|
|
$
|
665,783
|
|
||
|
Other comprehensive income (loss):
|
|||||||||||
|
Foreign currency translation adjustments
|
17,307
|
|
2,362
|
|
(30,152
|
)
|
|||||
|
Change in defined benefit plans
|
(5,583
|
)
|
(1,636
|
)
|
4,760
|
|
|||||
|
Gain (loss) on cash flow derivative hedges
|
570,495
|
|
411,223
|
|
(406,047
|
)
|
|||||
|
Total other comprehensive income (loss)
|
582,219
|
|
411,949
|
|
(431,439
|
)
|
|||||
|
Comprehensive Income
|
$
|
2,207,352
|
|
$
|
1,695,337
|
|
$
|
234,344
|
|
||
___________________________________________________________________
|
(1)
|
Including a
$21.7 million
loss related to the 2016 elimination of the Pullmantur reporting lag and a net deferred tax benefit of
$12.0 million
related to the 2015 Pullmantur impairment.
|
The accompanying notes are an integral part of these consolidated financial statements.
F-4
ROYAL CARIBBEAN CRUISES LTD.
|
As of December 31,
|
|||||||
|
2017
|
2016
|
||||||
|
(in thousands, except share data)
|
|||||||
|
Assets
|
|||||||
|
Current assets
|
|||||||
|
Cash and cash equivalents
|
$
|
120,112
|
|
$
|
132,603
|
|
|
|
Trade and other receivables, net
|
318,641
|
|
291,899
|
|
|||
|
Inventories
|
111,393
|
|
114,087
|
|
|||
|
Prepaid expenses and other assets
|
193,562
|
|
209,716
|
|
|||
|
Derivative financial instruments
|
99,320
|
|
—
|
|
|||
|
Total current assets
|
843,028
|
|
748,305
|
|
|||
|
Property and equipment, net
|
19,735,180
|
|
20,161,427
|
|
|||
|
Goodwill
|
288,512
|
|
288,386
|
|
|||
|
Other assets
|
1,429,597
|
|
1,112,206
|
|
|||
|
$
|
22,296,317
|
|
$
|
22,310,324
|
|
||
|
Liabilities and Shareholders' Equity
|
|||||||
|
Current liabilities
|
|||||||
|
Current portion of long-term debt
|
$
|
1,188,514
|
|
$
|
1,285,735
|
|
|
|
Accounts payable
|
360,113
|
|
305,313
|
|
|||
|
Accrued interest
|
47,469
|
|
46,166
|
|
|||
|
Accrued expenses and other liabilities
|
903,022
|
|
692,322
|
|
|||
|
Derivative financial instruments
|
47,464
|
|
146,592
|
|
|||
|
Customer deposits
|
2,243,682
|
|
1,965,473
|
|
|||
|
Total current liabilities
|
4,790,264
|
|
4,441,601
|
|
|||
|
Long-term debt
|
6,350,937
|
|
8,101,701
|
|
|||
|
Other long-term liabilities
|
452,813
|
|
645,610
|
|
|||
|
Commitments and contingencies (Note 15)
|
|
|
|||||
|
Shareholders' equity
|
|||||||
|
Preferred stock ($0.01 par value; 20,000,000 shares authorized; none outstanding)
|
—
|
|
—
|
|
|||
|
Common stock ($0.01 par value; 500,000,000 shares authorized; 235,198,901 and 234,613,486 shares issued, December 31, 2017 and December 31, 2016, respectively)
|
2,352
|
|
2,346
|
|
|||
|
Paid-in capital
|
3,390,117
|
|
3,328,517
|
|
|||
|
Retained earnings
|
9,022,405
|
|
7,860,341
|
|
|||
|
Accumulated other comprehensive loss
|
(334,265
|
)
|
(916,484
|
)
|
|||
|
Treasury stock (21,861,308 and 20,019,237 common shares at cost, December 31, 2017 and December 31, 2016, respectively)
|
(1,378,306
|
)
|
(1,153,308
|
)
|
|||
|
Total shareholders' equity
|
10,702,303
|
|
9,121,412
|
|
|||
|
$
|
22,296,317
|
|
$
|
22,310,324
|
|
||
The accompanying notes are an integral part of these consolidated financial statements.
F-5
ROYAL CARIBBEAN CRUISES LTD.
|
Year Ended December 31,
|
|||||||||||
|
2017
|
2016
|
2015
|
|||||||||
|
(in thousands)
|
|||||||||||
|
Operating Activities
|
|||||||||||
|
Net income
|
$
|
1,625,133
|
|
$
|
1,283,388
|
|
$
|
665,783
|
|
||
|
Adjustments:
|
|||||||||||
|
Depreciation and amortization
|
951,194
|
|
894,915
|
|
827,008
|
|
|||||
|
Impairment of Pullmantur related assets
|
—
|
|
—
|
|
411,267
|
|
|||||
|
Net deferred income tax expense (benefit)
|
1,730
|
|
2,608
|
|
(10,001
|
)
|
|||||
|
Share-based compensation expense
|
69,459
|
|
32,659
|
|
36,073
|
|
|||||
|
Equity investment income
|
(156,247
|
)
|
(128,350
|
)
|
(81,026
|
)
|
|||||
|
Amortization of debt issuance costs
|
45,943
|
|
52,795
|
|
52,153
|
|
|||||
|
Gain on sale of property and equipment
|
(30,902
|
)
|
—
|
|
—
|
|
|||||
|
(Gain) loss on derivative instruments not designated as hedges
|
(61,704
|
)
|
45,670
|
|
59,162
|
|
|||||
|
Changes in operating assets and liabilities:
|
|||||||||||
|
(Increase) decrease in trade and other receivables, net
|
(32,043
|
)
|
4,759
|
|
63,102
|
|
|||||
|
Decrease (increase) in inventories
|
2,424
|
|
(1,679
|
)
|
1,197
|
|
|||||
|
Decrease (increase) in prepaid expenses and other assets
|
20,859
|
|
11,519
|
|
(2,262
|
)
|
|||||
|
Increase (decrease) in accounts payable
|
36,780
|
|
29,564
|
|
(25,278
|
)
|
|||||
|
Increase (decrease) in accrued interest
|
1,303
|
|
7,841
|
|
(10,749
|
)
|
|||||
|
Increase in accrued expenses and other liabilities
|
34,215
|
|
20,718
|
|
33,859
|
|
|||||
|
Increase (decrease) in customer deposits
|
274,705
|
|
188,632
|
|
(92,849
|
)
|
|||||
|
Dividends received from unconsolidated affiliates
|
109,677
|
|
75,942
|
|
33,338
|
|
|||||
|
Other, net
|
(17,960
|
)
|
(4,291
|
)
|
(14,411
|
)
|
|||||
|
Net cash provided by operating activities
|
2,874,566
|
|
2,516,690
|
|
1,946,366
|
|
|||||
|
Investing Activities
|
|||||||||||
|
Purchases of property and equipment
|
(564,138
|
)
|
(2,494,363
|
)
|
(1,613,340
|
)
|
|||||
|
Cash received (paid) on settlement of derivative financial instruments
|
63,224
|
|
(213,202
|
)
|
(178,597
|
)
|
|||||
|
Investments in and loans to unconsolidated affiliates
|
(10,396
|
)
|
(9,155
|
)
|
(56,163
|
)
|
|||||
|
Cash received on loans to unconsolidated affiliates
|
62,303
|
|
38,213
|
|
124,253
|
|
|||||
|
Proceeds from sale of property and equipment
|
230,000
|
|
—
|
|
—
|
|
|||||
|
Other, net
(1)
|
5,415
|
|
(46,385
|
)
|
(19,128
|
)
|
|||||
|
Net cash used in investing activities
|
(213,592
|
)
|
(2,724,892
|
)
|
(1,742,975
|
)
|
|||||
|
Financing Activities
|
|||||||||||
|
Debt proceeds
|
5,866,966
|
|
7,338,560
|
|
4,399,501
|
|
|||||
|
Debt issuance costs
|
(51,590
|
)
|
(88,241
|
)
|
(68,020
|
)
|
|||||
|
Repayments of debt
|
(7,835,087
|
)
|
(6,365,570
|
)
|
(4,118,553
|
)
|
|||||
|
Purchase of treasury stock
|
(224,998
|
)
|
(299,960
|
)
|
(200,000
|
)
|
|||||
|
Dividends paid
|
(437,455
|
)
|
(346,487
|
)
|
(280,212
|
)
|
|||||
|
Proceeds from exercise of common stock options
|
2,525
|
|
2,258
|
|
11,252
|
|
|||||
|
Other, net
|
3,843
|
|
3,249
|
|
2,520
|
|
|||||
|
Net cash (used in) provided by financing activities
|
(2,675,796
|
)
|
243,809
|
|
(253,512
|
)
|
|||||
|
Effect of exchange rate changes on cash
|
2,331
|
|
(24,569
|
)
|
(17,555
|
)
|
|||||
|
Net (decrease) increase in cash and cash equivalents
|
(12,491
|
)
|
11,038
|
|
(67,676
|
)
|
|||||
The accompanying notes are an integral part of these consolidated financial statements.
F-6
|
Cash and cash equivalents at beginning of year
|
132,603
|
|
121,565
|
|
189,241
|
|
|||||
|
Cash and cash equivalents at end of year
|
$
|
120,112
|
|
$
|
132,603
|
|
$
|
121,565
|
|
||
|
Supplemental Disclosures
|
|||||||||||
|
Cash paid during the year for:
|
|||||||||||
|
Interest, net of amount capitalized
|
$
|
249,615
|
|
$
|
256,775
|
|
$
|
248,611
|
|
||
|
|
|||||||||||
|
Non-Cash Investing Activities
|
|||||||||||
|
Purchases of property and equipment included in accounts payable and accrued expenses and other liabilities
|
$
|
139,644
|
|
$
|
—
|
|
$
|
—
|
|
||
|
Notes receivable issued upon sale of property and equipment
|
$
|
20,409
|
|
$
|
213,042
|
|
$
|
—
|
|
||
___________________________________________________________________
(1)
Amount includes
$26.0 million
in 2016 related to cash included in the divestiture of Pullmantur Holdings.
The accompanying notes are an integral part of these consolidated financial statements.
F-7
ROYAL CARIBBEAN CRUISES LTD.
CONSOLIDATED STATEMENTS OF SHAREHOLDERS' EQUITY
|
Common Stock
|
Paid-in Capital
|
Retained Earnings
|
Accumulated Other Comprehensive Income (Loss)
|
Treasury Stock
|
Total Shareholders' Equity
|
||||||||||||||||||
|
(in thousands)
|
|||||||||||||||||||||||
|
Balances at January 1, 2015
|
$
|
2,331
|
|
$
|
3,253,552
|
|
$
|
6,575,248
|
|
$
|
(896,994
|
)
|
$
|
(649,778
|
)
|
$
|
8,284,359
|
|
|||||
|
Issuance under employee related plans
|
8
|
|
40,497
|
|
—
|
|
—
|
|
—
|
|
40,505
|
|
|||||||||||
|
Common Stock dividends
|
—
|
|
—
|
|
(296,169
|
)
|
—
|
|
—
|
|
(296,169
|
)
|
|||||||||||
|
Changes related to cash flow derivative hedges
|
—
|
|
—
|
|
—
|
|
(406,047
|
)
|
—
|
|
(406,047
|
)
|
|||||||||||
|
Change in defined benefit plans
|
—
|
|
—
|
|
—
|
|
4,760
|
|
—
|
|
4,760
|
|
|||||||||||
|
Foreign currency translation adjustments
|
—
|
|
—
|
|
—
|
|
(30,152
|
)
|
—
|
|
(30,152
|
)
|
|||||||||||
|
Purchase of Treasury Stock
|
—
|
|
3,570
|
|
—
|
|
—
|
|
(203,570
|
)
|
(200,000
|
)
|
|||||||||||
|
Net income
|
—
|
|
—
|
|
665,783
|
|
—
|
|
—
|
|
665,783
|
|
|||||||||||
|
Balances at December 31, 2015
|
2,339
|
|
3,297,619
|
|
6,944,862
|
|
(1,328,433
|
)
|
(853,348
|
)
|
8,063,039
|
|
|||||||||||
|
Issuance under employee related plans
|
7
|
|
30,898
|
|
—
|
|
—
|
|
—
|
|
30,905
|
|
|||||||||||
|
Common Stock dividends
|
—
|
|
—
|
|
(367,909
|
)
|
—
|
|
—
|
|
(367,909
|
)
|
|||||||||||
|
Changes related to cash flow derivative hedges
|
—
|
|
—
|
|
—
|
|
411,223
|
|
—
|
|
411,223
|
|
|||||||||||
|
Change in defined benefit plans
|
—
|
|
—
|
|
—
|
|
(1,636
|
)
|
—
|
|
(1,636
|
)
|
|||||||||||
|
Foreign currency translation adjustments
|
—
|
|
—
|
|
—
|
|
2,362
|
|
—
|
|
2,362
|
|
|||||||||||
|
Purchases of Treasury Stock
|
—
|
|
—
|
|
—
|
|
—
|
|
(299,960
|
)
|
(299,960
|
)
|
|||||||||||
|
Net income
|
—
|
|
—
|
|
1,283,388
|
|
—
|
|
—
|
|
1,283,388
|
|
|||||||||||
|
Balances at December 31, 2016
|
2,346
|
|
3,328,517
|
|
7,860,341
|
|
(916,484
|
)
|
(1,153,308
|
)
|
9,121,412
|
|
|||||||||||
|
Issuance under employee related plans
|
6
|
|
61,600
|
|
—
|
|
—
|
|
—
|
|
61,606
|
|
|||||||||||
|
Common Stock dividends
|
—
|
|
—
|
|
(463,069
|
)
|
—
|
|
—
|
|
(463,069
|
)
|
|||||||||||
|
Changes related to cash flow derivative hedges
|
—
|
|
—
|
|
—
|
|
570,495
|
|
—
|
|
570,495
|
|
|||||||||||
|
Change in defined benefit plans
|
—
|
|
—
|
|
—
|
|
(5,583
|
)
|
—
|
|
(5,583
|
)
|
|||||||||||
|
Foreign currency translation adjustments
|
—
|
|
—
|
|
—
|
|
17,307
|
|
—
|
|
17,307
|
|
|||||||||||
|
Purchases of Treasury Stock
|
—
|
|
—
|
|
—
|
|
—
|
|
(224,998
|
)
|
(224,998
|
)
|
|||||||||||
|
Net income
|
—
|
|
—
|
|
1,625,133
|
|
—
|
|
—
|
|
1,625,133
|
|
|||||||||||
|
Balances at December 31, 2017
|
$
|
2,352
|
|
$
|
3,390,117
|
|
$
|
9,022,405
|
|
$
|
(334,265
|
)
|
$
|
(1,378,306
|
)
|
$
|
10,702,303
|
|
|||||
The accompanying notes are an integral part of these consolidated financial statements.
F-8
ROYAL CARIBBEAN CRUISES LTD.
NOTES TO THE CONSOLIDATED FINANCIAL STATEMENTS
Note 1.
General
Description of Business
We are a global cruise company. We own and operate
three
global cruise brands: Royal Caribbean International, Celebrity Cruises and Azamara Club Cruises. We also own a
50%
joint venture interest in the German brand TUI Cruises, a
49%
interest in the Spanish brand Pullmantur and have a
36%
interest in the Chinese brand SkySea Cruises (collectively, our "Partner Brands"). We account for our investments in our Partner Brands under the equity method of accounting. Together, our Global Brands and our Partner Brands operate a combined
49
ships as of
December 31, 2017
. Our ships operate on a selection of worldwide itineraries that call on approximately
540
destinations on all
seven
continents.
Effective July 31, 2016, we sold
51%
of our interest in Pullmantur Holdings (formerly known as Royal Caribbean Holdings de España S.L. or "RCHE"), the parent company of the Pullmantur brand. We retain a
49%
interest in Pullmantur Holdings as well as full ownership of the
four
vessels currently operated by the Pullmantur brand under bareboat charter arrangements. We account for the bareboat charters of the vessels to Pullmantur Holdings as operating leases. We also provide certain ship management services to Pullmantur Holdings. We recognized an immaterial gain on the sale of our majority interest in Pullmantur Holdings. We had also retained full ownership of the aircraft which we subsequently sold during 2017. Effective August 2016, we no longer consolidate Pullmantur Holdings in our consolidated financial statements and our investment in the company is accounted for under the equity method of accounting. Refer to Note 6.
Other Assets
for further information on our retained interest in Pullmantur Holdings and Note 5.
Property and Equipment
for further information on the sale of the aircraft. The sale did not represent a strategic shift that will have a major effect on our operations and financial results, as we continue to provide similar itineraries to and source passengers from the markets served by the Pullmantur business. Therefore, the sale of Pullmantur Holdings did not meet the criteria for discontinued operations reporting.
Basis for Preparation of Consolidated Financial Statements
The consolidated financial statements are prepared in accordance with accounting principles generally accepted in the United States of America ("GAAP"). Estimates are required for the preparation of financial statements in accordance with these principles. Actual results could differ from these estimates. Refer to Note 2.
Summary of Significant Accounting Policies
for a discussion of our significant accounting policies.
All significant intercompany accounts and transactions are eliminated in consolidation. We consolidate entities over which we have control, usually evidenced by a direct ownership interest of greater than
50%
, and variable interest entities where we are determined to be the primary beneficiary. Refer to Note 6.
Other Assets
for further information regarding our variable interest entities. For affiliates we do not control but over which we have significant influence on financial and operating policies, usually evidenced by a direct ownership interest from
20%
to
50%
, the investment is accounted for using the equity method.
Prior to January 1, 2016, we consolidated the operating results of Pullmantur Holdings on a
two
-month reporting lag to allow for more timely preparation of our consolidated financial statements. Effective January 1, 2016, we eliminated the two-month reporting lag to reflect Pullmantur Holdings' financial position, results of operations and cash flows concurrently and consistently with the fiscal calendar of the Company ("elimination of the Pullmantur reporting lag"). The elimination of the Pullmantur reporting lag represented a change in accounting principle which we believed to be preferable because it provided more current information to the users of our financial statements. A change in accounting principle requires retrospective application, if material. The impact of the elimination of the reporting lag was immaterial to prior periods and was immaterial for our fiscal year ended December 31, 2016. As a result, we have accounted for this change in accounting principle in our consolidated results for the year ended December 31, 2016. Accordingly, the results of Pullmantur Holdings for November and December 2015 were included in our statement of comprehensive income (loss) for the year ended December 31, 2016. The effect of this change was
F-9
ROYAL CARIBBEAN CRUISES LTD.
NOTES TO THE CONSOLIDATED FINANCIAL STATEMENTS (Continued)
a decrease to net income of
$21.7 million
, which has been reported within
Other expense
in our consolidated statements of comprehensive income (loss) for the year ended December 31, 2016.
Note 2.
Summary of Significant Accounting Policies
Revenues and Expenses
Deposits received on sales of passenger cruises are initially recorded as customer deposit liabilities on our balance sheet. Customer deposits are subsequently recognized as passenger ticket revenues, together with revenues from onboard and other goods and services and all associated cruise operating expenses of a voyage.
Revenues and expenses include port costs that vary with guest head counts. The amounts of such port costs charged to our guests and included within
Passenger ticket revenues
on a gross basis were
$569.5 million
,
$570.3 million
and
$561.1 million
for the years
2017
,
2016
and
2015
, respectively.
Cash and Cash Equivalents
Cash and cash equivalents include cash and marketable securities with original maturities of less than 90 days.
Inventories
Inventories consist of provisions, supplies and fuel carried at the lower of cost (weighted-average) or net realizable value.
Property and Equipment
Property and equipment are stated at cost less accumulated depreciation and amortization. We capitalize interest as part of the cost of acquiring certain assets. Improvement costs that we believe add value to our ships are capitalized as additions to the ship and depreciated over the shorter of the improvements' estimated useful lives or that of the associated ship. The estimated cost and accumulated depreciation of replaced or refurbished ship components are written off and any resulting losses are recognized in
Cruise operating expenses
. Liquidated damages received from shipyards as a result of the late delivery of a new ship are recorded as reductions to the cost basis of the ship.
Depreciation of property and equipment is computed using the straight-line method over the estimated useful life of the asset. The useful lives of our ships are generally
30 years
, net of a
15%
projected residual value. The
30
-year useful life of our newly constructed ships and
15%
associated residual value are both based on the weighted-average of all major components of a ship. Our useful life and residual value estimates take into consideration the impact of anticipated technological changes, long-term cruise and vacation market conditions and historical useful lives of similarly-built ships. In addition, we take into consideration our estimates of the weighted-average useful lives of the ships' major component systems, such as hull, superstructure, main electric, engines and cabins. Depreciation for assets under capital leases is computed using the shorter of the lease term or related asset life.
Depreciation of property and equipment is computed utilizing the following useful lives:
|
Years
|
|
|
Ships
|
generally 30
|
|
Ship improvements
|
3-20
|
|
Buildings and improvements
|
10-40
|
|
Computer hardware and software
|
3-10
|
|
Transportation equipment and other
|
3-30
|
|
Leasehold improvements
|
Shorter of remaining lease term or useful life 3-30
|
We review long-lived assets for impairment whenever events or changes in circumstances indicate, based on estimated undiscounted future cash flows, that the carrying amount of these assets may not be fully recoverable. For purposes of recognition and measurement of an impairment loss, long-lived assets are grouped with other assets and
F-10
ROYAL CARIBBEAN CRUISES LTD.
NOTES TO THE CONSOLIDATED FINANCIAL STATEMENTS (Continued)
liabilities at the lowest level for which identifiable cash flows are largely independent of the cash flows of other assets and liabilities. The lowest level for which we maintain identifiable cash flows that are independent of the cash flows of other assets and liabilities is at the ship level for our ships and, prior to the sale of the aircraft, at the aggregated asset group level for our aircraft. If estimated future cash flows are less than the carrying value of an asset, an impairment charge is recognized to the extent its carrying value exceeds fair value.
We use the deferral method to account for drydocking costs. Under the deferral method, drydocking costs incurred are deferred and charged to expense on a straight-line basis over the period to the next scheduled drydock, which we estimate to be a period of
thirty
to
sixty
months based on the vessel's age as required by Class. Deferred drydock costs consist of the costs to drydock the vessel and other costs incurred in connection with the drydock which are necessary to maintain the vessel's Class certification. Class certification is necessary in order for our cruise ships to be flagged in a specific country, obtain liability insurance and legally operate as passenger cruise ships. The activities associated with those drydocking costs cannot be performed while the vessel is in service and, as such, are done during a drydock as a planned major maintenance activity. The significant deferred drydock costs consist of hauling and wharfage services provided by the drydock facility, hull inspection and related activities (e.g., scraping, pressure cleaning, bottom painting), maintenance to steering propulsion, thruster equipment and ballast tanks, port services such as tugs, pilotage and line handling, and freight associated with these items. We perform a detailed analysis of the various activities performed for each drydock and only defer those costs that are directly related to planned major maintenance activities necessary to maintain Class. The costs deferred are not otherwise routinely periodically performed to maintain a vessel's designed and intended operating capability. Repairs and maintenance activities are charged to expense as incurred.
Goodwill
Goodwill represents the excess of cost over the fair value of net tangible and identifiable intangible assets acquired. We review goodwill for impairment at the reporting unit level annually or, when events or circumstances dictate, more frequently. The impairment review for goodwill consists of a qualitative assessment of whether it is more-likely-than-not that a reporting unit's fair value is less than its carrying amount, and if necessary, a two-step goodwill impairment test. Factors to consider when performing the qualitative assessment include general economic conditions, limitations on accessing capital, changes in forecasted operating results, changes in fuel prices and fluctuations in foreign exchange rates. If the qualitative assessment demonstrates that it is more-likely-than-not that the estimated fair value of the reporting unit exceeds its carrying value, it is not necessary to perform the two-step goodwill impairment test. We may elect to bypass the qualitative assessment and proceed directly to step one, for any reporting unit, in any period. On a periodic basis, we elect to bypass the qualitative assessment and proceed to step one to corroborate the results of recent years' qualitative assessments. We can resume the qualitative assessment for any reporting unit in any subsequent period. When performing the two-step goodwill impairment test, the fair value of the reporting unit is determined and compared to the carrying value of the net assets allocated to the reporting unit. If the fair value of the reporting unit exceeds its carrying value, no further analysis or write-down of goodwill is required. If the fair value of the reporting unit is less than the carrying value of its net assets, the implied fair value of the reporting unit is allocated to all its underlying assets and liabilities, including both recognized and unrecognized tangible and intangible assets, based on their fair value. If necessary, goodwill is then written down to its implied fair value.
Intangible Assets
In connection with our acquisitions, we have acquired certain intangible assets to which value has been assigned based on our estimates. Intangible assets that are deemed to have an indefinite life are not amortized, but are subject to an annual impairment test, or when events or circumstances dictate, more frequently. The indefinite-life intangible asset impairment test consists of a comparison of the fair value of the indefinite-life intangible asset with its carrying amount. If the carrying amount exceeds its fair value, an impairment loss is recognized in an amount equal to that excess. If the fair value exceeds its carrying amount, the indefinite-life intangible asset is not considered impaired.
Other intangible assets assigned finite useful lives are amortized on a straight-line basis over their estimated useful lives.
F-11
ROYAL CARIBBEAN CRUISES LTD.
NOTES TO THE CONSOLIDATED FINANCIAL STATEMENTS (Continued)
Contingencies — Litigation
On an ongoing basis, we assess the potential liabilities related to any lawsuits or claims brought against us. While it is typically very difficult to determine the timing and ultimate outcome of such actions, we use our best judgment to determine if it is probable that we will incur an expense related to the settlement or final adjudication of such matters and whether a reasonable estimation of such probable loss, if any, can be made. In assessing probable losses, we take into consideration estimates of the amount of insurance recoveries, if any, which are recorded as assets when recoverability is probable. We accrue a liability when we believe a loss is probable and the amount of loss can be reasonably estimated. Due to the inherent uncertainties related to the eventual outcome of litigation and potential insurance recoveries, it is possible that certain matters may be resolved for amounts materially different from any provisions or disclosures that we have previously made.
Advertising Costs
Advertising costs are expensed as incurred except those costs which result in tangible assets, such as brochures, which are treated as prepaid expenses and charged to expense as consumed. Advertising costs consist of media advertising as well as brochure, production and direct mail costs.
Media advertising was
$233.5 million
,
$240.3 million
and
$242.8 million
, and brochure, production and direct mail costs were
$126.7 million
,
$120.8 million
and
$127.1 million
for the years
2017
,
2016
and
2015
, respectively.
Derivative Instruments
We enter into various forward, swap and option contracts to manage our interest rate exposure and to limit our exposure to fluctuations in foreign currency exchange rates and fuel prices. These instruments are recorded on the balance sheet at their fair value and the vast majority are designated as hedges. We also use non-derivative financial instruments designated as hedges of our net investment in our foreign operations and investments. Although certain of our derivative financial instruments do not qualify or are not accounted for under hedge accounting, we do not hold or issue derivative financial instruments for trading or other speculative purposes.
At inception of the hedge relationship, a derivative instrument that hedges the exposure to changes in the fair value of a firm commitment or a recognized asset or liability is designated as a fair value hedge. A derivative instrument that hedges a forecasted transaction or the variability of cash flows related to a recognized asset or liability is designated as a cash flow hedge.
Changes in the fair value of derivatives that are designated as fair value hedges are offset against changes in the fair value of the underlying hedged assets, liabilities or firm commitments. Gains and losses on derivatives that are designated as cash flow hedges are recorded as a component of
Accumulated other comprehensive loss
until the underlying hedged transactions are recognized in earnings. The foreign currency transaction gain or loss of our non-derivative financial instruments designated as hedges of our net investment in foreign operations and investments are recognized as a component of
Accumulated other comprehensive loss
along with the associated foreign currency translation adjustment of the foreign operation.
On an ongoing basis, we assess whether derivatives used in hedging transactions are "highly effective" in offsetting changes in the fair value or cash flow of hedged items. We use the long-haul method to assess hedge effectiveness using regression analysis for each hedge relationship under our interest rate, foreign currency and fuel hedging programs. We apply the same methodology on a consistent basis for assessing hedge effectiveness to all hedges within each hedging program (i.e., interest rate, foreign currency and fuel). We perform regression analyses over an observation period of up to
three
years, utilizing market data relevant to the hedge horizon of each hedge relationship. High effectiveness is achieved when a statistically valid relationship reflects a high degree of offset and correlation between the changes in the fair values of the derivative instrument and the hedged item. The determination of ineffectiveness is based on the amount of dollar offset between the change in fair value of the derivative instrument and the change in fair value of the hedged item at the end of the reporting period. If it is determined that a derivative is not highly effective as a hedge or hedge accounting is discontinued, any change in fair value of the derivative since the last date at which
F-12
ROYAL CARIBBEAN CRUISES LTD.
NOTES TO THE CONSOLIDATED FINANCIAL STATEMENTS (Continued)
it was determined to be effective is recognized in earnings. In addition, the ineffective portion of our highly effective hedges is immediately recognized in earnings and reported in
Other expense
in our consolidated statements of comprehensive income (loss).
Cash flows from derivative instruments that are designated as fair value or cash flow hedges are classified in the same category as the cash flows from the underlying hedged items. In the event that hedge accounting is discontinued, cash flows subsequent to the date of discontinuance are classified within investing activities. Cash flows from derivative instruments not designated as hedging instruments are classified as investing activities.
We consider the classification of the underlying hedged item’s cash flows in determining the classification for the designated derivative instrument’s cash flows. We classify derivative instrument cash flows from hedges of benchmark interest rate or hedges of fuel expense as operating activities due to the nature of the hedged item. Likewise, we classify derivative instrument cash flows from hedges of foreign currency risk on our newbuild ship payments as investing activities and derivative instrument cash flows from hedges of foreign currency risk on debt payments as financing activities.
Foreign Currency Translations and Transactions
We translate assets and liabilities of our foreign subsidiaries whose functional currency is the local currency, at exchange rates in effect at the balance sheet date. We translate revenues and expenses at weighted-average exchange rates for the period. Equity is translated at historical rates and the resulting foreign currency translation adjustments are included as a component of
Accumulated other comprehensive loss
, which is reflected as a separate component of
Shareholders' equity
. Exchange gains or losses arising from the remeasurement of monetary assets and liabilities denominated in a currency other than the functional currency of the entity involved are immediately included in our earnings, except for certain liabilities that have been designated to act as a hedge of a net investment in a foreign operation or investment. Exchange (losses) gains were
$(75.6) million
,
$39.8 million
and
$34.6 million
for the years
2017
,
2016
and
2015
, respectively, and were recorded within
Other expense
. The majority of our transactions are settled in United States dollars. Gains or losses resulting from transactions denominated in other currencies are recognized in income at each balance sheet date.
Concentrations of Credit Risk
We monitor our credit risk associated with financial and other institutions with which we conduct significant business and, to minimize these risks, we select counterparties with credit risks acceptable to us and we seek to limit our exposure to an individual counterparty. Credit risk, including but not limited to counterparty nonperformance under derivative instruments, our credit facilities and new ship progress payment guarantees, is not considered significant, as we primarily conduct business with large, well-established financial institutions, insurance companies and export credit agencies many of which we have long-term relationships with and which have credit risks acceptable to us or where the credit risk is spread out among a large number of counterparties. As of
December 31, 2017
, we had counterparty credit risk exposure under our derivative instruments of approximately
$212.8 million
, which was limited to the cost of replacing the contracts in the event of non-performance by the counterparties to the contracts, the majority of which are currently our lending banks. As of
December 31, 2016
, we did not have any exposure under our derivative instruments. We do not anticipate nonperformance by any of our significant counterparties. In addition, we have established guidelines we follow regarding credit ratings and instrument maturities to maintain safety and liquidity. We do not normally require collateral or other security to support credit relationships; however, in certain circumstances this option is available to us.
Earnings Per Share
Basic earnings per share is computed by dividing net income by the weighted-average number of shares of common stock outstanding during each period. Diluted earnings per share incorporates the incremental shares issuable upon the assumed exercise of stock options and conversion of potentially dilutive securities.
Stock-Based Employee Compensation
F-13
ROYAL CARIBBEAN CRUISES LTD.
NOTES TO THE CONSOLIDATED FINANCIAL STATEMENTS (Continued)
We measure and recognize compensation expense at the estimated fair value of employee stock awards. Compensation expense for awards and the related tax effects are recognized as they vest. We use the estimated amount of expected forfeitures to calculate compensation costs for all outstanding awards.
Segment Reporting
We own and operate
three
global cruise brands, Royal Caribbean International, Celebrity Cruises and Azamara Club Cruises. We also own a
50%
joint venture interest with TUI AG which operates the brand TUI Cruises, a
49%
interest in the Spanish brand Pullmantur and have a
36%
interest in the Chinese brand SkySea Cruises. We believe our brands possess the versatility to enter multiple cruise market segments within the cruise vacation industry. Although each of these brands have its own marketing style as well as ships and crews of various sizes, the nature of the products sold and services delivered by these brands share a common base (i.e., the sale and provision of cruise vacations). Our brands also have similar itineraries as well as similar cost and revenue components. In addition, our brands source passengers from similar markets around the world and operate in similar economic environments with a significant degree of commercial overlap. As a result, our brands have been aggregated as a single reportable segment based on the similarity of their economic characteristics, types of consumers, regulatory environment, maintenance requirements, supporting systems and processes as well as products and services provided. Our Chairman and Chief Executive Officer has been identified as the chief operating decision-maker and all significant operating decisions including the allocation of resources are based upon the analyses of the Company as
one
segment.
Information by geographic area is shown in the table below. Passenger ticket revenues are attributed to geographic areas based on where the reservation originates.
|
|
2017
|
|
2016
|
|
2015
|
|
Passenger ticket revenues:
|
|
|
|||
|
United States
|
59%
|
|
55%
|
55%
|
|
|
All other countries
|
41%
|
|
45%
|
45%
|
|
Recent Accounting Pronouncements
Revenue from Contracts with Customers
In May 2014, amended GAAP guidance was issued to clarify the principles used to recognize revenue for all entities. The guidance also requires more detailed disclosures and provides additional guidance for transactions that were not comprehensively addressed in the prior accounting guidance. This guidance must be applied using one of two retrospective application methods and will be effective for our annual reporting period beginning after December 15, 2017, including interim periods therein.
We have elected the modified retrospective method which will involve applying the guidance retrospectively only to the most current period presented in the consolidated financial statements and recognizing the cumulative effect of initially applying the guidance as an adjustment to the January 1, 2018 opening balance of retained earnings, if any. We have completed our evaluation of potential changes to our core revenues using the five-step model supported by the new revenue standard, including our accounting for customer loyalty programs and promotional offerings. Based on our assessment, the adoption of this newly issued guidance is not expected to have a material impact to the timing of recognition of our core revenues, but will require us to enhance our disclosures with respect to our revenue recognition policies.
Leases
In February 2016, amended GAAP guidance was issued to increase the transparency and comparability of lease accounting among organizations. For leases with a term greater than 12 months, the amendments require the lease rights and obligations arising from the leasing arrangements, including operating leases, to be recognized as assets and liabilities on the balance sheet. The amendments also expand the required disclosures surrounding leasing arrangements.
F-14
ROYAL CARIBBEAN CRUISES LTD.
NOTES TO THE CONSOLIDATED FINANCIAL STATEMENTS (Continued)
The guidance must be applied using a retrospective application method and will be effective for financial statements issued for fiscal years beginning after December 15, 2018 and interim periods within those years. Early adoption is permitted. We are currently evaluating the impact of the adoption of this newly issued guidance to our consolidated financial statements.
Classification of Certain Cash Receipts and Cash Payments
In August 2016, amended GAAP guidance was issued to clarify how certain cash receipts and cash payments are presented and classified in the statement of cash flows. The amendments are aimed at reducing the existing diversity in practice. The guidance should be applied using a retrospective transition method to each period presented and will be effective for annual periods beginning after December 15, 2017 and interim periods within those annual periods. Early adoption is permitted, including adoption in an interim period. We intend to adopt the guidance on the date of initial application, January 1, 2018. The adoption of this newly issued guidance is not expected to have a material impact to our consolidated financial statements.
Intra-Entity Transfers of Assets Other Than Inventory
In October 2016, amended GAAP guidance was issued that requires the income tax consequences of an intra-entity transfer of an asset, other than inventory, to be recognized at the time that the transfer occurs, rather than when the asset is sold to an outside party. The new guidance is effective for annual and interim reporting periods beginning after December 15, 2017. Early adoption is permitted as of the beginning of an annual period for which financial statements have not been issued. The guidance is required to be adopted retrospectively by recording a cumulative-effect adjustment to retained earnings as of the beginning of the adoption period. The adoption of this newly issued guidance is not expected to have a material impact to our consolidated financial statements.
Service Concession Arrangements
In May 2017, amended GAAP guidance was issued to clarify who should be viewed as the customer under service concession arrangements. A service concession arrangement is an arrangement under which a public sector entity (“grantor”), such as a Port Authority, grants a private entity (“operator”), such as the Company, the right to operate the grantor's infrastructure for a specified period of time. The amended guidance will require the Company to evaluate the relationship with the grantor and identify the multiple performance obligations that may exist under these concession arrangements, including consideration of construction services that may be performed, operational services, and any other maintenance or ancillary services performed under the service concession. In addition, the amended guidance will require that all revenue streams identified under such arrangements be evaluated with the grantor as the customer, irrespective of whether some of the revenues are paid by third-party users of the infrastructure under concession. The clarification will enable a more consistent application of the new Revenue from Contracts with Customers guidance, which along with this clarification guidance, will be effective for our annual reporting period beginning after December 15, 2017, including interim periods therein. This guidance must be applied using one of two retrospective application methods. The adoption of this newly issued guidance is not expected to have a material impact to our consolidated financial statements.
Derivatives and Hedging
In August 2017, amended GAAP guidance was issued to simplify and improve the financial reporting of hedging relationships to better portray the economic results of an entity's risk management activities in its financial statements. In addition to changes in designation and measurement for qualifying hedge relationships, the guidance requires an entity to report the earnings effect of the hedging instrument in the same income statement line item in which the earnings effect of the hedged item is reported. As a result, hedge ineffectiveness will no longer be separately measured or reported. This guidance will be effective for our annual reporting period beginning after December 15, 2018, including interim periods therein. Early adoption is permitted in any interim period after issuance of this guidance. All transition
F-15
ROYAL CARIBBEAN CRUISES LTD.
NOTES TO THE CONSOLIDATED FINANCIAL STATEMENTS (Continued)
requirements and elections should be applied to hedging relationships existing on the date of adoption. The effect of the adoption should be reflected as of the beginning of the fiscal year of adoption. We plan to early adopt this guidance in the first quarter of 2018. The adoption for this newly issued guidance is not expected to have a material impact on our consolidated financial statements.
Reclassifications
For the year ended December 31, 2016, restructuring charges of
$8.5 million
have been reclassified from
Restructuring charges
into
Marketing, selling and administrative expenses
in the consolidated statements of comprehensive income (loss) in order to conform to the current year presentation.
Note 3.
Goodwill
The carrying amount of goodwill attributable to our Royal Caribbean International and Celebrity Cruises reporting units and the changes in such balances during the years ended
December 31, 2017
and
December 31, 2016
were as follows (in thousands):
|
Royal
Caribbean International |
Celebrity Cruises
|
Total
|
|||||||
|
Balance at December 31, 2015
|
$
|
286,764
|
|
$
|
—
|
|
$
|
286,764
|
|
|
Goodwill attributable to purchase of Ocean Adventures
(1)
|
—
|
|
1,600
|
|
1,600
|
|
|||
|
Foreign currency translation adjustment
|
(10
|
)
|
32
|
|
22
|
|
|||
|
Balance at December 31, 2016
|
286,754
|
|
1,632
|
|
288,386
|
|
|||
|
Foreign currency translation adjustment
|
126
|
|
—
|
|
126
|
|
|||
|
Balance at December 31, 2017
|
$
|
286,880
|
|
$
|
1,632
|
|
$
|
288,512
|
|
___________________________________________________________________
|
(1)
|
In 2016, we purchased Ocean Adventures. The acquisition was accounted for as a business purchase combination using the purchase method of accounting which requires the use of fair value measurements. The business combination, including purchase transaction and assets acquired, was immaterial to our consolidated financial statements.
|
During the fourth quarter of
2017
, we performed a qualitative assessment of whether it was more-likely-than-not that our Royal Caribbean International reporting unit's fair value was less than its carrying amount before applying the two-step goodwill impairment test. The qualitative analysis included assessing the impact of certain factors such as general economic conditions, limitations on accessing capital, changes in forecasted operating results, changes in fuel prices and fluctuations in foreign exchange rates. Based on our qualitative assessment, we concluded that it was more-likely-than-not that the estimated fair value of the Royal Caribbean International reporting unit exceeded its carrying value and thus, we did not proceed to the two-step goodwill impairment test. No indicators of impairment exist primarily because the reporting unit's fair value has consistently exceeded its carrying value by a significant margin and forecasts of operating results generated by the reporting unit appear sufficient to support its carrying value. As a result of our assessment, we did not record an impairment of goodwill for the year ended
December 31, 2017
.
For the year ended December 31, 2016, we did not record an impairment of goodwill for our reporting units.
During the fourth quarter of 2015, we performed our annual impairment review of goodwill for the Royal Caribbean International reporting unit. We elected to bypass the qualitative assessment and proceeded directly to step one of the two-step goodwill impairment test to corroborate the results of prior years' qualitative assessments. As a result of the test, we determined the fair value of the Royal Caribbean International reporting unit exceeded its carrying value by approximately
90%
resulting in no impairment to the Royal Caribbean International goodwill for the year ended December 31, 2015.
F-16
ROYAL CARIBBEAN CRUISES LTD.
NOTES TO THE CONSOLIDATED FINANCIAL STATEMENTS (Continued)
In 2015, for our Pullmantur reporting unit, we reviewed the two-step goodwill impairment test based on our cash flow projections. As a result of this analysis, we determined that the carrying value of the Pullmantur reporting unit exceeded its fair value. Accordingly, upon the completion of the two-step impairment test, we recognized a goodwill impairment charge of
$123.8 million
. The charge reflected the full carrying amount of the goodwill leaving Pullmantur with no goodwill on its books. This impairment charge was recognized in earnings during the third quarter of 2015 and is reported within
Impairment of Pullmantur related assets
within our consolidated statements of comprehensive income (loss).
Note 4.
Intangible Assets
Intangible assets are reported in
Other assets
in our consolidated balance sheets. The carrying amount of indefinite-life intangible assets was not material for the years ended
December 31, 2017
and
December 31, 2016
.
During the third quarter of 2015, we performed an interim impairment evaluation of Pullmantur's trademarks and trade names using a discounted cash flow model and the relief-from-royalty method to compare the fair value of these indefinite-lived intangible assets to its carrying value. We used a discount rate comparable to the rate used in valuing the Pullmantur reporting unit in our goodwill impairment test. Based on our cash flow projections, we determined that the fair value of Pullmantur’s trademarks and trade names no longer exceeded their carrying value. Accordingly, we recognized an impairment charge of approximately
$174.3 million
to write down trademarks and trade names to their fair value. The charge reflected the full carrying amount of the trademark and trade names leaving Pullmantur with no intangible assets on its books. This impairment charge was recognized in earnings during the third quarter of 2015 and is reported within
Impairment of Pullmantur related assets
within our consolidated statements of comprehensive income (loss).
Finite-life intangible assets had a gross carrying amount and accumulated amortization amount of
$11.6 million
and
$3.7 million
, respectively, as of
December 31, 2017
, consisting of operating licenses to operate in the Galapagos Islands. As of December 31,
2017
, the remaining weighted average remaining life of these licenses were approximately
26.6
years. Amortization expense for finite-life intangible assets was immaterial to our consolidated financial statements.
Note 5.
Property and Equipment
Property and equipment consists of the following (in thousands):
|
2017
|
2016
|
||||||
|
Ships
|
$
|
23,714,745
|
|
$
|
23,978,822
|
|
|
|
Ship improvements
|
2,410,525
|
|
2,359,639
|
|
|||
|
Ships under construction
|
642,235
|
|
354,425
|
|
|||
|
Land, buildings and improvements, including leasehold improvements and port facilities
|
250,079
|
|
341,605
|
|
|||
|
Computer hardware and software, transportation equipment and other
|
762,512
|
|
1,108,301
|
|
|||
|
Total property and equipment
|
27,780,096
|
|
28,142,792
|
|
|||
|
Less—accumulated depreciation and amortization
|
(8,044,916
|
)
|
(7,981,365
|
)
|
|||
|
$
|
19,735,180
|
|
$
|
20,161,427
|
|
||
Ships under construction include progress payments for the construction of new ships as well as planning, design, interest and other associated costs. We capitalized interest costs of
$24.2 million
,
$25.3 million
and
$26.5 million
for the years
2017
,
2016
and
2015
, respectively.
During 2017, we sold our
three
aircraft and
6%
of our ownership stake in Wamos Air, S.A. (formerly known as Pullmantur Air, S.A.) to Wamos Air, S.A. In connection with the sale transaction, we extended
two
loans to Wamos Air, S.A. totaling
€17.3 million
, or approximately
$20.8 million
based on the exchange rate at
December 31, 2017
. The loans accrue interest at rates ranging from
4.78%
to
5.35%
per annum, amortize through maturity of October 2019 and July 2021, respectively, and are secured by first priority security interests over the aircraft engines and shares sold
F-17
ROYAL CARIBBEAN CRUISES LTD.
NOTES TO THE CONSOLIDATED FINANCIAL STATEMENTS (Continued)
in connection with the transaction. The sale resulted in an immaterial gain that was recognized in earnings during the fourth quarter of 2017. Post-sale, we retain a
13%
interest in Wamos Air, S.A.
During 2017, we entered into agreements with Meyer Turku to build two Icon-class ships for our Royal Caribbean International brand and we entered into an agreement to purchase a ship for our Azamara Club Cruises brand. Refer to Note 15.
Commitments and Contingencies
for further information.
In March 2017, we sold
Legend of the Seas
to an affiliate of TUI AG, our joint venture partner in TUI Cruises. The sale resulted in a gain of
$30.9 million
and is reported within
Other operating
within
Cruise operating expenses
in our consolidated statements of comprehensive income (loss) for the year ended December 31, 2017.
During 2016, we sold our
51%
interest in Pullmantur Holdings. For further information on the sale transaction, refer to Note 1.
General
. Due to this sale and the resulting change in the nature of the cash flows generated by the vessels that are owned by us and operated by Pullmantur Holdings, we reviewed these vessels for impairment and determined that the undiscounted future cash flows of the vessels exceeded their carrying value; therefore, no impairment was required at the time of the sale.
In April 2016, we sold
Splendour of the Seas
to TUI Cruises. Concurrent with the acquisition, TUI Cruises leased the ship to an affiliate of TUI AG, our joint venture partner in TUI Cruises, which now operates the ship. The gain recognized did not have a material effect to our consolidated financial statements.
During 2015, in conjunction with performing the two-step goodwill impairment test for the Pullmantur reporting unit, we identified that the estimated fair value of certain long-lived assets, consisting of
two
ships and
three
aircraft were less than their carrying values. As a result of this determination, we evaluated these assets pursuant to our long-lived asset impairment test, resulting in an impairment charge of
$113.2 million
to write down these assets to their estimated fair values. This impairment charge was recognized in earnings during the third quarter of 2015 and is reported within
Impairment of Pullmantur related assets
within our consolidated statements of comprehensive income (loss).
During 2015, Pullmantur sold
Ocean Dream
to an unrelated third-party for
$34.6 million
. The purchase price was paid via a secured promissory note, payable over a
nine
-year period. The buyer's obligations under this loan accrue interest at the rate of
6.0%
per annum and are secured by a first priority mortgage on the ship. The sale resulted in an immaterial gain that was deferred and is expected to be recognized at the end of the
nine
-year term.
Note 6.
Other Assets
A Variable Interest Entity ("VIE") is an entity in which the equity investors have not provided enough equity to finance the entity's activities or the equity investors (1) cannot directly or indirectly make decisions about the entity's activities through their voting rights or similar rights; (2) do not have the obligation to absorb the expected losses of the entity; (3) do not have the right to receive the expected residual returns of the entity; or (4) have voting rights that are not proportionate to their economic interests and the entity's activities involve or are conducted on behalf of an investor with a disproportionately small voting interest.
We have determined that TUI Cruises GmbH, our
50%
-owned joint venture, which operates the brand TUI Cruises, is a VIE. As of
December 31, 2017
, the net book value of our investment in TUI Cruises was approximately
$624.5 million
, primarily consisting of
$422.8 million
in equity and a loan of
€166.5 million
, or approximately
$199.8 million
based on the exchange rate at
December 31, 2017
. As of December 31, 2016, the net book value of our investment in TUI Cruises was approximately
$517.0 million
, primarily consisting of
$323.5 million
in equity and a loan of
€182.3 million
, or approximately
$192.4 million
based on the exchange rate at December 31, 2016. The loan, which was made in connection with the sale of
Splendour of the Seas
in April 2016, accrues interest at a rate of
6.25%
per annum and is payable over
10 years
. This loan is
50%
guaranteed by TUI AG, our joint venture partner in TUI Cruises, and is secured by a first priority mortgage on the ship. Refer to Note 5.
Property and Equipment
for further information. The majority of these amounts were included within
Other assets
in our consolidated balance sheets.
F-18
ROYAL CARIBBEAN CRUISES LTD.
NOTES TO THE CONSOLIDATED FINANCIAL STATEMENTS (Continued)
In addition, we and TUI AG have each guaranteed the repayment by TUI Cruises of
50%
of a bank loan. As of
December 31, 2017
, the outstanding principal amount of the loan was
€95.1 million
, or approximately
$114.2 million
based on the exchange rate at
December 31, 2017
. While this loan matures in May 2022, the lenders have agreed to release each shareholder's guarantee if certain conditions are met by April 2018. The loan amortizes quarterly and is secured by first mortgages on the
Mein Schiff 1
and M
ein Schiff 2
vessels. Based on current facts and circumstances, we do not believe potential obligations under our guarantee of this bank loan are probable.
Our investment amount, outstanding term loan and the potential obligations under the bank loan guarantee are substantially our maximum exposure to loss in connection with our investment in TUI Cruises. We have determined that we are not the primary beneficiary of TUI Cruises. We believe that the power to direct the activities that most significantly impact TUI Cruises’ economic performance are shared between ourselves and TUI AG. All the significant operating and financial decisions of TUI Cruises require the consent of both parties, which we believe creates shared power over TUI Cruises. Accordingly, we do not consolidate this entity and account for this investment under the equity method of accounting.
TUI Cruises has
two
newbuild ships on order scheduled to be delivered in each of 2018 and 2019. TUI Cruises has in place agreements for the secured financing of each of the ships on order for up to
80%
of the contract price. The remaining portion of the contract price of the ships is expected to be funded through an existing
€150.0 million
, or approximately
$180.1 million
based on the exchange rate at
December 31, 2017
, bank facility and TUI Cruises’ cash flows from operations. The various ship construction and financing agreements include certain restrictions on each of our and TUI AG’s ability to reduce our current ownership interest in TUI Cruises below
37.55%
through 2021.
We have determined that Pullmantur Holdings, in which we have a
49%
noncontrolling interest, is a VIE for which we are not the primary beneficiary, as we do not have the power to direct the activities that most significantly impact the entity's economic performance. Accordingly, following the sale of our
51%
interest in Pullmantur Holdings to Springwater Capital LLC ("Springwater") in 2016, we do not consolidate this entity and we account for this investment under the equity method of accounting. As of
December 31, 2017
, our maximum exposure to loss in Pullmantur Holdings was approximately
$53.7 million
consisting of loans and other receivables. As of
December 31, 2016
, our maximum exposure to loss in Pullmantur Holdings was approximately
$43.7 million
consisting of loans and other receivables. These amounts were included within
Trade and other receivables, net
and
Other assets
in our consolidated balance sheets.
In conjunction with the sale of our
51%
interest in Pullmantur Holdings, we agreed to provide a non-revolving working capital facility to a Pullmantur Holdings subsidiary in the amount of up to
€15.0 million
or approximately
$18.0 million
based on the exchange rate at
December 31, 2017
. Proceeds of the facility, which may be drawn through July 2018, will bear interest at the rate of
6.5%
per annum and are payable through 2022. Springwater has guaranteed repayment of
51%
of the outstanding amounts under the facility. As of
December 31, 2017
,
no
amounts had been drawn on this facility. See Note 1.
General
for further discussion on the sales transaction.
We have determined that Grand Bahama Shipyard Ltd. ("Grand Bahama"), a ship repair and maintenance facility in which we have a
40%
noncontrolling interest, is a VIE. This facility serves cruise and cargo ships, oil and gas tankers and offshore units. We utilize this facility, among other ship repair facilities, for our regularly scheduled drydocks and certain emergency repairs as may be required. During the year ended
December 31, 2017
and
2016
, we made payments of
$16.0 million
and
$39.8 million
, respectively, to Grand Bahama for ship repair and maintenance services. We have determined that we are not the primary beneficiary of this facility, as we do not have the power to direct the activities that most significantly impact the facility's economic performance. Accordingly, we do not consolidate this entity and we account for this investment under the equity method of accounting. As of
December 31, 2017
, the net book value of our investment in Grand Bahama was approximately
$49.4 million
, consisting of
$32.4 million
in equity and a loan of
$17.0 million
. As of
December 31, 2016
, the net book value of our investment in Grand Bahama was approximately
$47.0 million
, consisting of
$23.2 million
in equity and a loan of
$23.8 million
. These amounts represent our maximum exposure to loss related to our investment in Grand Bahama. During the first quarter of 2016, our debt agreement with Grand Bahama was amended to extend the maturity by
10 years
and increase the applicable interest rate to the lower
F-19
ROYAL CARIBBEAN CRUISES LTD.
NOTES TO THE CONSOLIDATED FINANCIAL STATEMENTS (Continued)
of (i) LIBOR plus
3.50%
and (ii)
5.50%
. Interest payable on the loan is due on a semi-annual basis. We have experienced strong payment performance on the loan since its amendment, and as a result completed an evaluation and review of the loan resulting in a reclassification of the loan to accrual status as of October 2017. During the year ended
December 31, 2017
, we received principal and interest payments of approximately
$15.7 million
. During the year ended
December 31, 2016
, we received payments of approximately
$14.8 million
. The loan balance is included within
Other assets
in our consolidated balance sheets. The loan is currently accruing interest under the effective yield method, which includes the recognition of previously unrecognized interest that accumulated while the loan was in non-accrual status.
We monitor credit risk associated with the loan through our participation on Grand Bahama's board of directors along with our review of Grand Bahama's financial statements and projected cash flows. Based on this review, we
believe the risk of loss associated with the outstanding loan is not probable as of
December 31, 2017
.
We have determined that Skysea Holding International Ltd. ("Skysea Holding"), in which we have a
36%
noncontrolling interest, is a VIE. During the second quarter of 2017, we made an equity contribution of
$7.1 million
which increased our equity interest from
35%
to
36%
. The contribution was made pursuant to a funding arrangement in which the entity's three largest investors agreed to contribute a total of
$30.0 million
in proportion to their equity interest in a series of installments. We have determined that we are not the primary beneficiary of Skysea Holding as we do not have the power to direct the activities that most significantly impact the entity's economic performance. Accordingly, we do not consolidate this entity and we account for this investment under the equity method of accounting. In December 2014, we and Ctrip.com International Ltd, which also owns
36%
of Skysea Holding, each provided a debt facility to a wholly owned subsidiary of Skysea Holding in the amount of
$80.0 million
, with an applicable interest rate of
6.5%
per annum, which mature in January 2030. Due to recent payment performance, the loans were classified to non-accrual status in 2017. The facilities, which are pari passu to each other, are each
100%
guaranteed by Skysea Holding and are secured by first priority mortgages on the ship
Golden Era.
As of
December 31, 2017
, the net book value of our investment in Skysea Holding and its subsidiaries was approximately
$96.0 million
, consisting of
$4.4 million
in equity and loans and other receivables of
$91.6 million
. As of
December 31, 2016
, the net book value of our investment in Skysea Holding and its subsidiaries was approximately
$98.0 million
, consisting of
$9.2 million
in equity and loans and other receivables of
$88.8 million
. The majority of these amounts were included within
Other assets
in our consolidated balance sheets and represent our maximum exposure to loss related to our investment in Skysea Holding.
We monitor credit risk associated with the loan through our participation on Skysea Holding's board of directors along with our review of Skysea Holding's financial statements and projected cash flows. Based on this review, we
believe the risk of loss associated with the outstanding loan is not probable as of
December 31, 2017
.
The following tables set forth information regarding our investments accounted for under the equity method of accounting, including the entities discussed above, (in thousands):
|
For the period ended December 31,
|
||||||||||||
|
2017
|
2016
|
2015
|
||||||||||
|
Share of equity income from investments
|
$
|
156,247
|
|
$
|
128,350
|
|
$
|
81,026
|
|
|||
|
Dividends received
|
$
|
109,677
|
|
$
|
75,942
|
|
$
|
33,338
|
|
|||
|
As of December 31,
|
||||||||
|
2017
|
2016
|
|||||||
|
Total notes receivable due from equity investments
|
$
|
314,323
|
|
$
|
323,636
|
|
||
|
Less-current portion
(1)
|
38,658
|
|
40,742
|
|
||||
|
Long-term portion
(2)
|
$
|
275,665
|
|
$
|
282,894
|
|
||
___________________________________________________________________
F-20
ROYAL CARIBBEAN CRUISES LTD.
NOTES TO THE CONSOLIDATED FINANCIAL STATEMENTS (Continued)
(1) Included within
Trade and other receivables, net
in our consolidated balance sheets.
(2)
Included within
Other assets
in our consolidated balance sheets.
We also provide ship management services to TUI Cruises GmbH, Pullmantur Holdings and Skysea Holding. Additionally, we bareboat charter to Pullmantur Holdings the vessels currently operated by its brands, which were retained by us following the sale of our
51%
interest in Pullmantur Holdings. We recorded the following as it relates to these services in our operating results within our consolidated statements of comprehensive income (loss) (in thousands):
|
For the period ended December 31,
|
||||||||||||
|
2017
|
2016
|
2015
|
||||||||||
|
Revenues
|
$
|
53,532
|
|
$
|
30,517
|
|
$
|
20,217
|
|
|||
|
Expenses
|
$
|
15,176
|
|
$
|
12,795
|
|
$
|
15,669
|
|
|||
Summarized financial information for our affiliates accounted for under the equity method of accounting was as follows (in thousands):
|
As of December 31,
|
||||||||
|
2017
|
2016
|
|||||||
|
Current assets
|
$
|
532,330
|
|
$
|
492,707
|
|
||
|
Non-current assets
|
3,673,613
|
|
2,942,580
|
|
||||
|
Total assets
|
$
|
4,205,943
|
|
$
|
3,435,287
|
|
||
|
Current liabilities
|
$
|
1,152,193
|
|
$
|
887,175
|
|
||
|
Non- current liabilities
|
1,974,166
|
|
1,704,495
|
|
||||
|
Total liabilities
|
$
|
3,126,359
|
|
$
|
2,591,670
|
|
||
|
Equity attributable to:
|
||||||||
|
Noncontrolling interest
|
$
|
1,753
|
|
$
|
1,544
|
|
||
|
For the period ended December 31,
|
||||||||||||
|
2017
|
2016
|
2015
|
||||||||||
|
Total revenues
|
$
|
1,994,014
|
|
$
|
1,340,662
|
|
$
|
990,172
|
|
|||
|
Total expenses
|
(1,684,276
|
)
|
(1,078,470
|
)
|
(830,898
|
)
|
||||||
|
Net income
|
$
|
309,738
|
|
$
|
262,192
|
|
$
|
159,274
|
|
|||
F-21
ROYAL CARIBBEAN CRUISES LTD.
NOTES TO THE CONSOLIDATED FINANCIAL STATEMENTS (Continued)
Note 7.
Long-Term Debt
Long-term debt consists of the following (in thousands):
|
2017
|
2016
|
||||||
|
$1.4 billion unsecured revolving credit facility, LIBOR plus 1.175%, currently 2.64% and a facility fee of 0.20%, due 2020
|
$
|
300,000
|
|
$
|
925,000
|
|
|
|
$1.2 billion unsecured revolving credit facility, LIBOR plus 1.175%, currently 2.58% and a facility fee of 0.20%, due 2022
|
280,000
|
|
805,000
|
|
|||
|
Unsecured senior notes and senior debentures, 2.65% to 7.50%, due 2018, 2020, 2022, 2027 and 2028
|
1,866,359
|
|
1,073,261
|
|
|||
|
$200 million unsecured term loan, LIBOR plus 1.30%
|
—
|
|
200,000
|
|
|||
|
$841.8 million unsecured term loan, LIBOR plus 1.00%, currently 2.52% due through 2028
|
736,604
|
|
806,756
|
|
|||
|
$226.1 million unsecured term loan, 2.53%, due through 2028
|
197,837
|
|
216,677
|
|
|||
|
€700.7 million unsecured term loan, EURIBOR plus 1.15% currently 1.15%, due through 2028
|
736,020
|
|
708,417
|
|
|||
|
$742.1 million unsecured term loan, LIBOR plus 1.30%, currently 2.81%, due through 2027
|
587,497
|
|
649,338
|
|
|||
|
$273.2 million unsecured term loan, LIBOR plus 1.75%
|
—
|
|
273,166
|
|
|||
|
$519 million unsecured term loan, LIBOR plus 0.45%, currently 2.00%, due through 2020
|
129,786
|
|
173,049
|
|
|||
|
$420 million unsecured term loan, 5.41%, due through 2021
|
135,514
|
|
171,444
|
|
|||
|
$420 million unsecured term loan, LIBOR plus 1.65%, currently 3.21%, due through 2021
|
140,000
|
|
175,000
|
|
|||
|
€159.4 million unsecured term loan, EURIBOR plus 1.58%, currently 1.58%, due through 2021
|
63,798
|
|
70,082
|
|
|||
|
$524.5 million unsecured term loan, LIBOR plus 0.50%, currently 1.96%, due through 2021
|
174,833
|
|
218,542
|
|
|||
|
$566.1 million unsecured term loan, LIBOR plus 0.37%, currently 1.90%, due through 2022
|
212,276
|
|
259,448
|
|
|||
|
$1.1 billion unsecured term loan, LIBOR plus 1.65%, currently 3.21%, due through 2022
|
345,877
|
|
460,652
|
|
|||
|
$632.0 million unsecured term loan, LIBOR plus 0.40%, currently 1.86%, due through 2023
|
315,979
|
|
368,643
|
|
|||
|
$673.5 million unsecured term loan, LIBOR plus 0.40%, currently 1.92%, due through 2024
|
392,860
|
|
448,983
|
|
|||
|
$65.0 million unsecured term loan, LIBOR plus 1.45%, currently 3.02%, due through 2019
|
65,227
|
|
67,027
|
|
|||
|
$380.0 million unsecured term loan, LIBOR plus 1.45%, currently 3.02%, due 2018
|
380,000
|
|
380,000
|
|
|||
|
$791.1 million unsecured term loan, LIBOR plus 1.30%, currently 2.85%, due through 2026
|
593,331
|
|
659,256
|
|
|||
|
$290.0 million unsecured term loan, LIBOR plus 1.75%
|
—
|
|
290,000
|
|
|||
|
€365 million unsecured term loan, EURIBOR plus 1.75%
|
—
|
|
123,963
|
|
|||
|
$7.3 million unsecured term loan, LIBOR plus 2.5%
|
—
|
|
3,964
|
|
|||
|
$30.3 million unsecured term loan, LIBOR plus 3.75%, currently 5.29%, due through 2021
|
5,400
|
|
6,597
|
|
|||
|
€80.0 million unsecured term loan, EURIBOR plus 1.32% currently 1.32%, due through 2024
|
14,267
|
|
—
|
|
|||
|
Capital lease obligations
|
33,139
|
|
40,385
|
|
|||
|
Total debt
|
7,706,604
|
|
9,574,650
|
|
|||
|
Less: unamortized debt issuance costs
|
(167,153
|
)
|
(187,214
|
)
|
|||
|
Total debt, net of unamortized debt issuance costs
|
7,539,451
|
|
9,387,436
|
|
|||
|
Less: current portion
|
(1,188,514
|
)
|
(1,285,735
|
)
|
|||
|
Long-term portion
|
$
|
6,350,937
|
|
$
|
8,101,701
|
|
|
In October 2017, we amended and restated our
$1.2 billion
unsecured revolving credit facility due August 2018. The amendment reduced the applicable margin and extended the termination date to October 2022. The applicable margin and facility fee vary with our debt rating and are currently
1.175%
and
0.20%
, respectively. In December 2017, we also amended and restated our
$1.4 billion
unsecured revolving credit facility due June 2020 to reduce pricing in line with the amended pricing of the
$1.2 billion
unsecured revolving credit facility. These amendments did not result
F-22
ROYAL CARIBBEAN CRUISES LTD.
NOTES TO THE CONSOLIDATED FINANCIAL STATEMENTS (Continued)
in the extinguishment of debt. Accordingly, as of December 31, 2017, we have an aggregate revolving borrowing capacity of
$2.6 billion
.
In November 2017, we issued
$300 million
of
2.65%
and
$500 million
of
3.70%
unsecured senior notes due 2020 and 2028, respectively, at
99.977%
and
99.623%
of par, respectively. Amounts from the issuance of these notes were used for general corporate purposes, such as repayment and refinancing of debt.
In November 2017, we entered into a credit agreement which provides an unsecured term loan facility in an amount up to
€80.0 million
, or approximately
$96.0 million
based on the exchange rate at
December 31, 2017
, for the purchase of a ship we have on order designed for the Galapagos Islands. We may draw up to
five
times under the facility through the earlier of the delivery of the ship and June 30, 2019. As of December 31, 2017, we have drawn
€11.9 million
, or approximately
$14.3 million
based on the exchange rate at
December 31, 2017
, on this facility. The loan is due and payable at maturity in November 2024. Interest on the loan accrues at a floating rate based on EURIBOR plus the applicable margin. The applicable margin varies with our debt rating and was
1.32%
as of December 31, 2017. In addition, we are subject to a commitment fee of
0.20%
per annum on the undrawn amount.
Except as described above, all of our unsecured ship financing term loans are guaranteed by the export credit agency in the respective country in which the ship is constructed. In consideration for these guarantees, depending on the financing arrangement, we pay to the applicable export credit agency (1) a fee of
1.01%
per annum based on the outstanding loan balance semi-annually over the term of the loan (subject to adjustment based upon our credit ratings) or (2) an upfront fee of
2.35%
to
2.37%
of the maximum loan amount. We amortize the fees that are paid upfront over the life of the loan and those that are paid semi-annually over each respective payment period. We classify these fees within
Amortization of debt issuance costs
in our consolidated statements of cash flows and within
Other assets
in our consolidated balance sheets.
Under certain of our agreements, the contractual interest rate, facility fee and/or export credit agency fee vary with our debt rating.
The unsecured senior notes and senior debentures are not redeemable prior to maturity, except that certain series may be redeemed upon the payment of a make-whole premium.
Following is a schedule of annual maturities on long-term debt including capital leases as of
December 31, 2017
for each of the next five years (in thousands):
|
Year
|
|||
|
2018
|
$
|
1,188,514
|
|
|
2019
|
762,614
|
|
|
|
2020
|
1,292,478
|
|
|
|
2021
|
640,734
|
|
|
|
2022
|
1,380,583
|
|
|
|
Thereafter
|
2,274,528
|
|
|
|
$
|
7,539,451
|
|
|
Note 8.
Shareholders' Equity
During the fourth and third quarters of
2017
, we declared a cash dividend on our common stock of
$0.60
per share which was paid in the first quarter of
2018
and fourth quarter of
2017
, respectively. During the first and second quarters of
2017
, we declared a cash dividend on our common stock of
$0.48
per share which was paid in the second and third quarters of 2017, respectively.
During the fourth and third quarters of
2016
, we declared a cash dividend on our common stock of
$0.48
per share which was paid in the first quarter of
2017
and fourth quarter of
2016
, respectively. We also declared and paid a cash dividend on our common stock of
$0.375
per share during each of the first and second quarters of
2016
. During
F-23
ROYAL CARIBBEAN CRUISES LTD.
NOTES TO THE CONSOLIDATED FINANCIAL STATEMENTS (Continued)
the first quarter of 2016, we also paid a cash dividend on our common stock of
$0.375
per share which was declared during the fourth quarter of 2015.
In April 2017, our board of directors authorized a 12-month common stock repurchase program for up to
$500 million
. The timing and number of shares to be repurchased will depend on a variety of factors including price and market conditions. Repurchases under the program may be made at management's discretion from time to time on the open market or through privately negotiated transactions. During the year ended December 31,
2017
, we repurchased
1.8 million
shares of our common stock for a total of
$225.0 million
in open market transactions that were recorded within
Treasury stock
in our consolidated balance sheets. As of December 31, 2017, we have
$275.0 million
that remain available for future stock repurchase transactions under our Board approved program.
During February 2018, we repurchased an additional
1.5 million
shares for a total of
$186.4 million
in open market transactions.
During the fourth quarter of 2015, our board of directors authorized a common stock repurchase program for up to
$500 million
that was completed in August 2016. During 2016, we purchased
4.1 million
shares for a total of
$300.0 million
in open market transactions. These transactions were recorded within
Treasury stock
in our consolidated balance sheet. Our repurchases under this program, including the
2.1 million
shares repurchased for
$200.0 million
during the fourth quarter of 2015, totaled
$500.0 million
.
Note 9.
Stock-Based Employee Compensation
We currently have awards outstanding under
two
stock-based compensation plans, which provide for awards to our officers, directors and key employees. The plans consist of a 2000 Stock Award Plan and a 2008 Equity Plan. Our ability to issue new awards under the 2000 Stock Award Plan terminated in accordance with the terms of the plan in September 2009. The 2008 Equity Plan, as amended, provides for the issuance of up to
14,000,000
shares of our common stock pursuant to grants of (i) incentive and non-qualified stock options, (ii) stock appreciation rights, (iii) stock awards (including time-based and/or performance-based stock awards) and (iv) restricted stock units (including time-based and performance-based restricted stock units). During any calendar year, no one individual (other than non-employee members of our Board of Directors) may be granted awards of more than
500,000
shares and no non-employee member of our Board of Directors may be granted awards with a value in excess of
$500,000
at the grant date. Options and restricted stock units outstanding as of
December 31, 2017
generally vest in equal installments over
four
years from the date of grant. In addition, performance shares and performance share units generally vest in
three
years. With certain limited exceptions, awards are forfeited if the recipient ceases to be an employee before the shares vest. Options are granted at a price not less than the fair value of the shares on the date of grant and expire not later than
ten
years after the date of grant.
Prior to 2012, our officers received a combination of stock options and restricted stock units. Beginning in 2012, our officers instead receive their long-term incentive awards through a combination of performance share units and restricted stock units. Each performance share unit award is expressed as a target number of performance share units based upon the fair market value of our common stock on the date the award is issued. The actual number of shares underlying each award (not to exceed
200%
of the target number of performance share units) will be determined based upon the Company's achievement of a specified performance target range. In
2017
, we issued a target number of
140,542
performance share units, which will vest approximately
three
years following the award issue date. The performance payout of these grants will be based on return on our invested capital ("ROIC") and earnings per share (“EPS”) for the year ended December 31, 2019, as may be adjusted by the Talent and Compensation Committee of our Board of Directors in early 2020 for events that are outside of management's control. In 2014, we also issued a one-time performance-based equity award to our Chairman & Chief Executive Officer in a target amount of
63,771
performance share units. In February 2016, the Compensation Committee set the payout level for this grant at
165%
of target based on our 2015 ROIC performance. As of December 2017, the award is no longer subject to restrictions on transfer.
Beginning in 2016, our senior officers meeting certain minimum age and service criteria receive their long-term incentive awards through a combination of restricted stock awards and restricted stock units. The restricted stock awards are subject to both performance and time-based vesting criteria while the restricted stock units are subject only to time-
F-24
ROYAL CARIBBEAN CRUISES LTD.
NOTES TO THE CONSOLIDATED FINANCIAL STATEMENTS (Continued)
based vesting criteria. Each restricted stock award is issued in an amount equal to
200%
of the target number of shares underlying the award based upon the fair market value of our common stock on the date the award is issued. Dividends accrue (but do not get paid) on the restricted stock awards during the vesting period, with the accrued amounts to be paid out following vesting only on the number of shares underlying the award which actually vest based on satisfaction of the performance criteria. The actual number of shares that vest (not to exceed
200%
of the shares) will be determined based upon the Company's achievement of a specified performance target range. In
2017
, we issued
137,948
restricted stock awards, representing
200%
of the target number of shares underlying the award, all of which are considered issued and outstanding from the date of issuance, however; grantees will only retain those shares earned as the result of the Company achieving the performance goals during the measurement period. The performance payout of the 2017 awards will be based on ROIC and EPS for the year ended December 31, 2019, as may be adjusted by the Talent and Compensation Committee of our Board of Directors in early 2020 for events that are outside of management's control.
We also provide an Employee Stock Purchase Plan ("ESPP") to facilitate the purchase by employees of up to
1,300,000
shares of common stock in the aggregate. Offerings to employees are made on a quarterly basis. Subject to certain limitations, the purchase price for each share of common stock is equal to
85%
of the average of the market prices of the common stock as reported on the New York Stock Exchange on the first business day of the purchase period and the last business day of each month of the purchase period. During
2017
,
2016
and
2015
,
51,989
,
42,347
and
28,724
shares of our common stock were purchased under the ESPP at a weighted-average price of
$93.15
,
$65.48
and
$72.52
, respectively.
Total compensation expense recognized for employee stock-based compensation for the years ended
December 31, 2017
,
2016
and
2015
was as follows:
|
Employee Stock-Based Compensation
|
|||||||||||
|
Classification of expense
|
2017
|
2016
|
2015
|
||||||||
|
(In thousands)
|
|||||||||||
|
Marketing, selling and administrative expenses
|
$
|
69,459
|
|
$
|
32,659
|
|
$
|
36,073
|
|
||
|
Total compensation expense
|
$
|
69,459
|
|
$
|
32,659
|
|
$
|
36,073
|
|
||
The fair value of each stock option grant is estimated on the date of grant using the Black-Scholes option pricing model. The estimated fair value of stock options, less estimated forfeitures, is amortized over the vesting period using the graded-vesting method. We did not issue any stock options during the years ended
December 31, 2017
,
2016
and
2015
.
Stock option activity and information about stock options outstanding are summarized in the following table:
|
Stock Option Activity
|
Number of
Options |
Weighted-
Average Exercise Price |
Weighted-
Average Remaining Contractual Term |
Aggregate
Intrinsic Value (1) |
|||||||||
|
|
|
|
(years)
|
(in thousands)
|
|||||||||
|
Outstanding at January 1, 2017
|
346,310
|
|
$
|
32.82
|
|
2.39
|
|
$
|
17,221
|
|
|||
|
Granted
|
—
|
|
—
|
|
—
|
|
—
|
|
|||||
|
Exercised
|
(72,000
|
)
|
$
|
35.07
|
|
—
|
|
—
|
|
||||
|
Canceled
|
(1,586
|
)
|
$
|
46.18
|
|
—
|
|
—
|
|
||||
|
Outstanding at December 31, 2017
|
272,724
|
|
$
|
32.15
|
|
1.41
|
|
$
|
24,053
|
|
|||
|
Vested at December 31, 2017
|
272,724
|
|
$
|
32.15
|
|
1.41
|
|
$
|
24,053
|
|
|||
|
Options Exercisable at December 31, 2017
|
272,724
|
|
$
|
32.15
|
|
1.41
|
|
$
|
24,053
|
|
|||
___________________________________________________________________
|
(1)
|
The intrinsic value represents the amount by which the fair value of stock exceeds the option exercise price.
|
F-25
ROYAL CARIBBEAN CRUISES LTD.
NOTES TO THE CONSOLIDATED FINANCIAL STATEMENTS (Continued)
The total intrinsic value of stock options exercised during the years ended
December 31, 2017
,
2016
and
2015
was
$4.5 million
,
$2.3 million
and
$13.8 million
, respectively. As of December 31, 2017, there was no unrecognized compensation cost, net of estimated forfeitures, related to stock options granted under our stock incentive plan.
Restricted stock units are converted into shares of common stock upon vesting or, if applicable, are settled on a
one
-for-one basis. The cost of these awards is determined using the fair value of our common stock on the date of the grant, and compensation expense is recognized over the vesting period. Restricted stock activity is summarized in the following table:
|
Restricted Stock Units Activity
|
Number of
Awards |
Weighted-
Average Grant Date Fair Value |
||||
|
Non-vested share units at January 1, 2017
|
748,516
|
|
$
|
61.95
|
|
|
|
Granted
|
425,170
|
|
$
|
99.03
|
|
|
|
Vested
|
(376,992
|
)
|
$
|
59.62
|
|
|
|
Canceled
|
(58,795
|
)
|
$
|
71.47
|
|
|
|
Non-vested share units expected to vest as of December 31, 2017
|
737,899
|
|
$
|
83.78
|
|
|
The weighted-average estimated fair value of restricted stock units granted during the year ended
2016
and
2015
was
$64.51
and
$73.98
, respectively. The total fair value of shares released on the vesting of restricted stock units during the years ended
December 31, 2017
,
2016
and
2015
was
$38.7 million
,
$23.2 million
and
$27.6 million
, respectively. As of
December 31, 2017
, we had
$24.2 million
of total unrecognized compensation expense, net of estimated forfeitures, related to restricted stock unit grants, which will be recognized over the weighted-average period of
1.73 years
.
Performance share units are converted into shares of common stock upon vesting on a
one
-for-one basis. We estimate the fair value of each performance share when the grant is authorized and the related service period has commenced. We remeasure the fair value of our performance shares in each subsequent reporting period until the grant date has occurred, which is the date when the performance conditions are satisfied. We recognize compensation cost over the vesting period based on the probability of the service and performance conditions being achieved adjusted for each subsequent fair value measurement until the grant date. If the specified service and performance conditions are not met, compensation expense will not be recognized and any previously recognized compensation expense will be reversed. Performance share units activity is summarized in the following table:
|
Performance Share Units Activity
|
Number of
Awards |
Weighted-
Average Grant Date Fair Value |
||||
|
Non-vested share units at January 1, 2017
|
342,152
|
|
$
|
61.78
|
|
|
|
Granted
|
140,542
|
|
$
|
84.16
|
|
|
|
Vested
|
(105,615
|
)
|
$
|
45.62
|
|
|
|
Canceled
|
(23,929
|
)
|
$
|
71.37
|
|
|
|
Non-vested share units expected to vest as of December 31, 2017
|
353,150
|
|
$
|
74.87
|
|
|
The weighted-average estimated fair value of performance share units granted during the year ended
2016
and
2015
was
$65.83
and
$71.36
, respectively. The total fair value of shares released on the vesting of performance share units during the years ended
December 31, 2017
,
2016
and
2015
was
$10.0 million
,
$16.9 million
and
$18.3 million
, respectively. As of
December 31, 2017
, we had
$11.9 million
of total unrecognized compensation expense, net of estimated forfeitures, related to performance share unit grants, which will be recognized over the weighted-average period of
1.08 years
.
F-26
ROYAL CARIBBEAN CRUISES LTD.
NOTES TO THE CONSOLIDATED FINANCIAL STATEMENTS (Continued)
The shares underlying our restricted stock awards to age and service eligible senior officers are issued as of the grant date in an amount equal to
200%
of the target number of shares. Following the vesting date, the restrictions will lift with respect to the number of shares for which the performance criteria was met and any excess shares will be canceled. Dividends will accrue on the issued restricted shares during the vesting period, but will not be paid to the recipient until the awards vest and the final number of shares underlying the award is determined, at which point, the dividends will be paid in cash only on the earned shares. We estimate the fair value of each restricted stock award when the grant is authorized and the related service period has commenced. We remeasure the fair value of these restricted stock awards in each subsequent reporting period until the grant date has occurred, which is the date when the performance conditions are satisfied. We recognize compensation cost over the vesting period based on the probability of the service and performance conditions being achieved adjusted for each subsequent fair value measurement until the grant date. If the specified service and performance conditions are not met, compensation expense will not be recognized, any previously recognized compensation expense will be reversed, and any unearned shares will be returned to the Company. Restricted stock awards activity is summarized in the following table:
|
Restricted Stock Awards Activity
|
Number of
Awards |
Weighted-
Average Grant Date Fair Value |
||||
|
Non-vested share units at January 1, 2017
|
132,228
|
|
$
|
66.93
|
|
|
|
Granted
|
137,948
|
|
$
|
95.04
|
|
|
|
Vested
|
—
|
|
$
|
—
|
|
|
|
Canceled
|
—
|
|
$
|
—
|
|
|
|
Non-vested share units expected to vest as of December 31, 2017
|
270,176
|
|
$
|
81.28
|
|
|
The weighted-average estimated fair value of restricted stock awards granted during the year ended 2016 was
$66.93
. As of
December 31, 2017
, we had
$2.0 million
of total unrecognized compensation expense, net of estimated forfeitures, related to restricted stock award grants, which will be recognized over the weighted-average period of
1.62 years
.
Note 10.
Earnings Per Share
A reconciliation between basic and diluted earnings per share is as follows (in thousands, except per share data):
|
Year Ended December 31,
|
|||||||||||
|
2017
|
2016
|
2015
|
|||||||||
|
Net income for basic and diluted earnings per share
|
$
|
1,625,133
|
|
$
|
1,283,388
|
|
$
|
665,783
|
|
||
|
Weighted-average common shares outstanding
|
214,617
|
|
215,393
|
|
219,537
|
|
|||||
|
Dilutive effect of stock-based awards
|
1,077
|
|
923
|
|
1,152
|
|
|||||
|
Diluted weighted-average shares outstanding
|
215,694
|
|
216,316
|
|
220,689
|
|
|||||
|
Basic earnings per share:
|
|||||||||||
|
Net income
|
$
|
7.57
|
|
$
|
5.96
|
|
$
|
3.03
|
|
||
|
Diluted earnings per share:
|
|||||||||||
|
Net income
|
$
|
7.53
|
|
$
|
5.93
|
|
$
|
3.02
|
|
||
There were
no
antidilutive shares for the year ended December 31,
2017
,
2016
and
2015
.
Note 11.
Retirement Plan
We maintain a defined contribution plan covering shoreside employees. Effective January 1, 2016, we commenced annual, non-elective contributions to the plan on behalf of all eligible participants equal to
3%
of participants' eligible
F-27
ROYAL CARIBBEAN CRUISES LTD.
NOTES TO THE CONSOLIDATED FINANCIAL STATEMENTS (Continued)
earnings. Remaining annual contributions to the plan are discretionary and are based on fixed percentages of participants' salaries and years of service, not to exceed certain maximums. Contribution expenses were
$17.4 million
,
$16.7 million
and
$16.8 million
for the years ended
December 31, 2017
,
2016
and
2015
, respectively.
Note 12.
Income Taxes
We are subject to corporate income taxes in countries where we have operations or subsidiaries. We and the majority of our ship-operating and vessel-owning subsidiaries are currently exempt from U.S. corporate tax on U.S. source income from the international operation of ships pursuant to Section 883 of the Internal Revenue Code. Regulations under Section 883 have limited the activities that are considered the international operation of a ship or incidental thereto. Accordingly, our provision for U.S. federal and state income taxes includes taxes on certain activities not considered incidental to the international operation of our ships.
Additionally, some of our ship-operating subsidiaries are subject to income tax under the tonnage tax regimes of Malta or the United Kingdom. Under these regimes, income from qualifying activities is subject to corporate income tax, but the tax is computed by reference to the tonnage of the ship or ships registered under the relevant provisions of the tax regimes (the "relevant shipping profits"), which replaces the regular taxable income base. Income from activities not considered qualifying activities, which we do not consider significant, remains subject to Maltese or U.K. corporate income tax.
Income tax expense for items not qualifying under Section 883, tonnage taxes and income taxes for the remainder of our subsidiaries was approximately
$18.3 million
,
$20.1 million
and
$11.1 million
and was recorded within
Other expense
for the years ended December 31,
2017
,
2016
and
2015
, respectively. In addition, all interest expense and penalties related to income tax liabilities are classified as income tax expense within
Other expense
.
For a majority of our subsidiaries, we do not expect to incur income taxes on future distributions of undistributed earnings of foreign subsidiaries. Accordingly, no deferred income taxes have been provided for the distribution of these earnings. Where we do expect to incur income taxes on future distributions of undistributed earnings, we have provided for deferred taxes, which we do not consider significant to our operations.
As of
December 31, 2017
, the Company had Net Operating Losses (“NOLs”) in foreign jurisdictions of
$7.5 million
. If not utilized,
$5.0 million
of the NOLs are subject to expiration between 2018 and 2024. The Company has not recognized any benefits related to these NOLs, as all NOLs have full valuation allowances.
Net deferred tax assets and deferred tax liabilities and corresponding valuation allowances related to our operations were not material as of December 31,
2017
and
2016
.
We regularly review deferred tax assets for recoverability based on our history of earnings, expectations of future earnings, and tax planning strategies. Realization of deferred tax assets ultimately depends on the existence of sufficient taxable income to support the amount of deferred taxes. A valuation allowance is recorded in those circumstances in which we conclude it is not more-likely-than-not we will recover the deferred tax assets prior to their expiration.
During the third quarter of 2015, the Pullmantur trademark and trade names were impaired. As a result of the impairment, there was no longer a difference between the book and tax basis of the trademark and trade names. During the third quarter of 2015, we reversed the deferred tax liability of
$43.4 million
and increased the deferred tax asset valuation allowance by
$31.4 million
, or to
100%
of the deferred tax asset balance. The resulting net
$12.0 million
deferred tax benefit was recorded as part of our income tax provision and was reported within
Other expense
in our consolidated statements of comprehensive income (loss) for the year ended December 31, 2015. Effective July 31, 2016, we sold
51%
of our interest in Pullmantur Holdings. For further information on the sale transaction, refer to Note 1.
General
.
F-28
ROYAL CARIBBEAN CRUISES LTD.
NOTES TO THE CONSOLIDATED FINANCIAL STATEMENTS (Continued)
Note 13.
Changes in Accumulated Other Comprehensive Income (Loss)
The following table presents the changes in accumulated other comprehensive loss by component for the years ended
December 31, 2017
and
2016
(in thousands):
|
Changes related to cash flow derivative hedges
|
Changes in defined
benefit plans |
Foreign currency translation adjustments
|
Accumulated other comprehensive income (loss)
|
|||||||||||||
|
Accumulated comprehensive loss at January 1, 2015
|
$
|
(826,026
|
)
|
$
|
(31,207
|
)
|
$
|
(39,761
|
)
|
$
|
(896,994
|
)
|
||||
|
Other comprehensive (loss) income before reclassifications
|
(697,671
|
)
|
3,053
|
|
(25,952
|
)
|
(720,570
|
)
|
||||||||
|
Amounts reclassified from accumulated other comprehensive loss
|
291,624
|
|
1,707
|
|
(4,200
|
)
|
289,131
|
|
||||||||
|
Net current-period other comprehensive (loss) income
|
(406,047
|
)
|
4,760
|
|
(30,152
|
)
|
(431,439
|
)
|
||||||||
|
Accumulated comprehensive loss at January 1, 2016
|
(1,232,073
|
)
|
(26,447
|
)
|
(69,913
|
)
|
(1,328,433
|
)
|
||||||||
|
Other comprehensive income (loss) before reclassifications
|
73,973
|
|
(2,777
|
)
|
2,362
|
|
73,558
|
|
||||||||
|
Amounts reclassified from accumulated other comprehensive loss
|
337,250
|
|
1,141
|
|
—
|
|
338,391
|
|
||||||||
|
Net current-period other comprehensive income (loss)
|
411,223
|
|
(1,636
|
)
|
2,362
|
|
411,949
|
|
||||||||
|
Accumulated comprehensive loss at January 1, 2017
|
(820,850
|
)
|
(28,083
|
)
|
(67,551
|
)
|
(916,484
|
)
|
||||||||
|
Other comprehensive income (loss) before reclassifications
|
381,865
|
|
(6,755
|
)
|
17,307
|
|
392,417
|
|
||||||||
|
Amounts reclassified from accumulated other comprehensive loss
|
188,630
|
|
1,172
|
|
—
|
|
189,802
|
|
||||||||
|
Net current-period other comprehensive income (loss)
|
570,495
|
|
(5,583
|
)
|
17,307
|
|
582,219
|
|
||||||||
|
Accumulated comprehensive loss at December 31, 2017
|
$
|
(250,355
|
)
|
$
|
(33,666
|
)
|
$
|
(50,244
|
)
|
$
|
(334,265
|
)
|
||||
The following table presents reclassifications out of accumulated other comprehensive loss for the years ended
December 31, 2017
and
2016
(in thousands):
F-29
ROYAL CARIBBEAN CRUISES LTD.
NOTES TO THE CONSOLIDATED FINANCIAL STATEMENTS (Continued)
|
Amount of Loss Reclassified from Accumulated Other Comprehensive Income (Loss) into Income
|
||||||||||||||
|
Details about Accumulated Other Comprehensive Income (Loss) Components
|
Year Ended December 31, 2017
|
Year Ended December 31, 2016
|
Year Ended December 31, 2015
|
Affected Line Item in Statements of Comprehensive Income (Loss)
|
||||||||||
|
Loss on cash flow derivative hedges:
|
||||||||||||||
|
Interest rate swaps
|
(31,603
|
)
|
(41,480
|
)
|
(36,401
|
)
|
Interest expense, net of interest capitalized
|
|||||||
|
Foreign currency forward contracts
|
(10,840
|
)
|
(8,114
|
)
|
(2,871
|
)
|
Depreciation and amortization expenses
|
|||||||
|
Foreign currency forward contracts
|
(9,472
|
)
|
(14,342
|
)
|
7,580
|
|
Other expense
|
|||||||
|
Foreign currency forward contracts
|
—
|
|
(207
|
)
|
—
|
|
Other indirect operating expenses
|
|||||||
|
Foreign currency collar options
|
(2,408
|
)
|
(2,408
|
)
|
(1,605
|
)
|
Depreciation and amortization expenses
|
|||||||
|
Fuel swaps
|
7,382
|
|
13,685
|
|
(9,583
|
)
|
Other expense
|
|||||||
|
Fuel swaps
|
(141,689
|
)
|
(284,384
|
)
|
(248,744
|
)
|
Fuel
|
|||||||
|
(188,630
|
)
|
(337,250
|
)
|
(291,624
|
)
|
|||||||||
|
Amortization of defined benefit plans:
|
||||||||||||||
|
Actuarial loss
|
(1,172
|
)
|
(1,141
|
)
|
(1,414
|
)
|
Payroll and related
|
|||||||
|
Prior service costs
|
—
|
|
—
|
|
(293
|
)
|
Payroll and related |
|||||||
|
(1,172
|
)
|
(1,141
|
)
|
(1,707
|
)
|
|||||||||
|
Release of foreign cumulative translation due to sale or liquidation of businesses:
|
||||||||||||||
|
Foreign cumulative translation
|
—
|
|
—
|
|
4,200
|
|
Other operating
|
|||||||
|
Total reclassifications for the period
|
$
|
(189,802
|
)
|
$
|
(338,391
|
)
|
$
|
(289,131
|
)
|
|||||
Note 14.
Fair Value Measurements and Derivative Instruments
Fair Value Measurements
The estimated fair value of our financial instruments that are not measured at fair value, categorized based upon the fair value hierarchy, are as follows (in thousands):
|
Fair Value Measurements at December 31, 2017 Using
|
Fair Value Measurements at December 31, 2016 Using
|
||||||||||||||||||||||||||||||||||||||
|
Description
|
Total Carrying Amount
|
Total Fair Value
|
Level 1
(1)
|
Level 2
(2)
|
Level 3
(3)
|
Total Carrying Amount
|
Total Fair Value
|
Level 1
(1)
|
Level 2
(2)
|
Level 3
(3)
|
|||||||||||||||||||||||||||||
|
Assets:
|
|||||||||||||||||||||||||||||||||||||||
|
Cash and cash equivalents
(4)
|
$
|
120,112
|
|
$
|
120,112
|
|
|
$
|
120,112
|
|
$
|
—
|
|
$
|
—
|
|
$
|
132,603
|
|
$
|
132,603
|
|
$
|
132,603
|
|
$
|
—
|
|
$
|
—
|
|
||||||||
|
Total Assets
|
$
|
120,112
|
|
$
|
120,112
|
|
|
$
|
120,112
|
|
$
|
—
|
|
$
|
—
|
|
$
|
132,603
|
|
$
|
132,603
|
|
$
|
132,603
|
|
$
|
—
|
|
$
|
—
|
|
||||||||
|
Liabilities:
|
|||||||||||||||||||||||||||||||||||||||
|
Long-term debt (including current portion of long-term debt)
(5)
|
$
|
7,506,312
|
|
$
|
8,038,092
|
|
|
$
|
—
|
|
$
|
8,038,092
|
|
$
|
—
|
|
$
|
9,347,051
|
|
$
|
9,859,266
|
|
$
|
—
|
|
$
|
9,859,266
|
|
$
|
—
|
|
||||||||
|
Total Liabilities
|
$
|
7,506,312
|
|
$
|
8,038,092
|
|
|
$
|
—
|
|
$
|
8,038,092
|
|
$
|
—
|
|
$
|
9,347,051
|
|
$
|
9,859,266
|
|
$
|
—
|
|
$
|
9,859,266
|
|
$
|
—
|
|
||||||||
___________________________________________________________________
|
(1)
|
Inputs based on quoted prices (unadjusted) in active markets for identical assets or liabilities that we have the ability to access. Valuation of these items does not entail a significant amount of judgment.
|
|
(2)
|
Inputs other than quoted prices included within Level 1 that are observable for the liability, either directly or indirectly. For unsecured revolving credit facilities and unsecured term loans, fair value is determined utilizing the income valuation approach. This valuation model takes into account
|
F-30
ROYAL CARIBBEAN CRUISES LTD.
NOTES TO THE CONSOLIDATED FINANCIAL STATEMENTS (Continued)
the contract terms of our debt such as the debt maturity and the interest rate on the debt. The valuation model also takes into account the creditworthiness of the Company.
|
(3)
|
Inputs that are unobservable. The Company did not use any Level 3 inputs as of
December 31, 2017
and
December 31, 2016
.
|
|
(4)
|
Consists of cash and marketable securities with original maturities of less than 90 days.
|
|
(5)
|
Consists of unsecured revolving credit facilities, senior notes, senior debentures and term loans. This does not include our capital lease obligations.
|
Other Financial Instruments
The carrying amounts of accounts receivable, accounts payable, accrued interest and accrued expenses approximate fair value at
December 31, 2017
and
December 31, 2016
.
Assets and liabilities that are recorded at fair value have been categorized based upon the fair value hierarchy. The following table presents information about the Company's financial instruments recorded at fair value on a recurring basis (in thousands):
|
Fair Value Measurements at December 31, 2017 Using
|
Fair Value Measurements at December 31, 2016 Using
|
||||||||||||||||||||||||||||||
|
Description
|
Total Fair Value
|
Level 1
(1)
|
Level 2
(2)
|
Level 3
(3)
|
Total Fair Value
|
Level 1
(1)
|
Level 2
(2)
|
Level 3
(3)
|
|||||||||||||||||||||||
|
Assets:
|
|||||||||||||||||||||||||||||||
|
Derivative financial instruments
(4)
|
$
|
320,385
|
|
$
|
—
|
|
$
|
320,385
|
|
$
|
—
|
|
$
|
19,397
|
|
$
|
—
|
|
$
|
19,397
|
|
$
|
—
|
|
|||||||
|
Investments
(5)
|
3,340
|
|
3,340
|
|
—
|
|
—
|
|
3,576
|
|
3,576
|
|
—
|
|
—
|
|
|||||||||||||||
|
Total Assets
|
$
|
323,725
|
|
$
|
3,340
|
|
$
|
320,385
|
|
$
|
—
|
|
$
|
22,973
|
|
$
|
3,576
|
|
$
|
19,397
|
|
$
|
—
|
|
|||||||
|
Liabilities:
|
|||||||||||||||||||||||||||||||
|
Derivative financial instruments
(6)
|
$
|
115,961
|
|
$
|
—
|
|
$
|
115,961
|
|
$
|
—
|
|
$
|
373,497
|
|
$
|
—
|
|
$
|
373,497
|
|
$
|
—
|
|
|||||||
|
Total Liabilities
|
$
|
115,961
|
|
$
|
—
|
|
$
|
115,961
|
|
$
|
—
|
|
$
|
373,497
|
|
$
|
—
|
|
$
|
373,497
|
|
$
|
—
|
|
|||||||
___________________________________________________________________
|
(1)
|
Inputs based on quoted prices (unadjusted) in active markets for identical assets or liabilities that we have the ability to access. Valuation of these items does not entail a significant amount of judgment.
|
|
(2)
|
Inputs other than quoted prices included within Level 1 that are observable for the asset or liability, either directly or indirectly. For foreign currency forward contracts, interest rate swaps, cross currency swaps and fuel swaps, fair value is derived using valuation models that utilize the income valuation approach. These valuation models take into account the contract terms, such as maturity as well as other inputs, such as foreign exchange rates and curves, fuel types, fuel curves and interest rate yield curves. All derivative instrument fair values take into account the creditworthiness of the counterparty and the Company.
|
|
(3)
|
Inputs that are unobservable. The Company did not use any Level 3 inputs as of
December 31, 2017
and
December 31, 2016
.
|
|
(4)
|
Consists of foreign currency forward contracts, interest rate swaps and fuel swaps. Please refer to the "Fair Value of Derivative Instruments" table for breakdown by instrument type.
|
|
(5)
|
Consists of exchange-traded equity securities and mutual funds reported within
Other assets
in our consolidated balance sheets.
|
|
(6)
|
Consists of foreign currency forward contracts, interest rate swaps and fuel swaps. Please refer to the "Fair Value of Derivative Instruments" table for breakdown by instrument type.
|
The reported fair values are based on a variety of factors and assumptions. Accordingly, the fair values may not represent actual values of the financial instruments that could have been realized as of
December 31, 2017
or
December 31, 2016
, or that will be realized in the future, and do not include expenses that could be incurred in an actual sale or settlement.
We have master International Swaps and Derivatives Association (“ISDA”) agreements in place with our derivative instrument counterparties. These ISDA agreements provide for final close out netting with our counterparties for all positions in the case of default or termination of the ISDA agreement. We have determined that our ISDA agreements provide us with rights of setoff on the fair value of derivative instruments in a gain position and those in a loss position with the same counterparty. We have elected not to offset such derivative instrument fair values in our consolidated balance sheets.
See
Credit Related Contingent Features
for further discussion on contingent collateral requirements for our derivative instruments.
F-31
ROYAL CARIBBEAN CRUISES LTD.
NOTES TO THE CONSOLIDATED FINANCIAL STATEMENTS (Continued)
The following table presents information about the Company’s offsetting of financial assets under master netting agreements with derivative counterparties:
|
Gross Amounts not Offset in the Consolidated Balance Sheet that are Subject to Master Netting Agreements
|
||||||||||||||||||||||||||||||||
|
As of December 31, 2017
|
As of December 31, 2016
|
|||||||||||||||||||||||||||||||
|
Gross Amount of Derivative Assets Presented in the Consolidated Balance Sheet
|
Gross Amount of Eligible Offsetting
Recognized Derivative Liabilities |
Cash Collateral
Received |
Net Amount of
Derivative Assets |
Gross Amount of Derivative Assets Presented in the Consolidated Balance Sheet
|
Gross Amount of Eligible Offsetting
Recognized Derivative Assets |
Cash Collateral
Received |
Net Amount of
Derivative Assets |
|||||||||||||||||||||||||
|
(In thousands)
|
||||||||||||||||||||||||||||||||
|
Derivatives subject to master netting agreements
|
$
|
320,385
|
|
$
|
(104,751
|
)
|
$
|
—
|
|
$
|
215,634
|
|
$
|
19,397
|
|
$
|
(19,397
|
)
|
$
|
—
|
|
$
|
—
|
|
||||||||
|
Total
|
$
|
320,385
|
|
$
|
(104,751
|
)
|
$
|
—
|
|
$
|
215,634
|
|
$
|
19,397
|
|
$
|
(19,397
|
)
|
$
|
—
|
|
$
|
—
|
|
||||||||
The following table presents information about the Company’s offsetting of financial liabilities under master netting agreements with derivative counterparties:
|
Gross Amounts not Offset in the Consolidated Balance Sheet that are Subject to Master Netting Agreements
|
||||||||||||||||||||||||||||||||
|
As of December 31, 2017
|
As of December 31, 2016
|
|||||||||||||||||||||||||||||||
|
Gross Amount of Derivative Liabilities Presented in the Consolidated Balance Sheet
|
Gross Amount of Eligible Offsetting
Recognized Derivative Assets |
Cash Collateral
Pledged |
Net Amount of
Derivative Liabilities |
Gross Amount of Derivative Liabilities Presented in the Consolidated Balance Sheet
|
Gross Amount of Eligible Offsetting
Recognized Derivative Liabilities |
Cash Collateral
Pledged |
Net Amount of
Derivative Liabilities |
|||||||||||||||||||||||||
|
(In thousands)
|
||||||||||||||||||||||||||||||||
|
Derivatives subject to master netting agreements
|
$
|
(115,961
|
)
|
$
|
104,751
|
|
$
|
—
|
|
$
|
(11,210
|
)
|
$
|
(373,497
|
)
|
$
|
19,397
|
|
$
|
7,213
|
|
$
|
(346,887
|
)
|
||||||||
|
Total
|
$
|
(115,961
|
)
|
$
|
104,751
|
|
$
|
—
|
|
$
|
(11,210
|
)
|
$
|
(373,497
|
)
|
$
|
19,397
|
|
$
|
7,213
|
|
$
|
(346,887
|
)
|
||||||||
Derivative Instruments
We are exposed to market risk attributable to changes in interest rates, foreign currency exchange rates and fuel prices. We try to mitigate these risks through a combination of our normal operating and financing activities and through the use of derivative financial instruments pursuant to our hedging practices and policies. The financial impact of these hedging instruments is primarily offset by corresponding changes in the underlying exposures being hedged. We achieve this by closely matching the notional amount, term and conditions of the derivative instrument with the underlying risk being hedged. Although certain of our derivative financial instruments do not qualify or are not accounted for under hedge accounting, our objective is not to hold or issue derivative financial instruments for trading or other speculative purposes.
We enter into various forward, swap and option contracts to manage our interest rate exposure and to limit our exposure to fluctuations in foreign currency exchange rates and fuel prices. These instruments are recorded on the balance sheet at their fair value and the vast majority are designated as hedges. We also use non-derivative financial instruments designated as hedges of our net investment in our foreign operations and investments.
At inception of the hedge relationship, a derivative instrument that hedges the exposure to changes in the fair value of a firm commitment or a recognized asset or liability is designated as a fair value hedge. A derivative instrument that hedges a forecasted transaction or the variability of cash flows related to a recognized asset or liability is designated as a cash flow hedge.
F-32
ROYAL CARIBBEAN CRUISES LTD.
NOTES TO THE CONSOLIDATED FINANCIAL STATEMENTS (Continued)
Changes in the fair value of derivatives that are designated as fair value hedges are offset against changes in the fair value of the underlying hedged assets, liabilities or firm commitments. Gains and losses on derivatives that are designated as cash flow hedges are recorded as a component of
Accumulated other comprehensive loss
until the underlying hedged transactions are recognized in earnings. The foreign currency transaction gain or loss of our non-derivative financial instruments and the changes in the fair value of derivatives designated as hedges of our net investment in foreign operations and investments are recognized as a component of
Accumulated other comprehensive loss
along with the associated foreign currency translation adjustment of the foreign operation or investment.
On an ongoing basis, we assess whether derivatives used in hedging transactions are "highly effective" in offsetting changes in the fair value or cash flow of hedged items. We use the long-haul method to assess hedge effectiveness using regression analysis for each hedge relationship under our interest rate, foreign currency and fuel hedging programs. We apply the same methodology on a consistent basis for assessing hedge effectiveness to all hedges within each hedging program (i.e., interest rate, foreign currency and fuel). We perform regression analyses over an observation period of up to three years, utilizing market data relevant to the hedge horizon of each hedge relationship. High effectiveness is achieved when a statistically valid relationship reflects a high degree of offset and correlation between the changes in the fair values of the derivative instrument and the hedged item. The determination of ineffectiveness is based on the amount of dollar offset between the change in fair value of the derivative instrument and the change in fair value of the hedged item at the end of the reporting period. If it is determined that a derivative is not highly effective as a hedge or hedge accounting is discontinued, any change in fair value of the derivative since the last date at which it was determined to be effective is recognized in earnings. In addition, the ineffective portion of our highly effective hedges is immediately recognized in earnings and reported in
Other expense
in our consolidated statements of comprehensive income (loss).
Cash flows from derivative instruments that are designated as fair value or cash flow hedges are classified in the same category as the cash flows from the underlying hedged items. In the event that hedge accounting is discontinued, cash flows subsequent to the date of discontinuance are classified within investing activities. Cash flows from derivative instruments not designated as hedging instruments are classified as investing activities.
We consider the classification of the underlying hedged item’s cash flows in determining the classification for the designated derivative instrument’s cash flows. We classify derivative instrument cash flows from hedges of benchmark interest rate or hedges of fuel expense as operating activities due to the nature of the hedged item. Likewise, we classify derivative instrument cash flows from hedges of foreign currency risk on our newbuild ship payments as investing activities and derivative instrument cash flows from hedges of foreign currency risk on debt payments as financing activities.
The following table presents information on the Company's cash flows from derivative instruments classified as investing activities in our Consolidated Statements of Cash Flows (in thousands):
|
For the Years Ended December 31,
|
|||||||||
|
2017
|
2016
|
2015
|
|||||||
|
Cash received on settlement of derivative financial instruments
|
$
|
63,777
|
|
$
|
110,637
|
|
$
|
2,148
|
|
|
Cash paid on settlement of derivative financial instruments
|
(553
|
)
|
(323,839
|
)
|
(180,745
|
)
|
|||
|
Cash received (paid) on settlement of derivative financial instruments
|
$
|
63,224
|
|
$
|
(213,202
|
)
|
$
|
(178,597
|
)
|
Interest Rate Risk
Our exposure to market risk for changes in interest rates relates to our long-term debt obligations including future interest payments. At
December 31, 2017
, approximately
57.4%
of our long-term debt was effectively fixed as compared to
40.5%
as of
December 31, 2016
. We use interest rate swap agreements to modify our exposure to interest rate movements and to manage our interest expense.
Market risk associated with our long-term fixed rate debt is the potential increase in fair value resulting from a decrease in interest rates. We use interest rate swap agreements that effectively convert a portion of our fixed-rate debt to a floating-rate basis
F-33
ROYAL CARIBBEAN CRUISES LTD.
NOTES TO THE CONSOLIDATED FINANCIAL STATEMENTS (Continued)
to manage this risk. At
December 31, 2017
and
December 31, 2016
, we maintained interest rate swap agreements on the following fixed-rate debt instruments:
|
Debt Instrument
|
Swap Notional as of December 31, 2017 (In thousands)
|
Maturity
|
Debt Fixed Rate
|
Swap Floating Rate: LIBOR plus
|
All-in Swap Floating Rate as of December 31, 2017
|
||
|
Oasis of the Seas
term loan
|
$
|
140,000
|
|
October 2021
|
5.41%
|
3.87%
|
5.44%
|
|
Unsecured senior notes
|
650,000
|
|
November 2022
|
5.25%
|
3.63%
|
5.05%
|
|
|
$
|
790,000
|
|
|||||
These interest rate swap agreements are accounted for as fair value hedges.
Market risk associated with our long-term floating rate debt is the potential increase in interest expense from an increase in interest rates. We use interest rate swap agreements that effectively convert a portion of our floating-rate debt to a fixed-rate basis to manage this risk. At
December 31, 2017
and
December 31, 2016
, we maintained interest rate swap agreements on the following floating-rate debt instruments:
|
Debt Instrument
|
Swap Notional as of December 31, 2017 (In thousands)
|
Maturity
|
Debt Floating Rate
|
All-in Swap Fixed Rate
|
|||
|
Celebrity Reflection
term loan
|
$
|
381,792
|
|
October 2024
|
LIBOR plus
|
0.40%
|
2.85%
|
|
Quantum of the Seas
term loan
|
551,250
|
|
October 2026
|
LIBOR plus
|
1.30%
|
3.74%
|
|
|
Anthem of the Seas
term loan
|
573,958
|
|
April 2027
|
LIBOR plus
|
1.30%
|
3.86%
|
|
|
Ovation of the Seas
term loan
|
726,250
|
|
April 2028
|
LIBOR plus
|
1.00%
|
3.16%
|
|
|
Harmony of the Seas
term loan
(1)
|
728,373
|
|
May 2028
|
EURIBOR plus
|
1.15%
|
2.26%
|
|
|
$
|
2,961,623
|
|
|||||
___________________________________________________________________
|
(1)
|
Interest rate swap agreements hedging the Euro-denominated term loan for
Harmony of the Seas
include a EURIBOR zero-floor matching the hedged debt EURIBOR zero-floor. Amount presented is based on the exchange rate as of
December 31, 2017
.
|
These interest rate swap agreements are accounted for as cash flow hedges.
The notional amount of interest rate swap agreements related to outstanding debt as of
December 31, 2017
and
2016
was
$3.8 billion
and
$4.0 billion
, respectively.
Foreign Currency Exchange Rate Risk
Derivative Instruments
Our primary exposure to foreign currency exchange rate risk relates to our ship construction contracts denominated in Euros, our foreign currency denominated debt and our international business operations. We enter into foreign currency forward contracts, collar options and cross currency swap agreements to manage portions of the exposure to movements in foreign currency exchange rates. As of
December 31, 2017
, the aggregate cost of our ships on order, not including the TUI Cruises' ships on order was approximately
$13.3 billion
, of which we had deposited
$465.7 million
as of such date. Approximately
54.0%
and
66.7%
of the aggregate cost of the ships under construction was exposed to fluctuations in the Euro exchange rate at
December 31, 2017
and
2016
, respectively. The majority of our foreign currency forward contracts, collar options and cross currency swap agreements are accounted for as cash flow, fair value or net investment hedges depending on the designation of the related hedge.
On a regular basis, we enter into foreign currency forward contracts and, from time to time, we utilize cross-currency swap agreements to minimize the volatility resulting from the remeasurement of net monetary assets and liabilities denominated in a currency other than our functional currency or the functional currencies of our foreign subsidiaries. During the
fourth
quarter of
2017
, we maintained an average of approximately
$843.3 million
of these foreign currency forward contracts. These instruments
F-34
ROYAL CARIBBEAN CRUISES LTD.
NOTES TO THE CONSOLIDATED FINANCIAL STATEMENTS (Continued)
are not designated as hedging instruments. In
2017
,
2016
and
2015
changes in the fair value of the foreign currency forward contracts resulted in a gain (loss) of approximately
$62.0 million
,
$(51.1) million
and
$(55.5) million
, respectively, which offset (losses) gains arising from the remeasurement of monetary assets and liabilities denominated in foreign currencies in those same years of
$(75.6) million
,
$39.8 million
and
$34.6 million
, respectively. These changes were recognized in earnings within
Other expense
in our consolidated statements of comprehensive income (loss).
We consider our investments in our foreign operations to be denominated in relatively stable currencies and of a long-term nature. As of
December 31, 2017
, we maintained foreign currency forward contracts and designated them as hedges of a portion of our net investment in TUI cruises of
€101.0 million
, or approximately
$121.3 million
based on the exchange rate at
December 31, 2017
. These forward currency contracts mature in October 2021.
The notional amount of outstanding foreign exchange contracts, including our forward contracts, as of
December 31, 2017
and
2016
was
$4.6 billion
and
$1.3 billion
, respectively.
Non-Derivative Instruments
We also address the exposure of our investments in foreign operations by denominating a portion of our debt in our subsidiaries' and investments' functional currencies and designating it as a hedge of these subsidiaries and investments. We had designated debt as a hedge of our net investments in TUI Cruises of approximately
€246.0 million
, or approximately
$295.3 million
, through
December 31, 2017
. As of December 31,
2016
, we had designated debt as a hedge of our net investments in TUI Cruises of approximately
€295.0 million
, or approximately
$311.2 million
.
Fuel Price Risk
Our exposure to market risk for changes in fuel prices relates primarily to the consumption of fuel on our ships. We use fuel swap agreements to mitigate the financial impact of fluctuations in fuel prices.
Our fuel swap agreements are accounted for as cash flow hedges. At
December 31, 2017
, we have hedged the variability in future cash flows for certain forecasted fuel transactions occurring through
2021
. As of
December 31, 2017
and
2016
, we had the following outstanding fuel swap agreements:
|
Fuel Swap Agreements
|
|||||
|
As of December 31, 2017
|
As of December 31, 2016
|
||||
|
(metric tons)
|
|||||
|
2017
|
—
|
|
799,065
|
|
|
|
2018
|
673,700
|
|
616,300
|
|
|
|
2019
|
668,500
|
|
521,000
|
|
|
|
2020
|
531,200
|
|
306,500
|
|
|
|
2021
|
224,900
|
|
—
|
|
|
|
Fuel Swap Agreements
|
|||||
|
As of December 31, 2017
|
As of December 31, 2016
|
||||
|
(% hedged)
|
|||||
|
Projected fuel purchases for year:
|
|||||
|
2017
|
—
|
|
60
|
%
|
|
|
2018
|
50
|
%
|
44
|
%
|
|
|
2019
|
46
|
%
|
35
|
%
|
|
|
2020
|
36
|
%
|
20
|
%
|
|
|
2021
|
14
|
%
|
—
|
%
|
|
At
December 31, 2017
and
2016
,
$23.7 million
and
$138.5 million
, respectively, of estimated unrealized net loss associated with our cash flow hedges pertaining to fuel swap agreements were expected to be reclassified to earnings from
Accumulated
F-35
ROYAL CARIBBEAN CRUISES LTD.
NOTES TO THE CONSOLIDATED FINANCIAL STATEMENTS (Continued)
other comprehensive loss
within the next 12 months. Reclassification is expected to occur as the result of fuel consumption associated with our hedged forecasted fuel purchases.
The fair value and line item caption of derivative instruments recorded within our consolidated balance sheets were as follows:
|
Fair Value of Derivative Instruments
|
|||||||||||||||||||
|
Asset Derivatives
|
Liability Derivatives
|
||||||||||||||||||
|
Balance Sheet
Location |
As of December 31, 2017
|
As of December 31, 2016
|
Balance Sheet
Location |
As of December 31, 2017
|
As of December 31, 2016
|
||||||||||||||
|
Fair Value
|
Fair Value
|
Fair Value
|
Fair Value
|
||||||||||||||||
|
(In thousands)
|
|||||||||||||||||||
|
Derivatives designated as hedging instruments under ASC 815-20
(1)
|
|||||||||||||||||||
|
Interest rate swaps
|
Other assets
|
$
|
7,330
|
|
$
|
5,246
|
|
Other long-term liabilities
|
$
|
46,509
|
|
$
|
57,679
|
|
|||||
|
Foreign currency forward contracts
|
Derivative financial instruments
|
68,352
|
|
—
|
|
Derivative financial instruments
|
—
|
|
5,574
|
|
|||||||||
|
Foreign currency forward contracts
|
Other assets
|
158,879
|
|
—
|
|
Other long-term liabilities
|
6,625
|
|
68,165
|
|
|||||||||
|
Fuel swaps
|
Derivative financial instruments
|
13,137
|
|
—
|
|
Derivative financial instruments
|
38,488
|
|
129,486
|
|
|||||||||
|
Fuel swaps
|
Other assets
|
51,265
|
|
13,608
|
|
Other long-term liabilities
|
13,411
|
|
95,125
|
|
|||||||||
|
Total derivatives designated as hedging instruments under ASC 815-20
|
298,963
|
|
18,854
|
|
105,033
|
|
356,029
|
|
|||||||||||
|
Derivatives not designated as hedging instruments under ASC 815-20
|
|||||||||||||||||||
|
Foreign currency forward contracts
|
Derivative Financial Instruments
|
9,945
|
|
—
|
|
Derivative financial instruments
|
2,933
|
|
—
|
|
|||||||||
|
Foreign currency forward contracts
|
Other assets
|
2,793
|
|
—
|
|
Other long-term liabilities
|
1,139
|
|
—
|
|
|||||||||
|
Fuel swaps
|
Derivative financial instruments
|
7,886
|
|
—
|
|
Derivative financial instruments
|
6,043
|
|
11,532
|
|
|||||||||
|
Fuel swaps
|
Other assets
|
798
|
|
543
|
|
Other long-term liabilities
|
813
|
|
5,936
|
|
|||||||||
|
Total derivatives not designated as hedging instruments under ASC 815-20
|
21,422
|
|
543
|
|
10,928
|
|
17,468
|
|
|||||||||||
|
Total derivatives
|
$
|
320,385
|
|
$
|
19,397
|
|
$
|
115,961
|
|
$
|
373,497
|
|
|||||||
___________________________________________________________________
|
(1)
|
Accounting Standard Codification 815-20 "
Derivatives and Hedging."
|
The carrying value and line item caption of non-derivative instruments designated as hedging instruments recorded within our consolidated balance sheets were as follows:
|
Carrying Value
|
||||||||||
|
Non-derivative instrument designated as
hedging instrument under ASC 815-20 |
Balance Sheet Location
|
As of December 31, 2017
|
As of December 31, 2016
|
|||||||
|
(In thousands)
|
||||||||||
|
Foreign currency debt
|
Current portion of long-term debt
|
$
|
70,097
|
|
$
|
61,601
|
|
|||
|
Foreign currency debt
|
Long-term debt
|
225,226
|
|
249,624
|
|
|||||
|
|
|
$
|
295,323
|
|
$
|
311,225
|
|
|||
The effect of derivative instruments qualifying and designated as hedging instruments and the related hedged items in fair value hedges on the consolidated statements of comprehensive income (loss) was as follows:
F-36
ROYAL CARIBBEAN CRUISES LTD.
NOTES TO THE CONSOLIDATED FINANCIAL STATEMENTS (Continued)
|
Location of Gain
(Loss) Recognized in Income on Derivative and Hedged Item |
Amount of Gain (Loss)
Recognized in Income on Derivative |
Amount of Gain (Loss)
Recognized in Income on Hedged Item |
||||||||||||||||
|
Derivatives and Related Hedged Items
under ASC 815-20 Fair Value Hedging Relationships |
Year Ended December 31, 2017
|
Year Ended December 31, 2016
|
Year Ended December 31, 2017
|
Year Ended December 31, 2016
|
||||||||||||||
|
(In thousands)
|
||||||||||||||||||
|
Interest rate swaps
|
Interest expense, net of interest capitalized
|
$
|
3,007
|
|
$
|
7,448
|
|
$
|
—
|
|
$
|
7,203
|
|
|||||
|
Interest rate swaps
|
Other expense
|
(3,139
|
)
|
(3,625
|
)
|
6,065
|
|
5,072
|
|
|||||||||
|
|
|
$
|
(132
|
)
|
$
|
3,823
|
|
$
|
6,065
|
|
$
|
12,275
|
|
|||||
The effect of derivative instruments qualifying and designated as cash flow hedging instruments on the consolidated financial statements was as follows:
|
Amount of Gain (Loss)
Recognized in Other Comprehensive Income on Derivatives (Effective Portion) |
Location of Gain
(Loss) Reclassified from Accumulated OCI into Income (Effective Portion) |
Amount of Gain (Loss)
Reclassified from Accumulated Other Comprehensive Income into Income (Effective Portion) |
Location of Gain
(Loss) Recognized in Income on Derivative (Ineffective Portion and Amount Excluded from Effectiveness Testing) |
Amount of Gain (Loss)
Recognized in Income on Derivative (Ineffective Portion and Amount Excluded from Effectiveness testing) |
||||||||||||||||||||||||
|
Derivatives under
ASC 815-20 Cash Flow Hedging Relationships |
Year Ended December 31, 2017
|
Year Ended December 31, 2016
|
Year Ended December 31, 2017
|
Year Ended December 31, 2016
|
Year Ended December 31, 2017
|
Year Ended December 31, 2016
|
||||||||||||||||||||||
|
(In thousands)
|
||||||||||||||||||||||||||||
|
Interest rate swaps
|
$
|
(13,312
|
)
|
$
|
(31,049
|
)
|
Interest expense
|
$
|
(31,603
|
)
|
$
|
(41,480
|
)
|
Other expense
|
$
|
—
|
|
$
|
—
|
|
||||||||
|
Foreign currency forward contracts
|
276,573
|
|
(51,092
|
)
|
Depreciation and amortization expenses
|
(10,840
|
)
|
(8,114
|
)
|
Other expense
|
131
|
|
—
|
|
||||||||||||||
|
Foreign currency forward contracts
|
—
|
|
—
|
|
Other expense
|
(9,472
|
)
|
(14,342
|
)
|
Other expense
|
—
|
|
(59
|
)
|
||||||||||||||
|
Foreign currency forward contracts
|
—
|
|
—
|
|
Other indirect operating expenses
|
—
|
|
(207
|
)
|
Other expense
|
—
|
|
—
|
|
||||||||||||||
|
Foreign currency collar options
|
—
|
|
—
|
|
Depreciation and amortization expenses
|
(2,408
|
)
|
(2,408
|
)
|
Other expense
|
—
|
|
—
|
|
||||||||||||||
|
Fuel swaps
|
—
|
|
—
|
|
Other expense
|
7,382
|
|
13,685
|
|
Other expense
|
—
|
|
—
|
|
||||||||||||||
|
Fuel swaps
|
118,604
|
|
156,139
|
|
Fuel
|
(141,689
|
)
|
(284,384
|
)
|
Other expense
|
2,738
|
|
(751
|
)
|
||||||||||||||
|
$
|
381,865
|
|
$
|
73,998
|
|
$
|
(188,630
|
)
|
$
|
(337,250
|
)
|
$
|
2,869
|
|
$
|
(810
|
)
|
|||||||||||
F-37
ROYAL CARIBBEAN CRUISES LTD.
NOTES TO THE CONSOLIDATED FINANCIAL STATEMENTS (Continued)
The effect of non-derivative instruments qualifying and designated as net investment hedging instruments on the consolidated financial statements was as follows:
|
Amount of Gain (Loss)
Recognized in Other Comprehensive Income (Effective Portion) |
Location of Gain
(Loss) in Income (Ineffective Portion and Amount Excluded from Effectiveness Testing) |
Amount of Gain (Loss) Recognized in Income (Ineffective Portion and
Amount Excluded from Effectiveness Testing) |
||||||||||||||||
|
Non-derivative instruments under ASC 815-20
Net Investment Hedging Relationships |
Year Ended December 31, 2017
|
Year Ended December 31, 2016
|
Year Ended December 31, 2017
|
Year Ended December 31, 2016
|
||||||||||||||
|
(In thousands)
|
|
|
|
|
|
|||||||||||||
|
Foreign Currency Debt
|
$
|
(38,971
|
)
|
$
|
20,295
|
|
Other expense
|
$
|
—
|
|
$
|
—
|
|
|||||
|
$
|
(38,971
|
)
|
$
|
20,295
|
|
|
$
|
—
|
|
$
|
—
|
|
||||||
The effect of derivatives not designated as hedging instruments on the consolidated financial statements was as follows:
|
Amount of Gain (Loss) Recognized
in Income on Derivatives |
||||||||||
|
Derivatives Not Designated as Hedging
Instruments under ASC 815-20 |
Location of Gain (Loss)
Recognized in Income on Derivatives |
Year Ended December 31, 2017
|
Year Ended December 31, 2016
|
|||||||
|
(In thousands)
|
||||||||||
|
Foreign currency forward contracts
|
Other expense
|
$
|
61,952
|
|
$
|
(51,029
|
)
|
|||
|
Fuel swaps
|
Other expense
|
(1,133
|
)
|
(1,000
|
)
|
|||||
|
|
|
$
|
60,819
|
|
$
|
(52,029
|
)
|
|||
Credit Related Contingent Features
Our current interest rate derivative instruments may require us to post collateral if our Standard & Poor's and Moody's credit ratings are below specified levels. Specifically, if on the fifth anniversary of executing a derivative instrument or on any succeeding fifth-year anniversary our credit ratings for our senior unsecured debt were to be rated below BBB- by Standard & Poor's and Baa3 by Moody's, then the counterparty may periodically demand that we post collateral in an amount equal to the difference between (i) the net market value of all derivative transactions with such counterparty that have reached their fifth year anniversary, to the extent negative, and (ii) the applicable minimum call amount.
The amount of collateral required to be posted following such event will change as, and to the extent, our net liability position increases or decreases by more than the applicable minimum call amount. If our credit rating for our senior unsecured debt is subsequently equal to, or above
BBB-
by Standard & Poor's or
Baa3
by Moody's, then any collateral posted at such time will be released to us and we will no longer be required to post collateral unless we meet the collateral trigger requirement at the next fifth-year anniversary. At
December 31, 2017
,
four
of our interest rate derivative instruments had reached their fifth anniversary; however, our senior unsecured debt credit rating was
BBB-
by Standard & Poor's and
Baa3
by Moody's and, accordingly, we were not required to post any collateral as of such date. As of December 31,
2016
,
two
of our interest rate derivative instruments had reached their fifth anniversary. As our unsecured debt credit rating at December 31, 2016 was below BBB-/Baa3, we had posted
$7.2 million
in collateral as of such date. Consistent with the provisions of our interest rate derivatives instruments, all collateral that was posted with our counterparties was returned upon reaching investment grade.
F-38
ROYAL CARIBBEAN CRUISES LTD.
NOTES TO THE CONSOLIDATED FINANCIAL STATEMENTS (Continued)
Note 15.
Commitments and Contingencies
Ship Purchase Obligations
Our future capital commitments consist primarily of new ship orders. As of
December 31, 2017
, we had
two
Quantum-class ships,
two
Oasis-class ships and two ships of a new generation of ships, known as our Icon-class, on order for our Royal Caribbean International brand with an aggregate capacity of approximately
30,500
berths. Additionally, as of
December 31, 2017
, we have
four
ships of a new generation of ships, known as our Edge-class, and a ship designed for the Galapagos Islands on order for our Celebrity Cruises brand with an aggregate capacity of approximately
11,700
berths. The following provides further information on recent developments with respect to our ship orders.
During the second quarter of 2017, we entered into agreements with Meyer Turku to build
two
Icon-class ships. Subsequently, in October 2017, we entered into credit agreements for the unsecured financing of these ships for up to
80%
of each ship’s contract price. For each ship, the official Finnish export credit agency, Finnvera, plc, has agreed to guarantee
100%
of a substantial majority of the financing to the lenders, with a smaller portion of the financing to be
95%
guaranteed by Euler Hermes, the official German export credit agency. The maximum loan amount under each facility is not to exceed
€1.4 billion
, or approximately
$1.7 billion
, based on the exchange rate at
December 31, 2017
. Interest on approximately
75%
of each loan will accrue at a fixed rate of
3.56%
and
3.76%
for the first and the second Icon-class ships, respectively, and the balance will accrue interest at a floating rate ranging from LIBOR plus
1.10%
to
1.15%
and LIBOR plus
1.15%
to
1.20%
for the first and the second Icon-class ships, respectively. Each loan will amortize semi-annually and will mature
12 years
following delivery of each ship. The first and second Icon-class ships will each have a capacity of approximately
5,650
berths and are expected to enter service in the second quarters of 2022 and 2024, respectively.
In July 2017, we entered into credit agreements for the unsecured financing of the third and fourth Edge-class ships and the fifth Oasis-class ship for up to
80%
of each ship’s contract price through facilities to be guaranteed
100%
by Bpifrance Assurance Export, the official export credit agency of France. Under these financing arrangements, we have the right, but not the obligation, to satisfy the obligations to be incurred upon delivery and acceptance of each ship under the shipbuilding contract by assuming, at delivery and acceptance, the debt indirectly incurred by the shipbuilder during the construction of each ship. The maximum loan amount under each facility is not to exceed
€684.2 million
in the case of the third Edge-class ship and the United States dollar equivalent of
€714.6 million
and
€1.1 billion
in the case of the fourth Edge-class ship and fifth Oasis-class ship, or approximately
$857.9 million
and
$1.3 billion
, respectively, based on the exchange rate at
December 31, 2017
. The loans will amortize semi-annually and will mature
12 years
following delivery of each ship. Interest on the loans will accrue at a fixed rate of
1.28%
for the third Edge-class ship and at a fixed rate of
3.18%
for both, the fourth Edge-class ship and the fifth Oasis-class ship. The third and fourth Edge-class ships, each of which will have a capacity of approximately
2,900
berths, are expected to enter service in the fourth quarters of 2021 and 2022, respectively. The fifth Oasis-class ship will have a capacity of approximately
5,450
berths and is expected to enter service in the second quarter of 2021.
In September 2017, we entered into an agreement to purchase a ship for our Azamara Club Cruises brand. The sale is expected to be completed with the delivery of the ship scheduled for March 2018.
During 2016, we entered into credit agreements for the unsecured financing of our first
two
Edge-class ships for up to
80%
of each ship’s contract price through facilities to be guaranteed
100%
by COFACE, the official export credit agency of France. The ships will each have a capacity of approximately
2,900
berths and are expected to enter service in the fourth quarter of 2018 and the first half of 2020, respectively. Under these financing arrangements, we have the right, but not the obligation, to satisfy the obligations to be incurred upon delivery and acceptance of each vessel under the shipbuilding contract by assuming, at delivery and acceptance, the debt indirectly incurred by the shipbuilder during the construction of each ship. The maximum loan amount under each facility is not to exceed the United States dollar equivalent of
€622.6 million
and
€627.1 million
, or approximately
$747.4 million
and
$752.8 million
, respectively, based on the exchange rate at
December 31, 2017
, for the first Edge-class ship delivery and the second Edge-class ship
F-39
ROYAL CARIBBEAN CRUISES LTD.
NOTES TO THE CONSOLIDATED FINANCIAL STATEMENTS (Continued)
delivery, respectively. The loans will amortize semi-annually and will mature
12 years
following delivery of each ship. Interest on the loans will accrue at a fixed rate of
3.23%
.
As of
December 31, 2017
, the aggregate cost of our ships on order, not including any ships on order by our Partner Brands, was approximately
$13.3 billion
, of which we had deposited
$465.7 million
as of such date. Approximately
54.0%
of the aggregate cost was exposed to fluctuations in the Euro exchange rate at
December 31, 2017
. Refer to Note 14.
Fair Value Measurements and Derivative Instruments
for further information.
Litigation
We are routinely involved in claims typical within the cruise vacation industry. The majority of these claims are covered by insurance. We believe the outcome of such claims, net of expected insurance recoveries, will not have a material adverse impact on our financial condition or results of operations and cash flows.
Operating Leases
We are obligated under other noncancelable operating leases primarily for offices, warehouses and motor vehicles. As of
December 31, 2017
, future minimum lease payments under noncancelable operating leases were as follows (in thousands):
|
Year
|
|||
|
2018
|
$
|
29,420
|
|
|
2019
|
24,077
|
|
|
|
2020
|
20,113
|
|
|
|
2021
|
13,005
|
|
|
|
2022
|
9,639
|
|
|
|
Thereafter
|
145,214
|
|
|
|
$
|
241,468
|
|
|
Total expense for all operating leases amounted to
$29.3 million
,
$29.0 million
and
$29.7 million
for the years
2017
,
2016
and
2015
, respectively.
Other
In July 2016, we executed an agreement with Miami Dade County (“MDC”), which was simultaneously assigned to Sumitomo Banking Corporation (“SMBC”), to lease land from MDC and construct a new cruise terminal at PortMiami in Miami, Florida. The terminal is expected to be approximately
170,000
square-feet and will serve as a homeport. During the construction period, SMBC will fund the costs of the terminal’s construction and land lease. Upon completion of the terminal's construction, we will operate and lease the terminal from SMBC for a
five
-year term. We determined that the lease arrangement between SMBC and us should be accounted for as an operating lease upon completion of the terminal.
Some of the contracts that we enter into include indemnification provisions that obligate us to make payments to the counterparty if certain events occur. These contingencies generally relate to changes in taxes, increased lender capital costs and other similar costs. The indemnification clauses are often standard contractual terms and are entered into in the normal course of business. There are no stated or notional amounts included in the indemnification clauses and we are not able to estimate the maximum potential amount of future payments, if any, under these indemnification clauses. We have not been required to make any payments under such indemnification clauses in the past and, under current circumstances, we do not believe an indemnification in any material amount is probable.
If any person acquires ownership of more than
50%
of our common stock or, subject to certain exceptions, during any
24
-month period, a majority of the Board is no longer comprised of individuals who were members of the Board on the first day of such period, we may be obligated to prepay indebtedness outstanding under our credit facilities,
F-40
ROYAL CARIBBEAN CRUISES LTD.
NOTES TO THE CONSOLIDATED FINANCIAL STATEMENTS (Continued)
which we may be unable to replace on similar terms. Our public debt securities also contain change of control provisions that would be triggered by a third-party acquisition of greater than
50%
of our common stock coupled with a ratings downgrade. If this were to occur, it would have an adverse impact on our liquidity and operations.
At
December 31, 2017
, we have future commitments to pay for our usage of certain port facilities, marine consumables, services and maintenance contracts as follows (in thousands):
|
Year
|
|||
|
2018
|
$
|
214,444
|
|
|
2019
|
152,345
|
|
|
|
2020
|
130,225
|
|
|
|
2021
|
87,748
|
|
|
|
2022
|
62,255
|
|
|
|
Thereafter
|
232,189
|
|
|
|
$
|
879,206
|
|
|
Note 16.
Quarterly Selected Financial Data (Unaudited)
|
(In thousands, except per share data)
|
|||||||||||||||||||||||||||||||
|
First Quarter
|
Second Quarter
|
Third Quarter
|
Fourth Quarter
|
||||||||||||||||||||||||||||
|
2017
|
2016
|
2017
|
2016
|
2017
|
2016
|
2017
|
2016
|
||||||||||||||||||||||||
|
Total revenues
(1)
|
$
|
2,008,560
|
|
$
|
1,917,795
|
|
$
|
2,195,274
|
|
$
|
2,105,262
|
|
$
|
2,569,544
|
|
$
|
2,563,741
|
|
$
|
2,004,467
|
|
$
|
1,909,603
|
|
|||||||
|
Operating income
|
$
|
279,522
|
|
$
|
163,127
|
|
$
|
419,697
|
|
$
|
282,273
|
|
$
|
737,488
|
|
$
|
734,963
|
|
$
|
307,349
|
|
$
|
296,842
|
|
|||||||
|
Net income
(2)
|
$
|
214,726
|
|
$
|
99,140
|
|
$
|
369,526
|
|
$
|
229,905
|
|
$
|
752,842
|
|
$
|
693,257
|
|
$
|
288,039
|
|
$
|
261,086
|
|
|||||||
|
Earnings per share:
|
|||||||||||||||||||||||||||||||
|
Basic
|
$
|
1.00
|
|
$
|
0.46
|
|
$
|
1.72
|
|
$
|
1.07
|
|
$
|
3.51
|
|
$
|
3.23
|
|
$
|
1.35
|
|
$
|
1.22
|
|
|||||||
|
Diluted
|
$
|
0.99
|
|
$
|
0.46
|
|
$
|
1.71
|
|
$
|
1.06
|
|
$
|
3.49
|
|
$
|
3.21
|
|
$
|
1.34
|
|
$
|
1.21
|
|
|||||||
|
Dividends declared per share
|
$
|
0.48
|
|
$
|
0.375
|
|
$
|
0.48
|
|
$
|
0.375
|
|
$
|
0.60
|
|
$
|
0.48
|
|
$
|
0.60
|
|
$
|
0.48
|
|
|||||||
___________________________________________________________________
|
(1)
|
Our revenues are seasonal based on the demand for cruises. Demand is strongest for cruises during the Northern Hemisphere's summer months and holidays.
|
|
(2)
|
Amount for the first quarter of 2016 includes
$21.7 million
net loss related to the elimination of the Pullmantur reporting lag.
|
F-41
TABLE OF CONTENTS
Part IItem 1. BusinessItem 1A. Risk FactorsItem 1B. Unresolved Staff CommentsItem 2. PropertiesItem 3. Legal ProceedingsItem 4. Mine Safety DisclosuresPart IIItem 5. Market For Registrant's Common Equity, Related Stockholder Matters and Issuer Purchases Of Equity SecuritiesItem 6. Selected Financial DataItem 7. Management's Discussion and Analysis Of Financial Condition and Results Of OperationsItem 7A. Quantitative and Qualitative Disclosures About Market RiskItem 8. Financial Statements and Supplementary DataItem 9. Changes in and Disagreements with Accountants on Accounting and Financial DisclosureItem 9A. Controls and ProceduresItem 9B. Other InformationPart IIIPart IVItem 15. Exhibits and Financial Statement SchedulesItem 16. Form 10-k SummaryNote 1. GeneralNote 2. Summary Of Significant Accounting PoliciesNote 3. GoodwillNote 4. Intangible AssetsNote 5. Property and EquipmentNote 6. Other AssetsNote 7. Long-term DebtNote 8. Shareholders' EquityNote 9. Stock-based Employee CompensationNote 10. Earnings Per ShareNote 11. Retirement PlanNote 12. Income TaxesNote 13. Changes in Accumulated Other Comprehensive Income (loss)Note 14. Fair Value Measurements and Derivative InstrumentsNote 15. Commitments and ContingenciesNote 16. Quarterly Selected Financial Data (unaudited)