READING INTERNATIONAL INC
10-Ks and 10-Qs
|
|
|
|
|
|
|
|
|
|
|
|
|
|
|
|
|
|
|
|
|
|
|
|
|
|
|
|
|
|
|
|
|
|
|
|
|
|
|
|
|
|
|
|
|
|
|
|
|
|
|
|
|
|
|
|
UNITED STATES
SECURITIES AND EXCHANGE COMMISSION
Washington, D.C. 20549
__________________________________
FORM 10-Q
(Mark One)
|
þ
|
QUARTERLY REPORT PURSUANT TO SECTION 13 OR 15(D) OF THE SECURITIES EXCHANGE ACT OF 1934
|
For the quarterly period ended: June 30, 2010
OR
|
¨
|
TRANSITION REPORT PURSUANT TO SECTION 13 OR 15(D) OF THE SECURITIES EXCHANGE ACT OF 1934
|
For the transition period from _____________ to ___________
Commission file number 1-8625
READING INTERNATIONAL, INC.
(Exact name of Registrant as specified in its charter)
|
NEVADA
(State or other jurisdiction of incorporation or organization)
|
95-3885184
(IRS Employer Identification No.)
|
|
500 Citadel Drive, Suite 300
Commerce, CA
(Address of principal executive offices)
|
90040
(Zip Code)
|
Registrant’s telephone number, including area code: (213) 235-2240
Indicate by check mark whether the registrant: (1) has filed all reports required to be filed by Section 13 or 15(d) of the Securities Exchange Act of 1934 during the preceding twelve months (or for such shorter period that the registrant was required to file such reports), and (2) has been subject to such filing requirements for the past 90 days. Yes
þ
No
¨
Indicate by check mark whether the registrant is a large accelerated filer, an accelerated filer, or a non-accelerated filer. See definition of “accelerated filer and large accelerated filer” in Rule 12b-2 of the Exchange Act. (Check one): Large accelerated filer
¨
Accelerated filer
þ
Non-accelerated filer
¨
Indicate by check mark whether the registrant is a shell company (as defined in Rule 12b-2 of the Exchange Act). Yes
¨
No
þ
Indicate the number of shares outstanding of each of the issuer’s classes of common stock, as of the latest practicable date. As of August 4, 2010, there were 21,308,823 shares of Class A Nonvoting Common stock, $0.01 par value per share and 1,495,490 shares of Class B Voting Common Stock, $0.01 par value per share outstanding.
READIN
G INTERNATIONAL, INC. AND SUBSIDIARIES
TABLE OF CONTENTS
Page
|
|
|
Reading International, Inc. and Subsidiaries
(U.S. dollars in thousands)
|
June 30,
2010
|
December 31, 2009
|
|||||||
|
ASSETS
|
||||||||
|
Current Assets:
|
||||||||
|
Cash and cash equivalents
|
$ | 26,495 | $ | 24,612 | ||||
|
Receivables
|
6,449 | 9,458 | ||||||
|
Inventory
|
762 | 860 | ||||||
|
Investment in marketable securities
|
2,730 | 3,120 | ||||||
|
Restricted cash
|
1,728 | 321 | ||||||
|
Land held for sale
|
44,129 | -- | ||||||
|
Prepaid and other current assets
|
2,860 | 3,078 | ||||||
|
Total current assets
|
85,153 | 41,449 | ||||||
|
Property held for and under development
|
31,833 | 78,676 | ||||||
|
Property & equipment, net
|
194,276 | 200,749 | ||||||
|
Investment in unconsolidated joint ventures and entities
|
8,980 | 9,732 | ||||||
|
Investment in Reading International Trust I
|
838 | 838 | ||||||
|
Goodwill
|
32,370 | 37,411 | ||||||
|
Intangible assets, net
|
21,336 | 22,655 | ||||||
|
Other assets
|
14,115 | 14,907 | ||||||
|
Total assets
|
$ | 388,901 | $ | 406,417 | ||||
|
LIABILITIES AND STOCKHOLDERS' EQUITY
|
||||||||
|
Current Liabilities:
|
||||||||
|
Accounts payable and accrued liabilities
|
$ | 13,304 | $ | 14,943 | ||||
|
Film rent payable
|
6,232 | 7,256 | ||||||
|
Notes payable – current portion
|
90,418 | 7,914 | ||||||
|
Note payable to related party – current portion
|
-- | 14,000 | ||||||
|
Taxes payable
|
23,851 | 6,140 | ||||||
|
Deferred current revenue
|
6,125 | 6,968 | ||||||
|
Other current liabilities
|
177 | 457 | ||||||
|
Total current liabilities
|
140,107 | 57,678 | ||||||
|
Notes payable – long-term portion
|
91,347 | 177,166 | ||||||
|
Note payable to related party – long-term portion
|
9,000 | -- | ||||||
|
Subordinated debt
|
27,913 | 27,913 | ||||||
|
Noncurrent tax liabilities
|
2,044 | 6,968 | ||||||
|
Deferred non-current revenue
|
102 | 577 | ||||||
|
Other liabilities
|
31,121 | 25,852 | ||||||
|
Total liabilities
|
301,634 | 296,154 | ||||||
|
Commitments and contingencies (Note 19)
|
||||||||
|
Stockholders’ equity:
|
||||||||
|
Class A Nonvoting Common Stock, par value $0.01, 100,000,000 shares authorized, 35,789,473 issued and 21,308,823 outstanding at June 30, 2010 and 35,610,857 issued and 21,132,582 outstanding at December 31, 2009
|
216 | 215 | ||||||
|
Class B Voting Common Stock, par value $0.01, 20,000,000 shares authorized and 1,495,490 issued and outstanding at June 30, 2010 and at December 31, 2009
|
15 | 15 | ||||||
|
Nonvoting preferred stock, par value $0.01, 12,000 shares authorized and no issued or outstanding shares at June 30, 2010 and at December 31, 2009
|
-- | -- | ||||||
|
Additional paid-in capital
|
133,440 | 134,044 | ||||||
|
Accumulated deficit
|
(76,746 | ) | (63,385 | ) | ||||
|
Treasury shares
|
(3,765 | ) | (3,514 | ) | ||||
|
Accumulated other comprehensive income
|
33,023 | 41,514 | ||||||
|
Total Reading International, Inc. stockholders’ equity
|
86,183 | 108,889 | ||||||
|
Noncontrolling interests
|
1,084 | 1,374 | ||||||
|
Total stockholders’ equity
|
87,267 | 110,263 | ||||||
|
Total liabilities and stockholders’ equity
|
$ | 388,901 | $ | 406,417 | ||||
See accompanying notes to unaudited condensed consolidated financial statements.
Reading International
, Inc. and Subsidiaries
(U.S. dollars in thousands, except per share amounts)
|
Three Months Ended
June 30,
|
Six Months Ended
June 30,
|
|||||||||||||||
|
2010
|
2009
|
2010
|
2009
|
|||||||||||||
|
Revenue
|
||||||||||||||||
|
Cinema
|
$ | 52,433 | $ | 51,215 | $ | 106,279 | $ | 94,651 | ||||||||
|
Real estate
|
4,599 | 3,207 | 8,902 | 6,849 | ||||||||||||
| 57,032 | 54,422 | 115,181 | 101,500 | |||||||||||||
|
Operating expense
|
||||||||||||||||
|
Cinema
|
41,867 | 40,143 | 85,162 | 75,249 | ||||||||||||
|
Real estate
|
2,224 | 1,632 | 4,491 | 3,439 | ||||||||||||
|
Depreciation and amortization
|
3,865 | 3,324 | 7,768 | 7,168 | ||||||||||||
|
Loss on transfer of real estate held for sale to continuing operations
|
-- | 549 | -- | 549 | ||||||||||||
|
Impairment expense
|
2,239 | -- | 2,239 | -- | ||||||||||||
|
General and administrative
|
4,616 | 4,233 | 8,822 | 8,668 | ||||||||||||
| 54,811 | 49,881 | 108,482 | 95,073 | |||||||||||||
|
Operating income
|
2,221 | 4,541 | 6,699 | 6,427 | ||||||||||||
|
Interest income
|
364 | 219 | 646 | 737 | ||||||||||||
|
Interest expense
|
(4,431 | ) | (3,090 | ) | (7,810 | ) | (7,998 | ) | ||||||||
|
Gain on retirement of subordinated debt (trust preferred securities)
|
-- | 10,714 | -- | 10,714 | ||||||||||||
|
Gain on sale of assets
|
351 | -- | 351 | -- | ||||||||||||
|
Other income (expense), net
|
(131 | ) | (1,921 | ) | (713 | ) | (2,716 | ) | ||||||||
|
Income (loss) before income tax expense and equity earnings of unconsolidated joint ventures and entities
|
(1,626 | ) | 10,463 | (827 | ) | 7,164 | ||||||||||
|
Income tax expense
|
(12,201 | ) | (647 | ) | (12,783 | ) | (999 | ) | ||||||||
|
Income (loss) before equity earnings of unconsolidated joint ventures and entities
|
(13,827 | ) | 9,816 | (13,610 | ) | 6,165 | ||||||||||
|
Equity earnings of unconsolidated joint ventures and entities
|
266 | 164 | 617 | 659 | ||||||||||||
|
Net income (loss)
|
$ | (13,561 | ) | $ | 9,980 | $ | (12,993 | ) | $ | 6,824 | ||||||
|
Net income attributable to noncontrolling interest
|
(153 | ) | (90 | ) | (368 | ) | (328 | ) | ||||||||
|
Net income (loss) attributable to Reading International, Inc. common shareholders
|
$ | (13,714 | ) | $ | 9,890 | $ | (13,361 | ) | $ | 6,496 | ||||||
|
Basic and diluted earnings (loss) per share attributable to Reading International, Inc. common shareholders
|
$ | (0.60 | ) | $ | 0.44 | $ | (0.59 | ) | $ | 0.29 | ||||||
|
Weighted average number of shares outstanding – basic
|
22,797,534 | 22,653,050 | 22,754,599 | 22,616,193 | ||||||||||||
|
Weighted average number of shares outstanding – dilutive
|
22,797,534 | 22,687,273 | 22,754,599 | 22,650,415 | ||||||||||||
See accompanying notes to unaudited condensed consolidated financial statements.
Readin
g International, Inc. and Subsidiaries
(U.S. dollars in thousands)
|
Six Months Ended
|
||||||||
|
June 30,
|
||||||||
|
2010
|
2009
|
|||||||
|
Operating Activities
|
||||||||
|
Net income (loss)
|
$ | (12,993 | ) | $ | 6,824 | |||
|
Adjustments to reconcile net income (loss) to net cash provided by operating activities:
|
||||||||
|
Loss recognized on foreign currency transactions
|
14 | 2,248 | ||||||
|
Equity earnings of unconsolidated joint ventures and entities
|
(617 | ) | (659 | ) | ||||
|
Distributions of earnings from unconsolidated joint ventures and entities
|
616 | 412 | ||||||
|
Loss provision on impairment of asset
|
2,239 | -- | ||||||
|
Other-than-temporary loss on marketable securities
|
-- | 2,093 | ||||||
|
Gain on retirement of subordinated debt (trust preferred securities)
|
-- | (10,714 | ) | |||||
|
Gain on option termination
|
-- | (1,530 | ) | |||||
|
Loss on transfer of real estate held for sale to continuing operations
|
-- | 549 | ||||||
|
Gain on sale of assets
|
(351 | ) | -- | |||||
|
Depreciation and amortization
|
7,768 | 7,168 | ||||||
|
Amortization of prior service costs
|
152 | 142 | ||||||
|
Amortization of above and below market leases
|
480 | 431 | ||||||
|
Amortization of deferred financing costs
|
333 | 417 | ||||||
|
Amortization of straight-line rent
|
318 | 721 | ||||||
|
Stock based compensation expense
|
26 | 331 | ||||||
|
Changes in operating assets and liabilities:
|
||||||||
|
Decrease in receivables
|
2,786 | 1,416 | ||||||
|
(Increase) decrease in prepaid and other assets
|
382 | (670 | ) | |||||
|
Decrease in accounts payable and accrued expenses
|
(1,290 | ) | (1,264 | ) | ||||
|
Decrease in film rent payable
|
(859 | ) | (1,234 | ) | ||||
|
Increase taxes payable
|
12,797 | 159 | ||||||
|
Decrease in deferred revenues and other liabilities
|
(1,117 | ) | (654 | ) | ||||
|
Net cash provided by operating activities
|
10,684 | 6,186 | ||||||
|
Investing activities
|
||||||||
|
Acquisitions
|
(2,891 | ) | -- | |||||
|
Acquisition deposits paid
|
(223 | ) | (147 | ) | ||||
|
Purchases of and additions to property and equipment
|
(4,353 | ) | (3,043 | ) | ||||
|
Change in restricted cash
|
(1,477 | ) | 801 | |||||
|
Purchase of marketable securities
|
-- | (11,463 | ) | |||||
|
Sale of marketable securities
|
29 | -- | ||||||
|
Distributions of investment in unconsolidated joint ventures and entities
|
259 | 1,277 | ||||||
|
Option proceeds
|
-- | 284 | ||||||
|
Net cash used in investing activities
|
(8,656 | ) | (12,291 | ) | ||||
|
Financing activities
|
||||||||
|
Repayment of long-term borrowings
|
(13,811 | ) | (5,468 | ) | ||||
|
Proceeds from borrowings
|
15,525 | 1,453 | ||||||
|
Repurchase of Class A Nonvoting Common Stock
|
(251 | ) | -- | |||||
|
Proceeds from the exercise of stock options
|
248 | -- | ||||||
|
Noncontrolling interest contributions
|
113 | 50 | ||||||
|
Noncontrolling interest distributions
|
(751 | ) | (489 | ) | ||||
|
Net cash provided by (used in) financing activities
|
1,073 | (4,454 | ) | |||||
|
Effect of exchange rate changes on cash and cash equivalents
|
(1,218 | ) | 884 | |||||
|
Increase (decrease) in cash and cash equivalents
|
1,883 | (9,675 | ) | |||||
|
Cash and cash equivalents at beginning of period
|
24,612 | 30,874 | ||||||
|
Cash and cash equivalents at end of period
|
$ | 26,495 | $ | 21,199 | ||||
|
Supplemental Disclosures
|
||||||||
|
Interest paid
|
$ | 6,963 | $ | 7,753 | ||||
|
Income taxes paid
|
$ | 469 | $ | 254 | ||||
|
Non-cash transactions
|
||||||||
|
Reduction in note payable associated with acquisition purchase price adjustment
|
$ | 4,381 | $ | 226 | ||||
|
Deemed distribution
|
$ | 877 | $ | -- | ||||
|
Capital lease asset addition
|
$ | 4,697 | $ | -- | ||||
|
Capital lease obligation
|
$ | 5,573 | $ | -- | ||||
|
Exchange of marketable securities for Reading International Trust I securities
|
$ | -- | $ | (11,463 | ) | |||
|
Retirement of subordinated debt (trust preferred securities)
|
$ | -- | $ | (23,634 | ) | |||
|
Retirement of Reading International Trust I securities
|
$ | -- | $ | 11,463 | ||||
|
Retirement of investment in Reading International Trust I securities
|
$ | -- | $ | 709 | ||||
See accompanying notes to unaudited condensed consolidated financial statements.
Readi
ng International, Inc. and Subsidiaries
Notes to Condensed Consolidated Financial Statements (Unaudited)
For the Six Months Ended June 30, 2010
Reading International, Inc., a Nevada corporation (“RDI” and collectively with our consolidated subsidiaries and corporate predecessors, the “Company,” “Reading” and “we,” “us,” or “our”), was founded in 1983 as a Delaware corporation and reincorporated in 1999 in Nevada. Our businesses consist primarily of:
|
·
|
the development, ownership and operation of multiplex cinemas in the United States, Australia, and New Zealand; and
|
|
·
|
the development, ownership, and operation of retail and commercial real estate in Australia, New Zealand, and the United States.
|
The accompanying unaudited condensed consolidated financial statements were prepared in accordance with accounting principles generally accepted in the United States of America (“US GAAP”) for interim reporting and with the instructions to Form 10-Q and Rule 10-01 of Regulation S-X of the Securities and Exchange Commission (“SEC”) for interim reporting. As such, certain information and disclosures typically required by US GAAP for complete financial statements have been condensed or omitted. The financial information presented in this quarterly report on Form 10-Q for the period ended June 30, 2010 (the “June Report”) should be read in conjunction with our 2009 Annual Report which contains the latest audited financial statements and related notes. The periods presented in this document are the three (“2010 Quarter”) and six (“2010 Six Months”) months ended June 30, 2010 and the three (“2009 Quarter”) and six (“2009 Six Months”) months ended June 30, 2009.
In the opinion of management, all adjustments of a normal recurring nature considered necessary to present fairly in all material respects our financial position, results of our operations, and cash flows as of and for the three and six months ended June 30, 2010 and 2009 have been made. The results of operations for the three and six months ended June 30, 2010 and 2009 are not necessarily indicative of the results of operations to be expected for the entire year.
Marketable Securities
We had investments in marketable securities of $2.7 million and $3.1 million at June 30, 2010 and December 31, 2009, respectively. We account for these investments as available for sale investments. We assess our investment in marketable securities for other-than-temporary impairments in accordance with Accounting Standards Codification (“ASC”) 320-10 for each applicable reporting period. During the three and six months ended June 30, 2010, we did not record any other-than-temporary losses related to our marketable securities, whereas, during the three and six months ended June 30, 2009, we recorded losses of $1.3 million and $2.1 million on certain marketable securities. Additionally, these investments have a cumulative unrealized gain (temporary) of $265,000 included in accumulated other comprehensive income at June 30, 2010. For the three months and six months ended June 30, 2010, our net unrealized loss (temporary) on marketable securities was $474,000 and $256,000, respectively. For the three and six months ended June 30, 2009, our net unrealized gain (temporary) on marketable securities was $3,000 and $1,000, respectively.
Expiring Long-Term Debt
As indicated in our 2009 Annual Report, the term of our Australia Corporate Credit Facility matures on June 30, 2011. Accordingly, the outstanding balance of this debt is classified as current on our June 30, 2010 balance sheet. The Australia Corporate Credit Facility is secured by the majority of our theater and entertainment-themed retail center (“ETRC”) properties in Australia. We are currently in the process of renegotiating this facility with our current lender while also seeking a replacement facility with other lenders. While no assurances can be given that we will be successful, we currently anticipate that the current facility will either be extended or replaced prior to maturity.
Other Income/Loss
For the 2010 Quarter, we recorded an other loss of $131,000 compared to $1.9 million for the 2009 Quarter. For the 2010 Quarter, the $131,000 other loss included offsetting settlements related to our Burstone litigation and the 2008 sale of our interest in the Botany Downs cinema. For the 2009 Quarter, the $1.9 million other loss included a $2.2 million loss on foreign currency translation, a $1.3 million other-than-temporary loss on marketable securities, offset by a $1.5 million gain on the expiration of an option to purchase granted with respect to our Auburn property.
For the 2010 Six Months, we recorded an other loss of $713,000 compared to $2.7 million for the 2009 Six Months. For the 2010 Six Months, the $713,000 other loss included offsetting settlements related to our Burstone litigation and the 2008 sale of our interest in the Botany Downs cinema and a $605,000 of loss associated our Mackie litigation. For the 2009 Six Months, the $2.7 million other loss included a $2.2 million loss on foreign currency translation, a $2.0 million other-than-temporary loss on marketable securities, offset by a $1.5 million gain on the expiration of an option to purchase granted with respect to our Auburn property.
Deferred Leasing Costs
We amortize direct costs incurred in connection with obtaining tenants over the respective term of the lease on a straight-line basis.
Deferred Financing Costs
We amortize direct costs incurred in connection with obtaining financing over the term of the loan using the effective interest method, or the straight-line method, if the result is not materially different. In addition, interest on loans with increasing interest rates and scheduled principal pre-payments, is also recognized using the effective interest method.
Accounting Pronouncements Adopted During 2010
FASB ASU 2009-17 – Reporting on Variable Interest Entities
In December 2009, the Financial Accounting Standards Board (FASB) issued Accounting Standards Update (“ASU”) 2009-17, “Consolidations (Topic 810): Improvements to Financial Reporting by Enterprises Involved with Variable Interest Entities.” This ASU incorporates Statement of Financial Accounting Standards (SFAS) No. 167, “Amendments to FASB Interpretation No. 46(R),” issued by the FASB in June 2009. The amendments in this ASU replace the quantitative-based risks and rewards calculation for determining which reporting entity, if any, has a controlling financial interest in a variable interest entity with an approach focused on identifying which reporting entity has the power to direct the activities of a variable interest entity that most significantly impact such entity’s economic performance and (i) the obligation to absorb losses of such entity or (ii) the right to receive benefits from such entity. ASU 2009-17 also requires additional disclosures about a reporting entity’s involvement in variable interest entities, which enhances the information provided to users of financial statements. We adopted ASU 2009-17 effective January 1, 2010. As a result of the fact that we have no variable interests in variable interest entities, the adoption of this ASU did not have a material impact on our financial position or results of operations.
FASB ASU 2010-06 – Fair Value Measurements
In January 2010, the FASB issued ASU 2010-06 to the Fair Value Measurements and Disclosure topic of the Accounting Standards Codification. The ASU clarifies disclosure requirements relating to the level of disaggregation of disclosures relating to classes of assets and liabilities and disclosures about inputs and valuation techniques used to measure fair value for both recurring and nonrecurring fair value estimates for Level 2 or Level 3 assets and liabilities. These requirements of the ASU are effective for interim and annual disclosures for interim and annual reporting periods beginning after December 15, 2009. The adoption of these requirements of the ASU resulted in the disclosure by the Company of the inputs and valuation techniques used in preparing the nonrecurring fair value measurement of an impaired property for purpose of presentation in the Company's financial statements.
New Accounting Pronouncements
FASB ASU 2010-06 – Fair Value Measurements
The ASU also requires additional disclosures about the transfers of classifications among the fair value classification levels and the reasons for those changes and separate presentation of purchases, sales, issuances, and settlements in the presentation of the roll forward of Level 3 assets and liabilities. Those disclosures are effective for interim and annual reporting periods for fiscal years beginning after December 15, 2010. The adoption of this portion of the ASU is not expected to have a material effect on the Company's financial statements.
There were no other new accounting pronouncements issued during the 2010 Quarter that will have a material impact on our financial statements.
Equity Compensation
Landplan Property Partners, Pty Ltd
On April 1, 2010, we terminated our then existing contractual relationship with Doug Osborne, at that time the chief executive officer of our Landplan real estate operations. Mr. Osborne’s incentive interest in our various Landplan projects was valued at $0 and closed out at that time. Mr. Osborne continues to provide services to us on a non-exclusive independent contractor basis. As consideration for his future services on our behalf with respect to our Manukau properties, we have agreed to pay Mr. Osborne an amount equal to 7.5% of the net profit realized, if any, from our investment in these properties. Profits are to be measured based on our total investment, without taking into account amortization or depreciation, and capitalizing all costs related to the carrying, development, and/or disposition of the properties. Based on our total investment to date in these properties (measured as stated in the immediately preceding sentence), we do not currently anticipate a profit from these properties, and, as a result, we have booked no expense in the three or six months ended June 30, 2010 with respect to Mr. Osborne’s consulting services with respect to our Manukau properties. During the three and six months ended June 30, 2009, we expensed $5,000 and $55,000 associated with Mr. Osborne’s previous, contractual interest in the properties associated with Landplan Property Partners, Pty Ltd.
Stock Based Compensation
For the three and six months ended June 30, 2010, we recorded compensation expense of $0, and $4,000, respectively, and, for the three and six months ended June 30, 2009, we recorded compensation expense of $56,000, and $113,000, respectively, related to the vesting of all our restricted stock grants. During the six months ended June 30, 2010, we issued 143,462 of Class A Nonvoting Shares to an executive employee associated with his prior years’ stock bonuses. For the three and six months, ended June 30, 2010, no restricted stock grants were made to our employees.
Employee/Director Stock Option Plan
We have a long-term incentive stock option plan that provides for the grant to eligible employees, directors, and consultants of incentive or nonstatutory options to purchase shares of our Class A Nonvoting Common Stock.
Our 1999 Stock Option Plan expired in November 2009, and has been replaced by our new 2010 Stock Incentive Plan, which was approved by the holders of our Class B Voting Common Stock in May 2010.
When the Company’s tax deduction from an option exercise exceeds the compensation cost resulting from the option, a tax benefit is created. FASB ASC 718-40 relating to Stock-Based Compensation (“FASB ASC 718-40”), requires that excess tax benefits related to stock option exercises be reflected as financing cash inflows instead of operating cash inflows. For the three months ended June 30, 2010 and 2009, there was no impact to the unaudited condensed consolidated statement of cash flows because there were no recognized tax benefits from stock option exercises during these periods.
FASB ASC 718-40 requires companies to estimate forfeitures. Based on our historical experience and the relative market price to strike price of the options, we do not currently estimate any forfeitures of vested or unvested options.
In accordance with FASB ASC 718-40, we estimate the fair value of our options using the Black-Scholes option-pricing model, which takes into account assumptions such as the dividend yield, the risk-free interest rate, the expected stock price volatility, and the expected life of the options. We exclude the dividend yield from the calculation, as we intend to retain all earnings. We expense the estimated grant date fair values of options issued on a straight-line basis over the vesting period.
We granted no options in the three or six months ended June 30, 2010 or 2009.
Based on prior year’s assumptions and in accordance with the FASB ASC 718-40 modified prospective method, we recorded compensation expense for the total estimated grant date fair value of stock options that vested of $8,000 and $22,000 for the three and six months ended June 30, 2010, respectively, and $58,000 and $218,000 for the three and six months ended June 30, 2009, respectively. At June 30, 2010, the total unrecognized estimated compensation cost related to non-vested stock options granted was $72,000, which we expect to recognize over a weighted average vesting period of 1.58 years. 60,000 and 90,000 options were exercised during the three and six months ended June 30, 2010 having a realized value of $91,000 and $138,000, respectively, for which we received $166,000 and $248,000, respectively, of cash. The grant date fair value of options vesting during the three and six months ended June 30, 2010 was $8,000 and $22,000, respectfully, and $58,000 and $218,000 for the three and six months ended June 30, 2009, respectively. The intrinsic, unrealized value of all options outstanding, vested and expected to vest, at June 30, 2010 was $74,000 of which 100% are currently exercisable.
Pursuant to both our 1999 Stock Option Plan and our 2010 Stock Incentive Plan, all stock options expire within ten years of their grant date. The aggregate total number of shares of Class A Nonvoting Common Stock authorized for issuance under our 2010 Stock Incentive Plan is 1,250,000. At the discretion of our Compensation and Stock Options Committee, the vesting period of stock options is usually between zero and four years.
We had the following stock options outstanding and exercisable as of June 30, 2010 and December 31, 2009:
|
Common Stock Options Outstanding
|
Weighted Average Exercise
Price of Options Outstanding
|
Common Stock Exercisable
Options
|
Weighted Average
Price of Exercisable
Options
|
|||||||||||||||||||||||||||||
|
Class A
|
Class B
|
Class A
|
Class B
|
Class A
|
Class B
|
Class A
|
Class B
|
|||||||||||||||||||||||||
|
Outstanding- January 1, 2009
|
577,850 | 185,100 | $ | 5.60 | $ | 9.90 | 525,350 | 110,100 | $ | 5.19 | $ | 9.67 | ||||||||||||||||||||
|
Granted
|
50,000 | -- | $ | 4.01 | $ | -- | ||||||||||||||||||||||||||
|
Exercised
|
(3,000 | ) | -- | $ | 3.80 | $ | -- | |||||||||||||||||||||||||
|
Expired
|
(35,100 | ) | (35,100 | ) | $ | 5.13 | $ | 8.47 | ||||||||||||||||||||||||
|
Outstanding- December 31, 2009
|
589,750 | 150,000 | $ | 5.51 | $ | 10.24 | 534,750 | 150,000 | $ | 5.62 | $ | 10.24 | ||||||||||||||||||||
|
Exercised
|
(90,000 | ) | -- | $ | 2.76 | $ | -- | |||||||||||||||||||||||||
|
Outstanding-June 30, 2010
|
499,750 | 150,000 | $ | 6.00 | $ | 10.24 | 449,750 | 150,000 | $ | 6.22 | $ | 10.24 | ||||||||||||||||||||
The weighted average remaining contractual life of all options outstanding, vested, and expected to vest at June 30, 2010 and December 31, 2009 was approximately 5.22 and 5.05 years, respectively. The weighted average remaining contractual life of the exercisable options outstanding at June 30, 2010 and December 31, 2009 was approximately 4.88 and 4.70 years, respectively.
We organize our operations into two reportable business segments within the meaning of FASB ASC 280-10 -
Segment Reporting
. Our reportable segments are
(1)
cinema exhibition and
(2)
real estate. The cinema exhibition segment is engaged in the development, ownership, and operation of multiplex cinemas. The real estate segment is engaged in the development, ownership, and operation of commercial properties. Incident to our real estate operations we have acquired, and continue to hold, raw land in urban and suburban centers in Australia and New Zealand.
During the six months ended June 30, 2010, we changed our reporting for intercompany property rent where our cinema operations were substantially the only tenant of such property by eliminating the intersegment revenue and expense relating to the intercompany rent, and transferring the third party lease costs from the real estate segment to the cinema segment. This change in management’s structure of the reportable segments commenced on January 1, 2010, such changes to segment reporting are reflected in the segment results for the three and six months ended June 30, 2010 and 2009, respectively. The retroactive presentation for the three and six months ended June 30, 2009 segment results decreased intersegment revenue and expense for the intercompany rent by $1.0 million and $2.2 million, respectively, and transferred the third party lease costs from the real estate segment to the cinema segment. The overall results of these changes decreased real estate segment revenues and expense by $1.0 million and $2.2 million, respectively. This change results in a reduction of real estate operating expense and an increase of cinema operating expense of $1.0 million and $2.2 million, respectively, on our Condensed Consolidated Statements of Operations for the three and six months ended June 30, 2009, respectively.
The tables below summarize the results of operations for each of our principal business segments for the three and six months ended June 30, 2010 and 2009, respectively. Operating expense includes costs associated with the day-to-day operations of the cinemas and the management of rental properties including our live theater assets (dollars in thousands):
|
Three months ended June 30, 2010
|
Cinema Exhibition
|
Real Estate
|
Intersegment Eliminations
|
Total
|
||||||||||||
|
Revenue
|
$ | 52,433 | $ | 6,014 | $ | (1,415 | ) | $ | 57,032 | |||||||
|
Operating expense
|
43,282 | 2,224 | (1,415 | ) | 44,091 | |||||||||||
|
Depreciation & amortization
|
2,555 | 1,118 | -- | 3,673 | ||||||||||||
|
Impairment expense
|
-- | 2,239 | -- | 2,239 | ||||||||||||
|
General & administrative expense
|
634 | 482 | -- | 1,116 | ||||||||||||
|
Segment operating income (loss)
|
$ | 5,962 | $ | (49 | ) | $ | -- | $ | 5,913 | |||||||
|
Three months ended June 30, 2009
|
Cinema Exhibition
|
Real Estate
|
Intersegment Eliminations
|
Total
|
||||||||||||
|
Revenue
|
$ | 51,215 | $ | 4,210 | $ | (1,003 | ) | $ | 54,422 | |||||||
|
Operating expense
|
41,146 | 1,632 | (1,003 | ) | 41,775 | |||||||||||
|
Depreciation & amortization
|
2,576 | 754 | -- | 3,330 | ||||||||||||
|
Loss on transfer of real estate held for sale to continuing operations
|
-- | 549 | -- | 549 | ||||||||||||
|
General & administrative expense
|
765 | 189 | -- | 954 | ||||||||||||
|
Segment operating income
|
$ | 6,728 | $ | 1,086 | $ | -- | $ | 7,814 | ||||||||
|
Reconciliation to net income attributable to Reading International, Inc. shareholders:
|
2010 Quarter
|
2009 Quarter
|
||||||
|
Total segment operating income
|
$ | 5,913 | $ | 7,814 | ||||
|
Non-segment:
|
||||||||
|
Depreciation and amortization expense
|
192 | (6 | ) | |||||
|
General and administrative expense
|
3,500 | 3,279 | ||||||
|
Operating income
|
2,221 | 4,541 | ||||||
|
Interest expense, net
|
(4,067 | ) | (2,871 | ) | ||||
|
Gain on retirement of subordinated debt (trust preferred securities)
|
-- | 10,714 | ||||||
|
Gain on sale of assets
|
351 | -- | ||||||
|
Other loss
|
(131 | ) | (1,921 | ) | ||||
|
Income tax expense
|
(12,201 | ) | (647 | ) | ||||
|
Equity earnings of unconsolidated joint ventures and entities
|
266 | 164 | ||||||
|
Net income (loss)
|
(13,561 | ) | 9,980 | |||||
|
Net income attributable to the noncontrolling interest
|
(153 | ) | (90 | ) | ||||
|
Net income (loss) attributable to Reading International, Inc. common shareholders
|
$ | (13,714 | ) | $ | 9,890 | |||
|
Six months ended June 30, 2010
|
Cinema Exhibition
|
Real Estate
|
Intersegment Eliminations
|
Total
|
||||||||||||
|
Revenue
|
$ | 106,279 | $ | 11,713 | $ | (2,811 | ) | $ | 115,181 | |||||||
|
Operating expense
|
87,973 | 4,491 | (2,811 | ) | 89,653 | |||||||||||
|
Depreciation & amortization
|
5,109 | 2,271 | -- | 7,380 | ||||||||||||
|
Impairment expense
|
-- | 2,239 | -- | 2,239 | ||||||||||||
|
General & administrative expense
|
1,226 | 706 | -- | 1,932 | ||||||||||||
|
Segment operating income
|
$ | 11,971 | $ | 2,006 | $ | -- | $ | 13,977 | ||||||||
|
Six months ended June 30, 2009
|
Cinema Exhibition
|
Real Estate
|
Intersegment Eliminations
|
Total
|
||||||||||||
|
Revenue
|
$ | 94,651 | $ | 9,196 | $ | (2,347 | ) | $ | 101,500 | |||||||
|
Operating expense
|
77,596 | 3,439 | (2,347 | ) | 78,688 | |||||||||||
|
Depreciation & amortization
|
5,485 | 1,435 | -- | 6,920 | ||||||||||||
|
Loss on transfer of real estate held for sale to continuing operations
|
-- | 549 | -- | 549 | ||||||||||||
|
General & administrative expense
|
1,567 | 370 | -- | 1,937 | ||||||||||||
|
Segment operating income
|
$ | 10,003 | $ | 3,403 | $ | -- | $ | 13,406 | ||||||||
|
Reconciliation to net income attributable to Reading International, Inc. shareholders:
|
2010 Six Months
|
2009 Six Months
|
||||||
|
Total segment operating income
|
$ | 13,977 | $ | 13,406 | ||||
|
Non-segment:
|
||||||||
|
Depreciation and amortization expense
|
388 | 248 | ||||||
|
General and administrative expense
|
6,890 | 6,731 | ||||||
|
Operating income
|
6,699 | 6,427 | ||||||
|
Interest expense, net
|
(7,164 | ) | (7,261 | ) | ||||
|
Gain on retirement of subordinated debt (trust preferred securities)
|
-- | 10,714 | ||||||
|
Gain on sale of assets
|
351 | -- | ||||||
|
Other loss
|
(713 | ) | (2,716 | ) | ||||
|
Income tax expense
|
(12,783 | ) | (999 | ) | ||||
|
Equity earnings of unconsolidated joint ventures and entities
|
617 | 659 | ||||||
|
Net income (loss)
|
(12,993 | ) | 6,824 | |||||
|
Net income attributable to the noncontrolling interest
|
(368 | ) | (328 | ) | ||||
|
Net income (loss) attributable to Reading International, Inc. common shareholders
|
$ | (13,361 | ) | $ | 6,496 | |||
We have significant assets in Australia and New Zealand. To the extent possible, we conduct our Australian and New Zealand operations on a self-funding basis. The carrying value of our Australian and New Zealand assets and liabilities fluctuate due to changes in the exchange rates between the US dollar and the functional currency of Australia (Australian dollar) and New Zealand (New Zealand dollar). We have no derivative financial instruments to hedge against the risk of foreign currency exposure.
Presented in the table below are the currency exchange rates for Australia and New Zealand as of June 30, 2010 and December 31, 2009:
|
US Dollar
|
||||||||
|
June 30, 2010
|
December 31, 2009
|
|||||||
|
Australian Dollar
|
$ | 0.8480 | $ | 0.8979 | ||||
|
New Zealand Dollar
|
$ | 0.6901 | $ | 0.7255 | ||||
Basic earnings (loss) per share is computed by dividing the net income (loss) attributable to Reading International, Inc. common shareholders by the weighted average number of common shares outstanding during the period. Diluted earnings (loss) per share is computed by dividing the net income (loss) attributable to Reading International, Inc. common shareholders by the weighted average number of common shares outstanding during the period after giving effect to all potentially dilutive common shares that would have been outstanding if the dilutive common shares had been issued. Stock options and non-vested stock awards give rise to potentially dilutive common shares. In accordance with FASB ASC 260-10 -
Earnings Per Share
,
these shares are included in the diluted earnings per share calculation under the treasury stock method. As noted in the table below, due to the small difference between the basic and diluted weighted average common shares, the basic and the diluted earnings (loss) per share are the same for the 2010 Quarter. The following is a calculation of earnings (loss) per share (dollars in thousands, except share data):
|
Three Months Ended
June 30,
|
Six Months Ended
June 30,
|
|||||||||||||||
|
2010
|
2009
|
2010
|
2009
|
|||||||||||||
|
Net income (loss) attributable to Reading International, Inc. common shareholders
|
$ | (13,714 | ) | $ | 9,890 | $ | (13,361 | ) | $ | 6,496 | ||||||
|
Basic and diluted earnings (loss) per share attributable to Reading International, Inc. common share holders
|
$ | (0.60 | ) | $ | 0.44 | $ | (0.59 | ) | $ | 0.29 | ||||||
|
Weighted average common stock – basic
|
22,797,534 | 22,653,050 | 22,754,599 | 22,616,193 | ||||||||||||
|
Weighted average common stock – dilutive
|
22,797,534 | 22,687,273 | 22,754,599 | 22,650,415 | ||||||||||||
For the three and six months ended June 30, 2010, we recorded losses from continuing operations. As such, we excluded the 25,058 of in-the-money stock options from the computation of diluted loss per share because they were anti-dilutive in those periods. For the three and six months ended June 30, 2009, the weighted average common stock – diluted included 34,222 of in-the-money incremental stock options. In addition, 624,692 of out-of-the-money stock options were excluded from the computation of diluted earnings (loss) per share for the three and six months ended June 30, 2010, and 693,628 of out-of-the-money stock options were excluded from the computation of diluted earnings (loss) per share for the three and six months ended June 30, 2009.
Property Held for Sale – Burwood
In May 2010, we announced our intent to sell and began actively marketing our 50.6-acre Burwood development site in suburban Melbourne. The current carrying value of this property on our books is $44.1 million (AUS$52.0 million) which has been reclassified from property held for development to land held for sale on our June 30, 2010 condensed consolidated balance sheet.
Property Held For and Under Development
As of June 30, 2010 and December 31, 2009, we owned property held for and under development summarized as follows (dollars in thousands):
|
Property Held For and Under Development
|
June 30, 2010
|
December 31,
2009
|
||||||
|
Land
|
$ | 27,400 | $ | 45,629 | ||||
|
Construction-in-progress (including capitalized interest)
|
4,433 | 33,047 | ||||||
|
Property held for and under development
|
$ | 31,833 | $ | 78,676 | ||||
We recorded capitalized interest related to our properties under development for the six months ended June 30, 2009 of $136,000. We have curtailed the development activities of our properties under development and are not currently capitalizing interest expense. Therefore, we did not capitalize any interest during the three or six months ended June 30, 2010.
Property and Equipment
As of June 30, 2010 and December 31, 2009, we owned investments in property and equipment as follows (dollars in thousands):
|
Property and equipment
|
June 30,
2010
|
December 31,
2009
|
||||||
|
Land
|
$ | 59,356 | $ | 61,110 | ||||
|
Building
|
121,606 | 122,784 | ||||||
|
Leasehold interests
|
33,319 | 33,716 | ||||||
|
Construction-in-progress
|
2,458 | 1,807 | ||||||
|
Fixtures and equipment
|
82,272 | 85,235 | ||||||
|
Total cost
|
299,011 | 304,652 | ||||||
|
Less: accumulated depreciation
|
(104,735 | ) | (103,903 | ) | ||||
|
Property and equipment, net
|
$ | 194,276 | $ | 200,749 | ||||
Depreciation expense for property and equipment was $3.4 million and $2.6 million for the three months ended June 30, 2010 and 2009, respectively, and $6.5 million and $5.8 million for the six months ended June 30, 2010 and 2009, respectively.
Our investments in unconsolidated joint ventures and entities are accounted for under the equity method of accounting, and, as of June 30, 2010 and December 31, 2009, included the following (dollars in thousands):
|
Interest
|
June 30,
2010
|
December 31,
2009
|
||||||||||
|
Rialto Distribution
|
33.3 | % | $ | -- | $ | -- | ||||||
|
Rialto Cinemas
|
50.0 | % | 4,168 | 4,475 | ||||||||
|
205-209 East 57
th
Street Associates, LLC
|
25.0 | % | 124 | 207 | ||||||||
|
Mt. Gravatt Cinema
|
33.3 | % | 4,688 | 5,050 | ||||||||
|
Total investments
|
$ | 8,980 | $ | 9,732 | ||||||||
For the three months ended June 30, 2010 and 2009, we recorded our share of equity earnings (loss) from our investments in unconsolidated joint ventures and entities as follows (dollars in thousands):
|
Three Months Ended
June 30,
|
Six Months Ended
June 30,
|
|||||||||||||||
|
2010
|
2009
|
2010
|
2009
|
|||||||||||||
|
Rialto Distribution
|
$ | 35 | $ | (60 | ) | $ | 35 | $ | (150 | ) | ||||||
|
Rialto Cinemas
|
64 | 19 | 85 | 106 | ||||||||||||
|
205-209 East 57
th
Street Associates, LLC
|
-- | -- | -- | 304 | ||||||||||||
|
Mt. Gravatt Cinema
|
167 | 205 | 497 | 399 | ||||||||||||
|
Total equity earnings
|
$ | 266 | $ | 164 | $ | 617 | $ | 659 | ||||||||
205-209 East 57th Street Associates, LLC – Retail Condominium Sale
The remaining retail condominium of our Place 57 joint venture was sold in February 2009 for approximately $4.0 million. Based on the closing statements of the sale, our share of the sale price was approximately $900,000 resulting in earnings to us of $304,000.
On February 10, 2010, we received $83,000 relating to our investment in the Place 57 joint venture representing a return of substantially all of our remaining initial investment.
In accordance with FASB ASC 350-20-35,
Goodwill - Subsequent Measurement and Impairment
, we perform an annual impairment review of our goodwill and other intangible assets on a reporting unit basis, or earlier if changes in circumstances indicate that an asset may be impaired. As of June 30, 2010 and December 31, 2009, we had goodwill consisting of the following (dollars in thousands):
|
Cinema
|
Real Estate
|
Total
|
||||||||||
|
Balance as of December 31, 2009
|
$ | 32,187 | $ | 5,224 | $ | 37,411 | ||||||
|
Change in goodwill due to a purchase price adjustment
|
(4,381 | ) | -- | (4,381 | ) | |||||||
|
Foreign currency translation adjustment
|
(660 | ) | -- | (660 | ) | |||||||
|
Balance at June 30, 2010
|
$ | 27,146 | $ | 5,224 | $ | 32,370 | ||||||
During the first quarter of 2010, Nationwide Theaters Corp. and Reading agreed to reduce the Nationwide Note 1 by $4.4 million pursuant to the original sale and purchase agreement (See Note 11 –
Notes Payable and Subordinated Debt (Trust Preferred Securities)
). The reduction in this note has resulted in an adjustment to the carrying value of the goodwill for $4.4 million.
We have intangible assets other than goodwill that are subject to amortization, which we amortize over various periods. We amortize our beneficial leases over the lease period, the longest of which is 20 years; our trade name using an accelerated amortization method over its estimated useful life of 50 years; and our option fee and other intangible assets over 10 years. For the three months ended June 30, 2010 and 2009, amortization expense totaled $614,000 and $697,000, respectively; and for the six months ended June 30, 2010 and 2009, amortization expense totaled $1.3 million and $1.3 million, respectively.
Intangible assets subject to amortization consist of the following (dollars in thousands):
|
As of June 30, 2010
|
Beneficial Leases
|
Trade name
|
Option Fee
|
Other Intangible Assets
|
Total
|
|||||||||||||||
|
Gross carrying amount
|
$ | 24,014 | $ | 7,220 | $ | 2,773 | $ | 449 | $ | 34,456 | ||||||||||
|
Less: Accumulated amortization
|
7,435 | 2,702 | 2,758 | 225 | 13,120 | |||||||||||||||
|
Total, net
|
$ | 16,579 | $ | 4,518 | $ | 15 | $ | 224 | $ | 21,336 | ||||||||||
|
As of December 31, 2009
|
Beneficial Leases
|
Trade name
|
Option Fee
|
Other Intangible Assets
|
Total
|
|||||||||||||||
|
Gross carrying amount
|
$ | 24,079 | $ | 7,220 | $ | 2,773 | $ | 451 | $ | 34,523 | ||||||||||
|
Less: Accumulated amortization
|
6,924 | 2,051 | 2,710 | 183 | 11,868 | |||||||||||||||
|
Total, net
|
$ | 17,155 | $ | 5,169 | $ | 63 | $ | 268 | $ | 22,655 | ||||||||||
Prepaid and other assets are summarized as follows (dollars in thousands):
|
June 30, 2010
|
December 31,
2009
|
|||||||
|
Prepaid and other current assets
|
||||||||
|
Prepaid expenses
|
$ | 1,176 | $ | 1,333 | ||||
|
Prepaid taxes
|
665 | 686 | ||||||
|
Deposits
|
152 | 146 | ||||||
|
Other
|
867 | 913 | ||||||
|
Total prepaid and other current assets
|
$ | 2,860 | $ | 3,078 | ||||
|
Other non-current assets
|
||||||||
|
Other non-cinema and non-rental real estate assets
|
$ | 1,134 | $ | 1,134 | ||||
|
Long-term deposits
|
212 | 269 | ||||||
|
Deferred financing costs, net
|
3,284 | 3,661 | ||||||
|
Interest rate swap at fair value – non-qualifying hedge
|
356 | 766 | ||||||
|
Other receivables
|
6,750 | 6,750 | ||||||
|
Tenant inducement asset
|
1,678 | 1,135 | ||||||
|
Straight-line rent asset
|
671 | 1,074 | ||||||
|
Other
|
30 | 118 | ||||||
|
Total non-current assets
|
$ | 14,115 | $ | 14,907 | ||||
The provision for income taxes is different from the amount computed by applying U.S. statutory rates to consolidated losses before taxes. The significant reason for these differences is as follows (dollars in thousands):
|
Three Months Ended
June 30,
|
Six Months Ended
June 30,
|
|||||||||||||||
|
2010
|
2009
|
2010
|
2009
|
|||||||||||||
|
Expected tax provision (benefit)
|
$ | (476 | ) | $ | 3,719 | $ | (73 | ) | $ | 2,738 | ||||||
|
Reduction (increase) in taxes resulting from:
|
||||||||||||||||
|
Change in valuation allowance, retirement of trust preferred debt
|
-- | (4,012 | ) | -- | (4,012 | ) | ||||||||||
|
Change in valuation allowance, other
|
413 | 388 | 149 | 1,355 | ||||||||||||
|
Foreign income tax provision
|
147 | 98 | 293 | 156 | ||||||||||||
|
Foreign withholding tax provision
|
66 | 165 | 267 | 321 | ||||||||||||
|
Tax effect of foreign tax rates on current income
|
63 | (95 | ) | (76 | ) | (81 | ) | |||||||||
|
State and local tax provision
|
127 | 257 | 213 | 268 | ||||||||||||
|
Reserve for federal tax litigation
|
11,861 | 127 | 12,010 | 254 | ||||||||||||
|
Actual tax provision
|
$ | 12,201 | $ | 647 | $ | 12,783 | $ | 999 | ||||||||
During the three and six months ended June 30, 2010 the Company’s FASB ASC 740-10-2a liability increased by $11.8 million and $12.0 million, respectively, reflecting the settlement in July 2010 of federal income tax matters under litigation, as more fully described in Note 13 –
Commitments and Contingencies
below.
Pursuant to ASC 740-10, a provision should be made for the tax effect of earnings of foreign subsidiaries that are not permanently invested outside the United States. Our intent is that earnings of our foreign subsidiaries are not permanently invested outside the United States. No current or cumulative earnings were available for distribution in the Reading Australia consolidated group of subsidiaries or in the Puerto Rico subsidiary as of June 30, 2010. The Reading New Zealand consolidated group of subsidiaries generated earnings in the six months ending June 30, 2010, but had no cumulative earnings available for distribution. We have provided $453,000 in foreign withholding taxes connected with foreign retained earnings.
We have accrued $25.9 million in income tax liabilities as of June 30, 2010, of which $23.9 million has been classified as income taxes payable and $2.0 million have been classified as non-current tax liabilities. As part of current tax liabilities, we have accrued $18.1 million in accordance with the cumulative probability approach prescribed by FASB ASC 740-10-25 – Income Taxes - Uncertain Tax Positions in connection with settlement of the IRS litigation matter discussed in Note 13 –
Commitments and Contingencies
below. We believe these amounts represent an adequate provision for our income tax exposures, including income tax contingencies related to foreign withholding taxes described in Note 15 –
Other Liabilities
.
The following table is a summary of the activity related to unrecognized tax benefits, excluding interest and penalties, for the periods ending June 30, 2010, December 31, 2009, and December 31, 2008 (dollars in thousands):
|
Six Months Ended June 30, 2009
|
Year Ended December 31, 2009
|
Year Ended December 31, 2008
|
||||||||||
|
Unrecognized tax benefits – gross beginning balance
|
$ | 11,412 | $ | 11,271 | $ | 11,417 | ||||||
|
Gross increases – prior period tax provisions
|
502 | 92 | -- | |||||||||
|
Gross decreases – prior period tax positions
|
(219 | ) | -- | (146 | ) | |||||||
|
Gross increases – current period tax positions
|
-- | 219 | -- | |||||||||
|
Settlements
|
3,765 | -- | -- | |||||||||
|
Statute of limitations lapse
|
(174 | ) | (170 | ) | -- | |||||||
|
Unrecognized tax benefits – gross ending balance
|
15,286 | 11,412 | 11,271 | |||||||||
We adopted FASB ASC 740-10-25 – Income Taxes - Uncertain Tax Positions (“ASC 740-10-25”) on January 1, 2007. As a result, we recognized a $509,000 cumulative increase to reserves for uncertain tax positions, which was accounted for as an adjustment to the beginning balance of accumulated deficit in 2007. As of that date, we also reclassified approximately $4.0 million in reserves from current taxes liabilities to non-current tax liabilities. Interest and/or penalties related to income tax matters are recorded as part of income tax expense. We had approximately $10.8 million of gross tax benefits and $1.7 million of tax interest unrecognized on the financial statements as of the date of adoption, mostly reflecting operating loss carry forwards and the IRS litigation matter described below. Of the $12.5 million total gross unrecognized tax benefits at January 1, 2007, $4.5 million would affect the effective tax rate if recognized. The remaining balance consists of items that would not affect the effective tax rate due to the existence of the valuation allowance. We recorded an increase to our gross unrecognized tax benefits of approximately $0.6 million and an increase to tax interest of approximately $0.6 million during the period January 1, 2007 to December 31, 2007. Of the $11.3 million gross unrecognized tax benefit at December 31, 2008, $3.1 million would affect the effective rate if recognized. We further recorded a decrease to our gross unrecognized tax benefits of approximately $0.1 million and an increase to tax interest of approximately $0.9 million during the period January 1, 2008 to December 31, 2008, and the total balance at December 31, 2008 was approximately $14.5 million (of which approximately $3.2 million represents interest). We further recorded an increase to our gross unrecognized tax benefits of approximately $0.2 million and an increase to tax interest of approximately $0.6 million during the period January 1, 2009 to December 31, 2009, and the total balance at December 31, 2009 was approximately $15.3 million (of which approximately $3.8 million represents interest). As of June 30, 2010, we recorded an increase to our gross unrecognized tax benefits of $3.8 million and an increase in tax interest of approximately $8.2 million to reflect a proposed agreement to settle the IRS litigation matter described in Note 13. The total balance as of that date was $27.4 million, of which $12.1 million represents interest. Of the $15.3 million gross unrecognized tax benefit at June 30, 2010, $7.1 million would affect the effective tax rate if recognized.
We anticipate that within 12 months following June 30, 2010 our gross unrecognized tax benefits will decrease by approximately $8.2 million, reflecting a reduction in available loss carry forwards related to the IRS litigation matter described in Note 13. Because of valuation allowances, the decrease will not affect the effective tax rate. We also anticipate in that period a tax payment of approximately $5.3 million tax, plus undetermined interest, to satisfy our obligation under the IRS litigation settlement. We expect no other significant change to our gross unrecognized tax benefits caused by settlement of audits or expiration of statutes of limitations.
Notes payable and subordinated debt (trust preferred securities) are summarized as follows (dollars in thousands):
|
Name of Note Payable or Security
|
June 30, 2010
Interest Rate
|
December 31, 2009
Interest Rate
|
Maturity Date
|
June 30, 2010
Balance
|
December 31, 2009
Balance
|
|||||||||||||||
|
Australian Corporate Credit Facility
|
6.22% | 5.58% |
June 30, 2011
|
$ | 85,224 | $ | 90,239 | |||||||||||||
|
Australian Shopping Center Loans
|
-- | -- | 2010-2013 | 636 | 786 | |||||||||||||||
|
New Zealand Corporate Credit Facility
|
4.55% | 4.35% |
March 31, 2012
|
18,288 | 10,882 | |||||||||||||||
|
Trust Preferred Securities
|
9.22% | 9.22% |
April 30, 2027
|
27,913 | 27,913 | |||||||||||||||
|
US Euro-Hypo Loan
|
6.73% | 6.73% |
July 11, 2012
|
15,000 | 15,000 | |||||||||||||||
|
US GE Capital Term Loan
|
6.35% | 6.35% |
February 21, 2013
|
30,975 | 32,700 | |||||||||||||||
|
US Liberty Theaters Term Loans
|
6.20% | 6.20% |
April 1, 2013
|
6,795 | 6,862 | |||||||||||||||
|
US Nationwide Loan 1
|
8.50% | 7.50 - 8.50% |
February 21, 2013
|
15,600 | 20,021 | |||||||||||||||
|
US Nationwide Loan 2
|
8.50% | 8.50% |
February 21, 2011
|
1,763 | 1,693 | |||||||||||||||
|
US Sutton Hill Capital Note 1 – Related Party
|
10.25% | 10.25% | N/A | -- | 5,000 | |||||||||||||||
|
US Sutton Hill Capital Note 2 – Related Party
|
8.25% | 8.25% |
December 31, 2013
|
9,000 | 9,000 | |||||||||||||||
|
US Union Square Term Loan
|
-- | 6.26% | N/A | -- | 6,897 | |||||||||||||||
|
US Union Square Term Loan – Sun Life
|
5.92% | 6.26% |
May 1, 2015
|
7,484 | -- | |||||||||||||||
|
Total
|
$ | 218,678 | $ | 226,993 | ||||||||||||||||
Australia Corporate Credit Facility
As indicated in our 2009 Annual Report, the term of our Australia Corporate Credit Facility matures on June 30, 2011. Accordingly, the outstanding balance of this debt is classified as current on our balance sheet. We are currently in the process of renegotiating this facility with our current lender while also seeking a replacement facility with other lenders. While no assurances can be given that we will be successful, we currently anticipate that the current facility will either be extended or replaced prior to maturity.
Union Square Loan
On April 30, 2010, we refinanced the loan secured by our Union Square property with another lender. The new loan for $7.5 million has a five-year term with a fixed interest rate of 5.92% per annum and an amortization payment schedule of 20 years with a balloon payment of approximately $6.4 million at the end of the loan term.
Sutton Hill Capital Notes 1 & 2
As part of the negotiation of the Village East Lease (see Note 20 – Related Party Transactions), we paid off the Sutton Hill Capital (“SHC”) Note #1 on June 30, 2010 of $5.0 million and renegotiated the SHC Note 2 for $9.0 million. Under the new terms of the SHC Note 2, the loan has a variable annual rate equal to a Five-Year Constant Maturity United States Treasury Note rate plus 575 basis points, subject to a minimum rate of 8.25% and a maximum rate of 10% and an expiration date of December 31, 2013. No other covenants are required for this loan. This loan is unsecured.
Nationwide Note 1
During the first quarter of 2010, Nationwide Theaters Corp. (the Seller’s note above associated with the Consolidated Cinemas acquisition) and Reading agreed to reduce the seller’s note, Nationwide Note 1, by $4.4 million pursuant to the original sale and purchase agreement. This reduction in the note effectively reduces the original purchase price for the Consolidated Cinemas by $4.4 million from $20.0 million to $15.6 million. The reduction in this note has resulted in an adjustment to the carrying value of the goodwill for $4.4 million.
Other liabilities are summarized as follows (dollars in thousands):
|
June 30, 2010
|
December 31, 2009
|
|||||||
|
Current liabilities
|
||||||||
|
Security deposit payable
|
$ | 181 | $ | 143 | ||||
|
Contractual commitment loss
|
-- | 321 | ||||||
|
Other
|
(4 | ) | (7 | ) | ||||
|
Other current liabilities
|
$ | 177 | $ | 457 | ||||
|
Other liabilities
|
||||||||
|
Foreign withholding taxes
|
$ | 5,944 | $ | 5,944 | ||||
|
Straight-line rent liability
|
6,462 | 6,199 | ||||||
|
Capital Lease liability
|
5,573 | -- | ||||||
|
Environmental reserve
|
1,656 | 1,656 | ||||||
|
Accrued pension
|
4,064 | 3,912 | ||||||
|
Interest rate swap – non-qualifying hedge
|
494 | 785 | ||||||
|
Acquired leases
|
3,693 | 4,042 | ||||||
|
Other payable
|
2,603 | 2,603 | ||||||
|
Other
|
632 | 711 | ||||||
|
Other liabilities
|
$ | 31,121 | $ | 25,852 | ||||
Included in our other liabilities are accrued pension costs of $4.1 million. The benefits of our pension plans are fully vested, and, as such, no service costs were recognized for the three and six months ended June 30, 2010 and 2009. Our pension plans are unfunded; therefore, the actuarial assumptions do not include an estimate for expected return on plan assets. For the three and six months ended June 30, 2010, we recognized $75,000 and $152,000, respectively, of interest cost and $76,000 and $152,000, respectively, of amortized prior service cost. For the three and six months ended June 30, 2009, we recognized $65,000 and $134,000, respectively, of interest cost and $71,000 and $142,000, respectively, of amortized prior service cost.
Unconsolidated Debt
Total debt of unconsolidated joint ventures and entities was $932,000 and $979,000 as of June 30, 2010 and December 31, 2009. Our share of unconsolidated debt, based on our ownership percentage, was $310,000 and $326,000 as of June 30, 2010 and December 31, 2009. This loan is guaranteed by one of our subsidiaries to the extent of our ownership percentage.
Litigation Update
IRS Litigation
In July 2010, our subsidiary, Craig Corporation (“Craig”), and the Internal Revenue Service (the “IRS”) agreed to file with the Tax Court a settlement of the IRS’s claim against Craig. In the settlement, the IRS conceded 70% of its proposed adjustment to income claimed in its notices of deficiency dated June 29, 2006. The proposed adjustment had resulted in a claim for unpaid taxes of $20.9 million plus interest. The effect of the terms of settlement on the Reading consolidated group is to require a total federal income tax obligation of $13.4 million, inclusive of interest due for the underpayment of taxes and net of all tax refunds available.
The impact of the settlement upon state taxes on the Reading consolidated group remains uncertain as of June 30, 2010, but if the agreed adjustment to income were reflected on state returns, it would cause a state tax obligation of approximately $4.7 million. Of this, $4.2 million would be related to California, and $0.5 million to other states. Craig’s 1997 tax year remains open with respect to Craig’s potential tax liability to the State of California. As of June 30, 2010, no deficiency has been asserted by the State of California, and we have made no final decision as to the course of action to be followed if a deficiency were to be asserted.
The decision to settle was based on various business considerations, the most prominent of which was the potential size of an adverse judgment (some $68.1 million including interest) and the estimated direct costs of trial.
As a result of this settlement, we recorded an additional federal and state tax expense of $11.8 million for the quarter ended June 30, 2010 to increase our reserve for uncertain tax positions in accordance with FASB ASC 740-10-25 – Income Taxes. As of March 31, 2010, we had a reserve against this uncertain tax position contingency of $6.3 million. As of June 30, 2010, we show the $18.1 million potential impact as current taxes payable.
Mackie Litigation
On November 7, 2005, we were sued in the Supreme Court of Victoria at Melbourne by a former construction contractor with respect to the discontinued development of an ETRC at Frankston, Victoria. The action is entitled Mackie Group Pty Ltd (the “Mackie Group”) v. Reading Properties Pty Ltd, and in it the former contractor seeks payment of a claimed fee in the amount of $848,000 (AUS$1.0 million). That case was tried in March 2010 before a judge, and a decision in favor of Mackie was rendered on April 16, 2010, finding us responsible to pay fees to Mackie in the amount of $848,000 (AUS$1.0 million) plus interest of $448,000 (AUS$528,000). It is also possible that the court will order us to pay a proportion of Mackie Group's costs of the proceeding. We have appealed the Mackie decision. Inclusive of the $555,000 (AUS$655,000) accrued in the six months ended June 30, 2010, we have accrued $1.3 million (AUS$1.5 million) associated with this judgment against us. Pending our appeal, and as agreed by both parties, we have placed $1.3 million (AUS$1.5 million) into a jointly controlled, restricted cash account relating to this judgment.
Noncontrolling interest is composed of the following enterprises:
|
·
|
50% membership interest in Angelika Film Centers LLC (“AFC LLC”) owned by a subsidiary of iDNA, Inc.;
|
|
·
|
25% noncontrolling interest in Australia Country Cinemas Pty Ltd (“ACC”) owned by Panorama Cinemas for the 21
st
Century Pty Ltd.;
|
|
·
|
33% noncontrolling interest in the Elsternwick Joint Venture owned by Champion Pictures Pty Ltd.;
|
|
·
|
15% incentive interest in certain property holding trusts established by LPP or its affiliates (see Note 2); and
|
|
·
|
25% noncontrolling interest in the Sutton Hill Properties, LLC owned by Sutton Hill Capital, L.L.C.
|
The components of noncontrolling interest are as follows (dollars in thousands):
|
June 30, 2010
|
December 31, 2009
|
|||||||
|
AFC LLC
|
$ | 955 | $ | 1,135 | ||||
|
Australian Country Cinemas
|
144 | 255 | ||||||
|
Elsternwick unincorporated joint venture
|
165 | 139 | ||||||
|
Landplan Property Partners
|
-- | -- | ||||||
|
Sutton Hill Properties
|
(180 | ) | (155 | ) | ||||
|
Noncontrolling interests in consolidated subsidiaries
|
$ | 1,084 | $ | 1,374 | ||||
The components of income attributable to noncontrolling interests are as follows (dollars in thousands):
|
Expense for the
|
Expense for the
|
|||||||||||||||
|
Three Months Ended June 30,
|
Six Months Ended June 30,
|
|||||||||||||||
|
2010
|
2009
|
2010
|
2009
|
|||||||||||||
|
AFC LLC
|
$ | 153 | $ | 98 | $ | 345 | $ | 302 | ||||||||
|
Australian Country Cinemas
|
58 | 43 | 118 | 70 | ||||||||||||
|
Elsternwick Unincorporated Joint Venture
|
15 | 6 | 43 | 16 | ||||||||||||
|
Landplan Property Partners
|
-- | 5 | -- | 55 | ||||||||||||
|
Sutton Hill Properties
|
(73 | ) | (62 | ) | (138 | ) | (115 | ) | ||||||||
|
Net income attributable to noncontrolling interest
|
$ | 153 | $ | 90 | $ | 368 | $ | 328 | ||||||||
A summary of the changes in controlling and noncontrolling stockholders’ equity is as follows (dollars in thousands):
|
Reading International, Inc. Stockholders’ Equity
|
Noncontrolling Interests
|
Total Stockholders’ Equity
|
||||||||||
|
Equity at – January 1, 2010
|
$ | 108,889 | $ | 1,374 | $ | 110,263 | ||||||
|
Net income (loss)
|
(13,361 | ) | 368 | (12,993 | ) | |||||||
|
Increase (decrease) in additional paid in capital
|
(604 | ) | 113 | (491 | ) | |||||||
|
Treasury stock purchased
|
(251 | ) | -- | (251 | ) | |||||||
|
Distributions to noncontrolling interests
|
-- | (751 | ) | (751 | ) | |||||||
|
Accumulated other comprehensive income
|
(8,490 | ) | (20 | ) | (8,510 | ) | ||||||
|
Equity at – June 30, 2010
|
$ | 86,183 | $ | 1,084 | $ | 87,267 | ||||||
|
Reading International, Inc. Stockholders’ Equity
|
Noncontrolling Stockholders’ Equity
|
Total Stockholders’ Equity
|
||||||||||
|
Equity at – January 1, 2009
|
$ | 67,630 | $ | 1,817 | $ | 69,447 | ||||||
|
Net income
|
6,496 | 328 | 6,824 | |||||||||
|
Increase in additional paid in capital
|
331 | 50 | 381 | |||||||||
|
Distributions to noncontrolling stockholders
|
-- | (489 | ) | (489 | ) | |||||||
|
Accumulated other comprehensive income
|
17,589 | 78 | 17,667 | |||||||||
|
Equity at – June 30, 2009
|
$ | 92,046 | $ | 1,784 | $ | 93,830 | ||||||
Common Stock Issuance
During the six months ended June 30, 2010, we issued 143,462 of Class A Nonvoting shares to an executive employee associated with his prior years’ stock bonuses.
For the stock options exercised during 2010, we issued for cash to employees of the corporation under our employee stock option plan 90,000 shares of Class A Nonvoting Common Stock at an exercise price of $2.76 per share.
U.S. GAAP requires that the effect of foreign currency translation adjustments and unrealized gains and/or losses on securities that are available-for-sale (“AFS”) be classified as comprehensive income (loss). The following table sets forth our comprehensive income (loss) for the periods indicated (dollars in thousands):
|
Three Months Ended
June 30,
|
Six Months Ended
June 30,
|
|||||||||||||||
|
2010
|
2009
|
2010
|
2009
|
|||||||||||||
|
Net unrealized gains (losses) on investments included in other comprehensive income:
|
||||||||||||||||
|
Reclassification of recognized loss on available for sale investments included in net income
|
$ | -- | $ | 1,346 | $ | -- | $ | 2,093 | ||||||||
|
Unrealized loss on available for sale investments
|
(474 | ) | (1,343 | ) | (256 | ) | (2,092 | ) | ||||||||
|
Net unrealized gains (losses) on investments
|
(474 | ) | 3 | (256 | ) | 1 | ||||||||||
|
Net income (loss)
|
(13,561 | ) | 9,980 | (12,993 | ) | 6,824 | ||||||||||
|
Foreign currency translation gains (losses)
|
(9,434 | ) | 19,796 | (8,407 | ) | 17,446 | ||||||||||
|
Accrued pension
|
76 | 71 | 152 | 142 | ||||||||||||
|
Comprehensive income (loss)
|
(23,393 | ) | 29,850 | (21,504 | ) | 24,413 | ||||||||||
|
Net income attributable to noncontrolling interest
|
(153 | ) | (90 | ) | (368 | ) | (328 | ) | ||||||||
|
Comprehensive income (loss) attributable to noncontrolling interest
|
28 | (79 | ) | 20 | (78 | ) | ||||||||||
|
Comprehensive income (loss) attributable to Reading International, Inc.
|
$ | (23,518 | ) | $ | 29,681 | $ | (21,852 | ) | $ | 24,007 | ||||||
We are exposed to interest rate changes from our outstanding floating rate borrowings. We manage our fixed to floating rate debt mix to mitigate the impact of adverse changes in interest rates on earnings and cash flows and on the market value of our borrowings. From time to time, we may enter into interest rate hedging contracts, which effectively convert a portion of our variable rate debt to a fixed rate over the term of the interest rate swap. In the case of our Australian borrowings, we are presently required to swap no less than 70% of our drawdowns under our Australian Corporate Credit Facility into fixed interest rate obligations. Under our GE Capital Term Loan, we are required to swap no less than 50% of our variable rate drawdowns for the first two years of the loan agreement.
The following table sets forth the terms of our interest rate swap derivative instruments at June 30, 2010:
|
Type of Instrument
|
Notional Amount
|
Pay Fixed Rate
|
Receive Variable Rate
|
Maturity Date
|
|||||||
|
Interest rate swap
|
$ | 32,500,000 | 2.854% | 0.5330% |
April 1, 2011
|
||||||
|
Interest rate swap
|
$ | 40,899,000 | 4.550% | 4.5433% |
December 31, 2011
|
||||||
|
Interest rate cap
|
$ | 22,023,000 | 4.550% | 4.5433% |
December 31, 2011
|
||||||
In accordance with FASB ASC 815-10-35,
Subsequent Valuation of Derivative Instruments and Hedging Instruments
(“FASB ASC 815-10-35”), we marked our interest rate swap instruments to market on the consolidated balance sheet resulting in an increase in interest expense of $342,000 and $119,000 during the three and six months ended June 30, 2010, respectively, and a $1.1 million and $710,000 decrease to interest expense during the three and six months ended June 30, 2009, respectively. At June 30, 2010, we recorded the fair market value of an interest rate swap and a cap of $356,000 as other long-term assets and an interest rate swap of $494,000 as an other long-term liability. At December 31, 2009, we recorded the fair market value of an interest rate swap and a cap of $766,000 as other long-term assets and an interest rate swap of $785,000 as an other long-term liability. In accordance with FASB ASC 815-10-35, we have not designated any of our current interest rate swap positions as financial reporting hedges.
We measure the following items at fair value on a recurring basis subject to the disclosure requirements of FASB ASC 820-20,
Fair Value of Financial Instruments
(dollars in thousands):
|
Book Value
|
Fair Value
|
|||||||||||||||||||
|
Financial Instrument
|
Level
|
June 30,
2010
|
December 31, 2009
|
June 30,
2010
|
December 31, 2009
|
|||||||||||||||
|
Investment in marketable securities
|
1 | $ | 2,730 | $ | 3,120 | $ | 2,730 | $ | 3,120 | |||||||||||
|
Interest rate swap & cap assets
|
2 | $ | 356 | $ | 766 | $ | 356 | $ | 766 | |||||||||||
|
Interest rate swap liability
|
2 | $ | 494 | $ | 785 | $ | 494 | $ | 785 | |||||||||||
ASC 820-10 establishes a fair value hierarchy that prioritizes the inputs to valuation techniques used to measure fair value. The statement requires that assets and liabilities carried at fair value be classified and disclosed in one of the following three categories:
|
·
|
Level 1: Quoted market prices in active markets for identical assets or liabilities.
|
|
·
|
Level 2: Observable market based inputs or unobservable inputs that are corroborated by market data.
|
|
·
|
Level 3: Unobservable inputs that are not corroborated by market data (were not used to value any of our assets requiring recurring measurements of fair value).
|
We used the following methods and assumptions to estimate the fair values of the assets and liabilities:
Level 1 Fair Value Measurements
– are based on market quotes of our marketable securities.
Level 2 Fair Value Measurements
–
Interest Rate Swaps
– The fair value of interest rate swaps and cap are estimated using internal discounted cash flow calculations based upon forward interest rate curves, which are corroborated by market data, and quotes obtained from counterparties to the agreements.
Level 3 Fair Value Measurements
– we do not have any assets or liabilities that fall into this category for assets measured at fair value on a recurring basis.
Impaired Property
- For assets measured on a non-recurring basis, such as real estate assets that are required to be recorded at fair value as a result of an impairment, our estimates of fair value are based on management’s best estimate derived from evaluating market sales data for comparable properties developed by a third party appraiser and arriving at management’s estimate of fair value based on such comparable data primarily based on properties with similar characteristics. The fair value of the Taringa Property was estimated at $1.8 million (AU$2.2 million) for purposes of recording our impairment expense for the three and six months ended June 30, 2010 and was based on level 3 inputs in developing management’s estimate of fair value.
As of June 30, 2010, we held certain items that are required to be measured at fair value on a recurring basis. These included cash equivalents, available for sale securities, and interest rate derivative contracts. Cash equivalents consist of short-term, highly liquid, income-producing investments, all of which have maturities of 90 days or less. Derivative instruments are related to our economic hedge of interest rates. Our available-for-sale securities primarily consist of investments associated with the ownership of marketable securities in Australia.
The fair values of the interest rate swap agreements are determined using the market standard methodology of discounting the future cash payments and cash receipts on the pay and receive legs of the interest swap agreements that have the net effect of swapping the estimated variable rate note payment stream for a fixed rate payment stream over the period of the swap. The variable interest rates used in the calculation of projected receipts on the interest rate swap and cap agreements are based on an expectation of future interest rates derived from observable market interest rate curves and volatilities. To comply with the provisions of ASC 820-10, we incorporate credit valuation adjustments to appropriately reflect both our own nonperformance risk and the respective counterparty's nonperformance risk in the fair value measurements. Although we have determined that the majority of the inputs used to value our derivatives fall within Level 2 of the fair value hierarchy, the credit valuation adjustments associated with our derivatives utilize Level 3 inputs, such as estimates of current credit spreads to evaluate the likelihood of default by our counterparties and us. However, as of June 30, 2010, we have assessed the significance of the impact of the credit valuation adjustments on the overall valuation and determined that the credit valuation adjustments are not significant to the overall valuation of our derivatives. As a result, we have determined that our derivative valuations in their entirety are classified in Level 2 of the fair value hierarchy. The nature of our interest rate swap derivative instruments is described in Note 17 –
Derivative Instruments
.
We have consistently applied these valuation techniques in all periods presented and believe we have obtained the most accurate information available for the types of derivative contracts we hold. Additionally, there were no transfers of assets and liabilities between levels 1, 2, or 3 during the three months ended June 30, 2010.
Financial Instruments Disclosed at Fair Value
The following table sets forth the carrying value and the fair value of our financial assets and liabilities at June 30, 2010 and December 31, 2009 (dollars in thousands):
|
Book Value
|
Fair Value
|
|||||||||||||||
|
Financial Instrument
|
June 30,
2010
|
December 31, 2009
|
June 30,
2010
|
December 31, 2009
|
||||||||||||
|
Notes payable
|
$ | 181,765 | $ | 185,080 | $ | 141,914 | $ | 172,946 | ||||||||
|
Notes payable to related party
|
$ | 9,000 | $ | 14,000 | $ | N/A | $ | N/A | ||||||||
|
Subordinated debt (trust preferred securities)
|
$ | 27,913 | $ | 27,913 | $ | 19,847 | $ | 20,416 | ||||||||
The fair value of notes payable to related party cannot be determined due to the related party nature of the terms of the notes payable.
We estimated the fair value of our secured mortgage notes payable, our unsecured notes payable, trust preferred securities, and other debt instruments by performing discounted cash flow analyses using an appropriate market discount rate. We calculated the market discount rate by obtaining period-end treasury rates for fixed-rate debt, or LIBOR rates for variable-rate debt, for maturities that correspond to the maturities of our debt, adding appropriate credit spreads derived from information obtained from third-party financial institutions. These credit spreads take into account factors such as our credit standing, the maturity of the debt, whether the debt is secured or unsecured, and the loan-to-value ratios of the debt.
Manukau Land Purchase
On April 30, 2009, we entered into an agreement to purchase for $3.6 million (NZ$5.2 million) a property adjacent to our Manukau property. An initial deposit of $26,000 (NZ$50,000) was paid upon signing of the agreement, a second deposit of $175,000 (NZ$258,000) was paid in the second quarter of 2009 and a third deposit of $531,000 (NZ$773,000) was paid in August 2009. The fourth and final purchase payment of $2.9 million (NZ$4.1 million) was made on March 31, 2010 completing our acquisition of this land parcel.
Taringa
During June 2010, we determined that we would no longer pursue the development of our Taringa properties. As such, we recorded an impairment of our investment in these properties by $2.2 million primarily associated with the development costs of the project.
Burwood – Held for Sale
In May 2010, we announced our intent to sell and began actively marketing our 50.6-acre Burwood development site in suburban Melbourne. The current carrying value of this property on our books is $44.1 million (AUS$52.0 million) which was reclassified from property held for development to land held for sale on our June 30, 2010 condensed consolidated balance sheet.
Village East Lease
On June 29, 2010, we agreed to extend our existing lease from Sutton Hill Capital LLC (“SHC”) of the Village East Cinema in New York City by 10 years, with a new termination date of June 30, 2020. The extended lease provides for a call option pursuant to which Reading may purchase the cinema lease for $5.9 million at the end of the lease term. Additionally, the lease has a put option pursuant to which SHC may require Reading to purchase all or a portion of SHC’s interest in the cinema lease at any time between July 1, 2013 and December 4, 2019. SHC’s put option may be exercised on one or more occasions in increments of not less than $100,000 each. As our Chairman, Chief Executive Officer and controlling shareholder, Mr. James J. Cotter is also the managing member of SHC; therefore, RDI and SHC are considered entities under common control. As a result, we recorded the Village East Cinema building as a property asset of $4.7 million on our balance sheet based on the cost carry-over basis from an entity under common control with a corresponding capital lease liability of $5.6 million presented under other liabilities (see Note 12 –
Other Liabilities
). This resulted in a deemed equity distribution of $877,000.
The future minimum lease payments associated with this lease are (dollars in thousands):
|
As of June 30, 2010
|
||||
|
2010
|
$ | 295 | ||
|
2011
|
590 | |||
|
2012
|
590 | |||
|
2013
|
590 | |||
|
2014
|
590 | |||
|
Thereafter
|
9,145 | |||
|
Total future minimum rental income
|
$ | 11,800 | ||
Sutton Hill Capital Notes 1 & 2
During the three months ended June 30, 2010, we paid off the SHC Note #1 and renegotiated the SHC Note #2 [see Note 11 –
Notes Payable and Subordinated Debt (Trust Preferred Securities
)].
IRS Litigation
During July 2010, our wholly owned subsidiary, Craig, and the IRS agreed to file with the Tax Court a stipulation settling the IRS’s claim against Craig. We have accrued $18.1 million for the federal and state tax liabilities for this settlement which resulted in a tax expense for the three and six months ending June 30, 2010 of $11.8 million and $12.0 million, respectively (see Note 13 –
Commitments and Contingencies
).
We are an internationally diversified company principally focused on the development, ownership, and operation of entertainment and real property assets in the United States, Australia, and New Zealand. Currently, we operate in two business segments:
|
·
|
cinema exhibition, through our 58 multiplex cinemas; and
|
|
·
|
real estate, including real estate development and the rental of retail, commercial and live theater assets.
|
We believe that these two business segments can complement one another, as we can use the comparatively consistent cash flows generated by our cinema operations to fund the front-end cash demands of our real estate development business.
We manage our worldwide cinema exhibition businesses under various different brands:
|
·
|
in the US, under the Reading, Angelika Film Center, Consolidated Amusements, and City Cinemas brands;
|
|
·
|
in Australia, under the Reading brand; and
|
|
·
|
in New Zealand, under the Reading and Rialto brands.
|
We believe cinema exhibition to be a business that will likely continue to generate consistent cash flows in the years ahead. We base this on our belief that people will continue to spend some reasonable portion of their entertainment dollar on entertainment outside of the home and that, when compared to other forms of outside the home entertainment, movies continue to be a popular and competitively priced option. During the third quarter of 2009, we leased two existing cinemas in New York City with 3 screens but elected not to renew the lease of our 5-screen cinema in Market City, Australia. Additionally, during May 2010, we elected not to renew the lease of our 4-screen Kapiti cinema in New Zealand. We anticipate that our cinema operations will continue as our main source of cash flow and will support our real estate oriented activities.
In short, while we do have operating company attributes, we see ourselves principally as a hard asset company and intend to add to shareholder value by building the value of our portfolio of tangible assets.
In addition, we may from time to time identify opportunities to expand our existing businesses and asset base, or to otherwise profit, through the acquisition of interests in other publicly traded companies, both in the United States and in the overseas jurisdictions in which we do business. We may also take positions in private companies in addition to our investments in various private cinema joint ventures.
At June 30, 2010, we owned and operated 52 cinemas with 421 screens, had interests in certain unconsolidated joint ventures and entities that own an additional 4 cinemas with 32 screens and managed 2 cinemas with 9 screens. We anticipate opening the following two newly leased cinemas:
|
·
|
one in Newcastle NSW, Australia with 8 screens which we anticipate will open in October 2010; and
|
|
·
|
the Angelika branded cinema in Merrifield, Virginia with 8 screens, which we anticipate will open in late 2011.
|
On July 24, 2009, we signed a lease with the City of Brisbane, Australia to lease our Indooroopilly building to them for an initial three-year period with two three-year options. Although we have curtailed our development activities, we remain opportunistic in our acquisitions of cinema and real estate assets. Our business plan going forward is to continue the build-out of our existing development properties and to seek out additional, profitable real estate development opportunities while continuing to use and judiciously expand our presence in the cinema exhibition by identifying, developing, and acquiring cinema properties when and where appropriate. In addition, we will continue to investigate potential synergistic acquisitions that may not readily fall into either of our two currently identified segments.
We continue to acquire, to dispose of, or to reposition assets in accordance with our business plan. For a description of our acquisitions so far in 2010, see Note 19 –
Acquisitions and Assets Held for Sale
to our June 30, 2010 Condensed Consolidated Financial Statements.
Results of Operations
At June 30, 2010, we owned and operated 52 cinemas with 421 screens, had interests in certain unconsolidated joint ventures and entities that own an additional 4 cinemas with 32 screens and managed 2 cinemas with 9 screens. In real estate during the period, we (i) owned and operated four ETRC’s that we developed in Australia and New Zealand, (ii) owned the fee interests in four developed commercial properties in Manhattan and Chicago improved with live theaters comprising seven stages and ancillary retail and commercial space, (iii) owned the fee interests underlying one of our Manhattan cinemas, and (iv) held for development an additional seven parcels aggregating approximately 78.4 acres located principally in urbanized areas of Australia and New Zealand. One of these parcels held for development, our Moonee Ponds property, comprises approximately 3.4 acres, and is in an area designated by the provincial government of Victoria, Australia as a “principal activity centre.”
Operating expense includes costs associated with the day-to-day operations of the cinemas and the management of rental properties, including our live theater assets. Our year-to-year results of operation were principally impacted by the following:
|
·
|
strong revenue growth from our cinema exhibition segment driven primarily by the availability of good 3D content and our ability to show these films on our newly installed 3D projectors;
|
|
·
|
the fluctuation in the value of the Australian and New Zealand dollars vis-à-vis the US dollar resulting in an increase in results of operations for our foreign operations for 2010 compared to 2009.
|
During the six months ended June 30, 2010, we changed our reporting for intercompany property rent where our cinema operations were substantially the only tenant of such property by eliminating the intersegment revenue and expense relating to the intercompany rent, and transferring the third party lease costs from the real estate segment to the cinema segment. This change in management’s structure of its reportable segments commenced on January 1, 2010, such changes to segment reporting are reflected in the segment results for the three and six months ended June 30, 2010 and 2009, respectively. The retroactive presentation for the three and six months ended June 30, 2009 segment results decreased intersegment revenue and expense for the intercompany rent by $1.0 million and $2.2 million, respectively, and transferred the third party lease costs from the real estate segment to the cinema segment. The overall results of these changes decreased real estate segment revenues and expense by $1.0 million and $2.2 million, respectively. This change results in a reduction of real estate operating expense and an increase of cinema operating expense of $1.0 million and $2.2 million, respectively on our Condensed Consolidated Statements of Operations for the three and six months ended June 30, 2009, respectively.
The tables below summarize the results of operations for each of our principal business segments for the three (“2009 Quarter”) and six (“2009 Six Months”) months ended June 30, 2009 and the three (“2008 Quarter”) and six (“2008 Six Months”) months ended June 30, 2008, respectively (dollars in thousands):
|
Three months ended June 30, 2010
|
Cinema Exhibition
|
Real Estate
|
Intersegment Eliminations
|
Total
|
||||||||||||
|
Revenue
|
$ | 52,433 | $ | 6,014 | $ | (1,415 | ) | $ | 57,032 | |||||||
|
Operating expense
|
43,282 | 2,224 | (1,415 | ) | 44,091 | |||||||||||
|
Depreciation & amortization
|
2,555 | 1,118 | -- | 3,673 | ||||||||||||
|
Impairment expense
|
-- | 2,239 | -- | 2,239 | ||||||||||||
|
General & administrative expense
|
634 | 482 | -- | 1,116 | ||||||||||||
|
Segment operating income (loss)
|
$ | 5,962 | $ | (49 | ) | $ | -- | $ | 5,913 | |||||||
|
Three months ended June 30, 2009
|
Cinema Exhibition
|
Real Estate
|
Intersegment Eliminations
|
Total
|
||||||||||||
|
Revenue
|
$ | 51,215 | $ | 4,210 | $ | (1,003 | ) | $ | 54,422 | |||||||
|
Operating expense
|
41,146 | 1,632 | (1,003 | ) | 41,775 | |||||||||||
|
Depreciation & amortization
|
2,576 | 754 | -- | 3,330 | ||||||||||||
|
Loss on transfer of real estate held for sale to continuing operations
|
-- | 549 | -- | 549 | ||||||||||||
|
General & administrative expense
|
765 | 189 | -- | 954 | ||||||||||||
|
Segment operating income
|
$ | 6,728 | $ | 1,086 | $ | -- | $ | 7,814 | ||||||||
|
Reconciliation to net income attributable to Reading International, Inc. shareholders:
|
2010 Quarter
|
2009 Quarter
|
||||||
|
Total segment operating income
|
$ | 5,913 | $ | 7,814 | ||||
|
Non-segment:
|
||||||||
|
Depreciation and amortization expense
|
192 | (6 | ) | |||||
|
General and administrative expense
|
3,500 | 3,279 | ||||||
|
Operating income
|
2,221 | 4,541 | ||||||
|
Interest expense, net
|
(4,067 | ) | (2,871 | ) | ||||
|
Gain on retirement of subordinated debt (trust preferred securities)
|
-- | 10,714 | ||||||
|
Gain on sale of assets
|
351 | -- | ||||||
|
Other loss
|
(131 | ) | (1,921 | ) | ||||
|
Income tax expense
|
(12,201 | ) | (647 | ) | ||||
|
Equity earnings of unconsolidated joint ventures and entities
|
266 | 164 | ||||||
|
Net income (loss)
|
(13,561 | ) | 9,980 | |||||
|
Net income attributable to the noncontrolling interest
|
(153 | ) | (90 | ) | ||||
|
Net income loss attributable to Reading International, Inc. common shareholders
|
$ | (13,714 | ) | $ | 9,890 | |||
|
Six months ended June 30, 2010
|
Cinema Exhibition
|
Real Estate
|
Intersegment Eliminations
|
Total
|
||||||||||||
|
Revenue
|
$ | 106,279 | $ | 11,713 | $ | (2,811 | ) | $ | 115,181 | |||||||
|
Operating expense
|
87,973 | 4,491 | (2,811 | ) | 89,653 | |||||||||||
|
Depreciation & amortization
|
5,109 | 2,271 | -- | 7,380 | ||||||||||||
|
Impairment expense
|
-- | 2,239 | -- | 2,239 | ||||||||||||
|
General & administrative expense
|
1,226 | 706 | -- | 1,932 | ||||||||||||
|
Segment operating income
|
$ | 11,971 | $ | 2,006 | $ | -- | $ | 13,977 | ||||||||
|
Six months ended June 30, 2009
|
Cinema Exhibition
|
Real Estate
|
Intersegment Eliminations
|
Total
|
||||||||||||
|
Revenue
|
$ | 94,651 | $ | 9,196 | $ | (2,347 | ) | $ | 101,500 | |||||||
|
Operating expense
|
77,596 | 3,439 | (2,347 | ) | 78,688 | |||||||||||
|
Depreciation & amortization
|
5,485 | 1,435 | -- | 6,920 | ||||||||||||
|
Loss on transfer of real estate held for sale to continuing operations
|
-- | 549 | -- | 549 | ||||||||||||
|
General & administrative expense
|
1,567 | 370 | -- | 1,937 | ||||||||||||
|
Segment operating income
|
$ | 10,003 | $ | 3,403 | $ | -- | $ | 13,406 | ||||||||
|
Reconciliation to net income attributable to Reading International, Inc. shareholders:
|
2010 Six Months
|
2009 Six Months
|
||||||
|
Total segment operating income
|
$ | 13,977 | $ | 13,406 | ||||
|
Non-segment:
|
||||||||
|
Depreciation and amortization expense
|
388 | 248 | ||||||
|
General and administrative expense
|
6,890 | 6,731 | ||||||
|
Operating income
|
6,699 | 6,427 | ||||||
|
Interest expense, net
|
(7,164 | ) | (7,261 | ) | ||||
|
Gain on retirement of subordinated debt (trust preferred securities)
|
-- | 10,714 | ||||||
|
Gain on sale of assets
|
351 | -- | ||||||
|
Other loss
|
(713 | ) | (2,716 | ) | ||||
|
Income tax expense
|
(12,783 | ) | (999 | ) | ||||
|
Equity earnings of unconsolidated joint ventures and entities
|
617 | 659 | ||||||
|
Net income (loss)
|
(12,993 | ) | 6,824 | |||||
|
Net income attributable to the noncontrolling interest
|
(368 | ) | (328 | ) | ||||
|
Net income (loss) attributable to Reading International, Inc. common shareholders
|
$ | (13,361 | ) | $ | 6,496 | |||
Cinema Exhibition Segment
Included in the cinema exhibition segment above is revenue and expense from the operations of 52 cinema complexes with 421 screens during the 2010 Quarter and 52 cinema complexes with 427 screens during the 2009 Quarter and management fee income from 2 cinemas with 9 screens in both years. The following tables detail our cinema exhibition segment operating results for the three and six months ended June 30, 2010 and 2009, respectively (dollars in thousands):
|
Three Months Ended June 30, 2010
|
United States
|
Australia
|
New Zealand
|
Total
|
||||||||||||
|
Admissions revenue
|
$ | 18,733 | $ | 14,280 | $ | 3,864 | $ | 36,877 | ||||||||
|
Concessions revenue
|
7,351 | 4,397 | 982 | 12,730 | ||||||||||||
|
Advertising and other revenues
|
1,404 | 1,164 | 258 | 2,826 | ||||||||||||
|
Total revenues
|
27,488 | 19,841 | 5,104 | 52,433 | ||||||||||||
|
Cinema costs
|
22,678 | 14,648 | 3,610 | 40,936 | ||||||||||||
|
Concession costs
|
1,178 | 935 | 233 | 2,346 | ||||||||||||
|
Total operating expense
|
23,856 | 15,583 | 3,843 | 43,282 | ||||||||||||
|
Depreciation and amortization
|
1,618 | 688 | 249 | 2,555 | ||||||||||||
|
General & administrative expense
|
499 | 135 | -- | 634 | ||||||||||||
|
Segment operating income
|
$ | 1,515 | $ | 3,435 | $ | 1,012 | $ | 5,962 | ||||||||
|
Three Months Ended June 30, 2009
|
United States
|
Australia
|
New Zealand
|
Total
|
||||||||||||
|
Admissions revenue
|
$ | 19,468 | $ | 13,246 | $ | 3,351 | $ | 36,065 | ||||||||
|
Concessions revenue
|
7,842 | 4,475 | 937 | 13,254 | ||||||||||||
|
Advertising and other revenues
|
1,141 | 595 | 160 | 1,896 | ||||||||||||
|
Total revenues
|
28,451 | 18,316 | 4,448 | 51,215 | ||||||||||||
|
Cinema costs
|
22,373 | 13,205 | 3,111 | 38,689 | ||||||||||||
|
Concession costs
|
1,254 | 972 | 231 | 2,457 | ||||||||||||
|
Total operating expense
|
23,627 | 14,177 | 3,342 | 41,146 | ||||||||||||
|
Depreciation and amortization
|
1,692 | 619 | 265 | 2,576 | ||||||||||||
|
General & administrative expense
|
596 | 169 | -- | 765 | ||||||||||||
|
Segment operating income
|
$ | 2,536 | $ | 3,351 | $ | 841 | $ | 6,728 | ||||||||
|
·
|
Cinema revenue increased for the 2010 Quarter by $1.2 million or 2.4% compared to the same period in 2009. The 2010 Quarter increase was primarily from our Australia and New Zealand cinema operations, which accounted for $2.2 million of the increase primarily relating to a year over year increase in the value of the Australia and New Zealand dollars compared to the U.S. dollar which was offset in part by lower local currency revenues for our Australia, New Zealand, and U.S. operations during the 2010 Quarter compared to the 2009 Quarter. This increase translated to higher Australian and New Zealand revenues for the 2010 Quarter compared to the 2009 Quarter (see below). Except for this uplift in revenues associated with foreign currency exchange, all of our revenues for the three geographical regions decreased primarily related to better film product in 2009 compared to 2010. In addition, we made certain internal reporting changes to our intersegment revenue recognition between our cinema and real estate segments which resulted in an increase in other cinema revenues of $41,000 in the U.S.
|
|
·
|
Operating expense increased for the 2010 Quarter by $2.1 million or 5.2% compared to the same period in 2009. This increase followed the increased revenues noted above primarily relating to an increase in the value of the Australia and New Zealand dollars compared to the U.S. dollar (see below). For the U.S., we noted higher operating costs primarily related to the newly leased 3D equipment and the associated labor-intensive nature of showing 3D films. Also, as mentioned above, we made certain internal reporting changes to our intersegment cost recognition between our cinema and real estate segments that resulted in a decrease in our cinema expenses of $67,000 in the U.S. Overall, our operating expense as a percent of gross revenue increased from 80.3% to 82.5% from the 2009 Quarter to the 2010 Quarter due primarily to the aforementioned cost increases in the U.S.
|
|
·
|
Depreciation and amortization expense decreased for the 2010 Quarter by $21,000 or 0.8% compared to the same period in 2009 primarily related to the short useful lives of the used assets associated with our Consolidated Entertainment cinemas purchased February 2008.
|
|
·
|
General and administrative costs decreased for the 2010 Quarter by $131,000 or 17.1% compared to the same period in 2009 primarily related to cost cutting measures throughout the segment.
|
|
·
|
For our statement of operations, Australia and New Zealand quarterly average exchange rates have increased by 16.1% and 16.0%, respectively, since the 2009 Quarter, which had an impact on the individual components of our income statement.
|
|
·
|
Because of the above, cinema segment income decreased for the 2010 Quarter by $766,000 compared to the same period in 2009.
|
The following tables detail our cinema segment operating results for the six months ended June 30, 2010 and 2009, respectively (dollars in thousands):
|
Six Months Ended June 30, 2010
|
United States
|
Australia
|
New Zealand
|
Total
|
||||||||||||
|
Admissions revenue
|
$ | 36,913 | $ | 30,604 | $ | 8,372 | $ | 75,889 | ||||||||
|
Concessions revenue
|
14,024 | 9,085 | 2,021 | 25,130 | ||||||||||||
|
Advertising and other revenues
|
2,551 | 2,222 | 487 | 5,260 | ||||||||||||
|
Total revenues
|
53,488 | 41,911 | 10,880 | 106,279 | ||||||||||||
|
Cinema costs
|
44,672 | 30,714 | 7,950 | 83,336 | ||||||||||||
|
Concession costs
|
2,185 | 1,975 | 477 | 4,637 | ||||||||||||
|
Total operating expense
|
46,857 | 32,689 | 8,427 | 87,973 | ||||||||||||
|
Depreciation and amortization
|
3,205 | 1,395 | 509 | 5,109 | ||||||||||||
|
General & administrative expense
|
945 | 281 | -- | 1,226 | ||||||||||||
|
Segment operating income
|
$ | 2,481 | $ | 7,546 | $ | 1,944 | $ | 11,971 | ||||||||
|
Six Months Ended June 30, 2009
|
United States
|
Australia
|
New Zealand
|
Total
|
||||||||||||
|
Admissions revenue
|
$ | 37,323 | $ | 23,644 | $ | 5,865 | $ | 66,832 | ||||||||
|
Concessions revenue
|
14,791 | 7,820 | 1,622 | 24,233 | ||||||||||||
|
Advertising and other revenues
|
2,192 | 1,072 | 322 | 3,586 | ||||||||||||
|
Total revenues
|
54,306 | 32,536 | 7,809 | 94,651 | ||||||||||||
|
Cinema costs
|
43,295 | 24,120 | 5,734 | 73,149 | ||||||||||||
|
Concession costs
|
2,344 | 1,701 | 402 | 4,447 | ||||||||||||
|
Total operating expense
|
45,639 | 25,821 | 6,136 | 77,596 | ||||||||||||
|
Depreciation and amortization
|
3,766 | 1,160 | 559 | 5,485 | ||||||||||||
|
General & administrative expense
|
1,234 | 333 | -- | 1,567 | ||||||||||||
|
Segment operating income
|
$ | 3,667 | $ | 5,222 | $ | 1,114 | $ | 10,003 | ||||||||
|
·
|
Cinema revenue increased for the 2010 Six Months by $11.6 million or 12.3% compared to the same period in 2009. The 2010 Six Months increase was primarily from our Australia and New Zealand cinema operations, which accounted for $12.4 million of the increase primarily related to an increase in the average ticket price primarily associated with the recently released 3D movies for the 2010 Six Months by comparison to 2009 and an increase in the value of the Australia and New Zealand dollars compared to the U.S. dollar (see below). Our U.S. cinemas did not experience the same uplift in revenues as noted from our Australia and New Zealand cinemas due to increased competition at one of our cinemas and decreased admissions circuit wide. In addition, we made certain internal reporting changes to our intersegment revenue recognition between our cinema and real estate segments which resulted in an increase in other cinema revenues of $157,000 in the U.S.
|
|
·
|
Operating expense increased for the 2010 Six Months by $10.4 million or 13.4% compared to the same period in 2009. For Australia and New Zealand, this increase followed the revenues noted above. For the U.S., we noted higher operating costs primarily related to the newly leased 3D equipment and the associated increased labor-intensive nature of showing 3D films. Overall, our operating expense as a percent of gross revenue increased slightly from 82.0% to 82.8% from the 2009 Six Months to the 2010 Six Months.
|
|
·
|
Depreciation and amortization expense decreased for the 2010 Six Months by $376,000 or 6.9% compared to the same period in 2009 primarily related to the short useful lives of the used assets associated with our Consolidated Entertainment cinemas purchased February 2008.
|
|
·
|
General and administrative costs decreased for the 2010 Six Months by $341,000 or 21.8% compared to the same period in 2009 primarily related to cost cutting measures throughout the segment.
|
|
·
|
For our statement of operations, Australia and New Zealand six month average exchange rates have increased by 12.8% and 11.0%, respectively, since the 2009 Six Months, which had an impact on the individual components of our income statement.
|
|
·
|
Because of the above, cinema segment income increased for the 2010 Six Months by $2.0 million compared to the same period in 2009, an 19.7% increase.
|
Real Estate Segment
The following tables detail our real estate segment operating results for the three months ended June 30, 2010 and 2009, respectively (dollars in thousands):
|
Three Months Ended June 30, 2010
|
United States
|
Australia
|
New Zealand
|
Total
|
||||||||||||
|
Live theater rental and ancillary income
|
$ | 965 | $ | -- | $ | -- | $ | 965 | ||||||||
|
Property rental income
|
438 | 3,080 | 1,531 | 5,049 | ||||||||||||
|
Total revenues
|
1,403 | 3,080 | 1,531 | 6,014 | ||||||||||||
|
Live theater costs
|
545 | -- | -- | 545 | ||||||||||||
|
Property rental cost
|
86 | 1,193 | 400 | 1,679 | ||||||||||||
|
Total operating expense
|
631 | 1,193 | 400 | 2,224 | ||||||||||||
|
Depreciation and amortization
|
79 | 675 | 364 | 1,118 | ||||||||||||
|
Impairment expense
|
-- | 2,239 | -- | 2,239 | ||||||||||||
|
General & administrative expense
|
1 | 456 | 25 | 482 | ||||||||||||
|
Segment operating income (loss)
|
$ | 692 | $ | (1,483 | ) | $ | 742 | $ | (49 | ) | ||||||
|
Three Months Ended June 30, 2009
|
United States
|
Australia
|
New Zealand
|
Total
|
||||||||||||
|
Live theatre rental and ancillary income
|
$ | 533 | $ | -- | $ | -- | $ | 533 | ||||||||
|
Property rental income
|
382 | 2,053 | 1,242 | 3,677 | ||||||||||||
|
Total revenues
|
915 | 2,053 | 1,242 | 4,210 | ||||||||||||
|
Live theatre costs
|
371 | -- | -- | 371 | ||||||||||||
|
Property rental cost
|
19 | 880 | 362 | 1,261 | ||||||||||||
|
Total operating expense
|
390 | 880 | 362 | 1,632 | ||||||||||||
|
Depreciation and amortization
|
81 | 341 | 332 | 754 | ||||||||||||
|
Loss on transfer of real estate held for sale to continuing operations
|
-- | 549 | -- | 549 | ||||||||||||
|
General & administrative expense
|
(2 | ) | 179 | 12 | 189 | |||||||||||
|
Segment operating income
|
$ | 446 | $ | 104 | $ | 536 | $ | 1,086 | ||||||||
|
·
|
Real estate revenue increased for the 2010 Quarter by $1.8 million or 42.9% compared to the same period in 2009. Real estate revenue increased in Australia and the U.S. in part due to the opening of our Indooroopilly office building during the third quarter of 2009 and improved live theater results in 2010 compared to the same period in 2009. Additionally, real estate revenue increased from our Australia and New Zealand properties primarily due to a year over year increase in the value of the Australia and New Zealand dollars compared to the U.S. dollar. This increase translated to higher Australian and New Zealand revenues for the 2010 Quarter compared to the 2009 Quarter (see below).
|
|
·
|
Operating expense for the real estate segment increased for the 2010 Quarter by $592,000 or 36.3% compared to the same period in 2009. This increase followed the increased revenues noted above.
|
|
·
|
Depreciation and amortization expense for the real estate segment increased by $364,000 or 48.3% for the 2010 Quarter compared to the same period in 2009 primarily due to the opening of our Indooroopilly office building during the third quarter of 2009 and the impact of currency exchange rates (see below).
|
|
·
|
We recorded a $2.2 million impairment charge related to our Taringa real estate property during the second quarter of 2010 primarily associated with the development costs of the project.
|
|
·
|
We recorded a loss, in effect catch up depreciation, during 2009, on transfer of real estate held for sale to continuing operations of $549,000 related to our Auburn property.
|
|
·
|
General and administrative costs increased for the 2010 Quarter by $293,000 or 155.0% compared to the same period in 2009 primarily due to the litigation costs associated with the Mackie case in Australia and the impact of currency exchange rate increases (see below).
|
|
·
|
For our statement of operations, Australia and New Zealand quarterly average exchange rates have decreased by 16.1% and 16.0%, respectively, since the 2009 Quarter, which had an impact on the individual components of our income statement.
|
|
·
|
As a result of the above, real estate segment income decreased for the 2010 Quarter by $1.1 million compared to the same period in 2009.
|
The following tables detail our real estate segment operating results for the six months ended June 30, 2010 and 2009, respectively (dollars in thousands):
|
Six Months Ended June 30, 2010
|
United States
|
Australia
|
New Zealand
|
Total
|
||||||||||||
|
Live theatre rental and ancillary income
|
$ | 1,475 | $ | -- | $ | -- | $ | 1,475 | ||||||||
|
Property rental income
|
875 | 6,190 | 3,173 | 10,238 | ||||||||||||
|
Total revenues
|
2,350 | 6,190 | 3,173 | 11,713 | ||||||||||||
|
Live theatre costs
|
1,002 | -- | -- | 1,002 | ||||||||||||
|
Property rental cost
|
240 | 2,409 | 840 | 3,489 | ||||||||||||
|
Total operating expense
|
1,242 | 2,409 | 840 | 4,491 | ||||||||||||
|
Depreciation and amortization
|
159 | 1,364 | 748 | 2,271 | ||||||||||||
|
Impairment expense
|
-- | 2,239 | -- | 2,239 | ||||||||||||
|
General & administrative expense
|
1 | 682 | 23 | 706 | ||||||||||||
|
Segment operating income (loss)
|
$ | 948 | $ | (504 | ) | $ | 1,562 | $ | 2,006 | |||||||
|
Six Months Ended June 30, 2009
|
United States
|
Australia
|
New Zealand
|
Total
|
||||||||||||
|
Live theatre rental and ancillary income
|
$ | 1,444 | $ | -- | $ | -- | $ | 1,444 | ||||||||
|
Property rental income
|
785 | 4,341 | 2,626 | 7,752 | ||||||||||||
|
Total revenues
|
2,229 | 4,341 | 2,626 | 9,196 | ||||||||||||
|
Live theatre costs
|
826 | -- | -- | 826 | ||||||||||||
|
Property rental cost
|
251 | 1,685 | 677 | 2,613 | ||||||||||||
|
Total operating expense
|
1,077 | 1,685 | 677 | 3,439 | ||||||||||||
|
Depreciation and amortization
|
164 | 644 | 627 | 1,435 | ||||||||||||
|
Loss on transfer of real estate held for sale to continuing operations
|
-- | 549 | -- | 549 | ||||||||||||
|
General & administrative expense
|
9 | 333 | 28 | 370 | ||||||||||||
|
Segment operating income
|
$ | 979 | $ | 1,130 | $ | 1,294 | $ | 3,403 | ||||||||
|
·
|
Real estate revenue increased for the 2010 Six Months by $2.5 million or 27.4% compared to the same period in 2009. Real estate revenue increased in Australia in part due to the opening of our Indooroopilly office building during the third quarter of 2009. Additionally, real estate revenue increased from our Australia and New Zealand properties primarily due to a year over year increase in the value of the Australia and New Zealand dollars compared to the U.S. dollar. This increase translated to higher Australian and New Zealand revenues for the 2010 Six Months compared to the 2009 Six Months (see below).
|
|
·
|
Operating expense for the real estate segment increased for the 2010 Six Months by $1.1 million or 30.6% compared to the same period in 2009. This increase followed the increased revenues noted above.
|
|
·
|
Depreciation and amortization expense for the real estate segment increased by $836,000 or 58.3% for the 2010 Six Months compared to the same period in 2009 primarily due to the opening of our Indooroopilly office building during the third quarter of 2009 and the impact of currency exchange rates (see below).
|
|
·
|
We recorded a $2.2 million impairment charge related to our Taringa real estate property during 2010 primarily associated with the development costs of the project.
|
|
·
|
We recorded a loss, in effect catch up depreciation, during 2009, on transfer of real estate held for sale to continuing operations of $549,000 related to our Auburn property.
|
|
·
|
General and administrative costs increased for the 2010 Six Months by $336,000 or 90.8% compared to the same period in 2009 primarily due to the litigation costs associated with the Mackie case in Australia and the impact of currency exchange rate increases (see below).
|
|
·
|
For our statement of operations, Australia and New Zealand six month average exchange rates have decreased by 12.8% and 11.0%, respectively, since the 2009 Six Months, which had an impact on the individual components of our income statement.
|
|
·
|
As a result of the above, real estate segment income decreased for the 2010 Six Months by $1.4 million compared to the same period in 2009.
|
Corporate
Quarterly Results
General and administrative expense includes expenses that are not directly attributable to other operating segments. General and administrative expense increased by $221,000 in the 2010 Quarter compared to the 2009 Quarter primarily related to an increase in legal fees associated with our federal tax litigation which was settled during July 2010 and currency changes that increased the Australia and New Zealand reported expense offset by decreases in payroll expense and other administrative costs.
Net interest expense increased by $1.2 million for the 2010 Quarter compared to the 2009 Quarter. The increase in interest expense during the 2010 Quarter was primarily related to changes to our interest rate swaps somewhat offset by lower debt balances for the 2010 Quarter compared to the same period last year.
During the 2009 Quarter, we recorded a $10.7 million gain on retirement of subordinated debt (trust preferred securities), net of a $749,000 loss on deferred financing costs associated with the subordinated debt.
During the 2010 Quarter, we recorded a $351,000 gain on sale of assets primarily related to a deferred gain on sale of a property.
For the 2010 Quarter, we recorded an other loss of $131,000 compared to $1.9 million for the 2009 Quarter. For the 2010 Quarter, the $131,000 other loss included offsetting settlements related to our Burstone litigation and the 2008 sale of our interest in the Botany Downs cinema. For the 2009 Quarter, the $1.9 million other loss included a $2.2 million loss on foreign currency translation, a $1.3 million other-than-temporary loss on marketable securities, offset by a $1.5 million gain on the expiration of an option to purchase granted with respect to our Auburn property.
For the 2010 Quarter, income tax expense increased by $11.8 million primarily relating to our July 2010 settlement with the IRS on our federal tax litigation case.
For the 2010 Quarter, we recorded an increase in our equity earnings of unconsolidated joint ventures and entities of $102,000.
Six Months Results
General and administrative expense increased by $159,000 in the 2010 Six Months compared to the 2009 Six Months related to decreases in payroll expense and other administrative costs offset by an increase in legal fees primarily associated with our federal tax litigation which was settled during July 2010 and currency changes that increased the Australia and New Zealand reported expense.
Net interest expense decreased by $97,000 for the 2010 Six Months compared to the 2009 Six Months. The decrease in interest expense during the 2010 Six Months was primarily related to lower debt balances for the 2010 Quarter compared to the same period last year offset by changes to our interest rate swaps.
During the 2009 Six Months, we recorded a $10.7 million gain on retirement of subordinated debt (trust preferred securities), net of a $749,000 loss on deferred financing costs associated with the subordinated debt.
During the 2010 Six Months, we recorded a $351,000 gain on sale of assets primarily related to a deferred gain on sale of a property.
For the 2010 Six Months, we recorded an other loss of $713,000 compared to $2.7 million for the 2009 Quarter. For the 2010 Six Months, the $713,000 other loss included offsetting settlements related to our Burstone litigation and the 2008 sale of our interest in the Botany Downs cinema and a $605,000 of loss associated our Mackie litigation. For the 2009 Six Months, the $2.7 million other loss included a $2.2 million loss on foreign currency translation, a $2.0 million other-than-temporary loss on marketable securities, offset by a $1.5 million gain on the expiration of an option to purchase granted with respect to our Auburn property.
For the 2010 Six Months, income tax expense increased by $12.0 million primarily relating to our July 2010 settlement with the IRS on our tax litigation case.
For the 2010 Six Months, we recorded a decrease in our equity earnings of unconsolidated joint ventures and entities of $42,000 primarily related to the last condominium being sold associated with our Place 57 investment during the 2009 Six Months. This decrease was somewhat offset by an increase in equity earnings from our Mt. Gravatt investment in the 2010 Six Months.
Net Income (Loss) Attributable to Reading International, Inc. Common Shareholders
During 2010, we recorded a net loss attributable to Reading International, Inc. common shareholders of $13.4 million for the 2010 Six Months compared to a net income of $6.5 million for the 2010 Six Months and a net loss of $13.7 million for the 2010 Quarter compared to net income of $9.9 million for the 2009 Quarter. The change from a net income to a net loss from 2009 to 2010 was primarily related to a one-time $10.7 million gain on retirement of subordinated debt in 2009 while in 2010 we recorded a one-time income tax accrual of $12.0 million for our federal tax case settlement and a property impairment charge of $2.2 million.
Acquisition
Manukau Land Purchase
On April 30, 2009, we entered into an agreement to purchase for $3.6 million (NZ$5.2 million) a property adjacent to our Manukau property. An initial deposit of $26,000 (NZ$50,000) was paid upon signing of the agreement, a second deposit of $175,000 (NZ$258,000) was paid in the second quarter of 2009 and a third deposit of $531,000 (NZ$773,000) was paid in August 2009. The fourth and final purchase payment of $2.9 million (NZ$4.1 million) was made on March 31, 2010.
Business Plan, Capital Resources, and Liquidity
Business Plan
Our cinema exhibition business plan is to continue to identify, develop, and acquire cinema properties, where reasonably available, that allow us to leverage our cinema expertise and technology over a larger operating base. Our real estate business plan is to continue development of our existing land assets to be sensitive to opportunities to convert our entertainment assets to higher and better uses, or, when appropriate, dispose of such assets. Because we believe that current economic conditions are not conducive to obtaining the pre-construction leasing commitments necessary to justify commencement of construction, we currently focus our development efforts on improving and enhancing land entitlements and negotiating with end users for build to suit projects. We will also continue to investigate potential synergistic acquisitions that may not readily fall into either of our two currently identified segments.
Contractual Obligations
The following table provides information with respect to the maturities and scheduled principal repayments of our secured debt and lease obligations at June 30, 2010 (in thousands):
|
2010
|
2011
|
2012
|
2013
|
2014
|
Thereafter
|
Total
|
||||||||||||||||||||||
|
Debt
|
$ | 707 | $ | 90,223 | $ | 34,249 | $ | 49,821 | $ | 336 | $ | 6,429 | $ | 181,765 | ||||||||||||||
|
Notes payable to related parties
|
-- | -- | -- | 9,000 | -- | -- | 9,000 | |||||||||||||||||||||
|
Subordinated notes (trust preferred securities)
|
-- | -- | -- | -- | -- | 27,913 | 27,913 | |||||||||||||||||||||
|
Pension liability
|
4 | 15 | 23 | 32 | 40 | 3,308 | 3,422 | |||||||||||||||||||||
|
Lease obligations
|
13,627 | 26,735 | 25,208 | 23,108 | 20,137 | 79,689 | 188,504 | |||||||||||||||||||||
|
Estimated interest on debt
|
6,064 | 10,647 | 5,059 | 2,773 | 1,617 | 15,468 | 41,628 | |||||||||||||||||||||
|
Total
|
$ | 20,402 | $ | 127,620 | $ | 64,539 | $ | 84,734 | $ | 22,130 | $ | 132,807 | $ | 452,232 | ||||||||||||||
We base estimated interest on long-term debt on the anticipated loan balances for future periods calculated against current fixed and variable interest rates.
We adopted FASB ASC 740-10-2a,
Accounting for Uncertainty in Income Taxes
on January 1, 2007. As of adoption, the total amount of gross unrecognized tax benefits for uncertain tax positions was $12.5 million increasing to $27.4 million as of June 30, 2010. We expect a tax payment related to these obligations within the next 12 months of approximately $5.3 million in federal taxes plus interest.
Unconsolidated Debt
Total debt of unconsolidated joint ventures and entities was $932,000 and $979,000 as of June 30, 2010 and December 31, 2009. Our share of unconsolidated debt, based on our ownership percentage, was $310,000 and $326,000 as of June 30, 2010 and December 31, 2009. This loan is guaranteed by one of our subsidiaries to the extent of our ownership percentage.
Off-Balance Sheet Arrangements
There are no off-balance sheet transactions, arrangements or obligations (including contingent obligations) that have, or are reasonably likely to have, a current or future material effect on our financial condition, changes in the financial condition, revenues or expenses, results of operations, liquidity, capital expenditures, or capital resources.
Currency Risk
We are subject to currency risk because we conduct a significant portion of our business in Australia and New Zealand. Set forth below is a chart indicating the various exchange rates at certain points in time for the Australian and New Zealand Dollar vis-à-vis the US Dollar over the past 20 years.
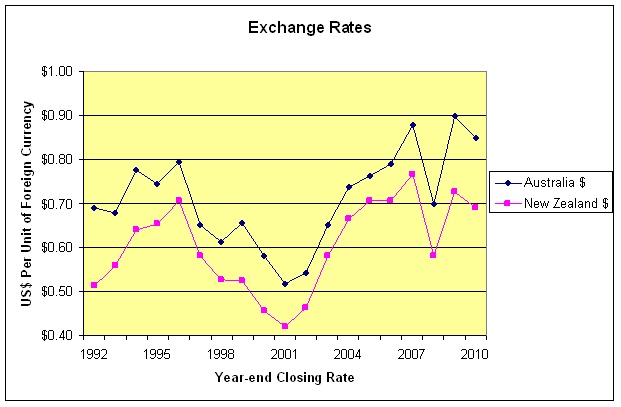
We do not engage in currency hedging activities. Rather, to the extent possible, we operate our Australian and New Zealand operations on a self-funding basis. Our policy in Australia and New Zealand is to match revenues and expenses, whenever possible, in local currencies. As a result, we have procured in local currencies the majority of our expenses in Australia and New Zealand. Due to the developing nature of our operations in Australia and New Zealand and our historic practice of funding our asset growth through local borrowings, our revenues are not yet significantly greater than our operating expenses and interest charges in these countries. As we continue to progress with our acquisition and development activities in Australia and New Zealand, the effect of variations in currency values will likely increase.
Liquidity and Capital Resources
Our ability to generate sufficient cash flows from operating activities in order to meet our obligations and commitments drives our liquidity position. This is further affected by our ability to obtain adequate, reasonable financing and/or to convert non-performing or non-strategic assets into cash.
Currently, our liquidity needs arise primarily from:
|
·
|
capital expenditure needs for our expanding digital and 3D implementations;
|
|
·
|
working capital requirements; and
|
|
·
|
debt servicing requirements.
|
At June 30, 2010, we had approximately $4.7 million (AUS$5.5 million) in undrawn funds under our Australian Corporate Credit Facility and $12.8 million (NZ$18.5 million) available under our line of credit in New Zealand. Accordingly, we believe that we have sufficient borrowing capacity under our Australian Corporate Credit Facility and our New Zealand line of credit to meet our anticipated short-term working capital requirements.
As indicated in our 2009 Annual Report, the term of our Australia Corporate Credit facility ends on June 30, 2011. As such, the outstanding balance of this debt is classified as current on our balance sheet. We are currently in the process of renegotiating this facility with our current lender while also seeking a facility with other lenders. While no assurances can be made that we will be successful, we are currently working to have the new facility in place during the first quarter of 2011.
Operating Activities
Cash provided by operations was $10.7 million in the 2010 Six Months compared to $6.2 million in the 2009 Six Months. The increase in cash provided by operations of $4.5 million was due primarily to a $2.6 million increase of operational cash flows.
Investing Activities
Cash used in investing activities for the 2010 Six Months decreased by $3.6 million to $8.7 million compared to $12.3 million from the same period in 2009. The $8.7 million cash used for the 2010 Six Months was primarily related to:
|
·
|
$4.4 million in property enhancements to our existing properties;
|
|
·
|
$2.9 million to purchase a property adjacent to our Manukau property;
|
|
·
|
$1.5 million of change in restricted cash; and
|
|
·
|
$223,000 of an acquisition deposit
|
offset by
|
·
|
$259,000 in return of investment of unconsolidated entities.
|
The $12.3 million cash used for the 2009 Six Months was primarily related to:
|
·
|
$3.0 million in property enhancements to our existing properties; and
|
|
·
|
$11.5 million to purchase marketable securities to exchange for our Reading International Trust I securities;
|
offset by
|
·
|
$801,000 of change in restricted cash;
|
|
·
|
$1.3 million in return of investment of unconsolidated entities; and
|
|
·
|
$284,000 receipt of an option purchase payment for the Auburn property.
|
Financing Activities
Cash provided by financing activities for the 2010 Six Months was $1.1 million compared to $4.5 million of cash used in financing activities for the same period in 2009 resulting in a change of $5.5 million. The $1.1 million in cash provided by financing activities during the 2010 Six Months was primarily related to:
|
·
|
$8.0 million of borrowing on our New Zealand credit facility;
|
|
·
|
$7.5 million of borrowing proceeds from our new Union Square Theater Term Loan; and
|
|
·
|
$248,000 of proceeds from the exercise of employee stock options;
|
offset by
|
·
|
$13.8 million of loan repayments including $6.9 million for the pay off of our Union Square Term Loan, $5.0 million for the pay off of our SHC Loan, and $1.7 million pay down of our GE Capital Loan;
|
|
·
|
$251,000 of repurchase of Class A Nonvoting Common Stock; and
|
|
·
|
$751,000 in noncontrolling interest distributions.
|
The $4.5 million in cash used in the 2009 Six Months was primarily related to:
|
·
|
$1.5 million of borrowing on our Australia credit facilities;
|
offset by
|
·
|
$5.5 million of loan repayments; and
|
|
·
|
$489,000 in noncontrolling interest distributions.
|
Critical Accounting Policies
The SEC defines critical accounting policies as those that are, in management’s view, most important to the portrayal of the company’s financial condition and results of operations and the most demanding in their calls on judgment. Although accounting for our core business of cinema and live theater exhibition with a real estate focus is relatively straightforward, we believe our most critical accounting policies relate to:
|
·
|
impairment of long-lived assets, including goodwill and intangible assets;
|
|
·
|
tax valuation allowance and obligations; and
|
|
·
|
legal and environmental obligations.
|
We discuss these critical accounting policies in our 2009 Annual Report and advise you to refer to that discussion.
Financial Risk Management
Our internally developed risk management procedure, seeks to minimize the potentially negative effects of changes in currency exchange rates and interest rates on the results of operations. Our primary exposure to fluctuations in the financial markets is currently due to changes in currency exchange rates between U.S and Australia and New Zealand, and interest rates.
As our operational focus continues to shift to Australia and New Zealand, unrealized foreign currency translation gains and losses could materially affect our financial position. We currently manage our currency exposure by creating, whenever possible, natural hedges in Australia and New Zealand. This involves local country sourcing of goods and services as well as borrowing in local currencies.
Our exposure to interest rate risk arises out of our long-term debt obligations. Consistent with our internally developed guidelines, we seek to reduce the negative effects of changes in interest rates by changing the character of the interest rate on our long-term debt, converting a variable rate into a fixed rate. Our internal procedures allow us to enter into derivative contracts on certain borrowing transactions to achieve this goal. Our Australian credit facilities provide for floating interest rates but require that not less than a certain percentage of the loans be swapped into fixed rate obligations using derivative contracts.
In accordance with FASB ASC 815-10-35,
Subsequent Valuation of Derivative Instruments and Hedging Instruments
(“FASB ASC 815-10-35”), we marked our interest rate swap instruments to market on the consolidated balance sheet resulting in an increase in interest expense of $342,000 and $119,000 during the three and six months ended June 30, 2010, respectively, and a $1.1 million and $710,000 decrease to interest expense during the three and six months ended June 30, 2009, respectively. At June 30, 2010, we recorded the fair market value of an interest rate swap and a cap of $356,000 as other long-term assets and an interest rate swap of $494,000 as an other long-term liability. At December 31, 2009, we recorded the fair market value of an interest rate swap and a cap of $766,000 as other long-term assets and an interest rate swap of $785,000 as an other long-term liability. In accordance with FASB ASC 815-10-35, we have not designated any of our current interest rate swap positions as financial reporting hedges.
Inflation
We continually monitor inflation and the effects of changing prices. Inflation increases the cost of goods and services used. Competitive conditions in many of our markets restrict our ability to recover fully the higher costs of acquired goods and services through price increases. We attempt to mitigate the impact of inflation by implementing continuous process improvement solutions to enhance productivity and efficiency and, as a result, lower costs and operating expenses. In our opinion, we have managed the effects of inflation appropriately, and, as a result, it has not had a material impact on our operations and the resulting financial position or liquidity.
Litigation
We are currently, and are from time to time, involved with claims and lawsuits arising in the ordinary course of our business. Some examples of the types of claims are:
|
·
|
contractual obligations;
|
|
·
|
insurance claims;
|
|
·
|
IRS claims;
|
|
·
|
employment matters;
|
|
·
|
environmental matters; and
|
|
·
|
anti-trust issues.
|
Where we are the plaintiffs, we expense all legal fees on an on-going basis and make no provision for any potential settlement amounts until received. In Australia, the prevailing party is entitled to recover its attorneys fees, which typically works out to be approximately 60% of the amounts actually spent where first class legal counsel is engaged at customary rates. Where we are a plaintiff, we have likewise made no provision for the liability for the defendant’s attorneys' fees in the event we are determined not to be the prevailing party.
Where we are the defendants, we accrue for probable damages, which insurance may not cover, as they become known and can be reasonably estimated. In our opinion, any claims and litigation in which we are currently involved are not reasonably likely to have a material adverse effect on our business, results of operations, financial position, or liquidity. However, we do not give any assurance as to the ultimate outcome of such claims and litigation. The resolution of such claims and litigation could be material to our operating results for any particular period, depending on the level of income for such period. Except as noted below regarding our Tax Litigation Case, there have been no material changes to our litigation exposure since our 2009 Annual Report.
In July 2010, our subsidiary, Craig Corporation (“Craig”), and the Internal Revenue Service (the “IRS”) agreed to file with the Tax Court a settlement of the IRS’s claim against Craig. In the settlement, the IRS conceded 70% of its proposed adjustment to income claimed in its notices of deficiency dated June 29, 2006. The proposed adjustment had resulted in a claim for unpaid taxes of $20.9 million plus interest. The effect of the terms of settlement on the Reading consolidated group is to require a total federal income tax obligation of $13.4 million, inclusive of interest due for the underpayment of taxes and net of all tax refunds available.
The impact of the settlement upon state taxes on the Reading consolidated group remains uncertain as of June 30, 2010, but if the agreed adjustment to income were reflected on state returns, it would cause a state tax obligation of approximately $4.7 million. Of this, $4.2 million would be related to California, and $0.5 million to other states. Craig’s 1997 tax year remains open with respect to Craig’s potential tax liability to the State of California. As of June 30, 2010, no deficiency has been asserted by the State of California, and we have made no final decision as to the course of action to be followed if a deficiency were to be asserted.
The decision to settle was based on various business considerations, the most prominent of which was the potential size of an adverse judgment (some $68.1 million including interest) and the estimated direct costs of trial.
As a result of this settlement, we recorded an additional federal and state tax expense of $11.8 million for the quarter ended June 30, 2010 to increase our reserve for uncertain tax positions in accordance with FASB ASC 740-10-25 – Income Taxes. As of March 31, 2010, we had a reserve against this uncertain tax position contingency of $6.3 million. As of June 30, 2010, we show the $18.1 million potential impact as current taxes payable.
Forward-Looking Statements
Our statements in this interim quarterly report contain a variety of forward-looking statements as defined by the Securities Litigation Reform Act of 1995. Forward-looking statements reflect only our expectations regarding future events and operating performance and necessarily speak only as of the date the information was prepared. We cannot guarantee that our expectation will be realized in whole or in part. You can recognize these statements by our use of words such as, by way of example, “may,” “will,” “expect,” “believe,” and “anticipate” or other similar terminology.
These forward-looking statements reflect our expectation after having considered a variety of risks and uncertainties. However, they are necessarily the product of internal discussion and do not necessarily completely reflect the views of individual members of our Board of Directors or of our management team. Individual Board members and individual members of our management team may have different views as to the risks and uncertainties involved, and may have different views as to future events or our operating performance.
Among the factors that could cause actual results to differ materially from those expressed in or underlying our forward-looking statements are the following:
|
·
|
With respect to our cinema operations:
|
|
o
|
The number and attractiveness to movie goers of the films released in future periods;
|
|
o
|
The amount of money spent by film distributors to promote their motion pictures;
|
|
o
|
The ability to implement digital and 3D projectors throughout our cinema circuits worldwide;
|
|
o
|
The licensing fees and terms required by film distributors from motion picture exhibitors in order to exhibit their films;
|
|
o
|
The continued willingness of moviegoers to spend money on our concession items;
|
|
o
|
The comparative attractiveness of motion pictures as a source of entertainment and willingness and/or ability of consumers (i) to spend their dollars on entertainment and (ii) to spend their entertainment dollars on movies in an outside the home environment;
|
|
o
|
The extent to which we encounter competition from other cinema exhibitors, from other sources of outside of the home entertainment, and from inside the home entertainment options, such as “home theaters” and competitive film product distribution technology such as, by way of example, cable, satellite broadcast, DVD and VHS rentals and sales, and so called “movies on demand;” and
|
|
o
|
The extent to and the efficiency with which, we are able to integrate acquisitions of cinema circuits with our existing operations.
|
|
·
|
With respect to our real estate development and operation activities:
|
|
o
|
The rental rates and capitalization rates applicable to the markets in which we operate and the quality of properties that we own;
|
|
o
|
The extent to which we can obtain on a timely basis the various land use approvals and entitlements needed to develop our properties;
|
|
o
|
The risks and uncertainties associated with real estate development;
|
|
o
|
The availability and cost of labor and materials;
|
|
o
|
Competition for development sites and tenants;
|
|
o
|
Environmental remediation issues; and
|
|
o
|
The extent to which our cinemas can continue to serve as an anchor tenant who will, in turn, be influenced by the same factors as will influence generally the results of our cinema operations.
|
|
·
|
With respect to our operations generally as an international company involved in both the development and operation of cinemas and the development and operation of real estate:
|
|
o
|
Our ongoing access to borrowed funds and capital and the interest that must be paid on that debt and the returns that must be paid on such capital;
|
|
o
|
The relative values of the currency used in the countries in which we operate;
|
|
o
|
Changes in government regulation;
|
|
o
|
Our labor relations and costs of labor (including future government requirements with respect to pension liabilities, disability insurance and health coverage, and vacations and leave);
|
|
o
|
Our exposure from time to time to legal claims and to uninsurable risks such as those related to our historic railroad operations, including potential environmental claims and health related claims relating to alleged exposure to asbestos or other substances now or in the future, recognized as being possible causes of cancer or other health related problems;
|
|
o
|
Changes in future effective tax rates and the results of currently ongoing and future potential audits by taxing authorities having jurisdiction over our various companies; and
|
|
o
|
Changes in applicable accounting policies and practices.
|
The above list is not exhaustive, as business is inherently unpredictable, risky, and subject to influence by numerous factors outside of our control. Such factors include changes in government regulation or policy, competition, interest rates, supply, technological innovation, changes in consumer taste and fancy, weather, and the extent to which consumers in our markets have the economic ability to spend money on beyond-the-home entertainment.
Given the variety and unpredictability of the factors that will ultimately influence our businesses and our results of operation, it naturally follows that no guarantees can be given that any of our forward-looking statements will ultimately prove to be correct. Actual results will undoubtedly vary and there is no guarantee as to how our securities will perform either when considered in isolation or when compared to other securities or investment opportunities.
Finally, please understand that we undertake no obligation to update publicly or to revise any of our forward-looking statements, whether because of new information, future events or otherwise, except as may be required under applicable law. Accordingly, you should always note the date to which our forward-looking statements speak.
Additionally, certain of the presentations included in this interim quarterly report may contain “non-GAAP financial measures.” In such case, we will make available in connection with such statements a reconciliation of this information to our GAAP financial statements.
The SEC requires that registrants include information about potential effects of changes in currency exchange and interest rates in their filings. Several alternatives, all with some limitations, have been offered. We base the following discussion on a sensitivity analysis, which models the effects of fluctuations in currency exchange rates and interest rates. This analysis is constrained by several factors, including the following:
|
·
|
It is based on a single point in time; and
|
|
·
|
It does not include the effects of other complex market reactions that would arise from the changes modeled.
|
Although the results of such an analysis may be useful as a benchmark, they should not be viewed as forecasts.
At June 30, 2010, approximately 49% and 16% of our assets were invested in assets denominated in Australian dollars (Reading Australia) and New Zealand dollars (Reading New Zealand), respectively, including approximately $15.8 million in cash and cash equivalents. At December 31, 2009, approximately 50% and 16% of our assets were invested in assets denominated in Australian dollars (Reading Australia) and New Zealand dollars (Reading New Zealand) including approximately $15.4 million in cash and cash equivalents.
Our policy in Australia and New Zealand is to match revenues and expenses, whenever possible, in local currencies. As a result, we have procured in local currencies a majority of our expenses in Australia and New Zealand. Due to the developing nature of our operations in Australia and New Zealand, our revenue is not yet significantly greater than our operating and interest expenses. The resulting natural hedge has led to a somewhat negligible foreign currency effect on our current earnings. Although foreign currency has had a nominal effect on our current earnings, the effect of the translation adjustment on our assets and liabilities noted in our other comprehensive income was a decrease of $9.4 million and $8.4 million for the three and six months ended June 30, 2010, respectively. As we continue to progress our acquisition and development activities in Australia and New Zealand, we cannot assure you that the foreign currency effect on our earnings will be negligible in the future.
Historically, our policy has been to borrow in local currencies to finance the development and construction of our ETRCs in Australia and New Zealand whenever possible. As a result, the borrowings in local currencies have provided somewhat of a natural hedge against the foreign currency exchange exposure. Even so, and as a result of our issuance of fully subordinated notes (TPS) in 2007, and their subsequent partial repayment, approximately 48% and 56% of our Australian and New Zealand assets, respectively, remain subject to such exposure unless we elect to hedge our foreign currency exchange between the US and Australian and New Zealand dollars. If the foreign currency rates were to fluctuate by 10% the resulting change in Australian and New Zealand assets would be $9.2 million and $3.5 million, respectively, and the change in our quarterly net income would be $28,000 and $58,000, respectively. Presently, we have no plan to hedge such exposure.
We record unrealized foreign currency translation gains or losses that could materially affect our financial position. As of June 30, 2010 and December 31, 2009, we have recorded a cumulative unrealized foreign currency translation gain of approximately $34.8 million and $43.2 million, respectively.
Historically, we maintain most of our cash and cash equivalent balances in short-term money market instruments with original maturities of three months or less. Due to the short-term nature of such investments, a change of 1% in short-term interest rates would not have a material effect on our financial condition.
While we have typically used fixed rate financing (secured by first mortgages) in the U.S., fixed rate financing is typically not available to corporate borrowers in Australia and New Zealand. The majority of our Australian and New Zealand bank loans have variable rates. The Australian facility provides for floating interest rates, but requires that not less than a certain percentage of the loan be swapped into fixed rate obligations (see
Financial Risk Management
above). If we consider the interest rate swaps, a 1% increase or decrease in short-term interest rates would have resulted in approximately $514,000 increase or decrease in our 2010 Quarter’s Australian and New Zealand interest expense.
We maintain disclosure controls and procedures that are designed to ensure that information required to be disclosed in the Company’s Exchange Act reports, as amended, is recorded, processed, summarized and reported within the time periods specified in the SEC’s rules and forms and that such information is accumulated and communicated to our management, including our Chief Executive Officer and Chief Financial Officer, as appropriate, to allow for timely decisions regarding required disclosure. In designing and evaluating the disclosure controls and procedures, management recognizes that any controls and procedures, no matter how well designed and operated, can provide only reasonable assurance of achieving the desired control objectives, and our management is required to apply its judgment in evaluating the cost-benefit relationship of possible controls and procedures.
Under the supervision and with the participation of our management, including our principal executive officer and principal financial officer, we conducted an evaluation of our disclosure controls and procedures, as such term is defined under Rule 13a-15(e) promulgated under the Securities Exchange Act of 1934, as amended (the “Exchange Act”). Based on this evaluation, our principal executive officer and our principal financial officer concluded that our disclosure controls and procedures were effective as of the end of the period covered by this quarterly report.
Changes in Internal Control over Financial Reporting
No change in our internal control over financial reporting (as defined in Rule 13a-15(f) and 15d-15(f) under the Exchange Act) occurred during the quarter ended June 30, 2010 that has materially affected, or is reasonably likely to materially affect, our internal control over financial reporting.
For a description of legal proceedings, please refer to Item 3 entitled Legal Proceedings contained in the Company’s Annual Report on Form 10-K for the year ended December 31, 2009.
For a description of grants of stock to certain executives, see the Stock Based Compensation section under see Note 2 –
Stock-Based and Equity Compensation
, above.
Not applicable.
None.
Not applicable.
|
31.1
|
Certification Pursuant to Section 302 of the Sarbanes-Oxley Act of 2002, filed herewith.
|
|
31.2
|
Certification Pursuant to Section 302 of the Sarbanes-Oxley Act of 2002, filed herewith.
|
|
32
|
Certifications Pursuant to Section 906 of the Sarbanes-Oxley Act of 2002, filed herewith.
|
SIGN
ATURES
Pursuant to the requirements of the Securities Exchange Act of 1934, the Registrant has duly caused this report to be signed on its behalf by the undersigned thereunto duly authorized.
READING INTERNATIONAL, INC.
|
Date:
|
August 6, 2010
|
By:
|
/s/ James J. Cotter
|
|
James J. Cotter
|
|||
|
Chief Executive Officer
|
|
Date:
|
August 6, 2010
|
By:
|
/s/ Andrzej Matyczynski
|
|
Andrzej Matyczynski
|
|||
|
Chief Financial Officer
|
-48-
TABLE OF CONTENTS
Part I Financial InformationItem 1 Financial StatementsNote 1 Basis Of PresentationNote 2 Equity and Stock Based CompensationNote 3 Business SegmentsNote 4 Operations in Foreign CurrencyNote 5 Earnings (loss) Per ShareNote 6 Property Held For Sale, Property Held For and Under Development, and Property and EquipmentNote 7 Investments in Unconsolidated Joint Ventures and EntitiesNote 8 Goodwill and Intangible AssetsNote 9 Prepaid and Other AssetsNote 10 Income TaxNote 11 Notes Payable and Subordinated Debt (trust Preferred Securities)Note 12 Other LiabilitiesNote 13 Commitments and ContingenciesNote 14 Noncontrolling InterestsNote 15 Common StockNote 16 Comprehensive Income (loss)Note 17 Derivative InstrumentsNote 18 Fair Value Of Financial InstrumentsNote 19 Acquisitions, Asset Impairment, and Assets Held For SaleNote 20 Related Party TransactionsNote 21 Subsequent EventItem 2 Management S Discussion and Analysis Of Financial Condition and Results Of OperationsItem 3 Quantitative and Qualitative Disclosure About Market RiskItem 4 Controls and ProceduresPart II Other InformationItem 1 - Legal ProceedingsItem 2 - Unregistered Sales Of Equity Securities and Use Of ProceedsItem 3 - Defaults Upon Senior SecuritiesItem 4 - Removed and ReservedItem 5 - Other InformationItem 6 - Exhibits