|
|
|
|
|
|
|
|
|
|
|
|
|
|
|
|
|
|
|
|
|
|
|
|
|
|
|
|
|
|
|
|
|
|
|
|
|
|
|
|
|
|
|
|
|
|
|
|
|
|
|
|
|
|
|
|
SECURITIES AND EXCHANGE COMMISSION
Washington, D.C. 20549
_____________________________________________________
FORM 10-Q
(Mark One)
|
☑ |
QUARTERLY REPORT PURSUANT TO SECTION 13 OR 15(D) OF THE SECURITIES EXCHANGE ACT OF 1934 |
For the quarterly period ended : September 30, 2019
OR
|
☐ |
TRANSITION REPORT PURSUANT TO SECTION 13 OR 15(D) OF THE SECURITIES EXCHANGE ACT OF 1934 |
For the transition period from ___________ to ___________
Commission file number 1-8625

READING INTERNATIONAL, INC.
(Exact name of Registrant as specified in its charter)
|
NEVADA (State or other jurisdiction of incorporation or organization) |
95-3885184 (IRS Employer Identification No.) |
|
5995 Sepulveda Boulevard, Suite 300 Culver City, CA (Address of principal executive offices) |
90230 (Zip Code) |
Registrant’s telephone number, including area code: (213) 235-2240
Securities registered pursuant to Section 12(b) of the Act:
|
|
|
|
|
|
|
Title of each class |
|
Trading Symbol(s) |
|
Name of each exchange on which registered |
|
Class A Common Stock, $0.01 par value |
|
RDI |
|
The Nasdaq Stock Market LLC |
|
Class B Common Stock, $0.01 par value |
|
RDIB |
|
The Nasdaq Stock Market LLC |
Indicate by check mark whether the registrant: (1) has filed all reports required to be filed by Section 13 or 15(d) of the Securities Exchange Act of 1934 during the preceding twelve months (or for such shorter period that the registrant was required to file such reports), and (2) has been subject to such filing requirements for the past 90 days. Yes ☑ No ☐
Indicate by check mark whether the registrant has submitted electronically every Interactive Data File required to be submitted and posted pursuant to Rule 405 of Regulation S-T (§ 232.405 of this chapter) during the preceding 12 months (or for such shorter period that the registrant was required to submit and post such files). Yes ☑ No ☐
Indicate by check mark whether the registrant is a large accelerated filer, an accelerated filer, a non-accelerated filer, smaller reporting company, or an emerging growth company. See definitions of “large accelerated filer”, “accelerated filer”, “smaller reporting company,” and “emerging growth company” in Rule 12b-2 of the Exchange Act.
Large accelerated filer ☐ Accelerated filer ☑ Non-accelerated filer ☐ Smaller reporting company ☐ Emerging growth company ☐
If an emerging growth company, indicate by check mark if the registrant has elected not to use the extended transition period for complying with any new or revised financial accounting standards provided pursuant to Section 13(a) of the Exchange Act. ☐
Indicate by check mark whether the registrant is a shell company (as defined in Rule 12b-2 of the Exchange Act). Yes ☐ No ☑
Indicate the number of shares outstanding of each of the issuer’s classes of common stock, as of the latest practicable date. As of November 8, 2019 there were 20,404,573 shares of Class A Nonvoting Common Stock, $0.01 par value per share and 1,680,590 shares of Class B Voting Common Stock, $0.01 par value per share outstanding.
1
READING INTERNATIONAL , INC. AND SUBSIDIARIES
TABLE OF CONTENTS
|
|
Page |
| 3 | |
| 3 | |
| 3 | |
| 4 | |
|
Consolidated Statements of Comprehensive Income (Unaudited) |
5 |
| 6 | |
| 7 | |
|
Item 2 – Management’s Discussion and Analysis of Financial Condition and Results of Operations |
31 |
|
Item 3 – Quantitative and Qualitative Disclosure about Market Risk |
48 |
| 49 | |
| 50 | |
| 50 | |
| 51 | |
|
Item 2 – Unregistered Sales of Equity Securities and Use of Proceeds |
51 |
| 51 | |
| 51 | |
| 51 | |
| 53 | |
|
Certifications |
|
2
PART 1 – FINANCIAL INFORMATION
READING INTERNATIONAL, INC.
(U.S. dollars in thousands, except share information)
|
|
|
|
|
|
|
|
|
|
|
|
|
|
|
|
|
|
|
September 30, |
|
December 31, |
||
|
|
|
2019 |
|
2018 |
||
|
ASSETS |
|
(unaudited) |
|
|
|
|
|
Current Assets: |
|
|
|
|
|
|
|
Cash and cash equivalents |
|
$ |
8,708 |
|
$ |
13,127 |
|
Receivables |
|
|
4,363 |
|
|
8,045 |
|
Inventory |
|
|
1,195 |
|
|
1,419 |
|
Prepaid and other current assets |
|
|
10,831 |
|
|
7,667 |
|
Total current assets |
|
|
25,097 |
|
|
30,258 |
|
Operating property, net |
|
|
248,100 |
|
|
257,667 |
|
Operating lease right-of-use assets |
|
|
216,963 |
|
|
— |
|
Investment and development property, net |
|
|
107,292 |
|
|
86,804 |
|
Investment in unconsolidated joint ventures |
|
|
4,721 |
|
|
5,121 |
|
Goodwill |
|
|
19,913 |
|
|
19,445 |
|
Intangible assets, net |
|
|
3,607 |
|
|
7,369 |
|
Deferred tax asset, net |
|
|
25,959 |
|
|
26,235 |
|
Other assets |
|
|
6,164 |
|
|
6,129 |
|
Total assets |
|
$ |
657,816 |
|
$ |
439,028 |
|
LIABILITIES AND STOCKHOLDERS' EQUITY |
|
|
|
|
|
|
|
Current Liabilities: |
|
|
|
|
|
|
|
Accounts payable and accrued liabilities |
|
$ |
24,318 |
|
$ |
26,154 |
|
Film rent payable |
|
|
6,430 |
|
|
8,661 |
|
Debt - current portion |
|
|
34,374 |
|
|
30,393 |
|
Derivative financial instruments - current portion |
|
|
105 |
|
|
41 |
|
Taxes payable - current |
|
|
611 |
|
|
1,710 |
|
Deferred current revenue |
|
|
6,406 |
|
|
9,264 |
|
Operating lease liabilities - current portion |
|
|
19,579 |
|
|
— |
|
Other current liabilities |
|
|
9,339 |
|
|
9,305 |
|
Total current liabilities |
|
|
101,162 |
|
|
85,528 |
|
Debt - long-term portion |
|
|
131,681 |
|
|
106,286 |
|
Derivative financial instruments - non-current portion |
|
|
291 |
|
|
145 |
|
Subordinated debt, net |
|
|
26,255 |
|
|
26,061 |
|
Noncurrent tax liabilities |
|
|
11,647 |
|
|
11,530 |
|
Operating lease liabilities - non-current portion |
|
|
210,737 |
|
|
— |
|
Other liabilities |
|
|
12,330 |
|
|
28,931 |
|
Total liabilities |
|
|
494,103 |
|
|
258,481 |
|
Commitments and contingencies (Note 13) |
|
|
|
|
|
|
|
Stockholders’ equity: |
|
|
|
|
|
|
|
Class A non-voting common stock, par value $0.01 , 100,000,000 shares authorized, |
|
|
|
|
|
|
|
32,963,489 issued and 20,404,573 outstanding at September 30, 2019 and 33,112,337 issued and 21,194,748 outstanding at December 31, 2018 |
|
|
231 |
|
|
232 |
|
Class B voting common stock, par value $0.01 , 20,000,000 shares authorized and |
|
|
|
|
|
|
|
1,680,590 issued and outstanding at September 30, 2019 and December 31, 2018 |
|
|
17 |
|
|
17 |
|
Nonvoting preferred stock, par value $0.01 , 12,000 shares authorized and no issued |
|
|
|
|
|
|
|
or outstanding shares at September 30, 2019 and December 31, 2018 |
|
|
— |
|
|
— |
|
Additional paid-in capital |
|
|
148,236 |
|
|
147,452 |
|
Retained earnings |
|
|
48,859 |
|
|
47,616 |
|
Treasury shares |
|
|
(36,541) |
|
|
(25,222) |
|
Accumulated other comprehensive income |
|
|
(1,288) |
|
|
6,115 |
|
Total Reading International, Inc. stockholders’ equity |
|
|
159,514 |
|
|
176,210 |
|
Noncontrolling interests |
|
|
4,199 |
|
|
4,337 |
|
Total stockholders’ equity |
|
|
163,713 |
|
|
180,547 |
|
Total liabilities and stockholders’ equity |
|
$ |
657,816 |
|
$ |
439,028 |
See accompanying Notes to the Unaudited Consolidated Financial Statements.
3
READING INTERNATIONAL, INC.
CONSOLIDATED STATEMENTS OF INCOME
( Unaudited; U.S. dollars in thousands, except per share data)
|
|
|
|
|
|
|
|
|
|
|
|
|
|
|
|
|
|
|
|
|
|
|
|
|
|
|
|
|
|
|
Quarter Ended |
|
Nine Months Ended |
||||||||
|
|
|
September 30, |
|
September 30, |
||||||||
|
|
|
2019 |
|
2018 |
|
2019 |
|
2018 |
||||
|
Revenue |
|
|
|
|
|
|
|
|
|
|
|
|
|
Cinema |
|
$ |
66,733 |
|
|
70,671 |
|
$ |
197,101 |
|
$ |
223,109 |
|
Real estate |
|
|
3,723 |
|
|
3,590 |
|
|
11,001 |
|
|
11,286 |
|
Total revenue |
|
|
70,456 |
|
|
74,261 |
|
|
208,102 |
|
|
234,395 |
|
Costs and expenses |
|
|
|
|
|
|
|
|
|
|
|
|
|
Cinema |
|
|
(53,709) |
|
|
(54,929) |
|
|
(158,273) |
|
|
(170,183) |
|
Real estate |
|
|
(2,225) |
|
|
(2,475) |
|
|
(7,108) |
|
|
(7,408) |
|
Depreciation and amortization |
|
|
(5,704) |
|
|
(5,829) |
|
|
(16,870) |
|
|
(16,705) |
|
General and administrative |
|
|
(5,908) |
|
|
(6,489) |
|
|
(18,426) |
|
|
(21,250) |
|
Total costs and expenses |
|
|
(67,546) |
|
|
(69,722) |
|
|
(200,677) |
|
|
(215,546) |
|
Operating income (loss) |
|
|
2,910 |
|
|
4,539 |
|
|
7,425 |
|
|
18,849 |
|
Interest expense, net |
|
|
(1,871) |
|
|
(1,748) |
|
|
(5,924) |
|
|
(5,132) |
|
Gain (loss) on sale of assets |
|
|
(1) |
|
|
— |
|
|
(1) |
|
|
— |
|
Other income (expense) |
|
|
141 |
|
|
(130) |
|
|
190 |
|
|
(273) |
|
Income (loss) before income tax expense and equity earnings of unconsolidated joint ventures |
|
|
1,179 |
|
|
2,661 |
|
|
1,690 |
|
|
13,444 |
|
Equity earnings of unconsolidated joint ventures |
|
|
220 |
|
|
80 |
|
|
581 |
|
|
667 |
|
Income (loss) before income taxes |
|
|
1,399 |
|
|
2,741 |
|
|
2,271 |
|
|
14,111 |
|
Income tax benefit (expense) |
|
|
(547) |
|
|
(1,482) |
|
|
(1,159) |
|
|
(4,618) |
|
Net income (loss) |
|
$ |
852 |
|
$ |
1,259 |
|
$ |
1,112 |
|
$ |
9,493 |
|
Less: net income (loss) attributable to noncontrolling interests |
|
|
(50) |
|
|
(38) |
|
|
(103) |
|
|
88 |
|
Net income (loss) attributable to Reading International, Inc. common shareholders |
|
$ |
902 |
|
$ |
1,297 |
|
$ |
1,215 |
|
$ |
9,405 |
|
Basic earnings (loss) per share attributable to Reading International, Inc. shareholders |
|
$ |
0.04 |
|
$ |
0.06 |
|
$ |
0.05 |
|
$ |
0.41 |
|
Diluted earnings (loss) per share attributable to Reading International, Inc. shareholders |
|
$ |
0.04 |
|
$ |
0.06 |
|
$ |
0.05 |
|
$ |
0.41 |
|
Weighted average number of shares outstanding–basic |
|
|
22,546,827 |
|
|
23,006,040 |
|
|
22,791,530 |
|
|
22,988,227 |
|
Weighted average number of shares outstanding–diluted |
|
|
22,688,230 |
|
|
23,197,924 |
|
|
22,952,838 |
|
|
23,185,021 |
See accompanying Notes to the Unaudited Consolidated Financial Statements .
4
READING INTERNATIONAL, INC.
C ONSOLIDATED STATEMENTS OF COMPREHENSIVE INCOME
( Unaudited; U.S. dollars in thousands)
|
|
||||||||||||
|
|
|
Quarter Ended |
|
Nine Months Ended |
||||||||
|
|
|
September 30, |
|
September 30, |
||||||||
|
|
|
2019 |
|
2018 |
|
2019 |
|
2018 |
||||
|
Net income (loss) |
|
$ |
852 |
|
$ |
1,259 |
|
$ |
1,112 |
|
$ |
9,493 |
|
Foreign currency translation gain (loss) |
|
|
(6,598) |
|
|
(3,547) |
|
|
(7,355) |
|
|
(12,318) |
|
Gain (loss) on cash flow hedges |
|
|
(20) |
|
|
— |
|
|
(211) |
|
|
— |
|
Other |
|
|
51 |
|
|
53 |
|
|
159 |
|
|
155 |
|
Comprehensive income (loss) |
|
|
(5,715) |
|
|
(2,235) |
|
|
(6,295) |
|
|
(2,670) |
|
Less: net income (loss) attributable to noncontrolling interests |
|
|
(50) |
|
|
(38) |
|
|
(103) |
|
|
88 |
|
Less: comprehensive income (loss) attributable to noncontrolling interests |
|
|
(2) |
|
|
(5) |
|
|
(2) |
|
|
(15) |
|
Comprehensive income (loss) attributable to Reading International, Inc. |
|
$ |
(5,663) |
|
|
(2,192) |
|
$ |
(6,190) |
|
$ |
(2,743) |
See accompanying Notes to the Unaudited Consolidated Financial Statements .
5
READING INTERNATIONAL, INC.
CON SOLIDATED STATEMENTS OF CASH FLOWS
( Unaudited; U.S. dollars in thousands)
|
|
||||||
|
|
Nine Months Ended |
|||||
|
|
September 30, |
|||||
|
|
2019 |
2018 |
||||
|
Operating Activities |
||||||
|
Net income (loss) |
$ |
1,112 |
$ |
9,493 | ||
|
Adjustments to reconcile net income (loss) to net cash provided by operating activities: |
||||||
|
Equity earnings of unconsolidated joint ventures |
(581) | (667) | ||||
|
Distributions of earnings from unconsolidated joint ventures |
760 | 532 | ||||
|
Amortization of operating leases |
15,719 |
— |
||||
|
Amortization of finance leases |
121 |
— |
||||
|
Change in operating lease liabilities |
(15,209) |
— |
||||
|
Interest on hedged derivatives |
1 |
— |
||||
|
Change in net deferred tax assets |
272 | (888) | ||||
|
Depreciation and amortization |
16,870 | 16,705 | ||||
|
Other amortization |
1,088 | 7 | ||||
|
Stock based compensation expense |
1,097 | 1,066 | ||||
|
Net changes in operating assets and liabilities: |
||||||
|
Receivables |
3,393 | 4,492 | ||||
|
Prepaid and other assets |
(4,757) | (545) | ||||
|
Payments for accrued pension |
(513) | (2,655) | ||||
|
Accounts payable and accrued expenses |
(3,165) | 411 | ||||
|
Film rent payable |
(2,129) | (6,366) | ||||
|
Taxes payable |
(1,091) | (877) | ||||
|
Deferred revenue and other liabilities |
(2,191) | (1,636) | ||||
|
Net cash provided by (used in) operating activities |
10,797 | 19,072 | ||||
|
Investing Activities |
||||||
|
Insurance recoveries relating to property damage and demolition costs |
168 |
— |
||||
|
Purchases of and additions to operating and investment properties |
(33,205) | (50,118) | ||||
|
Acquisition of business combinations |
(1,380) |
— |
||||
|
Change in restricted cash |
1,334 | (1,556) | ||||
|
Net cash provided by (used in) investing activities |
(33,083) | (51,674) | ||||
|
Financing Activities |
||||||
|
Repayment of long-term borrowings |
(31,692) | (29,546) | ||||
|
Repayment of finance lease principal |
(120) |
— |
||||
|
Proceeds from borrowings |
58,677 | 65,213 | ||||
|
Capitalized borrowing costs |
(502) |
— |
||||
|
Repurchase of Class A Nonvoting Common Stock |
(7,800) | (397) | ||||
|
(Cash paid) proceeds from the settlement of employee share transactions |
(315) | 340 | ||||
|
Noncontrolling interest contributions |
55 | 75 | ||||
|
Noncontrolling interest distributions |
(42) | (117) | ||||
|
Net cash provided by (used in) financing activities |
18,261 | 35,568 | ||||
|
Effect of exchange rate changes on cash and cash equivalents |
(394) | (920) | ||||
|
Net decrease in cash and cash equivalents |
(4,419) | 2,046 | ||||
|
Cash and cash equivalents at January 1 |
13,127 | 13,668 | ||||
|
Cash and cash equivalents at September 30 |
$ |
8,708 |
$ |
15,714 | ||
|
Supplemental Disclosures |
||||||
|
Interest paid |
$ |
8,134 |
$ |
5,762 | ||
|
Income taxes paid |
5,669 | 6,365 | ||||
|
Non-Cash Transactions |
||||||
|
Additions to operating and investing properties through accrued expenses |
5,768 | 2,911 | ||||
See accompanying Notes to the Unaudited Consolidated Financial Statements .
6
READING INTERNATIONAL, INC.
NOTES TO CONSOLIDATED FINANCIAL STATEMENTS (Unaudited)
Note 1 – Description of Business and Segment Reporting
The Company
Reading International, Inc., a Nevada corporation (“RDI” and collectively with our consolidated subsidiaries and corporate predecessors, the “Company”, “Reading” and “we”, “us”, or “our”), was incorporated in 1999. Our businesses consist primarily of:
|
|
· |
|
the operation, development and ownership of multiplex cinemas in the United States, Australia, and New Zealand; and, |
|
|
· |
|
the development, ownership, operation and/or rental of retail, commercial and live venue real estate assets in Australia, New Zealand, and the United States. |
Business Segments
Reported below are the operating segments of the Company for which separate financial information is available and evaluated regularly by the Chief Executive Officer, the chief operating decision-maker of the Company. As part of our real estate activities, we hold undeveloped land in urban and suburban centers in Australia, New Zealand, and the United States.
The table below summarizes the results of operations for each of our business segments for the quarter and nine months ended September 30, 2019 and 2018 , respectively. Operating expense includes costs associated with the day-to-day operations of the cinemas and the management of rental properties, including our live theater assets.
|
|
||||||||||||
|
|
Quarter Ended |
Nine Months Ended |
||||||||||
|
|
September 30, |
September 30, |
||||||||||
|
(Dollars in thousands) |
2019 |
2018 |
2019 |
2018 |
||||||||
|
Revenue: |
||||||||||||
|
Cinema exhibition |
$ |
66,733 |
$ |
70,671 |
$ |
197,101 |
$ |
223,109 | ||||
|
Real estate |
5,531 | 5,771 | 16,525 | 18,204 | ||||||||
|
Inter-segment elimination |
(1,808) | (2,181) | (5,524) | (6,918) | ||||||||
|
|
$ |
70,456 |
$ |
74,261 |
$ |
208,102 |
$ |
234,395 | ||||
|
Segment operating income (loss): |
||||||||||||
|
Cinema exhibition |
$ |
6,021 |
$ |
8,202 |
$ |
17,931 |
$ |
30,983 | ||||
|
Real estate |
1,485 | 1,260 | 3,987 | 4,896 | ||||||||
|
|
$ |
7,506 |
$ |
9,462 |
$ |
21,918 |
$ |
35,879 | ||||
A reconciliation of segment operating income to income before income taxes is as follows:
|
|
||||||||||||
|
|
Quarter Ended |
Nine Months Ended |
||||||||||
|
|
September 30, |
September 30, |
||||||||||
|
(Dollars in thousands) |
2019 |
2018 |
2019 |
2018 |
||||||||
|
Segment operating income (loss) |
$ |
7,506 |
$ |
9,462 |
$ |
21,918 |
$ |
35,879 | ||||
|
Unallocated corporate expense |
||||||||||||
|
Depreciation and amortization expense |
(103) | (92) | (288) | (313) | ||||||||
|
General and administrative expense |
(4,493) | (4,831) | (14,205) | (16,717) | ||||||||
|
Interest expense, net |
(1,871) | (1,748) | (5,924) | (5,132) | ||||||||
|
Equity earnings of unconsolidated joint ventures |
220 | 80 | 581 | 667 | ||||||||
|
Gain (loss) on sale of assets |
(1) |
— |
(1) |
— |
||||||||
|
Other income (expense) |
141 | (130) | 190 | (273) | ||||||||
|
Income (loss) before income tax expense |
$ |
1,399 |
$ |
2,741 |
$ |
2,271 |
$ |
14,111 | ||||
Note 2 – Summary of Significant Accounting Policies
Basis of Consolidation
The accompanying consolidated financial statements include the accounts of the Company’s wholly-owned subsidiaries as well as majority-owned subsidiaries that the Company controls, and should be read in conjunction with the Company’s Annual Report on Form 10-K as of and for the year ended December 31, 2018 (“ 2018 Form 10-K”). All significant intercompany balances and transactions have been eliminated on consolidation. These consolidated financial statements were prepared in accordance with accounting principles generally accepted in the United States of America (“U.S. GAAP”) for interim reporting with the instructions for Form 10-Q and Rule 10-01 of Regulation S-X of the Securities and Exchange Commission (“SEC”). As such, they do not include
7
all information and footnotes required by U.S. GAAP for complete financial statements. We believe that we have included all normal and recurring adjustments necessary for a fair presentation of the results for the interim period.
Operating results for the quarter and nine months ended September 30, 2019 are not necessarily indicative of the results that may be expected for the year ending December 31, 2019 .
Use of Estimates
The preparation of consolidated financial statements in conformity with U.S. GAAP requires management to make estimates and assumptions that affect the amounts reported in the consolidated financial statements and footnotes thereto. Significant estimates include (i) projections we make regarding the recoverability and impairment of our assets (including goodwill and intangibles), (ii) valuations of our derivative instruments, (iii) recoverability of our deferred tax assets, (iv) estimation of breakage and redemption experience rates, which drive how we recognize breakage on our gift card and gift certificates, and revenue from our customer loyalty program, and (v) allocation of insurance proceeds to various recoverable components. Actual results may differ from those estimates.
Recently Adopted and Issued Accounting Pronouncements
Adopted:
|
|
1) |
|
Accounting Standards Update (“ASU”) 2016-02 Leases: In February 2016, the Financial Accounting Standards Board (“FASB”) issued a new accounting standard, Accounting Standards Codification (“ ASC ”) 842 Leases , to increase transparency and comparability among organizations by requiring the recognition of right-of-use assets and lease liabilities on the balance sheet. Leases will be classified as either finance or operating, with classification affecting the pattern of expense recognition in the income statement. A modified retrospective transition approach is required for lessees with capital and operating leases existing at, or entered into after, the beginning of the earliest comparative period presented in the financial statements, with certain practical expedients available. |
On January 1, 2019, we adopted the new accounting standard ASC 842 Leases using the modified retrospective method. We recognized the cumulative effect of initially applying the new leasing standard as an adjustment to the opening balance of retained earnings. The comparative information has not been restated and continues to be reported under the accounting standards in effect for those periods. The standard had a material impact on our consolidated balance sheets, but not on our consolidated income statements or statements of cash flow.
|
(Dollars in thousands) |
Balance at
|
Adjustments
|
Balance at
|
||||||
|
Assets |
|||||||||
|
Operating property, net |
$ |
257,667 |
$ |
370 |
$ |
258,037 | |||
|
Operating lease right-of-use assets |
— |
232,319 | 232,319 | ||||||
|
Intangible assets, net |
7,369 | (3,542) | 3,827 | ||||||
|
Deferred tax asset, net |
26,235 | 82 | 26,317 | ||||||
|
Liabilities |
|||||||||
|
Operating lease liabilities |
$ |
— |
$ |
245,280 |
$ |
245,280 | |||
|
Other non-current liabilities |
28,931 | (16,033) | 12,898 | ||||||
|
Stockholders' Equity |
|||||||||
|
Non-controlling interest |
$ |
4,337 |
$ |
(46) |
$ |
4,291 | |||
|
Retained earnings |
47,616 | 28 | 47,644 | ||||||
8
|
|
|
Quarter Ended September 30, 2019 |
|
Nine Months Ended September 30, 2019 |
||||||||||||||
|
(Dollars in thousands) |
|
As Reported, September 30, 2019 |
|
Balances Without Adoption of ASC 842 |
|
Effect of
|
|
As Reported, September 30, 2019 |
|
Balances
|
|
Effect of
|
||||||
|
Cinema costs and expenses |
|
$ |
53,709 |
|
$ |
53,746 |
|
$ |
(37) |
|
$ |
158,273 |
|
$ |
158,357 |
|
$ |
(84) |
|
Depreciation and amortization |
|
|
5,704 |
|
|
5,665 |
|
|
39 |
|
|
16,870 |
|
|
16,749 |
|
|
121 |
|
General and administrative |
|
|
5,908 |
|
|
5,949 |
|
|
(41) |
|
|
18,426 |
|
|
18,554 |
|
|
(128) |
|
Interest expense, net |
|
|
1,871 |
|
|
1,867 |
|
|
4 |
|
|
5,924 |
|
|
5,914 |
|
|
10 |
|
Income tax (benefit) expense |
|
|
547 |
|
|
535 |
|
|
12 |
|
|
1,159 |
|
|
1,132 |
|
|
27 |
|
Net income (loss) |
|
$ |
852 |
|
$ |
829 |
|
$ |
23 |
|
$ |
1,112 |
|
$ |
1,058 |
|
$ |
54 |
|
|
|
|
|
|
|
|
|
|
|
|
(Dollars in thousands) |
|
As Reported,
|
|
Balances
|
|
Effect of
|
|||
|
Assets |
|
|
|
|
|
|
|
|
|
|
Operating property, net |
|
$ |
248,100 |
|
$ |
247,939 |
|
$ |
161 |
|
Intangible assets |
|
|
3,607 |
|
|
6,894 |
|
|
(3,287) |
|
Operating lease right-of-use assets |
|
|
216,963 |
|
|
— |
|
|
216,963 |
|
Deferred tax asset, net |
|
|
25,959 |
|
|
25,904 |
|
|
55 |
|
Liabilities |
|
|
|
|
|
|
|
|
|
|
Other current liabilities |
|
$ |
9,339 |
|
$ |
9,459 |
|
$ |
(120) |
|
Operating lease liabilities, current |
|
|
19,579 |
|
|
— |
|
|
19,579 |
|
Other non-current liabilities |
|
|
12,330 |
|
|
28,727 |
|
|
(16,397) |
|
Operating lease liabilities, non-current |
|
|
210,737 |
|
|
— |
|
|
210,737 |
|
Stockholders' Equity |
|
|
|
|
|
|
|
|
|
|
Retained earnings |
|
$ |
48,859 |
|
$ |
48,805 |
|
$ |
54 |
|
|
2) |
|
ASU 2014-09 Revenue from Contracts with Customers: On January 1, 2018, we adopted the new accounting standard ASC 606 Revenue from Contracts with Customers using the modified retrospective method. We recognized the cumulative effect of initially applying the new revenue standard as an adjustment to the opening balance of retained earnings. The comparative information was not restated. Adoption of this standard has no material effect on our consolidated financial statements. |
|
|
3) |
|
On January 1, 2018, we adopted ASU 2016-18, Statement of Cash Flows ( Topic 230 ) : Restricted Cash, a consensus of the FASB Emerging Issues Task Force . This standard requires that amounts generally described as restricted cash and cash equivalents be combined with unrestricted cash and cash equivalents when reconciling the beginning and end of period balances on the statement of cash flows. Adoption of this standard has no material effect on our consolidated statement of cash flows. |
|
|
4) |
|
On January 1, 2018, we adopted ASU 2 016-15, Statement of Cash Flows (Topic 230): Classification of Certain Cash Receipts and Cash Payments. The standard applies to eight (8) specific cash flow classification issues, reducing the current and potential future diversity in the presentation of certain cash flows. Adoption of this standard has no material effect on our consolidated statement of cash flows. |
|
|
5) |
|
On January 1, 2018, we adopted ASU 2017-07, Compensation—Retirement Benefits (Topic 715): Improving the Presentation of Net Periodic Pension Cost and Net Periodic Postretirement Benefit Cost . This standard (i) requires that an employer disaggregate the service cost component from the other components of net benefit cost, and (ii) specifies how to present the service cost component and the other components of net benefit cost in the income statement and (iii) allows only the service cost component of net benefit cost to be eligible for capitalization. Adoption of this standard has no material impact on our consolidated financial statements. |
|
|
6) |
|
On January 1, 2018, we adopted ASU 2017-01, Business Combinations (Topic 805): Clarifying the Definition of a Business . This ASU provides that when substantially all of the fair value of the gross assets acquired (or disposed of) is concentrated in a single identifiable asset or a group of similar identifiable assets, the asset is not a “business”, thus reducing the number of transactions that need further evaluation for business combination. The standard has no material impact on our current consolidated financial statements, and we do not expect it to be applicable to our consolidated financial statements in the near term unless we enter into a definitive business acquisition transaction. |
9
Issued:
|
|
v |
|
ASUs Effective 2019 and Beyond |
|
|
· |
|
Goodwill Impairment Simplification ( ASU 2017-04, Intangibles – Goodwill and Other (Topic 350): Simplifying the Test for Goodwill Impairment) |
Issued by FASB in January 2017, this standard removes the second step of the two-step impairment test for measuring goodwill and is to be applied on a prospective basis only. The new standard is effective for the Company on January 1, 2020, including interim periods within the year of adoption. Early adoption is permitted for interim or annual goodwill impairment tests performed on testing dates after January 1, 2017. Early adoption is not being contemplated. It is not anticipated that adoption of this standard will have any material impact on our consolidated financial statements.
Note 3 – Operations in Foreign Currency
We have significant assets in Australia and New Zealand. Historically, we have conducted our Australian and New Zealand operations (collectively “foreign operations”) on a self-funding basis where we use cash flows generated by our foreign operations to pay for the expense of foreign operations. Our Australian and New Zealand assets and liabilities are translated from their functional currencies of Australian dollar (“AU$”) and New Zealand dollar (“NZ$”), respectively, to the U.S. dollar based on the exchange rate as of September 30, 2019 . The carrying value of the assets and liabilities of our foreign operations fluctuates as a result of changes in the exchange rates between the functional currencies of the foreign operations and the U.S. dollar. The translation adjustments are accumulated in the Accumulated Other Comprehensive Income in the Consolidated Balance Sheets.
Due to the natural- hedge nature of our funding policy, we have not historically used derivative financial instruments to hedge against the risk of foreign currency exposure. However, in certain circumstances, we move funds between jurisdictions where circumstances encouraged us to do so from an overall economic standpoint. Going forward, particularly in light of recent tax law changes, we intend to take a more global view of our financial resources, and to be more flexible in making use of resources from one jurisdiction in other jurisdictions.
Presented in the table below are the currency exchange rates for Australia and New Zealand:
|
|
|||||||||
|
|
Foreign Currency / USD |
||||||||
|
|
As of and
|
As of and for the nine months ended |
As of and
|
As of and
|
As of and for the nine months ended |
||||
|
|
September 30, 2019 |
December 31, 2018 |
September 30, 2018 |
||||||
|
Spot Rate |
|||||||||
|
Australian Dollar |
0.6746 |
0.7046 |
0.7238 |
||||||
|
New Zealand Dollar |
0.6262 |
0.6711 |
0.6635 |
||||||
|
Average Rate |
|||||||||
|
Australian Dollar |
0.6856 |
0.6993 |
0.7479 |
0.7311 |
0.7580 |
||||
|
New Zealand Dollar |
0.6486 |
0.6643 |
0.6930 |
0.6685 |
0.7002 |
||||
Note 4 – Earnings Per Share
Basic earnings per share (“EPS”) is calculated by dividing the net income attributable to the Company’s common stockholders by the weighted average number of common shares outstanding during the period. Diluted EPS is calculated by dividing the net income attributable to the Company’s common stockholders by the weighted average number of common and common equivalent shares outstanding during the period and is calculated using the treasury stock method for equity-based compensation awards .
10
The following table sets forth the computation of basic and diluted EPS and a reconciliation of the weighted average number of common and common equivalent shares outstanding:
|
|
|
|
|
|
|
|
|
|
|
|
|
|
|
|
|
|
|
|
|
|
|
|
|
|
|
|
|
|
|
Quarter Ended |
|
Nine Months Ended |
||||||||
|
|
|
September 30, |
|
September 30, |
||||||||
|
(Dollars in thousands, except share data) |
|
2019 |
|
2018 |
|
2019 |
|
2018 |
||||
|
Numerator: |
|
|
|
|
|
|
|
|
|
|
|
|
|
Net income (loss) attributable to RDI common stockholders |
|
$ |
902 |
|
$ |
1,297 |
|
$ |
1,215 |
|
$ |
9,405 |
|
Denominator: |
|
|
|
|
|
|
|
|
|
|
|
|
|
Weighted average number of common stock – basic |
|
|
22,546,827 |
|
|
23,006,040 |
|
|
22,791,530 |
|
|
22,988,227 |
|
Weighted average dilutive impact of awards |
|
|
141,403 |
|
|
191,884 |
|
|
161,308 |
|
|
196,794 |
|
Weighted average number of common stock – diluted |
|
|
22,688,230 |
|
|
23,197,924 |
|
|
22,952,838 |
|
|
23,185,021 |
|
Basic earnings (loss) per share attributable to RDI common stockholders |
|
$ |
0.04 |
|
$ |
0.06 |
|
$ |
0.05 |
|
$ |
0.41 |
|
Diluted earnings (loss) per share attributable to RDI common stockholders |
|
$ |
0.04 |
|
$ |
0.06 |
|
$ |
0.05 |
|
$ |
0.41 |
|
Awards excluded from diluted earnings (loss) per share |
|
|
516,010 |
|
|
276,681 |
|
|
516,010 |
|
|
126,840 |
Our weighted average number of common stock - basic decrea sed, primarily as a result of the repurchase of shares of Class A Non-Voting Common Stock pursuant to our current stock repurchase program offset by the issuance of shares due to the exercise of share options and vesting of restricted stock units. During the first nine months of 2019, we repurchased 856,563 shares of Class A Non-Voting Common Stock at an average price of $13.20 per share.
Note 5 – Property and Equipment
Operating Property, net
As of September 30, 2019 and December 31, 2018 , property associated with our operating activities is summarized as follows:
|
|
||||||
|
|
September 30, |
December 31, |
||||
|
(Dollars in thousands) |
2019 |
2018 |
||||
|
Land |
$ |
73,675 |
$ |
75,689 | ||
|
Building and improvements |
143,408 | 149,734 | ||||
|
Leasehold improvements |
55,867 | 55,299 | ||||
|
Fixtures and equipment |
172,687 | 167,943 | ||||
|
Construction-in-progress |
7,032 | 3,478 | ||||
|
Total cost |
452,669 | 452,143 | ||||
|
Less: accumulated depreciation |
(204,569) | (194,476) | ||||
|
Operating property, net |
$ |
248,100 |
$ |
257,667 | ||
Depreciation expense for operating property was $5.5 million and $16.3 million for the quarter and nine months ended September 30, 2019 and $5.4 million and $15.6 million for the quarter and nine months ended September 30, 2018 , respectively.
Investment and Development Property, net
As of September 30, 2019 and December 31, 2018 , our investment and development property is summarized below:
|
|
||||||
|
|
September 30, |
December 31, |
||||
|
(Dollars in thousands) |
2019 |
2018 |
||||
|
Land |
$ |
23,392 |
$ |
24,371 | ||
|
Building |
1,900 | 1,900 | ||||
|
Construction-in-progress (including capitalized interest) |
82,000 | 60,533 | ||||
|
Investment and development property |
$ |
107,292 |
$ |
86,804 | ||
11
Construction-in-Progress – Operating and Investing Properties
Construction-in-Progress balances are included in both our operating and development properties. The balances of our major projects along with the movements for the nine months ended September 30, 2019 are shown below:
|
|
|||||||||||||||
|
(Dollars in thousands) |
Balance,
|
Additions during the period (1) |
Completed
|
Foreign
|
Balance, September 30, 2019 |
||||||||||
|
Union Square development |
$ |
55,634 |
$ |
21,098 |
$ |
— |
$ |
— |
$ |
76,732 | |||||
|
Courtenay Central development |
5,571 | 611 | (40) | (411) | 5,731 | ||||||||||
|
Cinema developments and improvements |
1,664 | 13,470 | (9,931) | (75) | 5,128 | ||||||||||
|
Other real estate projects |
1,142 | 717 | (338) | (80) | 1,441 | ||||||||||
|
Total |
$ |
64,011 |
$ |
35,896 |
$ |
(10,309) |
$ |
(566) |
$ |
89,032 | |||||
|
|
(1) |
|
Includes capitalized interest of $2.2 million and $4.9 million for the quarter and nine months ended September 30, 2019 . |
Real Estate Transactions
Purchase of Income Producing Property at Auburn/Redyard, Australia – On June 29, 2018, we added 20,870 square feet of land, improved with a 16,830 square foot office building, to our Auburn/Redyard entertainment-themed center (“ ETC ”) . The property was acquired at auction for $3.5 million ( AU$4.5 million) and is bordered by our existing ETC on three sides. The property is leased to Telstra through July 2022. This lease will allow us time to plan for the efficient integration of the property into our ETC. With this acquisition, Auburn/Redyard now represents approximately 519,992 square feet ( 48,309 square meters) of land, with approximately 1,620 feet ( 498 meters) of uninterrupted frontage to Parramatta Road, a major Sydney arterial motorway .
Purchase of Land at Cannon Park in Townsville, Australia – On June 13, 2018, we acquired a 163,000 square foot ( 15,150 square meter) parcel of land at our Cannon Park ETC, in connection with the restructuring of our relationship with the adjacent land owner. Prior to the restructuring, this parcel was commonly owned by us and the adjoining land owner. In the restructuring, the adjoining land owner conveyed to us its interest in the parcel for AU$1 . We granted the adjoining land owner certain access rights with respect to that parcel.
Exercise of Option to Acquire Ground Lessee’s interest in Ground Lease and Improvements Constituting the Village East Cinema – On August 28, 2019, we exercised our option to acquire the ground lessee’s interest in the 13 year ground lease underlying and the real property assets constituting our Village East Cinema in Manhattan. The purchase price under the option is $5.9 million. It is anticipated that the transaction will close on or about May 31, 2020 .
Note 6 – Investments in Unconsolidated Joint Ventures
Our investments in unconsolidated joint ventures are accounted for under the equity method of accounting.
The table below summarizes our active investment holdings in two (2) unconsolidated joint ventures as of September 30, 2019 and December 31, 2018 :
|
|
||||||||
|
|
September 30, |
December 31, |
||||||
|
(Dollars in thousands) |
Interest |
2019 |
2018 |
|||||
|
Rialto Cinemas |
50.0% |
$ |
1,112 |
$ |
1,260 | |||
|
Mt. Gravatt |
33.3% |
3,609 | 3,861 | |||||
|
Total investments |
$ |
4,721 |
$ |
5,121 | ||||
For the quarter and nine months ended September 30, 2019 and 2018 , the recognized share of equity earnings from our investments in unconsolidated joint ventures are as follows:
|
|
||||||||||||
|
|
Quarter Ended |
Nine Months Ended |
||||||||||
|
|
September 30, |
September 30, |
||||||||||
|
(Dollars in thousands) |
2019 |
2018 |
2019 |
2018 |
||||||||
|
Rialto Cinemas |
$ |
64 |
$ |
— |
$ |
78 |
$ |
152 | ||||
|
Mt. Gravatt |
156 | 80 | 503 | 515 | ||||||||
|
Total equity earnings |
$ |
220 |
$ |
80 |
$ |
581 |
$ |
667 | ||||
12
Note 7 – Goodwill and Intangible Assets
The table below summarizes goodwill by business segment as of September 30, 2019 and December 31, 2018 .
|
|
|||||||||
|
(Dollars in thousands) |
Cinema |
Real Estate |
Total |
||||||
|
Balance at December 31, 2018 |
$ |
14,221 |
$ |
5,224 |
$ |
19,445 | |||
|
Change in goodwill due to a purchase of a business combination |
1,225 |
— |
1,225 | ||||||
|
Foreign currency translation adjustment |
(757) |
— |
(757) | ||||||
|
Balance at September 30, 2019 |
$ |
14,689 |
$ |
5,224 |
$ |
19,913 | |||
The Company is required to test goodwill and other intangible assets for impairment on an annual basis and, if current events or circumstances require, on an interim basis. Our next annual evaluation of goodwill and other intangible assets is scheduled during the fourth quarter of 2019 . To test the impairment of goodwill, the Company compares the fair value of each reporting unit to its carrying amount, including the goodwill, to determine if there is potential goodwill impairment. A reporting unit is generally one level below the operating segment. As of September 30, 2019 , we were not aware that any events indicating potential impairment of goodwill had occurred.
The tables below summarize intangible assets other than goodwill, as of September 30, 2019 and December 31, 2018 , respectively.
|
|
||||||||||||
|
|
As of September 30, 2019 |
|||||||||||
|
(Dollars in thousands) |
Beneficial
|
Trade
|
Other
|
Total |
||||||||
|
Gross carrying amount |
$ |
14,973 |
$ |
7,258 |
$ |
2,262 |
$ |
24,493 | ||||
|
Less: Accumulated amortization |
(14,388) | (5,389) | (1,109) | (20,886) | ||||||||
|
Net intangible assets other than goodwill |
$ |
585 |
$ |
1,869 |
$ |
1,153 |
$ |
3,607 | ||||
|
|
||||||||||||
|
|
As of December 31, 2018 |
|||||||||||
|
(Dollars in thousands) |
Beneficial
|
Trade
|
Other
|
Total |
||||||||
|
Gross carrying amount |
$ |
28,592 |
$ |
7,254 |
$ |
1,951 |
$ |
37,797 | ||||
|
Less: Accumulated amortization |
(24,145) | (5,207) | (1,076) | (30,428) | ||||||||
|
Net intangible assets other than goodwill |
$ |
4,447 |
$ |
2,047 |
$ |
875 |
$ |
7,369 | ||||
Beneficial leases were amortized over the life of the lease up to 30 years up until January 1, 2019. Under ASC 842 they are now incorporated into the relevant right-of-use asset. Trade names are amortized based on the accelerated amortization method over their estimated useful life of 30 years, and other intangible assets are amortized over their estimated useful lives of up to 30 years (except for transferrable liquor licenses, which are indefinite-lived assets). The table below summarizes the amortization expense of intangible assets for the quarter and nine months ended September 30, 2019 .
|
|
||||||||||||
|
|
Quarter Ended |
Nine Months Ended |
||||||||||
|
|
September 30, |
September 30, |
||||||||||
|
(Dollars in thousands) |
2019 |
2018 |
2019 |
2018 |
||||||||
|
Beneficial lease amortization |
$ |
60 |
$ |
284 |
$ |
224 |
$ |
783 | ||||
|
Other amortization |
106 | 380 | 311 | 285 | ||||||||
|
Total intangible assets amortization |
$ |
166 |
$ |
664 |
$ |
535 |
$ |
1,068 | ||||
13
Note 8 – Prepaid and Other Assets
Prepaid and other assets are summarized as follows:
|
|
||||||
|
|
September 30, |
December 31, |
||||
|
(Dollars in thousands) |
2019 |
2018 |
||||
|
Prepaid and other current assets |
||||||
|
Prepaid expenses |
$ |
2,887 |
$ |
1,761 | ||
|
Prepaid rent |
895 | 930 | ||||
|
Prepaid taxes |
632 | 646 | ||||
|
Income taxes receivable |
6,148 | 2,704 | ||||
|
Deposits |
218 | 242 | ||||
|
Investment in marketable securities |
44 | 42 | ||||
|
Restricted cash |
7 | 1,342 | ||||
|
Total prepaid and other current assets |
$ |
10,831 |
$ |
7,667 | ||
|
Other non-current assets |
||||||
|
Straight-line rent |
4,184 | 4,150 | ||||
|
Other non-cinema and non-rental real estate assets |
1,134 | 1,134 | ||||
|
Investment in Reading International Trust I |
838 | 838 | ||||
|
Long-term deposits |
8 | 7 | ||||
|
Total other non-current assets |
$ |
6,164 |
$ |
6,129 | ||
Note 9 – Income Taxes
The interim provision for income taxes is different from the amount determined by applying the U.S. federal statutory rate to consolidated income before taxes. The differences are attributable to foreign tax rate differential, unrecognized tax benefits, and foreign tax credit. Our effective tax rate was 51.1% and 32.7% for the nine months ended September 30, 2019 and 2018, respectively. The change between 2019 and 2018 is primarily due to lower pretax income and accrued interest related to uncertain tax benefits.
Note 10 – Debt
The Company’s borrowings at September 30, 2019 and December 31, 2018 , net of deferred financing costs and including the impact of interest rate derivatives on effective interest rates, are summarized below:
|
|
|||||||||||||||
|
|
As of September 30, 2019 |
||||||||||||||
|
(Dollars in thousands) |
Maturity Date |
Contractual
|
Balance,
|
Balance,
|
Stated
|
Effective
|
|||||||||
|
Denominated in USD |
|||||||||||||||
|
Trust Preferred Securities (USA) |
April 30, 2027 |
$ |
27,913 |
$ |
27,913 |
$ |
26,228 |
6.27% |
6.27% |
||||||
|
Bank of America Credit Facility (USA) |
October 1, 2020 |
55,000 | 27,000 | 26,959 |
4.79% |
4.79% |
|||||||||
|
Bank of America Line of Credit (USA) |
October 1, 2020 |
5,000 | 5,000 | 5,000 |
5.04% |
5.04% |
|||||||||
|
Banc of America digital projector loan (USA) |
December 28, 2019 |
706 | 706 | 706 |
5.00% |
5.00% |
|||||||||
|
Cinemas 1, 2, 3 Term Loan (USA) |
December 1, 2019 |
18,767 | 18,767 | 18,597 |
3.25% |
3.25% |
|||||||||
|
Minetta & Orpheum Theatres Loan (USA) (2) |
November 1, 2023 |
8,000 | 8,000 | 7,880 |
4.15% |
5.15% |
|||||||||
|
U.S. Corporate Office Term Loan (USA) |
January 1, 2027 |
9,320 | 9,320 | 9,210 |
4.64% / 4.44% |
4.61% |
|||||||||
|
Purchase Money Promissory Note |
September 18, 2024 |
3,519 | 3,519 | 3,519 |
5.00% |
5.00% |
|||||||||
|
Union Square Construction Financing (USA) |
December 29, 2019 |
50,000 | 32,350 | 31,915 |
6.27% |
6.27% |
|||||||||
|
Denominated in foreign currency ("FC") (3) |
|||||||||||||||
|
NAB Corporate Term Loan (AU) |
December 31, 2023 |
80,952 | 54,977 | 54,782 |
1.91% |
1.91% |
|||||||||
|
Westpac Bank Corporate (NZ) |
December 31, 2023 |
20,038 | 7,514 | 7,514 |
3.05% |
3.05% |
|||||||||
|
|
$ |
279,215 |
$ |
195,066 |
$ |
192,310 | |||||||||
|
|
(1) |
|
Net of deferred financing costs amounting to
$2.8
million.
|
|
|
(2) |
|
The interest rate derivative associated with the Minetta & Orpheum loan provides for an effective fixed rate of 5.15% . |
|
|
(3) |
|
The contractual facilities a nd outstanding balances of the foreign currency denominated borrowings were translated into U.S. dollars based on the applicable exchange rates as of September 30, 2019 . |
14
|
|
|
|
|
|
|
|
|
|
|
|
|
|
|
|
|
|
|
|
|
|
|
|
|
|
|
|
|
|
|
|
|
|
|
|
|
As of December 31, 2018 |
|||||||||||||
|
(Dollars in thousands) |
|
Maturity Date |
|
Contractual
|
|
Balance,
|
|
Balance, Net (1) |
|
Stated
|
|
Effective Interest Rate |
|||
|
Denominated in USD |
|
|
|
|
|
|
|
|
|
|
|
|
|
|
|
|
Trust Preferred Securities (USA) (2) |
|
April 30, 2027 |
|
$ |
27,913 |
|
$ |
27,913 |
|
$ |
26,061 |
|
6.52% |
|
6.52% |
|
Bank of America Credit Facility (USA) (2) |
|
May 1, 2020 |
|
|
55,000 |
|
|
25,000 |
|
|
25,000 |
|
5.02% |
|
5.02% |
|
Bank of America Line of Credit (USA) |
|
October 31, 2019 |
|
|
5,000 |
|
|
— |
|
|
— |
|
5.48% |
|
5.48% |
|
Banc of America digital projector loan (USA) |
|
December 28, 2019 |
|
|
2,604 |
|
|
2,604 |
|
|
2,604 |
|
5.00% |
|
5.00% |
|
Cinemas 1, 2, 3 Term Loan (USA) |
|
September 1, 2019 |
|
|
19,086 |
|
|
19,086 |
|
|
18,838 |
|
3.25% |
|
3.25% |
|
Minetta & Orpheum Theatres Loan (USA) |
|
November 1, 2023 |
|
|
8,000 |
|
|
8,000 |
|
|
7,857 |
|
4.88% |
|
4.88% |
|
U.S. Corporate Office Term Loan (USA) |
|
January 1, 2027 |
|
|
9,495 |
|
|
9,495 |
|
|
9,373 |
|
4.64% / 4.44% |
|
4.61% |
|
Union Square Construction Financing (USA) |
|
December 29, 2019 |
|
|
57,500 |
|
|
27,182 |
|
|
25,280 |
|
6.76% / 12.51% |
|
8.35% |
|
Denominated in foreign currency ("FC") (3) |
|
|
|
|
|
|
|
|
|
|
|
|
|
|
|
|
NAB Corporate Loan Facility (AU) |
|
December 31, 2023 |
|
|
46,856 |
|
|
37,696 |
|
|
37,660 |
|
3.05% |
|
3.05% |
|
Westpac Corporate Credit Facility (NZ) |
|
December 31, 2023 |
|
|
21,475 |
|
|
10,067 |
|
|
10,067 |
|
3.80% |
|
3.80% |
|
|
|
|
|
$ |
252,929 |
|
$ |
167,043 |
|
$ |
162,740 |
|
|
|
|
|
|
(1) |
|
Net of deferred financing costs amounting to $4.3 million. |
|
|
(2) |
|
The interest rate derivatives associated with the Trust Preferred Securities and the Bank of America Credit Facility expired in October 2017 so the effective interest rate no longer applie d as of December 31, 2018. |
|
|
(3) |
|
The contractual facilities and outstanding balances of the foreign currency denominated borrowings were translated into U.S. dollars based on the applicable exchange rates as of December 31, 2018 . |
Our loan arrangements are presented, net of the deferred financing costs, on the face of our consolidated balance sheet as follows:
|
|
||||||
|
|
September 30, |
December 31, |
||||
|
Balance Sheet Caption |
2019 |
2018 |
||||
|
Debt - current portion |
$ |
34,374 |
$ |
30,393 | ||
|
Debt - long-term portion |
131,681 | 106,286 | ||||
|
Subordinated debt |
26,255 | 26,061 | ||||
|
Total borrowings |
$ |
192,310 |
$ |
162,740 | ||
Bank of America Credit Facility
On March 3, 2016, we amended our $55.0 million credit facility with Bank of America to permit real property acquisition loans. This amendment reduces the applicable consolidated leverage ratio covenant by 0.25% and modifies the term of the facility based on the earlier of the eighteen months from the date of such borrowing or the maturity date of the credit agreement. Such modification was not considered substantial in accordance with U.S. GAAP. On March 5, 2019, this Credit Facility was extended for six (6) months to May 1, 2020 . On August 8, 2019, this Credit Facility was extended by an additional four months to September 1, 2020 . On November 5, 2019, this Credit Facility was further extended by an additional one month to October 1, 2020.
Bank of America Line of Credit
In October 2016, the term of this $5.0 million line of credit was extended to October 31, 2019 . Such modification was not considered to be substantial under US GAAP. On August 8, 2019, this Line of Credit was extended an additional ten months to September 1, 2020 . On November 5, 2019, this Line of Credit was further extended by an additional one month to October 1, 2020.
Minetta and Orpheum Theatres Loan
On October 12, 2018, we refinanced our $7.5 million loan with Santander Bank, which is secured by our Minetta and Orpheum Theatres, with a loan for a five year term of $8.0 million. Such modification was not considered to be substantial under US GAAP.
Banc of America Digital Projector Loan
On February 5, 2018, we purchased our U.S. digital cinema projectors, which had previously been held on operating leases, using a $4.6 million loan from Banc of America. We made further U.S. digital projector purchases, of projectors similarly held on other operating leases, in March and April 2018, increasing this loan to $4.9 million. This loan carries an interest rate of 5% and is due and payable December 28, 2019.
15
44 Union Square Construction Financing
On December 29, 2016, we closed on our new construction finance facilities totaling $57.5 million to fund the non-equity portion of the anticipated construction costs of the redevelopment of our property at 44 Union Square in New York City. The combined facilities consisted of $50.0 million in aggregate loans (comprised of three loan tranches) from Bank of the Ozarks, and a $7.5 million mezzanine loan from Tammany Mezz Investor, LLC, an affiliate of Fisher Brothers. At December 31, 2016, Bank of the Ozarks advanced $8.0 million to repay the then existing $8.0 million loan with East West Bank. As of September 30, 2019 , an additional $24.4 million had been advanced under the senior loan facility. On August 8, 2019, we repaid in full the $7.5 million mezzanine loan from Tammany Mezz Investor, LLC.
U.S. Corporate Office Term Loan
On December 13, 2016, we obtained a ten -year $8.4 million mortgage loan on our new Los Angeles Corporate Headquarters at a fixed annual interest rate of 4.64% . This loan provided for a second loan upon completion of certain improvements. On June 26, 2017, we obtained a further $1.5 million under this provision at a fixed annual interest rate of 4.44% .
Cinemas 1,2,3 Term Loan
On August 31, 2016, Sutton Hill Properties LLC (“SHP”), a 75% subsidiary of RDI, refinanced its $15.0 million Santander Bank term loan with a new lender, Valley National Bank. This new $20.0 million loan is collateralized by our Cinemas 1,2,3 property and bears an interest rate of 3.25% per annum, with principal installments and accruing interest paid monthly. The new loan matured on September 1, 2019 , with a one -time option to extend maturity date for another year. On August 8, 2019, this maturity date was extended to December 1, 2019, with the one-time option to extend the maturity date for another year preserved. Such modification was not considered to be substantial under US GAAP.
Purchase Money Promissory Note
On September 18, 2019, we purchased 407,000 Company shares in a privately negotiated transaction under our Share Repurchase Program for $5.5 million . Of this amount, $3.5 million was paid by the issuance of a Purchase Money Promissory Note, which bears an interest rate of 5.0% per annum , payable in equal quarterly payments of principal plus accrued interest. The Purchase Money Promissory Note matures on September 18, 2024 .
Westpac Bank Corporate Credit Facility (NZ)
On December 20, 2018, we restructured our Westpac Corporate Credit Facilities. The maturity of the 1 st tranche (general/non-construction credit line) was extended to December 31, 2023 , with the available facility being reduced from NZ$35.0 million to NZ$32.0 million. The facility bears an interest rate of 1.75% above the Bank Bill Bid Rate on the drawn down balance and a 1.1% line of credit charge on the entire facility. The 2 nd tranche (construction line) with a facility of NZ$18.0 million was not renewed.
Australian NAB Corporate Term Loan (AU)
On March 15, 2019, we amended our Revolving Corporate Markets Loan Facility with National Australia Bank (“NAB”) from a facility comprised of (i) a AU$66.5 million loan facility with an interest rate of 0.95% above the Bank Bill Swap Bid Rate (“BBSY”) and a maturity date of June 30, 2019 and (ii) a bank guarantee of AU$5.0 million at a rate of 1.90% per annum into a (i) AU$120.0 million Corporate Loan facility at rates of 0.85% - 1.30% above BBSY depending on certain ratios with a due date of December 31, 2023 , of which AU$80.0 million is revolving and AU$40.0 million is core and (ii) a Bank Guarantee Facility of AU$5.0 million at a rate of 1.85% per annum. Such modifications of this particular term loan were not considered to be substantial under US GAAP.
16
Note 11 – Other Liabilities
Other liabilities are summarized as follows:
|
|
||||||
|
|
September 30, |
December 31, |
||||
|
(Dollars in thousands) |
2019 |
2018 |
||||
|
Current liabilities |
||||||
|
Lease liability |
$ |
5,900 |
$ |
5,900 | ||
|
Liability for demolition costs |
2,548 | 2,630 | ||||
|
Accrued pension |
684 | 684 | ||||
|
Security deposit payable |
83 | 84 | ||||
|
Finance lease liabilities |
117 |
— |
||||
|
Other |
7 | 7 | ||||
|
Other current liabilities |
$ |
9,339 |
$ |
9,305 | ||
|
Other liabilities |
||||||
|
Straight-line rent |
$ |
— |
$ |
16,362 | ||
|
Lease make-good provision |
5,930 | 5,614 | ||||
|
Accrued pension |
4,571 | 4,670 | ||||
|
Environmental reserve |
1,656 | 1,656 | ||||
|
Deferred revenue - real estate |
— |
32 | ||||
|
Acquired leases |
38 | 91 | ||||
|
Finance lease liabilities |
128 |
— |
||||
|
Other |
7 | 506 | ||||
|
Other liabilities |
$ |
12,330 |
$ |
28,931 | ||
On August 29, 2014, the Supplemental Executive Retirement Plan (“SERP”) that has been effective since March 1, 2007, was ended and replaced in accordance with the terms of a pension annuity. As a result of the termination of the SERP program, the accrued pension liability of $7.6 million was reversed and replaced with this pension annuity liability of $7.5 million. The valuation of the liability is based on the present value of $10.2 million discounted at a rate of 4.25% over a 15 -year term, resulting in a monthly payment of $57,000 . The discounted value of $2.7 million (which is the difference between the estimated payout of $10.2 million and the present value of $7.5 million) as of August 29, 2014 will be amortized and expensed based on the 15-year term. In addition, the accumulated actuarial loss of $3.1 million recorded, as part of other comprehensive income will also be amortized based on the 15 - year term.
In February 2018, we made a payment of $2.4 million relating to the annuity representing payments for the 42 months outstanding at the time. Monthly ongoing payments of $57,000 are now being made.
As a result of the above, included in our current and non-current liabilities are accrued pension costs of $5.3 million at September 30, 2019 . The benefits of our pension plan are fully vested and therefore no service costs were recognized for the quarter and nine months ended September 30, 2019 and 2018 . Our pension plan is unfunded.
During the quarter and nine months ended September 30, 2019 , the interest cost was $70,000 and $414,000 respectively, and the actuarial loss was $52,000 and $155,000 respectively. During the quarter and nine months ended September 30, 2018 , the interest cost was $45,000 and $135,000 respectively, and the actuarial loss was $52,000 and $156,000 respectively.
17
Note 12 – Accumulated Other Comprehensive Income
The following table summarizes the changes in each component of accumulated other comprehensive income attributable to RDI:
|
|
|
|
|
|
|
|
|
|
|
|
|
|
|
|
|
|
|
|
|
|
|
|
|
|
|
|
|
|
|
|
|
(Dollars in thousands) |
Foreign
|
|
Unrealized
|
|
Accrued
|
|
Hedge Accounting Reserve |
|
Total |
|||||
|
Balance at January 1, 2019 |
$ |
8,687 |
|
$ |
3 |
|
$ |
(2,438) |
|
$ |
(137) |
|
$ |
6,115 |
|
|
|
|
|
|
|
|
|
|
|
|
|
|
|
|
|
Change related to derivatives |
|
|
|
|
|
|
|
|
|
|
|
|
|
|
|
Total change in hedge fair value recorded in Other Comprehensive Income |
|
— |
|
|
— |
|
|
— |
|
|
(253) |
|
|
(253) |
|
Amounts reclassified from accumulated other comprehensive income |
|
— |
|
|
— |
|
|
— |
|
|
42 |
|
|
42 |
|
Net change related to derivatives |
|
— |
|
|
— |
|
|
— |
|
|
(211) |
|
|
(211) |
|
|
|
|
|
|
|
|
|
|
|
|
|
|
|
|
|
Net current-period other comprehensive income (loss) |
|
(7,351) |
|
|
4 |
|
|
155 |
|
|
(211) |
|
|
(7,403) |
|
Balance at September 30, 2019 |
$ |
1,336 |
|
$ |
7 |
|
$ |
(2,283) |
|
$ |
(348) |
|
$ |
(1,288) |
Note 13 – Commitments and Contingencies
Litigation General
We are currently involved in certain legal proceedings and, as required, have accrued estimates of probable and estimable losses for the resolution of these claims, including legal costs.
|
|
· |
|
Where we are a plaintiff , we accrue legal fees as incurred on an on-going basis and make no provision for any potential settlement amounts until received. In Australia, the prevailing party is usually entitled to recover its attorneys’ fees, which recoveries typically work out to be approximately 60% of the amounts actually spent where first-class legal counsel is engaged at customary rates. Where we are a plaintiff, we have likewise made no provision for the liability for the defendant’s attorneys' fees in the event we are determined not to be the prevailing party. |
|
|
· |
|
Where we are a defendant , we accrue for probable damages that insurance may not cover as they become known and can be reasonably estimated, as permitted under ASC 450-20 Loss Contingencies . In our opinion, any claims and litigation in which we are currently involved are not reasonably likely to have a material adverse effect on our business, results of operations, financial position, or liquidity. I t is possible, however, that future results of the operations for any particular quarterly or annual period could be materially affected by the ultimate outcome of the legal proceedings. From time-to-time, we are involved with claims and lawsuits arising in the ordinary course of our business that may include contractual obligations, insurance claims, tax claims, employment matters, and anti-trust issues, among other matters. |
All of these matters require significant judgments based on the facts known to us. These judgments are inherently uncertain and can change significantly when additional facts become known. We provide accruals for matters that have probable likelihood of occurrence and can be properly estimated as to their expected negative outcome. We do not record expected gains until the proceeds are received by us. However, we typically make no accruals for potential costs of defense, as such amounts are inherently uncertain and dependent upon the scope, extent and aggressiveness of the activities of the applicable plaintiff.
Environmental and Asbestos Claims on Reading Legacy Operations
Certain of our subsidiaries were historically involved in railroad operations, coal mining, and manufacturing. Also, certain of these subsidiaries appear in the chain-of-title of properties that may suffer from pollution. Accordingly, certain of these subsidiaries have, from time-to-time, been named in and may in the future be named in various actions brought under applicable environmental laws. Also, we are in the real estate development business and may encounter from time-to-time unanticipated environmental conditions at properties that we have acquired for development. These environmental conditions can increase the cost of such projects and adversely affect the value and potential for profit of such projects. We do not currently believe that our exposure under applicable environmental laws is material in amount.
From time to time, there are claims brought against us relating to the exposure of former employees of our railroad operations to asbestos and coal dust. These are generally covered by an insurance settlement reached in September 1990 with our insurance providers. However, this insurance settlement does not cover litigation by people who were not our employees and who may claim second-hand exposure to asbestos, coal dust and/or other chemicals or elements now recognized as potentially causing cancer in humans. Our known exposure to these types of claims, asserted or probable of being asserted, is not material.
18
Cotter Jr. Derivative Litigation
This action was originally brought by James J. Cotter, Jr. (“Cotter Jr.”) in June, 2015 in the Nevada District Court against all of the Directors of the Company and against the Company as a nominal defendant: James J. Cotter, Jr., individually and derivatively on behalf of Reading International, Inc. vs. Margaret Cotter, et al.” Case No,: A-15-719860-V. Summary judgment has been entered against Cotter, Jr., and in favor of all defendants and a $1.55 million cost judgment has been entered against Cotter, Jr., and in favor of our Company. Cotter, Jr. has appealed both judgements. Our application for attorney’s fees was denied, and we have appealed that determination. The issues on appeal are currently being briefed. No date for oral argument has been set. It is unlikely that any hearing will be held this year. As the Directors and Officers Liability Insurance Policy covering Cotter, Jr.’s claims in the Derivative Case ( $10.0 million) has been exhausted, the financial burden of defending our Directors against these claims, as required by applicable Nevada Law, has fallen upon our Company. During 2018, out-of-pocket third party costs in the amount of approximately $3.5 million were incurred by our Company in defending against these claims. For the nine months ended September 30, 2019, an additional $782,000 had been expensed, relating principally to the preparation of appellate briefs with respect to the Derivative Litigation.
Employment Litigation
The Company is currently involved in two California employment matters which include substantially overlapping wage and hour claims: Taylor Brown, individually, and on behalf of other members of the general public similarly situated vs. Reading Cinemas et al. Superior Court of the State of California for the County of Kern, Case No. BCV-19-1000390 (“Brown v. RC,” and the “Brown Class Action Complaint” respectively) and Peter M. Wagner, Jr., an individual, vs. Consolidated Entertainment, Inc. et al., Superior Court of the State of California for the County of San Diego, Case NO. 37-2019-00030695-CU-WT-CTL (“Wagner v. CEI,” and the “Wagner Individual Complaint” respectively). Brown v. RC was initially filed in December 2018, as an individual action and refiled as a putative class action in February 2019, but not served until June 24, 2019. These lawsuits seek damages, and attorneys’ fees, relating to alleged violations of California labor laws relating to meal periods, rest periods, reporting time pay, unpaid wages, timely pay upon termination and wage statements violations. Wagner v. CEI was filed as a discrimination and retaliation lawsuit in June 2019. The following month, in July 2019, a notice was served on us by separate counsel for Mr. Wagner under the California Private Attorney General Act of 2004 (Cal. Labor Code Section 2698, et seq ) (the “Wagner PAGA Claim”) purportedly asserting in a representational capacity claims under the PAGA statute, overlapping, in substantial part, the allegations set forth in the Brown Class Action Complaint. Neither plaintiff has specified the amount of damages sought.
The Company is investigating and intends to vigorously defend the allegations of the Brown Class Action Complaint, the Wagner Individual Complaint and the Wagner PAGA Claim and denies that a PAGA representative action is appropriate. These matters are in their early stages, and the putative class action has not been certified. As these cases are in early stages, the Company is unable to predict the outcome of the litigation or the range of potential loss, if any; however, the Company believes that its potential liability with respect to such matters is not material to its overall financial position, results of operations and cash flows. Accordingly, the Company has not established a reserve for loss in connection with these matters.
Note 14 – Non-controlling Interests
These are composed of the following enterprises:
|
|
· |
|
Australia Country Cinemas Pty Ltd. - 25% noncontrolling interest owned by Panorama Group International Pty Ltd.; |
|
|
· |
|
Shadow View Land and Farming, LLC - 50% noncontrolling membership interest owned by either the estate of Mr. James J. Cotter, Sr. (the “Cotter Estate”) and/or the James J. Cotter, Sr. Living Trust (the “Cotter Trust”); and, |
|
|
· |
|
Sutton Hill Properties, LLC - 25% noncontrolling interest owned by Sutton Hill Capital, LLC (which in turn is 50% owned by the Cotter Estate and/or the Cotter Trust). |
The components of noncontrolling interests are as follows:
|
|
||||||
|
|
September 30, |
December 31, |
||||
|
(Dollars in thousands) |
2019 |
2018 |
||||
|
Australian Country Cinemas, Pty Ltd |
$ |
68 |
$ |
89 | ||
|
Shadow View Land and Farming, LLC |
2,131 | 2,153 | ||||
|
Sutton Hill Properties, LLC |
2,000 | 2,095 | ||||
|
Noncontrolling interests in consolidated subsidiaries |
$ |
4,199 |
$ |
4,337 | ||
19
The components of income attributable to noncontrolling interests are as follows:
|
|
||||||||||||
|
|
Quarter Ended |
Nine Months Ended |
||||||||||
|
|
September 30, |
September 30, |
||||||||||
|
(Dollars in thousands) |
2019 |
2018 |
2019 |
2018 |
||||||||
|
Australian Country Cinemas, Pty Ltd |
$ |
32 |
$ |
(36) |
$ |
69 |
$ |
96 | ||||
|
Shadow View Land and Farming, LLC |
(43) | (16) | (77) | (41) | ||||||||
|
Sutton Hill Properties, LLC |
(39) | 14 | (95) | 33 | ||||||||
|
Net income (loss) attributable to noncontrolling interests |
$ |
(50) |
$ |
(38) |
$ |
(103) |
$ |
88 | ||||
20
Summary of Controlling and Noncontrolling Stockholders’ Equity
A summary of the changes in controlling and noncontrolling stockholders’ equity is as follows:
|
|
|
|
|
|
|
|
|
|
|
|
|
|
|
|
|
|
|
|
|
|
|
|
Common Shares |
|
|
Retained |
|
|
Accumulated |
Reading |
|
|
|
|
||||||||
|
|
Class A |
Class A |
Class B |
Class B |
Additional |
Earnings |
|
|
Other |
International Inc. |
|
|
Total |
|||||||
|
|
Non-Voting |
Par |
Voting |
Par |
Paid-In |
(Accumulated |
Treasury |
Comprehensive |
Stockholders’ |
Noncontrolling |
Stockholders’ |
|||||||||
|
(Dollars in thousands, except shares) |
Shares |
Value |
Shares |
Value |
Capital |
Deficit) |
Shares |
Income/(Loss) |
Equity |
Interests |
Equity |
|||||||||
|
At January 1, 2019 |
21,195 |
$ |
232 | 1,680 |
$ |
17 |
$ |
147,452 |
$ |
47,616 |
$ |
(25,222) |
$ |
6,115 |
$ |
176,210 |
$ |
4,337 |
$ |
180,547 |
|
Net income |
— |
|
— |
— |
|
— |
|
— |
|
(2,081) |
|
— |
|
— |
|
(2,081) |
|
(16) |
|
(2,097) |
|
Adjustments to opening retained earnings on adoption of ASC 842 |
— |
|
— |
— |
|
— |
|
— |
|
28 |
|
— |
|
— |
|
28 |
|
(46) |
|
(18) |
|
Other comprehensive income, net |
— |
|
— |
— |
|
— |
|
— |
|
— |
|
— |
|
1,510 |
|
1,510 |
|
1 |
|
1,511 |
|
Share-based compensation expense |
— |
|
— |
— |
|
— |
|
280 |
|
— |
|
— |
|
— |
|
280 |
|
— |
|
280 |
|
Share repurchase plan |
— |
|
— |
— |
|
— |
|
— |
|
— |
|
(9) |
|
— |
|
(9) |
|
— |
|
(9) |
|
Class A common stock issued for share-based bonuses and options exercised |
— |
|
— |
— |
|
— |
|
(185) |
|
— |
|
— |
|
— |
|
(185) |
|
— |
|
(185) |
|
In-kind exchange of share for the exercise of options, net issued |
— |
|
— |
— |
|
— |
|
— |
|
— |
|
— |
|
— |
|
— |
|
— |
|
— |
|
Restricted Stock Units |
40 |
|
1 |
— |
|
— |
|
(75) |
|
— |
|
— |
|
— |
|
(74) |
|
— |
|
(74) |
|
Contributions from noncontrolling stockholders |
— |
|
— |
— |
|
— |
|
— |
|
— |
|
— |
|
— |
|
— |
|
18 |
|
18 |
|
Distributions to noncontrolling stockholders |
— |
|
— |
— |
|
— |
|
— |
|
— |
|
— |
|
— |
|
— |
|
(27) |
|
(27) |
|
At March 31, 2019 |
21,235 |
$ |
233 | 1,680 |
$ |
17 |
$ |
147,472 |
$ |
45,563 |
$ |
(25,231) |
$ |
7,625 |
$ |
175,679 |
$ |
4,267 |
$ |
179,946 |
|
Net income |
— |
|
— |
— |
|
— |
|
— |
|
2,394 |
|
— |
|
— |
|
2,394 |
|
(37) |
|
2,357 |
|
Other comprehensive income, net |
— |
|
— |
— |
|
— |
|
— |
|
— |
|
— |
|
(2,346) |
|
(2,346) |
|
(1) |
|
(2,347) |
|
Share-based compensation expense |
— |
|
— |
— |
|
— |
|
400 |
|
— |
|
— |
|
— |
|
400 |
|
— |
|
400 |
|
Share repurchase plan |
(197) |
|
— |
— |
|
— |
|
— |
|
— |
|
(2,622) |
|
— |
|
(2,622) |
|
— |
|
(2,622) |
|
Class A common stock issued for share-based bonuses and options exercised |
— |
|
— |
— |
|
— |
|
— |
|
— |
|
— |
|
— |
|
— |
|
— |
|
— |
|
In-kind exchange of share for the exercise of options, net issued |
— |
|
— |
— |
|
— |
|
— |
|
— |
|
— |
|
— |
|
— |
|
— |
|
— |
|
Restricted Stock Units |
33 |
|
— |
— |
|
— |
|
(31) |
|
— |
|
— |
|
— |
|
(31) |
|
— |
|
(31) |
|
Contributions from noncontrolling stockholders |
— |
|
— |
— |
|
— |
|
— |
|
— |
|
— |
|
— |
|
— |
|
9 |
|
9 |
|
Distributions to noncontrolling stockholders |
— |
|
— |
— |
|
— |
|
— |
|
— |
|
— |
|
— |
|
— |
|
(15) |
|
(15) |
|
At June 30, 2019 |
21,071 |
$ |
233 | 1,680 |
$ |
17 |
$ |
147,841 |
$ |
47,957 |
$ |
(27,853) |
$ |
5,279 |
$ |
173,474 |
$ |
4,223 |
$ |
177,697 |
|
Net income |
— |
|
— |
— |
|
— |
|
— |
|
902 |
|
— |
|
— |
|
902 |
|
(50) |
|
852 |
|
Other comprehensive income, net |
— |
|
— |
— |
|
— |
|
— |
|
— |
|
— |
|
(6,567) |
|
(6,567) |
|
(2) |
|
(6,569) |
|
Share-based compensation expense |
— |
|
— |
— |
|
— |
|
417 |
|
— |
|
— |
|
— |
|
417 |
|
— |
|
417 |
|
Share repurchase plan |
(660) |
|
— |
— |
|
— |
|
— |
|
— |
|
(8,690) |
|
— |
|
(8,690) |
|
— |
|
(8,690) |
|
Class A common stock issued for share-based bonuses and options exercised |
— |
|
— |
— |
|
— |
|
— |
|
— |
|
— |
|
— |
|
— |
|
— |
|
— |
|
In-kind exchange of share for the exercise of options, net issued |
— |
|
— |
— |
|
— |
|
— |
|
— |
|
— |
|
— |
|
— |
|
— |
|
— |
|
Restricted Stock Units |
(6) |
|
— |
— |
|
— |
|
(22) |
|
— |
|
— |
|
— |
|
(22) |
|
— |
|
(22) |
|
Retirements |
— |
|
(2) |
— |
|
— |
|
— |
|
— |
|
2 |
|
— |
|
— |
|
— |
|
— |
|
Contributions from noncontrolling stockholders |
— |
|
— |
— |
|
— |
|
— |
|
— |
|
— |
|
— |
|
— |
|
28 |
|
28 |
|
Distributions to noncontrolling stockholders |
— |
|
— |
— |
|
— |
|
— |
|
— |
|
— |
|
— |
|
— |
|
— |
|
— |
|
At September 30, 2019 |
20,405 |
$ |
231 | 1,680 |
$ |
17 |
$ |
148,236 |
$ |
48,859 |
$ |
(36,541) |
$ |
(1,288) |
$ |
159,514 |
$ |
4,199 |
$ |
163,713 |
21
|
|
|
|
|
|
|
|
|
|
|
|
|
|
|
|
|
|
|
|
|
|
|
|
Common Shares |
|
|
Retained |
|
|
Accumulated |
Reading |
|
|
|
|
||||||||
|
|
Class A |
Class A |
Class B |
Class B |
Additional |
Earnings |
|
|
Other |
International Inc. |
|
|
Total |
|||||||
|
|
Non-Voting |
Par |
Voting |
Par |
Paid-In |
(Accumulated |
Treasury |
Comprehensive |
Stockholders’ |
Noncontrolling |
Stockholders’ |
|||||||||
|
(Dollars in thousands, except shares) |
Shares |
Value |
Shares |
Value |
Capital |
Deficit) |
Shares |
Income/(Loss) |
Equity |
Interests |
Equity |
|||||||||
|
At January 1, 2018 |
21,251 |
$ |
231 | 1,680 |
$ |
17 |
$ |
145,898 |
$ |
33,056 |
$ |
(22,906) |
$ |
20,991 |
$ |
177,287 |
$ |
4,331 |
$ |
181,618 |
|
Net income |
— |
|
— |
— |
|
— |
|
— |
|
3,082 |
|
— |
|
— |
|
3,082 |
|
22 |
|
3,104 |
|
Adjustments to opening retained earnings on adoption of ASC 842 |
— |
|
— |
— |
|
— |
|
— |
|
194 |
|
— |
|
— |
|
194 |
|
(2) |
|
192 |
|
Other comprehensive income, net |
— |
|
— |
— |
|
— |
|
— |
|
— |
|
— |
|
(750) |
|
(750) |
|
(3) |
|
(753) |
|
Share-based compensation expense |
— |
|
— |
— |
|
— |
|
379 |
|
— |
|
|
|
— |
|
379 |
|
— |
|
379 |
|
Share repurchase plan |
(19) |
|
— |
— |
|
— |
|
— |
|
— |
|
(317) |
|
— |
|
(317) |
|
— |
|
(317) |
|
Class A common stock issued for share-based bonuses and options exercised |
10 |
|
— |
— |
|
— |
|
61 |
|
— |
|
— |
|
— |
|
61 |
|
— |
|
61 |
|
In-kind exchange of share for the exercise of options, net issued |
9 |
|
— |
— |
|
— |
|
(75) |
|
— |
|
— |
|
— |
|
(75) |
|
— |
|
(75) |
|
Restricted Stock Units |
44 |
|
— |
— |
|
— |
|
(26) |
|
— |
— |
— |
— |
— |
|
(26) |
|
— |
|
(26) |
|
Contributions from noncontrolling stockholders |
— |
|
— |
— |
|
— |
|
— |
|
— |
— |
— |
— |
— |
|
— |
|
27 |
|
27 |
|
Distributions to noncontrolling stockholders |
— |
|
— |
— |
|
— |
|
— |
|
— |
|
— |
|
— |
|
— |
|
(43) |
|
(43) |
|
At March 31, 2018 |
21,295 |
$ |
231 | 1,680 |
$ |
17 |
$ |
146,237 |
$ |
36,332 |
$ |
(23,223) |
$ |
20,241 |
$ |
179,835 |
$ |
4,332 |
$ |
184,167 |
|
Net income |
— |
|
— |
— |
|
— |
|
— |
|
5,026 |
|
— |
|
— |
|
5,026 |
|
102 |
|
5,128 |
|
Adjustments to opening retained earnings on adoption of ASC 842 |
— |
|
— |
— |
|
— |
|
— |
|
— |
|
— |
|
— |
|
— |
|
— |
|
— |
|
Other comprehensive income, net |
— |
|
— |
— |
|
— |
|
— |
|
— |
|
— |
|
(7,910) |
|
(7,910) |
|
(5) |
|
(7,915) |
|
Share-based compensation expense |
— |
|
— |
— |
|
— |
|
338 |
|
— |
|
— |
|
— |
|
338 |
|
— |
|
338 |
|
Share repurchase plan |
(5) |
|
— |
— |
|
— |
|
— |
|
— |
|
(80) |
|
— |
|
(80) |
|
— |
|
(80) |
|
Class A common stock issued for share-based bonuses and options exercised |
— |
|
— |
— |
|
— |
|
— |
|
— |
|
— |
|
— |
|
— |
|
— |
|
— |
|
In-kind exchange of share for the exercise of options, net issued |
— |
|
1 |
— |
|
— |
|
— |
|
— |
|
— |
|
— |
|
1 |
|
— |
|
1 |
|
Restricted Stock Units |
— |
|
|
|
|
|
|
(8) |
|
|
|
|
|
|
|
(8) |
|
— |
|
(8) |
|
Contributions from noncontrolling stockholders |
— |
|
— |
— |
|
— |
|
— |
|
— |
|
— |
|
— |
|
— |
|
27 |
|
27 |
|
Distributions to noncontrolling stockholders |
— |
|
— |
— |
|
— |
|
— |
|
— |
|
— |
|
— |
|
— |
|
(50) |
|
(50) |
|
At June 30, 2018 |
21,290 |
$ |
232 | 1,680 |
$ |
17 |
$ |
146,567 |
$ |
41,358 |
$ |
(23,303) |
$ |
12,331 |
$ |
177,202 |
$ |
4,406 |
$ |
181,608 |
|
Net income |
— |
|
— |
— |
|
— |
|
— |
|
1,297 |
|
— |
|
— |
|
1,297 |
|
(38) |
|
1,259 |
|
Adjustments to opening retained earnings on adoption of ASC 842 |
— |
|
— |
— |
|
— |
|
— |
|
— |
|
— |
|
— |
|
— |
|
— |
|
— |
|
Other comprehensive income, net |
— |
|
— |
— |
|
— |
|
— |
|
— |
|
— |
|
(3,488) |
|
(3,488) |
|
(5) |
|
(3,493) |
|
Share-based compensation expense |
|
|
— |
— |
|
— |
|
348 |
|
— |
|
— |
|
— |
|
348 |
|
— |
|
348 |
|
Share repurchase plan |
(5) |
|
— |
— |
|
— |
|
— |
|
— |
|
— |
|
— |
|
— |
|
— |
|
— |
|
Class A common stock issued for share-based bonuses and options exercised |
25 |
|
— |
— |
|
— |
|
158 |
|
— |
|
— |
|
— |
|
158 |
|
— |
|
158 |
|
In-kind exchange of share for the exercise of options, net issued |
5 |
|
— |
— |
|
— |
|
1 |
|
— |
|
— |
|
— |
|
1 |
|
— |
|
1 |
|
Restricted Stock Units |
— |
|
— |
— |
|
— |
|
(15) |
|
— |
|
— |
|
— |
|
(15) |
|
— |
|
(15) |
|
Contributions from noncontrolling stockholders |
— |
|
— |
— |
|
— |
|
— |
|
— |
|
— |
|
— |
|
— |
|
21 |
|
21 |
|
Distributions to noncontrolling stockholders |
— |
|
— |
— |
|
— |
|
— |
|
— |
|
— |
|
— |
|
— |
|
(24) |
|
(24) |
|
At September 30, 2018 |
21,315 |
$ |
232 | 1,680 |
$ |
17 |
$ |
147,059 |
$ |
42,655 |
$ |
(23,303) |
$ |
8,843 |
$ |
175,503 |
$ |
4,360 |
$ |
179,863 |
22
Note 15 – Stock-Based Compensation and Stock Repurchases
Employee and Director Stock Option Plan
The Company may grant stock options and other share-based payment awards of our Common Stock to eligible employees, directors, and consultants under the 2010 Stock Incentive Plan (the “Plan”). The aggregate total number of shares of the Common Stock authorized for issuance under the Plan is 2,197,460 .
During the Company’s 2017 Annual Stockholders’ Meeting held on November 7, 2017, the Company's stockholders, upon recommendation of the Board of Directors, approved an amendment to the Plan to increase the number of shares of common stock issuable under the Plan by an additional 947,460 shares. The effect of the increase was to restore the amount of shares of Common Stock available under the Plan from the 302,540 shares available as of September 30, 2017, back up to its original reserve of 1,250,000 shares. As of September 30, 2019 , we had 778,304 shares remaining for future issuances.
Stock options are generally granted at exercise prices equal to the grant-date market prices and typically expire no later than five years from the grant date. In contrast to a stock option where the grantee buys the Company’s share at an exercise price determined on grant date, a restricted stock unit (“RSU”) entitles the grantee to receive one share for every RSU based on a vesting plan. At the discretion of our Compensation and Stock Options Committee, the vesting period of stock options and RSUs granted to employees ranges from zero to four years. Grants to directors and certain executive officers are subject to Board approval. At the time the options are exercised or RSUs vest and are settled, at the discretion of management, we will issue treasury shares or make a new issuance of shares to the option or RSU holder.
Stock Options
We estimate the grant-date fair value of our stock options using the Black-Scholes option-valuation model, which takes into account assumptions such as the dividend yield, the risk-free interest rate, the expected stock price volatility, and the expected life of the options. We expense the estimated grant-date fair values of options over the vesting period on a straight-line basis. Based on our historical experience, the “deemed exercise” of expiring in-the-money options and the relative market price to strike price of the options, we have not hereto estimated any forfeitures of vested or unvested options.
There were nil and 219,408 stock options issued in the quarter and nine months ended September 30, 2019 , respectively. The weighted average assumptions used in the option-valuation model were as follows:
|
|
||||||
|
|
Nine Months Ended September 30, |
|||||
|
|
2019 |
2018 |
||||
|
Stock option exercise price |
$ |
16.12 |
$ |
16.40 | ||
|
Risk-free interest rate |
2.42% | 2.56% | ||||
|
Expected dividend yield |
— |
— |
||||
|
Expected option life in years |
3.75 | 3.75 | ||||
|
Expected volatility |
23.32% | 24.99% | ||||
|
Weighted average fair value |
$ |
3.50 |
$ |
3.80 | ||
For the quarters ended September 30, 2019 and 2018 , we recorded compensation expense of $129,000 and $115,000 , respectively. For the nine months ended September 30, 2019 and September 30, 2018 , we recorded compensation expense of $329,000 and $312,000 , respectively. At September 30, 2019 , the total unrecognized estimated compensation expense related to non-vested stock options was $1.2 million, which we expect to recognize over a weighted average vesting period of 1.91 years. The intrinsic, unrealized value of all options outstanding, vested and expected to vest, at September 30, 2019 was $0.2 million, of which 100% are currently exercisable.
23
The following table summarizes the number of options outstanding and exercisable as of September 30, 2019 and December 31, 2018 :
|
|
|
|
|
|
|
|
|
|
|
|
|
|
|
|
|
|
|
|
|
|
|
|
|
|
|
Outstanding Stock Options - Class A Shares |
||||||||
|
|
|
Number
|
|
Weighted
|
|
Weighted
|
|
Aggregate
|
||
|
|
|
Class A |
|
Class A |
|
Class A |
|
Class A |
||
|
Balance - December 31, 2017 |
|
524,589 |
|
$ |
12.50 |
|
3.15 |
|
$ |
3,054,325 |
|
Granted |
|
126,840 |
|
|
16.40 |
|
— |
|
|
— |
|
Exercised |
|
(60,000) |
|
|
6.02 |
|
— |
|
|
610,249 |
|
Forfeited |
|
(4,960) |
|
|
12.08 |
|
— |
|
|
— |
|
Balance - December 31, 2018 |
|
586,469 |
|
$ |
14.01 |
|
2.88 |
|
$ |
1,530,528 |
|
Granted |
|
219,408 |
|
|
16.12 |
|
— |
|
|
— |
|
Exercised |
|
(69,500) |
|
|
13.42 |
|
— |
|
|
185,175 |
|
Forfeited |
|
(25,000) |
|
|
13.42 |
|
— |
|
|
— |
|
Balance - September 30, 2019 |
|
711,377 |
|
$ |
14.74 |
|
3.04 |
|
$ |
164,930 |
Restricted Stock Units
We estimate the grant-date fair values of our RSUs using the Company’s stock price at grant-date and record such fair values as compensation expense over the vesting period on a straight-line basis. The following table summarizes the status of the RSUs granted to-date as of September 30, 2019 :
|
|
|
|
|
|
|
|
|
|
|
|
|
|
|
|
|
|
|
|
|
|
|
|
|
|
|
|
|
|
|
Outstanding Restricted Stock Units |
||||||||||
|
|
|
RSU Grants (in units) |
|
|
|
Vested, |
|
Unvested, |
|
Forfeited, |
||
|
Grant Date |
|
Directors |
|
Management |
|
Total
|
|
September 30,
|
|
September 30,
|
|
September 30,
|
|
March 10, 2016 |
|
35,147 |
|
27,381 |
|
62,528 |
|
55,684 |
|
6,844 |
|
|
|
April 11, 2016 |
|
— |
|
5,625 |
|
5,625 |
|
3,962 |
|
1,146 |
|
517 |
|
March 23, 2017 |
|
30,681 |
|
32,463 |
|
63,144 |
|
46,919 |
|
16,225 |
|
|
|
August 29, 2017 |
|
— |
|
7,394 |
|
7,394 |
|
5,546 |
|
1,848 |
|
|
|
January 2, 2018 |
|
29,393 |
|
— |
|
29,393 |
|
29,393 |
|
— |
|
|
|
April 12, 2018 |
|
— |
|
29,596 |
|
29,596 |
|
7,409 |
|
22,187 |
|
|
|
April 13, 2018 |
|
— |
|
14,669 |
|
14,669 |
|
3,668 |
|
11,001 |
|
|
|
July 6, 2018 |
|
— |
|
932 |
|
932 |
|
— |
|
— |
|
932 |
|
November 7, 2018 |
|
23,010 |
|
— |
|
23,010 |
|
23,010 |
|
— |
|
|
|
March 13, 2019 |
|
— |
|
40,709 |
|
40,709 |
|
— |
|
40,709 |
|
|
|
March 14, 2019 |
|
— |
|
6,984 |
|
6,984 |
|
— |
|
6,984 |
|
|
|
May 7, 2019 |
|
11,565 |
|
— |
|
11,565 |
|
— |
|
11,565 |
|
|
|
|
|
|
|
|
|
|
|
|
|
|
|
|
|
Total |
|
129,796 |
|
165,753 |
|
295,549 |
|
175,591 |
|
118,509 |
|
1,449 |
RSU awards to management vest 25% at the end of each year for 4 years . Prior to November 7, 2018, RSU awards to directors vested 100% in January of the following year in which such RSUs were granted. At the November 7, 2018 Board meeting, it was determined that it would be more appropriate for the vesting of RSUs to align with the director ’ s term of office. Accordingly, the RSUs granted on November 7, 2018, vest on the first to occur of (i) 5:00 pm, Los Angeles, CA time on the last business day prior to the one-year anniversary of the grant date, or (ii) the date on which the recipient’s term as a director shall end and the recipient, or as the case may be, the recipient’s successor is elected to the board of directors at the next occurring annual meeting or special meeting of stockholders called for such purpose (the “Vesting Date”). This means that the Vesting Date of the RSUs granted to directors on November 7, 2018 was the date of the annual meetin g of stockholders on May 7, 2019 . Due to the fact that the Company has moved up its annual meeting of stockholders from November to May this year, this created a shorter than normal vesting period for the RSUs issued on November 7, 2018. In order to adjust for this factor, the award of RSUs to directors made immediately following the 2019 Annual Meeting of Stockholders was a value of $35,000 or one half of last year's annual grant. For the quarter ended September 30, 2019 and 2018 , we recorded compensation expense of $288,000 and $233,000 , respectively. For the nine months ended September 30, 2019 and September 30, 2018 we recorded compensation expense of $768,000 and $754,000 respectively. The total unrecognized compensation expense related to the non-vested RSUs was $1.6 million as of September 30, 2019 , which we expect to recognize over a weighted average vesting period of 1.74 years.
24
Stock Repurchase Program
On March 2, 2017, the Company's Board of Directors authorized management, at its discretion, to spend up to an aggregate of $25.0 million to acquire shares of Reading’s Class A Non-Voting Common Stock. On March 14, 2019, the Board of Directors extended this stock buy-back program for two years, through March 2, 2021. The Board of Directors did not increase the authorized amount, which was $16.2 million at March 31, 2019.
The repurchase program allows Reading to repurchase its shares in accordance with the requirements of the SEC on the open market, in block trades and in privately negotiated transactions, depending on market conditions and other factors. All purchases are subject to the availability of shares at prices that are acceptable to Reading, and accordingly, no assurances can be given as to the timing or number of shares that may ultimately be acquired pursuant to this authorization.
Under the stock repurchase program, as of September 30, 2019 , the Company has reacquired a total of 1,415,624 shares of Class A Non-Voting Common Stock for $20.1 million at an average price o f $14.23 per share (excluding transaction costs). 659,608 shares of Class A Non-Voting Common Stock were purchased during the quarter ended September 30, 2019 at an average price of $13.17 per share. This leaves $4.9 million available under the March 2, 2017 program, as extended, to March 2, 2021.
Note 16 - Leases
In all leases, whether we are the lessor or lessee, we define lease term as the non-cancellable term of the lease plus any renewals covered by renewal options that are reasonably certain of exercise based on our assessment of economic factors relevant to the lessee. The non-cancellable term of the lease commences on the date the lessor makes the underlying property in the lease available to the lessee, irrespective of when lease payments begin under the contract.
As Lessee
We have operating leases for certain cinemas and corporate offices, and finance leases for certain equipment assets. Our leases have remaining lease terms of 1 to 20 years, with certain leases having options to extend to up to a further 20 years.
Contracts are analyzed in accordance with the criteria set out in ASC 842 to determine if there is a lease present. For contracts that contain an operating lease, we account for the lease component and the non-lease component together as a single component. For contracts that contain a finance lease we account for the lease component and the non-lease component separately in accordance with ASC 842.
In leases where we are the lessee, we recognize a right of use asset and lease liability at lease commencement, which is measured by discounting lease payments using an incremental borrowing rate applicable to the relevant country and lease term of the lease as the discount rate. Subsequent amortization of the right of use asset and accretion of the lease liability for an operating lease is recognized as a single lease cost, on a straight line basis, over the term of the lease. A finance lease right-of-use asset is depreciated on a straight line basis over the lesser of the useful life of the leased asset or the lease term. Interest on each finance lease liability is determined as the amount that results in a constant periodic discount rate on the remaining balance of the liability. Property taxes and other non-lease costs are accounted for on an accrual basis.
Lease payments for our cinema operating leases consist of fixed base rent, and for certain leases, variable lease payments consisting of contracted percentages of revenue, changes in the relevant CPI, and/or other contracted financial metrics.
The components of lease expense are as follows:
|
|
|
|
|
|
|
|
|
|
|
|
|
|
|
|
|
Quarter Ended |
|
Nine Months Ended |
||||||||
|
|
|
September 30, |
|
September 30, |
||||||||
|
(Dollars in thousands) |
|
2019 |
|
2018 |
|
2019 |
|
2018 |
||||
|
Lease cost |
|
|
|
|
|
|
|
|
|
|
|
|
|
Finance lease cost: |
|
|
|
|
|
|
|
|
|
|
|
|
|
Amortization of right-of-use assets |
|
$ |
40 |
|
$ |
— |
|
$ |
121 |
|
$ |
— |
|
Interest on lease liabilities |
|
|
3 |
|
|
— |
|
|
10 |
|
|
— |
|
Operating lease cost |
|
|
7,773 |
|
|
— |
|
|
23,339 |
|
|
— |
|
Variable lease cost |
|
|
320 |
|
|
— |
|
|
1,174 |
|
|
— |
|
Total lease cost |
|
$ |
8,136 |
|
$ |
— |
|
$ |
24,644 |
|
$ |
— |
25
Supplemental cash flow information related to leases is as follows:
|
|
Nine Months Ended |
|||||
|
|
September 30, |
|||||
|
(Dollars in thousands) |
2019 |
2018 |
||||
|
Cash flows relating to lease cost |
||||||
|
Cash paid for amounts included in the measurement of lease liabilities: |
||||||
|
Operating cash flows for finance leases |
$ |
128 |
$ |
— |
||
|
Operating cash flows for operating leases |
22,988 |
— |
||||
|
Right-of-use assets obtained in exchange for new finance lease liabilities |
— |
— |
||||
|
Right-of-use assets obtained in exchange for new operating lease liabilities |
5,760 |
— |
||||
Supplemental balance sheet information related to leases is as follows:
|
|
|
|
|
|
|
|
|
|
|
September 30, |
|
December 31, |
||
|
(Dollars in thousands) |
|
2019 |
|
2018 |
||
|
Operating leases |
|
|
|
|
|
|
|
Operating lease right-of-use assets |
|
$ |
216,963 |
|
$ |
— |
|
Operating lease liabilities - current portion |
|
|
19,579 |
|
|
— |
|
Operating lease liabilities - non-current portion |
|
|
210,737 |
|
|
— |
|
Total operating lease liabilities |
|
$ |
230,316 |
|
$ |
— |
|
Finance leases |
|
|
|
|
|
|
|
Property plant and equipment, gross |
|
|
362 |
|
|
— |
|
Accumulated depreciation |
|
|
(121) |
|
|
— |
|
Property plant and equipment, net |
|
$ |
241 |
|
$ |
— |
|
Other current liabilities |
|
|
117 |
|
|
— |
|
Other long-term liabilities |
|
|
128 |
|
|
— |
|
Total finance lease liabilities |
|
$ |
245 |
|
$ |
— |
|
|
|
|
|
|
|
|
|
Other information |
|
|
|
|
|
|
|
Weighted-average remaining lease term - finance leases |
|
|
3 |
|
|
— |
|
Weighted-average remaining lease term - operating leases |
|
|
11 |
|
|
— |
|
Weighted-average discount rate - finance leases |
|
|
5.10% |
|
|
— |
|
Weighted-average discount rate - operating leases |
|
|
4.98% |
|
|
— |
The Maturities of our leases were as follows:
|
|
|
|
|
|
|
|
|
(Dollars in thousands) |
|
Operating
|
|
Finance
|
||
|
2019 |
|
$ |
7,673 |
|
$ |
43 |
|
2020 |
|
|
30,631 |
|
|
98 |
|
2021 |
|
|
30,956 |
|
|
52 |
|
2022 |
|
|
30,963 |
|
|
42 |
|
2023 |
|
|
30,102 |
|
|
29 |
|
Thereafter |
|
|
172,589 |
|
|
— |
|
Total lease payments |
|
$ |
302,914 |
|
$ |
264 |
|
Less imputed interest |
|
|
(72,598) |
|
|
(19) |
|
Total |
|
$ |
230,316 |
|
$ |
245 |
As of September 30, 2019 , we have additional operating leases, primarily for cinemas, that have not yet commenced of approximately $36.0 million. It is anticipated that thes e operating leases will commence between fiscal year 2019 and fiscal year 2021 with lease terms of 15 to 20 years.
As Lessor
We have entered into various leases as a lessor for our owned real estate properties. These leases vary in length between 1 and 20 years, with certain leases containing options to extend at the behest of the applicable tenants. Lease components consist of fixed base rent, and for certain leases, variable lease payments consisting of contracted percentages of revenue, changes in the relevant CPI, and/or other contracted financial metrics. None of our leases grant any right to the tenant to purchase the underlying asset.
26
We recognize lease payments for operating leases as property revenue on a straight-line basis over the lease term. Lease incentive payments we make to lessees are amortized as a reduction in property revenue over the lease term.
Lease income relating to operating lease payments was as follows:
|
|
|
|
|
|
|
|
|
|
|
|
|
|
|
|
|
Quarter Ended |
|
Nine Months Ended |
||||||||
|
|
|
September 30, |
|
September 30, |
||||||||
|
(Dollars in thousands) |
|
2019 |
|
2018 |
|
2019 |
|
2018 |
||||
|
Components of lease income |
|
|
|
|
|
|
|
|
|
|
|
|
|
Lease payments |
|
$ |
2,246 |
|
$ |
2,362 |
|
$ |
6,819 |
|
$ |
7,073 |
|
Variable lease payments |
|
|
302 |
|
|
55 |
|
|
898 |
|
|
708 |
|
Total lease income |
|
$ |
2,548 |
|
$ |
2,417 |
|
$ |
7,717 |
|
$ |
7,781 |
The book value of underlying assets under operating leases from owned assets was as follows:
|
|
|
|
|
|
|
|
|
|
|
|
|
|
|
|
|
|
|
|
|
|
|
September 30, |
|
December 31, |
||
|
(Dollars in thousands) |
|
|
|
|
|
|
|
2019 |
|
2018 |
||
|
Building and improvements |
|
|
|
|
|
|
|
|
|
|
|
|
|
Gross balance |
|
|
|
|
|
|
|
$ |
65,103 |
|
$ |
67,887 |
|
Accumulated depreciation |
|
|
|
|
|
|
|
|
(18,278) |
|
|
(17,709) |
|
Net Book Value |
|
|
|
|
|
|
|
$ |
46,825 |
|
$ |
50,178 |
The Maturity of our leases were as follows:
|
(Dollars in thousands) |
Operating
|
|||||||||||
|
2019 |
$ |
1,954 | ||||||||||
|
2020 |
7,301 | |||||||||||
|
2021 |
6,831 | |||||||||||
|
2022 |
5,984 | |||||||||||
|
2023 |
5,275 | |||||||||||
|
Thereafter |
10,214 | |||||||||||
|
Total |
$ |
37,559 | ||||||||||
Note 17 – Hedge Accounting
As of September 30, 2019 and December 31, 2018 , the Company held interest rate derivatives in the total notional amount of $8.0 million and $8.0 million , respectively.
The derivatives are recorded on the balance sheet at fair value and are included in the following line items:
|
|
|
|
|
|
|
|
|
|
|
|
|
|
|
Liability Derivatives |
||||||||
|
|
|
September 30, |
|
December 31, |
||||||
|
|
|
2019 |
|
2018 |
||||||
|
(Dollars in thousands) |
|
Balance sheet location |
|
Fair value |
|
Balance sheet location |
|
Fair value |
||
|
Interest rate contracts |
|
Derivative financial instruments - current portion |
|
$ |
105 |
|
Derivative financial instruments - current portion |
|
$ |
41 |
|
|
|
Derivative financial instruments - non-current portion |
|
|
291 |
|
Derivative financial instruments - non-current portion |
|
|
145 |
|
Total derivatives designated as hedging instruments |
|
|
|
$ |
396 |
|
|
|
$ |
186 |
|
Total derivatives |
|
|
|
$ |
396 |
|
|
|
$ |
186 |
We have no derivatives designated as hedging instruments which are in asset positions.
27
The changes in fair value are recorded in Other Comprehensive Income and released into interest expense in the same period(s) in which the hedged transactions affect earnings. In the quarter and nine months ended to September 30, 2019 and September 30, 2018 , respectively, the derivative instruments affected Comprehensive Income as follows:
|
|
|
|
|
|
|
|
|
|
|
|
|
|
|
|
(Dollars in thousands) |
Location of Loss Recognized in Income on Derivatives |
|
Amount of Loss Recognized in Income on Derivatives |
||||||||||
|
|
|
|
Quarter Ended September 30, 2019 |
|
Nine Months Ended September 30, 2019 |
||||||||
|
|
|
|
|
2019 |
|
|
2018 |
|
|
2019 |
|
|
2018 |
|
Interest rate contracts |
Interest expense |
|
$ |
18 |
|
$ |
— |
|
$ |
42 |
|
$ |
— |
|
Total |
|
|
$ |
18 |
|
$ |
— |
|
$ |
42 |
|
$ |
— |
|
|
|
|
|
|
|
|
|
|
|
|
|
|
|
|
|
Loss Recognized in OCI on Derivatives (Effective Portion) |
||||||||||
|
(Dollars in thousands) |
|
Amount |
|
Amount |
||||||||
|
|
|
Quarter Ended September 30 |
|
Nine Months Ended September 30 |
||||||||
|
|
|
|
2019 |
|
|
2018 |
|
|
2019 |
|
|
2018 |
|
Interest rate contracts |
|
$ |
38 |
|
$ |
— |
|
$ |
253 |
|
$ |
— |
|
Total |
|
$ |
38 |
|
$ |
— |
|
$ |
253 |
|
$ |
— |
|
|
|
|
|
|
|
|
|
|
|
|
|
|
|
|
||||||||||||
|
Line Item |
|
Amount |
|
Amount |
||||||||
|
|
|
Quarter Ended September 30 |
|
Nine Months Ended September 30 |
||||||||
|
|
|
|
2019 |
|
|
2018 |
|
|
2019 |
|
|
2018 |
|
Interest expense |
|
$ |
18 |
|
$ |
— |
|
$ |
42 |
|
$ |
— |
|
Total |
|
$ |
18 |
|
$ |
— |
|
$ |
42 |
|
$ |
— |
The derivative has no ineffective portion, and consequently no losses have been recognized directly in income.
Note 18 – Fair Value Measurements
ASC 820, Fair Value Measurement establishes a fair value hierarchy that prioritizes the inputs to valuation techniques used to measure fair value. The statement requires that assets and liabilities carried at fair value be classified and disclosed in one of the following three categories:
|
|
· |
|
Level 1: Quoted market prices in active markets for identical assets or liabilities; |
|
|
· |
|
Level 2: Quoted prices for similar instruments in active markets; quoted prices for identical or similar instruments in markets that are not active; and model-derived valuations in which all significant inputs and significant value drivers are observable in active markets; and, |
|
|
· |
|
Level 3: Valuations derived from valuation techniques in which one or more significant inputs or significant value drivers are unobservable. |
As of September 30, 2019 and December 31, 2018 material financial assets and financial liabilities were carried and measured at fair value on a recurring basis.
The following tables summarize our financial liabilities that are carried at cost and measured at fair value on a non-recurring basis as of September 30, 2019 and December 31, 2018 , by level within the fair value hierarchy.
|
|
|
|
|
|
|
|
|
|
|
|
|
|
|
|
|
|
|
|
|
|
|
|
|
|
|
|
|
|
|
|
|
|
|
|
|
|
|
|
Fair Value Measurement at September 30, 2019 |
||||||||||
|
(Dollars in thousands) |
|
Carrying
|
|
Level 1 |
|
Level 2 |
|
Level 3 |
|
Total |
|||||
|
Notes payable |
|
$ |
167,153 |
|
$ |
— |
|
$ |
— |
|
$ |
170,459 |
|
$ |
170,459 |
|
Subordinated debt |
|
|
27,913 |
|
|
— |
|
|
— |
|
|
19,008 |
|
|
19,008 |
|
|
|
$ |
195,066 |
|
$ |
— |
|
$ |
— |
|
$ |
189,467 |
|
$ |
189,467 |
28
|
|
|
|
|
|
|
|
|
|
|
|
|
|
|
|
|
|
|
|
|
|
|
|
|
|
|
|
|
|
|
|
|
|
|
|
|
|
|
|
Fair Value Measurement at December 31, 2018 |
||||||||||
|
(Dollars in thousands) |
|
Carrying
|
|
Level 1 |
|
Level 2 |
|
Level 3 |
|
Total |
|||||
|
Notes payable |
|
$ |
139,130 |
|
$ |
— |
|
$ |
— |
|
$ |
143,564 |
|
$ |
143,564 |
|
Subordinated debt |
|
|
27,913 |
|
|
— |
|
|
— |
|
|
18,895 |
|
|
18,895 |
|
|
|
$ |
167,043 |
|
$ |
— |
|
$ |
— |
|
$ |
162,459 |
|
$ |
162,459 |
|
|
(1) |
|
These balances are presented before any deduction for deferred financing costs. |
Following is a description of the valuation methodologies used to estimate the fair value of our financial assets and liabilities. There have been no changes in the methodologies used at September 30, 2019 and December 31, 2018 .
|
|
· |
|
Level 1 investments in marketable securities primarily consist of investments associated with the ownership of marketable securities in U.S. and New Zealand. These investments are valued based on observable market quotes on the last trading date of the reporting period. |
|
|
· |
|
Level 2 derivative financial instruments are valued based on discounted cash flow models that incorporate observable inputs such as interest rates and yield curves from the derivative counterparties. The credit valuation adjustments associated with our non-performance risk and counterparty credit risk are incorporated in the fair value estimates of our derivatives. As of September 30, 2019 and December 31, 2018 , we concluded that the credit valuation adjustments were not significant to the overall valuation of our derivatives. |
|
|
· |
|
Level 3 borrowings include our secured and unsecured notes payable, trust preferred securities and other debt instruments. The borrowings are valued based on discounted cash flow models that incorporate appropriate market discount rates. We calculated the market discount rate by obtaining period-end treasury rates for fixed-rate debt, or LIBOR for variable-rate debt, for maturities that correspond to the maturities of our debt, adding appropriate credit spreads derived from information obtained from third-party financial institutions. These credit spreads take into account factors such as our credit rate, debt maturity, types of borrowings, and the loan-to-value ratios of the debt. |
The Company’s financial instruments also include cash, cash equivalents, receivables and accounts payable. The carrying values of these financial instruments approximate the fair values due to their short maturities. Additionally, there were no transfers of assets and liabilities between levels 1, 2, or 3 during the quarter and nine months ended September 30, 2019 and September 30, 2018 .
29
Note 19 – Business Combination
On January 30, 2019, we purchased the tenant’s interest and other operating assets of an established four-screen cinema in Devonport, Tasmania, Australia, for $1.4 million ( AU$1.95 million). We commenced trading from this new cinema site on January 30, 2019.
The total purchase price was allocated to the identifiable assets acquired based on our estimates of their fair values on the acquisition date. The identified assets included fixtures and equipment and immaterial working capital balances . There were immaterial liabilities assumed.
Our final purchase price allocation is as follows:
|
(Dollars in thousands) |
Preliminary Purchase Price Allocation (1) |
Measurement Period Adjustments (2) |
Final Purchase Price Allocation (1) |
||||||
|
Tangible Assets |
|||||||||
|
Operating property: |
|||||||||
|
Fixtures and equipment |
$ |
153 |
$ |
— |
$ |
153 | |||
|
Intangible Assets |
|||||||||
|
Goodwill |
1,248 | (23) | 1,225 | ||||||
|
Total assets acquired |
1,401 | (23) | 1,378 | ||||||
|
|
|||||||||
|
Net assets acquired |
$ |
1,401 |
$ |
(23) |
$ |
1,378 | |||
|
|
(1) |
|
The balances were translated into U.S. Dollars based on the applicable exchange rate as of the date of acquisition, January 30, 2019. |
|
|
(2) |
|
The measurement period adjustments relate to finalization of immaterial employee obligations. |
30
This MD&A should be read in conjunction with the accompanying unaudited consolidated financial statements included in Part I, Item 1 (Financial Statements). The foregoing discussions and analyses contain certain forward-looking statements. Please refer to the “Forward Looking Statements” included at the conclusion of this section and our “Risk Factors” set forth in our 2018 Form 10-K, Part 1, Item 1A and the Risk Factors set out below.
Item 2 – Management’s Discussions and Analysis (“MD&A”) of Financial Condition and Results of Operations
BUSINESS OVERVIEW
We are an internationally diversified company principally focused on the development, lease or ownership, and operation of entertainment and real estate assets in the United States, Australia, and New Zealand. As of September 30, 2019 , we operate in two business segments:
|
|
· |
|
Cinema exhibition, through our 58 multiplex cinemas; and, |
|
|
· |
|
Real estate, including real estate development and the rental or licensing of retail, commercial and live theatre assets. |
We believe that these two business segments complement one another, as we can use the comparatively consistent cash flows generated by our cinema operations to fund the front-end cash demands of our real estate development business.
Cinema Exhibition Overview
We manage our worldwide cinema exhibition businesses under various brands:
|
|
· |
|
in the U.S., under the following brands: Reading Cinemas, Angelika Film Centers, Consolidated Theatres, and City Cinemas; |
|
|
· |
|
in Australia , under the Reading Cinemas brand; and, |
|
|
· |
|
in New Zealand, under the Reading Cinemas and Rialto Cinemas brands. |
Shown in the following table are the number of locations and theater screens in our theater circuit in each country, by state/territory/ region and indicating our cinema brands and our interest in the underlying assets as of September 30, 2019 .
|
|
|
|
|
|
|
|
|
|
|
|
|
|
|
|
|
|
|
|
|
|
|
|
|
|
|
|
|
|
|
State / Territory / |
|
Location |
|
Screen |
|
Interest in Asset
|
|
|
||
|
Country |
|
Region |
|
Count |
|
Count |
|
Leased |
|
Owned |
|
Operating Brands |
|
United States |
|
Hawaii |
|
9 |
|
98 |
|
9 |
|
|
|
Consolidated Theatres |
|
|
|
California |
|
7 |
|
88 |
|
7 |
|
|
|
Reading Cinemas, Angelika Film Center |
|
|
|
New York |
|
3 |
|
16 |
|
2 |
|
1 |
|
Angelika Film Center, City Cinemas |
|
|
|
Texas |
|
2 |
|
13 |
|
2 |
|
|
|
Angelika Film Center |
|
|
|
New Jersey |
|
1 |
|
12 |
|
1 |
|
|
|
Reading Cinemas |
|
|
|
Virginia |
|
1 |
|
8 |
|
1 |
|
|
|
Angelika Film Center |
|
|
|
Washington DC |
|
1 |
|
3 |
|
1 |
|
|
|
Angelika Film Center |
|
|
|
U.S. Total |
|
24 |
|
238 |
|
23 |
|
1 |
|
|
|
Australia |
|
New South Wales |
|
6 |
|
44 |
|
4 |
|
2 |
|
Reading Cinemas |
|
|
|
Victoria |
|
6 |
|
43 |
|
6 |
|
|
|
Reading Cinemas |
|
|
|
Queensland |
|
5 |
|
50 |
|
2 |
|
3 |
|
Reading Cinemas, Event Cinemas (1) |
|
|
|
Western Australia |
|
2 |
|
16 |
|
1 |
|
1 |
|
Reading Cinemas |
|
|
|
South Australia |
|
2 |
|
15 |
|
2 |
|
|
|
Reading Cinemas |
|
|
|
Tasmania |
|
1 |
|
4 |
|
1 |
|
|
|
Reading Cinemas |
|
|
|
Australia Total |
|
22 |
|
172 |
|
16 |
|
6 |
|
|
|
New Zealand |
|
Wellington |
|
3 |
|
18 |
|
2 |
|
1 |
|
Reading Cinemas |
|
|
|
Otago |
|
3 |
|
15 |
|
2 |
|
1 |
|
Reading Cinemas, Rialto Cinemas (2) |
|
|
|
Auckland |
|
2 |
|
15 |
|
2 |
|
|
|
Reading Cinemas, Rialto Cinemas (2) |
|
|
|
Canterbury |
|
1 |
|
8 |
|
1 |
|
|
|
Reading Cinemas |
|
|
|
Southland |
|
1 |
|
5 |
|
|
|
1 |
|
Reading Cinemas |
|
|
|
Bay of Plenty |
|
1 |
|
5 |
|
|
|
1 |
|
Reading Cinemas |
|
|
|
Hawke's Bay |
|
1 |
|
4 |
|
|
|
1 |
|
Reading Cinemas |
|
|
|
New Zealand Total |
|
12 |
|
70 |
|
7 |
|
5 |
|
|
|
GRAND TOTAL |
|
|
|
58 |
|
480 |
|
46 |
|
12 |
|
|
|
|
(1) |
|
Included above, the Company has a 33.3% unincorporated joint venture interest in a 16-screen cinema located in Mt. Gravatt, Queensland managed by Event Cinemas. |
|
|
(2) |
|
Included above, the Company is a 50% joint venture partner in two New Zealand Rialto cinemas, with a total of 13-screens. We are responsible for the booking of these cinemas and our joint venture partner, Event Cinemas, manages their day-to-day operations. |
Real Estate Overview
We engage in real estate development and the ownership, and rental or licensing to third parties of retail, commercial and live theatre assets. We own the fee interests in all three of our live theatres, and in 12 of our cinemas (as presented in the preceding table). Our real estate business creates long-term value for our stockholders through the continuous improvement and development of our investment and operating properties, including our entertainment-themed centers (“ETCs”).
31
Our real estate activities have historically consisted principally of:
|
|
· |
|
the ownership of fee or long-term leasehold interests in properties used in our cinema exhibition activities or which were acquired for the development of cinemas or cinema-based real estate development projects; |
|
|
· |
|
the acquisition and development of fee interests in land; |
|
|
· |
|
the licensing to production companies of the use of our live theatres; and, |
|
|
· |
|
the redevelopment of our existing fee-owned cinema or live theatre sites to their highest and best use. |
Cinema Exhibition
Our cinema revenue consists primarily of admissions, Food & Beverage (“F&B”), advertising, gift cards, theater rentals and online convenience fee revenue generated by the sale of our cinema tickets on our own websites and apps. Cinema operating expense consists of the costs directly attributable to the operation of the cinemas, including film rent expense, operating costs, and occupancy costs. Cinema revenue and expense fluctuate with the availability of quality first run films and the numbers of weeks such first run films stay in the market. For a breakdown of our current cinema assets that we previously owned and/or managed, please see Part I, Item 1 – Our Business of our 2018 Form 10-K.
While our capital projects in recent years have been focused in growing our real estate segment, we have over the past two years also placed special emphasis on the expansion and upgrading of our cinema exhibition portfolio, as discussed below:
Cinema Additions (including refurbishments and re-openings)
The latest additions and enhancements to our cinema portfolio are as follows:
|
|
· |
|
Opening our first dine-in concept, “Spotlight” in the United States: On March 30, 2018 we finished the conversion of one wing (six auditoriums) at our Reading Cinema in Murrieta, California (Cal Oaks) to our dine-in concept brand, “Spotlight”. |
|
|
· |
|
AU and NZ Additions/Refurbishments : On January 30, 2019, we purchased the tenant’s interest and other operating assets of an established four-screen cinema in Devonport, Tasmania, Australia, for $1.4 million (AU$1.95 million). We commenced trading from this new cinema site on January 30, 2019. For the first nine months of 2019, we invested in two additional Gold Lounge auditoriums at our Harbour T own cinema, and converted two screens to TITAN LUXE with fully recliner seating and renovated the Gold Lounge auditorium at West Lakes. This is in addition to the previously disclosed s ignificant improvements at The Palms , Maitland and Waurn Ponds. During January 2019, we closed our Courtenay Central cinema, servicing the Wellington market due to seismic concerns. We are currently working on our re-development and seismic strengthening plans for this facility. In order to service this market while we develop our plans for the redevelopment of Courtenay Central, we have opened a three-screen, 44 0 seat pop-up cinema in Lower Hutt, a suburb of Wellington, New Zealand. In 2017 and 2018, we improved the following theaters: Belmont, Rouse Hill, Napier, Charlestown, Elizabeth, Auburn and Rotorua. |
|
|
· |
|
U.S. Refurbishments: For the first nine months of 2019, we continued investing in refurbishments of two Consolidated Theatres in Hawaii in Mililani and Kahala on Oahu. We also added a TITAN XC screen and reserved seating at our Reading Cinemas in Rohnert Park, California. Since 2017, we have continued to invest in the refurbishment and enhancements of our existing cinemas, as contemplated by our strategic plan. During 2017 and 2018, we substantially refurbished seven locations : our Cal Oaks, Valley Plaza and Grossmont cinemas in California; our Ward , Pearlridge, and Mililani locations in Hawaii; and our Manville cinema in New Jersey. |
Cinema Pipeline
We currently plan to upgrade or begin the upgrade of 9 cinemas in the U.S., Australia, and New Zealand between now and the end of the year.
We have entered into lease agreements for five new cinemas in Australia (31 screens), which we anticipate will come online in 2019 - 2021. This includes the recently announced state-of-the art cinema at Miller’s Junction in Melbourne, Australia.
Our focus with respect to new cinemas is on featuring state-of-the-art projection and sound, luxury recliner seating, enhanced F&B (typically including alcohol service) and at least one major TITAN type presentation screen. We are emphasizing best in class services and amenities in order to differentiate ourselves from in-home and mobile viewing options. We believe that a night at the movies should be a special and premium experience and, indeed, that it must be in order to compete with the variety of options being offered to consumers through other platforms.
Throughout 2019, we will continue to focus on the rollout and enhancement of our proprietary online ticketing capabilities and social media interfaces. These are intended to enhance the convenience of our offerings and to promote customer affinity with the experience and product that we are presenting.
32
Cinema Closures
During the second and third quarter 2019, the leases underlying our profitable Paris Theatre, Beekman Theatre and 86 th Street Theater in New York City all expired. Our efforts to obtain extensions or new leases on commercially reasonable terms were unsuccessful.
While some of our theaters have encountered new competition, and while we believe that others will benefit from planned refurbishment and upgrading, none of our leased theaters are currently slated for closure.
During January 2019, we closed our Courtenay Central cinema in Wellington, New Zealand due to seismic concerns pending redevelopment and seismic upgrading of that facility.
Upgrades to our Film Exhibition Technology and Theater Amenities
As a part of our program to bring long-term value to our stockholders, we continue to explore cinema markets where we believe there to be an ongoing growth potential and to upgrade the technology and amenities offered at our existing sites. These include (i) upgrading of our existing cinemas and (ii) developing new cinemas to provide our customers with premium offerings, including state-of-the-art presentation (including sound, lounges and bar service ) and luxury seating. The upgrades to our theater circuits’ film exhibition technology and amenities are summarized in the following table (including joint ventures):
|
|
|
|
|
|
|
|
|
|
|
|
Location
|
|
Screen
|
|
Screen Format |
|
|
|
|
Digital (all cinemas in our theater circuit) |
58 |
|
480 |
|
IMAX |
1 |
|
1 |
|
TITAN XC and LUXE |
22 |
|
26 |
|
Dine-in Service |
|
|
|
|
Gold Lounge (AU/NZ) (1) |
10 |
|
26 |
|
Premium (AU/NZ) (2) |
12 |
|
22 |
|
Spotlight (U.S.) (3) |
1 |
|
6 |
|
Upgraded Food & Beverage menu (U.S.) (4) |
15 |
|
n/a |
|
Premium Seating (recliner seating features) |
25 |
|
149 |
|
Liquor Licenses Obtained (5) |
31 |
|
n/a |
|
|
(1) |
|
Gold Lounge : This is our " First Class Full Dine-in Service " in our Australian and New Zealand cinemas, which includes upgraded F&B menu (with alcoholic beverages), luxury recliner seating features (intimate 25-50 seat cinemas) and waiter service. |
|
|
(2) |
|
Premium Service : This is our " Business Class Dine-in Service " in our Australian and New Zealand cinemas, which typically includes upgraded F&B menu (some with alcoholic beverages) and may include luxury recliner seating features (less intimate 80-seat cinemas), but no waiter service. |
|
|
(3) |
|
Spotlight Service: On March 30, 2018 we opened “Spotlight,” our first dine-in cinema concept in the United States at Reading Cinemas in Murrieta, California. Six of our 17 auditoriums at this theater feature this dine-in concept. |
|
|
(4) |
|
Upgraded Food & Beverage Menu: Fifteen of our U.S. theaters feature an elevated food and beverage menu served from a common counter, which includes, without limitation, beer, wine and/or spirits and a food menu beyond traditional concessions. We have worked with former Food Network executives to create a menu of locally inspired and freshly prepared items. |
|
|
(5) |
|
Liquor Licenses: Licenses are applicable at each cinema location, rather than each theatre auditorium. For accounting purposes, we capitalize the cost of successfully purchasing or applying for liquor licenses meeting certain thresholds as an intangible asset due to long-term economic benefits derived on future sales of alcoholic beverages. |
Real Estate
Our operating properties currently consists of the following assets:
|
|
· |
|
our Newmarket, Queensland ETC, our Belmont, Western Australia ETC, our Auburn, New South Wales ETC, our Townsville, Queensland ETC, our Wellington, New Zealand ETC, and our Cinemas 1,2,3, New York, NY; |
|
|
· |
|
two single-auditorium live theatres in Manhattan (Minetta Lane and Orpheum) and a four-auditorium live theater complex (including the accompanying ancillary retail and commercial space) in Chicago (The Royal George); |
|
|
· |
|
our Worldwide Headquarters building in Culver City, California and our Australia corporate office building in Melbourne, Australia; and, |
|
|
· |
|
the ancillary retail and commercial space at some of our non-ETC cinema properties. |
We currently license our Minetta Lane theatre to Audible, Inc., a subsidiary of Amazon. This agreement continues through March 2020, and Audible has an option to extend for one additional year through March 2021. We are advised that Audible intends to produce plays featuring a limited cast of one or two characters and special live performance engagements, record those productions and make them available to the public through the Audible streaming service.
In addition, we have various parcels of unimproved real estate held for development in Australia and New Zealand and certain unimproved land in the United States, including some that was used in our legacy activities.
33
Our key real estate transactions in recent years are as follows:
Strategic Acquisitions
|
|
· |
|
Purchase of Land at Cannon Park, Australia – On June 13, 2018, we acquired a 163,000 square foot (15,150 square meter) parcel at our Cannon Park ETC, in connection with the restructuring of our relationship with the adjacent land owner. Prior to the restructuring, this parcel was commonly owned by us and the adjoining land owner. In the restructuring, the adjoining land owner conveyed to us its interest in the parcel for AU$1. We granted the adjoining land owner certain access rights. |
|
|
· |
|
Purchase of Property in Auburn, Australia – On June 29, 2018, we added 20,870 square feet of land, improved with a 16,830 square foot office building, to our Auburn/Redyard ETC. The property was acquired at auction for $3.5 million (AU$4.5 million) and is bordered by our existing ETC on three sides. The property is leased to Telstra through July 2022. This will allow us time to plan for the efficient integration of the property into our ETC. The final settlement payment was made in early October 2018 . |
|
|
· |
|
Exercise of Option to Acquire Ground Lessee’s interest in Ground Lease and Improvements Constituting the Village East Cinema – On August 28, 2019, we exercised our option to acquire the ground lessee’s interest in the 13 year ground lease underlying and the real property assets constituting our Village East Cinema in Manhattan. The purchase price under the option is $5.9 million. It is anticipated that the transaction will close on or about May 31, 2020 . |
Value-creating Opportunities
We are engaged in several real estate development projects to take our properties to their highest and best use. The most notable of these value-creating projects are as follows:
|
|
· |
|
Re -D evelopment of 44 Union Square (New York, U . S .) During July 2019 , we topped out the steel dome capping our redevelopment of historic Tammany Hall at 44 Union Square and the last of the glass was installed last month. We anticipate filing for our core and shell temporary certificate of occupancy in December 2019 and are in final negotiations of a long - term lease for approximately 90% of the net rentable area of the building. This lease would be for office use, and the remaining 7,200 square feet of ground floor space (facing onto Union Square) continues to be marketed for retail use by Newmark . |
|
|
· |
|
Expansion Project for our Newmarket Shopping Center at an affluent suburb of Brisbane, Australia . In December 2017, we opened our eight-screen Reading Cinema with TITAN LUXE, including 10,355 square feet of additional retail space and 124 parking spaces . As of September 30, 2019 , 100% of this new retail space has been leased. |
|
|
· |
|
Courtenay Central Re-Development in Wellington, New Zealand . Located in the heart of Wellington - New Zealand’s capital city – this center is comprised of 161,071 square feet of land situated proximate to the Te Papa Tongarewa Museum (attracting over 1.5 million visitors annually), across the street from the site of Wellington’s newly announced convention center (estimated to open its doors in 2022) and at a major public transit hub. Damage from the 2016 earthquake necessitated demolition of our nine-story parking garage at the site. Further, unrelated seismic issues have caused us to temporarily close the existing cinema and significant portions of the retail structure while we reevaluate the property for redevelopment as an entertainment themed urban center with a major food and grocery component. Wellington continues to be rated as one of the top cities in the world in which to live, and we continue to believe that the Courtenay Central site is located in one of the most vibrant and growing commercial and entertainment precincts of Wellington. We are currently working on a comprehensive plan for the redevelopment of this property featuring a variety of uses to compliment and build upon the “destination quality” of this location. |
34
|
|
§ |
|
Cinemas 1,2,3 Redevelopment – As previously disclosed, our endeavors to negotiate a joint development deal with our adjoining neighbors have not borne fruit. Given the closure of our three cinemas in New York City’s Upper East Side, we have determined to continue to operate this location as a cinema for at least the near term. |
|
|
· |
|
Manukau Land Rezoning – In August 2016, the Auck land City Council up-zoned 64.0 acres of our property in Manukau from agricultural to light in dustrial use. The remaining 6.4 acres were already zoned for heavy industrial use. With o ur zoning enhancement goal having been achieved, we are working with adjoining landholders to jointly advance necessary infrastructure improvement issues. Over the past nine months, we have developed budgets and layouts and have made the various resource consent filings required for the construction of anticipated infrastructure. We estimate that our property will support approximately 1.6 million square feet of improvements. We see this property as a future value realization opportunity for us. This tract is adjacent to the Auckland Airport, which is currently undergoing a major improvement and expansion project. |
Corporate Matters
|
|
§ |
|
Stock Repurchase Program – Our Board approved a $25-million r epurchase program on March 2, 2017, and extended it on March 14, 2019. Under this authorization R eading may repurchase its Class A Non-Voting Common Stock from time to time in accordance with the requirements of the Securities and Exchange Commission on the open market, in block trades and in privately negotiated transactions, depending on market conditions and other factors. The new author ization continues through March 2, 2021. T hrough September 30, 2019, we have repurchased 1,415,624 shares of Class A Non-Voting Common Stock at $14.23 per share (excluding transaction costs). 659,608 shares were purchased during the quarter ended September 30, 2019 , at an average price of $13.17 per share. As of September 30, 2019 , $4.9 million was available under the March 2, 2017 program, as extended, for repurchase. |
Our Financing Strategy
Our treasury management is focused on cash management using cash balances to reduce debt. We have used cash generated from operations and other excess cash, to the extent not needed for capital expenditures, to pay down o ur loans and credit facilities providing us flexibility on our available loan facilities for future use and, thereby, reducing interest charges. On a periodic basis, we review the maturities of our borrowing arrangements and negotiate for renewals and extensions where necessary in the current circumstances.
On March 15, 2019, we amended our Revolving Corporate Markets Loan Facility with National Australia Bank (“NAB”) from a facility comprised of (i) a AU$66.5 million loan facility with an interest rate of 0.95% above the Bank Bill Swap Bid Rate (“BBSY”) and a maturity date of June 30, 2019 and (ii) a bank guarantee of AU$5.0 million at a rate of 1.90% per annum into a (i) AU$120.0 million corporate loan facility at rates of 0.85%-1.30% above BBSY depending on certain ratios with a due date of December 31, 2023, of which AU$80.0 million is revolving and AU$40.0 million is core and (ii) a bank guarantee facility of AU$5.0 million at a rate of 1.85% per annum. Such modifications of this particular term loan were not considered to be substantial under US GAAP.
On December 20, 2018, we restructured our Westpac Corporate Credit Facilities. The maturity of the 1 st tranche (general/non-construction credit line) was extended to December 31, 2023, with the available facility being reduced from NZ$35.0 million to NZ$32.0 million. The facility bears an interest rate of 1.75% above the Bank Bill Bid Rate on the drawn down balance and a 1.1% line of credit charge on the entire facility. The 2 nd tranche (construction line) with a facility of NZ$18.0 million was removed.
On November 5, 2019, we extended our current Bank of America credit facilities until October 1, 2020 (the $55.0 million credit line).
Refer to our 2018 Form 10-K for more details on our cinema and real estate segments.
35
RESULTS OF OPERATIONS
The table below summarize s the results of operations for each of our principal business segments along with the non-segment information for the quarter and nine months ended September 30, 2019 and September 30, 2018 , respectively.
|
|
|
|
|
|
|
|
|
|
|
|
|
|
|
|
|
|
|
|
|
|
|
|
|
|
|
Quarter Ended |
|
% Change |
|
Nine Months Ended |
|
% Change |
||||||||||||
|
(Dollars in thousands) |
|
September 30,
|
|
September 30,
|
|
Fav/
|
|
September 30,
|
|
September 30,
|
|
Fav/
|
|||||||||
|
SEGMENT RESULTS |
|
|
|
|
|
|
|
|
|
|
|
|
|
|
|
|
|
|
|
|
|
|
|
Revenue |
|
|
|
|
|
|
|
|
|
|
|
|
|
|
|
|
|
|
|
|
|
|
Cinema exhibition |
|
$ |
66,733 |
|
|
70,671 |
|
(6) |
% |
|
$ |
197,101 |
|
$ |
223,109 |
|
(12) |
% |
||
|
|
Real estate |
|
|
5,531 |
|
|
5,771 |
|
(4) |
% |
|
|
16,525 |
|
|
18,204 |
|
(9) |
% |
||
|
|
Inter-segment elimination |
|
|
(1,808) |
|
|
(2,181) |
|
17 |
% |
|
|
(5,524) |
|
|
(6,918) |
|
20 |
% |
||
|
|
Total revenue |
|
|
70,456 |
|
|
74,261 |
|
(5) |
% |
|
|
208,102 |
|
|
234,395 |
|
(11) |
% |
||
|
|
Operating expense |
|
|
|
|
|
|
|
|
|
|
|
|
|
|
|
|
|
|
|
|
|
|
Cinema exhibition |
|
|
(55,517) |
|
|
(57,111) |
|
3 |
% |
|
|
(163,797) |
|
|
(177,101) |
|
8 |
% |
||
|
|
Real estate |
|
|
(2,225) |
|
|
(2,474) |
|
10 |
% |
|
|
(7,108) |
|
|
(7,409) |
|
4 |
% |
||
|
|
Inter-segment elimination |
|
|
1,808 |
|
|
2,181 |
|
(17) |
% |
|
|
5,524 |
|
|
6,918 |
|
(20) |
% |
||
|
|
Total operating expense |
|
|
(55,934) |
|
|
(57,404) |
|
3 |
% |
|
|
(165,381) |
|
|
(177,592) |
|
7 |
% |
||
|
|
Depreciation and amortization |
|
|
|
|
|
|
|
|
|
|
|
|
|
|
|
|
|
|
|
|
|
|
Cinema exhibition |
|
|
(4,271) |
|
|
(4,352) |
|
2 |
% |
|
|
(12,519) |
|
|
(12,199) |
|
(3) |
% |
||
|
|
Real estate |
|
|
(1,330) |
|
|
(1,385) |
|
4 |
% |
|
|
(4,061) |
|
|
(4,193) |
|
3 |
% |
||
|
|
Total depreciation and amortization |
|
|
(5,601) |
|
|
(5,737) |
|
2 |
% |
|
|
(16,580) |
|
|
(16,392) |
|
(1) |
% |
||
|
|
General and administrative expense |
|
|
|
|
|
|
|
|
|
|
|
|
|
|
|
|
|
|
|
|
|
|
Cinema exhibition |
|
|
(924) |
|
|
(1,006) |
|
8 |
% |
|
|
(2,854) |
|
|
(2,826) |
|
(1) |
% |
||
|
|
Real estate |
|
|
(491) |
|
|
(652) |
|
25 |
% |
|
|
(1,369) |
|
|
(1,706) |
|
20 |
% |
||
|
|
Total general and administrative expense |
|
|
(1,415) |
|
|
(1,658) |
|
15 |
% |
|
|
(4,223) |
|
|
(4,532) |
|
7 |
% |
||
|
|
Segment operating income |
|
|
|
|
|
|
|
|
|
|
|
|
|
|
|
|
|
|
|
|
|
|
Cinema exhibition |
|
|
6,021 |
|
|
8,202 |
|
(27) |
% |
|
|
17,931 |
|
|
30,983 |
|
(42) |
% |
||
|
|
Real estate |
|
|
1,485 |
|
|
1,260 |
|
18 |
% |
|
|
3,987 |
|
|
4,896 |
|
(19) |
% |
||
|
|
Total segment operating income |
|
$ |
7,506 |
|
$ |
9,462 |
|
(21) |
% |
|
$ |
21,918 |
|
$ |
35,879 |
|
(39) |
% |
||
|
NON-SEGMENT RESULTS |
|
|
|
|
|
|
|
|
|
|
|
|
|
|
|
|
|
|
|||
|
|
Depreciation and amortization expense |
|
|
(103) |
|
|
(92) |
|
(12) |
% |
|
|
(288) |
|
|
(313) |
|
8 |
% |
||
|
|
General and administrative expense |
|
|
(4,493) |
|
|
(4,831) |
|
7 |
% |
|
|
(14,205) |
|
|
(16,717) |
|
15 |
% |
||
|
|
Interest expense, net |
|
|
(1,871) |
|
|
(1,748) |
|
(7) |
% |
|
|
(5,924) |
|
|
(5,132) |
|
(15) |
% |
||
|
|
Equity earnings of unconsolidated joint ventures |
|
|
220 |
|
|
80 |
|
>100 |
% |
|
|
581 |
|
|
667 |
|
(13) |
% |
||
|
|
Gain (loss) on sale of assets |
|
|
(1) |
|
|
— |
|
nm |
|
|
(1) |
|
|
— |
|
nm |
% |
|||
|
|
Other income (expense) |
|
|
141 |
|
|
(130) |
|
>100 |
% |
|
|
190 |
|
|
(273) |
|
>100 |
% |
||
|
|
Income before income taxes |
|
|
1,399 |
|
|
2,741 |
|
(49) |
% |
|
|
2,271 |
|
|
14,111 |
|
(84) |
% |
||
|
|
Income tax benefit (expense) |
|
|
(547) |
|
|
(1,482) |
|
63 |
% |
|
|
(1,159) |
|
|
(4,618) |
|
75 |
% |
||
|
Net income (loss) |
|
|
852 |
|
|
1,259 |
|
(32) |
% |
|
|
1,112 |
|
|
9,493 |
|
(88) |
% |
|||
|
|
Less: net (income) loss attributable to noncontrolling interests |
|
|
(50) |
|
|
(38) |
|
(32) |
% |
|
|
(103) |
|
|
88 |
|
(>100) |
% |
||
|
Net income (loss) attributable to RDI common stockholders |
|
$ |
902 |
|
$ |
1,297 |
|
(30) |
% |
|
$ |
1,215 |
|
$ |
9,405 |
|
(87) |
% |
|||
|
Basic EPS |
|
$ |
0.04 |
|
$ |
0.06 |
|
(33) |
% |
|
$ |
0.05 |
|
$ |
0.41 |
|
(88) |
% |
|||
Consolidated and Non-Segment Results:
Third Quarter and Nine Months Net Results
For the quarter ended September 30, 2019, net income attributable to RDI common stockholders decreased by 30% , or $0.4 million, to $0.9 million, compared to the same period in the prior year. Basic EPS for the quarter ended September 30, 2019 , decreased by $0.02 to $0.04 compared to $0.06 for the quarter ended September 30, 2018 , mainly attributed to decreases in revenue in the Cinema business segment , offset by reductions of segment variable expenses and a 7% r eduction in non-segment general and administrative expenses. Additionally, revenues were adversely impacted by the continued weakening of the Australian and New Zealand dollar compared to the U.S. dollar.
For the nine months ended September 30, 2019, ne t income attributable to RDI common stockholders decreased by 87% , or $8.2 million, to $1.2 million, compared to the same period prior year . Basic EPS for the nine months ended September 30, 2019 , decreased by $0.36 , to $0.05 compared to the nine months ended September 30, 2018 , mainly attributable to decreases in revenue in both the Cinema and Real Estate business segments partially offset by a 15% decrease in non-segment general and administrative expenses.
With respect to both the three month and the nine month period, net income attributable to RDI common stockholders was adversely impacted by the declining value of the Australia and New Zealand dollar compared to the U.S. dollar compared to the same periods for the prior year. See Note 3 to the Consolidated Financial Statements. Since December 31, 2018, the Australian dollar has declined by 4.3% and the New Zealand dollar has declined by 6.7% compared to the U.S. dollar. See discussion of Australian and New Zealand results, below.
36
Revenue for the quarter ended September 30, 2019 decreased by 5% , or $3.8 million, to $70.5 million compared to the same period prior year. Revenue decreased in both the Cinema and Real Estate operating segments.
Revenue for the nine months ended September 30, 2019 decreased by 11% , or $ 26.3 million, to $ 208.1 million compared to the same period prior year. The revenue decreases were due to a (i) decrease in revenue from our cinema business primarily due to the soft film slate, and (ii) a decrease in revenue from the Real Estate business segment primarily due to the closure of most of the net rentable area of Courtenay Central due to our abundance of caution relative to potential seismic issues. Overseas revenues were also adversely impacted by the continued weakening of the Australian and New Zealand dollar compared to the U.S . dollar. While expenses are down overall, d ue to the fact that our occupancy costs with respect to our cinema operations are mostly fixed, the decrease in revenues disproportionally impacts the earnings from these operations, even though our film rent, cinema level labor and costs of goods sold are largely variable . In the case of New Zealand, the situation was exacerbated by the temporary c losure of ou r cinema at Courtenay Central. In order to partially compensate for the loss of our Courtenay Central cinema, during June 2019, we opened a three- screen, 440 seat pop-up theater, in Lower Hutt, a suburb of Wellington, New Zealand.
Non-Segment General & Administrative Expenses
Non-segment general and administrative expense for the quarter ended September 30, 2019 decreased by 7% , or $0.3 million, to $4.5 million compared to the same period in the prior year, related to lower legal expenses, consulting fees, and various compensation costs.
For the nine months ended September 30, 2019 , the decrease was 15% , or $2.5 million, to $14.2 million compared to the nine months ended September 30, 2018 , primarily related to lower legal expenses .
Income Tax Expense
Income tax expense for the quarter and nine months ended September 30, 2019 , decreased by $0.9 million and $3.5 million , respectively, compared to the equivalent prior-year period. The change between 2019 and 2018 is primarily related to lower pretax income for the quarter and first nine months of 2019.
Business Segment Results
At September 30, 2019 , we leased or owned and operated 58 cinemas with 480 screens which includes our interests in certain unconsolidated joint ventures that own 3 (three) cinemas with 29 screens. In the first quarter of 2019, we acquired a proven four-screen cinema in Devonport, Tasmania, Australia. During June 2019, we opened a three-screen cinema trading as “The Hutt Pop Up by Reading Cinemas” in Lower Hutt, a suburb of Wellington, New Zealand. In the second and third quarter, we closed three cinema s in New York C ity due to lease expirations . We also (i) owned and operated 5 (five) ETCs located in Newmarket (a suburb of Brisbane), Belmont (a suburb of Perth), Auburn (a suburb of Sydney) and in Townsville in Australia and Wellington in New Zealand, (ii) owned and operated our headquarters office buildings in Culver City (an emerging high-tech and communications hub in Los Angeles County) and Melbourne, Australia, (iii) owned and operated the fee interests in three developed commercial properties in Manhattan and Chicago improved with live theatres comprising 6 (six) stages and ancillary retail and commercial space (our fourth live theatre was closed at the end of 2015 as part of the redevelopment of 44 Union Square in New York City), (iv) owned a 75% managing member interest in a limited liability company, which in turn owns the fee interest in Cinemas 1,2,3, (v) held for development approximately 70.4 acres of developable industrial land located next to the Auckland Airport in New Zealand, (vi) owned a 50% managing member interest in a limited liability company, which in turn owns a 202-acre property in Coachella, California that is zoned approximately 150 acres for single-family residential use (maximum 550 homes) and approximately 50 acres for high density mixed use that is held for development, and, (vii) owned 197 acres principally in Pennsylvania from our legacy railroad business, including the Reading Viaduct in downtown Philadelphia. In addition, at the present time, we have agreements in place for the leasing of an additional five cinemas with 31 screens currently under development.
The Company transacts business in Australia and New Zealand and is subject to risks associated with changing foreign currency exchange rates. The Australian and New Zealand dollars based on the spot rate weakened versus prior quarter against the U.S. dollar slightly negatively impacting the value of our assets and liabilities. The average rate for the nine months ended September 30, 2019 and 2018 has also weakened by 7.7% and 5.1% respectively. This has decreased the value of our Australian and New Zealand revenues and expenses. Refer to Note 3 – Operations in Foreign Currency for further information .
37
Cinema Exhibition
The following table details our cinema exhibition segment operating results for the quarter and nine months ended September 30, 2019 and September 30, 2018 , respectively:
|
|
|
|
|
|
|
|
|
|
|
|
|
|
|
|
|
|
|
|
|
|
|
|
|
|
|
|
|
|
|
|
|
|
|
|
|
|
|
|
% Change |
|||
|
|
|
|
Quarter Ended |
|
Nine Months Ended |
|
Fav/(Unfav) |
|||||||||||||
|
(Dollars in thousands) |
September 30,
|
% of Revenue |
September 30,
|
% of Revenue |
|
September 30,
|
% of Revenue |
September 30,
|
% of Revenue |
|
Quarter
|
Nine Months Ended |
||||||||
|
REVENUE |
|
|
|
|
|
|
|
|
|
|
|
|
|
|
|
|
|
|
||
|
|
United States |
Admissions revenue |
$ |
22,540 |
34% |
$ |
25,664 |
36% |
|
$ |
67,173 |
34% |
$ |
78,506 |
35% |
|
(12) |
% |
(14) |
% |
|
|
|
Food & beverage revenue |
|
11,606 |
17% |
|
11,659 |
16% |
|
|
34,304 |
18% |
|
36,029 |
16% |
|
- |
% |
(5) |
% |
|
|
|
Advertising and other revenue |
|
2,604 |
4% |
|
2,715 |
4% |
|
|
8,266 |
4% |
|
7,902 |
4% |
|
(4) |
% |
5 |
% |
|
|
|
|
$ |
36,750 |
55% |
$ |
40,038 |
57% |
|
$ |
109,743 |
56% |
$ |
122,437 |
55% |
|
(8) |
% |
(10) |
% |
|
|
Australia |
Admissions revenue |
$ |
15,603 |
23% |
$ |
15,428 |
22% |
|
$ |
46,219 |
23% |
$ |
49,658 |
22% |
|
1 |
% |
(7) |
% |
|
|
|
Food & beverage revenue |
|
7,014 |
11% |
|
6,861 |
10% |
|
|
20,482 |
10% |
|
22,869 |
10% |
|
2 |
% |
(10) |
% |
|
|
|
Advertising and other revenue |
|
1,662 |
2% |
|
1,370 |
2% |
|
|
4,617 |
3% |
|
4,986 |
2% |
|
21 |
% |
(7) |
% |
|
|
|
|
$ |
24,279 |
36% |
$ |
23,659 |
33% |
|
$ |
71,318 |
36% |
$ |
77,513 |
35% |
|
3 |
% |
(8) |
% |
|
|
New Zealand |
Admissions revenue |
$ |
3,862 |
6% |
$ |
4,601 |
7% |
|
$ |
10,734 |
5% |
$ |
15,109 |
7% |
|
(16) |
% |
(29) |
% |
|
|
|
Food & beverage revenue |
|
1,618 |
3% |
|
1,992 |
3% |
|
|
4,549 |
3% |
|
6,792 |
3% |
|
(19) |
% |
(33) |
% |
|
|
|
Advertising and other revenue |
|
224 |
0% |
|
381 |
1% |
|
|
757 |
0% |
|
1,258 |
1% |
|
(41) |
% |
(40) |
% |
|
|
|
|
$ |
5,704 |
9% |
$ |
6,974 |
10% |
|
$ |
16,040 |
8% |
$ |
23,159 |
10% |
|
(18) |
% |
(31) |
% |
|
|
|
|
|
|
|
|
|
|
|
|
|
|
|
|
|
|
|
|
|
|
|
|
Total revenue |
$ |
66,733 |
100% |
$ |
70,671 |
100% |
|
$ |
197,101 |
100% |
$ |
223,109 |
100% |
|
(6) |
% |
(12) |
% |
|
|
OPERATING EXPENSE |
|
|
|
|
|
|
|
|
|
|
|
|
|
|
|
|
|
|
||
|
|
United States |
Film rent and advertising cost |
$ |
(12,215) |
19% |
$ |
(13,525) |
19% |
|
$ |
(35,989) |
19% |
$ |
(41,958) |
19% |
|
10 |
% |
14 |
% |
|
|
|
Food & beverage cost |
|
(2,642) |
4% |
|
(2,595) |
4% |
|
|
(7,952) |
4% |
|
(7,817) |
4% |
|
(2) |
% |
(2) |
% |
|
|
|
Occupancy expense |
|
(6,655) |
10% |
|
(7,193) |
10% |
|
|
(20,487) |
10% |
|
(21,777) |
10% |
|
7 |
% |
6 |
% |
|
|
|
Other operating expense |
|
(11,674) |
17% |
|
(11,021) |
16% |
|
|
(33,237) |
17% |
|
(31,639) |
14% |
|
(6) |
% |
(5) |
% |
|
|
|
|
$ |
(33,186) |
50% |
$ |
(34,334) |
49% |
|
$ |
(97,665) |
50% |
$ |
(103,191) |
46% |
|
3 |
% |
5 |
% |
|
|
Australia |
Film rent and advertising cost |
$ |
(7,456) |
11% |
$ |
(6,945) |
10% |
|
$ |
(21,764) |
11% |
$ |
(22,935) |
10% |
|
(7) |
% |
5 |
% |
|
|
|
Food & beverage cost |
|
(1,326) |
2% |
|
(1,365) |
2% |
|
|
(3,847) |
2% |
|
(4,563) |
2% |
|
3 |
% |
16 |
% |
|
|
|
Occupancy expense |
|
(3,948) |
6% |
|
(3,834) |
5% |
|
|
(11,882) |
6% |
|
(12,216) |
5% |
|
(3) |
% |
3 |
% |
|
|
|
Other operating expense |
|
(5,267) |
8% |
|
(5,265) |
7% |
|
|
(16,048) |
8% |
|
(16,611) |
7% |
|
- |
% |
3 |
% |
|
|
|
|
$ |
(17,997) |
27% |
$ |
(17,409) |
25% |
|
$ |
(53,541) |
27% |
$ |
(56,325) |
25% |
|
(3) |
% |
5 |
% |
|
|
New Zealand |
Film rent and advertising cost |
$ |
(1,835) |
3% |
$ |
(2,164) |
3% |
|
$ |
(5,065) |
3% |
$ |
(7,102) |
3% |
|
15 |
% |
29 |
% |
|
|
|
Food & beverage cost |
|
(328) |
0% |
|
(448) |
1% |
|
|
(945) |
0% |
|
(1,513) |
1% |
|
27 |
% |
38 |
% |
|
|
|
Occupancy expense |
|
(891) |
1% |
|
(1,221) |
2% |
|
|
(2,602) |
1% |
|
(3,923) |
2% |
|
27 |
% |
34 |
% |
|
|
|
Other operating expense |
|
(1,280) |
2% |
|
(1,535) |
2% |
|
|
(3,979) |
2% |
|
(5,047) |
2% |
|
17 |
% |
21 |
% |
|
|
|
|
$ |
(4,334) |
6% |
$ |
(5,368) |
8% |
|
$ |
(12,591) |
6% |
$ |
(17,585) |
8% |
|
19 |
% |
28 |
% |
|
|
|
|
|
|
|
|
|
|
|
|
|
|
|
|
|
|
|
|
|
|
|
|
Total operating expense |
$ |
(55,517) |
83% |
$ |
(57,111) |
81% |
|
$ |
(163,797) |
83% |
$ |
(177,101) |
79% |
|
3 |
% |
8 |
% |
|
|
DEPRECIATION, AMORTIZATION, GENERAL AND ADMINISTRATIVE EXPENSE |
|
|
|
|
|
|
|
|
|
|
|
|
|
|
|
|
|
|
||
|
|
United States |
Depreciation and amortization |
$ |
(2,647) |
4% |
$ |
(2,787) |
4% |
|
$ |
(7,790) |
4% |
$ |
(7,388) |
3% |
|
5 |
% |
(5) |
% |
|
|
|
General and administrative expense |
|
(480) |
1% |
|
(607) |
1% |
|
|
(1,516) |
1% |
|
(1,850) |
1% |
|
21 |
% |
18 |
% |
|
|
|
|
$ |
(3,127) |
5% |
$ |
(3,394) |
5% |
|
$ |
(9,306) |
5% |
$ |
(9,238) |
4% |
|
8 |
% |
(1) |
% |
|
|
Australia |
Depreciation and amortization |
$ |
(1,227) |
2% |
$ |
(1,187) |
2% |
|
$ |
(3,630) |
2% |
$ |
(3,572) |
2% |
|
(3) |
% |
(2) |
% |
|
|
|
General and administrative expense |
|
(384) |
1% |
|
(385) |
1% |
|
|
(1,238) |
1% |
|
(974) |
0% |
|
- |
% |
(27) |
% |
|
|
|
|
$ |
(1,611) |
3% |
$ |
(1,572) |
2% |
|
$ |
(4,868) |
3% |
$ |
(4,546) |
2% |
|
(2) |
% |
(7) |
% |
|
|
New Zealand |
Depreciation and amortization |
$ |
(396) |
1% |
$ |
(378) |
1% |
|
$ |
(1,099) |
1% |
$ |
(1,239) |
1% |
|
(5) |
% |
11 |
% |
|
|
|
General and administrative expense |
|
(61) |
0% |
|
(14) |
0% |
|
|
(100) |
0% |
|
(2) |
0% |
|
(>100) |
% |
(>100) |
% |
|
|
|
|
$ |
(457) |
1% |
$ |
(392) |
1% |
|
$ |
(1,199) |
1% |
$ |
(1,241) |
1% |
|
(17) |
% |
3 |
% |
|
|
|
|
|
|
|
|
|
|
|
|
|
|
|
|
|
|
|
|
|
|
|
|
Total depreciation, amortization, general and administrative expense |
$ |
(5,195) |
9% |
$ |
(5,358) |
8% |
|
$ |
(15,373) |
9% |
$ |
(15,025) |
7% |
|
3 |
% |
(2) |
% |
|
|
OPERATING INCOME – CINEMA |
|
|
|
|
|
|
|
|
|
|
|
|
|
|
|
|
|
|
||
|
|
United States |
$ |
437 |
1% |
$ |
2,310 |
3% |
|
$ |
2,772 |
1% |
$ |
10,008 |
4% |
|
(81) |
% |
(72) |
% |
|
|
|
Australia |
|
4,671 |
7% |
|
4,678 |
7% |
|
|
12,909 |
7% |
|
16,642 |
7% |
|
- |
% |
(22) |
% |
|
|
|
New Zealand |
|
913 |
1% |
|
1,214 |
2% |
|
|
2,250 |
1% |
|
4,333 |
2% |
|
(25) |
% |
(48) |
% |
|
|
|
Total Cinema operating income |
$ |
6,021 |
9% |
$ |
8,202 |
12% |
|
$ |
17,931 |
9% |
$ |
30,983 |
14% |
|
(27) |
% |
(42) |
% |
|
3 rd Quarter Results
Cinema Segment operating income
C inema segment operating income decreased by 27% , or $2.2 million, to $6.0 million for the quarter ended September 30, 2019 compared to September 30, 2018 , which was due to a decrease in attendance in all three circuits , the continued temporary closure of our Courtenay Central Cinema in Wellington, New Zealand, a weakening foreign currency exchange rate, offset by fluctuations in average ticket price (“ATP”), and spend per patron (“SPP”) as outlined below.
38
Revenue
Cinema revenue decreased by 6% , or $3.9 m illion, to $66.7 mi llion for the quarter ended September 30, 2019 compared to September 30, 2018 , primarily attributable to a weaker slate of film from arthouse/specialty distributors in the U.S., a weakening foreign currency exchange rate, and a decrease in attendance in all three circuits , offset by the full quarter operations of Mililani during 2019 as it was closed for renovations during the same period prior year.
Below are the changes in our cinema revenue by market:
|
|
· |
|
U.S. cinema revenue decreased by 8% , or $3.3 million, to $36.8 million for the third quarter due to a 14% decrease in attendance; offset by a 13% increase in SPP and a 2% increase in ATP. |
|
|
· |
|
Australia cinema revenue increased by 3% , or $0.6 million , to $24.3 million for the third quarter, primarily due to a 4% increase in SPP and 3% increase in ATP, offset by a 2% decrease in attendance. |
|
|
· |
|
New Zealand cinema revenue decreased by 18% , or $1.3 million, to $5.7 million for the third quarter due to a decrease of 24% in attendance (significantly due to the temporary closure of our Courtenay Central Cinema), offset by a 13% increase in SPP and a 10% increase in ATP, and the opening of The Hutt cinema during the second quarter of 2019. |
Operating expense
Operating expense for the third quarter ended September 30, 2019 decreased by 3% , or $1.6 million, to $55.5 million compared to the same quarter in 2018 primarily attributable to (i) lower film rent expense driven by lower admissions revenue, (ii) lower occupancy expenses and ( i ii) to a lesser extent lower F&B costs due to lower F&B r evenue primarily in New Zealand (significantly due to the temporary closure of the Courtenay Central Cinema).
Operating expense as a percentage of gross revenue has increased to 83% for the third quarter of 2019 , compared to 81% for the same period in 2018, due to the lower than anticipated revenue in our box office and the fact that certain of our occupancy costs are generally fixed, and cannot be adjusted to reflect such lower admission levels.
Depreciation, amortization, general and administrative expense
Depreciation, amortization, general and administrative expense for the quarter ended September 30, 2019 , decreased slightly at $5.2 million compared to $5.4 million for the third quarter 2018 . The 3% decrease of $0.2 million is attributable to a reduction in depreciation and amortization in the U.S. cinema segment.
Nine Month Results
Cinema Segment operating income
C inema segment operating income decreased by 42% , or $13.1 million, to $17.9 million for the nine months ended September 30, 2019 compared to the nine months ended September 30, 2018 , primarily due to a weak film slate worldwide resulting in decreases in attendance worldwide. Additionally, Courtenay Central Cinema in Wellington, New Zealand wa s temporarily closed in January 2019 due to seismic concerns and has not reopened.
Revenue
Cinema revenue decreased by 12% , or $26.0 million, to $197.1 million for the nine months ended September 30, 2019 compared to September 30, 2018 , primarily driven by decreased attendance worldwide, and offset by fluctuations in average ticket price (“ATP”), and spend per patron (“SPP”) as outlined below :
|
|
· |
|
U.S. cinema revenue decreased by 10% , or $12.7 million, to $109.7 million, due to a 1 6 % decrease in attendance, offset by a 11 % increase in SPP, and a 2% increase in ATP. According to industry sources, the U.S. exhibition industry admissions for the nine months ended September 30, 2019 wer e down 6%, declining from $7.7 billion to $7.3 billion for the same period in the prior year. Our declines were greater than the industry average due principally to the fact that we feature art and foreign film in a number of our facilities, which was more heavily impacted during the period than conventional film product. |
|
|
· |
|
Australia cine ma revenue decreased by 8% , or $6.2 million, to $71.3 million, primarily due to a 7% decrease in attendance, a 3% decrease in SPP, while ATP remained relatively flat. |
|
|
· |
|
New Zealand cinema revenue decreased by 31% , or $7.1 million, to $16.0 million, as a result of a 32% decrease in attendance (sig nificantly due to the temporary closure of our Courtenay Central Cinema); offset by a 5% increase in ATP and a 4% increase in SPP. |
Operating expense
Operating expense for the nine months ended September 30, 2019 decreased by 8% , or $13.3 million, to $163.8 millio n, primarily attributable to (i) lower film rent due to lower admissions revenue, (ii) lower F&B costs due to lower F&B revenue, and (iii) lower occupancy costs due to the temporary closure of Courtenay Central Cinema offset by the foreign currency movements . Of course, since we own Courtenay Central, our real estate revenues were adversely impacted in an equal amount.
39
Operating expense as a percentage of gross revenue has increased to 83% for the nine months ended September 30, 2019 , compared to 79% in the same period for 2018 , due to the lower than anticipated revenue in our box office and the fact that certain of our occupancy costs are generally fixed, and cannot be adjusted to reflect such lower admission levels.
Depreciation, amortization, general and administrative expense
Depreciation, amortization, general and administrative expense for th e nine months ended September 30, 2019 increased by 2% , or $0.3 million, to $15.4 million, compared to the same period in 201 8 . This expense remained relatively flat as the number of cinemas open ed or assets placed in to service ha s been minimal result ing in only slightly higher depreciation costs and these were partially o ffset by the foreign exchange movements in Australia and New Zealand.
Real Estate
The following table details our real estate segment operating results for the quarter and nine months ended September 30, 2019 and 2018 , respectively:
|
|
|
|
|
|
|
|
|
|
|
|
|
|
|
|
|
|
|
|
|
|
|
|
|
|
Quarter Ended |
|
Nine Months Ended |
|
Fav/(Unfav) |
|||||||||||||
|
(Dollars in thousands) |
September 30,
|
% of
|
September 30,
|
% of
|
|
September 30,
|
% of
|
September 30,
|
% of
|
|
Quarter Ended |
Nine Months Ended |
||||||||
|
REVENUE |
|
|
|
|
|
|
|
|
|
|
|
|
|
|
|
|
|
|
||
|
|
United States |
Live theater rental and ancillary income |
$ |
955 |
17% |
$ |
756 |
13% |
|
$ |
2,721 |
16% |
$ |
2,257 |
12% |
|
26 |
% |
21 |
% |
|
|
|
Property rental income |
|
51 |
1% |
|
49 |
1% |
|
|
152 |
1% |
|
153 |
1% |
|
4 |
% |
(1) |
% |
|
|
|
|
|
1,006 |
18% |
|
805 |
14% |
|
|
2,873 |
17% |
|
2,410 |
13% |
|
25 |
% |
19 |
% |
|
|
Australia |
Property rental income |
|
3,905 |
71% |
|
3,847 |
67% |
|
|
11,873 |
72% |
|
12,305 |
68% |
|
2 |
% |
(4) |
% |
|
|
New Zealand |
Property rental income |
|
620 |
11% |
|
1,119 |
19% |
|
|
1,779 |
11% |
|
3,489 |
19% |
|
(45) |
% |
(49) |
% |
|
|
|
|
|
|
|
|
|
|
|
|
|
|
|
|
|
|
|
|
|
|
|
|
Total revenue |
|
$ |
5,531 |
100% |
$ |
5,771 |
100% |
|
$ |
16,525 |
100% |
$ |
18,204 |
100% |
|
(4) |
% |
(9) |
% |
|
OPERATING EXPENSE |
|
|
|
|
|
|
|
|
|
|
|
|
|
|
|
|
|
|
||
|
|
United States |
Live theater cost |
$ |
(323) |
6% |
$ |
(325) |
6% |
|
$ |
(920) |
5% |
$ |
(951) |
5% |
|
1 |
% |
3 |
% |
|
|
|
Property cost |
|
(147) |
3% |
|
(117) |
2% |
|
|
(461) |
3% |
|
(392) |
2% |
|
(26) |
% |
(18) |
% |
|
|
|
Occupancy expense |
|
(74) |
1% |
|
(167) |
3% |
|
|
(353) |
2% |
|
(526) |
3% |
|
56 |
% |
33 |
% |
|
|
|
|
|
(544) |
10% |
|
(609) |
11% |
|
|
(1,734) |
10% |
|
(1,869) |
10% |
|
11 |
% |
7 |
% |
|
|
Australia |
Property cost |
|
(619) |
11% |
|
(796) |
14% |
|
|
(2,107) |
13% |
|
(2,300) |
13% |
|
22 |
% |
8 |
% |
|
|
|
Occupancy expense |
|
(669) |
12% |
|
(634) |
11% |
|
|
(2,024) |
12% |
|
(1,871) |
10% |
|
(6) |
% |
(8) |
% |
|
|
|
|
|
(1,288) |
23% |
|
(1,430) |
25% |
|
|
(4,131) |
25% |
|
(4,171) |
23% |
|
10 |
% |
1 |
% |
|
|
New Zealand |
Property cost |
|
(284) |
5% |
|
(282) |
5% |
|
|
(849) |
6% |
|
(920) |
5% |
|
(1) |
% |
8 |
% |
|
|
|
Occupancy expense |
|
(109) |
2% |
|
(153) |
3% |
|
|
(394) |
2% |
|
(449) |
2% |
|
29 |
% |
12 |
% |
|
|
|
|
|
(393) |
7% |
|
(435) |
8% |
|
|
(1,243) |
8% |
|
(1,369) |
8% |
|
10 |
% |
9 |
% |
|
|
|
|
|
|
|
|
|
|
|
|
|
|
|
|
|
|
|
|
|
|
|
|
Total operating expense |
|
$ |
(2,225) |
40% |
$ |
(2,474) |
43% |
|
$ |
(7,108) |
43% |
$ |
(7,409) |
41% |
|
10 |
% |
4 |
% |
|
DEPRECIATION, AMORTIZATION, GENERAL AND ADMINISTRATIVE EXPENSE |
|
|
|
|
|
|
|
|
|
|
|
|
|
|
|
|
|
|
||
|
|
United States |
Depreciation and amortization |
$ |
(196) |
4% |
$ |
(197) |
3% |
|
$ |
(584) |
4% |
$ |
(582) |
3% |
|
1 |
% |
- |
% |
|
|
|
General and administrative expense |
|
(54) |
1% |
|
(153) |
3% |
|
|
(392) |
2% |
|
(473) |
3% |
|
65 |
% |
17 |
% |
|
|
|
|
|
(250) |
5% |
|
(350) |
6% |
|
|
(976) |
6% |
|
(1,055) |
6% |
|
29 |
% |
7 |
% |
|
|
Australia |
Depreciation and amortization |
$ |
(892) |
16% |
$ |
(938) |
16% |
|
$ |
(2,729) |
17% |
$ |
(2,830) |
16% |
|
5 |
% |
4 |
% |
|
|
|
General and administrative expense |
|
(320) |
6% |
|
(499) |
9% |
|
|
(860) |
5% |
|
(1,233) |
7% |
|
36 |
% |
30 |
% |
|
|
|
|
|
(1,212) |
22% |
|
(1,437) |
25% |
|
|
(3,589) |
22% |
|
(4,063) |
22% |
|
16 |
% |
12 |
% |
|
|
New Zealand |
Depreciation and amortization |
|
(243) |
4% |
|
(250) |
4% |
|
|
(748) |
5% |
|
(781) |
4% |
|
3 |
% |
4 |
% |
|
|
|
General and administrative expense |
|
(116) |
2% |
|
— |
0% |
|
|
(117) |
1% |
|
— |
0% |
|
- |
% |
- |
% |
|
|
|
|
|
(359) |
6% |
|
(250) |
4% |
|
|
(865) |
6% |
|
(781) |
4% |
|
(44) |
% |
(11) |
% |
|
|
Total depreciation, amortization, general and administrative expense |
$ |
(1,821) |
33% |
$ |
(2,037) |
35% |
|
$ |
(5,430) |
34% |
$ |
(5,899) |
32% |
|
11 |
% |
8 |
% |
|
|
OPERATING INCOME - REAL ESTATE |
|
|
|
|
|
|
|
|
|
|
|
|
|
|
|
|
|
|
||
|
|
United States |
$ |
212 |
4% |
$ |
(154) |
(3)% |
|
$ |
163 |
1% |
$ |
(514) |
(3)% |
|
>100 |
% |
>100 |
% |
|
|
|
Australia |
|
1,405 |
24% |
|
980 |
17% |
|
|
4,153 |
25% |
|
4,071 |
22% |
|
43 |
% |
2 |
% |
|
|
|
New Zealand |
|
(132) |
-2% |
|
434 |
8% |
|
|
(329) |
(2)% |
|
1,339 |
7% |
|
(>100) |
% |
(>100) |
% |
|
|
|
Total real estate operating income |
$ |
1,485 |
27% |
$ |
1,260 |
22% |
|
$ |
3,987 |
24% |
$ |
4,896 |
27% |
|
18 |
% |
(19) |
% |
|
3 rd Quarter Results
Real Estate Segment income
Real estate segment operating income increased by 18% , or $0.2 million, to $1.5 million for the quarter ended September 30, 2019 compared to the third quarter ended September 30, 2018 , primarily due to a decrease in operating expenses in all three circuits; offset by a decrease in revenue in the New Zealand operations, specifically the ongoing closure of most of the net rentable area of Courtenay Central , offset by increased revenue from our live theatres.
Revenue
Real estate revenue for the third quarter 2019 decreased by 4% , or $0.2 million, to $5.5 million compared to the third quarter of 2018 primarily due to a decrease in revenues from our New Zealand segment related to the closure of portions of Courtenay Central.
40
Operating expense
Operating expense for the quarter ended September 30, 2019 decreased by 10%, or $0.2 million, to $2.2 million, compared to the third quarter of 2018, primarily driven by a reduction in property costs in the Australia segment.
Depreciation , amortization , general and administrative expense
Depreciation, amortization, general and administrative expense for the quarter ended September 30, 2019 decreased 11% , or $0.2 million, to $1.8 million compared to the previous year quarter, driven mainly by a decrease of expenses in the Australia segment of general and administrative expenses.
Nine Month Results
Real Estate Segment income
Real estate segment operating income decreased b y 19% , or $0.9 million, to $4.0 million for the nine months ended September 30, 2019 , compared to the same period in 2018 , primarily attributable to an operating loss in the New Zealand circuit of $0.3 million for 2019, compared to an operatin g gain of $1.3 million for the nine m onths ended September 30, 2018 . Real estate segment income has declined predominantly due to Courtenay Central’s partial closure and a weakening foreign currency exchange rate.
Revenue
Real estate revenue for the nine months ended September 30, 2019 decreased by 9% , or $1.7 million, to $16.5 milli on , primarily due to the partial closure of the Courtenay Central ETC in 2019, which was open for the entire year in 2018 , and the unfavorable impact of foreign currency movements in both Australia and New Zealand.
Operating expense
Operating expense for the nine months ended September 30, 2019 decreased by 4% , or $0.3 million, to $7.1 million, due to a reduction of occupancy costs in the U.S. segment.
Depreciation, amortization, general and administrative expense
Depreciation, amortization, general and administrative expense for the nine months ended September 30, 2019 decreased by 8% , or $0.5 million, to $5.4 million , primarily driven by general and administrative expense reductions in the U.S. and Australia, while depreciation remained relatively flat .
LIQUIDITY AND CAPITAL RESOURCES
Our cinema exhibition business plan is to enhance our current cinemas where it is financially reasonable to do so; develop our specialty cinemas in select markets; expand our food and beverage offering, and continue, on an opportunistic basis, to identify, develop, and acquire cinema properties at reasonable prices that allow us to leverage our cinema expertise over a larger operating base.
Our real estate business plan is to complete the redevelopment of 44 Union Square in New York City; to reassess and master-plan the Cinemas 1,2,3 property for redevelopment as a stand-alone 96,000 square foot mixed use property and in the interim to continue to use it as a cinema; to continue the master planning of the expansion of our Townsville ETC in Australia ; to master plan and consider the redevelopment of our Courtenay Central site in New Zealand into an urban entertainment center with a focus on cinema exhibition, food and beverage, and grocery store uses; and in Manukau, New Zealand, to continue to develop in concert with other major land owners, of plans for the development and funding of the infrastructure needed to support the construction of income-producing improvements; and to continue to be sensitive to opportunities to convert our entertainment assets to higher and better uses, or, where appropriate, to dispose of such assets. We will also continue to explore potential synergistic acquisitions that may not readily fall into either our cinema or real estate segment.
The success of our Company is dependent on our ability to execute these business plans effectively through our available resources (both cash and available borrowing facilities) while still timely and effectively managing our liquidity in order to meet our financial obligations when they come due. At the present, our financial obligations arise mainly from capital expenditure needs, working capital requirements, and debt servicing requirements. We manage the liquidity risk by ensuring our ability to generate sufficient cash flows from operating activities and to obtain adequate, reasonable financing or extension of maturity dates under reasonable arrangements, and/or if needed to convert non-performing or non-strategic assets into cash.
At September 30, 2019 , our consolidated cash and cash equivalents totaled $8.7 million. Of this amount, $2.7 million and $1.1 million were held by our Australian and New Zealand subsidiaries, respectively. Our intention for cash derived from Australia earnings cumulative to December 31, 2018 is to indefinitely reinvest those offshore. For Australia cash derived from earnings in 2019 and after, and for all cash derived from New Zealand earnings, we do not intend to indefinitely reinvest offshore. Any cash derived from Australia or New Zealand earnings not indefinitely reinvested may be subject to certain additional state income taxes when earned .
41
The change s in cash and cash equivalents for the nine months ended September 30, 2019 and 2018 are discussed as follows :
|
|
|||||||||
|
|
Nine Months Ended |
||||||||
|
|
September 30, |
||||||||
|
(Dollars in thousands) |
2019 |
2018 |
% Change |
||||||
|
Net cash provided by (used in) operating activities |
$ |
10,797 |
$ |
19,072 | (43) |
% |
|||
|
Net cash provided by (used in) investing activities |
(33,083) | (51,674) | 36 |
% |
|||||
|
Net cash provided by (used in) financing activities |
18,261 | 35,568 | (49) |
% |
|||||
|
Effect of exchange rate changes on cash and cash equivalents |
(394) | (920) | 57 |
% |
|||||
|
Increase (decrease) in cash and cash equivalents |
$ |
(4,419) |
$ |
2,046 |
(>100) |
% |
|||
Operating activities
Cash provided by operating activities for the first nine months of 2019 decreased by $8.3 million, to $ 10.8 million primarily driven by $ 5.0 million lower cash inflows from operating activities as well as a $ 3.3 million decrease in net operating assets.
Investing activities
Cash used in i nvesting activities during the nine months ended September 30, 2019 decreased by $18.6 million compared to the same period in 2018 , to net cash used of $33.1 million, primarily due to a decrease in our cinema refurbishment activities compared to the first nine months of 2018, and the substantial completion of the upgrading and expansion of our Newmarket and Auburn/Redyard ETCs in 2018 . During the first nine months of 2019, we invested in renovations at West Lakes, Harbour Town, and Union Square . It is anticipated that spending on our cinema activities will pick up over the remainder of the year.
Financing a ctivities
The $18.3 million net cash provided by financing activities during the nine mo nths ended September 30, 2019 was primarily related to $58.7 million of new borrowings, of fset by $31.7 million of loan repayments. Proceeds from these new borrowings related to the ongoing construction of our 44 Union Square project in Manhattan and to fund the capital improvements in our cinemas and real estate segments. Additionally , $ 7.8 million was used as part of our Stock Repurchase Program.
In addition, cash for interest expenses paid was $2.4 million higher for the nine months ended September 30, 2019 compared to the same period 2018, primarily due to increased average debt balances.
On March 2, 2017, the Board of Directors authorized a stock repurchase program to repurchase up to $25.0 million of Reading’s Class A Non-Voting Common Stock. The Board on March 14, 2019, extended that program to March 2, 2021. At September 30, 2019 , there was $4.9 million of capacity remaining in that authorization . During the nine months ended September 30, 2019 we have spent $11.3 million ( financed in part by the issuance to the seller of such shares of a purchase price promissory note of $3.5 million due on September 18, 2024) on repurchasing 856,563 shares of Class A Non-Voting Common Stock.
42
We manage our cash, investments and capital structure so we are able to meet the short-term and long-term obligations of our business, while maintaining financial flexibility and liquidity. We forecast, analyze and monitor our cash flows to enable investment and financing within the overall constraints of our financial strategy. In recent years, our treasury management has been focused on more aggressive cash management using cash balances to reduce debt. In earlier years, we maintained significant cash balances in our bank accounts. We have used cash generated from operations and other excess cash, to the extent not needed for any capital expenditures, to pay down our loans and credit facilities providing us some flexibility on our available loan facilities for future use and thereby, reducing interest charges.
The table below presents the changes in our total available resources (cash and borrowings), debt-to-equity ratio, working capital and other relevant information addressing our liquidity for the nine months ended September 30, 2019 and preceding four years:
|
|
|
|
|
|
|
|
|
|
|
|
|
|
|
|
|
|
|
|
|
|
|
|
|
|
|
|
|
|
|
|
|
|
|
|
|
As of and for the 9-Months Ended |
|
Year Ended December 31 |
|||||||||||
|
($ in thousands) |
|
September 30, 2019 |
|
2018 |
|
2017 |
|
2016 |
|
2015 (2) |
|||||
|
Total Resources (cash and borrowings) |
|
|
|
|
|
|
|
|
|
|
|
|
|
|
|
|
Cash and cash equivalents (unrestricted) |
|
$ |
8,708 |
|
$ |
13,127 |
|
$ |
13,668 |
|
$ |
19,017 |
|
$ |
19,702 |
|
Unused borrowing facility |
|
|
84,149 |
|
|
85,886 |
|
|
137,231 |
|
|
117,599 |
|
|
70,134 |
|
Restricted for capital projects (1) |
|
|
17,650 |
|
|
30,318 |
|
|
62,280 |
|
|
62,024 |
|
|
10,263 |
|
Unrestricted capacity |
|
|
66,499 |
|
|
55,568 |
|
|
74,951 |
|
|
55,575 |
|
|
59,871 |
|
Total resources at period end |
|
|
92,857 |
|
|
99,013 |
|
|
150,899 |
|
|
136,616 |
|
|
89,836 |
|
Total unrestricted resources at period end |
|
|
75,207 |
|
|
68,695 |
|
|
88,619 |
|
|
74,592 |
|
|
79,573 |
|
Debt-to-Equity Ratio |
|
|
|
|
|
|
|
|
|
|
|
|
|
|
|
|
Total contractual facility |
|
$ |
279,215 |
|
$ |
252,929 |
|
$ |
271,732 |
|
$ |
266,134 |
|
$ |
207,075 |
|
Total debt (gross of deferred financing costs) |
|
|
195,311 |
|
|
167,043 |
|
|
134,501 |
|
|
148,535 |
|
|
130,941 |
|
Current |
|
|
34,374 |
|
|
30,393 |
|
|
8,109 |
|
|
567 |
|
|
15,000 |
|
Non-current |
|
|
160,692 |
|
|
136,650 |
|
|
126,392 |
|
|
147,968 |
|
|
115,941 |
|
Finance lease liabilities |
|
|
245 |
|
|
— |
|
|
— |
|
|
— |
|
|
— |
|
Total book equity |
|
|
163,713 |
|
|
180,547 |
|
|
181,618 |
|
|
146,890 |
|
|
138,951 |
|
Debt-to-equity ratio |
|
|
1.19 |
|
|
0.93 |
|
|
0.74 |
|
|
1.01 |
|
|
0.94 |
|
Changes in Working Capital |
|
|
|
|
|
|
|
|
|
|
|
|
|
|
|
|
Working capital (deficit) (3) |
|
$ |
(76,065) |
|
$ |
(55,270) |
|
$ |
(46,971) |
|
$ |
6,655 |
|
$ |
(35,581) |
|
Current ratio |
|
|
0.25 |
|
|
0.35 |
|
|
0.42 |
|
|
1.10 |
|
|
0.51 |
|
Capital Expenditures (including acquisitions) |
|
$ |
34,585 |
|
$ |
56,827 |
|
$ |
76,708 |
|
$ |
49,166 |
|
$ |
53,119 |
|
|
(1) |
|
This relates to the construction facilities specifically negotiated for: (i) 44 Union Square redevelopment project, obtained in December 2016, and (ii) New Zealand construction projects, obtained in May 2015. The New Zealand construction loan expired December 31, 2018. |
|
|
(2) |
|
Certain 2015 balances included the restatement impact as a result of a change in accounting principle ( see Note 2 – Summary of Significant Accounting Policies – Accounting Changes ). Certain 2017 and 2016 balances included the restatement impact as a result of a prior period financial statement correction of immaterial errors (see Note 2 – Summary of Significant Accounting Policies – Prior Period Financial Statement Correction of Immaterial Errors ). |
|
|
(3) |
|
Typically our working capital (deficit) is negative as we receive revenue from our cinema business ahead of the time that we have to pay our associated liabilities. We use the money we receive to pay down our borrowings in the first instance |
C ONTRACTUAL OBLIGATIONS, COMMITMENTS AND CONTINGENCIES
The following table provides information with respect to the maturities and scheduled principal repayments of our recorded contractual obligations and certain of our commitments and contingencies, either recorded or off-balance sheet, as of September 30, 2019 :
|
|
|
|
|
|
|
|
|
|
|
|
|
|
|
|
|
|
|
|
|
|
|
|
|
|
|
|
|
|
|
|
|
|
|
|
|
|
|
|
|
|
|
|
|
|
|
(Dollars in thousands) |
|
2019 |
|
2020 |
|
2021 |
|
2022 |
|
2023 |
|
Thereafter |
|
Total |
|||||||
|
Debt (1) |
|
$ |
33,326 |
|
$ |
51,603 |
|
$ |
934 |
|
$ |
981 |
|
$ |
71,521 |
|
$ |
8,788 |
|
$ |
167,153 |
|
Operating leases, including imputed interest |
|
|
7,673 |
|
|
30,631 |
|
|
30,956 |
|
|
30,963 |
|
|
30,102 |
|
|
172,589 |
|
|
302,914 |
|
Finance leases, including imputed interest |
|
|
43 |
|
|
98 |
|
|
52 |
|
|
42 |
|
|
29 |
|
|
— |
|
|
264 |
|
Subordinated debt (1) |
|
|
— |
|
|
— |
|
|
— |
|
|
— |
|
|
— |
|
|
27,913 |
|
|
27,913 |
|
Pension liability |
|
|
171 |
|
|
684 |
|
|
684 |
|
|
684 |
|
|
684 |
|
|
2,348 |
|
|
5,255 |
|
Estimated interest on debt (2) |
|
|
2,359 |
|
|
6,867 |
|
|
5,003 |
|
|
4,969 |
|
|
4,915 |
|
|
7,184 |
|
|
31,297 |
|
Village East purchase option (3) |
|
|
— |
|
|
5,900 |
|
|
— |
|
|
— |
|
|
— |
|
|
— |
|
|
5,900 |
|
Total |
|
$ |
43,572 |
|
$ |
95,783 |
|
$ |
37,629 |
|
$ |
37,639 |
|
$ |
107,251 |
|
$ |
218,822 |
|
$ |
540,696 |
|
|
(1) |
|
Information is presented gross of deferred financing costs. |
|
|
(2) |
|
Estimated interest on debt is based on the anticipated loan balances for future periods and current applicable interest rates. |
|
|
(3) |
|
Represents the lease liability of the option associated with the ground lease purchase of the Village East Cinema . |
Refer to Note 13 – Commitments and Contingencies for additional information.
43
Litigation
We are currently involved in certain legal proceedings and, as required, have accrued estimates of probable and estimable losses for the resolution of these claims.
Where we are the plaintiffs, we expense all legal fees on an on-going basis and make no provision for any potential settlement amounts until received. In Australia, the prevailing party is usually entitled to recover its attorneys’ fees, which typically work out to be approximately 60% of the amounts actually spent where first class legal counsel is engaged at customary rates. Where we are a plaintiff, we have likewise made no provision for the liability for the defendant’s attorneys' fees in the event we are determined not to be the prevailing party.
Where we are the defendants, we accrue for probable damages that insurance may not cover as they become known and can be reasonably estimated. In our opinion, any claims and litigation in which we are currently involved are not reasonably likely to have a material adverse effect on our business, results of operations, financial position, or liquidity. I t is possible, however, that future results of the operations for any particular quarterly or annual period could be materially affected by the ultimate outcome of the legal proceedings. Please refer to Item 3 – Legal Proceedings in our 2018 Form 10-K for more information. There have been no material changes to our litigation since our 2018 Form 10-K, except as set forth in Note 13 – Commitments and Contingencies in the accompanying consolidated financial statements included in this Form 10-Q .
Off-Balance Sheet Arrangements
See Note 13 – Commitments and Contingencies to the Consolidated Financial Statements included herein on this report, there are no off-balance sheet arrangements or obligations (including contingent obligations) that have, or are reasonably likely to have, a current or future material effect on our financial condition, changes in the financial condition, revenue or expense, results of operations, liquidity, capital expenditures or capital resources .
CRITICAL ACCOUNTING POLICIES
We believe that the application of the following accounting policies requires significant judgments and estimates in the preparation of our Consolidated Financial Statements and hence, are critical to our business operations and the understanding of our financial results:
(i) Impairment of Long-lived Assets (other than Goodwill and Intangible Assets with indefinite lives) – we evaluate our long-lived assets and finite-lived intangible assets using historical and projected data of cash flows as our primary indicator of potential impairment and we take into consideration the seasonality of our business. If the sum of the estimated, undiscounted future cash flows is less than the carrying amount of the asset, then an impairment is recognized for the amount by which the carrying value of the asset exceeds its estimated fair value based on an appraisal or a discounted cash flow calculation. For certain non-income producing properties or for those assets with no consistent historical or projected cash flows, we obtain appraisals or other evidence to evaluate whether there are impairment indicators for these assets.
Besides the write-down of the carrying amount of our parking structure adjacent to our Courtenay Central ETC in Wellington, New Zealand due to earthquake damage during the fourth quarter of 2016, no other impairment losses were recorded for long-lived and finite-lived intangible assets for the three years ended December 31, 2018. Refer to Note 20 – Insurance Recoveries on Impairment and Related Losses due to Earthquake in the 2018 Form 10-K for further details.
(ii) Impairment of Goodwill and Intangible Assets with indefinite lives – goodwill and intangible assets with indefinite useful lives are not amortized, but instead, tested for impairment at least annually on a reporting unit basis. The impairment evaluation is based on the present value of estimated future cash flows of each reporting unit plus the expected terminal value. There are significant assumptions and estimates used in determining the future cash flows and terminal value. The most significant assumptions include our cost of debt and cost of equity assumptions that comprise the weighted average cost of capital for each reporting unit. Accordingly, actual results could vary materially from such estimates.
No impairment losses were recorded for goodwill and indefinite-lived intangible assets for the nine months ended September 30, 2019 .
F INANCIAL RISK MANAGEMENT
International Business Risks
Our international operations are subject to a variety of risks, including the following:
|
|
· |
|
Currency Risk : while we report our earnings and net assets in U.S. dollars, substantial portions of our revenue and of our obligations are denominated in either Australian or New Zealand dollars. The value of these currencies can vary significantly compared to the U.S. dollar and compared to each other. We do not hedge the currency risk, but rather have relied upon the
44 |
|
natural hedges that exist as a result of the fact that our film costs are typically fixed as a percentage of the box office, and our local operating costs and obligations are likewise typically denominated in local currencies. However, we do have intercompany debt and our ability to service this debt could be adversely impacted by declines in the relative value of the Australian and New Zealand dollar compared to the U.S. dollar. Also, our use of local borrowings to mitigate the business risk of currency fluctuations has reduced our flexibility to move cash between jurisdictions. Set forth below is a chart of the exchange ratios between these three currencies since 1996: |
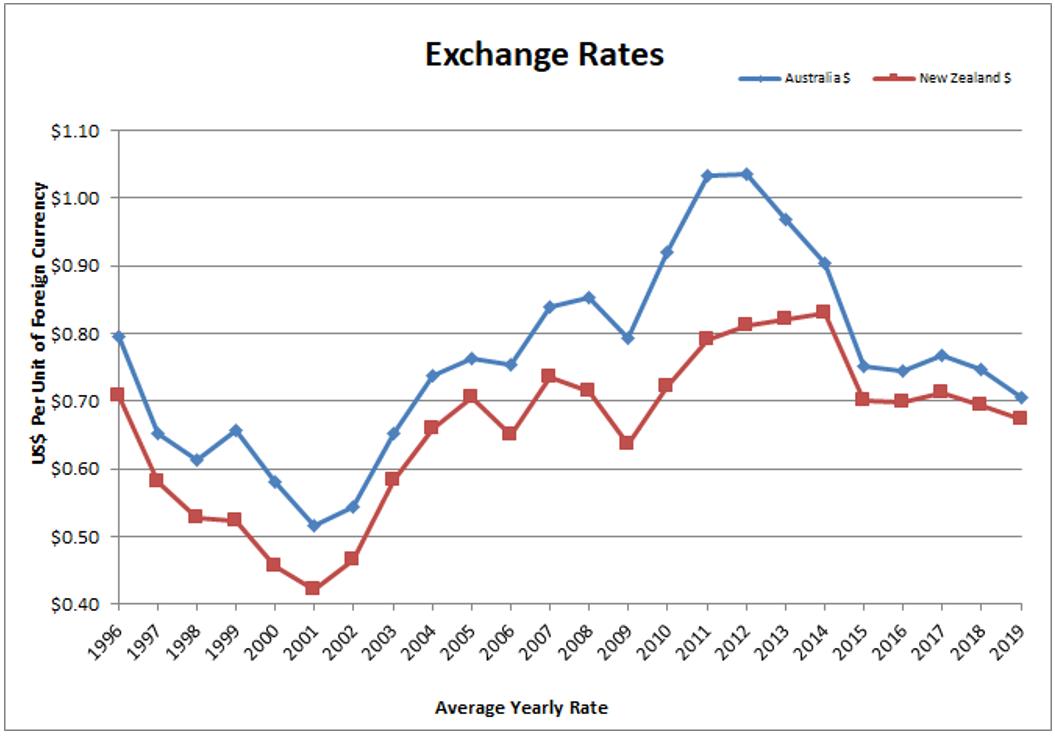
In recent periods, we have repaid intercompany debt and used the proceeds to fund capital investment in the United States. Accordingly, our debt levels in Australia are higher than they would have been if funds had not been returned for such purposes. On a company wide basis, this means that a reduction in the relative strength of the U.S. dollar versus the Australian dollar and/or the New Zealand dollar will effectively raise the overall cost of our borrowing and capital and make it more expensive to return funds from the United States to Australia and New Zealand.
Our exposure to interest rate risk arises out of our intermediate term floating-rate borrowings. To manage the risk, we utilize interest rate derivative contracts to convert certain floating-rate borrowings into fixed-rate borrowings. It is the Company’s policy to enter into interest rate derivative transactions only to the extent considered necessary to meet its objectives as stated above. The Company does not enter into these transactions or any other hedging transactions for speculative purposes.
Inflation
We continually monitor inflation and the effects of changing prices. Inflation increases the cost of goods and services used. Competitive conditions in many of our markets restrict our ability to recover fully the higher costs of acquired goods and services through price increases. We attempt to mitigate the impact of inflation by implementing continuous process improvement solutions to enhance productivity and efficiency and, as a result, lower costs and operating expenses. The effects of inflation have not had a material impact on our operations and the resulting financial position or liquidity.
45
FORWARD LOOKING STATEMENTS
Our statements in this interim quarterly report contain a variety of forward-looking statements as defined by the Securities Litigation Reform Act of 1995. Forward-looking statements reflect only our expectations regarding future events and operating performance and necessarily speak only as of the date the information was prepared. No guarantees can be given that our expectation will in fact be realized, in whole or in part. You can recognize these statements by our use of words such as, by way of example, “may,” “will,” “expect,” “believe,” and “anticipate” or other similar terminology.
These forward-looking statements reflect our expectation after having considered a variety of risks and uncertainties. However, they are necessarily the product of internal discussion and do not necessarily completely reflect the views of individual members of our Board of Directors or of our management team. Individual Board members and individual members of our management team may have different views as to the risks and uncertainties involved, and may have different views as to future events or our operating performance.
Among the factors that could cause actual results to differ materially from those expressed in or underlying our forward-looking statements are the following:
|
|
· |
|
with respect to our cinema operations: |
|
|
o |
|
the number and attractiveness to moviegoers of the films released in future periods; |
|
|
o |
|
the amount of money spent by film distributors to promote their motion pictures; |
|
|
o |
|
the licensing fees and terms required by film distributors from motion picture exhibitors in order to exhibit their films; |
|
|
o |
|
the comparative attractiveness of motion pictures as a source of entertainment and willingness and/or ability of consumers (i) to spend their dollars on entertainment and (ii) to spend their entertainment dollars on movies in and outside the home environment; |
|
|
o |
|
the extent to which we encounter competition from other cinema exhibitors, from other sources of outside-the-home entertainment, and from inside-the-home entertainment options, such as “home theaters” and competitive film product distribution technology, such as, by way of example, cable, satellite broadcast and Blu-ray/DVD rentals and sales, and so called “movies on demand”; |
|
|
o |
|
the impact of certain competitors’ subscription or advance pay programs; |
|
|
o |
|
the cost and impact of improvements to our cinemas, such as improved seating, enhanced food and beverage offerings and other improvements; |
|
|
o |
|
disruptions during theater improvements; |
|
|
o |
|
the extent to and the efficiency with which we are able to integrate acquisitions of cinema circuits with our existing operations; and |
|
|
o |
|
certain of our activities are in geologically active areas, creating a risk of damage and/or disruption of real estate and/or cinema businesses from earthquakes. |
|
|
· |
|
with respect to our real estate development and operation activities: |
|
|
o |
|
the rental rates and capitalization rates applicable to the markets in which we operate and the quality of properties that we own; |
|
|
o |
|
the ability to negotiate and execute lease agreements with material tenants; |
|
|
o |
|
the extent to which we can obtain on a timely basis the various land use approvals and entitlements needed to develop our properties; |
|
|
o |
|
the risks and uncertainties associated with real estate development; |
|
|
o |
|
the availability and cost of labor and materials; |
|
|
o |
|
the ability to obtain all permits to construct improvements; |
|
|
o |
|
the ability to finance improvements; |
|
|
o |
|
the disruptions from construction; |
|
|
o |
|
the possibility of construction delays, work stoppage and material shortage; |
|
|
o |
|
competition for development sites and tenants; |
|
|
o |
|
environmental remediation issues; |
|
|
o |
|
the extent to which our cinemas can continue to serve as an anchor tenant that will, in turn, be influenced by the same factors as will influence generally the results of our cinema operations; |
|
|
o |
|
the increased depreciation and amortization expense as construction projects transition to leased real property; |
|
|
o |
|
the ability to negotiate and execute joint venture opportunities and relationships; and |
|
|
o |
|
certain of our activities are in geologically active areas, creating a risk of damage and/or disruption of real estate and/or cinema businesses from earthquakes. |
46
|
|
· |
|
with respect to our operations generally as an international company involved in both the development and operation of cinemas and the development and operation of real estate and previously engaged for many years in the railroad business in the United States: |
|
|
o |
|
our ability to renew, extend or renegotiate our loans that mature in 20 20 ; |
|
|
o |
|
our ability to grow our Company and provide value to our stockholders; |
|
|
o |
|
our ongoing access to borrowed funds and capital and the interest that must be paid on that debt and the returns that must be paid on such capital; |
|
|
o |
|
expenses, management and Board distraction and other effects of the litigation efforts mounted by James Cotter, Jr. against the Company, including his efforts to cause a sale of voting control of the Company; |
|
|
o |
|
the relative values of the currency used in the countries in which we operate; |
|
|
o |
|
changes in government regulation, including by way of example, the costs resulting from the implementation of the requirements of Sarbanes-Oxley; |
|
|
o |
|
our labor relations and costs of labor (including future government requirements with respect to minimum wages, shift scheduling, the use of consultants, pension liabilities, disability insurance and health coverage, and vacations and leave); |
|
|
o |
|
our exposure from time to time to legal claims and to uninsurable risks such as those related to our historic railroad operations, including potential environmental claims and health-related claims relating to alleged exposure to asbestos or other substances now or in the future recognized as being possible causes of cancer or other health related problems, and class actions and private attorney general wage and hour based claims; |
|
|
o |
|
our exposure to cyber-security risks, including misappropriation of customer information or other breaches of information security; |
|
|
o |
|
changes in future effective tax rates and the results of currently ongoing and future potential audits by taxing authorities having jurisdiction over our various companies; and |
|
|
o |
|
changes in applicable accounting policies and practices. |
The above list is not necessarily exhaustive, as business is by definition unpredictable and risky, and subject to influence by numerous factors outside of our control, such as changes in government regulation or policy, competition, interest rates, supply, technological innovation, changes in consumer taste and fancy, weather, and the extent to which consumers in our markets have the economic wherewithal to spend money on beyond-the-home entertainment.
Given the variety and unpredictability of the factors that will ultimately influence our businesses and our results of operation, no guarantees can be given that any of our forward-looking statements will ultimately prove to be correct. Actual results will undoubtedly vary and there is no guarantee as to how our securities will perform either when considered in isolation or when compared to other securities or investment opportunities.
In addition to the forward-looking factors set forth above, we encourage you to review Item 1A. “Risk Factors,” from our Company’s Annual Report on SEC Form 10-K for the Year Ended December 31, 2018, as well as the risk factors set forth in any other filings made under the Securities Act of 1934, as amended, including any of our Quarterly Report of Form 10-Q.
Finally, we undertake no obligation to publicly update or to revise any of our forward-looking statements, whether as a result of new information, future events or otherwise, except as may be required under applicable law. Accordingly, you should always note the date to which our forward-looking statements speak.
Additionally, certain of the presentations included in this interim quarterly report may contain “non-GAAP financial measures.” In such case, a reconciliation of this information to our GAAP financial statements will be made available in connection with such statements.
47
Item 3 – Quantitative and Qualitative Disclosure about Market Risk
The SEC requires that registrants include information about potential effects of changes in currency exchange and interest rates in their filings. Several alternatives, all with some limitations, have been offered. We base the following discussion on a sensitivity analysis that models the effects of fluctuations in currency exchange rates and interest rates. This analysis is constrained by several factors, including the following:
|
|
· |
|
It is based on a single point in time; and |
|
|
· |
|
It does not include the effects of other complex market reactions that would arise from the changes modeled. |
Although the results of such an analysis may be useful as a benchmark, they should not be viewed as forecasts.
At September 30, 2019 , approximately 32% and 10% of our assets were invested in assets denominated in Australian dollars (Reading Australia) and New Zealand dollars (Reading New Zealand), respectively, including approximately $3.8 million in cash and cash equivalents. At December 31, 2018 , approximately 36% and 14% of our assets were invested in assets denominated in Australian dollars (Reading Australia) and New Zealand dollars (Reading New Zealand), including approximately $5.5 million in cash and cash equivalents.
Our policy in Australia and New Zealand is to match revenues and expenses, whenever possible, in local currencies. As a result, we have procured a majority of our expenses in Australia and New Zealand in local currencies. Despite this natural hedge, recent movements in foreign currencies have had an effect on our current earnings. Although foreign currency has had an effect on our current earnings, the effect of the translation adjustment on our assets and liabilities noted in our other comprehensive income was an decrease of $7.4 million for the nine months ended September 30, 2019 . As we continue to progress our acquisition and development activities in Australia and New Zealand, we cannot assure you that the foreign currency effect on our earnings will not be material in the future.
Historically, our policy has been to borrow in local currencies to finance the development and construction of our long-term assets in Australia and New Zealand whenever possible. As a result, the borrowings in local currencies have provided somewhat of a natural hedge against the foreign currency exchange exposure. Even so, and as a result of our issuance of subordinated Trust Preferred Securities in 2007, and their subsequent partial repayment, approximately 36% and 63% of our Australian and New Zealand assets, respectively, remain subject to such exposure, unless we elect to hedge our foreign currency exchange between the US and Australian and New Zealand dollars. If the foreign currency rates were to fluctuate by 10%, the resulting change in Australian and New Zealand assets would be $7.6 million and $4.1 million, respectively, and the change in our quarterly net income (loss) would be $0.9 million and ($0.1) million, respectively. Presently, we have no plan to hedge such exposure.
We record unrealized foreign currency translation gains or losses that could materially affect our financial position. As of September 30, 2019 and December 31, 2018 , the balance of cumulative foreign currency translation adjustments were approximately $1.3 million gain and $8.7 million gain, respectively.
Historically, we maintain most of our cash and cash equivalent balances in short-term money market instruments with original maturities of three months or less. Due to the short-term nature of such investments, a change of 1% in short-term interest rates would not have a material effect on our financial condition.
We have a combination of fixed and variable interest rate loans. In connection with our variable interest rate loans, a change of approximately 1% in short-term interest rates would have resulted in approximately $270,000 increase or decrease in our quarterly interest expense.
For further discussion on market risks, please refer to International Business Risks included in Item 2, Part 1 of this Form 10-Q.
48
Item 4 – Controls and Procedures
We maintain disclosure controls and procedures that are designed to ensure that information required to be disclosed in the Company’s reports filed under the Securities Exchange Act of 1934 , as amended (the “ Exchange Act ” ) , is recorded, processed, summarized and reported within the time periods specified in the SEC’s rules and forms and that such information is accumulated and communicated to our management, including our Chief Executive Officer and Chief Financial Officer, as appropriate, to allow for timely decisions regarding required disclosure. In designing and evaluating the disclosure controls and procedures, management recognizes that any controls and procedures, no matter how well designed and operated, can provide only reasonable assurance of achieving the desired control objectives, and our management is required to apply its judgment in evaluating the cost-benefit relationship of possible controls and procedures.
Under the supervision and with the participation of our management, including our principal executive officer and principal financial officer, we conducted an evaluation of our disclosure controls and procedures, as such, term is defined under Rule 13a-15(e) promulgated under the Exchange Act. Based upon that evaluation, we concluded that, as of September 30, 2019 , our disclosure controls and procedures were effective.
Changes in Internal Control over Financial Reporting
There were no other changes in our internal control over financial reporting (as defined in Rule 13a-15(f) and 15d-15(f) under the Exchange Act) that occurred during the quarter and nine months ended September 30, 2019 that have materially affected, or are reasonably likely to materially affect, our internal control over financial reporting.
49
The information required under Part II, Item 1 ( Legal Proceedings ) is incorporated by reference to the information contained in Note 13 – Commitments and Contingencies to the Consolidated Financial Statements included herein in Part I, Item 1 ( Financial Statements ) on this Quarterly Report on Form 10-Q.
Cotter Jr. Derivative Litigation
This action was originally brought by James J. Cotter, Jr. (“Cotter Jr.”) in June, 2015 in the Nevada District Court against all of the Directors of the Company and against the Company as a nominal defendant: James J. Cotter, Jr., individually and derivatively on behalf of Reading International, Inc. vs. Margaret Cotter, et al.” Case No,: A-15-719860-V. Summary judgment has been entered against Cotter, Jr., and in favor of all defendants and a $1.55 million cost judgment has been entered against Cotter, Jr., and in favor of our Company. Cotter, Jr. has appealed both judgements. Our application for attorney’s fees was denied, and we have appealed that determination. The issues on appeal are currently being briefed. No date for oral argument has been set. It is unlikely that any hearing will be held this year. As the Directors and Officers Liability Insurance Policy covering Cotter, Jr.’s claims in the Derivative Case ( $10.0 million) has been exhausted, the financial burden of defending our Directors against these claims, as required by applicable Nevada Law, has fallen upon our Company. During 2018, out-of-pocket third party costs in the amount of approximately $3.5 million were incurred by our Company in defending against these claims. For the nine months ended September 30, 2019, an additional $782,000 had been expensed, relating principally to the preparation of appellate briefs with respect to the Derivative Litigation.
Employment Litigation
The Company is currently involved in two California employment matters which include substantially overlapping wage and hour claims: Taylor Brown, individually, and on behalf of other members of the general public similarly situated vs. Reading Cinemas et al. Superior Court of the State of California for the County of Kern, Case No. BCV-19-1000390 (“Brown v. RC,” and the “Brown Class Action Complaint” respectively) and Peter M. Wagner, Jr., an individual, vs. Consolidated Entertainment, Inc. et al., Superior Court of the State of California for the County of San Diego, Case NO. 37-2019-00030695-CU-WT-CTL (“Wagner v. CEI,” and the “Wagner Individual Complaint” respectively). Brown v. RC was initially filed in December 2018, as an individual action and refiled as a putative class action in February 2019, but not served until June 24, 2019. These lawsuits seek damages, and attorneys’ fees, relating to alleged violations of California labor laws relating to meal periods, rest periods, reporting time pay, unpaid wages, timely pay upon termination and wage statements violations. Wagner v. CEI was filed as a discrimination and retaliation lawsuit in June 2019. The following month, in July 2019, a notice was served on us by separate counsel for Mr. Wagner under the California Private Attorney General Act of 2004 (Cal. Labor Code Section 2698, et seq ) (the “Wagner PAGA Claim”) purportedly asserting in a representational capacity claims under the PAGA statute, overlapping, in substantial part, the allegations set forth in the Brown Class Action Complaint. Neither plaintiff has specified the amount of damages sought.
The Company is investigating and intends to vigorously defend the allegations of the Brown Class Action Complaint, the Wagner Individual Complaint and the Wagner PAGA Claim and denies that a PAGA representative action is appropriate. These matters are in their early stages, and the putative class action has not been certified. As these cases are in early stages, the Company is unable to predict the outcome of the litigation or the range of potential loss, if any; however, the Company believes that its potential liability with respect to such matters is not material to its overall financial position, results of operations and cash flows. Accordingly, the Company has not established a reserve for loss in connection with these matters .
For further details on our legal proceedings, please refer to Item 3, Legal Proceedings, contained in our 2018 Form 10-K.
There have been no material changes in risk factors as previously disclosed in our 2018 Form 10-K.
Item 2 – Unregistered Sales of Equity Securities and Use of Proceeds
There were no unregistered sales of equity securities during the periods covered by this report.
50
The following table summarizes our repurchases under the March 2, 2017, stock repurchase program through to September 30, 2019 :
|
|
|
|
|
|
|
|
|
|
|
|
|
|
|
|
|
|
|
|
|
|
|
|
|
Period |
|
Total Number of Shares Purchased |
|
Average Price Paid per Share |
|
Total Number of Shares Purchased as part of our Stock Buy-Back Program |
|
Approximate Dollar Value of Shares that may yet be Purchased under the Stock Buy-Back Program |
||
|
March 2017 |
|
41,899 |
|
$ |
15.99 |
|
41,899 |
|
$ |
24,330,149 |
|
May 2017 |
|
98,816 |
|
$ |
15.78 |
|
98,816 |
|
$ |
22,771,316 |
|
June 2017 |
|
70,234 |
|
$ |
16.39 |
|
70,234 |
|
$ |
21,620,212 |
|
August 2017 |
|
160,489 |
|
$ |
15.82 |
|
160,489 |
|
$ |
19,081,288 |
|
September 2017 |
|
31,718 |
|
$ |
15.77 |
|
31,718 |
|
$ |
18,581,038 |
|
December 2017 |
|
6,567 |
|
$ |
16.01 |
|
6,567 |
|
$ |
18,475,900 |
|
February 2018 |
|
8,500 |
|
$ |
16.98 |
|
8,500 |
|
$ |
18,331,570 |
|
March 2018 |
|
10,138 |
|
$ |
16.99 |
|
10,138 |
|
$ |
18,159,364 |
|
April 2018 |
|
5,000 |
|
$ |
16.12 |
|
5,000 |
|
$ |
18,078,764 |
|
December 2018 |
|
125,700 |
|
$ |
15.24 |
|
125,700 |
|
$ |
16,162,529 |
|
March 2019 |
|
566 |
|
$ |
16.08 |
|
566 |
|
$ |
16,153,428 |
|
April 2019 |
|
571 |
|
$ |
16.27 |
|
571 |
|
$ |
16,144,138 |
|
May 2019 |
|
36,100 |
|
$ |
13.77 |
|
36,100 |
|
$ |
15,647,160 |
|
June 2019 |
|
159,718 |
|
$ |
13.22 |
|
159,718 |
|
$ |
13,536,171 |
|
July 2019 |
|
62,748 |
|
$ |
13.11 |
|
62,748 |
|
$ |
12,713,392 |
|
August 2019 |
|
121,291 |
|
$ |
12.15 |
|
121,291 |
|
$ |
11,239,920 |
|
September 2019 |
|
475,569 |
|
$ |
13.43 |
|
475,569 |
|
$ |
4,851,835 |
|
Total |
|
1,415,624 |
|
$ |
14.23 |
|
1,415,624 |
|
$ |
4,851,835 |
For a description of grants of stock to certain executives, see the Stock Based Compensation section under see Note 15 – Equity and Stock-Based Compensation to our Consolidated Financial Statements .
Item 3 – Defaults upon Senior Securities
None.
Item 4 – Mine Safety Disclosure
Not applicable.
On November 5, 2019, the Company promoted Gilbert Avanes as Chief Financial Officer of the Company effective immediately. Mr. Avanes will continue serving as the Company’s principal financial officer. Mr. Avanes had previously served as the Company’s interim Chief Financial Officer since January 24, 2019, in addition to his existing position as Treasurer. In connection with the promotion, the Company increased Mr. Avanes’ annual base salary to $275,000. The additional information required by Form 8-K Item 5.02(c)(2) and (3) regarding Mr. Avanes is incorporated by reference from the Company’s Form 8-K filed on January 29, 2019 and the Company’s Proxy Statement on Schedule 14A filed on April 16, 2019 .
|
31.1 |
Certification Pursuant to Section 302 of the Sarbanes-Oxley Act of 2002 , filed herewith. |
|
31.2 |
Certification Pursuant to Section 302 of the Sarbanes-Oxley Act of 2002 , filed herewith. |
|
32 |
Certifications Pursuant to Section 906 of the Sarbanes-Oxley Act of 2002 , furnished herewith. |
|
101.INS |
XBRL Instance Document |
|
101.SCH |
XBRL Taxonomy Extension Schema |
|
101.CAL |
XBRL Taxonomy Extension Calculation |
|
101.DEF |
XBRL Taxonomy Extension Definition |
|
101.LAB |
XBRL Taxonomy Extension Labels |
|
101.PRE |
XBRL Taxonomy Extension Presentation |
51
Pursuant to the requirements of the Securities Exchange Act of 1934, the Registrant has duly caused this report to be signed on its behalf by the undersigned thereunto duly authorized.
READING INTERNATIONAL, INC.
Date : November 12 , 2019
By: /s/ Ellen M. Cotter
Ellen M. Cotter
Chief Executive Officer
Date : November 12, 2019
By: /s/ Gilbert Avanes
Gilbert Avanes
Chief Financial Officer
52