RADNET, INC.
10-Ks and 10-Qs
|
|
|
|
|
|
|
|
|
|
|
|
|
|
|
|
|
|
|
|
|
|
|
|
|
|
|
|
|
|
|
|
|
|
|
|
|
|
|
|
|
|
|
|
|
|
|
|
|
|
|
|
|
|
|
|
|
|
|
|
|
|
UNITED STATES
SECURITIES AND EXCHANGE COMMISSION
Washington D.C. 20549
FORM 10-K
ANNUAL REPORT PURSUANT TO SECTION 13 OR 15(d) OF THE SECURITIES EXCHANGE ACT OF 1934
For the fiscal year ended December 31, 2010
Commission File Number 0-19019
RadNet, Inc.
(Exact name of registrant as specified in charter)
|
Delaware
|
13-3326724
|
|
(State or other jurisdiction of
incorporation or organization)
|
(I.R.S. Employer
Identification No.)
|
|
1510 Cotner Avenue
|
|
|
Los Angeles, California
|
90025
|
|
(Address of principal executive offices)
|
(Zip Code)
|
Registrant’s telephone number, including area code: (310) 478-7808
Securities registered pursuant to Section 12(b) of the Act:
|
Title of Each Class
|
Name of each exchange on which registered
|
|
Common Stock, $.0001 par value
|
NASDAQ Global Market
|
Securities registered pursuant to Section 12(g) of the Act: None
Indicate by check mark if the registrant is a well-known seasoned issuer, as defined in Rule 405 of the Securities Act. Yes
¨
No
x
Indicate by check mark if the registrant is not required to file reports pursuant to Section 13 or Section 15(d) or the act. Yes
¨
No
x
Indicate by check mark whether the registrant (1) has filed all reports required to be filed by Section 13 or 15(d) of the Securities and Exchange Act of 1934 during the preceding 12 months (or for such shorter period that the registrant was required to file such reports), and (2) has been subject to such filing requirements for the past 90 days. Yes
x
No
¨
Indicate by check mark whether the registrant has submitted electronically and posted on its corporate Website, if any, every Interactive Data File required to be submitted and posted pursuant to Rule 405 of Regulation S-T (§232.405 of this chapter) during the preceding 12 months (or for such shorter period that the registrant was required to submit and post such files). Yes
¨
No
¨
Indicate by check mark if disclosure of delinquent filers pursuant to Item 405 of Regulation S-K is not contained herein, and will not be contained, to the best of registrant’s knowledge, in definitive proxy or information statements incorporated by reference in Part III of this Form 10-K or any amendment to this Form 10-K.
x
Indicate by check mark whether the registrant is a large accelerated filer, an accelerated filer, a non-accelerated filer, or a smaller reporting company. See the definitions of “large accelerated filer,” “accelerated filer” and “smaller reporting company” in Rule 12b-2 of the Exchange Act.
|
Large Accelerated Filer
¨
|
Accelerated Filer
x
|
||
|
Non-Accelerated Filer
¨
(Do not check if a smaller reporting company)
|
Smaller Reporting Company
¨
|
Indicate by check mark whether the registrant is a shell company (as defined in Exchange Act Rule 12b-2 Yes
¨
No
x
The aggregate market value of the registrant’s voting and nonvoting common equity held by non-affiliates of the registrant was approximately $71,593,977 on June 30, 2010 (the last business day of the registrant’s most recently completed second quarter) based on the closing price for the common stock on the NASDAQ Global Market on June 30, 2010.
The number of shares of the registrant’s common stock outstanding on March 7, 2011, was 37,268,475 shares.
DOCUMENTS INCORPORATED BY REFERENCE
The information required by Part III of the Form 10-K, to the extent not set forth herein, is incorporated herein by reference from the registrant’s definitive proxy statement for the Annual Meeting of Stockholders, to be filed with the Securities and Exchange Commission pursuant to Regulation 14A not later than 120 days after the close of the registrant’s fiscal year.
RADNET, INC.
TABLE OF CONTENTS
|
FORM 10-K ITEM
|
PAGE
|
|
|
PART I.
|
||
|
Item 1.
|
Business
|
4
|
|
Item 1A.
|
Risk Factors
|
23
|
|
Item 1B.
|
Unresolved Staff Comments
|
33
|
|
Item 2.
|
Properties
|
33
|
|
Item 3.
|
Legal Proceedings
|
33
|
|
Item 4.
|
(Removed and Reserved).
|
33
|
|
PART II.
|
||
|
Item 5.
|
Market for Registrant’s Common Equity, Related Stockholder Matters and Issuer Purchases of Equity Securities
|
34
|
|
Item 6.
|
Selected Consolidated Financial Data
|
36
|
|
Item 7.
|
Management’s Discussion and Analysis of Financial Condition and Results of Operations
|
37
|
|
Item 7A.
|
Quantitative and Qualitative Disclosures About Market Risk
|
57
|
|
Item 8.
|
Financial Statements and Supplementary Data
|
57
|
|
Item 9.
|
Changes in and Disagreements with Accountants on Accounting and Financial Disclosure
|
94
|
|
Item 9A.
|
Controls and Procedures
|
94
|
|
Item 9B.
|
Other Information
|
96
|
|
PART III.
|
||
|
Item 10.
|
Directors, Executive Officers and Corporate Governance
|
96
|
|
Item 11.
|
Executive Compensation
|
96
|
|
Item 12.
|
Security Ownership of Certain Beneficial Owners and Management and Related Stockholder Matters
|
96
|
|
Item 13.
|
Certain Relationships and Related Transactions, and Director Independence
|
96
|
|
Item 14.
|
Principal Accountant Fees and Services
|
96
|
|
PART IV.
|
||
|
Item 15.
|
Exhibits and Financial Statement Schedules
|
97
|
2
Cautionary Note Regarding Forward-Looking Statements
This annual report contains forward-looking statements within the meaning of Section 27A of the Securities Act of 1933, as amended and Section 21E of the Securities Exchange Act of 1934, as amended. These statements relate to future events or our future financial performance, and involve known and unknown risks, uncertainties and other factors that may cause our actual results, levels of activity, performance or achievements to be materially different from any future results, levels of activity, performance or achievements expressed or implied by these forward-looking statements. These risks and other factors include, among other things, those listed in Item 1 — “Business,” Item 1A— “Risk Factors,” Item 3— “Legal Proceedings,” Item 7 — “Management’s Discussion and Analysis of Financial Condition and Results of Operations” and elsewhere in this annual report. In some cases, you can identify forward-looking statements by terminology such as “may,” “will,” “should,” “expect,” “intend,” “plan,” “anticipate,” “believe,” “estimate,” “predict,” “potential,” “continue,” “assumption” or the negative of these terms or other comparable terminology. The forward-looking statements contained herein reflect our current views with respect to future events and are based on our currently available financial, economic and competitive data and on current business plans. Actual events or results may differ materially depending on risks and uncertainties that may affect our operations, markets, services, prices and other factors. Important factors that could cause actual results to differ materially from those in the forward-looking statements include, but are not limited to statements concerning our ability to successfully acquire and integrate new operations, to grow our contract management business, our financial guidance, our statements regarding future cost savings, our statements regarding increased business from new equipment or operations and our statements regarding our ability to finance our operations.
We do not undertake any responsibility to release publicly any revisions to these forward-looking statements to take into account events or circumstances that occur after the date of this annual report. Additionally, we do not undertake any responsibility to update you on the occurrence of any unanticipated events which may cause actual results to differ from those expressed or implied by the forward-looking statements contained in this annual report.
3
|
Item 1.
|
Business
|
Business Overview
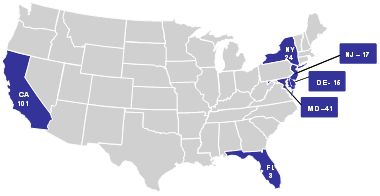
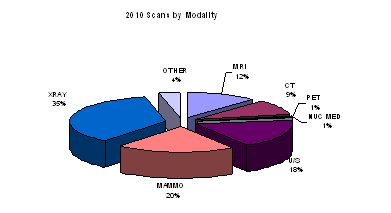
With 201 centers, as of December 31, 2010, located in California, Delaware, Maryland, New Jersey, Florida, and New York, we are the leading national provider of freestanding, fixed-site outpatient diagnostic imaging services in the United States based on number of locations and annual imaging revenue. Our centers provide physicians with imaging capabilities to facilitate the diagnosis and treatment of diseases and disorders and may reduce unnecessary invasive procedures, often minimizing the cost and amount of care for patients. Our services include magnetic resonance imaging (MRI), computed tomography (CT), positron emission tomography (PET), nuclear medicine, mammography, ultrasound, diagnostic radiology (X-ray), fluoroscopy and other related procedures. The vast majority of our centers offer multi-modality imaging services, a key point of differentiation from our competitors. Our multi-modality strategy diversifies revenue streams, reduces exposure to reimbursement changes and provides patients and referring physicians one location to serve the needs of multiple procedures.
We seek to develop leading positions in regional markets in order to leverage operational efficiencies. Our scale and density within selected geographies provides close, long-term relationships with key payors, radiology groups and referring physicians. Each of our facility managers is responsible for managing relationships with local physicians and payors, meeting our standards of patient service and maintaining profitability. We provide corporate training programs, standardized policies and procedures and sharing of best practices among the physicians in our regional networks.
In late 2010 and early 2011 we sought to expand our offering of imaging related services by our acquisition of eRad (development and sale of computerized imaging systems for the imaging industry) and Imaging On Call (teleradiology services for interpretation of images for radiology groups, hospitals and others after business hours, for overflow and specialty work).
We derive substantially all of our revenue, directly or indirectly, from fees charged for the diagnostic imaging services performed at our facilities. For the year ended December 31, 2010, we performed 3,315,019 diagnostic imaging procedures and generated net revenue from continuing operations of $548.5 million. Additional information concerning RadNet, Inc., including our consolidated subsidiaries, for each of the years ended December 31, 2010, December 31, 2009 and December 31, 2008 is included in the consolidated financial statements and notes thereto in this Annual Report.
History of our Business
We were originally incorporated in the State of New York in 1985 and have been continuously engaged in the medical imaging business since that time.
On November 15, 2006, we completed the acquisition of Radiologix, Inc. Radiologix, a Delaware corporation, then employing approximately 2,200 people, through its subsidiaries, was a national provider of diagnostic imaging services through the ownership and operation of freestanding, outpatient diagnostic imaging centers. Radiologix owned, operated and maintained equipment in 69 locations, with imaging centers in seven states, including primary operations in the Mid-Atlantic; the Bay-Area, California; the Treasure Coast area, Florida; and the Finger Lakes (Rochester) and Hudson Valley areas of New York State.
4
Since that time we have continued to develop our medical imaging business through a combination of organic growth and acquisitions. For a discussion of acquisitions and dispositions of facilities, see Item 7 - “Management’s Discussion and Analysis and Results of Operations—Facility Acquisitions” below.
On September 3, 2008 we reincorporated from New York into Delaware and have operated as a Delaware corporation since that time.
On October 1, 2010, we completed our acquisition of Image Medical Corporation, the parent of eRAD, Inc. (see Note 3 to the consolidated financial statements to this Form 10-K). eRAD, Inc., headquartered in Greenville, South Carolina, has been a premier provider of Picture Archiving and Communications Systems (PACS) and related workflow solutions to the radiology industry since 1999. Over 250 hospitals, teleradiology businesses, imaging centers and specialty physician groups use eRAD’s technology to distribute, visualize, store and retrieve digital images taken from all diagnostic imaging modalities. eRAD has approximately 30 employees, including a Research and Development team of 11 software engineers in Budapest, Hungary.
In addition, we have assembled an industry leading team of software developers, based out of Prince Edward Island, Canada, to create radiology workflow solutions known as Radiology Information Systems (“RIS”) focused exclusively on RadNet’s internal use. All members of this Canadian based team have significant software development expertise in radiology, and together with eRAD and its PACS technology, will create fully integrated solutions to manage all aspects of RadNet’s internal information needs. eRAD and the newly hired software development team form a Radiology Information Technology division of RadNet.
References to“RadNet,” “we,” “us,” “our” or the “Company” in this report refer to RadNet, Inc., its subsidiaries and affiliated entities. See “Management’s Discussion and Analysis and Results of Operations—Overview.”
Company Website
We maintain a website at
www.radnet.com
. We make available, free of charge, on our website our annual report on Form 10-K, quarterly reports on Form 10-Q, current reports on Form 8-K and all amendments to those reports as soon as is reasonably practicable after the material is electronically filed with the Securities and Exchange Commission. References to our website addressed in this report are provided as a convenience and do not constitute, or should be viewed as, an incorporation by reference of the information contained on, or available through, the website. Therefore, such information should not be considered part of this report.
Industry Overview
Diagnostic imaging involves the use of non-invasive procedures to generate representations of internal anatomy and function that can be recorded on film or digitized for display on a video monitor. Diagnostic imaging procedures facilitate the early diagnosis and treatment of diseases and disorders and may reduce unnecessary invasive procedures, often minimizing the cost and amount of care for patients. Diagnostic imaging procedures include MRI, CT, PET, nuclear medicine, ultrasound, mammography, X-ray and fluoroscopy. We estimate that the national imaging market in the United States is $100 billion, with projected mid-single digit growth for MRI, CT and PET/CT driven by the aging of the U.S. population, wider physician and payor acceptance for imaging technologies, and greater consumer and physician awareness of diagnostic screening capabilities.
While general X-ray remains the most commonly performed diagnostic imaging procedure, the fastest growing and higher margin procedures are MRI, CT and PET. The rapid growth in PET scans is attributable to the increasing recognition of the efficacy of PET scans in the diagnosis and monitoring of cancer. The number of MRI and CT scans continues to grow due to their wider acceptance by physicians and payors, an increasing number of applications for their use and a general increase in demand due to the aging population in the United States.
Industry Trends
We believe the diagnostic imaging services industry will continue to grow as a result of a number of factors, including the following:
5
Escalating Demand for Healthcare Services from an Aging Population
Persons over the age of 65 comprise one of the fastest growing segments of the population in the United States. According to the United States Census Bureau, this group is expected to increase as much as 33% from 2010 to 2020. Because diagnostic imaging use tends to increase as a person ages, we believe the aging population will generate more demand for diagnostic imaging procedures
.
New Effective Applications for Diagnostic Imaging Technology
New technological developments are expected to extend the clinical uses of diagnostic imaging technology and increase the number of scans performed. Recent technological advancements include:
|
·
|
MRI spectroscopy, which can differentiate malignant from benign lesions;
|
|
·
|
MRI angiography, which can produce three-dimensional images of body parts and assess the status of blood vessels;
|
|
·
|
enhancements in teleradiology systems, which permit the digital transmission of radiological images from one location to another for interpretation by radiologists at remote locations; and
|
|
·
|
the development of combined PET/CT scanners, which combine the technology from PET and CT to create a powerful diagnostic imaging system.
|
Additional improvements in imaging technologies, contrast agents and scan capabilities are leading to new non-invasive methods of diagnosing blockages in the heart’s vital coronary arteries, liver metastases, pelvic diseases and vascular abnormalities without exploratory surgery. We believe that the use of the diagnostic capabilities of MRI and other imaging services will continue to increase because they are cost-effective, time-efficient and non-invasive, as compared to alternative procedures, including surgery, and that newer technologies and future technological advancements will further increase the use of imaging services. At the same time, the industry has increasingly used upgrades to existing equipment to expand applications, extend the useful life of existing equipment, improve image quality, reduce image acquisition time and increase the volume of scans that can be performed. We believe this trend toward equipment upgrades rather than equipment replacements will continue, as we do not foresee new imaging technologies on the near-term horizon that will displace MRI, CT or PET as the principal advanced diagnostic imaging modalities.
Wider Physician and Payor Acceptance of the Use of Imaging
During the last 30 years, there has been a major effort undertaken by the medical and scientific communities to develop higher quality, cost-effective diagnostic imaging technologies and to minimize the risks associated with the application of these technologies. The thrust of product development during this period has largely been to reduce the hazards associated with conventional x-ray and nuclear medicine techniques and to develop new, harmless imaging technologies. As a result, the use of advanced diagnostic imaging modalities, such as MRI, CT and PET, which provide superior image quality compared to other diagnostic imaging technologies, has increased rapidly in recent years. These advanced modalities allow physicians to diagnose a wide variety of diseases and injuries quickly and accurately without exploratory surgery or other surgical or invasive procedures, which are usually more expensive, involve greater risk to patients and result in longer rehabilitation time. Because advanced imaging systems are increasingly seen as a tool for reducing long-term healthcare costs, they are gaining wider acceptance among payors.
Greater Consumer Awareness of and Demand for Preventive Diagnostic Screening
Diagnostic imaging, such as elective full-body scans, is increasingly being used as a screening tool for preventive care procedures. Consumer awareness of diagnostic imaging as a less invasive and preventive screening method has added to the growth in diagnostic imaging procedures. We believe that further technological advancements allowing for early diagnosis of diseases and disorders using less invasive procedures will create additional demand for diagnostic imaging.
Diagnostic Imaging Settings
Diagnostic imaging services are typically provided in one of the following settings:
6
Fixed-site, freestanding outpatient diagnostic facilities
These facilities range from single-modality to multi-modality facilities and are generally not owned by hospitals or clinics. These facilities depend upon physician referrals for their patients and generally do not maintain dedicated, contractual relationships with hospitals or clinics. In fact, these facilities may compete with hospitals or clinics that have their own imaging systems to provide services to these patients. These facilities bill third-party payors, such as managed care organizations, insurance companies, Medicare or Medicaid. All of our facilities are in this category.
Hospitals
Many hospitals provide both inpatient and outpatient diagnostic imaging services, typically on site. These inpatient and outpatient centers are owned and operated by the hospital or clinic, or jointly by both, and are primarily used by patients of the hospital or clinic. The hospital or clinic bills third-party payors, such as managed care organizations, insurance companies, Medicare or Medicaid.
While many hospitals own or lease their own equipment, certain hospitals provide these services by contracting with providers of mobile imaging equipment. Using specially designed trailers, mobile imaging service providers transport imaging equipment and provide services to hospitals and clinics on a part-time or full-time basis, thus allowing small to mid-size hospitals and clinics that do not have the patient demand to justify fixed on-site access to advanced diagnostic imaging technology. Diagnostic imaging providers contract directly with the hospital or clinic and are typically reimbursed directly by them.
Diagnostic Imaging Modalities
The principal diagnostic imaging modalities we use at our facilities are:
MRI
MRI has become widely accepted as the standard diagnostic tool for a wide and fast-growing variety of clinical applications for soft tissue anatomy, such as those found in the brain, spinal cord and interior ligaments of body joints such as the knee. MRI uses a strong magnetic field in conjunction with low energy electromagnetic waves that are processed by a computer to produce high-resolution, three-dimensional, cross-sectional images of body tissue, including the brain, spine, abdomen, heart and extremities. A typical MRI examination takes from 20 to 45 minutes. MRI systems can have either open or closed designs, routinely have magnetic field strength of 0.2 Tesla to 3.0 Tesla and are priced in the range of $0.6 million to $2.5 million. As of December 31, 2010, we had 151 MRI systems in operation.
CT
CT provides higher resolution images than conventional X-rays, but generally not as well defined as those produced by MRI. CT uses a computer to direct the movement of an X-ray tube to produce multiple cross-sectional images of a particular organ or area of the body. CT is used to detect tumors and other conditions affecting bones and internal organs. It is also used to detect the occurrence of strokes, hemorrhages and infections. A typical CT examination takes from 15 to 45 minutes. CT systems are priced in the range of $0.3 million to $1.2 million. As of December 31, 2010, we had 83 CT systems in operation.
PET
PET scanning involves the administration of a radiopharmaceutical agent with a positron-emitting isotope and the measurement of the distribution of that isotope to create images for diagnostic purposes. PET scans provide the capability to determine how metabolic activity impacts other aspects of physiology in the disease process by correlating the reading for the PET with other tools such as CT or MRI. PET technology has been found highly effective and appropriate in certain clinical circumstances for the detection and assessment of tumors throughout the body, the evaluation of some cardiac conditions and the assessment of epilepsy seizure sites. The information provided by PET technology often obviates the need to perform further highly invasive or diagnostic surgical procedures. PET systems are priced in the range of $0.8 million to $2.5 million. In addition, we employ combined PET/CT systems that blend the PET and CT imaging modalities into one scanner. These combined systems are priced in the range of $1.1 million to $2.8 million. As of December 31, 2010, we had 32 PET or combination PET/CT systems in operation.
7
Nuclear Medicine
Nuclear medicine uses short-lived radioactive isotopes that release small amounts of radiation that can be recorded by a gamma camera and processed by a computer to produce an image of various anatomical structures or to assess the function of various organs such as the heart, kidneys, thyroid and bones. Nuclear medicine is used primarily to study anatomic and metabolic functions. Nuclear medicine systems are priced in the range of $300,000 to $400,000. As of December 31, 2010, we had 41 nuclear medicine systems in operation.
X-ray
X-rays use roentgen rays to penetrate the body and record images of organs and structures on film. Digital X-ray systems add computer image processing capability to traditional X-ray images, which provides faster transmission of images with a higher resolution and the capability to store images more cost-effectively. X-ray systems are priced in the range of $95,000 to $440,000. As of December 31, 2010, we had 168 x-ray systems in operation.
Ultrasound
Ultrasound imaging uses sound waves and their echoes to visualize and locate internal organs. It is particularly useful in viewing soft tissues that do not X-ray well. Ultrasound is used in pregnancy to avoid X-ray exposure as well as in gynecological, urologic, vascular, cardiac and breast applications. Ultrasound systems are priced in the range of $90,000 to $250,000. As of December 31, 2010, we had 283 ultrasound systems in operation.
Mammography
Mammography is a specialized form of radiology using low dosage X-rays to visualize breast tissue and is the primary screening tool for breast cancer. Mammography procedures and related services assist in the diagnosis of and treatment planning for breast cancer. Analog mammography systems are priced in the range of $70,000 to $100,000, and digital mammography systems are priced in the range of $250,000 to $400,000. As of December 31, 2010, we had 135 mammography systems in operation, 124 of which are digital mammography systems.
Fluoroscopy
Fluoroscopy uses ionizing radiation combined with a video viewing system for real time monitoring of organs. Fluoroscopy systems are priced in the range of $100,000 to $400,000. As of December 31, 2010, we had 99 fluoroscopy systems in operation.
Our Competitive Strengths
Our Position as the Largest Provider of Freestanding, Fixed-site Outpatient Diagnostic Imaging Services in the United
States, Based on Number of Centers and Revenue
As of December 31, 2010, we operated 201 centers in California, Delaware, Maryland, New Jersey, Florida, and New York. Our size and scale allow us to achieve operating, sourcing and administrative efficiencies, including equipment and medical supply sourcing savings and favorable maintenance contracts from equipment manufacturers and other suppliers. Our specific knowledge of our geographic markets drives strong relationships with key payors, radiology groups and referring physicians within our markets.
Our Comprehensive "Multi-Modality" Diagnostic Imaging Offering
The vast majority of our centers offer multi-modality procedures, driving strong relationships with referring physicians and payors in our markets and a diversified revenue base. At each of our multi-modality facilities, we offer patients and referring physicians one location to serve their needs for multiple procedures. Furthermore, we have complemented many of our multi-modality sites with single-modality sites to accommodate overflow and to provide a full range of services within a local area consistent with demand. This prevents multiple patient visits or unnecessary travel between facilities, thereby increasing patient throughput and decreasing costs and time delays. Our revenue is generated by a broad mix of modalities. We believe our multi-modality strategy lessens our exposure to reimbursement changes in any specific modality.
8
Our Facility Density in Many Highly Populated Areas of the United States
The strategic organization of our diagnostic imaging facilities into regional networks concentrated in major population centers in seven states offers unique benefits to our patients, our referring physicians, our payors and us. We are able to increase the convenience of our services to patients by implementing scheduling systems within geographic regions, where practical. For example, many of our diagnostic imaging facilities within a particular region can access the patient appointment calendars of other facilities within the same regional network to efficiently allocate time available and to meet a patient's appointment, date, time, or location preferences. The grouping of our facilities within regional networks enables us to easily move technologists and other personnel, as well as equipment, from under-utilized to over-utilized facilities on an as-needed basis, and drive referrals. Our organization of referral networks results in increased patient throughput, greater operating efficiencies, better equipment utilization rates and improved response time for our patients. We believe our networks of facilities and tailored service offerings for geographic areas drives local physician referrals, makes us an attractive candidate for selection as a preferred provider by third-party payors, creates economies of scale and provides barriers to entry by competitors in our markets.
Our Strong Relationships with Payors and Diversified Payor Mix
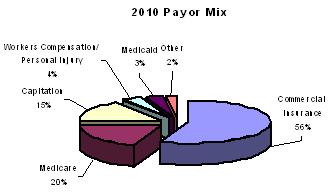
Our revenue is derived from a diverse mix of payors, including private payors, managed care capitated payors and government payors, which should mitigate our exposure to possible unfavorable reimbursement trends within any one payor class. In addition, our experience with capitation arrangements over the last several years has provided us with the expertise to manage utilization and pricing effectively, resulting in a predictable and recurring stream of revenue. We believe that third-party payors representing large groups of patients often prefer to enter into managed care contracts with providers that offer a broad array of diagnostic imaging services at convenient locations throughout a geographic area. As of December 31, 2010, we received approximately 56% of our payments from commercial insurance payors, 15% from managed care capitated payors, 20% from Medicare and 3% from Medicaid. With the exception of Blue Cross/Blue Shield, which are managed by different entities in each of the states in which we operate, and Medicare, no single payor accounted for more than 5% of our net revenue for the twelve months ended December 31, 2010.
9
Our Strong Relationships with Experienced and Highly Regarded Radiologists
Our contracted radiologists have outstanding credentials, strong relationships with referring physicians, and a broad mix of sub-specialties. The collective experience and expertise of these radiologists translates into more accurate and efficient service to patients. Our close relationship with Howard G. Berger, M.D., our President and Chief Executive Officer, and Beverly Radiology Medical Group (“BRMG”) in California and our long-term arrangements with radiologists outside of California enable us to better ensure that medical service provided at our facilities is consistent with the needs and expectations of our referring physicians, patients and payors.
Our Experienced and Committed Management Team
Our senior management group has more than 100 years of combined healthcare management experience. Our executive management team has created our differentiated approach based on their comprehensive understanding of the diagnostic imaging industry and the dynamics of our regional markets. We have a track record of successful acquisitions and integration of acquired businesses into RadNet, and have managed the business through a variety of economic and reimbursement cycles. Our management beneficially owns approximately 29% of our common stock.
Our Technologically Advanced Imaging Systems
In late 2010 and early 2011 we sought to expand our offering of imaging related services by our acquisition of eRad (development and sale of computerized imaging systems for the imaging industry) and Imaging On Call (teleradiology services for interpretation of images for radiology groups, hospitals and others after business hours, for overflow and specialty work).
Business Strategy
Maximize Performance at Our Existing Facilities
We intend to enhance our operations and increase scan volume and revenue at our existing facilities by expanding physician relationships and increasing the procedure offerings.
Expansion Into Related Businesses
With our acquisition of eRad we entered the business of development and sale of software systems essential to the imaging business. Similarly, with our acquisition of Imaging On Call on January 3, 2011, we entered the teleradiology business. We intend to regularly evaluate for potential acquisitions of other businesses to the extent they complement our imaging business.
Focus on Profitable Contracting
We regularly evaluate our contracts with third-party payors, industry vendors and radiology groups, as well as our equipment and real property leases, to determine how we may improve the terms to increase our revenues and reduce our expenses. Because many of our contracts with third party payors are short-term in nature, we can regularly renegotiate these contracts, if necessary. We believe our position as a leading provider of diagnostic imaging services and our long-term relationships with physician groups in our markets enable us to obtain more favorable contract terms than would be available to smaller or less experienced imaging services providers.
Expand MRI, CT and PET Applications
We intend to continue to use expanding MRI, CT and PET applications as they become commercially available. Most of these applications can be performed by our existing MRI, CT and PET systems with upgrades to software and hardware, thereby minimizing capital expenditure requirements. We intend to introduce applications that will decrease scan and image-reading time and increase our productivity.
Optimize Operating Efficiencies
We intend to maximize our equipment utilization by adding, upgrading and re-deploying equipment where we experience excess demand. We will continue to trim excess operating and general and administrative costs where it is feasible to do so. We may also continue to use, where appropriate, highly trained radiology physician assistants to perform, under appropriate supervision of radiologists, basic services traditionally performed by radiologists. We will continue to upgrade our advanced information technology system to create cost reductions for our facilities in areas such as image storage, support personnel and financial management.
10
Expand Our Networks
We intend to continue to expand the number of our facilities through new developments and targeted acquisitions, using a disciplined approach for evaluating and entering new areas, including consideration of whether we have adequate financial resources to expand. Our current plans are to strengthen our market presence in geographic areas where we currently have existing operations and to expand into neighboring and other areas which we determine to be appropriate. We perform extensive due diligence before developing a new facility or acquiring an existing facility, including surveying local referral sources and radiologists, as well as examining the demographics, reimbursement environment, competitive landscape and intrinsic demand of the geographic market. We generally will only enter new markets where:
|
·
|
there is sufficient patient demand for outpatient diagnostic imaging services;
|
|
·
|
we believe we can gain significant market share;
|
|
·
|
we can build key referral relationships or we have already established such relationships; and
|
|
·
|
payors are receptive to our entry into the market.
|
Our Services
We offer a comprehensive set of imaging services including MRI, CT, PET, nuclear medicine, X-ray, ultrasound, mammography, fluoroscopy and other related procedures. We focus on providing standardized high quality imaging services, regardless of location, to ensure patients, physicians and payors consistency in service and quality. To ensure the high quality of our services, we monitor patient satisfaction, timeliness of services to patients and reports to physicians. We believe our fees are generally lower than hospital fees for the services we provide.
The key features of our services include:
|
·
|
patient-friendly, non-clinical environments;
|
|
·
|
a 24-hour turnaround on routine examinations;
|
|
·
|
interpretations within one to two hours, if needed;
|
|
·
|
flexible patient scheduling, including same-day appointments;
|
|
·
|
extended operating hours, including weekends;
|
|
·
|
reports delivered by courier, facsimile or email;
|
|
·
|
availability of second opinions and consultations;
|
|
·
|
availability of sub-specialty interpretations at no additional charge; and
|
|
·
|
standardized fee schedules by region.
|
Radiology Professionals
In the states in which we provide services (except Florida), a lay person or any entity other than a professional corporation or similar professional organization is not allowed to practice medicine, including by employing professional persons or by having any ownership interest or profit participation in or control over any medical professional practice. This doctrine is commonly referred to as the prohibition on the “corporate practice” of medicine. In order to comply with this prohibition, we contract with radiologists to provide professional medical services in our facilities, including the supervision and interpretation of diagnostic imaging procedures. The radiology practice maintains full control over the physicians it employs. Pursuant to each management contract, we make available the imaging facility and all of the furniture and medical equipment at the facility for use by the radiology practice, and the practice is responsible for staffing the facility with qualified professional medical personnel. In addition, we provide management services and administration of the non-medical functions relating to the professional medical practice at the facility, including among other functions, provision of clerical and administrative personnel, bookkeeping and accounting services, billing and collection, provision of medical and office supplies, secretarial, reception and transcription services, maintenance of medical records, and advertising, marketing and promotional activities. As compensation for the services furnished under contracts with radiologists, we generally receive an agreed percentage of the medical practice billings for, or collections from, services provided at the facility, typically varying between 75% to 85% of global net revenue or collections after deduction of the professional fees.
11
At all but 10 of our California facilities, we contract for the provision of professional medical services directly with BRMG, or indirectly through BRMG with other radiology groups.
Many states have also enacted laws prohibiting a licensed professional from splitting fees derived from the practice of medicine with an unlicensed person or business entity. We do not believe that the management, administrative, technical and other non-medical services we provide to each of our contracted radiology groups violate the corporate practice of medicine prohibition or that the fees we charge for such services violate the fee splitting prohibition. However, the enforcement and interpretation of these laws by regulatory authorities and state courts vary from state to state. If our arrangements with our independent contractor radiology groups are found to violate state laws prohibiting the practice of medicine by general business corporations or fee splitting, our business, financial condition and ability to operate in those states could be adversely affected.
BRMG in California
Howard G. Berger, M.D., is our President and Chief Executive Officer, a member of our Board of Directors and owns approximately 15% of our outstanding common stock. Dr. Berger also owns, indirectly, 99% of the equity interests in BRMG. BRMG provides all of the professional medical services at 91 of our facilities located in California under a management agreement with us, and contracts with various other independent physicians and physician groups to provide the professional medical services at most of our other California facilities. We obtain professional medical services from BRMG in California, rather than provide such services directly or through subsidiaries, in order to comply with California’s prohibition against the corporate practice of medicine. However, as a result of our close relationship with Dr. Berger and BRMG, we believe that we are able to better ensure that medical service is provided at our California facilities in a manner consistent with our needs and expectations and those of our referring physicians, patients and payors than if we obtained these services from unaffiliated physician groups.
We believe that physicians are drawn to BRMG and the other radiologist groups with whom we contract by the opportunity to work with the state-of-the-art equipment we make available to them, as well as the opportunity to receive specialized training through our fellowship programs, and engage in clinical research programs, which generally are available only in university settings and major hospitals.
As of December 31, 2010, BRMG employed 74 full-time and seven part-time radiologists. Under our management agreement with BRMG, we are paid a percentage of the amounts collected for the professional services BRMG physicians render as compensation for our services and for the use of our facilities and equipment. For the year ended December 31, 2010, this percentage was 79%. The percentage may be adjusted, if necessary, to ensure that the parties receive the fair value for the services they render. The following are the other principal terms of our management agreement with BRMG:
|
·
|
The agreement expires on January 1, 2014. However, the agreement automatically renews for consecutive 10-year periods, unless either party delivers a notice of non-renewal to the other party no later than six months prior to the scheduled expiration date. Either party may terminate the agreement if the other party defaults under its obligations, after notice and an opportunity to cure. We may terminate the agreement if Dr. Berger no longer owns at least 60% of the equity of BRMG; as of December 31, 2010, he owned 99% of the equity of BRMG.
|
|
·
|
At its expense, BRMG employs or contracts with an adequate number of physicians necessary to provide all professional medical services at all of our California facilities, except for 10 facilities for which we contract with separate medical groups.
|
|
·
|
At our expense, we provide all furniture, furnishings and medical equipment located at the facilities and we manage and administer all non-medical functions at, and provide all nurses and other non-physician personnel required for the operation of, the facilities.
|
|
·
|
If BRMG wants to open a new facility, we have the right of first refusal to provide the space and services for the facility under the same terms and conditions set forth in the management agreement.
|
|
·
|
If we want to open a new facility, BRMG must use its best efforts to provide medical personnel under the same terms and conditions set forth in the management agreement. If BRMG cannot provide such personnel, we have the right to contract with other physicians to provide services at the facility.
|
|
·
|
BRMG must maintain medical malpractice insurance for each of its physicians with coverage limits not less than $1 million per incident and $3 million in the aggregate per year. BRMG also has agreed to indemnify us for any losses we suffer that arise out of the acts or omissions of BRMG and its employees, contractors and agents.
|
12
Non-California Locations and 10 California Locations
At the 10 centers in California that BRMG does not provide professional medical services, and at all of the centers which are located outside of California, we have entered into long-term contracts with prominent third-party radiology groups in the area to provide physician services at those facilities. These arrangements also allow us to comply with the prohibition against the “corporate practice” of medicine in other states in which we operate (except in Florida which does not have an equivalent statute prohibiting the corporate practice of medicine).
These third-party radiology practice groups provide professional services, including supervision and interpretation of diagnostic imaging procedures, in our diagnostic imaging centers. The radiology practices maintain full control over the provision of professional services. The contracted radiology practices generally have outstanding physician and practice credentials and reputations; strong competitive market positions; a broad sub-specialty mix of physicians; a history of growth and potential for continued growth. In these facilities we have entered into long-term agreements (typically 10-40 years in length) under which, in addition to obtaining technical fees for the use of our diagnostic imaging equipment and the provision of technical services, we provide management services and receive a fee based on the practice group’s professional revenue. We typically receive 100% of the technical reimbursements associated with imaging procedures plus certain fees paid to us for providing additional management services. The radiology practice groups retain the professional reimbursements associated with imaging procedures after deducting certain additional management service fees paid to us.
Additionally, we perform certain management services for a portion of the professional groups with whom we contract who provide professional radiology services at local hospitals. For performing these management services, which include billing, collecting, transcription and medical coding, we receive management fees.
Payors
The fees charged for diagnostic imaging services performed at our facilities are paid by a diverse mix of payors, as illustrated for the following periods presented in the table below:
|
% of Net Revenue
|
||||||||||||
|
|
Year Ended
December 31,
2010
|
Year Ended
December 31,
2009
|
Year Ended
December 31,
2008
|
|||||||||
|
Commercial Insurance
(1)(2)
|
56%
|
56%
|
56%
|
|||||||||
|
Managed Care Capitated Payors
|
15%
|
15%
|
15%
|
|||||||||
|
Medicare
|
20%
|
20%
|
20%
|
|||||||||
(1)
Includes Blue Cross/Blue Shield plans, which represented 19% of our net revenue for the year ended December 31, 2008, 24% of our net revenue for the year ended December 31, 2009 and 19% of our net revenue for the year ended December 31, 2010.
(2)
Includes co-payments, direct patient payments and payments through contracts with physician groups and other non-insurance company payors.
We have described below the types of reimbursement arrangements we have with third-party payors.
Commercial Insurance
Generally, insurance companies reimburse us, directly or indirectly, including through BRMG in California or through the contracted radiology groups elsewhere, on the basis of agreed upon rates. These rates are on average approximately the same as the rates set forth in the Medicare Physician Fee Schedule for the particular service. The patients are generally not responsible for any amount above the insurance allowable amount.
13
Managed Care Capitation Agreements
Under these agreements, which are generally between BRMG in California and outside of California between the contracted radiology group and the payor, typically an independent physician group or other medical group, the payor pays a pre-determined amount per-member per-month in exchange for the radiology group providing all necessary covered services to the managed care members included in the agreement. These contracts pass much of the financial risk of providing outpatient diagnostic imaging services, including the risk of over-use, from the payor to the radiology group and, as a result of our management agreement with the radiology group, to us.
We believe that through our comprehensive utilization management, or UM, program we have become highly skilled at assessing and moderating the risks associated with the capitation agreements, so that these agreements are profitable for us. Our UM program is managed by our UM department, which consists of administrative and nursing staff as well as BRMG medical staff who are actively involved with the referring physicians and payor management in both prospective and retrospective review programs. Our UM program includes the following features, all of which are designed to manage our costs while ensuring that patients receive appropriate care:
|
·
|
Physician Education
At the inception of a new capitation agreement, we provide the new referring physicians with binders of educational material comprised of proprietary information that we have prepared and third-party information we have compiled, which are designed to address diagnostic strategies for common diseases. We distribute additional material according to the referral practices of the group as determined in the retrospective analysis described below.
|
|
·
|
Prospective Review
Referring physicians are required to submit authorization requests for non-emergency high-intensity services: MRI, CT, special procedures and nuclear medicine studies. The UM medical staff, according to accepted practice guidelines, considers the necessity and appropriateness of each request. Notification is then sent to the imaging facility, referring physician and medical group. Appeals for cases not approved are directed to us. The capitated payor has the final authority to uphold or deny our recommendation.
|
|
·
|
Retrospective Review
We collect and sort encounter activity by payor, place of service, referring physician, exam type and date of service. The data is then presented in quantitative and analytical form to facilitate understanding of utilization activity and to provide a comparison between fee-for-service and Medicare equivalents. Our Medical Director prepares a quarterly report for each payor and referring physician, which we send to them. When we find that a referring physician is over utilizing services, we work with the physician to modify referral patterns.
|
Medicare/Medicaid
Medicare is the federal health insurance program for people age 65 or older and people under age 65 with certain disabilities. Medicaid, funded by both the federal government and states, is a state-administered health insurance program for qualifying low-income and medically needy persons. For services for which we bill Medicare directly or indirectly, including through contracted radiologists, we are paid under the Medicare Physician Fee Schedule. Medicare patients usually pay a 20% co-payment unless they have secondary insurance. Medicaid rates are set by the individual states for each state program and Medicaid patients may be responsible for a modest co-payment.
Contracts with Physician Groups and Other Entities
For some of our contracts with physician groups and other providers, we do not bill payors, but instead accept agreed upon rates for our radiology services.
14
Contracts with Physician Groups and Other Non-Insurance Company Payors
These payors reimburse us, directly or indirectly, on the basis of agreed upon rates. These rates are typically at or below the rates set forth in the current Medicare Fee Schedule for the particular service. However, we often agree to a specified rate for MRI and CT procedures that is not tied to the Medicare Fee Schedule. The patients are generally not responsible for the unreimbursed portion.
Facilities
Through our wholly owned subsidiaries, we operate 101 fixed-site, freestanding outpatient diagnostic imaging facilities in California, 41 in the Baltimore-Washington, D.C. area, 24 in the Rochester and Hudson Valley areas of New York, 15 in Delaware, 17 in New Jersey, as well as three individual facilities in Florida. We lease the premises at which these facilities are located.
Our facilities are primarily located in regional networks that we refer to as regions. The majority of our facilities are multi-modality sites, offering various combinations of MRI, CT, PET, nuclear medicine, ultrasound, X-ray, fluoroscopy services and other related procedures. A portion of our facilities are single-modality sites, offering either X-ray or MRI services. Consistent with our regional network strategy, we locate our single-modality facilities near multi-modality facilities, to help accommodate overflow in targeted demographic areas.
The following table sets forth the number of our facilities for each year during the five-year period ended December 31, 2010:
| Year Ended December 31 | ||||||||||||||||||||
|
2006
|
2007
|
2008
|
2009
|
2010
|
||||||||||||||||
|
Total facilities owned or managed (at beginning of the year)
|
57 | 132 | 141 | 164 | 180 | |||||||||||||||
|
Facilities added by:
|
||||||||||||||||||||
|
Acquisition *
|
78 | 12 | 24 | 14 | 28 | |||||||||||||||
|
Internal development
|
4 | 2 | 4 | 3 | 8 | |||||||||||||||
|
Facilities closed or sold
|
(7) | (5) | (5) | (1) | (15) | |||||||||||||||
|
Total facilities owned (at year end)
|
132* | 141 | 164 | 180 | 201 | |||||||||||||||
|
* Includes 69 Radiologix facilities acquired on November 15, 2006
|
||||||||||||||||||||
The following table indicates, as of December 31, 2010, the quantity of principal diagnostic equipment available at our facilities, by region:
|
MRI
|
Open/MRI
|
CT
|
PET/CT
|
Mammo
|
Ultrasound
|
X-ray
|
NucMed
|
Fluoroscopy
|
Total
|
|
|
California
|
47
|
23
|
31
|
18
|
68
|
118
|
71
|
17
|
57
|
450
|
|
Florida
|
2
|
1
|
2
|
1
|
6
|
5
|
4
|
2
|
2
|
25
|
|
Delaware
|
8
|
1
|
6
|
1
|
4
|
13
|
16
|
1
|
4
|
54
|
|
New Jersey
|
15
|
2
|
8
|
-
|
8
|
23
|
8
|
-
|
11
|
75
|
|
New York
|
16
|
1
|
11
|
3
|
16
|
36
|
20
|
2
|
9
|
114
|
|
Maryland
|
26
|
9
|
25
|
9
|
33
|
88
|
49
|
19
|
16
|
274
|
|
Total
|
114
|
37
|
83
|
32
|
135
|
283
|
168
|
41
|
99
|
992
|
The average age of our MRI and CT units is less than six years, and the average age of our PET units is less than four years. The useful life of our MRI, CT and PET units is typically ten years.
Facility Acquisitions and Divestitures
Information regarding our facility acquisitions can be found within Item 7 - “Management’s Discussion and Analysis of Financial Condition and Results of Operations”, as well as Note 3 and 4 to the consolidated financial statements of this Form 10-K.
15
Information Technology
Our corporate headquarters and many of our facilities are interconnected through a state-of-the-art information technology system. This system, which is compliant with the Health Insurance Portability and Accountability Act of 1996, is comprised of a number of integrated applications and provides a single operating platform for billing and collections, electronic medical records, practice management and image management.
This technology has created cost reductions for our facilities in areas such as image storage, support personnel and financial management and has further allowed us to optimize the productivity of all aspects of our business by enabling us to:
|
·
|
capture patient demographic, history and billing information at point-of-service;
|
|
·
|
automatically generate bills and electronically file claims with third-party payors;
|
|
·
|
record and store diagnostic report images in digital format;
|
|
·
|
digitally transmit in real-time diagnostic images from one location to another, thus enabling networked radiologists to cover larger geographic markets by using the specialized training of other networked radiologists;
|
|
·
|
perform claims, rejection and collection analysis; and
|
|
·
|
perform sophisticated financial analysis, such as analyzing cost and profitability, volume, charges, current activity and patient case mix, with respect to each of our managed care contracts.
|
Diagnostic reports and images are currently accessible via the Internet by our California referring providers. We have worked with some of the larger medical groups in California with whom we have contracts to provide access to this content through their web portals. We are in the process of making such services available outside of California.
With our acquisition of eRad we believe we will be able to develop and implement programs which improve the systems we utilize in the operation of our business by providing systems which meet our specific needs as opposed to being limited to systems developed for the imaging industry in general.
Personnel
At December 31, 2010, we had a total of 3,320 full-time, 549 part-time and 712 per diem employees, including those employed by BRMG. These numbers include 74 full-time and seven part-time physicians and 920 full-time, 341 part-time and 426 per-diem technologists.
We employ site managers who are responsible for overseeing day-to-day and routine operations at each of our facilities, including staffing, modality and schedule coordination, referring physician and patient relations and purchasing of materials. These site managers report to regional managers and directors, who are responsible for oversight of the operations of all facilities within their region, including sales, marketing and contracting. The regional managers and directors, along with our directors of contracting, marketing, facilities, management/purchasing and human resources report to our chief operating officers. These officers, our chief financial officer, our director of information services and our medical director report to our chief executive officer.
None of our employees is subject to a collective bargaining agreement nor have we experienced any work stoppages. We believe our relationship with our employees is good.
Sales and Marketing
At December 31, 2010, our California sales and marketing team consisted of one director of marketing, six territory sales managers and 35 customer service representatives. Our eastern marketing team consists of 48 customer sales representatives and seven sales managers who each report to a district manager. Our sales and marketing team employs a multi-pronged approach to marketing, including physician, payor and sports marketing programs.
16
Physician Marketing
Each customer service representative is responsible for marketing activity on behalf of one or more facilities. The representatives act as a liaison between the facility and referring physicians, holding meetings periodically and on an as-needed basis with them and their staff to present educational programs on new applications and uses of our systems and to address particular patient service issues that have arisen. In our experience, consistent hands-on contact with a referring physician and his or her staff generates goodwill and increases referrals. The representatives also continually seek to establish referral relationships with new physicians and physician groups. In addition to a base salary and a car allowance, each representative receives a quarterly bonus if the facility or facilities on behalf of which he or she markets meets specified net revenue goals for the quarter.
Payor Marketing
Our marketing team regularly meets with managed care organizations and insurance companies to solicit contracts and meet with existing contracting payors to solidify those relationships. The comprehensiveness of our services, the geographic location of our facilities and the reputation of the physicians with whom we contract all serve as tools for obtaining new or repeat business from payors.
Sports Marketing Program
We have a sports marketing program designed to increase our public profile. We provide X-ray equipment and a technician for all of the basketball games of the Lakers, Clippers and Sparks held at the Staples Center in Los Angeles, Ducks hockey games held at the Honda Center in Anaheim, and University of Southern California football games held in the Los Angeles Coliseum. In exchange for this service, we receive game tickets and an advertisement in each team program throughout the season. In addition, we have a close relationship with the physicians for some of these teams.
Suppliers
Historically, we have acquired a majority of our advanced diagnostic imaging equipment from GE Medical Systems, Inc., and we purchase medical supplies from various national vendors. We believe that we have excellent working relationships with all of our major vendors. However, there are several comparable vendors for our supplies that would be available to us if one of our current vendors becomes unavailable.
We primarily acquire our equipment with cash or through various financing arrangements with equipment vendors and third party equipment finance companies involving the use of capital leases with purchase options at minimal prices at the end of the lease term. At December 31, 2010, capital lease obligations, excluding interest, totaled approximately $14.8 million through 2014, including current installments totaling approximately $9.1 million. If we open or acquire additional imaging facilities, we may have to incur material capital lease obligations.
Timely, effective maintenance is essential for achieving high utilization rates of our imaging equipment. We have an arrangement with GE Medical Systems, Inc. under which it has agreed to be responsible for the maintenance and repair of a majority of our equipment for a fee that is based upon a percentage of our revenue, subject to a minimum payment. Net revenue is reduced by the provision for bad debts, mobile PET revenue and other professional reading service revenue to obtain adjusted net revenue.
Competition
The market for diagnostic imaging services is highly competitive. We compete principally on the basis of our reputation, our ability to provide multiple modalities at many of our facilities, the location of our facilities, the quality of our diagnostic imaging services and technologists and the ability to establish and maintain relationships with healthcare providers and referring physicians. We compete locally with groups of radiologists, established hospitals, clinics and other independent organizations that own and operate imaging equipment. Our competitors include Alliance Healthcare Services, Inc., Diagnostic Imaging Group, InSight Health Services Corp. and American Radiology Services. Some of our competitors may now or in the future have access to greater financial resources than we do and may have access to newer, more advanced equipment. In addition, some physician practices have established their own diagnostic imaging facilities within their group practices to compete with us. We experience additional competition as a result of those activities.
Each of the non-BRMG contracted radiology practices has entered into agreements with its physician shareholders and full-time employed radiologists that generally prohibit those shareholders and radiologists from competing for a period of two years within defined geographic regions after they cease to be owners or employees, as applicable. In certain states, like California, a covenant not to compete is enforced in limited circumstances involving the sale of a business. In other states, a covenant not to compete will be enforced only:
|
·
|
to the extent it is necessary to protect a legitimate business interest of the party seeking enforcement;
|
|
·
|
if it does not unreasonably restrain the party against whom enforcement is sought; and
|
|
·
|
if it is not contrary to public interest.
|
17
Enforceability of a non-compete covenant is determined by a court based on all of the facts and circumstances of the specific case at the time enforcement is sought. For this reason, it is not possible to predict whether or to what extent a court will enforce the contracted radiology practices’ covenants. The inability of the contracted radiology practices or us to enforce radiologist’s non-compete covenants could result in increased competition from individuals who are knowledgeable about our business strategies and operations.
Liability Insurance
We maintain insurance policies with coverage we believe is appropriate in light of the risks attendant to our business and consistent with industry practice. However, adequate liability insurance may not be available to us in the future at acceptable costs or at all. We maintain general liability insurance and professional liability insurance in commercially reasonable amounts. Additionally, we maintain workers’ compensation insurance on all of our employees. Coverage is placed on a statutory basis and responds to individual state’s requirements.
Pursuant to our agreements with physician groups with whom we contract, including BRMG, each group must maintain medical malpractice insurance for each physician in the group, having coverage limits of not less than $1.0 million per incident and $3.0 million in the aggregate per year.
California’s medical malpractice cap further reduces our exposure. California places a $250,000 limit on non-economic damages for medical malpractice cases. Non-economic damages are defined as compensation for pain, suffering, inconvenience, physical impairment, disfigurement and other non-pecuniary injury. The cap applies whether the case is for injury or death, and it allows only one $250,000 recovery in a wrongful death case. No cap applies to economic damages. Other states in which we now operate do not have similar limitations and in those states we believe our insurance coverage to be sufficient.
We maintain a $5.0 million key-man life insurance policy on the life of Dr. Berger. We are the beneficiary under the policy.
Regulation
General
The healthcare industry is highly regulated, and we can give no assurance that the regulatory environment in which we operate will not change significantly in the future. Our ability to operate profitably will depend in part upon us, and the contracted radiology practices and their affiliated physicians obtaining and maintaining all necessary licenses and other approvals, and operating in compliance with applicable healthcare regulations. We believe that healthcare regulations will continue to change. Therefore, we monitor developments in healthcare law and modify our operations from time to time as the business and regulatory environment changes. Although we intend to continue to operate in compliance, we cannot ensure that we will be able to adequately modify our operations so as to address changes in the regulatory environment.
Licensing and Certification Laws
Ownership, construction, operation, expansion and acquisition of diagnostic imaging facilities are subject to various federal and state laws, regulations and approvals concerning licensing of facilities and personnel. In addition, free-standing diagnostic imaging facilities that provide services not performed as part of a physician office must meet Medicare requirements to be certified as an independent diagnostic testing facility to bill the Medicare program. We may not be able to receive the required regulatory approvals for any future acquisitions, expansions or replacements, and the failure to obtain these approvals could limit the market for our services. We have experienced a slowdown in the credentialing of our physicians over the last several years which has lengthened our billing and collection cycle.
Corporate Practice of Medicine
In the states in which we operate, a lay person or any entity other than a professional corporation or other similar professional organization is not allowed to practice medicine, including by employing professional persons or by having any ownership interest or profit participation in or control over any medical professional practice. The laws of such states also prohibit a lay person or a non-professional entity from exercising control over the medical judgments or decisions of physicians and from engaging in certain financial arrangements, such as splitting professional fees with physicians. We structure our relationships with the radiology practices, including the purchase of diagnostic imaging facilities, in a manner that we believe keeps us from engaging in the practice of medicine, exercising control over the medical judgments or decisions of the radiology practices or their physicians, or violating the prohibitions against fee-splitting. There can be no assurance that our present arrangements with BRMG or the other physicians providing medical services and medical supervision at our imaging facilities will not be challenged, and, if challenged, that they will not be found to violate the corporate practice of medicine or fee splitting prohibitions, thus subjecting us to a potential combination of damages, injunction and civil and criminal penalties or require us to restructure our arrangements in a way that would affect the control or quality of our services or change the amounts we receive under our management agreements, or both.
18
Medicare and Medicaid Fraud and Abuse
Our revenue is derived through our ownership, operation and management of diagnostic imaging centers and from service fees paid to us by contracted radiology practices. During the year ended December 31, 2010, approximately 20% of our revenue generated at our diagnostic imaging centers was derived from federal government sponsored healthcare programs (Medicare) and 3% from state sponsored programs (Medicaid).
Federal law known as the Anti-kickback Statute prohibits the knowing and willful offer, payment, solicitation or receipt of any form of remuneration in return for, or to induce, (i) the referral of a person, (ii) the furnishing or arranging for the furnishing of items or services reimbursable under the Medicare, Medicaid or other governmental programs or (iii) the purchase, lease or order or arranging or recommending purchasing, leasing or ordering of any item or service reimbursable under the Medicare, Medicaid or other governmental programs. Enforcement of this anti-kickback law is a high priority for the federal government, which has substantially increased enforcement resources and is scheduled to continue increasing such resources. Noncompliance with the federal Anti-kickback Statute can result in exclusion from the Medicare, Medicaid or other governmental programs and civil and criminal penalties.
As described above, the Anti-kickback Statute is broad, and it prohibits many arrangements and practices that are lawful in businesses outside of the healthcare industry. Recognizing that the Anti-kickback Statute is broad and may technically prohibit many innocuous or beneficial arrangements within the healthcare industry, the Office of the Inspector General of the U.S. Department of Health and Human Services issued regulations in July of 1991, which the Department has referred to as “safe harbors.” These safe harbor regulations set forth certain provisions which, if met in form and substance, will assure healthcare providers and other parties that they will not be prosecuted under the federal Anti-kickback Statute. Additional safe harbor provisions providing similar protections have been published intermittently since 1991. Our arrangements with physicians, physician practice groups, hospitals and other persons or entities who are in a position to refer may not fully meet the stringent criteria specified in the various safe harbors. Although full compliance with these provisions ensures against prosecution under the federal Anti-kickback Statute, the failure of a transaction or arrangement to fit within a specific safe harbor does not necessarily mean that the transaction or arrangement is illegal or that prosecution under the federal Anti-kickback Statute will be pursued.
Although some of our arrangements may not fall within a safe harbor, we believe that such business arrangements do not violate the Anti-kickback Statute because we are careful to structure them to reflect fair value and ensure that the reasons underlying our decision to enter into a business arrangement comport with reasonable interpretations of the Anti-kickback Statute. However, even though we continuously strive to comply with the requirements of the Anti-kickback Statute, liability under the Anti-kickback Statute may still arise because of the intentions or actions of the parties with whom we do business. While we are not aware of any such intentions or actions, we have only limited knowledge regarding the intentions or actions underlying those arrangements. Conduct and business arrangements that do not fully satisfy one of these safe harbor provisions may result in increased scrutiny by government enforcement authorities such as the Office of the Inspector General.
Significant prohibitions against physician referrals have been enacted by Congress. These prohibitions include the Ethics in Patient Referral Act of 1989 which is commonly known as the Stark Law. The Stark Law prohibits a physician from referring Medicare patients to an entity providing designated health services, as defined under the Stark Law, including, without limitation, radiology services, in which the physician (or immediate family member) has an ownership or investment interest or with which the physician (or immediate family member) has entered into a compensation arrangement. The Stark Law also prohibits the entity from billing for any such prohibited referral. The penalties for violating the Stark Law include a prohibition on payment by these governmental programs and civil penalties of as much as $15,000 for each violation referral and $100,000 for participation in a circumvention scheme. We believe that, although we receive fees under our service agreements for management and administrative services, we are not in a position to make or influence referrals of patients.
On January 4, 2001, the Centers for Medicare and Medicaid Services (CMS) published the first phase of the final regulations to implement the Stark Law. CMS subsequently released phase two of the Stark Law final rule as a final rule effective July 26, 2004; phase three, effective on December 4, 2007; and finally, on August 19, 2008, CMS finalized additional changes to the Stark Law which became effective on October 1, 2009. Under the Stark Law, radiology and certain other imaging services and radiation therapy services and supplies are services included in the designated health services subject to the self-referral prohibition. Such services include the professional and technical components of any diagnostic test or procedure using X-rays, ultrasound or other imaging services, CT, MRI, radiation therapy and diagnostic mammography services (but not screening mammography services). The Stark Law, however, excludes from designated health services: (i) X-ray, fluoroscopy or ultrasound procedures that require the insertion of a needle, catheter, tube or probe through the skin or into a body orifice; (ii) radiology procedures that are integral to the performance of, and performed during, non-radiological medical procedures; and (iii) invasive or interventional radiology, because the radiology services in these procedures are merely incidental or secondary to another procedure that the physician has ordered. Beginning January 1, 2007, PET and nuclear medicine procedures are included as designated health services under the Stark Law.
19
The Stark Law provides that a request by a radiologist for diagnostic radiology services or a request by a radiation oncologist for radiation therapy, if such services are furnished by or under the supervision of such radiologist or radiation oncologist pursuant to a consultation requested by another physician, does not constitute a referral by a referring physician. If such requirements are met, the Stark Law self-referral prohibition would not apply to such services. The effect of the Stark Law on the radiology practices, therefore, will depend on the precise scope of services furnished by each such practice’s radiologists and whether such services derive from consultations or are self-generated. We believe that, other than self-referred patients, all of the services covered by the Stark Law provided by the contracted radiology practices derive from requests for consultation by non-affiliated physicians. Therefore, we believe that the Stark Law is not implicated by the financial relationships between our operations and the contracted radiology practices.
In addition, we believe that we have structured our acquisitions of the assets of existing practices, and we intend to structure any future acquisitions, so as not to violate the Anti-kickback Statute and Stark Law and regulations. Specifically, we believe the consideration paid by us to physicians to acquire the tangible and intangible assets associated with their practices is consistent with fair value in arms’ length transactions and is not intended to induce the referral of patients or other business generated by such physicians. Should any such practice be deemed to constitute an arrangement designed to induce the referral of Medicare or Medicaid patients, then our acquisitions could be viewed as possibly violating anti-kickback and anti-referral laws and regulations. A determination of liability under any such laws could have a material adverse effect on our business, financial condition and results of operations.
The federal government embarked on an initiative to audit all Medicare carriers, which are the companies that adjudicate and pay Medicare claims. These audits are expected to intensify governmental scrutiny of individual providers. An unsatisfactory audit of any of our diagnostic imaging facilities or contracted radiology practices could result in any or all of the following: significant repayment obligations, exclusion from the Medicare, Medicaid or other governmental programs, and civil and criminal penalties.
Federal regulatory and law enforcement authorities have increased enforcement activities with respect to Medicare, Medicaid fraud and abuse regulations and other reimbursement laws and rules, including laws and regulations that govern our activities and the activities of the radiology practices. The federal government also has increased funding to fight healthcare fraud and is coordinating its enforcement efforts among various agencies, such as the U.S. Department of Justice, the U.S. Department of Health and Human Services Office of Inspector General, and state Medicaid fraud control units. The trend towards increased funding is also seen most recently in President Obama’s budget for fiscal year 2011. The government may investigate our or the radiology practices’ activities, claims may be made against us or the radiology practices and these increased enforcement activities may directly or indirectly have an adverse effect on our business, financial condition and results of operations.
State Anti-kickback and Physician Self-referral Laws
Many states have adopted laws similar to the federal Anti-kickback Statute. Some of these state prohibitions apply to referral of patients for healthcare services reimbursed by any source, not only the Medicare and Medicaid programs. Although we believe that we comply with both federal and state Anti-kickback laws, any finding of a violation of these laws could subject us to criminal and civil penalties or possible exclusion from federal or state healthcare programs. Such penalties would adversely affect our financial performance and our ability to operate our business.
Federal False Claims Act
The federal False Claims Act provides, in part, that the federal government may bring a lawsuit against any person who it believes has knowingly presented, or caused to be presented, a false or fraudulent request for payment from the federal government, or who has made a false statement or used a false record to get a claim approved. The federal False Claims Act further provides that a lawsuit thereunder may be initiated in the name of the United States by an individual, a “whistleblower,” who is an original source of the allegations. The government has taken the position that claims presented in violation of the federal anti-kickback law or Stark Law may be considered a violation of the federal False Claims Act. Penalties include civil penalties of not less than $5,500 and not more than $11,000 for each false claim, plus three times the amount of damages that the federal government sustained because of the act of that person.
Recently, the number of suits brought against healthcare providers by private individuals has increased dramatically. Further, on May 20, 2009, President Obama signed into law the Fraud Enforcement and Recovery Act of 2009 (FERA), which greatly expanded the types of entities and conduct subject to the False Claims Act. Also, various states are considering or have enacted laws modeled after the federal False Claims Act. Under the Deficit Reduction Act of 2005, or DRA, states are being encouraged to adopt false claims acts similar to the federal False Claims Act, which establish liability for submission of fraudulent claims to the State Medicaid program and contain whistleblower provisions. Even in instances when a whistleblower action is dismissed with no judgment or settlement, we may incur substantial legal fees and other costs relating to an investigation. Future actions under the False Claims Act may result in significant fines and legal fees, which would adversely affect our financial performance and our ability to operate our business.
20
We believe that we are in compliance with the rules and regulations that apply to the federal False Claims Act as well as its state counterparts. However, we could be found to have violated certain rules and regulations resulting in sanctions under the federal False Claims Act or its state counterparts. If we are so found in violation, any sanctions imposed could result in fines and penalties and restrictions on and exclusion from participation in federal and state healthcare programs that are integral to our business.
Healthcare Reform Legislation
Healthcare reform legislation enacted in the first quarter of 2010 by the Patient Protection and Affordable Care Act or PPACA, specifically requires the U.S. Department of Health and Human Services, in computing physician practice expense relative value units, to increase the equipment utilization factor for advanced diagnostic imaging services (such as MRI, CT and PET) from a presumed utilization rate of 50% to 65% for 2010 through 2012, 70% in 2013, and 75% thereafter. Excluded from the adjustment are low-technology imaging modalities such as ultrasound, X-ray and fluoroscopy. The Health Care and Education Reconciliation Act of 2010 (H.R. 4872)
or Reconciliation Act
, which was passed by the Senate and approved by the President on March 30, 2010, amends the provision for higher presumed utilization of advanced diagnostic imaging services to a presumed rate of 75%. The higher utilization rate should be fully implemented beginning in 2011, in place of the phase-in approach provided in the PPACA. These changes may result in decreased revenue for the scans we perform for Medicare beneficiaries. Other changes in reimbursement for services rendered by Medicare Advantage plans may also reduce the revenues we receive for services rendered to Medicare Advantage enrollees.
Health Insurance Portability and Accountability Act of 1996
Congress enacted the Health Insurance Portability and Accountability Act of 1996, or HIPAA, in part, to combat healthcare fraud and to protect the privacy and security of patients’ individually identifiable healthcare information. HIPAA, among other things, amends existing crimes and criminal penalties for Medicare fraud and enacts new federal healthcare fraud crimes, including actions affecting non-government healthcare benefit programs. Under HIPAA, a healthcare benefit program includes any private plan or contract affecting interstate commerce under which any medical benefit, item or service is provided. A person or entity that knowingly and willfully obtains the money or property of any healthcare benefit program by means of false or fraudulent representations in connection with the delivery of healthcare services is subject to a fine or imprisonment, or potentially both. In addition, HIPAA authorizes the imposition of civil money penalties against entities that employ or enter into contracts with excluded Medicare or Medicaid program participants if such entities provide services to federal health program beneficiaries. A finding of liability under HIPAA could have a material adverse effect on our business, financial condition and results of operations.
Further, HIPAA requires healthcare providers and their business associates to maintain the privacy and security of individually identifiable protected health information (“PHI”). HIPAA imposes federal standards for electronic transactions, for the security of electronic health information and for protecting the privacy of PHI. The Health Information Technology for Economic and Clinical Health Act of 2009 (“HITECH”), signed into law on February 17, 2009, dramatically expanded, among other things, (1) the scope of HIPAA to now apply directly to “business associates,” or independent contractors who receive or obtain PHI in connection with providing a service to a covered entity, (2) substantive security and privacy obligations, including new federal security breach notification requirements to affected individuals, DHHS and prominent media outlets, of certain breaches of unsecured PHI, (3) restrictions on marketing communications and a prohibition on covered entities or business associates from receiving remuneration in exchange for PHI, and (4) the civil and criminal penalties that may be imposed for HIPAA violations, increasing the annual cap in penalties from $25,000 to $1.5 million per year.
In addition, many states have enacted comparable privacy and security statutes or regulations that, in some cases, are more stringent than HIPAA requirements. In those cases it may be necessary to modify our operations and procedures to comply with the more stringent state laws, which may entail significant and costly changes for us. We believe that we are in compliance with such state laws and regulations. However, if we fail to comply with applicable state laws and regulations, we could be subject to additional sanctions.
We believe that we are in compliance with the current HIPAA requirements, as amended by HITECH, and comparable state laws, but we anticipate that we may encounter certain costs associated with future compliance. Moreover, we cannot guarantee that enforcement agencies or courts will not make interpretations of the HIPAA standards that are inconsistent with ours, or the interpretations of our contracted radiology practices or their affiliated physicians. A finding of liability under the HIPAA standards may result in significant criminal and civil penalties. Noncompliance also may result in exclusion from participation in government programs, including Medicare and Medicaid. These actions could have a material adverse effect on our business, financial condition, and results of operations.
21
Compliance Program
We maintain a program to monitor compliance with federal and state laws and regulations applicable to healthcare entities. We have a compliance officer who is charged with implementing and supervising our compliance program, which includes the adoption of (i) Standards of Conduct for our employees and affiliates and (ii) a process that specifies how employees, affiliates and others may report regulatory or ethical concerns to our compliance officer. We believe that our compliance program meets the relevant standards provided by the Office of Inspector General of the Department of Health and Human Services.
An important part of our compliance program consists of conducting periodic audits of various aspects of our operations and that of the contracted radiology practices. We also conduct mandatory educational programs designed to familiarize our employees with the regulatory requirements and specific elements of our compliance program.
U.S. Food and Drug Administration or FDA
The FDA has issued the requisite pre-market approval for all of the MRI and CT systems we use. We do not believe that any further FDA approval is required in connection with the majority of equipment currently in operation or proposed to be operated, except under regulations issued by the FDA pursuant to the Mammography Quality Standards Act of 1992, as amended by the Mammography Quality Standards Reauthorization Acts of 1998 and 2004 (collectively, the MQSA). All mammography facilities are required to meet the applicable MQSA requirements, including quality standards, be accredited by an approved accreditation body or state agency and certified by the FDA or an FDA-approved certifying state agency. Pursuant to the accreditation process, each facility providing mammography services must comply with certain standards that include, among other things, annual inspection of the facility's equipment, personnel (interpreting physicians, technologists and medical physicists) and practices.
Compliance with these MQSA requirements and standards is required to obtain Medicare payment for services provided to beneficiaries and to avoid various sanctions, including monetary penalties, or suspension of certification. Although the Mammography Accreditation Program of the American College of Radiology is an approved accreditation body and currently accredits all of our facilities which provide mammography services, and although we anticipate continuing to meet the requirements for accreditation, if we lose such accreditation, the FDA could revoke our certification. Congress has extended Medicare benefits to include coverage of screening mammography but coverage is subject to the facility performing the mammography meeting prescribed quality standards described above. The Medicare requirements to meet the standards apply to diagnostic mammography and image quality examination as well as screening mammography.
Radiologist Licensing
The radiologists providing professional medical services at our facilities are subject to licensing and related regulations by the states in which they provide services. As a result, we require BRMG and the other radiology groups with which we contract to require those radiologists to have and maintain appropriate licensure. We do not believe that such laws and regulations will either prohibit or require licensure approval of our business operations, although no assurances can be made that such laws and regulations will not be interpreted to extend such prohibitions or requirements to our operations.
Insurance Laws and Regulation
States in which we operate have adopted certain laws and regulations affecting risk assumption in the healthcare industry, including those that subject any physician or physician network engaged in risk-based managed care to applicable insurance laws and regulations. These laws and regulations may require physicians and physician networks to meet minimum capital requirements and other safety and soundness requirements. Implementing additional regulations or compliance requirements could result in substantial costs to the contracted radiology practices, limiting their ability to enter into capitated or other risk-sharing managed care arrangements and indirectly affecting our revenue from the contracted practices.
Environmental Matters
The facilities we operate or manage generate hazardous and medical waste subject to federal and state requirements regarding handling and disposal. We believe that the facilities that we operate and manage are currently in compliance in all material respects with applicable federal, state and local statutes and ordinances regulating the handling and disposal of such materials. We do not believe that we will be required to expend any material additional amounts in order to remain in compliance with these laws and regulations or that compliance will materially affect our capital expenditures, earnings or competitive position.
22
Deficit Reduction Act of 2005 (DRA)
On February 8, 2006, the President signed into law the DRA. Effective January 1, 2007, the DRA provides that Medicare reimbursement for the technical component for imaging services (excluding diagnostic and screening mammography) performed in freestanding facilities will be capped. Payment will be the lesser of the Medicare Physician Fee Schedule or the Hospital Outpatient Prospective Payment System (HOPPS) rates. Implementation of these reimbursement reductions contained in the DRA has had a significant adverse effect on our business, financial condition and results of operations.
The DRA also codified the reduction in reimbursement for multiple images on contiguous body parts previously announced by CMS, the agency responsible for administering the Medicare program. In November 2005, CMS announced that it would pay 100% of the technical component of the higher priced imaging procedure and 50% of the technical component of each additional imaging procedure for imaging procedures involving contiguous body parts within a family of codes when performed in the same session. CMS had indicated that it would phase in this 50% rate reduction over two years, so that the reduction was 25% for each additional imaging procedure in 2006 and another 25% in 2007. To date, CMS has implemented the 25% reduction for each additional procedure but has not yet implemented the additional 25% reduction scheduled for 2007. However, for services furnished on or after July 1, 2010, the PPACA which, as stated above, was signed into law on March 23, 2010, requires the full 50% reduction to be implemented. We have determined that the impact of this final 25% reduction is, and will be in the future, immaterial to our operating results.
|
Item 1A.
|
Risk Factors
|
If BRMG or any of our other contracted radiology practices terminate their agreements with us, our business could substantially diminish.
Our relationship with BRMG is an integral part of our business. Through our management agreement, BRMG provides all of the professional medical services at 91 of our 101 California facilities. Professional medical services are provided at the balance of our other facilities through management contracts with other radiology groups. BRMG and these other radiology groups contract with various other independent physicians and physician groups to provide all of the professional medical services at most of our facilities, and they must use their best efforts to provide the professional medical services at any new facilities that we open or acquire in their areas of operation. In addition, BRMG and the other radiology groups’ strong relationships with referring physicians are largely responsible for the revenue generated at the facilities they service. Although our management agreement with BRMG runs until 2014, and for terms as long, if not longer, with the other groups, BRMG and the other radiology groups have the right to terminate the agreements if we default on our obligations and fail to cure the default. Also, the various radiology groups’ ability to continue performing under the management agreements may be curtailed or eliminated due to the groups’ financial difficulties, loss of physicians or other circumstances. If the radiology groups cannot perform their obligations to us, we would need to contract with one or more other radiology groups to provide the professional medical services at the facilities serviced by the group. We may not be able to locate radiology groups willing to provide those services on terms acceptable to us, if at all. Even if we were able to do so, any replacement radiology group’s relationships with referring physicians may not be as extensive as those of the terminated group. In any such event, our business could be seriously harmed. In addition, the radiology groups are party to substantially all of the managed care contracts from which we derive revenue. If we were unable to readily replace these contracts, our revenue would be negatively affected.
Adverse changes in general domestic and worldwide economic conditions and instability and disruption of credit markets could adversely affect our operating results, financial condition, or liquidity.
We are subject to risk arising from adverse changes in general domestic and global economic conditions, including recession or economic slowdown and disruption of credit markets. Recent global market and economic conditions have been unprecedented and challenging with tighter credit conditions and recession in most major economies continuing into 2010. Continued concerns about the systemic impact of potential long-term and wide-spread recession, inflation, energy costs, geopolitical issues, the availability and cost of credit and the United States mortgage market have contributed to increased market volatility and diminished expectations for the United States economy. Added concerns fueled by the United States government's financial assistance to certain companies and other federal government’s interventions in the United States financial system has led to increased market uncertainty and instability in both United States and international capital and credit markets. These conditions, combined with volatile oil prices, declining business and consumer confidence and increased unemployment, have contributed to volatility of unprecedented levels. We believe our MRI and PET/CT scan volumes were impacted in 2009 and 2010 by rising unemployment rates, the number of under-insured or uninsured patients and other conditions arising from the global economic conditions described above.
As a result of these market conditions, the cost and availability of credit has been and may continue to be adversely affected by illiquid credit markets and wider credit spreads. Concern about the stability of the markets generally and the strength of counterparties specifically has led many lenders and institutional investors to reduce, and in some cases, cease to provide funding to borrowers.
23
Continued turbulence in the United States and international markets and economies may adversely affect our liquidity and financial condition, and the liquidity and financial condition of our customers. If these market conditions continue, they may limit our ability, and the ability of our customers, to timely replace maturing liabilities, and access the capital markets to meet liquidity needs, resulting in adverse effects on our financial condition and results of operations.
We have experienced operating losses and we have a substantial accumulated deficit. If we are unable to improve our financial performance, we may be unable to pay our obligations.
We have incurred net losses of $12.9 million, $2.3 million and $12.8 million, for the years ended December 31, 2010, 2009 and 2008, respectively. As of December 31, 2010, our accumulated deficit was $82.5 million. We have been successful in significantly reducing our net losses over the past two years. Our net loss for the year ended December 31, 2010 included a $9.9 million loss on extinguishment of debt related to our debt refinancing completed on April 6, 2010. We expect to continue this trend and to begin generating net income. However, we cannot provide any assurances as to the likelihood, timing, or extent of our ability to achieve net income from operations. If we cannot generate income from operations in sufficient amounts, we will not be able to pay our obligations as they become due. Our inability to generate income from operations to pay our obligations could adversely impact our business, financial condition and results of operations.
Our substantial debt could adversely affect our financial condition and prevent us from fulfilling our obligations under our unsecured senior notes.
Our current substantial indebtedness and any future indebtedness we incur could adversely affect our financial condition. We are highly leveraged. As of December 31, 2010, our total indebtedness was $504.6 million, $482.9 million of which constituted senior secured indebtedness. Our substantial indebtedness could also:
|
●
|
make it difficult for us to satisfy our obligations with respect to our outstanding indebtedness;
|
|
|
●
|
require us to dedicate a substantial portion of our cash flow from operations to payments on our debt, reducing the availability of our cash flow to fund working capital, capital expenditures, acquisitions and other general corporate purposes;
|
|
|
●
|
expose us to the risk of interest rate increases on our variable rate borrowings, including borrowings under our new senior secured credit facilities;
|
|
|
●
|
increase our vulnerability to adverse general economic and industry conditions;
|
|
|
●
|
limit our flexibility in planning for, or reacting to, changes in our business and the industry in which we operate;
|
|
|
●
|
place us at a competitive disadvantage compared to our competitors that have less debt; and
|
|
|
●
|
limit our ability to borrow additional funds on terms that are satisfactory to us or at all.
|
We may not be able to finance future needs or adapt our business plan to changes because of restrictions placed on us by our New Credit Facilities, the indenture governing our senior unsecured notes and instruments governing our other indebtedness.
The indenture governing the senior unsecured notes and our New Credit Facilities contain affirmative and negative covenants which restrict, among other things, our ability to:
|
|
●
|
pay dividends or make certain other restricted payments or investments;
|
|
|
●
|
incur additional indebtedness and issue preferred stock;
|
|
|
●
|
create liens (other than permitted liens) securing indebtedness or trade payables unless the notes are secured on an equal and ratable basis with the obligations so secured, and, if such liens secure subordinated indebtedness, the notes are secured by a lien senior to such liens;
|
|
|
●
|
sell certain assets or merge with or into other companies or otherwise dispose of all or substantially all of our assets;
|
|
|
●
|
enter into certain transactions with affiliates;
|
|
|
●
|
create restrictions on dividends or other payments by our restricted subsidiaries; and
|
|
|
●
|
create guarantees of indebtedness by restricted subsidiaries.
|
24
All of these restrictions could affect our ability to operate our business and may limit our ability to take advantage of potential business opportunities as they arise. A failure to comply with these covenants and restrictions would permit the relevant creditors to declare all amounts borrowed under the applicable agreement governing such indebtedness, together with accrued interest and fees, to be immediately due and payable. If the indebtedness under the New Credit Facilities or the senior unsecured notes is accelerated, we may not have sufficient assets to repay amounts due under the New Credit Facilities, the senior unsecured notes or on other indebtedness then outstanding.
Our success depends in part on our key personnel and loss of key executives could adversely affect our operations. In addition, former employees and radiology practices we have previously contracted with could use the experience and relationships developed while employed or under contract with us to compete with us.
Our success depends in part on our ability to attract and retain qualified senior and executive management, managerial and technical personnel. Competition in recruiting these personnel may make it difficult for us to continue our growth and success. The loss of their services or our inability in the future to attract and retain management and other key personnel could hinder the implementation of our business strategy. The loss of the services of Dr. Howard G. Berger, our President and Chief Executive Officer, and Norman R. Hames or Stephen M. Forthuber, our Chief Operating Officers, west and east coast, respectively, could have a significant negative impact on our operations. We believe that they could not easily be replaced with executives of equal experience and capabilities. We do not maintain key person insurance on the life of any of our executive officers with the exception of a $5.0 million policy on the life of Dr. Berger. Also, if we lose the services of Dr. Berger, our relationship with BRMG could deteriorate, which would materially adversely affect our business.
Many of the states in which we operate do not enforce agreements that prohibit a former employee from competing with a former employer. As a result, many of our employees whose employment is terminated are free to compete with us, subject to prohibitions on the use of confidential information and, depending on the terms of the employee’s employment agreement, on solicitation of existing employees and customers. A former executive, manager or other key employee who joins one of our competitors could use the relationships he or she established with third party payors, radiologists or referring physicians while our employee and the industry knowledge he or she acquired during that tenure to enhance the new employer’s ability to compete with us.
The agreements with most of our radiology practices contain non-compete provisions however the enforceability of these provisions is determined by a court based on all the facts and circumstances of the specific case at the time enforcement is sought. Our inability to enforce radiologists’ non-compete provisions could result in increased competition from individuals who are knowledgeable about our business strategies and operations.
The California budget crisis, if not successfully resolved could have an impact on our revenue.
California is experiencing a budget crisis which has resulted in significant state government cutbacks. 101 of our 201 facilities are located in California. One to one-and-one-half percent (1% to 1.5%) of our revenues come from the California Medicaid program ($5 million to $7.5 million). To the extent California is unable to provide these payments on a timely basis, or at all, our revenues will be negatively impacted.
Our failure to integrate the businesses we acquire successfully and on a timely basis could reduce our profitability.
We may never realize expected synergies, business opportunities and growth prospects in connection with our acquisitions. We may experience increased competition that limits our ability to expand our business. We may not be able to capitalize on expected business opportunities, assumptions underlying estimates of expected cost savings may be inaccurate, or general industry and business conditions may deteriorate. In addition, integrating operations will require significant efforts and expenses on our part. Personnel may leave or be terminated because of an acquisition. Our management may have its attention diverted while trying to integrate an acquisition. If these factors limit our ability to integrate the operations of an acquisition successfully or on a timely basis, our expectations of future results of operations, including certain cost savings and synergies as a result of the acquisition, may not be met. In addition, our growth and operating strategies for a target’s business may be different from the strategies that the target company pursued prior to our acquisition. If our strategies are not the proper strategies, it could have a material adverse effect on our business, financial condition and results of operations.
Our ability to generate revenue depends in large part on referrals from physicians.
A significant reduction in physician referrals would have a negative impact on our business. We derive substantially all of our net revenue, directly or indirectly, from fees charged for the diagnostic imaging services performed at our facilities. We depend on referrals of patients from unaffiliated physicians and other third parties who have no contractual obligations to refer patients to us for a substantial portion of the services we perform. If a sufficiently large number of these physicians and other third parties were to discontinue referring patients to us, our scan volume could decrease, which would reduce our net revenue and operating margins. Further, commercial third-party payors have implemented programs that could limit the ability of physicians to refer patients to us. For example, prepaid healthcare plans, such as health maintenance organizations, sometimes contract directly with providers and require their enrollees to obtain these services exclusively from those providers. Some insurance companies and self-insured employers also limit these services to contracted providers. These “closed panel” systems are now common in the managed care environment. Other systems create an economic disincentive for referrals to providers outside the system’s designated panel of providers. If we are unable to compete successfully for these managed care contracts, our results and prospects for growth could be adversely affected.
25
The regulatory framework in which we operate is uncertain and evolving.
Healthcare laws and regulations may change significantly in the future. We continuously monitor these developments and modify our operations from time to time as the regulatory environment changes. We cannot assure you however, that we will be able to adapt our operations to address new regulations or that new regulations will not adversely affect our business. In addition, although we believe that we are operating in compliance with applicable federal and state laws, neither our current or anticipated business operations nor the operations of the contracted radiology practices have been the subject of judicial or regulatory interpretation. We cannot assure you that a review of our business by courts or regulatory authorities will not result in a determination that could adversely affect our operations or that the healthcare regulatory environment will not change in a way that restricts our operations.
Certain states have enacted statutes or adopted regulations affecting risk assumption in the healthcare industry, including statutes and regulations that subject any physician or physician network engaged in risk-based managed care contracting to applicable insurance laws and regulations. These laws and regulations, if adopted in the states in which we operate, may require physicians and physician networks to meet minimum capital requirements and other safety and soundness requirements. Implementing additional regulations or compliance requirements could result in substantial costs to us and the contracted radiology practices and limit our ability to enter into capitation or other risk-sharing managed care arrangements.
Changes in the method or rates of third-party reimbursement could have a negative impact on our results.
From time to time, changes designed to contain healthcare costs have been implemented, some of which have resulted in decreased reimbursement rates for diagnostic imaging services that impact our business. For services for which we bill Medicare directly, we are paid under the Medicare Physician Fee Schedule, which is updated on an annual basis. Under the Medicare statutory formula, payments under the Physician Fee Schedule would have decreased for the past several years if Congress failed to intervene. For example, for 2008, the fee schedule rates were to be reduced by approximately 10.1%. The Medicare, Medicaid and SCHIP Extension Act of 2007 eliminated the 10.1% reduction for 2008 and increased the annual payment rate update by 0.5%. This increase to the annual Medicare Physician Fee Schedule payment update was effective only for Medicare claims with dates of service between January 1, 2008 and June 30, 2008. Beginning July 1, 2008, under the Medicare Improvement for Patients and Providers Act of 2008 (MIPPA), the 0.5% increase was continued for the rest of 2008. In addition, MIPPA established a 1.1% increase to the Medicare Physician Fee Schedule payment update for 2009. For 2010, CMS projected a rate reduction of 21.2% in the absence of Congressional intervention. However, over the course of the first six months of 2010, various temporary solutions were enacted by Congress which resulted in delaying any such change to the physician fee schedule. Ultimately, a 2.2% increase in the conversion factor was passed by Congress effective June 1, 2010, further delaying the pending 21.2% conversion factor reduction to November 30, 2010. On November 2, 2010, CMS released the calendar year 2011 Medicare Physician Fee Schedule. The rule would have significantly reduced physician fee schedule payments in 2011 had Congress not acted by passing the Physician Payment and Therapy Relief Act of 2010 and the Medicare and Medicaid Extenders Act of 2010, which together continue the 2.2% update from June 2010 through December 31, 2011. While Congress has historically provided temporary relief from the formula-driven reductions in the conversion factor, it cannot be guaranteed that Congress will act to provide relief in the future. The failure of Congress to act could adversely impact our revenues and results of operation.
MIPPA also modified the methodology by which the budget neutrality formula was applied to the 2009 physician fee schedule payment rates, resulting in an overall reduction in payment rates for services performed by many specialties, including an estimated 3% reduction for radiation oncology and 1% reduction for nuclear medicine. The impact of these payment rate reductions could impact the Company's future revenue depending upon our service mix.
A number of other legislative changes impact our business. For example, DRA imposed caps on Medicare payment rates for certain imaging services furnished in physician's offices and other non-hospital based settings. The caps impact MRI and PET/CT. Under the cap, payments for specified imaging services cannot exceed the hospital outpatient payment rates for those services. This change applies to services furnished on or after January 1, 2007. The limitation is applicable to the technical components of the diagnostic imaging services only, which is the payment we receive for the services for which we bill directly under the Medicare Physician Fee Schedule.
The DRA also codified the reduction in reimbursement for multiple images on contiguous body parts, which was previously announced by CMS. The DRA mandated payment at 100% of the technical component of the higher priced imaging procedure and 50% for the technical component of each additional imaging procedure for multiple images of contiguous body parts within a family of codes performed in the same session. Beginning in 2006, CMS had only implemented a 25% reduction for each additional imaging procedure on contiguous body parts. However, for services furnished on or after July 1, 2010, PPACA requires the full 50% reduction to be implemented.
26
Regulatory updates to payment rates for which we bill the Medicare program directly are published annually by CMS in the Federal Register. For payments under the Physician Fee Schedule for calendar year 2010, CMS changed the way it calculates components of the Medicare Physician Fee Schedule. First, CMS reduced payment rates for certain diagnostic services using equipment costing more than $1 million through revisions to usage assumptions from the current 50% usage rate to a 90% usage rate. This change applied to MRI and CT scans. The Reconciliation Act, signed into law on March 30, 2010, resets the assumed usage rate for diagnostic imaging equipment costing more than $1 million to a rate of 75%, effective for payments made under the 2011 Medicare Physician Fee Schedule and subsequent years. CMS finalized this change in the Medicare Physician Fee Schedule for calendar year 2011. Further with respect to its 2010 changes, CMS also reduced payment for services primarily involving the technical component rather than the physician work component, including the services we provide, by adjusting downward malpractice payments for these services. The reductions primarily impacted radiology and other diagnostic tests. All these changes to the Medicare Physician Fee Schedule will be transitioned over a four year period such that beginning in 2013, CMS will fully implement the revised payment rates. For the 2010 transitioned payment, CMS estimates the impact of its changes will result in a 5% reduction in radiology, 18% reduction in nuclear medicine and 12% reduction for all suppliers providing the technical component of diagnostic tests generally.
Pressure to control healthcare costs could have a negative impact on our results.
One of the principal objectives of health maintenance organizations and preferred provider organizations is to control the cost of healthcare services. Healthcare providers participating in managed care plans may be required to refer diagnostic imaging tests to certain providers depending on the plan in which a covered patient is enrolled. In addition, managed care contracting has become very competitive, and reimbursement schedules are at or below Medicare reimbursement levels. The expansion of health maintenance organizations, preferred provider organizations and other managed care organizations within the geographic areas covered by our network could have a negative impact on the utilization and pricing of our services, because these organizations will exert greater control over patients’ access to diagnostic imaging services, the selections of the provider of such services and reimbursement rates for those services.
If our contracted radiology practices, including BRMG, lose a significant number of their radiologists, our financial results could be adversely affected.
At times, there has been a shortage of qualified radiologists in some of the regional markets we serve. In addition, competition in recruiting radiologists may make it difficult for our contracted radiology practices to maintain adequate levels of radiologists. If a significant number of radiologists terminate their relationships with our contracted radiology practices and those radiology practices cannot recruit sufficient qualified radiologists to fulfill their obligations under our agreements with them, our ability to maximize the use of our diagnostic imaging facilities and our financial results could be adversely affected. For example, in fiscal 2002, due to a shortage of qualified radiologists in the marketplace, BRMG experienced difficulty in hiring and retaining physicians and thus engaged independent contractors and part-time fill-in physicians. Their cost was double the salary of a regular BRMG full-time physician. Increased expenses to BRMG will impact our financial results because the management fee we receive from BRMG, which is based on a percentage of BRMG’s collections, is adjusted annually to take into account the expenses of BRMG. Neither we, nor our contracted radiology practices, maintain insurance on the lives of any affiliated physicians.
We may not be able to successfully grow our business, which would adversely affect our financial condition and results of operations.
Historically, we have experienced substantial growth through acquisitions that have increased our size, scope and geographic distribution. During the past two fiscal years, we have completed 19 acquisitions. These acquisitions have added 42 centers to our fixed-site outpatient diagnostic imaging services. Our ability to successfully expand through acquiring facilities, developing new facilities, adding equipment at existing facilities, and directly or indirectly entering into contractual relationships with high-quality radiology practices depends upon many factors, including our ability to:
|
·
|
identify attractive and willing candidates for acquisitions;
|
|
·
|
identify locations in existing or new markets for development of new facilities;
|
|
·
|
comply with legal requirements affecting our arrangements with contracted radiology practices, including state prohibitions on fee-splitting, corporate practice of medicine and self-referrals;
|
|
·
|
obtain regulatory approvals where necessary and comply with licensing and certification requirements applicable to our diagnostic imaging facilities, the contracted radiology practices and the physicians associated with the contracted radiology practices;
|
27
|
·
|
recruit a sufficient number of qualified radiology technologists and other non-medical personnel;
|
|
·
|
expand our infrastructure and management; and
|
|
·
|
compete for opportunities. We may not be able to compete effectively for the acquisition of diagnostic imaging facilities. Our competitors may have more established operating histories and greater resources than we do. Competition may also make any acquisitions more expensive.
|
In October 2010, we completed our acquisition of Image Medical Corporation, the parent of eRAD, Inc. We believe the eRAD, Inc. acquisition provides us with access to additional technology to be utilized by our current facilities as well as expanding the products and services we may offer. Our beliefs regarding the merit of this acquisition and others are based upon numerous assumptions that are subject to risks and uncertainties that could deviate materially from our estimates, and could adversely affect our operating results.
Managing the acquisition of eRAD, Inc., as well as any other future acquisitions, will entail numerous operational and financial risks, including:
|
·
|
inability to obtain adequate financing;
|
|
·
|
possible adverse effects on our operating results;
|
|
·
|
diversion of management’s attention and resources;
|
|
·
|
failure to retain key personnel;
|
|
·
|
difficulties in integrating new operations into our existing infrastructure; and
|
|
·
|
amortization or write-offs of acquired intangible assets, including goodwill.
|
If we are unable to successfully grow our business through acquisitions it could have an adverse effect on our financial condition and results of operations.
The acquisition of eRAD, Inc. results in a new line of business for us that could be difficult to integrate, disrupt our business or harm our results of operations.
Although we offer some services similar to those offered by eRAD, Inc., the acquisition of eRAD, Inc. has provided us with a new line of business that has a large research and development component that is new to our business. The process of integrating the acquired business, technology, service and research and development component into our business and operations and entry into a new line of business in which we are inexperienced may result in unforeseen operating difficulties and expenditures. In developing the new line of business as a result of the eRAD, Inc. acquisition, we may invest significant time and resources, including the attention of management’s time that would otherwise be available for ongoing development of our business that may affect our results of operations and we may not be able to take full advantage of the business opportunities available to us as we expand the new line of business. Additionally, there are many competitors in the same business as eRAD, Failure to successfully manage these risks in the development and implementation of new lines of business could have a material, adverse effect on the Company’s business, financial condition, and results of operations.
We may become subject to professional malpractice liability, which could be costly and negatively impact our business.
The physicians employed by our contracted radiology practices are from time to time subject to malpractice claims. We structure our relationships with the practices under our management agreements in a manner that we believe does not constitute the practice of medicine by us or subject us to professional malpractice claims for acts or omissions of physicians employed by the contracted radiology practices. Nevertheless, claims, suits or complaints relating to services provided by the contracted radiology practices have been asserted against us in the past and may be asserted against us in the future. In addition, we may be subject to professional liability claims, including, without limitation, for improper use or malfunction of our diagnostic imaging equipment or for accidental contamination or injury from exposure to radiation. We may not be able to maintain adequate liability insurance to protect us against those claims at acceptable costs or at all.
28
Any claim made against us that is not fully covered by insurance could be costly to defend, result in a substantial damage award against us and divert the attention of our management from our operations, all of which could have an adverse effect on our financial performance. In addition, successful claims against us may adversely affect our business or reputation. Although California places a $250,000 limit on non-economic damages for medical malpractice cases, no limit applies to economic damages and no such limits exist in the other states in which we now provide services.
We may not receive payment from some of our healthcare provider customers because of their financial circumstances.
Some of our healthcare provider customers do not have significant financial resources, liquidity or access to capital. If these customers experience financial difficulties they may be unable to pay us for the equipment and services that we provide. A significant deterioration in general or local economic conditions could have a material adverse effect on the financial health of certain of our healthcare provider customers. As a result, we may have to increase the amounts of accounts receivables that we write-off, which would adversely affect our financial condition and results of operations.
Some of our imaging modalities use radioactive materials, which generate regulated waste and could subject us to liabilities for injuries or violations of environmental and health and safety laws.
Some of our imaging procedures use radioactive materials, which generate medical and other regulated wastes. For example, patients are injected with a radioactive substance before undergoing a PET scan. Storage, use and disposal of these materials and waste products present the risk of accidental environmental contamination and physical injury. We are subject to federal, state and local regulations governing storage, handling and disposal of these materials. We could incur significant costs and the diversion of our management’s attention in order to comply with current or future environmental and health and safety laws and regulations. Also, we cannot completely eliminate the risk of accidental contamination or injury from these hazardous materials. Although we believe that we maintain professional liability insurance coverage consistent with industry practice in the event of an accident, we could be held liable for any resulting damages, and any liability could exceed the limits of or fall outside the coverage of our professional liability insurance.
We experience competition from other diagnostic imaging companies and hospitals, and this competition could adversely affect our revenue and business.
The market for diagnostic imaging services is highly competitive. We compete principally on the basis of our reputation, our ability to provide multiple modalities at many of our facilities, the location of our facilities and the quality of our diagnostic imaging services. We compete locally with groups of radiologists, established hospitals, clinics and other independent organizations that own and operate imaging equipment. Our competitors include Alliance Healthcare Services, Inc., Diagnostic Imaging Group, InSight Health Services Corp. and American Radiology Services. Some of our competitors may now or in the future have access to greater financial resources than we do and may have access to newer, more advanced equipment. In addition, some physician practices have established their own diagnostic imaging facilities within their group practices and compete with us. We are experiencing increased competition as a result of such activities, and if we are unable to successfully compete, our business and financial condition would be adversely affected.
State and federal anti-kickback and anti-self-referral laws may adversely affect income.
Various federal and state laws govern financial arrangements among healthcare providers. The federal Anti-Kickback Law prohibits the knowing and willful offer, payment, solicitation or receipt of any form of remuneration in return for, or to induce, the referral of Medicare, Medicaid, or other federal healthcare program patients, or in return for, or to induce, the purchase, lease or order of items or services that are covered by Medicare, Medicaid, or other federal healthcare programs. Similarly, many state laws prohibit the solicitation, payment or receipt of remuneration in return for, or to induce the referral of patients in private as well as government programs. Violation of these Anti-Kickback Laws may result in substantial civil or criminal penalties for individuals or entities and/or exclusion from federal or state healthcare programs. We believe we are operating in compliance with applicable law and believe that our arrangements with providers would not be found to violate the Anti-Kickback Laws. However, these laws could be interpreted in a manner inconsistent with our operations.
Federal law prohibiting physician self-referrals, known as the Stark Law, prohibits a physician from referring Medicare or Medicaid patients to an entity for certain “designated health services” if the physician has a prohibited financial relationship with that entity, unless an exception applies. Certain radiology services are considered “designated health services” under the Stark Law. Although we believe our operations do not violate the Stark Law, our activities may be challenged. If a challenge to our activities is successful, it could have an adverse effect on our operations. In addition, legislation may be enacted in the future that further addresses Medicare and Medicaid fraud and abuse or that imposes additional requirements or burdens on us.
In addition, under the DRA, states enacting false claims statutes similar to the federal False Claims Act, which establish liability for submission of fraudulent claims to the State Medicaid program and contain qui tam or whistleblower provisions, receive an increased percentage of any recovery from a State Medicaid judgment or settlement. Adoption of new false claims statutes in states where we operate may impose additional requirements or burdens on us.
29
Technological change in our industry could reduce the demand for our services and require us to incur significant costs to upgrade our equipment.
The development of new technologies or refinements of existing modalities may require us to upgrade and enhance our existing equipment before we may otherwise intend. Many companies currently manufacture diagnostic imaging equipment. Competition among manufacturers for a greater share of the diagnostic imaging equipment market may result in technological advances in the speed and imaging capacity of new equipment. This may accelerate the obsolescence of our equipment, and we may not have the financial ability to acquire the new or improved equipment and may not be able to maintain a competitive equipment base. In addition, advances in technology may enable physicians and others to perform diagnostic imaging procedures without us. If we are unable to deliver our services in the efficient and effective manner that payors, physicians and patients expect and thus our revenue could substantially decrease.
A failure to meet our capital expenditure requirements could adversely affect our business.
We operate in a capital intensive, high fixed-cost industry that requires significant amounts of capital to fund operations, particularly the initial start-up and development expenses of new diagnostic imaging facilities and the acquisition of additional facilities and new diagnostic imaging equipment. We incur capital expenditures to, among other things, upgrade and replace existing equipment for existing facilities and expand within our existing markets and enter new markets. To the extent we are unable to generate sufficient cash from our operations, funds are not available from our lenders or we are unable to structure or obtain financing through operating leases, long-term installment notes or capital leases, we may be unable to meet our capital expenditure requirements.
Because we have high fixed costs, lower scan volumes per system could adversely affect our business.
The principal components of our expenses, excluding depreciation, consist of debt service, capital lease payments, compensation paid to technologists, salaries, real estate lease expenses and equipment maintenance costs. Because a majority of these expenses are fixed, a relatively small change in our revenue could have a disproportionate effect on our operating and financial results depending on the source of our revenue. Thus, decreased revenue as a result of lower scan volumes per system could result in lower margins, which could materially adversely affect our business.
Capitation fee arrangements could reduce our operating margins.
For the year ended December 31, 2010, we derived approximately 15% of our payments from capitation arrangements, and we intend to increase the revenue we derive from capitation arrangements in the future. Under capitation arrangements, the payor pays a pre-determined amount per-patient per-month in exchange for us providing all necessary covered services to the patients covered under the arrangement. These contracts pass much of the financial risk of providing diagnostic imaging services, including the risk of over-use, from the payor to the provider. Our success depends in part on our ability to negotiate effectively, on behalf of the contracted radiology practices and our diagnostic imaging facilities, contracts with health maintenance organizations, employer groups and other third-party payors for services to be provided on a capitated basis and to efficiently manage the utilization of those services. If we are not successful in managing the utilization of services under these capitation arrangements or if patients or enrollees covered by these contracts require more frequent or extensive care than anticipated, we would incur unanticipated costs not offset by additional revenue, which would reduce operating margins.
We may be unable to effectively maintain our equipment or generate revenue when our equipment is not operational.
Timely, effective service is essential to maintaining our reputation and high use rates on our imaging equipment. Although we have an agreement with GE Medical Systems pursuant to which it maintains and repairs the majority of our imaging equipment, this agreement does not compensate us for loss of revenue when our systems are not fully operational and our business interruption insurance may not provide sufficient coverage for the loss of revenue. Also, GE Medical Systems may not be able to perform repairs or supply needed parts in a timely manner, which could result in a loss of revenue. Therefore, if we experience more equipment malfunctions than anticipated or if we are unable to promptly obtain the service necessary to keep our equipment functioning effectively, our ability to provide services would be adversely affected and our revenue could decline.
Disruption or malfunction in our information systems could adversely affect our business.
Our information technology system is vulnerable to damage or interruption from:
|
·
|
earthquakes, fires, floods and other natural disasters;
|
|
·
|
power losses, computer systems failures, internet and telecommunications or data network failures, operator negligence, improper operation by or supervision of employees, physical and electronic losses of data and similar events; and
|
30
|
·
|
computer viruses, penetration by hackers seeking to disrupt operations or misappropriate information and other breaches of security.
|
We rely on our information systems to perform functions critical to our ability to operate, including patient scheduling, billing, collections, image storage and image transmission. Accordingly, an extended interruption in the system’s function could significantly curtail, directly and indirectly, our ability to conduct our business and generate revenue.
We are vulnerable to earthquakes, harsh weather and other natural disasters.
Our corporate headquarters and 101 of our facilities are located in California, an area prone to earthquakes and other natural disasters. Three of our facilities are located in an area of Florida that has suffered from hurricanes. Some of our facilities have been affected by snow and other harsh weather conditions, particularly in February 2010, when winter snow storms in the mid-Atlantic region, including Maryland, Delaware and New Jersey, caused us to close many of our facilities for up to 5 business days. An earthquake, harsh weather conditions or other natural disaster could decrease scan volume during affected periods and seriously impair our operations. Damage to our equipment or interruption of our business would adversely affect our financial condition and results of operations.
Complying with federal and state regulations is an expensive and time-consuming process, and any failure to comply could result in substantial penalties.
We are directly or indirectly through the radiology practices with which we contract subject to extensive regulation by both the federal government and the state governments in which we provide services, including:
|
·
|
the federal False Claims Act;
|
|
·
|
the federal Medicare and Medicaid Anti-Kickback Laws, and state anti-kickback prohibitions;
|
|
·
|
federal and state billing and claims submission laws and regulations;
|
|
·
|
the federal Health Insurance Portability and Accountability Act of 1996, as amended by the Health Information Technology for Economic and Clinical Health Act of 2009, and comparable state laws;
|
|
·
|
the federal physician self-referral prohibition commonly known as the Stark Law and the state equivalent of the Stark Law;
|
|
·
|
state laws that prohibit the practice of medicine by non-physicians and prohibit fee-splitting arrangements involving physicians;
|
|
·
|
federal and state laws governing the diagnostic imaging and therapeutic equipment we use in our business concerning patient safety, equipment operating specifications and radiation exposure levels; and
|
|
·
|
state laws governing reimbursement for diagnostic services related to services compensable under workers compensation rules.
|
If our operations are found to be in violation of any of the laws and regulations to which we or the radiology practices with which we contract are subject, we may be subject to the applicable penalty associated with the violation, including civil and criminal penalties, damages, fines and the curtailment of our operations. Any penalties, damages, fines or curtailment of our operations, individually or in the aggregate, could adversely affect our ability to operate our business and our financial results. The risks of our being found in violation of these laws and regulations is increased by the fact that many of them have not been fully interpreted by the regulatory authorities or the courts, and their provisions are open to a variety of interpretations. Any action brought against us for violation of these laws or regulations, even if we successfully defend against it, could cause us to incur significant legal expenses and divert our management’s attention from the operation of our business.
If we fail to comply with various licensure, certification and accreditation standards, we may be subject to loss of licensure, certification or accreditation, which would adversely affect our operations.
31
Ownership, construction, operation, expansion and acquisition of our diagnostic imaging facilities are subject to various federal and state laws, regulations and approvals concerning licensing of personnel, other required certificates for certain types of healthcare facilities and certain medical equipment. In addition, freestanding diagnostic imaging facilities that provide services independent of a physician’s office must be enrolled by Medicare as an independent diagnostic treatment facility, or IDTF, to bill the Medicare program. Medicare carriers have discretion in applying the IDTF requirements and therefore the application of these requirements may vary from jurisdiction to jurisdiction. In addition, federal legislation requires all suppliers that provide the technical component of diagnostic MRI, PET/CT, CT, and nuclear medicine to be accredited by an accreditation organization designated by CMS (which currently include the American College of Radiology (ACR), the Intersocietal Accreditation Commission (IAC) and the Joint Commission) by January 1, 2012. Our MRI, CT, nuclear medicine, ultrasound and mammography facilities are currently accredited by the American College of Radiology. We may not be able to receive the required regulatory approvals or accreditation for any future acquisitions, expansions or replacements, and the failure to obtain these approvals could limit the opportunity to expand our services.
Our facilities are subject to periodic inspection by governmental and other authorities to assure continued compliance with the various standards necessary for licensure and certification. If any facility loses its certification under the Medicare program, then the facility will be ineligible to receive reimbursement from the Medicare and Medicaid programs. For the year ended December 31, 2010, approximately 23% of our net revenue came from the Medicare and Medicaid programs. A change in the applicable certification status of one of our facilities could adversely affect our other facilities and in turn us as a whole. We have experienced a slowdown in the credentialing of our physicians over the last several years which has lengthened our billing and collection cycle, and could negatively impact our ability to collect revenue from patients covered by Medicare. Credentialing of physicians is required by our payors prior to commencing payment.
Our agreements with the contracted radiology practices must be structured to avoid the corporate practice of medicine and fee-splitting .
State law prohibits us from exercising control over the medical judgments or decisions of physicians and from engaging in certain financial arrangements, such as splitting professional fees with physicians. These laws are enforced by state courts and regulatory authorities, each with broad discretion. A component of our business has been to enter into management agreements with radiology practices. We provide management, administrative, technical and other non-medical services to the radiology practices in exchange for a service fee typically based on a percentage of the practice’s revenue. We structure our relationships with the radiology practices, including the purchase of diagnostic imaging facilities, in a manner that we believe keeps us from engaging in the practice of medicine or exercising control over the medical judgments or decisions of the radiology practices or their physicians, or violating the prohibitions against fee-splitting. There can be no assurance that our present arrangements with BRMG or the physicians providing medical services and medical supervision at our imaging facilities will not be challenged, and, if challenged, that they will not be found to violate the corporate practice of medicine or fee splitting prohibitions, thus subjecting us to potential damages, injunction and/or civil and criminal penalties or require us to restructure our arrangements in a way that would affect the control or quality of our services and/or change the amounts we receive under our management agreements. Any of these results could jeopardize our business.
Newly enacted and future federal legislation could limit the prices we can charge for our services, which would reduce our revenue and adversely affect our operating results.
The PPACA and the Reconciliation Act introduced certain changes that may result in decreased revenue for the scans we perform. Among other things, the new legislation will adjust Medicare payment rates for physician imaging services in an attempt to better reflect actual usage, by revising upward the assumed usage rate for diagnostic imaging equipment costing more than $1 million. For certain diagnostic services performed on or after January 1, 2011, the legislation reduces the assumed usage rate for such equipment from CMS’s current rate of 90% to a rate of 75%, resulting in an increase in payment rates for such services. The new legislation also adjusts the technical component discount on single-session imaging studies on contiguous body parts from 25% to 50%. These latter changes will reduce payments for the applicable services and thus may result in a decrease in the associated revenues we receive. Other changes in reimbursement for services rendered by Medicare Advantage plans may reduce the revenues we receive for services rendered to Medicare Advantage enrollees.
Possible volatility in our stock price could negatively affect us and our stockholders.
The trading price of our common stock on the NASDAQ Global Market has fluctuated significantly in the past. During the period from January 1, 2008 through December 31, 2010, the trading price of our common stock fluctuated from a high of $4.04 per share to a low of $1.00 per share. In the past, we have experienced a drop in stock price following an announcement of disappointing earnings or earnings guidance. Any such announcement in the future could lead to a similar drop in stock price. The price of our common stock could also be subject to wide fluctuations in the future as a result of a number of other factors, including the following:
|
·
|
changes in expectations as to future financial performance or buy/sell recommendations of securities analysts;
|
32
|
·
|
our, or a competitor’s, announcement of new services, or significant acquisitions, strategic partnerships, joint ventures or capital commitments; and
|
|
·
|
the operating and stock price performance of other comparable companies.
|
In addition, the U.S. securities markets have experienced significant price and volume fluctuations. These fluctuations often have been unrelated to the operating performance of companies in these markets. Broad market and industry factors may lead to volatility in the price of our common stock, regardless of our operating performance. Moreover, our stock has limited trading volume, and this illiquidity may increase the volatility of our stock price.
In the past, following periods of volatility in the market price of an individual company’s securities, securities class action litigation often has been instituted against that company. The institution of similar litigation against us could result in substantial costs and a diversion of management’s attention and resources, which could negatively affect our business, results of operations or financial condition.
Provisions of the Delaware General Corporation Law and our organizational documents may discourage an acquisition of us.
In the future, we could become the subject of an unsolicited attempted takeover of our company. Although an unsolicited takeover could be in the best interests of our stockholders, our organizational documents and the General Corporation Law of the State of Delaware both contain provisions that will impede the removal of directors and may discourage a third-party from making a proposal to acquire us. For example, the provisions:
|
·
|
permit the board of directors to increase its own size, within the maximum limitations set forth in the bylaws, and fill the resulting vacancies;
|
|
·
|
authorize the issuance of additional shares of preferred stock in one or more series without a stockholder vote;
|
|
·
|
establish an advance notice procedure for stockholder proposals to be brought before an annual meeting of our stockholders, including proposed nominations of persons for election to the board of directors; and
|
|
·
|
prohibit transfers and/or acquisitions of stock that would result in any stockholder owning greater than 5% of the currently outstanding stock resulting in a limitation on net operating loss carryovers, capital loss carryovers, general business credit carryovers, alternative minimum tax credit carryovers and foreign tax credit carryovers, as well as any loss or deduction attributable to a "net unrealized built-in loss" within the meaning of Section 382 of the internal revenue code of 1986, as amended.
|
We are subject to Section 203 of the Delaware General Corporation Law, which could have the effect of delaying or preventing a change in control.
|
Item 1B.
|
Unresolved Staff Comments
|
None.
Our corporate headquarters is located in adjoining premises at 1508, 1510 and 1516 Cotner Avenue, Los Angeles, California 90025, in approximately 21,500 square feet occupied under leases, which expire (with options to extend) on June 30, 2017. In addition, we lease approximately 60,000 square feet of warehouse and other space under leases nationwide, which expire at various dates through August 2020. We also have a regional office of approximately 39,000 square feet in Baltimore, Maryland under a lease, which expires September 30, 2012. Our facility lease terms vary in length from month to month to 15 years with renewal options upon prior written notice, from 1 year to 10 years depending upon the agreed upon terms with the local landlord. Facility lease amounts generally increase from 1% to 6% on an annual basis. We do not have options to purchase the facilities we rent.
|
Item 3.
|
Legal Proceedings
|
We are engaged from time to time in the defense of lawsuits arising out of the ordinary course and conduct of our business. We believe that the outcome of our current litigation will not have a material adverse impact on our business, financial condition and results of operations. However, we could be subsequently named as a defendant in other lawsuits that could adversely affect us.
|
Item 4.
|
(
Removed and Reserved)
|
33
|
Item 5.
|
Market for the Registrant’s Common Equity, Related Stockholder Matters and Issuer Purchases of Equity Securities
|
Our common stock is quoted on the NASDAQ Global Market under the symbol “RDNT.” The following table indicates the high and low prices for our common stock for the periods indicated based upon information supplied by the NASDAQ Global Market.
|
Low
|
High
|
|||||||
|
Quarter Ended
|
||||||||
|
December 31, 2010
|
$
|
2.00
|
$
|
2.96
|
||||
|
September 30, 2010
|
1.83
|
2.58
|
||||||
|
June 30, 2010
|
2.37
|
4.04
|
||||||
|
March 31, 2010
|
2.04
|
3.18
|
||||||
|
December 31, 2009
|
$
|
1.90
|
$
|
3.39
|
||||
|
September 30, 2009
|
2.01
|
3.18
|
||||||
|
June 30, 2009
|
1.00
|
2.79
|
||||||
|
March 31, 2009
|
0.85
|
3.96
|
||||||
The last low and high prices for our common stock on the NASDAQ Global Market on March 7, 2011 were $3.47 and $3.54,
respectively. As of March 7, 2011, the number of holders of record of our common stock was 838. However, Cede & Co., the nominee for The Depository Trust Company, the clearing agency for most broker-dealers, owned a substantial number of our outstanding shares of common stock of record on that date. Our management believes that the number of beneficial owners of our common stock is approximately 4,000.
Stock Performance Graph
The following graph compares the yearly percentage change in cumulative total stockholder return of the Company’s Common Stock during the period from 2005 to 2010 with (i) the cumulative total return of the S&P500 index and (ii) the cumulative total return of the S&P500 – Healthcare Sector index. The comparison assumes $100 was invested in October 31, 2005 in the Common Stock and in each of the foregoing indices and the reinvestment of dividends through January 1, 2011. The stock price performance on the following graph is not necessarily indicative of future stock price performance.
This graph shall not be deemed incorporated by reference by any general statement incorporating by reference this Form 10-K into any filing under the Securities Act or under the Exchange Act, except to the extent that RadNet specifically incorporates this information by reference, and shall not otherwise be deemed filed under such Acts.
We did not pay dividends in fiscal 2009 or 2010 and we do not expect to pay any dividends in the foreseeable future.
34
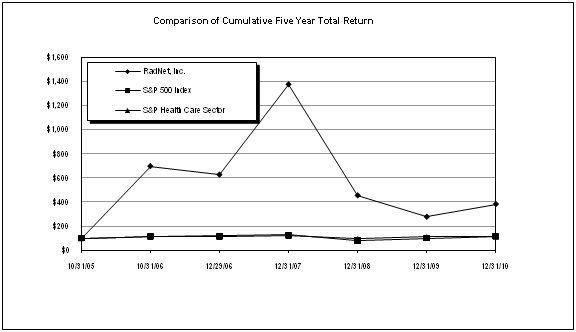
|
ANNUAL RETURN PERCENTAGE
Years Ending
|
|||||||
|
Company / Index
|
10/31/06
|
12/29/06
|
12/31/07
|
12/31/08
|
12/31/09
|
12/31/10
|
|
|
RadNet, Inc.
|
594.59
|
-10.12
|
119.70
|
-67.00
|
-39.10
|
38.24
|
|
|
S&P 500 Index
|
16.34
|
3.33
|
5.49
|
-37.00
|
26.46
|
15.06
|
|
|
S&P Health Care Sector
|
11.36
|
0.91
|
7.15
|
-22.81
|
19.70
|
2.90
|
|
|
INDEXED RETURNS
|
|||||||
|
Base
|
Years Ending
|
||||||
|
Period
|
|||||||
|
Company / Index
|
10/31/05
|
10/31/06
|
12/29/06
|
12/31/07
|
12/31/08
|
12/31/09
|
12/31/10
|
|
RadNet, Inc.
|
100
|
694.59
|
624.32
|
1371.62
|
452.70
|
275.68
|
381.08
|
|
S&P 500 Index
|
100
|
116.34
|
120.22
|
126.82
|
79.90
|
101.04
|
116.27
|
|
S&P Health Care Sector
|
100
|
111.36
|
112.38
|
120.41
|
92.95
|
111.26
|
114.48
|
Recent Sales of Unregistered Securities
During the fiscal year ended December 31, 2010, we sold the following securities pursuant to an exemption from registration provided under Section 4(2) of the Securities Act of 1933, as amended:
|
·
|
In January 2010, we issued 75,000 shares of our common stock, valued at approximately $153,000 on the date of acquisition, to an individual as part of the purchase price for acquisition of a group of imaging center in Union, New Jersey.
|
|
·
|
In April 2010, we issued 375,000 shares of our common stock, valued at approximately $1.2 million on the date of acquisition, to an individual as part of the purchase price for acquisition of a group of imaging center in Bakersfield, California.
|
35
|
Item 6.
|
Selected Consolidated Financial Data
|
The following table sets forth our selected historical consolidated financial data. The selected consolidated statements of operations data set forth below for the years ended December 31, 2010, 2009 and 2008, and the consolidated balance sheet data as of December 31, 2010 and 2009, are derived from our audited consolidated financial statements and notes thereto included elsewhere herein. The selected historical consolidated statements of operations data set forth below for the years ended December 31, 2007, October 31, 2006 and the two months ended December 31, 2006, and the consolidated balance sheet data set forth below as of December 31, 2008, 2007 and 2006, and October 31, 2006 are derived from our audited consolidated financial statements not included herein. This data should be read in conjunction with and is qualified in its entirety by reference to the audited consolidated financial statements and the related notes included elsewhere in this Form 10-K and Item 7 - “Management’s Discussion and Analysis of Financial Condition and Results of Operations.”
The financial data set forth below and discussed in this Annual Report are derived from the consolidated financial statements of RadNet, its subsidiaries and certain affiliates. As a result of the contractual and operational relationship among BRMG, Dr. Berger and us, we are considered to have a controlling financial interest in BRMG pursuant to applicable accounting guidance. Due to the deemed controlling financial interest, we are required to include BRMG as a consolidated entity in our consolidated financial statements. This means, for example, that revenue generated by BRMG from the provision of professional medical services to our patients, as well as BRMG’s costs of providing those services, are included as net revenue in our consolidated statement of operations, whereas the management fee that BRMG pays to us under our management agreement with BRMG is eliminated as a result of the consolidation of our results with those of BRMG. Also, because BRMG is a consolidated entity in our financial statements, any borrowings or advances we have received from or made to BRMG have been eliminated in our consolidated balance sheet. If BRMG were not treated as a consolidated entity in our consolidated financial statements, the presentation of certain items in our income statement, such as net revenue and costs and expenses, would change but our net income would not, because in operation and historically, the annual revenue of BRMG from all sources closely approximates its expenses, including Dr. Berger’s compensation, fees payable to us and amounts payable to third parties.
|
Years Ended
|
Two Months Ended
|
Years Ended
|
||||||||||||||||||||||||||
|
December 31,
|
December 31,
|
October 31,
|
||||||||||||||||||||||||||
|
2010
|
2009
|
2008
|
2007
|
2006
|
2006
|
2006
|
||||||||||||||||||||||
|
(unaudited)
|
||||||||||||||||||||||||||||
|
(dollars in thousands, except per share data)
|
||||||||||||||||||||||||||||
|
Statement of Operations Data:
|
||||||||||||||||||||||||||||
|
Net revenue
|
$ | 548,537 | $ | 524,368 | $ | 498,815 | $ | 423,576 | $ | 192,859 | $ | 57,374 | $ | 161,005 | ||||||||||||||
|
Operating expenses:
|
||||||||||||||||||||||||||||
|
Operating expenses
|
420,973 | 397,753 | 384,297 | 330,550 | 147,226 | 46,033 | 120,342 | |||||||||||||||||||||
|
Depreciation and amortization
|
53,997 | 53,800 | 53,548 | 45,281 | 19,542 | 5,907 | 16,394 | |||||||||||||||||||||
|
Provision for bad bebts
|
33,158 | 32,704 | 30,832 | 27,467 | 10,707 | 3,907 | 7,626 | |||||||||||||||||||||
|
Loss (gain) on disposal of equipment, net
|
1,136 | 523 | 516 | 72 | 335 | (38 | ) | 373 | ||||||||||||||||||||
|
Gain from sale of joint venture interests
|
- | - | - | (1,868 | ) | - | - | - | ||||||||||||||||||||
|
Gain on bargin purchase
|
- | (1,387 | ) | - | - | - | - | - | ||||||||||||||||||||
|
Loss on extinguishment of debt
|
9,871 | - | - | - | - | - | - | |||||||||||||||||||||
|
Net loss
|
(12,852 | ) | (2,267 | ) | (12,836 | ) | (18,131 | ) | (17,722 | ) | (10,983 | ) | (6,894 | ) | ||||||||||||||
|
Basic and diluted loss per share
|
(0.35 | ) | (0.06 | ) | (0.36 | ) | (0.52 | ) | (0.57 | ) | (0.35 | ) | (0.33 | ) | ||||||||||||||
|
Balance Sheet Data:
|
||||||||||||||||||||||||||||
|
Cash and cash equivalents
|
$ | 627 | $ | 10,094 | $ | - | $ | 18 | $ | 3,221 | $ | 3,221 | $ | 2 | ||||||||||||||
|
Total assets
|
539,514 | 480,671 | 495,572 | 433,620 | 394,766 | 394,766 | 131,636 | |||||||||||||||||||||
|
Total long-term liabilities
|
516,723 | 456,727 | 469,994 | 428,743 | 381,903 | 381,903 | 179,288 | |||||||||||||||||||||
|
Total liabilities
|
621,987 | 555,432 | 576,602 | 503,244 | 440,508 | 440,508 | 210,430 | |||||||||||||||||||||
|
Working capital (deficit)
|
5,761 | 9,204 | 2,720 | 23,180 | 31,230 | 31,230 | 2,896 | |||||||||||||||||||||
|
Stockholders' deficit
|
(82,473 | ) | (74,761 | ) | (81,030 | ) | (69,830 | ) | (46,996 | ) | (46,996 | ) | (78,794 | ) | ||||||||||||||
36
|
Item 7
.
|
Management’s Discussion and Analysis of Financial Condition and Results of Operations
|
Overview
Business Overview
With 201 centers, as of December 31, 2010, located in California, Delaware, Maryland, New Jersey, Florida, and New York, we are the leading national provider of freestanding, fixed-site outpatient diagnostic imaging services in the United States based on number of locations and annual imaging revenue. Our centers provide physicians with imaging capabilities to facilitate the diagnosis and treatment of diseases and disorders and may reduce unnecessary invasive procedures, often minimizing the cost and amount of care for patients. Our services include magnetic resonance imaging (MRI), computed tomography (CT), positron emission tomography (PET), nuclear medicine, mammography, ultrasound, diagnostic radiology (X-ray), fluoroscopy and other related procedures. The vast majority of our centers offer multi-modality imaging services, a key point of differentiation from our competitors. Our multi-modality strategy diversifies revenue streams, reduces exposure to reimbursement changes and provides patients and referring physicians one location to serve the needs of multiple procedures.
We seek to develop leading positions in regional markets in order to leverage operational efficiencies. Our scale and density within selected geographies provides close, long-term relationships with key payors, radiology groups and referring physicians. Each of our facility managers is responsible for managing relationships with local physicians and payors, meeting our standards of patient service and maintaining profitability. We provide corporate training programs, standardized policies and procedures and sharing of best practices among the physicians in our regional networks.
We derive substantially all of our revenue, directly or indirectly, from fees charged for the diagnostic imaging services performed at our facilities. For the year ended December 31, 2010, we performed 3,315,019 diagnostic imaging procedures and generated net revenue from continuing operations of $548.5 million. Additional information concerning RadNet, Inc., including our consolidated subsidiaries, for each of the years ended December 31, 2010, 2009 and 2008, is included in the consolidated financial statements and notes thereto in this Annual Report.
Our revenue is derived from a diverse mix of payors, including private payors, managed care capitated payors and government payors. We believe our payor diversity mitigates our exposure to possible unfavorable reimbursement trends within any one-payor class. In addition, our experience with capitation arrangements over the last several years has provided us with the expertise to manage utilization and pricing effectively, resulting in a predictable stream of revenue. As of December 31, 2010, we received approximately 56% of our payments from commercial insurance payors, 15% from managed care capitated payors, 20% from Medicare and 3% from Medicaid. With the exception of Blue Cross/Blue Shield and government payors, no single payor accounted for more than 5% of our net revenue for the twelve months ended December 31, 2010.
As of December 31, 2010, we had in operation 151 MRI systems, 83 CT systems, 32 PET or combination PET/CT systems, 41 nuclear medicine systems, 168 x-ray systems, 135 mammography systems, 283 ultrasound systems, and 99 fluoroscopy systems.
On November 15, 2006, we completed the acquisition of Radiologix, Inc. Radiologix, a Delaware corporation, then employing approximately 2,200 people, through its subsidiaries, was a national provider of diagnostic imaging services through the ownership and operation of freestanding, outpatient diagnostic imaging centers. Radiologix owned, operated and maintained equipment in 69 locations, with imaging centers in seven states, including primary operations in the Mid-Atlantic; the Bay-Area, California; the Treasure Coast area, Florida; Northeast Kansas; and the Finger Lakes (Rochester) and Hudson Valley areas of New York State.
Since that time we have continued to develop our medical imaging business through a combination of organic growth and acquisitions. For a discussion of acquisitions and dispositions of facilities, see “Management’s Discussion and Analysis and Results of Operations—Facility Acquisitions” below.
The consolidated financial statements include the accounts of Radnet Management and BRMG. The consolidated financial statements also include Radnet Management I, Inc., Radnet Management II, Inc., Radiologix, Inc., Radnet Management Imaging Services, Inc., Delaware Imaging Partners, Inc., New Jersey Imaging Partners, Inc. and Diagnostic Imaging Services, Inc. (DIS), all wholly owned subsidiaries of Radnet Management. All of these affiliated entities are referred to collectively as “RadNet”, “we”, “us,” “our” or the “Company” in this report.
37
Accounting Standards Codification Section 810-10-15-14 stipulates that generally any entity with a) insufficient equity to finance its activities without additional subordinated financial support provided by any parties, or b) equity holders that, as a group, lack the characteristics specified in the Codification which evidence a controlling financial interest, is considered a Variable Interest Entity (“VIE”). We consolidate all voting interest entities in which we own a majority voting interest and all VIEs for which we are the primary beneficiary. We determine whether we are the primary beneficiary of a VIE through a qualitative analysis that identifies which variable interest holder has the controlling financial interest in the VIE. The variable interest holder who has both of the following has the controlling financial interest and is the primary beneficiary: (1) the power to direct the activities of the VIE that most significantly impact the VIE’s economic performance and (2) the obligation to absorb losses of, or the right to receive benefits from, the VIE that could potentially be significant to the VIE. In performing our analysis, we consider all relevant facts and circumstances, including: the design and activities of the VIE, the terms of the contracts the VIE has entered into, the nature of the VIE’s variable interests issued and how they were negotiated with or marketed to potential investors, and which parties participated significantly in the design or redesign of the entity.
Recent Developments
On October 1, 2010, we completed our acquisition of Image Medical Corporation, the parent of eRAD, Inc. (see Note 3 to the consolidated financial statements to this Form 10-K). eRAD, Inc., headquartered in Greenville, South Carolina, has been a premier provider of Picture Archiving and Communications Systems (PACS) and related workflow solutions to the radiology industry since 1999. Over 250 hospitals, teleradiology businesses, imaging centers and specialty physician groups use eRAD’s technology to distribute, visualize, store and retrieve digital images taken from all diagnostic imaging modalities. eRAD has approximately 30 employees, including a Research and Development team of 11 software engineers in Budapest, Hungary.
In addition, we have assembled an industry leading team of software developers, based out of Prince Edward Island, Canada, to create radiology workflow solutions known as Radiology Information Systems (“RIS”) focused exclusively on RadNet’s internal use. All members of this Canadian based team have significant software development expertise in radiology, and together with eRAD and its PACS technology, will create fully integrated solutions to manage all aspects of RadNet’s internal information needs. eRAD and the newly hired software development team form a Radiology Information Technology division of RadNet.
On January 3, 2011, we consummated the acquisition of Imaging On Call, LLC, a provider of teleradiology services to radiology groups, hospitals and imaging centers located in Poughkeepsie, New York, for $5.5 million cash plus an earn-out of up to an additional $2.5 million.
On February 14, 2011, we completed an exchange offer where by all of our senior unsecured notes were exchanged for registered publicly tradable notes.
On March 7, 2011, we executed a definitive agreement to acquire five multi-modality imaging centers in Maryland from Diagnostic Health Corporation. We will pay approximately $7.1 million, in a combination of cash and the assumption of certain capital lease liabilities. The facilities located in Bowie, Chevy Chase, Frederick, Rockville and Waldorf operate a combination of MRI, CT, ultrasound, mammography, x-ray and other related modalities.
Industry Trends
Prior to 2007, for services for which we bill Medicare directly, we were paid under the Medicare Physician Fee Schedule, which is updated on an annual basis. Under the Medicare statutory formula, payments under the Physician Fee Schedule would have decreased for the past several years if Congress failed to intervene. For example, for 2008, the fee schedule rates were to be reduced by approximately 10.1%. The Medicare, Medicaid and SCHIP Extension Act of 2007 eliminated the 10.1% reduction for 2008 and increased the annual payment rate update by 0.5%. This increase to the annual Medicare Physician Fee Schedule payment update was effective only for Medicare claims with dates of service between January 1, 2008 and June 30, 2008. Beginning July 1, 2008, under MIPPA, the 0.5% increase was continued for the rest of 2008. In addition, MIPPA established a 1.1% increase to the Medicare Physician Fee Schedule payment update for 2009.
For 2010, CMS projected a rate reduction of 21.2%
in the absence of Congressional intervention. However, over the course of the first six months of 2010, various temporary solutions were enacted by Congress which resulted in delaying any such change to the physician fee schedule. Ultimately, a 2.2% increase in the conversion factor was passed by Congress effective June 1, 2010, further delaying the pending 21.2% conversion factor reduction to November 30, 2010. On November 29, 2010, the calendar year 2011 physician fee schedule final rule with comment period was published in the Federal Register. The rule updates payment policies and Medicare payment rates under the Medicare physician fee schedule for physicians’ services and would have significantly reduced physician fee schedule payments in 2011 had Congress not acted by passing the Physician Payment and Therapy Relief Act of 2010 and the Medicare and Medicaid Extenders Act of 2010, which together continue the 2.2% update from June 2010 through December 31, 2011. While Congress has historically provided temporary relief from the formula-driven reductions in the conversion factor, it cannot be guaranteed that Congress will act to provide relief in the future. The failure of Congress to act could adversely impact our revenues and results of operation.
MIPPA also modified the methodology by which the budget neutrality formula was applied to the 2009 physician fee schedule payment rates, resulting in an overall reduction in payment rates for services performed by many specialties, including an estimated 1% reduction for nuclear medicine. The impact of the payment rates on specific companies depends on their service mix. Also with respect to MIPPA, the legislation requires all suppliers that provide the technical component of diagnostic MRI, PET/CT, CT, and nuclear medicine to be accredited by an accreditation organization designated by CMS (which currently include the ACR, the IAC and The Joint Commission) by January 1, 2012. Our MRI, CT, nuclear medicine, ultrasound and mammography facilities are currently accredited by the ACR.
38
A number of other legislative changes impact our retail business. For example, beginning on January 1, 2007, the DRA imposed caps on Medicare payment rates for certain imaging services furnished in physician’s offices and other non-hospital based settings. Under the cap, payments for specified imaging services cannot exceed the hospital outpatient payment rates for those services. The limitation is applicable to the technical components of the diagnostic imaging services only, which is the payment we receive for the services for which we bill directly under the Medicare Physician Fee Schedule. CMS issues on an annual basis the hospital outpatient prospective payment rates, which are used to develop the caps. If the technical component of the service established under the Physician Fee Schedule (without including geographic adjustments) exceeds the hospital outpatient payment amount for the service (also without including geographic adjustments), then the payment is to be reduced. In other words, in those instances where the technical component for the particular service is greater for the non-hospital site, the DRA directs that the hospital outpatient payment rate be substituted for the otherwise applicable Physician Fee Schedule payment rate.
The DRA also codified the reduction in reimbursement for multiple images on contiguous body parts, which was previously announced by CMS. The DRA mandated payment at 100% of the technical component of the higher priced imaging procedure and 50% for the technical component of each additional imaging procedure for multiple images of contiguous body parts within a family of codes performed in the same session. Initially, CMS announced that it would phase in this reimbursement reduction over a two-year period, to include a 25% reduction for each additional imaging procedure on contiguous body parts in 2006 and an additional 25% reduction in 2007. CMS did not implement the additional 25% reduction scheduled for 2007, but for services furnished on or after July 1, 2010, PPACA requires the full 50% reduction to be implemented.
Regulatory updates to payment rates for which we bill the Medicare program directly are published annually by CMS. For payments under the Physician Fee Schedule for calendar year 2010, CMS changed the way it calculates components of the Medicare Physician Fee Schedule. First, CMS reduced payment rates for certain diagnostic services using equipment costing more than $1 million through revisions to usage assumptions from the current 50% usage rate to a 90% usage rate. This change applied to MRI and CT scans. However, for certain diagnostic services performed on or after January 1, 2011, the Reconciliation Act reduces the assumed usage rate for such equipment from CMS’s current rate of 90% to a rate of 75%, resulting in an increase in payment rates for such services.
Recent global market and economic conditions have been unprecedented. Concerns about the potential long-term and widespread recession, inflation, energy costs, geopolitical issues, the availability and cost of credit, the United States mortgage market and a declining real estate market in the United States have contributed to increased market volatility and diminished expectations for the United States economy. These conditions, combined with declining business and consumer confidence and increased unemployment, have contributed to unusual volatility. At this time, it is unclear what impact this might have on our future revenues or business.
As a result of these market conditions, the cost and availability of credit has been and may continue to be adversely affected by illiquid credit markets and wider credit spreads. Concern about the stability of the markets generally and the strength of counterparties specifically has led many lenders and institutional investors to reduce, and in some cases, cease to provide funding to borrowers. If market conditions continue, they may limit our ability to timely access the capital markets to meet liquidity needs, resulting in adverse effects on our financial condition and results of operations.
39
Results of Operations
The following table sets forth, for the periods indicated, the percentage that certain items in the statements of operations bears to net revenue.
RADNET, INC. AND SUBSIDIARIES
CONSOLIDATED STATEMENTS OF OPERATIONS
|
Years Ended December 31,
|
||||||||||||
|
2010
|
2009
|
2008
|
||||||||||
|
NET REVENUE
|
100.0% | 100.0% | 100.0% | |||||||||
|
OPERATING EXPENSES
|
||||||||||||
|
Cost of operations
|
76.7% | 75.9% | 77.0% | |||||||||
|
Depreciation and amortization
|
9.8% | 10.3% | 10.7% | |||||||||
|
Provision for bad debts
|
6.0% | 6.2% | 6.2% | |||||||||
|
Loss on sale of equipment
|
0.2% | 0.1% | 0.1% | |||||||||
|
Severance costs
|
0.2% | 0.1% | 0.1% | |||||||||
|
Total operating expenses
|
93.0% | 92.6% | 94.1% | |||||||||
|
INCOME FROM OPERATIONS
|
7.0% | 7.4% | 5.9% | |||||||||
|
OTHER EXPENSES (INCOME)
|
||||||||||||
|
Interest expense
|
8.8% | 9.5% | 10.4% | |||||||||
|
Gain on bargain purchase
|
0.0% | -0.3% | 0.0% | |||||||||
|
Loss on extinguishment of debt
|
1.8% | 0.0% | 0.0% | |||||||||
|
Other expenses (income)
|
0.1% | 0.1% | 0.0% | |||||||||
|
Total other expenses
|
10.7% | 9.4% | 10.4% | |||||||||
|
LOSS BEFORE INCOME TAXES AND EQUITY
|
||||||||||||
|
IN EARNINGS OF JOINT VENTURES
|
-3.7% | -1.9% | -4.5% | |||||||||
|
Provision for income taxes
|
-0.1% | -0.1% | 0.0% | |||||||||
|
Equity in earnings of joint ventures
|
1.5% | 1.6% | 2.0% | |||||||||
|
NET LOSS
|
-2.3% | -0.4% | -2.6% | |||||||||
|
Net income attributable to noncontrolling interests
|
0.0% | 0.0% | 0.0% | |||||||||
|
NET LOSS ATTRIBUTABLE TO RADNET, INC.
|
||||||||||||
|
COMMON STOCKHOLDERS
|
-2.3% | -0.4% | % | -2.6% | ||||||||
40
Year Ended December 31, 2010 Compared to the Year Ended December 31, 2009
Net Revenue
Net revenue for the year ended December 31, 2010 was $548.5 million compared to $524.4 million for the year ended December 31, 2009, an increase of $24.2 million, or 4.6%.
Net revenue, including only those centers which were in operation throughout the full fiscal years of both 2010 and 2009, decreased $16.2 million, or 3.2%. This 3.2% decrease is primarily the result of a decline in patient scheduling during the first half of 2010, much of which was due to unusually severe weather conditions on the east coast during the first quarter of 2010
.
The decline also was the result of lower frequency of office visits to primary care and specialist physicians, our referral sources, in 2010 as a result of a broad based economic slowdown. This comparison excludes revenue contributions from centers that were acquired subsequent to January 1, 2009. For the year ended December 31, 2010, net revenue from centers that were acquired subsequent to January 1, 2009 and excluded from the above comparison was $51.3 million. For the year ended December 31, 2009, net revenue from centers that were acquired subsequent to January 1, 2009 and excluded from the above comparison was $10.9 million.
Operating Expenses
Cost of operations for the year ended December 31, 2010 increased approximately $23.2 million, or 5.8%, from $397.8 million for the year ended December 31, 2009 to $421.0 million for the year ended December 31, 2010. The following table sets forth our operating expenses for the years ended December 31, 2010 and 2009 (in thousands):
|
Years Ended December 31,
|
||||||||
|
2010
|
2009
|
|||||||
|
Salaries and professional reading fees, excluding stock-based compensation
|
$ | 231,922 | $ | 215,095 | ||||
|
Stock-based compensation
|
3,718 | 3,607 | ||||||
|
Building and equipment rental
|
47,938 | 43,346 | ||||||
|
Medical supplies
|
30,413 | 32,507 | ||||||
|
Other operating expenses
*
|
106,982 | 103,198 | ||||||
|
Cost of operations
|
420,973 | 397,753 | ||||||
|
Depreciation and amortization
|
53,997 | 53,800 | ||||||
|
Provision for bad debts
|
33,158 | 32,704 | ||||||
|
Loss on sale of equipment
|
1,136 | 523 | ||||||
|
Severance costs
|
838 | 731 | ||||||
|
Total operating expenses
|
$ | 510,102 | $ | 485,511 | ||||
|
·
|
Salaries and professional reading fees, excluding stock-based compensation and severance
|
Salaries and professional reading fees increased $16.8 million, or 7.8%, to $231.9 million for the year ended December 31, 2010, compared to $215.1 million for the year ended December 31, 2009.
Salaries and professional reading fees, including only those centers which were in operation throughout the full fiscal years of both 2010 and 2009, decreased $2.2 million, or 1.0%. This 1.0% decrease is primarily due to cost cutting measures implemented in the third quarter of 2008 and continued throughout 2009. This comparison excludes contributions from centers that were acquired subsequent to January 1, 2009. For the year ended December 31, 2010, salaries and professional reading fees from centers that were acquired subsequent to January 1, 2009 and excluded from the above comparison was $22.8 million. For the year ended December 31, 2009, salaries and professional reading fees from centers that were acquired subsequent to January 1, 2009, and excluded from the above comparison was $3.8 million.
41
|
·
|
Stock-based compensation
|
Stock-based compensation increased $111,000, or 3.1%, to $3.7 million for the year ended December 31, 2010 compared to $3.6 million for the year ended December 31, 2009. The increase is primarily due to additional options granted during 2010.
|
·
|
Building and equipment rental
|
Building and equipment rental expenses increased $4.6 million, or 10.6%, to $47.9 million for the year ended December 31, 2010, compared to $43.3 million for the year ended December 31, 2009.
Building and equipment rental expenses, including only those centers which were in operation throughout the full fiscal years of both 2010 and 2009, increased $450,000, or 1.0%. This 1.0% increase is primarily due to the acquisition, through operating lease contracts, of additional imaging equipment at certain existing imaging centers during 2010. This comparison excludes contributions from centers that were acquired subsequent to January 1, 2009. For the year ended December 31, 2010, building and equipment rental expenses from centers that were acquired subsequent to January 1, 2009, and excluded from the above comparison, was $5.9 million. For the year ended December 31, 2009, building and equipment rental expenses from centers that were acquired subsequent to January 1, 2009, and excluded from the above comparison, was $1.7 million.
|
·
|
Medical supplies
|
Medical supplies expense decreased $2.1 million, or 6.4%, to $30.4 million for the year ended December 31, 2010, compared to $32.5 million for the year ended December 31, 2009.
Medical supplies expenses, including only those centers which were in operation throughout the full fiscal years of both 2010 and 2009, decreased $3.8 million, or 11.8%. This 11.8% decrease is primarily due to a change in vendors supplying certain drugs used in operating our Breastlink centers as well as obtaining certain rebates during 2010. This comparison excludes contributions from centers that were acquired or divested subsequent to January 1, 2009. For the year ended December 31, 2010, medical supplies expense from centers that were acquired subsequent to January 1, 2009, and excluded from the above comparison was $2.0 million. For the year ended December 31, 2009, medical supplies expense from centers that were acquired subsequent to January 1, 2009, and excluded from the above comparison was $315,000.
|
·
|
Depreciation and amortization expense
|
Depreciation and amortization expense increased $197,000, or 0.4%, to $54.0 million for the year ended December 31, 2010 when compared to the same period last year. The increase is due in part to increases to amortization expense related to certain intangible assets acquired from eRAD.
|
·
|
Provision for bad debts
|
Provision for bad debts increased $197,000, or 1.4%, to $33.2 million, or 6.0% of net revenue, for the year ended December 31, 2010 compared to $32.7 million, or 6.2% of net revenue, for the year ended December 31, 2009. This increase is in line with the increase in net revenues.
|
·
|
Loss on sale of equipment
|
Loss on sale of equipment was $1.1 million and $523,000 for the years ended December 31, 2010 and 2009, respectively. In both years, this loss resulted from the sale of imaging equipment for scrap value upon acquisition of upgraded equipment.
|
·
|
Severance costs
|
During the year ended December 31, 2010, we recorded severance costs of $838,000 compared to $731,000 recorded during the year ended December 31, 2009. In each period, these costs were primarily associated with the integration of acquired operations.
42
Interest expense
Interest expense for the year ended December 31, 2010 decreased approximately $1.6 million, or 3.2%, to $48.4 million for the year ended December 31, 2010 compared to $50.0 million for the year ended December 31, 2009. Interest expense for the year ended December 31, 2010 included $917,000 of amortization of Accumulated Other Comprehensive Loss associated with fair value adjustments to our interest rate swaps accumulated prior to April 6, 2010, the date of our debt refinancing. See “Liquidity and Capital Resources” below for more details on our debt refinancing. Interest expense for the year ended December 31, 2009 included $6.1 million of amortization of Accumulated Other Comprehensive Loss associated with fair value adjustments accumulated prior to our January 28, 2009 modification of interest rate swaps. Excluding these adjustments to interest expense related to our interest rate swaps in both periods, interest expense increased $3.6 million. This increase was primarily due to interest expense on the additional borrowings under the debt refinancing completed April 6, 2010.
Loss on extinguishment of debt
For the year ended December 31, 2010, we recorded a $9.9 million loss on extinguishment of debt related to our debt refinancing completed on April 6, 2010. This loss included a $7.6 million write-off of deferred loan costs associated with our GE debt settled on April 6, 2010 as well as approximately $2.3 million to settle a call premium associated with our prior credit facilities and for interest rate swap related expenses.
Gain on bargain purchase
On June 12, 2009, we acquired the assets and business of nine imaging centers located in New Jersey from Medical Resources, Inc. for approximately $2.1 million. At the time of the acquisition, we immediately sold the assets and business of one of those nine centers to an unrelated third party for approximately $650,000.
In accordance with accounting standards, any excess of fair value of acquired net assets over the acquisition consideration results in a gain on bargain purchase. Prior to recording a gain, the acquiring entity must reassess whether all acquired assets and assumed liabilities have been identified and recognized and perform re-measurements to verify that the consideration paid, assets acquired, and liabilities assumed have been properly valued. The Company underwent such a reassessment, and as a result, has recorded a gain on bargain purchase of approximately $1.4 million.
We believe that the gain on bargain purchase resulted from various factors that impacted the sale of those New Jersey assets. The seller was performing a full liquidation of its assets for the benefit of its creditors. Upon liquidation of all of its assets, the seller intended to close its business. The New Jersey assets were the only remaining assets to be sold before a full wind-down of the seller’s business could be completed. We believe that the seller was willing to accept a bargain purchase price from us in return for our ability to act more quickly and with greater certainty than any other prospective acquirer. The decline in the credit markets made it difficult for other acquirers who relied upon third party financing to complete the transaction. The relatively small size of the transaction for us, the lack of required third-party financing and our expertise in completing similar transactions in the past gave the seller confidence that we could complete the transaction expeditiously and without difficulty.
Other expenses
For the year ended December 31, 2010, we recorded $132,000 of other expense related to fair value adjustments on our interest rate swaps as well as $373,000 of other expense related to litigation. For the year ended December 31, 2009, we recorded $823,000 of other income related to fair value adjustments on our interest rate swaps, offset by $1.2 million of other expense primarily related to litigation.
Income tax expense
For the year ended December 31, 2010 and 2009, we recorded $576,000 and $443,000, respectively, for state income tax expense primarily related to taxable income generated in the states of Maryland and Delaware.
Equity in earnings from unconsolidated joint ventures
Equity in earnings from our unconsolidated joint ventures decreased $226,000, or 2.7% to $8.2 million for the year ended December 31, 2010 compared to $8.4 million for the year ended December 31, 2009
.
The 2.7% decrease is primarily due to an adjustment in collection rates during 2010, offset in part by the fact that a charge to net revenue was taken during the third quarter of 2009 related to valuation adjustments of accounts receivable at September 30, 2009.
43
Year Ended December 31, 2009 Compared to the Year Ended December 31, 2008
Net Revenue
Net revenue for the year ended December 31, 2009 was $524.4 million compared to $498.8 million for the year ended December 31, 2008, an increase of $25.6 million, or 5.1%.
Net revenue, including only those centers which were in operation throughout the full fiscal years of both 2009 and 2008, increased $8.1 million, or 1.8%. This 1.8% increase is mainly due to an increase in procedure volumes. This comparison excludes revenue contributions from centers that were acquired or divested subsequent to January 1, 2008. For the year ended December 31, 2009, net revenue from centers that were acquired subsequent to January 1, 2008 and excluded from the above comparison was $71.0 million. For the year ended December 31, 2008, net revenue from centers that were acquired subsequent to January 1, 2008 and excluded from the above comparison was $47.7 million. Also excluded was $5.8 million from centers that were divested subsequent to January 1, 2008.
Operating Expenses
Cost of operations for the year ended December 31, 2009 increased approximately $13.5 million, or 3.5%, from $384.3 million for the year ended December 31, 2008 to $397.8 million for the year ended December 31, 2009. The following table sets forth our operating expenses for the years ended December 31, 2009 and 2008 (in thousands):
|
Years Ended December 31,
|
||||||||
|
2009
|
2008
|
|||||||
|
Salaries and professional reading fees, excluding stock-based compensation
|
$
|
215,095
|
$
|
210,450
|
||||
|
Stock-based compensation
|
3,607
|
2,902
|
||||||
|
Building and equipment rental
|
43,346
|
43,478
|
||||||
|
Medical supplies
|
32,507
|
29,848
|
||||||
|
Other operating expenses
*
|
103,198
|
97,619
|
||||||
|
Cost of operations
|
397,753
|
384,297
|
||||||
|
Depreciation and amortization
|
53,800
|
53,548
|
||||||
|
Provision for bad debts
|
32,704
|
30,832
|
||||||
|
Loss on sale of equipment, net
|
523
|
516
|
||||||
|
Severance costs
|
731
|
335
|
||||||
|
Total operating expenses
|
$
|
485,511
|
$
|
469,528
|
||||
* Includes billing fees, office supplies, repairs and maintenance, insurance, business tax and license, outside services, utilities, marketing, travel and other expenses.
|
·
|
Salaries and professional reading fees, excluding stock-based compensation and severance
|
Salaries and professional reading fees increased $4.6 million, or 2.2%, to $215.1 million for the year ended December 31, 2009, compared to $210.5 million for the year ended December 31, 2008.
Salaries and professional reading fees, including only those centers which were in operation throughout the full fiscal years of both 2009 and 2008, decreased $1.9 million, or 1.0%. This 1.0% decrease is primarily due to cost cutting measures implemented in the third quarter of 2008. This comparison excludes contributions from centers that were acquired or divested subsequent to January 1, 2008. For the year ended December 31, 2009, salaries and professional reading fees from centers that were acquired subsequent to January 1, 2008 and excluded from the above comparison was $26.6 million. For the year ended December 31, 2008, salaries and professional reading fees from centers that were acquired subsequent to January 1, 2008, and excluded from the above comparison was $17.1 million. Also excluded was $3.0 million from centers that were divested subsequent to January 1, 2008.
44
|
·
|
Stock-based compensation
|
Stock-based compensation increased $705,000, or 24.3%, to $3.6 million for the year ended December 31, 2009 compared to $2.9 million for the year ended December 31, 2008. The increase is primarily due to additional options granted during the first half of 2009, some of which were fully vested on the date of grant.
|
·
|
Building and equipment rental
|
Building and equipment rental expenses decreased $132,000, or 0.3%, to $43.4 million for the year ended December 31, 2009, compared to $43.5 million for the year ended December 31, 2008.
Building and equipment rental expenses, including only those centers which were in operation throughout the full fiscal years of both 2009 and 2008, decreased $2.4 million, or 6.1%. This 6.1% decrease is primarily due to the conversion of certain equipment lease contracts from operating to capital leases in the first quarter of 2009. This comparison excludes contributions from centers that were acquired or divested subsequent to January 1, 2008. For the year ended December 31, 2009, building and equipment rental expenses from centers that were acquired subsequent to January 1, 2008, and excluded from the above comparison, was $6.2 million. For the year ended December 31, 2008, building and equipment rental expenses from centers that were acquired subsequent to January 1, 2008, and excluded from the above comparison, was $3.6 million. Also excluded was $328,000 from centers that were divested subsequent to January 1, 2008.
|
·
|
Medical supplies
|
Medical supplies expense increased $2.7 million, or 8.9%, to $32.5 million for the year ended December 31, 2009, compared to $29.8 million for the year ended December 31, 2008.
Medical supplies expenses, including only those centers which were in operation throughout the full fiscal years of both 2009 and 2008, increased $1.3 million, or 6.4%. This 6.4% increase is in line with procedure volumes and net revenues generated at these existing centers. This comparison excludes contributions from centers that were acquired or divested subsequent to January 1, 2008. For the year ended December 31, 2009, medical supplies expense from centers that were acquired subsequent to January 1, 2008, and excluded from the above comparison was $11.5 million. For the year ended December 31, 2008, medical supplies expense from centers that were acquired subsequent to January 1, 2008, and excluded from the above comparison was $9.6 million. Also excluded from the above comparison was $500,000 from centers that were divested subsequent to January 1, 2008.
|
·
|
Depreciation and amortization expense
|
Depreciation and amortization expense increased $252,000, or 0.4%, to $53.8 million for the year ended December 31, 2009 when compared to the same period last year. The increase is due in part to increases to depreciation expense on new imaging equipment offset by the completion of amortization schedules related to covenant-not-to-compete contracts in early 2009.
|
·
|
Provision for bad debts
|
Provision for bad debts increased $1.9 million, or 6.0%, to $32.7 million, or 6.2% of net revenue, for the year ended December 31, 2009 compared to $30.8 million, or 6.2% of net revenue, for the year ended December 31, 2008. This increase is in line with the increase in net revenues.
|
·
|
Loss on sale of equipment
|
Loss on sale of equipment was $523,000 and $516,000 for the years ended December 31, 2009 and 2008, respectively. In both years, this loss resulted from the sale of imaging equipment for scrap value upon acquisition of upgraded equipment.
|
·
|
Severance costs
|
During the year ended December 31, 2009, we recorded severance costs of $731,000 compared to $335,000 recorded during the year ended December 31, 2008. In each period, these costs were primarily associated with the integration of Radiologix and other acquired operations.
45
Interest expense
Interest expense for the year ended December 31, 2009 was $50.0 million compared to $51.8 million for the year ended December 31, 2008. The interest expense for the year ended December 31, 2009 includes $6.1 million of amortization associated with a swap agreement that expired in April 2009 and the modification of two interest rate swaps designated as cash flow hedges (see Liquidity and Capital Resources below) and amortization of deferred loan costs of $2.7 million. Excluding the $6.1 million amortization, interest expense for the year ended December 31, 2009 decreased by $7.8 million when compared to the prior year. This decrease is primarily due to a $9.7 million decrease in interest expense on our senior debt, partially offset by a $1.6 million increase in interest expense on our interest rate swaps for the year ended December 31, 2009 as compared to the prior year.
Gain on bargain purchase
On June 12, 2009, we acquired the assets and business of nine imaging centers located in New Jersey from Medical Resources, Inc. for approximately $2.1 million. At the time of the acquisition, we immediately sold the assets and business of one of those nine centers to an unrelated third party for approximately $650,000.
In accordance with accounting standards, any excess of fair value of acquired net assets over the acquisition consideration results in a gain on bargain purchase. Prior to recording a gain, the acquiring entity must reassess whether all acquired assets and assumed liabilities have been identified and recognized and perform re-measurements to verify that the consideration paid, assets acquired, and liabilities assumed have been properly valued. The Company underwent such a reassessment, and as a result, has recorded a gain on bargain purchase of approximately $1.4 million.
We believe that the gain on bargain purchase resulted from various factors that impacted the sale of those New Jersey assets. The seller was performing a full liquidation of its assets for the benefit of its creditors. Upon liquidation of all of its assets, the seller intended to close its business. The New Jersey assets were the only remaining assets to be sold before a full wind-down of the seller’s business could be completed. We believe that the seller was willing to accept a bargain purchase price from us in return for our ability to act more quickly and with greater certainty than any other prospective acquirer. The decline in the credit markets made it difficult for other acquirers who relied upon third party financing to complete the transaction. The relatively small size of the transaction for us, the lack of required third-party financing and our expertise in completing similar transactions in the past gave the seller confidence that we could complete the transaction expeditiously and without difficulty.
Other expense (income)
For the year ended December 31, 2009, we recorded $823,000 of other income related to fair value adjustments on our interest rate swaps, offset by $1.2 million of other expense primarily related to litigation.
Income tax expense
For the year ended December 31, 2009 and 2008, we recorded $443,000 and $151,000, respectively, for state income tax expense primarily related to taxable income generated in the states of Maryland and Delaware.
Equity in earnings from unconsolidated joint ventures
For the year ended December 31, 2009, we recognized equity in earnings from unconsolidated joint ventures of $8.5 million compared to $9.8 million for the year ended December 31, 2008. This variance is due to a combination of decreases in our collection rates and increases in our repair and maintenance costs associated with new equipment transitioning from warranty to maintenance contracts in the third quarter of 2009.
We use both GAAP and non-GAAP metrics to measure our financial results. We believe that, in addition to GAAP metrics, these non-GAAP metrics assist us in measuring our cash generated from operations and ability to service our debt obligations. We believe this information is useful to investors and other interested parties because we are highly leveraged and our non-GAAP metrics removes non-cash and nonrecurring charges that occur in the affected period and provides a basis for measuring the Company's financial condition against other quarters.
46
One non-GAAP measure we believe assists us is Adjusted EBITDA. We define Adjusted EBITDA as earnings before interest, taxes, depreciation and amortization, each from continuing operations and exclude losses or gains on the disposal of equipment, other income or loss, loss on debt extinguishments, bargain purchase gains and non-cash equity compensation. Adjusted EBITDA includes equity earnings in unconsolidated operations and subtracts allocations of earnings to non-controlling interests in subsidiaries, and is adjusted for non-cash or extraordinary and one-time events taken place during the period.
Adjusted EBITDA is reconciled to its nearest comparable GAAP financial measure, net income (loss). Adjusted EBITDA is a non-GAAP financial measure used as an analytical indicator by us and the healthcare industry to assess business performance, and is a measure of leverage capacity and ability to service debt. Adjusted EBITDA should not be considered a measure of financial performance under GAAP, and the items excluded from Adjusted EBITDA should not be considered in isolation or as alternatives to net income, cash flows generated by operating, investing or financing activities or other financial statement data presented in the consolidated financial statements as an indicator of financial performance or liquidity. As Adjusted EBITDA is not a measurement determined in accordance with GAAP and is therefore susceptible to varying methods of calculation, this metric, as presented, may not be comparable to other similarly titled measures of other companies.
The following is a reconciliation of GAAP net loss to Adjusted EBITDA for the years ended December 31, 2010, 2009, and 2008, respectively:
|
Years Ended
|
||||||||||||
|
December 31,
|
||||||||||||
|
2010
|
2009
|
2008
|
||||||||||
|
Net Loss Attributable to RadNet, Inc. Common Stockholders
|
$ | (12,852 | ) | $ | (2,267 | ) | $ | (12,836 | ) | |||
|
Plus Provision for Income Taxes
|
576 | 443 | 151 | |||||||||
|
Plus Other Expenses (Income)
|
505 | 416 | - | |||||||||
|
Plus Interest Expense
|
48,398 | 50,016 | 51,811 | |||||||||
|
Plus Severence Costs
|
838 | 731 | 335 | |||||||||
|
Plus Loss on Sale of Equipment
|
1,136 | 523 | 516 | |||||||||
|
Plus Gain on Bargain Purchase
|
- | (1,387 | ) | - | ||||||||
|
Plus Loss on Extinguishment of Debt
|
9,871 | - | - | |||||||||
|
Plus other one-time expenses
|
- | - | 1,976 | |||||||||
|
Plus Depreciation and Amortization
|
53,997 | 53,800 | 53,548 | |||||||||
|
Plus Non Cash Employee Stock Based Compensation
|
3,718 | 3,607 | 2,902 | |||||||||
|
Adjusted EBITDA
|
$ | 106,187 | $ | 105,882 | $ | 98,403 | ||||||
Liquidity and Capital Resources
We had a working capital balance of $5.8 million and $9.2 million at December 31, 2010 and 2009, respectively. We had a net loss attributable to RadNet, Inc.’s common stockholders of $12.9 million, $2.3 million and $12.8 million for the years ended December 31, 2010, 2009 and 2008, respectively. We also had a RadNet, Inc. stockholder equity deficit of $82.5 million and $74.8 million at December 31, 2010 and 2009, respectively.
We operate in a capital intensive, high fixed-cost industry that requires significant amounts of capital to fund operations. In addition to operations, we require a significant amount of capital for the initial start-up and development expense of new diagnostic imaging facilities, the acquisition of additional facilities and new diagnostic imaging equipment, and to service our existing debt and contractual obligations. Because our cash flows from operations have been insufficient to fund all of these capital requirements, we have depended on the availability of financing under credit arrangements with third parties.
Our business strategy with regard to operations focuses on the following:
|
·
|
maximizing performance at our existing facilities;
|
|
·
|
focusing on profitable contracting;
|
|
·
|
expanding MRI, CT and PET applications;
|
|
·
|
optimizing operating efficiencies; and
|
|
·
|
expanding our networks.
|
47
On November 15, 2006, we entered into a $405 million senior secured credit facility with GE Commercial Finance Healthcare Financial Services (the “November 2006 Credit Facility”). This facility was used to finance our acquisition of Radiologix, refinance existing indebtedness, pay transaction costs and expenses relating to our acquisition of Radiologix, and provide financing for working capital needs post-acquisition. The facility consisted of a revolving credit facility of up to $45 million, a $225 million first lien Term Loan and a $135 million second lien Term Loan. On August 23, 2007, we secured an incremental $35 million (“Incremental Facility”) as part of our existing credit facilities with GE Commercial Finance Healthcare Financial Services. The Incremental Facility consisted of an additional $25 million as part of our first lien Term Loan and $10 million of additional capacity under our existing revolving line of credit bringing the total capacity to $55 million. On February 22, 2008, we secured a second incremental $35 million (“Second Incremental Facility”) of capacity as part of our existing credit facilities with GE Commercial Finance Healthcare Financial Services, all collectively referred to as our “GE Credit Facility.”
On April 6, 2010 we completed our debt refinancing plan for an aggregate of $585 million. The debt refinancing plan included our “New Credit Agreement” which included the issuance of a $285 million senior secured term loan due April 6, 2016, a $100 million senior secured revolving credit facility due April 6, 2015, and our “Senior Notes” which includes $200 million in aggregate principal amount of senior unsecured notes due April 1, 2018. We used $412.0 million of the proceeds from the debt restructuring to pay off our prior credit facility and an additional $1.7 million to settle a call premium associated with our prior credit facilities. As a result of this refinancing, we recorded during the second quarter of 2010 a loss on extinguishment of debt of approximately $9.9 million which is made up of the $1.7 million call premium, $7.6 million write-off of deferred loan costs associated with the prior credit facility, as well as $600,000 of additional debt settlement costs.
At December 31, 2010, the balance of the senior secured term loan was approximately $282.9 million and the par value of our senior unsecured notes was $200.0 million.
Just prior to our refinancing discussed above, our outstanding indebtedness under our GE credit facility included a $242.0 million senior secured term loan B and a $170.0 million second lien term loan.
New Credit Agreement
As mentioned above, on April 6, 2010, we entered into a new Credit and Guaranty Agreement (the “
New Credit Agreement
”) pursuant to which we obtained $385 million in senior secured bank financing, consisting of a $285 million, six-year term loan facility and a $100 million, five-year revolving credit facility (the
New Credit Facilities
). In connection with the New Credit Facilities, we terminated the GE Credit Facility.
Interest.
The New Credit Facilities bear interest through maturity at a rate determined by adding the applicable margin to either (a) the Base Rate, which is the highest of the (i) Prime Rate, (ii) the rate which is 0.5% in excess of the Federal Funds Effective Rate, (iii) 3.00% and (iv) 1.00% in excess of the one-month Adjusted Eurodollar Rate at such time, or (b) the Adjusted Eurodollar Rate, which is the higher of (i) the London interbank offered rate, adjusted for statutory reserve requirements, for the respective interest period, as determined by the administrative agent and (ii) 2.00%. Applicable margin means (i) (a) with respect to Tranche B Term Loans that are Eurodollar Rate Loans, 3.75% per annum and (b) with respect to Tranche B Term Loans that are Base Rate Loans, 2.75% per annum; and (ii) (a) with respect to Revolving Loans that are Eurodollar Rate Loans, 3.75% per annum and (b) with respect to Revolving Loans and Swing Line Loans that are Base Rate Loans, 2.75% per annum.
Payments.
Commencing on June 30, 2010, we are required to make quarterly amortization payments on the term loan facility, each in the amount of $712,500, with the remaining principal balance paid at maturity. Under the New Credit Agreement, we are also required to make mandatory prepayments, subject to specified exceptions, from Consolidated Excess Cash Flow, and upon certain events, including, but not limited to, (i) the receipt of net cash proceeds from the sale or other disposition of any property or assets by us or any of our subsidiaries, (ii) the receipt of net cash proceeds from insurance or condemnation proceeds paid on account of any loss of any property or assets of us or any of our subsidiaries, (iii) the receipt of net cash proceeds from the incurrence of indebtedness by us or any of our subsidiaries (other than certain indebtedness otherwise permitted under the loan documents relating to the New Credit Facilities) and (iv) the receipt of net cash proceeds by us or any of our subsidiaries from Extraordinary Receipts, as defined in the New Credit Agreement.
Guarantees and Collateral.
The obligations under the New Credit Facilities are guaranteed by us, all of our current and future wholly-owned domestic restricted subsidiaries and certain of our affiliates. The obligations under the New Credit Facilities and the guarantees are secured by a perfected first priority security interest in all of Radnet Management’s and the guarantors’ tangible and intangible assets, including, but not limited to, pledges of equity interests of Radnet Management and all of our current and future domestic subsidiaries.
48
Restrictive Covenants.
In addition to certain customary covenants, the New Credit Agreement places limits on our ability to declare dividends or redeem or repurchase capital stock, prepay, redeem or purchase debt, incur liens and engage in sale-leaseback transactions, make loans and investments, incur additional indebtedness, amend or otherwise alter debt and other material agreements, engage in mergers, acquisitions and asset sales, enter into transactions with affiliates and alter the business we and our subsidiaries currently conduct.
Financial Covenants.
The New Credit Agreement contains financial covenants including a minimum interest coverage ratio, a maximum total leverage ratio and a limit on annual capital expenditures. Failure to comply with these covenants could permit the lenders under the New Credit Facilities to declare all amounts borrowed, together with accrued interest and fees, to be immediately due and payable.
Events of Default.
In addition to certain customary events of default, events of default under the New Credit Facilities include failure to pay principal or interest when due, a material breach of any representation or warranty contained in the loan documents, covenant defaults, events of bankruptcy and a change of control.
Senior Unsecured Notes
Also, as mentioned above, on April 6, 2010, we issued $200 million in aggregate amount of senior unsecured Notes which have a coupon of 10.375% and were issued at a price of 98.680%. The Notes were issued by Radnet Management, Inc. and guaranteed jointly and severally on a senior unsecured basis by us and all of our current and future wholly-owned domestic restricted subsidiaries. The Notes were offered and sold in a private placement exempt from registration under the Securities Act to qualified institutional buyers pursuant to Rule 144A and Regulation S under the Securities Act. The Notes will mature on April 1, 2018, and bear interest at the rate of 10.375% per year. We will pay interest on the Notes on April 1
and October 1, commencing October 1, 2010. The Notes are governed under an indenture agreement with U.S. Bank National Association as trustee. Under the terms of the indenture agreement, we agreed to file a registration statement with the Securities and Exchange Commission (“SEC”) relating to an offer to exchange the Notes for registered publicly tradable notes that have substantially identical terms as the Notes. On August 30, 2010, we filed a registration statement on Form S-4 with the SEC relating to the offer to exchange the Notes. On January 13, 2011, our registration statement was declared effective by the SEC. On February 14, 2011, we completed an exchange offer where by all Notes were exchanged for registered publicly tradable notes.
Ranking.
The Notes and the guarantees:
|
|
·
|
rank equally in right of payment with
any existing and future unsecured
senior indebtedness of the guarantors;
|
|
|
·
|
rank senior in right of payment to all existing and future subordinated indebtedness of the Guarantors;
|
|
|
·
|
are effectively subordinated in right of payment to any secured indebtedness of the guarantors (including indebtedness under the New Credit Facilities) to the extent of the value of the assets securing such indebtedness; and
|
|
|
·
|
are structurally subordinated in right of payment to all existing and future indebtedness and other liabilities of any of the Company’s subsidiaries that is not a guarantor of the Notes.
|
Optional Redemption.
Radnet Management may redeem the Notes, in whole or in part, at any time on or after April 1, 2014, at the redemption prices specified under the Indenture. Prior to April 1, 2013, we may redeem up to 35% of aggregate principal amount of the Notes issued under the Indenture from the net proceeds of one or more equity offerings at a redemption price equal to 110.375% of the Notes redeemed, plus accrued and unpaid interest, if any. Radnet Management is also permitted to redeem the Notes prior to
April 1, 2014, in whole or in part, at a redemption price equal to 100% of the principal amount redeemed, plus a make-whole premium and accrued and unpaid interest, if any.
Change of Control and Asset Sales.
If a change in control of Radnet Management occurs, Radnet Management must give holders of the Notes the opportunity to sell their Notes at 101% of their face amount, plus accrued interest. If we or one of our restricted subsidiaries sells assets under certain circumstances, Radnet Management will be required to make an offer to purchase the Notes at their face amount, plus accrued and unpaid interest to the purchase date.
Restrictive Covenants.
The Indenture contains covenants that limit, among other things, the ability of us and our restricted subsidiaries, to:
|
·
|
pay dividends or make certain other restricted payments or investments;
|
|
·
|
incur additional indebtedness and issue preferred stock;
|
|
·
|
create liens (other than permitted liens) securing indebtedness or trade payables unless the notes are secured on an equal and ratable basis with the obligations so secured, and, if such liens secure subordinated indebtedness, the notes are secured by a lien senior to such liens;
|
|
·
|
sell certain assets or merge with or into other companies or otherwise dispose of all or substantially all of our assets;
|
49
|
·
|
enter into certain transactions with affiliates;
|
|
·
|
create restrictions on dividends or other payments by our restricted subsidiaries; and
|
|
·
|
create guarantees of indebtedness by restricted subsidiaries.
|
However, these limitations are subject to a number of important qualifications and exceptions, as described in the Indenture.
Our ability to generate sufficient cash flow from operations to make payments on our debt and other contractual obligations will depend on our future financial performance. A range of economic, competitive, regulatory, legislative and business factors, many of which are outside of our control, will affect our financial performance. Although no assurance can be given, taking these factors into account, including our historical experience, we believe that through implementing our strategic plans, we will obtain sufficient cash to satisfy our obligations as they become due in the next twelve months.
Sources and Uses of Cash
Cash provided by operating activities was $66.9 million, $76.6 million and $45.4 million for the years ended December 31, 2010, 2009 and 2008, respectively.
Cash used in investing activities was $101.4 million, $36.3 million and $56.0 million for the years ended December 31, 2010, 2009 and 2008, respectively. For the year ended December 31, 2010, we purchased property and equipment for approximately $40.3 million and acquired the assets and businesses of additional imaging facilities for approximately $61.8 million (see Note 3 to the consolidated financial statements of this Form 10-K).
Cash provided by financing activities was $25.0 million for the year ended December 31, 2010, compared to cash used in financing activities of $30.2 million for the year ended December 31, 2009; and cash provided by financing activities of $10.6 million for the year ended December 31, 2008. The cash provided by financing activities for the year ended December 31, 2010 was primarily related to our debt refinancing completed on April 6, 2010.
Contractual Commitments
Our future obligations for notes payable, equipment under capital leases, lines of credit, equipment and building operating leases and purchase and other contractual obligations for the next five years and thereafter include (dollars in thousands):
|
2011
|
2012
|
2013
|
2014
|
2015
|
Future
|
Total
|
||||||||||||||||||||||
|
Notes Payable (1)
|
$ | 45,636,928 | $ | 42,011,750 | $ | 40,689,377 | $ | 40,018,349 | $ | 39,195,163 | $ | 524,348,805 | $ | 731,900,372 | ||||||||||||||
|
Capital Leases (2)
|
9,944,313 | 4,663,009 | 1,226,132 | 74,558 | - | - | 15,908,012 | |||||||||||||||||||||
|
Operating Leases (3)
|
38,958,456 | 33,856,693 | 28,302,381 | 22,054,510 | 17,545,846 | 75,475,216 | 216,193,103 | |||||||||||||||||||||
|
Total
|
$ | 94,539,697 | $ | 80,531,453 | $ | 70,217,890 | $ | 62,147,418 | $ | 56,741,009 | $ | 599,824,021 | $ | 964,001,488 | ||||||||||||||
(2)
Includes interest component of capital lease obligations.
(3)
Includes all existing options to extend lease terms that are reasonably assured to be exercised.
We have an arrangement with GE Medical Systems under which it has agreed to be responsible for the maintenance and repair of a majority of our equipment for a fee that is based on the type and age of the equipment. Under this agreement, we are committed to minimum payments of approximately $24.0 million per year through 2016.
Critical Accounting Policies
Use of Estimates
Our discussion and analysis of financial condition and results of operations are based on our consolidated financial statements that were prepared in accordance with U.S. generally accepted accounting principles, or GAAP. Management makes estimates and assumptions when preparing financial statements. These estimates and assumptions affect various matters, including:
50
|
·
|
our reported amounts of assets and liabilities in our consolidated balance sheets at the dates of the financial statements;
|
|
·
|
our disclosure of contingent assets and liabilities at the dates of the financial statements; and
|
|
·
|
our reported amounts of net revenue and expenses in our consolidated statements of operations during the reporting periods.
|
These estimates involve judgments with respect to numerous factors that are difficult to predict and are beyond management’s control. As a result, actual amounts could differ materially from these estimates.
The Securities and Exchange Commission, or SEC, defines critical accounting estimates as those that are both most important to the portrayal of a company’s financial condition and results of operations and require management’s most difficult, subjective or complex judgment, often as a result of the need to make estimates about the effect of matters that are inherently uncertain and may change in subsequent periods. In note 2 to our consolidated financial statements, we discuss our significant accounting policies, including those that do not require management to make difficult, subjective or complex judgments or estimates. The most significant areas involving management’s judgments and estimates are described below.
Revenue Recognition
Our consolidated net revenue consists of net patient fee for service revenue and revenue from capitation arrangements, or capitation revenue. Net patient service revenue is recognized at the time services are provided net of contractual adjustments based on our evaluation of expected collections resulting from the analysis of current and past due accounts, past collection experience in relation to amounts billed and other relevant information. The amount of expected collection is continually adjusted as more information is received and such adjustments are recorded in current operations. Contractual adjustments result from the differences between the rates charged for services performed and reimbursements by government-sponsored healthcare programs and insurance companies for such services. Capitation revenue is recognized as revenue during the period in which we were obligated to provide services to plan enrollees under contracts with various health plans. Under these contracts, we receive a per-enrollee amount each month covering all contracted services needed by the plan enrollees.
Accounts Receivable
Substantially all of our accounts receivable are due under fee-for-service contracts from third party payors, such as insurance companies and government-sponsored healthcare programs, or directly from patients. Services are generally provided pursuant to one-year contracts with healthcare providers. Receivables generally are collected within industry norms for third-party payors. We continuously monitor collections from our payors and maintain an allowance for bad debts based upon specific payor collection issues that we have identified and our historical experience.
Depreciation and Amortization of Long-Lived Assets
We depreciate our long-lived assets over their estimated economic useful lives with the exception of leasehold improvements where we use the shorter of the assets useful lives or the lease term of the facility for which these assets are associated.
Deferred Tax Assets
We evaluate the realizability of the net deferred tax assets and assess the valuation allowance periodically. If future taxable income or other factors are not consistent with our expectations, an adjustment to our allowance for net deferred tax assets may be required. For net deferred tax assets we consider estimates of future taxable income, including tax planning strategies in determining whether our net deferred tax assets are more likely than not to be realized.
Valuation of Goodwill and Long-Lived Assets
Goodwill at December 31, 2010 totaled $143.4 million. Goodwill is recorded as a result of business combinations. Management evaluates goodwill, at a minimum, on an annual basis and whenever events and changes in circumstances suggest that the carrying amount may not be recoverable in accordance with Statement of Financial Accounting Standards, or SFAS, No. 142,
“Goodwill and Other Intangible Assets
,” codified in FASB ASC Topic 350.
Impairment of goodwill is tested at the reporting unit level by comparing the reporting unit’s carrying amount, including goodwill, to the fair value of the reporting unit. The fair value of a reporting unit is estimated using a combination of the income or discounted cash flows approach and the market approach, which uses comparable market data. If the carrying amount of the reporting unit exceeds its fair value, goodwill is considered impaired and a second step is performed to measure the amount of impairment loss, if any. We tested goodwill for impairment on October 1, 2010. Based on our test, we noted no impairment related to goodwill as of October 1, 2010. However, if estimates or the related assumptions change in the future, we may be required to record impairment charges to reduce the carrying amount of goodwill.
51
We evaluate our long-lived assets (property and equipment) and definite-lived intangibles for impairment whenever indicators of impairment exist. The accounting standards require that if the sum of the undiscounted expected future cash flows from a long-lived asset or definite-lived intangible is less than the carrying value of that asset, an asset impairment charge must be recognized. The amount of the impairment charge is calculated as the excess of the asset’s carrying value over its fair value, which generally represents the discounted future cash flows from that asset or in the case of assets we expect to sell, at fair value less costs to sell. No indicators of impairment were identified with respect to our long-lived assets as of December 31, 2010.
Facility Acquisitions
On December 31, 2010, we completed our acquisition of two imaging centers from Presgar Imaging and affiliated entities located in Brooklyn and Orchard Park, New York for cash consideration of $1.6 million plus the assumption of approximately $700,000 of debt. Highway Imaging in Brooklyn and Parkland Diagnostic in Orchard Park are both multimodality facilities, offering a combination of MRI, CT, PET/CT, ultrasound, mammography, bone density and x-ray. We have made a preliminary purchase price allocation of the acquired assets and assumed liabilities; approximately $2.8 million of fixed assets, and $102,000 of goodwill was recorded with respect to this transaction. Also, we assumed approximately $700,000 of equipment notes and $610,000 of accrued expenses.
On October 1, 2010, we completed the acquisition of five medical imaging facilities located in Northern New Jersey and a 50% equity interest in a sixth center from Progressive Health, LLC and certain affiliates and related entities for an aggregate of $17.15 million in cash and a warrant to purchase our common stock, which had a fair value of approximately $306,000 on the day it was granted. See Note 4 to the consolidated financial statements of this Form 10-K for more detail relating to our preliminary purchase price allocation.
On October 1, 2010, we completed our acquisition of Image Medical Corporation, the parent of eRAD, Inc., for approximately $8.5 million in cash and a $2.2 million promissory note to the former shareholders of eRAD. We have also assembled a new software development team, consisting of veterans of the radiology software industry, to complement eRAD’s product portfolio. eRAD and the newly hired software development team form a Radiology Information Technology division of RadNet, under the leadership of Ranjan Jayanathan, RadNet’s Chief Information Officer.
eRAD, Inc., headquartered in Greenville, South Carolina, has been a premier provider of Picture Archiving and Communications Systems (PACS) and related workflow solutions to the radiology industry since 1999. Over 250 hospitals, teleradiology businesses, imaging centers and specialty physician groups use eRAD’s technology to distribute, visualize, store and retrieve digital images taken from all diagnostic imaging modalities. eRAD has approximately 30 employees, including a Research and Development team of 11 software engineers in Budapest, Hungary.
See Note 4 to the consolidated financial statements of this Form 10-K for more detail relating to our preliminary purchase price allocation for eRAD.
On September 10, 2010, we completed the acquisition of substantially all of the assets of Korangy Medical Equipment, LLC in Catonsville, Maryland for approximately $605,000. We have made a preliminary purchase price allocation of the acquired assets and assumed liabilities and $605,000 of fixed assets and no goodwill was recorded with respect to this transaction.
On August 11, 2010, we completed the acquisition of Health Diagnostics of New Jersey in Edison, New Jersey for approximately $3.5 million. We have made a preliminary purchase price allocation of the acquired assets and assumed liabilities and $3.0 million of fixed assets, $300,000 of other intangible assets related to covenant not to compete contracts, and $977,000 of goodwill was recorded with respect to this transaction. Also, we recorded a reserve of approximately $635,000 for obligations under an existing operating facility lease through February of 2014 that we do not intend to utilize.
On July 1, 2010, we completed the acquisition of an imaging center located in Fremont, California from Insight Health Corp. for approximately $141,000. We have made a preliminary purchase price allocation of the acquired assets and assumed liabilities and $170,000 of fixed assets, $150,000 of other intangible assets related to covenant not to compete contracts, and no goodwill was recorded with respect to this transaction. Also, we recorded a reserve of approximately $184,000 for obligations under an existing operating facility lease through August of 2012 that we do not intend to utilize.
On July 1, 2010, we completed the acquisition of Delaware Orthopedic Specialists in Newark, Delaware for approximately $525,000. We have made a purchase price allocation of the acquired assets and assumed liabilities and $430,000 of fixed assets, $95,000 of other intangible assets related to covenant not to compete contracts, and no goodwill was recorded with respect to this transaction.
52
On May 1, 2010, we completed the acquisition of Touchstone Imaging of Bowie, LLC in Bowie, Maryland for approximately $595,000. We have made a purchase price allocation of the acquired assets and assumed liabilities and $595,000 of fixed assets and no goodwill was recorded with respect to this transaction.
On April 30, 2010, we completed the acquisition of Delaware Diagnostic Services, Inc. (Limestone) in Wilmington, Delaware for approximately $87,000. We have made a purchase price allocation of the acquired assets and assumed liabilities and $87,000 of fixed assets and no goodwill was recorded with respect to this transaction.
On April 30, 2010, we acquired three multi-modality facilities from Sonix Medical Resources, Inc. through a bankruptcy proceeding in New York for approximately $2.3 million in cash. The facilities located in Brooklyn, New York, Chatham, New Jersey and Haddon Heights, New Jersey operate a combination of MRI, CT, mammography, ultrasound, fluoroscopy, X-ray and related modalities. We have made a purchase price allocation of the acquired assets and assumed liabilities and approximately $1.4 million of fixed assets and $844,000 of goodwill was recorded with respect to this transaction.
On April 1, 2010, we completed the acquisition of Truxtun Medical Group in Bakersfield, California for approximately $20.3 million in cash and the issuance of 375,000 shares of RadNet, Inc. common stock valued at approximately $1.2 million on the date of acquisition. Truxtun operates four multi-modality facilities in Bakersfield, a Metropolitan Statistical Area with a population exceeding 800,000 residents in Kern County, California. Truxtun provides a broad range of services including MRI, CT, PET/CT, mammography, nuclear medicine, fluoroscopy, ultrasound, X-ray and related procedures. We have made a purchase price allocation of the acquired assets and assumed liabilities and approximately $2.4 million of working capital, $6.9 million of fixed assets, $1.6 million of other intangible assets related to Trade-name and covenant not to compete contracts, and $10.7 million of goodwill was recorded with respect to this transaction.
On March 15, 2010, we acquired the imaging practice of Theodore Feit, M.D., Inc. in Burbank, California for cash consideration of $350,000. We have made a purchase price allocation of the acquired assets and liabilities, and approximately $350,000 of fixed assets and no goodwill was recorded with respect to this transaction.
On March 1, 2010, we completed the acquisition of Anaheim Open MRI in Anaheim, California for cash consideration of $910,000. The facility operates MRI, CT, ultrasound and X-ray, and has been rebranded as Anaheim Advanced Imaging. We have made a purchase price allocation of the acquired assets and assumed liabilities, and approximately $605,000 of fixed assets and $305,000 of goodwill was recorded with respect to this transaction.
On January 1, 2010, we completed the acquisition of Union Imaging Center in Union, New Jersey from Modern Medical Modalities Corporation for approximately $5.4 million in cash and the issuance of 75,000 shares of RadNet, Inc. common stock valued at approximately $153,000 on the date of acquisition. The center operates imaging modalities including MRI, CT, PET/CT, mammography, ultrasound, nuclear medicine and X-ray. We have made a purchase price allocation of the acquired assets and assumed liabilities, and approximately $1.9 million of fixed assets and $3.7 million of goodwill was recorded with respect to this transaction.
On October 1, 2009, we completed the acquisition of the imaging assets of Chesapeake Urology Associates in Baltimore, Maryland for approximately $950,000. Chesapeake Urology operated CT scanners in three locations in the greater Baltimore area. We have made a purchase price allocation of the acquired assets and liabilities, and approximately $650,000 of fixed assets, $275,000 of covenant not to compete contracts and $19,000 of goodwill was recorded with respect to this transaction.
On October 1, 2009, we completed the acquisition of the women’s imaging business of Ridgewood Diagnostics, a multi-modality women’s imaging practice located near Rochester, New York’s Unity Hospital for $1.1 million and 50,000 shares of RadNet common stock valued at approximately $129,000 on the date of acquisition. In conjunction with the Ridgewood Diagnostics transaction, on October 16, 2009, we completed the acquisition of the women’s imaging business of Unity Hospital for $100,000. We plan to consolidate the Ridgewood Diagnostics and Unity Hospital operations into one facility during 2010. We have made a purchase price allocation of the acquired assets and liabilities, and approximately $92,000 of fixed assets, $150,000 of covenant not to compete contracts and $1.1 million of goodwill was recorded with respect to these transactions.
On June 12, 2009, we acquired the assets and business of nine imaging centers located in New Jersey from an unrelated third party for approximately $2.1 million. At the time of the acquisition, we immediately sold the assets and business of one of those nine centers to an unrelated third party for approximately $650,000. We have made a purchase price allocation of the acquired assets and liabilities associated with the remaining eight centers at their respective fair values.
53
In accordance with accounting standards, any excess of fair value of acquired net assets over the acquisition consideration results in a gain on bargain purchase. Prior to recording a gain, the acquiring entity must reassess whether all acquired assets and assumed liabilities have been identified and recognized and perform re-measurements to verify that the consideration paid, assets acquired, and liabilities assumed have been properly valued. The Company underwent such a reassessment, and as a result, has recorded a gain on bargain purchase of approximately $1.4 million.
We believe that the gain on bargain purchase resulted from various factors that impacted the sale of those New Jersey assets. The seller was performing a full liquidation of its assets for the benefit of its creditors. Upon liquidation of all of its assets, the seller intended to close its business. The New Jersey assets were the only remaining assets to be sold before a full wind-down of the seller’s business could be completed. We believe that the seller was willing to accept a bargain purchase price from us in return for our ability to act more quickly and with greater certainty than any other prospective acquirer. The decline in the credit markets made it difficult for other acquirers who relied upon third party financing to complete the transaction. The relatively small size of the transaction for us, the lack of required third-party financing and our expertise in completing similar transactions in the past gave the seller confidence that we could complete the transaction expeditiously and without difficulty.
In our purchase price allocation we recorded approximately $3.1 million of land and fixed assets, $250,000 of intangible assets and $121,000 of other current assets.
On March 31, 2009, we acquired the assets and business of Inter-County Imaging in Yonkers, NY for approximately $553,000. We have made a purchase price allocation of the acquired assets and liabilities, and approximately $500,000 of fixed assets and no goodwill was recorded with respect to this transaction.
On March 27, 2009, we acquired the assets and business of Elite Diagnostic Imaging, LLC in Victorville, CA for approximately $1.3 million. We have made a purchase price allocation of the acquired assets and liabilities, and approximately $1.2 million of fixed assets and $100,000 of goodwill was recorded with respect to this transaction.
On October 31, 2008, we acquired the assets and business of Middletown Imaging in Middletown, Delaware for $210,000 in cash and the assumption of capital lease debt of $1.2 million. We allocated the purchase price to the acquired assets and liabilities. Approximately $530,000 of goodwill was recorded with respect to this transaction.
On August 15, 2008, we acquired the women’s imaging practice of Parvis Gamagami, M.D., Inc. in Van Nuys, CA for $600,000. Upon acquisition, we relocated the practice to a nearby center we recently acquired from InSight Health in Encino, CA. We rebranded the InSight center as the Encino Breast Care Center, and focused it on Digital Mammography, Ultrasound, MRI and other modalities pertaining to women’s health. We have allocated the full purchase price of $600,000 to goodwill.
On July 23, 2008, we acquired the assets and business of NeuroSciences Imaging Center in Newark, Delaware for $4.5 million in cash. The center, which performs MRI, CT, Bone Density, X-ray, Fluoroscopy and other specialized procedures, is located in a highly specialized medical complex called the Neuroscience and Surgery Institute of Delaware. The acquisition complements our recent purchase of the Papastavros Associates Imaging centers completed in March, 2008. We made a purchase price allocation of the acquired assets and liabilities, and approximately $2.6 million of goodwill was recorded with respect to this transaction.
On June 18, 2008, we acquired the assets and business of Ellicott Open MRI for the assumption of approximately $181,000 of capital lease debt.
On June 2, 2008, we acquired the assets and business of Simi Valley Advanced Medical, a Southern California based multi-modality imaging center, for the assumption of capital lease debt of $1.7 million. We allocated the purchase price to the acquired assets and liabilities, and approximately $313,000 of goodwill was recorded with respect to this transaction.
On April 15, 2008, we acquired the net assets of five Los Angeles area imaging centers from InSight Health Corp. We completed the purchase of a sixth center in Van Nuys, CA from Insight Health Corp. on June 2, 2008. The total purchase price for the six centers was $8.5 million in cash. The centers provide a combination of imaging modalities, including MRI, CT, X-ray, Ultrasound and Mammography. We allocated the purchase price to the acquired assets and liabilities, and approximately $5.6 million of goodwill was recorded with respect to this transaction.
On April 1, 2008, we acquired the net assets and business of BreastLink Medical Group, Inc., a prominent Southern California breast medical oncology business and a leading breast surgery business, for the assumption of approximately $4.0 million of accrued liabilities and capital lease obligations. We allocated the purchase price to the acquired assets and liabilities, and approximately $2.1 million of goodwill was recorded with respect to this transaction.
54
On March 12, 2008, we acquired the net assets and business of Papastavros Associates Medical Imaging for $9.0 million in cash and the assumption of capital leases of $337,000. Founded in 1958, Papastavros Associates Medical Imaging is one of the largest and most established outpatient imaging practices in Delaware. The 12 Papastavros centers offer a combination of MRI, CT, PET, nuclear medicine, mammography, bone densitometry, fluoroscopy, ultrasound and X-ray. We allocated the purchase price to the acquired assets and liabilities, and approximately $3.6 million of goodwill, and $1.2 million for covenants not to compete, were recorded with respect to this transaction.
On February 1, 2008, we acquired the net assets and business of The Rolling Oaks Imaging Group, located in Westlake and Thousand Oaks, California, for $6.0 million in cash and the assumption of capital leases of $2.7 million. The practice consists of two centers, one of which is a dedicated women’s center. The centers are multimodality and include a combination of MRI, CT, PET/CT, mammography, ultrasound and X-ray. The centers are positioned in the community as high-end, high-quality imaging facilities that employ state-of-the-art technology, including 3 Tesla MRI and 64 slice CT units. The facilities have been fixtures in the Westlake/Thousand Oaks market since 2003. We allocated the purchase price to the acquired assets and liabilities, and approximately $5.6 million of goodwill was recorded with respect to this transaction.
MATERIAL ACQUISITIONS
As discussed above, on October 1, 2010, RadNet completed its acquisitions of Image Medical Corporation, parent of eRAD, Inc., and its acquisition of five imaging centers in Northern New Jersey and a 50% equity interest in a sixth center from Progressive and certain affiliates and related entities. We determined that each of these acquisitions were material. Accordingly, as required under ASC 805-10-50, we are providing below certain additional disclosures on an aggregate basis relating to these two acquisitions.
The total purchase price and the allocation of the purchase price for the above businesses (collectively, the “Group”) is as follows (in thousands):
|
Cash
|
$ | 25,650 | ||
|
Fair value of warrant issued
|
306 | |||
|
Promissory note
|
2,250 | |||
|
Total combined purchase price for the Group
|
$ | 28,206 |
Under the purchase method of accounting, the total purchase price shown above is allocated to the Group’s net tangible and intangible assets acquired and liabilities assumed based on the estimated fair values of the acquired assets and liabilities assumed as of the date of each individual acquisition. The following table summarizes the aggregate purchase price allocation (in thousands).
|
Current assets
|
$ | 1,907 | ||
|
Property and equipment, net
|
5,284 | |||
|
Identifiable intangible assets
|
4,343 | |||
|
Goodwill
|
20,183 | |||
|
Current liabilities
|
(2,299 | ) | ||
|
Capital lease obligations and other
|
(1,212 | ) | ||
| $ | 28,206 |
We have estimated the fair value of tangible assets acquired and liabilities assumed. Some of these estimates are subject to change, particularly those estimates relating to the valuation of property and equipment and identifiable intangible assets. The final allocation of the purchase price will be based upon the fair value of assets and liabilities assumed, and in these cases, we will use the services of an external valuation firm to assist us in determining the final fair values which we expect to have completed during our first quarter ended March 31, 2011.
CURRENT ASSETS: We valued current assets at their respective carrying amounts as we believe that these amounts approximate their current fair values.
IDENTIFIABLE INTANGIBLE ASSETS: We expect identifiable intangible assets acquired to include trade names and covenants not to compete. Trade names represent the value of branding in the community. Covenants not to compete are contracts entered into with certain former members of management of the Group on the date of acquisition of the applicable business.
55
Identifiable intangible assets consist of the following (in thousands):
|
Estimated
|
|||||||||
|
Estimated
|
Amortization
|
Annual
|
|||||||
|
Fair Value
|
Period
|
Amortization
|
|||||||
|
Trade Name
|
$ | 258 |
Indefinite
|
Not applicable
|
|||||
|
Customer Relationships
|
1,397 |
5 Years
|
279 | ||||||
|
Developed Technology and In-Process R&D
|
2,688 |
5 Years
|
538 | ||||||
| $ | 4,343 | $ | 817 | ||||||
Intangible assets are being amortized using the straight-line method, considering the pattern in which the economic benefits of the intangible assets are consumed.
GOODWILL: Approximately $20.2 million has been allocated to goodwill. Goodwill represents the excess of the purchase price over the fair value of the underlying net tangible and intangible assets. Management evaluates goodwill, at a minimum, on an annual basis and whenever events and changes in circumstances suggest that the carrying amount may not be recoverable. Impairment of goodwill is tested at the reporting unit level by comparing the reporting unit’s carrying amount, including goodwill, to the fair value of the reporting unit. The fair value of a reporting unit is estimated using a combination of the income or discounted cash flows approach and the market approach, which uses comparable market data. If the carrying amount of the reporting unit exceeds its fair value, goodwill is considered impaired and a second step is performed to measure the amount of impairment loss, if any. We tested goodwill for impairment on October 1, 2010.
The revenue and earnings of the Group included in the Company’s consolidated income statement from the respective actual acquisition dates of each business in the Group to the period ended December 31, 2010 are as follows (in thousands):
|
Net Revenue
|
$ | 5,433 | ||
|
Net Income
|
409 | |||
The following unaudited pro-forma financial information for the years ended December 31, 2010 and 2009 represents the combined results of operations of the Company and the Group as if the Group’s acquisition had occurred on a single date of January 31, 2009. The unaudited pro-forma financial information does not necessarily reflect the results of operations that would have occurred had the Group constituted a single entity during such periods (in thousands).
|
Years Ended
|
||||||||
|
December 31,
|
||||||||
|
2010
|
2009
|
|||||||
|
Net Revenue
|
566,696 | 547,587 | ||||||
|
Net loss
|
(11,023 | ) | (973 | ) | ||||
|
Pro-forma net loss per share
|
(0.30 | ) | (0.03 | ) | ||||
Recent Accounting Standards
In December 2009, the FASB issued ASU 2009-17,
Consolidations (Topic 810) – Improvements to Financial Reporting by Enterprises Involved with Variable Interest Entities
. ASU 2009-17 changes how a reporting entity determines when an entity that is insufficiently capitalized or is not controlled through voting (or similar rights) should be consolidated. ASU 2009-17 also requires a reporting entity to provide additional disclosures about its involvement with variable interest entities and any significant changes in risk exposure due to that involvement. ASU 2009-17 is effective at the start of a reporting entity’s first fiscal year beginning after November 15, 2009, or January 1, 2010, for a calendar year entity. Early adoption is not permitted. Our adoption of ASU 2009-17 did not have a material impact on our consolidated financial position, results of operations or cash flows.
In January 2010, the FASB issued authoritative guidance intended to improve disclosures about fair value measurements. The guidance requires entities to disclose significant transfers in and out of fair value hierarchy levels and the reasons for the transfers. Additionally, the guidance clarifies that a reporting entity should provide fair value measurements for each class of assets and liabilities and disclose the inputs and valuation techniques used for fair value measurements using significant other observable inputs (Level 2) and significant unobservable inputs (Level 3). The Company maintains interest rate swaps which are required to be recorded at fair value on a recurring basis. See Note 8 to the consolidated financial statements of this Form 10-K for required disclosures under this guidance.
56
In February 2010, the FASB issued authoritative guidance on subsequent events. The guidance requires an SEC filer to evaluate subsequent events through the date the financial statements are issued but no longer requires an SEC filer to disclose the date through which the subsequent event evaluation occurred. The guidance became effective for the Company upon issuance and had no impact on the Company’s results of operations or financial position.
|
Item 7A.
|
Quantitative and Qualitative Disclosures About Market Risk
|
Foreign Currency Exchange Risk.
We sell our services exclusively in the United States and receive payment for our services exclusively in United States dollars. As a result, our financial results are unlikely to be affected by factors such as changes in foreign currency, exchange rates or weak economic conditions in foreign markets.
After the completion of the acquisition of Image Medical Corporation, the parent of eRAD, Inc. on October 1, 2010, we maintain research and development facilities in Prince Edward Island, Canada and Budapest, Hungary for which expenses are paid in the local currency. Accordingly, we do have currency risk resulting from fluctuations between such local currency and the United States Dollar. At the present time, we do not have any foreign exchange currency contracts to mitigate this risk. Fluctuations in foreign exchange rates could impact future operating results.
Interest Rate Sensitivity.
A large portion of our interest expense is not sensitive to changes in the general level of interest in the United States because much of our indebtedness has interest rates that were fixed when we entered into the note payable or capital lease obligation. Our credit facility however, which is classified as a long-term liability on our financial statements, is interest expense sensitive to changes in the general level of interest in the United States because it is priced at a 3.75% spread to the greater of 2% (“LIBOR Floor”) or 3 month LIBOR. At December 31, 2010, we had $282.9 million outstanding under our credit facilities. Because the LIBOR Floor exceeds the current spot rate of 3 month LIBOR (currently at about 31 basis points), the spot rate of 3 month LIBOR would have to increase by more than 170 basis points before we would recognize any increase in our interest expense. The LIBOR rate would have to increase by 270 basis points for us to realize a 1% increase in our borrowing rate under our current credit facility and for us to experience an annual increase of $2.8 million in our interest expense.
|
Item 8.
|
Financial Statements and Supplementary Data
|
57
Report of Independent Registered Public Accounting Firm
The Board of Directors and Stockholders of RadNet, Inc.
We have audited the accompanying consolidated balance sheets of RadNet, Inc. and subsidiaries (the “Company” or “RadNet”) as of December 31, 2010 and 2009, and the related consolidated statements of operations, equity deficit, and cash flows for each of the three years in the period ended December 31, 2010. Our audits also included the financial statement schedule listed in the Index at Item 15(a). These financial statements and schedule are the responsibility of the Company’s management. Our responsibility is to express an opinion on these financial statements and schedule based on our audits.
We conducted our audits in accordance with the standards of the Public Company Accounting Oversight Board (United States). Those standards require that we plan and perform the audit to obtain reasonable assurance about whether the financial statements are free of material misstatement. An audit includes examining, on a test basis, evidence supporting the amounts and disclosures in the financial statements. An audit also includes assessing the accounting principles used and significant estimates made by management, as well as evaluating the overall financial statement presentation. We believe that our audits provide a reasonable basis for our opinion.
In our opinion, the financial statements referred to above present fairly, in all material respects, the consolidated financial position of RadNet, Inc. and subsidiaries at December 31, 2010 and 2009, and the consolidated results of their operations and their cash flows for each of the three years in the period ended December 31, 2010, in conformity with U.S. generally accepted accounting principles. Also, in our opinion, the related financial statement schedule when considered in relation to the basic financial statements taken as a whole, presents fairly in all material respects the information set forth therein.
We also have audited, in accordance with the standards of the Public Company Accounting Oversight Board (United States), RadNet’s internal control over financial reporting as of December 31, 2010, based on criteria established in
Internal Control-Integrated Framework
issued by the Committee of Sponsoring Organizations of the Treadway Commission and our report dated March 11, 2011, expressed an unqualified opinion thereon.
|
|
/s/ Ernst & Young LLP
|
|
Los Angeles, California
March 11, 2011
58
RADNET, INC. AND SUBSIDIARIES
CONSOLIDATED BALANCE SHEETS
(IN THOUSANDS EXCEPT SHARE DATA)
|
December 31,
|
||||||||
|
2010
|
2009
|
|||||||
|
ASSETS
|
||||||||
|
CURRENT ASSETS
|
||||||||
|
Cash and cash equivalents
|
$ | 627 | $ | 10,094 | ||||
|
Accounts receivable, net
|
96,094 | 87,825 | ||||||
|
Prepaid expenses and other current assets
|
14,304 | 9,990 | ||||||
|
Total current assets
|
111,025 | 107,909 | ||||||
|
PROPERTY AND EQUIPMENT, NET
|
194,230 | 182,571 | ||||||
|
OTHER ASSETS
|
||||||||
|
Goodwill
|
143,353 | 106,502 | ||||||
|
Other intangible assets
|
57,348 | 54,313 | ||||||
|
Deferred financing costs, net
|
15,486 | 8,229 | ||||||
|
Investment in joint ventures
|
15,444 | 18,741 | ||||||
|
Deposits and other
|
2,628 | 2,406 | ||||||
|
Total assets
|
$ | 539,514 | $ | 480,671 | ||||
|
LIABILITIES AND EQUITY DEFICIT
|
||||||||
|
CURRENT LIABILITIES
|
||||||||
|
Accounts payable and accrued expenses
|
$ | 82,619 | $ | 69,641 | ||||
|
Due to affiliates
|
2,975 | 7,456 | ||||||
|
Deferred revenue
|
1,568 | - | ||||||
|
Current portion of notes payable
|
8,218 | 6,927 | ||||||
|
Current portion of deferred rent
|
745 | 560 | ||||||
|
Current portion of obligations under capital leases
|
9,139 | 14,121 | ||||||
|
Total current liabilities
|
105,264 | 98,705 | # | |||||
|
LONG-TERM LIABILITIES
|
||||||||
|
Deferred rent, net of current portion
|
10,379 | 8,920 | ||||||
|
Deferred taxes
|
277 | 277 | ||||||
|
Notes payable, net of current portion
|
481,578 | 416,699 | ||||||
|
Obligations under capital lease, net of current portion
|
5,639 | 13,568 | ||||||
|
Other non-current liabilities
|
18,850 | 17,263 | ||||||
|
Total liabilities
|
621,987 | 555,432 | ||||||
|
COMMITMENTS AND CONTINGENCIES
|
||||||||
|
EQUITY DEFICIT
|
||||||||
|
Common stock - $.0001 par value, 200,000,000 shares authorized;
37,223,475 and 36,259,279 shares issued and outstanding at December 31, 2010 and 2009, respectively |
4 | 4 | ||||||
|
Paid-in-capital
|
162,444 | 156,758 | ||||||
|
Accumulated other comprehensive loss
|
(2,137 | ) | (1,588 | ) | ||||
|
Accumulated deficit
|
(242,841 | ) | (229,989 | ) | ||||
|
Total Radnet, Inc.'s equity deficit
|
(82,530 | ) | (74,815 | ) | ||||
|
Noncontrolling interests
|
57 | 54 | ||||||
|
Total equity deficit
|
(82,473 | ) | (74,761 | ) | ||||
|
Total liabilities and equity deficit
|
$ | 539,514 | $ | 480,671 | ||||
The accompanying notes are an integral part of these financial statements.
59
RADNET, INC. AND SUBSIDIARIES
CONSOLIDATED STATEMENTS OF OPERATIONS
(IN THOUSANDS EXCEPT SHARE DATA)
|
Years Ended December 31,
|
||||||||||||
|
2010
|
2009
|
2008
|
||||||||||
|
NET REVENUE
|
$ | 548,537 | $ | 524,368 | $ | 498,815 | ||||||
|
OPERATING EXPENSES
|
||||||||||||
|
Cost of operations
|
420,973 | 397,753 | 384,297 | |||||||||
|
Depreciation and amortization
|
53,997 | 53,800 | 53,548 | |||||||||
|
Provision for bad debts
|
33,158 | 32,704 | 30,832 | |||||||||
|
Loss on sale of equipment
|
1,136 | 523 | 516 | |||||||||
|
Severance costs
|
838 | 731 | 335 | |||||||||
|
Total operating expenses
|
510,102 | 485,511 | 469,528 | |||||||||
|
INCOME FROM OPERATIONS
|
38,435 | 38,857 | 29,287 | |||||||||
|
OTHER EXPENSES (INCOME)
|
||||||||||||
|
Interest expense
|
48,398 | 50,016 | 51,811 | |||||||||
|
Gain on bargain purchase
|
- | (1,387 | ) | - | ||||||||
|
Loss on extinguishment of debt
|
9,871 | - | - | |||||||||
|
Other expenses (income)
|
505 | 416 | (151 | ) | ||||||||
|
Total other expenses
|
58,774 | 49,045 | 51,660 | |||||||||
|
LOSS BEFORE INCOME TAXES AND EQUITY
|
||||||||||||
|
IN EARNINGS OF JOINT VENTURES
|
(20,339 | ) | (10,188 | ) | (22,373 | ) | ||||||
|
Provision for income taxes
|
(576 | ) | (443 | ) | (151 | ) | ||||||
|
Equity in earnings of joint ventures
|
8,230 | 8,456 | 9,791 | |||||||||
|
NET LOSS
|
(12,685 | ) | (2,175 | ) | (12,733 | ) | ||||||
|
Net income attributable to noncontrolling interests
|
167 | 92 | 103 | |||||||||
|
NET LOSS ATTRIBUTABLE TO RADNET, INC.
|
||||||||||||
|
COMMON STOCKHOLDERS
|
$ | (12,852 | ) | $ | (2,267 | ) | $ | (12,836 | ) | |||
|
BASIC AND DILUTED NET LOSS PER SHARE ATTRIBUTABLE
|
||||||||||||
|
TO RADNET, INC. COMMON STOCKHOLDERS
|
$ | (0.35 | ) | $ | (0.06 | ) | $ | (0.36 | ) | |||
|
WEIGHTED AVERAGE SHARES OUTSTANDING
|
||||||||||||
|
Basic and Diluted
|
36,853,477 | 36,047,033 | 35,721,028 | |||||||||
The accompanying notes are an integral part of these financial statements.
60
RADNET, INC. AND SUBSIDIARIES
CONSOLIDATED STATEMENT OF EQUITY DEFICIT
(IN THOUSANDS EXCEPT SHARE DATA)
|
Common Stock
Shares
|
Amount
|
Paid-in
Capital
|
Accumulated
Deficit
|
Accumulated
Other
|
Total
Radnet, Inc.'s
|
Noncontrolling
Interests
|
Total
Equity Deficit
|
|||||||||||||||||||||||||
|
BALANCE - DECEMBER 31, 2007
|
35,239,558 | $ | 4 | $ | 149,631 | $ | (214,886 | ) | $ | (4,579 | ) | $ | (69,830 | ) | $ | 206 | $ | (69,624 | ) | |||||||||||||
|
Issuance of common stock upon e
xercise of options/warrants
|
671,916 | - | 473 | - | - | 473 | - | 473 | ||||||||||||||||||||||||
|
Stock-based compensation
|
- | - | 2,902 | - | - | 2,902 | - | 2,902 | ||||||||||||||||||||||||
|
Dividends paid to noncontrolling i
nterests
|
- | - | - | - | - | - | (231 | ) | (231 | ) | ||||||||||||||||||||||
|
Change in fair value of
cash flow hedge
|
- | - | - | - | (1,817 | ) | (1,817 | ) | - | (1,817 | ) | |||||||||||||||||||||
|
Net loss
|
- | - | - | (12,836 | ) | - | (12,836 | ) | 103 | (12,733 | ) | |||||||||||||||||||||
|
Comprehensive loss
|
(14,653 | ) | 103 | (14,550 | ) | |||||||||||||||||||||||||||
|
BALANCE - DECEMBER 31, 2008
|
35,911,474 | $ | 4 | $ | 153,006 | $ | (227,722 | ) | $ | (6,396 | ) | $ | (81,108 | ) | $ | 78 | $ | (81,030 | ) | |||||||||||||
|
Issuance of common stock to
shareholders of Ridgewood Diagnostics
|
50,000 | $ | - | 129 | $ | - | $ | - | 129 | - | 129 | |||||||||||||||||||||
|
Issuance of common stock upon exercise of options/warrants
|
297,805 | - | 16 | - | - | 16 | - | 16 | ||||||||||||||||||||||||
|
Stock-based compensation
|
- | - | 3,607 | - | - | 3,607 | - | 3,607 | ||||||||||||||||||||||||
|
Dividends paid to noncontrolling interests
|
- | - | - | - | - | - | (116 | ) | (116 | ) | ||||||||||||||||||||||
|
Change in fair value of cash flow hedge
|
- | - | - | - | (1,311 | ) | (1,311 | ) | - | (1,311 | ) | |||||||||||||||||||||
|
Change in fair value of cash flow hedge from p
rior periods reclassified to earnings
|
- | - | - | - | 6,119 | 6,119 | - | 6,119 | ||||||||||||||||||||||||
|
Net loss
|
(2,267 | ) | (2,267 | ) | 92 | (2,175 | ) | |||||||||||||||||||||||||
|
Comprehensive income
|
- | - | - | - | - | 2,541 | 92 | 2,633 | ||||||||||||||||||||||||
|
BALANCE - DECEMBER 31, 2009
|
36,259,279 | $ | 4 | $ | 156,758 | $ | (229,989 | ) | $ | (1,588 | ) | $ | (74,815 | ) | $ | 54 | $ | (74,761 | ) | |||||||||||||
|
Issuance of common stock to sellers of Truxtun Imaging
|
375,000 | - | 1,238 | - | - | 1,238 | - | 1,238 | ||||||||||||||||||||||||
|
Issuance of common stock to sellers of Union Imaging
|
75,000 | - | 153 | - | - | 153 | - | 153 | ||||||||||||||||||||||||
|
Issuance of warrant to sellers of Rutherford Imaging
|
- | - | 306 | - | - | 306 | - | 306 | ||||||||||||||||||||||||
|
Issuance of common stock upon exercise of options/warrants
|
514,196 | 271 | - | - | 271 | - | 271 | |||||||||||||||||||||||||
|
Stock-based compensation
|
- | 3,718 | - | - | 3,718 | - | 3,718 | |||||||||||||||||||||||||
|
Non-controlling interests assumed from the acquisition of Progressive imaging
|
(33 | ) | (33 | ) | ||||||||||||||||||||||||||||
|
Dividends paid to noncontrolling interests
|
- | - | - | - | - | - | (131 | ) | (131 | ) | ||||||||||||||||||||||
|
Change in cumulative foreign currency translation adjustment
|
- | - | - | - | 6 | 6 | 6 | |||||||||||||||||||||||||
|
Change in fair value of cash flow hedge
|
- | - | - | - | (1,472 | ) | (1,472 | ) | - | (1,472 | ) | |||||||||||||||||||||
|
Change in fair value of cash flow hedge from prior periods reclassified to earnings
|
- | - | - | - | 917 | 917 | - | 917 | ||||||||||||||||||||||||
|
Net loss
|
(12,852 | ) | (12,852 | ) | 167 | (12,685 | ) | |||||||||||||||||||||||||
|
Comprehensive loss
|
- | - | - | - | - | (13,401 | ) | 167 | (13,234 | ) | ||||||||||||||||||||||
|
BALANCE - DECEMBER 31, 2010
|
37,223,475 | $ | 4 | $ | 162,444 | $ | (242,841 | ) | $ | (2,137 | ) | $ | (82,530 | ) | $ | 57 | $ | (82,473 | ) | |||||||||||||
The accompanying notes are an integral part of these financial statements.
61
RADNET, INC. AND SUBSIDIARIES
CONSOLIDATED STATEMENTS OF CASH FLOWS
(IN THOUSANDS)
|
Years Ended December 31,
|
||||||||||||
|
2010
|
2009
|
2008
|
||||||||||
|
CASH FLOWS FROM OPERATING ACTIVITIES
|
||||||||||||
|
Net loss
|
$ | (12,685 | ) | $ | (2,175 | ) | $ | (12,733 | ) | |||
|
Adjustments to reconcile net loss
|
||||||||||||
|
to net cash provided by operating activities:
|
||||||||||||
|
Depreciation and amortization
|
53,997 | 53,800 | 53,548 | |||||||||
|
Provision for bad debts
|
33,158 | 32,704 | 30,832 | |||||||||
|
Equity in earnings of joint ventures
|
(8,230 | ) | (8,456 | ) | (9,791 | ) | ||||||
|
Distributions from joint ventures
|
10,917 | 7,667 | 7,982 | |||||||||
|
Deferred rent amortization
|
1,848 | 1,094 | 3,514 | |||||||||
|
Amortization of deferred financing cost
|
2,797 | 2,678 | 2,567 | |||||||||
|
Amortization of bond discount
|
164 | - | - | |||||||||
|
Net loss on disposal of assets
|
1,136 | 523 | 516 | |||||||||
|
Loss on extinguishment of debt
|
9,871 | - | - | |||||||||
|
Gain on bargain purchase
|
- | (1,387 | ) | - | ||||||||
|
Gain on extinguishment of debt
|
- | - | (47 | ) | ||||||||
|
Amortization of cash flow hedge
|
917 | 6,119 | - | |||||||||
|
Stock-based compensation
|
3,718 | 3,607 | 2,902 | |||||||||
|
Changes in operating assets and liabilities, net of assets
|
||||||||||||
|
acquired and liabilities assumed in purchase transactions:
|
||||||||||||
|
Accounts receivable
|
(35,985 | ) | (24,432 | ) | (36,297 | ) | ||||||
|
Other current assets
|
(3,226 | ) | 4,206 | (1,515 | ) | |||||||
|
Other assets
|
24 | 51 | 684 | |||||||||
|
Deferred revenue
|
207 | |||||||||||
|
Accounts payable and accrued expenses
|
8,256 | 619 | 3,270 | |||||||||
|
Net cash provided by operating activities
|
66,884 | 76,618 | 45,432 | |||||||||
|
CASH FLOWS FROM INVESTING ACTIVITIES
|
||||||||||||
|
Purchase of imaging facilities
|
(61,774 | ) | (6,085 | ) | (28,859 | ) | ||||||
|
Proceeds from sale of imaging facilities
|
- | 650 | - | |||||||||
|
Purchase of property and equipment
|
(40,293 | ) | (30,752 | ) | (29,199 | ) | ||||||
|
Proceeds from sale of equipment
|
685 | 219 | 2,961 | |||||||||
|
Purchase of equity interest in joint ventures
|
- | (315 | ) | (938 | ) | |||||||
|
Net cash used in investing activities
|
(101,382 | ) | (36,283 | ) | (56,035 | ) | ||||||
|
CASH FLOWS FROM FINANCING ACTIVITIES
|
||||||||||||
|
Principal payments on notes and leases payable
|
(21,463 | ) | (23,660 | ) | (19,112 | ) | ||||||
|
Proceeds from borrowings on notes payable
|
- | - | 35,000 | |||||||||
|
Proceeds from borrowings upon refinancing
|
482,360 | - | 1,212 | |||||||||
|
Repayment of bebt
|
(412,000 | ) | ||||||||||
|
Deferred financing costs
|
(17,613 | ) | - | (4,277 | ) | |||||||
|
Net payments on line of credit
|
- | (1,742 | ) | (2,480 | ) | |||||||
|
Payments to counterparties of interest rate swaps, net of amounts received
|
(6,382 | ) | (4,739 | ) | - | |||||||
|
Distributions to noncontrolling interests
|
(131 | ) | (116 | ) | (231 | ) | ||||||
|
Proceeds from issuance of common stock upon exercise of options/warrants
|
271 | 16 | 473 | |||||||||
|
Net cash provided by (used in) financing activities
|
25,042 | (30,241 | ) | 10,585 | ||||||||
|
EFFECT OF EXCHANGE RATE CHANGES ON CASH
|
(11 | ) | - | - | ||||||||
|
NET (DECREASE) INCREASE IN CASH AND CASH EQUIVALENTS
|
(9,467 | ) | 10,094 | (18 | ) | |||||||
|
CASH AND CASH EQUIVALENTS, beginning of period
|
10,094 | - | 18 | |||||||||
|
CASH AND CASH EQUIVALENTS, end of period
|
$ | 627 | $ | 10,094 | $ | - | ||||||
|
SUPPLEMENTAL DISCLOSURE OF CASH FLOW INFORMATION
|
||||||||||||
|
Cash paid during the period for interest
|
$ | 40,352 | $ | 40,092 | $ | 49,236 | ||||||
|
Cash paid during the period for income taxes
|
$ | 659 | $ | 348 | $ | 389 | ||||||
The accompanying notes are an integral part of these financial statements.
62
RADNET, INC. AND SUBSIDIARIES
CONSOLIDATED STATEMENTS OF CASH FLOWS (CONTINUED)
Supplemental Schedule of Non-Cash Investing and Financing Activities
We entered into capital leases and equipment notes for approximately $33,000, $10.4 million and $23.7 million, excluding capital leases assumed in acquisitions, during the years ended December 31, 2010, 2009 and 2008, respectively. We also acquired equipment and certain leasehold improvements for approximately $12.2 million, $12.3 million and $17.8 million during the years ended December 31, 2010, 2009 and 2008, respectively, that we had not paid for as of December 31, 2010, 2009 and 2008, respectively. The offsetting amount due was recorded in our consolidated balance sheet under accounts payable and accrued expenses.
As discussed in Note 11, we entered into interest rate swap modifications in the first quarter of 2009. These modifications include a significant financing element and, as such, all cash inflows and outflows subsequent to the date of modification are presented as financing activities. Also, as a result of our debt refinancing completed on April 6, 2010, our interest rate swaps are no longer effective. Accordingly, all changes in their fair value after April 6, 2010 are, and will continue to be recognized in earnings as other expense.
Detail of investing activity related to acquisitions can be found in Notes 3 and 4.
63
NOTES TO CONSOLIDATED FINANCIAL STATEMENTS
At December 31, 2010, we operated a group of regional networks comprised of 201 diagnostic imaging facilities located in seven states with operations primarily in California, Maryland, Florida, Delaware, New Jersey and New York. We provide diagnostic imaging services including magnetic resonance imaging (MRI), computed tomography (CT), positron emission tomography (PET), nuclear medicine, mammography, ultrasound, diagnostic radiology, or X-ray, fluoroscopy and other related procedures. The Company’s operations comprise a single segment for financial reporting purposes.
On October 1, 2010, we completed our acquisition of Image Medical Corporation, the parent of eRAD, Inc. (see Note 3). eRAD, Inc., headquartered in Greenville, South Carolina, has been a premier provider of Picture Archiving and Communications Systems (PACS) and related workflow solutions to the radiology industry since 1999.
eRAD and the newly hired software development team form a Radiology Information Technology division of RadNet that will create fully integrated solutions to manage all aspects of RadNet’s internal information needs.
The consolidated financial statements include the accounts of Radnet Management, Inc. (or “Radnet Management”) and Beverly Radiology Medical Group III, a professional partnership (“BRMG”). The consolidated financial statements also include Radnet Management I, Inc., Radnet Management II, Inc., Radiologix, Inc., Radnet Management Imaging Services, Inc., Delaware Imaging Partners, Inc., New Jersey Imaging Partners, Inc. and Diagnostic Imaging Services, Inc. ( “ DIS ” ), all wholly owned subsidiaries of Radnet Management. All of these affiliated entities are referred to collectively as “RadNet”, “we”, “us”, “our” or the “Company” in this report.
Accounting Standards Codification Section 810-10-15-14 stipulates that generally any entity with a) insufficient equity to finance its activities without additional subordinated financial support provided by any parties, or b) equity holders that, as a group, lack the characteristics specified in the Codification which evidence a controlling financial interest, is considered a Variable Interest Entity (“VIE”). We consolidate all voting interest entities in which we own a majority voting interest and all VIEs for which we are the primary beneficiary. We determine whether we are the primary beneficiary of a VIE through a qualitative analysis that identifies which variable interest holder has the controlling financial interest in the VIE. The variable interest holder who has both of the following has the controlling financial interest and is the primary beneficiary: (1) the power to direct the activities of the VIE that most significantly impact the VIE’s economic performance and (2) the obligation to absorb losses of, or the right to receive benefits from, the VIE that could potentially be significant to the VIE. In performing our analysis, we consider all relevant facts and circumstances, including: the design and activities of the VIE, the terms of the contracts the VIE has entered into, the nature of the VIE’s variable interests issued and how they were negotiated with or marketed to potential investors, and which parties participated significantly in the design or redesign of the entity.
Howard G. Berger, M.D. is our President and Chief Executive Officer, a member of our Board of Directors and owns approximately 15% of our outstanding common stock. Dr. Berger also owns, indirectly, 99% of the equity interests in BRMG. BRMG provides all of the professional medical services at the majority of our facilities located in California under a management agreement with us, and employs physicians or contracts with various other independent physicians and physician groups to provide the professional medical services at most of our other California facilities. We generally obtain professional medical services from BRMG in California, rather than provide such services directly or through subsidiaries, in order to comply with California’s prohibition against the corporate practice of medicine. However, as a result of our close relationship with Dr. Berger and BRMG, we believe that we are able to better ensure that medical service is provided at our California facilities in a manner consistent with our needs and expectations and those of our referring physicians, patients and payors than if we obtained these services from unaffiliated physician groups. BRMG is a partnership of ProNet Imaging Medical Group, Inc. (99%), Breastlink Medical Group, Inc. (100%) and Beverly Radiology Medical Group, Inc. (99%), each of which are 99% or 100% owned by Dr. Berger. RadNet provides non-medical, technical and administrative services to BRMG for which it receives a management fee, per the management agreement. Through the management agreement and our relationship with Dr. Berger, we have exclusive authority over all non-medical decision making related to the ongoing business operations of BRMG. Through our management agreement with BRMG we determine the annual budget of BRMG and make all physician employment decisions. BRMG has insignificant operating assets and liabilities, and deminimis equity. Through the management agreement with us, all of BRMG’s cash flows are transferred to us. We have determined that BRMG is a variable interest entity, and that we are the primary beneficiary, and consequently, we consolidate the revenue and expenses of BRMG. BRMG recognized $51.5 million, $47.7 million and $44.6 million of revenue, net of management service fees to RadNet, for the years ended December 31, 2010, 2009 and 2008, respectively, and $51.5 million, $47.7 million and $44.6 million of operating expenses for the years ended December 31, 2010, 2009 and 2008, respectively. RadNet recognized $186.3 million, $171.4 million and $160.4 million of net revenues for the year ended December 31, 2010, 2009 and 2008, respectively, for management services provided to BRMG relating primarily to the technical portion of total billed revenue. The cash flows of BRMG are included in the accompanying consolidated statements of cash flows. All intercompany balances and transactions have been eliminated in consolidation.
The creditors of BRMG do not have recourse to our general credit and there are no other arrangements that could expose us to losses. However, BRMG is managed to recognize no net income or net loss and, therefore, RadNet may be required to provide financial support to cover any operating expenses in excess of operating revenues.
64
In June 2009, the
Financial Accounting Standards Board (
FASB) issued new guidance which made significant changes to the model for determining who should consolidate a VIE and addressed how often this assessment should be performed. The guidance was effective for us on January 1, 2010 (see Note 6).
Aside from centers in California where we contract with BRMG for the provision of professional medical services, at the remaining centers in California and at all of the centers which are located outside of California, we have entered into long-term contracts with independent radiology groups in the area to provide physician services at those facilities. These third party radiology practices provide professional services, including supervision and interpretation of diagnostic imaging procedures, in our diagnostic imaging centers. The radiology practices maintain full control over the provision of professional services. The contracted radiology practices generally have outstanding physician and practice credentials and reputations; strong competitive market positions; a broad sub-specialty mix of physicians; a history of growth and potential for continued growth. In these facilities we enter into long-term agreements with radiology practice groups (typically 40 years). Under these arrangements, in addition to obtaining technical fees for the use of our diagnostic imaging equipment and the provision of technical services, we provide management services and receive a fee based on the practice group’s professional revenue, including revenue derived outside of our diagnostic imaging centers. We own the diagnostic imaging equipment and, therefore, receive 100% of the technical reimbursements associated with imaging procedures. The radiology practice groups retain the professional reimbursements associated with imaging procedures after deducting management service fees. We have no financial controlling interest in the independent (non-BRMG) radiology practices; accordingly, we do not consolidate the financial statements of those practices in our consolidated financial statements.
PRINCIPLES OF CONSOLIDATION - The operating activities of subsidiaries are included in the accompanying consolidated financial statements from the date of acquisition. Investments in companies in which the Company has the ability to exercise significant influence, but not control, are accounted for by the equity method. All intercompany transactions and balances, including those with our equity method investees, have been eliminated in consolidation.
USE OF ESTIMATES - The preparation of the financial statements in conformity with U.S. generally accepted accounting principles requires management to make estimates and assumptions that affect the amounts reported in the financial statements and accompanying notes. These estimates and assumptions affect various matters, including our reported amounts of assets and liabilities in our consolidated balance sheets at the dates of the financial statements; our disclosure of contingent assets and liabilities at the dates of the financial statements; and our reported amounts of revenues and expenses in our consolidated statements of operations during the reporting periods. These estimates involve judgments with respect to numerous factors that are difficult to predict and are beyond management’s control. As a result, actual amounts could materially differ from these estimates.
RECLASSIFICATION – Certain reclassifications have been made to the December 31, 2009 consolidated financial statements and accompanying notes to conform with the December 31, 2010 presentation including certain immaterial reclassification within our statement of operations between interest expense and other expense.
REVENUE RECOGNITION – Our consolidated net revenue primarily consists of net patient fee for service revenue and revenue from capitation arrangements, or capitation revenue. Net patient service revenue is recognized at the time services are provided net of contractual adjustments based on our evaluation of expected collections resulting from the analysis of current and past due accounts, past collection experience in relation to amounts billed and other relevant information. The amount of expected collection is continually adjusted as more information is received and such adjustments are recorded in current operations. Contractual adjustments result from the differences between the rates charged for services performed and reimbursements by government-sponsored healthcare programs and insurance companies for such services. Capitation revenue is recognized as revenue during the period in which we were obligated to provide services to plan enrollees under contracts with various health plans. Under these contracts, we receive a per-enrollee amount each month covering all contracted services to be provided to plan enrollees.
SOFTWARE REVENUE RECOGNITION - On October 1, 2010, we completed our acquisition of Image Medical Corporation, the parent of eRAD, Inc. (see Notes 3 & 4). eRAD sells Picture Archiving Communications Systems (“PACS”) and related services, primarily in the United States. The PACS systems sold by eRAD are primarily composed of certain elements: hardware, software, installation and training, and support. Sales are made primarily through eRAD’s sales force. These sales are multiple-element arrangements that generally include hardware, software, software installation, configuration, system installation, training and first-year warranty support. In a very small number of cases, hardware is not included. Hardware, which is not unique or special purpose, is purchased from a third-party and resold to eRAD’s customers with a small mark-up.
With the acquisition of eRAD we adopted ASU 2009-14,
Certain Revenue Arrangements That Include Software Elements
and ASU 2009-13,
Revenue Arrangements with Multiple Deliverables
for all transactions occurring after January 1, 2008.
We have determined that our core software products, such as PACS, are essential to most of our arrangements as hardware, software and related services are sold as an integrated package. Therefore, these transactions are accounted for under ASC 605-25,
Multiple-Element Arrangements
(as modified by ASU 2009-13). Non-essential software and related services, and essential software sold on a stand-alone basis without hardware, would continue to be accounted for under ASC 985-605,
Software.
65
We recognize revenue for four units of accounting, Hardware, Software, Installation (including manufacturing and configuration, training, implementation and project management) and post-contract support (“
PCS”)
, as follows:
|
●
|
Hardware
– Revenue is recognized when the hardware is shipped. The hardware qualifies as a separate unit of accounting under ASC 605-25-25-5, as it meets the following criteria:
|
|||
|
o
|
The hardware has standalone value as it is sold separately by other vendors and the customer could resell the hardware on a standalone basis; and
|
|||
|
o
|
Delivery or performance of the undelivered items is probable and substantially within our control.
|
|
●
|
Software
– We sell essential and non-essential software. In the case of essential software, revenue is recognized along with the related hardware revenue. In those cases where essential software is sold without hardware, revenue is deferred and recognized over the term of the PCS as we have not established vendor specific objective evidence (VSOE) for our PCS offering.
|
|
●
|
Installation
– Installation revenue related to essential software that is sold with hardware, is recognized when the installation is completed, as it qualifies as a separate unit of account once delivered as it can be provided by a third party. Installation related to essential software sold without hardware, and non-essential software, is deferred and recognized over the term of the PCS, as there is a lack of VSOE. Total installation revenue is allocated between essential and non-essential software based on relative values.
|
|
●
|
Post-Contract Support
– Revenue is recognized over the term of the agreement, usually one year.
|
Our transactions do not generally contain refund provisions. We allocate the transaction price to each unit of accounting using relative selling price. We consider historical pricing, list price and market considerations in determining estimated selling price in the allocation.
From date of acquisition through December 31, 2010, we recorded approximately $998,000 in revenue related to our eRAD business which is included in net revenue in our consolidated statement of operations for the year ended December 31, 2010. At December 31, 2010 we had a deferred revenue liability of approximately $1.6 million associated with eRAD sales which we expect to recognize into revenue over the next 12 months.
SOFTWARE DEVELOPMENT COSTS - Costs related to the research and development of new software products and enhancements to existing software products are expensed as incurred until technological feasibility of the product has been established, at which time such costs are capitalized, subject to expected recoverability.
We utilize a verity of computerized information systems in our day to day operation of our 201 diagnostic imaging facilities. One such system is our front desk patient tracking system or Radiology Information System (“RIS”). We currently utilize third party RIS software solutions and pay monthly fees to outside third party software vendors for the use of this software. We intend to develop our own RIS solution from the ground up through our wholly owned subsidiary, Radnet Management Information Systems (“RMIS”). Beginning August 1, 2010, RMIS directly employs a team of software development engineers to develop from the ground up a RIS system specifically tailored for Radnet, Inc. and the operation of our 201 imaging centers.
By following the accounting guidance under ASC 350-40,
Accounting for the Costs of Computer Software Developed for Internal Use,
the development costs incurred by RMIS, which began on August 1, 2010, will be capitalized and amortized over the useful life of the developed RIS system which we determined to be 5 years. The development stage will run for approximately 36 months ending on or around August 1, 2013. We have estimated total costs to be capitalized will be approximately $4.6 million and will start to be amortized in August of 2013 at approximately $77,000 per month.
As of December 31, 2010 we have capitalized approximately $458,000 in costs associated with the development of our RIS system to a construction in progress account which is a component of our total Property and Equipment of $194.2 million at December 31, 2010.
CONCENTRATION OF CREDIT RISKS - Financial instruments that potentially subject us to credit risk are primarily cash equivalents and accounts receivable. We have placed our cash and cash equivalents with one major financial institution. At times, the cash in the financial institution is temporarily in excess of the amount insured by the Federal Deposit Insurance Corporation, or FDIC. Substantially all of our accounts receivable are due under fee-for-service contracts from third party payors, such as insurance companies and government-sponsored healthcare programs, or directly from patients. Services are generally provided pursuant to one-year contracts with healthcare providers. Receivables generally are collected within industry norms for third-party payors. We continuously monitor collections from our clients and maintain an allowance for bad debts based upon our historical collection experience. As of December 31, 2010 and 2009, our allowance for bad debts was $19.0 million and $13.0 million, respectively.
CASH AND CASH EQUIVALENTS - We consider all highly liquid investments that mature in three months or less when purchased to be cash equivalents. The carrying amount of cash and cash equivalents approximates their fair market value.
DEFERRED FINANCING COSTS - Costs of financing are deferred and amortized on a straight-line basis over the life of the loan.
INVENTORIES - Inventories, consisting of mainly medical supplies, are stated at the lower of cost or market with cost determined by the first-in, first-out method. Reserves for slow-moving and obsolete inventories are provided based on historical experience and product demand. We evaluate the adequacy of these reserves periodically.
66
PROPERTY AND EQUIPMENT - Property and equipment are stated at cost, less accumulated depreciation and amortization. Depreciation and amortization of property and equipment are provided using the straight-line method over the estimated useful lives, which range from 3 to 15 years. Leasehold improvements are amortized at the lesser of lease term or their estimated useful lives, whichever is lower, which range from 3 to 30 years. Only a few leasehold improvements are deemed to have a life greater than 15 to 20 years. Maintenance and repairs are charged to expense as incurred.
GOODWILL - Goodwill at December 31, 2010 totaled $143.4 million. Goodwill is recorded as a result of business combinations. Management evaluates goodwill, at a minimum, on an annual basis and whenever events and changes in circumstances suggest that the carrying amount may not be recoverable. Impairment of goodwill is tested at the reporting unit level by comparing the reporting unit’s carrying amount, including goodwill, to the fair value of the reporting unit. The fair value of a reporting unit is estimated using a combination of the income or discounted cash flows approach and the market approach, which uses comparable market data. If the carrying amount of the reporting unit exceeds its fair value, goodwill is considered impaired and a second step is performed to measure the amount of impairment loss, if any. We tested goodwill for impairment on October 1, 2010. Based on our test, we noted no impairment related to goodwill as of October 1, 2010. However, if estimates or the related assumptions change in the future, we may be required to record impairment charges to reduce the carrying amount of goodwill.
LONG-LIVED ASSETS - We evaluate our long-lived assets (property and equipment) and definite-lived intangibles for impairment whenever indicators of impairment exist. The accounting standards require that if the sum of the undiscounted expected future cash flows from a long-lived asset or definite-lived intangible is less than the carrying value of that asset, an asset impairment charge must be recognized. The amount of the impairment charge is calculated as the excess of the asset’s carrying value over its fair value, which generally represents the discounted future cash flows from that asset or in the case of assets we expect to sell, at fair value less costs to sell. No indicators of impairment were identified with respect to our long-lived assets as of December 31, 2010.
INCOME TAXES - Income tax expense is computed using an asset and liability method and using expected annual effective tax rates. Under this method, deferred income tax assets and liabilities result from temporary differences in the financial reporting bases and the income tax reporting bases of assets and liabilities. The measurement of deferred tax assets is reduced, if necessary, by the amount of any tax benefit that, based on available evidence, is not expected to be realized. When it appears more likely than not that deferred taxes will not be realized, a valuation allowance is recorded to reduce the deferred tax asset to its estimated realizable value. For net deferred tax assets we consider estimates of future taxable income, including tax planning strategies in determining whether our net deferred tax assets are more likely than not to be realized. Income taxes are further explained in Note 12.
UNINSURED RISKS – Prior to November 1, 2006 we maintained a self-insured workers’ compensation insurance program for which our third party administrator over this program continues to make payments on behalf of the Company for claims incurred from November 1, 2004 through October 31, 2006. We are required to maintain a cash collateral account with this administrator as guarantee of our submission of full reimbursement of claims paid on our behalf. We record this collateral deposit as restricted cash and include it as other current assets in our consolidated balance sheet which amounted to approximately $869,000 and $869,000 as of December 31, 2010 and 2009, respectively.
With respect to the above-mentioned claims incurred from November 1, 2004 through October 31, 2006, the estimated future cash obligation associated with the unpaid portion of those claims that remain open but have not yet been resolved is recorded to accrued expenses in our consolidated balance sheet. This current liability is determined by the administrator’s estimate of loss development of open claims and was approximately $396,000 and $358,000 at December 31, 2010 and 2009, respectively.
For the two years from November 1, 2006 through October 31, 2008, we pre-funded our anticipated workers’ compensation claims’ losses through a third party administrator. As of December 31, 2010, we anticipate that the loss development on the claims for the latter of these two years will exceed what has already paid and expensed. Accordingly, we have recorded a reserve of $250,000 for estimated costs exceeding the actuary’s original estimate on open claims from this period which we recorded to accrued expenses in our consolidated balance sheet at December 31, 2010.
On November 1, 2008 we obtained a fully funded and insured workers’ compensation policy, thereby eliminating any uninsured risks for employee injuries occurring on or after that date.
We and our affiliated physicians carry an annual medical malpractice insurance policy that protects us for claims that are filed during the policy year and that fall within policy limits. The policy has a deductible for which we have recorded liabilities and included it in our consolidated balance sheet at December 31, 2010 and December 31, 2009 of approximately $270,000 and $207,000, respectively.
In December 2008, to eliminate the exposure for claims not reported during the regular malpractice policy period, the Company purchased a medical malpractice tail policy, which provides coverage for any claims reported in the event that our medical malpractice policy expires. As of December 31, 2010, this policy remains in effect.
On January 1, 2008 we entered into an arrangement with Blue Shield to administer and process claims under a new self-insured plan that provides health insurance coverage for our employees and dependents. We have recorded liabilities as of December 31, 2010 and December 31, 2009 of $2.2 and $2.1 million, respectively, for the estimated future cash obligations associated with the unpaid portion of the medical and dental claims incurred by our participants. Additionally, we entered into an agreement with Blue Shield for a stop loss policy that provides coverage for any claims that exceed $200,000 up to a maximum of $1.0 million in order for us to limit our exposure for unusual or catastrophic claims.
67
LOSS CONTRACTS – We assess the profitability of our contracts to provide management services to our contracted physician groups and identify those contracts where current operating results or forecasts indicate probable future losses. Anticipated future revenue is compared to anticipated costs. If the anticipated future cost exceeds the revenue, a loss contract accrual is recorded. In connection with the acquisition of Radiologix in November 2006, we acquired certain management service agreements for which forecasted costs exceeds forecasted revenue. As such, an $8.9 million loss contract accrual was established in purchase accounting, and is included in other non-current liabilities. The recorded loss contract accrual is being accreted into operations over the remaining term of the acquired management service agreements. As of December 31, 2010 and 2009, the remaining accrual balance is $7.5 million, and $8.3 million, respectively.
In addition, we have certain operating lease commitments for facilities that are not in use. Accordingly, we have recorded a loss contract accrual related to the remaining payments under these lease commitments. As of December 31, 2010 and 2009, the remaining loss contract accrual for these leases is $1.6 million and $683,000, respectively.
EQUITY BASED COMPENSATION – We have two long-term incentive plans that currently have outstanding stock options which we refer to as the 2000 Plan and the 2006 Plan. The 2000 Plan was terminated as to future grants when the 2006 Plan was approved by the stockholders in 2006. We have reserved for issuance under the 2006 Plan 6,500,000 shares of common stock. Certain options granted under the 2006 Plan to employees are intended to qualify as incentive stock options under existing tax regulations. In addition, we issue non-qualified stock options and warrants under the 2006 Plan from time to time to non-employees, in connection with acquisitions and for other purposes and we may also issue stock under the 2006 Plan. Stock options and warrants generally vest over two to five years and expire five to ten years from date of grant.
The compensation expense recognized for all equity-based awards is net of estimated forfeitures and is recognized over the awards’ service period. Equity-based compensation is classified in operating expenses within the same line item as the majority of the cash compensation paid to employees.
DERIVATIVE FINANCIAL INSTRUMENTS - We are exposed to certain risks relating to our ongoing business operations. The primary risk managed by using derivative instruments is interest rate risk. We have entered into interest rate swap agreements to manage interest rate risk exposure. The interest rate swap agreements utilized by us effectively modifies our exposure to interest rate risk by converting our floating-rate debt to a fixed rate basis during the period of the interest rate swap, thus reducing the impact of interest-rate changes on future interest expense. Unrealized gains or losses on the change in fair value for interest rate swaps that do not qualify as hedges are recognized in income.
We designate our interest rate swaps as cash flow hedges of floating-rate borrowings. For interest rate swaps that are designated and qualify as a cash flow hedge (i.e., hedging the exposure to variability in expected future cash flows that is attributable to a particular risk), the effective portion of the gain or loss on the derivative instrument is initially reported as a component of other comprehensive income, then reclassified into earnings in the same line item associated with the forecasted transaction and in the same period or periods during which the hedged transaction affects earnings (e.g., in “interest expense” when the hedged transactions are interest cash flows associated with floating-rate debt). The remaining gain or loss on the derivative instrument in excess of the cumulative change in the present value of future cash flows of the hedged item, if any (i.e., the ineffectiveness portion), or hedge component excluded from the assessment of effectiveness, are recognized in the statement of operations during the current period (see Note 11 below for more specific detail on the accounting for our derivative instruments). Unrealized gains or losses on the change in fair value of interest rate swaps that do not qualify as hedges are recognized in earnings.
FOREIGN CURRENCY TRANSLATION - The functional currency of our foreign subsidiaries is the local currency. In accordance with ASC 830,
Foreign Currency Matters
, assets and liabilities denominated in foreign currencies are translated using the exchange rate at the balance sheet dates. Revenues and expenses are translated using average exchange rates prevailing during the reporting period. Any translation adjustments resulting from this process are shown separately as a component of accumulated other comprehensive income (loss). Foreign currency transaction gains and losses are included in the determination of net loss.
COMPREHENSIVE INCOME - Financial Accounting Standards Board (FASB) Accounting Standards Codification (ASC) Topic 210 (originally issued as SFAS No. 130,
Reporting Comprehensive Income)
establishes rules for reporting and displaying comprehensive income and its components. Unrealized gains or losses on the change in fair value of the Company’s cash flow hedging activities are included in comprehensive income (loss). Also included are foreign currency translation adjustments. The components of comprehensive income (loss) for the three years in the period ended December 31, 2010 are included in the Consolidated Statement of Equity Deficit.
FAIR VALUE MEASUREMENTS –
We utilize a three-tier fair value hierarchy, which prioritizes the inputs used in measuring fair value. These tiers are: Level 1, defined as observable inputs such as quoted prices in active markets; Level 2, defined as inputs other than quoted prices in active markets that are either directly or indirectly observable; and Level 3, defined as unobservable inputs in which little or no market data exists, therefore requiring an entity to develop its own assumptions.
Our consolidated balance sheets include the following financial instruments: cash and cash equivalents, receivables, trade accounts payable, capital leases, long-term debt and other liabilities. We consider the carrying amounts of cash and cash equivalents, receivables, other current assets and current liabilities to approximate their fair value because of the relatively short period of time between the origination of these instruments and their expected realization or payment. Additionally, we consider the carrying amount of our capital lease obligations to approximate their fair value because the weighted average interest rate used to formulate the carrying amounts approximates current market rates.
68
At December 31, 2010, based on Level 2 inputs primarily related to comparable market prices, we determined the fair values of our senior secured term loan and our senior unsecured notes, both issued on April 6, 2010, to be $281.8 million and $188.0 million, respectively. The carrying amount of the senior secured term loan and the senior unsecured notes at December 31, 2010 was $282.9 million and $200.0 million, respectively.
The Company maintains interest rate swaps which are required to be recorded at fair value on a recurring basis. At December 31, 2010 the fair value of these swaps of a liability of $10.5 million was determined using Level 2 inputs. More specifically, the fair value was determined by calculating the value of the difference between the fixed interest rate of the interest rate swaps and the counterparty’s forward LIBOR curve, which would be the input used in the valuations. The forward LIBOR curve is readily available in the public markets or can be derived from information available in the public markets.
On January 1, 2009, the Company adopted, without material impact on its consolidated financial statements, the provisions of FASB ASC Topic 820 related to nonfinancial assets and nonfinancial liabilities that are not required or permitted to be measured at fair value on a recurring basis, which include those measured at fair value including goodwill impairment testing, indefinite-lived intangible assets measured at fair value for impairment assessment, nonfinancial long-lived assets measured at fair value for impairment assessment, asset retirement obligations initially measured at fair value, and those initially measured at fair value in a business combination.
EARNINGS PER SHARE - Earnings per share is based upon the weighted average number of shares of common stock and common stock equivalents outstanding, net of common stock held in treasury, as follows (in thousands except share and per share data):
|
Years Ended December 31,
|
||||||||||||
|
2010
|
2009
|
2008
|
||||||||||
|
Net loss attributable to Radnet, Inc.'s common stockholders
|
$ | (12,852 | ) | $ | (2,267 | ) | $ | (12,836 | ) | |||
|
BASIC LOSS PER SHARE ATTRIBUTABLE TO RADNET, INC.'S COMMON STOCKHOLDERS
|
||||||||||||
|
Weighted average number of common shares outstanding during the year
|
36,853,477 | 36,047,033 | 35,721,028 | |||||||||
|
Basic loss per share attributable to Radnet, Inc.'s common stockholders
|
$ | (0.35 | ) | $ | (0.06 | ) | $ | (0.36 | ) | |||
|
DILUTED LOSS PER SHARE ATTRIBUTABLE TO RADNET, INC.'S COMMON STOCKHOLDERS
|
||||||||||||
|
Weighted average number of common shares outstanding during the year
|
36,853,477 | 36,047,033 | 35,721,028 | |||||||||
|
Add additional shares issuable upon exercise of stock options and warrants
|
- | - | - | |||||||||
|
Weighted average number of common shares used in calculating diluted loss per share
|
36,853,477 | 36,047,033 | 35,721,028 | |||||||||
|
Diluted loss per share attributable to Radnet, Inc.'s common stockholders
|
$ | (0.35 | ) | $ | (0.06 | ) | $ | (0.36 | ) | |||
For all periods presented we excluded all options and warrants in the calculation of diluted earnings per share because their effect would be antidilutive. However, these instruments could potentially dilute earnings per share in future years.
INVESTMENT IN JOINT VENTURES – We have eight unconsolidated joint ventures with ownership interests ranging from 22% to 50%. These joint ventures represent partnerships with hospitals, health systems or radiology practices and were formed for the purpose of owning and operating diagnostic imaging centers. Professional services at the joint venture diagnostic imaging centers are performed by contracted radiology practices or a radiology practice that participates in the joint venture. Our investment in these joint ventures is accounted for under the equity method. Investment in joint ventures decreased $3.3 million to $15.4 million at December 31, 2010 compared to $18.7 million at December 31, 2009. This decrease is primarily related to our respective share of distributions of $10.9 million offset by our recording of equity earnings of $8.2 million.
We received management service fees from the centers underlying these joint ventures of approximately $6.8 million, $7.1 million and $7.3 million for the years ended December 31, 2010, 2009 and 2008, respectively, and eliminated the portion of the fees earned associated with our ownership from our net revenue with an offsetting increase to our equity earnings.
69
The following table is a summary of key financial data for these joint ventures as of December 31, 2010 and 2009 and for the years then ended December 31, 2010, 2009 and 2008 (in thousands):
|
December 31,
|
|||||||||||
|
Balance Sheet Data:
|
2010
|
2009
|
|||||||||
|
Current assets
|
$ | 15,941 | $ | 20,920 | |||||||
|
Noncurrent assets
|
27,369 | 27,243 | |||||||||
|
Current liabilities
|
(6,844 | ) | (5,929 | ) | |||||||
|
Noncurrent liabilities
|
(8,220 | ) | (7,692 | ) | |||||||
|
Total net assets
|
$ | 28,246 | $ | 34,542 | |||||||
|
Book value of Radnet joint venture interests
|
$ | 11,805 | $ | 14,934 | |||||||
|
Cost in excess of book value of acquired joint venture interests
|
3,383 | 3,383 | |||||||||
|
Elimination of intercompany profit remaining on Radnet's consolidated balance sheet
|
256 | 424 | |||||||||
|
Total value of Radnet joint venture interests
|
$ | 15,444 | $ | 18,741 | |||||||
|
Total book value of other joint venture partner interests
|
$ | 16,441 | $ | 19,608 | |||||||
|
Income statement data for the years ended December 31,
|
2010
|
2009
|
2008
|
|||||||||
|
Net revenue
|
$ | 76,937 | $ | 76,557 | $ | 80,948 | ||||||
|
Net income
|
$ | 12,639 | $ | 12,744 | $ | 17,758 | ||||||
On December 31, 2010, we completed our acquisition of two imaging centers from Presgar Imaging and affiliated entities located in Brooklyn and Orchard Park, New York for cash consideration of $1.6 million plus the assumption of approximately $700,000 of debt. Highway Imaging in Brooklyn and Parkland Diagnostic in Orchard Park are both multimodality facilities, offering a combination of MRI, CT, PET/CT, ultrasound, mammography, bone density and x-ray. We have made a preliminary purchase price allocation of the acquired assets and assumed liabilities; approximately $2.8 million of fixed assets, and $102,000 of goodwill was recorded with respect to this transaction. Also, we assumed approximately $700,000 of equipment notes and $610,000 of accrued expenses.
On October 1, 2010, we completed the acquisition of five medical imaging facilities located in Northern New Jersey and a 50% equity interest in a sixth center from Progressive Health, LLC and certain affiliates and related entities for an aggregate of $17.15 million in cash and a warrant to purchase our common stock, which had a fair value of approximately $306,000 on the day it was granted. See Note 4 to the consolidated financial statements of this Form 10-K for more detail relating to our preliminary purchase price allocation.
On October 1, 2010, we completed our acquisition of Image Medical Corporation, the parent of eRAD, Inc., for approximately $8.5 million in cash and a $2.2 million promissory note to the former shareholders of eRAD. eRAD, Inc., headquartered in Greenville, South Carolina, has been a premier provider of Picture Archiving and Communications Systems (PACS) and related workflow solutions to the radiology industry since 1999.
See Note 4 for more detail relating to our preliminary purchase price allocation for eRAD.
On September 10, 2010, we completed the acquisition of substantially all of the assets of Korangy Medical Equipment, LLC in Catonsville, Maryland for approximately $605,000. We have made a preliminary purchase price allocation of the acquired assets and assumed liabilities and $605,000 of fixed assets and no goodwill was recorded with respect to this transaction.
On August 11, 2010, we completed the acquisition of Health Diagnostics of New Jersey in Edison, New Jersey for approximately $3.5 million. We have made a preliminary purchase price allocation of the acquired assets and assumed liabilities and $3.0 million of fixed assets, $300,000 of other intangible assets related to covenant not to compete contracts, and $977,000 of goodwill was recorded with respect to this transaction. Also, we recorded a reserve of approximately $635,000 for obligations under an existing operating facility lease through February of 2014 that we do not intend to utilize.
On July 1, 2010, we completed the acquisition of an imaging center located in Fremont, California from Insight Health Corp. for approximately $141,000. We have made a preliminary purchase price allocation of the acquired assets and assumed liabilities and $170,000 of fixed assets, $150,000 of other intangible assets related to covenant not to compete contracts, and no goodwill was recorded with respect to this transaction. Also, we recorded a reserve of approximately $184,000 for obligations under an existing operating facility lease through August of 2012 that we do not intend to utilize.
70
On July 1, 2010, we completed the acquisition of Delaware Orthopedic Specialists in Newark, Delaware for approximately $525,000. We have made a purchase price allocation of the acquired assets and assumed liabilities and $430,000 of fixed assets, $95,000 of other intangible assets related to covenant not to compete contracts, and no goodwill was recorded with respect to this transaction.
On May 1, 2010, we completed the acquisition of Touchstone Imaging of Bowie, LLC in Bowie, Maryland for approximately $595,000. We have made a purchase price allocation of the acquired assets and assumed liabilities and $595,000 of fixed assets and no goodwill was recorded with respect to this transaction.
On April 30, 2010, we completed the acquisition of Delaware Diagnostic Services, Inc. (Limestone) in Wilmington, Delaware for approximately $87,000. We have made a purchase price allocation of the acquired assets and assumed liabilities and $87,000 of fixed assets and no goodwill was recorded with respect to this transaction.
On April 30, 2010, we acquired three multi-modality facilities from Sonix Medical Resources, Inc. through a bankruptcy proceeding in New York for approximately $2.3 million in cash. The facilities located in Brooklyn, New York, Chatham, New Jersey and Haddon Heights, New Jersey operate a combination of MRI, CT, mammography, ultrasound, fluoroscopy, X-ray and related modalities. We have made a purchase price allocation of the acquired assets and assumed liabilities and approximately $1.4 million of fixed assets and $884,000 of goodwill was recorded with respect to this transaction.
On April 1, 2010, we completed the acquisition of Truxtun Medical Group in Bakersfield, California for approximately $20.3 million in cash and the issuance of 375,000 shares of RadNet, Inc. common stock valued at approximately $1.2 million on the date of acquisition. Truxtun operates four multi-modality facilities in Bakersfield, a Metropolitan Statistical Area in Kern County, California. Truxtun provides a broad range of services including MRI, CT, PET/CT, mammography, nuclear medicine, fluoroscopy, ultrasound, X-ray and related procedures. We have made a purchase price allocation of the acquired assets and assumed liabilities and approximately $2.4 million of working capital, $6.9 million of fixed assets, $1.6 million of other intangible assets related to Trade-name and covenant not to compete contracts, and $10.7 million of goodwill was recorded with respect to this transaction.
On March 15, 2010, we acquired the imaging practice of Theodore Feit, M.D., Inc. in Burbank, California for cash consideration of $350,000. We have made a purchase price allocation of the acquired assets and liabilities, and approximately $350,000 of fixed assets and no goodwill was recorded with respect to this transaction.
On March 1, 2010, we completed the acquisition of Anaheim Open MRI in Anaheim, California for cash consideration of $910,000. The facility operates MRI, CT, ultrasound and X-ray, and has been rebranded as Anaheim Advanced Imaging. We have made a purchase price allocation of the acquired assets and assumed liabilities, and approximately $605,000 of fixed assets and $305,000 of goodwill was recorded with respect to this transaction.
On January 1, 2010, we completed the acquisition of Union Imaging Center in Union, New Jersey from Modern Medical Modalities Corporation for approximately $5.4 million in cash and the issuance of 75,000 shares of RadNet, Inc. common stock valued at approximately $153,000 on the date of acquisition. The center operates imaging modalities including MRI, CT, PET/CT, mammography, ultrasound, nuclear medicine and X-ray. We have made a purchase price allocation of the acquired assets and assumed liabilities, and approximately $1.9 million of fixed assets and $3.7 million of goodwill was recorded with respect to this transaction.
On October 1, 2009, we completed the acquisition of the imaging assets of Chesapeake Urology Associates in Baltimore, Maryland for approximately $950,000. Chesapeake Urology operated CT scanners in three locations in the greater Baltimore area. We have made a purchase price allocation of the acquired assets and liabilities, and approximately $650,000 of fixed assets, $275,000 of covenant not to compete contracts and $19,000 of goodwill was recorded with respect to this transaction.
On October 1, 2009, we completed the acquisition of the women’s imaging business of Ridgewood Diagnostics, a multi-modality women’s imaging practice located near Rochester, New York’s Unity Hospital for $1.1 million and 50,000 shares of RadNet common stock valued at approximately $129,000 on the date of acquisition. In conjunction with the Ridgewood Diagnostics transaction, on October 16, 2009, we completed the acquisition of the women’s imaging business of Unity Hospital for $100,000. We have made a purchase price allocation of the acquired assets and liabilities, and approximately $92,000 of fixed assets, $150,000 of covenant not to compete contracts and $1.1 million of goodwill was recorded with respect to these transactions.
On June 12, 2009, we acquired the assets and business of nine imaging centers located in New Jersey from an unrelated third party for approximately $2.1 million. At the time of the acquisition, we immediately sold the assets and business of one of those nine centers to an unrelated third party for approximately $650,000. We have made a purchase price allocation of the acquired assets and liabilities associated with the remaining eight centers at their respective fair values.
In accordance with accounting standards, any excess of fair value of acquired net assets over the acquisition consideration results in a gain on bargain purchase. Prior to recording a gain, the acquiring entity must reassess whether all acquired assets and assumed liabilities have been identified and recognized and perform re-measurements to verify that the consideration paid, assets acquired, and liabilities assumed have been properly valued. The Company underwent such a reassessment, and as a result, has recorded a gain on bargain purchase of approximately $1.4 million.
71
We believe that the gain on bargain purchase resulted from various factors that impacted the sale of those New Jersey assets. The seller was performing a full liquidation of its assets for the benefit of its creditors. Upon liquidation of all of its assets, the seller intended to close its business. The New Jersey assets were the only remaining assets to be sold before a full wind-down of the seller’s business could be completed. We believe that the seller was willing to accept a bargain purchase price from us in return for our ability to act more quickly and with greater certainty than any other prospective acquirer. The decline in the credit markets made it difficult for other acquirers who relied upon third party financing to complete the transaction. The relatively small size of the transaction for us, the lack of required third-party financing and our expertise in completing similar transactions in the past gave the seller confidence that we could complete the transaction expeditiously and without difficulty.
In our purchase price allocation we recorded approximately $3.1 million of land and fixed assets, $250,000 of intangible assets and $121,000 of other current assets.
On March 31, 2009, we acquired the assets and business of Inter-County Imaging in Yonkers, NY for approximately $553,000. We have made a purchase price allocation of the acquired assets and liabilities, and approximately $500,000 of fixed assets and no goodwill was recorded with respect to this transaction.
On March 27, 2009, we acquired the assets and business of Elite Diagnostic Imaging, LLC in Victorville, CA for approximately $1.3 million. We have made a purchase price allocation of the acquired assets and liabilities, and approximately $1.2 million of fixed assets and $100,000 of goodwill was recorded with respect to this transaction.
On October 31, 2008, we acquired the assets and business of Middletown Imaging in Middletown, Delaware for $210,000 in cash and the assumption of capital lease debt of $1.2 million. We allocated the purchase price to the acquired assets and liabilities. Approximately $530,000 of goodwill was recorded with respect to this transaction.
On August 15, 2008, we acquired the women’s imaging practice of Parvis Gamagami, M.D., Inc. in Van Nuys, CA for $600,000. Upon acquisition, we relocated the practice to a nearby center we recently acquired from InSight Health in Encino, CA. We rebranded the InSight center as the Encino Breast Care Center, and focused it on Digital Mammography, Ultrasound, MRI and other modalities pertaining to women’s health. We have allocated the full purchase price of $600,000 to goodwill.
On July 23, 2008, we acquired the assets and business of NeuroSciences Imaging Center in Newark, Delaware for $4.5 million in cash. The center, which performs MRI, CT, Bone Density, X-ray, Fluoroscopy and other specialized procedures, is located in a highly specialized medical complex called the Neuroscience and Surgery Institute of Delaware. The acquisition complements our recent purchase of the Papastavros Associates Imaging centers completed in March, 2008. We made a purchase price allocation of the acquired assets and liabilities, and approximately $2.6 million of goodwill was recorded with respect to this transaction.
On June 18, 2008, we acquired the assets and business of Ellicott Open MRI for the assumption of approximately $181,000 of capital lease debt.
On June 2, 2008, we acquired the assets and business of Simi Valley Advanced Medical, a Southern California based multi-modality imaging center, for the assumption of capital lease debt of $1.7 million. We allocated the purchase price to the acquired assets and liabilities, and approximately $313,000 of goodwill was recorded with respect to this transaction.
On April 15, 2008, we acquired the net assets of five Los Angeles area imaging centers from InSight Health Corp. We completed the purchase of a sixth center in Van Nuys, CA from Insight Health Corp. on June 2, 2008. The total purchase price for the six centers was $8.5 million in cash. The centers provide a combination of imaging modalities, including MRI, CT, X-ray, Ultrasound and Mammography. We allocated the purchase price to the acquired assets and liabilities, and approximately $5.6 million of goodwill was recorded with respect to this transaction.
On April 1, 2008, we acquired the net assets and business of BreastLink Medical Group, Inc., a prominent Southern California breast medical oncology business and a leading breast surgery business, for the assumption of approximately $4.0 million of accrued liabilities and capital lease obligations. We allocated the purchase price to the acquired assets and liabilities, and approximately $2.1 million of goodwill was recorded with respect to this transaction.
On March 12, 2008, we acquired the net assets and business of Papastavros Associates Medical Imaging for $9.0 million in cash and the assumption of capital leases of $337,000. Founded in 1958, Papastavros Associates Medical Imaging is one of the largest and most established outpatient imaging practices in Delaware. The 12 Papastavros centers offer a combination of MRI, CT, PET, nuclear medicine, mammography, bone densitometry, fluoroscopy, ultrasound and X-ray. We allocated the purchase price to the acquired assets and liabilities, and approximately $3.6 million of goodwill, and $1.2 million for covenants not to compete, were recorded with respect to this transaction.
On February 1, 2008, we acquired the net assets and business of The Rolling Oaks Imaging Group, located in Westlake and Thousand Oaks, California, for $6.0 million in cash and the assumption of capital leases of $2.7 million. The practice consists of two centers, one of which is a dedicated women’s center. The centers are multimodality and include a combination of MRI, CT, PET/CT, mammography, ultrasound and X-ray. The centers are positioned in the community as high-end, high-quality imaging facilities that employ state-of-the-art technology, including 3 Tesla MRI and 64 slice CT units. The facilities have been fixtures in the Westlake/Thousand Oaks market since 2003. We allocated the purchase price to the acquired assets and liabilities, and approximately $5.6 million of goodwill was recorded with respect to this transaction.
72
As discussed in Note 3 above, on October 1, 2010, RadNet completed its acquisitions of Image Medical Corporation, parent of eRAD, Inc., and its acquisition of five imaging centers in Northern New Jersey and a 50% equity interest in a sixth center from Progressive and certain affiliates and related entities. We determined that each of these acquisitions were material. Accordingly, as required under ASC 805-10-50, we are providing below certain additional disclosures on an aggregate basis relating to these two acquisitions.
The total purchase price and the allocation of the purchase price for the above businesses (collectively, the “Group”) is as follows (in thousands):
|
Cash
|
$ | 25,650 | ||
|
Fair value of warrant issued
|
306 | |||
|
Promissory note
|
2,250 | |||
|
Total combined purchase price for the Group
|
$ | 28,206 |
Under the purchase method of accounting, the total purchase price shown above is allocated to the Group’s net tangible and intangible assets acquired and liabilities assumed based on the estimated fair values of the acquired assets and liabilities assumed as of the date of each individual acquisition. The following table summarizes the aggregate purchase price allocation (in thousands).
|
Current assets
|
$ | 1,907 | ||
|
Property and equipment, net
|
5,284 | |||
|
Identifiable intangible assets
|
4,343 | |||
|
Goodwill
|
20,183 | |||
|
Current liabilities
|
(2,299 | ) | ||
|
Capital lease obligations and other
|
(1,212 | ) | ||
| $ | 28,206 |
We have estimated the fair value of tangible assets acquired and liabilities assumed. Some of these estimates are subject to change, particularly those estimates relating to the valuation of property and equipment and identifiable intangible assets. The final allocation of the purchase price will be based upon the fair value of assets and liabilities assumed, and in these cases, we will use the services of an external valuation firm to assist us in determining the final fair values which we expect to have completed during our first quarter ended March 31, 2011.
CURRENT ASSETS: We valued current assets at their respective carrying amounts as we believe that these amounts approximate their current fair values.
IDENTIFIABLE INTANGIBLE ASSETS: We expect identifiable intangible assets acquired to include trade names and covenants not to compete. Trade names represent the value of branding in the community. Covenants not to compete are contracts entered into with certain former members of management of the Group on the date of acquisition of the applicable business.
Identifiable intangible assets consist of the following (in thousands):
|
Estimated
|
|||||||||
|
Estimated
|
Amortization
|
Annual
|
|||||||
|
Fair Value
|
Period
|
Amortization
|
|||||||
|
Trade Name
|
$ | 258 |
Indefinite
|
Not applicable
|
|||||
|
Customer Relationships
|
1,397 |
5 Years
|
279 | ||||||
|
Developed Technology and In-Process R&D
|
2,688 |
5 Years
|
538 | ||||||
| $ | 4,343 | $ | 817 | ||||||
Intangible assets are being amortized using the straight-line method, considering the pattern in which the economic benefits of the intangible assets are consumed.
GOODWILL: Approximately $20.2 million has been allocated to goodwill. Goodwill represents the excess of the purchase price over the fair value of the underlying net tangible and intangible assets. Management evaluates goodwill, at a minimum, on an annual basis and whenever events and changes in circumstances suggest that the carrying amount may not be recoverable. Impairment of goodwill is tested at the reporting unit level by comparing the reporting unit’s carrying amount, including goodwill, to the fair value of the reporting unit. The fair value of a reporting unit is estimated using a combination of the income or discounted cash flows approach and the market approach, which uses comparable market data. If the carrying amount of the reporting unit exceeds its fair value, goodwill is considered impaired and a second step is performed to measure the amount of impairment loss, if any. We tested goodwill for impairment on October 1, 2010.
73
The revenue and earnings of the Group included in the Company’s consolidated income statement from the respective actual acquisition dates of each business in the Group to the period ended December 31, 2010 are as follows (in thousands):
|
Net Revenue
|
$ | 5,433 | ||
|
Net Income
|
409 |
The following unaudited pro-forma financial information for the years ended December 31, 2010 and 2009 represents the combined results of operations of the Company and the Group as if the Group’s acquisition had occurred on a single date of January 31, 2009. The unaudited pro-forma financial information does not necessarily reflect the results of operations that would have occurred had the Group constituted a single entity during such periods (in thousands).
|
Years Ended
|
||||||||
|
December 31,
|
||||||||
|
2010
|
2009
|
|||||||
|
Net Revenue
|
566,696 | 547,587 | ||||||
|
Net loss
|
(11,023 | ) | (973 | ) | ||||
|
Pro-forma net loss per share
|
(0.30 | ) | (0.03 | ) | ||||
Goodwill at December 31, 2010 totaled $143.4 million. Goodwill is recorded as a result of business combinations. Activity in goodwill for the years ended December 31, 2008, 2009 and 2010, are provided below (in thousands):
|
Balance as of December 31, 2007
|
$ | 84,395 | ||
|
Adjustments to our preliminary allocation of the purchase price of Borg Imaging Group
|
(254 | ) | ||
|
Adjustments to our preliminary allocation of the purchase price of Valley Imaging Center, Inc.
|
212 | |||
|
Goodwill acquired through the acquisition of Rolling Oaks Imaging Group
|
5,612 | |||
|
Goodwill acquired through the acquisition of Papastavros Associates Medical Imaging
|
3,649 | |||
|
Goodwill acquired through the acquisition of BreastLink Medical Group, Inc
|
2,048 | |||
|
Goodwill acquired through the acquisition of InSight Health Corp.
|
5,560 | |||
|
Goodwill acquired through the acquisition of Simi Valley Advanced Medical
|
313 | |||
|
Goodwill acquired through the acquisition of NeuroSciences Imaging Center
|
2,613 | |||
|
Goodwill acquired through the acquisition of imaging practice of Parvis Gamagami, M.D
|
600 | |||
|
Goodwill acquired through the acquisition of Middletown Imaging
|
530 | |||
|
Balance as of December 31, 2008
|
105,278 | |||
|
Goodwill acquired through the acquisition of Elite Diagnostic Imaging, LLC
|
100 | |||
|
Goodwill acquired through the acquisition of Ridgewood Diagnostics and Unity Hospital
|
1,105 | |||
|
Goodwill acquired through the acquisition of Chesapeake Urology Associates
|
19 | |||
|
Balance as of December 31, 2009
|
106,502 | |||
|
Goodwill acquired through the acquisition of Union Imaging
|
3,748 | |||
|
Goodwill acquired through the acquisition of Anaheim Open MRI
|
305 | |||
|
Goodwill acquired through the acquisition of Truxtun Medical Group
|
10,652 | |||
|
Goodwill acquired through the acquisition of Sonix Medical Resources
|
884 | |||
|
Goodwill acquired through the acquisition of Health Diagnostics
|
977 | |||
|
Goodwill acquired through the acquisition of Image Medical Corporation
|
7,327 | |||
|
Goodwill acquired through the acquisition of Progressive Health
|
12,856 | |||
|
Goodwill acquired through the acquisition of two imaging centers from Presgar Imaging
|
102 | |||
|
Balance as of December 31, 2010
|
$ | 143,353 |
The amount of goodwill from these acquisitions that is deductible for tax purposes was $40.8 million.
Other intangible assets are primarily related to the value of management service agreements obtained through our acquisition of Radiologix, Inc. in 2006 and are recorded at cost of $57.9 million less accumulated amortization of $9.6 million at December 31, 2010. Also included in other intangible assets is the value of covenant not to compete contracts associated with our recent facility acquisitions (see note 3) totaling $4.3 million less accumulated amortization of $2.4 million, as well as the value of trade names associated with acquired imaging facilities totaling $4.3 million less accumulated amortization of $1.1 million. Also in connection with our recent purchase of eRAD (Note 4) and included in other intangible assets is the value of eRAD’s developed technology and its customer relationships. Amortization expense for the year ended December 31, 2010, 2009 and 2008 was $3.5 million, $3.2 million and $4.1 million, respectively. Intangible assets are amortized using the straight-line method. Management service agreements are amortized over 25 years using the straight line method Developed technology and customer relationships are amortized over 5 years using the straight line method.
74
The following table shows annual amortization expense, by asset classes that will be recorded over the next five years (in thousands):
|
2011
|
2012
|
2013
|
2014
|
2015
|
Thereafter |
Total
|
||||||||||||||||||||||
|
Management Service Contracts
|
$ | 2,315 | $ | 2,315 | $ | 2,315 | $ | 2,315 | $ | 2,315 | $ | 36,754 | $ | 48,329 | ||||||||||||||
|
Covenant not to compete contracts
|
801 | 619 | 244 | 173 | 61 | - | 1,898 | |||||||||||||||||||||
|
Customer relationships
|
280 | 280 | 280 | 280 | 207 | 1,327 | ||||||||||||||||||||||
|
Developed technology and in-process R&D
|
538 | 538 | 538 | 538 | 402 | 2,554 | ||||||||||||||||||||||
|
Trade Names
|
150 | 150 | 112 | - | 2,828 | 3,240 | ||||||||||||||||||||||
|
Total Annual Amortization
|
$ | 4,084 | $ | 3,902 | $ | 3,489 | $ | 3,306 | $ | 2,985 | $ | 39,582 | $ | 57,348 | ||||||||||||||
In December 2009, the FASB issued ASU 2009-17,
Consolidations (Topic 810) – Improvements to Financial Reporting by Enterprises Involved with Variable Interest Entities
. ASU 2009-17 changes how a reporting entity determines when an entity that is insufficiently capitalized or is not controlled through voting (or similar rights) should be consolidated. ASU 2009-17 also requires a reporting entity to provide additional disclosures about its involvement with variable interest entities and any significant changes in risk exposure due to that involvement. ASU 2009-17 is effective at the start of a reporting entity’s first fiscal year beginning after November 15, 2009, or January 1, 2010, for a calendar year entity. Early adoption is not permitted. Our adoption of ASU 2009-17 did not have a material impact on our consolidated financial position, results of operations or cash flows.
In January 2010, the FASB issued authoritative guidance intended to improve disclosures about fair value measurements. The guidance requires entities to disclose significant transfers in and out of fair value hierarchy levels and the reasons for the transfers. Additionally, the guidance clarifies that a reporting entity should provide fair value measurements for each class of assets and liabilities and disclose the inputs and valuation techniques used for fair value measurements using significant other observable inputs (Level 2) and significant unobservable inputs (Level 3). The Company maintains interest rate swaps which are required to be recorded at fair value on a recurring basis. See Note 11 below for required disclosures under this guidance.
In February 2010, the FASB issued authoritative guidance on subsequent events. The guidance requires an SEC filer to evaluate subsequent events through the date the financial statements are issued but no longer requires an SEC filer to disclose the date through which the subsequent event evaluation occurred. The guidance became effective for the Company upon issuance and had no impact on the Company’s results of operations or financial position.
Property and equipment and accumulated depreciation and amortization are as follows (in thousands):
|
December 31,
|
||||||||
|
2010
|
2009
|
|||||||
|
Land
|
$ | 250 | $ | 250 | ||||
|
Medical equipment
|
226,315 | 200,471 | ||||||
|
Office equipment, furniture and fixtures
|
57,292 | 56,136 | ||||||
|
Leasehold improvements
|
131,411 | 101,904 | ||||||
|
Equipment under capital lease
|
43,735 | 57,421 | ||||||
| 459,003 | 416,182 | |||||||
|
Accumulated depreciation and amortization
|
(264,773 | ) | (233,611 | ) | ||||
| $ | 194,230 | $ | 182,571 | |||||
Depreciation and amortization expense on property and equipment, including amortization of equipment under capital leases, for the years ended December 31, 2010, 2009 and 2008 $50.5 million, $50.6 million and $49.4 million, respectively.
75
|
December 31,
|
||||||||
|
2010
|
2009
|
|||||||
|
Accounts payable
|
$ | 24,659 | $ | 17,717 | ||||
|
Accrued expenses
|
34,814 | 32,305 | ||||||
|
Accrued payroll and vacation
|
15,626 | 13,153 | ||||||
|
Accrued professional fees
|
7,803 | 6,466 | ||||||
|
Total
|
$ | 82,902 | $ | 69,641 | ||||
On November 15, 2006, we entered into a $405 million senior secured credit facility with GE Commercial Finance Healthcare Financial Services (the “November 2006 Credit Facility”). This facility was used to finance our acquisition of Radiologix, refinance existing indebtedness, pay transaction costs and expenses relating to our acquisition of Radiologix, and provide financing for working capital needs post-acquisition. The facility consisted of a revolving credit facility of up to $45 million, a $225 million first lien Term Loan and a $135 million second lien Term Loan. On August 23, 2007, we secured an incremental $35 million (“Incremental Facility”) as part of our existing credit facilities with GE Commercial Finance Healthcare Financial Services. The Incremental Facility consisted of an additional $25 million as part of our first lien Term Loan and $10 million of additional capacity under our existing revolving line of credit bringing the total capacity to $55 million. On February 22, 2008, we secured a second incremental $35 million (“Second Incremental Facility”) of capacity as part of our existing credit facilities with GE Commercial Finance Healthcare Financial Services, all collectively referred to as our “GE Credit Facility.
On April 6, 2010 we completed our debt refinancing plan for an aggregate of $585 million. The debt refinancing plan included our “New Credit Agreement” which includes the issuance of a $285 million senior secured term loan due April 6, 2016, a $100 million senior secured revolving credit facility due April 6, 2015, and our “Senior Notes” which includes $200 million in aggregate principal amount of senior unsecured notes due April 1, 2018. We used $412.0 million of the proceeds from the debt restructuring to pay off our prior credit facility and an additional $1.7 million to settle a call premium associated with our prior credit facilities. As a result of this refinancing, we recorded during the second quarter of 2010 a loss on extinguishment of debt of approximately $9.9 million which is made up of the $1.7 million call premium, $7.6 million write-off of deferred loan costs associated with the prior credit facility, as well as $600,000 of additional debt settlement costs.
At December 31, 2010, the balance of the senior secured term loan was approximately $282.9 million and the par value of our senior unsecured notes was $200.0 million.
Just prior to our refinancing discussed above, our outstanding indebtedness under our GE credit facility included a $242.0 million senior secured term loan B and a $170.0 million second lien term loan.
New Credit Agreement
As mentioned above, on April 6, 2010, we entered into a new Credit and Guaranty Agreement (the “
New Credit Agreement
”) pursuant to which we obtained $385 million in senior secured bank financing, consisting of a $285 million, six-year term loan facility and a $100 million, five-year revolving credit facility (the
New Credit Facilities
). In connection with the New Credit Facilities, we terminated the GE Credit Facility.
Interest.
The New Credit Facilities bear interest through maturity at a rate determined by adding the applicable margin to either (a) the Base Rate, which is the highest of the (i) Prime Rate, (ii) the rate which is 0.5% in excess of the Federal Funds Effective Rate, (iii) 3.00% and (iv) 1.00% in excess of the one-month Adjusted Eurodollar Rate at such time, or (b) the Adjusted Eurodollar Rate, which is the higher of (i) the London interbank offered rate, adjusted for statutory reserve requirements, for the respective interest period, as determined by the administrative agent and (ii) 2.00%. Applicable margin means (i) (a) with respect to Tranche B Term Loans that are Eurodollar Rate Loans, 3.75% per annum and (b) with respect to Tranche B Term Loans that are Base Rate Loans, 2.75% per annum; and (ii) (a) with respect to Revolving Loans that are Eurodollar Rate Loans, 3.75% per annum and (b) with respect to Revolving Loans and Swing Line Loans that are Base Rate Loans, 2.75% per annum.
Payments.
Commencing on June 30, 2010, we are required to make quarterly amortization payments on the term loan facility, each in the amount of $712,500, with the remaining principal balance paid at maturity. Under the New Credit Agreement, we are also required to make mandatory prepayments, subject to specified exceptions, from Consolidated Excess Cash Flow, and upon certain events, including, but not limited to, (i) the receipt of net cash proceeds from the sale or other disposition of any property or assets by us or any of our subsidiaries, (ii) the receipt of net cash proceeds from insurance or condemnation proceeds paid on account of any loss of any property or assets of us or any of our subsidiaries, (iii) the receipt of net cash proceeds from the incurrence of indebtedness by us or any of our subsidiaries (other than certain indebtedness otherwise permitted under the loan documents relating to the New Credit Facilities) and (iv) the receipt of net cash proceeds by us or any of our subsidiaries from Extraordinary Receipts, as defined in the New Credit Agreement.
76
Guarantees and Collateral.
The obligations under the New Credit Facilities are guaranteed by us, all of our current and future wholly-owned domestic restricted subsidiaries and certain of our affiliates. The obligations under the New Credit Facilities and the guarantees are secured by a perfected first priority security interest in all of Radnet Management’s and the guarantors’ tangible and intangible assets, including, but not limited to, pledges of equity interests of Radnet Management and all of our current and future domestic subsidiaries.
Restrictive Covenants.
In addition to certain customary covenants, the New Credit Agreement places limits on our ability to declare dividends or redeem or repurchase capital stock, prepay, redeem or purchase debt, incur liens and engage in sale-leaseback transactions, make loans and investments, incur additional indebtedness, amend or otherwise alter debt and other material agreements, engage in mergers, acquisitions and asset sales, enter into transactions with affiliates and alter the business we and our subsidiaries currently conduct.
Financial Covenants.
The New Credit Agreement contains financial covenants including a minimum interest coverage ratio, a maximum total leverage ratio and a limit on annual capital expenditures. Failure to comply with these covenants could permit the lenders under the New Credit Facilities to declare all amounts borrowed, together with accrued interest and fees, to be immediately due and payable.
Events of Default.
In addition to certain customary events of default, events of default under the New Credit Facilities include failure to pay principal or interest when due, a material breach of any representation or warranty contained in the loan documents, covenant defaults, events of bankruptcy and a change of control.
Senior Unsecured Notes
Also, as mentioned above, on April 6, 2010, we issued $200 million in aggregate amount of senior unsecured Notes which have a coupon of 10.375% and were issued at a price of 98.680%. The Notes were issued by Radnet Management, Inc. and guaranteed jointly and severally on a senior unsecured basis by us and all of our current and future wholly-owned domestic restricted subsidiaries. The Notes were offered and sold in a private placement exempt from registration under the Securities Act to qualified institutional buyers pursuant to Rule 144A and Regulation S under the Securities Act. The Notes will mature on April 1, 2018, and bear interest at the rate of 10.375% per year. We will pay interest on the Notes on April 1
and October 1, commencing October 1, 2010. The Notes are governed under an indenture agreement with U.S. Bank National Association as trustee. Under the terms of the indenture agreement, we agreed to file a registration statement with the Securities and Exchange Commission (“SEC”) relating to an offer to exchange the Notes for registered publicly tradable notes that have substantially identical terms as the Notes. On August 30, 2010, we filed a registration statement on Form S-4 with the SEC relating to the offer to exchange the Notes. On January 13, 2011, our registration statement was declared effective by the SEC. On February 14, 2011, we completed an exchange offer where by all Notes were exchanged for registered publicly tradable notes.
Ranking.
The Notes and the guarantees:
|
|
·
|
rank equally in right of payment with
any existing and future unsecured
senior indebtedness of the guarantors;
|
|
|
·
|
rank senior in right of payment to all existing and future subordinated indebtedness of the Guarantors;
|
|
|
·
|
are effectively subordinated in right of payment to any secured indebtedness of the guarantors (including indebtedness under the New Credit Facilities) to the extent of the value of the assets securing such indebtedness; and
|
|
|
·
|
are structurally subordinated in right of payment to all existing and future indebtedness and other liabilities of any of the Company’s subsidiaries that is not a guarantor of the Notes.
|
Optional Redemption.
Radnet Management may redeem the Notes, in whole or in part, at any time on or after April 1, 2014, at the redemption prices specified under the Indenture. Prior to April 1, 2013, we may redeem up to 35% of aggregate principal amount of the Notes issued under the Indenture from the net proceeds of one or more equity offerings at a redemption price equal to 110.375% of the Notes redeemed, plus accrued and unpaid interest, if any. Radnet Management is also permitted to redeem the Notes prior to
April 1, 2014, in whole or in part, at a redemption price equal to 100% of the principal amount redeemed, plus a make-whole premium and accrued and unpaid interest, if any.
Change of Control and Asset Sales.
If a change in control of Radnet Management occurs, Radnet Management must give holders of the Notes the opportunity to sell their Notes at 101% of their face amount, plus accrued interest. If we or one of our restricted subsidiaries sells assets under certain circumstances, Radnet Management will be required to make an offer to purchase the Notes at their face amount, plus accrued and unpaid interest to the purchase date.
Restrictive Covenants.
The Indenture contains covenants that limit, among other things, the ability of us and our restricted subsidiaries, to:
|
·
|
pay dividends or make certain other restricted payments or investments;
|
|
·
|
incur additional indebtedness and issue preferred stock;
|
|
·
|
create liens (other than permitted liens) securing indebtedness or trade payables unless the notes are secured on an equal and ratable basis with the obligations so secured, and, if such liens secure subordinated indebtedness, the notes are secured by a lien senior to such liens;
|
|
·
|
sell certain assets or merge with or into other companies or otherwise dispose of all or substantially all of our assets;
|
|
·
|
enter into certain transactions with affiliates;
|
77
|
·
|
create restrictions on dividends or other payments by our restricted subsidiaries; and
|
|
·
|
create guarantees of indebtedness by restricted subsidiaries.
|
However, these limitations are subject to a number of important qualifications and exceptions, as described in the Indenture. As of December 31, 2010, we were in compliance with all covenants.
Notes payable, line of credit and capital lease obligations consist of the following (in thousands):
|
December 31,
|
||||||||
|
2010
|
2009
|
|||||||
|
Revolving lines of credit
|
$
|
-
|
$
|
-
|
||||
|
Senior secured term loan
|
282,862
|
-
|
||||||
|
Senior unsecured notes
|
200,000
|
-
|
||||||
|
Discount on Notes
|
(2,476
|
)
|
-
|
|||||
|
GE credit facility
|
-
|
412,625
|
||||||
|
Equipment notes payable at interest rates ranging from 8.8% to 13.5%, due through 2013, collateralized by medical equipment
|
9,410
|
11,001
|
||||||
|
Obligations under capital leases at interest rates ranging from 9.1% to 13.0%, due through 2010, collateralized by medical and office equipment
|
14,778
|
27,689
|
||||||
|
504,574
|
451,315
|
|||||||
|
Less: current portion
|
(17,357
|
)
|
(21,048
|
)
|
||||
|
$
|
487,217
|
$
|
430,267
|
|||||
The following is a listing of annual principal maturities of notes payable exclusive of capital leases and repayments on our revolving credit facilities for years ending December 31 (in thousands):
|
2011
|
$ | 8,218 | ||
|
2012
|
5,022 | |||
|
2013
|
3,985 | |||
|
2014
|
3,532 | |||
|
2015
|
2,897 | |||
|
Thereafter
|
468,618 | |||
| $ | 492,272 |
|
2011
|
$ | 9,944 | ||
|
2012
|
4,663 | |||
|
2013
|
1,226 | |||
|
2014
|
75 | |||
|
Total minimum payments
|
15,908 | |||
|
Amount representing interest
|
(1,130 | ) | ||
|
Present value of net minimum lease payments
|
14,778 | |||
|
Less current portion
|
(9,139 | ) | ||
|
Long-term portion
|
$ | 5,639 |
78
The following tables present condensed consolidating financial information for: (a) RadNet, Inc. (the “Parent”) on a stand-alone basis as a guarantor of the senior secured term loan due 2016 and the senior notes due 2018 ; (b) Radnet Management, Inc., the subsidiary issuer (the “Subsidiary Issuer”) of the senior secured term loan due 2016 and the senior notes due 2018; (c) on a combined basis, the guarantor subsidiaries (the “Guarantor Subsidiaries”) of the senior secured term loan due 2016 and the senior notes due 2018, which include all other 100% owned subsidiaries of the Subsidiary Issuer; (d) on a combined basis, the non-guarantor subsidiaries, which include joint venture partnerships of which the Subsidiary Issuer holds investments of 50% or greater, as well as BRMG, which we consolidate as a variable interest entity. Separate financial statements of the Subsidiary Issuer or the Guarantor Subsidiaries are not presented because the guarantee by the Parent and each Guarantor Subsidiary is full and unconditional, joint and several. In lieu thereof, the Parent includes the following:
RADNET, INC. AND SUBSIDIARIES
CONDENSED CONSOLIDATED BALANCE SHEET
December 31, 2010
(in thousands)
| Subsidiary | Guarantor | Non-Guarantor | ||||||||||||||||||||||
|
Parent
|
Issuer
|
Subsidiaries
|
Subsidiaries
|
Eliminations
|
Consolidated
|
|||||||||||||||||||
|
ASSETS
|
||||||||||||||||||||||||
|
CURRENT ASSETS
|
||||||||||||||||||||||||
|
Cash and cash equivalents
|
$ | - | $ | 205 | $ | - | $ | 422 | $ | - | $ | 627 | ||||||||||||
|
Accounts receivable, net
|
- | - | 52,493 | 43,601 | - | 96,094 | ||||||||||||||||||
|
Prepaid expenses and other current assets
|
- | 8,481 | 5,543 | 280 | - | 14,304 | ||||||||||||||||||
| Total current assets | - | 8,686 | 58,036 | 44,303 | - | 111,025 | ||||||||||||||||||
|
PROPERTY AND EQUIPMENT, NET
|
- | 46,893 | 145,770 | 1,567 | - | 194,230 | ||||||||||||||||||
|
OTHER ASSETS
|
- | |||||||||||||||||||||||
|
Goodwill
|
- | 41,768 | 101,585 | - | - | 143,353 | ||||||||||||||||||
|
Other intangible assets
|
- | 137 | 57,211 | - | - | 57,348 | ||||||||||||||||||
|
Deferred financing costs, net
|
- | 15,486 | - | - | - | 15,486 | ||||||||||||||||||
|
Investment in subsidiaries
|
(82,813 | ) | 218,110 | 9,223 | - | (144,520 | ) | - | ||||||||||||||||
|
Investment in joint ventures
|
- | - | 15,444 | - | - | 15,444 | ||||||||||||||||||
|
Deposits and other
|
- | 1,320 | 1,308 | - | - | 2,628 | ||||||||||||||||||
| Total assets | $ | (82,813 | ) | $ | 332,400 | $ | 388,577 | $ | 45,870 | $ | (144,520 | ) | $ | 539,514 | ||||||||||
|
LIABILITIES AND EQUITY DEFICIT
|
||||||||||||||||||||||||
|
CURRENT LIABILITIES
|
||||||||||||||||||||||||
|
Intercompany
|
$ | - | $ | (133,637 | ) | $ | 107,258 | $ | 26,379 | - | ||||||||||||||
|
Accounts payable and accrued expenses
|
- | 44,450 | 30,997 | 7,172 | - | 82,619 | ||||||||||||||||||
|
Due to affiliates
|
- | - | 1,082 | 1,893 | - | 2,975 | ||||||||||||||||||
|
Deferred revenue
|
- | - | 1,568 | - | - | 1,568 | ||||||||||||||||||
|
Current portion of notes payable
|
- | 3,082 | 5,136 | - | - | 8,218 | ||||||||||||||||||
|
Current portion of deferred rent
|
- | 321 | 424 | - | - | 745 | ||||||||||||||||||
|
Obligations under capital leases
|
- | 5,640 | 3,150 | 349 | - | 9,139 | ||||||||||||||||||
| Total current liabilities | - | (80,144 | ) | 149,615 | 35,793 | - | 105,264 | |||||||||||||||||
|
LONG-TERM LIABILITIES
|
||||||||||||||||||||||||
|
Deferred rent, net of current portion
|
- | 6,086 | 4,293 | - | - | 10,379 | ||||||||||||||||||
|
Deferred taxes
|
- | - | 277 | - | - | 277 | ||||||||||||||||||
|
Notes payable, net of current portion
|
- | 475,231 | 6,347 | - | - | 481,578 | ||||||||||||||||||
|
Obligations under capital leases,
net of current portion
|
- | 3,535 | 1,307 | 797 | - | 5,639 | ||||||||||||||||||
|
Other non-current liabilities
|
- | 10,505 | 8,345 | - | - | 18,850 | ||||||||||||||||||
| Total liabilities | - | 415,213 | 170,184 | 36,590 | - | 621,987 | ||||||||||||||||||
|
EQUITY DEFICIT
|
||||||||||||||||||||||||
|
Total Radnet, Inc.'s equity deficit
|
(82,813 | ) | (82,813 | ) | 218,393 | 9,223 | (144,520 | ) | (82,530 | ) | ||||||||||||||
|
Noncontrolling interests
|
- | - | - | 57 | - | 57 | ||||||||||||||||||
| Total equity deficit | (82,813 | ) | (82,813 | ) | 218,393 | 9,280 | (144,520 | ) | (82,473 | ) | ||||||||||||||
| Total liabilities and equity deficit | $ | (82,813 | ) | $ | 332,400 | $ | 388,577 | $ | 45,870 | $ | (144,520 | ) | $ | 539,514 | ||||||||||
79
RADNET, INC. AND SUBSIDIARIES
CONDENSED CONSOLIDATED BALANCE SHEET
December 31, 2009
(in thousands)
| Subsidiary | Guarantor | Non-Guarantor | ||||||||||||||||||||||
| Parent |
Issuer
|
Subsidiaries
|
Subsidiaries
|
Eliminations | Consolidated | |||||||||||||||||||
|
ASSETS
|
||||||||||||||||||||||||
|
CURRENT ASSETS
|
||||||||||||||||||||||||
|
Cash and cash equivalents
|
$ | - | $ | 10,094 | $ | - | $ | - | $ | - | $ | 10,094 | ||||||||||||
|
Accounts receivable, net
|
- | - | 47,616 | 40,209 | - | 87,825 | ||||||||||||||||||
|
Prepaid expenses and other current assets
|
- | 5,810 | 3,979 | 201 | - | 9,990 | ||||||||||||||||||
|
Total current assets
|
- | 15,904 | 51,595 | 40,410 | - | 107,909 | ||||||||||||||||||
|
PROPERTY AND EQUIPMENT, NET
|
- | 47,777 | 134,276 | 518 | - | 182,571 | ||||||||||||||||||
|
OTHER ASSETS
|
- | |||||||||||||||||||||||
|
Goodwill
|
- | 41,462 | 65,040 | - | - | 106,502 | ||||||||||||||||||
|
Other intangible assets
|
- | 224 | 54,089 | - | - | 54,313 | ||||||||||||||||||
|
Deferred financing costs, net
|
- | 8,229 | - | - | - | 8,229 | ||||||||||||||||||
|
Investment in subsidiaries
|
(74,815 | ) | 192,129 | 9,459 | - | (126,773 | ) | - | ||||||||||||||||
|
Investment in joint ventures
|
- | - | 18,741 | - | - | 18,741 | ||||||||||||||||||
|
Deposits and other
|
- | 2,196 | 210 | - | - | 2,406 | ||||||||||||||||||
|
Total assets
|
$ | (74,815 | ) | $ | 307,921 | $ | 333,410 | $ | 40,928 | $ | (126,773 | ) | $ | 480,671 | ||||||||||
|
LIABILITIES AND EQUITY DEFICIT
|
||||||||||||||||||||||||
|
CURRENT LIABILITIES
|
||||||||||||||||||||||||
|
Intercompany
|
$ | - | $ | (89,783 | ) | $ | 65,904 | $ | 23,879 | - | ||||||||||||||
|
Accounts payable and accrued expenses
|
- | 32,091 | 30,827 | 6,723 | - | 69,641 | ||||||||||||||||||
|
Due to affiliates
|
- | - | 6,643 | 813 | - | 7,456 | ||||||||||||||||||
|
Deferred revenue
|
- | - | ||||||||||||||||||||||
|
Current portion of notes payable
|
- | 2,864 | 4,063 | - | - | 6,927 | ||||||||||||||||||
|
Current portion of deferred rent
|
- | 224 | 336 | - | - | 560 | ||||||||||||||||||
|
Obligations under capital leases
|
- | 8,357 | 5,764 | - | - | 14,121 | ||||||||||||||||||
|
Total current liabilities
|
- | (46,247 | ) | 113,537 | 31,415 | - | 98,705 | |||||||||||||||||
|
LONG-TERM LIABILITIES
|
||||||||||||||||||||||||
|
Deferred rent, net of current portion
|
- | 5,437 | 3,483 | - | - | 8,920 | ||||||||||||||||||
|
Deferred taxes
|
- | - | 277 | - | - | 277 | ||||||||||||||||||
|
Notes payable, net of current portion
|
- | 405,494 | 11,205 | - | - | 416,699 | ||||||||||||||||||
|
Obligations under capital leases,
net of current portion
|
- | 9,153 | 4,415 | - | - | 13,568 | ||||||||||||||||||
|
Other non-current liabilities
|
- | 8,899 | 8,364 | - | - | 17,263 | ||||||||||||||||||
|
Total liabilities
|
- | 382,736 | 141,281 | 31,415 | - | 555,432 | ||||||||||||||||||
|
EQUITY DEFICIT
|
||||||||||||||||||||||||
|
Total Radnet, Inc.'s equity deficit
|
(74,815 | ) | (74,815 | ) | 192,129 | 9,459 | (126,773 | ) | (74,815 | ) | ||||||||||||||
|
Noncontrolling interests
|
- | - | - | 54 | - | 54 | ||||||||||||||||||
|
Total equity deficit
|
(74,815 | ) | (74,815 | ) | 192,129 | 9,513 | (126,773 | ) | (74,761 | ) | ||||||||||||||
|
Total liabilities and equity deficit
|
$ | (74,815 | ) | $ | 307,921 | $ | 333,410 | $ | 40,928 | $ | (126,773 | ) | $ | 480,671 | ||||||||||
80
|
RADNET, INC. AND SUBSIDIARIES
|
|
CONDENSED CONSOLIDATED STATEMENTS OF OPERATIONS
|
|
For The Year Ended December 31, 2010
|
|
(in thousands)
|
|
Subsidiary
|
Guarantor
|
Non-Guarantor
|
||||||||||||||||||||||
|
Parent
|
Issuer
|
Subsidiaries
|
Subsidiaries
|
Eliminations
|
Consolidated
|
|||||||||||||||||||
|
NET REVENUE
|
$ | - | $ | 119,659 | $ | 371,773 | $ | 57,105 | $ | - | $ | 548,537 | ||||||||||||
|
OPERATING EXPENSES
|
||||||||||||||||||||||||
|
Cost of operations
|
- | 103,563 | 264,258 | 53,152 | - | 420,973 | ||||||||||||||||||
|
Depreciation and amortization
|
- | 13,656 | 40,150 | 191 | - | 53,997 | ||||||||||||||||||
|
Provision for bad debts
|
- | 5,243 | 25,426 | 2,489 | - | 33,158 | ||||||||||||||||||
|
Loss on sale of equipment
|
- | 141 | 995 | - | - | 1,136 | ||||||||||||||||||
|
Severance costs
|
- | 490 | 321 | 27 | - | 838 | ||||||||||||||||||
|
Total operating expenses
|
- | 123,093 | 331,150 | 55,859 | - | 510,102 | ||||||||||||||||||
|
INCOME (LOSS) FROM OPERATIONS
|
- | (3,434 | ) | 40,623 | 1,246 | - | 38,435 | |||||||||||||||||
|
OTHER EXPENSES
|
||||||||||||||||||||||||
|
Interest expense
|
- | 25,405 | 22,965 | 28 | - | 48,398 | ||||||||||||||||||
|
Loss on extinguishment of debt
|
- | 9,871 | - | - | - | 9,871 | ||||||||||||||||||
|
Other expenses
|
- | 362 | 143 | - | - | 505 | ||||||||||||||||||
|
Total other expenses
|
- | 35,638 | 23,108 | 28 | - | 58,774 | ||||||||||||||||||
|
INCOME (LOSS) BEFORE INCOME TAXES AND
EQUITY IN EARNINGS OF JOINT VENTURES
|
- | (39,072 | ) | 17,515 | 1,218 | - | (20,339 | ) | ||||||||||||||||
|
Provision for income taxes
|
- | (38 | ) | (532 | ) | (6 | ) | - | (576 | ) | ||||||||||||||
|
Equity in earnings (losses) of consolidated subsidiaries
|
(12,852 | ) | 26,258 | 1,045 | (14,451 | ) | - | |||||||||||||||||
|
Equity in earnings of joint ventures
|
- | - | 8,230 | - | - | 8,230 | ||||||||||||||||||
|
NET INCOME (LOSS)
|
(12,852 | ) | (12,852 | ) | 26,258 | 1,212 | (14,451 | ) | (12,685 | ) | ||||||||||||||
|
Net income attributable to noncontrolling interests
|
- | - | - | 167 | - | 167 | ||||||||||||||||||
|
NET INCOME (LOSS) ATTRIBUTABLE TO
RADNET, INC. COMMON STOCKHOLDERS
|
$ | (12,852 | ) | $ | (12,852 | ) | $ | 26,258 | $ | 1,045 | $ | (14,451 | ) | $ | (12,852 | ) | ||||||||
81
|
RADNET, INC. AND SUBSIDIARIES
|
|
CONDENSED CONSOLIDATED STATEMENTS OF OPERATIONS
|
|
For The Year Ended December 31, 2009
|
|
(in thousands)
|
|
Subsidiary
|
Guarantor
|
Non-Guarantor
|
||||||||||||||||||||||
|
Parent
|
Issuer
|
Subsidiaries
|
Subsidiaries
|
Eliminations
|
Consolidated
|
|||||||||||||||||||
|
NET REVENUE
|
$ | - | $ | 121,879 | $ | 349,836 | $ | 52,653 | $ | - | $ | 524,368 | ||||||||||||
|
OPERATING EXPENSES
|
||||||||||||||||||||||||
|
Cost of operations
|
- | 107,512 | 240,328 | 49,913 | - | 397,753 | ||||||||||||||||||
|
Depreciation and amortization
|
- | 13,457 | 40,199 | 144 | - | 53,800 | ||||||||||||||||||
|
Provision for bad debts
|
- | 3,676 | 27,377 | 1,651 | - | 32,704 | ||||||||||||||||||
|
Loss (gain) on sale of equipment
|
- | - | 523 | - | - | 523 | ||||||||||||||||||
|
Severance costs
|
- | 78 | 650 | 3 | - | 731 | ||||||||||||||||||
|
Total operating expenses
|
- | 124,723 | 309,077 | 51,711 | - | 485,511 | ||||||||||||||||||
|
INCOME (LOSS) FROM OPERATIONS
|
- | (2,844 | ) | 40,759 | 942 | - | 38,857 | |||||||||||||||||
|
OTHER EXPENSES
|
||||||||||||||||||||||||
|
Interest expense
|
- | 24,987 | 24,201 | 5 | - | 49,193 | ||||||||||||||||||
|
Gain on bargin purchase
|
- | - | (1,387 | ) | - | - | (1,387 | ) | ||||||||||||||||
|
Other expenses (income)
|
- | 1,011 | 228 | - | - | 1,239 | ||||||||||||||||||
|
Total other expenses
|
- | 25,998 | 23,042 | 5 | - | 49,045 | ||||||||||||||||||
|
INCOME (LOSS) BEFORE INCOME TAXES AND
EQUITY IN EARNINGS OF JOINT VENTURES
|
- | (28,842 | ) | 17,717 | 937 | - | (10,188 | ) | ||||||||||||||||
|
Provision for income taxes
|
- | (18 | ) | (425 | ) | - | - | (443 | ) | |||||||||||||||
|
Equity in earnings (losses) of consolidated subsidiaries
|
(2,267 | ) | 26,593 | 845 | (25,171 | ) | - | |||||||||||||||||
|
Equity in earnings of joint ventures
|
- | - | 8,456 | - | - | 8,456 | ||||||||||||||||||
|
NET INCOME (LOSS)
|
(2,267 | ) | (2,267 | ) | 26,593 | 937 | (25,171 | ) | (2,175 | ) | ||||||||||||||
|
Net income attributable to noncontrolling interests
|
- | - | - | 92 | - | 92 | ||||||||||||||||||
|
NET INCOME (LOSS) ATTRIBUTABLE TO
RADNET, INC. COMMON STOCKHOLDERS
|
$ | (2,267 | ) | $ | (2,267 | ) | $ | 26,593 | $ | 845 | $ | (25,171 | ) | $ | (2,267 | ) | ||||||||
82
|
CONDENSED CONSOLIDATED STATEMENTS OF OPERATIONS
|
|
For The Year Ended December 31, 2008
|
|
(in thousands)
|
|
Subsidiary
|
Guarantor
|
Non-Guarantor
|
||||||||||||||||||||||
|
Parent
|
Issuer
|
Subsidiaries
|
Subsidiaries
|
Eliminations
|
Consolidated
|
|||||||||||||||||||
|
NET REVENUE
|
$ | - | $ | 115,311 | $ | 333,871 | $ | 49,633 | $ | - | $ | 498,815 | ||||||||||||
|
OPERATING EXPENSES
|
||||||||||||||||||||||||
|
Cost of operations
|
- | 104,386 | 232,938 | 46,973 | - | 384,297 | ||||||||||||||||||
|
Depreciation and amortization
|
- | 15,008 | 38,396 | 144 | - | 53,548 | ||||||||||||||||||
|
Provision for bad debts
|
- | 3,313 | 25,975 | 1,544 | - | 30,832 | ||||||||||||||||||
|
Loss on sale of equipment
|
- | (749 | ) | 1,265 | - | - | 516 | |||||||||||||||||
|
Severance costs
|
- | 138 | 197 | - | - | 335 | ||||||||||||||||||
|
Total operating expenses
|
- | 122,096 | 298,771 | 48,661 | - | 469,528 | ||||||||||||||||||
|
INCOME (LOSS) FROM OPERATIONS
|
- | (6,785 | ) | 35,100 | 972 | - | 29,287 | |||||||||||||||||
|
OTHER EXPENSES
|
||||||||||||||||||||||||
|
Interest expense
|
- | 26,686 | 25,121 | 4 | - | 51,811 | ||||||||||||||||||
|
Loss on extinguishment of debt
|
- | - | - | - | - | - | ||||||||||||||||||
|
Other expenses
|
- | (49 | ) | (102 | ) | - | - | (151 | ) | |||||||||||||||
|
Total other expenses
|
- | 26,637 | 25,019 | 4 | - | 51,660 | ||||||||||||||||||
|
INCOME (LOSS) BEFORE INCOME TAXES AND
EQUITY IN EARNINGS OF JOINT VENTURES
|
- | (33,422 | ) | 10,081 | 968 | - | (22,373 | ) | ||||||||||||||||
|
Provision for income taxes
|
- | (13 | ) | (138 | ) | - | - | (151 | ) | |||||||||||||||
|
Equity in earnings (losses) of consolidated subsidiaries
|
(12,836 | ) | 20,917 | 865 | (8,946 | ) | - | |||||||||||||||||
|
Equity in earnings of joint ventures
|
- | (318 | ) | 10,109 | - | - | 9,791 | |||||||||||||||||
|
NET INCOME (LOSS)
|
(12,836 | ) | (12,836 | ) | 20,917 | 968 | (8,946 | ) | (12,733 | ) | ||||||||||||||
|
Net income attributable to noncontrolling interests
|
- | - | - | 103 | - | 103 | ||||||||||||||||||
|
NET INCOME (LOSS) ATTRIBUTABLE TO
RADNET, INC. COMMON STOCKHOLDERS
|
$ | (12,836 | ) | $ | (12,836 | ) | $ | 20,917 | $ | 865 | $ | (8,946 | ) | $ | (12,836 | ) | ||||||||
83
|
RADNET, INC. AND SUBSIDIARIES
|
|
CONDENSED CONSOLIDATED STATEMENTS OF CASH FLOWS
|
|
For The Year Ended December 31, 2010
|
|
(in thousands)
|
|
Subsidiary
|
Guarantor
|
Non-Guarantor
|
||||||||||||||||||||||
|
Parent
|
Issuer
|
Subsidiaries
|
Subsidiaries
|
Eliminations
|
Consolidated
|
|||||||||||||||||||
|
CASH FLOWS FROM OPERATING ACTIVITIES
|
||||||||||||||||||||||||
|
Net income (loss)
|
$ | (12,852 | ) | $ | (12,852 | ) | $ | 26,258 | $ | 1,212 | $ | (14,451 | ) | $ | (12,685 | ) | ||||||||
|
Adjustments to reconcile net income (loss)
to net cash provided by (used in) operating activities:
|
||||||||||||||||||||||||
|
Depreciation and amortization
|
- | 13,656 | 40,150 | 191 | - | 53,997 | ||||||||||||||||||
|
Provision for bad debts
|
- | 5,243 | 25,426 | 2,489 | - | 33,158 | ||||||||||||||||||
|
Equity in (earnings) loss of consolidated subsidiaries
|
12,852 | (26,258 | ) | (1,045 | ) | 14,451 | - | |||||||||||||||||
|
Distributions from consolidated subsidiaries
|
- | 1,247 | - | (1,247 | ) | - | ||||||||||||||||||
|
Equity in earnings of joint ventures
|
- | - | (8,230 | ) | (8,230 | ) | ||||||||||||||||||
|
Distributions from joint ventures
|
- | - | 10,917 | - | - | 10,917 | ||||||||||||||||||
|
Deferred rent amortization
|
- | 254 | 1,594 | - | - | 1,848 | ||||||||||||||||||
|
Deferred financing cost interest expense
|
- | 2,797 | - | - | - | 2,797 | ||||||||||||||||||
|
Amortization of bond discount
|
164 | 164 | ||||||||||||||||||||||
|
Loss on sale of equipment
|
- | 141 | 995 | - | - | 1,136 | ||||||||||||||||||
|
Loss on extinguishment of debt
|
- | 9,871 | - | - | - | 9,871 | ||||||||||||||||||
|
Amortization of cash flow hedge
|
917 | 917 | ||||||||||||||||||||||
|
Stock-based compensation
|
- | 929 | 2,789 | - | - | 3,718 | ||||||||||||||||||
|
Changes in operating assets and liabilities, net of assets
acquired and liabilities assumed in purchase transactions:
|
||||||||||||||||||||||||
|
Accounts receivable
|
- | - | (22,951 | ) | (13,034 | ) | - | (35,985 | ) | |||||||||||||||
|
Other current assets
|
- | (2,552 | ) | (635 | ) | (39 | ) | - | (3,226 | ) | ||||||||||||||
|
A/P I/C
|
- | - | - | |||||||||||||||||||||
|
Other assets
|
- | 876 | (852 | ) | - | - | 24 | |||||||||||||||||
|
Deferred revenue
|
207 | 207 | ||||||||||||||||||||||
|
Accounts payable and accrued expenses
|
- | (27,504 | ) | 24,615 | 11,145 | - | 8,256 | |||||||||||||||||
|
Net cash provided by (used in) operating activities
|
- | (34,318 | ) | 100,485 | 1,964 | (1,247 | ) | 66,884 | ||||||||||||||||
|
CASH FLOWS FROM INVESTING ACTIVITIES
|
||||||||||||||||||||||||
|
Purchase of imaging facilities
|
- | (1,401 | ) | (60,387 | ) | 14 | - | (61,774 | ) | |||||||||||||||
|
Proceeds from sale of equipment
|
121 | 564 | 685 | |||||||||||||||||||||
|
Purchase of property and equipment
|
- | (12,024 | ) | (28,175 | ) | (94 | ) | - | (40,293 | ) | ||||||||||||||
|
Purchase of equity interest in joint ventures
|
- | - | - | - | - | - | ||||||||||||||||||
|
Net cash used in investing activities
|
- | (13,304 | ) | (87,998 | ) | (80 | ) | - | (101,382 | ) | ||||||||||||||
|
CASH FLOWS FROM FINANCING ACTIVITIES
|
||||||||||||||||||||||||
|
Principal payments on notes and leases payable
|
- | (8,903 | ) | (12,476 | ) | (84 | ) | - | (21,463 | ) | ||||||||||||||
|
Repayment of debt
|
- | (412,000 | ) | - | - | - | (412,000 | ) | ||||||||||||||||
|
Proceeds from borrowings
|
- | 482,360 | - | - | - | 482,360 | ||||||||||||||||||
|
Deferred financing costs
|
- | (17,613 | ) | - | - | - | (17,613 | ) | ||||||||||||||||
|
Distributions paid to noncontrolling interests
|
- | - | - | (1,378 | ) | 1,247 | (131 | ) | ||||||||||||||||
|
Payments on line of credit
|
- | - | - | - | - | - | ||||||||||||||||||
|
Payments to counterparties of cash flow hedges
|
- | (6,382 | ) | - | - | - | (6,382 | ) | ||||||||||||||||
|
Proceeds from issuance of common stock
|
- | 271 | - | - | - | 271 | ||||||||||||||||||
|
Net cash provided by (used in) financing activities
|
- | 37,733 | (12,476 | ) | (1,462 | ) | 1,247 | 25,042 | ||||||||||||||||
| EFFECT OF EXCHANGE RATE CHANGES ON CASH | ||||||||||||||||||||||||
|
NET INCREASE (DECREASE) IN CASH
AND CASH EQUIVALENTS
|
- | (9,889 | ) | - | 422 | - | (9,467 | ) | ||||||||||||||||
|
CASH AND CASH EQUIVALENTS,
beginning of period
|
- | 10,094 | - | - | - | 10,094 | ||||||||||||||||||
|
CASH AND CASH EQUIVALENTS,
end of period
|
$ | - | $ | 205 | $ | - | $ | 422 | $ | - | $ | 627 | ||||||||||||
84
|
RADNET, INC. AND SUBSIDIARIES
|
|
CONDENSED CONSOLIDATED STATEMENTS OF CASH FLOWS
|
|
For The Year Ended December 31, 2009
|
|
(in thousands)
|
|
Subsidiary
|
Guarantor
|
Non-Guarantor
|
||||||||||||||||||||||
|
Parent
|
Issuer
|
Subsidiaries
|
Subsidiaries
|
Eliminations
|
Consolidated
|
|||||||||||||||||||
|
CASH FLOWS FROM OPERATING ACTIVITIES
|
||||||||||||||||||||||||
|
Net income (loss)
|
$ | (2,267 | ) | $ | (2,267 | ) | $ | 26,593 | $ | 937 | $ | (25,171 | ) | $ | (2,175 | ) | ||||||||
|
Adjustments to reconcile net income (loss)
to net cash provided by operating activities:
|
||||||||||||||||||||||||
|
Depreciation and amortization
|
- | 13,457 | 40,199 | 144 | - | 53,800 | ||||||||||||||||||
|
Provision for bad debts
|
- | 3,676 | 27,377 | 1,651 | - | 32,704 | ||||||||||||||||||
|
Equity in (earnings) loss of consolidated subsidiaries
|
2,267 | (26,593 | ) | (845 | ) | 25,171 | - | |||||||||||||||||
|
Distributions from consolidated subsidiaries
|
- | 1,217 | - | (1,217 | ) | - | ||||||||||||||||||
|
Equity in earnings of joint ventures
|
- | - | (8,456 | ) | (8,456 | ) | ||||||||||||||||||
|
Distributions from joint ventures
|
- | - | 7,667 | - | - | 7,667 | ||||||||||||||||||
|
Deferred rent amortization
|
- | 474 | 620 | - | - | 1,094 | ||||||||||||||||||
|
Deferred financing cost interest expense
|
- | 2,678 | - | - | - | 2,678 | ||||||||||||||||||
|
Loss on sale of equipment
|
- | - | 523 | - | - | 523 | ||||||||||||||||||
|
Gain on bargain purchase
|
- | - | (1,387 | ) | - | - | (1,387 | ) | ||||||||||||||||
|
Amortization of cash flow hedge
|
6,119 | - | 6,119 | |||||||||||||||||||||
|
Stock-based compensation
|
- | 902 | 2,705 | - | - | 3,607 | ||||||||||||||||||
|
Changes in operating assets and liabilities, net of assets
acquired and liabilities assumed in purchase transactions:
|
||||||||||||||||||||||||
|
Accounts receivable
|
- | - | (24,815 | ) | 383 | - | (24,432 | ) | ||||||||||||||||
|
Other current assets
|
- | 1,405 | 2,785 | 16 | - | 4,206 | ||||||||||||||||||
|
Other assets
|
- | 70 | (45 | ) | 26 | - | 51 | |||||||||||||||||
|
Accounts payable and accrued expenses
|
- | 33,160 | (30,717 | ) | (1,824 | ) | - | 619 | ||||||||||||||||
|
Net cash provided by operating activities
|
- | 33,081 | 43,421 | 1,333 | (1,217 | ) | 76,618 | |||||||||||||||||
|
CASH FLOWS FROM INVESTING ACTIVITIES
|
||||||||||||||||||||||||
|
Purchase of imaging facilities
|
- | (1,258 | ) | (4,827 | ) | - | - | (6,085 | ) | |||||||||||||||
|
Purchase of property and equipment
|
- | (5,944 | ) | (24,808 | ) | - | - | (30,752 | ) | |||||||||||||||
|
Proceeds from sale of imaging facilities
|
- | - | 650 | - | - | 650 | ||||||||||||||||||
|
Proceeds from sale of equipment
|
- | 219 | 219 | |||||||||||||||||||||
|
Purchase of equity interest in joint ventures
|
- | - | (315 | ) | - | - | (315 | ) | ||||||||||||||||
|
Net cash used in investing activities
|
- | (7,202 | ) | (29,081 | ) | - | - | (36,283 | ) | |||||||||||||||
|
CASH FLOWS FROM FINANCING ACTIVITIES
|
||||||||||||||||||||||||
|
Principal payments on notes and leases payable
|
- | (9,320 | ) | (14,340 | ) | - | - | (23,660 | ) | |||||||||||||||
|
Distributions paid to noncontrolling interests
|
- | - | - | (1,333 | ) | 1,217 | (116 | ) | ||||||||||||||||
|
Payments on line of credit
|
- | (1,742 | ) | - | - | - | (1,742 | ) | ||||||||||||||||
|
Payments to counterparties of cash flow hedges
|
- | (4,739 | ) | - | - | - | (4,739 | ) | ||||||||||||||||
|
Proceeds from issuance of common stock
|
- | 16 | - | - | - | 16 | ||||||||||||||||||
|
Net cash used in financing activities
|
- | (15,785 | ) | (14,340 | ) | (1,333 | ) | 1,217 | (30,241 | ) | ||||||||||||||
|
NET INCREASE IN CASH
AND CASH EQUIVALENTS
|
- | 10,094 | - | - | - | 10,094 | ||||||||||||||||||
|
CASH AND CASH EQUIVALENTS,
beginning of period
|
- | - | - | - | - | - | ||||||||||||||||||
|
CASH AND CASH EQUIVALENTS,
end of period
|
$ | - | $ | 10,094 | $ | - | $ | - | $ | - | $ | 10,094 | ||||||||||||
85
|
RADNET, INC. AND SUBSIDIARIES
|
|
CONDENSED CONSOLIDATED STATEMENTS OF CASH FLOWS
|
|
For The Year Ended December 31, 2008
|
|
(in thousands)
|
|
Subsidiary
|
Guarantor
|
Non-Guarantor
|
||||||||||||||||||||||
|
Parent
|
Issuer
|
Subsidiaries
|
Subsidiaries
|
Eliminations
|
Consolidated
|
|||||||||||||||||||
|
CASH FLOWS FROM OPERATING ACTIVITIES
|
||||||||||||||||||||||||
|
Net income (loss)
|
$ | (12,836 | ) | $ | (12,836 | ) | $ | 20,917 | $ | 968 | $ | (8,946 | ) | $ | (12,733 | ) | ||||||||
|
Adjustments to reconcile net income (loss)
to net cash provided by (used in) operating activities:
|
||||||||||||||||||||||||
|
Depreciation and amortization
|
- | 15,008 | 38,396 | 144 | - | 53,548 | ||||||||||||||||||
|
Provision for bad debts
|
- | 3,313 | 25,975 | 1,544 | - | 30,832 | ||||||||||||||||||
|
Equity in (earnings) loss of consolidated subsidiaries
|
12,836 | (20,917 | ) | (865 | ) | 8,946 | - | |||||||||||||||||
|
Distributions from consolidated subsidiaries
|
- | 2,170 | - | (2,170 | ) | - | ||||||||||||||||||
|
Equity in earnings of joint ventures
|
- | 318 | (10,109 | ) | (9,791 | ) | ||||||||||||||||||
|
Distributions from joint ventures
|
- | - | 7,982 | - | - | 7,982 | ||||||||||||||||||
|
Deferred rent amortization
|
- | 1,256 | 2,258 | - | - | 3,514 | ||||||||||||||||||
|
Deferred financing cost interest expense
|
- | 2,567 | - | - | - | 2,567 | ||||||||||||||||||
|
Loss on sale of equipment
|
- | (749 | ) | 1,265 | - | - | 516 | |||||||||||||||||
|
Gain on extinguishment of debt
|
- | (47 | ) | - | - | - | (47 | ) | ||||||||||||||||
|
Amortization of cash flow hedge
|
- | - | - | |||||||||||||||||||||
|
Stock-based compensation
|
- | 726 | 2,176 | - | - | 2,902 | ||||||||||||||||||
|
Changes in operating assets and liabilities, net of assets
acquired and liabilities assumed in purchase transactions:
|
||||||||||||||||||||||||
|
Accounts receivable
|
- | - | (23,568 | ) | (12,729 | ) | - | (36,297 | ) | |||||||||||||||
|
Other current assets
|
- | (2,093 | ) | 383 | 195 | - | (1,515 | ) | ||||||||||||||||
|
Other assets
|
- | 994 | (284 | ) | (26 | ) | - | 684 | ||||||||||||||||
|
Accounts payable and accrued expenses
|
- | 8,119 | (17,154 | ) | 12,305 | - | 3,270 | |||||||||||||||||
|
Net cash provided by (used in) operating activities
|
- | (4,341 | ) | 49,542 | 2,401 | (2,170 | ) | 45,432 | ||||||||||||||||
|
CASH FLOWS FROM INVESTING ACTIVITIES
|
||||||||||||||||||||||||
|
Purchase of imaging facilities
|
- | (8,290 | ) | (20,569 | ) | - | - | (28,859 | ) | |||||||||||||||
|
Purchase of property and equipment
|
- | (8,800 | ) | (20,399 | ) | - | - | (29,199 | ) | |||||||||||||||
|
Proceeds from sale of imaging facilities
|
- | - | - | - | - | - | ||||||||||||||||||
|
Proceeds from sale of equipment
|
1,678 | 1,283 | 2,961 | |||||||||||||||||||||
|
Purchase of equity interest in joint ventures
|
- | - | (938 | ) | - | - | (938 | ) | ||||||||||||||||
|
Net cash used in investing activities
|
- | (15,412 | ) | (40,623 | ) | - | - | (56,035 | ) | |||||||||||||||
|
CASH FLOWS FROM FINANCING ACTIVITIES
|
||||||||||||||||||||||||
|
Principal payments on notes and leases payable
|
- | (8,963 | ) | (10,149 | ) | - | - | (19,112 | ) | |||||||||||||||
|
Proceeds from borrowings upon refinancing
|
35,000 | - | 35,000 | |||||||||||||||||||||
|
Proceeds from borrowings on notes payable
|
1,212 | 1,212 | ||||||||||||||||||||||
|
Deferred financing costs
|
(4,277 | ) | (4,277 | ) | ||||||||||||||||||||
|
Distributions paid to noncontrolling interests
|
- | - | - | (2,401 | ) | 2,170 | (231 | ) | ||||||||||||||||
|
Payments on line of credit
|
- | (2,480 | ) | - | - | - | (2,480 | ) | ||||||||||||||||
|
Payments to counterparties of cash flow hedges
|
- | - | - | - | - | - | ||||||||||||||||||
|
Proceeds from issuance of common stock
|
- | 473 | - | - | - | 473 | ||||||||||||||||||
|
Net cash provided by (used in) financing activities
|
- | 19,753 | (8,937 | ) | (2,401 | ) | 2,170 | 10,585 | ||||||||||||||||
|
NET DECREASE IN CASH
AND CASH EQUIVALENTS
|
- | - | (18 | ) | - | - | (18 | ) | ||||||||||||||||
|
CASH AND CASH EQUIVALENTS,
beginning of period
|
- | - | 18 | - | - | 18 | ||||||||||||||||||
|
CASH AND CASH EQUIVALENTS,
end of period
|
$ | - | $ | - | $ | - | $ | - | $ | - | $ | - | ||||||||||||
86
We are exposed to certain risks relating to our ongoing business operations. The primary risk managed by us using derivative instruments is interest rate risk. We entered into interest rate swap agreements to manage interest rate risk exposure. The interest rate swap agreements utilized by us effectively modify our exposure to interest rate risk by converting our floating-rate debt to a fixed rate basis during the period of the interest rate swap, thus reducing the impact of interest-rate changes on future interest expense.
We designate our interest rate swaps as cash flow hedges of floating-rate borrowings. For interest rate swaps that were designated and qualified as a cash flow hedge (i.e., hedging the exposure to variability in expected future cash flows that is attributable to a particular risk), the effective portion of the gain or loss on the derivative instrument is initially reported as a component of other comprehensive income, then reclassified into earnings in the same line item associated with the forecasted transaction and in the same period or periods during which the hedged transaction affects earnings (e.g., in “interest expense” when the hedged transactions are interest cash flows associated with floating-rate debt). The remaining gain or loss on the derivative instrument in excess of the cumulative change in the present value of future cash flows of the hedged item, if any (i.e., the ineffectiveness portion), or hedge components excluded from the assessment of effectiveness, are recognized in the statement of operations during the current period. Unrealized gains or losses on the change in fair value for interest rate swaps that do not qualify as hedges are recognized in income.
In connection with our GE credit facility, we swapped 50% of the aggregate principal amount of the facilities to a floating rate within 90 days of the closing. On April 11, 2006, effective April 28, 2006, we entered into an interest rate swap on $73.0 million fixing the LIBOR rate of interest at 5.47% for a period of three years. This swap was made in conjunction with the $161.0 million credit facility that closed on March 9, 2006. In addition, on November 15, 2006, we entered into an interest rate swap, designated as a cash flow hedge, on $107.0 million fixing the LIBOR rate of interest at 5.02% for a period of three years, and on November 28, 2006, we entered into an interest rate swap, also designated as a cash flow hedge, on $90.0 million fixing the LIBOR rate of interest at 5.03% for a period of three years. Previously, the interest rate on the above $270.0 million portion of the credit facility was based upon a spread over LIBOR which floats with market conditions.
During the first quarter of 2009 we modified the two interest rate swaps designated as cash flow hedges mentioned above. The modifications, commonly referred to as “blend and extends”, extended the maturity of and re-priced these two interest rate swaps originally executed in 2006 for an additional 36 months.
On the LIBOR hedge modification for a notional amount of $107 million of LIBOR exposure, the Company on January 29, 2009 replaced the existing fixed LIBOR rate of 5.02% with a new rate of 3.47% maturing on November 15, 2012. On the second LIBOR hedge modification for a notional amount of $90 million of LIBOR exposure, the Company, on February 5, 2009, replaced the existing fixed LIBOR rate of 5.03% with a new rate of 3.62% also maturing on November 15, 2012. Both modified interest swaps were designated as cash flow hedges.
As part of these modifications, the negative fair values of the original interest rate swaps, as well as a certain amount of accrued interest, associated with the original cash flow hedges were incorporated into the fair values of the new modified cash flow hedges. The related Accumulated Other Comprehensive Loss (AOCL) associated with the negative fair values of the original cash flow hedges on their dates of modification, which totaled $6.1 million, was amortized on a straight-line basis to interest expense through November 15, 2009, the maturity date of the original cash flow hedges.
We document our risk management strategy and hedge effectiveness at the inception of the hedge, and, unless the instrument qualifies for the short-cut method of hedge accounting, over the term of each hedging relationship. Our use of derivative financial instruments is limited to interest rate swaps, the purpose of which is to hedge the cash flows of variable-rate indebtedness. We do not hold or issue derivative financial instruments for speculative purposes. In accordance with ASC Topic 815, derivatives that have been designated and qualify as cash flow hedging instruments are reported at fair value. The gain or loss on the effective portion of the hedge (i.e., change in fair value) was initially reported as a component of accumulated other comprehensive loss in the Company’s consolidated statement of equity deficit. The remaining gain or loss, if any, is recognized currently in earnings. Unrealized gains or losses on the change in fair value of interest rate swaps that do not qualify as hedges are recognized in earnings.
As a result of our refinancing
and the New Credit Agreement and the issuance of the Notes
completed on April 6, 2010, our interest rate swaps do not match the terms of our current bank debt and so accordingly, we have determined that they are no longer designated as cash flow hedges. Accordingly, all changes in their fair value after April 6, 2010 are, and will continue to be recognized in earnings as other expense.
The related Accumulated Other Comprehensive Loss (AOCL) of $3.1 million associated with the negative fair values of these interest rate swaps on April 6, 2010, the date of our refinancing, will be amortized on a straight-line basis to interest expense through November 15, 2012, the maturity date of these cash flow hedges. As of April 6, 2010, the fair value of the interest rate swaps was a negative $10.4 million. From April 6, 2010 to December 31, 2010, approximately $917,000 of AOCL was amortized to interest expense.
87
At December 31, 2010 the negative fair value of these interest rate swaps was $10.5 million and was classified as other non-current liabilities in our consolidated balance sheet. For the year ended December 31, 2010, we recognized approximately $132,000 in other expense related to the change in fair value of these interest rate swaps from April 6, 2010 to December 31, 2010.
A tabular presentation of the fair value of derivative instruments as of December 31, 2010 is as follows (amounts in thousands):
|
Balance Sheet Location
|
Fair Value – Asset (Liability)
Derivatives
|
|
|
Derivatives
|
||
|
Interest rate contracts
|
Other non-current liabilities
|
$(10,505)
|
A tabular presentation of the fair value of derivative instruments as of December 31, 2009 is as follows (amounts in thousands):
|
Balance Sheet Location
|
Fair Value – Asset (Liability)
Derivatives
|
|
|
Derivatives
|
||
|
Interest rate contracts
|
Other non-current liabilities
|
$(8,901)
|
A tabular presentation of the effect of derivative instruments on our statement of operations is as follows (amounts in thousands):
For the Year Ended December 31, 2010
|
Ineffective
Interest Rate
Swap
|
Amount of
Gain (Loss)
Recognized
in OCI on
Derivative
(Effective
Portion)
|
Amount of Gain
(Loss)
Recognized in
Income on
Derivative
(Ineffective
Portion)
|
Location of
Gain (Loss)
Recognized in
Income on
Derivative
(Ineffective
Portion)
|
Amount of
Gain (Loss)
Reclassified from
Accumulated
OCI into Income
(Effective
Portion)
|
Location of
Gain (Loss)
Reclassified from
Accumulated
OCI into
Income
(Effective
Portion)
|
|
|
Interest rate contracts
|
($1,472)
|
($132)
|
Other income/ (expense)
|
* ($917)
|
Interest income/(expense)
|
* Amortization of OCI associated with the cash flow hedges through April 6, 2010 (see discussion above).
For the Year Ended December 31, 2009
|
Ineffective
Interest
Rate
Swap
|
Amount of
Gain (Loss)
Recognized
in OCI on
Derivative
(Effective
Portion)
|
Amount of Gain
(Loss)
Recognized in
Income on
Derivative
(Ineffective
Portion)
|
Location of
Gain (Loss)
Recognized in
Income on
Derivative
(Ineffective
Portion)
|
Amount of
Gain (Loss)
Reclassified from
Accumulated
OCI into
Income
(Effective
Portion)
|
Location of
Gain (Loss)
Reclassified from
Accumulated
OCI into
Income
(Effective
Portion)
|
|
|
Interest rate contracts
|
($1,311)
|
$823
|
Other income/ (expense)
|
* ($6,119)
|
Interest income/(expense)
|
* Amortization of OCI associated with the original cash flow hedges prior to modification on January 28, 2009 (see discussion above).
For the Year Ended December 31, 2008
|
Ineffective
Interest Rate
Swap
|
Amount of
Gain (Loss)
Recognized
in OCI on
Derivative
(Effective
Portion)
|
Amount of Gain
(Loss)
Recognized in
Income on
Derivative
(Ineffective
Portion)
|
Location of
Gain (Loss)
Recognized in
Income on
Derivative
(Ineffective
Portion)
|
Amount of
Gain (Loss)
Reclassified from
Accumulated
OCI into
Income
(Effective
Portion)
|
Location of
Gain (Loss)
Reclassified from
Accumulated
OCI into
Income
(Effective
Portion)
|
|
|
Interest rate contracts
|
($1,817)
|
-----
|
Other income/ (expense)
|
-----
|
Interest income/(expense)
|
88
Deferred income taxes reflect the net tax effects of temporary differences between carrying amounts of assets and liabilities for financial and income tax reporting purposes and operating loss carryforwards. For the years ended December 31, 2010, 2009 and 2008, we recognized $576,000, $443,000 and $151,000, respectively, of state income tax.
|
Years Ended
|
||||||||||||
|
December 31,
|
||||||||||||
|
2010
|
2009
|
2008
|
||||||||||
|
Federal tax
|
34.00 | % | 34.00 | % | 34.00 | % | ||||||
|
State franchise tax, net of federal benefit
|
-2.24 | % | -16.03 | % | -1.26 | % | ||||||
|
Non deductible expenses
|
-7.76 | % | -2.47 | % | -1.44 | % | ||||||
|
Changes in valuation allowance
|
-28.68 | % | -39.78 | % | -32.56 | % | ||||||
|
Income tax expense
|
-4.68 | % | -24.28 | % | -1.26 | % | ||||||
Our deferred tax assets and liabilities comprise the following (in thousands):
|
December 31,
|
||||||||
|
Deferred tax assets:
|
2010
|
2009
|
||||||
|
Net operating losses
|
$ | 66,683 | $ | 67,671 | ||||
|
Accrued expenses
|
7,387 | 6,232 | ||||||
|
Unfavorable contract liability
|
3,578 | 3,256 | ||||||
|
Equity compensation
|
3,701 | 3,701 | ||||||
|
Allowance for doubtful accounts
|
3,608 | 1,823 | ||||||
|
Other
|
455 | 370 | ||||||
|
Valuation allowance
|
(56,617 | ) | (55,268 | ) | ||||
|
Total Deferred Tax Assets
|
$ | 28,795 | $ | 27,785 | ||||
|
Deferred tax liabilities:
|
||||||||
|
Property Plant & Equipment
|
(7,615 | ) | (10,006 | ) | ||||
|
Goodwill
|
(10,503 | ) | (9,239 | ) | ||||
|
Intangibles
|
(10,326 | ) | (8,461 | ) | ||||
|
Other
|
(628 | ) | (356 | ) | ||||
|
Total Deferred Tax Liabilities
|
$ | (29,072 | ) | $ | (28,062 | ) | ||
|
Net deferred tax Asset (Liability)
|
$ | (277 | ) | $ | (277 | ) | ||
As of December 31, 2010, we had federal and state net operating loss carryforwards of approximately $178.1 million and $122.2 million, respectively, which expire at various intervals from the years 2017 to 2030. As of December 31, 2010, $17.9 million of our federal net operating loss carryforwards acquired in connection with the 1998 acquisition of Diagnostic Imaging Services, Inc. and the 2006 acquisition of Radiologix Inc. and the 2010 acquisition of Image Medical Corp. were subject to limitations related to their utilization under Section 382 of the Internal Revenue Code. Future ownership changes as determined under Section 382 of the Internal Revenue Code could further limit the utilization of net operating loss carryforwards. Realization of deferred tax assets is dependent upon future earnings, if any, the timing and amount of which are uncertain. Accordingly, the net deferred tax assets have been fully offset by a valuation allowance. Cumulative excess tax benefits of $4.2 million, related to the exercise of nonqualified stock options, will be recorded in equity when realized.
89
We consider all evidence available when determining whether deferred tax assets are more likely than not to be realized, including tax planning strategies t
hat could involve the sale of certain assets and
would be employed to prevent an NOL from expiring unutilized. As of December 31, 2010, we have determined that deferred tax assets of $28.8 million are more-likely than not to be realized. We have also determined that deferred tax liabilities of $12.9 million are required substantially related to book basis in goodwill that has an indefinite life.
For the next five years, and thereafter, federal net operating loss carryforwards expire as follows (in thousands):
|
Total Net Operating
Loss Carryforwards
|
Amount Subject
to 382 limitation
|
|||||||
|
Year Ended
|
||||||||
|
2011
|
- | - | ||||||
|
2012
|
- | - | ||||||
|
2013
|
- | - | ||||||
|
2014
|
- | - | ||||||
|
2015
|
- | - | ||||||
|
Thereafter
|
178,126 | 17,043 | ||||||
| $ | 178,126 | $ | 17,043 | |||||
We file consolidated income tax returns in the U.S. federal jurisdiction, and various states and foreign jurisdictions. We continue to reinvest earnings of the non-US entities for the foreseeable future and therefore have not recognized any U.S. tax expense on these earnings. With limited exceptions, we are no longer subject to U.S. federal, state and local, or non-U.S. income tax examinations by tax authorities for years before 1998. We do not anticipate the results of any open examinations would result in a material change to its financial position.
We adopted the amended provisions of ASC Topic 740,
Income Taxes
, on January 1, 2007. The implementation did not result in the recording of an increase to liabilities for uncertain tax positions. In 2010, we acquired a subsidiary that recognized a liability for uncertain tax positions in a prior year. A reconciliation of the beginning and ending amount of unrecognized tax benefits is as follows (in thousands):
|
Balance at December 31, 2009
|
$ | - | ||
|
Additional based on tax positions of acquired subsidiaries in prior years
|
90 | |||
|
Balance at December 31, 2010
|
$ | 90 |
We recognize accrued interest and penalties related to unrecognized tax benefits in income tax expense. We recognized no penalties and interest during the years ended December 31, 2010, 2009 and 2008, and had accrued approximately $90,000 and $0 for the payment of penalties and interest at December 31, 2010 and 2009, respectively. The reserves for uncertain tax positions are included in accounts payable, accrued and other liabilities as of December 31, 2010 and 2009.
Stock Incentive Plans
We have two long-term incentive plans that currently have outstanding stock options which we refer to as the 2000 Plan and the 2006 Plan. The 2000 Plan was terminated as to future grants when the 2006 Plan was approved by the stockholders in 2006. We have reserved for issuance under the 2006 Plan 6,500,000 shares of common stock. Certain options granted under the 2006 Plan to employees are intended to qualify as incentive stock options under existing tax regulations. In addition, we issue non-qualified stock options and warrants under the 2006 Plan from time to time to non-employees, in connection with acquisitions and for other purposes and we may also issue stock under the Plan. Stock options and warrants generally vest over two to five years and expire five to ten years from date of grant.
As of December 31, 2010, 3,507,583, or approximately 62.0%, of all the outstanding stock options and warrants under our option plans are fully vested. During the year ended December 31, 2010, we granted options and warrants to acquire 1,780,000 shares of common stock.
We have issued warrants outside the Plan under various types of arrangements to employees, in conjunction with debt financing and in exchange for outside services. All warrants issued to employees or consultants after our February 2007 listing on the NASDAQ Global Market have been characterized as awards under the 2006 Plan. All warrants outside the Plan have been issued with an exercise price equal to the fair value of the underlying common stock on the date of grant. The warrants expire from five to seven years from the date of grant. Vesting terms are determined by the board of directors or the compensation committee of the board of directors at the date of grant.
90
As of December 31, 2010, 2,444,566, or approximately 90.0%, of all the outstanding warrants outside the 2006 Plan are fully vested. During the year ended December 31, 2010, we granted warrants to acquired 200,000 shares of common stock.
The following tables illustrate the impact of equity-based compensation on reported amounts (in thousands except per share data):
|
For the Years Ended December 31,
|
||||||||||||||||||||||||
|
2010
|
2009
|
2008
|
||||||||||||||||||||||
|
Impact of Equity-Based Compensation
|
||||||||||||||||||||||||
|
As Reported
|
Comp.
|
As Reported
|
Comp.
|
As Reported
|
Comp.
|
|||||||||||||||||||
|
Income from operations
|
$ | 38,435 | $ | (3,718 | ) | $ | 38,857 | $ | (3,607 | ) | $ | 29,287 | $ | (2,902 | ) | |||||||||
|
Net loss attributable to Radnet, Inc.'s common stockholders before income taxes
|
$ | (12,276 | ) | $ | (3,718 | ) | $ | (1,824 | ) | $ | (3,607 | ) | $ | (12,685 | ) | $ | (2,902 | ) | ||||||
|
Net loss attributable to Radnet, Inc.'s common stockholders
|
$ | (12,852 | ) | $ | (3,718 | ) | $ | (2,267 | ) | $ | (3,607 | ) | $ | (12,836 | ) | $ | (2,902 | ) | ||||||
|
Basic and diluted net loss per share attributable to Radnet, Inc.'s common stockholders
|
$ | (0.35 | ) | $ | (0.10 | ) | $ | (0.06 | ) | $ | (0.10 | ) | $ | (0.36 | ) | $ | (0.08 | ) | ||||||
|
Net diluted earnings per share attributable to Radnet, Inc.'s common stockholders
|
$ | (0.35 | ) | $ | (0.10 | ) | $ | (0.06 | ) | $ | (0.10 | ) | $ | (0.36 | ) | $ | (0.08 | ) | ||||||
The following summarizes all of our option and warrant transactions in 2010:
|
Weighted Average
|
||||||||
|
Weighted Average
|
Remaining
|
Aggregate
|
||||||
|
Outstanding Options and Warrants
|
Exercise price
|
Contractual Life
|
Intrinsic
|
|||||
|
Under the 2006 Plan
|
Shares
|
Per Common Share
|
(in years)
|
Value
|
||||
|
Balance, December 31, 2009
|
3,959,750
|
$4.15
|
||||||
|
Granted
|
1,780,000
|
2.46
|
||||||
|
Exercised
|
(18,750)
|
0.92
|
||||||
|
Canceled or expired
|
(60,000)
|
2.40
|
||||||
|
Balance, December 31, 2010
|
5,661,000
|
3.65
|
3.54
|
$ 1,690,200
|
||||
|
Exercisable at December 31, 2010
|
3,507,583
|
3.77
|
3.28
|
967,075
|
|
Weighted Average
|
||||||||
|
Weighted Average
|
Remaining
|
Aggregate
|
||||||
|
Non-Plan
|
Exercise price
|
Contractual Life
|
Intrinsic
|
|||||
|
Outstanding Warrants
|
Shares
|
Per Common Share
|
(in years)
|
Value
|
||||
|
Balance, December 31, 2009
|
3,057,898
|
$2.24
|
||||||
|
Granted
|
200,000
|
2.62
|
||||||
|
Exercised
|
(540,000)
|
0.80
|
||||||
|
Canceled or expired
|
-
|
-
|
||||||
|
Balance, December 31, 2010
|
2,717,898
|
2.56
|
1.92
|
$ 2,275,627
|
||||
|
Exercisable at December 31, 2010
|
2,444,566
|
2.38
|
1.59
|
2,235,227
|
The aggregate intrinsic value in the table above represents the total pretax intrinsic value (the difference between our closing stock price on December 31, 2010 and the exercise price, multiplied by the number of in-the-money options) that would have been received by the option holder had all option holders exercised their options on December 31, 2010. Total intrinsic value of options and warrants exercised during the years ended December 31, 2010, 2009 and 2008 was approximately $1.3 million, $848,000 and $4.2 million respectively. As of December 31, 2010, total unrecognized stock-based compensation expense related to non-vested employee awards was approximately $3.6 million, which is expected to be recognized over a weighted average period of approximately 1.6 years.
The fair value of each option granted is estimated on the grant date using the Black-Scholes option pricing model which takes into account as of the grant date the exercise price and expected life of the option, the current price of the underlying stock and its expected volatility, expected dividends on the stock and the risk-free interest rate for the term of the option. The following is the average of the data used to calculate the fair value:
91
|
Risk-free
|
Expected
|
Expected
|
Expected
|
|||||
|
Interest Rate
|
Life
|
Volatility
|
Dividends
|
|||||
|
December 31, 2010
|
1.92%
|
3.19 years
|
90.65%
|
-
|
||||
|
December 31, 2009
|
2.65%
|
3.10 years
|
91.45%
|
-
|
||||
|
December 31, 2008
|
2.75%
|
3.41 years
|
71.75%
|
-
|
||||
Because we lack detailed information about exercise behavior at this time, we have determined the expected term assumption under the “Simplified Method” as defined in ASC Topic 718, originally issued as SAB No. 110. The expected stock price volatility is based on the historical volatility of our stock. The risk-free interest rate is based on the U.S. Treasury yield in effect at the time of grant with an equivalent remaining term. We have not paid dividends in the past and do not currently plan to pay any dividends in the near future.
The weighted-average grant date fair value of stock options and warrants granted during the years ended December 31, 2010, 2009 and 2008 was $1.46, $1.43 and $2.54, respectively.
Leases
– We lease various operating facilities and certain medical equipment under operating leases with renewal options expiring through 2025. Certain leases contain renewal options from two to ten years and escalation based either on the consumer price index or fixed rent escalators. The schedule below includes lease renewals that are reasonably assured. Leases with fixed rent escalators are recorded on a straight-line basis. We record deferred rent for tenant leasehold improvement allowances received from a lessor and amortize the deferred rent expense over the term of the lease agreement. Minimum annual payments under operating leases for future years, including all options to extend, ending December 31 were as follows (in thousands):
|
Facilities
|
Equipment
|
Total
|
||||||||||
|
2011
|
$ | 29,824 | $ | 9,134 | $ | 38,958 | ||||||
|
2012
|
26,670 | 7,186 | 33,856 | |||||||||
|
2013
|
23,577 | 4,726 | 28,303 | |||||||||
|
2014
|
20,213 | 1,842 | 22,055 | |||||||||
|
2015
|
16,780 | 766 | 17,546 | |||||||||
|
Thereafter
|
75,475 | - | 75,475 | |||||||||
| $ | 192,539 | $ | 23,654 | $ | 216,193 | |||||||
Total rent expense, including equipment rentals, for the years ended December 31, 2010, 2009 and 2008 was $47.9 million, $43.4 million and $43.5 million, respectively.
We have an arrangement with GE Medical Systems under which it has agreed to be responsible for the maintenance and repair of a majority of our equipment for a fee that is based on the type and age of the equipment. Under this agreement, we are committed to minimum payments of approximately $24.0 million per year through 2016.
We are engaged from time to time in the defense of lawsuits arising out of the ordinary course and conduct of our business. We believe that the outcome of our current litigation will not have a material adverse impact on our business, financial condition and results of operations. However, we could be subsequently named as a defendant in other lawsuits that could adversely affect us.
We adopted a profit-sharing/savings plan pursuant to Section 401(k) of the Internal Revenue Code that covers substantially all non-professional employees. Eligible employees may contribute on a tax-deferred basis a percentage of compensation, up to the maximum allowable under tax law. Employee contributions vest immediately. The plan does not require a matching contribution by us. There was no expense for any periods presented in the report.
The following table sets forth a summary of our unaudited quarterly operating results for each of the last eight quarters in the years ended December 31, 2010 and 2009. This quarterly data has been derived from our unaudited consolidated interim financial statements which, in our opinion, have been prepared on substantially the same basis as the audited financial statements contained elsewhere in this report and include all normal recurring adjustments necessary for a fair presentation of the financial information for the periods presented. These unaudited quarterly results should be read in conjunction with our financial statements and notes thereto included elsewhere in this report. The operating results in any quarter are not necessarily indicative of the results that may be expected for any future period (in thousands except for earnings per share).
92
|
2010 Quarter Ended
|
2009 Quarter Ended
|
|||||||||||||||||||||||||||||||
|
Mar 31
|
June 30
|
Sept 30
|
Dec 31
|
Mar 31
|
June 30
|
Sept 30
|
Dec 31
|
|||||||||||||||||||||||||
|
Statement of Operations Data:
|
||||||||||||||||||||||||||||||||
|
Net revenue
|
$ | 124,178 | $ | 138,951 | $ | 140,093 | $ | 145,315 | $ | 128,003 | $ | 131,146 | $ | 133,404 | $ | 131,815 | ||||||||||||||||
|
Total operating expenses
|
119,827 | 129,035 | 128,709 | 132,531 | 118,204 | 120,527 | 124,261 | 121,132 | ||||||||||||||||||||||||
|
Total other expenses
|
9,967 | 23,750 | 13,602 | 11,455 | 13,219 | 13,370 | 12,365 | 11,478 | ||||||||||||||||||||||||
|
Equity in earnings of joint ventures
|
1,861 | 1,971 | 2,282 | 2,116 | 2,635 | 2,453 | 1,751 | 1,617 | ||||||||||||||||||||||||
|
Income tax expense (benefit)
|
334 | (128 | ) | 317 | 53 | 37 | 13 | 231 | 162 | |||||||||||||||||||||||
|
Net income (loss)
|
(4,089 | ) | (11,735 | ) | (253 | ) | 3,392 | (822 | ) | (311 | ) | (1,702 | ) | 660 | ||||||||||||||||||
|
Net income attributable to noncontrolling interests
|
22 | 21 | 32 | 92 | 20 | 25 | 24 | 23 | ||||||||||||||||||||||||
|
Net income (loss) attributable to Radnet, Inc. common stockholders
|
$ | (4,111 | ) | $ | (11,756 | ) | $ | (285 | ) | $ | 3,300 | $ | (842 | ) | $ | (336 | ) | $ | (1,726 | ) | $ | 637 | ||||||||||
|
Basic net income (loss) attributable to Radnet, Inc. common stockholders earnings (loss) per share:
|
$ | (0.11 | ) | $ | (0.32 | ) | $ | (0.01 | ) | $ | 0.09 | $ | (0.02 | ) | $ | (0.01 | ) | $ | (0.05 | ) | $ | 0.02 | ||||||||||
|
Diluted net income (loss) attributable to Radnet, Inc. common stockholders earnings (loss) per share:
|
$ | (0.11 | ) | $ | (0.32 | ) | $ | (0.01 | ) | $ | 0.09 | $ | (0.02 | ) | $ | (0.01 | ) | $ | (0.05 | ) | $ | 0.02 | ||||||||||
|
Weighted average shares outstanding
|
||||||||||||||||||||||||||||||||
|
Basic
|
36,364 | 36,917 | 36,980 | 37,143 | 35,916 | 35,924 | 36,105 | 36,238 | ||||||||||||||||||||||||
|
Diluted
|
36,364 | 36,917 | 36,980 | 37,845 | 35,916 | 35,924 | 36,105 | 37,394 | ||||||||||||||||||||||||
On January 3, 2011, we consummated the acquisition of Imaging On Call, LLC, a provider of teleradiology services to radiology groups, hospitals and imaging centers located in Poughkeepsie, New York, for $5.5 million cash plus an earn-out of up to an additional $2.5 million.
On February 14, 2011, we completed an exchange offer where by all of our senior unsecured notes were exchanged for registered publicly tradable notes.
On March 7, 2011, we executed a definitive agreement to acquire five multi-modality imaging centers in Maryland from Diagnostic Health Corporation. We will pay approximately $7.1 million, in a combination of cash and the assumption of certain capital lease liabilities. The facilities located in Bowie, Chevy Chase, Frederick, Rockville and Waldorf operate a combination of MRI, CT, ultrasound, mammography, x-ray and other related modalities.
93
|
Item 9.
|
Changes In and Disagreements with Accountants on Accounting and Financial Disclosure
|
None.
|
Item 9A.
|
Controls and Procedures
|
Disclosure Controls and Procedures
Our disclosure controls and procedures are designed to provide reasonable assurances that material information related to our company is recorded, processed, summarized and reported within the time periods specified in the SEC rules and forms, and that such information is accumulated and reported to our management, including our Chief Executive Officer and Chief Financial Officer, as appropriate, to allow timely decisions regarding required disclosure.
We have performed an evaluation under the supervision and with the participation of our management, including our Chief Executive Officer and Chief Financial Officer, of the effectiveness of our disclosure controls and procedures, as defined under the Securities Exchange Act of 1934. Based on that evaluation, our management, including our Chief Executive Officer, and Chief Financial Officer, concluded that, effective as of December 31, 2010, our disclosure controls and procedures were at that “reasonable assurance” level.
Management’s Annual Report on Internal Control over Financial Reporting
Our management is responsible for establishing and maintaining adequate internal control over financial reporting, as such term is defined in Exchange Act Rules 13a-15(f) and 15d-15(f). Under the supervision and with the participation of our management, including our Chief Executive Officer, and Chief Financial Officer, we conducted an evaluation of the effectiveness of our internal control over financial reporting as of December 31, 2010 based on the guidelines established in
Internal Control — Integrated Framework
issued by the Committee of Sponsoring Organizations of the Treadway Commission (COSO). Our internal control over financial reporting includes policies and procedures that provide reasonable assurance regarding the reliability of financial reporting and the preparation of financial statements for external reporting purposes in accordance with U.S. generally accepted accounting principles.
Based on the results of our evaluation, our management concluded that our internal control over financial reporting was effective as of December 31, 2010. We reviewed the results of management’s assessment with our Audit Committee.
The effectiveness of the Company’s internal control over financial reporting has been audited by Ernst & Young LLP, an independent registered public accounting firm, as stated in their report appearing on the page immediately following, which expresses an unqualified opinion on the effectiveness of the Company’s internal control over financial reporting as of December 31, 2010.
Changes in Internal Control over Financial Reporting
There were no changes in our internal control over financial reporting during the last fiscal quarter that have materially affected, or are reasonably likely to materially affect, our internal control over financial reporting.
94
REPORT OF INDEPENDENT REGISTERED PUBLIC ACCOUNTING FIRM
Board of Directors and Stockholders of
RadNet, Inc.
We have audited RadNet Inc. and subsidiaries' (“RadNet’s”) internal control over financial reporting as of December 31, 2010, based on criteria established in
Internal Control—Integrated Framework
issued by the Committee of Sponsoring Organizations of the Treadway Commission (the COSO criteria). RadNet’s management is responsible for maintaining effective internal control over financial reporting, and for its assessment of the effectiveness of internal control over financial reporting included in the accompanying “Management’s Annual Report on Internal Control over Financial Reporting.” Our responsibility is to express an opinion on RadNet’s internal control over financial reporting based on our audit.
We conducted our audit in accordance with the standards of the Public Company Accounting Oversight Board (United States). Those standards require that we plan and perform the audit to obtain reasonable assurance about whether effective internal control over financial reporting was maintained in all material respects. Our audit included obtaining an understanding of internal control over financial reporting, assessing the risk that a material weakness exists, testing and evaluating the design and operating effectiveness of internal control based on the assessed risk, and performing such other procedures as we considered necessary in the circumstances. We believe that our audit provides a reasonable basis for our opinion.
A company’s internal control over financial reporting is a process designed to provide reasonable assurance regarding the reliability of financial reporting and the preparation of financial statements for external purposes in accordance with generally accepted accounting principles. A company’s internal control over financial reporting includes those policies and procedures that (1) pertain to the maintenance of records that, in reasonable detail, accurately and fairly reflect the transactions and dispositions of the assets of the company; (2) provide reasonable assurance that transactions are recorded as necessary to permit preparation of financial statements in accordance with generally accepted accounting principles, and that receipts and expenditures of the company are being made only in accordance with authorizations of management and directors of the company; and (3) provide reasonable assurance regarding prevention or timely detection of unauthorized acquisition, use or disposition of the company’s assets that could have a material effect on the financial statements.
Because of its inherent limitations, internal control over financial reporting may not prevent or detect misstatements. Also, projections of any evaluation of effectiveness to future periods are subject to the risk that controls may become inadequate because of changes in conditions, or that the degree of compliance with the policies or procedures may deteriorate.
In our opinion, RadNet, Inc. and subsidiaries maintained, in all material respects, effective internal control over financial reporting as of December 31, 2010, based on the COSO criteria.
We have also audited, in accordance with the standards of the Public Company Accounting Oversight Board (United States) the consolidated balance sheets of RadNet, Inc. and subsidiaries as of December 31, 2010 and 2009, and the related consolidated statements of operations, equity deficit, and cash flows for each of the three years in the period ended December 31, 2010 of RadNet, Inc. and subsidiaries and our report dated March 11, 2011 expressed an unqualified opinion thereon.
|
/s/ Ernst & Young LLP
|
Los Angeles, California
March 11, 2011
95
None
As used in this Part III, “RadNet” and the “Company” means RadNet, Inc.
The information required by this item regarding the Company’s directors and executive officers is incorporated herein by reference to the sections entitled “Proposal 1 – Election Of Directors” and “Compensation of Directors and Executive Officers” and “Executive Officers” and “Corporate Governance – Board Committees – Section 16(a) Beneficial Ownership Reporting Compliance” in the Company’s definitive Proxy Statement for the Annual Meeting of Stockholders to be filed with the Securities and Exchange Commission within 120 days after the end of our fiscal year (the “Proxy Statement”).
We have adopted a code of financial ethics applicable to our directors, officers and employees which is designed to deter wrongdoing and to promote:
|
|
·
|
honest and ethical conduct;
|
|
|
·
|
full, fair, accurate, timely and understandable disclosure in reports and documents that we file with the SEC and in our other public communications;
|
|
|
·
|
compliance with applicable laws, rules and regulations, including insider trading compliance; and
|
|
|
·
|
accountability for adherence to the code and prompt internal reporting of violations of the code, including illegal or unethical behavior regarding accounting or auditing practices.
|
You may obtain a copy of our Code of Financial Ethics on our website at
www.radnet.com
under Investors — Corporate Governance. The Audit Committee is responsible for reviewing the Code of Financial Ethics and amending as necessary. Any amendments will be disclosed on our website.
The information required by this item is incorporated by reference to the sections entitled “Compensation of Directors and Executive Officers” and “Compensation Discussion and Analysis” in the Proxy Statement.
The information required by this item is incorporated by reference to the sections entitled “Security Ownership of Certain Beneficial Owners and Management” and “Compensation of Directors and Executive Officers– Summary Compensation Table” in the Proxy Statement.
The information required by this item is incorporated by reference to the section entitled ““Certain Relationships and Related Party Transactions” in the Proxy Statement.
The information required by this item is incorporated by reference to the sections entitled “Independent Registered Public Accounting Firm Fees” and “Policy on Audit Committee Pre-Approval of Audit and Permissible Non-Audit Services of the Independent Registered Public Accounting Firm” in the Proxy Statement.
96
|
|
Page No.
|
|
|
(a) Financial Statements – The following financial statements are filed herewith:
|
||
|
Report of Independent Registered Public Accounting Firm
|
58
|
|
|
Consolidated Balance Sheets
|
59
|
|
|
Consolidated Statements of Operations
|
60
|
|
|
Consolidated Statements of Equity Deficit
|
61
|
|
|
Consolidated Statements of Cash Flows
|
62
|
|
|
Notes to Consolidated Financial Statements
|
64 to 93
|
|
|
(b) Financial Statements Schedules
|
|
Schedules – The Following financial statement schedules are filed herewith:
|
|
|
Schedule II – Valuation and Qualifying Accounts
|
All other schedules are omitted because they are not applicable or the required information is shown in the consolidated financial statements or notes thereto.
RADNET, INC. AND SUBSIDIARIES
SCHEDULE II – VALUATION AND QUALIFYING ACCOUNTS
|
Balance at
Beginning of Year
|
Additional Charges Against Income
|
Deductions
f
rom Reserve
|
Balance at
End of Year
|
|||||||||||||
|
Year Ended December 31, 2010
|
||||||||||||||||
|
Accounts Receivable-Allowance for Bad Debts
|
$ | 12,951 | $ | 33,158 | $ | (27,116 | ) | $ | 18,993 | |||||||
|
Year Ended December 31, 2009
|
||||||||||||||||
|
Accounts Receivable-Allowance for Bad Debts
|
$ | 12,065 | $ | 32,704 | $ | (31,818 | ) | $ | 12,951 | |||||||
|
Year Ended December 31, 2008
|
||||||||||||||||
|
Accounts Receivable-Allowance for Bad Debts
|
$ | 11,571 | $ | 30,832 | $ | (30,338 | ) | $ | 12,065 | |||||||
97
(c) Exhibits – The following exhibits are filed herewith or incorporated by reference herein:
|
Exhibit No.
|
Description of Exhibit
|
||
|
2.1
|
Agreement and Plan of Merger, dated as of July 6, 2006, by and among Primedex, Radiologix, Radnet Management, Inc. and Merger Sub (incorporated by reference to exhibit filed with Registration Statement on Form S-4 (File No. 333-136800)).
|
||
|
2.2
|
Agreement and Plan of Merger and Reorganization, dated as of September 3, 2008 (incorporated by reference to exhibit filed with Form 8-K on September 4, 2008).
|
||
|
2.3
|
Membership Interests Purchase Agreement dated September 7, 2010 by and among New Jersey Imaging Partners, Inc., RadNet, Inc., Progressive Health, LLC and the other parties named therein (incorporated by reference to exhibit filed with Form 8-K on January 7, 2011) .
|
||
|
2.4
|
Purchase Agreement dated September 7, 2010 by and between New Jersey Imaging Partners, Inc. and Progressive Medical Imaging of Rutherford, LLC (incorporated by reference to exhibit filed with Amendment No. 1 to Registration Statement on Form S-4 (File No. 333-169107)).
|
||
|
2.5
|
Merger Agreement dated September 13, 2010 by and among RadNet Managed Imaging Services, Inc. INC Merger Sub, Inc. and Image Medical Corporation (incorporated by reference to exhibit filed with Amendment No. 1 to Registration Statement on Form S-4 (File No. 333-169107)).
|
||
|
3.1
|
Certificate of Incorporation of RadNet, Inc., a Delaware corporation (incorporated by reference to exhibit filed with Form 8-K on September 4, 2008).
|
||
|
3.2
|
Certificate of Amendment to Certificate of Incorporation of RadNet, Inc., a Delaware corporation, dated September 2, 2008 (incorporated by reference to exhibit filed with Form 8-K on September 4, 2008).
|
||
|
3.3
|
Bylaws of RadNet, Inc., a Delaware corporation (incorporated by reference to exhibit filed with Form 8-K on September 4, 2008).
|
||
|
4.1
|
Indenture, dated as of April 6, 2010, by and among Radnet Management, Inc., RadNet, Inc. the subsidiary guarantors thereunder, and U.S. Bank, National Association, as Trustee (incorporated by reference to exhibit filed with Form 8-K on April 6, 2010).
|
||
|
4.2
|
Form of Exchange Note (included in Exhibit 4.1).
|
||
|
4.3
|
Form of 10 3/8% Note (included in Exhibit 4.1).
|
||
|
4.4
|
Registration Rights Agreement, dated April 6, 2010, by and among Radnet Management, Inc., RadNet, Inc., the subsidiary guarantors thereunder, and Deutsche Bank Securities Inc. and Barclays Capital Inc., as representatives of the initial purchasers (incorporated by reference to exhibit filed with Form 8-K on April 6, 2010).
|
||
|
4.5
|
Supplemental Indenture, dated as of July 6, 2010, by and between Advanced Radiology, LLC and U.S. Bank, National Association, as Trustee (incorporated by reference to exhibit filed with Registration Statement on Form S-4 (File No. 333-169107)).
|
||
|
4.6
|
Supplemental Indenture, dated as of August 19, 2010 by and between Health Diagnostics of New Jersey, LLC and U.S. Bank, National Association, as Trustee (incorporated by reference to exhibit filed with Registration Statement on Form S-4 (File No. 333-169107)).
|
||
|
4.7
|
Supplemental Indenture, dated as of January 10, 2011, by and between Image Medical Corporation and U.S. Bank, National Association, as Trustee (incorporated by reference to exhibit filed with Amendment No. 1 to Registration Statement on Form S-4 (File No. 333-169107)).
|
||
|
4.8
|
Supplemental Indenture, dated as of January 10, 2011, by and between eRAD, Inc. and U.S. Bank, National Association, as Trustee (incorporated by reference to exhibit filed with Amendment No. 1 to Registration Statement on Form S-4 (File No. 333-169107)).
|
||
|
4.9
|
Supplemental Indenture, dated as of January 10, 2011, by and between East Bergen Imaging, LLC and U.S. Bank, National Association, as Trustee (incorporated by reference to exhibit filed with Amendment No. 1 to Registration Statement on Form S-4 (File No. 333-169107)).
|
||
98
|
4.10
|
Supplemental Indenture, dated as of January 10, 2011, by and between Progressive Medical Imaging of Bloomfield, LLC and U.S. Bank, National Association, as Trustee (incorporated by reference to exhibit filed with Amendment No. 1 to Registration Statement on Form S-4 (File No. 333-169107)).
|
||
|
4.11
|
Supplemental Indenture, dated as of January 10, 2011, by and between Progressive Medical Imaging of Hackensack, LLC and U.S. Bank, National Association, as Trustee (incorporated by reference to exhibit filed with Amendment No. 1 to Registration Statement on Form S-4 (File No. 333-169107)).
|
||
|
4.12
|
Supplemental Indenture, dated as of January 10, 2011, by and between Progressive Medical Imaging of Union City, LLC and U.S. Bank, National Association, as Trustee (incorporated by reference to exhibit filed with Amendment No. 1 to Registration Statement on Form S-4 (File No. 333-169107)).
|
||
|
4.13
|
Supplemental Indenture, dated as of January 10, 2011, by and between Progressive X-Ray of Englewood, LLC and U.S. Bank, National Association, as Trustee (incorporated by reference to exhibit filed with Amendment No. 1 to Registration Statement on Form S-4 (File No. 333-169107)).
|
||
|
4.14
|
Supplemental Indenture, dated as of January 10, 2011, by and between Progressive X-Ray of Kearney, LLC and U.S. Bank, National Association, as Trustee (incorporated by reference to exhibit filed with Amendment No. 1 to Registration Statement on Form S-4 (File No. 333-169107)).
|
||
|
4.15
|
Supplemental Indenture, dated as of January 10, 2011, by and between Imaging On Call, LLC and U.S. Bank, National Association, as Trustee (incorporated by reference to exhibit filed with Amendment No. 1 to Registration Statement on Form S-4 (File No. 333-169107)).
|
||
|
4.16
|
Supplemental Indenture, dated as of January 10, 2011, by and between Advanced NA, LLC and U.S. Bank, National Association, as Trustee (incorporated by reference to exhibit filed with Amendment No. 1 to Registration Statement on Form S-4 (File No. 333-169107)).
|
||
|
10.1
|
Credit and Guaranty Agreement, dated April 6, 2010, by and among Radnet Management, Inc., RadNet, Inc., the guarantors thereunder, General Electric Capital Corporation, Deutsche Bank Securities, Inc., RBC Capital Markets and Barclays Bank PLC (incorporated by reference to exhibit filed with Form 10-Q for the quarter ended September 30, 2010).
|
||
|
10.2
|
Pledge and Security Agreement, dated April 6, 2010, by and among Radnet Management, Inc., RadNet, Inc., the guarantors thereunder, and Barclays Bank PLC (incorporated by reference to exhibit filed with Form 8-K on April 6, 2010).
|
||
|
10.3
|
Form of Trademark Security Agreement, dated April 6, 2010, by and among the guarantors thereunder and Barclays Bank PLC (filed as an exhibit to the Pledge and Security Agreement, dated April 6, 2010, by among the guarantors thereunder and Barclays Bank PLC, included as Exhibit 10.2).
|
||
|
10.4
|
Pledge Supplement, dated as of February 23, 2011, among East Bergen Imaging, LLC, Progressive Medical Imaging of Bloomfield, LLC, Progressive Medical Imaging of Hackensack, LLC, Progressive Medical Imaging of Union City, LLC, Progressive X-Ray of Englewood, LLC, Progressive X-Ray of Kearney, LLC, Imaging On Call, LLC, Advanced NA, LLC and Advanced Radiology, LLC (incorporated by reference to exhibit filed with Form 8-K on March 1, 2011).
|
||
|
10.5
|
Counterpart Agreement, dated as of February 23, 2011, among East Bergen Imaging, LLC, Progressive Medical Imaging of Bloomfield, LLC, Progressive Medical Imaging of Hackensack, LLC, Progressive Medical Imaging of Union City, LLC, Progressive X-Ray of Englewood, LLC, Progressive X-Ray of Kearney, LLC, Imaging On Call, LLC, Advanced NA, LLC, Advanced Radiology, LLC and Barclays Bank PLC (incorporated by reference to exhibit filed with Form 8-K on March 1, 2011).
|
||
|
10.6
|
Allonge to Intercompany Note, dated as of February 23, 2011, among East Bergen Imaging, LLC, Progressive Medical Imaging of Bloomfield, LLC, Progressive Medical Imaging of Hackensack, LLC, Progressive Medical Imaging of Union City, LLC, Progressive X-Ray of Englewood, LLC, Progressive X-Ray of Kearney, LLC, Imaging On Call, LLC, Advanced NA, LLC and Advanced Radiology, LLC (incorporated by reference to exhibit filed with Form 8-K on March 1, 2011).
|
||
|
10.7
|
2000 Incentive Stock Option Plan (as amended) (incorporated by reference to exhibit filed with the Form 10-K for the year ended October 31, 2003).*
|
||
|
10.8
|
2006 Equity Incentive Plan (incorporated by reference to exhibit filed with Registration Statement on Form S-4 (File No. 333-136800)).*
|
||
99
|
10.9
|
First Amendment to the 2006 Equity Incentive Plan (incorporated by reference to exhibit filed with Form 10-Q for the quarter ended June 30, 2008).*
|
||
|
10.10
|
Form of Warrant recharacterized as under the 2006 Equity Incentive Plan – Form A (incorporated by reference to exhibit filed with Form 10-Q for the quarter ended June 30, 2008).
|
||
|
10.11
|
Form of Warrant recharacterized as under the 2006 Equity Incentive Plan – Form B (incorporated by reference to exhibit filed with Form 10-Q for the quarter ended June 30, 2008).
|
||
|
10.12
|
Form of Indemnification Agreement between the registrant and each of its officers and directors(incorporated by reference to exhibit filed with Form 10-Q for the quarter ended March 31, 2008).*
|
||
|
10.13
|
Employment Agreement dated as of June 12, 1992 with Howard G. Berger, M.D. (incorporated by reference to exhibit filed with an amendment to Form 8-K report for June 12, 1992).*
|
||
|
10.14
|
Amendment to Employment Agreement with Howard G. Berger, M.D. (incorporated by reference to exhibit filed with Form 10-Q for the quarter ended January 31, 2004).*
|
||
|
10.15
|
Employment Agreement dated as of April 16, 2001 with Jeffrey L. Linden (incorporated by reference to exhibit filed with Form 10-K for the year ended October 31, 2001).*
|
||
|
Amendment to Employment Agreement with Jeffrey L. Linden (incorporated by reference to exhibit filed with Form 10-Q for the quarter ended January 31, 2004).*
|
|||
|
10.16
|
Employment Agreement dated as of May 1, 2001 with Norman R. Hames (incorporated by reference to exhibit filed with Form 10-K for the year ended October 31, 2001).*
|
||
|
10.17
|
Amendment to Employment Agreement with Norman R. Hames (incorporated by reference to exhibit filed with Form 10-Q for the quarter ended January 31, 2004).*
|
||
|
10.18
|
Employment Agreement with Mark Stolper effective January 1, 2009 (incorporated by reference to exhibit filed with Form 10-K for the year ended December 31, 2009).*
|
||
|
10.19
|
Retention Agreement with Stephen Forthuber dated November 15, 2006 (incorporated by reference to exhibit filed with Form 10-K/T for the year ended December 31,2 006).*
|
||
|
10.20
|
Amended and Restated Management and Service Agreement between Radnet Management, Inc. and Beverly Radiology Medical Group III dated January 1, 2004 (incorporated by reference to exhibit filed with Form 10-K for the year ended October 31, 2003).
|
||
|
12.1
|
Statement of Computation of Ratio of Earnings to Fixed Charges.
|
||
|
14.1
|
Code of Financial Ethics (incorporated by reference to exhibit filed with Form 10-K for the year ended October 31, 2003).
|
||
|
21.1
|
List of Subsidiaries.
|
||
|
23.1
|
Consent of Registered Independent Public Accounting Firm
.
|
||
|
24.1
|
Power of Attorney (included on signature page attached hereto)
.
|
||
|
31.1
|
CEO Certification pursuant to Section 302.
|
||
|
31.2
|
CFO Certification pursuant to Section 302.
|
||
|
32.1
|
CEO Certification pursuant to Section 906.
|
||
|
32.2
|
CFO Certification pursuant to Section 906.
|
100
SIGNATURES
Pursuant to the requirements of Section 13 or 15(d) of the Securities Exchange Act of 1934, the Registrant has duly caused this report to be signed on its behalf by the undersigned, thereunto duly authorized.
|
RADNET, INC.
|
|||
|
Date: March 11, 2011
|
/s/ HOWARD G. BERGER, M.D .
|
||
|
Howard G. Berger, M.D., President,
|
|||
|
Chief Executive Officer and Director
|
|||
POWER OF ATTORNEY
KNOW ALL PERSONS BY THESE PRESENTS, that each person whose signature appears below hereby severally constitutes and appoints Howard G. Berger, M.D. and Mark D. Stolper, and each of them, his true and lawful attorney-in-fact and agent, with full power of substitution and re-substitution for him and in his name, place and stead, in any and all capacities to sign any and all amendments to this report, and to file the same, with all exhibits thereto, and other documents in connection therewith, with the Commission, granting unto said attorney-in-fact and agents, and each of them, full power and authority to do and perform each and every act and thing requisite or necessary fully to all intents and purposes as he might or could do in person, hereby ratifying and confirming all that each said attorneys-in-fact and agents or any of them or their or his substitute or substitutes, may lawfully do or cause to be done by virtue hereof.
Pursuant to the requirements of the Securities Exchange Act of 1934, this report has been signed below by the following persons on behalf of registrant in the capacities and on the dates indicated.
|
By
|
/s/ HOWARD G. BERGER, M.D .
|
|
|
Howard G. Berger, M.D., Director, Chief Executive Officer and President
|
||
|
Date: March 11, 2011
|
||
|
By
|
/s/ MARVIN S. CADWELL
|
|
|
Marvin S. Cadwell, Director
|
||
|
Date: March 11, 2011
|
||
|
By
|
/s/ JOHN V. CRUES, III, M.D.
|
|
|
John V. Crues, III, M.D., Director
|
||
|
Date: March 11, 2011
|
||
|
By
|
/s/ NORMAN R. HAMES
|
|
|
Norman R. Hames, Director
|
||
|
Date: March 11, 2011
|
||
|
By
|
/s/ DAVID L. SWARTZ
|
|
|
David L. Swartz, Director
|
||
|
Date: March 11, 2011
|
||
|
By
|
/s/ LAWRENCE L. LEVITT
|
|
|
Lawrence L. Levitt, Director
|
||
|
Date: March 11, 2011
|
||
|
By
|
/s/ MICHAEL L. SHERMAN, M.D.
|
|
|
Michael L. Sherman, M.D., Director
|
||
|
Date: March 11, 2011
|
||
|
By
|
/s/ MARK D. STOLPER
|
|
|
Mark D. Stolper,
Chief Financial Officer
(Principal Accounting Officer)
|
||
|
Date: March 11, 2011
|
||
101
TABLE OF CONTENTS
Part IItem 1. BusinessItem 1A. Risk FactorsItem 1B. Unresolved Staff CommentsItem 2. PropertiesItem 3. Legal ProceedingsItem 4. (removed and Reserved)Part IIItem 5. Market For The Registrant S Common Equity, Related Stockholder Matters and Issuer Purchases Of Equity SecuritiesItem 6. Selected Consolidated Financial DataItem 7. Management S Discussion and Analysis Of Financial Condition and Results Of OperationsItem 7A. Quantitative and Qualitative Disclosures About Market RiskItem 8. Financial Statements and Supplementary DataNote 1 Nature Of BusinessNote 2 - Summary Of Significant Accounting PoliciesNote 3 Facility AcquisitionsNote 4 Material AcquisitionsNote 5 Goodwill and Other Intangible AssetsNote 6 Recent Accounting StandardsNote 7 - Property and EquipmentNote 8 Accounts Payable and Accrued Expenses (in Thousands)Note 9 - Notes Payable, Line Of Credit and Capital LeasesNote 10 Supplemental Guarantor InformationNote 11 Derivative InstrumentsNote 12 Income TaxesNote 13 Stock-based CompensationNote 14 Commitments and ContingenciesNote 15 Employee Benefit PlanNote 16 Quarterly Results Of Operations (unaudited)Note 17 Subsequent EventsItem 9. Changes in and Disagreements with Accountants on Accounting and Financial DisclosureItem 9A. Controls and ProceduresItem 9B. Other InformationPart IIIItem 10. Directors, Executive Officers and Corporate GovernanceItem 11. Executive CompensationItem 12. Security Ownership Of Certain Beneficial Owners and Management and Related Shareholder MattersItem 13. Certain Relationships and Related Transactions, and Director IndependenceItem 14. Principal Accountant Fees and ServicesPart IVItem 15. Exhibits and Financial Statements Schedule Page NoItem 15. Exhibits and Financial Statements Schedule