REGENCY CENTERS CORP
10-Ks and 10-Qs
|
|
|
|
|
|
|
|
|
|
|
|
|
|
|
|
|
|
|
|
|
|
|
|
|
|
|
|
|
|
|
|
|
|
|
|
|
|
|
|
|
|
|
|
|
|
|
|
|
|
|
|
|
|
|
|
SECURITIES AND EXCHANGE COMMISSION
Washington, DC 20549
FORM 10-K
|
x
|
ANNUAL REPORT PURSUANT TO SECTION 13 OR 15(d) OF THE SECURITIES EXCHANGE ACT OF 1934
|
or
For the transition period from
to
|
o
|
TRANSITION REPORT PURSUANT TO SECTION 13 OR 15(d) OF THE SECURITIES EXCHANGE ACT OF 1934
|
Commission File Number 1-12298 (Regency Centers Corporation)
Commission File Number 0-24763 (Regency Centers, L.P.)
REGENCY CENTERS CORPORATION
REGENCY CENTERS, L.P.
(Exact name of registrant as specified in its charter)
|
FLORIDA (REGENCY CENTERS CORPORATION)
|

|
59-3191743
|
|
DELAWARE (REGENCY CENTERS, L.P.)
|
59-3429602
|
|
|
(State or other jurisdiction of incorporation or organization)
|
(I.R.S. Employer Identification No.)
|
|
|
One Independent Drive, Suite 114
Jacksonville, Florida 32202
|
(904) 598-7000
|
|
|
(Address of principal executive offices) (zip code)
|
(Registrant's telephone number, including area code)
|
|
Securities registered pursuant to Section 12(b) of the Act:
Regency Centers Corporation
|
Title of each class
|
|
Name of each exchange on which registered
|
|
Common Stock, $.01 par value
|
|
New York Stock Exchange
|
|
6.625% Series 6 Cumulative Redeemable Preferred Stock, $.01 par value
|
New York Stock Exchange
|
|
|
6.000% Series 7 Cumulative Redeemable Preferred Stock, $.01 par value
|
|
New York Stock Exchange
|
|
Title of each class
|
|
Name of each exchange on which registered
|
|
None
|
|
N/A
|
Securities registered pursuant to Section 12(g) of the Act:
Regency Centers Corporation: None
Regency Centers, L.P.:
Units of Partnership Interest
Indicate by check mark if the registrant is a well-known seasoned issuer, as defined in Rule 405 of the Securities Act.
Regency Centers Corporation YES
x
NO
o
Regency Centers, L.P. YES
x
NO
o
Indicate by check mark if the registrant is not required to file reports pursuant to Section 13 or Section 15(d) of the Act
Regency Centers Corporation YES
o
NO
x
Regency Centers, L.P. YES
o
NO
x
Indicate by check mark whether the registrant (1) has filed all reports required to be filed by Section 13 or 15(d) of the Securities Exchange Act of 1934 during the preceding 12 months (or for such shorter period that the registrant was required to file such reports), and (2) has been subject to such filing requirements for the past 90 days.
Regency Centers Corporation YES
x
NO
o
Regency Centers, L.P. YES
x
NO
o
Indicate by check mark whether the registrant has submitted electronically and posted on its corporate Web site, if any, every Interactive Data File required to be submitted and posted pursuant to Rule 405 of Regulation S-T (§232.405 of this chapter) during the preceding 12 months (or for such shorter period that the registrant was required to submit and post such files).
Regency Centers Corporation YES
x
NO
o
Regency Centers, L.P. YES
x
NO
o
Indicate by check mark if disclosure of delinquent filers pursuant to Item 405 of Regulation S-K (§229.405 of this chapter) is not contained herein, and will not be contained, to the best of registrant's knowledge, in definitive proxy or information statements incorporated by reference in Part III of this Form 10-K or any amendment to this Form 10-K.
Regency Centers Corporation
x
Regency Centers, L.P.
x
Indicate by check mark whether the registrant is a large accelerated filer, an accelerated filer, a non-accelerated filer, or a smaller reporting company. See the definitions of “large accelerated filer,” “accelerated filer” and “smaller reporting company” in Rule 12b-2 of the Exchange Act. (Check one):
Regency Centers Corporation:
|
Large accelerated filer
|
x
|
Accelerated filer
|
o
|
|
|
Non-accelerated filer
|
o
|
Smaller reporting company
|
o
|
|
Regency Centers, L.P.:
|
Large accelerated filer
|
o
|
|
Accelerated filer
|
x
|
|
Non-accelerated filer
|
o
|
|
Smaller reporting company
|
o
|
Indicate by check mark whether the registrant is a shell company (as defined in Rule 12b-2 of the Act).
Regency Centers Corporation YES
o
NO
x
Regency Centers, L.P. YES
o
NO
x
State the aggregate market value of the voting and non-voting common equity held by non-affiliates computed by reference to the price at which the common equity was last sold, or the average bid and asked price of such common equity, as of the last business day of the registrants' most recently completed second fiscal quarter.
Regency Centers Corporation
$8.2 billion
Regency Centers, L.P.
N/A
The number of shares outstanding of the Regency Centers Corporation’s voting common stock was
104,704,642
as of
February 24, 2017
.
Documents Incorporated by Reference
Portions of Regency Centers Corporation's proxy statement in connection with its
2017
Annual Meeting of Stockholders are incorporated by reference in Part III.
EXPLANATORY NOTE
This report combines the annual reports on Form 10-K for the year ended
December 31, 2016
of Regency Centers Corporation and Regency Centers, L.P. Unless stated otherwise or the context otherwise requires, references to “Regency Centers Corporation” or the “Parent Company” mean Regency Centers Corporation and its controlled subsidiaries; and references to “Regency Centers, L.P.” or the “Operating Partnership” mean Regency Centers, L.P. and its controlled subsidiaries. The term “the Company”, "Regency Centers" or “Regency” means the Parent Company and the Operating Partnership, collectively.
The Parent Company is a real estate investment trust (“REIT”) and the general partner of the Operating Partnership. The Operating Partnership's capital includes general and limited common Partnership Units (“Units”). As of
December 31, 2016
, the Parent Company owned all of the Preferred Units of the Operating Partnership and approximately
99.9%
of the Units in the Operating Partnership. The remaining limited Units are owned by investors. As the sole general partner of the Operating Partnership, the Parent Company has exclusive control of the Operating Partnership's day-to-day management.
The Company believes combining the annual reports on Form 10-K of the Parent Company and the Operating Partnership into this single report provides the following benefits:
|
•
|
Enhances investors' understanding of the Parent Company and the Operating Partnership by enabling investors to view the business as a whole in the same manner as management views and operates the business;
|
|
•
|
Eliminates duplicative disclosure and provides a more streamlined and readable presentation; and
|
|
•
|
Creates time and cost efficiencies through the preparation of one combined report instead of two separate reports.
|
Management operates the Parent Company and the Operating Partnership as one business. The management of the Parent Company consists of the same individuals as the management of the Operating Partnership. These individuals are officers of the Parent Company and employees of the Operating Partnership.
The Company believes it is important to understand the few differences between the Parent Company and the Operating Partnership in the context of how the Parent Company and the Operating Partnership operate as a consolidated company. The Parent Company is a REIT, whose only material asset is its ownership of partnership interests of the Operating Partnership. As a result, the Parent Company does not conduct business itself, other than acting as the sole general partner of the Operating Partnership, issuing public equity from time to time and guaranteeing certain debt of the Operating Partnership. The Parent Company does not hold any indebtedness, but guarantees all of the unsecured public debt of the Operating Partnership. The Operating Partnership holds all the assets of the Company and retains the ownership interests in the Company's joint ventures. Except for net proceeds from public equity issuances by the Parent Company, which are contributed to the Operating Partnership in exchange for partnership units, the Operating Partnership generates all remaining capital required by the Company's business. These sources include the Operating Partnership's operations, its direct or indirect incurrence of indebtedness, and the issuance of partnership units.
Stockholders' equity, partners' capital, and noncontrolling interests are the main areas of difference between the consolidated financial statements of the Parent Company and those of the Operating Partnership. The Operating Partnership's capital includes general and limited common Partnership Units, and Preferred Units owned by the Parent Company. The limited partners' units in the Operating Partnership owned by third parties are accounted for in partners' capital in the Operating Partnership's financial statements and outside of stockholders' equity in noncontrolling interests in the Parent Company's financial statements. The Preferred Units owned by the Parent Company are eliminated in consolidation in the accompanying consolidated financial statements of the Parent Company and are classified as preferred units of general partner in the accompanying consolidated financial statements of the Operating Partnership.
In order to highlight the differences between the Parent Company and the Operating Partnership, there are sections in this report that separately discuss the Parent Company and the Operating Partnership, including separate financial statements, controls and procedures sections, and separate Exhibit 31 and 32 certifications. In the sections that combine disclosure for the Parent Company and the Operating Partnership, this report refers to actions or holdings as being actions or holdings of the Company.
As general partner with control of the Operating Partnership, the Parent Company consolidates the Operating Partnership for financial reporting purposes, and the Parent Company does not have assets other than its investment in the Operating Partnership. Therefore, while stockholders' equity and partners' capital differ as discussed above, the assets and liabilities of the Parent Company and the Operating Partnership are the same on their respective financial statements.
TABLE OF CONTENTS
|
Item No.
|
Form 10-K
Report Page
|
|
|
PART I
|
||
|
1.
|
||
|
1A.
|
||
|
1B.
|
||
|
2.
|
||
|
3.
|
||
|
4.
|
||
|
PART II
|
||
|
5.
|
||
|
6.
|
||
|
7.
|
||
|
7A.
|
||
|
8.
|
||
|
9.
|
||
|
9A.
|
||
|
9B.
|
||
|
PART III
|
||
|
10.
|
||
|
11.
|
||
|
12.
|
||
|
13.
|
||
|
14.
|
||
|
PART IV
|
||
|
15.
|
||
|
SIGNATURES
|
||
|
16.
|
||
Forward-Looking Statements
In addition to historical information, information in this Form 10-K contains forward-looking statements as defined under federal securities laws. These forward-looking statements include statements about anticipated changes in our revenues, the size of our development and redevelopment program, earnings per share and unit, returns and portfolio value, and expectations about our liquidity. These statements are based on current expectations, estimates and projections about the real estate industry and markets in which the Company operates, and management's beliefs and assumptions. Forward-looking statements are not guarantees of future performance and involve certain known and unknown risks and uncertainties that could cause actual results to differ materially from those expressed or implied by such statements. Known risks and uncertainties are described further in the Item 1A.
Risk Factors
below. The following discussion should be read in conjunction with the accompanying Consolidated Financial Statements and Notes thereto of Regency Centers Corporation and Regency Centers, L.P. appearing elsewhere herein. We do not undertake any obligation to release publicly any revisions to such forward-looking statements to reflect events or uncertainties after the date hereof or to reflect the occurrence of uncertain events.
Pending Merger with Equity One, Inc.
On November 14, 2016, Regency Centers Corporation entered into an Agreement and Plan of Merger (the “Merger Agreement”) with Equity One, Inc. (“Equity One”), pursuant to which, subject to the satisfaction or waiver of certain conditions, Equity One will merge with and into the Regency Centers Corporation, with Regency Centers Corporation being the surviving corporation (the “Merger”). The combined company will retain the Regency name and continue to trade under the ticker symbol “REG” on the New York Stock Exchange (the “NYSE”).
On the terms and subject to the conditions set forth in the Merger Agreement, which has been unanimously approved by the boards of directors of Regency Centers Corporation and Equity One, at the effective time of the Merger (the “Effective Time”), each share of the common stock, par value $0.01 per share, of Equity One issued and outstanding immediately prior to the Effective Time (other than shares of Equity One owned directly by Equity One or the Regency Centers Corporation and in each case not held on behalf of third parties) will be converted into the right to receive 0.45 of a newly issued share of the common stock of Regency Centers Corporation.
The closing of the Merger is subject to certain conditions, including the requisite approvals from the stockholders of each of Regency Centers Corporation and Equity One (which approvals were received at special meetings of the stockholders of each company held on February 24, 2017), the receipt of certain tax opinions by Regency Centers Corporation and Equity One, and other customary closing conditions. The Merger is expected to close on March 1, 2017. However, the Company cannot predict with certainty when, or if, the Merger will be completed because completion of the Merger is subject to conditions beyond the control of the Company.
For more information about the Merger, the Merger Agreement and related agreements, see note 16 of the Notes to the Consolidated Financial Statements in Item 8 herein.
Regency Centers began its operations as a publicly-traded REIT in 1993, and, as of
December 31, 2016
, owns direct or partial interests in 307 shopping centers, the majority of which are grocery-anchored community and neighborhood centers. Our centers are located in the top markets of
25
states and the District of Columbia, and contain 37.8 million square feet ("SF") of gross leasable area ("GLA"). Our pro-rata share of this GLA is 28.7 million square feet. All of our operating, investing, and financing activities are performed through the Operating Partnership, our wholly-owned subsidiaries, and through our co-investment partnerships.
Our mission is to be the preeminent national grocery-anchored shopping center owner and developer through:
|
•
|
First-rate performance of our exceptionally merchandised and located national portfolio;
|
|
•
|
Value-enhancing services from an accomplished team of professionals in the business; and
|
|
•
|
Creation of superior growth in shareholder value.
|
Our strategy is:
|
•
|
Sustain average annual 3% same property NOI growth from a high-quality, growing portfolio of thriving community and neighborhood shopping centers;
|
|
•
|
Develop new, and redevelop existing, high quality shopping centers at attractive returns on investment from a disciplined development program;
|
1
|
•
|
Maintain our balance sheet to provide financial flexibility, to cost effectively fund uses of capital, and to weather economic downturns; and
|
|
•
|
Engage a talented and dedicated team with high standards of integrity that operates efficiently and is recognized as a leader in the real estate industry.
|
We expect to execute our strategy as follows:
Sustain average annual 3% same property NOI growth from a high-quality, growing portfolio of thriving community and neighborhood shopping centers:
|
•
|
Own and develop centers that are located at key corners in our nation’s most attractive metro areas;
|
|
•
|
Target trade areas characterized by their strong demographics and consumer buying power, and draw shoppers to our centers with highly productive anchor tenants;
|
|
•
|
Attract the best national, regional and local retailers and restaurants;
|
|
•
|
Pursue initiatives that reinforce the underlying quality of our portfolio and maximize long-term growth such as “Fresh Look®,” an operating philosophy that guides our merchandising and place-making programs;
|
|
•
|
Fortify future NOI growth by rigorously reviewing our portfolio to identify and sell operating properties that no longer meet our investment standards; and
|
|
•
|
Opportunistically upgrade our portfolio by acquiring high quality shopping centers with meaningful upside in NOI growth funded from the sale of operating properties that no longer meet our investment standards.
|
Develop new, and redevelop existing, high quality shopping centers at attractive returns on investment from a disciplined development program:
|
•
|
Maintain and grow our existing presence in our key markets with in-house expertise and anchor relationships;
|
|
•
|
Develop shopping centers located in desirable infill markets for long-term ownership;
|
|
•
|
Anchor developments with dominant, national and regional chains and high volume specialty grocers;
|
|
•
|
Create additional value through redevelopment of existing centers; and
|
|
•
|
Fund our development program primarily from the sale of operating properties that no longer meet our investment criteria.
|
Cost-effectively enhance our balance sheet to reduce our cost of capital, provide financial flexibility and weather economic downturns:
|
•
|
Prudently access our multiple sources of debt and equity through the capital markets and co-investment partnerships;
|
|
•
|
Fund development and acquisitions from free cash flows, selling operating properties that no longer meet our investment standards, and accessing favorably priced equity;
|
|
•
|
Further reduce leverage through organic growth in earnings and, when appropriate, accessing the capital markets;
|
|
•
|
Rigorously manage our line of credit and maintain substantial uncommitted capacity;
|
|
•
|
Maintain a large pool of unencumbered assets and excellent relationships with mortgage lenders; and
|
|
•
|
Maintain a well laddered debt maturity profile.
|
Engage a talented and dedicated team that operates efficiently and is recognized as a leader in the real estate industry with respect to development and operating capabilities, customer relationships, operating and technology systems, and environmental sustainability:
|
•
|
Reflect our values by executing and successfully meeting our commitments to our people and our communities, a tradition we have embraced for over 50 years;
|
|
•
|
Foster a values-based culture, offering a comprehensive benefits package and an engaging workplace environment;
|
|
•
|
Uphold unwavering standards of honesty and integrity and build our reputation by maintaining the highest ethical principles;
|
|
•
|
Offer a challenging, safe and dynamic work environment and support the professional development and personal life of each employee;
|
|
•
|
Encourage employees to achieve their personal health goals through a robust wellness program focused on education, awareness and prevention; and
|
|
•
|
Contribute to the betterment of our communities by supporting philanthropic programs with employee contribution matching and paid volunteer time.
|
Environmental Sustainability
We believe being an industry leader in sustainability is in the best interest of our tenants, investors, employees, and the communities in which we operate. We are committed to reducing our environmental impact, including energy and water use,
2
greenhouse gas emissions, and waste. We believe this commitment is not only the right thing to do, but also assists the Company in achieving key strategic objectives in operations and development. We are committed to transparency with regard to our sustainability performance, risks and opportunities, and will continue to increase disclosure using industry accepted reporting frameworks. We currently have a Green Star rating from the Global Real Estate Sustainability Benchmark, or GRESB, for the second consecutive year. More information about our sustainability strategy, goals, performance, and formal disclosures are available on our website at www.regencycenters.com.
Competition
We are amongst the largest owners of shopping centers in the nation based on revenues, number of properties, GLA, and market capitalization. There are numerous companies and individuals engaged in the ownership, development, acquisition, and operation of shopping centers that compete with us in our targeted markets, including grocery store chains that also anchor some of our shopping centers. This results in competition for attracting anchor tenants, as well as the acquisition of existing shopping centers and new development sites. We believe that our competitive advantages are driven by:
|
•
|
our locations within our market areas;
|
|
•
|
the design and high quality of our shopping centers;
|
|
•
|
the strong demographics surrounding our shopping centers;
|
|
•
|
our relationships with our anchor tenants and our side-shop and out-parcel retailers;
|
|
•
|
our practice of maintaining and renovating our shopping centers; and
|
|
•
|
our ability to source and develop new shopping centers.
|
Employees
Our corporate headquarters are located at One Independent Drive, Suite 114, Jacksonville, Florida. We presently maintain 18 market offices nationwide, including our corporate headquarters, where we conduct management, leasing, construction, and investment activities. We have 371 employees and we believe that our relations with our employees are good.
Compliance with Governmental Regulations
Under various federal, state and local laws, ordinances and regulations, we may be liable for the cost to remove or remediate certain hazardous or toxic substances at our shopping centers. These laws often impose liability without regard to whether the owner knew of, or was responsible for, the presence of the hazardous or toxic substances. The cost of required remediation and the owner's liability for remediation could exceed the value of the property and/or the aggregate assets of the owner. The presence of such substances, or the failure to properly remediate such substances, may adversely affect our ability to sell or lease the property or borrow using the property as collateral. Although we have a number of properties that could require or are currently undergoing varying levels of environmental remediation, known environmental remediation is not currently expected to have a material financial impact on us due to insurance programs designed to mitigate the cost of remediation, various state-regulated programs that shift the responsibility and cost to the state, and existing accrued liabilities for remediation.
3
Executive Officers
Our executive officers are appointed each year by our Board of Directors. Each of our executive officers has been employed by us for more than five years.
|
Name
|
Age
|
Title
|
Executive Officer in Position Shown Since
|
|
Martin E. Stein, Jr.
|
64
|
Chairman and Chief Executive Officer
|
1993
|
|
Lisa Palmer
|
49
|
President and Chief Financial Officer
|
2016
(1)
|
|
Dan M. Chandler, III
|
49
|
Executive Vice President of Development
|
2016
(2)
|
|
James D. Thompson
|
61
|
Executive Vice President of Operations
|
2016
(3)
|
(1)
Ms. Palmer assumed the responsibilities of President, effective January 1, 2016 in addition to her responsibilities as Chief Financial Officer, which she has held since January 2013. Prior to that, Ms. Palmer served as Senior Vice President of Capital Markets since 2003 and has been with the Company since 1996.
(2)
Mr. Chandler assumed the role of Executive Vice President of Development on January 1, 2016 and previously served as our Managing Director - West since 2009. Prior to that, Mr. Chandler served as a Managing Director from 2006 to 2007, Senior President of Investments from 2002 to 2006, and Vice President of Investments from 1997 to 2002.
(3)
Mr. Thompson assumed the role of Executive Vice President of Operations on January 1, 2016 and previously served as our Managing Director - East since our initial public offering in 1993. Prior to that time, Mr. Thompson served as Executive Vice President of our predecessor real estate division beginning in 1981.
Company Website Access and SEC Filings
Our website may be accessed at
www.regencycenters.com
. All of our filings with the Securities and Exchange Commission can be accessed free of charge through our website promptly after filing; however, in the event that the website is inaccessible, we will provide paper copies of our most recent annual report on Form 10-K, the most recent quarterly report on Form 10-Q, current reports filed or furnished on Form 8-K, and all related amendments, excluding exhibits, free of charge upon request. These filings are also accessible on the SEC's website at
www.sec.gov
.
General Information
Our registrar and stock transfer agent is Broadridge Corporate Issuer Solutions, Inc. (“Broadridge”), Philadelphia, PA. We offer a dividend reinvestment plan (“DRIP”) that enables our stockholders to reinvest dividends automatically, as well as to make voluntary cash payments toward the purchase of additional shares. For more information, contact Broadridge toll free at (855) 449-0975 or our Shareholder Relations Department at (904) 598-7000.
Our independent registered public accounting firm is KPMG LLP, Jacksonville, Florida. Our legal counsel is Foley & Lardner LLP, Jacksonville, Florida.
Annual Meeting
Our annual meeting will be held at The River Club, Florida Room 2, One Independent Dr., Jacksonville, Florida, at 10:30 a.m. on Thursday, April 27,
2017
.
4
Defined Terms
We use certain non-GAAP performance measures, in addition to the required GAAP presentations, as we believe these measures improve the understanding of the Company's operational results. We manage our entire real estate portfolio without regard to ownership structure, although certain decisions impacting properties owned through partnerships require partner approval. Therefore, we believe presenting our pro-rata share of certain operating metrics regardless of ownership structure, along with other non-GAAP measures, makes comparisons of other REITs' operating results to the Company's more meaningful. We continually evaluate the usefulness, relevance, limitations, and calculation of our reported non-GAAP performance measures to determine how best to provide relevant information to the public, and thus such reported measures could change.
The following terms, as defined, are commonly used by management and the investing public to understand and evaluate our operational results:
|
•
|
Same Property
information is provided for operating properties that were owned and operated for the entirety of both calendar year periods being compared and excludes Non-Same Properties and Properties in Development.
|
|
•
|
A Non-Same Property
is a property acquired, sold, or a development completion during either calendar year period being compared. Corporate activities, including the captive insurance company, are part of Non-Same Property.
|
|
•
|
Property In Development
includes land or properties in various stages of development and redevelopment including active pre-development activities.
|
|
•
|
Development Completion
is a project in development that is deemed complete upon the earliest of: (i) 90% of total estimated net development costs have been incurred and percent leased equals or exceeds 95%, or (ii) the project features at least two years of anchor operations, or (iii) three years have passed since the start of construction. Once deemed complete, the property is termed an Operating Property.
|
|
•
|
Pro-Rata
information includes 100% of our consolidated properties plus our ownership interest in our unconsolidated real estate investment partnerships.
|
The pro-rata information is prepared on a basis consistent with the comparable consolidated amounts and is intended to more accurately reflect our proportionate economic interest in the operating results of properties in our portfolio. We do not control the unconsolidated investment partnerships, and the pro-rata presentations of the assets and liabilities, and revenues and expenses do not represent our legal claim to such items. The partners are entitled to profit or loss allocations and distributions of cash flows according to the operating agreements, which provide for such allocations according to their invested capital. Our share of invested capital establishes the ownership interests we use to prepare our pro-rata share.
The presentation of pro-rata information has limitations which include, but are not limited to, the following:
|
•
|
The amounts shown on the individual line items were derived by applying our overall economic ownership interest percentage determined when applying the equity method of accounting or allocating noncontrolling interests, and do not necessarily represent our legal claim to the assets and liabilities, or the revenues and expenses; and
|
|
•
|
Other companies in our industry may calculate their pro-rata interest differently, limiting the usefulness as a comparative measure.
|
Because of these limitations, the pro-rata financial information should not be considered independently or as a substitute for our financial statements as reported under GAAP. We compensate for these limitations by relying primarily on our GAAP financial statements, using the pro-rata information as a supplement.
|
•
|
Core EBITDA
is defined as earnings before interest, taxes, depreciation and amortization, real estate gains and losses, and development and acquisition pursuit costs.
|
|
•
|
Fixed Charge Coverage Ratio
is defined as Core EBITDA divided by the sum of the gross interest and scheduled mortgage principal paid to our lenders plus dividends paid to our preferred stockholders.
|
|
•
|
Net Operating Income ("NOI")
is the sum of minimum rent, percentage rent and recoveries from tenants and other income, less operating and maintenance, real estate taxes, and provision for doubtful accounts. NOI excludes straight-
|
5
line rental income and expense, above and below market rent amortization and other fees. The Company also provides disclosure of NOI excluding termination fees, which excludes both termination fee income and expenses.
|
•
|
NAREIT Funds from Operations ("NAREIT FFO")
is a commonly used measure of REIT performance, which the National Association of Real Estate Investment Trusts ("NAREIT") defines as net income, computed in accordance with GAAP, excluding gains and losses from sales of depreciable property, net of tax, excluding operating real estate impairments, plus depreciation and amortization, and after adjustments for unconsolidated partnerships and joint ventures. We compute NAREIT FFO for all periods presented in accordance with NAREIT's definition. Many companies use different depreciable lives and methods, and real estate values historically fluctuate with market conditions. Since NAREIT FFO excludes depreciation and amortization and gains and losses from depreciable property dispositions, and impairments, it provides a performance measure that, when compared year over year, reflects the impact on operations from trends in occupancy rates, rental rates, operating costs, acquisition and development activities, and financing costs. This provides a perspective of our financial performance not immediately apparent from net income determined in accordance with GAAP. Thus, NAREIT FFO is a supplemental non-GAAP financial measure of our operating performance, which does not represent cash generated from operating activities in accordance with GAAP; and, therefore, should not be considered a substitute measure of cash flows from operations.
|
|
•
|
Core FFO
is an additional performance measure used by Regency as the computation of NAREIT FFO includes certain non-cash and non-comparable items that affect the Company's period-over-period performance. Core FFO excludes from NAREIT FFO, but is not limited to: (a) transaction related gains, income or expense; (b) impairments on land; (c) gains or losses from the early extinguishment of debt; and (d) other non-core amounts as they occur. The Company provides a reconciliation of NAREIT FFO to Core FFO.
|
6
Risks Relating to the Merger
The Merger may not be completed on the terms or timeline currently contemplated, or at all.
Although Regency Centers' stockholders and Equity One's stockholders approved the Merger in separate stockholder meetings on February 24, 2017, the completion of the merger is subject to certain conditions, including: (1) approval for listing on the NYSE of the common stock of Regency Centers to be issued in connection with the merger; (2) the registration statement for our shares being issued pursuant to the merger not being the subject of any stop order or proceeding seeking a stop order; (3) no injunction or law prohibiting the merger; (4) accuracy of each party’s representations, subject in most cases to materiality or material adverse effect qualifications; (5) material compliance with each party’s covenants; and (6) receipt by each of Equity One and Regency Centers of an opinion to the effect that the merger will qualify as a “reorganization” within the meaning of Section 368(a) of the Code and of an opinion that each of Equity One and Regency Centers qualify as a REIT under the Internal Revenue Code of 1986, as amended (the "Code"). Neither Equity One nor Regency Centers can provide assurances that the merger will be consummated on the terms or timeline currently contemplated, or at all.
The exchange ratio is fixed and will not be adjusted in the event of any change in either our or Equity One’s stock prices.
At the effective time of the Merger, each share of Equity One common stock (other than any shares owned directly by Regency Centers or Equity One and in each case not held on behalf of third parties) outstanding immediately prior to the effective time of the merger will be converted into the right to receive 0.45 of a newly issued share of our common stock, with cash paid in lieu of fractional shares. The exchange ratio is fixed in the merger agreement and will not be adjusted for changes in the market price of either our common stock or Equity One common stock. Changes in the price of our common stock prior to the merger will affect the market value of the merger consideration that Equity One stockholders will receive on the closing of the merger. Stock price changes may result from a variety of factors (many of which are beyond the control of Regency Centers and Equity One), including the following factors:
|
•
|
changes in the respective businesses, operations, assets, liabilities and prospects of either company;
|
changes in market assessments of the business, operations, financial position and prospects of either company;
|
•
|
market assessments of the likelihood that the merger will be completed;
|
|
•
|
interest rates, general market and economic conditions and other factors generally affecting the price of our common stock and Equity One common stock;
|
|
•
|
federal, state and local legislation, governmental regulation and legal developments in the businesses in which we and Equity One operate; and
|
|
•
|
other factors beyond the control of Regency Centers or Equity One, including those described under this “Risk Factors” heading.
|
Our stockholders may be diluted by the merger.
The merger may dilute the ownership position of our stockholders. Upon completion of the merger, our legacy stockholders will own approximately 62% of the issued and outstanding shares of our common stock, and legacy Equity One stockholders will own approximately 38% of the issued and outstanding shares of our common stock. Consequently, our stockholders may have less influence over our management and policies after the effective time of the merger than they currently exercise over our management and policies.
Failure to complete the merger could adversely affect our stock price and our future business and financial results
.
If the merger is not completed, our ongoing businesses may be adversely affected and we will be subject to numerous risks, including the following:
|
•
|
upon termination of the merger agreement under specified circumstances, Equity One may be required to pay Regency Centers a termination fee of $150 million and we may be required to pay Equity One a termination fee of $240 million;
|
|
•
|
we are paying substantial costs relating to the merger, such as legal, accounting, financial advisor, filing, printing and mailing fees and integration preparation costs that have already been incurred or will continue to be incurred until the closing of the merger;
|
|
•
|
our management focusing on the merger instead of on pursuing other opportunities that could be beneficial to Regency Centers without realizing any of the benefits of having the merger completed; and
|
|
•
|
reputational harm due to the adverse perception of any failure to successfully complete the merger.
|
7
If the merger is not completed, we cannot assure our stockholders that these risks will not materialize or will not materially affect the business, financial results and our stock prices.
The merger agreement contains provisions that could discourage a potential competing acquirer of Regency Centers or could result in any competing proposal being at a lower price than it might otherwise be.
The merger agreement contains provisions that, subject to limited exceptions, restrict the ability of each of Regency Centers and Equity One to initiate, solicit, propose, knowingly encourage or facilitate competing third-party proposals to effect, among other things, a merger, reorganization, share exchange, consolidation or the sale of 15% or more of the stock or consolidated net revenues, net income or total assets of Regency Centers or Equity One. In addition, either Regency Centers or Equity One generally has an opportunity to offer to modify the terms of the merger agreement in response to certain competing superior proposals that may be made to the other party before the boards of directors of Regency Centers or Equity One, as the case may be, may withdraw or modify its recommendation in response to such superior proposal or terminate the merger agreement to enter into such superior proposal. In some circumstances, one of the parties will be required to pay a substantial termination fee to the other party.
These provisions could discourage a potential competing acquirer that might have an interest in acquiring all or a significant part of Regency Centers from considering or proposing such an acquisition, even if it were prepared to pay consideration with a higher per share cash or market value than that market value proposed to be received or realized in the merger, or might result in a potential competing acquirer proposing to pay a lower price than it might otherwise have proposed to pay because of the added expense of the termination fee that may become payable in certain circumstances under the merger agreement.
The pendency of the merger could adversely affect the business and operations of Regency Centers and Equity One.
In connection with the pending merger, some of our and Equity One’s tenants or vendors may delay or defer decisions, which could adversely affect the revenues, earnings, funds from operations, cash flows and expenses of Regency Centers and Equity One, regardless of whether the merger is completed. Similarly, current and prospective employees of Regency Centers and Equity One may experience uncertainty about their future roles with Regency Centers following the merger, which may materially adversely affect our and Equity One’s ability to attract and retain key personnel during the pendency of the merger. In addition, due to interim operating covenants in the merger agreement, we and Equity One may be unable (without the other party’s prior written consent), during the pendency of the merger, to pursue strategic transactions, undertake significant capital projects, undertake certain significant financing transactions and otherwise pursue other actions, even if such actions would prove beneficial.
Risks Relating to Regency Centers after Completion of the Merger
We expect to incur substantial expenses related to the merger.
We expect to incur substantial expenses in completing the merger and integrating the business, operations, networks, systems, technologies, policies and procedures of Regency Centers and Equity One. There are a large number of processes that must be integrated in the merger, including leasing, billing, management information, purchasing, accounting and finance, sales, payroll and benefits, fixed asset, lease administration and regulatory compliance. While we and Equity One have assumed that a certain level of transaction and integration expenses would be incurred, there are a number of factors beyond our control that could affect the total amount or the timing of integration expenses.
Following the merger, we may be unable to integrate the business of Equity One successfully or realize the anticipated synergies and related benefits of the merger or do so within the anticipated time frame.
The merger involves the combination of two companies which currently operate as independent public companies. We will be required to devote significant management attention and resources to integrating the business practices and operations of Equity One. Potential difficulties we may encounter in the integration process include the following:
|
•
|
the inability to successfully combine the businesses of Regency Centers and Equity One in a manner that permits Regency Centers to achieve the cost savings anticipated to result from the merger, which would result in some anticipated benefits of the merger not being realized in the time frame currently anticipated, or at all;
|
|
•
|
the inability to successfully realize the anticipated value from some of Equity One’s assets, particularly from the redevelopment projects;
|
|
•
|
lost sales and tenants as a result of certain tenants of either of Regency Centers or Equity One deciding not to continue to do business with Regency Centers;
|
|
•
|
the complexities associated with integrating personnel from the two companies;
|
|
•
|
the additional complexities of combining two companies with different histories, cultures, markets, strategies and customer bases;
|
8
|
•
|
the failure by Regency Centers to retain key employees of either of the two companies;
|
|
•
|
potential unknown liabilities and unforeseen increased expenses, delays or regulatory conditions associated with the merger; and
|
|
•
|
performance shortfalls at one or both of the two companies as a result of the diversion of management’s attention caused by completing the merger and integrating the companies’ operations.
|
For all these reasons, you should be aware that it is possible that the integration process could result in the distraction of our management, the disruption of our ongoing business or inconsistencies in our services, standards, controls, procedures and policies, any of which could adversely affect the ability of Regency Centers to maintain relationships with tenants, vendors and employees or to achieve the anticipated benefits of the merger, or could otherwise adversely affect our business and financial results.
Following the merger, we may be unable to retain key employees.
Our success after the merger will depend in part upon our ability to retain key Regency and Equity One employees. Key employees may depart either before or after the merger because of issues relating to the uncertainty and difficulty of integration or a desire not to remain with Regency Centers following the merger. Accordingly, no assurance can be given that we will be able to retain key employees to the same extent as in the past.
Our future operating results will suffer if we do not effectively manage our operations following the merger.
Following the merger, we may continue to expand our operations through additional acquisitions, development opportunities and other strategic transactions, some of which involve complex challenges. Our future success will depend, in part, upon our ability to manage our expansion opportunities, which may pose substantial challenges for Regency Centers to integrate new operations into our existing business in an efficient and timely manner, and to successfully monitor our operations, costs, regulatory compliance and service quality, and to maintain other necessary internal controls. We cannot assure you that our expansion or acquisition opportunities will be successful, or that we will realize our expected operating efficiencies, cost savings, revenue enhancements, synergies or other benefits.
The trading price of shares of our common stock following the merger may be affected by factors different from those affecting the price of shares of our common stock before the merger.
If the merger is completed, legacy Regency stockholders will become holders of approximately 62% of the outstanding shares of our common stock and legacy Equity One stockholders will become holders of approximately 38% of the outstanding shares of Equity One common stock. The results of our operations and the trading price of our common stock after the merger may be affected by factors different from those currently affecting our results of operations and the trading prices of our common stock. For example, some institutional investors which currently own both Equity One and our common stock may elect to decrease their ownership in the merged company by selling our common stock. Accordingly, the historical trading prices and financial results of Regency Centers and Equity One may not be indicative of these matters for Regency Centers after the merger.
Following the merger, we will have a substantial amount of indebtedness and may need to incur more in the future.
We have substantial indebtedness and, in connection with the merger, will incur additional indebtedness. The incurrence of new indebtedness could have adverse consequences on our business following the merger, such as:
|
•
|
requiring Regency Centers to use a substantial portion of our cash flow from operations to service our indebtedness, which would reduce the available cash flow to fund working capital, capital expenditures, development projects, and other general corporate purposes and reduce cash for distributions;
|
|
•
|
limiting our ability to obtain additional financing to fund our working capital needs, acquisitions, capital expenditures, or other debt service requirements or for other purposes;
|
|
•
|
increasing our costs of incurring additional debt;
|
|
•
|
increasing our exposure to floating interest rates;
|
|
•
|
limiting our ability to compete with other companies that are not as highly leveraged, as we may be less capable of responding to adverse economic and industry conditions;
|
|
•
|
restricting Regency Centers from making strategic acquisitions, developing properties, or exploiting business opportunities;
|
|
•
|
restricting the way in which we conduct our business because of financial and operating covenants in the agreements governing our existing and future indebtedness;
|
|
•
|
exposing Regency Centers to potential events of default (if not cured or waived) under covenants contained in our debt instruments that could have a material adverse effect on our business, financial condition, and operating results;
|
9
|
•
|
increasing our vulnerability to a downturn in general economic conditions; and
|
|
•
|
limiting our ability to react to changing market conditions in its industry.
|
The impact of any of these potential adverse consequences could have a material adverse effect on our results of operations, financial condition, and liquidity.
At the effective time of the merger, the Gazit Parties will become significant stockholders of Regency Centers and may have interests that are different from, or are in addition to, Regency Centers or our other stockholders in the future.
At the effective time of the merger, Mr. Chaim Katzman and Gazit-Globe, Ltd. and certain of its affiliated entities ("the Gazit Parties") will own approximately 13% of outstanding shares of our common stock, based on their ownership of approximately 34% of the Equity One common stock as of November 14, 2016. This concentration of ownership in one group of stockholders could potentially be disadvantageous to the interests of our other stockholders. For example, if the Gazit Parties were to sell or otherwise transfer all or a large percentage of their holdings, our stock price could decline, and we could find it more expensive to raise capital, if needed, through the sale of additional equity securities.
Under the governance agreement, we are required to nominate Mr. Katzman to our board of directors and solicit votes for his election for so long as the Gazit Parties beneficially own 7% or more of our common stock outstanding as of immediately after the effective time of the merger. The governance agreement also provides that in the event of Mr. Katzman’s death, disability, resignation or removal, or failure of Mr. Katzman to be re-elected, the Gazit Parties will have the right to designate another person to be appointed to our board of directors, which person must be reasonably acceptable to our board of directors.
The Gazit Parties have interests that may be different from, or in addition to, the interests of our other stockholders in material respects. For example, the Gazit Parties may have an interest in directly or indirectly pursuing acquisitions, divestitures, financings or other transactions that, in their judgment, could enhance their other equity investments, even though such transactions might involve risks to Regency Centers. The Gazit Parties may, from time to time in the future, acquire interests in businesses that directly or indirectly compete with our business. They may also pursue acquisition opportunities that may be complementary to our business, and, as a result, those acquisition opportunities may not be available to Regency Centers. For more information, see “Agreements with the Gazit Parties-Governance Agreement.”
Counterparties to certain agreements with Regency Centers or Equity One may exercise contractual rights under such agreements in connection with the merger.
We and Equity One are each party to certain agreements that give the counterparty certain rights following a “change in control,” including in some cases the right to terminate such agreements. Under some such agreements, for example certain debt obligations, the merger may constitute a change in control and therefore the counterparty may exercise certain rights under the agreement upon the closing of the merger. Any such counterparty may request modifications of its respective agreements as a condition to granting a waiver or consent under its agreement. There is no assurance that such counterparties will not exercise their rights under the agreements, including termination rights where available, that the exercise of any such rights will not result in a material adverse effect or that any modifications of such agreements will not result in a material adverse effect.
Risk Factors Related to Our Industry and Real Estate Investments
A shift in retail shopping from brick and mortar stores to e-commerce may have an adverse impact on our revenues and cash flow.
Many retailers operating brick and mortar stores have made e-commerce sales a vital piece of their business. Although many of the retailers in our shopping centers either provide services or sell groceries, such that their customer base does not have a tendency toward online shopping, the shift to e-commerce sales may adversely impact our retail tenants' sales causing those retailers to adjust the size or number of retail locations in the future. This shift could adversely impact our occupancy and rental rates, which would impact our revenues and cash flows.
Downturns in the retail industry likely will have a direct adverse impact on our revenues and cash flow.
Our properties consist primarily of grocery-anchored shopping centers. Our performance therefore is generally linked to economic conditions in the market for retail space. The market for retail space could be adversely affected by any of the following:
|
•
|
weakness in the national, regional and local economies, which could adversely impact consumer spending and retail sales and in turn tenant demand for space and lead to increased store closings;
|
|
•
|
adverse financial conditions for grocery and retail anchors;
|
|
•
|
continued consolidation in the retail sector;
|
10
|
•
|
excess amount of retail space in our markets;
|
|
•
|
reduction in the demand by tenants to occupy our shopping centers as a result of reduced consumer demand for certain retail categories;
|
|
•
|
the growth of super-centers and warehouse club retailers, such as those operated by Wal-Mart and Costco, and their adverse effect on traditional grocery chains;
|
|
•
|
the impact of changing energy costs on consumers and its consequential effect on retail spending; and
|
|
•
|
consequences of any armed conflict involving, or terrorist attack against, the United States.
|
To the extent that any of these conditions occur, they are likely to impact market rents for retail space, occupancy in the operating portfolio, our ability to sell, acquire or develop properties, and our cash available for distributions to stock and unit holders.
Our revenues and cash flow could be adversely affected if economic or market conditions deteriorate where our properties are geographically concentrated, which may impede our ability to generate sufficient income to pay expenses and maintain our properties.
The economic conditions in markets in which our properties are concentrated greatly influence our financial performance. During the year ended
December 31, 2016
, our properties in
California
,
Florida
, and
Texas
accounted for
31.0%
,
12.1%
, and
10.3%
, respectively, of our net operating income from Consolidated Properties plus our pro-rata share from Unconsolidated Properties ("pro-rata basis"). Our revenues and cash available to pay expenses, maintain our properties, and for distributions to stock and unit holders could be adversely affected by this geographic concentration if market conditions, such as supply of or demand for retail space, deteriorate in
California
,
Florida
, or
Texas
relative to other geographic areas.
Our success depends on the success and continued presence of our “anchor” tenants.
Anchor tenants (those occupying 10,000 square feet or more) occupy large amounts of square footage, pay a significant portion of the total rents at a property and contribute to the success of other tenants by drawing significant numbers of customers to a property.
We derive significant revenues from anchor tenants such as
Kroger
,
Publix
, and
Albertsons/Safeway
, who accounted for
4.7%
,
3.1%
, and
2.7%
, respectively, of our total annualized base rent on a pro-rata basis, for the year ended
December 31, 2016
. Our net income could be adversely affected by the loss of revenues in the event a significant tenant:
|
•
|
becomes bankrupt or insolvent;
|
|
•
|
experiences a downturn in its business;
|
|
•
|
materially defaults on its leases;
|
|
•
|
does not renew its leases as they expire; or
|
|
•
|
renews at lower rental rates.
|
Some anchors have the right to vacate and prevent re-tenanting by paying rent for the balance of the lease term. Vacated anchor space, including space owned by the anchor, can reduce rental revenues generated by the shopping center because of the loss of the departed anchor tenant's customer drawing power. If a significant tenant vacates a property, co-tenancy clauses in select centers may allow other tenants to modify or terminate their rent or lease obligations. Co-tenancy clauses have several variants: they may allow a tenant to postpone a store opening if certain other tenants fail to open their stores; they may allow a tenant to close its store prior to lease expiration if another tenant closes its store prior to lease expiration; or more commonly, they may allow a tenant to pay reduced levels of rent until a certain number of tenants open their stores within the same shopping center.
11
A significant percentage of our revenues are derived from smaller shop tenants and our net income could be adversely impacted if our smaller shop tenants are not successful.
A significant percentage of our revenues are derived from smaller shop tenants (those occupying less than 10,000 square feet). Smaller shop tenants may be more vulnerable to negative economic conditions as they have more limited resources than larger tenants. Such tenants continue to face increasing competition from non-store retailers and growing e-commerce. In addition, some of these retailers may seek to reduce their store sizes as they increasingly rely on alternative distribution channels, including e-commerce, and adjust their square footage needs accordingly. The types of smaller shop tenants vary from retail shops to service providers. If we are unable to attract the right type or mix of smaller shop tenants into our centers, our net income could be adversely impacted.
At
December 31, 2016
, shop space represents approximately
38%
of our GLA and is leased at average base rents of
$31
PSF. A one-percent decline in our shop space occupancy could result in a reduction to minimum rent of approximately
$8.6 million
.
We may be unable to collect balances due from tenants in bankruptcy.
Although minimum rent is supported by long-term lease contracts, tenants who file bankruptcy have the legal right to reject any or all of their leases and close related stores. In the event that a tenant with a significant number of leases in our shopping centers files bankruptcy and rejects its leases, we could experience a significant reduction in our revenues and may not be able to collect all pre-petition amounts owed by that party.
Our real estate assets may be subject to impairment charges.
Our long-lived assets, primarily real estate held for investment, are carried at cost unless circumstances indicate that the carrying value of the assets may not be recoverable. We evaluate whether there are any indicators, including property operating performance and general market conditions, such that the value of the real estate properties (including any related amortizable intangible assets or liabilities) may not be recoverable. Through the evaluation, we compare the current carrying value of the asset to the estimated undiscounted cash flows that are directly associated with the use and ultimate disposition of the asset. Our estimated cash flows are based on several key assumptions, including rental rates, costs of tenant improvements, leasing commissions, anticipated holding periods, and assumptions regarding the residual value upon disposition, including the exit capitalization rate. These key assumptions are subjective in nature and could differ materially from actual results. Changes in our disposition strategy or changes in the marketplace may alter the holding period of an asset or asset group, which may result in an impairment loss and such loss could be material to the Company's financial condition or operating performance. To the extent that the carrying value of the asset exceeds the estimated undiscounted cash flows, an impairment loss is recognized equal to the excess of carrying value over fair value.
The fair value of real estate assets is subjective and is determined through comparable sales information and other market data if available, or through use of an income approach such as the direct capitalization method or the traditional discounted cash flow approach. Such cash flow projections take into account expected future operating income, trends and prospects, as well as the effects of demand, competition and other relevant criteria, and therefore are subject to management judgment. Changes in those factors could impact the determination of fair value. In estimating the fair value of undeveloped land, we generally use market data and comparable sales information.
These subjective assessments have a direct impact on our net income because recording an impairment charge results in an immediate negative adjustment to net income. There can be no assurance that we will not take additional charges in the future related to the impairment of our assets. Any future impairment could have a material adverse effect on our net income in the period in which the charge is taken.
Adverse global market and economic conditions could cause us to recognize impairment charges or otherwise harm our performance.
We are unable to predict the timing, severity, and length of adverse market and economic conditions. Adverse market and economic conditions may impede our ability to generate sufficient operating cash flow to pay expenses, maintain properties, pay distributions to our stock and unit holders, and refinance debt. During adverse periods, there may be significant uncertainty in the valuation of our properties and investments that could result in a substantial decrease in their value. No assurance can be given that we would be able to recover the current carrying amount of all of our properties and investments in the future. Our failure to do so would require us to recognize impairment charges for the period in which we reached that conclusion, which could materially and adversely affect us and the market price of our common stock.
12
Unsuccessful development activities or a slowdown in development activities could have a direct impact on our revenues, revenue growth, and/or net income.
We actively pursue development opportunities. Development activities require various government and other approvals for entitlements and any delay in such approvals may significantly delay the development process. We may not recover our investment in development projects for which approvals are not received. We incur other risks associated with development activities, including:
|
•
|
the risk that we may be unable to lease developments to full occupancy on a timely basis;
|
|
•
|
the risk that occupancy rates and rents of a completed project will not be sufficient to make the project profitable;
|
|
•
|
the risk that development costs of a project may exceed original estimates, possibly making the project unprofitable;
|
|
•
|
the risk that delays in the development and construction process could increase costs;
|
|
•
|
the risk that we may abandon development opportunities and lose our investment in such opportunities;
|
|
•
|
the risk that the size of our development pipeline will strain our capacity to complete the developments within the targeted timelines and at the expected returns on invested capital;
|
|
•
|
changes in the level of future development and redevelopment activity could have an adverse impact on operating results by reducing the amount of capitalizable internal costs for development projects; and
|
|
•
|
the lack of cash flow during the construction period.
|
If we expand into new markets, we may not be successful, which could adversely affect our financial condition, results of operations and cash flows.
If opportunities arise, we may acquire properties in new markets. Each of the risks applicable to our ability to acquire and integrate successfully and operate properties in our current markets is also applicable in new markets. In addition, we may not possess the same level of familiarity with the dynamics and market conditions of the new markets we may enter, which could adversely affect the results of our expansion into those markets, and we may be unable to achieve our desired return on our investments in new markets. If we are unsuccessful in expanding into new markets, it could adversely affect our financial condition, results of operations and cash flows.
Our acquisition activities may not produce the returns that we expect.
Our investment strategy includes investing in high-quality shopping centers that are leased to market-dominant grocers, category-leading anchors, specialty retailers, or restaurants located in areas with high barriers to entry and above average household incomes and population densities. The acquisition of properties and/or companies entails risks that include, but are not limited to, the following, any of which could adversely affect our results of operations and our ability to meet our obligations:
|
•
|
properties we acquire may fail to achieve the occupancy or rental rates we project, within the time frames we estimate, which may result in the properties' failure to achieve the returns we projected;
|
|
•
|
our pre-acquisition evaluation of the physical condition of each new investment may not detect certain defects or identify necessary repairs until after the property is acquired, which could significantly increase our total acquisition costs or decrease cash flow from the property;
|
|
•
|
our investigation of a company, property or building prior to our acquisition, and any representations we may receive from such seller, may fail to reveal various liabilities, which could reduce the cash flow from the acquisition or increase our acquisition costs;
|
|
•
|
our estimate of the costs to improve, reposition or redevelop a property may prove to be too low, or the time we estimate to complete the improvement, repositioning or redevelopment may be too short, either of which could result in the property failing to achieve the returns we have projected, either temporarily or for a longer time;
|
|
•
|
we may not recover our costs from an unsuccessful acquisition;
|
|
•
|
our acquisition activities may distract our management and generate significant costs; and
|
|
•
|
we may not be able to integrate an acquisition into our existing operations successfully.
|
We may experience difficulty or delay in renewing leases or re-leasing space.
We derive most of our revenue from rent received from our tenants. We are subject to the risks that, upon expiration or termination of leases, leases for space in our properties may not be renewed, space may not be re-leased, or the terms of renewal or re-lease, including the cost of required renovations or concessions to tenants, may be less favorable than current lease terms. As a result, our results of operations and our net income could be adversely impacted.
13
We may be unable to sell properties when appropriate because real estate investments are illiquid.
Real estate investments generally cannot be sold quickly. Our inability to respond promptly to unfavorable changes in the performance of our investments could have an adverse effect on our ability to meet our obligations and make distributions to our stock and unit holders.
Certain of the properties in our portfolio are subject to ground leases; if we are found to be in breach of a ground lease or are unable to renew a ground lease, we could be materially and adversely affected.
We have
24
properties, in our portfolio of
307
properties, that are either completely or partially on land subject to ground leases with third parties. Accordingly, we only own long-term leasehold or similar interest in those properties. If we are found to be in breach of a ground lease, we could lose our interest in the improvements and the right to operate the property that is subject to the ground lease. In addition, unless we can purchase a fee interest in the underlying land or extend the terms of these leases before or at their expiration, as to which no assurance can be given, we will lose our interest in the improvements and the right to operate such properties. The existing lease terms, including renewal options, were taken into consideration when making our investment decisions. The purchase price and subsequent improvements are being depreciated over the shorter of the remaining life of the ground leases or the useful life of the underlying assets. If we were to lose the right to operate a property due to a breach or not exercising renewal options of the ground lease, we would be unable to derive income from such property, which would impair the value of our investments, and materially and adversely affect our financial condition, results of operations and cash flows.
Geographic concentration of our properties makes our business vulnerable to natural disasters, severe weather conditions and climate change, which could have an adverse effect on our cash flow and operating results.
A significant portion of our property gross leasable area is located in areas that are susceptible to earthquakes, tropical storms, hurricanes, tornadoes, wildfires, sea-level rise, and other natural disasters and impacts of climate change. As of
December 31, 2016
, approximately
23.3%
,
15.3%
, and
11.4%
of our property gross leasable area, on a pro-rata basis, was located in
California
,
Florida
, and
Texas
, respectively. Intense weather conditions during the last decade have caused our cost of property insurance to increase significantly. We recognize that the frequency and / or intensity of extreme weather events, sea-level rise, and other climatic changes may continue to increase, and as a result, our exposure to these events could increase. These weather conditions may also disrupt our business and the business of our tenants, which could affect the ability of some tenants to pay rent and may reduce the willingness of residents to remain in or move to the affected area. Therefore, as a result of the geographic concentration of our properties, we face risks, including higher costs, such as uninsured property losses and higher insurance premiums, and disruptions to our business and the businesses of our tenants.
An uninsured loss or a loss that exceeds the insurance coverage on our properties could subject us to loss of capital or revenue on those properties.
We carry comprehensive liability, fire, flood, extended coverage, rental loss, and environmental insurance for our properties with policy specifications and insured limits customarily carried for similar properties. We believe that the insurance carried on our properties is adequate and consistent with industry standards. There are, however, some types of losses, such as losses from hurricanes, terrorism, wars or earthquakes, for which the insurance levels carried may not be sufficient to fully cover catastrophic losses impacting multiple properties. In addition, tenants generally are required to indemnify and hold us harmless from liabilities resulting from injury to persons or damage to personal or real property, on or off the premises, due to activities conducted by tenants or their agents on the properties (including without limitation any environmental contamination), and at the tenant's expense, to obtain and keep in full force during the term of the lease, liability and property damage insurance policies. However, our tenants may not properly maintain their insurance policies or have the ability to pay the deductibles associated with such policies. Should a loss occur that is uninsured or in an amount exceeding the combined aggregate limits for the policies noted above, or in the event of a loss that is subject to a substantial deductible under an insurance policy, we could lose all or part of our capital invested in, and anticipated revenue from, such properties, which could have a material adverse effect on our operating results and financial condition, as well as our ability to make distributions to stock and unit holders.
Loss of our key personnel could adversely affect our business and operations.
We depend on the efforts of our key executive personnel. Although we have developed a succession plan and believe qualified replacements could be found for our key executives, the loss of their services could adversely affect our business and operations.
14
We face competition from numerous sources, including other REITs and other real estate owners.
The ownership of shopping centers is highly fragmented. We face competition from other REITs and well capitalized institutional investors, as well as from numerous small owners in the acquisition, ownership, and leasing of shopping centers. We also compete to develop shopping centers with other REITs engaged in development activities as well as with local, regional, and national real estate developers. This competition may:
|
•
|
reduce the number of properties available for acquisition or development;
|
|
•
|
increase the cost of properties available for acquisition or development;
|
|
•
|
hinder our ability to attract and retain tenants, leading to increased vacancy rates and/or reduced rents; and
|
|
•
|
adversely affect our ability to minimize our expenses of operation.
|
If we cannot successfully compete in our targeted markets, our cash flow, and therefore distributions to stock and unit holders, may be adversely affected.
Costs of environmental remediation could reduce our cash flow available for distribution to stock and unit holders.
Under various federal, state and local laws, an owner or manager of real property may be liable for the costs of removal or remediation of hazardous or toxic substances on the property. These laws often impose liability without regard to whether the owner knew of, or was responsible for, the presence of hazardous or toxic substances. The cost of any required remediation could exceed the value of the property and/or the aggregate assets of the owner or the responsible party. The presence of, or the failure to properly remediate, hazardous or toxic substances may adversely affect our ability to sell or lease a contaminated property or to use the property as collateral for a loan. Any of these developments could reduce cash flow and our ability to make distributions to stock and unit holders.
Compliance with the Americans with Disabilities Act and fire, safety and other regulations may require us to make unintended expenditures.
All of our properties are required to comply with the Americans with Disabilities Act (“ADA”), which generally requires that buildings be made accessible to people with disabilities. Compliance with ADA requirements could require removal of access barriers, and noncompliance could result in imposition of fines by the U.S. government or an award of damages to private litigants, or both. While the tenants to whom we lease properties are obligated by law to comply with the ADA provisions, and typically under tenant leases are obligated to cover costs associated with compliance, if required changes involve greater expenditures than anticipated, or if the changes must be made on a more accelerated basis than anticipated, the ability of these tenants to cover costs could be adversely affected. In addition, we are required to operate the properties in compliance with fire and safety regulations, building codes and other land use regulations, as they may be adopted by governmental entities and become applicable to the properties. We may be required to make substantial capital expenditures to comply with these requirements, and these expenditures could have a material adverse effect on our ability to meet our financial obligations and make distributions to our stock and unit holders.
If we do not maintain the security of tenant-related information, we could incur substantial costs and become subject to litigation.
We receive certain information about our tenants that depends upon secure transmissions of confidential information over public networks, including information permitting cashless payments. A compromise of our security systems that results in information being obtained by unauthorized persons could result in litigation against us or the imposition of penalties and require us to expend significant resources related to our information security systems. Such disruptions could adversely affect our operations, results of operations, financial condition and liquidity.
We rely extensively on computer systems to process transactions and manage our business; cyber security attacks and other disruptions could harm our ability to run our business.
We face risks associated with security breaches, whether through (i) cyber attacks or cyber intrusions, (ii) malware or computer viruses and (iii) people with access or who gain access to our systems, and other significant disruptions of our computer networks and related systems. The risk of a security breach or disruption, particularly through cyber attack or cyber intrusion, has increased as the number, intensity and sophistication of attempted attacks and intrusions from around the world have increased. Our computer networks and related systems are essential to the operation of our business and our ability to perform day-to-day operations. Although we make efforts to maintain the security and integrity of our computer networks and related systems, and we have implemented various measures to manage the risk of a security breach or disruption, there can be no assurance that our security efforts and measures will be effective or that attempted security breaches or disruptions would not be successful or damaging. A security breach or other disruption involving our computer networks and related systems
15
could significantly disrupt the proper functioning of our networks and systems and, as a result, disrupt our operations, which could have a material adverse effect on our liquidity, financial condition and results of operations.
Risk Factors Related to Our Co-investment Partnerships and Acquisition Structure
We do not have voting control over our joint venture investments, so we are unable to ensure that our objectives will be pursued.
We have invested substantial capital as a partner in a number of joint venture investments for the acquisition or development of properties. These investments involve risks not present in a wholly-owned project as we do not have voting control over the ventures, although we do have approval rights over major decisions. The other partner may (i) have interests or goals that are inconsistent with our interests or goals or (ii) otherwise impede our objectives. The other partner also may become insolvent or bankrupt. These factors could limit the return that we receive from such investments or cause our cash flows to be lower than our estimates.
The termination of our co-investment partnerships could adversely affect our cash flow, operating results, and our ability to make distributions to stock and unit holders.
If co-investment partnerships owning a significant number of properties were dissolved for any reason, we would lose the asset and property management fees from these co-investment partnerships, which could adversely affect our operating results and our cash available for distribution to stock and unit holders.
Risk Factors Related to Funding Strategies and Capital Structure
Higher market capitalization rates for our properties could adversely impact our ability to sell properties and fund developments and acquisitions, and could dilute earnings.
As part of our funding strategy, we sell operating properties that no longer meet our investment standards or those with a limited future growth profile. These sales proceeds are used to fund the construction of new developments, redevelopments and acquisitions. An increase in market capitalization rates could cause a reduction in the value of centers identified for sale, which would have an adverse impact on the amount of cash generated. In order to meet the cash requirements of our development program, we may be required to sell more properties than initially planned, which could have a negative impact on our earnings. Additionally, the sale of properties resulting in significant tax gains could require higher distributions to our stockholders or payment of additional income taxes in order to maintain our REIT status. It would be our intent to utilize 1031 exchanges to mitigate taxable income, however there can be no assurance that we will identify properties that meet our investment objectives for acquisitions.
We depend on external sources of capital, which may not be available in the future on favorable terms or at all.
To qualify as a REIT, the Parent Company must, among other things, distribute to its stockholders each year at least 90% of its REIT taxable income (excluding any net capital gains). Because of these distribution requirements, we may not be able to fund all future capital needs with income from operations. We therefore will have to rely on third-party sources of capital, which may or may not be available on favorable terms or at all. Our access to third-party sources of capital depends on a number of things, including the market's perception of our growth potential and our current and potential future earnings. Our access to debt depends on our credit rating, the willingness of creditors to lend to us and conditions in the capital markets. In addition to finding creditors willing to lend to us, we are dependent upon our joint venture partners to contribute their pro rata share of any amount needed to repay or refinance existing debt when lenders reduce the amount of debt our joint ventures are eligible to refinance.
In addition, our existing debt arrangements also impose covenants that limit our flexibility in obtaining other financing. Additional equity offerings may result in substantial dilution of stockholders' interests and additional debt financing may substantially increase our degree of leverage.
Without access to external sources of capital, we would be required to pay outstanding debt with our operating cash flows and proceeds from property sales. Our operating cash flows may not be sufficient to pay our outstanding debt as it comes due and real estate investments generally cannot be sold quickly at a return we believe is appropriate. If we are required to deleverage our business with operating cash flows and proceeds from property sales, we may be forced to reduce the amount of, or eliminate altogether, our distributions to stock and unit holders or refrain from making investments in our business.
16
Our debt financing may adversely affect our business and financial condition.
Our ability to make scheduled payments or to refinance our indebtedness will depend primarily on our future performance, which to a certain extent is subject to economic, financial, competitive and other factors beyond our control. In addition, we do not expect to generate sufficient funds from operations to make balloon principal payments on our debt when due. If we are unable to refinance our debt on acceptable terms, we may be forced (i) to dispose of properties, which might result in losses, or (ii) to obtain financing at unfavorable terms, either of which could reduce the cash flow available for distributions to stock and unit holders. If we cannot make required mortgage payments, the mortgagee could foreclose on the property securing the mortgage.
Covenants in our debt agreements may restrict our operating activities and adversely affect our financial condition.
Our unsecured notes, unsecured term loan, and unsecured line of credit contain customary covenants, including compliance with financial ratios, such as ratio of total debt to gross asset value and fixed charge coverage ratio. Fixed charge coverage ratio is defined as earnings before interest, taxes, depreciation and amortization ("EBITDA") divided by the sum of interest expense and scheduled mortgage principal paid to our lenders plus dividends paid to our preferred stockholders. Our debt arrangements also restrict our ability to enter into a transaction that would result in a change of control. These covenants may limit our operational flexibility and our acquisition activities. Moreover, if we breach any of the covenants in our debt agreements, and do not cure the breach within the applicable cure period, our lenders could require us to repay the debt immediately, even in the absence of a payment default. Many of our debt arrangements, including our unsecured notes, unsecured term loan, and unsecured line of credit are cross-defaulted, which means that the lenders under those debt arrangements can put us in default and require immediate repayment of their debt if we breach and fail to cure a default under certain of our other material debt obligations. As a result, any default under our debt covenants could have an adverse effect on our financial condition, our results of operations, our ability to meet our obligations, and the market value of our stock.
Increases in interest rates would cause our borrowing costs to rise and negatively impact our results of operations.
Although a significant amount of our outstanding debt has fixed interest rates, we do borrow funds at variable interest rates under our credit facilities. As of
December 31, 2016
,
1.3%
of our outstanding debt was variable rate debt. Increases in interest rates would increase our interest expense on any variable rate debt to the extent we have not hedged our exposure to changes in interest rates. In addition, increases in interest rates will affect the terms under which we refinance our existing debt as it matures, to the extent we have not hedged our exposure to changes in interest rates. This would reduce our future earnings and cash flows, which could adversely affect our ability to service our debt and meet our other obligations and also could reduce the amount we are able to distribute to our stock and unit holders.
Hedging activity may expose us to risks, including the risks that a counterparty will not perform and that the hedge will not yield the economic benefits we anticipate, which could adversely affect us.
From time to time, we manage our exposure to interest rate volatility by using interest rate hedging arrangements that involve risk, such as the risk that counterparties may fail to honor their obligations under these arrangements, and that these arrangements may not be effective in reducing our exposure to interest rate changes. There can be no assurance that our hedging arrangements will qualify for hedge accounting or that our hedging activities will have the desired beneficial impact on our results of operations. Should we desire to terminate a hedging agreement, there could be significant costs and cash requirements involved to fulfill our obligations under the hedging agreement. Failure to hedge effectively against interest rate changes may adversely affect our results of operations.
We may acquire properties or portfolios of properties through tax-deferred contribution transactions, which could result in stockholder dilution and limit our ability to sell such assets.
We may acquire properties or portfolios of properties through tax deferred contribution transactions in exchange for partnership interests in our operating partnership, which may result in stockholder dilution. This acquisition structure may have the effect of, among other things, reducing the amount of tax depreciation we could deduct over the tax life of the acquired properties, and may require that we agree to protect the contributors’ ability to defer recognition of taxable gain through restrictions on our ability to dispose of the acquired properties and/or the allocation of partnership debt to the contributors to maintain their tax bases. These restrictions could limit our ability to sell an asset at a time, or on terms, that would be favorable absent such restrictions.
17
Risk Factors Related to the Market Price for Our Debt and Equity Securities
Changes in economic and market conditions could adversely affect the market price of our securities.
The market price of our debt and equity securities may fluctuate significantly in response to many factors, many of which are out of our control, including:
|
•
|
actual or anticipated variations in our operating results;
|
|
•
|
changes in our funds from operations or earnings estimates;
|
|
•
|
publication of research reports about us or the real estate industry in general and recommendations by financial analysts or actions taken by rating agencies with respect to our securities or those of other REIT's;
|
|
•
|
the ability of our tenants to pay rent and meet their other obligations to us under current lease terms and our ability to re-lease space as leases expire;
|
|
•
|
increases in market interest rates that drive purchasers of our stock to demand a higher dividend yield;
|
|
•
|
changes in market valuations of similar companies;
|
|
•
|
adverse market reaction to any additional debt we incur in the future;
|
|
•
|
any future issuances of equity securities;
|
|
•
|
additions or departures of key management personnel;
|
|
•
|
strategic actions by us or our competitors, such as acquisitions or restructurings;
|
|
•
|
actions by institutional stockholders;
|
|
•
|
changes in our dividend payments;
|
|
•
|
potential tax law changes on REITs;
|
|
•
|
speculation in the press or investment community; and
|
|
•
|
general market and economic conditions.
|
These factors may cause the market price of our securities to decline, regardless of our financial condition, results of operations, business or prospects. It is impossible to ensure that the market price of our securities, including our common stock, will not fall in the future. A decrease in the market price of our common stock could reduce our ability to raise additional equity in the public markets. Selling common stock at a decreased market price would have a dilutive impact on existing stockholders.
There is no assurance that we will continue to pay dividends at historical rates.
Our ability to continue to pay dividends at historical rates or to increase our dividend rate will depend on a number of factors, including, among others, the following:
|
•
|
our financial condition and results of future operations;
|
|
•
|
the terms of our loan covenants; and
|
|
•
|
our ability to acquire, finance, develop or redevelop and lease additional properties at attractive rates.
|
If we do not maintain or periodically increase the dividend on our common stock, it could have an adverse effect on the market price of our common stock and other securities.
Changes in accounting standards may adversely impact our financial results.
The Financial Accounting Standards Board ("FASB"), in conjunction with the SEC, has several key projects recently completed or on their agenda that could impact how we currently account for our material transactions, including lease accounting and other convergence projects with the International Accounting Standards Board. The largest projects, Revenue from Contracts with Customers and Leases, have been issued and will be adopted by the Company by their effective dates, as further described in note 1. We do not currently expect the adoption of the Revenue from Contracts with Customers standard to have a material impact, but are still completing our evaluation. The Leases standard is expected to have an impact, specifically to require all of our operating leases for office, ground and equipment leases to be recorded on the balance sheet. Additionally, a material change is expected as it relates to accounting for initial direct costs to obtain a lease with a tenant. Previously capitalizable internal leasing salaries will no longer be capitalizable under the new standard.
18
Risk Factors Related to Federal Income Tax Laws
If the Parent Company fails to qualify as a REIT for federal income tax purposes, it would be subject to federal income tax at regular corporate rates.
We believe that the Parent Company qualifies for taxation as a REIT for federal income tax purposes, and we plan to operate so that we can continue to meet the requirements for taxation as a REIT. If the Parent Company continues to qualify as a REIT, it generally will not be subject to federal income tax on income that we distribute to our stockholders. Many REIT requirements, however, are highly technical and complex. The determination that the Parent Company is a REIT requires an analysis of various factual matters and circumstances, some of which may not be totally within our control and some of which involve questions of interpretation. For example, to qualify as a REIT, at least 95% of our gross income must come from specific passive sources, like rent, that are itemized in the REIT tax laws. There can be no assurance that the Internal Revenue Service (“IRS”) or a court would agree with the positions we have taken in interpreting the REIT requirements. We are also required to distribute to our stockholders at least 90% of our REIT taxable income, excluding capital gains. The fact that we hold many of our assets through co-investment partnerships and their subsidiaries further complicates the application of the REIT requirements. Furthermore, Congress and the IRS might make changes to the tax laws and regulations, and the courts might issue new rulings, that make it more difficult, or impossible, for the Parent Company to remain qualified as a REIT.
Also, unless the IRS granted relief under certain statutory provisions, the Parent Company would remain disqualified as a REIT for four years following the year it first failed to qualify. If the Parent Company failed to qualify as a REIT (currently and/or with respect to any tax years for which the statute of limitations has not expired), we would have to pay significant income taxes, reducing cash available to pay dividends, which would likely have a significant adverse effect on the value of our securities. In addition, we would no longer be required to pay any dividends to stockholders. Although we believe that the Parent Company qualifies as a REIT, we cannot assure you that the Parent Company will continue to qualify or remain qualified as a REIT for tax purposes.
Even if the Parent Company qualifies as a REIT for federal income tax purposes, we are required to pay certain federal, state and local taxes on our income and property. For example, if we have net income from “prohibited transactions,” that income will be subject to a 100% tax. In general, prohibited transactions include sales or other dispositions of property held primarily for sale to customers in the ordinary course of business. The determination as to whether a particular sale is a prohibited transaction depends on the facts and circumstances related to that sale. While we have undertaken a significant number of asset sales in recent years, we do not believe that those sales should be considered prohibited transactions, but there can be no assurance that the IRS would not contend otherwise.
Dividends paid by REITs generally do not qualify for reduced tax rates.
Subject to limited exceptions, dividends paid by REITs (other than distributions designated as capital gain dividends or returns of capital) are not eligible for reduced rates for qualified dividends paid by "C" corporations and are taxable at ordinary income tax rates. The more favorable rates applicable to regular corporate qualified dividends could cause investors who are individuals, trusts and estates to perceive investments in REITs to be relatively less attractive than investments in the stocks of non-REIT corporations that pay dividends, which could adversely affect the value of the shares of REITs, including the shares of our capital stock.
Foreign stockholders may be subject to U.S. federal income tax on gain recognized on a disposition of our common stock if we do not qualify as a "domestically controlled" REIT.
A foreign person disposing of a U.S. real property interest, including shares of a U.S. corporation whose assets consist principally of U.S. real property interests is generally subject to U.S. federal income tax on any gain recognized on the disposition. This tax does not apply, however, to the disposition of stock in a REIT if the REIT is "domestically controlled." In general, we will be a domestically controlled REIT if at all times during the five-year period ending on the applicable stockholder’s disposition of our stock, less than 50% in value of our stock was held directly or indirectly by non-U.S. persons. If we were to fail to qualify as a domestically controlled REIT, gain recognized by a foreign stockholder on a disposition of our common stock would be subject to U.S. federal income tax unless our common stock was traded on an established securities market and the foreign stockholder did not at any time during a specified testing period directly or indirectly own more than 10% of our outstanding common stock.
Legislative or other actions affecting REITs could have a negative effect on us.
The rules dealing with federal income taxation are constantly under review by persons involved in the legislative process and by the IRS and the U.S. Department of the Treasury. Changes to the tax laws, with or without retroactive application, could adversely affect our investors or us. We cannot predict how changes in the tax laws might affect our investors
19
or us. New legislation, Treasury Regulations, administrative interpretations or court decisions could significantly and negatively affect our ability to qualify as a REIT or the federal income tax consequences of such qualification, or the federal income tax consequences of an investment in us. Also, the law relating to the tax treatment of other entities, or an investment in other entities, could change, making an investment in such other entities more attractive relative to an investment in a REIT.
Complying with REIT requirements may limit our ability to hedge effectively and may cause us to incur tax liabilities.
The REIT provisions of the Code limit our ability to hedge our liabilities. Generally, income from a hedging transaction that constitutes “qualifying income” for purposes of the 75% or 95% gross income tests applicable to REITs, does not constitute “gross income” for purposes of the 75% or 95% gross income tests, provided that we properly identify the hedging transaction pursuant to the applicable sections of the Code and Treasury Regulations. To the extent that we enter into other types of hedging transactions, or fail to make the proper tax identifications, the income from those transactions is likely to be treated as non-qualifying income for purposes of both gross income tests. As a result of these rules, we may need to limit our use of otherwise advantageous hedging techniques or implement those hedges through a taxable REIT subsidiary, or TRS.
Risk Factors Related to Our Ownership Limitations and the Florida Business Corporation Act
Restrictions on the ownership of the Parent Company's capital stock to preserve its REIT status could delay or prevent a change in control.
Ownership of more than 7% by value of our outstanding capital stock is prohibited, with certain exceptions, by the Parent Company's articles of incorporation, for the purpose of maintaining its qualification as a REIT. This 7% limitation may discourage a change in control and may also (i) deter tender offers for our capital stock, which offers may be attractive to our stockholders, or (ii) limit the opportunity for our stockholders to receive a premium for their capital stock that might otherwise exist if an investor attempted to assemble a block in excess of 7% of our outstanding capital stock or to affect a change in control.
The issuance of the Parent Company's capital stock could delay or prevent a change in control.
The Parent Company's articles of incorporation authorize our Board of Directors to issue up to 30,000,000 shares of preferred stock and 10,000,000 shares of special common stock and to establish the preferences and rights of any shares issued. The issuance of preferred stock or special common stock could have the effect of delaying or preventing a change in control. The provisions of the Florida Business Corporation Act regarding affiliated transactions could also deter potential acquisitions by preventing the acquiring party from consummating a merger or other extraordinary corporate transaction without the approval of our disinterested stockholders.
None.
20
The following table is a list of the shopping centers, summarized by state and in order of largest holdings, presented for Consolidated Properties (excludes properties owned by unconsolidated co-investment partnerships):
|
December 31, 2016
|
December 31, 2015
|
|||||||||||||||||||||||
|
Location
|
Number of Properties
|
GLA (in thousands)
|
Percent of Total
GLA |
Percent Leased
|
Number of Properties
|
GLA (in thousands)
|
Percent of Total
GLA |
Percent Leased
|
||||||||||||||||
|
California
|
43
|
|
5,734
|
|
24.0
|
%
|
97.7
|
%
|
42
|
|
5,619
|
|
24.1
|
%
|
95.6
|
%
|
||||||||
|
Florida
|
37
|
|
4,167
|
|
17.4
|
%
|
93.6
|
%
|
39
|
|
4,214
|
|
18.1
|
%
|
94.7
|
%
|
||||||||
|
Texas
|
23
|
|
3,014
|
|
12.6
|
%
|
96.0
|
%
|
22
|
|
2,716
|
|
11.7
|
%
|
97.6
|
%
|
||||||||
|
Georgia
|
15
|
|
1,395
|
|
5.8
|
%
|
93.8
|
%
|
15
|
|
1,392
|
|
6.0
|
%
|
92.9
|
%
|
||||||||
|
Colorado
|
14
|
|
1,146
|
|
4.8
|
%
|
93.8
|
%
|
15
|
|
1,266
|
|
5.4
|
%
|
91.3
|
%
|
||||||||
|
North Carolina
|
10
|
|
895
|
|
3.8
|
%
|
96.2
|
%
|
10
|
|
895
|
|
3.8
|
%
|
95.8
|
%
|
||||||||
|
Ohio
|
8
|
|
1,184
|
|
4.9
|
%
|
98.4
|
%
|
8
|
|
1,164
|
|
5.0
|
%
|
98.6
|
%
|
||||||||
|
Virginia
|
7
|
|
1,233
|
|
5.2
|
%
|
87.5
|
%
|
6
|
|
841
|
|
3.6
|
%
|
96.2
|
%
|
||||||||
|
Oregon
|
7
|
|
741
|
|
3.1
|
%
|
93.3
|
%
|
7
|
|
742
|
|
3.2
|
%
|
87.9
|
%
|
||||||||
|
Washington
|
6
|
|
672
|
|
2.8
|
%
|
99.3
|
%
|
5
|
|
606
|
|
2.6
|
%
|
98.7
|
%
|
||||||||
|
Illinois
|
5
|
|
817
|
|
3.4
|
%
|
98.7
|
%
|
5
|
|
817
|
|
3.5
|
%
|
98.2
|
%
|
||||||||
|
Missouri
|
4
|
|
408
|
|
1.7
|
%
|
99.5
|
%
|
4
|
|
408
|
|
1.8
|
%
|
100.0
|
%
|
||||||||
|
Massachusetts
|
3
|
|
516
|
|
2.2
|
%
|
95.5
|
%
|
3
|
|
516
|
|
2.2
|
%
|
96.1
|
%
|
||||||||
|
Tennessee
|
3
|
|
317
|
|
1.3
|
%
|
96.3
|
%
|
3
|
|
317
|
|
1.4
|
%
|
96.1
|
%
|
||||||||
|
Connecticut
|
3
|
|
316
|
|
1.3
|
%
|
94.7
|
%
|
3
|
|
315
|
|
1.4
|
%
|
96.3
|
%
|
||||||||
|
Pennsylvania
|
3
|
|
317
|
|
1.3
|
%
|
94.7
|
%
|
3
|
|
311
|
|
1.3
|
%
|
98.4
|
%
|
||||||||
|
Indiana
|
1
|
|
254
|
|
1.1
|
%
|
97.9
|
%
|
3
|
|
281
|
|
1.2
|
%
|
93.8
|
%
|
||||||||
|
Arizona
|
1
|
|
36
|
|
0.1
|
%
|
60.4
|
%
|
2
|
|
274
|
|
1.2
|
%
|
92.7
|
%
|
||||||||
|
Delaware
|
1
|
|
232
|
|
1.0
|
%
|
93.6
|
%
|
1
|
|
232
|
|
1.0
|
%
|
90.1
|
%
|
||||||||
|
Maryland
|
1
|
|
117
|
|
0.5
|
%
|
97.9
|
%
|
1
|
|
113
|
|
0.5
|
%
|
96.1
|
%
|
||||||||
|
Michigan
|
1
|
|
97
|
|
0.4
|
%
|
97.1
|
%
|
1
|
|
97
|
|
0.4
|
%
|
95.7
|
%
|
||||||||
|
New York
|
1
|
|
105
|
|
0.4
|
%
|
—%
|
|
—
|
|
—
|
|
—%
|
|
—%
|
|
||||||||
|
New Jersey
|
1
|
|
218
|
|
0.9
|
%
|
65.9
|
%
|
—
|
|
—
|
|
—%
|
|
—%
|
|
||||||||
|
Alabama
|
—
|
|
—
|
|
—%
|
|
—%
|
|
1
|
|
85
|
|
0.4
|
%
|
95.0
|
%
|
||||||||
|
South Carolina
|
—
|
|
—
|
|
—%
|
|
—%
|
|
1
|
|
59
|
|
0.2
|
%
|
100.0
|
%
|
||||||||
|
Total
|
198
|
23,931
|
100.0%
|
94.8%
|
200
|
23,280
|
100.0%
|
95.4%
|
||||||||||||||||
Certain Consolidated Properties are encumbered by mortgage loans of
$467.1 million
, excluding debt premiums and discounts, as of
December 31, 2016
.
The weighted average annual effective rent for the consolidated portfolio of properties, net of tenant concessions, is
$19.70
and
$18.95
per square foot ("PSF") as of
December 31, 2016
and
2015
, respectively.
21
The following table is a list of the shopping centers, summarized by state and in order of largest holdings, presented for Unconsolidated Properties (includes properties owned by unconsolidated co-investment partnerships):
|
December 31, 2016
|
December 31, 2015
|
|||||||||||||||
|
Location
|
Number of Properties
|
GLA (in thousands)
|
Percent of Total
GLA |
Percent Leased
|
Number of Properties
|
GLA (in thousands)
|
Percent of Total
GLA |
Percent Leased
|
||||||||
|
California
|
20
|
2,652
|
19.1%
|
97.5%
|
20
|
2,652
|
18.0%
|
98.7%
|
||||||||
|
Virginia
|
18
|
2,551
|
18.3%
|
95.1%
|
19
|
2,645
|
17.9%
|
96.9%
|
||||||||
|
Maryland
|
11
|
1,182
|
8.5%
|
96.1%
|
13
|
1,491
|
10.1%
|
92.5%
|
||||||||
|
North Carolina
|
8
|
1,275
|
9.2%
|
95.3%
|
8
|
1,275
|
8.6%
|
97.6%
|
||||||||
|
Florida
|
7
|
729
|
5.2%
|
98.4%
|
8
|
682
|
4.6%
|
97.4%
|
||||||||
|
Texas
|
7
|
932
|
6.7%
|
98.4%
|
7
|
932
|
6.3%
|
99.3%
|
||||||||
|
Pennsylvania
|
6
|
664
|
4.8%
|
91.7%
|
6
|
664
|
4.5%
|
88.7%
|
||||||||
|
Colorado
|
5
|
853
|
6.1%
|
95.1%
|
5
|
862
|
5.8%
|
92.9%
|
||||||||
|
Minnesota
|
5
|
674
|
4.8%
|
98.6%
|
5
|
674
|
4.6%
|
98.3%
|
||||||||
|
Washington
|
5
|
621
|
4.6%
|
95.2%
|
5
|
621
|
4.2%
|
97.0%
|
||||||||
|
Illinois
|
4
|
671
|
4.8%
|
95.7%
|
7
|
944
|
6.4%
|
94.6%
|
||||||||
|
New Jersey
|
2
|
158
|
1.1%
|
100.0%
|
2
|
158
|
1.1%
|
95.7%
|
||||||||
|
Indiana
|
2
|
139
|
1.0%
|
100.0%
|
2
|
139
|
0.9%
|
100.0%
|
||||||||
|
District of Columbia
|
2
|
40
|
0.3%
|
100.0%
|
2
|
40
|
0.3%
|
100.0%
|
||||||||
|
Connecticut
|
1
|
186
|
1.3%
|
94.8%
|
1
|
186
|
1.3%
|
98.8%
|
||||||||
|
South Carolina
|
1
|
80
|
0.6%
|
100.0%
|
2
|
162
|
1.1%
|
100.0%
|
||||||||
|
New York
|
1
|
141
|
1.0%
|
100.0%
|
1
|
141
|
1.0%
|
100.0%
|
||||||||
|
Arizona
|
1
|
108
|
0.8%
|
89.7%
|
1
|
108
|
0.7%
|
87.4%
|
||||||||
|
Oregon
|
1
|
93
|
0.7%
|
94.7%
|
1
|
93
|
0.6%
|
98.1%
|
||||||||
|
Georgia
|
1
|
86
|
0.6%
|
98.5%
|
1
|
86
|
0.6%
|
100.0%
|
||||||||
|
Delaware
|
1
|
64
|
0.5%
|
92.6%
|
1
|
67
|
0.5%
|
91.0%
|
||||||||
|
Wisconsin
|
—
|
—
|
—%
|
—%
|
1
|
133
|
0.9%
|
92.8%
|
||||||||
|
Total
|
109
|
13,899
|
100.0%
|
96.3%
|
118
|
14,755
|
100.0%
|
96.3%
|
||||||||
Certain Unconsolidated Properties are encumbered by mortgage loans of
$1.3 billion
, excluding debt premiums and discounts, as of
December 31, 2016
.
The weighted average annual effective rent for the unconsolidated portfolio of properties, net of tenant concessions, is
$19.25
and
$18.81
PSF as of
December 31, 2016
and
2015
, respectively.
22
The following table summarizes the largest tenants occupying our shopping centers for Consolidated Properties plus our pro-rata share of Unconsolidated Properties, as of
December 31, 2016
, based upon a percentage of total annualized base rent (GLA and dollars in thousands):
|
Tenant
|
GLA
|
Percent of Company Owned GLA
|
Annualized Base Rent
|
Percent of Annualized Base Rent
|
Number of Leased Stores
|
Anchor Owned Stores
(1)
|
|||||||
|
Kroger
|
2,686
|
9.3%
|
$
|
26,288
|
|
4.7%
|
54
|
5
|
|||||
|
Publix
|
1,641
|
5.7%
|
17,617
|
|
3.1%
|
40
|
1
|
||||||
|
Albertsons/Safeway
|
1,361
|
4.7%
|
15,178
|
|
2.7%
|
41
|
7
|
||||||
|
Whole Foods
|
713
|
2.5%
|
13,895
|
|
2.5%
|
21
|
—
|
||||||
|
TJX Companies
|
807
|
2.8%
|
10,895
|
|
1.9%
|
38
|
—
|
||||||
|
CVS
|
498
|
1.7%
|
8,644
|
|
1.5%
|
45
|
—
|
||||||
|
PETCO
|
324
|
1.1%
|
7,218
|
|
1.3%
|
41
|
—
|
||||||
|
Ahold/Delhaize
|
460
|
1.6%
|
6,301
|
|
1.1%
|
14
|
—
|
||||||
|
H.E.B.
|
344
|
1.2%
|
5,762
|
|
1.0%
|
5
|
—
|
||||||
|
Trader Joe's
|
179
|
0.6%
|
4,995
|
|
0.9%
|
19
|
—
|
||||||
|
Ross Dress For Less
|
306
|
1.1%
|
4,982
|
|
0.9%
|
16
|
—
|
||||||
|
Nordstrom Rack
|
174
|
0.6%
|
4,937
|
|
0.9%
|
5
|
—
|
||||||
|
Bank of America
|
88
|
0.3%
|
4,580
|
|
0.8%
|
31
|
—
|
||||||
|
Target
|
410
|
1.4%
|
4,441
|
|
0.8%
|
5
|
13
|
||||||
|
Starbucks
|
106
|
0.4%
|
4,424
|
|
0.8%
|
81
|
—
|
||||||
|
Wells Fargo Bank
|
85
|
0.3%
|
4,416
|
|
0.8%
|
41
|
—
|
||||||
|
JPMorgan Chase Bank
|
64
|
0.2%
|
3,995
|
|
0.7%
|
25
|
—
|
||||||
|
Kohl's
|
289
|
1.0%
|
3,950
|
|
0.7%
|
4
|
—
|
||||||
|
Dick's Sporting Goods
|
267
|
0.9%
|
3,441
|
|
0.6%
|
5
|
—
|
||||||
|
Panera Bread
|
97
|
0.3%
|
3,359
|
|
0.6%
|
27
|
—
|
||||||
|
Sears Holdings
|
376
|
1.3%
|
3,090
|
|
0.6%
|
5
|
1
|
||||||
|
Bed Bath & Beyond
|
175
|
0.6%
|
2,940
|
|
0.5%
|
6
|
—
|
||||||
|
Subway
|
85
|
0.3%
|
2,927
|
|
0.5%
|
91
|
—
|
||||||
|
Massage Envy
|
89
|
0.3%
|
2,808
|
|
0.5%
|
33
|
—
|
||||||
|
Rite Aid
|
171
|
0.6%
|
2,807
|
|
0.5%
|
19
|
—
|
||||||
(1)
Stores owned by anchor tenant that are attached to our centers.
Our leases for tenant space under 10,000 square feet generally have terms ranging from three to seven years. Leases greater than 10,000 square feet generally have lease terms in excess of five years, mostly comprised of anchor tenants. Many of the anchor leases contain provisions allowing the tenant the option of extending the term of the lease at expiration. Our leases provide for the monthly payment in advance of fixed minimum rent, the tenant's pro-rata share of real estate taxes, insurance, and common area maintenance (“CAM”) expenses, and reimbursement for utility costs if not directly metered.
23
The following table summarizes pro-rata lease expirations for the next ten years and thereafter, for our Consolidated and Unconsolidated Properties, assuming no tenants renew their leases (GLA and dollars in thousands):
|
Lease Expiration Year
|
Number of Tenants with Expiring Leases
|
Pro-rata Expiring GLA
|
Percent of Total Company GLA
|
In Place Minimum Rent Expiring Under Leases
(2)
|
Percent of Minimum Rent
(2)
|
Pro-rata Expiring ABR
|
||||||||||||||
|
(1)
|
200
|
|
158
|
|
0.6
|
%
|
$
|
3,699
|
|
0.7
|
%
|
$
|
23.41
|
|
||||||
|
2017
|
887
|
|
2,219
|
|
8.2
|
%
|
48,215
|
|
8.9
|
%
|
21.73
|
|
||||||||
|
2018
|
975
|
|
2,783
|
|
10.3
|
%
|
59,549
|
|
11.0
|
%
|
21.40
|
|
||||||||
|
2019
|
911
|
|
3,229
|
|
12.0
|
%
|
64,178
|
|
11.9
|
%
|
19.88
|
|
||||||||
|
2020
|
934
|
|
3,094
|
|
11.5
|
%
|
65,686
|
|
12.1
|
%
|
21.23
|
|
||||||||
|
2021
|
911
|
|
3,324
|
|
12.3
|
%
|
68,210
|
|
12.6
|
%
|
20.52
|
|
||||||||
|
2022
|
494
|
|
2,645
|
|
9.8
|
%
|
50,047
|
|
9.3
|
%
|
18.92
|
|
||||||||
|
2023
|
240
|
|
1,153
|
|
4.3
|
%
|
25,352
|
|
4.7
|
%
|
21.99
|
|
||||||||
|
2024
|
253
|
|
1,513
|
|
5.6
|
%
|
30,311
|
|
5.6
|
%
|
20.03
|
|
||||||||
|
2025
|
236
|
|
1,191
|
|
4.4
|
%
|
28,304
|
|
5.2
|
%
|
23.76
|
|
||||||||
|
2026
|
216
|
|
1,176
|
|
4.4
|
%
|
28,639
|
|
5.3
|
%
|
24.35
|
|
||||||||
|
Thereafter
|
441
|
|
4,466
|
|
16.6
|
%
|
68,781
|
|
12.7
|
%
|
15.40
|
|
||||||||
|
Total
|
6,698
|
|
26,951
|
|
100.0
|
%
|
$
|
540,971
|
|
100.0
|
%
|
|||||||||
(1)
Leases currently under month-to-month rent or in process of renewal.
(2)
Minimum rent includes current minimum rent and future contractual rent steps, but excludes additional rent such as percentage rent, common area maintenance, real estate taxes and insurance reimbursements.
During
2017
, we have a total of
887
leases expiring, representing
2.2 million
square feet of GLA. These expiring leases have an average base rent of
$21.73
PSF. The average base rent of new leases signed during
2016
was
$23.98
PSF. During periods of recession or when occupancy is low, tenants have more bargaining power, which may result in rental rate declines on new or renewal leases. In periods of recovery and/or when occupancy levels are high, landlords have more bargaining power, which generally results in rental rate growth on new and renewal leases. Based on current economic trends and expectations, and pro-rata percent leased of
95.4%
, we expect average base rent on new and renewal leases during
2017
to meet or exceed average rental rates on leases expiring in
2017
. Exceptions may arise in certain geographic areas or at specific shopping centers based on the local economic situation, competition, location, and size of the space being leased, among other factors. Additionally, significant changes or uncertainties affecting micro- or macroeconomic climates may cause significant changes to our current expectations.
24
See the following property table and also see Item 7, Management's Discussion and Analysis, for further information about our Consolidated and Unconsolidated Properties.
|
|
||||||||||||||||||||
|
Property Name
|
(1)
CBSA
|
State
|
(2)
Owner-ship Interest
|
Year Acquired
|
Year Constructed or Last Major Renovation
|
Mortgages or Encumbrances (in 000's)
|
Gross Leasable Area
(GLA) (in 000's)
|
(3)
Percent Leased
|
(4)
Average Base Rent (Per Sq Ft)
|
(5)
Grocer(s) & Major Tenant(s) >35,000 SFT
|
||||||||||
|
Palm Valley Marketplace
|
Phoenix-Mesa-Scottsdale
|
AZ
|
20%
|
2001
|
1999
|
$—
|
108
|
89.7%
|
$14.51
|
Safeway
|
||||||||||
|
Shops at Arizona
|
Phoenix-Mesa-Scottsdale
|
AZ
|
2003
|
2000
|
—
|
36
|
60.4%
|
9.91
|
--
|
|||||||||||
|
4S Commons Town Center
|
San Diego-Carlsbad-San Marcos
|
CA
|
85%
|
2004
|
2004
|
62,500
|
240
|
100.0%
|
31.93
|
Ralphs, Jimbo's...Naturally!
|
||||||||||
|
Amerige Heights Town Center
|
Los Angeles-Long Beach-Santa Ana
|
CA
|
2000
|
2000
|
16,106
|
89
|
100.0%
|
28.79
|
Albertsons, (Target)
|
|||||||||||
|
Balboa Mesa Shopping Center
|
San Diego-Carlsbad-San Marcos
|
CA
|
2012
|
1969
|
—
|
207
|
100.0%
|
25.07
|
Von's Food & Drug, Kohl's
|
|||||||||||
|
Bayhill Shopping Center
|
San Francisco-Oakland-Fremont
|
CA
|
40%
|
2005
|
1990
|
20,838
|
122
|
97.3%
|
23.67
|
Mollie Stone's Market
|
||||||||||
|
Blossom Valley
|
San Jose-Sunnyvale-Santa Clara
|
CA
|
20%
|
1999
|
1990
|
—
|
93
|
98.9%
|
25.32
|
Safeway
|
||||||||||
|
Brea Marketplace
(6)
|
Los Angeles-Long Beach-Santa Ana
|
CA
|
40%
|
2005
|
1987
|
47,167
|
352
|
99.0%
|
17.83
|
Sprout's Markets, Target
|
||||||||||
|
Clayton Valley Shopping Center
|
San Francisco-Oakland-Fremont
|
CA
|
2003
|
2004
|
—
|
260
|
94.7%
|
22.03
|
Grocery Outlet, Orchard Supply Hardware
|
|||||||||||
|
Corral Hollow
|
Stockton
|
CA
|
25%
|
2000
|
2000
|
—
|
167
|
100.0%
|
16.74
|
Safeway, Orchard Supply & Hardware
|
||||||||||
|
Costa Verde Center
|
San Diego-Carlsbad-San Marcos
|
CA
|
1999
|
1988
|
—
|
179
|
90.1%
|
35.41
|
Bristol Farms
|
|||||||||||
|
Diablo Plaza
|
San Francisco-Oakland-Fremont
|
CA
|
1999
|
1982
|
—
|
63
|
100.0%
|
38.08
|
(Safeway)
|
|||||||||||
|
East Washington Place
|
Santa Rosa-Petaluma
|
CA
|
2011
|
2011
|
—
|
203
|
100.0%
|
24.04
|
(Target), Dick's Sporting Goods, TJ Maxx
|
|||||||||||
|
El Camino Shopping Center
|
Los Angeles-Long Beach-Santa Ana
|
CA
|
1999
|
1995
|
—
|
136
|
98.4%
|
35.14
|
Bristol Farms
|
|||||||||||
|
El Cerrito Plaza
|
San Francisco-Oakland-Fremont
|
CA
|
2000
|
2000
|
37,237
|
256
|
97.2%
|
28.01
|
(Lucky's), Trader Joe's
|
|||||||||||
|
El Norte Pkwy Plaza
|
San Diego-Carlsbad-San Marcos
|
CA
|
1999
|
1984
|
—
|
91
|
94.5%
|
17.81
|
Von's Food & Drug
|
|||||||||||
|
Encina Grande
|
San Francisco-Oakland-Fremont
|
CA
|
1999
|
1965
|
—
|
106
|
100.0%
|
30.42
|
Whole Foods
|
|||||||||||
|
Five Points Shopping Center
|
Santa Barbara-Santa Maria-Goleta
|
CA
|
40%
|
2005
|
1960
|
26,604
|
145
|
98.7%
|
27.70
|
Smart & Final
|
||||||||||
|
Folsom Prairie City Crossing
|
Sacramento--Arden-Arcade--Roseville
|
CA
|
1999
|
1999
|
—
|
90
|
98.7%
|
20.49
|
Safeway
|
|||||||||||
|
French Valley Village Center
|
Riverside-San Bernardino-Ontario
|
CA
|
2004
|
2004
|
—
|
99
|
100.0%
|
25.49
|
Stater Bros.
|
|||||||||||
|
Friars Mission Center
|
San Diego-Carlsbad-San Marcos
|
CA
|
1999
|
1989
|
—
|
147
|
100.0%
|
32.87
|
Ralphs
|
|||||||||||
|
Gateway 101
|
San Francisco-Oakland-Fremont
|
CA
|
2008
|
2008
|
—
|
92
|
100.0%
|
32.05
|
(Home Depot), (Best Buy), Target, Nordstrom Rack
|
|||||||||||
|
Gelson's Westlake Market Plaza
|
Oxnard-Thousand Oaks-Ventura
|
CA
|
2002
|
2002
|
—
|
85
|
100.0%
|
23.77
|
Gelson's Markets
|
|||||||||||
|
Golden Hills Promenade
|
San Luis Obispo-Paso Robles
|
CA
|
2006
|
2006
|
—
|
244
|
98.9%
|
7.56
|
Lowe's
|
|||||||||||
|
Granada Village
|
Los Angeles-Long Beach-Santa Ana
|
CA
|
40%
|
2005
|
1965
|
50,000
|
226
|
100.0%
|
22.57
|
Sprout's Markets
|
||||||||||
|
Hasley Canyon Village
|
Los Angeles-Long Beach-Santa Ana
|
CA
|
20%
|
2003
|
2003
|
—
|
66
|
100.0%
|
25.03
|
Ralphs
|
||||||||||
|
Heritage Plaza
(6)
|
Los Angeles-Long Beach-Santa Ana
|
CA
|
1999
|
1981
|
—
|
230
|
98.6%
|
34.76
|
Ralphs
|
|||||||||||
|
Indio Towne Center
|
Riverside-San Bernardino-Ontario
|
CA
|
2006
|
2010
|
—
|
180
|
92.4%
|
17.94
|
(Home Depot), (WinCo), Toys R Us
|
|||||||||||
|
Jefferson Square
|
Riverside-San Bernardino-Ontario
|
CA
|
2007
|
2007
|
—
|
38
|
49.3%
|
15.80
|
--
|
|||||||||||
|
Laguna Niguel Plaza
|
Los Angeles-Long Beach-Santa Ana
|
CA
|
40%
|
2005
|
1985
|
—
|
42
|
100.0%
|
27.35
|
(Albertsons)
|
||||||||||
|
Marina Shores
|
Los Angeles-Long Beach-Santa Ana
|
CA
|
20%
|
2008
|
2001
|
10,897
|
68
|
100.0%
|
34.82
|
Whole Foods
|
||||||||||
|
Mariposa Shopping Center
|
San Jose-Sunnyvale-Santa Clara
|
CA
|
40%
|
2005
|
1957
|
20,140
|
127
|
100.0%
|
19.33
|
Safeway
|
||||||||||
|
Morningside Plaza
|
Los Angeles-Long Beach-Santa Ana
|
CA
|
1999
|
1996
|
—
|
91
|
98.8%
|
22.31
|
Stater Bros.
|
|||||||||||
|
Navajo Shopping Center
|
San Diego-Carlsbad-San Marcos
|
CA
|
40%
|
2005
|
1964
|
8,215
|
102
|
98.0%
|
13.76
|
Albertsons
|
||||||||||
|
Newland Center
|
Los Angeles-Long Beach-Santa Ana
|
CA
|
1999
|
1985
|
—
|
152
|
99.1%
|
22.93
|
Albertsons
|
|||||||||||
25
|
|
||||||||||||||||||||
|
Property Name
|
(1)
CBSA
|
State
|
(2)
Owner-ship Interest
|
Year Acquired
|
Year Constructed or Last Major Renovation
|
Mortgages or Encumbrances (in 000's)
|
Gross Leasable Area
(GLA) (in 000's)
|
(3)
Percent Leased
|
(4)
Average Base Rent (Per Sq Ft)
|
(5)
Grocer(s) & Major Tenant(s) >35,000 SFT
|
||||||||||
|
Oak Shade Town Center
|
Sacramento--Arden-Arcade--Roseville
|
CA
|
2011
|
1998
|
8,695
|
104
|
99.4%
|
20.03
|
Safeway
|
|||||||||||
|
Oakbrook Plaza
|
Oxnard-Thousand Oaks-Ventura
|
CA
|
1999
|
1982
|
—
|
83
|
95.4%
|
18.21
|
Gelson's Markets
|
|||||||||||
|
Persimmon Place
|
San Francisco-Oakland-Fremont
|
CA
|
2014
|
2014
|
—
|
153
|
100.0%
|
34.28
|
Whole Foods, Nordstrom Rack
|
|||||||||||
|
Plaza Hermosa
|
Los Angeles-Long Beach-Santa Ana
|
CA
|
1999
|
1984
|
13,800
|
95
|
100.0%
|
25.62
|
Von's Food & Drug
|
|||||||||||
|
Pleasant Hill Shopping Center
|
San Francisco-Oakland-Fremont
|
CA
|
40%
|
2005
|
1970
|
50,000
|
232
|
100.0%
|
24.57
|
Target, Toys "R" Us
|
||||||||||
|
Point Loma Plaza
|
San Diego-Carlsbad-San Marcos
|
CA
|
40%
|
2005
|
1987
|
25,984
|
213
|
82.9%
|
21.40
|
Von's Food & Drug
|
||||||||||
|
Powell Street Plaza
|
San Francisco-Oakland-Fremont
|
CA
|
2001
|
1987
|
—
|
166
|
100.0%
|
32.87
|
Trader Joe's
|
|||||||||||
|
Raley's Supermarket
|
Sacramento--Arden-Arcade--Roseville
|
CA
|
20%
|
2007
|
1964
|
—
|
63
|
100.0%
|
12.50
|
Raley's
|
||||||||||
|
Rancho San Diego Village
|
San Diego-Carlsbad-San Marcos
|
CA
|
40%
|
2005
|
1981
|
22,393
|
153
|
93.1%
|
21.02
|
Smart & Final
|
||||||||||
|
Rona Plaza
|
Los Angeles-Long Beach-Santa Ana
|
CA
|
1999
|
1989
|
—
|
52
|
100.0%
|
20.31
|
Superior Super Warehouse
|
|||||||||||
|
San Leandro Plaza
|
San Francisco-Oakland-Fremont
|
CA
|
1999
|
1982
|
—
|
50
|
100.0%
|
34.45
|
(Safeway)
|
|||||||||||
|
Seal Beach
|
Los Angeles-Long Beach-Santa Ana
|
CA
|
20%
|
2002
|
1966
|
2,200
|
97
|
97.8%
|
23.47
|
Von's Food & Drug
|
||||||||||
|
Sequoia Station
|
San Francisco-Oakland-Fremont
|
CA
|
1999
|
1996
|
21,100
|
103
|
100.0%
|
39.17
|
(Safeway)
|
|||||||||||
|
Shoppes at Homestead (fka Loehmanns Plaza California)
|
San Jose-Sunnyvale-Santa Clara
|
CA
|
1999
|
1983
|
—
|
113
|
100.0%
|
22.28
|
(Safeway)
|
|||||||||||
|
Silverado Plaza
|
Napa
|
CA
|
40%
|
2005
|
1974
|
10,058
|
85
|
98.4%
|
16.60
|
Nob Hill
|
||||||||||
|
Snell & Branham Plaza
|
San Jose-Sunnyvale-Santa Clara
|
CA
|
40%
|
2005
|
1988
|
13,427
|
92
|
100.0%
|
18.26
|
Safeway
|
||||||||||
|
South Bay Village
|
Los Angeles-Long Beach-Santa Ana
|
CA
|
2012
|
2012
|
—
|
108
|
100.0%
|
19.11
|
Wal-Mart, Orchard Supply Hardware
|
|||||||||||
|
Strawflower Village
|
San Francisco-Oakland-Fremont
|
CA
|
1999
|
1985
|
—
|
79
|
94.6%
|
19.76
|
Safeway
|
|||||||||||
|
Tassajara Crossing
|
San Francisco-Oakland-Fremont
|
CA
|
1999
|
1990
|
19,800
|
146
|
95.9%
|
23.63
|
Safeway
|
|||||||||||
|
The Hub Hillcrest Market (fka Uptown District)
|
San Diego-Carlsbad-San Marcos
|
CA
|
2012
|
1990
|
—
|
149
|
97.6%
|
37.72
|
Ralphs, Trader Joe's
|
|||||||||||
|
Tustin Legacy
(7)
|
Los Angeles-Long Beach-Santa Ana
|
CA
|
2016
|
2016
|
—
|
112
|
82.3%
|
28.57
|
Stater Bros.
|
|||||||||||
|
Twin Oaks Shopping Center
|
Los Angeles-Long Beach-Santa Ana
|
CA
|
40%
|
2005
|
1978
|
9,924
|
98
|
96.9%
|
18.26
|
Ralphs
|
||||||||||
|
Twin Peaks
|
San Diego-Carlsbad-San Marcos
|
CA
|
1999
|
1988
|
—
|
208
|
96.9%
|
19.74
|
Target
|
|||||||||||
|
Valencia Crossroads
|
Los Angeles-Long Beach-Santa Ana
|
CA
|
2002
|
2003
|
—
|
173
|
100.0%
|
26.03
|
Whole Foods, Kohl's
|
|||||||||||
|
Village at La Floresta
|
Los Angeles-Long Beach-Santa Ana
|
CA
|
2014
|
2014
|
—
|
87
|
100.0%
|
32.70
|
Whole Foods
|
|||||||||||
|
West Park Plaza
|
San Jose-Sunnyvale-Santa Clara
|
CA
|
1999
|
1996
|
—
|
88
|
100.0%
|
17.71
|
Safeway
|
|||||||||||
|
Westlake Village Plaza and Center
|
Oxnard-Thousand Oaks-Ventura
|
CA
|
1999
|
1975
|
—
|
197
|
100.0%
|
36.97
|
Von's Food & Drug and Sprouts
|
|||||||||||
|
Woodman Van Nuys
|
Los Angeles-Long Beach-Santa Ana
|
CA
|
1999
|
1992
|
—
|
108
|
100.0%
|
15.33
|
El Super
|
|||||||||||
|
Woodside Central
|
San Francisco-Oakland-Fremont
|
CA
|
1999
|
1993
|
—
|
81
|
100.0%
|
23.98
|
(Target)
|
|||||||||||
|
Ygnacio Plaza
|
San Francisco-Oakland-Fremont
|
CA
|
40%
|
2005
|
1968
|
27,326
|
110
|
100.0%
|
35.45
|
Sports Basement
|
||||||||||
|
Applewood Shopping Center
|
Denver-Aurora
|
CO
|
40%
|
2005
|
1956
|
—
|
372
|
91.5%
|
12.02
|
King Soopers, Wal-Mart
|
||||||||||
|
Arapahoe Village
|
Boulder
|
CO
|
40%
|
2005
|
1957
|
13,936
|
159
|
95.2%
|
17.48
|
Safeway
|
||||||||||
|
Belleview Square
|
Denver-Aurora
|
CO
|
2004
|
1978
|
—
|
117
|
100.0%
|
18.02
|
King Soopers
|
|||||||||||
|
Boulevard Center
|
Denver-Aurora
|
CO
|
1999
|
1986
|
—
|
79
|
94.1%
|
28.32
|
(Safeway)
|
|||||||||||
|
Buckley Square
|
Denver-Aurora
|
CO
|
1999
|
1978
|
—
|
116
|
100.0%
|
11.05
|
King Soopers
|
|||||||||||
|
Centerplace of Greeley III Phase I
|
Greeley
|
CO
|
2007
|
2007
|
—
|
119
|
64.7%
|
13.70
|
--
|
|||||||||||
26
|
|
||||||||||||||||||||
|
Property Name
|
(1)
CBSA
|
State
|
(2)
Owner-ship Interest
|
Year Acquired
|
Year Constructed or Last Major Renovation
|
Mortgages or Encumbrances (in 000's)
|
Gross Leasable Area
(GLA) (in 000's)
|
(3)
Percent Leased
|
(4)
Average Base Rent (Per Sq Ft)
|
(5)
Grocer(s) & Major Tenant(s) >35,000 SFT
|
||||||||||
|
Cherrywood Square
|
Denver-Aurora
|
CO
|
40%
|
2005
|
1978
|
4,302
|
97
|
97.8%
|
9.88
|
King Soopers
|
||||||||||
|
Crossroads Commons
|
Boulder
|
CO
|
20%
|
2001
|
1986
|
16,501
|
143
|
100.0%
|
26.95
|
Whole Foods
|
||||||||||
|
Falcon Marketplace
|
Colorado Springs
|
CO
|
2005
|
2005
|
—
|
22
|
93.8%
|
21.83
|
(Wal-Mart)
|
|||||||||||
|
Hilltop Village
|
Denver-Aurora
|
CO
|
2002
|
2003
|
—
|
100
|
91.1%
|
9.38
|
King Soopers
|
|||||||||||
|
Kent Place
|
Denver-Aurora
|
CO
|
50%
|
2011
|
2011
|
8,250
|
48
|
100.0%
|
19.49
|
King Soopers
|
||||||||||
|
Littleton Square
|
Denver-Aurora
|
CO
|
1999
|
1997
|
—
|
99
|
100.0%
|
10.46
|
King Soopers
|
|||||||||||
|
Lloyd King Center
|
Denver-Aurora
|
CO
|
1998
|
1998
|
—
|
83
|
96.9%
|
11.83
|
King Soopers
|
|||||||||||
|
Marketplace at Briargate
|
Colorado Springs
|
CO
|
2006
|
2006
|
—
|
29
|
91.8%
|
30.11
|
(King Soopers)
|
|||||||||||
|
Monument Jackson Creek
|
Colorado Springs
|
CO
|
1998
|
1999
|
—
|
85
|
100.0%
|
11.73
|
King Soopers
|
|||||||||||
|
Ralston Square Shopping Center
|
Denver-Aurora
|
CO
|
40%
|
2005
|
1977
|
4,302
|
83
|
100.0%
|
11.01
|
King Soopers
|
||||||||||
|
Shops at Quail Creek
|
Denver-Aurora
|
CO
|
2008
|
2008
|
—
|
38
|
96.5%
|
28.01
|
(King Soopers)
|
|||||||||||
|
Stroh Ranch
|
Denver-Aurora
|
CO
|
1998
|
1998
|
—
|
93
|
98.5%
|
12.71
|
King Soopers
|
|||||||||||
|
Woodmen Plaza
|
Colorado Springs
|
CO
|
1998
|
1998
|
—
|
116
|
94.1%
|
13.05
|
King Soopers
|
|||||||||||
|
Black Rock
|
Bridgeport-Stamford-Norwalk
|
CT
|
80%
|
2014
|
1996
|
20,000
|
98
|
97.8%
|
32.14
|
--
|
||||||||||
|
Brick Walk
(6)
|
Bridgeport-Stamford-Norwalk
|
CT
|
80%
|
2014
|
2007
|
33,000
|
124
|
90.5%
|
44.57
|
--
|
||||||||||
|
Corbin's Corner
|
Hartford-West Hartford-East Hartford
|
CT
|
40%
|
2005
|
1962
|
39,532
|
186
|
94.8%
|
26.39
|
Trader Joe's, Toys "R" Us, Best Buy
|
||||||||||
|
Fairfield Center
(6)
|
Bridgeport-Stamford-Norwalk
|
CT
|
80%
|
2014
|
2000
|
—
|
94
|
97.0%
|
33.94
|
--
|
||||||||||
|
Shops at The Columbia
|
Washington-Arlington-Alexandria
|
DC
|
25%
|
2006
|
2006
|
—
|
23
|
100.0%
|
40.51
|
Trader Joe's
|
||||||||||
|
Spring Valley Shopping Center
|
Washington-Arlington-Alexandria
|
DC
|
40%
|
2005
|
1930
|
12,530
|
17
|
100.0%
|
91.76
|
--
|
||||||||||
|
Pike Creek
|
Philadelphia-Camden-Wilmington
|
DE
|
1998
|
1981
|
—
|
232
|
93.6%
|
14.20
|
Acme Markets, K-Mart
|
|||||||||||
|
Shoppes of Graylyn
|
Philadelphia-Camden-Wilmington
|
DE
|
40%
|
2005
|
1971
|
—
|
64
|
92.6%
|
23.46
|
--
|
||||||||||
|
Anastasia Plaza
|
Jacksonville
|
FL
|
1993
|
1988
|
—
|
102
|
98.4%
|
13.06
|
Publix
|
|||||||||||
|
Aventura Shopping Center
|
Miami-Fort Lauderdale-Miami Beach
|
FL
|
1994
|
1974
|
—
|
95
|
84.8%
|
32.49
|
Publix
|
|||||||||||
|
Berkshire Commons
|
Naples-Marco Island
|
FL
|
1994
|
1992
|
7,500
|
110
|
96.9%
|
13.76
|
Publix
|
|||||||||||
|
Bloomingdale Square
|
Tampa-St. Petersburg-Clearwater
|
FL
|
1998
|
1987
|
—
|
268
|
64.5%
|
12.78
|
Publix, Bealls
|
|||||||||||
|
Boynton Lakes Plaza
|
Miami-Fort Lauderdale-Miami Beach
|
FL
|
1997
|
1993
|
—
|
110
|
94.9%
|
15.89
|
Publix
|
|||||||||||
|
Brooklyn Station on Riverside (fka Shoppes on Riverside)
|
Jacksonville
|
FL
|
2013
|
2013
|
—
|
50
|
97.2%
|
25.52
|
The Fresh Market
|
|||||||||||
|
Caligo Crossing
|
Miami-Fort Lauderdale-Miami Beach
|
FL
|
2007
|
2007
|
—
|
11
|
100.0%
|
46.84
|
(Kohl's)
|
|||||||||||
|
Carriage Gate
|
Tallahassee
|
FL
|
1994
|
1978
|
—
|
74
|
86.6%
|
21.40
|
Trader Joe's
|
|||||||||||
|
Chasewood Plaza
|
Miami-Fort Lauderdale-Miami Beach
|
FL
|
1993
|
1986
|
—
|
151
|
100.0%
|
24.76
|
Publix
|
|||||||||||
|
Corkscrew Village
|
Cape Coral-Fort Myers
|
FL
|
2007
|
1997
|
7,343
|
82
|
97.0%
|
13.55
|
Publix
|
|||||||||||
|
Courtyard Shopping Center
|
Jacksonville
|
FL
|
1993
|
1987
|
—
|
137
|
100.0%
|
3.50
|
(Publix), Target
|
|||||||||||
|
Fleming Island
|
Jacksonville
|
FL
|
1998
|
2000
|
—
|
132
|
99.3%
|
15.09
|
Publix, (Target)
|
|||||||||||
|
Fountain Square
|
Miami-Fort Lauderdale-Miami Beach
|
FL
|
2013
|
2013
|
—
|
177
|
96.4%
|
25.55
|
Publix, (Target)
|
|||||||||||
|
Garden Square
|
Miami-Fort Lauderdale-Miami Beach
|
FL
|
1997
|
1991
|
—
|
90
|
100.0%
|
16.72
|
Publix
|
|||||||||||
|
Grande Oak
|
Cape Coral-Fort Myers
|
FL
|
2000
|
2000
|
—
|
79
|
98.2%
|
15.29
|
Publix
|
|||||||||||
|
Hibernia Pavilion
|
Jacksonville
|
FL
|
2006
|
2006
|
—
|
51
|
89.6%
|
15.81
|
Publix
|
|||||||||||
27
|
|
||||||||||||||||||||
|
Property Name
|
(1)
CBSA
|
State
|
(2)
Owner-ship Interest
|
Year Acquired
|
Year Constructed or Last Major Renovation
|
Mortgages or Encumbrances (in 000's)
|
Gross Leasable Area
(GLA) (in 000's)
|
(3)
Percent Leased
|
(4)
Average Base Rent (Per Sq Ft)
|
(5)
Grocer(s) & Major Tenant(s) >35,000 SFT
|
||||||||||
|
John's Creek Center
|
Jacksonville
|
FL
|
20%
|
2003
|
2004
|
9,000
|
75
|
100.0%
|
14.63
|
Publix
|
||||||||||
|
Julington Village
|
Jacksonville
|
FL
|
20%
|
1999
|
1999
|
9,500
|
82
|
98.0%
|
15.35
|
Publix
|
||||||||||
|
Marketplace Shopping Center
|
Tampa-St. Petersburg-Clearwater
|
FL
|
1995
|
1983
|
—
|
90
|
88.8%
|
19.53
|
LA Fitness
|
|||||||||||
|
Millhopper Shopping Center
|
Gainesville
|
FL
|
1993
|
1974
|
—
|
76
|
100.0%
|
16.47
|
Publix
|
|||||||||||
|
Naples Walk Shopping Center
|
Naples-Marco Island
|
FL
|
2007
|
1999
|
—
|
125
|
93.9%
|
15.90
|
Publix
|
|||||||||||
|
Newberry Square
|
Gainesville
|
FL
|
1994
|
1986
|
—
|
181
|
83.3%
|
7.12
|
Publix, K-Mart
|
|||||||||||
|
Nocatee Town Center
|
Jacksonville
|
FL
|
2007
|
2007
|
—
|
107
|
89.6%
|
17.80
|
Publix
|
|||||||||||
|
Northgate Square
|
Tampa-St. Petersburg-Clearwater
|
FL
|
2007
|
1995
|
—
|
75
|
98.2%
|
14.14
|
Publix
|
|||||||||||
|
Oakleaf Commons
|
Jacksonville
|
FL
|
2006
|
2006
|
—
|
74
|
90.5%
|
14.14
|
Publix
|
|||||||||||
|
Ocala Corners
(6)
|
Tallahassee
|
FL
|
2000
|
2000
|
4,615
|
87
|
100.0%
|
13.74
|
Publix
|
|||||||||||
|
Old St Augustine Plaza
|
Jacksonville
|
FL
|
1996
|
1990
|
—
|
256
|
100.0%
|
9.77
|
Publix, Burlington Coat Factory, Hobby Lobby
|
|||||||||||
|
Pebblebrook Plaza
|
Naples-Marco Island
|
FL
|
50%
|
2000
|
2000
|
—
|
77
|
100.0%
|
14.58
|
Publix
|
||||||||||
|
Pine Tree Plaza
|
Jacksonville
|
FL
|
1997
|
1999
|
—
|
63
|
90.7%
|
13.58
|
Publix
|
|||||||||||
|
Plaza Venezia
|
Orlando
|
FL
|
20%
|
2016
|
2000
|
36,500
|
202
|
95.1%
|
25.61
|
Publix
|
||||||||||
|
Regency Square
|
Tampa-St. Petersburg-Clearwater
|
FL
|
1993
|
1986
|
—
|
352
|
95.9%
|
16.74
|
AMC Theater, Michaels, (Best Buy), (Macdill)
|
|||||||||||
|
Seminole Shoppes
|
Jacksonville
|
FL
|
50%
|
2009
|
2009
|
9,430
|
77
|
100.0%
|
22.04
|
Publix
|
||||||||||
|
Shoppes @ 104
|
Miami-Fort Lauderdale-Miami Beach
|
FL
|
1998
|
1990
|
—
|
108
|
97.4%
|
16.98
|
Winn-Dixie
|
|||||||||||
|
Shoppes at Bartram Park
|
Jacksonville
|
FL
|
50%
|
2005
|
2004
|
—
|
126
|
100.0%
|
19.13
|
Publix, (Kohl's)
|
||||||||||
|
Shops at John's Creek
|
Jacksonville
|
FL
|
2003
|
2004
|
—
|
15
|
100.0%
|
20.78
|
--
|
|||||||||||
|
Starke
(6)
|
Other
|
FL
|
2000
|
2000
|
—
|
13
|
100.0%
|
25.56
|
--
|
|||||||||||
|
Suncoast Crossing
(6)
|
Tampa-St. Petersburg-Clearwater
|
FL
|
2007
|
2007
|
—
|
118
|
92.0%
|
6.14
|
Kohl's, (Target)
|
|||||||||||
|
Town Square
|
Tampa-St. Petersburg-Clearwater
|
FL
|
1997
|
1999
|
—
|
44
|
100.0%
|
29.32
|
--
|
|||||||||||
|
University Commons
(6)
|
Miami-Fort Lauderdale-Miami Beach
|
FL
|
2015
|
2001
|
37,532
|
180
|
100.0%
|
31.11
|
Whole Foods, Nordstrom Rack
|
|||||||||||
|
Village Center
|
Tampa-St. Petersburg-Clearwater
|
FL
|
1995
|
1993
|
—
|
187
|
99.9%
|
19.24
|
Publix
|
|||||||||||
|
Welleby Plaza
|
Miami-Fort Lauderdale-Miami Beach
|
FL
|
1996
|
1982
|
—
|
110
|
91.0%
|
12.54
|
Publix
|
|||||||||||
|
Wellington Town Square
|
Miami-Fort Lauderdale-Miami Beach
|
FL
|
1996
|
1982
|
12,800
|
107
|
94.0%
|
21.84
|
Publix
|
|||||||||||
|
Westchase
|
Tampa-St. Petersburg-Clearwater
|
FL
|
2007
|
1998
|
6,623
|
79
|
98.5%
|
15.49
|
Publix
|
|||||||||||
|
Willa Springs
|
Orlando
|
FL
|
20%
|
2000
|
2000
|
—
|
90
|
100.0%
|
19.99
|
Publix
|
||||||||||
|
Ashford Place
|
Atlanta-Sandy Springs-Marietta
|
GA
|
1997
|
1993
|
—
|
53
|
100.0%
|
20.87
|
--
|
|||||||||||
|
Briarcliff La Vista
|
Atlanta-Sandy Springs-Marietta
|
GA
|
1997
|
1962
|
—
|
39
|
100.0%
|
20.17
|
--
|
|||||||||||
|
Briarcliff Village
(6)
|
Atlanta-Sandy Springs-Marietta
|
GA
|
1997
|
1990
|
—
|
190
|
98.4%
|
16.01
|
Publix
|
|||||||||||
|
Brighten Park (fka Loehmanns Plaza Georgia)
|
Atlanta-Sandy Springs-Marietta
|
GA
|
1997
|
1986
|
—
|
138
|
97.8%
|
24.54
|
The Fresh Market
|
|||||||||||
|
Buckhead Court
|
Atlanta-Sandy Springs-Marietta
|
GA
|
1997
|
1984
|
—
|
48
|
100.0%
|
21.67
|
--
|
|||||||||||
|
Cambridge Square
|
Atlanta-Sandy Springs-Marietta
|
GA
|
1996
|
1979
|
—
|
71
|
100.0%
|
14.97
|
Kroger
|
|||||||||||
|
Cornerstone Square
|
Atlanta-Sandy Springs-Marietta
|
GA
|
1997
|
1990
|
—
|
80
|
87.6%
|
16.56
|
Aldi
|
|||||||||||
|
Delk Spectrum
|
Atlanta-Sandy Springs-Marietta
|
GA
|
1998
|
1991
|
—
|
99
|
93.8%
|
14.89
|
Publix
|
|||||||||||
28
|
|
||||||||||||||||||||
|
Property Name
|
(1)
CBSA
|
State
|
(2)
Owner-ship Interest
|
Year Acquired
|
Year Constructed or Last Major Renovation
|
Mortgages or Encumbrances (in 000's)
|
Gross Leasable Area
(GLA) (in 000's)
|
(3)
Percent Leased
|
(4)
Average Base Rent (Per Sq Ft)
|
(5)
Grocer(s) & Major Tenant(s) >35,000 SFT
|
||||||||||
|
Dunwoody Hall
|
Atlanta-Sandy Springs-Marietta
|
GA
|
20%
|
1997
|
1986
|
—
|
86
|
98.5%
|
17.60
|
Publix
|
||||||||||
|
Dunwoody Village
|
Atlanta-Sandy Springs-Marietta
|
GA
|
1997
|
1975
|
—
|
121
|
94.4%
|
18.78
|
The Fresh Market
|
|||||||||||
|
Howell Mill Village
(6)
|
Atlanta-Sandy Springs-Marietta
|
GA
|
2004
|
1984
|
—
|
92
|
98.6%
|
21.69
|
Publix
|
|||||||||||
|
Paces Ferry Plaza
(6)
|
Atlanta-Sandy Springs-Marietta
|
GA
|
1997
|
1987
|
—
|
65
|
75.7%
|
31.82
|
--
|
|||||||||||
|
Powers Ferry Square
|
Atlanta-Sandy Springs-Marietta
|
GA
|
1997
|
1987
|
—
|
101
|
74.3%
|
32.97
|
--
|
|||||||||||
|
Powers Ferry Village
|
Atlanta-Sandy Springs-Marietta
|
GA
|
1997
|
1994
|
—
|
79
|
100.0%
|
13.58
|
Publix
|
|||||||||||
|
Russell Ridge
|
Atlanta-Sandy Springs-Marietta
|
GA
|
1994
|
1995
|
—
|
101
|
98.6%
|
12.82
|
Kroger
|
|||||||||||
|
Sandy Springs
|
Atlanta-Sandy Springs-Marietta
|
GA
|
2012
|
2006
|
—
|
116
|
88.6%
|
21.56
|
Trader Joe's
|
|||||||||||
|
Civic Center Plaza
|
Chicago-Naperville-Joliet
|
IL
|
40%
|
2005
|
1989
|
22,000
|
265
|
98.1%
|
11.25
|
Super H Mart, Home Depot
|
||||||||||
|
Clybourn Commons
|
Chicago-Naperville-Joliet
|
IL
|
2014
|
1999
|
—
|
32
|
100.0%
|
36.95
|
--
|
|||||||||||
|
Glen Oak Plaza
|
Chicago-Naperville-Joliet
|
IL
|
2010
|
1967
|
—
|
63
|
95.2%
|
23.19
|
Trader Joe's
|
|||||||||||
|
Hinsdale
|
Chicago-Naperville-Joliet
|
IL
|
1998
|
1986
|
—
|
179
|
97.8%
|
15.10
|
Whole Foods
|
|||||||||||
|
Riverside Sq & River's Edge
|
Chicago-Naperville-Joliet
|
IL
|
40%
|
2005
|
1986
|
14,998
|
169
|
91.1%
|
16.04
|
Mariano's Fresh Market
|
||||||||||
|
Roscoe Square
|
Chicago-Naperville-Joliet
|
IL
|
40%
|
2005
|
1981
|
11,322
|
140
|
100.0%
|
20.49
|
Mariano's Fresh Market
|
||||||||||
|
Stonebrook Plaza Shopping Center
|
Chicago-Naperville-Joliet
|
IL
|
40%
|
2005
|
1984
|
8,006
|
96
|
90.8%
|
12.09
|
Jewel-Osco
|
||||||||||
|
Westchester Commons (fka Westbrook Commons)
|
Chicago-Naperville-Joliet
|
IL
|
2001
|
1984
|
—
|
139
|
97.6%
|
17.73
|
Mariano's Fresh Market
|
|||||||||||
|
Willow Festival
(6)
|
Chicago-Naperville-Joliet
|
IL
|
2010
|
2007
|
39,505
|
404
|
100.0%
|
16.94
|
Whole Foods, Lowe's
|
|||||||||||
|
Shops on Main
|
Chicago-Naperville-Joliet
|
IN
|
92%
|
2013
|
2013
|
—
|
254
|
97.9%
|
15.33
|
Whole Foods, Gordmans
|
||||||||||
|
Willow Lake Shopping Center
|
Indianapolis
|
IN
|
40%
|
2005
|
1987
|
—
|
86
|
100.0%
|
16.72
|
(Kroger)
|
||||||||||
|
Willow Lake West Shopping Center
|
Indianapolis
|
IN
|
40%
|
2005
|
2001
|
10,000
|
53
|
100.0%
|
24.94
|
Trader Joe's
|
||||||||||
|
Fellsway Plaza
(6)
|
Boston-Cambridge-Quincy
|
MA
|
75%
|
2013
|
1959
|
34,600
|
155
|
100.0%
|
22.69
|
Stop & Shop
|
||||||||||
|
Shops at Saugus
|
Boston-Cambridge-Quincy
|
MA
|
2006
|
2006
|
—
|
87
|
94.4%
|
28.86
|
Trader Joe's
|
|||||||||||
|
Twin City Plaza
|
Boston-Cambridge-Quincy
|
MA
|
2006
|
2004
|
—
|
274
|
93.2%
|
18.16
|
Shaw's, Marshall's
|
|||||||||||
|
Burnt Mills
(6)
|
Washington-Arlington-Alexandria
|
MD
|
20%
|
2013
|
2004
|
7,000
|
31
|
100.0%
|
38.25
|
Trader Joe's
|
||||||||||
|
Cloppers Mill Village
|
Washington-Arlington-Alexandria
|
MD
|
40%
|
2005
|
1995
|
—
|
137
|
92.5%
|
17.34
|
Shoppers Food Warehouse
|
||||||||||
|
Festival at Woodholme
|
Baltimore-Towson
|
MD
|
40%
|
2005
|
1986
|
20,838
|
81
|
95.4%
|
38.09
|
Trader Joe's
|
||||||||||
|
Firstfield Shopping Center
|
Washington-Arlington-Alexandria
|
MD
|
40%
|
2005
|
1978
|
—
|
22
|
95.5%
|
37.89
|
--
|
||||||||||
|
King Farm Village Center
|
Washington-Arlington-Alexandria
|
MD
|
25%
|
2004
|
2001
|
27,500
|
118
|
95.3%
|
26.04
|
Safeway
|
||||||||||
|
Parkville Shopping Center
|
Baltimore-Towson
|
MD
|
40%
|
2005
|
1961
|
11,559
|
163
|
92.5%
|
15.88
|
Giant Food
|
||||||||||
|
Southside Marketplace
|
Baltimore-Towson
|
MD
|
40%
|
2005
|
1990
|
14,366
|
125
|
96.0%
|
19.34
|
Shoppers Food Warehouse
|
||||||||||
|
Takoma Park
|
Washington-Arlington-Alexandria
|
MD
|
40%
|
2005
|
1960
|
—
|
104
|
100.0%
|
13.02
|
Shoppers Food Warehouse
|
||||||||||
|
Valley Centre
|
Baltimore-Towson
|
MD
|
40%
|
2005
|
1987
|
18,706
|
220
|
97.0%
|
15.77
|
Aldi, TJ Maxx
|
||||||||||
|
Village at Lee Airpark
(6)
|
Baltimore-Towson
|
MD
|
2005
|
2005
|
—
|
117
|
97.9%
|
28.13
|
Giant Food, (Sunrise)
|
|||||||||||
|
Watkins Park Plaza
|
Washington-Arlington-Alexandria
|
MD
|
40%
|
2005
|
1985
|
—
|
111
|
100.0%
|
25.45
|
LA Fitness
|
||||||||||
|
Woodmoor Shopping Center
|
Washington-Arlington-Alexandria
|
MD
|
40%
|
2005
|
1954
|
6,391
|
69
|
98.1%
|
29.71
|
--
|
||||||||||
|
Fenton Marketplace
|
Flint
|
MI
|
1999
|
1999
|
—
|
97
|
97.1%
|
7.88
|
Family Farm & Home
|
|||||||||||
29
|
|
||||||||||||||||||||
|
Property Name
|
(1)
CBSA
|
State
|
(2)
Owner-ship Interest
|
Year Acquired
|
Year Constructed or Last Major Renovation
|
Mortgages or Encumbrances (in 000's)
|
Gross Leasable Area
(GLA) (in 000's)
|
(3)
Percent Leased
|
(4)
Average Base Rent (Per Sq Ft)
|
(5)
Grocer(s) & Major Tenant(s) >35,000 SFT
|
||||||||||
|
Apple Valley Square
|
Minneapolis-St. Paul-Bloomington
|
MN
|
25%
|
2006
|
1998
|
—
|
185
|
99.0%
|
12.63
|
Rainbow Foods, Jo-Ann Fabrics, (Burlington Coat Factory)
|
||||||||||
|
Calhoun Commons
|
Minneapolis-St. Paul-Bloomington
|
MN
|
25%
|
2011
|
1999
|
2,282
|
66
|
100.0%
|
24.34
|
Whole Foods
|
||||||||||
|
Colonial Square
|
Minneapolis-St. Paul-Bloomington
|
MN
|
40%
|
2005
|
1959
|
9,633
|
93
|
97.4%
|
22.38
|
Lund's
|
||||||||||
|
Rockford Road Plaza
|
Minneapolis-St. Paul-Bloomington
|
MN
|
40%
|
2005
|
1991
|
20,000
|
204
|
100.0%
|
12.38
|
Kohl's
|
||||||||||
|
Rockridge Center
|
Minneapolis-St. Paul-Bloomington
|
MN
|
20%
|
2011
|
2006
|
14,500
|
125
|
96.0%
|
13.15
|
Cub Foods
|
||||||||||
|
Brentwood Plaza
|
St. Louis
|
MO
|
2007
|
2002
|
—
|
60
|
100.0%
|
10.48
|
Schnucks
|
|||||||||||
|
Bridgeton
|
St. Louis
|
MO
|
2007
|
2005
|
—
|
71
|
97.3%
|
11.93
|
Schnucks, (Home Depot)
|
|||||||||||
|
Dardenne Crossing
|
St. Louis
|
MO
|
2007
|
1996
|
—
|
67
|
100.0%
|
10.85
|
Schnucks
|
|||||||||||
|
Kirkwood Commons
|
St. Louis
|
MO
|
2007
|
2000
|
9,978
|
210
|
100.0%
|
9.97
|
Wal-Mart, (Target), (Lowe's)
|
|||||||||||
|
Cameron Village
|
Raleigh-Cary
|
NC
|
30%
|
2004
|
1949
|
60,000
|
558
|
91.6%
|
21.75
|
Harris Teeter, The Fresh Market
|
||||||||||
|
Carmel Commons
|
Charlotte-Gastonia-Concord
|
NC
|
1997
|
1979
|
—
|
133
|
99.2%
|
19.72
|
The Fresh Market
|
|||||||||||
|
Cochran Commons
|
Charlotte-Gastonia-Concord
|
NC
|
20%
|
2007
|
2003
|
5,250
|
66
|
98.2%
|
16.26
|
Harris Teeter
|
||||||||||
|
Colonnade Center
|
Raleigh-Cary
|
NC
|
2009
|
2009
|
—
|
58
|
100.0%
|
27.19
|
Whole Foods
|
|||||||||||
|
Glenwood Village
|
Raleigh-Cary
|
NC
|
1997
|
1983
|
—
|
43
|
100.0%
|
15.34
|
Harris Teeter
|
|||||||||||
|
Harris Crossing
|
Raleigh-Cary
|
NC
|
2007
|
2007
|
—
|
65
|
92.9%
|
8.54
|
Harris Teeter
|
|||||||||||
|
Holly Park
|
Raleigh-Cary
|
NC
|
99%
|
2013
|
1969
|
—
|
160
|
93.3%
|
15.32
|
Trader Joe's
|
||||||||||
|
Lake Pine Plaza
|
Raleigh-Cary
|
NC
|
1998
|
1997
|
—
|
88
|
100.0%
|
12.35
|
Kroger
|
|||||||||||
|
Maynard Crossing
|
Raleigh-Cary
|
NC
|
20%
|
1998
|
1997
|
—
|
123
|
98.9%
|
15.32
|
Kroger
|
||||||||||
|
Phillips Place
|
Charlotte-Gastonia-Concord
|
NC
|
50%
|
2012
|
2005
|
40,000
|
133
|
96.9%
|
32.29
|
Dean & Deluca
|
||||||||||
|
Providence Commons
|
Charlotte-Gastonia-Concord
|
NC
|
25%
|
2010
|
1994
|
—
|
74
|
100.0%
|
18.20
|
Harris Teeter
|
||||||||||
|
Shoppes of Kildaire
|
Raleigh-Cary
|
NC
|
40%
|
2005
|
1986
|
20,000
|
145
|
98.6%
|
17.91
|
Trader Joe's
|
||||||||||
|
Shops at Erwin Mill (fka Erwin Square)
|
Durham-Chapel Hill
|
NC
|
55%
|
2012
|
2012
|
10,000
|
87
|
97.2%
|
16.97
|
Harris Teeter
|
||||||||||
|
Southpoint Crossing
|
Durham-Chapel Hill
|
NC
|
1998
|
1998
|
—
|
103
|
93.9%
|
15.52
|
Kroger
|
|||||||||||
|
Sutton Square
|
Raleigh-Cary
|
NC
|
20%
|
2006
|
1985
|
—
|
101
|
98.7%
|
18.79
|
The Fresh Market
|
||||||||||
|
Village Plaza
|
Durham-Chapel Hill
|
NC
|
20%
|
2012
|
1975
|
8,000
|
75
|
96.8%
|
16.89
|
Whole Foods
|
||||||||||
|
Willow Oaks
(7)
|
Charlotte-Gastonia-Concord
|
NC
|
2014
|
2014
|
—
|
69
|
92.9%
|
16.68
|
Publix
|
|||||||||||
|
Woodcroft Shopping Center
|
Durham-Chapel Hill
|
NC
|
1996
|
1984
|
—
|
90
|
95.7%
|
12.67
|
Food Lion
|
|||||||||||
|
Chimney Rock Crossing
(7)
|
New York-Northern New Jersey-Long Island
|
NJ
|
2016
|
2016
|
—
|
218
|
65.9%
|
29.73
|
Whole Foods, Nordstrom Rack
|
|||||||||||
|
Haddon Commons
|
Philadelphia-Camden-Wilmington
|
NJ
|
40%
|
2005
|
1985
|
—
|
54
|
100.0%
|
13.67
|
Acme Markets
|
||||||||||
|
Plaza Square
|
New York-Northern New Jersey-Long Island
|
NJ
|
40%
|
2005
|
1990
|
13,375
|
104
|
100.0%
|
22.45
|
Shop Rite
|
||||||||||
|
Garden City Park
|
New York-Northern New Jersey-Long Island
|
NY
|
2016
|
1965
|
—
|
105
|
96.4%
|
19.55
|
King Kullen
|
|||||||||||
|
Lake Grove Commons
|
New York-Northern New Jersey-Long Island
|
NY
|
40%
|
2012
|
2008
|
31,294
|
141
|
100.0%
|
32.78
|
Whole Foods, LA Fitness
|
||||||||||
|
Cherry Grove
|
Cincinnati-Middletown
|
OH
|
1998
|
1997
|
—
|
196
|
92.3%
|
11.88
|
Kroger
|
|||||||||||
|
East Pointe
|
Columbus
|
OH
|
1998
|
1993
|
—
|
107
|
98.7%
|
9.82
|
Kroger
|
|||||||||||
30
|
|
||||||||||||||||||||
|
Property Name
|
(1)
CBSA
|
State
|
(2)
Owner-ship Interest
|
Year Acquired
|
Year Constructed or Last Major Renovation
|
Mortgages or Encumbrances (in 000's)
|
Gross Leasable Area
(GLA) (in 000's)
|
(3)
Percent Leased
|
(4)
Average Base Rent (Per Sq Ft)
|
(5)
Grocer(s) & Major Tenant(s) >35,000 SFT
|
||||||||||
|
Hyde Park
|
Cincinnati-Middletown
|
OH
|
1997
|
1995
|
—
|
397
|
99.3%
|
15.63
|
Kroger, Remke Markets
|
|||||||||||
|
Kroger New Albany Center
|
Columbus
|
OH
|
50%
|
1999
|
1999
|
—
|
93
|
100.0%
|
11.98
|
Kroger
|
||||||||||
|
Maxtown Road (Northgate)
|
Columbus
|
OH
|
1998
|
1996
|
—
|
105
|
100.0%
|
12.62
|
Kroger, (Home Depot)
|
|||||||||||
|
Red Bank Village
|
Cincinnati-Middletown
|
OH
|
2006
|
2006
|
—
|
164
|
100.0%
|
6.53
|
Wal-Mart
|
|||||||||||
|
Regency Commons
|
Cincinnati-Middletown
|
OH
|
2004
|
2004
|
—
|
34
|
100.0%
|
22.83
|
--
|
|||||||||||
|
Westchester Plaza
|
Cincinnati-Middletown
|
OH
|
1998
|
1988
|
—
|
88
|
100.0%
|
9.68
|
Kroger
|
|||||||||||
|
Corvallis Market Center
|
Corvallis
|
OR
|
2006
|
2006
|
—
|
85
|
100.0%
|
20.08
|
Trader Joe's
|
|||||||||||
|
Greenway Town Center
|
Portland-Vancouver-Beaverton
|
OR
|
40%
|
2005
|
1979
|
—
|
93
|
94.7%
|
13.62
|
Whole Foods
|
||||||||||
|
Murrayhill Marketplace
|
Portland-Vancouver-Beaverton
|
OR
|
1999
|
1988
|
—
|
150
|
85.9%
|
16.03
|
Safeway
|
|||||||||||
|
Northgate Marketplace
|
Medford
|
OR
|
2011
|
2011
|
—
|
81
|
100.0%
|
21.68
|
Trader Joe's
|
|||||||||||
|
Northgate Marketplace Ph II
(7)
|
Medford
|
OR
|
2015
|
2015
|
—
|
177
|
90.9%
|
14.68
|
Dick's Sporting Goods
|
|||||||||||
|
Sherwood Crossroads
|
Portland-Vancouver-Beaverton
|
OR
|
1999
|
1999
|
—
|
88
|
93.8%
|
10.86
|
Safeway
|
|||||||||||
|
Tanasbourne Market
(6)
|
Portland-Vancouver-Beaverton
|
OR
|
2006
|
2006
|
—
|
71
|
100.0%
|
27.53
|
Whole Foods
|
|||||||||||
|
Walker Center
|
Portland-Vancouver-Beaverton
|
OR
|
1999
|
1987
|
—
|
90
|
92.4%
|
20.32
|
Bed Bath and Beyond
|
|||||||||||
|
Allen Street Shopping Center
|
Allentown-Bethlehem-Easton
|
PA
|
40%
|
2005
|
1958
|
—
|
46
|
100.0%
|
14.44
|
Ahart's Market
|
||||||||||
|
City Avenue Shopping Center
|
Philadelphia-Camden-Wilmington
|
PA
|
40%
|
2005
|
1960
|
—
|
162
|
89.6%
|
19.23
|
Ross Dress for Less
|
||||||||||
|
Gateway Shopping Center
|
Philadelphia-Camden-Wilmington
|
PA
|
2004
|
1960
|
—
|
221
|
94.8%
|
29.40
|
Trader Joe's
|
|||||||||||
|
Hershey
(6)
|
Harrisburg-Carlisle
|
PA
|
2000
|
2000
|
—
|
6
|
100.0%
|
28.00
|
--
|
|||||||||||
|
Lower Nazareth Commons
|
Allentown-Bethlehem-Easton
|
PA
|
2007
|
2007
|
—
|
90
|
94.2%
|
24.31
|
(Wegmans), (Target)
|
|||||||||||
|
Mercer Square Shopping Center
|
Philadelphia-Camden-Wilmington
|
PA
|
40%
|
2005
|
1988
|
10,849
|
91
|
95.9%
|
22.60
|
Weis Markets
|
||||||||||
|
Newtown Square Shopping Center
|
Philadelphia-Camden-Wilmington
|
PA
|
40%
|
2005
|
1970
|
10,662
|
143
|
84.3%
|
17.80
|
Acme Markets
|
||||||||||
|
Stefko Boulevard Shopping Center
|
Allentown-Bethlehem-Easton
|
PA
|
40%
|
2005
|
1976
|
—
|
134
|
93.9%
|
7.89
|
Valley Farm Market
|
||||||||||
|
Warwick Square Shopping Center
|
Philadelphia-Camden-Wilmington
|
PA
|
40%
|
2005
|
1999
|
9,540
|
90
|
95.1%
|
20.56
|
Giant Food
|
||||||||||
|
Merchants Village
|
Charleston-North Charleston
|
SC
|
40%
|
1997
|
1997
|
9,000
|
80
|
100.0%
|
15.70
|
Publix
|
||||||||||
|
Harpeth Village Fieldstone
|
Nashville-Davidson--Murfreesboro
|
TN
|
1997
|
1998
|
—
|
70
|
100.0%
|
14.65
|
Publix
|
|||||||||||
|
Northlake Village
|
Nashville-Davidson--Murfreesboro
|
TN
|
2000
|
1988
|
—
|
138
|
91.5%
|
13.23
|
Kroger
|
|||||||||||
|
Peartree Village
|
Nashville-Davidson--Murfreesboro
|
TN
|
1997
|
1997
|
6,153
|
110
|
100.0%
|
18.32
|
Harris Teeter
|
|||||||||||
|
Alden Bridge
|
Houston-Baytown-Sugar Land
|
TX
|
20%
|
2002
|
1998
|
—
|
139
|
100.0%
|
19.70
|
Kroger
|
||||||||||
|
Bethany Park Place
|
Dallas-Fort Worth-Arlington
|
TX
|
20%
|
1998
|
1998
|
—
|
99
|
100.0%
|
11.63
|
Kroger
|
||||||||||
|
CityLine Market
|
Dallas-Fort Worth-Arlington
|
TX
|
2014
|
2014
|
—
|
81
|
100.0%
|
26.57
|
Whole Foods
|
|||||||||||
|
CityLine Market Phase II
|
Dallas-Fort Worth-Arlington
|
TX
|
2014
|
2015
|
—
|
22
|
100.0%
|
25.88
|
--
|
|||||||||||
|
Cochran's Crossing
|
Houston-Baytown-Sugar Land
|
TX
|
2002
|
1994
|
—
|
138
|
94.1%
|
17.77
|
Kroger
|
|||||||||||
|
Hancock
|
Austin-Round Rock
|
TX
|
1999
|
1998
|
—
|
410
|
98.0%
|
14.86
|
H.E.B., Sears
|
|||||||||||
|
Hickory Creek Plaza
|
Dallas-Fort Worth-Arlington
|
TX
|
2006
|
2006
|
—
|
28
|
100.0%
|
25.51
|
(Kroger)
|
|||||||||||
|
Hillcrest Village
|
Dallas-Fort Worth-Arlington
|
TX
|
1999
|
1991
|
—
|
15
|
100.0%
|
45.81
|
--
|
|||||||||||
|
Indian Springs Center
|
Houston-Baytown-Sugar Land
|
TX
|
2002
|
2003
|
—
|
137
|
100.0%
|
23.76
|
H.E.B.
|
|||||||||||
|
Keller Town Center
|
Dallas-Fort Worth-Arlington
|
TX
|
1999
|
1999
|
—
|
120
|
96.9%
|
15.31
|
Tom Thumb
|
|||||||||||
31
|
|
||||||||||||||||||||
|
Property Name
|
(1)
CBSA
|
State
|
(2)
Owner-ship Interest
|
Year Acquired
|
Year Constructed or Last Major Renovation
|
Mortgages or Encumbrances (in 000's)
|
Gross Leasable Area
(GLA) (in 000's)
|
(3)
Percent Leased
|
(4)
Average Base Rent (Per Sq Ft)
|
(5)
Grocer(s) & Major Tenant(s) >35,000 SFT
|
||||||||||
|
Lebanon/Legacy Center
|
Dallas-Fort Worth-Arlington
|
TX
|
2000
|
2002
|
—
|
56
|
100.0%
|
24.01
|
(Wal-Mart)
|
|||||||||||
|
Market at Preston Forest
|
Dallas-Fort Worth-Arlington
|
TX
|
1999
|
1990
|
—
|
96
|
100.0%
|
20.35
|
Tom Thumb
|
|||||||||||
|
Market at Round Rock
|
Austin-Round Rock
|
TX
|
1999
|
1987
|
—
|
123
|
100.0%
|
17.31
|
Sprout's Markets
|
|||||||||||
|
Market at Springwoods Village
(7)
|
Houston-Baytown-Sugar Land
|
TX
|
53%
|
2016
|
2016
|
—
|
167
|
81.5%
|
11.81
|
Kroger
|
||||||||||
|
Mockingbird Common
|
Dallas-Fort Worth-Arlington
|
TX
|
1999
|
1987
|
10,300
|
120
|
95.0%
|
16.86
|
Tom Thumb
|
|||||||||||
|
North Hills
|
Austin-Round Rock
|
TX
|
1999
|
1995
|
—
|
144
|
98.7%
|
22.16
|
H.E.B.
|
|||||||||||
|
Panther Creek
|
Houston-Baytown-Sugar Land
|
TX
|
2002
|
1994
|
—
|
166
|
100.0%
|
19.31
|
Randall's Food
|
|||||||||||
|
Preston Oaks
(6)
|
Dallas-Fort Worth-Arlington
|
TX
|
2013
|
1991
|
—
|
104
|
94.8%
|
31.28
|
H.E.B. Central Market
|
|||||||||||
|
Prestonbrook
|
Dallas-Fort Worth-Arlington
|
TX
|
1998
|
1998
|
6,800
|
92
|
100.0%
|
14.04
|
Kroger
|
|||||||||||
|
Shiloh Springs
|
Dallas-Fort Worth-Arlington
|
TX
|
20%
|
1998
|
1998
|
—
|
110
|
92.4%
|
14.21
|
Kroger
|
||||||||||
|
Shops at Mira Vista
|
Austin-Round Rock
|
TX
|
2014
|
2002
|
242
|
68
|
100.0%
|
21.58
|
Trader Joe's
|
|||||||||||
|
Southpark at Cinco Ranch
|
Houston-Baytown-Sugar Land
|
TX
|
2012
|
2012
|
—
|
265
|
99.2%
|
13.04
|
Kroger, Academy Sports
|
|||||||||||
|
Sterling Ridge
|
Houston-Baytown-Sugar Land
|
TX
|
2002
|
2000
|
13,900
|
129
|
100.0%
|
20.38
|
Kroger
|
|||||||||||
|
Sweetwater Plaza
|
Houston-Baytown-Sugar Land
|
TX
|
20%
|
2001
|
2000
|
10,897
|
135
|
97.5%
|
16.88
|
Kroger
|
||||||||||
|
Tech Ridge Center
|
Austin-Round Rock
|
TX
|
2011
|
2001
|
7,784
|
185
|
98.8%
|
23.05
|
H.E.B.
|
|||||||||||
|
The Village at Riverstone
(7)
|
Houston-Baytown-Sugar Land
|
TX
|
2016
|
2016
|
—
|
165
|
72.3%
|
9.97
|
Kroger
|
|||||||||||
|
Weslayan Plaza East
|
Houston-Baytown-Sugar Land
|
TX
|
40%
|
2005
|
1969
|
—
|
168
|
100.0%
|
19.44
|
Berings
|
||||||||||
|
Weslayan Plaza West
|
Houston-Baytown-Sugar Land
|
TX
|
40%
|
2005
|
1969
|
37,865
|
186
|
98.9%
|
19.25
|
Randall's Food
|
||||||||||
|
Westwood Village
|
Houston-Baytown-Sugar Land
|
TX
|
2006
|
2006
|
—
|
184
|
96.7%
|
18.42
|
(Target)
|
|||||||||||
|
Woodway Collection
|
Houston-Baytown-Sugar Land
|
TX
|
40%
|
2005
|
1974
|
8,683
|
97
|
98.8%
|
27.53
|
Whole Foods
|
||||||||||
|
Ashburn Farm Market Center
|
Washington-Arlington-Alexandria
|
VA
|
2000
|
2000
|
—
|
92
|
98.8%
|
25.31
|
Giant Food
|
|||||||||||
|
Ashburn Farm Village Center
|
Washington-Arlington-Alexandria
|
VA
|
40%
|
2005
|
1996
|
—
|
89
|
97.3%
|
13.99
|
Shoppers Food Warehouse
|
||||||||||
|
Belmont Chase
|
Washington-Arlington-Alexandria
|
VA
|
2014
|
2014
|
—
|
91
|
100.0%
|
30.32
|
Whole Foods
|
|||||||||||
|
Braemar Shopping Center
|
Washington-Arlington-Alexandria
|
VA
|
25%
|
2004
|
2004
|
11,231
|
96
|
97.9%
|
21.63
|
Safeway
|
||||||||||
|
Centre Ridge Marketplace
|
Washington-Arlington-Alexandria
|
VA
|
40%
|
2005
|
1996
|
13,284
|
104
|
95.7%
|
17.86
|
Shoppers Food Warehouse
|
||||||||||
|
Culpeper Colonnade
|
Culpeper
|
VA
|
2006
|
2006
|
—
|
171
|
98.8%
|
15.13
|
Martin's, Dick's Sporting Goods, (Target)
|
|||||||||||
|
Fairfax Shopping Center
|
Washington-Arlington-Alexandria
|
VA
|
2007
|
1955
|
—
|
68
|
58.7%
|
6.69
|
--
|
|||||||||||
|
Festival at Manchester Lakes
(6)
|
Washington-Arlington-Alexandria
|
VA
|
40%
|
2005
|
1990
|
22,915
|
169
|
100.0%
|
26.44
|
Shoppers Food Warehouse
|
||||||||||
|
Fox Mill Shopping Center
|
Washington-Arlington-Alexandria
|
VA
|
40%
|
2005
|
1977
|
15,955
|
103
|
100.0%
|
24.04
|
Giant Food
|
||||||||||
|
Gayton Crossing
|
Richmond
|
VA
|
40%
|
2005
|
1983
|
—
|
158
|
87.1%
|
15.11
|
Martin's, (Kroger)
|
||||||||||
|
Greenbriar Town Center
|
Washington-Arlington-Alexandria
|
VA
|
40%
|
2005
|
1972
|
49,664
|
340
|
97.7%
|
24.76
|
Giant Food
|
||||||||||
|
Hanover Village Shopping Center
|
Richmond
|
VA
|
40%
|
2005
|
1971
|
—
|
90
|
98.4%
|
9.00
|
Aldi
|
||||||||||
|
Hollymead Town Center
|
Charlottesville
|
VA
|
20%
|
2003
|
2004
|
25,000
|
154
|
93.8%
|
22.74
|
Harris Teeter, (Target)
|
||||||||||
|
Kamp Washington Shopping Center
|
Washington-Arlington-Alexandria
|
VA
|
40%
|
2005
|
1960
|
—
|
72
|
95.0%
|
38.11
|
Earth Fare
|
||||||||||
|
Kings Park Shopping Center
(6)
|
Washington-Arlington-Alexandria
|
VA
|
40%
|
2005
|
1966
|
13,482
|
93
|
100.0%
|
28.03
|
Giant Food
|
||||||||||
|
Lorton Station Marketplace
|
Washington-Arlington-Alexandria
|
VA
|
20%
|
2006
|
2005
|
9,875
|
132
|
90.5%
|
23.00
|
Shoppers Food Warehouse
|
||||||||||
|
Market Common Clarendon
|
Washington-Arlington-Alexandria
|
VA
|
2016
|
2001
|
—
|
393
|
71.5%
|
31.09
|
Whole Foods, Crate & Barrel
|
|||||||||||
32
|
|
||||||||||||||||||||
|
Property Name
|
(1)
CBSA
|
State
|
(2)
Owner-ship Interest
|
Year Acquired
|
Year Constructed or Last Major Renovation
|
Mortgages or Encumbrances (in 000's)
|
Gross Leasable Area
(GLA) (in 000's)
|
(3)
Percent Leased
|
(4)
Average Base Rent (Per Sq Ft)
|
(5)
Grocer(s) & Major Tenant(s) >35,000 SFT
|
||||||||||
|
Saratoga Shopping Center
|
Washington-Arlington-Alexandria
|
VA
|
40%
|
2005
|
1977
|
10,943
|
114
|
96.5%
|
19.35
|
Giant Food
|
||||||||||
|
Shops at County Center
|
Washington-Arlington-Alexandria
|
VA
|
2005
|
2005
|
—
|
97
|
91.6%
|
20.15
|
Harris Teeter
|
|||||||||||
|
Shops at Stonewall
|
Washington-Arlington-Alexandria
|
VA
|
2007
|
2011
|
—
|
321
|
99.1%
|
17.12
|
Wegmans, Dick's Sporting Goods
|
|||||||||||
|
Town Center at Sterling Shopping Center
|
Washington-Arlington-Alexandria
|
VA
|
40%
|
2005
|
1980
|
—
|
187
|
90.2%
|
19.49
|
Giant Food
|
||||||||||
|
Village Center at Dulles
|
Washington-Arlington-Alexandria
|
VA
|
20%
|
2002
|
1991
|
40,812
|
298
|
93.3%
|
25.72
|
Shoppers Food Warehouse, Gold's Gym
|
||||||||||
|
Village Shopping Center
|
Richmond
|
VA
|
40%
|
2005
|
1948
|
15,713
|
111
|
98.2%
|
23.04
|
Martin's
|
||||||||||
|
Willston Centre I
|
Washington-Arlington-Alexandria
|
VA
|
40%
|
2005
|
1952
|
—
|
105
|
89.1%
|
25.98
|
--
|
||||||||||
|
Willston Centre II
|
Washington-Arlington-Alexandria
|
VA
|
40%
|
2005
|
1986
|
27,000
|
136
|
96.1%
|
24.71
|
Safeway, (Target)
|
||||||||||
|
Aurora Marketplace
|
Seattle-Tacoma-Bellevue
|
WA
|
40%
|
2005
|
1991
|
11,395
|
107
|
92.3%
|
16.06
|
Safeway
|
||||||||||
|
Broadway Market
(6)
|
Seattle-Tacoma-Bellevue
|
WA
|
20%
|
2014
|
1988
|
21,500
|
140
|
96.0%
|
24.43
|
Quality Food Centers
|
||||||||||
|
Cascade Plaza
|
Seattle-Tacoma-Bellevue
|
WA
|
20%
|
1999
|
1999
|
14,181
|
215
|
92.6%
|
11.68
|
Safeway
|
||||||||||
|
Eastgate Plaza
|
Seattle-Tacoma-Bellevue
|
WA
|
40%
|
2005
|
1956
|
10,101
|
78
|
100.0%
|
24.24
|
Albertsons
|
||||||||||
|
Grand Ridge
|
Seattle-Tacoma-Bellevue
|
WA
|
2012
|
2012
|
10,931
|
326
|
100.0%
|
22.65
|
Safeway, Regal Cinemas
|
|||||||||||
|
Inglewood Plaza
|
Seattle-Tacoma-Bellevue
|
WA
|
1999
|
1985
|
—
|
17
|
100.0%
|
37.39
|
--
|
|||||||||||
|
Klahanie Shopping Center
|
Seattle-Tacoma-Bellevue
|
WA
|
2016
|
1998
|
—
|
67
|
93.3%
|
30.52
|
(QFC)
|
|||||||||||
|
Overlake Fashion Plaza
(6)
|
Seattle-Tacoma-Bellevue
|
WA
|
40%
|
2005
|
1987
|
11,850
|
81
|
100.0%
|
24.93
|
(Sears)
|
||||||||||
|
Pine Lake Village
|
Seattle-Tacoma-Bellevue
|
WA
|
1999
|
1989
|
—
|
103
|
100.0%
|
23.29
|
Quality Food Centers
|
|||||||||||
|
Sammamish-Highlands
|
Seattle-Tacoma-Bellevue
|
WA
|
1999
|
1992
|
—
|
101
|
100.0%
|
31.00
|
(Safeway)
|
|||||||||||
|
Southcenter
|
Seattle-Tacoma-Bellevue
|
WA
|
1999
|
1990
|
—
|
58
|
100.0%
|
28.66
|
(Target)
|
|||||||||||
|
Regency Centers Total
|
`
|
$1,787,217
|
37,831
|
95.4%
|
||||||||||||||||
(1)
CBSA refers to Core Based Statistical Area.
(2)
Represents our ownership interest in the property, if not wholly owned.
(3)
Includes properties where we have not yet incurred at least 90% of the expected costs to complete and 95% occupied or the anchor has not yet been open for at least two calendar years ("development properties" or "properties in development"). If development properties are excluded, the total percentage leased would be
96.0%
for our Combined Portfolio of shopping centers.
(4)
Average base rent PSF is calculated based on annual minimum contractual base rent per the tenant lease, excluding percentage rent and recovery revenue.
(5)
A retailer that supports our shopping center and in which we have no ownership is indicated by parentheses.
(6)
The ground underlying the building and improvements are not owned by Regency or its unconsolidated real estate partnerships, but is subject to a ground lease.
(7)
Property in development.
33
We are a party to various legal proceedings that arise in the ordinary course of our business. Except for the matter noted below, we are not currently involved in any litigation nor to our knowledge, is any litigation threatened against us, the outcome of which would, in our judgment based on information currently available to us, have a material adverse effect on our financial position or results of operations.
After the announcement of the merger agreement on November 14, 2016, a putative class action was filed on behalf of a purported stockholder in the Circuit Court for Duval County, Florida, under the following caption: Robert Garfield on Behalf of Himself and All Others Similarly Situated vs. Regency Centers Corporation, Martin E. Stein, Jr., John C. Schweitzer, Raymond L. Bank, Bryce Blair, C. Ronald Blankenship, J. Dix Druce, Jr., Mary Lou Fiala, David P. O'Connor, and Thomas G. Wattles, No. 16-2017-CA-000688-XXXX-MA, filed February 3, 2017.
The class action alleges, among other matters, that the definitive joint proxy statement/prospectus filed by Regency and Equity One with the Securities and Exchange Commission (the “SEC”) on January 24, 2017 (the “Joint Proxy Statement/Prospectus”) omitted certain material information in connection with the Merger. The complainant seeks various remedies, including injunctive relief to prevent the consummation of the Merger unless certain allegedly material information is disclosed and seeking compensatory and rescissory damages in the event the Merger is consummated without such disclosures.
On February 17, 2017, the defendants entered into a stipulation of settlement with respect to the class action, pursuant to which the parties have agreed, among other things, that Regency will make certain supplemental disclosures. The supplemental disclosures were made by Regency in the Current Report on Form 8-K filed by Regency with the SEC on February 17, 2017. The supplemental disclosures should be read in conjunction with the Joint Proxy Statement/Prospectus, which should be read in its entirety.
Regency believes that the class action is without merit and that no supplemental disclosure is or was required to the Joint Proxy Statement/Prospectus under any applicable rule, statute, regulation or law. However, to, among other things, eliminate the burden, inconvenience, expense, risk and disruption of further litigation, Regency has determined to provide supplemental disclosures. Additional information regarding the stipulation of settlement may be found in the Current Report on Form 8-K as filed with the SEC on February 17, 2017.
None.
|
Item 5.
|
Market for the Registrant's Common Equity, Related Stockholder Matters, and Issuer Purchases of Equity Securities
|
O
ur common stock is traded on the New York Stock Exchange under the symbol "REG." The following table sets forth the high and low sales prices and the cash dividends declared on our common stock by quarter for
2016
and
2015
.
|
2016
|
2015
|
|||||||||||||||||||
|
Quarter Ended
|
High Price
|
Low Price
|
Cash Dividends Declared
|
High Price
|
Low Price
|
Cash Dividends Declared
|
||||||||||||||
|
March 31
|
$
|
77.17
|
|
66.05
|
|
0.5000
|
|
$
|
70.80
|
|
63.38
|
|
0.4850
|
|
||||||
|
June 30
|
83.73
|
|
72.35
|
|
0.5000
|
|
69.45
|
|
58.81
|
|
0.4850
|
|
||||||||
|
September 30
|
85.35
|
|
75.76
|
|
0.5000
|
|
64.79
|
|
55.79
|
|
0.4850
|
|
||||||||
|
December 31
|
77.25
|
|
65.16
|
|
0.5000
|
|
69.45
|
|
61.71
|
|
0.4850
|
|
||||||||
34
We have determined that the dividends paid during
2016
and
2015
on our common stock qualify for the following tax treatment:
|
Total Distribution per Share
|
Ordinary Dividends
|
Total Capital Gain Distributions
|
Nontaxable Distributions
|
Qualified Dividends (included in Ordinary Dividends)
|
Unrecapt Sec 1250 Gain
|
|||||||||||||
|
2016
|
$
|
2.0000
|
|
1.0600
|
|
0.1600
|
|
0.7800
|
|
—
|
|
0.1600
|
|
|||||
|
2015
|
1.9400
|
|
1.4744
|
|
0.0970
|
|
0.3686
|
|
0.0970
|
|
0.0388
|
|
||||||
As of February 13,
2017
, there were 41,805 holders of common equity.
We intend to pay regular quarterly distributions to Regency Centers Corporation's common stockholders. Future distributions will be declared and paid at the discretion of our Board of Directors and will depend upon cash generated by operating activities, our financial condition, capital requirements, annual dividend requirements under the REIT provisions of the Internal Revenue Code of 1986, as amended, and such other factors as our Board of Directors deems relevant. In order to maintain Regency Centers Corporation's qualification as a REIT for federal income tax purposes, we are generally required to make annual distributions at least equal to 90% of our real estate investment trust taxable income for the taxable year. Under certain circumstances, which we do not expect to occur, we could be required to make distributions in excess of cash available for distributions in order to meet such requirements. We have a dividend reinvestment plan under which shareholders may elect to reinvest their dividends automatically in common stock. Under the plan, we may elect to purchase common stock in the open market on behalf of shareholders or may issue new common stock to such stockholders.
Under the loan agreement of our line of credit, in the event of any monetary default, we may not make distributions to stockholders except to the extent necessary to maintain our REIT status.
There were no unregistered sales of equity securities, and we did not repurchase any of our equity securities during the quarter ended
December 31, 2016
.
35
The performance graph furnished below shows Regency's cumulative total stockholder return to the S&P 500 Index, the FTSE NAREIT Equity REIT Index, and the FTSE NAREIT Equity Shopping Centers index since December 31, 2010. The stock performance graph should not be deemed filed or incorporated by reference into any other filing made by us under the Securities Act of 1933 or the Securities Exchange Act of 1934, except to the extent that we specifically incorporate the stock performance graph by reference in another filing.
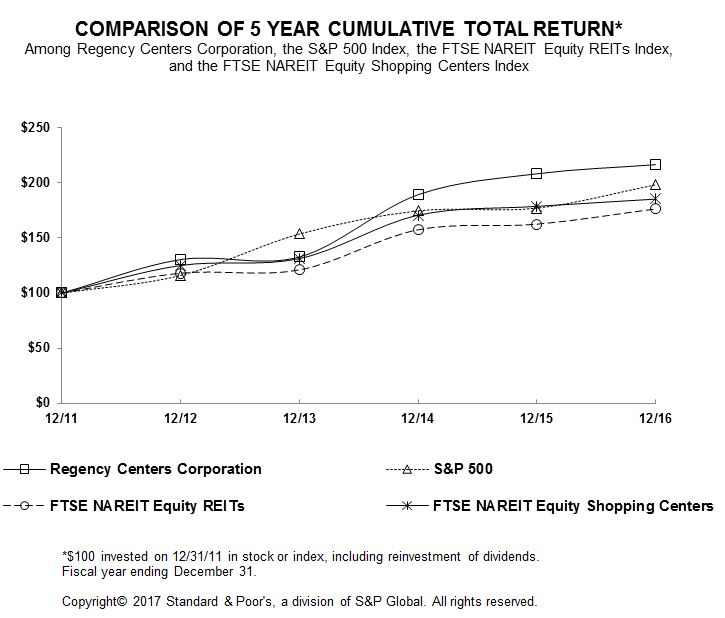
|
|
|
12/11
|
12/12
|
12/13
|
12/14
|
12/15
|
12/16
|
|||||||
|
Regency Centers Corporation
|
$
|
100.00
|
|
130.37
|
|
132.73
|
|
189.19
|
|
208.15
|
|
216.42
|
|
|
|
S&P 500
|
100.00
|
|
116.00
|
|
153.58
|
|
174.60
|
|
177.01
|
|
198.18
|
|
||
|
FTSE NAREIT Equity REITs
|
100.00
|
|
118.06
|
|
120.97
|
|
157.43
|
|
162.46
|
|
176.30
|
|
||
|
FTSE NAREIT Equity Shopping Centers
|
100.00
|
|
125.02
|
|
131.26
|
|
170.59
|
|
178.64
|
|
185.21
|
|
||
36
Item 6.
Selected Financial Data
(in thousands, except per share and unit data, number of properties, and ratio of earnings to fixed charges)
The following table sets forth Selected Financial Data for the Company on a historical basis for the five years ended
December 31, 2016
(in thousands, except per share and unit data, number of properties, and ratio of earnings to fixed charges). This historical Selected Financial Data has been derived from the audited consolidated financial statements. This information should be read in conjunction with the consolidated financial statements of Regency Centers Corporation and Regency Centers, L.P. (including the related notes thereto) and Management's Discussion and Analysis of the Financial Condition and Results of Operations, each included elsewhere in this Form 10-K.
Parent Company
|
2016
|
2015
|
2014
|
2013
|
2012
|
||||||||||||
|
Operating data:
|
||||||||||||||||
|
Revenues
|
$
|
614,371
|
|
569,763
|
|
537,898
|
|
489,007
|
|
473,929
|
|
|||||
|
Operating expenses
|
403,152
|
|
365,098
|
|
353,348
|
|
324,687
|
|
307,493
|
|
||||||
|
Total other expense (income)
|
148,066
|
|
(1)
|
110,236
|
|
83,046
|
|
(2)
|
111,741
|
|
131,240
|
|
||||
|
Income from operations before equity in income of investments in real estate partnerships
|
63,153
|
|
94,429
|
|
101,504
|
|
52,579
|
|
35,196
|
|
||||||
|
Equity in income of investments in real estate partnerships
|
56,518
|
|
22,508
|
|
31,270
|
|
31,718
|
|
23,807
|
|
||||||
|
Income tax (benefit) expense of taxable REIT subsidiary
|
—
|
|
—
|
|
(996
|
)
|
—
|
|
13,224
|
|
||||||
|
Income from continuing operations
|
119,671
|
|
116,937
|
|
133,770
|
|
84,297
|
|
45,779
|
|
||||||
|
Income (loss) from discontinued operations
(3)
|
—
|
|
—
|
|
—
|
|
65,285
|
|
(21,728
|
)
|
||||||
|
Gain on sale of real estate, net of tax
|
47,321
|
|
35,606
|
|
55,077
|
|
1,703
|
|
2,158
|
|
||||||
|
Net income
|
166,992
|
|
152,543
|
|
188,847
|
|
151,285
|
|
26,209
|
|
||||||
|
Income attributable to noncontrolling interests
|
(2,070
|
)
|
(2,487
|
)
|
(1,457
|
)
|
(1,481
|
)
|
(342
|
)
|
||||||
|
Net income attributable to the Company
|
164,922
|
|
150,056
|
|
187,390
|
|
149,804
|
|
25,867
|
|
||||||
|
Preferred stock dividends
|
(21,062
|
)
|
(21,062
|
)
|
(21,062
|
)
|
(21,062
|
)
|
(32,531
|
)
|
||||||
|
Net income (loss) attributable to common stockholders
|
$
|
143,860
|
|
128,994
|
|
166,328
|
|
128,742
|
|
(6,664
|
)
|
|||||
|
NAREIT FFO
(4)
|
277,301
|
|
276,515
|
|
269,149
|
|
240,621
|
|
222,100
|
|
||||||
|
Core FFO
(4)
|
333,957
|
|
288,872
|
|
261,506
|
|
241,619
|
|
230,937
|
|
||||||
|
Income per common share - diluted (note 12):
|
||||||||||||||||
|
Continuing operations
|
$
|
1.42
|
|
1.36
|
|
1.80
|
|
0.69
|
|
0.16
|
|
|||||
|
Discontinued operations
(3)
|
—
|
|
—
|
|
—
|
|
0.71
|
|
(0.24
|
)
|
||||||
|
Net income attributable to common stockholders
|
$
|
1.42
|
|
1.36
|
|
1.80
|
|
1.40
|
|
(0.08
|
)
|
|||||
|
Other information:
|
||||||||||||||||
|
Net cash provided by operating activities
|
$
|
289,376
|
|
275,637
|
|
277,742
|
|
250,731
|
|
257,215
|
|
|||||
|
Net cash (used in) provided by investing activities
|
(409,671
|
)
|
(139,346
|
)
|
(210,290
|
)
|
(9,817
|
)
|
3,623
|
|
||||||
|
Net cash provided by (used in) financing activities
|
96,695
|
|
(213,211
|
)
|
(34,360
|
)
|
(182,579
|
)
|
(249,891
|
)
|
||||||
|
Dividends paid to common stockholders
|
201,336
|
|
181,691
|
|
172,900
|
|
168,095
|
|
164,747
|
|
||||||
|
Common dividends declared per share
|
2.00
|
|
1.94
|
|
1.88
|
|
1.85
|
|
1.85
|
|
||||||
|
Common stock outstanding including exchangeable operating partnership units
|
104,651
|
|
97,367
|
|
94,262
|
|
92,499
|
|
90,572
|
|
||||||
|
Ratio of earnings to fixed charges
(5)
|
2.6
|
|
2.5
|
|
2.6
|
|
1.8
|
|
1.6
|
|
||||||
|
Ratio of earnings to combined fixed charges and preference dividends
(5)
|
2.1
|
|
2.1
|
|
2.2
|
|
1.5
|
|
1.4
|
|
||||||
|
Balance sheet data:
|
||||||||||||||||
|
Real estate investments before accumulated depreciation
|
$
|
5,230,198
|
|
4,852,106
|
|
4,743,053
|
|
4,385,380
|
|
4,352,839
|
|
|||||
|
Total assets
|
4,488,906
|
|
4,182,881
|
|
4,197,170
|
|
3,913,516
|
|
3,853,458
|
|
||||||
|
Total debt
|
1,642,420
|
|
1,864,285
|
|
2,021,357
|
|
1,854,697
|
|
1,941,891
|
|
||||||
|
Total liabilities
|
1,864,404
|
|
2,100,261
|
|
2,260,688
|
|
2,052,382
|
|
2,107,547
|
|
||||||
|
Total stockholders’ equity
|
2,591,301
|
|
2,054,109
|
|
1,906,592
|
|
1,843,354
|
|
1,730,765
|
|
||||||
|
Total noncontrolling interests
|
33,201
|
|
28,511
|
|
29,890
|
|
17,780
|
|
15,146
|
|
||||||
(1)
During the year ended December 31, 2016, the Company recognized a $40.6 million charge to settle $220 million of forward starting interest rate swaps related to new debt previously expected to be issued in 2017. As a result of its July 2016 equity offering and the early redemption of the $300 million notes in August 2016, the Company believed that the issuance of new fixed rate debt within the remaining period of the forward starting swaps was probable to no longer occur. Accordingly, the Company ceased hedge accounting and reclassified the $40.6 million paid to settle the forward starting swaps from Accumulated other comprehensive loss to earnings.
(2)
During the year ended December 31, 2014, the Company recognized a gain on remeasurement of investment in real estate partnership of $18.3 million, which is included in
Total other expense (income)
and
Income from operations
, upon the acquisition of the remaining 50% interest in a single operating property, resulting in consolidation of the property as a business
37
combination. The gain on remeasurement was calculated based on the difference between the carrying value and the fair value of the previously held equity interest.
(3)
On January 1, 2014, the Company prospectively adopted Financial Accounting Standards Board ("FASB") Accounting Standards Update ("ASU") No. 2014-08, Presentation of Financial Statements (Topic 205) and Property, Plant and Equipment (Topic 360): Reporting Discontinued Operations and Disclosures of Disposals of Components of an Entity, which changes the requirements for reporting discontinued operations. Under the new guidance, only disposals representing a strategic shift in operations should be presented as discontinued operations. No property disposals since adoption of this ASU qualify as discontinued operations, therefore prior period amounts were not reclassified for property sales since adoption.
(4)
See Item 1,
Defined Terms
,
for the definition of NAREIT FFO and Core FFO and Item 7,
Supplemental Earnings Information
, for a reconciliation to the nearest GAAP measure.
(5)
See Exhibit 12.1 for additional information regarding the computations of ratio of earnings to fixed charges and ratio of earnings to combined fixed charges and preference dividends.
38
Operating Partnership
|
2016
|
2015
|
2014
|
2013
|
2012
|
||||||||||||
|
Operating data:
|
||||||||||||||||
|
Revenues
|
$
|
614,371
|
|
569,763
|
|
537,898
|
|
489,007
|
|
473,929
|
|
|||||
|
Operating expenses
|
403,152
|
|
365,098
|
|
353,348
|
|
324,687
|
|
307,493
|
|
||||||
|
Total other expense (income)
|
148,066
|
|
(1)
|
110,236
|
|
83,046
|
|
(2)
|
111,741
|
|
131,240
|
|
||||
|
Income from operations before equity in income of investments in real estate partnerships
|
63,153
|
|
94,429
|
|
101,504
|
|
52,579
|
|
35,196
|
|
||||||
|
Equity in income of investments in real estate partnerships
|
56,518
|
|
22,508
|
|
31,270
|
|
31,718
|
|
23,807
|
|
||||||
|
Income tax (benefit) expense of taxable REIT subsidiary
|
—
|
|
—
|
|
(996
|
)
|
—
|
|
13,224
|
|
||||||
|
Income from continuing operations
|
119,671
|
|
116,937
|
|
133,770
|
|
84,297
|
|
45,779
|
|
||||||
|
Income (loss) from discontinued operations
(3)
|
—
|
|
—
|
|
—
|
|
65,285
|
|
(21,728
|
)
|
||||||
|
Gain on sale of real estate, net of tax
|
47,321
|
|
35,606
|
|
55,077
|
|
1,703
|
|
2,158
|
|
||||||
|
Net income
|
166,992
|
|
152,543
|
|
188,847
|
|
151,285
|
|
26,209
|
|
||||||
|
Income attributable to noncontrolling interests
|
(1,813
|
)
|
(2,247
|
)
|
(1,138
|
)
|
(1,205
|
)
|
(865
|
)
|
||||||
|
Net income attributable to the Partnership
|
165,179
|
|
150,296
|
|
187,709
|
|
150,080
|
|
25,344
|
|
||||||
|
Preferred unit distributions
|
(21,062
|
)
|
(21,062
|
)
|
(21,062
|
)
|
(21,062
|
)
|
(31,902
|
)
|
||||||
|
Net income (loss) attributable to common unit holders
|
$
|
144,117
|
|
129,234
|
|
166,647
|
|
129,018
|
|
(6,558
|
)
|
|||||
|
NAREIT FFO
(4)
|
277,301
|
|
276,515
|
|
269,149
|
|
240,621
|
|
222,100
|
|
||||||
|
Core FFO
(4)
|
333,957
|
|
288,872
|
|
261,506
|
|
241,619
|
|
230,937
|
|
||||||
|
Income per common unit - diluted (note 12):
|
||||||||||||||||
|
Continuing operations
|
$
|
1.42
|
|
1.36
|
|
1.80
|
|
0.69
|
|
0.16
|
|
|||||
|
Discontinued operations
(3)
|
—
|
|
—
|
|
—
|
|
0.71
|
|
(0.24
|
)
|
||||||
|
Net income (loss) attributable to common unit holders
|
$
|
1.42
|
|
1.36
|
|
1.80
|
|
1.40
|
|
(0.08
|
)
|
|||||
|
Other information:
|
||||||||||||||||
|
Net cash provided by operating activities
|
$
|
289,376
|
|
275,637
|
|
277,742
|
|
250,731
|
|
257,215
|
|
|||||
|
Net cash (used in) provided by investing activities
|
(409,671
|
)
|
(139,346
|
)
|
(210,290
|
)
|
(9,817
|
)
|
3,623
|
|
||||||
|
Net cash provided by (used in) financing activities
|
96,695
|
|
(213,211
|
)
|
(34,360
|
)
|
(182,579
|
)
|
(249,891
|
)
|
||||||
|
Distributions paid on common units
|
201,336
|
|
181,691
|
|
172,900
|
|
168,095
|
|
164,747
|
|
||||||
|
Ratio of earnings to fixed charges
(5)
|
2.6
|
|
2.5
|
|
2.6
|
|
1.8
|
|
1.6
|
|
||||||
|
Ratio of combined fixed charges and preference dividends to earnings
(5)
|
2.1
|
|
2.1
|
|
2.2
|
|
1.5
|
|
1.4
|
|
||||||
|
Balance sheet data:
|
||||||||||||||||
|
Real estate investments before accumulated depreciation
|
$
|
5,230,198
|
|
4,852,106
|
|
4,743,053
|
|
4,385,380
|
|
4,352,839
|
|
|||||
|
Total assets
|
4,488,906
|
|
4,182,881
|
|
4,197,170
|
|
3,913,516
|
|
3,853,458
|
|
||||||
|
Total debt
|
1,642,420
|
|
1,864,285
|
|
2,021,357
|
|
1,854,697
|
|
1,941,891
|
|
||||||
|
Total liabilities
|
1,864,404
|
|
2,100,261
|
|
2,260,688
|
|
2,052,382
|
|
2,107,547
|
|
||||||
|
Total partners’ capital
|
2,589,334
|
|
2,052,134
|
|
1,904,678
|
|
1,841,928
|
|
1,729,612
|
|
||||||
|
Total noncontrolling interests
|
35,168
|
|
30,486
|
|
31,804
|
|
19,206
|
|
16,299
|
|
||||||
(1)
During the year ended December 31, 2016, the Operating Partnership recognized a $40.6 million charge to settle $220 million of forward starting interest rate swaps related to new debt previously expected to be issued in 2017. As a result of its July 2016 equity offering and the early redemption of the $300 million notes in August 2016, the Operating Partnership believed that the issuance of new fixed rate debt within the remaining period of the forward starting swaps was probable to no longer occur. Accordingly, the Operating Partnership ceased hedge accounting and reclassified the $40.6 million paid to settle the forward starting swaps from Accumulated other comprehensive loss to earnings.
(2)
During the year ended December 31, 2014, the Operating Partnership recognized a gain on remeasurement of investment in real estate partnership of $18.3 million, which is included in
Total other expense (income)
and
Income from operations
, upon the acquisition of the remaining 50% interest in a single operating property, resulting in consolidation of the property as a business combination. The gain on remeasurement was calculated based on the difference between the carrying value and the fair value of the previously held equity interest.
(3)
On January 1, 2014, the Operating Partnership prospectively adopted Financial Accounting Standards Board ("FASB") Accounting Standards Update ("ASU") No. 2014-08, Presentation of Financial Statements (Topic 205) and Property, Plant and Equipment (Topic 360): Reporting Discontinued Operations and Disclosures of Disposals of Components of an Entity, which changes the requirements for reporting discontinued operations. Under the new guidance, only disposals representing a strategic shift in operations should be presented as discontinued operations. No property disposals since adoption of this ASU qualify as discontinued operations, therefore prior period amounts were not reclassified for property sales since adoption.
39
(4)
See Item 1,
Defined Terms
,
for the definition of NAREIT FFO and Core FFO and Item 7,
Supplemental Earnings Information
, for a reconciliation to the nearest GAAP measure.
(5)
See Exhibit 12.1 for additional information regarding the computations of ratio of earnings to fixed charges and ratio of earnings to combined fixed charges and preference dividends.
40
Pending Merger with Equity One, Inc.
On November 14, 2016, Regency Centers Corporation entered into an Agreement and Plan of Merger (the “Merger Agreement”) with Equity One, Inc. (“Equity One”), pursuant to which, subject to the satisfaction or waiver of certain conditions, Equity One will merge with and into the Regency Centers Corporation, with Regency Centers Corporation being the surviving corporation (the “Merger”). The combined company will retain the Regency name and continue to trade under the ticker symbol “REG” on the New York Stock Exchange (the “NYSE”).
On the terms and subject to the conditions set forth in the Merger Agreement, which has been unanimously approved by the boards of directors of Regency Centers Corporation and Equity One, at the effective time of the Merger (the “Effective Time”), each share of the common stock, par value $0.01 per share, of Equity One issued and outstanding immediately prior to the Effective Time (other than shares of Equity One owned directly by Equity One or the Regency Centers Corporation and in each case not held on behalf of third parties) will be converted into the right to receive 0.45 of a newly issued share of the common stock of Regency Centers Corporation.
The closing of the Merger is subject to certain conditions, including the requisite approvals from the stockholders of each of Regency Centers Corporation and Equity One (which approvals were received at special meetings of the stockholders of each company held on February 24, 2017), the receipt of certain tax opinions by Regency Centers Corporation and Equity One, and other customary closing conditions. The Merger is expected to close on March 1, 2017. However, the Company cannot predict with certainty when, or if, the Merger will be completed because completion of the Merger is subject to conditions beyond the control of the Company.
For more information about the Merger, the Merger Agreement and related agreements, see Note 16 of the Notes to the Consolidated Financial Statements in Item 8 herein.
Executing on our Strategy
During
2016
, we executed on our strategic objectives to further solidify Regency’s position as a leader among shopping center REITs:
Sustain average annual 3% same property NOI growth from a high-quality, growing portfolio of thriving community and neighborhood shopping centers.
We earn revenues and generate cash flow by leasing space in our shopping centers to grocery stores, major retail anchors, restaurants, side-shop retailers, and service providers, as well as ground leasing or selling out-parcels to these same types of tenants. We experience growth in revenues by increasing occupancy and rental rates in our existing shopping centers, by acquiring and developing new shopping centers, and by redeveloping shopping centers within our portfolio. Noteworthy milestones and achievements during
2016
include:
|
•
|
We achieved pro-rata same property NOI growth, excluding termination fees, of
3.5%
.
|
|
•
|
Pro-rata same property percent leased remained high at 96.2% at
December 31, 2016
.
|
|
•
|
We grew rental rates 11.3% on comparable spaces for new and renewal leases.
|
|
•
|
We acquired
three
operating properties for a gross purchase price of
$333.8 million
.
|
Develop new, high quality shopping centers and redevelop existing centers at attractive returns on investment from a disciplined development program.
We capitalize on our development capabilities, market presence, and anchor relationships by investing in new developments and redevelopments of existing centers.
|
•
|
During
2016
, we started $221.4 million of development and redevelopment projects, net of partner funding requirements, with a weighted average projected return of 7.8% upon completion.
|
|
•
|
At
December 31, 2016
, we have
six
ground-up developments in process, with total expected net development costs of $209.3 million, net of partner funding requirements, and have $97.7 million of net costs to complete. These developments are projected to return 7.4% on capital upon completion and are currently 78.6% leased.
|
41
|
•
|
We also have 15 redevelopments of existing centers in process with total expected net redevelopment costs of $88.4 million, with $59.3 million of costs to complete, and projected incremental returns ranging from 7.0% - 10.0% upon completion.
|
We fund acquisitions and development activities from various capital sources including operating cash flows, the sale of operating properties that no longer meet our investment standards, equity offerings, new debt financing, and capital from our co-investment partners.
|
•
|
At
December 31, 2016
, our net debt-to-core EBITDA ratio on a pro-rata basis for the trailing twelve months was 4.4x versus 5.2x at
December 31, 2015
. We had
$13.3 million
of cash and
$779.2 million
available on our line of credit.
|
|
•
|
In June 2016, we settled
1.85 million
of the 3.1 million shares of the forward equity offering resulting in net proceeds of
$137.5 million
, which were used to partially repay the line of credit balance.
|
|
•
|
In July 2016, we amended our existing Term Loan, which increased the facility size by $100.0 million to
$265.0 million
, extended the maturity date to
January 5, 2022
and fixed the interest rate at
2.0%
.
|
|
•
|
In July 2016, we issued 5.0 million shares of common stock resulting in net proceeds of $400.1 million, used to (i) repay in full our
$300.0 million
5.875% Senior Unsecured Notes due June 2017 ("$300 million note"), including a make-whole payment, (ii) settle the forward interest rate swaps, and (iii) fund investment activities and general corporate purposes.
|
|
•
|
In January 2017, we completed a combined $650 million public offering of two tranches of senior unsecured notes:
|
|
•
|
$350.0 million
of
3.6%
notes due
February 1, 2027
, which priced at
99.741%
. The Company intends to use the net proceeds in connection with the consummation of the previously announced pending merger with Equity One, Inc., including (i) to repay approximately
$285.0 million
in aggregate principal amount of debt of Equity One, and any related interest, fees and expenses and (ii) to pay transaction expenses related to the pending merger with Equity One. In the event that the merger agreement is not consummated, we will be required to redeem these notes then outstanding at a redemption price equal to 101% of the principal amount to be redeemed plus accrued and unpaid interest, if any.
|
|
•
|
$300.0 million
of
4.4%
notes due
February 1, 2047
, which priced at
99.110%
. The Company used a portion of the net proceeds to redeem all of the outstanding shares of its
6.625%
Series 6 preferred shares on February 16, 2017 and intends to use the balance to fund investment activities and for general corporate purposes.
|
Leasing Activity and Significant Tenants
We believe our high-quality, grocery anchored shopping centers located in densely populated, desirable infill trade areas create attractive spaces for retail tenants. Improvements in the economy, combined with historically low levels of new supply and robust tenant demand, allow us to focus on merchandising of our centers to ensure the right mix of operators and unique retailers, which draws more retail customers to our centers.
Pro-rata Occupancy
For the purpose of the following disclosures of occupancy and leasing activity, "anchor space" is considered space greater than or equal to 10,000 SF and "shop space" is less than 10,000 SF. The following table summarizes pro-rata occupancy rates of our combined Consolidated and Unconsolidated shopping center portfolio:
|
December 31, 2016
|
December 31, 2015
|
|||
|
% Leased – Operating
(1)
|
96.0%
|
95.9%
|
||
|
Anchor space
|
97.8%
|
98.5%
|
||
|
Shop space
|
93.1%
|
91.7%
|
||
(1)
Excludes properties in development.
The decline in anchor percent leased is due, in part, to the bankruptcy of Sports Authority and its rejection of two leases at our shopping centers. See additional discussion below about bankruptcies.
42
Pro-rata Leasing Activity
The following table summarizes leasing activity, including Regency's pro-rata share of activity within the portfolio of our co-investment partnerships:
|
Year ended December 31, 2016
|
||||||||||||||||
|
Leasing Transactions
(1)
|
SF (in thousands)
|
Base Rent PSF
(2)
|
Tenant Improvements PSF
(2)
|
Leasing Commissions PSF
(2)
|
||||||||||||
|
Anchor Leases
|
||||||||||||||||
|
New
|
22
|
729
|
$
|
16.99
|
|
$
|
7.95
|
|
$
|
2.42
|
|
|||||
|
Renewal
|
84
|
1,610
|
$
|
14.00
|
|
$
|
0.50
|
|
$
|
0.54
|
|
|||||
|
Total Anchor Leases
(1)
|
106
|
2,339
|
$
|
14.94
|
|
$
|
2.83
|
|
$
|
1.13
|
|
|||||
|
Shop Space
|
||||||||||||||||
|
New
|
443
|
774
|
$
|
30.56
|
|
$
|
12.29
|
|
$
|
14.01
|
|
|||||
|
Renewal
|
987
|
1,502
|
$
|
31.16
|
|
$
|
1.26
|
|
$
|
3.87
|
|
|||||
|
Total Shop Space Leases
(1)
|
1,430
|
2,276
|
$
|
30.95
|
|
$
|
5.01
|
|
$
|
7.32
|
|
|||||
|
Total Leases
|
1,536
|
4,615
|
$
|
22.84
|
|
$
|
3.90
|
|
$
|
4.18
|
|
|||||
|
Year ended December 31, 2015
|
||||||||||||||||
|
Leasing Transactions
(1)
|
SF (in thousands)
|
Base Rent PSF
(2)
|
Tenant Improvements PSF
(2)
|
Leasing Commissions PSF
(2)
|
||||||||||||
|
Anchor Leases
|
||||||||||||||||
|
New
|
15
|
295
|
$
|
13.81
|
|
$
|
5.28
|
|
$
|
5.14
|
|
|||||
|
Renewal
|
48
|
972
|
$
|
11.96
|
|
$
|
0.01
|
|
$
|
1.08
|
|
|||||
|
Total Anchor Leases
(1)
|
63
|
1,267
|
$
|
12.39
|
|
$
|
1.24
|
|
$
|
2.03
|
|
|||||
|
Shop Space
|
||||||||||||||||
|
New
|
445
|
724
|
$
|
30.67
|
|
$
|
10.35
|
|
$
|
13.53
|
|
|||||
|
Renewal
|
950
|
1,497
|
$
|
30.33
|
|
$
|
0.64
|
|
$
|
3.92
|
|
|||||
|
Total Shop Space Leases
(1)
|
1,395
|
2,221
|
$
|
30.44
|
|
$
|
3.81
|
|
$
|
7.06
|
|
|||||
|
Total Leases
|
1,458
|
3,488
|
$
|
23.88
|
|
$
|
2.87
|
|
$
|
5.23
|
|
|||||
(1)
Number of leasing transactions reported at 100%; all other statistics reported at pro-rata share.
(2)
Totals for base rent, tenant improvements, and leasing commissions reflect the weighted average PSF.
Total average base rent signed on our shop space leases of
$30.95
increased in 2016 compared to 2015 and exceeds the average annual base rent of all shop space leases due to expire during the next twelve months of $28.39 PSF by 9%.
Significant Tenants and Concentrations of Risk
We seek to reduce our operating and leasing risks through geographic diversification and by avoiding dependence on any single property, market, or tenant. The following table summarizes our four most significant tenants, based on their percentage of annualized base rent, each of which is a grocery tenant:
|
December 31, 2016
|
||||||
|
Grocery Anchor
|
Number of
Stores
(1)
|
Percentage of
Company-
owned GLA
(2)
|
Percentage of
Annualized
Base Rent
(2)
|
|||
|
Kroger
|
59
|
9.3%
|
4.7%
|
|||
|
Publix
|
41
|
5.7%
|
3.1%
|
|||
|
Albertsons/Safeway
|
48
|
4.7%
|
2.7%
|
|||
|
Whole Foods
|
21
|
2.5%
|
2.5%
|
|||
(1)
Includes stores owned by grocery anchors that are attached to our centers.
(2)
Includes Regency's pro-rata share of Unconsolidated Properties and excludes those owned by anchors.
43
Bankruptcies and Credit Concerns
Our management team devotes significant time to researching and monitoring consumer preferences, customer shopping behaviors, alternative retail methods accessible via the Internet, and demographics in order to anticipate the challenges and opportunities impacting the retail industry. We closely monitor the operating performance and rent collections of the tenants in our shopping centers, but also those retailers experiencing significant changes to their business models as a result of reduced customer traffic in their stores and increased competition from Internet sales. Retailers who are unable to withstand these and other business pressures, such as operating and financing their business, may approach us to modify their lease agreement or file bankruptcy. Although base rent is supported by long-term lease contracts, tenants who file bankruptcy generally have the legal right to reject any or all of their leases and close related stores. In the event that a tenant with a significant number of leases in our shopping centers files bankruptcy and cancels its leases, we could experience a significant reduction in our revenues. Currently, no tenant represents more than 5% of our annual base rent on a pro-rata basis. Also, as a result of our research and findings, we may reduce new leasing, suspend leasing, or curtail the allowance for the construction of leasehold improvements within a certain retail category or to a specific retailer in order to reduce our risk from bankruptcies and store closings.
During March 2016, Sports Authority filed for Chapter 11 bankruptcy protection, at which time we had three leases in our portfolio. One of those leases has been assumed by another retailer and the remaining two have been rejected and the stores closed. Those two rejected leases represented $2.1 million, or 0.4%, of total annualized base rent on a pro-rata basis; however, we have since executed leases to re-tenant these spaces.
During 2016, Sears Holdings announced that it planned to accelerate the closing of a number of stores. Sears continues to report significant declines in operating revenues and performance, and its ability to continue operating stores in our shopping centers is uncertain. We have five Sears or Kmart leases in our portfolio, which currently represent $3.1 million, or 0.6%, of total annualized base rent on a pro-rata basis. None of the announced store closures, as of this filing, are within our shopping centers. However, we are currently working to opportunistically re-tenant the spaces as the lease terms permit.
44
Results from Operations
Comparison of the years ended
December 31, 2016
and
2015
:
Our total revenues increased as summarized in the following table:
|
(in thousands)
|
2016
|
2015
|
Change
|
|||||||
|
Minimum rent
|
$
|
444,305
|
|
415,155
|
|
29,150
|
|
|||
|
Percentage rent
|
4,128
|
|
3,750
|
|
378
|
|
||||
|
Recoveries from tenants
|
127,677
|
|
116,120
|
|
11,557
|
|
||||
|
Other income
|
12,934
|
|
9,175
|
|
3,759
|
|
||||
|
Management, transaction, and other fees
|
25,327
|
|
25,563
|
|
(236
|
)
|
||||
|
Total revenues
|
$
|
614,371
|
|
569,763
|
|
44,608
|
|
|||
Minimum rent increased as follows:
|
•
|
$11.9 million increase from rent commencing at development properties;
|
|
•
|
$15.3 million increase from new acquisitions of operating properties; and
|
|
•
|
$7.9 million increase at same properties, reflecting a $9.7 million increase from redevelopments and rental rate growth on new and renewal leases, offset by a $1.8 million charge to straight line rent primarily attributable to expected early terminations;
|
|
•
|
reduced by $5.9 million from the sale of operating properties.
|
Recoveries from tenants represent reimbursements to us for tenants' pro-rata share of the operating, maintenance, and real estate tax expenses that we incur to operate our shopping centers. Recoveries from tenants increased as follows:
|
•
|
$3.9 million increase from rent commencing at development properties;
|
|
•
|
$4.2 million increase from new acquisitions of operating properties; and
|
|
•
|
$5.6 million increase from same properties associated with higher recoverable costs;
|
|
•
|
reduced by $2.1 million from the sale of operating properties.
|
Other income, which consists of incidental income earned at our centers, increased
$3.8 million
as follows:
|
•
|
$2.3 million in same properties primarily as a result of lease termination and easement fees; and
|
|
•
|
$1.5 million in parking income related to the acquisition of Market Common Clarendon.
|
Changes in our operating expenses are summarized in the following table:
|
(in thousands)
|
2016
|
2015
|
Change
|
|||||||
|
Depreciation and amortization
|
$
|
162,327
|
|
146,829
|
|
15,498
|
|
|||
|
Operating and maintenance
|
95,022
|
|
82,978
|
|
12,044
|
|
||||
|
General and administrative
|
65,327
|
|
65,600
|
|
(273
|
)
|
||||
|
Real estate taxes
|
66,395
|
|
61,855
|
|
4,540
|
|
||||
|
Other operating expenses
|
14,081
|
|
7,836
|
|
6,245
|
|
||||
|
Total operating expenses
|
$
|
403,152
|
|
365,098
|
|
38,054
|
|
|||
Depreciation and amortization costs increased as follows:
|
•
|
$4.8 million increase as we began depreciating costs at development properties where tenant spaces were completed and became available for occupancy;
|
45
|
•
|
$8.8 million increase from new acquisitions of operating properties; and
|
|
•
|
$5.8 million increase at same properties, attributable to recent capital improvements and redevelopments;
|
|
•
|
reduced by $3.9 million from the sale of operating properties and other corporate asset disposals.
|
Operating and maintenance costs increased as follows:
|
•
|
$2.6 million increase from operations commencing at development properties;
|
|
•
|
$6.2 million increase from new acquisitions of operating properties; and
|
|
•
|
$4.8 million increase at same properties primarily attributable to recoverable costs;
|
|
•
|
reduced by $1.6 million from the sale of operating properties.
|
Real estate taxes increased as follows:
|
•
|
$1.6 million increase from development properties where capitalization ceased as tenant spaces became available for occupancy;
|
|
•
|
$2.8 million increase from new acquisitions of operating properties; and
|
|
•
|
$1.4 million increase at same properties from increased tax assessments;
|
|
•
|
reduced by $1.3 million from sold properties.
|
Other operating expenses increased
$6.2 million
primarily due to costs incurred from 2016 acquisition activities, including costs associated with the announced pending merger of Equity One, Inc.
The following table presents the components of other expense (income):
|
(in thousands)
|
2016
|
2015
|
Change
|
|||||||
|
Interest expense, net
|
||||||||||
|
Interest on notes payable
|
$
|
81,330
|
|
98,485
|
|
(17,155
|
)
|
|||
|
Interest on unsecured credit facilities
|
5,635
|
|
3,566
|
|
2,069
|
|
||||
|
Capitalized interest
|
(3,481
|
)
|
(6,739
|
)
|
3,258
|
|
||||
|
Hedge expense
|
8,408
|
|
8,900
|
|
(492
|
)
|
||||
|
Interest income
|
(1,180
|
)
|
(1,590
|
)
|
410
|
|
||||
|
Interest expense, net
|
90,712
|
|
102,622
|
|
(11,910
|
)
|
||||
|
Provision for impairment
|
4,200
|
|
—
|
|
4,200
|
|
||||
|
Early extinguishment of debt
|
14,240
|
|
8,239
|
|
6,001
|
|
||||
|
Net investment income
|
(1,672
|
)
|
(625
|
)
|
(1,047
|
)
|
||||
|
Loss on derivative instruments
|
40,586
|
|
—
|
|
40,586
|
|
||||
|
Total other expense (income)
|
$
|
148,066
|
|
110,236
|
|
37,830
|
|
|||
The
$11.9 million
decrease in total interest expense is due to:
|
•
|
$17.2 million
decrease in interest on notes payable due to lower interest rates from refinancing and deleveraging activities during 2016 and the early redemption of our $300 million notes in August 2016; offset by
|
|
•
|
$2.1 million
increase in interest on unsecured credit facilities related to higher average balances on our Line and a $100 million increase on our Term Loan during 2016; and
|
|
•
|
$3.3 million
increase due to lower interest capitalization on our development and redevelopment projects based on the status and cumulative spend on the projects in process.
|
During 2016, we recognized
$4.2 million
of impairment losses on two operating properties and two land parcels. One of the operating properties and both land parcels have since been sold. We did not recognize any impairments during 2015.
46
We redeemed all of our outstanding $400 million notes in two tranches occurring in 2016 and 2015. During 2016, we recognized a $14.2 million charge when redeeming the $300 million notes. During 2015, we early redeemed $100 million of those same notes, which included an $8.2 million make-whole premium charge.
Net investment income increased
$1.0 million
, driven by realized and unrealized gains on investments held within the non-qualified deferred compensation plan during 2016.
We recognized a $40.6 million charge to settle $220 million of forward starting interest rate swaps related to new debt previously expected to be issued in 2017. As a result of our July 2016 equity offering and the early redemption of the $300 million notes in August 2016, the Company believed that the issuance of new fixed rate debt within the remaining period of the forward starting swaps was probable to no longer occur. Accordingly, we ceased hedge accounting and reclassified the $40.6 million paid to settle the forward starting swaps from Accumulated other comprehensive loss to earnings.
Our equity in income of investments in real estate partnerships increased as follows:
|
(in thousands)
|
Regency's Ownership
|
2016
|
2015
|
Change
|
||||||||
|
GRI - Regency, LLC (GRIR)
|
40.00%
|
$
|
29,791
|
|
18,148
|
|
11,643
|
|
||||
|
Columbia Regency Retail Partners, LLC (Columbia I)
|
20.00%
|
4,180
|
|
(278
|
)
|
4,458
|
|
|||||
|
Columbia Regency Partners II, LLC (Columbia II)
|
20.00%
|
3,240
|
|
755
|
|
2,485
|
|
|||||
|
Cameron Village, LLC (Cameron)
|
30.00%
|
695
|
|
643
|
|
52
|
|
|||||
|
RegCal, LLC (RegCal)
|
25.00%
|
1,080
|
|
576
|
|
504
|
|
|||||
|
US Regency Retail I, LLC (USAA)
|
20.01%
|
1,180
|
|
807
|
|
373
|
|
|||||
|
Other investments in real estate partnerships
|
50.00%
|
16,352
|
|
1,857
|
|
14,495
|
|
|||||
|
Total equity in income of investments in real estate partnerships
|
$
|
56,518
|
|
22,508
|
|
34,010
|
|
|||||
The
$34.0 million
increase in our equity in income in investments in real estate partnerships is largely attributed to (i) our share of gains on the sale of real estate within our GRIR, Columbia I, Columbia II, and Other investments in real estate partnerships; (ii) interest expense savings within GRIR resulting from decreased debt balances and refinancing activity at lower interest rates; and (iii) and a decrease in depreciation expense within GRIR from fully depreciated land improvement assets.
The following represents the remaining components that comprise net income attributable to the common stockholders and unit holders:
|
(in thousands)
|
2016
|
2015
|
Change
|
|||||||
|
Income from operations
|
$
|
119,671
|
|
116,937
|
|
2,734
|
|
|||
|
Gain on sale of real estate, net of tax
|
47,321
|
|
35,606
|
|
11,715
|
|
||||
|
Income attributable to noncontrolling interests
|
(2,070
|
)
|
(2,487
|
)
|
417
|
|
||||
|
Preferred stock dividends
|
(21,062
|
)
|
(21,062
|
)
|
—
|
|
||||
|
Net income attributable to common stockholders
|
$
|
143,860
|
|
128,994
|
|
14,866
|
|
|||
|
Net income attributable to exchangeable operating partnership units
|
257
|
|
240
|
|
17
|
|
||||
|
Net income attributable to common unit holders
|
$
|
144,117
|
|
129,234
|
|
14,883
|
|
|||
During 2016, we sold
eleven
operating properties and
sixteen
land parcels resulting in gains of
$47.3 million
, compared to gains of
$35.6 million
from the sale of
five
operating properties and
two
land parcels during 2015.
47
Comparison of the years ended
December 31, 2015
and
2014
:
Our total revenues increased as summarized in the following table:
|
(in thousands)
|
2015
|
2014
|
Change
|
|||||||
|
Minimum rent
|
$
|
415,155
|
|
390,697
|
|
24,458
|
|
|||
|
Percentage rent
|
3,750
|
|
3,488
|
|
262
|
|
||||
|
Recoveries from tenants
|
116,120
|
|
108,434
|
|
7,686
|
|
||||
|
Other income
|
9,175
|
|
11,184
|
|
(2,009
|
)
|
||||
|
Management, transaction, and other fees
|
25,563
|
|
24,095
|
|
1,468
|
|
||||
|
Total revenues
|
$
|
569,763
|
|
537,898
|
|
31,865
|
|
|||
Minimum rent increased as follows:
|
•
|
$5.0 million increase from new acquisitions of operating properties;
|
|
•
|
$9.8 million increase from rent commencing at development properties; and
|
|
•
|
$15.7 million increase at same properties, with $6.7 million relating to redevelopment properties, and $9.0 million relating to higher rental rates and rent paying occupancy growth;
|
|
•
|
reduced by $6.0 million from the sale of operating properties.
|
Recoveries from tenants represent reimbursements to us for tenants' pro-rata share of the operating, maintenance, and
real estate tax expenses that we incur to operate our shopping centers. Recoveries from tenants increased as follows:
|
•
|
$1.2 million increase from new acquisitions of operating properties;
|
|
•
|
$1.5 million increase from rent commencing at development properties; and,
|
|
•
|
$5.9 million increase from same properties associated with rent paying occupancy improvements and higher recoverable costs;
|
|
•
|
reduced by $890,000 from the sale of operating properties.
|
Other income, which consists of incidental income earned at our centers, decreased primarily as a result of a lower level of settlement and lease termination income earned in 2015.
48
We earn fees, at market-based rates, for asset management, property management, leasing, acquisition, and financing services that we provided to our co-investment partnerships and third parties as follows:
|
(in thousands)
|
2015
|
2014
|
Change
|
|||||||
|
Asset management fees
|
$
|
6,416
|
|
6,013
|
|
403
|
|
|||
|
Property management fees
|
13,123
|
|
13,020
|
|
103
|
|
||||
|
Leasing commissions and other fees
|
6,024
|
|
5,062
|
|
962
|
|
||||
|
Total management, transaction, and other fees
|
$
|
25,563
|
|
24,095
|
|
1,468
|
|
|||
Asset and property management fees increased due to higher property values and revenues in our co-investment partnerships. Leasing commissions and other fees increased during 2015 due to the higher average rents on leasing transactions.
Changes in our operating expenses are summarized in the following table:
|
(in thousands)
|
2015
|
2014
|
Change
|
|||||||
|
Depreciation and amortization
|
$
|
146,829
|
|
147,791
|
|
(962
|
)
|
|||
|
Operating and maintenance
|
82,978
|
|
77,788
|
|
5,190
|
|
||||
|
General and administrative
|
65,600
|
|
60,242
|
|
5,358
|
|
||||
|
Real estate taxes
|
61,855
|
|
59,031
|
|
2,824
|
|
||||
|
Other operating expenses
|
7,836
|
|
8,496
|
|
(660
|
)
|
||||
|
Total operating expenses
|
$
|
365,098
|
|
353,348
|
|
11,750
|
|
|||
Depreciation and amortization decreased as follows:
|
•
|
$2.9 million decrease from the sale of operating properties;
|
|
•
|
$1.9 million increase primarily from operations beginning at development properties and the acquisition of operating properties.
|
Operating and maintenance costs increased as follows:
|
•
|
$1.6 million increase from operations commencing at development properties;
|
|
•
|
$2.1 million increase from new acquisitions of operating properties;
|
|
•
|
$2.9 million increase at same properties attributable to an increase in recoverable costs;
|
|
•
|
reduced by $1.4 million from the sale of operating properties.
|
General and administrative expenses increased as follows:
|
•
|
$3.9 million of higher compensation costs primarily related to executive management changes during 2015;
|
|
•
|
$2.3 million of lower development overhead capitalization based on fewer new development and redevelopment projects started in 2015;
|
|
•
|
reduced by
$1.1
million from the decrease in the value of participant obligations within the deferred compensation plan.
|
Real estate taxes increased as follows:
|
•
|
$690,000 increase from new acquisitions of operating properties;
|
|
•
|
$510,000 increase from development properties where capitalization ceased as tenant spaces became available for occupancy; and,
|
|
•
|
$2.0 million increase at same properties from increased tax assessments;
|
49
|
•
|
reduced by approximately $360,000 from the sale of operating properties.
|
The following table presents the components of other expense (income):
|
(in thousands)
|
2015
|
2014
|
Change
|
|||||||
|
Interest expense, net
|
||||||||||
|
Interest on notes payable
|
98,485
|
|
104,938
|
|
(6,453
|
)
|
||||
|
Interest on unsecured credit facilities
|
3,566
|
|
3,539
|
|
27
|
|
||||
|
Capitalized interest
|
(6,739
|
)
|
(7,142
|
)
|
403
|
|
||||
|
Hedge expense
|
8,900
|
|
9,366
|
|
(466
|
)
|
||||
|
Interest income
|
(1,590
|
)
|
(1,210
|
)
|
(380
|
)
|
||||
|
Interest expense, net
|
102,622
|
|
109,491
|
|
(6,869
|
)
|
||||
|
Provision for impairment
|
—
|
|
1,257
|
|
(1,257
|
)
|
||||
|
Early extinguishment of debt
|
8,239
|
|
18
|
|
8,221
|
|
||||
|
Net investment income
|
(625
|
)
|
(9,449
|
)
|
8,824
|
|
||||
|
Gain on remeasurement of investment in real estate partnership
|
—
|
|
(18,271
|
)
|
18,271
|
|
||||
|
Total other expense (income)
|
$
|
110,236
|
|
83,046
|
|
27,190
|
|
|||
The $6.9 million decrease in interest expense, net is mainly due to lower interest rates from refinancing our long-term debt during 2014 and 2015 and lower outstanding balances on notes payable.
We had no impairment losses during 2015. However, during the year ended December 31, 2014, we recognized a $1.1 million loss on the disposal of one operating property and one land parcel and a $175,000 impairment on two parcels of land held.
During November 2015, we incurred an $8.2 million charge from a make-whole premium on our $100.0 million early redemption of the $400.0 million outstanding 5.875% senior unsecured notes that are due in 2017.
Net investment income decreased $8.8 million, largely driven by an $8.1 million gain realized on the sale of available-for-sale securities in 2014 and a
$1.1
million decrease in the fair value of plan assets in the non-qualified deferred compensation plan during 2015, which is consistent with the change in plan liabilities included in general and administrative expenses above.
During the year ended December 31, 2014, we acquired the remaining 50% interest and gained control of a previously unconsolidated investment in a real estate partnership that owns a single operating property. As the operating property constitutes a business, acquisition of control was accounted for as a step acquisition, and the net assets acquired were recognized at fair value. The gain of $18.3 million was recognized as the difference between the fair value and carrying value of the Company's previously held equity interest, using an income approach to measure fair value.
50
Our equity in income of investments in real estate partnerships increased (decreased) as follows:
|
(in thousands)
|
Regency's Ownership
|
2015
|
2014
|
Change
|
||||||||
|
GRI - Regency, LLC (GRIR)
|
40.00%
|
$
|
18,148
|
|
13,727
|
|
4,421
|
|
||||
|
Columbia Regency Retail Partners, LLC (Columbia I)
|
20.00%
|
(278
|
)
|
1,431
|
|
(1,709
|
)
|
|||||
|
Columbia Regency Partners II, LLC (Columbia II)
|
20.00%
|
755
|
|
233
|
|
522
|
|
|||||
|
Cameron Village, LLC (Cameron)
|
30.00%
|
643
|
|
1,008
|
|
(365
|
)
|
|||||
|
RegCal, LLC (RegCal)
|
25.00%
|
576
|
|
966
|
|
(390
|
)
|
|||||
|
US Regency Retail I, LLC (USAA)
|
20.01%
|
807
|
|
567
|
|
240
|
|
|||||
|
Other investments in real estate partnerships
|
50.00%
|
1,857
|
|
13,338
|
|
(11,481
|
)
|
|||||
|
Total equity in income of investments in real estate partnerships
|
$
|
22,508
|
|
31,270
|
|
(8,762
|
)
|
|||||
The $8.8 million net decrease is largely attributed to:
GRIR
:
$4.4 million increase driven by:
|
•
|
$1.3 million increase in base rent from occupancy and rental rate growth,
|
|
•
|
$1.8 million decrease in depreciation due to higher depreciation expense in 2014 relating to redevelopment activity,
|
|
•
|
Reduced interest expense approximately $800,000 by paying off or refinancing property debt at better rates in 2014 and 2015.
|
Columbia I
:
$1.8 million decrease from impairment loss upon the sale of one operating property during 2015;
Columbia II
:
$424,000 increase due to impairment losses recognized upon the sale of two properties during 2014; and
Other investments in real estate partnerships
:
$11.4 million decrease within our other investment partnerships driven by the $10.9 million gains on the sale of two land parcels and two operating properties during 2014.
The following represents the remaining components that comprise net income attributable to the common stockholders and unit holders:
|
(in thousands)
|
2015
|
2014
|
Change
|
|||||||
|
Income from operations
|
$
|
116,937
|
|
132,774
|
|
(15,837
|
)
|
|||
|
Income tax (benefit) of taxable REIT subsidiary
|
—
|
|
(996
|
)
|
996
|
|
||||
|
Gain on sale of real estate, net of tax
|
35,606
|
|
55,077
|
|
(19,471
|
)
|
||||
|
Income attributable to noncontrolling interests
|
(2,487
|
)
|
(1,457
|
)
|
(1,030
|
)
|
||||
|
Preferred stock dividends
|
(21,062
|
)
|
(21,062
|
)
|
—
|
|
||||
|
Net income attributable to common stockholders
|
$
|
128,994
|
|
166,328
|
|
(37,334
|
)
|
|||
|
Net income attributable to exchangeable operating partnership units
|
240
|
|
319
|
|
(79
|
)
|
||||
|
Net income attributable to common unit holders
|
$
|
129,234
|
|
166,647
|
|
(37,413
|
)
|
|||
A $1.0 million tax benefit was recognized in 2014 upon the receipt of a state tax refund from amending our prior tax returns.
We recognized $35.6 million of gains on the sale of real estate, net of taxes, in 2015 attributable to the sale of five operating properties and two land parcels as compared to $55.1 million of gains on the sale of real estate, net of taxes, in 2014 attributable to the sale of eleven operating properties and six land parcels.
Income attributable to noncontrolling interests increased $1.0 million due to to the 2014 acquisition of a portfolio held within a consolidated partnership, coupled with new operating activity from a development beginning operations, and a recent redevelopment completion within our consolidated partnerships.
51
Supplemental Earnings Information
We use certain non-GAAP performance measures, in addition to the required GAAP presentations, as we believe these measures improve the understanding of the Company's operating results. We manage our entire real estate portfolio without regard to ownership structure, although certain decisions impacting properties owned through partnerships require partner approval. Therefore, we believe presenting our pro-rata share of operating results regardless of ownership structure, along with other non-GAAP measures, may assist in comparing the Company's operating results to other REITs'. We continually evaluate the usefulness, relevance, limitations, and calculation of our reported non-GAAP performance measures to determine how best to provide relevant information to the public, and thus such reported measures could change.
Pro-Rata Same Property NOI:
Our pro-rata same property NOI, excluding termination fees, grew from the following major components:
|
(in thousands)
|
2016
|
2015
|
Change
|
|||||||
|
Base rent
|
$
|
486,776
|
|
473,468
|
|
13,308
|
|
|||
|
Percentage rent
|
5,213
|
|
4,943
|
|
270
|
|
||||
|
Recovery revenue
|
144,383
|
|
142,189
|
|
2,194
|
|
||||
|
Other income
|
11,243
|
|
7,758
|
|
3,485
|
|
||||
|
Operating expenses
|
178,117
|
|
176,326
|
|
1,791
|
|
||||
|
Pro-rata same property NOI
(1)
|
$
|
469,498
|
|
452,032
|
|
17,466
|
|
|||
|
Less: Termination fees
|
1,224
|
|
(319
|
)
|
1,543
|
|
||||
|
Pro-rata same property NOI excluding termination fees
|
$
|
468,274
|
|
452,351
|
|
15,923
|
|
|||
|
Same property NOI growth
|
3.5
|
%
|
||||||||
(1)
See the end of the Supplemental Earnings Information section for a reconciliation to the nearest GAAP measure.
Base rent increased
$13.3 million
, driven by increases at redevelopments and increases in rental rate growth on new and renewal leases and contractual rent steps in our existing leases, with occupancy remaining flat.
Recovery revenue increased
$2.2 million
, as a result of increases in recoverable costs, as noted below.
Other income increased
$3.5 million
, as a result of lease termination fees, easement sales, and settlements in 2016.
Operating expenses increased
$1.8 million
, due to higher recoverable costs.
Same Property Rollforward:
Our same property pool includes the following property count, pro-rata GLA, and changes therein:
|
2016
|
2015
|
||||||||
|
(GLA in thousands)
|
Property Count
|
GLA
|
Property Count
|
GLA
|
|||||
|
Beginning same property count
|
300
|
|
26,508
|
|
298
|
|
25,526
|
|
|
|
Acquired properties owned for entirety of comparable periods
|
6
|
|
443
|
|
4
|
|
427
|
|
|
|
Developments that reached completion by beginning of earliest comparable period presented
|
2
|
|
342
|
|
3
|
|
790
|
|
|
|
Disposed properties
|
(19
|
)
|
(933
|
)
|
(5
|
)
|
(260
|
)
|
|
|
SF adjustments
(1)
|
—
|
|
32
|
|
—
|
|
25
|
|
|
|
Ending same property count
|
289
|
|
26,392
|
|
300
|
|
26,508
|
|
|
(1)
SF adjustments arise from remeasurements or redevelopments.
52
NAREIT FFO and Core FFO:
Our reconciliation of net income attributable to common stock and unit holders to NAREIT FFO and Core FFO is as follows:
|
(in thousands, except share information)
|
2016
|
2015
|
||||
|
Reconciliation of Net income to NAREIT FFO
|
||||||
|
Net income attributable to common stockholders
|
$
|
143,860
|
|
128,994
|
|
|
|
Adjustments to reconcile to NAREIT FFO:
(1)
|
||||||
|
Depreciation and amortization (excluding FF&E)
|
193,451
|
|
182,103
|
|
||
|
Provision for impairment to operating properties
|
3,159
|
|
1,820
|
|
||
|
Gain on sale of operating properties, net of tax
|
(63,426
|
)
|
(36,642
|
)
|
||
|
Exchangeable partnership units
|
257
|
|
240
|
|
||
|
NAREIT FFO attributable to common stock and unit holders
|
$
|
277,301
|
|
276,515
|
|
|
|
Reconciliation of NAREIT FFO to Core FFO
|
||||||
|
NAREIT FFO attributable to common stock and unit holders
|
$
|
277,301
|
|
276,515
|
|
|
|
Adjustments to reconcile to Core FFO:
(1)
|
||||||
|
Acquisition pursuit and closing costs
|
2,007
|
|
1,734
|
|
||
|
Development pursuit costs
|
1,503
|
|
675
|
|
||
|
Merger related costs
|
6,539
|
|
—
|
|
||
|
Gain on sale of land
|
(8,769
|
)
|
(73
|
)
|
||
|
Provision for impairment to land
|
580
|
|
—
|
|
||
|
Loss on derivative instruments and hedge ineffectiveness
|
40,589
|
|
5
|
|
||
|
Early extinguishment of debt
|
14,207
|
|
8,239
|
|
||
|
Change in executive management
|
—
|
|
2,193
|
|
||
|
Dividends from investments
|
—
|
|
(416
|
)
|
||
|
Core FFO attributable to common stockholders
|
$
|
333,957
|
|
288,872
|
|
|
(1)
Includes Regency's pro-rata share of unconsolidated investment partnerships, net of pro-rata share attributable to noncontrolling interests.
53
Reconciliation of Same Property NOI to Nearest GAAP Measure:
Our reconciliation of property revenues and property expenses to Same Property NOI, on a pro-rata basis, is as follows:
|
2016
|
2015
|
||||||||||||||||||
|
(in thousands)
|
Same Property
|
Other
(1)
|
Total
|
Same Property
|
Other
(1)
|
Total
|
|||||||||||||
|
Income from operations
|
$
|
271,588
|
|
(151,917
|
)
|
119,671
|
|
235,125
|
|
(118,188
|
)
|
116,937
|
|
||||||
|
Less:
|
|||||||||||||||||||
|
Management, transaction, and other fees
|
—
|
|
25,327
|
|
25,327
|
|
—
|
|
25,563
|
|
25,563
|
|
|||||||
|
Other
(2)
|
5,130
|
|
11,014
|
|
16,144
|
|
8,063
|
|
8,126
|
|
16,189
|
|
|||||||
|
Plus:
|
|||||||||||||||||||
|
Depreciation and amortization
|
140,848
|
|
21,479
|
|
162,327
|
|
135,075
|
|
11,754
|
|
146,829
|
|
|||||||
|
General and administrative
|
—
|
|
65,327
|
|
65,327
|
|
—
|
|
65,600
|
|
65,600
|
|
|||||||
|
Other operating expense, excluding provision for doubtful accounts
|
1,395
|
|
10,981
|
|
12,376
|
|
597
|
|
4,875
|
|
5,472
|
|
|||||||
|
Other expense (income)
|
29,560
|
|
118,506
|
|
148,066
|
|
28,424
|
|
81,812
|
|
110,236
|
|
|||||||
|
Equity in income (loss) of investments in real estate excluded from NOI
(3)
|
31,237
|
|
2,715
|
|
33,952
|
|
60,874
|
|
6,298
|
|
67,172
|
|
|||||||
|
Pro-rata NOI
|
$
|
469,498
|
|
30,750
|
|
500,248
|
|
452,032
|
|
18,462
|
|
470,494
|
|
||||||
(1)
Includes revenues and expenses attributable to non-same property, sold property, development property, and corporate activities.
(2)
Includes straight-line rental income, net of reserves, above and below market rent amortization, other fees, and noncontrolling interest.
(3)
Includes non-NOI expenses incurred at our unconsolidated real estate partnerships, including those separated out above for our consolidated properties.
54
Liquidity and Capital Resources
General
We use cash flows generated from operating, investing, and financing activities to strengthen our balance sheet and reduce risk, finance our development and redevelopment projects, fund our targeted investments, and maintain financial flexibility. We continuously monitor the capital markets and evaluate our ability to issue new debt or equity to repay maturing debt or fund our capital commitments
Our Parent Company has no capital commitments other than its guarantees of the commitments of our Operating Partnership. The Parent Company will from time to time access the capital markets for the purpose of issuing new equity and will simultaneously contribute all of the offering proceeds to the Operating Partnership in exchange for additional partnership units. All debt is issued by our Operating Partnership or by our co-investment partnerships. Based upon our available sources of capital, our current credit ratings, and the number of high quality, unencumbered properties we own, we believe our available capital resources are sufficient to meet our expected capital needs. In addition to its
$13.3 million
of cash, the Company has the following additional sources of capital available:
|
(in thousands)
|
December 31, 2016
|
|||
|
ATM equity program (see note 8)
|
||||
|
Original offering amount
|
$
|
200,000
|
|
|
|
Available capacity
|
$
|
70,800
|
|
|
|
Forward Equity Offering
|
||||
|
Original offering amount
|
$
|
233,300
|
|
|
|
Available equity offering to settle
(1)
|
$
|
94,063
|
|
|
|
Line of Credit (the "Line") (see note 6)
|
||||
|
Total commitment amount
|
$
|
800,000
|
|
|
|
Available capacity
(2)
|
$
|
779,200
|
|
|
|
Maturity
(3)
|
May 13, 2019
|
|||
|
(1)
We have 1.25 million shares to settle prior to June 23, 2017 at an offering price of $75.25 per share before any underwriting discount and offering expenses.
|
||||
|
(2)
Net of letters of credit.
|
||||
|
(3)
The Company has the option to extend the maturity for two additional six-month periods.
|
||||
We operate our business such that we expect net cash flow from operating activities will provide the necessary funds to pay our distributions to our common and preferred stock and unit holders, which were
$222.4 million
and
$202.8 million
for the years ended
December 31, 2016
and
2015
, respectively. Our dividend distribution policy is set by our Board of Directors, who monitors our financial position. Our Board of Directors recently declared a common stock dividend of
$0.51
per share, payable on March 1,
2017
. Future dividends will be declared at the discretion of our Board of Directors and will be subject to capital requirements and availability. We plan to continue paying an aggregate amount of distributions to our stock and unit holders that, at a minimum, meet the requirements to continue qualifying as a REIT for federal income tax purposes.
During the next twelve months, we estimate that we will require approximately
$240.2 million
of cash, including
$149.9 million
to complete in-process developments and redevelopments,
$86.3 million
to repay maturing debt, and
$4.0 million
to fund our pro-rata share of estimated capital contributions to our co-investment partnerships for repayment of maturing debt. If we start new developments, redevelop additional shopping centers, or commit to new acquisitions, our cash requirements will increase. If we refinance maturing debt, our cash requirements will decrease. To meet our cash requirements, we may utilize cash generated from operations, proceeds from the sale of real estate, available borrowings from our Line, and when the capital markets are favorable, proceeds from the sale of equity and the issuance of new long-term debt. These estimated needs reflect Regency's needs as a stand-alone entity and is not meant to reflect or give effect to the pending merger with Equity One.
We endeavor to maintain a high percentage of unencumbered assets. As of
December 31, 2016
, 83.0% of our wholly-owned real estate assets were unencumbered. Such assets allow us to access the secured and unsecured debt markets and to
55
maintain availability on the Line. Our coverage ratio, including our pro-rata share of our partnerships, was 3.3 and 2.8 times for the trailing four quarters ended
December 31, 2016
and
December 31, 2015
, respectively. We define our coverage ratio as earnings before interest, taxes, investment transaction profits net of deal costs, depreciation and amortization (“Core EBITDA”) divided by the sum of the gross interest and scheduled mortgage principal paid to our lenders plus dividends paid to our preferred stockholders.
Our Line, Term Loan, and unsecured loans require that we remain in compliance with various covenants, which are
described in note 6 to the Consolidated Financial Statements. We are in compliance with these covenants at
December 31, 2016
and expect to remain in compliance.
Subsequent Events
Subsequent to
December 31, 2016
, the Company priced a public offering of two tranches of senior unsecured notes:
|
•
|
$350.0 million
of
3.6%
notes due
February 1, 2027
, which priced at
99.741%
. The Company intends to use the net proceeds in connection with the consummation of the previously announced pending merger with Equity One, Inc., including (i) to repay approximately
$285.0 million
in aggregate principal amount of debt of Equity One, and any related interest, fees and expenses and (ii) to pay transaction expenses related to the pending merger with Equity One. In the event that the merger agreement is not consummated, we will be required to redeem these notes then outstanding at a redemption price equal to 101% of the principal amount to be redeemed plus accrued and unpaid interest, if any.
|
|
•
|
$300.0 million
of
4.4%
notes due
February 1, 2047
, which priced at
99.110%
. The Company used a portion of the net proceeds to redeem all of the outstanding shares of its
6.625%
Series 6 preferred shares on February 16, 2017 and intends to use the balance to fund investment activities and for general corporate purposes.
|
In connection with the pending Merger, the Company has commitments to (i) amend its Line by increasing the borrowing capacity to
$1.0 billion
and (ii) enter a new
$300.0 million
term loan facility. Both of these transactions are contingent upon the consummation of the Merger and are scheduled to close simultaneously with the Merger. The Company plans to use the proceeds from the new term loan to repay existing term loans held by Equity One. The additional line capacity will accommodate the Company's increased property operations and development / redevelopment programs from the Merger.
Summary of Cash Flow Activity
The following table summarizes net cash flows related to operating, investing, and financing activities of the Company:
|
(in thousands)
|
2016
|
2015
|
Change
|
|||||||
|
Net cash provided by operating activities
|
$
|
289,376
|
|
275,637
|
|
13,739
|
|
|||
|
Net cash used in investing activities
|
(409,671
|
)
|
(139,346
|
)
|
(270,325
|
)
|
||||
|
Net cash provided by (used in) financing activities
|
96,695
|
|
(213,211
|
)
|
309,906
|
|
||||
|
Net decrease in cash and cash equivalents
|
(23,600
|
)
|
(76,920
|
)
|
53,320
|
|
||||
|
Total cash and cash equivalents
|
$
|
13,256
|
|
36,856
|
|
(23,600
|
)
|
|||
Net cash provided by operating activities
:
Net cash provided by operating activities increased by
$13.7 million
due to:
|
•
|
$32.4 million
increase in cash from operating income;
|
|
•
|
$3.7 million
increase in operating cash flow distributions received from our unconsolidated real estate partnerships as several redevelopment projects were completed and began generating operating cash flows; and,
|
|
•
|
$11.0 million
net increase in cash due to timing of cash receipts and payments related to operating activities; offset by
|
|
•
|
$40.6 million and
$7.3 million
paid during 2016 and 2015, respectively, to settle forward starting interest rate swaps put in place to hedge changes in interest rates on expected issuance of ten year fixed rate debt. The $40.6 million paid in 2016 was recognized through net income since the previously forecasted debt transaction was probable to no longer occur. The $7.3 million paid in 2015 was recognized in Other comprehensive income and is being reclassified to earnings over the period of the ten year debt issued in 2015.
|
56
Net cash used in investing activities:
Net cash used in investing activities increased by
$270.3 million
as follows:
|
(in thousands)
|
2016
|
2015
|
Change
|
|||||||
|
Cash flows from investing activities:
|
||||||||||
|
Acquisition of operating real estate
|
$
|
(333,220
|
)
|
(42,983
|
)
|
(290,237
|
)
|
|||
|
Advance deposits paid on acquisition of operating real estate
|
(750
|
)
|
(2,250
|
)
|
1,500
|
|
||||
|
Real estate development and capital improvements
|
(234,598
|
)
|
(205,103
|
)
|
(29,495
|
)
|
||||
|
Proceeds from sale of real estate investments
|
135,269
|
|
108,822
|
|
26,447
|
|
||||
|
Collection of notes receivable
|
—
|
|
1,719
|
|
(1,719
|
)
|
||||
|
Investments in real estate partnerships
|
(37,879
|
)
|
(20,054
|
)
|
(17,825
|
)
|
||||
|
Distributions received from investments in real estate partnerships
|
58,810
|
|
23,801
|
|
35,009
|
|
||||
|
Dividends on investment securities
|
330
|
|
243
|
|
87
|
|
||||
|
Acquisition of securities
|
(55,223
|
)
|
(31,941
|
)
|
(23,282
|
)
|
||||
|
Proceeds from sale of securities
|
57,590
|
|
28,400
|
|
29,190
|
|
||||
|
Net cash used in investing activities
|
$
|
(409,671
|
)
|
(139,346
|
)
|
(270,325
|
)
|
|||
Significant investing and divesting activities included:
|
•
|
We acquired three shopping centers, with
569,000
SF of GLA in
2016
, compared to one shopping center with
180,000
SF of GLA during
2015
.
|
|
•
|
We invested
$29.5 million
more in 2016 than 2015 on real estate development and capital improvements, as further detailed in a table below.
|
|
•
|
We received proceeds of
$135.3 million
from the sale of
eleven
shopping centers and
sixteen
land parcels in
2016
, compared to
$108.8 million
for
five
shopping centers and
two
land parcels in
2015
.
|
|
•
|
We invested
$17.8 million
more in our unconsolidated partnerships during
2016
than
2015
due to the acquisition of an operating property in
2016
. Contributions were made each year to fund our share of maturing mortgage debt and redevelopment activities.
|
|
•
|
Distributions received from our unconsolidated partnerships include return of capital from sales or financing proceeds. The
$58.8 million
received in
2016
includes proceeds from the sales of ten shopping centers with co-investment partners. Distributions in
2015
include $12.8 million of proceeds from the sale of one shopping center with a co-investment partner and $11.0 million of financing proceeds.
|
|
•
|
Acquisition of securities and proceeds from sale of securities pertain to equity and debt securities held by our captive insurance company and our deferred compensation plan. The majority of our investing activity during 2016 relates to reallocation of plan assets. During 2015, we invested $7.9 million of funds held in our captive insurance subsidiary in available-for-sale marketable securities. Our insurance subsidiary is required to maintain statutory minimum capital and surplus, and therefore, access to these securities may be limited.
|
57
We plan to continue developing and redeveloping shopping centers for long-term investment purposes. We deployed capital of
$234.6 million
for the development, redevelopment, and improvement of our real estate properties as comprised of the following:
|
(in thousands)
|
2016
|
2015
|
Change
|
|||||||
|
Capital expenditures:
|
||||||||||
|
Land acquisitions for development / redevelopment
|
$
|
26,938
|
|
5,135
|
|
21,803
|
|
|||
|
Building and tenant improvements
|
32,941
|
|
30,103
|
|
2,838
|
|
||||
|
Redevelopment costs
|
51,226
|
|
50,933
|
|
293
|
|
||||
|
Development costs
|
107,300
|
|
100,111
|
|
7,189
|
|
||||
|
Capitalized interest
|
3,482
|
|
6,740
|
|
(3,258
|
)
|
||||
|
Capitalized direct compensation
|
12,711
|
|
12,081
|
|
630
|
|
||||
|
Real estate development and capital improvements
|
$
|
234,598
|
|
205,103
|
|
29,495
|
|
|||
|
•
|
During
2016
we acquired
four
land parcels for new development projects as compared to two in
2015
.
|
|
•
|
Building and tenant improvements increased
$2.8 million
during the
year ended December 31, 2016
primarily related to timing of capital projects.
|
|
•
|
Redevelopment expenditures were slightly higher during
2016
due to the timing, magnitude, and number of projects currently in process. We intend to continuously improve our portfolio of shopping centers through redevelopment which can include adjacent land acquisition, existing building expansion, new out-parcel
|
building construction, and tenant improvement costs. The size and scope of each redevelopment project
varies with each redevelopment plan.
|
•
|
The
$7.2 million
increase in our development project expenditures was due to the size of and progress on developments. See the table below for a detail of current and recently completed development projects.
|
|
•
|
Interest is capitalized on our development and redevelopment projects and is based on cumulative actual
|
development costs expended. We cease interest capitalization when the property is no longer being
developed or is available for occupancy upon substantial completion of tenant improvements, but in no event
would we capitalize interest on the project beyond 12 months after the anchor opens for business. Capitalized
interest decreased in 2016 as compared to 2015 as our development or redevelopment projects neared
substantial completion and we commenced fewer new projects during the first half of
2016
.
|
•
|
We have a staff of employees who directly support our development and redevelopment program. Internal
|
compensation costs directly attributable to these activities are capitalized as part of each project. Changes in
the level of future development and redevelopment activity could adversely impact results of operations by
reducing the amount of internal costs for development and redevelopment projects that may be capitalized. A
10% reduction in development and redevelopment activity without a corresponding reduction in the
compensation costs directly related to our development and redevelopment activities could result in an
additional charge to net income of $1.4 million per year.
The following table summarizes our development projects:
|
December 31, 2016
|
||||||||||||||||||||||
|
(in thousands, except cost PSF)
|
||||||||||||||||||||||
|
Property Name
|
Market
|
Start Date
|
Estimated/Actual Anchor Opens
|
Estimated Net Development Costs
(1)
|
% of Costs Incurred
(1)
|
GLA
|
Cost PSF GLA
(1)
|
|||||||||||||||
|
Willow Oaks Crossing
|
Charlotte, NC
|
Q2-14
|
Dec-15
|
$
|
13,996
|
|
99
|
%
|
69
|
|
203
|
|
||||||||||
|
Northgate Marketplace Ph II
|
Medford, OR
|
Q4-15
|
Oct-16
|
40,700
|
|
91
|
%
|
177
|
|
230
|
|
|||||||||||
|
Market at Springwoods Village
(2)
|
Houston, TX
|
Q1-16
|
May-17
|
28,192
|
|
50
|
%
|
89
|
|
317
|
|
|||||||||||
|
The Village at Tustin Legacy
|
Los Angeles, CA
|
Q3-16
|
Oct-17
|
37,822
|
|
50
|
%
|
112
|
|
338
|
|
|||||||||||
|
Chimney Rock Crossing
|
New York, NY
|
Q4-16
|
May-18
|
71,175
|
|
27
|
%
|
218
|
|
326
|
|
|||||||||||
|
The Village at Riverstone
|
Houston, TX
|
Q4-16
|
Aug-18
|
30,638
|
|
42
|
%
|
165
|
|
186
|
|
|||||||||||
|
$
|
222,523
|
|
52
|
%
|
830
|
|
$
|
268
|
|
|||||||||||||
(1)
Includes leasing costs, and is net of tenant reimbursements.
58
(2)
Estimated Net Development Costs are reported at full project cost. Our ownership interest in this consolidated property is 53%.
The following table summarizes our completed development projects:
|
December 31, 2016
|
|||||||||||||||
|
(in thousands, except cost PSF)
|
|||||||||||||||
|
Property Name
|
Market
|
Completion Date
|
Net Development Costs
(1)
|
GLA
|
Cost PSF GLA
(1)
|
||||||||||
|
Belmont Chase
|
Washington, DC
|
Q1-16
|
$
|
28,308
|
|
91
|
|
$
|
311
|
|
|||||
|
CityLine Market
|
Dallas, TX
|
Q1-16
|
27,861
|
|
81
|
|
344
|
|
|||||||
|
Village at La Floresta
|
Los Angeles, CA
|
Q2-16
|
32,451
|
|
87
|
|
373
|
|
|||||||
|
Brooklyn Station on Riverside
|
Jacksonville, FL
|
Q3-16
|
14,987
|
|
50
|
|
300
|
|
|||||||
|
CityLine Market Ph II
|
Dallas, TX
|
Q4-16
|
5,597
|
|
22
|
|
$
|
254
|
|
||||||
|
Total
|
$
|
109,204
|
|
331
|
|
$
|
330
|
|
|||||||
(1)
Includes leasing costs and is net of tenant reimbursements.
Net cash provided by (used in) financing activities
:
Net cash flows generated from financing activities increased by
$309.9 million
during
2016
, as follows:
|
(in thousands)
|
2016
|
2015
|
Change
|
|||||||
|
Cash flows from financing activities:
|
||||||||||
|
Equity issuances
|
$
|
548,920
|
|
198,494
|
|
350,426
|
|
|||
|
Distributions to limited partners in consolidated partnerships, net
|
(4,213
|
)
|
(5,341
|
)
|
1,128
|
|
||||
|
Dividend payments
|
(222,398
|
)
|
(202,753
|
)
|
(19,645
|
)
|
||||
|
Unsecured credit facilities
|
115,000
|
|
90,000
|
|
25,000
|
|
||||
|
Proceeds from debt issuance
|
53,446
|
|
252,476
|
|
(199,030
|
)
|
||||
|
Debt repayment
|
(392,755
|
)
|
(540,089
|
)
|
147,334
|
|
||||
|
Payment of loan costs
|
(2,233
|
)
|
(5,998
|
)
|
3,765
|
|
||||
|
Proceeds from sale of treasury stock, net
|
928
|
|
—
|
|
928
|
|
||||
|
Net cash provided by (used in) financing activities
|
$
|
96,695
|
|
(213,211
|
)
|
309,906
|
|
|||
Significant financing activities during the years ended
December 31, 2016
and
2015
include the following:
|
•
|
We raised
$548.9 million
during 2016 through equity issuances:
|
|
◦
|
we issued
182,787
shares of common stock through our ATM program at an average price of
$68.85
per share resulting in net proceeds of
$12.3 million
,
|
|
◦
|
we settled
1.85 million
shares under our forward equity offering at an average price of $74.32 per share resulting in proceeds of
$137.5 million
, and
|
|
◦
|
we issued
5.0 million
shares of common stock at
$79.78
per share resulting in net proceeds of
$400.1 million
.
|
During 2015, we issued 2.9 million shares of common stock at an average price of $64.71 in an underwritten forward public equity offering that settled in November 2015 resulting in net proceeds of $185.8 million. Additionally, we issued
189,266
shares of common stock through our ATM program at an average price of
$67.86
per share resulting in net proceeds of
$12.7 million
.
|
•
|
The change in distributions paid to limited partners in consolidated partnerships, net, primarily relates to the buyout of a limited partner's interest during 2015.
|
|
•
|
During 2016, our dividend payments increased as a result of the greater number of common shares outstanding and an increase in our dividend rate.
|
59
|
•
|
We received proceeds of $100.0 million upon expanding our Term Loan during 2016 which were used to partially fund the acquisition of Market Common Clarendon, and repay $15.0 million, net on the Line as compared to
$90.0 million
borrowed on from our Term Loan during 2015.
|
|
•
|
We received
$53.4 million
of mortgage proceeds in 2016 upon the encumbrance of two operating properties. During 2015, we issued $250.0 million of new fixed rate ten-year unsecured public debt.
|
|
•
|
During 2016, we used
$392.8 million
to repay debt, including:
|
|
◦
|
$300.0 million
for the early redemption of our $300 million notes due 2017,
|
|
◦
|
$14.1 million
paid for debt extinguishment costs, including a make-whole premium to redeem the $300 million notes, and
|
|
◦
|
$78.7 million
for scheduled principal payments and four mortgage repayments.
|
During 2015, we used
$540.1 million
to repay debt, including:
|
◦
|
$350.0 million to redeem our notes that matured in 2015 and $108.0 million, including an $8.0 million make-whole premium, to redeem a portion of our notes due 2017, and
|
|
◦
|
$82.0 million
for scheduled principal payments and three mortgage repayments.
|
|
•
|
We paid
$2.2 million
in loan closing costs during 2016, primarily to amend the Term Loan, while we paid
$6.0 million
during 2015 for the new fixed rate unsecured public debt and the modification to our Line.
|
60
Contractual Obligations
We have debt obligations related to our mortgage loans, unsecured notes, unsecured credit facilities and interest rate swap obligations as described further below and in note 6 and note 7 to the Consolidated Financial Statements. We have shopping centers that are subject to non-cancelable long-term ground leases where a third party owns and has leased the underlying land to us to construct and/or operate a shopping center. In addition, we have non-cancelable operating leases pertaining to office space from which we conduct our business.
The following table of Contractual Obligations summarizes our debt maturities, including our pro-rata share of obligations within co-investment partnerships as of
December 31, 2016
, and excludes the following:
|
•
|
Recorded debt premiums or discounts that are not obligations;
|
|
•
|
Obligations related to construction or development contracts, since payments are only due upon satisfactory performance under the contracts;
|
|
•
|
Letters of credit of
$5.8 million
issued to cover our captive insurance program and performance obligations on certain development projects, which the latter will be satisfied upon completion of the development projects; and
|
|
•
|
Obligations for retirement savings plans due to uncertainty around timing of participant withdrawals, which are solely within the control of the participant, and are further discussed in note 11 to the Consolidated Financial Statements.
|
|
Payments Due by Period
|
|||||||||||||||||||||||
|
(in thousands)
|
2017
|
2018
|
2019
|
2020
|
2021
|
Beyond 5 Years
|
Total
|
||||||||||||||||
|
Notes payable:
|
|||||||||||||||||||||||
|
Regency
(1)
|
$
|
161,440
|
|
127,262
|
|
184,022
|
|
286,971
|
|
323,262
|
|
904,803
|
|
$
|
1,987,760
|
|
|||||||
|
Regency's share of joint ventures
(1) (2)
|
32,550
|
|
48,851
|
|
41,381
|
|
102,286
|
|
94,726
|
|
270,555
|
|
590,349
|
|
|||||||||
|
Operating leases:
|
|||||||||||||||||||||||
|
Regency - office leases
|
4,017
|
|
3,518
|
|
3,482
|
|
3,314
|
|
2,992
|
|
9,410
|
|
26,733
|
|
|||||||||
|
Subleases:
|
|||||||||||||||||||||||
|
Regency - office leases
|
(46
|
)
|
—
|
|
—
|
|
—
|
|
—
|
|
—
|
|
(46
|
)
|
|||||||||
|
Ground leases:
|
|||||||||||||||||||||||
|
Regency
|
5,769
|
|
7,946
|
|
8,649
|
|
8,392
|
|
8,298
|
|
433,066
|
|
472,120
|
|
|||||||||
|
Regency's share of joint ventures
|
385
|
|
385
|
|
391
|
|
392
|
|
392
|
|
18,713
|
|
20,658
|
|
|||||||||
|
Total
|
$
|
204,115
|
|
187,962
|
|
237,925
|
|
401,355
|
|
429,670
|
|
1,636,547
|
|
$
|
3,097,574
|
|
|||||||
(1)
Includes interest payments.
(2)
We are obligated to contribute our pro-rata share to fund maturities if they are not refinanced. We believe that our partners are financially sound and have sufficient capital or access thereto to fund future capital requirements. In the event that a co-investment partner was unable to fund its share of the capital requirements of the co-investment partnership, we would have the right, but not the obligation, to loan the defaulting partner the amount of its capital call.
Critical Accounting Estimates
Knowledge about our accounting policies is necessary for a complete understanding of our financial statements. The preparation of our financial statements requires that we make certain estimates that impact the balance of assets and liabilities as of a financial statement date and the reported amount of income and expenses during a financial reporting period. These accounting estimates are based upon, but not limited to, our judgments about historical and expected future results, current market conditions, and interpretation of industry accounting standards. They are considered to be critical because of their significance to the financial statements and the possibility that future events may differ from those judgments, or that the use of different assumptions could result in materially different estimates. We review these estimates on a periodic basis to ensure reasonableness; however, the amounts we may ultimately realize could differ from such estimates.
61
Accounts Receivable and Straight Line Rent
Minimum rent, percentage rent, and expense recoveries from tenants for common area maintenance costs, insurance and real estate taxes are the Company's principal source of revenue. As a result of generating this revenue, we will routinely have accounts receivable due from tenants. We are subject to tenant defaults and bankruptcies that may affect the collection of outstanding receivables. To address the collectability of these receivables, we analyze historical tenant collection rates, write-off experience, tenant credit-worthiness and current economic trends when evaluating the adequacy of our allowance for doubtful accounts and straight line rent reserve. Although we estimate uncollectible receivables and provide for them through charges against income, actual experience may differ from those estimates.
Real Estate Investments
Acquisition of Real Estate Investments
Upon acquisition of real estate operating properties, the Company estimates the fair value of acquired tangible assets (consisting of land, building, building improvements and tenant improvements) and identified intangible assets and liabilities (consisting of above and below-market leases and in-place leases), assumed debt, and any noncontrolling interest in the acquiree at the date of acquisition, based on evaluation of information and estimates available at that date. Based on these estimates, the Company allocates the estimated fair value to the applicable assets and liabilities. Fair value is determined based on an exit price approach, which contemplates the price that would be received to sell an asset or paid to transfer a liability in an orderly transaction between market participants at the measurement date. If, up to one year from the acquisition date, information regarding fair value of the assets acquired and liabilities assumed is received and estimates are refined, appropriate adjustments are made to the purchase price allocation on a retrospective basis. The Company expenses transaction costs associated with business combinations in the period incurred.
We strategically co-invest with partners to own, manage, acquire, develop and redevelop operating properties. We analyze our investments in real estate partnerships in order to determine whether the entity should be consolidated. If it is determined that these investments do not require consolidation because the entities are not variable interest entities (“VIEs”), we are not considered the primary beneficiary of the entities determined to be VIEs, we do not have voting control, and/or the limited partners (or non-managing members) have substantive kick-out or participation rights, then the selection of the accounting method used to account for our investments in real estate partnerships is generally determined by our voting interests and the degree of influence we have over the entity. Management uses its judgment when making these determinations. We use the equity method of accounting for investments in real estate partnerships when we own 20% or more of the voting interests and have significant influence but do not have a controlling financial interest, or if we own less than 20% of the voting interests but have determined that we have significant influence. Under the equity method, we record our investments in and advances to these entities as investments in real estate partnerships in our consolidated balance sheets, and our proportionate share of earnings or losses earned by the joint venture is recognized in equity in income (loss) of investments in real estate partnerships in our consolidated statements of operations.
Development of Real Estate Assets and Cost Capitalization
We capitalize the acquisition of land, the construction of buildings, and other specifically identifiable development costs incurred by recording them in properties in development in our accompanying Consolidated Balance Sheets. Other specifically identifiable development costs include pre-development costs essential to the development process, as well as, interest, real estate taxes, and direct employee costs incurred during the development period. Once a development property is substantially complete and held available for occupancy, these indirect costs are no longer capitalized.
|
•
|
Pre-development costs are incurred prior to land acquisition during the due diligence phase and include contract deposits, legal, engineering, and other professional fees related to evaluating the feasibility of developing a shopping center. If we determine it is probable that a specific project undergoing due diligence will not be developed, we immediately expense all related capitalized pre-development costs not considered recoverable.
|
|
•
|
Interest costs are capitalized to each development project based on applying our weighted average borrowing rate to that portion of the actual development costs expended. We cease interest cost capitalization when the property is no longer being developed or is available for occupancy upon substantial completion of tenant improvements, but in no event would we capitalize interest on the project beyond 12 months after the anchor opens for business. During the years ended
December 31, 2016
,
2015
, and
2014
, we capitalized interest of
$3.5 million
,
$6.7 million
, and
$7.1 million
, respectively, on our development projects.
|
|
•
|
Real estate taxes are capitalized to each development project over the same period as we capitalize interest.
|
|
•
|
We have a staff of employees who directly support our development program. All direct internal costs attributable to these development activities are capitalized as part of each development project. The capitalization of costs is directly
|
62
related to the actual level of development activity occurring. During the years ended
December 31, 2016
,
2015
, and
2014
, we capitalized
$13.0 million
,
$13.8 million
, and
$16.1 million
, respectively, of direct internal costs incurred to support our development program.
Valuation of Real Estate Investments
We evaluate whether there are any indicators that have occurred, including property operating performance and general market conditions, that would result in us determining that the carrying value of our real estate properties (including any related amortizable intangible assets or liabilities) may not be recoverable. If such indicators occur, we compare the current carrying value of the asset to the estimated undiscounted cash flows that are directly associated with the use and ultimate disposition of the asset. Our estimated cash flows are based on several key assumptions, including rental rates, costs of tenant improvements, leasing commissions, anticipated hold period, and assumptions regarding the residual value upon disposition, including the exit capitalization rate. These key assumptions are subjective in nature and the resulting impairment, if any, could differ from the actual gain or loss recognized upon ultimate sale in an arm's length transaction. If the carrying value of the asset exceeds the estimated undiscounted cash flows, an impairment loss is recognized equal to the excess of carrying value over fair value. Changes in our disposition strategy or changes in the marketplace may alter the hold period of an asset or asset group, which may result in an impairment loss and such loss could be material to the Company's financial condition or operating performance.
We evaluate our investments in real estate partnerships for impairment whenever there are indicators, including underlying property operating performance and general market conditions, that the value of our investments in real estate partnerships may be impaired. An investment in a real estate partnerships is considered impaired only if we determine that its fair value is less than the net carrying value of the investment in that real estate partnerships on an other-than-temporary basis. Cash flow projections for the investments consider property level factors, such as expected future operating income, trends and prospects, as well as the effects of demand, competition and other factors. We consider various qualitative factors to determine if a decrease in the value of our investment is other-than-temporary. These factors include the age of the real estate partnerships, our intent and ability to retain our investment in the entity, the financial condition and long-term prospects of the entity and relationships with our partners and banks. If we believe that the decline in the fair value of the investment is temporary, no impairment charge is recorded. If our analysis indicates that there is an other-than-temporary impairment related to the investment in a particular real estate partnership, the carrying value of the investment will be adjusted to an amount that reflects the estimated fair value of the investment.
The fair value of real estate investments is subjective and is determined through comparable sales information and other market data if available, or through use of an income approach such as the direct capitalization or the traditional discounted cash flow methods. Such cash flow projections consider factors such as expected future operating income, trends and prospects, as well as the effects of demand, competition and other factors, and therefore are subject to management judgment and changes in those factors could impact the determination of fair value. In estimating the fair value of undeveloped land, we generally use market data and comparable sales information.
Derivative Instruments
The Company utilizes financial derivative instruments to manage risks associated with changing interest rates. Specifically, the Company enters into derivative financial instruments to manage exposures that arise from business activities that result in the receipt or future payment of known and uncertain cash amounts, the amount of which are determined by interest rates. The Company's derivative financial instruments are used to manage differences in the amount, timing, and duration of the Company's known or expected cash payments principally related to the Company's borrowings. For additional information on the Company’s use and accounting for derivatives, see Notes 1 and 7 to the Consolidated Financial Statements.
The Company assesses effectiveness of our cash flow hedges both at inception and on an ongoing basis. The effective portion of changes in fair value of the interest rate swaps associated with our cash flow hedges is recorded in other comprehensive income which is included in accumulated other comprehensive loss on our consolidated balance sheet and our consolidated statement of equity. Our cash flow hedges become ineffective if critical terms of the hedging instrument and the debt instrument do not perfectly match such as notional amounts, settlement dates, reset dates, calculation period and LIBOR rate. If a cash flow hedge is deemed ineffective, the ineffective portion of changes in fair value of the interest rate swaps associated with our cash flow hedges is recognized in earnings in the period affected.
The fair value of the Company's interest rate derivatives is determined using widely accepted valuation techniques including discounted cash flow analysis on the expected cash flows of each derivative. This analysis reflects the contractual terms of the derivatives, including the period to maturity, and uses observable market-based inputs, including interest rate curves and implied volatilities. The Company incorporates credit valuation adjustments to appropriately reflect both its own nonperformance risk and the respective counterparty's nonperformance risk in the fair value measurements.
63
Recent Accounting Pronouncements
See Note 1 to Consolidated Financial Statements.
Environmental Matters
We are subject to numerous environmental laws and regulations as they apply to our shopping centers pertaining to chemicals used by the dry cleaning industry, the existence of asbestos in older shopping centers, and underground petroleum storage tanks. We believe that the tenants who currently operate dry cleaning plants or gas stations do so in accordance with current laws and regulations. Generally, we use all legal means to cause tenants to remove dry cleaning plants from our shopping centers or convert them to more environmentally friendly systems. Where available, we have applied and been accepted into state-sponsored environmental programs. We have a blanket environmental insurance policy for third-party liabilities and remediation costs on shopping centers that currently have no known environmental contamination. We have also placed environmental insurance, where possible, on specific properties with known contamination, in order to mitigate our environmental risk. We monitor the shopping centers containing environmental issues and in certain cases voluntarily remediate the sites. We also have legal obligations to remediate certain sites and we are in the process of doing so.
As of
December 31, 2016
we and our Investments in real estate partnerships had accrued liabilities of
$8.9 million
for our pro-rata share of environmental remediation. We believe that the ultimate disposition of currently known environmental matters will not have a material effect on our financial position, liquidity, or results of operations; however, we can give no assurance that existing environmental studies on our shopping centers have revealed all potential environmental liabilities; that any previous owner, occupant or tenant did not create any material environmental condition not known to us; that the current environmental condition of the shopping centers will not be affected by tenants and occupants, by the condition of nearby properties, or by unrelated third parties; or that changes in applicable environmental laws and regulations or their interpretation will not result in additional environmental liability to us.
Off-Balance Sheet Arrangements
We do not have off-balance sheet arrangements, financings, or other relationships with other unconsolidated entities (other than our unconsolidated investment partnerships) or other persons, also known as variable interest entities, not previously discussed. Our unconsolidated investment partnership properties have been financed with non-recourse loans. We have no guarantees related to these loans.
Inflation/Deflation
Inflation has been historically low and has had a minimal impact on the operating performance of our shopping centers; however, inflation may become a greater concern in the future. Substantially all of our long-term leases contain provisions designed to mitigate the adverse impact of inflation. Most of our leases require tenants to pay their pro-rata share of operating expenses, including common-area maintenance, real estate taxes, insurance and utilities, thereby reducing our exposure to increases in costs and operating expenses resulting from inflation. In addition, many of our leases are for terms of less than ten years, which permits us to seek increased rents upon re-rental at market rates. However, during deflationary periods or periods of economic weakness, minimum rents and percentage rents will decline as the supply of available retail space exceeds demand and consumer spending declines. Occupancy declines resulting from a weak economic period will also likely result in lower recovery rates of our operating expenses.
64
We are exposed to two significant components of interest rate risk:
|
•
|
We have a Line commitment, as further described in Note 6 to the Consolidated Financial Statements, which has a variable interest rate that is based upon an annual rate of
LIBOR plus 0.925%
. LIBOR rates charged on our Line change monthly. The spread on the Line is dependent upon maintaining specific credit ratings. If our credit ratings are downgraded, the spread on the Line would increase, resulting in higher interest costs. The interest rate spread based on our credit rating ranges from LIBOR plus 0.875% to LIBOR plus 1.550%.
|
|
•
|
We are also exposed to changes in interest rates when we refinance our existing long-term fixed rate debt. The objective of our interest rate risk management program is to limit the impact of interest rate changes on earnings and cash flows. To achieve these objectives, we borrow primarily at fixed interest rates and may enter into derivative financial instruments such as interest rate swaps, caps, or treasury locks in order to mitigate our interest rate risk on a related financial instrument. We do not enter into derivative or interest rate transactions for speculative purposes. Our interest rate swaps are structured solely for the purpose of interest rate protection.
|
We continuously monitor the capital markets and evaluate our ability to issue new debt to repay maturing debt or fund our commitments. Based upon the current capital markets, our current credit ratings, our current capacity under our unsecured credit facilities, and the number of high quality, unencumbered properties that we own which could collateralize borrowings, we expect that we will be able to successfully issue new secured or unsecured debt to fund these debt obligations.
Our interest rate risk is monitored using a variety of techniques. The table below presents the principal cash flows, weighted average interest rates of remaining debt, and the fair value of total debt as of
December 31, 2016
(dollars in thousands). The table is presented by year of expected maturity to evaluate the expected cash flows and sensitivity to interest rate changes. Although the average interest rate for variable rate debt is included in the table, those rates represent rates that existed as of
December 31, 2016
and are subject to change on a monthly basis. Further, the table below incorporates only those exposures that exist as of
December 31, 2016
and does not consider exposures or positions that could arise after that date. Since firm commitments are not presented, the table has limited predictive value. As a result, our ultimate realized gain or loss with respect to interest rate fluctuations will depend on the exposures that arise during the period, our hedging strategies at that time, and actual interest rates.
|
2017
|
2018
|
2019
|
2020
|
2021
|
Thereafter
|
Total
|
Fair Value
|
||||||||||||||||||
|
Fixed rate debt
|
$
|
91,618
|
|
62,186
|
|
110,205
|
|
239,047
|
|
288,970
|
|
840,066
|
|
1,632,092
|
|
1,699,730
|
|
||||||||
|
Average interest rate for all fixed rate debt
(1)
|
4.34
|
%
|
4.27
|
%
|
3.99
|
%
|
3.67
|
%
|
3.25
|
%
|
3.78
|
%
|
|
|
|||||||||||
|
Variable rate LIBOR debt
|
$
|
—
|
|
—
|
|
15,000
|
|
—
|
|
—
|
|
—
|
|
15,000
|
|
14,970
|
|
||||||||
|
Average interest rate for all variable rate debt
(1)
|
—
|
%
|
—
|
%
|
1.41
|
%
|
—
|
%
|
—
|
%
|
—
|
%
|
|
|
|||||||||||
(1)
Average interest rates at the end of each year presented.
65
Regency Centers Corporation and Regency Centers, L.P.
Index to Financial Statements
|
Regency Centers Corporation:
|
|
|
Regency Centers, L.P.:
|
|
|
Financial Statement Schedule
|
|
All other schedules are omitted because of the absence of conditions under which they are required, materiality or because information required therein is shown in the consolidated financial statements or notes thereto.
66
Report of Independent Registered Public Accounting Firm
The Board of Directors and Stockholders
Regency Centers Corporation:
We have audited the accompanying consolidated balance sheets of Regency Centers Corporation and subsidiaries as of
December 31, 2016
and
2015
, and the related consolidated statements of operations, comprehensive income, equity, and cash flows for each of the years in the three‑year period ended
December 31, 2016
. In connection with our audits of the consolidated financial statements, we also have audited the financial statement schedule III. These consolidated financial statements and financial statement schedule are the responsibility of the Company’s management. Our responsibility is to express an opinion on these consolidated financial statements and financial statement schedule based on our audits.
We conducted our audits in accordance with the standards of the Public Company Accounting Oversight Board (United States). Those standards require that we plan and perform the audit to obtain reasonable assurance about whether the financial statements are free of material misstatement. An audit includes examining, on a test basis, evidence supporting the amounts and disclosures in the financial statements. An audit also includes assessing the accounting principles used and significant estimates made by management, as well as evaluating the overall financial statement presentation. We believe that our audits provide a reasonable basis for our opinion.
In our opinion, the consolidated financial statements referred to above present fairly, in all material respects, the financial position of Regency Centers Corporation and subsidiaries as of
December 31, 2016
and
2015
, and the results of their operations and their cash flows for each of the years in the three‑year period ended
December 31, 2016
, in conformity with U.S. generally accepted accounting principles. Also in our opinion, the related financial statement schedule, when considered in relation to the basic consolidated financial statements taken as a whole, present fairly, in all material respects, the information set forth therein.
We also have audited, in accordance with the standards of the Public Company Accounting Oversight Board (United States), Regency Centers Corporation’s internal control over financial reporting as of
December 31, 2016
, based on criteria established in
Internal Control - Integrated Framework
(2013) issued by the Committee of Sponsoring Organizations of the Treadway Commission (COSO), and our report dated
February 27, 2017
expressed an unqualified opinion on the effectiveness of the Company’s internal control over financial reporting.
/s/ KPMG LLP
February 27, 2017
Jacksonville, Florida
Certified Public Accountants
67
Report of Independent Registered Public Accounting Firm
The Board of Directors and Stockholders
Regency Centers Corporation:
We have audited Regency Centers Corporation’s internal control over financial reporting as of
December 31, 2016
, based on criteria established in
Internal Control - Integrated Framework
(2013) issued by the Committee of Sponsoring Organizations of the Treadway Commission (COSO). Regency Centers Corporation’s management is responsible for maintaining effective internal control over financial reporting and for its assessment of the effectiveness of internal control over financial reporting, included in the accompanying Management’s Report on Internal Control over Financial Reporting. Our responsibility is to express an opinion on the Company’s internal control over financial reporting based on our audit.
We conducted our audit in accordance with the standards of the Public Company Accounting Oversight Board (United States). Those standards require that we plan and perform the audit to obtain reasonable assurance about whether effective internal control over financial reporting was maintained in all material respects. Our audit included obtaining an understanding of internal control over financial reporting, assessing the risk that a material weakness exists, and testing and evaluating the design and operating effectiveness of internal control based on the assessed risk. Our audit also included performing such other procedures as we considered necessary in the circumstances. We believe that our audit provides a reasonable basis for our opinion.
A company’s internal control over financial reporting is a process designed to provide reasonable assurance regarding the reliability of financial reporting and the preparation of financial statements for external purposes in accordance with generally accepted accounting principles. A company’s internal control over financial reporting includes those policies and procedures that (1) pertain to the maintenance of records that, in reasonable detail, accurately and fairly reflect the transactions and dispositions of the assets of the company; (2) provide reasonable assurance that transactions are recorded as necessary to permit preparation of financial statements in accordance with generally accepted accounting principles, and that receipts and expenditures of the company are being made only in accordance with authorizations of management and directors of the company; and (3) provide reasonable assurance regarding prevention or timely detection of unauthorized acquisition, use, or disposition of the company’s assets that could have a material effect on the financial statements.
Because of its inherent limitations, internal control over financial reporting may not prevent or detect misstatements. Also, projections of any evaluation of effectiveness to future periods are subject to the risk that controls may become inadequate because of changes in conditions, or that the degree of compliance with the policies or procedures may deteriorate.
In our opinion, Regency Centers Corporation maintained, in all material respects, effective internal control over financial reporting as of
December 31, 2016
, based on criteria established in
Internal Control - Integrated Framework
(2013) issued by the Committee of Sponsoring Organizations of the Treadway Commission.
We also have audited, in accordance with the standards of the Public Company Accounting Oversight Board (United States), the consolidated balance sheets of Regency Centers Corporation and subsidiaries as of
December 31, 2016
and
2015
, and the related consolidated statements of operations, comprehensive income, equity, and cash flows for each of the years in the three-year period ended
December 31, 2016
, and our report dated
February 27, 2017
expressed an unqualified opinion on those consolidated financial statements.
/s/ KPMG LLP
February 27, 2017
Jacksonville, Florida
Certified Public Accountants
68
Report of Independent Registered Public Accounting Firm
The Partners
Regency Centers, L.P.:
We have audited the accompanying consolidated balance sheets of Regency Centers, L.P. and subsidiaries as of
December 31, 2016
and
2015
, and the related consolidated statements of operations, comprehensive income, capital, and cash flows for each of the years in the three‑year period ended
December 31, 2016
. In connection with our audits of the consolidated financial statements, we also have audited the financial statement schedule III. These consolidated financial statements and financial statement schedule are the responsibility of the Partnership’s management. Our responsibility is to express an opinion on these consolidated financial statements and financial statement schedule based on our audits.
We conducted our audits in accordance with the standards of the Public Company Accounting Oversight Board (United States). Those standards require that we plan and perform the audit to obtain reasonable assurance about whether the financial statements are free of material misstatement. An audit includes examining, on a test basis, evidence supporting the amounts and disclosures in the financial statements. An audit also includes assessing the accounting principles used and significant estimates made by management, as well as evaluating the overall financial statement presentation. We believe that our audits provide a reasonable basis for our opinion.
In our opinion, the consolidated financial statements referred to above present fairly, in all material respects, the financial position of Regency Centers, L.P. and subsidiaries as of
December 31, 2016
and
2015
, and the results of their operations and their cash flows for each of the years in the three‑year period ended
December 31, 2016
, in conformity with U.S. generally accepted accounting principles. Also in our opinion, the related financial statement schedule, when considered in relation to the basic consolidated financial statements taken as a whole, present fairly, in all material respects, the information set forth therein.
We also have audited, in accordance with the standards of the Public Company Accounting Oversight Board (United States), Regency Centers, L.P.’s internal control over financial reporting as of
December 31, 2016
, based on criteria established in
Internal Control - Integrated Framework
(2013) issued by the Committee of Sponsoring Organizations of the Treadway Commission (COSO), and our report dated
February 27, 2017
expressed an unqualified opinion on the effectiveness of the Partnership’s internal control over financial reporting.
/s/ KPMG LLP
February 27, 2017
Jacksonville, Florida
Certified Public Accountants
69
Report of Independent Registered Public Accounting Firm
The Partners
Regency Centers, L.P.:
We have audited Regency Centers, L.P.’s internal control over financial reporting as of
December 31, 2016
, based on criteria established in
Internal Control - Integrated Framework
(2013) issued by the Committee of Sponsoring Organizations of the Treadway Commission (COSO). Regency Centers, L.P.’s management is responsible for maintaining effective internal control over financial reporting and for its assessment of the effectiveness of internal control over financial reporting, included in the accompanying Management’s Report on Internal Control over Financial Reporting. Our responsibility is to express an opinion on the Partnership’s internal control over financial reporting based on our audit.
We conducted our audit in accordance with the standards of the Public Company Accounting Oversight Board (United States). Those standards require that we plan and perform the audit to obtain reasonable assurance about whether effective internal control over financial reporting was maintained in all material respects. Our audit included obtaining an understanding of internal control over financial reporting, assessing the risk that a material weakness exists, and testing and evaluating the design and operating effectiveness of internal control based on the assessed risk. Our audit also included performing such other procedures as we considered necessary in the circumstances. We believe that our audit provides a reasonable basis for our opinion.
A company’s internal control over financial reporting is a process designed to provide reasonable assurance regarding the reliability of financial reporting and the preparation of financial statements for external purposes in accordance with generally accepted accounting principles. A company’s internal control over financial reporting includes those policies and procedures that (1) pertain to the maintenance of records that, in reasonable detail, accurately and fairly reflect the transactions and dispositions of the assets of the company; (2) provide reasonable assurance that transactions are recorded as necessary to permit preparation of financial statements in accordance with generally accepted accounting principles, and that receipts and expenditures of the company are being made only in accordance with authorizations of management and directors of the company; and (3) provide reasonable assurance regarding prevention or timely detection of unauthorized acquisition, use, or disposition of the company’s assets that could have a material effect on the financial statements.
Because of its inherent limitations, internal control over financial reporting may not prevent or detect misstatements. Also, projections of any evaluation of effectiveness to future periods are subject to the risk that controls may become inadequate because of changes in conditions, or that the degree of compliance with the policies or procedures may deteriorate.
In our opinion, Regency Centers, L.P. maintained, in all material respects, effective internal control over financial reporting as of
December 31, 2016
, based on criteria established in
Internal Control - Integrated Framework
(2013) issued by the Committee of Sponsoring Organizations of the Treadway Commission.
We also have audited, in accordance with the standards of the Public Company Accounting Oversight Board (United States), the consolidated balance sheets of Regency Centers, L.P. and subsidiaries as of
December 31, 2016
and
2015
, and the related consolidated statements of operations, comprehensive income, capital, and cash flows for each of the years in the three-year period ended
December 31, 2016
, and our report dated
February 27, 2017
expressed an unqualified opinion on those consolidated financial statements.
/s/ KPMG LLP
February 27, 2017
Jacksonville, Florida
Certified Public Accountants
70
REGENCY CENTERS CORPORATION
Consolidated Balance Sheets
December 31, 2016
and
2015
(in thousands, except share data)
|
|
2016
|
2015
|
|||||
|
Assets
|
|||||||
|
Real estate investments at cost (notes 1, 2 and 3):
|
|||||||
|
Land
|
$
|
1,660,424
|
|
1,479,814
|
|
||
|
Buildings and improvements
|
3,092,197
|
|
2,896,396
|
|
|||
|
Properties in development
|
180,878
|
|
169,690
|
|
|||
|
4,933,499
|
|
4,545,900
|
|
||||
|
Less: accumulated depreciation
|
1,124,391
|
|
1,043,787
|
|
|||
|
3,809,108
|
|
3,502,113
|
|
||||
|
Investments in real estate partnerships (note 4)
|
296,699
|
|
306,206
|
|
|||
|
Net real estate investments
|
4,105,807
|
|
3,808,319
|
|
|||
|
Cash and cash equivalents
|
13,256
|
|
36,856
|
|
|||
|
Restricted cash
|
4,623
|
|
3,767
|
|
|||
|
Tenant and other receivables, net (note 1):
|
111,722
|
|
106,164
|
|
|||
|
Deferred leasing costs, less accumulated amortization of $83,529 and $76,823 at December 31, 2016 and 2015, respectively
|
69,000
|
|
66,367
|
|
|||
|
Acquired lease intangible assets, less accumulated amortization of $56,695 and $45,639 at December 31, 2016 and 2015, respectively (note 5)
|
118,831
|
|
105,380
|
|
|||
|
Trading securities held in trust, at fair value (note 11)
|
28,588
|
|
29,093
|
|
|||
|
Other assets
|
37,079
|
|
26,935
|
|
|||
|
Total assets
|
$
|
4,488,906
|
|
4,182,881
|
|
||
|
Liabilities and Equity
|
|||||||
|
Liabilities:
|
|||||||
|
Notes payable (note 6)
|
$
|
1,363,925
|
|
1,699,771
|
|
||
|
Unsecured credit facilities (note 6)
|
278,495
|
|
164,514
|
|
|||
|
Accounts payable and other liabilities
|
138,936
|
|
164,515
|
|
|||
|
Acquired lease intangible liabilities, less accumulated amortization of $23,538 and $17,555 at December 31, 2016 and 2015, respectively (note 5)
|
54,180
|
|
42,034
|
|
|||
|
Tenants’ security and escrow deposits and prepaid rent
|
28,868
|
|
29,427
|
|
|||
|
Total liabilities
|
1,864,404
|
|
2,100,261
|
|
|||
|
Commitments and contingencies (notes 13 and 14)
|
—
|
|
—
|
|
|||
|
Equity:
|
|||||||
|
Stockholders’ equity (note 9):
|
|||||||
|
Preferred stock, $0.01 par value per share, 30,000,000 shares authorized; 13,000,000 Series 6 and 7 shares issued and outstanding at December 31, 2016 and 2015, with liquidation preferences of $25 per share
|
325,000
|
|
325,000
|
|
|||
|
Common stock $0.01 par value per share,150,000,000 shares authorized; 104,497,286 and 97,212,638 shares issued at December 31, 2016 and 2015, respectively
|
1,045
|
|
972
|
|
|||
|
Treasury stock at cost, 347,903 and 417,862 shares held at December 31, 2016 and 2015, respectively
|
(17,062
|
)
|
(19,658
|
)
|
|||
|
Additional paid in capital
|
3,294,923
|
|
2,742,508
|
|
|||
|
Accumulated other comprehensive loss
|
(18,346
|
)
|
(58,693
|
)
|
|||
|
Distributions in excess of net income
|
(994,259
|
)
|
(936,020
|
)
|
|||
|
Total stockholders’ equity
|
2,591,301
|
|
2,054,109
|
|
|||
|
Noncontrolling interests (note 9):
|
|||||||
|
Exchangeable operating partnership units, aggregate redemption value of $10,630 and $10,502 at December 31, 2016 and 2015, respectively
|
(1,967
|
)
|
(1,975
|
)
|
|||
|
Limited partners’ interests in consolidated partnerships
|
35,168
|
|
30,486
|
|
|||
|
Total noncontrolling interests
|
33,201
|
|
28,511
|
|
|||
|
Total equity
|
2,624,502
|
|
2,082,620
|
|
|||
|
Total liabilities and equity
|
$
|
4,488,906
|
|
4,182,881
|
|
||
See accompanying notes to consolidated financial statements.
71
REGENCY CENTERS CORPORATION
For the years ended
December 31, 2016
,
2015
, and
2014
(in thousands, except per share data)
|
|
2016
|
2015
|
2014
|
|||||||
|
Revenues:
|
||||||||||
|
Minimum rent
|
$
|
444,305
|
|
415,155
|
|
390,697
|
|
|||
|
Percentage rent
|
4,128
|
|
3,750
|
|
3,488
|
|
||||
|
Recoveries from tenants and other income
|
140,611
|
|
125,295
|
|
119,618
|
|
||||
|
Management, transaction, and other fees
|
25,327
|
|
25,563
|
|
24,095
|
|
||||
|
Total revenues
|
614,371
|
|
569,763
|
|
537,898
|
|
||||
|
Operating expenses:
|
||||||||||
|
Depreciation and amortization
|
162,327
|
|
146,829
|
|
147,791
|
|
||||
|
Operating and maintenance
|
95,022
|
|
82,978
|
|
77,788
|
|
||||
|
General and administrative
|
65,327
|
|
65,600
|
|
60,242
|
|
||||
|
Real estate taxes
|
66,395
|
|
61,855
|
|
59,031
|
|
||||
|
Other operating expenses
|
14,081
|
|
7,836
|
|
8,496
|
|
||||
|
Total operating expenses
|
403,152
|
|
365,098
|
|
353,348
|
|
||||
|
Other expense (income):
|
||||||||||
|
Interest expense, net of interest income of $1,180 , $1,590, and $1,210 in 2016, 2015, and 2014, respectively
|
90,712
|
|
102,622
|
|
109,491
|
|
||||
|
Provision for impairment
|
4,200
|
|
—
|
|
1,257
|
|
||||
|
Early extinguishment of debt
|
14,240
|
|
8,239
|
|
18
|
|
||||
|
Net investment income, including unrealized (gains) losses of ($773), $1,734, and $1,058 in 2016, 2015, and 2014, respectively (notes 11)
|
(1,672
|
)
|
(625
|
)
|
(9,449
|
)
|
||||
|
Gain on remeasurement of investment in real estate partnership
|
—
|
|
—
|
|
(18,271
|
)
|
||||
|
Loss on derivative instruments
|
40,586
|
|
—
|
|
—
|
|
||||
|
Total other expense (income)
|
148,066
|
|
110,236
|
|
83,046
|
|
||||
|
Income from operations before equity in income of investments in real estate partnerships
|
63,153
|
|
94,429
|
|
101,504
|
|
||||
|
Equity in income of investments in real estate partnerships (note 4)
|
56,518
|
|
22,508
|
|
31,270
|
|
||||
|
Income tax (benefit) of taxable REIT subsidiary
|
—
|
|
—
|
|
(996
|
)
|
||||
|
Income from operations
|
119,671
|
|
116,937
|
|
133,770
|
|
||||
|
Gain on sale of real estate, net of tax
|
47,321
|
|
35,606
|
|
55,077
|
|
||||
|
Net income
|
166,992
|
|
152,543
|
|
188,847
|
|
||||
|
Noncontrolling interests:
|
||||||||||
|
Exchangeable operating partnership units
|
(257
|
)
|
(240
|
)
|
(319
|
)
|
||||
|
Limited partners’ interests in consolidated partnerships
|
(1,813
|
)
|
(2,247
|
)
|
(1,138
|
)
|
||||
|
Income attributable to noncontrolling interests
|
(2,070
|
)
|
(2,487
|
)
|
(1,457
|
)
|
||||
|
Net income attributable to the Company
|
164,922
|
|
150,056
|
|
187,390
|
|
||||
|
Preferred stock dividends
|
(21,062
|
)
|
(21,062
|
)
|
(21,062
|
)
|
||||
|
Net income attributable to common stockholders
|
|
$
|
143,860
|
|
128,994
|
|
166,328
|
|
||
|
Income per common share - basic (note 12):
|
$
|
1.43
|
|
1.37
|
|
1.80
|
|
|||
|
Income per common share - diluted (note 12):
|
$
|
1.42
|
|
1.36
|
|
1.80
|
|
|||
See accompanying notes to consolidated financial statements.
72
REGENCY CENTERS CORPORATION
Consolidated Statements of Comprehensive Income
For the years ended
December 31, 2016
,
2015
, and
2014
(in thousands)
|
2016
|
2015
|
2014
|
||||||||
|
Net income
|
$
|
166,992
|
|
152,543
|
|
188,847
|
|
|||
|
Other comprehensive (loss) income:
|
||||||||||
|
Effective portion of change in fair value of derivative instruments:
|
||||||||||
|
Effective portion of change in fair value of derivative instruments
|
(10,332
|
)
|
(10,089
|
)
|
(49,968
|
)
|
||||
|
Reclassification adjustment of derivative instruments included in net income
|
51,139
|
|
9,152
|
|
9,353
|
|
||||
|
Unrealized gain (loss) on available-for-sale securities
|
24
|
|
(43
|
)
|
7,765
|
|
||||
|
Less: realized gains on sale of available-for-sale securities recognized in net income
|
—
|
|
—
|
|
(7,765
|
)
|
||||
|
Other comprehensive income (loss)
|
40,831
|
|
(980
|
)
|
(40,615
|
)
|
||||
|
Comprehensive income
|
207,823
|
|
151,563
|
|
148,232
|
|
||||
|
Less: comprehensive income (loss) attributable to noncontrolling interests:
|
||||||||||
|
Net income attributable to noncontrolling interests
|
2,070
|
|
2,487
|
|
1,457
|
|
||||
|
Other comprehensive income (loss) attributable to noncontrolling interests
|
484
|
|
(35
|
)
|
(271
|
)
|
||||
|
Comprehensive income attributable to noncontrolling interests
|
2,554
|
|
2,452
|
|
1,186
|
|
||||
|
Comprehensive income attributable to the Company
|
$
|
205,269
|
|
149,111
|
|
147,046
|
|
|||
See accompanying notes to consolidated financial statements.
73
|
REGENCY CENTERS CORPORATION
Consolidated Statements of Equity
For the
years
ended
December 31, 2016
,
2015
, and
2014
(in thousands, except per share data)
|
|||||||||||||||||||||||||||||||||
|
|
|
|
|
|
|
|
Noncontrolling Interests
|
|
|||||||||||||||||||||||||
|
|
Preferred
Stock |
Common
Stock |
Treasury
Stock |
Additional
Paid In Capital |
Accumulated
Other Comprehensive Loss |
Distributions
in Excess of Net Income |
Total
Stockholders’ Equity |
Exchangeable
Operating Partnership Units |
Limited
Partners’ Interest in Consolidated Partnerships |
Total
Noncontrolling Interests |
Total
Equity |
||||||||||||||||||||||
|
Balance at December 31, 2013
|
$
|
325,000
|
|
923
|
|
(16,726
|
)
|
2,426,477
|
|
(17,404
|
)
|
(874,916
|
)
|
1,843,354
|
|
(1,426
|
)
|
19,206
|
|
17,780
|
|
1,861,134
|
|
||||||||||
|
Net income
|
—
|
|
—
|
|
—
|
|
—
|
|
—
|
|
187,390
|
|
187,390
|
|
319
|
|
1,138
|
|
1,457
|
|
188,847
|
|
|||||||||||
|
Other comprehensive income (loss)
|
—
|
|
—
|
|
—
|
|
—
|
|
(40,344
|
)
|
—
|
|
(40,344
|
)
|
(70
|
)
|
(201
|
)
|
(271
|
)
|
(40,615
|
)
|
|||||||||||
|
Deferred compensation plan, net
|
—
|
|
—
|
|
(2,656
|
)
|
2,656
|
|
—
|
|
—
|
|
—
|
|
—
|
|
—
|
|
—
|
|
—
|
|
|||||||||||
|
Amortization of restricted stock issued
|
—
|
|
—
|
|
—
|
|
12,161
|
|
—
|
|
—
|
|
12,161
|
|
—
|
|
—
|
|
—
|
|
12,161
|
|
|||||||||||
|
Common stock redeemed for taxes withheld for stock based compensation, net
|
—
|
|
—
|
|
—
|
|
(3,493
|
)
|
—
|
|
—
|
|
(3,493
|
)
|
—
|
|
—
|
|
—
|
|
(3,493
|
)
|
|||||||||||
|
Common stock issued for dividend reinvestment plan
|
—
|
|
—
|
|
—
|
|
1,184
|
|
—
|
|
—
|
|
1,184
|
|
—
|
|
—
|
|
—
|
|
1,184
|
|
|||||||||||
|
Common stock issued for stock offerings, net of issuance costs
|
—
|
|
18
|
|
—
|
|
102,435
|
|
—
|
|
—
|
|
102,453
|
|
—
|
|
—
|
|
—
|
|
102,453
|
|
|||||||||||
|
Redemption of preferred units
|
—
|
|
—
|
|
—
|
|
—
|
|
—
|
|
—
|
|
—
|
|
(300
|
)
|
—
|
|
(300
|
)
|
(300
|
)
|
|||||||||||
|
Common stock issued for partnership units exchanged
|
—
|
|
—
|
|
—
|
|
137
|
|
—
|
|
—
|
|
137
|
|
(137
|
)
|
—
|
|
(137
|
)
|
—
|
|
|||||||||||
|
Contributions from partners
|
—
|
|
—
|
|
—
|
|
—
|
|
—
|
|
—
|
|
—
|
|
—
|
|
16,204
|
|
16,204
|
|
16,204
|
|
|||||||||||
|
Distributions to partners
|
—
|
|
—
|
|
—
|
|
(1,404
|
)
|
—
|
|
—
|
|
(1,404
|
)
|
—
|
|
(4,543
|
)
|
(4,543
|
)
|
(5,947
|
)
|
|||||||||||
|
Cash dividends declared:
|
|||||||||||||||||||||||||||||||||
|
Preferred stock/unit
|
—
|
|
—
|
|
—
|
|
—
|
|
—
|
|
(21,062
|
)
|
(21,062
|
)
|
—
|
|
—
|
|
—
|
|
(21,062
|
)
|
|||||||||||
|
Common stock/unit ($1.88 per share)
|
—
|
|
—
|
|
—
|
|
—
|
|
—
|
|
(173,784
|
)
|
(173,784
|
)
|
(300
|
)
|
—
|
|
(300
|
)
|
(174,084
|
)
|
|||||||||||
|
Balance at December 31, 2014
|
$
|
325,000
|
|
941
|
|
(19,382
|
)
|
2,540,153
|
|
(57,748
|
)
|
(882,372
|
)
|
1,906,592
|
|
(1,914
|
)
|
31,804
|
|
29,890
|
|
1,936,482
|
|
||||||||||
|
Net income
|
—
|
|
—
|
|
—
|
|
—
|
|
—
|
|
150,056
|
|
150,056
|
|
240
|
|
2,247
|
|
2,487
|
|
152,543
|
|
|||||||||||
|
Other comprehensive income (loss)
|
—
|
|
—
|
|
—
|
|
—
|
|
(945
|
)
|
—
|
|
(945
|
)
|
(2
|
)
|
(33
|
)
|
(35
|
)
|
(980
|
)
|
|||||||||||
|
Deferred compensation plan, net
|
—
|
|
—
|
|
(276
|
)
|
276
|
|
—
|
|
—
|
|
—
|
|
—
|
|
—
|
|
—
|
|
—
|
|
|||||||||||
|
Amortization of restricted stock issued
|
—
|
|
—
|
|
—
|
|
13,869
|
|
—
|
|
—
|
|
13,869
|
|
—
|
|
—
|
|
—
|
|
13,869
|
|
|||||||||||
|
Common stock redeemed for taxes withheld for stock based compensation, net
|
—
|
|
—
|
|
—
|
|
(9,706
|
)
|
—
|
|
—
|
|
(9,706
|
)
|
—
|
|
—
|
|
—
|
|
(9,706
|
)
|
|||||||||||
|
Common stock issued for dividend reinvestment plan
|
—
|
|
—
|
|
—
|
|
1,250
|
|
—
|
|
—
|
|
1,250
|
|
—
|
|
—
|
|
—
|
|
1,250
|
|
|||||||||||
|
Common stock issued for stock offerings, net of issuance costs
|
—
|
|
31
|
|
—
|
|
198,463
|
|
—
|
|
—
|
|
198,494
|
|
—
|
|
—
|
|
—
|
|
198,494
|
|
|||||||||||
|
Contributions from partners
|
—
|
|
—
|
|
—
|
|
—
|
|
—
|
|
—
|
|
—
|
|
—
|
|
717
|
|
717
|
|
717
|
|
|||||||||||
74
|
REGENCY CENTERS CORPORATION
Consolidated Statements of Equity
For the
years
ended
December 31, 2016
,
2015
, and
2014
(in thousands, except per share data)
|
|||||||||||||||||||||||||||||||||
|
|
|
|
|
|
|
|
Noncontrolling Interests
|
|
|||||||||||||||||||||||||
|
|
Preferred
Stock |
Common
Stock |
Treasury
Stock |
Additional
Paid In Capital |
Accumulated
Other Comprehensive Loss |
Distributions
in Excess of Net Income |
Total
Stockholders’ Equity |
Exchangeable
Operating Partnership Units |
Limited
Partners’ Interest in Consolidated Partnerships |
Total
Noncontrolling Interests |
Total
Equity |
||||||||||||||||||||||
|
Distributions to partners
|
—
|
|
—
|
|
—
|
|
(1,797
|
)
|
—
|
|
—
|
|
(1,797
|
)
|
—
|
|
(4,249
|
)
|
(4,249
|
)
|
(6,046
|
)
|
|||||||||||
|
Cash dividends declared:
|
|||||||||||||||||||||||||||||||||
|
Preferred stock/unit
|
—
|
|
—
|
|
—
|
|
—
|
|
—
|
|
(21,062
|
)
|
(21,062
|
)
|
—
|
|
—
|
|
—
|
|
(21,062
|
)
|
|||||||||||
|
Common stock/unit ($1.94 per share)
|
—
|
|
—
|
|
—
|
|
—
|
|
—
|
|
(182,642
|
)
|
(182,642
|
)
|
(299
|
)
|
—
|
|
(299
|
)
|
(182,941
|
)
|
|||||||||||
|
Balance at December 31, 2015
|
$
|
325,000
|
|
972
|
|
(19,658
|
)
|
2,742,508
|
|
(58,693
|
)
|
(936,020
|
)
|
2,054,109
|
|
(1,975
|
)
|
30,486
|
|
28,511
|
|
2,082,620
|
|
||||||||||
|
Net income
|
—
|
|
—
|
|
—
|
|
—
|
|
—
|
|
164,922
|
|
164,922
|
|
257
|
|
1,813
|
|
2,070
|
|
166,992
|
|
|||||||||||
|
Other comprehensive income (loss)
|
—
|
|
—
|
|
—
|
|
—
|
|
40,347
|
|
—
|
|
40,347
|
|
58
|
|
426
|
|
484
|
|
40,831
|
|
|||||||||||
|
Deferred compensation plan, net
|
—
|
|
—
|
|
2,596
|
|
(2,596
|
)
|
—
|
|
—
|
|
—
|
|
—
|
|
—
|
|
—
|
|
—
|
|
|||||||||||
|
Amortization of restricted stock issued
|
—
|
|
2
|
|
—
|
|
13,419
|
|
—
|
|
—
|
|
13,421
|
|
—
|
|
—
|
|
—
|
|
13,421
|
|
|||||||||||
|
Common stock redeemed for taxes withheld for stock based compensation, net
|
—
|
|
—
|
|
—
|
|
(7,789
|
)
|
—
|
|
—
|
|
(7,789
|
)
|
—
|
|
—
|
|
—
|
|
(7,789
|
)
|
|||||||||||
|
Common stock issued for dividend reinvestment plan
|
—
|
|
—
|
|
—
|
|
1,070
|
|
—
|
|
—
|
|
1,070
|
|
—
|
|
—
|
|
—
|
|
1,070
|
|
|||||||||||
|
Common stock issued for stock offerings, net of issuance costs
|
—
|
|
71
|
|
—
|
|
548,849
|
|
—
|
|
—
|
|
548,920
|
|
—
|
|
—
|
|
—
|
|
548,920
|
|
|||||||||||
|
Reallocation of limited partners' interest
|
—
|
|
—
|
|
—
|
|
(538
|
)
|
—
|
|
—
|
|
(538
|
)
|
—
|
|
538
|
|
538
|
|
—
|
|
|||||||||||
|
Contributions from partners
|
—
|
|
—
|
|
—
|
|
—
|
|
—
|
|
—
|
|
—
|
|
—
|
|
8,760
|
|
8,760
|
|
8,760
|
|
|||||||||||
|
Distributions to partners
|
—
|
|
—
|
|
—
|
|
—
|
|
—
|
|
—
|
|
—
|
|
—
|
|
(6,855
|
)
|
(6,855
|
)
|
(6,855
|
)
|
|||||||||||
|
Cash dividends declared:
|
|||||||||||||||||||||||||||||||||
|
Preferred stock/unit
|
—
|
|
—
|
|
—
|
|
—
|
|
—
|
|
(21,062
|
)
|
(21,062
|
)
|
—
|
|
—
|
|
—
|
|
(21,062
|
)
|
|||||||||||
|
Common stock/unit ($2.00 per share)
|
—
|
|
—
|
|
—
|
|
—
|
|
—
|
|
(202,099
|
)
|
(202,099
|
)
|
(307
|
)
|
—
|
|
(307
|
)
|
(202,406
|
)
|
|||||||||||
|
Balance at December 31, 2016
|
$
|
325,000
|
|
1,045
|
|
(17,062
|
)
|
3,294,923
|
|
(18,346
|
)
|
(994,259
|
)
|
2,591,301
|
|
(1,967
|
)
|
35,168
|
|
33,201
|
|
2,624,502
|
|
||||||||||
See accompanying notes to consolidated financial statements.
75
|
REGENCY CENTERS CORPORATION
For the years ended December 31, 2016, 2015, and 2014
(in thousands)
|
||||||||||
|
|
2016
|
2015
|
2014
|
|||||||
|
Cash flows from operating activities:
|
||||||||||
|
Net income
|
$
|
166,992
|
|
152,543
|
|
188,847
|
|
|||
|
Adjustments to reconcile net income to net cash provided by operating activities:
|
||||||||||
|
Depreciation and amortization
|
162,327
|
|
146,829
|
|
147,791
|
|
||||
|
Amortization of deferred loan cost and debt premium
|
9,762
|
|
9,677
|
|
10,521
|
|
||||
|
Amortization and (accretion) of above and below market lease intangibles, net
|
(3,879
|
)
|
(1,598
|
)
|
(3,101
|
)
|
||||
|
Stock-based compensation, net of capitalization
|
10,652
|
|
11,081
|
|
9,662
|
|
||||
|
Equity in income of investments in real estate partnerships
|
(56,518
|
)
|
(22,508
|
)
|
(31,270
|
)
|
||||
|
Gain on remeasurement of investment in real estate partnership
|
—
|
|
—
|
|
(18,271
|
)
|
||||
|
Gain on sale of real estate, net of tax
|
(47,321
|
)
|
(35,606
|
)
|
(55,077
|
)
|
||||
|
Provision for impairment
|
4,200
|
|
—
|
|
1,257
|
|
||||
|
Early extinguishment of debt
|
14,240
|
|
8,239
|
|
18
|
|
||||
|
Distribution of earnings from operations of investments in real estate partnerships
|
50,361
|
|
46,646
|
|
42,767
|
|
||||
|
Settlement of derivative instruments
|
—
|
|
(7,267
|
)
|
4,648
|
|
||||
|
Gain on derivative instruments
|
—
|
|
—
|
|
(13
|
)
|
||||
|
Deferred compensation expense
|
1,655
|
|
207
|
|
1,386
|
|
||||
|
Realized and unrealized gain on investments (note 11)
|
(1,673
|
)
|
(626
|
)
|
(9,158
|
)
|
||||
|
Changes in assets and liabilities:
|
||||||||||
|
Restricted cash
|
59
|
|
1,926
|
|
848
|
|
||||
|
Accounts receivable, net
|
(9,565
|
)
|
(11,965
|
)
|
(6,225
|
)
|
||||
|
Straight-line rent receivable, net
|
(7,219
|
)
|
(8,231
|
)
|
(6,544
|
)
|
||||
|
Deferred leasing costs
|
(10,349
|
)
|
(12,949
|
)
|
(8,252
|
)
|
||||
|
Other assets
|
673
|
|
(496
|
)
|
89
|
|
||||
|
Accounts payable and other liabilities
|
5,543
|
|
(3,810
|
)
|
6,201
|
|
||||
|
Tenants’ security and escrow deposits and prepaid rent
|
(564
|
)
|
3,545
|
|
1,618
|
|
||||
|
Net cash provided by operating activities
|
289,376
|
|
275,637
|
|
277,742
|
|
||||
|
Cash flows from investing activities:
|
||||||||||
|
Acquisition of operating real estate
|
(333,220
|
)
|
(42,983
|
)
|
(112,120
|
)
|
||||
|
Advance deposits paid on acquisition of operating real estate
|
(750
|
)
|
(2,250
|
)
|
—
|
|
||||
|
Real estate development and capital improvements
|
(234,598
|
)
|
(205,103
|
)
|
(238,237
|
)
|
||||
|
Proceeds from sale of real estate investments
|
135,269
|
|
108,822
|
|
118,787
|
|
||||
|
Collection of notes receivable
|
—
|
|
1,719
|
|
—
|
|
||||
|
Investments in real estate partnerships
|
(37,879
|
)
|
(20,054
|
)
|
(23,577
|
)
|
||||
|
Distributions received from investments in real estate partnerships
|
58,810
|
|
23,801
|
|
37,152
|
|
||||
|
Dividends on investment securities
|
330
|
|
243
|
|
243
|
|
||||
|
Acquisition of securities
|
(55,223
|
)
|
(31,941
|
)
|
(23,760
|
)
|
||||
|
Proceeds from sale of securities
|
57,590
|
|
28,400
|
|
31,222
|
|
||||
|
Net cash used in investing activities
|
(409,671
|
)
|
(139,346
|
)
|
(210,290
|
)
|
||||
76
|
REGENCY CENTERS CORPORATION
Consolidated Statements of Cash Flows
For the years ended December 31, 2016, 2015, and 2014
(in thousands)
|
||||||||||
|
|
2016
|
2015
|
2014
|
|||||||
|
Cash flows from financing activities:
|
||||||||||
|
Net proceeds from common stock issuance
|
548,920
|
|
198,494
|
|
102,453
|
|
||||
|
Proceeds from sale of treasury stock
|
957
|
|
—
|
|
—
|
|
||||
|
Acquisition of treasury stock
|
(29
|
)
|
—
|
|
—
|
|
||||
|
Redemption of preferred stock and partnership units
|
—
|
|
—
|
|
(300
|
)
|
||||
|
Distributions to limited partners in consolidated partnerships, net
|
(4,213
|
)
|
(5,341
|
)
|
(5,303
|
)
|
||||
|
Distributions to exchangeable operating partnership unit holders
|
(307
|
)
|
(299
|
)
|
(300
|
)
|
||||
|
Dividends paid to common stockholders
|
(201,029
|
)
|
(181,392
|
)
|
(172,600
|
)
|
||||
|
Dividends paid to preferred stockholders
|
(21,062
|
)
|
(21,062
|
)
|
(21,062
|
)
|
||||
|
Repayment of fixed rate unsecured notes
|
(300,000
|
)
|
(450,000
|
)
|
(150,000
|
)
|
||||
|
Proceeds from issuance of fixed rate unsecured notes, net
|
—
|
|
248,160
|
|
248,705
|
|
||||
|
Proceeds from unsecured credit facilities
|
460,000
|
|
445,000
|
|
255,000
|
|
||||
|
Repayment of unsecured credit facilities
|
(345,000
|
)
|
(355,000
|
)
|
(255,000
|
)
|
||||
|
Proceeds from notes payable
|
53,446
|
|
4,316
|
|
12,739
|
|
||||
|
Repayment of notes payable
|
(72,803
|
)
|
(76,168
|
)
|
(38,717
|
)
|
||||
|
Scheduled principal payments
|
(5,860
|
)
|
(5,878
|
)
|
(6,909
|
)
|
||||
|
Payment of loan costs
|
(2,233
|
)
|
(5,998
|
)
|
(3,066
|
)
|
||||
|
Early redemption costs
|
(14,092
|
)
|
(8,043
|
)
|
—
|
|
||||
|
Net cash provided by (used in) financing activities
|
96,695
|
|
(213,211
|
)
|
(34,360
|
)
|
||||
|
Net decrease in cash and cash equivalents
|
(23,600
|
)
|
(76,920
|
)
|
33,092
|
|
||||
|
Cash and cash equivalents at beginning of the year
|
36,856
|
|
113,776
|
|
80,684
|
|
||||
|
Cash and cash equivalents at end of the year
|
$
|
13,256
|
|
36,856
|
|
113,776
|
|
|||
|
Supplemental disclosure of cash flow information:
|
||||||||||
|
Cash paid for interest (net of capitalized interest of $3,482, $6,740, and $7,142 in 2016, 2015, and 2014, respectively)
|
$
|
82,950
|
|
101,527
|
|
109,425
|
|
|||
|
Cash paid for income taxes
|
$
|
—
|
|
1,015
|
|
2,169
|
|
|||
|
Supplemental disclosure of non-cash transactions:
|
||||||||||
|
Common stock issued for partnership units exchanged
|
$
|
—
|
|
—
|
|
137
|
|
|||
|
Mortgage loans assumed for the acquisition of real estate
|
$
|
—
|
|
42,799
|
|
103,187
|
|
|||
|
Change in fair value of securities available-for-sale
|
$
|
24
|
|
(43
|
)
|
—
|
|
|||
|
Initial fair value of non-controlling interest recorded at acquisition
|
$
|
—
|
|
—
|
|
15,385
|
|
|||
|
Acquisition of previously unconsolidated real estate investments
|
$
|
—
|
|
—
|
|
16,182
|
|
|||
|
Change in fair value of derivative instruments
|
$
|
(10,332
|
)
|
(9,012
|
)
|
(49,968
|
)
|
|||
|
Common stock issued for dividend reinvestment plan
|
$
|
1,070
|
|
1,250
|
|
1,184
|
|
|||
|
Stock-based compensation capitalized
|
$
|
2,963
|
|
2,988
|
|
2,707
|
|
|||
|
Contributions from limited partners in consolidated partnerships, net
|
$
|
8,755
|
|
13
|
|
1,579
|
|
|||
|
Common stock issued for dividend reinvestment in trust
|
$
|
728
|
|
833
|
|
779
|
|
|||
|
Contribution of stock awards into trust
|
$
|
1,538
|
|
1,651
|
|
1,881
|
|
|||
|
Distribution of stock held in trust
|
$
|
4,114
|
|
1,898
|
|
4
|
|
|||
|
Deconsolidation of previously consolidated partnership:
|
||||||||||
|
Real estate, net
|
$
|
14,144
|
|
—
|
|
—
|
|
|||
|
Investments in real estate partnerships
|
$
|
(3,355
|
)
|
—
|
|
—
|
|
|||
|
Notes payable
|
$
|
(9,415
|
)
|
—
|
|
—
|
|
|||
|
Other assets and liabilities
|
$
|
571
|
|
—
|
|
—
|
|
|||
|
Limited partners' interest in consolidated partnerships
|
$
|
(2,099
|
)
|
—
|
|
—
|
|
|||
77
REGENCY CENTERS, L.P.
Consolidated Balance Sheets
December 31, 2016
and
2015
(in thousands, except unit data)
|
|
2016
|
2015
|
|||||
|
Assets
|
|||||||
|
Real estate investments at cost (notes 1, 2 and 3):
|
|||||||
|
Land
|
$
|
1,660,424
|
|
1,479,814
|
|
||
|
Buildings and improvements
|
3,092,197
|
|
2,896,396
|
|
|||
|
Properties in development
|
180,878
|
|
169,690
|
|
|||
|
4,933,499
|
|
4,545,900
|
|
||||
|
Less: accumulated depreciation
|
1,124,391
|
|
1,043,787
|
|
|||
|
3,809,108
|
|
3,502,113
|
|
||||
|
Investments in real estate partnerships (note 4)
|
296,699
|
|
306,206
|
|
|||
|
Net real estate investments
|
4,105,807
|
|
3,808,319
|
|
|||
|
Cash and cash equivalents
|
13,256
|
|
36,856
|
|
|||
|
Restricted cash
|
4,623
|
|
3,767
|
|
|||
|
Tenant and other receivables, net (note 1):
|
111,722
|
|
106,164
|
|
|||
|
Deferred leasing costs, less accumulated amortization of $83,529 and $76,823 at December 31, 2016 and 2015, respectively
|
69,000
|
|
66,367
|
|
|||
|
Acquired lease intangible assets, less accumulated amortization of $56,695 and $45,639 at December 31, 2016 and 2015, respectively (note 5)
|
118,831
|
|
105,380
|
|
|||
|
Trading securities held in trust, at fair value (note 11)
|
28,588
|
|
29,093
|
|
|||
|
Other assets
|
37,079
|
|
26,935
|
|
|||
|
Total assets
|
$
|
4,488,906
|
|
4,182,881
|
|
||
|
Liabilities and Capital
|
|||||||
|
Liabilities:
|
|||||||
|
Notes payable (note 6)
|
$
|
1,363,925
|
|
1,699,771
|
|
||
|
Unsecured credit facilities (note 6)
|
278,495
|
|
164,514
|
|
|||
|
Accounts payable and other liabilities
|
138,936
|
|
164,515
|
|
|||
|
Acquired lease intangible liabilities, less accumulated amortization of $23,538 and $17,555 at December 31, 2016 and 2015, respectively (note 5)
|
54,180
|
|
42,034
|
|
|||
|
Tenants’ security and escrow deposits and prepaid rent
|
28,868
|
|
29,427
|
|
|||
|
Total liabilities
|
1,864,404
|
|
2,100,261
|
|
|||
|
Commitments and contingencies (notes 13 and 14)
|
—
|
|
—
|
|
|||
|
Capital:
|
|||||||
|
Partners’ capital (note 9):
|
|||||||
|
Preferred units of general partner, $0.01 par value per unit, 13,000,000 units issued and outstanding at December 31, 2016 and 2015, respectively, liquidation preference of $25 per unit
|
325,000
|
|
325,000
|
|
|||
|
General partner; 104,497,286 and 97,212,638 units outstanding at December 31, 2016 and 2015, respectively
|
2,284,647
|
|
1,787,802
|
|
|||
|
Limited partners; 154,170 units outstanding at December 31, 2016 and 2015
|
(1,967
|
)
|
(1,975
|
)
|
|||
|
Accumulated other comprehensive loss
|
(18,346
|
)
|
(58,693
|
)
|
|||
|
Total partners’ capital
|
2,589,334
|
|
2,052,134
|
|
|||
|
Noncontrolling interests (note 9):
|
|||||||
|
Limited partners’ interests in consolidated partnerships
|
35,168
|
|
30,486
|
|
|||
|
Total noncontrolling interests
|
35,168
|
|
30,486
|
|
|||
|
Total capital
|
2,624,502
|
|
2,082,620
|
|
|||
|
Total liabilities and capital
|
$
|
4,488,906
|
|
4,182,881
|
|
||
See accompanying notes to consolidated financial statements.
78
REGENCY CENTERS, L.P.
Consolidated Statements of Operations
For the years ended
December 31, 2016
,
2015
, and
2014
(in thousands, except per unit data)
|
|
2016
|
2015
|
2014
|
|||||||
|
Revenues:
|
||||||||||
|
Minimum rent
|
$
|
444,305
|
|
415,155
|
|
390,697
|
|
|||
|
Percentage rent
|
4,128
|
|
3,750
|
|
3,488
|
|
||||
|
Recoveries from tenants and other income
|
140,611
|
|
125,295
|
|
119,618
|
|
||||
|
Management, transaction, and other fees
|
25,327
|
|
25,563
|
|
24,095
|
|
||||
|
Total revenues
|
614,371
|
|
569,763
|
|
537,898
|
|
||||
|
Operating expenses:
|
||||||||||
|
Depreciation and amortization
|
162,327
|
|
146,829
|
|
147,791
|
|
||||
|
Operating and maintenance
|
95,022
|
|
82,978
|
|
77,788
|
|
||||
|
General and administrative
|
65,327
|
|
65,600
|
|
60,242
|
|
||||
|
Real estate taxes
|
66,395
|
|
61,855
|
|
59,031
|
|
||||
|
Other operating expenses
|
14,081
|
|
7,836
|
|
8,496
|
|
||||
|
Total operating expenses
|
403,152
|
|
365,098
|
|
353,348
|
|
||||
|
Other expense (income):
|
||||||||||
|
Interest expense, net of interest income of $1,180 , $1,590, and $1,210 in 2016, 2015, and 2014, respectively
|
90,712
|
|
102,622
|
|
109,491
|
|
||||
|
Provision for impairment
|
4,200
|
|
—
|
|
1,257
|
|
||||
|
Early extinguishment of debt
|
14,240
|
|
8,239
|
|
18
|
|
||||
|
Net investment income, including unrealized (gains) losses of ($773), $1,734, and $1,058 in 2016, 2015, and 2014, respectively (notes 11)
|
(1,672
|
)
|
(625
|
)
|
(9,449
|
)
|
||||
|
Gain on remeasurement of investment in real estate partnership
|
—
|
|
—
|
|
(18,271
|
)
|
||||
|
Loss on derivative instruments
|
40,586
|
|
—
|
|
—
|
|
||||
|
Total other expense (income)
|
148,066
|
|
110,236
|
|
83,046
|
|
||||
|
Income from operations before equity in income of investments in real estate partnerships
|
63,153
|
|
94,429
|
|
101,504
|
|
||||
|
Equity in income of investments in real estate partnerships (note 4)
|
56,518
|
|
22,508
|
|
31,270
|
|
||||
|
Income tax (benefit) of taxable REIT subsidiary
|
—
|
|
—
|
|
(996
|
)
|
||||
|
Income from operations
|
119,671
|
|
116,937
|
|
133,770
|
|
||||
|
Gain on sale of real estate, net of tax
|
47,321
|
|
35,606
|
|
55,077
|
|
||||
|
Net income
|
166,992
|
|
152,543
|
|
188,847
|
|
||||
|
Limited partners’ interests in consolidated partnerships
|
(1,813
|
)
|
(2,247
|
)
|
(1,138
|
)
|
||||
|
Net income attributable to the Partnership
|
165,179
|
|
150,296
|
|
187,709
|
|
||||
|
Preferred unit distributions
|
(21,062
|
)
|
(21,062
|
)
|
(21,062
|
)
|
||||
|
Net income attributable to common unit holders
|
$
|
144,117
|
|
129,234
|
|
166,647
|
|
|||
|
Income per common unit - basic (note 12):
|
$
|
1.43
|
|
1.37
|
|
1.80
|
|
|||
|
Income per common unit - diluted (note 12):
|
$
|
1.42
|
|
1.36
|
|
1.80
|
|
|||
See accompanying notes to consolidated financial statements.
79
REGENCY CENTERS, L.P.
Consolidated Statements of Comprehensive Income
For the years ended
December 31, 2016
,
2015
, and
2014
(in thousands)
|
2016
|
2015
|
2014
|
||||||||
|
Net income
|
$
|
166,992
|
|
152,543
|
|
188,847
|
|
|||
|
Other comprehensive (loss) income:
|
||||||||||
|
Effective portion of change in fair value of derivative instruments:
|
||||||||||
|
Effective portion of change in fair value of derivative instruments
|
(10,332
|
)
|
(10,089
|
)
|
(49,968
|
)
|
||||
|
Reclassification adjustment of derivative instruments included in net income
|
51,139
|
|
9,152
|
|
9,353
|
|
||||
|
Unrealized gain (loss) on available-for-sale securities
|
24
|
|
(43
|
)
|
7,765
|
|
||||
|
Less: realized gains on sale of available-for-sale securities recognized in net income
|
—
|
|
—
|
|
(7,765
|
)
|
||||
|
Other comprehensive income (loss)
|
40,831
|
|
(980
|
)
|
(40,615
|
)
|
||||
|
Comprehensive income
|
207,823
|
|
151,563
|
|
148,232
|
|
||||
|
Less: comprehensive income (loss) attributable to noncontrolling interests:
|
||||||||||
|
Net income attributable to noncontrolling interests
|
1,813
|
|
2,247
|
|
1,138
|
|
||||
|
Other comprehensive income (loss) attributable to noncontrolling interests
|
426
|
|
(33
|
)
|
(201
|
)
|
||||
|
Comprehensive income attributable to noncontrolling interests
|
2,239
|
|
2,214
|
|
937
|
|
||||
|
Comprehensive income attributable to the Partnership
|
$
|
205,584
|
|
149,349
|
|
147,295
|
|
|||
See accompanying notes to consolidated financial statements.
80
|
REGENCY CENTERS, L.P.
Consolidated Statements of Capital
For the
years
ended
December 31, 2016
,
2015
, and
2014
(in thousands)
|
||||||||||||||||||
|
|
General Partner
Preferred and Common Units |
Limited
Partners |
Accumulated
Other Comprehensive Loss |
Total
Partners’ Capital |
Noncontrolling
Interests in Limited Partners’ Interest in Consolidated Partnerships |
Total
Capital |
||||||||||||
|
Balance at December 31, 2013
|
$
|
1,860,758
|
|
(1,426
|
)
|
(17,404
|
)
|
1,841,928
|
|
19,206
|
|
1,861,134
|
|
|||||
|
Net income
|
187,390
|
|
319
|
|
—
|
|
187,709
|
|
1,138
|
|
188,847
|
|
||||||
|
Other comprehensive income (loss)
|
—
|
|
(70
|
)
|
(40,344
|
)
|
(40,414
|
)
|
(201
|
)
|
(40,615
|
)
|
||||||
|
Contributions from partners
|
—
|
|
—
|
|
—
|
|
—
|
|
16,204
|
|
16,204
|
|
||||||
|
Distributions to partners
|
(175,188
|
)
|
(300
|
)
|
—
|
|
(175,488
|
)
|
(4,543
|
)
|
(180,031
|
)
|
||||||
|
Redemption of preferred units
|
—
|
|
(300
|
)
|
—
|
|
(300
|
)
|
—
|
|
(300
|
)
|
||||||
|
Preferred unit distributions
|
(21,062
|
)
|
—
|
|
—
|
|
(21,062
|
)
|
—
|
|
(21,062
|
)
|
||||||
|
Restricted units issued as a result of amortization of restricted stock issued by Parent Company
|
12,161
|
|
—
|
|
—
|
|
12,161
|
|
—
|
|
12,161
|
|
||||||
|
Common units exchanged for common stock of the Parent Company
|
137
|
|
(137
|
)
|
—
|
|
—
|
|
—
|
|
—
|
|
||||||
|
Common units issued as a result of common stock issued by Parent Company, net of repurchases
|
100,144
|
|
—
|
|
—
|
|
100,144
|
|
—
|
|
100,144
|
|
||||||
|
Balance at December 31, 2014
|
$
|
1,964,340
|
|
(1,914
|
)
|
(57,748
|
)
|
1,904,678
|
|
31,804
|
|
1,936,482
|
|
|||||
|
Net income
|
150,056
|
|
240
|
|
—
|
|
150,296
|
|
2,247
|
|
152,543
|
|
||||||
|
Other comprehensive income (loss)
|
—
|
|
(2
|
)
|
(945
|
)
|
(947
|
)
|
(33
|
)
|
(980
|
)
|
||||||
|
Contributions from partners
|
—
|
|
—
|
|
—
|
|
—
|
|
717
|
|
717
|
|
||||||
|
Distributions to partners
|
(184,439
|
)
|
(299
|
)
|
—
|
|
(184,738
|
)
|
(4,249
|
)
|
(188,987
|
)
|
||||||
|
Preferred unit distributions
|
(21,062
|
)
|
—
|
|
—
|
|
(21,062
|
)
|
—
|
|
(21,062
|
)
|
||||||
|
Restricted units issued as a result of amortization of restricted stock issued by Parent Company
|
13,869
|
|
—
|
|
—
|
|
13,869
|
|
—
|
|
13,869
|
|
||||||
|
Common units issued as a result of common stock issued by Parent Company, net of repurchases
|
190,038
|
|
—
|
|
—
|
|
190,038
|
|
—
|
|
190,038
|
|
||||||
|
Balance at December 31, 2015
|
$
|
2,112,802
|
|
(1,975
|
)
|
(58,693
|
)
|
2,052,134
|
|
30,486
|
|
2,082,620
|
|
|||||
|
Net income
|
164,922
|
|
257
|
|
—
|
|
165,179
|
|
1,813
|
|
166,992
|
|
||||||
|
Other comprehensive income (loss)
|
—
|
|
58
|
|
40,347
|
|
40,405
|
|
426
|
|
40,831
|
|
||||||
|
Contributions from partners
|
—
|
|
—
|
|
—
|
|
—
|
|
8,760
|
|
8,760
|
|
||||||
|
Distributions to partners
|
(202,099
|
)
|
(307
|
)
|
—
|
|
(202,406
|
)
|
(6,855
|
)
|
(209,261
|
)
|
||||||
|
Reallocation of limited partners' interest
|
(538
|
)
|
—
|
|
—
|
|
(538
|
)
|
538
|
|
—
|
|
||||||
81
|
REGENCY CENTERS, L.P.
Consolidated Statements of Capital
For the
years
ended
December 31, 2016
,
2015
, and
2014
(in thousands)
|
||||||||||||||||||
|
|
General Partner
Preferred and Common Units |
Limited
Partners |
Accumulated
Other Comprehensive Loss |
Total
Partners’ Capital |
Noncontrolling
Interests in Limited Partners’ Interest in Consolidated Partnerships |
Total
Capital |
||||||||||||
|
Redemption of preferred units
|
—
|
|
—
|
|
—
|
|
—
|
|
—
|
|
—
|
|
||||||
|
Preferred unit distributions
|
(21,062
|
)
|
—
|
|
—
|
|
(21,062
|
)
|
—
|
|
(21,062
|
)
|
||||||
|
Restricted units issued as a result of amortization of restricted stock issued by Parent Company
|
13,421
|
|
—
|
|
—
|
|
13,421
|
|
—
|
|
13,421
|
|
||||||
|
Common units issued as a result of common stock issued by Parent Company, net of repurchases
|
542,201
|
|
—
|
|
—
|
|
542,201
|
|
—
|
|
542,201
|
|
||||||
|
Balance at December 31, 2016
|
$
|
2,609,647
|
|
(1,967
|
)
|
(18,346
|
)
|
2,589,334
|
|
35,168
|
|
2,624,502
|
|
|||||
See accompanying notes to consolidated financial statements.
82
|
REGENCY CENTERS, L.P.
Consolidated Statements of Cash Flows
For the years ended December 31, 2016, 2015, and 2014
(in thousands)
|
||||||||||
|
|
2016
|
2015
|
2014
|
|||||||
|
Cash flows from operating activities:
|
||||||||||
|
Net income
|
$
|
166,992
|
|
152,543
|
|
188,847
|
|
|||
|
Adjustments to reconcile net income to net cash provided by operating activities:
|
||||||||||
|
Depreciation and amortization
|
162,327
|
|
146,829
|
|
147,791
|
|
||||
|
Amortization of deferred loan cost and debt premium
|
9,762
|
|
9,677
|
|
10,521
|
|
||||
|
Amortization and (accretion) of above and below market lease intangibles, net
|
(3,879
|
)
|
(1,598
|
)
|
(3,101
|
)
|
||||
|
Stock-based compensation, net of capitalization
|
10,652
|
|
11,081
|
|
9,662
|
|
||||
|
Equity in income of investments in real estate partnerships
|
(56,518
|
)
|
(22,508
|
)
|
(31,270
|
)
|
||||
|
Gain on remeasurement of investment in real estate partnership
|
—
|
|
—
|
|
(18,271
|
)
|
||||
|
Gain on sale of real estate, net of tax
|
(47,321
|
)
|
(35,606
|
)
|
(55,077
|
)
|
||||
|
Provision for impairment
|
4,200
|
|
—
|
|
1,257
|
|
||||
|
Early extinguishment of debt
|
14,240
|
|
8,239
|
|
18
|
|
||||
|
Deferred income tax expense of taxable REIT subsidiary
|
—
|
|
—
|
|
—
|
|
||||
|
Distribution of earnings from operations of investments in real estate partnerships
|
50,361
|
|
46,646
|
|
42,767
|
|
||||
|
Settlement of derivative instruments
|
—
|
|
(7,267
|
)
|
4,648
|
|
||||
|
Gain on derivative instruments
|
—
|
|
—
|
|
(13
|
)
|
||||
|
Deferred compensation expense
|
1,655
|
|
207
|
|
1,386
|
|
||||
|
Realized and unrealized gain on investments (note 11)
|
(1,673
|
)
|
(626
|
)
|
(9,158
|
)
|
||||
|
Changes in assets and liabilities:
|
||||||||||
|
Restricted cash
|
59
|
|
1,926
|
|
848
|
|
||||
|
Accounts receivable, net
|
(9,565
|
)
|
(11,965
|
)
|
(6,225
|
)
|
||||
|
Straight-line rent receivable, net
|
(7,219
|
)
|
(8,231
|
)
|
(6,544
|
)
|
||||
|
Deferred leasing costs
|
(10,349
|
)
|
(12,949
|
)
|
(8,252
|
)
|
||||
|
Other assets
|
673
|
|
(496
|
)
|
89
|
|
||||
|
Accounts payable and other liabilities
|
5,543
|
|
(3,810
|
)
|
6,201
|
|
||||
|
Tenants’ security and escrow deposits and prepaid rent
|
(564
|
)
|
3,545
|
|
1,618
|
|
||||
|
Net cash provided by operating activities
|
289,376
|
|
275,637
|
|
277,742
|
|
||||
|
Cash flows from investing activities:
|
||||||||||
|
Acquisition of operating real estate
|
(333,220
|
)
|
(42,983
|
)
|
(112,120
|
)
|
||||
|
Advance deposits paid on acquisition of operating real estate
|
(750
|
)
|
(2,250
|
)
|
—
|
|
||||
|
Real estate development and capital improvements
|
(234,598
|
)
|
(205,103
|
)
|
(238,237
|
)
|
||||
|
Proceeds from sale of real estate investments
|
135,269
|
|
108,822
|
|
118,787
|
|
||||
|
Collection of notes receivable
|
—
|
|
1,719
|
|
—
|
|
||||
|
Investments in real estate partnerships
|
(37,879
|
)
|
(20,054
|
)
|
(23,577
|
)
|
||||
|
Distributions received from investments in real estate partnerships
|
58,810
|
|
23,801
|
|
37,152
|
|
||||
|
Dividends on investment securities
|
330
|
|
243
|
|
243
|
|
||||
|
Acquisition of securities
|
(55,223
|
)
|
(31,941
|
)
|
(23,760
|
)
|
||||
|
Proceeds from sale of securities
|
57,590
|
|
28,400
|
|
31,222
|
|
||||
|
Net cash used in investing activities
|
(409,671
|
)
|
(139,346
|
)
|
(210,290
|
)
|
||||
83
|
REGENCY CENTERS, L.P.
Consolidated Statements of Cash Flows
For the years ended December 31, 2016, 2015, and 2014
(in thousands)
|
||||||||||
|
|
2016
|
2015
|
2014
|
|||||||
|
Cash flows from financing activities:
|
||||||||||
|
Net proceeds from common units issued as a result of common stock issued by Parent Company
|
548,920
|
|
198,494
|
|
102,453
|
|
||||
|
Proceeds from treasury units issued as a result of treasury stock sold by Parent Company
|
957
|
|
—
|
|
—
|
|
||||
|
Acquisition of treasury units as a result of treasury stock acquired by Parent Company
|
(29
|
)
|
—
|
|
—
|
|
||||
|
Redemption of preferred partnership units
|
—
|
|
—
|
|
(300
|
)
|
||||
|
Distributions to limited partners in consolidated partnerships, net
|
(4,213
|
)
|
(5,341
|
)
|
(5,303
|
)
|
||||
|
Distributions to partners
|
(201,336
|
)
|
(181,691
|
)
|
(172,900
|
)
|
||||
|
Distributions to preferred unit holders
|
(21,062
|
)
|
(21,062
|
)
|
(21,062
|
)
|
||||
|
Repayment of fixed rate unsecured notes
|
(300,000
|
)
|
(450,000
|
)
|
(150,000
|
)
|
||||
|
Proceeds from issuance of fixed rate unsecured notes, net
|
—
|
|
248,160
|
|
248,705
|
|
||||
|
Proceeds from unsecured credit facilities
|
460,000
|
|
445,000
|
|
255,000
|
|
||||
|
Repayment of unsecured credit facilities
|
(345,000
|
)
|
(355,000
|
)
|
(255,000
|
)
|
||||
|
Proceeds from notes payable
|
53,446
|
|
4,316
|
|
12,739
|
|
||||
|
Repayment of notes payable
|
(72,803
|
)
|
(76,168
|
)
|
(38,717
|
)
|
||||
|
Scheduled principal payments
|
(5,860
|
)
|
(5,878
|
)
|
(6,909
|
)
|
||||
|
Payment of loan costs
|
(2,233
|
)
|
(5,998
|
)
|
(3,066
|
)
|
||||
|
Early redemption costs
|
(14,092
|
)
|
(8,043
|
)
|
—
|
|
||||
|
Net cash provided by (used in) financing activities
|
96,695
|
|
(213,211
|
)
|
(34,360
|
)
|
||||
|
Net decrease in cash and cash equivalents
|
(23,600
|
)
|
(76,920
|
)
|
33,092
|
|
||||
|
Cash and cash equivalents at beginning of the year
|
36,856
|
|
113,776
|
|
80,684
|
|
||||
|
Cash and cash equivalents at end of the year
|
$
|
13,256
|
|
36,856
|
|
113,776
|
|
|||
|
Supplemental disclosure of cash flow information:
|
||||||||||
|
Cash paid for interest (net of capitalized interest of $3,482, $6,740, and $7,142 in 2016, 2015, and 2014, respectively)
|
$
|
82,950
|
|
101,527
|
|
109,425
|
|
|||
|
Cash paid for income taxes
|
$
|
—
|
|
1,015
|
|
2,169
|
|
|||
|
Supplemental disclosure of non-cash transactions:
|
||||||||||
|
Common stock issued by Parent Company for partnership units exchanged
|
$
|
—
|
|
—
|
|
137
|
|
|||
|
Mortgage loans assumed for the acquisition of real estate
|
$
|
—
|
|
42,799
|
|
103,187
|
|
|||
|
Change in fair value of securities available-for-sale
|
$
|
24
|
|
(43
|
)
|
—
|
|
|||
|
Initial fair value of non-controlling interest recorded at acquisition
|
$
|
—
|
|
—
|
|
15,385
|
|
|||
|
Acquisition of previously unconsolidated real estate investments
|
$
|
—
|
|
—
|
|
16,182
|
|
|||
|
Change in fair value of derivative instruments
|
$
|
(10,332
|
)
|
(9,012
|
)
|
(49,968
|
)
|
|||
|
Common stock issued by Parent Company for dividend reinvestment plan
|
$
|
1,070
|
|
1,250
|
|
1,184
|
|
|||
|
Stock-based compensation capitalized
|
$
|
2,963
|
|
2,988
|
|
2,707
|
|
|||
|
Contributions from limited partners in consolidated partnerships, net
|
$
|
8,755
|
|
13
|
|
1,579
|
|
|||
|
Common stock issued for dividend reinvestment in trust
|
$
|
728
|
|
833
|
|
779
|
|
|||
|
Contribution of stock awards into trust
|
$
|
1,538
|
|
1,651
|
|
1,881
|
|
|||
|
Distribution of stock held in trust
|
$
|
4,114
|
|
1,898
|
|
4
|
|
|||
|
Deconsolidation of previously consolidated partnership:
|
||||||||||
|
Real estate, net
|
$
|
14,144
|
|
—
|
|
—
|
|
|||
|
Investments in real estate partnerships
|
$
|
(3,355
|
)
|
—
|
|
—
|
|
|||
|
Notes payable
|
$
|
(9,415
|
)
|
—
|
|
—
|
|
|||
|
Other assets and liabilities
|
$
|
571
|
|
—
|
|
—
|
|
|||
|
Limited partners' interest in consolidated partnerships
|
$
|
(2,099
|
)
|
—
|
|
—
|
|
|||
See accompanying notes to consolidated financial statements.
84
REGENCY CENTERS CORPORATION AND REGENCY CENTERS, L.P.
Notes to Consolidated Financial Statements
December 31, 2016
|
1.
|
Summary of Significant Accounting Policies
|
(a) Organization and Principles of Consolidation
General
Regency Centers Corporation (the “Parent Company”) began its operations as a Real Estate Investment Trust (“REIT”) in
1993
and is the general partner of Regency Centers, L.P. (the “Operating Partnership”). The Parent Company engages in the ownership, management, leasing, acquisition, and development of retail shopping centers through the Operating Partnership, and has no other assets or liabilities other than through its investment in the Operating Partnership. The Parent Company guarantees all of the unsecured debt of the Operating Partnership. As of
December 31, 2016
, the Parent Company, the Operating Partnership, and their controlled subsidiaries on a consolidated basis (the "Company” or “Regency”) owned
198
retail shopping centers and held partial interests in an additional
109
retail shopping centers through unconsolidated investments in real estate partnerships (also referred to as "joint ventures" or "co-investment partnerships").
Estimates, Risks, and Uncertainties
The preparation of the consolidated financial statements in conformity with U.S. Generally Accepted Accounting Principles (“GAAP”) requires the Company's management to make estimates and assumptions that affect the reported amounts of assets and liabilities, and disclosure of contingent assets and liabilities, at the date of the financial statements and the reported amounts of revenues and expenses during the reporting period. Actual results could differ from those estimates. The most significant estimates in the Company's financial statements relate to the net carrying values of its real estate investments, accounts receivable, and straight line rent receivable. It is possible that the estimates and assumptions that have been utilized in the preparation of the consolidated financial statements could change significantly if economic conditions were to weaken.
Consolidation
The accompanying consolidated financial statements include the accounts of the Parent Company, the Operating Partnership, its wholly-owned subsidiaries, and consolidated partnerships in which the Company has a controlling interest. Investments in real estate partnerships not controlled by the Company are accounted for under the equity method. All significant inter-company balances and transactions are eliminated in the consolidated financial statements.
The Company consolidates properties that are wholly owned or properties where it owns less than 100%, but which it controls. Control is determined using an evaluation based on accounting standards related to the consolidation of voting interest entities and variable interest entities ("VIEs"). For joint ventures that are determined to be a VIE, the Company consolidates the entity where it is deemed to be the primary beneficiary. Determination of the primary beneficiary is based on whether an entity has (1) the power to direct the activities of the VIE that most significantly impact the entity's economic performance, and (2) the obligation to absorb losses of the entity that could potentially be significant to the VIE or the right to receive benefits from the entity that could potentially be significant to the VIE. The Company's determination of the primary beneficiary considers all relationships between it and the VIE, including management agreements and other contractual arrangements.
Ownership of the Parent Company
The Parent Company has a single class of common stock outstanding and two series of preferred stock outstanding (“Series 6 and 7 Preferred Stock”). The dividends on the Series 6 and 7 Preferred Stock are cumulative and payable in arrears quarterly.
Subsequent to
December 31, 2016
, on February 16, 2017, the Parent Company provided notice of its intent and redeemed all outstanding shares of Series 6 Preferred Stock, as discussed further in note 9.
85
REGENCY CENTERS CORPORATION AND REGENCY CENTERS, L.P.
Notes to Consolidated Financial Statements
December 31, 2016
Ownership of the Operating Partnership
The Operating Partnership's capital includes general and limited common Partnership Units. As of
December 31, 2016
, the Parent Company owned approximately
99.9%
,or
104,497,286
, of the
104,651,456
outstanding common Partnership Units of the Operating Partnership, with the remaining limited Partnership Units held by third parties ("Exchangeable operating partnership units" or "EOP units"). The Parent Company serves as general partner of the Operating Partnership. The EOP unit holders have limited rights over the Operating Partnership such that they do not have the power to direct the activities of the Operating Partnership. As such, the Operating Partnership is considered a variable interest entity, and the Parent Company is the primary beneficiary, which consolidates it. The Parent Company's only investment is the Operating Partnership. Net income and distributions of the Operating Partnership are allocable to the general and limited common Partnership Units in accordance with their ownership percentages.
Real Estate Partnerships
Regency has an ownership interest in
120
properties through partnerships, of which
11
are consolidated. These partners include institutional investors, other real estate developers and/or operators, and individual parties who help Regency source transactions for development and investment (the "Partners" or "limited partners"). Regency has a variable interest in these entities through its equity interests. As managing member, Regency maintains the books and records and typically provides leasing and property management to the partnerships. The Partners’ level of involvement varies from protective decisions (debt, bankruptcy, selling primary asset(s) of business) to involvement in approving leases, operating budgets, and capital budgets.
|
•
|
Those partnerships for which the Partners only have protective rights are considered VIEs under ASC 810, Consolidation. Regency is the primary beneficiary of these VIEs as Regency has power over these partnerships and they operate primarily for the benefit of Regency. As such, Regency consolidates these entities and reports the limited partners’ interest as noncontrolling interests.
|
The majority of the operations of the VIEs are funded with cash flows generated by the properties, or in the case of developments, with capital contributions or third party construction loans. Regency does not provide financial support to the VIEs.
|
•
|
Those partnerships for which the Partners are involved in the day to day decisions and do not have any other aspects that would cause them to be considered VIEs, are evaluated for consolidation using the voting interest model.
|
|
◦
|
Those partnerships in which Regency has a controlling financial interest are consolidated and the limited partners’ ownership interest and share of net income is recorded as noncontrolling interest.
|
|
◦
|
Those partnerships in which Regency does not have a controlling financial interest are accounted for using the equity method and its ownership interest is recognized through single-line presentation as Investments in Real Estate Partnerships, in the Consolidated Balance Sheet, and Equity in Income of Investments in Real Estate Partnerships, in the Consolidated Statements of Operations. Cash distributions of earnings from operations from investments in real estate partnerships are presented in cash flows provided by operating activities in the accompanying Consolidated Statements of Cash Flows. Cash distributions from the sale of a property or loan proceeds received from the placement of debt on a property included in investments in real estate partnerships are presented in cash flows provided by investing activities in the accompanying Consolidated Statements of Cash Flows. The net difference in the carrying amount of investments in real estate partnerships and the underlying equity in net assets is either accreted to income and recorded in equity in income of investments in real estate partnerships in the accompanying Consolidated Statements of Operations over the expected useful lives of the properties and other intangible assets, which range in lives from
10
to
40
years, or recognized at liquidation if the joint venture agreement includes a unilateral right to elect to dissolve the real estate partnership and, upon such an election, receive a distribution in-kind.
|
86
REGENCY CENTERS CORPORATION AND REGENCY CENTERS, L.P.
Notes to Consolidated Financial Statements
December 31, 2016
The assets of these partnerships are restricted to the use of the partnerships and cannot be used by general creditors of the Company. And similarly, the obligations of these partnerships can only be settled by the assets of these partnerships.
The major classes of assets, liabilities, and non-controlling equity interests held by the Company's VIEs, exclusive of the Operating Partnership as a whole, are as follows:
|
(in thousands)
|
December 31, 2016
|
December 31, 2015
|
|||
|
Assets
|
|||||
|
Real estate assets, net
|
$
|
86,440
|
|
81,424
|
|
|
Cash and cash equivalents
|
3,444
|
|
790
|
|
|
|
Liabilities
|
|||||
|
Notes payable
|
8,175
|
|
17,948
|
|
|
|
Equity
|
|||||
|
Limited partners’ interests in consolidated partnerships
|
17,565
|
|
11,058
|
|
|
Noncontrolling Interests
Noncontrolling Interests of the Parent Company
The consolidated financial statements of the Parent Company include the following ownership interests held by owners other than the preferred and common stockholders of the Parent Company: (i) the limited Partnership Units in the Operating Partnership held by third parties and (ii) the minority-owned interest held by third parties in consolidated partnerships (“Limited partners' interests in consolidated partnerships”). The Parent Company has included all of these noncontrolling interests in permanent equity, separate from the Parent Company's stockholders' equity, in the accompanying Consolidated Balance Sheets and Consolidated Statements of Equity and Comprehensive Income (Loss). The portion of net income or comprehensive income attributable to these noncontrolling interests is included in net income and comprehensive income in the accompanying Consolidated Statements of Operations and Consolidated Statements of Comprehensive Income (Loss) of the Parent Company.
In accordance with the FASB ASC Topic 480, securities that are redeemable for cash or other assets at the option of the holder, not solely within the control of the issuer, are classified as redeemable noncontrolling interests outside of permanent equity in the Consolidated Balance Sheets. The Parent Company has evaluated the conditions as specified under the FASB ASC Topic 480 as it relates to exchangeable operating partnership units outstanding and concluded that it has the right to satisfy the redemption requirements of the units by delivering unregistered common stock. Each outstanding exchangeable operating partnership unit is exchangeable for one share of common stock of the Parent Company, and the unit holder cannot require redemption in cash or other assets. Limited partners' interests in consolidated partnerships are not redeemable by the holders. The Parent Company also evaluated its fiduciary duties to itself, its shareholders, and, as the managing general partner of the Operating Partnership, to the Operating Partnership, and concluded its fiduciary duties are not in conflict with each other or the underlying agreements. Therefore, the Parent Company classifies such units and interests as permanent equity in the accompanying Consolidated Balance Sheets and Consolidated Statements of Equity.
Noncontrolling Interests of the Operating Partnership
The Operating Partnership has determined that limited partners' interests in consolidated partnerships are noncontrolling interests. Subject to certain conditions and pursuant to the terms of the agreement, the Company generally has the right, but not the obligation, to purchase the other member’s interest or sell its own interest in these consolidated partnerships. The Operating Partnership has included these noncontrolling interests in permanent capital, separate from partners' capital, in the accompanying Consolidated Balance Sheets and Consolidated Statements of Capital. The portion of net income (loss) or comprehensive income
87
REGENCY CENTERS CORPORATION AND REGENCY CENTERS, L.P.
Notes to Consolidated Financial Statements
December 31, 2016
(loss) attributable to these noncontrolling interests is included in net income and comprehensive income in the accompanying Consolidated Statements of Operations and Consolidated Statements Comprehensive Income (Loss) of the Operating Partnership.
(b) Revenues and Tenant Receivable
Leasing Revenue and Receivables
The Company leases space to tenants under agreements with varying terms. Leases are accounted for as operating leases with minimum rent recognized on a straight-line basis over the term of the lease regardless of when payments are due. The Company estimates the collectibility of the accounts receivable related to base rents, straight-line rents, expense reimbursements, and other revenue taking into consideration the Company's historical write-off experience, tenant credit-worthiness, current economic trends, and remaining lease terms
.
The Company recorded the following provisions for doubtful accounts:
|
Year ended December 31,
|
|||||||||
|
(in thousands)
|
2016
|
2015
|
2014
|
||||||
|
Gross provision for doubtful accounts
|
$
|
1,705
|
|
2,364
|
|
2,192
|
|
||
|
Provision for straight line rent reserve
|
$
|
2,271
|
|
714
|
|
107
|
|
||
The following table represents the components of Tenant and other receivables, net in the accompanying Consolidated Balance Sheets:
|
December 31,
|
||||||
|
(in thousands)
|
2016
|
2015
|
||||
|
Billed tenant receivables
|
$
|
15,599
|
|
14,521
|
|
|
|
Accrued CAM, insurance and tax reimbursements
|
9,221
|
|
12,358
|
|
||
|
Other receivables
|
12,058
|
|
10,708
|
|
||
|
Straight-line rent receivables
|
73,384
|
|
64,757
|
|
||
|
Notes receivable
|
10,481
|
|
10,480
|
|
||
|
Less: allowance for doubtful accounts
|
(5,460
|
)
|
(5,295
|
)
|
||
|
Less: straight-line rent reserves
|
(3,561
|
)
|
(1,365
|
)
|
||
|
Total tenant and other receivables, net
|
$
|
111,722
|
|
106,164
|
|
|
More than half of all of the lease agreements with anchor tenants contain provisions that provide for additional rents based on tenants' sales volume ("percentage rent"). Percentage rents are recognized when the tenants achieve the specified targets as defined in their lease agreements. Substantially all lease agreements contain provisions for reimbursement of the tenants' share of real estate taxes, insurance and common area maintenance (“CAM”) costs. Recovery of real estate taxes, insurance, and CAM costs are recognized as the respective costs are incurred in accordance with the lease agreements.
When the Company is the owner of the leasehold improvements, recognition of straight line lease revenue commences when the lessee is given possession of the leased space upon completion of tenant improvements. However, when the leasehold improvements are owned by the tenant, the lease inception date is the date the tenant obtains possession of the leased space for purposes of constructing its leasehold improvements.
The Notes receivable balance represents a single note from a previous property sale, which has a fixed interest rate of
7.0%
, a maturity date of
January 2019
, and is secured by real estate held as collateral.
88
REGENCY CENTERS CORPORATION AND REGENCY CENTERS, L.P.
Notes to Consolidated Financial Statements
December 31, 2016
Real Estate Sales
Profits from sales of real estate are recognized under the full accrual method by the Company when: (i) a sale is consummated; (ii) the buyer's initial and continuing investment is adequate to demonstrate a commitment to pay for the property; (iii) the Company's receivable, if applicable, is not subject to future subordination; (iv) the Company has transferred to the buyer the usual risks and rewards of ownership; and (v) the Company does not have substantial continuing involvement with the property.
The Company sells shopping centers to joint ventures in exchange for cash equal to the fair value of the ownership interest of its partners. The Company accounts for those sales as “partial sales” and recognizes gains on those partial sales in the period the properties were sold to the extent of the percentage interest sold, and in the case of certain real estate partnerships, applies a more restrictive method of recognizing gains, as discussed further below.
As of
December 31, 2016
,
five
of the Company's joint ventures (“DIK-JV”) give each partner the unilateral right to elect to dissolve the real estate partnership and, upon such an election, receive a distribution in-kind (“DIK”) of the assets of the real estate partnership equal to their respective capital account, which could include properties the Company previously sold to the real estate partnership.
Because the contingency associated with the possibility of receiving a particular property back upon liquidation is not satisfied at the property level, but at the aggregate level, no previously deferred gain is recognized by the Company on an individual property sold by the DIK-JV to a third party or received by the Company upon actual dissolution. Instead, the property received upon dissolution is recorded at the carrying value of the Company's investment in the DIK-JV on the date of dissolution. However, the deferred gain is recognized if and when all such properties in the DIK-JV are sold to a third party.
Management Services
The Company is engaged under agreements with its joint venture partners to provide asset management, property management, leasing, investing, and financing services for such joint ventures' shopping centers. The fees are market-based, generally calculated as a percentage of either revenues earned or the estimated values of the properties managed or the proceeds received, and are recognized as services are rendered, when fees due are determinable, and collectibility is reasonably assured. The Company also receives transaction fees, as contractually agreed upon with a joint venture, which include fees such as acquisition fees, disposition fees, “promotes”, or “earnouts”, which are recognized as services are rendered, when fees due are determinable, and collectibility is reasonably assured.
(c) Real Estate Investments
Capitalization and Depreciation
Maintenance and repairs that do not improve or extend the useful lives of the respective assets are recorded in operating and maintenance expense.
As part of the leasing process, the Company may provide the lessee with an allowance for the construction of leasehold improvements. These leasehold improvements are capitalized and recorded as tenant improvements, and depreciated over the shorter of the useful life of the improvements or the remaining lease term. If the allowance represents a payment for a purpose other than funding leasehold improvements, or in the event the Company is not considered the owner of the improvements, the allowance is considered to be a lease incentive and is recognized over the lease term as a reduction of minimum rent. Factors considered during this evaluation include, among other things, who holds legal title to the improvements as well as other controlling rights provided by the lease agreement and provisions for substantiation of such costs (e.g. unilateral control of the tenant space during the build-out process). Determination of the appropriate
89
REGENCY CENTERS CORPORATION AND REGENCY CENTERS, L.P.
Notes to Consolidated Financial Statements
December 31, 2016
accounting for the payment of a tenant allowance is made on a lease-by-lease basis, considering the facts and circumstances of the individual tenant lease.
Depreciation is computed using the straight-line method over estimated useful lives of approximately
40
years for buildings and improvements, the shorter of the useful life or the remaining lease term subject to a maximum of
10
years for tenant improvements, and
three
to
seven
years for furniture and equipment.
Development Costs
Land, buildings, and improvements are recorded at cost. All specifically identifiable costs related to development activities are capitalized into properties in development on the accompanying Consolidated Balance Sheets. Properties in development are defined as properties that are in the construction or initial lease-up phase. The capitalized costs include pre-development costs essential to the development of the property, development costs, construction costs, interest costs, real estate taxes, and allocated direct employee costs incurred during the period of development. Interest costs are capitalized into each development project based upon applying the Company's weighted average borrowing rate to that portion of the actual development costs expended. The Company discontinues interest and real estate tax capitalization when the property is no longer being developed or is available for occupancy upon substantial completion of tenant improvements, but in no event would the Company capitalize interest on the project beyond
12
months after substantial completion of the building shell.
Pre-development costs represent the costs the Company incurs prior to land acquisition including contract deposits, as well as legal, engineering, and other external professional fees related to evaluating the feasibility of developing a shopping center. As of
December 31, 2016
and
2015
, the Company had refundable deposits of approximately
$1.2 million
and
$1.3 million
, respectively, included in pre-development costs. If the Company determines that the development of a particular shopping center is no longer probable, any related pre-development costs previously capitalized are immediately expensed. During the years ended
December 31, 2016
,
2015
, and
2014
, the Company expensed pre-development costs of approximately
$1.5 million
,
$1.7 million
, and
$2.3 million
, respectively, in other operating expenses in the accompanying Consolidated Statements of Operations.
Acquisitions
The Company and the real estate partnerships account for business combinations using the acquisition method by recognizing and measuring the identifiable assets acquired, the liabilities assumed, and any noncontrolling interest in the acquiree at their acquisition date fair values. The Company expenses transaction costs associated with business combinations in the period incurred.
The Company's methodology includes estimating an “as-if vacant” fair value of the physical property, which includes land, building, and improvements. In addition, the Company determines the estimated fair value of identifiable intangible assets and liabilities, considering the following categories: (i) value of in-place leases, and (ii) above and below-market value of in-place leases.
The value of in-place leases is estimated based on the value associated with the costs avoided in originating leases compared to the acquired in-place leases as well as the value associated with lost rental and recovery revenue during the assumed lease-up period. The value of in-place leases is recorded to amortization expense over the remaining expected term of the respective leases.
Above-market and below-market in-place lease values for acquired properties are recorded based on the present value of the difference between (i) the contractual amounts to be paid pursuant to the in-place leases and (ii) management's estimate of fair market lease rates for comparable in-place leases, measured over a period equal to the remaining non-cancelable term of the lease, including below-market renewal options, if applicable. The value of above-market leases is amortized as a reduction of minimum rent over the remaining terms of the respective leases and the value of below-market leases is accreted to minimum rent over the remaining terms of the respective leases, including below-market renewal options, if applicable. The Company does not assign value to customer
90
REGENCY CENTERS CORPORATION AND REGENCY CENTERS, L.P.
Notes to Consolidated Financial Statements
December 31, 2016
relationship intangibles if it has pre-existing business relationships with the major retailers at the acquired property since they do not provide incremental value over the Company's existing relationships.
Held for Sale
The Company classifies land, an operating property, or a property in development as held-for-sale upon satisfaction of the following criteria: (i) management commits to a plan to sell a property (or group of properties), (ii) the property is available for immediate sale in its present condition subject only to terms that are usual and customary for sales of such properties, (iii) an active program to locate a buyer and other actions required to complete the plan to sell the property have been initiated, (iv) the sale of the property is probable and transfer of the asset is expected to be completed within one year, (v) the property is being actively marketed for sale, and (vi) actions required to complete the plan indicate that it is unlikely that significant changes to the plan will be made or that the plan will be withdrawn. Operating properties held-for-sale are carried at the lower of cost or fair value less costs to sell.
Impairment
We evaluate whether there are any indicators, including property operating performance and general market conditions, that the value of the real estate properties (including any related amortizable intangible assets or liabilities) may not be recoverable. Through the evaluation, we compare the current carrying value of the asset to the estimated undiscounted cash flows that are directly associated with the use and ultimate disposition of the asset. Our estimated cash flows are based on several key assumptions, including rental rates, costs of tenant improvements, leasing commissions, anticipated hold period, and assumptions regarding the residual value upon disposition, including the exit capitalization rate. These key assumptions are subjective in nature and could differ materially from actual results. Changes in our disposition strategy or changes in the marketplace may alter the hold period of an asset or asset group which may result in an impairment loss and such loss could be material to the Company's financial condition or operating performance. To the extent that the carrying value of the asset exceeds the estimated undiscounted cash flows, an impairment loss is recognized equal to the excess of carrying value over fair value. If such indicators are not identified, management will not assess the recoverability of a property's carrying value. If a property previously classified as held and used is changed to held-for-sale, the Company estimates fair value, less expected costs to sell, which could cause the Company to determine that the property is impaired.
The fair value of real estate assets is subjective and is determined through comparable sales information and other market data if available, or through use of an income approach such as the direct capitalization method or the traditional discounted cash flow approach. Such cash flow projections consider factors such as expected future operating income, trends and prospects, as well as the effects of demand, competition and other factors, and therefore is subject to management judgment and changes in those factors could impact the determination of fair value. In estimating the fair value of undeveloped land, the Company generally uses market data and comparable sales information.
A loss in value of investments in real estate partnerships under the equity method of accounting, other than a temporary decline, must be recognized in the period in which the loss occurs. If management identifies indicators that the value of the Company's investment in real estate partnerships may be impaired, it evaluates the investment by calculating the fair value of the investment by discounting estimated future cash flows over the expected term of the investment.
Tax Basis
The net tax basis of the Company's real estate assets exceeds the book basis by approximately
$190.3 million
and
$183.9 million
at
December 31, 2016
and
2015
, respectively, primarily due to the property impairments recorded for book purposes and the cost basis of the assets acquired and their carryover basis recorded for tax purposes.
91
REGENCY CENTERS CORPORATION AND REGENCY CENTERS, L.P.
Notes to Consolidated Financial Statements
December 31, 2016
(d) Cash and Cash Equivalents
Any instruments which have an original maturity of 90 days or less when purchased are considered cash equivalents. As of
December 31, 2016
and
2015
,
$4.6 million
and
$3.8 million
, respectively, of cash was restricted through escrow agreements and certain mortgage loans.
(e) Securities
The Company determines the appropriate classification of its investments in debt and equity securities at the time of purchase and reevaluates such determinations at each balance sheet date. Debt securities are classified as held to maturity when the Company has the positive intent and ability to hold the securities to maturity. Marketable securities that are bought and held principally for the purpose of selling them in the near term are classified as trading securities and are reported at fair value, with unrealized gains and losses recognized in earnings. Debt and marketable equity securities not classified as held to maturity or as trading, are classified as available-for-sale, and are carried at fair value, with the unrealized gains and losses, net of tax, included in the determination of comprehensive income and reported in the Consolidated Statements of Comprehensive Income. The fair value of securities is determined using quoted market prices.
(f) Deferred Leasing Costs
Deferred leasing costs consist of internal and external commissions associated with leasing the Company's shopping centers, and are presented net of accumulated amortization. Such costs are amortized over the periods through lease expiration or loan maturity, respectively. If the lease is terminated early, the remaining leasing costs are written off.
(g) Derivative Financial Instruments
The Company manages economic risks, including interest rate, liquidity, and credit risk primarily by managing the amount, sources, and duration of its debt funding and the use of derivative financial instruments. Specifically, the Company enters into derivative financial instruments to manage exposures that arise from business activities that result in the receipt or future payment of known and uncertain cash amounts, the amount of which are determined by interest rates. The Company's derivative financial instruments are used to manage differences in the amount, timing, and duration of the Company's known or expected cash payments principally related to the Company's borrowings.
All derivative instruments, whether designated in hedging relationships or not, are recorded on the accompanying Consolidated Balance Sheets at their fair value. The accounting for changes in the fair value of derivatives depends on the intended use of the derivative, whether the Company has elected to designate a derivative in a hedging relationship and apply hedge accounting, and whether the hedging relationship has satisfied the criteria necessary to apply hedge accounting. Derivatives designated and qualifying as a hedge of the exposure to changes in the fair value of an asset, liability, or firm commitment attributable to a particular risk, such as interest rate risk, are considered fair value hedges. Derivatives designated and qualifying as a hedge of the exposure to variability in expected future cash flows, or other types of forecasted transactions, are considered cash flow hedges. Hedge accounting generally provides for the matching of the timing of gain or loss recognition on the hedging instrument with the recognition of the changes in the fair value of the hedged asset or liability attributable to the hedged risk in a fair value hedge or the earnings effect of the hedged forecasted transactions in a cash flow hedge. The Company may enter into derivative contracts that are intended to economically hedge certain risks, even though hedge accounting does not apply or the Company elects not to apply hedge accounting.
The Company uses interest rate swaps to mitigate its interest rate risk on a related financial instrument or forecasted transaction, and the Company designates these interest rate swaps as cash flow hedges. Interest rate swaps designated as cash flow hedges involve the receipt of variable-rate amounts from a counterparty in exchange for the Company making fixed-rate payments over the life of the agreements without exchange of the underlying notional amount. The gains or losses resulting from changes in fair value of derivatives that qualify as cash flow hedges are recognized in other comprehensive income (“OCI”) while the ineffective portion of the derivative's change in fair value is recognized in the Statements of Operations as interest
92
REGENCY CENTERS CORPORATION AND REGENCY CENTERS, L.P.
Notes to Consolidated Financial Statements
December 31, 2016
expense. Upon the settlement of a hedge, gains and losses remaining in OCI are amortized through earnings over the underlying term of the hedged transaction.
The Company formally documents all relationships between hedging instruments and hedged items, as well as its risk management objectives and strategies for undertaking various hedge transactions. The Company assesses, both at inception of the hedge and on an ongoing basis, whether the derivatives that are used in hedging transactions are highly effective in offsetting changes in the cash flows and/or forecasted cash flows of the hedged items.
In assessing the valuation of the hedges, the Company uses standard market conventions and techniques such as discounted cash flow analysis, option pricing models, and termination costs at each balance sheet date. All methods of assessing fair value result in a general approximation of value, and such value may never actually be realized.
The cash receipts or payments to settle interest rate swaps are presented in cash flows provided by operating activities in the accompanying Consolidated Statements of Cash Flows.
(h) Income Taxes
The Parent Company believes it qualifies, and intends to continue to qualify, as a REIT under the Internal Revenue Code (the “Code”). As a REIT, the Parent Company will generally not be subject to federal income tax, provided that distributions to its stockholders are at least equal to REIT taxable income. Regency Realty Group, Inc. (“RRG”), a wholly-owned subsidiary of the Operating Partnership, is a Taxable REIT Subsidiary (“TRS”) as defined in Section 856(l) of the Code. RRG is subject to federal and state income taxes and files separate tax returns. As a pass through entity, the Operating Partnership's taxable income or loss is reported by its partners, of which the Parent Company, as general partner and approximately
99.9%
owner, is allocated its pro-rata share of tax attributes.
Earnings and profits, which determine the taxability of dividends to stockholders, differs from net income reported for financial reporting purposes primarily because of differences in depreciable lives and cost bases of the shopping centers, as well as other timing differences.
Tax positions are initially recognized in the financial statements when it is more likely than not the position will be sustained upon examination by the tax authorities. Such tax positions shall initially and subsequently be measured as the largest amount of tax benefit that has a greater than 50% likelihood of being realized upon ultimate settlement with the tax authority assuming full knowledge of the position and relevant facts. The Company believes that it has appropriate support for the income tax positions taken and to be taken on its tax returns and that its accruals for tax liabilities are adequate for all open tax years (
2013
and forward for federal and state) based on an assessment of many factors including past experience and interpretations of tax laws applied to the facts of each matter.
(i) Earnings per Share and Unit
Basic earnings per share of common stock and unit are computed based upon the weighted average number of common shares and units, respectively, outstanding during the period. Diluted earnings per share and unit reflect the conversion of obligations and the assumed exercises of securities including the effects of shares issuable under the Company's share-based payment arrangements, if dilutive. Dividends paid on the Company's share-based compensation awards are not participating securities as they are forfeitable.
93
REGENCY CENTERS CORPORATION AND REGENCY CENTERS, L.P.
Notes to Consolidated Financial Statements
December 31, 2016
(j) Stock-Based Compensation
The Company grants stock-based compensation to its employees and directors. The Company recognizes stock-based compensation based on the grant-date fair value of the award and the cost of the stock-based compensation is expensed over the vesting period.
When the Parent Company issues common shares as compensation, it receives a like number of common units from the Operating Partnership. The Company is committed to contributing to the Operating Partnership all proceeds from the exercise of stock options or other share-based awards granted under the Parent Company's Long-Term Omnibus Plan (the “Plan”). Accordingly, the Parent Company's ownership in the Operating Partnership will increase based on the amount of proceeds contributed to the Operating Partnership for the common units it receives. As a result of the issuance of common units to the Parent Company for stock-based compensation, the Operating Partnership records the effect of accounts for stock-based compensation for awards of equity in the Parent Company.
(k) Segment Reporting
The Company's business is investing in retail shopping centers through direct ownership or through joint ventures. The Company actively manages its portfolio of retail shopping centers and may from time to time make decisions to sell lower performing properties or developments not meeting its long-term investment objectives. The proceeds from sales are reinvested into higher quality retail shopping centers, through acquisitions or new developments, which management believes will generate sustainable revenue growth and attractive returns. It is management's intent that all retail shopping centers will be owned or developed for investment purposes; however, the Company may decide to sell all or a portion of a development upon completion. The Company's revenues and net income are generated from the operation of its investment portfolio. The Company also earns fees for services provided to manage and lease retail shopping centers owned through joint ventures.
The Company's portfolio is located throughout the United States. Management does not distinguish or group its operations on a geographical basis for purposes of allocating resources or capital. The Company reviews operating and financial data for each property on an individual basis; therefore, the Company defines an operating segment as its individual properties. The individual properties have been aggregated into one reportable segment based upon their similarities with regard to both the nature and economics of the centers, tenants and operational processes, as well as long-term average financial performance.
(l) Business Concentration
No single tenant accounts for
5%
or more of revenue and none of the shopping centers are located outside the United States.
(m) Fair Value of Assets and Liabilities
Fair value is a market-based measurement, not an entity-specific measurement. Therefore, a fair value measurement is determined based on the assumptions that market participants would use in pricing the asset or liability. As a basis for considering market participant assumptions in fair value measurements, the Company uses a fair value hierarchy that distinguishes between market participant assumptions based on market data obtained from independent sources (observable inputs that are classified within Levels 1 and 2 of the hierarchy) and the Company's own assumptions about market participant assumptions (unobservable inputs classified within Level 3 of the hierarchy). The three levels of inputs used to measure fair value are as follows:
|
•
|
Level 1 - Quoted prices (unadjusted) in active markets for identical assets or liabilities that the Company has the ability to access.
|
|
•
|
Level 2 - Inputs other than quoted prices included in Level 1 that are observable for the asset or liability, either directly or indirectly.
|
94
REGENCY CENTERS CORPORATION AND REGENCY CENTERS, L.P.
Notes to Consolidated Financial Statements
December 31, 2016
|
•
|
Level 3 - Unobservable inputs for the asset or liability, which are typically based on the Company's own assumptions, as there is little, if any, related market activity.
|
The Company also remeasures nonfinancial assets and nonfinancial liabilities, initially measured at fair value in a business combination or other new basis event, at fair value in subsequent periods if a remeasurement event occurs.
(n) Reclassifications
During the
year ended December 31, 2016
, the Company reclassified its land held for future development from Properties in development to Land within the accompanying Consolidated Balance Sheets. The Company reclassified prior period amounts of
$47.3 million
to conform to current period presentation.
95
REGENCY CENTERS CORPORATION AND REGENCY CENTERS, L.P.
Notes to Consolidated Financial Statements
December 31, 2016
(o) Recent Accounting Pronouncements
The following table provides a brief description of recent accounting pronouncements and expected impact on our financial statements:
|
Standard
|
Description
|
Date of adoption
|
Effect on the financial statements or other significant matters
|
|||
|
Recently adopted:
|
||||||
|
ASU 2015-02,
February 2015
, Consolidation (Topic 810): Amendments to the Consolidation Analysis
|
ASU 2015-02 affects reporting entities that are required to evaluate whether they should consolidate certain legal entities. ASU 2015-02 modifies the evaluation of whether limited partnerships and similar legal entities are VIEs or voting interest entities, eliminates the presumption that a general partner should consolidate a limited partnership, and affects the consolidation analysis of reporting entities that are involved with VIEs.
|
January 2016
|
The adoption of this standard resulted in five additional investment partnerships being considered variable interest entities due to the limited partners' lack of substantive participation in the partnerships. This did not result in any impact to the Company's Consolidated Balance Sheets, Statements of Operations, or Cash Flows, but did result in additional disclosures about its relationships with and exposure to variable interest entities.
|
|||
|
ASU 2015-03, April 2015,
Interest - Imputation of Interest
(Subtopic 835-30):
Simplifying the Presentation of Debt Issuance Costs
|
ASU 2015-03 simplifies the presentation of debt issuance costs by requiring that debt issuance costs related to a recognized debt liability be presented in the balance sheet as a direct deduction from the carrying amount of that debt liability, consistent with debt discounts.
|
January 2016
|
The adoption and implementation of this standard has resulted in the retrospective presentation of debt issuance costs associated with the Company's notes payable and term loans as a direct deduction from the carrying amount of the related debt instruments (previously, included in deferred costs in the consolidated balance sheets).
Unamortized debt issuance costs of $8.2 million has been reclassified to offset the related debt as of December 31, 2015.
|
|||
|
ASU 2015-15, August 2015,
Interest—Imputation of Interest (Subtopic 835-30): Presentation and Subsequent Measurement of Debt Issuance Costs Associated with Line-of-Credit Arrangements
|
ASU 2015-15 clarifies that debt issuance costs related to line-of-credit arrangements may be deferred and presented as an asset, amortized over the term of the line-of-credit arrangement, regardless of whether there are any outstanding borrowings.
|
January 2016
|
The adoption of this standard resulted in the continued presentation of debt issuance costs related to the Line of credit ("Line") as an asset in the Consolidated Balance Sheets, previously within deferred costs, and now presented within other assets.
|
|||
|
ASU 2014-15, August 2014,
Presentation of Financial Statements—Going Concern (Subtopic 205-40): Disclosure of Uncertainties about an Entity’s Ability to Continue as a Going Concern
|
The standard requires management to evaluate whether there are conditions or events that raise substantial doubt about the entity’s ability to continue as a going concern, and to provide certain disclosures when it is probable that the entity will be unable to meet its obligations as they become due within one year after the date that the financial statements are issued.
|
December 2016
|
The adoption of this standard did not have an impact on the Company's Consolidated Balance Sheets, Statements of Operations, or Cash Flows but did result in more disclosure surrounding the Company's plans for addressing significant upcoming debt maturities.
|
|||
96
REGENCY CENTERS CORPORATION AND REGENCY CENTERS, L.P.
Notes to Consolidated Financial Statements
December 31, 2016
|
Standard
|
Description
|
Date of adoption
|
Effect on the financial statements or other significant matters
|
|||
|
Not yet adopted:
|
||||||
|
ASU 2016-09, March 2016,
Compensation-Stock Compensation (Topic 718):
Improvements to Employee Share-Based Payment Accounting
|
This ASU affects entities that issue share-based payment awards to their employees. The ASU is designed to simplify several aspects of accounting for share-based payment award transactions including income tax consequences, classification of awards as either equity or liabilities, an option to recognize stock compensation forfeitures as they occur, and changes to classification on the statement of cash flows.
|
January 2017
|
The Company does not expect the adoption of this standard to have an impact on its financial statements and related disclosures.
|
|||
|
ASU 2016-01, January 2016,
Financial Instruments—Overall (Subtopic 825-10): Recognition and Measurement of Financial Assets and Financial Liabilities
|
The standard amends the guidance to classify equity securities with readily-determinable fair values into different categories and requires equity securities to be measured at fair value with changes in the fair value recognized through net income. Equity investments accounted for under the equity method are not included in the scope of this amendment. Early adoption of this amendment is not permitted.
|
January 2018
|
The Company does not expect the adoption and implementation of this standard to have a material impact on its results of operations, financial
condition or cash flows.
|
|||
|
ASU 2016-15, August 2016,
Statement of Cash Flows (Topic 230): Classification of Certain Cash Receipts and Cash Payments
|
The standard makes eight targeted changes to how cash receipts and cash payments are presented and classified in the statement of cash flows. Early adoption is permitted on a retrospective basis.
|
January 2018
|
The ASU is consistent with the Company's current treatment and the Company does not expect the adoption and implementation of this standard to have an impact on its cash flow statement.
|
|||
|
ASU 2016-18, November 2016,
Statement of Cash Flows (Topic 230): Restricted Cash
|
This ASU requires entities to show the changes in the total of cash, cash equivalents, restricted cash, and restricted cash equivalents in the statement of cash flows. Early adoption is permitted on a retrospective basis.
|
January 2018
|
The Company is currently evaluating the alternative methods of adoption and does not expect the adoption to have a material impact on its Statements of Cash Flows.
|
|||
|
ASU 2017-01
January 2017
, Business Combinations (Topic 805): Clarifying the Definition of a Business
|
The amendments in this update provide a screen to determine when an integrated set of assets and activities, collectively referred to as a "set", is not a business. The screen requires that when substantially all of the fair value of the gross assets acquired (or disposed of) is concentrated in a single identifiable asset or a group of similar identifiable assets, the set is not a business. This screen reduces the number of transactions that need to be further evaluated.
If the screen is not met, the amendments in this update (1) require that to be considered a business, a set must include, at a minimum, an input and a substantive process that together significantly contribute to the ability to create output and (2) remove the evaluation of whether a market participant could replace missing elements. The amendments provide a framework to assist entities in evaluating whether both an input and a substantive process are present. Early adoption is permitted.
|
January 2018
|
The Company is currently evaluating the amendments from this Update, but expects it to change the treatment of individual operating properties from being considered a business to being considered an asset.
This change will result in acquisition costs being capitalized as part of the asset acquisition, whereas current treatment has them recognized in earnings in the period incurred.
Additional changes from the Update are still being evaluated to identify their impact to the Company's financial statements and related disclosures.
|
|||
97
REGENCY CENTERS CORPORATION AND REGENCY CENTERS, L.P.
Notes to Consolidated Financial Statements
December 31, 2016
|
Standard
|
Description
|
Date of adoption
|
Effect on the financial statements or other significant matters
|
|||
|
Revenue from Contracts with Customers (Topic 606):
ASU 2014-09, May 2014,
Revenue from Contracts with Customers (Topic 606)
ASU 2016-08, March 2016,
Revenue from Contracts with Customers (Topic 606): Principal versus Agent Considerations
ASU 2016-10, April 2016,
Revenue from Contracts with Customers (Topic 606): Identifying Performance Obligations and Licensing
ASU 2016-12, May 2016,
Revenue from Contracts with Customers (Topic 606): Narrow-Scope Improvements and Practical Expedients
ASU 2016-19, December 2016,
Technical Corrections and Improvements
ASU 2016-20, December 2016,
Technical Corrections and Improvements to Topic 606 Revenue From Contracts With Customers
ASU 2017-05, February 2017, Clarifying the Scope of Asset Derecognition Guidance and Accounting for Partial Sales of Nonfinanial Assets
|
The standard will replace existing revenue recognition standards and significantly expand the disclosure requirements for revenue arrangements. It may be adopted either retrospectively or on a modified retrospective basis to new contracts and existing contracts with remaining performance obligations as of the effective date.
|
January 2018
|
The Company is completing its evaluation of the new ASU's as applied to its revenue streams and contracts within the scope of Topic 606. The Company currently does not expect the adoption of these new ASU's to result in a material change to its revenue recognition policies or practices, including timing or presentation.
The Company is still evaluating the adoption method, which is dependent on final determination of the nature of any changes resulting from the new standard.
|
|||
98
REGENCY CENTERS CORPORATION AND REGENCY CENTERS, L.P.
Notes to Consolidated Financial Statements
December 31, 2016
|
Standard
|
Description
|
Date of adoption
|
Effect on the financial statements or other significant matters
|
|||
|
ASU 2016-02, February 2016,
Leases (Topic 842)
|
The standard amends the existing accounting standards for lease accounting, including requiring lessees to recognize most leases on their balance sheets. It also makes targeted changes to lessor accounting, including a change to the treatment of initial direct leasing costs, which no longer considers fixed internal leasing salaries as capitalizable costs.
Early adoption of this standard is permitted to coincide with adoption of ASU 2014-09. The standard requires a modified retrospective transition approach for all leases existing at, or entered into after, the date of initial application, with an option to use certain transition relief.
|
January 2019
|
The Company is currently evaluating the impact this standard will have on its financial statements and related disclosures.
|
|||
|
ASU 2016-13, June 2016
, Financial Instruments—Credit Losses (Topic 326): Measurement of Credit Losses on Financial Instruments
|
The amendments in this update replace the incurred loss impairment methodology in current GAAP with a methodology that reflects expected credit losses and requires consideration of a broader range of reasonable and supportable information to inform credit loss estimates.
This ASU applies to how the Company determines its allowance for doubtful accounts on tenant receivables.
|
January 2020
|
The Company is currently evaluating the alternative methods of adoption and the impact the ASU will have on its financial statements and related disclosures.
|
|||
99
REGENCY CENTERS CORPORATION AND REGENCY CENTERS, L.P.
Notes to Consolidated Financial Statements
December 31, 2016
|
2.
|
Real Estate Investments
|
Acquisitions
The following tables detail the shopping centers acquired or land acquired for development.
|
(in thousands)
|
Year ended December 31, 2016
|
||||||||||||||||||
|
Date Purchased
|
Property Name
|
City/State
|
Property Type
|
Purchase Price
|
Debt Assumed, Net of Premiums
|
Intangible Assets
|
Intangible Liabilities
|
||||||||||||
|
2/22/2016
|
Garden City Park
|
Garden City Park, NY
|
Operating
|
$
|
17,300
|
|
—
|
|
10,171
|
|
2,940
|
|
|||||||
|
3/4/2016
|
The Market at Springwoods Village
(1)
|
Houston, TX
|
Development
|
17,994
|
|
—
|
|
—
|
|
—
|
|
||||||||
|
5/16/2016
|
Market Common Clarendon
|
Arlington, VA
|
Operating
|
280,500
|
|
—
|
|
15,428
|
|
15,662
|
|
||||||||
|
7/15/2016
|
Klahanie Shopping Center
|
Sammamish, WA
|
Operating
|
35,988
|
|
—
|
|
2,264
|
|
539
|
|
||||||||
|
8/4/2016
|
The Village at Tustin Legacy
|
Tustin, CA
|
Development
|
18,800
|
|
—
|
|
—
|
|
—
|
|
||||||||
|
10/26/2016
|
Nocatee Phase III
|
Jacksonville, FL
|
Development
|
240
|
|
—
|
|
—
|
|
—
|
|
||||||||
|
10/30/2016
|
Brooklyn Station Phase II
|
Jacksonville, FL
|
Development
|
50
|
|
—
|
|
—
|
|
—
|
|
||||||||
|
12/6/2016
|
The Village at Riverstone
|
Houston, TX
|
Development
|
16,656
|
|
—
|
|
—
|
|
—
|
|
||||||||
|
Total property acquisitions
|
$
|
387,528
|
|
—
|
|
27,863
|
|
19,141
|
|
||||||||||
|
(1)
Regency acquired a 53% controlling interest in the Market at Springwoods Village partnership to develop a shopping center on land contributed by the partner. As a result of consolidation, the Company recorded the partner's non-controlling interest of $8.4 million in Limited partners' interests in consolidated partnerships in the accompanying Consolidated Balance Sheets.
|
|||||||||||||||||||
|
(in thousands)
|
Year ended December 31, 2015
|
||||||||||||||||||
|
Date Purchased
|
Property Name
|
City/State
|
Property Type
|
Purchase Price
|
Debt Assumed, Net of Premiums
|
Intangible Assets
|
Intangible Liabilities
|
||||||||||||
|
9/1/2015
|
University Commons
|
Boca Raton, FL
|
Operating
|
$
|
80,500
|
|
42,799
|
|
64,482
|
|
14,039
|
|
|||||||
|
10/9/2015
|
CityLine Market Ph II
|
Dallas, TX
|
Development
|
2,157
|
|
—
|
|
—
|
|
—
|
|
||||||||
|
12/29/2015
|
Northgate Ph II
|
Medford, OR
|
Development
|
4,000
|
|
—
|
|
—
|
|
—
|
|
||||||||
|
Total property acquisitions
|
$
|
86,657
|
|
42,799
|
|
64,482
|
|
14,039
|
|
||||||||||
The results of operations from acquisitions are included in the Consolidated Statements of Operations beginning on the acquisition date. The real estate operations acquired, other than Market Common Clarendon, are not considered material to Company, individually or in the aggregate. Results of operations related to the acquisition of Market Common Clarendon resulted in the following impact to Revenues and Net income attributable to common stockholders, as follows:
|
(in thousands)
|
Year ended December 31, 2016
|
|||
|
Increase in total revenues
|
$
|
11,427
|
|
|
|
Increase in net income attributable to common stockholders
(1)
|
798
|
|
||
(1)
Includes
$1.6 million
of transaction costs during the
year ended December 31, 2016
, which are recorded in Other operating expenses in the accompanying Consolidated Statements of Operations.
100
REGENCY CENTERS CORPORATION AND REGENCY CENTERS, L.P.
Notes to Consolidated Financial Statements
December 31, 2016
The following unaudited pro forma financial data includes the incremental revenues, operating expenses, depreciation and amortization, and costs of financing the Market Common Clarendon acquisition as if it had occurred on January 1, 2015:
|
(Pro Forma)
|
||||||
|
Year ended December 31,
|
||||||
|
(in thousands, except per share data)
|
2016
|
2015
|
||||
|
Total revenues
|
622,124
|
|
589,506
|
|
||
|
Income from operations
|
(1)
|
121,921
|
|
119,339
|
|
|
|
Net income attributable to common stockholders
|
(1)
|
146,111
|
|
131,396
|
|
|
|
Income per common share - basic
|
1.42
|
|
1.37
|
|
||
|
Income per common share - diluted
|
1.42
|
|
1.36
|
|
||
(1)
The pro forma earnings for the
year ended December 31, 2016
were adjusted to exclude
$1.6 million
of acquisition costs, while 2015 pro forma earnings were adjusted to include those costs during the first quarter of 2015.
The pro forma financial data is not necessarily indicative of what the actual results of operations would have been assuming the transaction had been completed as set forth above, nor does it purport to represent the results of operations for future periods.
The following table details the weighted average amortization and net accretion periods, in years, of the major classes of intangible assets and intangible liabilities arising from the Market Common Clarendon acquisition, at the acquisition date:
|
Weighted Average
|
||
|
Amortization Period
|
||
|
Assets:
|
(in years)
|
|
|
In-place leases
|
7.4
|
|
|
Liabilities:
|
||
|
Acquired lease intangible liabilities
|
7.9
|
|
Pending Merger with Equity One
For more information about the shareholder approved but not yet consummated merger, see note 16, Subsequent Events.
101
REGENCY CENTERS CORPORATION AND REGENCY CENTERS, L.P.
Notes to Consolidated Financial Statements
December 31, 2016
3. Property Dispositions
Dispositions
The following table provides a summary of consolidated shopping centers and land parcels disposed of:
|
Year ended December 31,
|
|||||||||
|
(in thousands)
|
2016
|
2015
|
2014
|
||||||
|
Net proceeds from sale of real estate investments
|
$
|
137,479
|
|
(1)
|
108,822
|
|
118,787
|
|
|
|
Gain on sale of real estate, net of tax
|
$
|
47,321
|
|
35,606
|
|
55,077
|
|
||
|
Provision for impairment of real estate sold
|
$
|
1,700
|
|
—
|
|
1,257
|
|
||
|
Number of operating properties sold
|
11
|
|
5
|
|
11
|
|
|||
|
Number of land out-parcels sold
|
16
|
|
2
|
|
6
|
|
|||
(1)
Includes cash deposits received in the previous year.
|
4.
|
Investments in Real Estate Partnerships
|
The Company invests in real estate partnerships, which consist of the following:
|
December 31, 2016
|
||||||||||||||||
|
(in thousands)
|
Regency's Ownership
|
Number of Properties
|
Total Investment
|
Total Assets of the Partnership
|
Net Income of the Partnership
|
The Company's Share of Net Income of the Partnership
|
||||||||||
|
GRI - Regency, LLC (GRIR)
(1)
|
40.00%
|
70
|
$
|
201,240
|
|
1,676,134
|
|
74,758
|
|
29,791
|
|
|||||
|
Columbia Regency Retail Partners, LLC (Columbia I)
(1)
|
20.00%
|
7
|
9,687
|
|
145,192
|
|
21,024
|
|
4,180
|
|
||||||
|
Columbia Regency Partners II, LLC (Columbia II)
(1)
|
20.00%
|
12
|
14,750
|
|
338,307
|
|
16,765
|
|
3,240
|
|
||||||
|
Cameron Village, LLC (Cameron)
|
30.00%
|
1
|
11,877
|
|
99,967
|
|
2,326
|
|
695
|
|
||||||
|
RegCal, LLC (RegCal)
(1)
|
25.00%
|
7
|
21,516
|
|
141,827
|
|
4,358
|
|
1,080
|
|
||||||
|
US Regency Retail I, LLC (USAA)
(1)
|
20.01%
|
8
|
13,176
|
|
109,665
|
|
5,901
|
|
1,180
|
|
||||||
|
Other investments in real estate partnerships
|
50.00%
|
4
|
24,453
|
|
97,650
|
|
35,915
|
|
16,352
|
|
||||||
|
Total investments in real estate partnerships
|
109
|
$
|
296,699
|
|
2,608,742
|
|
161,047
|
|
56,518
|
|
||||||
|
December 31, 2015
|
||||||||||||||||
|
(in thousands)
|
Regency's Ownership
|
Number of Properties
|
Total Investment
|
Total Assets of the Partnership
|
Net Income of the Partnership
|
The Company's Share of Net Income of the Partnership
|
||||||||||
|
GRI - Regency, LLC (GRIR)
(1)
|
40.00%
|
73
|
$
|
220,099
|
|
1,744,017
|
|
45,761
|
|
18,148
|
|
|||||
|
Columbia Regency Retail Partners, LLC (Columbia I)
(1)
|
20.00%
|
9
|
15,255
|
|
175,044
|
|
(1,396
|
)
|
(278
|
)
|
||||||
|
Columbia Regency Partners II, LLC (Columbia II)
(1)
|
20.00%
|
14
|
8,496
|
|
290,064
|
|
3,794
|
|
755
|
|
||||||
|
Cameron Village, LLC (Cameron)
|
30.00%
|
1
|
11,857
|
|
100,124
|
|
2,195
|
|
643
|
|
||||||
|
RegCal, LLC (RegCal)
(1)
|
25.00%
|
7
|
17,967
|
|
145,213
|
|
2,316
|
|
576
|
|
||||||
|
US Regency Retail I, LLC (USAA)
(1)
|
20.01%
|
8
|
161
|
|
112,225
|
|
4,011
|
|
807
|
|
||||||
|
Other investments in real estate partnerships
|
50.00%
|
6
|
32,371
|
|
108,698
|
|
4,067
|
|
1,857
|
|
||||||
|
Total investments in real estate partnerships
|
118
|
$
|
306,206
|
|
2,675,385
|
|
60,748
|
|
22,508
|
|
||||||
(1)
These partnership agreements have a unilateral right for election to dissolve the partnership and receive a DIK upon liquidation; therefore, the Company has applied the Restricted Gain Method to determine the amount of gain
102
REGENCY CENTERS CORPORATION AND REGENCY CENTERS, L.P.
Notes to Consolidated Financial Statements
December 31, 2016
recognized on property sales to these partnerships. During
2016
and
2015
, the Company did not sell any properties to these real estate partnerships, and accordingly, the Restricted Gain Method was not applied.
The summarized balance sheet information for the investments in real estate partnerships, on a combined basis, is as follows:
|
December 31,
|
|||||||
|
(in thousands)
|
2016
|
2015
|
|||||
|
Investments in real estate, net
|
$
|
2,439,110
|
|
2,497,770
|
|
||
|
Acquired lease intangible assets, net
|
42,974
|
|
43,469
|
|
|||
|
Other assets
|
126,658
|
|
134,146
|
|
|||
|
Total assets
|
$
|
2,608,742
|
|
2,675,385
|
|
||
|
Notes payable
|
$
|
1,309,931
|
|
1,401,977
|
|
||
|
Acquired lease intangible liabilities, net
|
29,678
|
|
23,826
|
|
|||
|
Other liabilities
|
64,979
|
|
66,061
|
|
|||
|
Capital - Regency
|
405,722
|
|
414,681
|
|
|||
|
Capital - Third parties
|
798,432
|
|
768,840
|
|
|||
|
Total liabilities and capital
|
$
|
2,608,742
|
|
2,675,385
|
|
||
The following table reconciles the Company's capital recorded by the unconsolidated partnerships to the Company's investments in real estate partnerships reported in the accompanying consolidated balance sheet:
|
December 31,
|
|||||||
|
(in thousands)
|
2016
|
2015
|
|||||
|
Capital - Regency
|
$
|
405,722
|
|
414,681
|
|
||
|
less: Impairment of investment in real estate partnerships
|
(1,300
|
)
|
(1,300
|
)
|
|||
|
less: Ownership percentage or Restricted Gain Method deferral
|
(29,520
|
)
|
(28,972
|
)
|
|||
|
less: Net book equity in excess of purchase price
|
(78,203
|
)
|
(78,203
|
)
|
|||
|
Investments in real estate partnerships
|
$
|
296,699
|
|
306,206
|
|
||
103
REGENCY CENTERS CORPORATION AND REGENCY CENTERS, L.P.
Notes to Consolidated Financial Statements
December 31, 2016
The revenues and expenses for the investments in real estate partnerships, on a combined basis, are summarized as follows:
|
Year ended December 31,
|
||||||||||
|
(in thousands)
|
2016
|
2015
|
2014
|
|||||||
|
Total revenues
|
$
|
364,087
|
|
363,745
|
|
361,103
|
|
|||
|
Operating expenses:
|
||||||||||
|
Depreciation and amortization
|
99,252
|
|
111,648
|
|
117,780
|
|
||||
|
Operating and maintenance
|
52,725
|
|
51,970
|
|
55,216
|
|
||||
|
General and administrative
|
5,342
|
|
5,292
|
|
5,503
|
|
||||
|
Real estate taxes
|
42,813
|
|
43,769
|
|
42,380
|
|
||||
|
Other operating expenses
|
2,356
|
|
2,989
|
|
2,234
|
|
||||
|
Total operating expenses
|
202,488
|
|
215,668
|
|
223,113
|
|
||||
|
Other expense (income):
|
||||||||||
|
Interest expense, net
|
69,193
|
|
79,477
|
|
84,155
|
|
||||
|
Gain on sale of real estate
|
(70,907
|
)
|
(2,766
|
)
|
(28,856
|
)
|
||||
|
Provision for impairment
|
—
|
|
9,102
|
|
2,123
|
|
||||
|
Early extinguishment of debt
|
69
|
|
—
|
|
114
|
|
||||
|
Other expense (income)
|
2,197
|
|
1,516
|
|
988
|
|
||||
|
Total other expense (income)
|
552
|
|
87,329
|
|
58,524
|
|
||||
|
Net income of the Partnerships
|
$
|
161,047
|
|
60,748
|
|
79,466
|
|
|||
|
The Company's share of net income of the Partnerships
|
$
|
56,518
|
|
22,508
|
|
31,270
|
|
|||
Acquisitions
The following table provides a summary of shopping centers and land parcels acquired through our unconsolidated real estate partnerships, which had
no
acquisitions for the year ended
December 31, 2015
.
|
(in thousands)
|
Year ended December 31, 2016
|
||||||||||||||||||||||
|
Date Purchased
|
Property Name
|
City/State
|
Property Type
|
Co-investment Partner
|
Ownership %
|
Purchase Price
|
Debt Assumed, Net of Premiums
|
Intangible Assets
|
Intangible Liabilities
|
||||||||||||||
|
3/24/2016
|
Applewood Village Shops
|
Denver, CO
|
Operating
(1)
|
GRIR
|
40.00%
|
$
|
200
|
|
—
|
|
—
|
|
—
|
|
|||||||||
|
12/20/2016
|
Plaza Venezia
|
Orlando, FL
|
Operating
|
Columbia II
|
20.00%
|
92,350
|
|
35,076
|
|
6,899
|
|
11,548
|
|
||||||||||
|
Total property acquisitions
|
$
|
92,550
|
|
35,076
|
|
6,899
|
|
11,548
|
|
||||||||||||||
(1)
Land parcels purchased as additions to the operating property.
104
REGENCY CENTERS CORPORATION AND REGENCY CENTERS, L.P.
Notes to Consolidated Financial Statements
December 31, 2016
Dispositions
The following table provides a summary of shopping centers and land out-parcels disposed of through our unconsolidated real estate partnerships:
|
Year ended December 31,
|
||||||||||
|
(in thousands)
|
2016
|
2015
|
2014
|
|||||||
|
Proceeds from sale of real estate investments
|
$
|
174,090
|
|
39,459
|
|
88,106
|
|
|||
|
Gain on sale of real estate
|
$
|
70,907
|
|
2,766
|
|
28,856
|
|
|||
|
The Company's share of gain on sale of real estate
|
$
|
25,003
|
|
1,108
|
|
13,615
|
|
|||
|
Number of operating properties sold
|
10
|
|
2
|
|
6
|
|
||||
|
Number of land out-parcels sold
|
1
|
|
—
|
|
2
|
|
||||
Notes Payable
Scheduled principal repayments on notes payable held by our unconsolidated investments in real estate partnerships as of
December 31, 2016
were as follows:
|
Scheduled Principal Payments and Maturities by Year:
|
Scheduled
Principal Payments |
Mortgage Loan
Maturities |
Unsecured
Maturities |
Total
|
Regency’s
Pro-Rata Share |
|||||||||||
|
2017
|
$
|
17,795
|
|
—
|
|
19,635
|
|
37,430
|
|
10,505
|
|
|||||
|
2018
|
18,983
|
|
67,022
|
|
—
|
|
86,005
|
|
27,799
|
|
||||||
|
2019
|
18,231
|
|
65,939
|
|
—
|
|
84,170
|
|
21,766
|
|
||||||
|
2020
|
15,133
|
|
222,199
|
|
—
|
|
237,332
|
|
85,660
|
|
||||||
|
2021
|
10,674
|
|
211,432
|
|
—
|
|
222,106
|
|
82,806
|
|
||||||
|
Beyond 5 Years
|
10,580
|
|
642,500
|
|
—
|
|
653,080
|
|
243,982
|
|
||||||
|
Net unamortized loan costs, debt premium / (discount)
|
—
|
|
(10,192
|
)
|
—
|
|
(10,192
|
)
|
(3,488
|
)
|
||||||
|
Total notes payable
|
$
|
91,396
|
|
1,198,900
|
|
19,635
|
|
1,309,931
|
|
469,030
|
|
|||||
These loans are all non-recourse. Maturities will be repaid from proceeds from refinancing, partner capital contributions, or a combination thereof. The Company is obligated to contribute its pro-rata share to fund maturities if the loans are not refinanced, and it has the capacity to do so from existing cash balances, availability on its line of credit, and operating cash flows. The Company believes that its partners are financially sound and have sufficient capital or access thereto to fund future capital requirements. In the event that a co-investment partner was unable to fund its share of the capital requirements of the co-investment partnership, the Company would have the right, but not the obligation, to loan the defaulting partner the amount of its capital call.
Management fee income
In addition to earning our pro-rata share of net income or loss in each of these co-investment partnerships, we receive fees, as follows:
|
Year ended December 31,
|
||||||||||
|
(in thousands)
|
2016
|
2015
|
2014
|
|||||||
|
Asset management, property management, leasing, and investment and financing services
|
$
|
24,595
|
|
24,519
|
|
22,983
|
|
|||
105
REGENCY CENTERS CORPORATION AND REGENCY CENTERS, L.P.
Notes to Consolidated Financial Statements
December 31, 2016
|
5.
|
Acquired Lease Intangibles
|
The Company had the following acquired lease intangibles:
|
December 31,
|
||||||
|
(in thousands)
|
2016
|
2015
|
||||
|
In-place leases
|
$
|
96,178
|
|
77,691
|
|
|
|
Above-market leases
|
14,684
|
|
14,841
|
|
||
|
Below-market ground leases
|
64,664
|
|
58,487
|
|
||
|
Total intangible assets
|
$
|
175,526
|
|
|
151,019
|
|
|
Accumulated amortization
|
(56,695
|
)
|
(45,639
|
)
|
||
|
Acquired lease intangible assets, net
|
$
|
118,831
|
|
105,380
|
|
|
|
Below-market leases
|
$
|
71,996
|
|
53,868
|
|
|
|
Above-market ground leases
|
5,722
|
|
5,722
|
|
||
|
Accumulated amortization
|
(23,538
|
)
|
(17,555
|
)
|
||
|
Acquired lease intangible liabilities, net
|
$
|
54,180
|
|
42,034
|
|
|
The following table provides a summary of amortization and net accretion amounts from acquired lease intangibles:
|
Year ended December 31,
|
|||||||||
|
(in thousands)
|
2016
|
2015
|
2014
|
||||||
|
In-place lease amortization
|
$
|
11,533
|
|
9,141
|
|
10,365
|
|
||
|
Above-market lease amortization
(1)
|
1,742
|
|
1,950
|
|
1,795
|
|
|||
|
Below-market ground lease amortization
(3)
|
1,111
|
|
351
|
|
23
|
|
|||
|
Acquired lease intangible asset amortization
|
$
|
14,386
|
|
11,442
|
|
12,183
|
|
||
|
Below-market lease amortization
(2)
|
$
|
6,827
|
|
3,940
|
|
4,437
|
|
||
|
Above-market ground lease amortization
(3)
|
$
|
167
|
|
215
|
|
153
|
|
||
|
Acquired lease intangible liability amortization
|
$
|
6,994
|
|
4,155
|
|
4,590
|
|
||
(1)
Amounts are recorded as a reduction to minimum rent.
(2)
Amounts are recorded as an increase to minimum rent.
(3)
Above and below market ground lease amortization are recorded as offsets to other operating expenses.
The estimated aggregate amortization and net accretion amounts from acquired lease intangibles for the next five years are as follows:
|
(in thousands)
|
||||||
|
In Process Year Ending December 31,
|
Amortization Expense
|
Net Accretion
|
||||
|
2017
|
$
|
12,073
|
|
6,834
|
|
|
|
2018
|
10,300
|
|
6,339
|
|
||
|
2019
|
8,945
|
|
5,919
|
|
||
|
2020
|
7,023
|
|
4,829
|
|
||
|
2021
|
6,081
|
|
4,509
|
|
||
106
REGENCY CENTERS CORPORATION AND REGENCY CENTERS, L.P.
Notes to Consolidated Financial Statements
December 31, 2016
6. Notes Payable and Unsecured Credit Facilities
The Company’s outstanding debt consists of the following:
|
December 31,
|
||||||
|
(in thousands)
|
2016
|
2015
|
||||
|
Notes payable:
|
||||||
|
Fixed rate mortgage loans
|
$
|
384,786
|
|
475,214
|
|
|
|
Variable rate mortgage loans
|
86,969
|
|
(1)
|
34,154
|
|
|
|
Fixed rate unsecured public debt
|
892,170
|
|
1,190,403
|
|
||
|
Total notes payable
|
1,363,925
|
|
1,699,771
|
|
||
|
Unsecured credit facilities:
|
||||||
|
Line
|
15,000
|
|
—
|
|
||
|
Term Loan
|
263,495
|
|
164,514
|
|
||
|
Total unsecured credit facilities
|
278,495
|
|
164,514
|
|
||
|
Total debt outstanding
|
$
|
1,642,420
|
|
1,864,285
|
|
|
(1)
Includes three mortgages, whose interest varies on a LIBOR based formula. Each of these variable rate loans have interest rate swaps in place to fix the interest rates at a range of
2.8%
to
3.7%
.
Notes Payable
Notes payable consist of mortgage loans secured by properties and unsecured public debt. Mortgage loans may be prepaid, but could be subject to yield maintenance premiums. Mortgage loans are generally due in monthly installments of principal and interest or interest only, whereas, interest on unsecured public debt is payable semi-annually.
The Company is required to comply with certain financial covenants for its unsecured public debt as defined in the indenture agreements such as the following ratios: Consolidated Debt to Consolidated Assets, Consolidated Secured Debt to Consolidated Assets, Consolidated Income for Debt Service to Consolidated Debt Service, and Unencumbered Consolidated Assets to Unsecured Consolidated Debt. As of
December 31, 2016
, management of the Company believes it is in compliance with all financial covenants for its unsecured public debt.
As of
December 31, 2016
, the key interest rates of the Company's notes payables were as follows:
|
Interest Rates
|
||||||||||
|
Maturing Through
|
Minimum
|
Maximum
|
Weighted Average Effective Rate
|
Weighted Average Contractual Rate
|
||||||
|
Mortgage loans
|
2032
|
3.30%
|
8.40%
|
6.00%
|
5.80%
|
|||||
|
Fixed rate unsecured public debt
|
2025
|
3.75%
|
6.00%
|
5.30%
|
4.50%
|
|||||
Unsecured Credit Facilities
The Company has an unsecured line of credit commitment (the "Line") and an unsecured term loan commitment (the "Term Loan") under separate credit agreements with a syndicate of banks.
The Company is required to comply with certain financial covenants as defined in the Line and Term Loan credit agreements, such as Ratio of Indebtedness to Total Asset Value ("TAV"), Ratio of Unsecured Indebtedness to Unencumbered Asset Value, Ratio of Adjusted Earnings Before Interest Taxes Depreciation and Amortization (“EBITDA”) to Fixed Charges, Ratio of Secured Indebtedness to TAV, Ratio of Unencumbered Net Operating Income to Unsecured Interest Expense, and other covenants customary with
107
REGENCY CENTERS CORPORATION AND REGENCY CENTERS, L.P.
Notes to Consolidated Financial Statements
December 31, 2016
this type of unsecured financing. As of
December 31, 2016
, management of the Company believes it is in compliance with all financial covenants for the Line and Term Loan.
The key terms of the Line and Term Loan were as follows:
|
December 31, 2016
|
|||||||||||||||||||||
|
(in thousands)
|
Total Capacity
|
Remaining Capacity
|
Maturing Through
|
Variable Interest Rate
(5)
|
Fee
|
Weighted Average Effective Rate
|
Weighted Average Contractual Rate
|
||||||||||||||
|
Line
(8)
|
$
|
800,000
|
|
(1)
|
$
|
779,200
|
|
(2)
|
5/13/2019
|
(3)
|
LIBOR plus 0.925%
|
0.15%
|
(4)
|
1.70
|
%
|
1.40
|
%
|
||||
|
Term Loan
(9)
|
$
|
265,000
|
|
—
|
|
1/5/2022
|
LIBOR plus 0.95%
|
(6)
|
$
|
35
|
|
(7)
|
2.10
|
%
|
2.00
|
%
|
|||||
(1)
The Company has the ability to increase the Line through an accordion feature to
$1.0 billion
. See discussion below regarding expansion of Line subsequent to
December 31, 2016
.
(2)
Borrowing capacity is reduced by the balance of outstanding borrowings and commitments under outstanding letters of credit.
(3)
Maturity is subject to two six month extensions at the Company's option.
(4)
The commitment fee is subject to an adjustment based on the higher of the Company's corporate credit ratings from Moody's and S&P.
(5)
Interest rate spread is subject to Regency maintaining its corporate credit and senior unsecured ratings at BBB.
(6)
Effective July 7, 2016, the interest rate on the underlying debt is LIBOR + 0.95%, with an interest rate swap in place to fix the interest on the entire balance at
2%
through maturity.
(7)
Annual fee, in thousands.
(8)
Weighted average contractual and effective rates for the Line are calculated based on a fully drawn Line balance.
(9)
Weighted average contractual and effective rates for the Term Loan are based on the fixed rate with the interest rate swap.
Scheduled principal payments and maturities on notes payable and unsecured credit facilities were as follows:
|
(in thousands)
|
December 31, 2016
|
|||||||||||
|
Scheduled Principal Payments and Maturities by Year:
|
Scheduled
Principal Payments |
Mortgage Loan
Maturities |
Unsecured
Maturities
(1)
|
Total
|
||||||||
|
2017
|
$
|
5,279
|
|
86,339
|
|
—
|
|
91,618
|
|
|||
|
2018
|
4,829
|
|
57,358
|
|
—
|
|
62,187
|
|
||||
|
2019
|
4,205
|
|
106,000
|
|
15,000
|
|
125,205
|
|
||||
|
2020
|
4,636
|
|
84,411
|
|
150,000
|
|
239,047
|
|
||||
|
2021
|
3,780
|
|
35,190
|
|
250,000
|
|
288,970
|
|
||||
|
Beyond 5 Years
|
9,888
|
|
65,179
|
|
765,000
|
|
840,067
|
|
||||
|
Unamortized debt premium/(discount) and issuance costs
|
—
|
|
4,662
|
|
(9,336
|
)
|
(4,674
|
)
|
||||
|
Total notes payable
|
$
|
32,617
|
|
439,139
|
|
1,170,664
|
|
1,642,420
|
|
|||
(1)
Includes unsecured public debt and unsecured credit facilities.
The Company has
$86.3 million
of debt maturing over the next twelve months, which it currently intends to refinance. If market conditions change and refinancing is not an option, the Company has sufficient capacity on its Line to repay the maturing debt, all of which is in the form of non-recourse mortgage loans.
108
REGENCY CENTERS CORPORATION AND REGENCY CENTERS, L.P.
Notes to Consolidated Financial Statements
December 31, 2016
Financing - Subsequent Events
Subsequent to
December 31, 2016
, the Company priced a public offering of two tranches of senior unsecured notes:
|
•
|
$350.0 million
of
3.6%
notes due
February 1, 2027
, which priced at
99.741%
. The Company intends to use the net proceeds in connection with the consummation of the previously announced pending merger with Equity One, Inc., including (i) to repay approximately
$285.0 million
in aggregate principal amount of debt of Equity One, and any related interest, fees and expenses and (ii) to pay transaction expenses related to the pending merger with Equity One. In the event that the merger agreement is not consummated, the Company will be required to redeem these notes then outstanding at a redemption price equal to 101% of the principal amount to be redeemed plus accrued and unpaid interest, if any.
|
|
•
|
$300.0 million
of
4.4%
notes due
February 1, 2047
, which priced at
99.110%
. The Company used a portion of the net proceeds to redeem all of the outstanding shares of its
6.625%
Series 6 preferred shares on February 16, 2017 and intends to use the balance to fund investment activities and for general corporate purposes.
|
In connection with the pending Merger, the Company has commitments to (i) amend its Line by increasing the borrowing capacity to
$1.0 billion
and (ii) enter a new
$300.0 million
term loan facility. Both of these transactions are contingent upon the consummation of the Merger and are scheduled to close simultaneously with the Merger. The Company plans to use the proceeds from the new term loan to repay existing term loans held by Equity One. The additional line capacity will accommodate the Company's increased property operations and development / redevelopment programs from the Merger.
109
REGENCY CENTERS CORPORATION AND REGENCY CENTERS, L.P.
Notes to Consolidated Financial Statements
December 31, 2016
7. Derivative Financial Instruments
The following table summarizes the terms and fair values of the Company's derivative financial instruments, as well as their classification on the Consolidated Balance Sheets:
|
Fair Value at December 31,
|
|||||||||||||||||||
|
(in thousands)
|
Assets (Liabilities)
(2)
|
||||||||||||||||||
|
Effective Date
|
Maturity Date
|
Early Termination Date
(1)
|
Notional Amount
|
Bank Pays Variable Rate of
|
Regency Pays Fixed Rate of
|
2016
|
2015
|
||||||||||||
|
10/16/13
|
10/16/20
|
N/A
|
$
|
28,100
|
|
1 Month LIBOR
|
2.196%
|
$
|
(580
|
)
|
(898
|
)
|
|||||||
|
8/1/16
|
1/5/22
|
N/A
|
200,000
|
|
1 Month LIBOR
|
1.048%
|
7,538
|
|
—
|
|
|||||||||
|
8/1/16
|
1/5/22
|
N/A
|
65,000
|
|
1 Month LIBOR
|
1.070%
|
2,351
|
|
—
|
|
|||||||||
|
4/7/16
|
4/1/23
|
N/A
|
20,000
|
|
1 Month LIBOR
|
1.303%
|
720
|
|
—
|
|
|||||||||
|
12/1/16
|
11/1/23
|
N/A
|
33,000
|
|
1 Month LIBOR
|
1.490%
|
1,013
|
|
—
|
|
|||||||||
|
6/15/17
|
6/15/27
|
12/15/17
|
20,000
|
|
3 Month LIBOR
|
3.488%
|
(3)
|
—
|
|
(1,798
|
)
|
||||||||
|
6/15/17
|
6/15/27
|
12/15/17
|
100,000
|
|
3 Month LIBOR
|
3.480%
|
(3)
|
—
|
|
(8,922
|
)
|
||||||||
|
6/15/17
|
6/15/27
|
12/15/17
|
100,000
|
|
3 Month LIBOR
|
3.480%
|
(3)
|
—
|
|
(8,921
|
)
|
||||||||
|
Total derivative financial instruments
|
$
|
11,042
|
|
(20,539
|
)
|
||||||||||||||
(1)
Represents the date specified in the agreement for either optional or mandatory early termination by the counterparty, which will result in cash settlement. The Company has the option to terminate and settle at any date prior to this.
(2)
Derivatives in an asset position are included within Other assets in the accompanying Consolidated Balance Sheets, while those in a liability position are included within Accounts payable and other liabilities.
(3)
In 2014, the Company entered into
$220 million
of forward starting interest rate swaps to hedge the interest rate on new fixed rate ten year debt that the Company expected to issue in June 2017 for the specific purpose of repaying at maturity the
$300 million
notes. These interest rate swaps locked in a weighted average fixed rate of
3.48%
, before the Company's credit spread. These swaps were settled during the during the third quarter of 2016, as further described below.
These derivative financial instruments are all interest rate swaps, which are designated and qualify as cash flow hedges. The Company does not use derivatives for trading or speculative purposes and currently does not have any derivatives that are not designated as hedges. The Company has master netting agreements, however the Company does not have multiple derivatives subject to a single master netting agreement with the same counterparties. Therefore none are offset in the accompanying Consolidated Balance Sheets.
The effective portion of changes in the fair value of derivatives designated and qualifying as cash flow hedges is recorded in accumulated other comprehensive income (loss) ("AOCI") and subsequently reclassified into earnings in the period that the hedged forecasted transaction affects earnings. The ineffective portion of the change in fair value of the derivatives is recognized directly in earnings within interest expense, in the accompanying Consolidated Statements of Operations.
110
REGENCY CENTERS CORPORATION AND REGENCY CENTERS, L.P.
Notes to Consolidated Financial Statements
December 31, 2016
The following table represents the effect of the derivative financial instruments on the accompanying consolidated financial statements:
|
Derivatives in FASB
ASC Topic 815 Cash Flow Hedging Relationships: |
Amount of Gain (Loss)
Recognized in OCI on Derivative (Effective Portion) |
Location and Amount of Gain (Loss)
Reclassified from Accumulated OCI into Income (Effective Portion) |
Location and Amount of Gain or
(Loss) Recognized in Income on Derivative (Ineffective Portion and Missed Forecast) |
||||||||||||||||||||||||||||||
|
Year ended December 31,
|
Year ended December 31,
|
Year ended December 31,
|
|||||||||||||||||||||||||||||||
|
(in thousands)
|
2016
|
2015
|
2014
|
|
2016
|
2015
|
2014
|
|
2016
|
2015
|
2014
|
||||||||||||||||||||||
|
Interest rate swaps
|
$
|
(10,332
|
)
|
(10,089
|
)
|
(49,968
|
)
|
Interest expense
|
$
|
(51,139
|
)
|
(9,152
|
)
|
(9,353
|
)
|
Loss on derivative instruments
|
$
|
(40,586
|
)
|
—
|
|
—
|
|
||||||||||
As of
December 31, 2016
, the Company expects
$9.8 million
of net deferred losses on derivative instruments accumulated in other comprehensive income, including the Company's share from its Investments in real estate partnerships, to be reclassified into earnings during the next 12 months. Included in the reclass is
$8.4 million
which is related to previously settled swaps on the Company's ten year fixed rate unsecured loans.
Hedge Settlement
During the third quarter of 2016, the Company initiated and completed a
$400.1 million
equity offering, as further described in note 9, for the primary purpose of funding the early redemption of its
$300 million
notes. The Company also used
$40.6 million
from the net offering proceeds to settle
$220 million
of forward starting swaps related to new debt previously expected to be issued in 2017 to repay the notes at maturity. As a result of the equity offering, the Company believed that the issuance of new fixed rate debt within the remaining period of the forward starting swaps was probable not to occur. Accordingly, the Company ceased hedge accounting and reclassified the
$40.6 million
paid to settle the forward starting swaps from Accumulated other comprehensive loss to earnings during the third quarter of 2016.
8. Fair Value Measurements
(a) Disclosure of Fair Value of Financial Instruments
All financial instruments of the Company are reflected in the accompanying Consolidated Balance Sheets at amounts which, in management's estimation, reasonably approximates their fair values, except for the following:
|
December 31,
|
|||||||||||||
|
2016
|
2015
|
||||||||||||
|
(in thousands)
|
Carrying Amount
|
Fair Value
|
Carrying Amount
|
Fair Value
|
|||||||||
|
Financial assets:
|
|||||||||||||
|
Notes receivable
|
$
|
10,481
|
|
10,380
|
|
$
|
10,480
|
|
10,620
|
|
|||
|
Financial liabilities:
|
|||||||||||||
|
Notes payable
|
$
|
1,363,925
|
|
1,435,000
|
|
$
|
1,699,771
|
|
1,793,200
|
|
|||
|
Unsecured credit facilities
|
$
|
278,495
|
|
279,700
|
|
$
|
164,514
|
|
165,300
|
|
|||
The above fair values represent management's estimate of the amounts that would be received from selling those assets or that would be paid to transfer those liabilities in an orderly transaction between market participants as of
December 31, 2016
and
2015
. These fair value measurements maximize the use of observable inputs. However, in situations where there is little, if any, market activity for the asset or liability at the measurement date, the fair value measurement reflects the Company's own judgments about the assumptions that market participants would use in pricing the asset or liability.
The Company develops its judgments based on the best information available at the measurement date, including expected cash flows, appropriately risk-adjusted discount rates, and available observable and unobservable inputs. Service providers involved in fair value measurements are evaluated for competency and qualifications on an ongoing basis. As considerable judgment is often necessary to estimate the fair value of these financial instruments, the fair
111
REGENCY CENTERS CORPORATION AND REGENCY CENTERS, L.P.
Notes to Consolidated Financial Statements
December 31, 2016
values presented above are not necessarily indicative of amounts that will be realized upon disposition of the financial instruments.
The following methods and assumptions were used to estimate the fair value of these financial instruments:
Notes Receivable
The fair value of the Company's notes receivable is estimated by calculating the present value of future contractual cash flows discounted at interest rates available for notes of the same terms and maturities, adjusted for counter-party specific credit risk. The fair value of notes receivable was determined primarily using Level 3 inputs of the fair value hierarchy, which considered counter-party credit risk and collateral risk of the underlying property securing the note receivable.
Notes Payable
The fair value of the Company's unsecured debt is estimated based on the quoted market prices for the same or similar issues or on the current rates offered to the Company for debt of the same remaining maturities. The fair value of the unsecured debt was determined using Level 2 inputs of the fair value hierarchy.
The fair value of the Company's mortgage notes payable is estimated by discounting future cash flows of each instrument at rates that reflect the current market rates available to the Company for debt of the same terms and maturities. Fixed rate loans assumed in connection with real estate acquisitions are recorded in the accompanying consolidated financial statements at fair value at the time the property is acquired. The fair value of the mortgage notes payable was determined using Level 2 inputs of the fair value hierarchy.
Unsecured Credit Facilities
The fair value of the Company's Unsecured credit facilities is estimated based on the interest rates currently offered to the Company by financial institutions. The fair value of the credit facilities was determined using Level 2 inputs of the fair value hierarchy.
The following interest rates were used by the Company to estimate the fair value of its financial instruments:
|
December 31,
|
||||||||
|
2016
|
2015
|
|||||||
|
Low
|
High
|
Low
|
High
|
|||||
|
Notes receivable
|
7.2%
|
7.2%
|
6.3%
|
6.3%
|
||||
|
Notes payable
|
2.9%
|
3.9%
|
2.8%
|
4.2%
|
||||
|
Unsecured credit facilities
|
1.5%
|
1.6%
|
1.1%
|
1.1%
|
||||
(b) Fair Value Measurements
The following financial instruments are measured at fair value on a recurring basis:
Trading Securities Held in Trust
The Company has investments in marketable securities, which are assets of the non-qualified deferred compensation plan ("NQDCP"), that are classified as trading securities held in trust on the accompanying Consolidated Balance Sheets. The fair value of the trading securities held in trust was determined using quoted prices in active markets, which are considered Level 1 inputs of the fair value hierarchy. Changes in the value of trading securities are recorded within net investment (income) loss from deferred compensation plan in the accompanying Consolidated Statements of Operations.
112
REGENCY CENTERS CORPORATION AND REGENCY CENTERS, L.P.
Notes to Consolidated Financial Statements
December 31, 2016
Available-for-Sale Securities
Available-for-sale securities consist of investments in certificates of deposit and corporate bonds, and are recorded at fair value using matrix pricing methods to estimate fair value, which are considered Level 2 inputs of the fair value hierarchy. Unrealized gains or losses on these securities are recognized through Other comprehensive income.
Interest Rate Derivatives
The fair value of the Company's interest rate derivatives is determined using widely accepted valuation techniques including discounted cash flow analysis on the expected cash flows of each derivative. This analysis reflects the contractual terms of the derivatives, including the period to maturity, and uses observable market-based inputs, including interest rate curves and implied volatilities. The Company incorporates credit valuation adjustments to appropriately reflect both its own nonperformance risk and the respective counterparty's nonperformance risk in the fair value measurements.
Although the Company has determined that the majority of the inputs used to value its derivatives fall within Level 2 of the fair value hierarchy, the credit valuation adjustments associated with its derivatives utilize Level 3 inputs, such as estimates of current credit spreads, to evaluate the likelihood of default by the Company and its counterparties. The Company has assessed the significance of the impact of the credit valuation adjustments on the overall valuation of its derivative positions and has determined that the credit valuation adjustments are not significant to the overall valuation of its interest rate swaps. As a result, the Company determined that its interest rate swaps valuation in its entirety is classified in Level 2 of the fair value hierarchy.
113
REGENCY CENTERS CORPORATION AND REGENCY CENTERS, L.P.
Notes to Consolidated Financial Statements
December 31, 2016
The following table presents the placement in the fair value hierarchy of assets and liabilities that are measured at fair value on a recurring basis:
|
Fair Value Measurements as of December 31, 2016
|
||||||||||||
|
Quoted Prices in Active Markets for Identical Assets
|
Significant Other Observable Inputs
|
Significant Unobservable Inputs
|
||||||||||
|
(in thousands)
|
Balance
|
(Level 1)
|
(Level 2)
|
(Level 3)
|
||||||||
|
Assets:
|
||||||||||||
|
Trading securities held in trust
|
$
|
28,588
|
|
28,588
|
|
—
|
|
—
|
|
|||
|
Available-for-sale securities
|
7,420
|
|
—
|
|
7,420
|
|
—
|
|
||||
|
Interest rate derivatives
|
11,622
|
|
—
|
|
11,622
|
|
—
|
|
||||
|
Total
|
$
|
47,630
|
|
28,588
|
|
19,042
|
|
—
|
|
|||
|
Liabilities:
|
||||||||||||
|
Interest rate derivatives
|
$
|
(580
|
)
|
—
|
|
(580
|
)
|
—
|
|
|||
|
Fair Value Measurements as of December 31, 2015
|
||||||||||||
|
Quoted Prices in Active Markets for Identical Assets
|
Significant Other Observable Inputs
|
Significant Unobservable Inputs
|
||||||||||
|
(in thousands)
|
Balance
|
(Level 1)
|
(Level 2)
|
(Level 3)
|
||||||||
|
Assets:
|
||||||||||||
|
Trading securities held in trust
|
$
|
29,093
|
|
29,093
|
|
—
|
|
—
|
|
|||
|
Available-for-sale securities
|
7,922
|
|
—
|
|
7,922
|
|
—
|
|
||||
|
Total
|
$
|
37,015
|
|
29,093
|
|
7,922
|
|
—
|
|
|||
|
Liabilities:
|
||||||||||||
|
Interest rate derivatives
|
$
|
(20,539
|
)
|
—
|
|
(20,539
|
)
|
—
|
|
|||
114
REGENCY CENTERS CORPORATION AND REGENCY CENTERS, L.P.
Notes to Consolidated Financial Statements
December 31, 2016
9. Equity and Capital
Preferred Stock of the Parent Company
Terms and conditions of the preferred stock outstanding are summarized as follows:
|
Preferred Stock Outstanding as of December 31, 2016 and 2015
|
|||||||||||||
|
Date of Issuance
|
Shares Issued and Outstanding
|
Liquidation Preference
|
Distribution Rate
|
Callable By Company
|
|||||||||
|
Series 6
|
2/16/2012
|
10,000,000
|
|
$
|
250,000,000
|
|
6.625%
|
2/16/2017
|
|||||
|
Series 7
|
8/23/2012
|
3,000,000
|
|
75,000,000
|
|
6.000%
|
8/23/2017
|
||||||
|
13,000,000
|
|
$
|
325,000,000
|
|
|||||||||
The Series 6 and 7 preferred shares are perpetual, absent a change in control of the Parent Company, are not convertible into common stock of the Parent Company, and are redeemable at par upon the Company’s election beginning
5
years after the issuance date. None of the terms of the preferred stock contain any unconditional obligations that would require the Company to redeem the securities at any time or for any purpose.
Preferred Shares Redemption - Subsequent Event
Subsequent to
December 31, 2016
, on
February 16, 2017
, the Parent Company redeemed all of the issued and outstanding
6.625%
Series 6
cumulative redeemable preferred shares. The redemption price of
$25.21
per share includes accrued and unpaid dividends, resulting in an aggregate amount being paid of
$252.0 million
. The funds use to redeem the Series 6 preferred shares were provided by the senior unsecured debt offering done in January 2017, as discussed in note 6.
Common Stock of the Parent Company
Issuances:
At the Market ("ATM") Program
Under the Parent Company's March 2014 prospectus supplement filed with the Securities and Exchange Commission with respect to an ATM equity offering program, the Parent Company may sell up to
$200.0 million
of common stock at prices determined by the market at the time of sale. As of
December 31, 2016
,
$70.8 million
in common stock remained available for issuance under this ATM equity program.
The following table presents the shares that were issued under the ATM equity program, which was used to fund investment activities:
|
Year ended December 31,
|
||||||
|
(dollar amounts are in thousands, except price per share data)
|
2016
|
2015
|
||||
|
Shares issued
(1)
|
182,787
|
|
189,266
|
|
||
|
Weighted average price per share
|
$
|
68.85
|
|
67.86
|
|
|
|
Gross proceeds
|
$
|
12,584
|
|
12,843
|
|
|
|
Commissions
|
$
|
157
|
|
161
|
|
|
|
Issuance costs
|
$
|
97
|
|
—
|
|
|
|
(1)
Reflects shares traded in December and settled in January each year.
|
||||||
Forward Equity Offering
In March 2016, the Parent Company entered into a forward sale agreement (the "Forward Equity Offering") to issue
3.10 million
shares of its common stock at an offering price of
$75.25
per share, before any underwriting discount and offering expenses.
115
REGENCY CENTERS CORPORATION AND REGENCY CENTERS, L.P.
Notes to Consolidated Financial Statements
December 31, 2016
In June 2016, the Parent Company partially settled its forward equity offering by delivering
1.85 million
shares of newly issued common stock, receiving
$137.5 million
of net proceeds, which were used to repay the Line.
The remaining
1.25 million
shares must be settled under the forward sale agreement prior to
June 23, 2017
.
Equity Offering
In July 2016, the Parent Company issued
5.0 million
shares of common stock at
$79.78
per share resulting in net proceeds of
$400.1 million
, used to (i) redeem, in August,
$300 million
of notes, including a make-whole payment, (ii) settle forward interest rate swaps, and (iii) fund investment activities and general corporate purposes.
Tax Status of Dividends
The following table summarizes the tax status of dividends paid on our common shares:
|
Year ended December 31,
|
|||||
|
2016
|
2015
|
2014
|
|||
|
Dividend per share
|
$2.00
|
1.94
|
1.88
|
||
|
Ordinary income
|
53%
|
71%
|
70%
|
||
|
Capital gain
|
8%
|
5%
|
16%
|
||
|
Return of capital
|
39%
|
19%
|
14%
|
||
|
Qualified dividend income
|
—%
|
5%
|
—%
|
||
Preferred Units of the Operating Partnership
Preferred units for the Parent Company are outstanding in relation to the Parent Company's preferred stock, as discussed above.
Common Units of the Operating Partnership
Issuances:
Common units were issued to the Parent Company in relation to the Parent Company's issuance of common stock, as discussed above.
General Partners
The Parent Company, as general partner, owned the following Partnership Units outstanding:
|
December 31,
|
||||||
|
(in thousands)
|
2016
|
2015
|
||||
|
Partnership units owned by the general partner
|
104,497
|
|
97,213
|
|
||
|
Partnership units owned by the limited partners
|
154
|
|
154
|
|
||
|
Total partnership units outstanding
|
104,651
|
|
97,367
|
|
||
|
Percentage of partnership units owned by the general partner
|
99.9%
|
99.8%
|
||||
116
REGENCY CENTERS CORPORATION AND REGENCY CENTERS, L.P.
Notes to Consolidated Financial Statements
December 31, 2016
Accumulated Other Comprehensive Income (Loss)
The following table presents changes in the balances of each component of AOCI:
|
Controlling Interest
|
Noncontrolling Interest
|
Total
|
|||||||||||||||||||
|
(in thousands)
|
Cash Flow Hedges
|
Unrealized gain (loss) on Available-For-Sale Securities
|
AOCI
|
Cash Flow Hedges
|
Unrealized gain (loss) on Available-For-Sale Securities
|
AOCI
|
AOCI
|
||||||||||||||
|
Balance as of December 31, 2013
|
$
|
(17,404
|
)
|
—
|
|
(17,404
|
)
|
(479
|
)
|
—
|
|
(479
|
)
|
(17,883
|
)
|
||||||
|
Other comprehensive income before reclassifications
|
(49,524
|
)
|
7,752
|
|
(41,772
|
)
|
(444
|
)
|
13
|
|
(431
|
)
|
(42,203
|
)
|
|||||||
|
Amounts reclassified from accumulated other comprehensive income
|
9,180
|
|
(7,752
|
)
|
1,428
|
|
173
|
|
(13
|
)
|
160
|
|
1,588
|
|
|||||||
|
Current period other comprehensive income, net
|
(40,344
|
)
|
—
|
|
(40,344
|
)
|
(271
|
)
|
—
|
|
(271
|
)
|
(40,615
|
)
|
|||||||
|
Balance as of December 31, 2014
|
$
|
(57,748
|
)
|
—
|
|
(57,748
|
)
|
(750
|
)
|
—
|
|
(750
|
)
|
(58,498
|
)
|
||||||
|
Other comprehensive income before reclassifications
|
(9,897
|
)
|
(43
|
)
|
(9,940
|
)
|
(192
|
)
|
—
|
|
(192
|
)
|
(10,132
|
)
|
|||||||
|
Amounts reclassified from accumulated other comprehensive income
|
8,995
|
|
—
|
|
8,995
|
|
157
|
|
—
|
|
157
|
|
9,152
|
|
|||||||
|
Current period other comprehensive income, net
|
(902
|
)
|
(43
|
)
|
(945
|
)
|
(35
|
)
|
—
|
|
(35
|
)
|
(980
|
)
|
|||||||
|
Balance as of December 31, 2015
|
$
|
(58,650
|
)
|
(43
|
)
|
(58,693
|
)
|
(785
|
)
|
—
|
|
(785
|
)
|
(59,478
|
)
|
||||||
|
Other comprehensive income before reclassifications
|
(10,587
|
)
|
24
|
|
(10,563
|
)
|
255
|
|
—
|
|
255
|
|
(10,308
|
)
|
|||||||
|
Amounts reclassified from accumulated other comprehensive income
|
50,910
|
|
—
|
|
50,910
|
|
229
|
|
—
|
|
229
|
|
51,139
|
|
|||||||
|
Current period other comprehensive income, net
|
40,323
|
|
24
|
|
40,347
|
|
484
|
|
—
|
|
484
|
|
40,831
|
|
|||||||
|
Balance as of December 31, 2016
|
$
|
(18,327
|
)
|
(19
|
)
|
(18,346
|
)
|
(301
|
)
|
—
|
|
(301
|
)
|
(18,647
|
)
|
||||||
The following represents amounts reclassified out of AOCI into income:
|
AOCI Component
|
Amount Reclassified from AOCI into Income
|
Affected Line Item (s) Where Net Income is Presented
|
|||||||||
|
Year ended December 31,
|
|||||||||||
|
(in thousands)
|
2016
|
2015
|
2014
|
||||||||
|
Interest rate swaps
|
$
|
51,139
|
|
9,152
|
|
9,353
|
|
Interest expense and Loss on derivative instruments
|
|||
|
Realized gains on sale of available-for-sale securities
|
—
|
|
—
|
|
(7,765
|
)
|
Net investment (income) loss
|
||||
117
REGENCY CENTERS CORPORATION AND REGENCY CENTERS, L.P.
Notes to Consolidated Financial Statements
December 31, 2016
10. Stock-Based Compensation
The Company recorded stock-based compensation in general and administrative expenses in the accompanying Consolidated Statements of Operations, the components of which are further described below:
|
Year ended December 31,
|
|||||||||
|
(in thousands)
|
2016
|
2015
|
2014
|
||||||
|
Restricted stock
(1)
|
$
|
13,422
|
|
13,869
|
|
12,161
|
|
||
|
Directors' fees paid in common stock
(1)
|
193
|
|
200
|
|
208
|
|
|||
|
Capitalized stock-based compensation
(2)
|
(2,963
|
)
|
(2,988
|
)
|
(2,707
|
)
|
|||
|
Stock-based compensation, net of capitalization
|
$
|
10,652
|
|
11,081
|
|
9,662
|
|
||
(1)
Includes amortization of the grant date fair value of restricted stock awards over the respective vesting periods.
(2)
Includes compensation expense specifically identifiable to development and leasing activities.
The Company established its Long Term Omnibus Plan (the "Plan") under which the Board of Directors may grant stock options and other stock-based awards to officers, directors, and other key employees. The Plan allows the Company to issue up to
4.1 million
shares in the form of the Parent Company's common stock or stock options. As of
December 31, 2016
, there were
2.3 million
shares available for grant under the Plan either through stock options or restricted stock.
Stock Option Awards
Stock options are granted under the Plan with an exercise price equal to the Parent Company's stock's price at the date of grant. All stock options granted have
ten
-year lives, contain vesting terms of
one
to
five
years from the date of grant and some have dividend equivalent rights. The fair value of each option award is estimated on the date of grant using the Black-Scholes-Merton closed-form (“Black-Scholes”) option valuation model. The Company believes that the use of the Black-Scholes model meets the fair value measurement objectives of FASB ASC Topic 718 and reflects all substantive characteristics of the instruments being valued. There were
no
stock options granted during the years ended
December 31, 2016
,
2015
or
2014
. There were
no
stock options exercised, forfeited or expired during the years ended
December 31, 2016
or
2015
.
The following table summarizes stock options outstanding:
|
Year ended December 31, 2016
|
|||||||||||||
|
|
Number of Options
|
Weighted Average Exercise Price
|
Weighted Average Remaining Contractual Term (in years)
|
Aggregate Intrinsic Value (in thousands)
|
|||||||||
|
Outstanding as of December 31, 2015
|
8,741
|
|
$
|
88.45
|
|
1.1
|
$
|
(178
|
)
|
||||
|
Outstanding as of December 31, 2016
|
8,741
|
|
$
|
88.45
|
|
0.1
|
$
|
(170
|
)
|
||||
|
Vested as of December 31, 2016
|
8,741
|
|
$
|
88.45
|
|
0.1
|
$
|
(170
|
)
|
||||
|
Exercisable as of December 31, 2016
(1)
|
8,741
|
|
$
|
88.45
|
|
0.1
|
$
|
(170
|
)
|
||||
(1)
The Company issues new shares to fulfill option exercises from its authorized shares available. The total intrinsic value of options exercised during the year ended
December 31,
2014
was approximately
$1.3 million
.
Restricted Stock Awards
The Company grants restricted stock under the Plan to its employees as a form of long-term compensation and retention. The terms of each restricted stock grant vary depending upon the participant's responsibilities and position within the Company. The Company's stock grants can be categorized as either time-based awards, performance-based awards, or market-based awards. All awards are valued at fair value, earn dividends throughout the vesting period, and have no voting rights. Fair value is measured using the grant date market price for all time-based or performance-based awards. Market based awards are valued using a Monte Carlo simulation to estimate the fair value based on the probability of satisfying the market conditions and the projected stock price at the time of payout, discounted to the
118
REGENCY CENTERS CORPORATION AND REGENCY CENTERS, L.P.
Notes to Consolidated Financial Statements
December 31, 2016
valuation date over a three year performance period. Assumptions include historic volatility over the previous three year period, risk-free interest rates, and Regency's historic daily return as compared to the market index. Since the award payout includes dividend equivalents and the total shareholder return includes the value of dividends, no dividend yield assumption is required for the valuation. Compensation expense is measured at the grant date and recognized on a straight-line basis over the requisite vesting period for the entire award.
The following table summarizes non-vested restricted stock activity:
|
Year ended December 31, 2016
|
|||||||
|
|
Number of Shares
|
Intrinsic Value
(in thousands) |
Weighted Average Grant Price
|
||||
|
Non-vested as of December 31, 2015
|
615,420
|
|
|||||
|
Add: Time-based awards granted
(1) (4)
|
117,275
|
|
$73.22
|
||||
|
Add: Performance-based awards granted
(2) (4)
|
6,521
|
|
$73.22
|
||||
|
Add: Market-based awards granted
(3) (4)
|
67,332
|
|
$90.49
|
||||
|
Less: Vested and Distributed
(5)
|
222,915
|
|
$70.27
|
||||
|
Less: Forfeited
|
22,372
|
|
$60.53
|
||||
|
Non-vested as of December 31, 2016
(6)
|
561,261
|
|
$39,699
|
||||
(1)
Time-based awards vest beginning on the first anniversary following the grant date over a
three
or
four
year service period. These grants are subject only to continued employment and are not dependent on future performance measures. Accordingly, if such vesting criteria are not met, compensation cost previously recognized would be reversed.
(2)
Performance-based awards are earned subject to future performance measurements. Once the performance criteria are achieved and the actual number of shares earned is determined, shares vest over a required service period. The Company considers the likelihood of meeting the performance criteria based upon management's estimates from which it determines the amounts recognized as expense on a periodic basis.
(3)
Market-based awards are earned dependent upon the Company's total shareholder return in relation to the shareholder return of a NAREIT index over a
three
-year period. Once the performance criteria are met and the actual number of shares earned is determined, the shares are immediately vested and distributed. The probability of meeting the criteria is considered when calculating the estimated fair value on the date of grant using a Monte Carlo simulation. These awards are accounted for as awards with market criteria, with compensation cost recognized over the service period, regardless of whether the performance criteria are achieved and the awards are ultimately earned. The significant assumptions underlying determination of fair values for market-based awards granted were as follows:
|
Year ended December 31,
|
||||||
|
2016
|
2015
|
2014
|
||||
|
Volatility
|
18.50%
|
17.10%
|
24.60%
|
|||
|
Risk free interest rate
|
0.88%
|
0.78%
|
0.64%
|
|||
(4)
The weighted-average grant price for restricted stock granted during the years ended
December 31, 2016
,
2015
, and
2014
was
$79.40
,
$69.80
, and
$48.18
, respectively.
(5)
The total intrinsic value of restricted stock vested during the years ended
December 31, 2016
,
2015
, and
2014
was
$15.4 million
,
$18.6 million
, and
$12.4 million
, respectively.
(6)
As of
December 31, 2016
, there was
$12.8 million
of unrecognized compensation cost related to non-vested restricted stock granted under the Parent Company's Plan. When recognized, this compensation results in additional paid in capital in the accompanying Consolidated Statements of Equity of the Parent Company and in general partner preferred and common units in the accompanying Consolidated Statements of Capital of the Operating Partnership. This unrecognized compensation cost is expected to be recognized over the next
three
years. The Company issues new restricted stock from its authorized shares available at the date of grant.
119
REGENCY CENTERS CORPORATION AND REGENCY CENTERS, L.P.
Notes to Consolidated Financial Statements
December 31, 2016
11. Saving and Retirement Plans
401(k) Retirement Plan
The Company maintains a 401(k) retirement plan covering substantially all employees, which permits participants to defer up to the maximum allowable amount determined by the IRS of their eligible compensation. This deferred compensation, together with Company matching contributions equal to 100% of employee deferrals up to a maximum of
$5,000
of their eligible compensation, is fully vested and funded as of
December 31, 2016
. Additionally, an annual profit sharing contribution is made, which vests over a
three
year period. Costs for Company contributions to the plan totaled
$3.3 million
,
$3.1 million
and
$2.8 million
for the years ended
December 31, 2016
,
2015
, and
2014
, respectively.
Non-Qualified Deferred Compensation Plan
The Company maintains a non-qualified deferred compensation plan (“NQDCP”), which allows select employees and directors to defer part or all of their cash bonus, director fees, and vested restricted stock awards. All contributions into the participants' accounts are fully vested upon contribution to the NQDCP and are deposited in a Rabbi trust.
The following table reflects the balances of the assets and deferred compensation liabilities of the Rabbi trust in the accompanying Consolidated Balance Sheets:
|
Non Qualified Deferred Compensation Plan Component
(1)
|
Year ended December 31,
|
|||||
|
(in thousands)
|
2016
|
2015
|
||||
|
Assets:
|
||||||
|
Trading securities held in trust
|
$
|
28,588
|
|
29,093
|
|
|
|
Liabilities:
|
||||||
|
Accounts payable and other liabilities
|
$
|
28,214
|
|
28,632
|
|
|
(1)
Assets and liabilities of the Rabbi trust are exclusive of the shares of the Company's common stock.
Realized and unrealized gains and losses on trading securities are recognized within income from deferred compensation plan in the accompanying Consolidated Statements of Operations. Changes in participant obligations, which is based on changes in the value of their investment elections, is recognized within general and administrative expenses within the accompanying Consolidated Statements of Operations.
Investments in shares of the Company's common stock are included, at cost, as treasury stock in the accompanying Consolidated Balance Sheets of the Parent Company and as a reduction of general partner capital in the accompanying Consolidated Balance Sheets of the Operating Partnership. The participant's deferred compensation liability attributable to the participants' investments in shares of the Company's common stock are included, at cost, within additional paid in capital in the accompanying Consolidated Balance Sheets of the Parent Company and as a reduction of general partner capital in the accompanying Consolidated Balance Sheets of the Operating Partnership. Changes in participant account balances related to the Regency common stock fund are recorded directly within stockholders' equity.
120
REGENCY CENTERS CORPORATION AND REGENCY CENTERS, L.P.
Notes to Consolidated Financial Statements
December 31, 2016
12. Earnings per Share and Unit
Parent Company Earnings per Share
The following summarizes the calculation of basic and diluted earnings per share:
|
Year ended December 31,
|
||||||||||
|
(in thousands, except per share data)
|
2016
|
2015
|
2014
|
|||||||
|
Numerator:
|
||||||||||
|
Income from operations attributable to common stockholders - basic
|
$
|
143,860
|
|
128,994
|
|
165,875
|
|
|||
|
Income from operations attributable to common stockholders - diluted
|
$
|
143,860
|
|
128,994
|
|
165,938
|
|
|||
|
Denominator:
|
||||||||||
|
Weighted average common shares outstanding for basic EPS
|
100,863
|
|
94,391
|
|
92,370
|
|
||||
|
Weighted average common shares outstanding for diluted EPS
(1)
|
101,285
|
|
94,856
|
|
92,404
|
|
||||
|
Income per common share – basic
|
$
|
1.43
|
|
1.37
|
|
1.80
|
|
|||
|
Income per common share – diluted
|
$
|
1.42
|
|
1.36
|
|
1.80
|
|
|||
(1)
Includes the dilutive impact of unvested restricted stock and shares issuable under the forward equity offering using the treasury stock method.
Income allocated to noncontrolling interests of the Operating Partnership has been excluded from the numerator and exchangeable Operating Partnership units have been omitted from the denominator for the purpose of computing diluted earnings per share since the effect of including these amounts in the numerator and denominator would have no impact. Weighted average exchangeable Operating Partnership units outstanding for the years ended
December 31, 2016
and
2015
were
154,170
, and for the year ended
December 31,
2014
was
157,950
.
Operating Partnership Earnings per Unit
The following summarizes the calculation of basic and diluted earnings per unit:
|
Year ended December 31,
|
||||||||||
|
(in thousands, except per share data)
|
2016
|
2015
|
2014
|
|||||||
|
Numerator:
|
||||||||||
|
Income from operations attributable to common unit holders - basic
|
$
|
144,117
|
|
129,234
|
|
166,194
|
|
|||
|
Income from operations attributable to common unit holders - diluted
|
$
|
144,117
|
|
129,234
|
|
166,257
|
|
|||
|
Denominator:
|
||||||||||
|
Weighted average common units outstanding for basic EPU
|
101,017
|
|
94,546
|
|
92,528
|
|
||||
|
Weighted average common units outstanding for diluted EPU
(1)
|
101,439
|
|
95,011
|
|
92,562
|
|
||||
|
Income per common unit – basic
|
$
|
1.43
|
|
1.37
|
|
1.80
|
|
|||
|
Income per common unit – diluted
|
$
|
1.42
|
|
1.36
|
|
1.80
|
|
|||
(1)
Includes the dilutive impact of unvested restricted stock and forward equity offering using the treasury stock method.
121
REGENCY CENTERS CORPORATION AND REGENCY CENTERS, L.P.
Notes to Consolidated Financial Statements
December 31, 2016
13. Operating Leases
The Company's properties are leased to tenants under operating leases. Our leases for tenant space under
10,000
square feet generally have terms ranging from
three
to
seven
years. Leases greater than
10,000
square feet generally have lease terms in excess of
five
years, mostly comprised of anchor tenants. Many of the anchor leases contain provisions allowing the tenant the option of extending the term of the lease at expiration. Future minimum rents under non-cancelable operating leases as of
December 31, 2016
, excluding both tenant reimbursements of operating expenses and additional percentage rent based on tenants' sales, are as follows:
|
In Process Year Ending December 31,
|
Future Minimum Rents (in thousands)
|
|||
|
2017
|
$
|
434,070
|
|
|
|
2018
|
390,872
|
|
||
|
2019
|
346,356
|
|
||
|
2020
|
295,289
|
|
||
|
2021
|
241,549
|
|
||
|
Thereafter
|
990,609
|
|
||
|
Total
|
$
|
2,698,745
|
|
|
The shopping centers' tenant base primarily includes national and regional supermarkets, drug stores, discount department stores, and other retailers and, consequently, the credit risk is concentrated in the retail industry. There were
no
tenants that individually represented more than
5%
of the Company's annualized future minimum rents.
The Company has shopping centers that are subject to non-cancelable, long-term ground leases where a third party owns and has leased the underlying land to the Company to construct and/or operate a shopping center. Ground leases expire through the year
2101
, and in most cases, provide for renewal options. Buildings and improvements constructed on the leased land are capitalized and depreciated over the shorter of the useful life of the improvements or the lease term.
In addition, the Company has non-cancelable operating leases pertaining to office space from which it conducts its business. Office leases expire through the year
2027
, and in most cases, provide for renewal options. Leasehold improvements are capitalized, recorded as tenant improvements, and depreciated over the shorter of the useful life of the improvements or the lease term.
Operating lease expense was
$13.1 million
,
$9.5 million
, and
$8.9 million
for the years ended
December 31, 2016
,
2015
, and
2014
, respectively. The following table summarizes the future obligations under non-cancelable operating leases as of
December 31, 2016
:
|
In Process Year Ending December 31,
|
Future Obligations (in thousands)
|
|||
|
2017
|
$
|
9,740
|
|
|
|
2018
|
11,464
|
|
||
|
2019
|
12,131
|
|
||
|
2020
|
11,706
|
|
||
|
2021
|
11,290
|
|
||
|
Thereafter
|
442,476
|
|
||
|
Total
|
$
|
498,807
|
|
|
14 Commitments and Contingencies
The Company is involved in litigation on a number of matters and is subject to certain claims, which arise in the normal course of business, none of which, in the opinion of management, is expected to have a material adverse effect on the Company's consolidated financial position, results of operations, or liquidity. Legal fees are expensed as incurred.
122
REGENCY CENTERS CORPORATION AND REGENCY CENTERS, L.P.
Notes to Consolidated Financial Statements
December 31, 2016
After the announcement of the merger agreement on November 14, 2016, a putative class action was filed on behalf of a purported stockholder in the Circuit Court for Duval County, Florida, under the following caption: Robert Garfield on Behalf of Himself and All Others Similarly Situated vs. Regency Centers Corporation, Martin E. Stein, Jr., John C. Schweitzer, Raymond L. Bank, Bryce Blair, C. Ronald Blankenship, J. Dix Druce, Jr., Mary Lou Fiala, David P. O'Connor, and Thomas G. Wattles, No. 16-2017-CA-000688-XXXX-MA, filed February 3, 2017.
The class action alleges, among other matters, that the definitive joint proxy statement/prospectus filed by Regency and Equity One with the Securities and Exchange Commission (the “SEC”) on January 24, 2017 (the “Joint Proxy Statement/Prospectus”) omitted certain material information in connection with the Merger. The complainant seeks various remedies, including injunctive relief to prevent the consummation of the Merger unless certain allegedly material information is disclosed and seeking compensatory and rescissory damages in the event the Merger is consummated without such disclosures.
On February 17, 2017, the defendants entered into a stipulation of settlement with respect to the class action, pursuant to which the parties have agreed, among other things, that Regency will make certain supplemental disclosures. The supplemental disclosures were made by Regency in the Current Report on Form 8-K filed by Regency with the SEC on February 17, 2017. The supplemental disclosures should be read in conjunction with the Joint Proxy Statement/Prospectus, which should be read in its entirety.
Regency believes that the class action is without merit and that no supplemental disclosure is required to the Joint Proxy Statement/Prospectus under any applicable rule, statute, regulation or law. However, to, among other things, eliminate the burden, inconvenience, expense, risk and disruption of further litigation, Regency has determined that it will provide supplemental disclosures. Additional information regarding the stipulation of settlement or additional disclosures may be found in the Current Report on Form 8-K as filed with the SEC on February 17, 2017.
The Company is also subject to numerous environmental laws and regulations as they apply to real estate pertaining to chemicals used by the dry cleaning industry, the existence of asbestos in older shopping centers, and underground petroleum storage tanks. The Company believes that the ultimate disposition of currently known environmental matters will not have a material effect on its financial position, liquidity, or operations; however, it can give no assurance that existing environmental studies with respect to the shopping centers have revealed all potential environmental liabilities; that any previous owner, occupant or tenant did not create any material environmental condition not known to it; that the current environmental condition of the shopping centers will not be affected by tenants and occupants, by the condition of nearby properties, or by unrelated third parties; or that changes in applicable environmental laws and regulations or their interpretation will not result in additional environmental liability to the Company.
The Company has the right to issue letters of credit under the Line up to an amount not to exceed
$50.0 million
, which reduces the credit availability under the Line. These letters of credit are primarily issued as collateral to facilitate the construction of development projects. As of
December 31, 2016
and
2015
, the Company had
$5.8 million
and
$5.9 million
in letters of credit outstanding, respectively.
123
REGENCY CENTERS CORPORATION AND REGENCY CENTERS, L.P.
Notes to Consolidated Financial Statements
December 31, 2016
15. Summary of Quarterly Financial Data (Unaudited)
The following table summarizes selected Quarterly Financial Data for the Company on a historical basis for the years ended
December 31, 2016
and
2015
:
|
(in thousands except per share and per unit data)
|
First Quarter
|
Second Quarter
|
Third Quarter
|
Fourth Quarter
|
|||||||||
|
Year ended December 31, 2016
|
|||||||||||||
|
Operating Data:
|
|||||||||||||
|
Revenue
|
$
|
149,628
|
|
152,413
|
|
152,769
|
|
159,561
|
|
||||
|
Net income attributable to common stockholders
|
$
|
47,877
|
|
34,810
|
|
5,305
|
|
55,868
|
|
||||
|
Net income attributable to exchangeable operating partnership units
|
85
|
|
64
|
|
16
|
|
92
|
|
|||||
|
Net income attributable to common unit holders
|
$
|
47,962
|
|
34,874
|
|
5,321
|
|
55,960
|
|
||||
|
Net income attributable to common stock and unit holders per share and unit:
|
|||||||||||||
|
Basic
|
$
|
0.49
|
|
0.36
|
|
0.05
|
|
0.53
|
|
||||
|
Diluted
|
$
|
0.49
|
|
0.35
|
|
0.05
|
|
0.53
|
|
||||
|
Year ended December 31, 2015
|
|||||||||||||
|
Operating Data:
|
|||||||||||||
|
Revenue
|
$
|
140,399
|
|
141,129
|
|
142,068
|
|
146,167
|
|
||||
|
Net income attributable to common stockholders
|
$
|
25,174
|
|
32,480
|
|
53,731
|
|
17,609
|
|
||||
|
Net income attributable to exchangeable operating partnership units
|
49
|
|
61
|
|
94
|
|
36
|
|
|||||
|
Net income attributable to common unit holders
|
$
|
25,223
|
|
32,541
|
|
53,825
|
|
17,645
|
|
||||
|
Net income attributable to common stock and unit holders per share and unit:
|
|||||||||||||
|
Basic
|
$
|
0.27
|
|
0.35
|
|
0.57
|
|
0.18
|
|
||||
|
Diluted
|
$
|
0.27
|
|
0.34
|
|
0.57
|
|
0.18
|
|
||||
124
REGENCY CENTERS CORPORATION AND REGENCY CENTERS, L.P.
Notes to Consolidated Financial Statements
December 31, 2016
16. Subsequent Events
Approval of Merger with Equity One, Inc.
On November 14, 2016, Regency entered into a Merger Agreement with Equity One, pursuant to which, subject to the satisfaction or waiver of certain conditions, Equity One will merge with and into the Company, with Regency being the surviving corporation (the “Merger”). The combined company will retain the Regency name and will continue to trade under the ticker symbol REG on the New York Stock Exchange ("NYSE"). The Company will expand its board of directors to
12
directors and will add three persons who served on Equity One's board of directors. The executive officers of Regency immediately prior to the effective date of the merger will continue to serve as executive officers of the combined company.
On the terms and subject to the conditions set forth in the Merger Agreement, which has been unanimously approved by the boards of directors of the Company and Equity One, at the effective time of the Merger, each share of the common stock, par value
$0.01
per share, of Equity One issued and outstanding immediately prior to the effective time (other than shares of Equity One owned directly by Equity One or the Company and in each case not held on behalf of third parties) will be converted into the right to receive
0.45
of a newly issued share of the common stock of the Company.
The consummation of the Merger is subject to certain closing conditions, including (i) the approval of the Company’s and Equity One’s respective stockholders, (ii) the shares of Company Common Stock to be issued in the Merger will have been approved for listing on the New York Stock Exchange, subject to official notice of issuance, (iii) the absence of any temporary restraining order, preliminary or permanent injunction or other order issued by any court of competent jurisdiction or other legal restraint or prohibition preventing the consummation of the Merger, (iv) the receipt of certain tax opinions by the Company and Equity One, and (v) other customary conditions specified in the Merger Agreement.
At a special meeting of Regency stockholders, held on Friday, February 24, 2017, the stockholders approved all matters subject to stockholder vote, including
(i) the proposed Merger Agreement and the Merger,
(ii) the proposal to amend the Restated Articles of Incorporation of Regency to increase the number of authorized shares of Regency common stock, and
(iii) the proposal to increase the size of the Regency board of directors to
12
directors.
At a separate special meeting of Equity One stockholders, also held on Friday, February 24, 2017, their stockholders approved all matters subject to stockholder vote, including
(i) the proposed Merger Agreement and the Merger, and
(ii) the proposal to approve the compensation that may be paid or become payable to the named executive officers in connection with the Merger.
The Merger is expected to close effective March 1, 2017, at which time each share of Equity One common stock issued and outstanding will be converted into the right to receive
0.45
of a newly issued share of Regency common stock. The merger will be accounted for using the acquisition method of accounting. The purchase price will be computed using the closing price of Regency common stock on the closing date applied to the number of shares of common stock issued to consummate the merger. Under the acquisition method of accounting, the total purchase price is allocated to the acquired net tangible and identifiable intangible assets and liabilities assumed of Equity One based on their respective fair values, on the closing date. Since the purchase price will be based on the price of Regency's common stock on the effective date, the purchase price and resulting purchase price allocation is not yet known. Further information about preliminary estimated purchase price and unaudited pro forma financial statements of the combined company can be found in the Form S-4, as filed with the Securities and Exchange Commission on December 22, 2016 and subsequent amendments thereto.
After the announcement of the merger agreement on November 14, 2016, a putative class action was filed on behalf of a purported stockholder in the Circuit Court for Duval County, Florida, under the following caption: Robert Garfield on Behalf of Himself and All Others Similarly Situated vs. Regency Centers Corporation, Martin E. Stein, Jr., John C. Schweitzer, Raymond L. Bank, Bryce Blair, C. Ronald Blankenship, J. Dix Druce, Jr., Mary Lou Fiala, David P. O'Connor, and Thomas G. Wattles, No. 16-2017-CA-000688-XXXX-MA, filed February 3, 2017.
125
REGENCY CENTERS CORPORATION AND REGENCY CENTERS, L.P.
Notes to Consolidated Financial Statements
December 31, 2016
The class action alleges, among other matters, that the definitive joint proxy statement/prospectus filed by Regency and Equity One with the Securities and Exchange Commission (the “SEC”) on January 24, 2017 (the “Joint Proxy Statement/Prospectus”) omitted certain material information in connection with the Merger. The complainant seeks various remedies, including injunctive relief to prevent the consummation of the Merger unless certain allegedly material information is disclosed and seeking compensatory and rescissory damages in the event the Merger is consummated without such disclosures.
On February 17, 2017, the defendants entered into a stipulation of settlement with respect to the class action, pursuant to which the parties have agreed, among other things, that Regency will make certain supplemental disclosures. The supplemental disclosures were made by Regency in the Current Report on Form 8-K filed by Regency with the SEC on February 17, 2017. The supplemental disclosures should be read in conjunction with the Joint Proxy Statement/Prospectus, which should be read in its entirety.
Regency believes that the class action is without merit and that no supplemental disclosure is or was required to the Joint Proxy Statement/Prospectus under any applicable rule, statute, regulation or law. However, to, among other things, eliminate the burden, inconvenience, expense, risk and disruption of further litigation, Regency has determined to provide supplemental disclosures. Additional information regarding the stipulation of settlement may be found in the Current Report on Form 8-K as filed with the SEC on February 17, 2017.
126
|
REGENCY CENTERS CORPORATION AND REGENCY CENTERS, L.P.
Schedule III - Consolidated Real Estate and Accumulated Depreciation December 31, 2016 (in thousands) |
||||||||||||||||||||||||||||
|
Initial Cost
|
Total Cost
|
Net Cost
|
||||||||||||||||||||||||||
|
Shopping Centers
(1)
|
Land
|
Building & Improvements
|
Cost Capitalized
Subsequent to
Acquisition
(2)
|
Land
|
Building & Improvements
|
Total
|
Accumulated Depreciation
|
Net of Accumulated Depreciation
|
Mortgages
|
|||||||||||||||||||
|
4S Commons Town Center
|
$
|
30,760
|
|
35,830
|
|
942
|
|
30,812
|
|
36,720
|
|
67,532
|
|
20,997
|
|
46,535
|
|
62,500
|
|
|||||||||
|
Amerige Heights Town Center
|
10,109
|
|
11,288
|
|
486
|
|
10,109
|
|
11,774
|
|
21,883
|
|
3,833
|
|
18,050
|
|
16,105
|
|
||||||||||
|
Anastasia Plaza
|
9,065
|
|
—
|
|
615
|
|
3,338
|
|
6,342
|
|
9,680
|
|
1,993
|
|
7,687
|
|
—
|
|
||||||||||
|
Ashburn Farm Market Center
|
9,835
|
|
4,812
|
|
244
|
|
9,835
|
|
5,056
|
|
14,891
|
|
4,084
|
|
10,807
|
|
—
|
|
||||||||||
|
Ashford Perimeter
|
2,584
|
|
9,865
|
|
1,062
|
|
2,584
|
|
10,927
|
|
13,511
|
|
6,829
|
|
6,682
|
|
—
|
|
||||||||||
|
Aventura Shopping Center
|
2,751
|
|
10,459
|
|
(10,367
|
)
|
2,751
|
|
92
|
|
2,843
|
|
52
|
|
2,791
|
|
—
|
|
||||||||||
|
Balboa Mesa Shopping Center
|
23,074
|
|
33,838
|
|
13,985
|
|
27,769
|
|
43,128
|
|
70,897
|
|
7,663
|
|
63,234
|
|
—
|
|
||||||||||
|
Belleview Square
|
8,132
|
|
9,756
|
|
2,649
|
|
8,323
|
|
12,214
|
|
20,537
|
|
6,709
|
|
13,828
|
|
—
|
|
||||||||||
|
Belmont Chase
|
13,881
|
|
15,407
|
|
—
|
|
13,881
|
|
15,407
|
|
29,288
|
|
1,415
|
|
27,873
|
|
—
|
|
||||||||||
|
Berkshire Commons
|
2,295
|
|
9,551
|
|
2,278
|
|
2,965
|
|
11,159
|
|
14,124
|
|
7,199
|
|
6,925
|
|
7,500
|
|
||||||||||
|
Black Rock
|
22,251
|
|
20,815
|
|
196
|
|
22,250
|
|
21,011
|
|
43,261
|
|
2,668
|
|
40,593
|
|
20,000
|
|
||||||||||
|
Bloomingdale Square
|
3,940
|
|
14,912
|
|
2,595
|
|
3,940
|
|
17,507
|
|
21,447
|
|
8,588
|
|
12,859
|
|
—
|
|
||||||||||
|
Boulevard Center
|
3,659
|
|
10,787
|
|
1,341
|
|
3,659
|
|
12,128
|
|
15,787
|
|
6,287
|
|
9,500
|
|
—
|
|
||||||||||
|
Boynton Lakes Plaza
|
2,628
|
|
11,236
|
|
4,699
|
|
3,606
|
|
14,957
|
|
18,563
|
|
6,246
|
|
12,317
|
|
—
|
|
||||||||||
|
Brentwood Plaza
|
2,788
|
|
3,473
|
|
286
|
|
2,788
|
|
3,759
|
|
6,547
|
|
1,042
|
|
5,505
|
|
—
|
|
||||||||||
|
Briarcliff La Vista
|
694
|
|
3,292
|
|
473
|
|
694
|
|
3,765
|
|
4,459
|
|
2,601
|
|
1,858
|
|
—
|
|
||||||||||
|
Briarcliff Village
|
4,597
|
|
24,836
|
|
1,380
|
|
4,597
|
|
26,216
|
|
30,813
|
|
16,579
|
|
14,234
|
|
—
|
|
||||||||||
|
Brick Walk
|
25,299
|
|
41,995
|
|
352
|
|
25,299
|
|
42,347
|
|
67,646
|
|
4,039
|
|
63,607
|
|
33,000
|
|
||||||||||
|
Bridgeton
|
3,033
|
|
8,137
|
|
415
|
|
3,067
|
|
8,518
|
|
11,585
|
|
1,863
|
|
9,722
|
|
—
|
|
||||||||||
|
Brighten Park
|
3,983
|
|
18,687
|
|
10,852
|
|
4,234
|
|
29,288
|
|
33,522
|
|
12,472
|
|
21,050
|
|
—
|
|
||||||||||
|
Brooklyn Station on Riverside
|
7,019
|
|
8,688
|
|
—
|
|
7,019
|
|
8,688
|
|
15,707
|
|
741
|
|
14,966
|
|
—
|
|
||||||||||
|
Buckhead Court
|
1,417
|
|
7,432
|
|
2,573
|
|
1,417
|
|
10,005
|
|
11,422
|
|
5,661
|
|
5,761
|
|
—
|
|
||||||||||
|
Buckley Square
|
2,970
|
|
5,978
|
|
1,131
|
|
2,970
|
|
7,109
|
|
10,079
|
|
3,773
|
|
6,306
|
|
—
|
|
||||||||||
|
Caligo Crossing
|
2,459
|
|
4,897
|
|
144
|
|
2,546
|
|
4,954
|
|
7,500
|
|
2,353
|
|
5,147
|
|
—
|
|
||||||||||
|
Cambridge Square
|
774
|
|
4,347
|
|
761
|
|
774
|
|
5,108
|
|
5,882
|
|
2,950
|
|
2,932
|
|
—
|
|
||||||||||
|
Carmel Commons
|
2,466
|
|
12,548
|
|
5,014
|
|
3,422
|
|
16,606
|
|
20,028
|
|
8,297
|
|
11,731
|
|
—
|
|
||||||||||
|
Carriage Gate
|
833
|
|
4,974
|
|
2,830
|
|
1,302
|
|
7,335
|
|
8,637
|
|
5,171
|
|
3,466
|
|
—
|
|
||||||||||
|
Centerplace of Greeley III
|
6,661
|
|
11,502
|
|
515
|
|
5,694
|
|
12,984
|
|
18,678
|
|
3,912
|
|
14,766
|
|
—
|
|
||||||||||
|
Chasewood Plaza
|
4,612
|
|
20,829
|
|
5,051
|
|
6,518
|
|
23,974
|
|
30,492
|
|
14,640
|
|
15,852
|
|
—
|
|
||||||||||
|
Cherry Grove
|
3,533
|
|
15,862
|
|
2,567
|
|
3,533
|
|
18,429
|
|
21,962
|
|
8,766
|
|
13,196
|
|
—
|
|
||||||||||
|
CityLine Market
|
12,208
|
|
15,839
|
|
—
|
|
12,208
|
|
15,839
|
|
28,047
|
|
563
|
|
27,484
|
|
—
|
|
||||||||||
|
CityLine Market Ph II
|
2,611
|
|
3,051
|
|
—
|
|
2,611
|
|
3,051
|
|
5,662
|
|
42
|
|
5,620
|
|
—
|
|
||||||||||
127
|
REGENCY CENTERS CORPORATION AND REGENCY CENTERS, L.P.
Schedule III - Consolidated Real Estate and Accumulated Depreciation December 31, 2016 (in thousands) |
||||||||||||||||||||||||||||
|
Initial Cost
|
Total Cost
|
Net Cost
|
||||||||||||||||||||||||||
|
Shopping Centers
(1)
|
Land
|
Building & Improvements
|
Cost Capitalized
Subsequent to
Acquisition
(2)
|
Land
|
Building & Improvements
|
Total
|
Accumulated Depreciation
|
Net of Accumulated Depreciation
|
Mortgages
|
|||||||||||||||||||
|
Clayton Valley Shopping Center
|
24,189
|
|
35,422
|
|
2,535
|
|
24,538
|
|
37,608
|
|
62,146
|
|
20,655
|
|
41,491
|
|
—
|
|
||||||||||
|
Clybourn Commons
|
15,056
|
|
5,594
|
|
308
|
|
15,056
|
|
5,902
|
|
20,958
|
|
714
|
|
20,244
|
|
—
|
|
||||||||||
|
Cochran's Crossing
|
13,154
|
|
12,315
|
|
995
|
|
13,154
|
|
13,310
|
|
26,464
|
|
8,881
|
|
17,583
|
|
—
|
|
||||||||||
|
Corkscrew Village
|
8,407
|
|
8,004
|
|
567
|
|
8,407
|
|
8,571
|
|
16,978
|
|
2,998
|
|
13,980
|
|
7,343
|
|
||||||||||
|
Cornerstone Square
|
1,772
|
|
6,944
|
|
1,151
|
|
1,772
|
|
8,095
|
|
9,867
|
|
4,897
|
|
4,970
|
|
—
|
|
||||||||||
|
Corvallis Market Center
|
6,674
|
|
12,244
|
|
387
|
|
6,696
|
|
12,609
|
|
19,305
|
|
4,687
|
|
14,618
|
|
—
|
|
||||||||||
|
Costa Verde Center
|
12,740
|
|
26,868
|
|
1,555
|
|
12,798
|
|
28,365
|
|
41,163
|
|
14,597
|
|
26,566
|
|
—
|
|
||||||||||
|
Courtyard Landcom
|
5,867
|
|
4
|
|
3
|
|
5,867
|
|
7
|
|
5,874
|
|
2
|
|
5,872
|
|
—
|
|
||||||||||
|
Culpeper Colonnade
|
15,944
|
|
10,601
|
|
4,876
|
|
16,258
|
|
15,163
|
|
31,421
|
|
7,971
|
|
23,450
|
|
—
|
|
||||||||||
|
Dardenne Crossing
|
4,194
|
|
4,005
|
|
328
|
|
4,343
|
|
4,184
|
|
8,527
|
|
1,301
|
|
7,226
|
|
—
|
|
||||||||||
|
Delk Spectrum
|
2,985
|
|
12,001
|
|
2,711
|
|
3,271
|
|
14,426
|
|
17,697
|
|
6,935
|
|
10,762
|
|
—
|
|
||||||||||
|
Diablo Plaza
|
5,300
|
|
8,181
|
|
1,317
|
|
5,300
|
|
9,498
|
|
14,798
|
|
4,571
|
|
10,227
|
|
—
|
|
||||||||||
|
Dunwoody Village
|
3,342
|
|
15,934
|
|
3,541
|
|
3,342
|
|
19,475
|
|
22,817
|
|
12,283
|
|
10,534
|
|
—
|
|
||||||||||
|
East Pointe
|
1,730
|
|
7,189
|
|
1,993
|
|
1,944
|
|
8,968
|
|
10,912
|
|
4,744
|
|
6,168
|
|
—
|
|
||||||||||
|
East Washington Place
|
15,993
|
|
40,180
|
|
1,588
|
|
15,509
|
|
42,252
|
|
57,761
|
|
7,066
|
|
50,695
|
|
—
|
|
||||||||||
|
El Camino Shopping Center
|
7,600
|
|
11,538
|
|
1,248
|
|
7,600
|
|
12,786
|
|
20,386
|
|
5,790
|
|
14,596
|
|
—
|
|
||||||||||
|
El Cerrito Plaza
|
11,025
|
|
27,371
|
|
1,079
|
|
11,025
|
|
28,450
|
|
39,475
|
|
8,369
|
|
31,106
|
|
37,237
|
|
||||||||||
|
El Norte Parkway Plaza
|
2,834
|
|
7,370
|
|
3,266
|
|
3,263
|
|
10,207
|
|
13,470
|
|
4,539
|
|
8,931
|
|
—
|
|
||||||||||
|
Encina Grande
|
5,040
|
|
11,572
|
|
18,923
|
|
10,205
|
|
25,330
|
|
35,535
|
|
8,619
|
|
26,916
|
|
—
|
|
||||||||||
|
Fairfax Shopping Center
|
15,239
|
|
11,367
|
|
(8,763
|
)
|
10,826
|
|
7,017
|
|
17,843
|
|
2,942
|
|
14,901
|
|
—
|
|
||||||||||
|
Fairfield
|
6,731
|
|
29,420
|
|
456
|
|
6,731
|
|
29,876
|
|
36,607
|
|
2,759
|
|
33,848
|
|
—
|
|
||||||||||
|
Falcon
|
1,340
|
|
4,168
|
|
294
|
|
1,340
|
|
4,462
|
|
5,802
|
|
1,836
|
|
3,966
|
|
—
|
|
||||||||||
|
Fellsway Plaza
|
30,712
|
|
7,327
|
|
10,022
|
|
34,923
|
|
13,138
|
|
48,061
|
|
2,762
|
|
45,299
|
|
34,600
|
|
||||||||||
|
Fenton Marketplace
|
2,298
|
|
8,510
|
|
(8,305
|
)
|
512
|
|
1,991
|
|
2,503
|
|
558
|
|
1,945
|
|
—
|
|
||||||||||
|
Fleming Island
|
3,077
|
|
11,587
|
|
2,958
|
|
3,111
|
|
14,511
|
|
17,622
|
|
6,620
|
|
11,002
|
|
—
|
|
||||||||||
|
Fountain Square
|
29,650
|
|
28,393
|
|
2
|
|
29,290
|
|
28,755
|
|
58,045
|
|
3,205
|
|
54,840
|
|
—
|
|
||||||||||
|
French Valley Village Center
|
11,924
|
|
16,856
|
|
175
|
|
11,822
|
|
17,133
|
|
28,955
|
|
10,237
|
|
18,718
|
|
—
|
|
||||||||||
|
Friars Mission Center
|
6,660
|
|
28,021
|
|
1,418
|
|
6,660
|
|
29,439
|
|
36,099
|
|
13,281
|
|
22,818
|
|
—
|
|
||||||||||
|
Garden City
|
741
|
|
9,764
|
|
6
|
|
741
|
|
9,770
|
|
10,511
|
|
349
|
|
10,162
|
|
—
|
|
||||||||||
|
Gardens Square
|
2,136
|
|
8,273
|
|
502
|
|
2,136
|
|
8,775
|
|
10,911
|
|
4,488
|
|
6,423
|
|
—
|
|
||||||||||
|
Gateway 101
|
24,971
|
|
9,113
|
|
(1,435
|
)
|
24,971
|
|
7,678
|
|
32,649
|
|
2,539
|
|
30,110
|
|
—
|
|
||||||||||
|
Gateway Shopping Center
|
52,665
|
|
7,134
|
|
8,651
|
|
55,296
|
|
13,154
|
|
68,450
|
|
12,045
|
|
56,405
|
|
—
|
|
||||||||||
128
|
REGENCY CENTERS CORPORATION AND REGENCY CENTERS, L.P.
Schedule III - Consolidated Real Estate and Accumulated Depreciation December 31, 2016 (in thousands) |
||||||||||||||||||||||||||||
|
Initial Cost
|
Total Cost
|
Net Cost
|
||||||||||||||||||||||||||
|
Shopping Centers
(1)
|
Land
|
Building & Improvements
|
Cost Capitalized
Subsequent to
Acquisition
(2)
|
Land
|
Building & Improvements
|
Total
|
Accumulated Depreciation
|
Net of Accumulated Depreciation
|
Mortgages
|
|||||||||||||||||||
|
Gelson's Westlake Market Plaza
|
3,157
|
|
11,153
|
|
5,462
|
|
4,648
|
|
15,124
|
|
19,772
|
|
5,358
|
|
14,414
|
|
—
|
|
||||||||||
|
Glen Oak Plaza
|
4,103
|
|
12,951
|
|
554
|
|
4,103
|
|
13,505
|
|
17,608
|
|
2,977
|
|
14,631
|
|
—
|
|
||||||||||
|
Glenwood Village
|
1,194
|
|
5,381
|
|
297
|
|
1,194
|
|
5,678
|
|
6,872
|
|
3,905
|
|
2,967
|
|
—
|
|
||||||||||
|
Golden Hills Plaza
|
12,699
|
|
18,482
|
|
2,160
|
|
11,397
|
|
21,944
|
|
33,341
|
|
6,792
|
|
26,549
|
|
—
|
|
||||||||||
|
Grand Ridge Plaza
|
24,208
|
|
61,033
|
|
2,872
|
|
24,879
|
|
63,234
|
|
88,113
|
|
10,786
|
|
77,327
|
|
10,931
|
|
||||||||||
|
Hancock
|
8,232
|
|
28,260
|
|
1,597
|
|
8,232
|
|
29,857
|
|
38,089
|
|
14,654
|
|
23,435
|
|
—
|
|
||||||||||
|
Harpeth Village Fieldstone
|
2,284
|
|
9,443
|
|
521
|
|
2,284
|
|
9,964
|
|
12,248
|
|
4,702
|
|
7,546
|
|
—
|
|
||||||||||
|
Harris Crossing
|
7,199
|
|
3,687
|
|
(720
|
)
|
6,443
|
|
3,723
|
|
10,166
|
|
2,011
|
|
8,155
|
|
—
|
|
||||||||||
|
Heritage Land
|
12,390
|
|
—
|
|
(453
|
)
|
11,937
|
|
—
|
|
11,937
|
|
—
|
|
11,937
|
|
—
|
|
||||||||||
|
Heritage Plaza
|
—
|
|
26,097
|
|
14,278
|
|
278
|
|
40,097
|
|
40,375
|
|
15,259
|
|
25,116
|
|
—
|
|
||||||||||
|
Hershey
|
7
|
|
808
|
|
8
|
|
7
|
|
816
|
|
823
|
|
361
|
|
462
|
|
—
|
|
||||||||||
|
Hibernia Pavilion
|
4,929
|
|
5,065
|
|
75
|
|
4,929
|
|
5,140
|
|
10,069
|
|
2,376
|
|
7,693
|
|
—
|
|
||||||||||
|
Hickory Creek Plaza
|
5,629
|
|
4,564
|
|
319
|
|
5,629
|
|
4,883
|
|
10,512
|
|
3,425
|
|
7,087
|
|
—
|
|
||||||||||
|
Hillcrest Village
|
1,600
|
|
1,909
|
|
51
|
|
1,600
|
|
1,960
|
|
3,560
|
|
897
|
|
2,663
|
|
—
|
|
||||||||||
|
Hilltop Village
|
2,995
|
|
4,581
|
|
2,124
|
|
3,097
|
|
6,603
|
|
9,700
|
|
1,278
|
|
8,422
|
|
—
|
|
||||||||||
|
Hinsdale
|
5,734
|
|
16,709
|
|
11,561
|
|
8,279
|
|
25,725
|
|
34,004
|
|
10,145
|
|
23,859
|
|
—
|
|
||||||||||
|
Holly Park
|
8,975
|
|
23,799
|
|
(211
|
)
|
8,828
|
|
23,735
|
|
32,563
|
|
2,688
|
|
29,875
|
|
—
|
|
||||||||||
|
Howell Mill Village
|
5,157
|
|
14,279
|
|
2,255
|
|
5,157
|
|
16,534
|
|
21,691
|
|
4,850
|
|
16,841
|
|
—
|
|
||||||||||
|
Hyde Park
|
9,809
|
|
39,905
|
|
2,661
|
|
9,809
|
|
42,566
|
|
52,375
|
|
22,453
|
|
29,922
|
|
—
|
|
||||||||||
|
Indian Springs
|
24,974
|
|
25,903
|
|
(43
|
)
|
25,034
|
|
25,800
|
|
50,834
|
|
2,010
|
|
48,824
|
|
—
|
|
||||||||||
|
Indio Towne Center
|
17,946
|
|
32,617
|
|
5,206
|
|
23,092
|
|
32,677
|
|
55,769
|
|
13,037
|
|
42,732
|
|
—
|
|
||||||||||
|
Inglewood Plaza
|
1,300
|
|
2,159
|
|
619
|
|
1,300
|
|
2,778
|
|
4,078
|
|
1,239
|
|
2,839
|
|
—
|
|
||||||||||
|
Jefferson Square
|
5,167
|
|
6,445
|
|
(7,220
|
)
|
1,894
|
|
2,498
|
|
4,392
|
|
508
|
|
3,884
|
|
—
|
|
||||||||||
|
Keller Town Center
|
2,294
|
|
12,841
|
|
685
|
|
2,404
|
|
13,416
|
|
15,820
|
|
6,073
|
|
9,747
|
|
—
|
|
||||||||||
|
Kent Place
|
4,855
|
|
3,586
|
|
785
|
|
5,269
|
|
3,957
|
|
9,226
|
|
620
|
|
8,606
|
|
8,250
|
|
||||||||||
|
Kirkwood Commons
|
6,772
|
|
16,224
|
|
478
|
|
6,802
|
|
16,672
|
|
23,474
|
|
3,410
|
|
20,064
|
|
9,978
|
|
||||||||||
|
Klahanie Shopping Center
|
14,451
|
|
20,089
|
|
40
|
|
14,451
|
|
20,129
|
|
34,580
|
|
358
|
|
34,222
|
|
—
|
|
||||||||||
|
Kroger New Albany Center
|
3,844
|
|
6,599
|
|
636
|
|
3,844
|
|
7,235
|
|
11,079
|
|
4,988
|
|
6,091
|
|
—
|
|
||||||||||
|
Lake Pine Plaza
|
2,008
|
|
7,632
|
|
594
|
|
2,029
|
|
8,205
|
|
10,234
|
|
3,986
|
|
6,248
|
|
—
|
|
||||||||||
|
Lebanon/Legacy Center
|
3,913
|
|
7,874
|
|
99
|
|
3,913
|
|
7,973
|
|
11,886
|
|
5,344
|
|
6,542
|
|
—
|
|
||||||||||
|
Littleton Square
|
2,030
|
|
8,859
|
|
(3,887
|
)
|
2,409
|
|
4,593
|
|
7,002
|
|
1,689
|
|
5,313
|
|
—
|
|
||||||||||
|
Lloyd King
|
1,779
|
|
10,060
|
|
1,168
|
|
1,779
|
|
11,228
|
|
13,007
|
|
5,551
|
|
7,456
|
|
—
|
|
||||||||||
129
|
REGENCY CENTERS CORPORATION AND REGENCY CENTERS, L.P.
Schedule III - Consolidated Real Estate and Accumulated Depreciation December 31, 2016 (in thousands) |
||||||||||||||||||||||||||||
|
Initial Cost
|
Total Cost
|
Net Cost
|
||||||||||||||||||||||||||
|
Shopping Centers
(1)
|
Land
|
Building & Improvements
|
Cost Capitalized
Subsequent to
Acquisition
(2)
|
Land
|
Building & Improvements
|
Total
|
Accumulated Depreciation
|
Net of Accumulated Depreciation
|
Mortgages
|
|||||||||||||||||||
|
Loehmanns Plaza California
|
5,420
|
|
9,450
|
|
1,149
|
|
5,420
|
|
10,599
|
|
16,019
|
|
5,095
|
|
10,924
|
|
—
|
|
||||||||||
|
Lower Nazareth Commons
|
15,992
|
|
12,964
|
|
1,985
|
|
16,343
|
|
14,598
|
|
30,941
|
|
6,446
|
|
24,495
|
|
—
|
|
||||||||||
|
Market at Colonnade Center
|
6,455
|
|
9,839
|
|
69
|
|
6,160
|
|
10,203
|
|
16,363
|
|
2,853
|
|
13,510
|
|
—
|
|
||||||||||
|
Market at Preston Forest
|
4,400
|
|
11,445
|
|
1,179
|
|
4,400
|
|
12,624
|
|
17,024
|
|
6,044
|
|
10,980
|
|
—
|
|
||||||||||
|
Market at Round Rock
|
2,000
|
|
9,676
|
|
6,402
|
|
2,000
|
|
16,078
|
|
18,078
|
|
7,910
|
|
10,168
|
|
—
|
|
||||||||||
|
Market Common Clarendon
|
154,932
|
|
126,328
|
|
—
|
|
154,932
|
|
126,328
|
|
281,260
|
|
3,098
|
|
278,162
|
|
—
|
|
||||||||||
|
Marketplace Shopping Center
|
1,287
|
|
5,509
|
|
5,469
|
|
1,330
|
|
10,935
|
|
12,265
|
|
5,695
|
|
6,570
|
|
—
|
|
||||||||||
|
Marketplace at Briargate
|
1,706
|
|
4,885
|
|
62
|
|
1,727
|
|
4,926
|
|
6,653
|
|
2,303
|
|
4,350
|
|
—
|
|
||||||||||
|
Millhopper Shopping Center
|
1,073
|
|
5,358
|
|
5,136
|
|
1,796
|
|
9,771
|
|
11,567
|
|
6,302
|
|
5,265
|
|
—
|
|
||||||||||
|
Mockingbird Commons
|
3,000
|
|
10,728
|
|
972
|
|
3,000
|
|
11,700
|
|
14,700
|
|
5,643
|
|
9,057
|
|
10,300
|
|
||||||||||
|
Monument Jackson Creek
|
2,999
|
|
6,765
|
|
679
|
|
2,999
|
|
7,444
|
|
10,443
|
|
5,202
|
|
5,241
|
|
—
|
|
||||||||||
|
Morningside Plaza
|
4,300
|
|
13,951
|
|
725
|
|
4,300
|
|
14,676
|
|
18,976
|
|
7,004
|
|
11,972
|
|
—
|
|
||||||||||
|
Murryhill Marketplace
|
2,670
|
|
18,401
|
|
12,441
|
|
2,858
|
|
30,654
|
|
33,512
|
|
9,908
|
|
23,604
|
|
—
|
|
||||||||||
|
Naples Walk
|
18,173
|
|
13,554
|
|
696
|
|
18,173
|
|
14,250
|
|
32,423
|
|
5,059
|
|
27,364
|
|
—
|
|
||||||||||
|
Newberry Square
|
2,412
|
|
10,150
|
|
516
|
|
2,412
|
|
10,666
|
|
13,078
|
|
7,594
|
|
5,484
|
|
—
|
|
||||||||||
|
Newland Center
|
12,500
|
|
10,697
|
|
7,738
|
|
15,777
|
|
15,158
|
|
30,935
|
|
6,169
|
|
24,766
|
|
—
|
|
||||||||||
|
Nocatee Town Center
|
10,124
|
|
8,691
|
|
670
|
|
8,695
|
|
10,790
|
|
19,485
|
|
3,489
|
|
15,996
|
|
—
|
|
||||||||||
|
North Hills
|
4,900
|
|
19,774
|
|
1,146
|
|
4,900
|
|
20,920
|
|
25,820
|
|
10,006
|
|
15,814
|
|
—
|
|
||||||||||
|
Northgate Marketplace
|
5,668
|
|
13,727
|
|
(101
|
)
|
4,995
|
|
14,299
|
|
19,294
|
|
3,337
|
|
15,957
|
|
—
|
|
||||||||||
|
Northgate Plaza (Maxtown Road)
|
1,769
|
|
6,652
|
|
266
|
|
1,769
|
|
6,918
|
|
8,687
|
|
3,873
|
|
4,814
|
|
—
|
|
||||||||||
|
Northgate Square
|
5,011
|
|
8,692
|
|
908
|
|
5,011
|
|
9,600
|
|
14,611
|
|
3,278
|
|
11,333
|
|
—
|
|
||||||||||
|
Northlake Village
|
2,662
|
|
11,284
|
|
1,411
|
|
2,686
|
|
12,671
|
|
15,357
|
|
5,792
|
|
9,565
|
|
—
|
|
||||||||||
|
Oak Shade Town Center
|
6,591
|
|
28,966
|
|
554
|
|
6,591
|
|
29,520
|
|
36,111
|
|
5,798
|
|
30,313
|
|
8,695
|
|
||||||||||
|
Oakbrook Plaza
|
4,000
|
|
6,668
|
|
415
|
|
4,000
|
|
7,083
|
|
11,083
|
|
3,419
|
|
7,664
|
|
—
|
|
||||||||||
|
Oakleaf Commons
|
3,503
|
|
11,671
|
|
3,048
|
|
6,242
|
|
11,980
|
|
18,222
|
|
4,916
|
|
13,306
|
|
—
|
|
||||||||||
|
Ocala Corners
|
1,816
|
|
10,515
|
|
456
|
|
1,816
|
|
10,971
|
|
12,787
|
|
2,717
|
|
10,070
|
|
4,615
|
|
||||||||||
|
Old St Augustine Plaza
|
2,368
|
|
11,405
|
|
(529
|
)
|
2,368
|
|
10,876
|
|
13,244
|
|
5,853
|
|
7,391
|
|
—
|
|
||||||||||
|
Paces Ferry Plaza
|
2,812
|
|
12,639
|
|
1,316
|
|
2,812
|
|
13,955
|
|
16,767
|
|
8,469
|
|
8,298
|
|
—
|
|
||||||||||
|
Panther Creek
|
14,414
|
|
14,748
|
|
3,368
|
|
15,212
|
|
17,318
|
|
32,530
|
|
11,184
|
|
21,346
|
|
—
|
|
||||||||||
|
Peartree Village
|
5,197
|
|
19,746
|
|
863
|
|
5,197
|
|
20,609
|
|
25,806
|
|
11,052
|
|
14,754
|
|
6,153
|
|
||||||||||
|
Persimmons Place
|
25,975
|
|
37,965
|
|
—
|
|
26,619
|
|
37,321
|
|
63,940
|
|
3,234
|
|
60,706
|
|
—
|
|
||||||||||
|
Pike Creek
|
5,153
|
|
20,652
|
|
1,632
|
|
5,251
|
|
22,186
|
|
27,437
|
|
11,095
|
|
16,342
|
|
—
|
|
||||||||||
130
|
REGENCY CENTERS CORPORATION AND REGENCY CENTERS, L.P.
Schedule III - Consolidated Real Estate and Accumulated Depreciation December 31, 2016 (in thousands) |
||||||||||||||||||||||||||||
|
Initial Cost
|
Total Cost
|
Net Cost
|
||||||||||||||||||||||||||
|
Shopping Centers
(1)
|
Land
|
Building & Improvements
|
Cost Capitalized
Subsequent to
Acquisition
(2)
|
Land
|
Building & Improvements
|
Total
|
Accumulated Depreciation
|
Net of Accumulated Depreciation
|
Mortgages
|
|||||||||||||||||||
|
Pine Lake Village
|
6,300
|
|
10,991
|
|
871
|
|
6,300
|
|
11,862
|
|
18,162
|
|
5,798
|
|
12,364
|
|
—
|
|
||||||||||
|
Pine Tree Plaza
|
668
|
|
6,220
|
|
590
|
|
668
|
|
6,810
|
|
7,478
|
|
3,247
|
|
4,231
|
|
—
|
|
||||||||||
|
Plaza Hermosa
|
4,200
|
|
10,109
|
|
3,159
|
|
4,202
|
|
13,266
|
|
17,468
|
|
5,516
|
|
11,952
|
|
13,800
|
|
||||||||||
|
Powell Street Plaza
|
8,248
|
|
30,716
|
|
2,532
|
|
8,248
|
|
33,248
|
|
41,496
|
|
13,533
|
|
27,963
|
|
—
|
|
||||||||||
|
Powers Ferry Square
|
3,687
|
|
17,965
|
|
6,503
|
|
5,345
|
|
22,810
|
|
28,155
|
|
13,538
|
|
14,617
|
|
—
|
|
||||||||||
|
Powers Ferry Village
|
1,191
|
|
4,672
|
|
518
|
|
1,191
|
|
5,190
|
|
6,381
|
|
3,407
|
|
2,974
|
|
—
|
|
||||||||||
|
Prairie City Crossing
|
4,164
|
|
13,032
|
|
493
|
|
4,164
|
|
13,525
|
|
17,689
|
|
5,518
|
|
12,171
|
|
—
|
|
||||||||||
|
Prestonbrook
|
7,069
|
|
8,622
|
|
568
|
|
7,069
|
|
9,190
|
|
16,259
|
|
6,247
|
|
10,012
|
|
6,800
|
|
||||||||||
|
Preston Oaks
|
763
|
|
30,438
|
|
443
|
|
763
|
|
30,881
|
|
31,644
|
|
3,404
|
|
28,240
|
|
—
|
|
||||||||||
|
Red Bank
|
10,336
|
|
9,505
|
|
(89
|
)
|
10,110
|
|
9,642
|
|
19,752
|
|
2,274
|
|
17,478
|
|
—
|
|
||||||||||
|
Regency Commons
|
3,917
|
|
3,616
|
|
236
|
|
3,917
|
|
3,852
|
|
7,769
|
|
2,173
|
|
5,596
|
|
—
|
|
||||||||||
|
Regency Square
|
4,770
|
|
25,191
|
|
5,200
|
|
5,060
|
|
30,101
|
|
35,161
|
|
21,946
|
|
13,215
|
|
—
|
|
||||||||||
|
Rona Plaza
|
1,500
|
|
4,917
|
|
225
|
|
1,500
|
|
5,142
|
|
6,642
|
|
2,731
|
|
3,911
|
|
—
|
|
||||||||||
|
Russell Ridge
|
2,234
|
|
6,903
|
|
1,396
|
|
2,234
|
|
8,299
|
|
10,533
|
|
4,534
|
|
5,999
|
|
—
|
|
||||||||||
|
Sammamish-Highlands
|
9,300
|
|
8,075
|
|
8,000
|
|
9,592
|
|
15,783
|
|
25,375
|
|
6,352
|
|
19,023
|
|
—
|
|
||||||||||
|
San Leandro Plaza
|
1,300
|
|
8,226
|
|
558
|
|
1,300
|
|
8,784
|
|
10,084
|
|
4,065
|
|
6,019
|
|
—
|
|
||||||||||
|
Sandy Springs
|
6,889
|
|
28,056
|
|
2,195
|
|
6,889
|
|
30,251
|
|
37,140
|
|
4,213
|
|
32,927
|
|
—
|
|
||||||||||
|
Saugus
|
19,201
|
|
17,984
|
|
(342
|
)
|
18,811
|
|
18,032
|
|
36,843
|
|
7,373
|
|
29,470
|
|
—
|
|
||||||||||
|
Sequoia Station
|
9,100
|
|
18,356
|
|
1,632
|
|
9,100
|
|
19,988
|
|
29,088
|
|
9,166
|
|
19,922
|
|
21,100
|
|
||||||||||
|
Sherwood II
|
2,731
|
|
6,360
|
|
646
|
|
2,731
|
|
7,006
|
|
9,737
|
|
2,668
|
|
7,069
|
|
—
|
|
||||||||||
|
Shoppes @ 104
|
11,193
|
|
—
|
|
850
|
|
6,652
|
|
5,391
|
|
12,043
|
|
1,888
|
|
10,155
|
|
—
|
|
||||||||||
|
Shoppes of Grande Oak
|
5,091
|
|
5,985
|
|
276
|
|
5,091
|
|
6,261
|
|
11,352
|
|
4,606
|
|
6,746
|
|
—
|
|
||||||||||
|
Shops at Arizona
|
3,063
|
|
3,243
|
|
(4,276
|
)
|
881
|
|
1,149
|
|
2,030
|
|
168
|
|
1,862
|
|
—
|
|
||||||||||
|
Shops at County Center
|
9,957
|
|
11,296
|
|
914
|
|
10,254
|
|
11,913
|
|
22,167
|
|
7,090
|
|
15,077
|
|
—
|
|
||||||||||
|
Shops at Erwin Mill
|
9,082
|
|
6,124
|
|
(7
|
)
|
9,082
|
|
6,117
|
|
15,199
|
|
1,250
|
|
13,949
|
|
10,000
|
|
||||||||||
|
Shops at Johns Creek
|
1,863
|
|
2,014
|
|
(342
|
)
|
1,501
|
|
2,034
|
|
3,535
|
|
1,141
|
|
2,394
|
|
—
|
|
||||||||||
|
Shops at Mira Vista
|
11,691
|
|
9,026
|
|
52
|
|
11,691
|
|
9,078
|
|
20,769
|
|
1,065
|
|
19,704
|
|
242
|
|
||||||||||
|
Shops at Quail Creek
|
1,487
|
|
7,717
|
|
449
|
|
1,458
|
|
8,195
|
|
9,653
|
|
2,821
|
|
6,832
|
|
—
|
|
||||||||||
|
Shops on Main
|
17,020
|
|
27,055
|
|
31
|
|
17,064
|
|
27,042
|
|
44,106
|
|
4,031
|
|
40,075
|
|
—
|
|
||||||||||
|
South Bay Village
|
11,714
|
|
15,580
|
|
1,382
|
|
11,776
|
|
16,900
|
|
28,676
|
|
2,750
|
|
25,926
|
|
—
|
|
||||||||||
|
Southcenter
|
1,300
|
|
12,750
|
|
1,427
|
|
1,300
|
|
14,177
|
|
15,477
|
|
6,503
|
|
8,974
|
|
—
|
|
||||||||||
|
Southpark at Cinco Ranch
|
18,395
|
|
11,306
|
|
5,867
|
|
21,146
|
|
14,422
|
|
35,568
|
|
3,045
|
|
32,523
|
|
—
|
|
||||||||||
131
|
REGENCY CENTERS CORPORATION AND REGENCY CENTERS, L.P.
Schedule III - Consolidated Real Estate and Accumulated Depreciation December 31, 2016 (in thousands) |
||||||||||||||||||||||||||||
|
Initial Cost
|
Total Cost
|
Net Cost
|
||||||||||||||||||||||||||
|
Shopping Centers
(1)
|
Land
|
Building & Improvements
|
Cost Capitalized
Subsequent to
Acquisition
(2)
|
Land
|
Building & Improvements
|
Total
|
Accumulated Depreciation
|
Net of Accumulated Depreciation
|
Mortgages
|
|||||||||||||||||||
|
SouthPoint Crossing
|
4,412
|
|
12,235
|
|
720
|
|
4,382
|
|
12,985
|
|
17,367
|
|
5,910
|
|
11,457
|
|
—
|
|
||||||||||
|
Starke
|
71
|
|
1,683
|
|
5
|
|
71
|
|
1,688
|
|
1,759
|
|
685
|
|
1,074
|
|
—
|
|
||||||||||
|
Sterling Ridge
|
12,846
|
|
12,162
|
|
645
|
|
12,846
|
|
12,807
|
|
25,653
|
|
8,697
|
|
16,956
|
|
13,900
|
|
||||||||||
|
Stonewall
|
27,511
|
|
22,123
|
|
7,212
|
|
28,429
|
|
28,417
|
|
56,846
|
|
13,637
|
|
43,209
|
|
—
|
|
||||||||||
|
Strawflower Village
|
4,060
|
|
8,084
|
|
579
|
|
4,060
|
|
8,663
|
|
12,723
|
|
4,345
|
|
8,378
|
|
—
|
|
||||||||||
|
Stroh Ranch
|
4,280
|
|
8,189
|
|
451
|
|
4,280
|
|
8,640
|
|
12,920
|
|
5,732
|
|
7,188
|
|
—
|
|
||||||||||
|
Suncoast Crossing
|
9,030
|
|
10,764
|
|
4,449
|
|
13,374
|
|
10,869
|
|
24,243
|
|
4,960
|
|
19,283
|
|
—
|
|
||||||||||
|
Tanasbourne Market
|
3,269
|
|
10,861
|
|
(297
|
)
|
3,269
|
|
10,564
|
|
13,833
|
|
4,054
|
|
9,779
|
|
—
|
|
||||||||||
|
Tassajara Crossing
|
8,560
|
|
15,464
|
|
1,025
|
|
8,560
|
|
16,489
|
|
25,049
|
|
7,596
|
|
17,453
|
|
19,800
|
|
||||||||||
|
Tech Ridge Center
|
12,945
|
|
37,169
|
|
(690
|
)
|
12,945
|
|
36,479
|
|
49,424
|
|
8,320
|
|
41,104
|
|
7,784
|
|
||||||||||
|
The Hub Hillcrest Market
|
18,773
|
|
61,906
|
|
4,488
|
|
19,610
|
|
65,557
|
|
85,167
|
|
7,825
|
|
77,342
|
|
—
|
|
||||||||||
|
Town Square
|
883
|
|
8,132
|
|
389
|
|
883
|
|
8,521
|
|
9,404
|
|
4,563
|
|
4,841
|
|
—
|
|
||||||||||
|
Twin City Plaza
|
17,245
|
|
44,225
|
|
1,854
|
|
17,263
|
|
46,061
|
|
63,324
|
|
13,945
|
|
49,379
|
|
—
|
|
||||||||||
|
Twin Peaks
|
5,200
|
|
25,827
|
|
1,038
|
|
5,200
|
|
26,865
|
|
32,065
|
|
12,270
|
|
19,795
|
|
—
|
|
||||||||||
|
University Commons
|
4,070
|
|
30,785
|
|
(2
|
)
|
4,070
|
|
30,783
|
|
34,853
|
|
1,717
|
|
33,136
|
|
37,532
|
|
||||||||||
|
Valencia Crossroads
|
17,921
|
|
17,659
|
|
582
|
|
17,921
|
|
18,241
|
|
36,162
|
|
14,473
|
|
21,689
|
|
—
|
|
||||||||||
|
Village at La Floresta
|
13,140
|
|
20,258
|
|
—
|
|
13,140
|
|
20,258
|
|
33,398
|
|
1,014
|
|
32,384
|
|
—
|
|
||||||||||
|
Village at Lee Airpark
|
11,099
|
|
12,968
|
|
3,421
|
|
12,014
|
|
15,474
|
|
27,488
|
|
6,527
|
|
20,961
|
|
—
|
|
||||||||||
|
Village Center
|
3,885
|
|
14,131
|
|
8,348
|
|
5,434
|
|
20,930
|
|
26,364
|
|
7,875
|
|
18,489
|
|
—
|
|
||||||||||
|
Walker Center
|
3,840
|
|
7,232
|
|
3,272
|
|
3,878
|
|
10,466
|
|
14,344
|
|
5,233
|
|
9,111
|
|
—
|
|
||||||||||
|
Welleby Plaza
|
1,496
|
|
7,787
|
|
1,107
|
|
1,496
|
|
8,894
|
|
10,390
|
|
6,587
|
|
3,803
|
|
—
|
|
||||||||||
|
Wellington Town Square
|
2,041
|
|
12,131
|
|
342
|
|
2,041
|
|
12,473
|
|
14,514
|
|
6,559
|
|
7,955
|
|
12,800
|
|
||||||||||
|
West Park Plaza
|
5,840
|
|
5,759
|
|
1,288
|
|
5,840
|
|
7,047
|
|
12,887
|
|
3,626
|
|
9,261
|
|
—
|
|
||||||||||
|
Westchase
|
5,302
|
|
8,273
|
|
505
|
|
5,302
|
|
8,778
|
|
14,080
|
|
2,930
|
|
11,150
|
|
6,623
|
|
||||||||||
|
Westchester Commons
|
3,366
|
|
11,751
|
|
10,870
|
|
4,894
|
|
21,093
|
|
25,987
|
|
5,681
|
|
20,306
|
|
—
|
|
||||||||||
|
Westchester Plaza
|
1,857
|
|
7,572
|
|
361
|
|
1,857
|
|
7,933
|
|
9,790
|
|
4,988
|
|
4,802
|
|
—
|
|
||||||||||
|
Westlake Plaza and Center
|
7,043
|
|
27,195
|
|
29,198
|
|
17,561
|
|
45,875
|
|
63,436
|
|
17,158
|
|
46,278
|
|
—
|
|
||||||||||
|
Westwood Village
|
19,933
|
|
25,301
|
|
(1,284
|
)
|
19,553
|
|
24,397
|
|
43,950
|
|
10,971
|
|
32,979
|
|
—
|
|
||||||||||
|
Willow Festival
|
1,954
|
|
56,501
|
|
1,187
|
|
1,954
|
|
57,688
|
|
59,642
|
|
11,078
|
|
48,564
|
|
39,505
|
|
||||||||||
|
Woodcroft Shopping Center
|
1,419
|
|
6,284
|
|
806
|
|
1,421
|
|
7,088
|
|
8,509
|
|
3,988
|
|
4,521
|
|
—
|
|
||||||||||
|
Woodman Van Nuy
|
5,500
|
|
7,195
|
|
257
|
|
5,500
|
|
7,452
|
|
12,952
|
|
3,534
|
|
9,418
|
|
—
|
|
||||||||||
|
Woodmen and Rangewood
|
7,621
|
|
11,018
|
|
609
|
|
7,621
|
|
11,627
|
|
19,248
|
|
9,934
|
|
9,314
|
|
—
|
|
||||||||||
132
|
REGENCY CENTERS CORPORATION AND REGENCY CENTERS, L.P.
Schedule III - Consolidated Real Estate and Accumulated Depreciation December 31, 2016 (in thousands) |
||||||||||||||||||||||||||||
|
Initial Cost
|
Total Cost
|
Net Cost
|
||||||||||||||||||||||||||
|
Shopping Centers
(1)
|
Land
|
Building & Improvements
|
Cost Capitalized
Subsequent to
Acquisition
(2)
|
Land
|
Building & Improvements
|
Total
|
Accumulated Depreciation
|
Net of Accumulated Depreciation
|
Mortgages
|
|||||||||||||||||||
|
Woodside Central
|
3,500
|
|
9,288
|
|
610
|
|
3,500
|
|
9,898
|
|
13,398
|
|
4,604
|
|
8,794
|
|
—
|
|
||||||||||
|
Total Corporate Assets
|
—
|
|
—
|
|
1,677
|
|
—
|
|
1,678
|
|
1,678
|
|
1,562
|
|
116
|
|
—
|
|
||||||||||
|
Land held for future development
|
23,202
|
|
—
|
|
—
|
|
23,202
|
|
—
|
|
23,202
|
|
54
|
|
23,148
|
|
—
|
|
||||||||||
|
Properties in Development
|
—
|
|
—
|
|
180,878
|
|
5,331
|
|
175,547
|
|
180,878
|
|
863
|
|
180,015
|
|
—
|
|
||||||||||
|
$
|
1,620,365
|
|
2,790,644
|
|
522,490
|
|
1,665,755
|
|
3,267,744
|
|
4,933,499
|
|
1,124,391
|
|
3,809,108
|
|
467,093
|
|
||||||||||
(1)
See Item 2,
Properties
for geographic location and year each operating property was acquired.
(2)
The negative balance for costs capitalized subsequent to acquisition could include out-parcels sold, provision for loss recorded, and demolition of part of the property for redevelopment.
See accompanying report of independent registered public accounting firm.
133
REGENCY CENTERS CORPORATION AND REGENCY CENTERS, L.P.
Schedule III - Consolidated Real Estate and Accumulated Depreciation, continued
December 31, 2016
(in thousands)
Depreciation and amortization of the Company's investment in buildings and improvements reflected in the statements of operations is calculated over the estimated useful lives of the assets, which are up to
40
years. The aggregate cost for federal income tax purposes was approximately
$5.1 billion
at
December 31, 2016
.
The changes in total real estate assets for the years ended
December 31, 2016
,
2015
, and
2014
are as follows (in thousands):
|
2016
|
2015
|
2014
|
||||||||
|
Beginning balance
|
$
|
4,545,900
|
|
4,409,886
|
|
4,026,531
|
|
|||
|
Acquired properties
|
370,010
|
|
39,850
|
|
274,091
|
|
||||
|
Developments and improvements
|
148,904
|
|
174,972
|
|
191,250
|
|
||||
|
Sale of properties
|
(126,855
|
)
|
(78,808
|
)
|
(81,811
|
)
|
||||
|
Provision for impairment
|
(4,460
|
)
|
—
|
|
(175
|
)
|
||||
|
Ending balance
|
$
|
4,933,499
|
|
4,545,900
|
|
4,409,886
|
|
|||
The changes in accumulated depreciation for the years ended
December 31, 2016
,
2015
, and
2014
are as follows (in thousands):
|
2016
|
2015
|
2014
|
||||||||
|
Beginning balance
|
$
|
1,043,787
|
|
933,708
|
|
844,873
|
|
|||
|
Depreciation expense
|
115,355
|
|
119,475
|
|
108,692
|
|
||||
|
Sale of properties
|
(32,791
|
)
|
(9,396
|
)
|
(19,857
|
)
|
||||
|
Provision for impairment
|
(1,960
|
)
|
—
|
|
—
|
|
||||
|
Ending balance
|
$
|
1,124,391
|
|
1,043,787
|
|
933,708
|
|
|||
See accompanying report of independent registered public accounting firm.
134
None.
Controls and Procedures (Regency Centers Corporation)
Conclusion Regarding the Effectiveness of Disclosure Controls and Procedures
Under the supervision and with the participation of the Parent Company's management, including its chief executive officer and chief financial officer, the Parent Company conducted an evaluation of its disclosure controls and procedures, as such term is defined under Rule 13a-15(e) and 15d-15(e) promulgated under the Securities Exchange Act of 1934, as amended (the "Exchange Act"). Based on this evaluation, the Parent Company's chief executive officer and chief financial officer concluded that its disclosure controls and procedures were effective as of the end of the period covered by this annual report on Form 10-K to ensure information required to be disclosed in the reports filed or submitted under the Exchange Act is recorded, processed, summarized and reported, within the time period specified in the SEC's rules and forms. These disclosure controls and procedures include controls and procedures designed to ensure that information required to be disclosed by the Parent Company in the reports it files or submits is accumulated and communicated to management, including its chief executive officer and chief financial officer, as appropriate, to allow timely decisions regarding required disclosure.
Management's Report on Internal Control over Financial Reporting
The Parent Company's management is responsible for establishing and maintaining adequate internal control over financial reporting, as such term is defined in Exchange Act Rules 13a-15(f) and 15d-15(f). Under the supervision and with the participation of its management, including its chief executive officer and chief financial officer, the Parent Company conducted an evaluation of the effectiveness of its internal control over financial reporting based on the framework in
Internal Control - Integrated Framework
issued by the Committee of Sponsoring Organizations of the Treadway Commission. Based on its evaluation under the framework in
Internal Control - Integrated Framework (2013)
, the Parent Company's management concluded that its internal control over financial reporting was effective as of
December 31, 2016
.
KPMG LLP, an independent registered public accounting firm, has audited the consolidated financial statements included in this annual report on Form 10-K and, as part of their audit, has issued a report, included herein, on the effectiveness of the Parent Company's internal control over financial reporting.
The Parent Company's system of internal control over financial reporting was designed to provide reasonable assurance regarding the preparation and fair presentation of published financial statements in accordance with accounting principles generally accepted in the United States. All internal control systems, no matter how well designed, have inherent limitations. Therefore, even those systems determined to be effective can provide only reasonable assurance and may not prevent or detect misstatements. Also, projections of any evaluation of effectiveness to future periods are subject to the risk that controls may become inadequate because of changes in conditions, or that the degree of compliance with the policies or procedures may deteriorate.
Changes in Internal Controls
There have been no changes in the Parent Company's internal controls over financial reporting identified in connection with this evaluation that occurred during the fourth quarter of
2016
and that have materially affected, or are reasonably likely to materially affect, its internal controls over financial reporting.
Controls and Procedures (Regency Centers, L.P.)
Conclusion Regarding the Effectiveness of Disclosure Controls and Procedures
Under the supervision and with the participation of the Operating Partnership's management, including the chief executive officer and chief financial officer of its general partner, the Operating Partnership conducted an evaluation of its disclosure controls and procedures, as such term is defined under Rule 13a-15(e) and 15d-15(e) promulgated under the Exchange Act. Based on this evaluation, the chief executive officer and chief financial officer of its general partner concluded that its disclosure controls and procedures were effective as of the end of the period covered by this annual report on Form 10-K to ensure information required to be disclosed in the reports filed or submitted under the Exchange Act is recorded, processed, summarized and reported, within the time period specified in the SEC's rules and forms. These disclosure controls and procedures include controls and procedures designed to ensure that information required to be disclosed by the Operating Partnership in the reports it files or submits is accumulated and communicated to management, including the chief executive officer and chief financial officer of its general partner, as appropriate, to allow timely decisions regarding required disclosure.
135
Management's Report on Internal Control over Financial Reporting
The Operating Partnership's management is responsible for establishing and maintaining adequate internal control over financial reporting, as such term is defined in Exchange Act Rules 13a-15(f) and 15d-15(f). Under the supervision and with the participation of its management, including the chief executive officer and chief financial officer of its general partner, the Operating Partnership conducted an evaluation of the effectiveness of its internal control over financial reporting based on the framework in
Internal Control - Integrated Framework
issued by the Committee of Sponsoring Organizations of the Treadway Commission. Based on its evaluation under the framework in
Internal Control - Integrated Framework (2013)
, the Operating Partnership's management concluded that its internal control over financial reporting was effective as of
December 31, 2016
.
KPMG LLP, an independent registered public accounting firm, has audited the consolidated financial statements included in this annual report on Form 10-K and, as part of their audit, has issued a report, included herein, on the effectiveness of the Operating Partnership's internal control over financial reporting.
The Operating Partnership's system of internal control over financial reporting was designed to provide reasonable assurance regarding the preparation and fair presentation of published financial statements in accordance with accounting principles generally accepted in the United States. All internal control systems, no matter how well designed, have inherent limitations. Therefore, even those systems determined to be effective can provide only reasonable assurance and may not prevent or detect misstatements. Also, projections of any evaluation of effectiveness to future periods are subject to the risk that controls may become inadequate because of changes in conditions, or that the degree of compliance with the policies or procedures may deteriorate.
Changes in Internal Controls
There have been no changes in the Operating Partnership's internal controls over financial reporting identified in connection with this evaluation that occurred during the fourth quarter of
2016
and that have materially affected, or are reasonably likely to materially affect, its internal controls over financial reporting.
Not applicable
Information concerning our directors, executive officers, and corporate governance is incorporated herein by reference to our definitive proxy statement to be filed with the Securities and Exchange Commission within 120 days after the end of the fiscal year covered by this Form 10-K with respect to the
2017
Annual Meeting of Stockholders. Information regarding executive officers is included in Part I of this Form 10-K as permitted by General Instruction G(3).
Code of Ethics.
We have adopted a code of ethics applicable to our Board of Directors, principal executive officers, principal financial officer, principal accounting officer and persons performing similar functions. The text of this code of ethics may be found on our web site at www.regencycenters.com. We intend to post a notice of any waiver from, or amendment to, any provision of our code of ethics on our web site.
136
Incorporated herein by reference to our definitive proxy statement to be filed with the Securities and Exchange Commission within 120 days after the end of the fiscal year covered by this Form 10-K with respect to the
2017
Annual Meeting of Stockholders.
|
Item 12.
|
Security Ownership of Certain Beneficial Owners and Management and Related Stockholder Matters
|
Equity Compensation Plan Information
|
(a)
|
(b)
|
(c)
|
||||||||
|
Plan Category
|
Number of securities to be issued upon exercise of outstanding options, warrants and rights
(1)
|
Weighted-average exercise price of outstanding options, warrants and rights
(2)
|
Number of securities remaining available for future issuance under equity compensation plans (excluding securities reflected in column a)
(3)
|
|||||||
|
Equity compensation plans
approved by security holders
|
8,740
|
|
$
|
88.45
|
|
1,787,149
|
|
|||
|
Equity compensation plans not approved by security holders
|
N/A
|
N/A
|
N/A
|
|||||||
|
Total
|
8,740
|
|
$
|
88.45
|
|
1,787,149
|
|
|||
(1)
This column does not include
561,261
shares that may be issued pursuant to unvested restricted stock and performance share awards.
(2)
The weighted average exercise price excludes stock rights awards, which we sometimes refer to as unvested restricted stock.
(3)
The Regency Centers Corporation 2011 Omnibus Incentive Plan, (“Omnibus Plan”), as approved by stockholders at our 2011 annual meeting, provides that an aggregate maximum of 4.1 million shares of our common stock are reserved for issuance under the Omnibus Plan.
Information about security ownership is incorporated herein by reference to our definitive proxy statement to be filed with the Securities and Exchange Commission within 120 days after the end of the fiscal year covered by this Form 10-K with respect to the
2017
Annual Meeting of Stockholders.
Incorporated herein by reference to our definitive proxy statement to be filed with the Securities and Exchange Commission within 120 days after the end of the fiscal year covered by this Form 10-K with respect to the
2017
Annual Meeting of Stockholders.
Item 14.
Principal Accountant Fees and Services
Incorporated herein by reference to our definitive proxy statement to be filed with the Securities and Exchange Commission within 120 days after the end of the fiscal year covered by this Form 10-K with respect to the
2017
Annual Meeting of Stockholders.
137
(a) Financial Statements and Financial Statement Schedules:
Regency Centers Corporation and Regency Centers, L.P.
2016
financial statements and financial statement schedule, together with the reports of KPMG LLP are listed on the index immediately preceding the financial statements in Item 8, Consolidated Financial Statements and Supplemental Data.
(b) Exhibits:
In reviewing the agreements included as exhibits to this report, please remember they are included to provide you with information regarding their terms and are not intended to provide any other factual or disclosure information about the Company, its subsidiaries or other parties to the agreements. The Agreements contain representations and warranties by each of the parties to the applicable agreement. These representations and warranties have been made solely for the benefit of the other parties to the applicable agreement and:
|
•
|
should not in all instances be treated as categorical statements of fact, but rather as a way of allocating the risk to one of the parties if those statements prove to be inaccurate;
|
|
•
|
have been qualified by disclosures that were made to the other party in connection with the negotiation of the applicable agreement, which disclosures are not necessarily reflected in the agreement;
|
|
•
|
may apply standards of materiality in a way that is different from what may be viewed as material to you or other investors; and
|
|
•
|
were made only as of the date of the applicable agreement or such other date or dates as may be specified in the agreement and are subject to more recent developments.
|
Accordingly, these representations and warranties may not describe the actual state of affairs as of the date they were made or at any other time. We acknowledge that, notwithstanding the inclusion of the foregoing cautionary statements, we are responsible for considering whether additional specific disclosures of material information regarding material contractual provisions are required to make the statements in this report not misleading. Additional information about the Company may be found elsewhere in this report and the Company's other public files, which are available without charge through the SEC's website at
http://www.sec.gov
.
Unless otherwise indicated below, the Commission file number to the exhibit is No. 001-12298.
1. Underwriting Agreement
|
(a)
|
Equity Distribution Agreement (the “Wells Agreement”) among the Company, Regency Centers, L.P. and Wells Fargo Securities, LLC dated August 10, 2012 (incorporated by reference to Exhibit 1.1 to the Company's report on Form 8-K filed on August 10, 2012), as amended by Amendment No. 1 dated August 6, 2013 (incorporated by reference to Exhibit 1.2 to the Company’s report on Form 8-K filed on August 6, 2013), Amendment No. 2 dated March 4, 2014 (incorporated by reference to Exhibit 1.1 to the Company’s report on Form 8-K filed on March 4, 2014) and Amendment No. 3 dated February 24, 2015 (incorporated by reference to Exhibit 1(a) to the Company’s Form 10-Q filed on May 7, 2015).
|
The Equity Distribution Agreements listed below are substantially identical in all material respects to the Wells Agreement, except for the identities of the parties, and have not been filed as exhibits to the Company's 1934 Act reports pursuant to Instruction 2 to Item 601 of Regulation S-K:
|
(i)
|
Equity Distribution Agreement among the Company, Regency Centers, L.P. and Merrill Lynch, Pierce, Fenner & Smith Incorporated dated August 10, 2012, as amended by Amendment Nos. 1, 2, and 3; and
|
|
(ii)
|
Equity Distribution Agreement among the Company, Regency Centers, L.P. and J.P. Morgan Securities LLC dated August 10, 2012, as amended by Amendment Nos. 1, 2, and 3.
|
|
(b)
|
Equity Distribution Agreement (the “Jefferies Agreement”) among the Company, Regency Centers, L.P. and Jefferies LLC dated August 6, 2013 (incorporated by reference to Exhibit 1.1 to the Company's report on Form 8-K filed on August 6, 2013), as amended by Amendment No. 1 dated March 4, 2014 (incorporated by
|
138
reference to the Company’s Form 8-K filed on March 4, 2014) and Amendment No. 2 (incorporated by reference to Exhibit 1(b) to the Company’s Form 10-Q filed on May 7, 2015).
The Equity Distribution Agreements listed below is substantially identical in all material respects to the Jefferies Agreement except for the identities of the parties, and has not been filed as an exhibit to the Company's 1934 Act reports pursuant to Instruction 2 to Item 601 of Regulation S-K:
|
(i)
|
Equity Distribution Agreement among the Company, Regency Centers, L.P. and RBC Capital Markets, LLC dated August 6, 2013 as amended by Amendment No. 1 dated March 4, 2014 and Amendment No. 2 dated February 24, 2015.
|
2. Plan of Acquisition, Reorganization, Arrangement, Liquidation or Succession
|
(a)
|
Agreement and Plan of Merger, dated as of November 14, 2016, by and between Regency and Equity One (incorporated by reference to Exhibit 2.1 to the Company’s Form 8-K filed on November 15, 2016) (Schedules and exhibits omitted pursuant to Item 601(b)(2) of Regulation S-K. The Company agrees to supplementally furnish to the Securities and Exchange Commission upon request any omitted schedule or exhibit to the Merger Agreement.)
|
3. Articles of Incorporation and Bylaws
|
(a)
|
Restated Articles of Incorporation of Regency Centers Corporation (incorporated by reference to Exhibit 3.1 to the Company's Form 8-K filed on June 5, 2013).
|
|
(b)
|
Amended and Restated Bylaws of Regency Centers Corporation (incorporated by reference to Exhibit 3.1 to the Company's Form 8-K filed on April 21, 2016).
|
|
(c)
|
Fourth Amended and Restated Certificate of Limited Partnership of Regency Centers, L.P. (incorporated by reference to Exhibit 3(a) to Regency Centers, L.P.'s Form 10-K filed on March 17, 2009).
|
|
(d)
|
Fifth Amended and Restated Agreement of Limited Partnership of Regency Centers, L.P., (incorporated by reference to Exhibit 3(d) to the Company's Form 10-K filed on February 19, 2014).
|
4. Instruments Defining Rights of Security Holders
|
(a)
|
See Exhibits 3(a) and 3(b) for provisions of the Articles of Incorporation and Bylaws of the Company defining the rights of security holders. See Exhibits 3(c) and 3(d) for provisions of the Partnership Agreement of Regency Centers, L.P. defining rights of security holders.
|
|
(b)
|
Indenture dated December 5, 2001 between Regency Centers, L.P., the guarantors named therein and First Union National Bank, as trustee (incorporated by reference to Exhibit 4.4 to Regency Centers, L.P.'s Form 8-K filed on December 10, 2001).
|
|
(i)
|
First Supplemental Indenture dated as of June 5, 2007 among Regency Centers, L.P., the Company as guarantor and U.S. Bank National Association, as successor to Wachovia Bank, National Association (formerly known as First Union National Bank), as trustee (incorporated by reference to Exhibit 4.1 to Regency Centers, L.P.'s Form 8-K filed on June 5, 2007).
|
|
(ii)
|
Second Supplemental Indenture dated as of June 2, 2010 to the Indenture dated as of December 5, 2001 between Regency Centers, L.P., Regency Centers Corporation, as guarantor, and U.S. Bank National Association, as successor to Wachovia Bank, National Association (formerly known as First Union National Bank), as Trustee incorporated by reference to Exhibit 4.1 to the Company’s Form 8-K filed on June 3, 2010).
|
|
(iii)
|
Third Supplemental Indenture dated as of August 17, 2015 to the Indenture dated as of December 5, 2001 among Regency Centers, L.P., Regency Centers Corporation, as guarantor, and U.S. Bank, National Association, as trustee (incorporated by reference to Exhibit 4.1 to the Company’s Form 8-K filed on August 18, 2015).
|
139
|
(iv)
|
Fourth Supplemental Indenture dated as of January 26, 2017 among Regency Centers, L.P., Regency Centers Corporation, as guarantor, and U.S. Bank National Association, as trustee (incorporated by reference to Exhibit 4.1 to the Company's Form 8-K filed on January 26, 2016).
|
10. Material Contracts (~ indicates management contract or compensatory plan)
|
~(a)
|
Regency Centers Corporation Long Term Omnibus Plan (incorporated by reference to Exhibit 10.9 to the Company's Form 10-Q filed on May 8, 2008).
|
|
~(i)
|
Form of Stock Rights Award Agreement pursuant to the Company's Long Term Omnibus Plan (incorporated by reference to Exhibit 10(b) to the Company's Form 10-K filed on March 10, 2006).
|
|
~(ii)
|
Form of 409A Amendment to Stock Rights Award Agreement (incorporated by reference to Exhibit 10(b)(i) to the Company's Form 10-K filed on March on 17, 2009).
|
|
~(iii)
|
Form of Nonqualified Stock Option Agreement pursuant to the Company's Long Term Omnibus Plan (incorporated by reference to Exhibit 10(c) to the Company's Form 10-K filed on March 10, 2006).
|
|
~(iv)
|
Form of 409A Amendment to Stock Option Agreement (incorporated by reference to Exhibit 10(c)(i) to the Company's Form 10-K filed on March 17, 2009).
|
|
~(v)
|
Amended and Restated Deferred Compensation Plan dated May 6, 2003 (incorporated by reference to Exhibit 10(k) to the Company's Form 10-K filed on March 12, 2004).
|
|
~(vi)
|
Regency Centers Corporation 2005 Deferred Compensation Plan (incorporated by reference to Exhibit 10(s) to the Company's Form 8-K filed on December 21, 2004).
|
|
~(vii)
|
First Amendment to Regency Centers Corporation 2005 Deferred Compensation Plan dated December 2005 (incorporated by reference to Exhibit 10(q)(i) to the Company's Form 10-K filed on March 10, 2006).
|
|
~(viii)
|
Second Amendment to the Regency Centers Corporation Amended and Restated Deferred Compensation Plan (incorporated by reference to Exhibit 10.2 to the Company's Form 8-K filed on June 13, 2011).
|
|
~(ix)
|
Third Amendment to the Regency Centers Corporation 2005 Deferred Compensation Plan (incorporated by reference to Exhibit 10.1 to the Company's Form 8-K filed on June 13, 2011).
|
|
~(b)
|
Regency Centers Corporation 2011 Omnibus Plan (incorporated by reference to Annex A to the Company's 2011 Annual Meeting Proxy Statement filed on March 24, 2011).
|
|
~(c)
|
Form of Director/Officer Indemnification Agreement (filed as an Exhibit to Pre-effective Amendment No. 2 to the Company's registration statement on Form S-11 filed on October 5, 1993 (33-67258), and incorporated by reference).
|
|
~(d)
|
Form of Amended and Restated Severance and Change of Control Agreement dated as of July 15, 2015 by and between the Company and Martin E. Stein, Jr. (incorporated by reference to Exhibit 10.1 of the Company's Form 8-K filed on July 20, 2015).
|
|
~(e)
|
Form of Amended and Restated Severance and Change of Control Agreement dated as of July 15, 2015 by and between the Company and Lisa Palmer (incorporated by reference to Exhibit 10.3 of the Company's Form 8-K filed on July 20, 2015).
|
140
|
~(f)
|
Form of Amended and Restated Severance and Change of Control Agreement dated as of July 15, 2015 by and between the Company and Dan M. Chandler, III (incorporated by reference to Exhibit 10.4 of the Company's Form 8-K filed on July 20, 2015).
|
|
~(g)
|
Form of Amended and Restated Severance and Change of Control Agreement dated as of July 15, 2015 by and between the Company and James D. Thompson (incorporated by reference to Exhibit 10.6 of the Company's Form 8-K filed on July 20, 2015).
|
|
(h)
|
Third Amended and Restated Credit Agreement dated as of September 7, 2011 by and among Regency Centers, , L.P., the Company, each of the financial institutions party thereto, and Wells Fargo Bank, National Association (incorporated by reference to Exhibit 10.1 to the Company's Form 10-Q filed on November 8, 2011).
|
|
(i)
|
First Amendment to Third Amended and Restated Credit Agreement dated September 13, 2012 (incorporated by reference to Exhibit 10.1 to the Company's Form 10-Q filed on November 9, 2012).
|
|
(ii)
|
Second Amendment to Third Amended and Restated Credit Agreement dated June 27, 2014 (incorporated by reference to Exhibit 10.1 to the Company's Form 10-Q filed on August 8, 2014).
|
|
(iii)
|
Third Amendment to Third Amended and Restated Credit Agreement dated May 13, 2015 (incorporated by reference to Exhibit 10.1 to the Company’s Form 8-K filed on May 18, 2015).
|
|
(i)
|
Term Loan Agreement dated as of November 17, 2011 by and among Regency Centers, L.P., the Company, each of the financial institutions party thereto and Wells Fargo Securities, LLC (incorporated by reference to Exhibit 10.1 to the Company's Form 10-K filed on February 29, 2012).
|
|
(i)
|
First Amendment to Term Loan Agreement dated as of June 19, 2012 (incorporated by reference to Exhibit 10(h)(i) to the Company's Form 10-K filed on March 1, 2013).
|
|
(ii)
|
Second Amendment to Term Loan Agreement dated as of December 19, 2012 (incorporated by reference to Exhibit 10(h)(ii) to the Company's Form 10-K filed on March 1, 2013).
|
|
(iii)
|
Third Amendment to Term Loan Agreement dated as of June 27, 2014 (incorporated by reference to Exhibit 10.2 to the Company's Form 10-Q filed on August 8, 2014).
|
|
(iv)
|
Fourth Amendment to Term Loan Agreement dated as of May 13, 2015 (incorporated by reference to Exhibit 10(j)(iv) to the Company's Form 10-K filed on February 18, 2016).
|
|
(v)
|
Fifth Amendment to Term Loan Agreement dated as of July 7, 2016 (incorporated by reference to exhibit 10.1 to the Company's Form 8-K filed on July 7, 2016).
|
|
(j)
|
Second Amended and Restated Limited Liability Company Agreement of Macquarie CountryWide-Regency II, LLC dated as of July 31, 2009 by and among Global Retail Investors, LLC, Regency Centers, L.P. and Macquarie CountryWide (US) No. 2 LLC (incorporated by reference to Exhibit 10.1 to the Company's Form 10-Q filed on November 6, 2009).
|
|
(i)
|
Amendment No. 1 to Second Amended and Restate Limited Liability Company Agreement of GRI-Regency, LLC (formerly Macquarie CountryWide-Regency II, LLC) (incorporated by reference to Exhibit 10.(h)(i) to the Company’s Form 10-K filed March 1, 2011).
|
|
(k)
|
The Forward Sale Agreement dated as of March 17, 2016 between Regency Centers Corporation and JPMorgan Chase Bank, National Association, London Branch (incorporated by reference to Exhibit 10.1 to the Company’s Form 8-K filed on March 21, 2016).
|
141
|
(l)
|
Voting Agreement, dated as of November 14, 2016, by and among Regency and the Gazelle Stockholders
(incorporated by reference to Exhibit 10.1 to the Company’s Form 8-K filed on November 15, 2016).
|
|
(m)
|
Governance Agreement, dated as of November 14, 2016, by and among Regency and the Gazelle Stockholders (incorporated by reference to Exhibit 10.2 to the Company’s Form 8-K filed on November 15, 2016).
|
12. Computation of ratios
12.1 Computation of Ratio of Earnings to Fixed Charges and Ratio of Combined Fixed Charges and Preference Dividends to Earnings
21. Subsidiaries of Regency Centers Corporation
23. Consents of Independent Accountants
23.1 Consent of KPMG LLP for Regency Centers Corporation.
23.2 Consent of KPMG LLP for Regency Centers, L.P.
31. Rule 13a-14(a)/15d-14(a) Certifications.
31.1 Rule 13a-14 Certification of Chief Executive Officer for Regency Centers Corporation.
31.2 Rule 13a-14 Certification of Chief Financial Officer for Regency Centers Corporation.
31.3 Rule 13a-14 Certification of Chief Executive Officer for Regency Centers, L.P.
31.4 Rule 13a-14 Certification of Chief Financial Officer for Regency Centers, L.P.
32. Section 1350 Certifications.
The certifications in this exhibit 32 are being furnished solely to accompany this report pursuant to 18 U.S.C. § 1350, and are not being filed for purposes of Section 18 of the Securities Exchange Act of 1934, as amended, and are not to be incorporated by reference into any of the Company's filings, whether made before or after the date hereof, regardless of any general incorporation language in such filing.
|
32.1
|
18 U.S.C. § 1350 Certification of Chief Executive Officer for Regency Centers Corporation.
|
|
32.2
|
18 U.S.C. § 1350 Certification of Chief Financial Officer for Regency Centers Corporation.
|
32.3 18 U.S.C. § 1350 Certification of Chief Executive Officer for Regency Centers, L.P.
32.4 18 U.S.C. § 1350 Certification of Chief Financial Officer for Regency Centers, L.P.
101. Interactive Data Files
101.INS+ XBRL Instance Document
101.SCH+ XBRL Taxonomy Extension Schema Document
101.CAL+ XBRL Taxonomy Extension Calculation Linkbase Document
101.DEF+ XBRL Taxonomy Definition Linkbase Document
101.LAB+ XBRL Taxonomy Extension Label Linkbase Document
101.PRE+ XBRL Taxonomy Extension Presentation Linkbase Document
__________________________
+ Submitted electronically with this Annual Report
142
SIGNATURES
Pursuant to the requirements of Section 13 or 15(d) of the Securities Exchange Act of 1934, the registrant has duly caused this report to be signed on its behalf by the undersigned, thereunto duly authorized.
|
February 27, 2017
|
REGENCY CENTERS CORPORATION
|
|
|
By:
|
/s/ Martin E. Stein, Jr.
Martin E. Stein. Jr., Chairman of the Board and Chief Executive Officer
|
|
|
February 27, 2017
|
REGENCY CENTERS, L.P.
|
|
|
By:
|
Regency Centers Corporation, General Partner
|
|
|
By:
|
/s/ Martin E. Stein, Jr.
Martin E. Stein. Jr., Chairman of the Board and Chief Executive Officer
|
|
143
Pursuant to the requirements of the Securities Exchange Act of 1934, this report has been signed below by the following persons on behalf of the registrant and in the capacities and on the dates indicated.
|
February 27, 2017
|
/s/ Martin E. Stein, Jr.
Martin E. Stein. Jr., Chairman of the Board and Chief Executive Officer
|
|
|
February 27, 2017
|
/s/ Lisa Palmer
Lisa Palmer, President and Chief Financial Officer (Principal Financial Officer)
|
|
|
February 27, 2017
|
/s/ J. Christian Leavitt
J. Christian Leavitt, Senior Vice President and Treasurer (Principal Accounting Officer)
|
|
|
February 27, 2017
|
/s/ Raymond L. Bank
Raymond L. Bank, Director
|
|
|
February 27, 2017
|
/s/ Bryce Blair
Bryce Blair, Director
|
|
|
February 27, 2017
|
/s/ C. Ronald Blankenship
C. Ronald Blankenship, Director
|
|
|
February 27, 2017
|
/s/ J. Dix Druce
J. Dix Druce, Director
|
|
|
February 27, 2017
|
/s/ Mary Lou Fiala
Mary Lou Fiala, Director
|
|
|
February 27, 2017
|
/s/ David P. O'Connor
David P. O'Connor, Director
|
|
|
February 27, 2017
|
/s/ John C. Schweitzer
John C. Schweitzer, Director
|
|
|
February 27, 2017
|
/s/ Thomas G. Wattles
Thomas G. Wattles, Director
|
|
144
TABLE OF CONTENTS
Part IItem 1. BusinessItem 1A. Risk FactorsItem 1B. Unresolved Staff CommentsItem 2. PropertiesItem 3. Legal ProceedingsItem 4. Mine Safety DisclosuresPart IIItem 5. Market For The Registrant's Common Equity, Related Stockholder Matters, and Issuer Purchases Of Equity SecuritiesItem 6. Selected Financial DataItem 7. Management S Discussion and Analysis Of Financial Condition and Results Of OperationsItem 7A. Quantitative and Qualitative Disclosures About Market RiskItem 8. Consolidated Financial Statements and Supplementary DataItem 9. Changes in and Disagreements with Accountants on Accounting and Financial DisclosureItem 9A. Controls and ProceduresItem 9B. Other InformationPart IIIItem 10. Directors, Executive Officers, and Corporate GovernanceItem 11. Executive CompensationItem 12. Security Ownership Of Certain Beneficial Owners and Management and Related Stockholder MattersItem 13. Certain Relationships and Related Transactions, and Director IndependenceItem 14. Principal Accountant Fees and ServicesPart IVItem 15. Exhibits and Financial Statement Schedules